Attached files
 Creating the Premier
Food & Specialty Beverage
Packaging Company
Exhibit 99.1 |
 FORWARD LOOKING STATEMENT
1
I
SILGAN HOLDINGS INC.
Information provided and statements contained in this document that are not purely
historical are forward-looking statements within the meaning of
Section
27A
of
the
Securities
Act
of
1933,
Section
21E
of
the
Securities
Exchange
Act
of
1934
and
the
Private
Securities
Litigation
Reform
Act of 1995. Such forward-looking statements only speak as of the date of this
document, and Silgan and Graham assume no obligation to update the
information included in this document. Such forward-looking statements include information concerning Silgan’s or Graham’s
possible
or
assumed
future
results
of
operations.
These
statements
often
include
words
such
as
“approximately,”
“believe,”
“expect,”
“anticipate,”
“intend,”
“plan,”
“estimate”
or
similar
expressions
and
may
include,
but
are
not
limited
to,
statements
about
the
benefits
of
the
proposed merger between Silgan and Graham, including future financial and operating
results, the combined company’s plans, objectives, expectations and
intentions and other statements that are not historical fact. These forward-looking statements are not historical facts, and are
based on current expectations, estimates and projections about Silgan’s and
Graham’s industry, management’s beliefs and certain assumptions
made by management, many of which, by their nature, are inherently uncertain and
beyond Silgan’s and Graham’s control. Accordingly, readers are
cautioned that any such forward-looking statements are not guarantees of future performance and are subject to certain risks, uncertainties
and assumptions that are difficult to predict, including, without limitation, the
expected closing date of the transaction; the possibility that the
expected
synergies
and
value
creation
from
the
proposed
merger
will
not
be
realized,
or
will
not
be
realized
within
the
expected
time
period;
the
risk that the businesses will not be integrated successfully; disruption from the
merger making it more difficult to maintain business and operational
relationships; the risk that unexpected costs will be incurred; changes in economic conditions, political conditions, trade protection
measures, licensing requirements and tax matters in the foreign countries in which
Silgan and Graham do business; the possibility that the merger
does
not
close,
including,
but
not
limited
to,
due
to
the
failure
to
satisfy
the
closing
conditions;
the
risk
that
a
regulatory
approval
may
be
obtained subject to conditions; the risk that financing for the transaction may not
be available on favorable terms; and Silgan’s and Graham’s ability
to accurately predict future market conditions. Additional factors that could cause results to differ materially from those described in the
forward-looking statements can be found in Silgan’s 2010 Annual Report on
Form 10-K, Graham’s 2010 Annual Report on Form 10-K and each
company’s other filings with the SEC available at the SEC’s website
(http://www.sec.gov). Although Silgan and Graham believe that the
expectations reflected in such forward-looking statements are reasonable as of
the date made, expectations may prove to have been materially
different
from
the
results
expressed
or
implied
by
such
forward-looking
statements.
Unless
otherwise
required
by
law,
Silgan
and
Graham
also
disclaim any obligation to update their view of any such risks or uncertainties or
to announce publicly the result of any revisions to the forward- looking
statements made in this document. |
 FORWARD LOOKING STATEMENT
2
I
SILGAN HOLDINGS INC.
Additional Information and Where to Find It:
The
proposed
merger
transaction
involving
Silgan
and
Graham
will
be
submitted
to
the
respective
stockholders
of
Silgan
and
Graham for their consideration. In connection with the proposed merger, Silgan will
prepare a registration statement on Form S-4 that will include a joint
proxy statement/prospectus for the stockholders of Silgan and Graham to be filed with the Securities and
Exchange Commission (the “SEC”), and each will mail the joint proxy
statement/prospectus to their respective stockholders and file
other
documents
regarding
the
proposed
transaction
with
the
SEC
as
well.
Silgan
and
Graham
urge
investors
and
stockholders to read the joint proxy statement/prospectus when it becomes available,
as well as other documents filed with
the
SEC,
because
they
will
contain
important
information.
Investors
and
security
holders
will
be
able
to
receive
the
registration
statement
containing
the
proxy
statement/prospectus
and
other
documents
free
of
charge
at
the
SEC’s
web
site,
http://www.sec.gov,
from
Silgan
at
4
Landmark
Square,
Suite
400,
Stamford,
CT
06901,
or
from
Graham
at
2401
Pleasant
Valley
Road, York, PA 17402.
Participants in Solicitation:
Silgan, Graham and their respective directors and executive officers and other
members of management and employees may be deemed to be participants in the
solicitation of proxies from the respective stockholders of Silgan and Graham in favor of the
merger. Information regarding the persons who may, under the rules of the SEC, be
deemed participants in the solicitation of the respective stockholders of
Silgan and Graham in connection with the proposed merger will be set forth in the joint proxy
statement/prospectus
when
it
is
filed
with
the
SEC.
You
can
find
information
about
Silgan’s
executive
officers
and
directors
in
its
definitive proxy statement for its 2010 annual meeting of stockholders, which was
filed with the SEC on April 29, 2010. You can find more information about
Graham’s executive officers and directors in its definitive proxy statement for its 2010 annual meeting
of
stockholders,
which
was
filed
with
the
SEC
on
April
30,
2010.
You
can
obtain
free
copies
of
these
documents
from
Silgan
and
Graham using the contact information above. |
 AGENDA
3
I
SILGAN HOLDINGS INC.
About Silgan
Strategic Rationale
Financial Impact
Next Steps / Q & A
Compelling Combination to Create World’s Premier Food and
Specialty Beverage Packaging Company |
 4
I
SILGAN HOLDINGS INC.
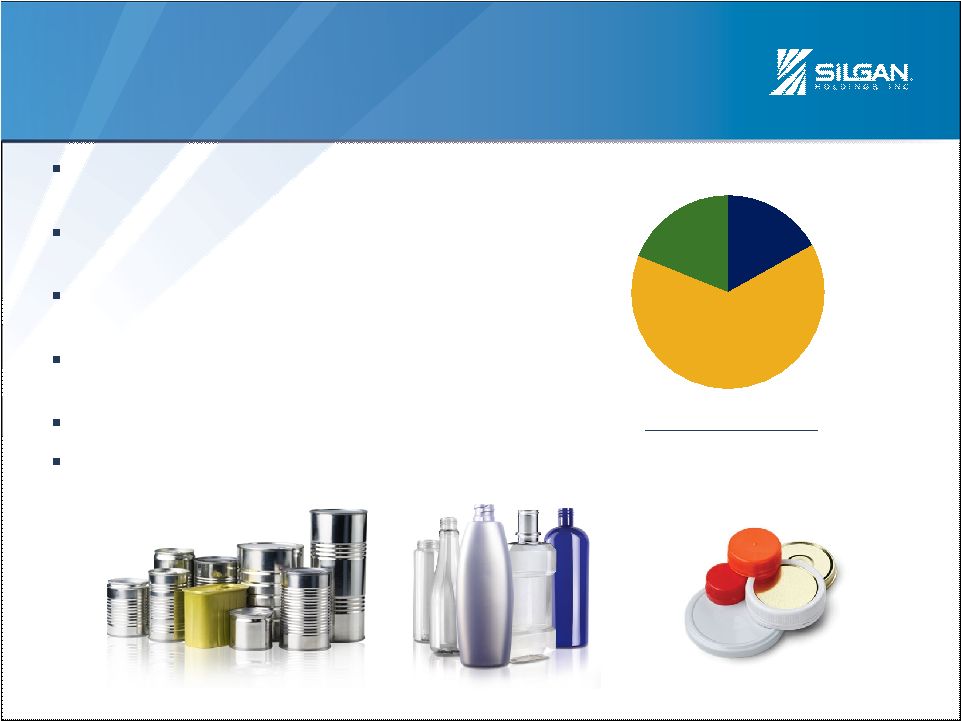
SILGAN SNAPSHOT
2010 Sales by Business
$3.4 Billion Total Sales
____________________
Note: Silgan figures pro forma for full year of IPEC and Vogel &
Noot acquisitions. Focused portfolio of industry leading
consumer packaging franchises
Largest manufacturer of metal food
containers in North America
Leading positions in closures and plastic
containers
Long-term customer contracts and
near site / on site locations
83 manufacturing facilities
~9,000 employees and operations in 19
countries
Closures
Metal
Plastic
17%
64%
19% |
 OUR
FRANCHISE FOCUS 5
I
SILGAN HOLDINGS INC.
Leading
Market
Positions
Best Value
(quality, price, service)
Leading Technology
and Manufacturing
Support
Long-term
Customer
Relationships
High Return
on Capital
Employed
Sustainable Competitive Advantage |
 HISTORICAL RETURNS
6
I
SILGAN HOLDINGS INC.
$1,878
$1,941
$1,988
$2,312
$2,421
$2,495
$2,668
$2,923
$3,121
$3,067
$3,072
$250
$750
$1,250
$1,750
$2,250
$2,750
$3,250
$3,750
2000
2001
2002
2003
2004
2005
2006
2007
2008
2009
2010
0.0%
5.0%
10.0%
15.0%
20.0%
25.0%
AVERAGE ROCE = 18%
____________________
Notes: ROCE calculated as Operating Profit divided by Total
Year-end Debt and Equity Sales
from
2000
-
2003
reflect
the
adoption
of
EITF
No.
00-10.
ROCE
from
2000
–
2009
is
adjusted
to
reflect
the
retrospective
inventory
accounting
change
from
LIFO
to
FIFO
for
Plastics.
2010 not pro forma for Vogel & Noot and IPEC acquisitions.
|
        FRANCHISE LANDSCAPE
Metal
Containers
Metal
Containers
Plastic
Containers
Plastic
Containers
Closures
Closures
Food
Specialty
Beverage
Personal
Care
Personal
Care
7
I
SILGAN HOLDINGS INC.
____________________
Note: Size of circle indicative of North American market size.
|
 Food and
Specialty
Beverage
Household
Personal Care
/ Specialty
Automotive
Lubricants
11%
6%
18%
65%
8
I
SILGAN HOLDINGS INC.
GRAHAM PACKAGING SNAPSHOT
2010 Sales by Business Unit
$2.8 Billion Total Sales
____________________
Note: Graham Packaging figures pro forma full year
for Liquid Container acquisition. Leading global supplier of innovative
plastic containers for branded consumer products
Approximately 90% of sales in product
categories with leading market position
97 manufacturing facilities, of which ~1/3 of
plants are on-site with customers
8,200 employees
Operations in 15 countries |
 9
I
SILGAN HOLDINGS INC.
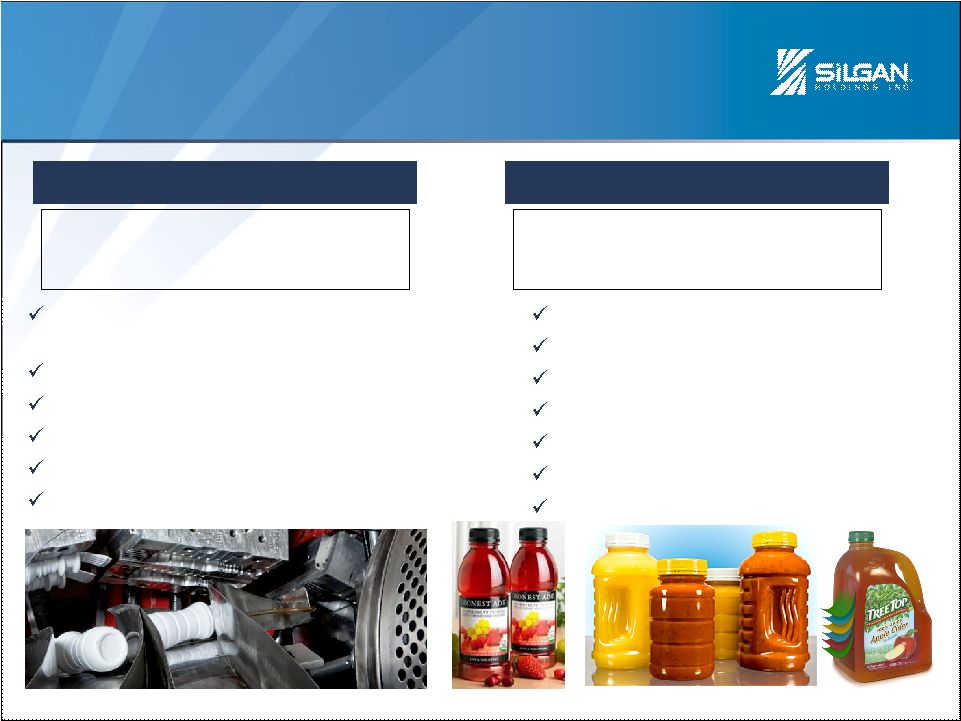
SUPERIOR TECHNOLOGY WITH A LONG
HISTORY OF INNOVATION
~ 80% of Products Utilize
Proprietary Technology
Process Technology
Product Innovation
High-Speed Extrusion Blow Molding
Wheels
High-Speed PET Bottle Production
Multi-Layer Barrier Production
Light-Weighting Technologies
Hot-Fill Processing Capabilities
Post Consumer Recycling
World-Class Design Center
SlingShot™
ThermaSet™
G-Lite®
Multi-Layer Barrier
SurBond™, SurShot®
MonoSorb®
Over 1,000 Issued or Pending
Patents |
 HISTORICAL STABILITY THROUGH
RESIN VOLATILITY
10
I
SILGAN HOLDINGS INC.
$505
$479
$474
$470
$463
$459
$455
$450
$453
$444
$432
$423
$413
$401
$399
$455
$441
$250
$300
$350
$400
$450
$500
Q4 06
Q1 07
Q2 07
Q3 07
Q4 07
Q1 08
Q2 08
Q3 08
Q4 08
Q1 09
Q2 09
Q3 09
Q4 09
Q1 10
Q2 10
Q3 10
Q4 10
____________________
Notes: Dollars in millions.
Graham Packaging 2010 financials not pro forma for Liquid Container
acquisition. Graham Packaging LTM Adjusted EBITDA
|
 AGENDA
11
I
SILGAN HOLDINGS INC.
About Silgan
Strategic Rationale
Financial Impact
Next Steps / Q & A
Compelling Combination to Create World’s Premier Food and
Specialty Beverage Packaging Company |
 12
I
SILGAN HOLDINGS INC.
STRATEGIC RATIONALE
Creates Leading Food and Specialty Beverage Packaging Market Position
•
#1 market positions across franchises
•
High barriers to entry
•
Stable end markets
Common Business Fundamentals to Silgan
•
End market focus
•
Entrenched customer partnerships
•
Raw material passthroughs
•
Focus on FCF, return on capital and operational excellence
Compelling Synergy Opportunities with Low Integration Risk
Accretive to Cash Flow, Earnings and Growth
Positions Shareholders to Realize Attractive Levered Equity Returns
|
 13
I
SILGAN HOLDINGS INC.
COMPLEMENTARY
CONSUMER PACKAGING FRANCHISES
____________________
Note: Dollars in millions.
(1) Silgan figures pro forma full year for IPEC and Vogel & Noot
acquisitions. (2) Graham Packaging figures pro forma full year
for Liquid Container acquisition; Liquid Container assumed to be 80% food & beverage.
Plastic
100%
=
By
Franchise
+
$3,437
$2,803
$6,240
By End
Market
(1)
Silgan
Pro forma
Graham Packaging
(2)
Balanced Franchise Portfolio Supporting
Common
Food & Beverage Markets
Closures
Metal
Plastic
54%
35%
11%
Closures
Metal
Plastic
17%
64%
19%
77%
Food and Beverage
Other
+
=
PF Food &
Beverage
1.6x SLGN
Standalone |
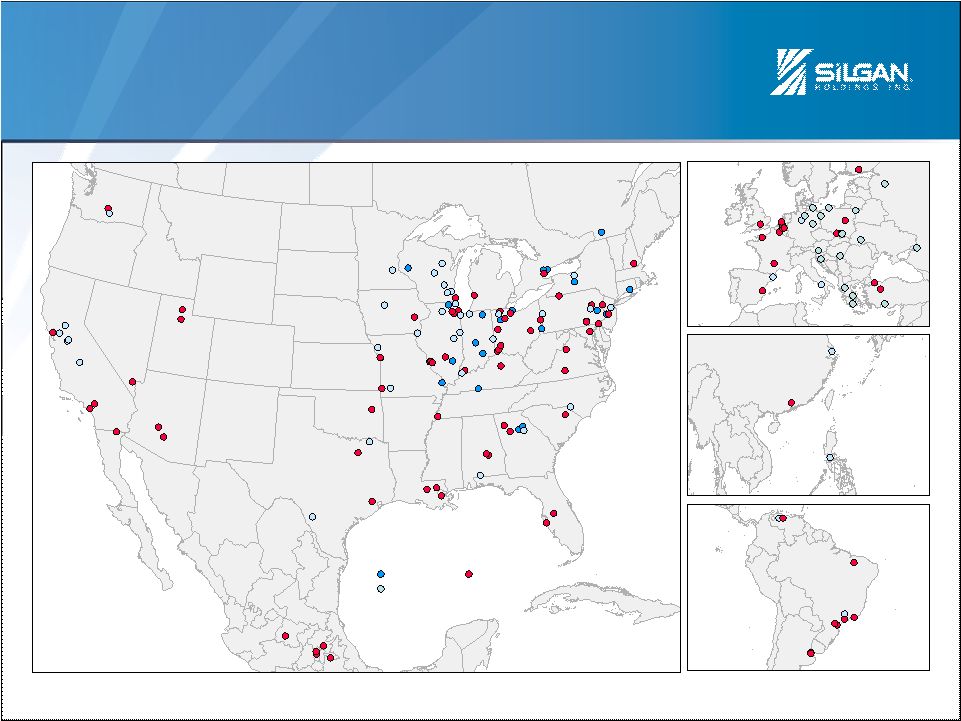 BROAD GLOBAL
FOOTPRINT:
180 OPERATING FACILITIES
14
I
SILGAN HOLDINGS INC.
58
Silgan
Plants
73
Graham
Plants
21
14
1
2
9
Silgan (Cans, Closures)
Silgan Plastics
Graham
2 |
 15
I
SILGAN HOLDINGS INC.
COMBINED WORLD CLASS CONSUMER
PACKAGING CUSTOMER BASE
Silgan / Graham
Common Heritage
On Site / Near Site
Manufacturing
Long-term Strategic
Partnerships
Raw Material
Passthroughs
BP Lubricants
Complementary Customer Base Across Multiple Products |
 FRANCHISES ALIGNED TO MARKETS
Metal
Containers
Plastic
Containers
Closures
Food
Specialty
Beverage
Personal
Care
16
I
SILGAN HOLDINGS INC.
____________________
Note: Size of circle indicative of North American market size.
|
 AGENDA
17
I
SILGAN HOLDINGS INC.
About Silgan
Strategic Rationale
Financial Impact
Next Steps / Q & A
Compelling Combination to Create World’s Premier Food and
Specialty Beverage Packaging Company |
 TRANSACTION SUMMARY
18
I
SILGAN HOLDINGS INC.
Silgan has agreed to acquire Graham Packaging to form the world’s leading
food and specialty beverage packaging company
0.402 Silgan shares + $4.75 in cash for total consideration of $19.56/ share
Total Enterprise Value of $4.1 billion
•
7.0x 2011E EBITDA
•
6.5x 2011E EBITDA (with $50 million synergies)
Pro forma Net Debt / Adjusted EBITDA of 3.9x, with expected rapid
deleveraging from robust free cash flow
Voting agreements executed with:
•
Silgan co-founders who beneficially own 29% of Silgan shares
•
Blackstone and the Graham Family who collectively own 65% of Graham
Packaging shares
Expected closing in Q3 |
 19
I
SILGAN HOLDINGS INC.
DEBT FINANCING SUMMARY
Transaction structured to maintain Ba2 / BB credit profile
Fully committed debt financing of $4.0 billion
Assuming $500 million of Graham bonds
$245 million change of control payment under Graham income
tax receivable agreements
•
NPV of tax benefits received exceeds upfront payment
|
 20
I
SILGAN HOLDINGS INC.
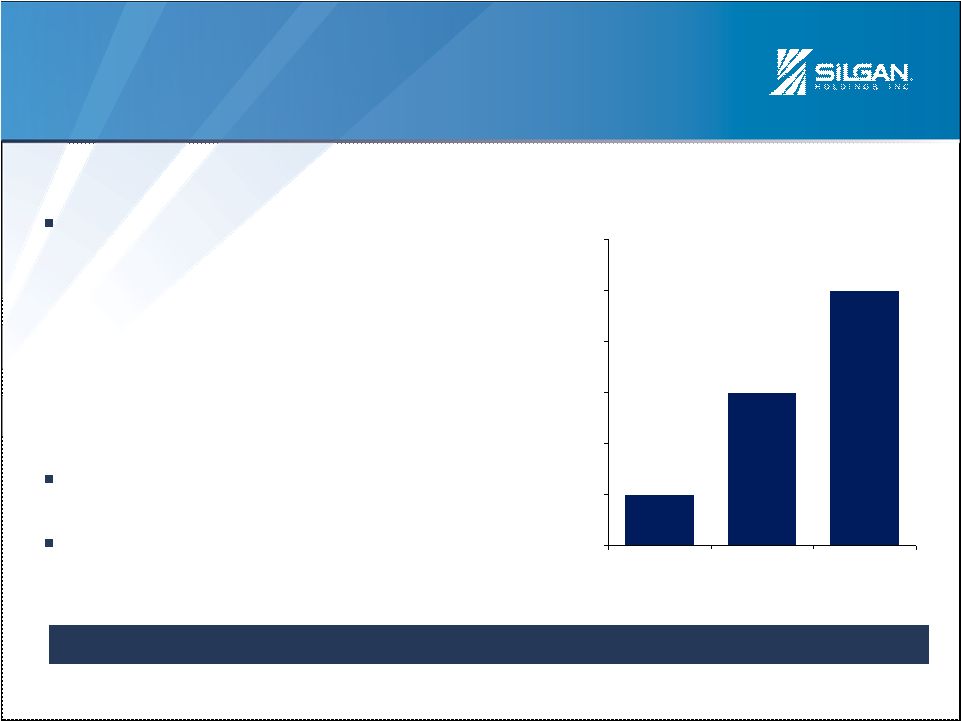
SYNERGY OPPORTUNITIES
Compelling Synergy Opportunities with Low Integration Risk
SG&A –
$18 million
•
Corporate / Administration
•
Sales
•
R&D / Technology
Procurement –
$15 million
Operational
/
Best
Practices
–
$17
million
$10
$30
$50
$0
$10
$20
$30
$40
$50
$60
Year 1
Year 2
Full
Run-Rate
Estimated Annual Impact
($mm) |
 21
I
SILGAN HOLDINGS INC.
DISCIPLINED FOCUS
EBITDA Growth
Cash Flow Generation
Focus on ROCE
Disciplined Long-Term
Acquisition Strategy
Capital Structure
Franchise
Building
Value
Creation |
 SUPERIOR RETURNS AND CASH FLOW
22
I
SILGAN HOLDINGS INC.
Adj. EBITDA –
Capex as % of Sales
(1)
ROCE
18.0%
20.1%
19.4%
16.4%
18.1%
16.7%
0.0%
5.0%
10.0%
15.0%
20.0%
25.0%
2008
2009
2010
9.3%
11.4%
11.6%
11.9%
13.9%
14.4%
0.0%
5.0%
10.0%
15.0%
2008
2009
2010
____________________
Notes:
Return
on
Capital
Employed
(ROCE)
defined
as
EBIT
divided
by
the
sum
of
total
year-end
debt
and
equity;
Graham
Packaging
ROCE
based
on
Adjusted
EBIT.
2010 ROCE for Silgan not pro forma full year for IPEC and Vogel & Noot
acquisitions. (1)
2010
Silgan
pro
forma
full
year
for
IPEC
and
Vogel
&
Noot
acquisitions;
2010
Graham
Packaging
pro
forma
full
year
for
Liquid
Container
acquisition.
Silgan
Graham Packaging |
 23
I
SILGAN HOLDINGS INC.
MULTIPLE DRIVERS OF FREE CASH FLOW
Operations
Proven Free Cash Flow of both Silgan and Graham
Packaging
Pro forma 2010 EBITDA of $1.1 billion (including $50
million of synergies)
Estimated 2011 combined Capex of ~$335 million
Low Cost of
Debt Capital
Pro forma total debt of ~$4.7 billion
Low-to-mid 5%’s expected weighted average cost of debt
Favorable
Tax
Attributes
Graham Packaging NOLs will offset taxable income by
~$175 million for first five years
~$60 million annual cash tax savings
Robust Free Cash Flow: ~$500mm ($5/share) in 1st Full Year
____________________
Note: Free cash flow defined as Operating Cash Flow less Capex on a pro
forma basis. |
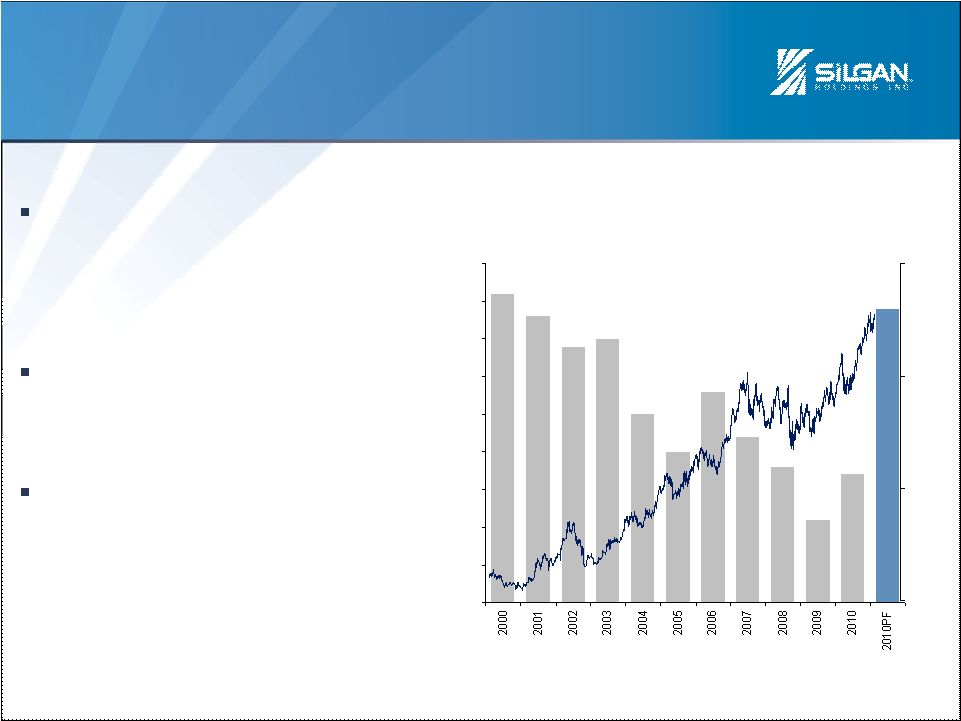 4.1x
3.8x
3.4x
3.5x
2.5x
2.0x
2.8x
2.2x
1.8x
1.1x
1.7x
3.9x
0.0x
0.5x
1.0x
1.5x
2.0x
2.5x
3.0x
3.5x
4.0x
4.5x
$0.00
$15.00
$30.00
$45.00
24
I
SILGAN HOLDINGS INC.
DISCIPLINED FINANCIAL APPROACH
20+ year history of delivering
strong levered equity returns to
shareholders
Consistent Silgan track record
of deleveraging post-acquisition
Financial policy and
commitment to dividend
unchanged
____________________
Notes: 2000-2010 Net Leverage defined as EBITDA divided by Net
Debt. (1) Pro forma for Vogel & Noot and Graham acquisitions
using adjusted EBITDA with $50mm in synergies assumed for Graham. Net Leverage
Ratio / Stock Price Performance
(1)
Price ($)
Net Leverage |
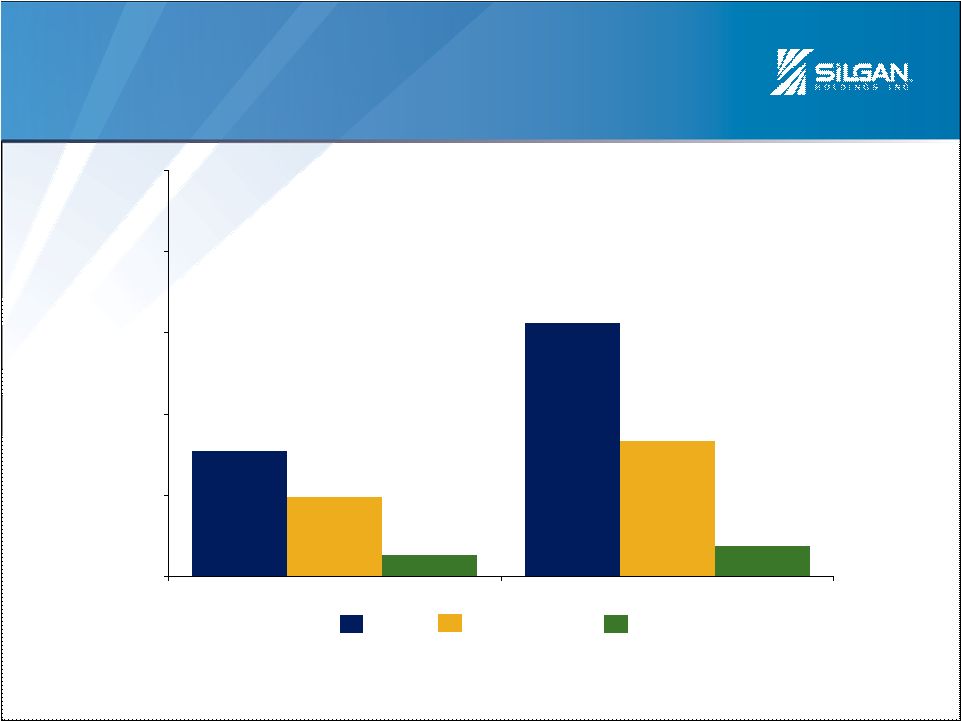 15.4%
31.2%
9.8%
16.6%
2.7%
3.8%
0.0%
10.0%
20.0%
30.0%
40.0%
50.0%
5-Year
10-Year
Packaging Peers
SLGN
S&P 500
TRACK RECORD OF SUPERIOR LEVERED
EQUITY RETURNS
25
I
SILGAN HOLDINGS INC.
____________________
Notes:
Total
Shareholder
Return
includes
cumulative
share
price
returns
and
dividends
reinvested
through
April
1,
2011.
Packaging Peers include AptarGroup, Ball, Bemis, Crown, Owens-Illinois,
Sealed Air and Sonoco. Packaging
Peers’
total
shareholder
return
represents
the
average.
Total Shareholder Return CAGR |
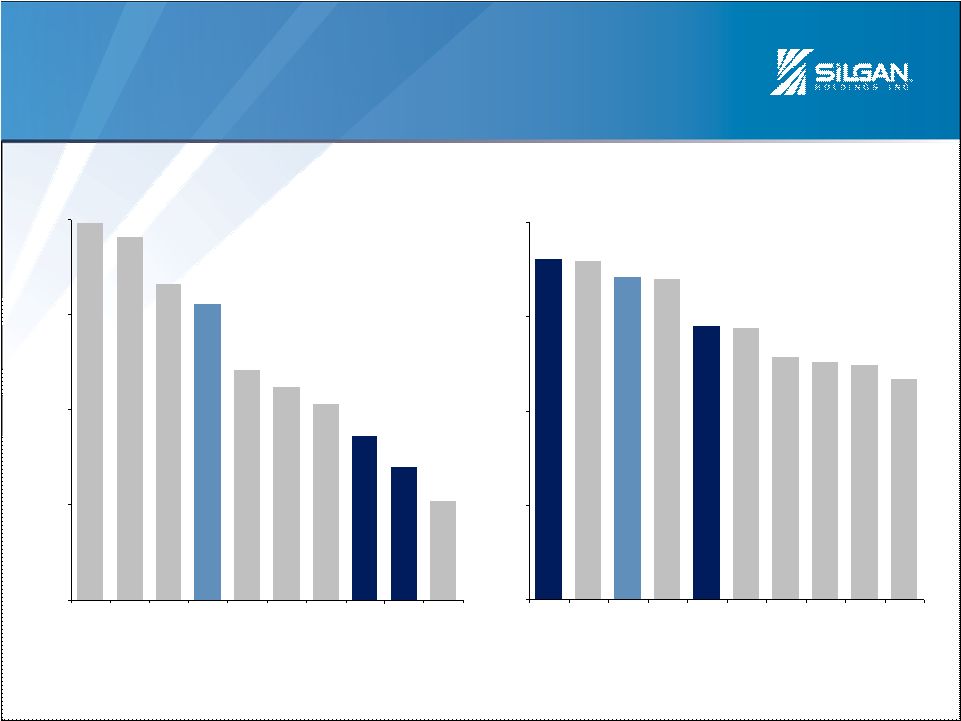 TRANSFORMATIVE TO SILGAN’S FINANCIAL
PROFILE
26
I
SILGAN HOLDINGS INC.
2010 Revenue
2010 EBITDA -
Capex % of Sales
____________________
Notes:
Silgan 2010 figures pro forma full year for IPEC and Vogel & Noot
acquisitions. 2010 Silgan Adj. EBITDA includes adjustments per
reconciliation in Appendix. Graham
Packaging
2010
Revenue,
Adj.
EBITDA
and
Capex
figures
pro
forma
full
year
for
Liquid
Container
acquisition.
Pro
forma
Silgan
and
Graham
Packaging
Adj.
EBITDA
includes
$50mm
in
synergies.
$7,941
$7,630
$6,633
$6,240
$4,835
$4,490
$4,124
$3,437
$2,803
$2,077
$0
$2,000
$4,000
$6,000
$8,000
CCK
BLL
OI
PF
BMS
SEE
SON
SLGN
GRM
ATR
($mm)
14.4%
14.4%
13.7%
13.6%
11.6%
11.5%
10.3%
10.1%
9.9%
9.3%
0.0%
4.0%
8.0%
12.0%
16.0%
GRM
SEE
PF
ATR
SLGN
OI
BMS
BLL
SON
CCK |
 ACQUISITION A PERFECT FIT WITH OUR
FRANCHISE CRITERIA…
27
I
SILGAN HOLDINGS INC.
Leading
Market
Positions
Best Value
(quality, price, service)
Leading Technology
and Manufacturing
Support
Long-term
Customer
Relationships
High Return
on Capital
Employed
Sustainable Competitive Advantage
WHITE CAP
METAL CONTAINERS
GRAHAM PACKAGING |
 28
I
SILGAN HOLDINGS INC.
…AND OUR DISCIPLINED FOCUS
EBITDA Growth
Cash Flow Generation
Focus on ROCE
Disciplined Long-Term
Acquisition Strategy
Capital Structure
Franchise
Building
Value
Creation |
 AGENDA
29
I
SILGAN HOLDINGS INC.
About Silgan
Strategic Rationale
Financial Impact
Next Steps / Q & A
Compelling Combination to Create World’s Premier Food and
Specialty Beverage Packaging Company |
 NEXT STEPS / Q & A
30
I
SILGAN HOLDINGS INC.
Raise permanent debt financing
Shareholder votes at Silgan and Graham
Customary regulatory approvals
Expected closing Q3 |
 31
I
SILGAN HOLDINGS INC.
APPENDIX
Non-GAAP Reconciliation |
 32
I
SILGAN HOLDINGS INC.
EBITDA RECONCILIATION –
SILGAN
($ in millions)
Reconciliation
2010
2009
2008
Net Income
$144.6
$159.4
$125.0
Provision for income taxes
77.0
88.2
68.6
Interest and other debt expense
54.1
49.7
60.2
Loss on early extinguishment of debt
7.5
1.3
-
Income from Operations
$283.3
$298.6
$253.7
Depreciation & Amortization
142.9
145.3
144.0
EBITDA
$426.3
$443.9
$397.7
Rationalization charges
22.2
1.5
12.2
Stock option & RSU expenses
5.8
4.9
3.7
Venezuela Devaluation
3.2
-
-
Adjusted EBITDA
$457.5
$450.3
$413.6 |
 33
I
SILGAN HOLDINGS INC.
NET LEVERAGE RECONCILIATION –
SILGAN
($ in millions)
Reconciliation
2010
2009
2008
2007
2006
2005
2004
2003
2002
2001
2000
Total Debt
$904.7
$799.4
$884.9
$992.5
$955.6
$700.4
$841.7
$1,002.6
$956.8
$944.8
$1,031.5
Less: Cash
175.2
305.8
163.0
95.9
16.7
20.5
35.4
12.1
58.3
18.0
20.1
Net Debt
$729.4
$493.7
$721.9
$896.6
$938.9
$679.9
$806.3
$990.5
$898.5
$926.8
$1,011.4
Net Income
$144.6
$159.4
$125.0
$126.8
$100.5
$90.3
$87.7
$42.9
$54.0
$40.7
$31.2
Equity Loss in Affiliates
-
-
-
-
-
-
-
0.3
2.6
4.1
4.6
Provision for income taxes
77.0
88.2
68.6
73.0
48.9
62.7
60.7
28.2
36.9
29.5
23.1
Gain on assets contributed to Affiliate
-
-
-
-
-
-
-
-
-
(4.9)
-
Interest and other debt expense
54.1
49.7
60.2
66.0
59.2
49.4
55.6
78.9
73.8
81.2
91.2
Loss on early extinguishment of debt
7.5
1.3
-
-
0.2
11.2
1.6
19.2
1.0
-
6.9
Income from Operations
$283.3
$298.6
$253.7
$265.8
$208.8
$213.6
$205.6
$169.4
$168.3
$150.6
$157.0
Depreciation & Amortization
142.9
145.3
144.0
138.0
126.2
121.2
118.5
111.3
95.7
95.5
89.0
EBITDA
$426.3
$443.9
$397.7
$403.8
$335.0
$334.8
$324.1
$280.7
$264.0
$246.1
$246.0
Net Leverage Ratio
1.7x
1.1x
1.8x
2.2x
2.8x
2.0x
2.5x
3.5x
3.4x
3.8x
4.1x
____________________
Note: Net Income from 2000-2009 is adjusted to reflect the
retrospective inventory accounting change from LIFO to FIFO for Plastics. |
 34
I
SILGAN HOLDINGS INC.
EBITDA RECONCILIATION –
GRAHAM
PACKAGING
($ in millions)
____________________
(1)Represents
the
net
loss
on
disposal
of
fixed
assets,
stock-based
compensation
expense
and
equity
income
from
unconsolidated
subsidiaries.
(2)Represents
annual
fees
paid
to
Blackstone
Management
Partners
III
L.L.C.,
through
the
date
of
the
IPO,
and
a
limited
partner
of
Holdings
pursuant
to
the
Fifth
Amended
and
Restated
Limited
Partnership
Agreement,
the
Monitoring Agreement and the Sixth Amended and Restated Limited Partnership
Agreement. (3)Represents
costs
related
to
the
termination
of
the
Monitoring
Agreement,
IPO
bonus
payments
and
other
IPO-related
costs.
(4)Represents costs related to the acquisition and integration of the
Liquid Entities, China Roots and other entities. (5)Represents costs
related to a settlement to OnTech, plant closures, employee severance and other costs.
(6)Represents administrative expenses incurred by Blackstone.
Reconciliation
2010
2009
2008
2007
2006
Net Income
$61.8
$14.3
($57.9)
($207.4)
($121.1)
Loss from discontinued operations
-
9.5
10.5
3.7
1.1
Income tax (benefit) provision
(50.7)
27.0
13.0
20.3
27.5
Interest Income
(0.7)
(1.1)
(0.8)
(0.9)
(0.6)
Interest Expense
185.6
176.9
180.0
210.4
207.4
Income from Operations
$196.0
$226.5
$144.8
$26.1
$114.3
Depreciation & Amortization
171.1
158.6
175.5
201.7
204.6
EBITDA
$367.1
$385.1
$320.3
$227.8
$318.9
Asset impairment charges
9.6
41.8
96.1
157.7
25.9
Increase in income tax receivable obligations
5.0
-
-
-
-
Other non-cash charges
(1)
4.9
7.3
9.3
19.4
14.3
Fees related to monitoring agreements
(2)
1.5
5.0
5.0
5.0
5.0
Net loss on debt extinguishment
31.1
8.7
-
-
-
Write-off of amounts in accumulated other
comprehensive income related to interest rate swaps
7.0
-
-
-
-
Contract termination fee and IPO-related expenses
(3)
39.6
0.2
-
-
-
Acquisition and integration expenses
(4)
20.3
-
-
-
-
Venezuelan hyper-inflationary accounting
2.3
-
-
-
-
Reorganization and other costs
(5)
16.0
14.2
22.0
22.0
34.6
Other administrative expenses
(6)
-
0.1
0.1
0.1
-
Adjusted EBITDA
$504.4
$462.5
$452.8
$432.0
$398.7
Depreciation & Amortization
171.1
158.6
175.5
201.7
204.6
Adjusted EBIT
$333.3
$303.9
$277.3
$230.3
$194.1 |
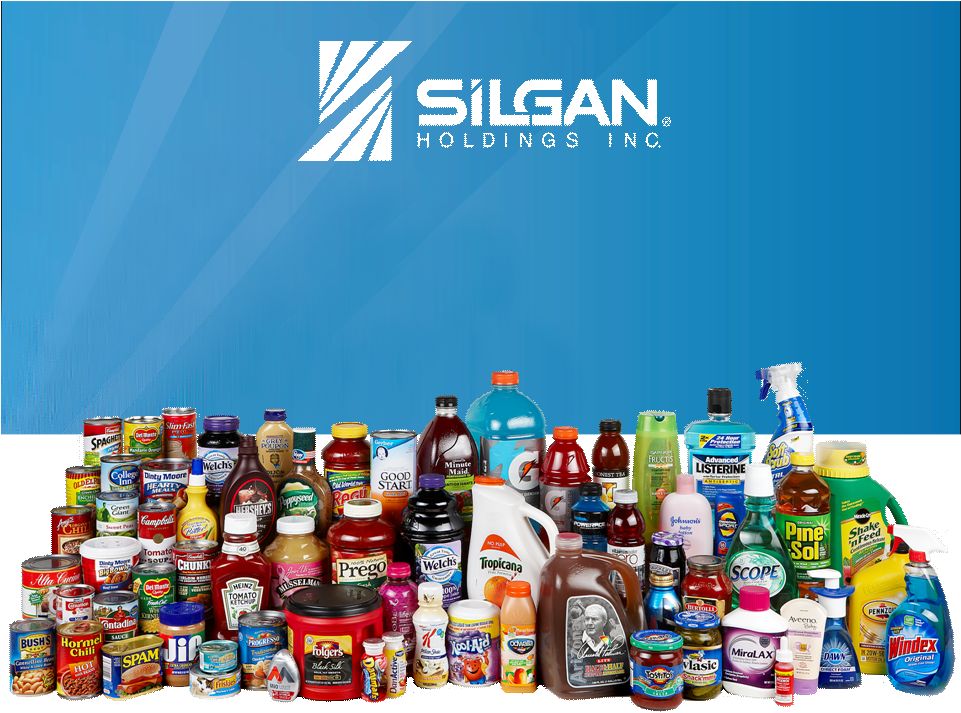 Creating the Premier
Food & Specialty Beverage
Packaging Company |
