Attached files
| file | filename |
|---|---|
| 8-K - FORM 8-K - GenOn Energy, Inc. | c15499e8vk.htm |
Exhibit 99.1

| Bank of America/Merrill Lynch Megawatt Roundup April 13, 2011 Edward R. Muller Chairman and CEO |
| 2 Safe Harbor Statement Forward-Looking StatementsThis presentation contains statements, estimates or projections that constitute "forward-looking statements" as defined under U.S. federal securities laws. In some cases, one can identify forward-looking statements by terminology such as "will," "expect," "estimate," "think," "forecast," "guidance," "outlook," "plan," "lead," "project" or other comparable terminology. Forward-looking statements are subject to certain risks and uncertainties that could cause actual results to differ materially from our historical experience and our present expectations or projections. These risks include, but are not limited to: legislative and regulatory initiatives or changes affecting the electric industry; changes in, or changes in the application of, environmental or other laws and regulations; failure of our generating facilities to perform as expected, including outages for unscheduled maintenance or repair; changes in market conditions or the entry of additional competition in our markets; the ability to integrate successfully the businesses following the merger and realize cost savings and any other synergies; and those factors contained in our periodic reports filed with the SEC, including in the "Risk Factors" section of our most recent Annual Report on Form 10-K. The forward-looking information in this document is given as of the date of the particular statement and we assume no duty to update this information. Our filings and other important information are also available on the Investor Relations page of our web site at www.genon.com.Non-GAAP Financial InformationThe following presentation includes "non-GAAP financial measures" as defined in Regulation G under the Securities Exchange Act of 1934, as amended. Reconciliations of these measures to the most directly comparable GAAP measures are contained herein. This presentation is available in the Investor Relations section of our web site at www.genon.com. Note:The picture on the cover includes an artist's rendering of GenOn Marsh Landing in its completed state. Construction of Marsh Landing began October 2010 and is currently ongoing. |
| 3 Today's Discussion Status of environmental controls for the GenOn coal fleetHedging to reduce volatility in realized gross marginBalance sheet structured to manage through different commodity price environments |

| 4 Generation Portfolio Excludes Potrero (362 MWs), which was shut down on February 28, 2011. Approximately 1,300 MW of generating capacity will move from MISO to PJM in June 2011. Total Generating Capacity 24,2371 MWs CAISO Southeast (SERC, FRCC) PJM ISO - NE NYISO MISO Operating Segment / Market Net Capacity(MW) Net Capacity(MW) Eastern PJM 6,336 6,336 Western PJM/MISO Western PJM 5,814 5,814 MISO2 1,669 Total Western PJM/ MISO 7,483 California1 5,363 5,363 Other Southeast 2,520 2,520 NYISO 1,139 1,139 ISO- NE 1,396 Total Other 5,055 5,055 Total1 24,237 24,237 |
| Control Technology for the Coal Fleet Total generating capacity 24,237 MWCoal or waste coal generation is 31% or 7,542 MW58% or 4,374 MW of the coal fleet has both SO2 and NOX controls68% or 5,136 MW of the coal fleet has SO2 controls80% or 6,042 MW of the coal fleet has NOX controlsWill invest in further environmental controls only if economic 5 |
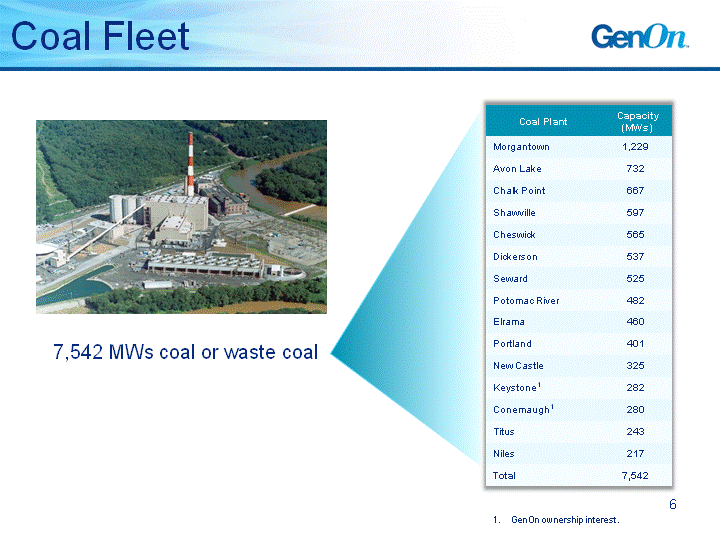
| Coal Fleet 6 7,542 MWs coal or waste coal GenOn ownership interest. |
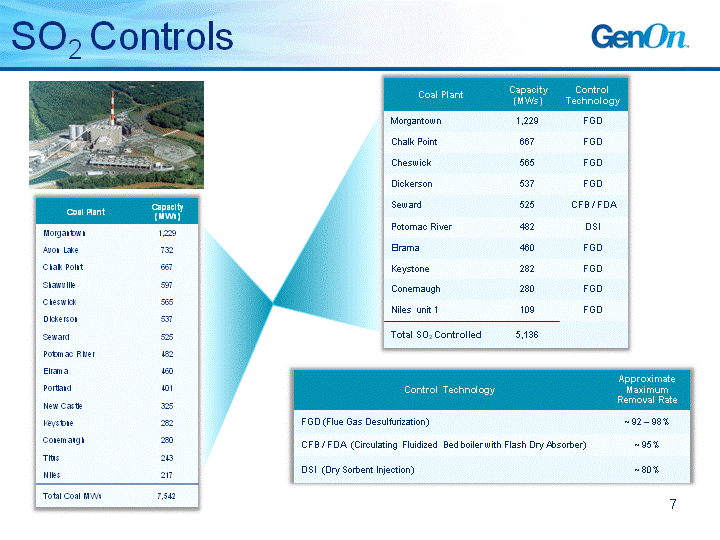
| SO2 Controls 7 Coal Plant Capacity (MWs) Control Technology Morgantown 1,229 FGD Chalk Point 667 FGD Cheswick 565 FGD Dickerson 537 FGD Seward 525 CFB / FDA Potomac River 482 DSI Elrama 460 FGD Keystone 282 FGD Conemaugh 280 FGD Niles unit 1 109 FGD Total SO2 Controlled 5,136 Control Technology Approximate Maximum Removal Rate FGD (Flue Gas Desulfurization) ~ 92 - 98% CFB / FDA (Circulating Fluidized Bed boiler with Flash Dry Absorber) ~ 95% DSI (Dry Sorbent Injection) ~ 80% |
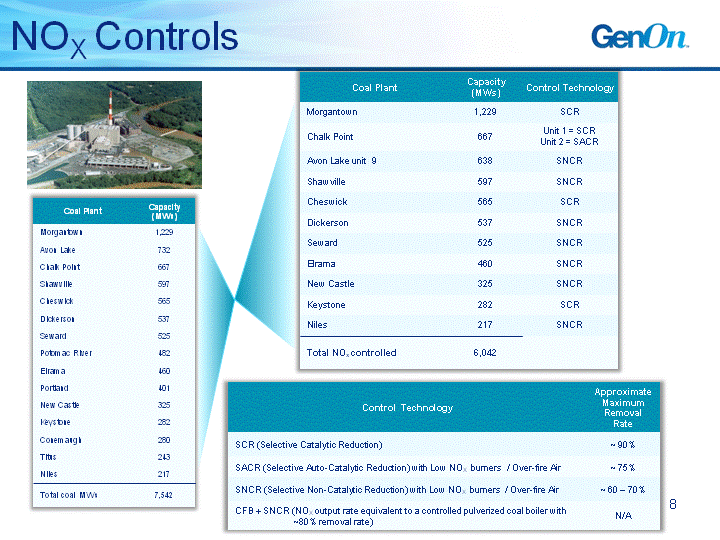
| NOX Controls 8 Coal Plant Capacity (MWs) Control Technology Morgantown 1,229 SCR Chalk Point 667 Unit 1 = SCR Unit 2 = SACR Avon Lake unit 9 638 SNCR Shawville 597 SNCR Cheswick 565 SCR Dickerson 537 SNCR Seward 525 SNCR Elrama 460 SNCR New Castle 325 SNCR Keystone 282 SCR Niles 217 SNCR Total NOx controlled 6,042 Coal Plant Capacity(MWs) Morgantown 1,229 Avon Lake 732 Chalk Point 667 Shawville 597 Cheswick 565 Dickerson 537 Seward 525 Potomac River 482 Elrama 460 Portland 401 New Castle 325 Keystone 282 Conemaugh 280 Titus 243 Niles 217 Total coal MWs 7,542 Control Technology Approximate Maximum Removal Rate SCR (Selective Catalytic Reduction) ~ 90% SACR (Selective Auto-Catalytic Reduction) with Low NOX burners / Over-fire Air ~ 75% SNCR (Selective Non-Catalytic Reduction) with Low NOX burners / Over-fire Air ~ 60 - 70% CFB + SNCR (NOX output rate equivalent to a controlled pulverized coal boiler with ~80% removal rate) N/A |
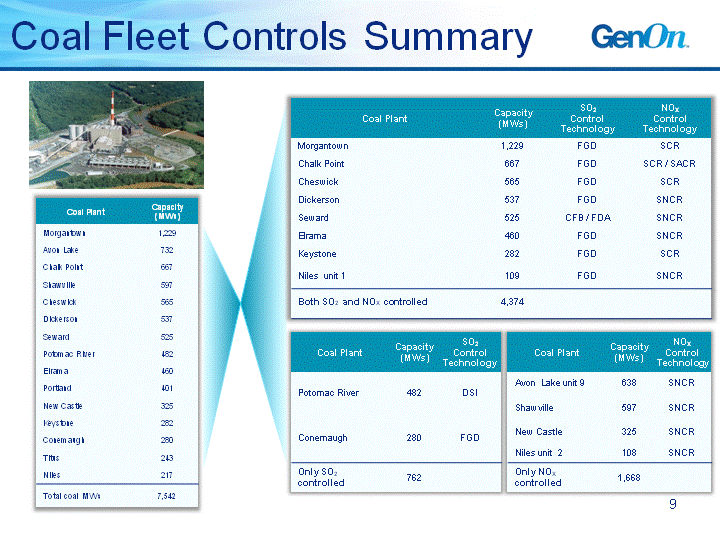
| Coal Fleet Controls Summary 9 Coal Plant Capacity(MWs) SO2 Control Technology NOX Control Technology Morgantown 1,229 FGD SCR Chalk Point 667 FGD SCR / SACR Cheswick 565 FGD SCR Dickerson 537 FGD SNCR Seward 525 CFB / FDA SNCR Elrama 460 FGD SNCR Keystone 282 FGD SCR Niles unit 1 109 FGD SNCR Both SO2 and NOX controlled 4,374 Coal Plant Capacity(MWs) SO2 Control Technology Potomac River 482 DSI Conemaugh 280 FGD Only SO2 controlled 762 Coal Plant Capacity(MWs) NOX Control Technology Avon Lake unit 9 638 SNCR Shawville 597 SNCR New Castle 325 SNCR Niles unit 2 108 SNCR Only NOX controlled 1,668 |
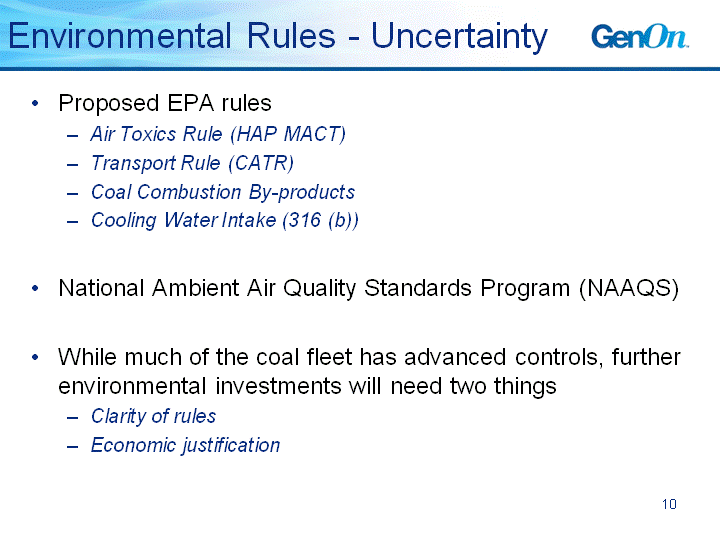
| Environmental Rules - Uncertainty Proposed EPA rulesAir Toxics Rule (HAP MACT)Transport Rule (CATR)Coal Combustion By-productsCooling Water Intake (316 (b))National Ambient Air Quality Standards Program (NAAQS)While much of the coal fleet has advanced controls, further environmental investments will need two thingsClarity of rulesEconomic justification 10 |

| Hedging Approach Reduce variability in realized gross marginHedge only when there is economic valueReduces need for more liquidityHedge levels will vary based on expected generation which fluctuates with changes in market conditions 11 |
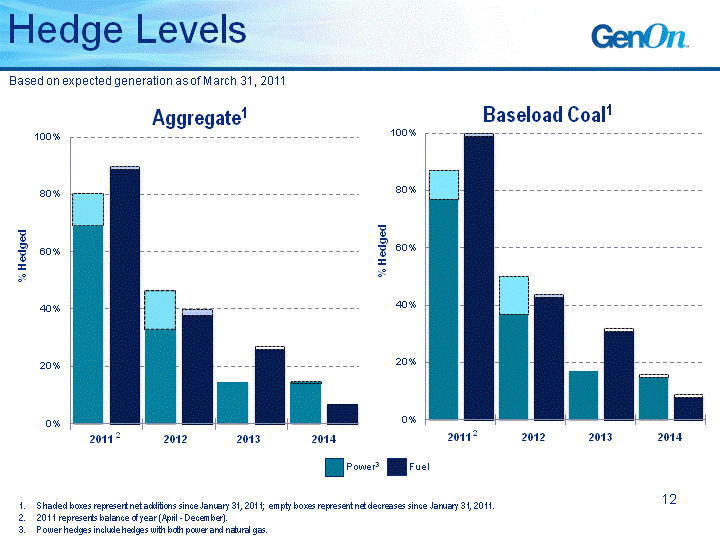
| 12 Hedge Levels Aggregate1 Baseload Coal1 Shaded boxes represent net additions since January 31, 2011; empty boxes represent net decreases since January 31, 2011.2011 represents balance of year (April - December).Power hedges include hedges with both power and natural gas. Based on expected generation as of March 31, 2011 2011 2012 2013 2014 2 (CHART) 2011 2012 2013 2014 (CHART) Power3 Fuel 2 |
| Balance Sheet and Liquidity Sized the balance sheet to an appropriate level with financing arranged for the mergerMaintain liquidity to support the business through 5 years of higher and lower commodity prices 13 |
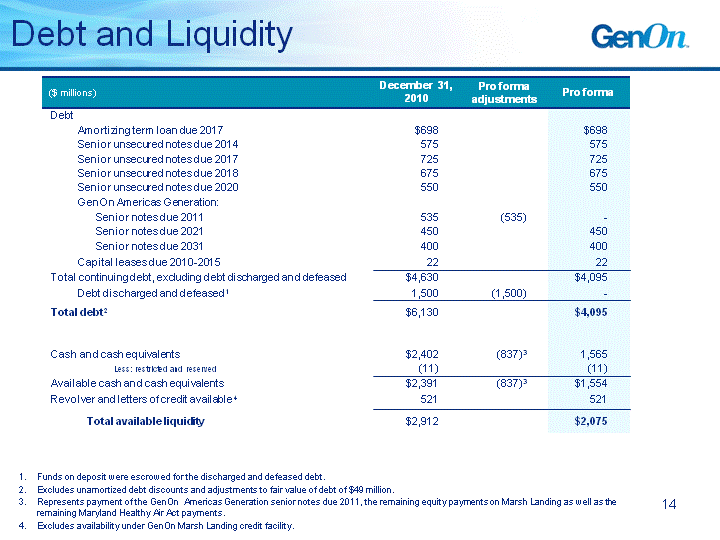
| 14 Debt and Liquidity Debt and Liquidity Funds on deposit were escrowed for the discharged and defeased debt.Excludes unamortized debt discounts and adjustments to fair value of debt of $49 million.Represents payment of the GenOn Americas Generation senior notes due 2011, the remaining equity payments on Marsh Landing as well as the remaining Maryland Healthy Air Act payments.Excludes availability under GenOn Marsh Landing credit facility. |
| Summary Much of the coal fleet has advanced environmental controlsFurther environmental controls will need rule clarity and economic justificationHedging to reduce variability in realized gross marginSized the balance sheet to an appropriate level with financing arranged for the merger 15 |

| Bank of America/Merrill LynchMegawatt RoundupApril 13, 2011 Q&A |
