Attached files
Table of Contents
UNITED STATES
SECURITIES AND EXCHANGE COMMISSION
Washington, D.C. 20549
FORM 10-K
(Mark One)
| x | ANNUAL REPORT PURSUANT TO SECTION 13 OR 15(d) OF THE SECURITIES EXCHANGE ACT OF 1934 |
For the fiscal year ended January 29, 2011
OR
| ¨ | TRANSITION REPORT PURSUANT TO SECTION 13 OR 15(d) OF THE SECURITIES EXCHANGE ACT OF 1934 |
For the transition period from to .
Commission File number 0-21764
Perry Ellis International, Inc.
(Exact Name of Registrant as Specified in Its Charter)
| Florida | 59-1162998 | |
| (State or Other Jurisdiction of Incorporation or Organization) |
(I.R.S. Employer Identification No.) | |
| 3000 N.W. 107th Avenue Miami, Florida | 33172 | |
| (Address of Principal Executive Offices) | (Zip Code) | |
(305) 592-2830
(Registrant’s telephone number, including area code)
Securities registered pursuant to Section 12(b) of the Act:
Common Stock, par value $.01 per share
(Title of each class)
Securities registered pursuant to Section 12(g) of the Act:
None
Indicate by check mark if the registrant is a well-known seasoned issuer, as defined in Rule 405 of the Securities Act. Yes ¨ No x
Indicate by check mark if the registrant is not required to file reports pursuant to Section 13 or Section 15(d) of the Act. Yes ¨ No x
Indicate by check mark whether the registrant (1) has filed all reports required to be filed by Section 13 or 15(d) of the Securities Exchange Act of 1934 during the preceding 12 months (or for such shorter period that the registrant was required to file such reports), and (2) has been subject to such filing requirements for the past 90 days. Yes x No ¨
Indicate by check mark whether the registrant has submitted electronically and posted on its corporate Web site, if any, every Interactive Data File required to be submitted and posted pursuant to Rule 405 of Regulation S-T during the preceding 12 months (or for such shorter period that the registrant was required to submit and post such files). ¨ Yes ¨ No
Indicate by check mark if disclosure of delinquent filers pursuant to Item 405 of Regulation S-K is not contained herein, and will not be contained, to the best of the registrant’s knowledge, in definitive proxy or information statements incorporated by reference in Part III of this Form 10-K or any amendment to this Form 10-K. ¨
Indicate by check mark whether the registrant is a large accelerated filer, an accelerated filer, a non-accelerated filer or a smaller reporting company. See definitions of “large accelerated filer,” “accelerated filer” and “small reporting company” in Rule 12b-2 of the Exchange Act. (Check one):
| Large accelerated filer | ¨ | Accelerated filer | x | |||
| Non-accelerated filer | ¨ | Smaller reporting company | ¨ | |||
Indicate by check mark whether the registrant is a shell company (as defined in Rule 12b-2 of the Exchange Act) Yes ¨ No x
The aggregate market value of the voting stock held by non-affiliates of the registrant is approximately $225,968,365 (as of July 31, 2010).
The number of shares outstanding of the registrant’s Common Stock is 16,169,403 (as of April 11, 2011).
DOCUMENTS INCORPORATED BY REFERENCE
The following documents are incorporated by reference:
Portions of the Company’s Proxy Statement for the 2011 Annual Meeting—Part III
Table of Contents
Unless the context otherwise requires, all references to “Perry Ellis,” the “Company,” “we,” “us” or “our” include Perry Ellis International, Inc. and its subsidiaries. References in this report to the Rafaella acquisition refer to our acquisition of this brand in January 2011, and references to the Laundry by Shelli Segal and C&C California acquisition refer to our acquisition of these brands in February 2008. In March 2009 we adopted a “retail calendar” fiscal year commencing for fiscal 2010. The retail calendar fiscal year divides a quarter into a series of 4-5-4 equal weeks. Each week begins on a Sunday and ends on the corresponding Saturday. References in this report to annual financial data for Perry Ellis refer to fiscal years ended January 29, 2011, January 30, 2010 and January 31, 2009. This Form 10-K contains references to trademarks held by us and those of third parties.
General information about Perry Ellis can be found at www.pery.com. We make our annual report on Form 10-K, quarterly reports on Form 10-Q, current report on Form 8-K and amendments to these reports filed or furnished pursuant to Section 13 or 15(d) of the Securities Exchange Act of 1934 available free of charge on our website, as soon as reasonably practicable after they are electronically filed with the SEC.
FORWARD-LOOKING STATEMENTS
We caution readers that this report and the portions of the proxy statement incorporated by reference into this report include “forward-looking statements” as that term is used in the Private Securities Litigation Reform Act of 1995. Forward-looking statements are based on current expectations rather than historical facts and they are indicated by words or phrases such as “anticipate,” “believe,” “budget,” “contemplate,” “continue,” “could,” “envision,” “estimate,” “expect,” “guidance,” “indicate,” “intend,” “may,” “might,” “plan,” “possibly,” “potential,” “predict,” “probably,” “pro-forma,” “project,” “seek,” “should,” “target,” or “will” or the negative thereof or other variations thereon and similar words or phrases or comparable terminology. We have based such forward-looking statements on our current expectations, assumptions, estimates and projections. While we believe these expectations, assumptions, estimates and projections are reasonable, such forward-looking statements are only predictions and involve known and unknown risks and uncertainties, and other factors that may cause actual results, performance or achievements to be materially different from any future results, performance or achievements expressed or implied by such forward-looking statements, many of which are beyond our control. These and other important factors may cause our actual results, performance or achievements to differ materially from any future results, performance or achievements expressed or implied by these forward-looking statements. Some of the factors that could affect our financial performance, cause actual results to differ from our estimates, or underlie such forward-looking statements, are as set forth below and in various places in this report and in the portions of the proxy statement incorporated by reference, including under the headings Item 1 “Business,” Item 1A “Risk Factors,” and Item 7 “Management’s Discussion and Analysis of Financial Condition and Results of Operations” in this report. These factors include:
| • | general economic conditions, |
| • | a significant decrease in business from or loss of any of our major customers or programs, |
| • | anticipated and unanticipated trends and conditions in our industry, including the impact of recent or future retail and wholesale consolidation, |
| • | recent and future economic conditions, including turmoil in the financial and credit markets, |
| • | the effectiveness of our planned advertising, marketing and promotional campaigns, |
| • | our ability to contain costs, |
| • | disruptions in the supply chain, |
1
Table of Contents
| • | our future capital needs and our ability to obtain financing, |
| • | our ability to protect our trademarks, |
| • | our ability to integrate acquired businesses, trademarks, tradenames and licenses, |
| • | our ability to predict consumer preferences and changes in fashion trends and consumer acceptance of both new designs and newly introduced products, |
| • | the termination or non-renewal of any material license agreements to which we are a party, |
| • | changes in the costs of raw materials, labor and advertising, |
| • | our ability to carry out growth strategies including expansion in international and direct to consumer retail markets, |
| • | the level of consumer spending for apparel and other merchandise, |
| • | our ability to compete, |
| • | exposure to foreign currency risk and interest rate risk, |
| • | possible disruption in commercial activities due to terrorist activity and armed conflict, and |
| • | other factors set forth in this report and in our other Securities and Exchange Commission (“SEC”) filings. |
You are cautioned that all forward-looking statements involve risks and uncertainties, detailed in our filings with the SEC. You are cautioned not to place undue reliance on these forward-looking statements, which are valid only as of the date they were made. We undertake no obligation to update or revise any forward-looking statements to reflect new information or the occurrence of unanticipated events or otherwise.
2
Table of Contents
PART I
Item 1. Business
Overview
We are one of the leading apparel companies in the United States. We manage a portfolio of major brands, some of which were established over 100 years ago. We design, source, market and license our products nationally and internationally at multiple price points and across all major levels of retail distribution in approximately 15,000 selling doors. Our portfolio of highly recognized brands includes the Perry Ellis® family of brands, Axis®, Tricots St. Raphael®, Jantzen®, John Henry®, Cubavera®, the Havanera Co.®, Centro®, Solero®, Natural Issue®, Munsingwear®, Grand Slam®, Original Penguin® by Munsingwear® (“Original Penguin”), Mondo di Marco®, Redsand®, Pro Player®, Manhattan®, Axist®, Savane®, Farah®, Gotcha®, Girl Star®, MCD®, Laundry by Shelli Segal®, C&C California®, and Rafaella®. We also (i) license the Nike® brand for swimwear and swimwear accessories, (ii) license the JAG® brand for men’s and women’s swimwear and cover-ups, (iii) license the Callaway Golf® brand and Top-Flite® for golf apparel, (iv) license the PGA TOUR® brand, including Champions Tour®, for golf apparel, and (v) license Pierre Cardin® for men’s sportswear.
We distribute our products primarily to wholesale customers that represent all major levels of retail distribution including department stores, national and regional chain stores, mass merchants, specialty stores, sporting goods stores, the corporate wear market, e-commerce, as well as clubs and independent retailers in the United States, Canada, Mexico, the United Kingdom and Europe. Our largest customers include Kohl’s Corporation (“Kohl’s”), Macy’s, Inc. (“Macy’s”), The Marmaxx Group (TJ Maxx / Marshalls), Dillard’s Inc. (“Dillard’s”), Sam’s Wholesale Club (“Sam’s”), and J.C. Penney Company (“J.C. Penney”). As of March 2, 2011, we operated 38 Perry Ellis and three Original Penguin retail outlet stores located primarily in upscale retail outlet malls across the United States and Puerto Rico. As of March 2, 2011 we also operated one Perry Ellis and one Cubavera retail store located in Miami, Florida and seven Original Penguin retail stores located in upscale demographic markets in the United States. In addition, we leverage our design, sourcing and logistics expertise by offering a limited number of private label programs to retailers. In order to maximize the worldwide exposure of our brands and generate high margin royalty income, we license our brands through three worldwide, 37 domestic, and 94 international license agreements covering over 100 countries.
Our wholesale business, which is comprised of men’s and women’s sportswear, swimwear and swimwear accessories, accounted for 97% of our total revenues in fiscal 2011 and, our licensing business accounted for approximately 3% of our total revenues in fiscal 2011. We have traditionally focused on the men’s sportswear market, which represented approximately 87% of our total revenues in fiscal 2011, while our women’s dresses and casual sportswear and men’s and women’s swimwear markets represented approximately 13% of our total revenues in fiscal 2011. Finally, our U.S. based business represents approximately 91% of total revenues, while our foreign operations represented 9% for fiscal 2011.
Our licensing business is a significant contributor to our operating income. We license the brands we own to third parties for the manufacturing and marketing of various products in distribution channels and countries in which we do not distribute those brands, including men’s and women’s apparel and footwear, men’s suits, underwear, loungewear, outerwear, fragrances, eyewear and accessories. These licensing arrangements heighten the overall awareness of our brands without requiring us to make capital investments or incur additional operating expenses.
Our Competitive Strengths
We believe that our competitive strengths position us to capitalize on several trends that have affected the apparel industry in recent years. These trends include:
| • | the consolidation of the department and chain store distribution channels into a smaller number of larger retailers, |
3
Table of Contents
| • | the increased dependence of retailers on reliable suppliers who have design expertise, advanced systems and technology, and the ability to quickly meet changing consumer tastes, |
| • | the continued importance of strong brands as a source of product differentiation, and |
| • | planning, sourcing, replenishment requirements from customers versus managed inventory capabilities of vendors. |
We believe that we have the following competitive strengths in our industry:
Portfolio of nationally and internationally recognized brands. We currently own or license a portfolio of over 30 brands, which enjoy high recognition within their respective consumer segments. Our brands attract a loyal following of consumers and retailers who desire high quality, well-designed fashion apparel and accessories. We have developed our premier brand, Perry Ellis, into an American sportswear lifestyle brand. Our other owned brands include well-known names such as Cubavera, the Havanera Co., Original Penguin, Rafaella, Laundry by Shelli Segal, C&C California, Redsand, Gotcha and Jantzen. Additionally, we license various brands including Callaway Golf, Top-Flite, Nike, JAG, PGA TOUR and Pierre Cardin. To broaden our brands’ consumer reach into additional categories and geographies, we also license several of our owned brands to third parties. We believe our strong brand recognition supports the strength of the business by helping to define consumer preferences and drive selling space at retailers.
Diversified business model. We believe that our diversified business model allows us to maximize the reach of our brand portfolio while reducing the risk associated with any single brand, product category or point of distribution. We view our business as being diversified:
By brand: We maintain a global portfolio of over 30 highly recognized brands that appeal to fashion conscious consumers across various income levels. We design, source, market and license most of our products on a brand-by-brand basis targeting distinct consumer demographic and lifestyle profiles. For example, we market the Perry Ellis and Original Penguin brands to higher-income consumers and market the Grand Slam, John Henry and the Havanera Co. brands to middle-income consumers. We also market brands that target women through our Laundry by Shelli Segal and C&C California brands, through our family of swimwear products, which include Jantzen, Nike, JAG and Perry Ellis, and through our January 2011 acquisition of the Rafaella brand.
By product: We design and market apparel and accessories in a broad range of both men’s and women’s product categories, which we believe increases the stability of our business. Our menswear offerings include casual sportswear and bottoms, dress shirts and pants, jeans wear, golf apparel, sweaters, sports apparel, swimwear and swim accessories, active wear, outerwear and leather accessories. Our womenswear offerings include dresses, sportswear, swimwear, and swim accessories, and with our 2011 acquisition of the Rafaella brands, we further expanded our sportswear offerings. We believe that our product diversity decreases our dependence on a single product line or fashion trend and contributes substantially to our growth opportunities.
By distribution channel: We market our products across multiple levels of retail distribution, allowing us to reach a broad range of consumers domestically and internationally. We distribute our products through luxury stores, department stores, national and regional chain stores, mass merchants, specialty stores, sporting goods stores, the corporate wear market, e-commerce, as well as clubs and independent retailers. Our products are distributed through approximately 15,000 doors at some of the nation’s leading retailers, including Kohl’s, Macy’s, TJ Maxx / Marshalls, Dillard’s, Sam’s and J.C. Penney. We also distribute our products through our own retail stores, which include 38 Perry Ellis and three Original Penguin retail outlet stores and one Perry Ellis, one Cubavera and seven Original Penguin full-price retail stores. We also operate e-commerce sites for several of our brands. Finally, we have successfully expanded product and brand distribution in the United Kingdom, Canada, Mexico and Europe, and believe additional opportunities exist for further international expansion of our brand base.
4
Table of Contents
The following table illustrates the current diversity of the brands and products we produce and market and their respective distribution channels:
| Distribution Channels |
Sportswear |
Bottoms/ Jeans Wear |
Golf |
Action Sportsbrands/ Swim | ||||
| Luxury Stores | Original Penguin Tricots St. Raphael Axis Laundry by Shelli Segal C&C California |
Original Penguin | Callaway Golf | |||||
| Department Stores | Perry Ellis | Perry Ellis | Callaway Golf | Perry Ellis | ||||
| Perry Ellis Portfolio Savane Cubavera Laundry by Shelli Segal Rafaella Rafaella Form & Function |
Perry Ellis Portfolio Savane Store Brands Pierre Cardin |
PGA TOUR Champions Tour |
Nike Swim Jantzen Redsand MCD JAG | |||||
| Chain Stores | Natural Issue The Havanera Co. Axist John Henry Pierre Cardin Centro |
Natural Issue Axist Store Brands |
PGA TOUR Pro Player Grand Slam |
Nike Swim Gotcha Girl Star JAG | ||||
| Mass Merchants | Solero Store Brands |
Store Brands | Top-Flite Store Brands |
|||||
| Corporate/Resort | Cubavera | Callaway Golf PGA TOUR Munsingwear |
||||||
| Specialty Stores | C&C California Laundry by Shelli Segal Original Penguin |
Jantzen Nike Swim Gotcha MCD Redsand JAG | ||||||
| International(1) | Perry Ellis Original Penguin Manhattan Mondo di Marco Farah Laundry by Shelli Segal |
Perry Ellis Original Penguin Farah |
Grand Slam | Jantzen Nike | ||||
| Direct Retail | Original Penguin Perry Ellis Cubavera C&C California |
Original Penguin Perry Ellis |
Original Penguin | |||||
| (1) | This channel includes Company operated retail stores and concession locations. |
Strong relationships with our retailers. We believe that our established relationships with retailers allow us to maximize the selling space dedicated to our products, monitor our brand presentation and merchandising selection, and proactively introduce new brands and products. Because of our quality brands and products, dedication to customer service, design expertise and sourcing capabilities, we have developed and maintained long-standing relationships with our largest customers.
5
Table of Contents
Solid licensing capabilities and relationships. We license many of the brands we own, and, as a result, have gained significant experience in identifying potential licensing opportunities. We have established relationships with many licensees and believe these relationships provide opportunities to grow our revenues and earnings while minimizing capital expenditures and execution risk. We believe that our broad portfolio of brands also appeals to licensees because our brands (i) are solidly positioned in retail outlets at all major levels of retail distribution, (ii) have increased our exposure nationally and internationally and (iii) give licensees the opportunity to sell their products into different distribution channels. For example, a manufacturer of women’s leather bags might license the Laundry by Shelli Segal brand to enter the luxury store channel. By licensing our owned brands, we offer consumers a complete product assortment by brand. We also coordinate our marketing efforts with licensees, thereby maximizing exposure for our brands and our return on investment.
Sophisticated global low-cost sourcing capabilities. We have sourced our products globally for over 45 years and employ sophisticated logistics and supply chain management systems to maintain maximum flexibility. Our network of worldwide company owned sourcing offices and some agents enables us to meet our customers’ needs in an efficient and high quality manner without relying on any one vendor, factory, or country. In fiscal 2011, based on the total units, we sourced our products from Asia (84%), the Americas (8%) and the Middle East (8%). We maintain a staff of over 200 experienced sourcing professionals in six offices in China (including two in Hong Kong), as well as in the United States, South Korea, Taiwan, and Vietnam. Our sourcing offices closely monitor our suppliers and provide strict quality assurance analyses that allow us to consistently maintain our high quality standard for our customers. We have a compliance department that works closely with our quality assurance staff to ensure that our sourcing partners comply with Company-mandated and country-specific labor and employment regulations. We believe that sourcing our products overseas allows us to manage our inventories more effectively while avoiding capital investments in production facilities. Because of our sourcing experience, capabilities and relationships, we believe that we are well positioned to take advantage of the changing textile and apparel quota environment.
Design expertise and advanced technology. We maintain a staff of designers, merchandisers and artists who are supported by a staff of design professionals, including assistant designers, technical designers, graphic artists and production assistants. Our in-house design staff designs substantially all of our products using advanced computer-aided design technology that minimizes the time-intensive and costly production of sewn prototypes prior to customer approval. In addition, this technology provides our customers with products that have been custom designed for their specific needs and meet current fashion trends. We employ advanced fabric and design technologies to ensure a proper fit and outstanding performance when we create our women’s and men’s swimwear. We regularly upgrade our computer technology to enhance our design capabilities, facilitate communication with our global suppliers and customers on a real-time basis, react faster to new product developments by competitors and meet changes in customer needs.
We use an Oracle Retail system, which enhances our sales planners’ ability to manage our retail customers’ inventory at the SKU level. This system helps maximize the sales and margins of our products by increasing inventory turns for the retailer, which in turn reduces our product returns and markdowns and increases our profitability. We use both PerrySolutions in-house software and Oracle Retail during the assortment planning process to allocate the correct quantities for the initial rollout of product at retail.
Proven ability to integrate acquisitions. We have been successful in selectively acquiring, managing, developing and positioning more than 30 highly recognized brands within our business, including Munsingwear (1996), Perry Ellis (1999), John Henry (1999), Manhattan (1999), Jantzen (2002), the brands owned by Perry Ellis Menswear, LLC and Redsand (2003), Farah and Savane (2005), the action sports Gotcha, Girl Star and MCD brands (2005/2006), the women’s contemporary brands, Laundry by Shelli Segal and C&C California (2008) and most recently Rafaella (2011).
6
Table of Contents
As part of an extensive integration process for each brand, we have:
| • | improved the responsiveness to market trends by applying our design and sourcing expertise, |
| • | communicated positioning of our new brands through various wide-ranging marketing programs, |
| • | solidified our management team to design, market and license brands, |
| • | repositioned the brands into different distribution channels to address the needs in those channels, |
| • | renegotiated existing licensing agreements and sought new licensing opportunities in new segments and markets, and |
| • | extended our sourcing and distribution capabilities to the products to include international wholesale and retail distribution. |
Experienced management team. Our senior management team averages more than 30 years in the apparel industry and has extensive experience in growing and rejuvenating brands, structuring licensing agreements, and building strong relationships with global suppliers and retailers. George Feldenkreis, our chairman and chief executive officer, and Oscar Feldenkreis, our vice chairman, president and chief operating officer, have employment agreements through January 31, 2013. Additionally, we have an established and highly experienced team of senior managers who support our business.
Our Business Strategy
Our strategy is to continue to pursue our three-dimensional approach to growth and profitability by developing and enhancing our portfolio of brands, increasing the scope and diversity of our product offerings and broadening distribution for our brands. The key elements of our business strategy include the following:
Continue to strengthen the competitive position and recognition of our brands. We intend to continue enhancing the recognition of our brands by aggressively marketing them to both consumers and retailers. We manage each brand individually, developing a distinct brand and marketing strategy for every product category and distribution channel. We participate in cooperative advertising in print and broadcast media, as well as market directly to consumers through billboards, event and celebrity sponsorships, special event advertisements, online through our e-commerce platform and viral marketing initiatives, and advertisements in selected periodicals. In addition, we continue to have a strong presence at trade shows, such as “M.A.G.I.C.” in Las Vegas, Market Week in New York, PGA in Orlando, Bread and Butter in Europe and golf, surf and swim shows and events throughout the world. Licensing our brands to third parties also enhances brand recognition by providing increased customer exposure domestically and internationally, as well as opportunities for future product extensions.
Continue to diversify our product line. We intend to continue to expand the range of our product lines, thereby capitalizing on the name recognition, popularity, and target customer segmentation of our major brands. For example, our Jantzen acquisition took us into the swim and swim accessories markets, and through the Nike swim and JAG brands into the sports distribution and swim department stores channels. We have used the expertise developed through Jantzen, coupled with the power of the Perry Ellis and Original Penguin brands, to successfully expand our swim business. With the acquisitions of the Rafaella, Laundry by Shelli Segal and C&C California brands, we have significantly strengthened our position in women’s apparel in the United States. Our recent Rafaella acquisition provides us with the potential for product extensions and synergies throughout the Laundry by Shelli Segal, C&C California and Perry Ellis brands. We also see opportunity for the production of swimwear lines for these brands and the licensing of accessories, footwear and fragrances categories. Finally, we will seek further expansion of our womenswear offerings through a continued launch of e-commerce sites.
7
Table of Contents
Increase penetration in each channel. We will continue to selectively pursue new ways to increase our penetration of existing channels of distribution for our products, focusing on maintaining the integrity of our products and reinforcing our image at existing and new retail stores. We will seek to introduce our products to geographic areas and consumer sectors that are presently less familiar with our products. We will also seek to expand our business with our existing customers by offering them products that are compelling and different from those in the marketplace and by capitalizing on our relationships with them by offering them more of our products.
Adapt to our continually changing marketplace. We will continue to make the necessary investments and implement strategies to meet the growing needs of our customers on a timely basis in the ever-changing apparel industry. We are currently focusing on expanding our business in the following areas:
| • | We have successfully focused on Hispanics, the largest minority group in the United States, by developing the Cubavera, the Havanera Co., Centro and Solero brands. These brands specifically target the Hispanic market and consumers that embrace the Hispanic lifestyle brands. We also develop and sell to retailers Hispanic-inspired sportswear under private label brands. We look to continue expansion of this product category. |
| • | We re-introduced the Original Penguin brand, to target both Generation X and Generation Y, who are suburban upper-middle class. The product line is primarily sold at upscale department and upper tier specialty stores, as well as in seven of our own upscale retail locations. We believe this brand has continued growth opportunities as we expand our product categories into premium denim and women’s sportswear and dresses, as well as expanding our distribution to include an increasing number of direct retail store locations. |
| • | With the acquisition of the Laundry by Shelli Segal, C&C California and Rafaella brands, we significantly strengthened our position in women’s apparel in the United States. The Rafaella acquisition provides us with the potential for product extensions and synergies throughout the Laundry by Shelli Segal, C&C California and Perry Ellis Brands. We see opportunity for the production of swimwear lines for these brands. We also see additional potential by licensing out accessories, footwear and fragrances. |
| • | With the acquisition of the Gotcha, Girl Star and MCD brands, coupled with the growth of our Redsand brand, we will continue to pursue ways to increase our penetration of the action sports brand category. |
| • | We are a top producer of golf lifestyle products with multiple brands including Callaway Golf, PGA TOUR, Grand Slam, and Champions Tour, across multiple distribution channels and look for further expansion in this area. We added Callaway Golf and Top-Flite to our portfolio of golf, during fiscal 2010, which allows us to leverage our design and sourcing capabilities as we distribute for Callaway. |
| • | We expect to increase the presence of our brands in Europe by leveraging our United Kingdom market position with our Farah brand bottoms. We successfully introduced the Original Penguin brand on a pan European basis in fiscal 2007. We look to generate further expansion of Original Penguin and of our other brands internationally. |
| • | We are focused on several initiatives to increase our direct to consumer sales, including further expansion of our full-priced retail, our outlet stores and our continued launch of E-commerce web sites. |
Expand our licensing opportunities. Licensing our brands to third parties enhances brand recognition by providing increased customer exposure domestically and internationally, as well as opportunities for future product extensions. We intend to continue to license our brands to existing and new licensees as profitable opportunities arise and expand our licensing activities in home, womenswear, sportswear, and fragrances across all geographies. We will continue to provide our licensing partners with strong brands, design expertise and innovative marketing strategies. In addition to the revenues and brand awareness that licensing provides us, we also believe that licensing our brands benefits us by providing significant high-margin operating income.
8
Table of Contents
Pursue strategic acquisitions and opportunities that leverage and enhance our business platforms. We intend to continue our strategy of making selective disciplined acquisitions to expand our portfolio of brands and add new product categories. We intend to pursue acquisition opportunities in a disciplined and opportunistic manner and focus on products or categories that have high consumer awareness and are difficult to duplicate from a technical or logistical standpoint. We will also continue to internally develop new brands and logical extensions of existing brands as opportunities in the marketplace arise. Since our initial public offering in 1993, we have acquired, or obtained licenses for, many brands, including Munsingwear, Perry Ellis, John Henry, Manhattan, Jantzen, JAG, Nike, Mondo di Marco, Axis, Tricots St. Raphael, Redsand, Pro Player, PGA TOUR, Savane, Farah, Champions Tour, Gotcha, Girl Star, MCD, Laundry by Shelli Segal, C&C California, Callaway Golf, Top-Flite, Pierre Cardin, and most recently, Rafaella. We believe that our history of selectively acquiring under-marketed or under-performing brands and incorporating them into our efficient infrastructure generates a superior return on investment for us.
Recent Developments
On March 2, 2011 we entered into underwriting agreements with Merrill Lynch, Pierce, Fenner & Smith Incorporated and Deutsche Bank Securities Inc., as representatives of the underwriters that are parties thereto (the “Underwriting Agreements”) in connection with common stock and senior subordinated offerings.
Pursuant to the Underwriting Agreement relating to the common stock offering, we agreed to sell, and the underwriters agreed to purchase, 2.0 million shares of our common stock at a price to the public of $28.00 per share and an underwriting discount of $1.40 per share, resulting in net proceeds to us before offering expenses of $26.60 per share, or $53.2 million in aggregate net proceeds. We used the net proceeds from the common stock offering to repay a portion of the amounts outstanding under our senior credit facility.
Pursuant to the Underwriting Agreement relating to the senior subordinated notes offering, we agreed to sell, and the underwriters agreed to purchase, $150 million in aggregate principal amount of our 7 7/8% Senior Subordinated Notes Due 2019 at a price to the public of 100.00% of par and an underwriting discount of 2.0%, resulting in aggregate net proceeds to us of $147.0 million,. We used the net proceeds of the senior subordinated notes offering first to redeem our outstanding 8 7/8% Senior Subordinated Notes Due 2013 at a redemption price of 101.4792% of the outstanding principal amount, plus accrued and unpaid interest, and the remaining net proceeds were used to repay a portion of the amounts outstanding under our senior credit facility.
On January 28, 2011, we completed the acquisition of substantially all of the assets of Rafaella Apparel Group, Inc., an entity controlled by affiliates of Cerberus Capital Management, L.P. Rafaella is a leading designer, sourcer, marketer and distributor of a full line of women’s sportswear. The consideration paid by us totaled $80 million in cash and a warrant to purchase 106,564 shares of our common stock. This purchase included Rafaella’s inventory, receivables, purchase orders and intellectual property. We assumed certain liabilities of Rafaella, including, among other things, certain accounts payable, accrued liabilities and certain letters of credit. We funded the acquisition through our senior credit facility.
The acquisition of the Rafaella brands provides us with the opportunity to extend product offerings to additional retail customers. We also see the opportunity to build sportswear collections under our existing brands such as Laundry by Shelli Segal, C&C California and Perry Ellis. The Rafaella brands target a value-conscious, yet fashion-minded, consumer and are distributed through several major department stores.
In August 2009, we entered into a licensing agreement with Pierre Cardin to design, manufacture, and distribute Pierre Cardin sportswear apparel in the United States, Puerto Rico, and the U.S. Virgin Islands.
In March 2009, we entered into a licensing agreement with Callaway Golf Company to design, manufacture and distribute Callaway golf and sportswear apparel in North America. Subsequently, we amended the licensing agreement to include Top-Flite.
9
Table of Contents
In February 2008, we completed the acquisition of Laundry by Shelli Segal and C&C California brands from Liz Claiborne Inc. (“Liz Claiborne”) for $34.0 million, including all rights, titles, interests, tangible and intangible assets, and $6.9 million of inventory. We funded this acquisition through our senior credit facility.
Brands
In fiscal 2011, approximately 82% of our net sales were from branded label sales compared to 83% in fiscal 2010. We currently own and license nationally and internationally over 30 recognized brands and the products are sourced for and sold throughout all major levels of retail distribution. Our owned brands include the Perry Ellis family of brands, Axis, Tricots St. Raphael, Jantzen, John Henry, Cubavera, the Havanera Co., Centro, Solero, Natural Issue, Munsingwear, Grand Slam, Original Penguin, Mondo di Marco, Redsand, Pro Player, Manhattan, Axist, Savane, Farah, Gotcha, Girl Star, MCD, Laundry by Shelli Segal, C&C California, and Rafaella. We also distribute the Nike, JAG, Champions Tour, PGA TOUR, Callaway Golf, Top-Flite and Pierre Cardin brands under license arrangements.
We license, our premier brand, Perry Ellis, and many of our other brands for products in distribution channels in which we do not sell directly to retailers. In addition, we license our brands internationally. Our depth of brand selection enables us to target consumers across a wide range of ages, incomes and lifestyles, reduces our reliance on any single distribution channel, customer or demographic group, and minimizes competition among brands.
Perry Ellis. The Perry Ellis, Perry Ellis Portfolio and Perry Ellis America brands together propose a lifestyle inspired by a witty vision of American Sportswear updated to address current trends, and does so with a strong focus on quality, value, comfort and innovation. The Perry Ellis lifestyle appeals primarily to higher-income, fashion conscious, professional men. The Perry Ellis branded products are sold in upscale and major department stores, both domestic and international, as well as online at www.perryellis.com and at branded stores. We also license the Perry Ellis brand to third parties for a wide variety of apparel and non-apparel products.
Axist. The Axist brand offers trend right fashion and style for today’s discerning male consumer and is exclusively sold at Kohl’s.
Axis. The look and feel of Axis is inspired by the casual yet spirited energy of the West Coast lifestyle. The collection’s ‘modern-yet-casual’ wovens, knits, sweaters, blazers and bottoms are characterized by exceptionally soft fabrics and garment details which utilize interesting aging and washing techniques. Carried in luxury and regional department stores around the country, the label was established in the 1980s and has continuously defined casual “trend right” sportswear for the upper-tier market.
C&C California. Based in Los Angeles, C&C California was founded in 2003, creating vintage-inspired tees from ultra-soft cotton in a wide range of exuberant colors. C&C California designs and markets a sportswear collection for women, including woven tops, bottoms and premium cashmere sweaters. With a cult celebrity fan base the label is known for its soft-handed, quality fabrics. C&C California creates sophisticated, chic, California inspired apparel with an emphasis on refined sexiness, comfort and subtle detailing in vibrant colors, targeting the fashion conscious customer, regardless of age. C&C California is distributed through specialty retailers, luxury department stores and its own website www.candccalifornia.com.
Laundry by Shelli Segal. Laundry by Shelli Segal, founded in 1988, has been a leader in the contemporary dress market for over 20 years. The label is a reflection of the “LA Girl” – feminine and contemporary with a fun and flirty attitude, always demanding the next fashion statement. Laundry by Shelli Segal offers must-have clothes for a 24/7 lifestyle, from work to play, bringing luxury and creating fashion forward designs for the consumer in the know. Sought after by fashionistas and Hollywood A-listers alike, the label attracts multiple celebrities. The brand is available in premium department stores and luxury specialty retailers, as well as internationally. Laundry by Design (“LBD”), the little sister of Laundry by Shelli Segal, is the collection inspired by the next generation girl who loves to shop and stand out in the crowd. LBD is value priced and answers the need for the more youthful, carefree girl that wants the of-the-moment trends.
10
Table of Contents
Rafaella. Founded in 1982, Rafaella focuses on understanding the needs of the modern woman who leads an on-the-go lifestyle. The brand’s continued success is a result of combining luxury fabrics and great style with an impeccable fit, and is how the brand eventually became famous for “The Perfect Fitting Pant”. The brand is currently distributed through better department stores.
Original Penguin. We re-introduced the Original Penguin brand with its signature penguin icon logo in fiscal 2003, which is a lifestyle product for the Generation X and Y men in the urban and suburban upper-middle class. The Original Penguin lifestyle re-defines the terms geek-chic and eccentric preppy with a strong focus on Americana and vintage inspired looks. The line offers a complete array of products updating the looks that its targeted consumers’ fathers loved to wear. The product line is sold worldwide at upscale department and upper tier specialty stores and includes apparel, shoes and accessory items. The brand is also sold through 10 stand-alone stores in the USA and several international flagships in Great Britain, South Africa, Argentina, Chile and the Philippines. It is also sold online at www.originalpenguin.com.
Jantzen. The Jantzen brand signifies leadership in style, innovation and fashion, as we celebrated our centennial anniversary. For over 100 years, Jantzen has fused chic global aesthetics with iconic and authentic style. The brand’s signature red diving girl logo is one of the most recognized icons today. Timeless glamour combined with our modern day approach to marketing will continue to elevate the brand. The collection is sold in upscale, specialty and major department stores.
Cubavera, the Havanera Co, Centro, and Solero. Our Hispanic heritage brands appeal to a multicultural consumer. The collections are designed with cross generational and crossover appeal while embracing the Hispanic lifestyle. Cubavera is currently sold in major department stores as well as specialty stores around the country, while the Havanera Co., Centro, and Solero brands are sold exclusively at J.C. Penney, Kohl’s, and Kmart, respectively. Cubavera is also sold in one stand-alone retail store and on line at www.cubavera.com.
Grand Slam. Grand Slam is America’s golf heritage brand. In 1951, Grand Slam introduced the world famous golf shirt with patented underarm gusset, which allowed for a full and even swing. Today, this heritage is brought to life through a performance golf line that reflects a classic golf lifestyle. The Grand Slam brand is sold exclusively at Kohl’s.
Savane. The Savane brand is an established brand with a dynamic history of being a leader in delivering product newness and performance innovations in men’s bottoms. The Savane collection offers an array of styles, silhouettes and fabrications for every wearing occasion, and can be found in major department stores and specialty retailers.
Farah. Farah was born in the 1920s in El Paso, Texas, and became a cult classic in the United Kingdom in the 1970s. The brand has recently been resurrected to capture the interest of young, fashion-conscious men through innovative marketing and sportswear which draws inspiration from Farah design archives. Meanwhile, a line of Farah brand bottoms appealing to comfort- and value-minded men currently holds a large market share position in the U.K. Its products are widely distributed in premium and better department stores, specialty stores, discount club markets.
John Henry. John Henry offers a dress casual collection perfect for “9 to 9 dressing” with an updated attitude while offering quality and value. The brand is available at national and regional stores.
Natural Issue. Since its inception, Natural Issue has supplied price conscious men with the higher-end looks they covet. The product line, including dress casual shirts, sweaters and pants, is primarily sold at national and regional chain stores.
11
Table of Contents
Gotcha. Launched in 1978 from a Laguna Beach, California garage, Gotcha transformed the surf market through its incredible product, advertising, events and athletes. Gotcha celebrated its 30th anniversary as an action sports leader in 2008. Marketed as an accessible California youth lifestyle brand and widely distributed to mid-tier and action sports accounts. Gotcha enjoys a globally recognized icon and is sold in over twenty countries across five continents.
Redsand. Rooted in the coastal lifestyle of Southern California, the independent spirit of this brand is influenced by a passion for surf, travel, music, and art. Featuring an organic sensibility, creative details and a timeless look, Redsand is designed to inspire self-expression. The brand is sold at regional department stores.
Pro Player. Pro Player is an active sports brand with unisex and cross-generational appeal. The brand is committed to innovative design and quality fabrics, and appeals to health conscious individuals who enjoy a variety of indoor and outdoor sporting activities. The brand is sold at national and regional chain and sporting goods stores.
MCD. MCD delivers authentic California street wear design to progressive youth consumers, focusing on action sports specialty market.
Manhattan. The Manhattan brand’s dress casual apparel features an accessible price point and is sold primarily to mass merchants and upscale specialty stores internationally.
Tricots St. Raphael. Throughout 30 years Tricots St. Raphael has built a reputation of luxury and sophistication. Impeccably designed sweaters and knits provide discerning men with distinctive patterns and a rich harmony of colors to outfit their refined lifestyle. Sportswear and sweaters are primarily targeted to department stores.
Mondo di Marco. The Mondo di Marco collection represents the essence of its Italian heritage with a modern sportswear approach and appeals to status-driven men. The brand is primarily targeted to department stores and upper tier specialty stores.
PGA TOUR and Champions Tour. We are the exclusive U.S. men’s apparel licensee for the PGA TOUR and Champions Tour brands for department and chain store channels of distribution. This license was originally acquired in 2004 and has recently been extended through 2012. The PGA TOUR features the game’s biggest names and most competitive players in the world. The official season is covered in virtually every major market in North America with hundreds of thousands of on-site fans and millions of television viewers worldwide. The brand is sold to mid-tier department stores and sporting good stores. Our agreement with the PGA TOUR also includes the rights to sell apparel under the Champions Tour label. The Champions Tour showcases the most accomplished and revered players in golf. Formerly called the Senior PGA TOUR, the Champions Tour has been labeled the most successful senior sports venture in history. Champions Tour apparel is sold in major department and national chain stores, as well as in the off-course golf channel. Products under both the PGA TOUR and the Champions Tour label include golf shirts, outerwear, sweaters, pants and shorts.
Nike. We are the swimwear licensee in the USA, Canada and Mexico for Nike, the world’s leading sports and fitness company, to design, market and distribute men’s, women’s and children’s competitive and active swimwear, as well as swim related apparel and accessories. Nike swim products are sold throughout team dealers, sporting goods, better specialty and department stores. The agreement was recently renewed and runs through 2014.
Jag. We acquired the license for Jag in 2006. This brand has been a major player in the swimwear arena for the past two decades. Jag swimwear is intended for an active woman seeking functionality and style from her swimwear. It is sold in major department stores, national chains and specialty stores. The current agreement runs through June 2014.
12
Table of Contents
Callaway Golf. We became the official apparel licensee of Callaway Golf Company in March 2009. We have licensed the use of the Callaway Golf trademark to design, source and sell Callaway Golf brand apparel in North America. The Callaway Golf apparel men’s collection and sport range includes classic and fashion lines featuring knit and woven shirts, pullovers, jackets, sweaters, vests, pants, shorts, headwear and accessories. The collection range designs focus on sophisticated styling using luxury fabrics while the sport range designs aim to appeal to the active consumer. The agreement runs through December 2014 with an option for an extension until 2019.
Pierre Cardin. We became the licensee for Pierre Cardin in fiscal 2010 for the following categories in the United States, Puerto Rico and the U.S. Virgin Islands: outerwear, warm up suits, knits, sweaters, casual bottoms and denim. One of the world’s iconic fashion brands, Pierre Cardin is celebrating its 60th anniversary in 2010, and it is still one of the most recognized brand names in the industry. Known for its avant-garde styling and futuristic design, the brand is a fusion of French savoir-faire and New York metropolitan style. Color, patterns and design details give it a modern edge that is targeted to a cross-generational man. Carried in mid-tier department stores, the label offers easy-care fashion at accessible prices. The agreement runs through June 2015.
Private Label. In addition to our sales of branded products, we sell products to retailers for sale under the labels of their own store lines. We sell private label products to Kohl’s, Dillard’s, J.C. Penney, Sears, BJ’s Wholesale Club, and Stein Mart, Inc. Private label sales generally yield lower gross margins than sales of comparable branded products. Private label sales accounted for approximately 18% and 17% of our net sales during fiscal 2011 and 2010, respectively. The majority of our fiscal 2011 and 2010 private label sales related to our bottoms product category, which utilizes our production and replenishment expertise.
Products and Product Design
We offer a broad line of high quality men’s casual sportswear, dress shirts and pants, jeans wear, golf apparel, sweaters, sports apparel, outerwear, swimwear and swim accessories, active wear and leather accessories. Our women’s wear offerings include dresses, casual sportswear, swimwear and swim accessories. Substantially all of our products are designed by our in-house staff utilizing our advanced computer-aided design technology. This technology enables us to produce computer-generated simulated samples that display how a particular style will look in a given color and fabric before it is actually produced. These samples can be printed on paper or directly onto fabric to accurately present the colors and patterns to a potential customer. In addition, we can quickly alter the simulated sample in response to our customers’ needs, such as change of color, print layout, collar style and trimming, pocket details and/or placket treatments. The use of computer-aided design technology minimizes the time-consuming and costly need to produce actual sewn samples prior to retailer approval, allows us to create custom-designed products meeting the specific needs of customers and reduces a product’s time to market, from conception to the delivery of the product to customers.
In designing our apparel products, we seek to promote consumer appeal by combining functional, colorful and high quality fabrics with creative designs and graphics. Styles, color schemes and fabrics are also selected to encourage consumers to coordinate outfits and form collections, thereby encouraging multiple purchases. Our designers stay abreast of the latest design trends, fabrics, colors, styles and consumer preferences by attending trade shows, periodically conducting market research in Europe, Asia and the United States and using outside consultants. Our purchasing department also seeks to improve the quality of our fabrics by staying informed about the latest trends in fabric all over the world. In addition, we actively monitor the retail sales of our products to determine changes in consumer trends.
In accordance with standard industry practices for licensed products, we have the right to approve the concepts and designs of all products produced and distributed by our licensees.
13
Table of Contents
Our products include:
Tops. We offer a broad line of sport shirts, dress shirts, sweaters, fleece, outerwear and jackets. This includes cotton and cotton-blend printed, yarn-dyed and solid knit shirts, cotton woven shirts, silk, cotton and rayon printed button front sport shirts, linen sport shirts, golf shirts, and embroidered knits and woven shirts. Our shirt line also includes dress shirts, dress casual shirts, brushed twill shirts, jacquard knits and yarn-dyed flannels. Additionally, we are one of the leading distributors of guayabera-style shirts in the United States. We market shirts under a number of our own brands as well as the private labels of our retail customers. Our tops are produced in a wide range of men’s sizes, including sizes for the big and tall men’s market. Sales of tops accounted for approximately 44%, 42% and 45% of our net sales during fiscal 2011, 2010, and 2009, respectively.
Bottoms. Our bottoms line includes a variety of styles of wool, wool-blend, linen and polyester/rayon dress pants, casual pants in cotton and polyester/cotton and linen/cotton walking shorts. We market our bottoms as single items or as a collection to complement our shirt lines. Sales of bottoms accounted for approximately 38%, 39% and 38% of our net sales during fiscal 2011, 2010, and 2009, respectively.
Swimwear. Our swimwear line includes women’s, men’s and junior’s swimwear and accessories. Sales of swimwear and accessories accounted for approximately 10%, 11% and 11% of net sales during fiscal 2011, 2010 and 2009, respectively.
Women’s Dress and Contemporary. Laundry by Shelli Segal and C&C California have increased our distribution of women’s contemporary products, both in the dress and sportswear product category. During 2011, 2010 and 2009, sales in this product category represented approximately 3% of net sales.
Accessories. We also offer accessories under our existing brands, as well as private label. The majority of the accessories we sell are leather accessories. Accessories accounted for approximately 5%, 5% and 3% of net sales during each of fiscal 2011, 2010 and 2009, respectively.
Licensing Operations
We license the brands we own to third parties for various product categories in distribution channels and countries where we do not distribute our brands. Licensing enhances the images of our brands by widening the range, product offerings and distribution of products sold under our brands without requiring us to make capital investments or incur additional operating expenses. As a result of this strategy, we have gained experience in identifying potential licensing opportunities and have established relationships with many licensees. Our licensing operation is also a significant contributor to our operating income.
As of January 29, 2011, we were the licensor in 134 license agreements, 3 worldwide, 37 domestic and 94 international, for various products including footwear, men’s suits, sportswear, dress shirts and bottoms, underwear, loungewear, outerwear, active wear, neckwear, fragrances, eyewear, accessories and home. Wholesale sales of licensed products by our licensees were approximately $530 million, $500 million and $511 million in fiscal 2011, 2010, and 2009, respectively. We received royalties from these sales of approximately $26.4 million, $24.9 million and $25.4 million in fiscal 2011, 2010, and 2009, respectively. We believe that our long-term licensing opportunities will continue to grow domestically and internationally. See our Consolidated Financial Statements and the related notes in this report for further information.
Although the Perry Ellis brand has international recognition, we still perceive the brand to be under-penetrated in international markets such as Europe, Latin America and Asia. We are actively attempting to obtain licensees for the Perry Ellis brand in international markets. We believe that our brand and licensing experience will enable us to capitalize on these international opportunities and that our operations in the United Kingdom will assist us in this endeavor. In addition, we believe that the Jantzen brand’s history of over a century will allow us to take advantage of many domestic and international licensing opportunities.
14
Table of Contents
In the contemporary market, we have been successful with licensing our Original Penguin brand, both domestically and internationally, in categories such as footwear, eyewear, hats, watches and neckwear. We also believe the addition of Laundry by Shelli Segal and C&C California, and most recently Rafaella provides multiple licensing opportunities such as accessories, footwear and fragrance.
To maintain a brand’s image, we closely monitor our licensees and approve all licensed products. In evaluating a prospective licensee, we consider the candidate’s experience, financial stability, manufacturing performance and marketing ability. We also evaluate the marketability and compatibility of the proposed products with our other products. We regularly monitor product design, development, merchandising and marketing of licensees, and schedule meetings throughout the year with licensees to ensure quality, uniformity and consistency with our products. We also give our licensees a view of our products and fashion collections and our expectations of where its products should be positioned in the marketplace. In addition to approving, in advance, all of our licensees’ products, we also approve their advertising, promotional and packaging materials.
As part of our licensing strategy, we work with our licensees to further enhance the development, image, and sales of their products. We offer licensees marketing support, and our relationships with retailers help the licensees generate higher revenues.
Our license agreements generally extend for a period of three to five years with options to renew prior to expiration for an additional multi-year period based upon a licensee meeting certain performance criteria. The typical agreement requires that the licensee pay us the greater of a royalty based on a percentage of the licensee’s net sales of the licensed products or a guaranteed minimum royalty that typically increases over the term of the agreement. Generally, licensees are required to contribute to us additional monies for advertising and promotion of the licensed products in their covered territory.
Marketing, Distribution and Customers
We market our apparel products to customers principally through the direct efforts of our in-house sales staff, independent commissioned sales representatives who work exclusively for us, and other non-exclusive independent commissioned sales representatives who generally market other product lines as well as ours. We also attend major industry trade shows and “market weeks” in the apparel industry and trade shows in our swimwear, golf, and corporate businesses.
We operate 38 Perry Ellis and three Original Penguin retail outlet stores, one Perry Ellis and one Cubavera retail store and seven Original Penguin retail stores. We also have e-commerce web sites for our Perry Ellis, Cubavera, Original Penguin brands, and C&C California.
We believe that customer service is a key factor in successfully marketing our apparel products. We coordinate efforts with customers to develop products meeting their specific needs using our design expertise and computer-aided design technology. Utilizing our sourcing capabilities, we strive to produce and deliver products to our customers on a timely basis.
Our in-house sales staff is responsible for customer follow-up and support, including monitoring prompt order fulfillment and timely delivery. We utilize EDI and the Internet for certain customers in order to provide advance-shipping notices, process orders and conduct billing operations. In addition, certain customers use the EDI system to communicate their weekly inventory requirements per store to us. We then fill these orders either by shipping directly to the individual stores or by sending shipments, individually packaged and bar coded by store, to a centralized customer distribution center.
We use PerrySolutions, our software system that enables our sales planners to manage our retail customers’ inventory at the SKU level. This system helps maximize the sales and margins of our products by increasing inventory turns for the retailer, which in turn reduces our product returns and markdowns and increases our profitability. We also use demographic mapping data software that helps us develop specific micro-market plans for our customers and provide them with enhanced returns on our various product lines.
15
Table of Contents
We invested in the Oracle Retail (formally known as Retek and Profit Logic) suite of products with the goal of reducing markdowns, increasing inventory turns and increasing revenues while automating the process. The different modules will allow us to monitor our customers’ product by store and quickly react to changes in consumer behavior. The suite also includes best of breed store inventory and point of sales software, which will allow us to keep just in time inventory at our retail stores. This investment shows our commitment to understanding our consumer in order to strengthen our brands as well as our effort to support the continued expansion of our direct retail businesses. Additionally we invested in Trade Management Oracle Financials software to quickly and positively resolve customer claims, while tracking employee accountability.
We sell merchandise to a broad spectrum of retailers, including national and regional chain, upscale department, mass merchant and specialty stores. Our largest customers include Kohl’s, Macy’s, Dillard’s, Sam’s, and TJ Maxx / Marshalls. We have developed and maintained long-standing relationships with these customers. We also sell merchandise to corporate wear distributors.
Net sales to our five largest customers accounted for approximately 50%, 53% and 46% of net sales in fiscal 2011, 2010, and 2009, respectively. For fiscal 2011, two customers accounted for over 10% of net sales; Kohl’s and Macy’s accounted for approximately 19% and 11% of net sales, respectively. For fiscal 2010, two customers accounted for over 10% of net sales; Kohl’s and Macy’s accounted for approximately 20% and 11% of net sales, respectively. For fiscal 2009, two customers accounted for over 10% of net sales; Kohl’s and Macy’s accounted for approximately 17%, and 12% of net sales, respectively.
Advertising and Promotions
We advertise to customers through print advertisements in a variety of consumer and trade magazines and newspapers and through outdoor advertising such as billboards strategically placed to be viewed by consumers. In order to promote our men’s sportswear at the retail level, we participate in cooperative advertising in print and broadcast media, which features our products in our customers’ advertisements. The cost of this cooperative advertising is shared with our customers. We also conduct various in-store marketing activities with our customers, such as retail events and promotions, the costs of which are shared by our customers. These events and promotions are in great part orchestrated to coincide with high volume shopping times such as holidays (Christmas and Thanksgiving) and Father’s Day. In addition to event promotion, we place perennial displays and signs of our products in retail establishments.
We use direct consumer advertising in select markets featuring the Perry Ellis, Cubavera, the Havanera Co., Jantzen, Savane and Original Penguin brand names through the placement of highly visible billboards, sponsorships and special event advertising. We also maintain informational websites featuring our brands. We create and implement editorial and public relations strategies designed to heighten the visibility of our brands. All of these activities are coordinated around each brand in an integrated marketing approach.
While we continue to utilize traditional marketing and advertising vehicles such as print and media, we have also increased our focus on social media. Utilizing such areas as the company e-commerce platform, brand ambassadors, and Facebook, we have expanded our reach to customers who utilize these branding and shopping forums.
These same strategies, modified for each individual market are used for our international efforts in more than a dozen other countries.
16
Table of Contents
Seasonality and Backlog
Our products have historically been geared towards lighter weight apparel generally worn during the spring and summer months. We believe that this seasonality has been reduced with our introduction of fall, winter and holiday merchandise. The swimwear business, however, is highly seasonal in nature, with the vast majority of our sales occurring in our first and fourth quarter.
We generally receive orders from our retailers approximately five to seven months prior to shipment. For the majority of our sales, we have orders from our retailers before we place orders with our suppliers. A summary of the order and delivery cycle for our four primary selling seasons, excluding swimwear, is illustrated below:
| Merchandise Season |
Advance Order Period |
Delivery Period to Retailers | ||
| Spring | July to September | January to March | ||
| Summer | October to December | April and May | ||
| Fall | January to March | June to September | ||
| Holiday | April to June | October and November |
Sales and receivables are recorded when inventory is shipped. Our backlog of orders includes confirmed and unconfirmed orders, which we believe, based on our past experience and industry practice will be confirmed. As of April 1, 2011, the backlog for orders of our products, all of which are expected to be shipped during fiscal 2012, was approximately $459 million, as compared to approximately $419 million as of April 1, 2010. The backlog as of April 1, 2011 includes orders for Rafaella. The amount of unfilled orders at a point in time is affected by a number of factors, including the mix of product, the timing of the receipt and processing of customer orders and the scheduling of the sourcing and shipping of the product, which in most cases depends on the desires of the customer. Our backlog is also affected by an on-going trend among retailers to reduce the lead-time on their orders. In recent years, our customers have been more cautious of their inventory levels and have delayed placing orders and re-orders compared to our previous experience. Due to these factors a comparison of unfilled orders from period to period is not necessarily meaningful and may not be indicative of eventual actual shipments.
Supply of Products and Quality Control
We currently use independent contract manufacturers to supply the substantial majority of the products we sell. Of the total units of sourced products in fiscal 2011, 84% was sourced from suppliers in Asia, 8% was sourced from suppliers in the Americas and 8% was sourced from suppliers in the Middle East, respectively. We believe that the use of numerous independent contract manufacturers allows us to maximize production flexibility, while avoiding significant capital expenditures, work-in-process inventory build-ups and the costs of maintaining and operating production facilities. We have had relationships with some suppliers for over 30 years, however, none of these relationships are formal or require either party to purchase or supply any fixed quantity of product.
The vast majority of our products are purchased as “full packages,” where we place an order with the supplier and the supplier purchases all the raw materials, assembles the garments and ships them to our distribution facilities or third party facilities.
We maintain a staff of experienced sourcing professionals in six offices in China (including two in Hong Kong), as well as the United States, South Korea, Taiwan, and Vietnam. This staff sources our products worldwide, monitors our suppliers’ purchases of raw material, and monitors production at contract manufacturing facilities in order to ensure quality control and timely delivery. We also operate through independent agents in Asia and the Middle East. Our personnel based in our Miami, Florida office perform similar functions with respect to our suppliers in the Americas. We conduct inspections of samples of each product prior to cutting by contractors, during the manufacturing process and prior to shipment. We also have full-time quality assurance inspectors in Latin America and the Caribbean and in each of our overseas offices.
17
Table of Contents
Generally, the foreign contractors purchase the raw material in accordance with our specifications. Raw materials, which are in most instances made and/or colored especially for us, consist principally of piece goods and yarn and are specified by us from a number of foreign and domestic textile mills and converters.
We are committed to ethical sourcing standards and require our independent contractors to comply with our code of conduct. We monitor compliance by our foreign contract manufacturers with applicable laws and regulations relating to, for example, the payment of wages, working conditions and the environment. As part of our compliance program, we maintain compliance departments in the United States and overseas and routinely perform audits of our contract manufacturers and require corrective action when appropriate.
Import and Import Restrictions
Our import operations are subject to constraints imposed by bilateral trade agreements between the United States and a number of foreign countries. These agreements impose quotas on the amount and type of goods that can be imported into the United States from some countries. Most of our imported products are also subject to United States customs duties.
We closely monitor developments in quotas, duties, and tariffs and continually seek to minimize our exposure to these risks through, among other things, geographical diversification of our contract manufacturers, maintaining our overseas offices, allocating overseas production to product categories where more quotas are available, and shifting of production among countries and manufacturers.
Under the terms of the World Trade Organization (“WTO”) Agreement on Textiles and Clothing, WTO members removed all quotas effective January 1, 2005, and the current environment over textile quotas continues to rapidly change. While the danger of quota embargoes has subsided since the removal of quotas for WTO member countries, threats to some apparel categories in China and Vietnam present themselves on occasion through proposed protectionist legislation in the US Congress. These events are closely monitored and our board and executive level memberships in various apparel trade associations ensure early awareness and communication to our sourcing staff.
We believe that our extensive management and sourcing capability, our flexible sourcing model, and our experience and relationships throughout the world enable us to take advantage of the changing textile and apparel environment. Because of our sourcing experience, capabilities and relationships, we believe we are well positioned to take advantage of the changing textile and apparel quota environment.
Competition
The apparel industry is highly competitive and fragmented. Our competitors include numerous apparel designers, manufacturers, importers, licensors, and our own customers’ private label programs, many of which are larger and have greater financial and marketing resources than we have available to us. We believe that the principal competitive factors in the industry are: (1) brand name and brand identity, (2) timeliness, consistency, reliability and quality of services provided, (3) market share and visibility, (4) price, and (5) the ability to anticipate customer and consumer demands and maintain appeal of products to customers.
We strive to focus on these points and have proven our ability to anticipate and respond quickly to customer demands with our brands, range of products and our ability to operate within the industry’s production and delivery constraints. We believe that our continued dedication to customer service, product assortment and quality control, as well as our aggressive pursuit of licensing and acquisition opportunities, directly addresses the competitive factors in all market segments. Our established brands and relationships with retailers have resulted in a loyal following of customers.
18
Table of Contents
We understand that the level of competition and the nature of our competitors vary by product segment. In particular, in the mass market channel, manufacturers constitute our main competitors in this less expensive segment of the market, while high profile domestic and foreign designers and licensors account for our main competitors in the more upscale segment of the market. Although we have been able to compete successfully to date, there can be no assurance that significant new competitors will not develop in the future.
Trademarks
Our material trademarks are registered with the United States Patent and Trademark Office and in other countries. We regard our trademarks and other proprietary rights as valuable assets that are critical in the marketing of our products, and, therefore, we vigorously protect our trademarks against infringements.
Environmental Matters
We are committed to minimizing the negative impact of our business activities on the environment and believe our operations are in compliance with all applicable laws and regulations. Additionally, our business activities could be negatively impacted by severe weather conditions which could affect the sale of our products or disrupt our sourcing.
Employees
As of April 1, 2011, we had approximately 2,400 employees worldwide compared to approximately 2,200 employees as of March 1, 2010. None of our employees is subject to a collective bargaining agreement. We consider our employee relations to be satisfactory.
Item 1A. Risk Factors
Our business faces certain risks. The risks described below may not be the only risks we face. Additional risks that we do not yet know of or that we currently think are immaterial may also impair our business. If any of the events or circumstances described as risks below or elsewhere in this report actually occurs, our business, results of operations or financial condition could be materially and adversely affected.
We rely on a few key customers, and a significant decrease in business from the loss of any one key customer or key program could substantially reduce our revenues and harm our business.
We derive a significant amount of our revenues from a few major customers. For example, net sales to our five largest customers accounted for approximately 50%, 53% and 46% of net sales for fiscal 2011, 2010 and 2009, respectively. For fiscal 2011, two customers accounted for over 10% of net sales; Kohl’s and Macy’s accounted for approximately 19% and 11% of net sales, respectively. For fiscal 2010, two customers accounted for over 10% of net sales; Kohl’s and Macy’s accounted for approximately 20% and 11% of net sales, respectively. For fiscal 2009, two customers accounted for over 10% of net sales; Kohl’s and Macy’s accounted for approximately 17%, and 12% of net sales, respectively. A significant decrease in business from or loss of any of our major customers could harm our financial condition by causing a significant decline in revenues.
We do not have long-term contracts with any of our customers and purchases generally occur on an order-by-order basis. We believe that purchasing decisions are generally made independently by individual department stores within a company-controlled group. There has been a trend, however, toward more centralized purchasing decisions. As such decisions become more centralized, the risk to us of such concentration increases. Furthermore, our customers could curtail or cease their business with us because of changes in their strategic and operational initiatives, such as an increased focus on private label, consolidation with another retailer, changes in our customer’s buying patterns, financial instability and other reasons. If our customers curtail or cease business with us, our revenues could significantly decrease and our financial condition could be significantly harmed.
19
Table of Contents
Recent and future economic conditions, including turmoil in the financial and credit markets, may adversely affect our business.
Recent economic conditions may adversely affect our business, our customers, and our financing and other contractual arrangements. In addition, conditions may remain depressed in the future or may be subject to further deterioration. Recent and future developments in the United States and global economies may lead to further reductions in consumer spending, which could have an adverse effect on the sales of our products. Such events could adversely affect the business of our wholesale and retail customers, which may among other things, result in financial difficulties leading to restructuring, bankruptcies, liquidations, and other unfavorable events of our customers, and may cause such customers to reduce or discontinue orders of our products. Financial difficulties of our customers may also affect the ability of our customers to access credit markets or lead to higher credit risk relating to receivables from customers. Recent or future turmoil in the financial and credit markets could make it more difficult for us to obtain financing or refinance existing debt when the need arises or on terms that would be acceptable to us.
Domestic and international political situations may also affect consumer confidence. The threat, outbreak or escalation of terrorism, military conflicts or other hostilities could lead to further decreases in consumer spending.
The worldwide apparel industry is heavily influenced by general economic conditions.
The apparel industry is highly cyclical and heavily dependent upon the overall level of consumer spending. Purchases of apparel and related goods tend to be highly correlated with cycles in the disposable income of consumers. Our wholesale customers may anticipate and respond to adverse changes in economic conditions and uncertainty by reducing inventories and canceling orders. Accordingly, a reduction in consumer spending in any of the regions in which we compete as a result of any substantial deterioration in general economic conditions (including as a result of uncertainty in world financial markets, weakness in the credit markets, the recent housing slump in the United States, increases in the price of fuel, international turmoil or terrorist attacks) or increases in interest rates could adversely affect the sales of our products.
We may not be able to anticipate consumer preferences and fashion trends, which could negatively affect acceptance of our products by retailers and consumers and result in a significant decrease in net sales.
Our failure to anticipate, identify and respond effectively to changing consumer demands and fashion trends could adversely affect acceptance of our products by retailers and consumers and may result in a significant decrease in net sales or leave us with a substantial amount of unsold inventory. We believe that our success depends on our ability to anticipate, identify and respond to changing fashion trends in a timely manner. Our products must appeal to a broad range of consumers whose preferences cannot be predicted with certainty and are subject to rapid change. We may not be able to continue to develop appealing styles or successfully meet constantly changing consumer demands in the future. In addition, any new products or brands that we introduce may not be successfully received by retailers and consumers. Due to the acquisitions of Laundry by Shelli Segal, C&C California and Rafaella, we have increased our exposure to women’s apparel, thus making us subject to additional changes in fashion trends as women’s fashion trends have historically changed more rapidly than men’s. If our products are not successfully received by retailers and consumers and we are left with a substantial amount of unsold inventory, we may be forced to rely on markdowns or promotional sales to dispose of excess, slow-moving inventory. If this occurs, our business, financial condition, results of operations and prospects may be harmed.
The failure of our suppliers to use acceptable ethical business practices could cause our business to suffer.
We require our suppliers to operate in compliance with applicable laws and regulations regarding working conditions, employment practices and environmental compliance. Additionally, we or our customers’ operating guidelines may require additional obligations in those areas. We do not, however, control our suppliers or their labor and other business practices. If one of our suppliers violates labor or other laws or implements labor or other business practices that are generally regarded as unethical in the United States, the shipment of finished products to us could be interrupted, orders could be cancelled, relationships could be terminated and our reputation could be damaged. Any of these events could have a material adverse effect on our revenue and, consequently, our results of operations.
20
Table of Contents
Increases in the prices of raw materials used to manufacture our products or increases in costs to transport our products could materially increase our costs and decrease our profitability.
The principal fabrics used in our business are made from cotton, wool, silk, synthetic and cotton-synthetic blends. The prices we pay for these fabrics are dependent on the market prices for the raw materials used to produce them, primarily cotton and chemical components of synthetic fabrics. These raw materials are subject to price volatility caused by weather, supply conditions, government regulations, energy costs, economic climate and other unpredictable factors. Fluctuations in petroleum prices may also influence the prices of related items such as chemicals, dyestuffs and polyester yarn as well as the costs we incur to transport products from our suppliers and costs we incur to distribute products to our customers. Any raw material price increase or increase in costs related to the transport of our products (primarily petroleum costs) could increase our cost of sales and decrease our profitability unless we are able to pass higher prices on to our customers. In addition, if one or more of our competitors is able to reduce its production costs by taking greater advantage of any reductions in raw material prices or favorable sourcing agreements, we may face pricing pressures from those competitors and may be forced to reduce our prices or face a decline in net sales, either of which could have an adverse effect on our business, results of operations or financial condition.
Fluctuations in the price, availability and quality of the fabrics or other raw materials used to manufacture our products, as well as the price for labor, marketing and transportation, could have a material adverse effect on our cost of sales or our ability to meet our customers’ demands. The prices for such fabrics depend largely on the market prices for the raw materials used to produce them. The price and availability of such raw materials may fluctuate significantly, depending on many factors. In the future, we may not be able to pass all or a portion of such higher prices on to our customers.
We are dependent upon the revenues generated by our licensing of brands from third parties, and the loss or inability to renew certain of these licenses could reduce our net income.
The interruption of the business of third parties that license their brands to us could adversely affect our net income. We currently license the Nike, JAG, Champions Tour, PGA TOUR, Callaway Golf, Top-Flite and Pierre Cardin brands from third parties. These licenses vary in length of term, renewal conditions and royalty obligations. The average term of these licenses is three to five years with automatic renewals depending upon whether we achieve certain targeted sales goals. We may not be able to renew or extend any of these licenses on favorable terms, if at all. If we are unable to renew or extend any of these licenses, we could experience a decrease in net income.
We are dependent upon the revenues generated by the licensing of our brands to third parties, and the loss or inability to renew certain of these licenses could reduce our royalty income and consequently reduce our net income.
The loss of several licensees of our brands at any one time could adversely affect our royalty income and net income. Royalty income from licensing our brands to third parties accounted for $26.4 million, or 3% of total revenues, for the fiscal 2011 and for $24.9 million, or 3% of total revenues, for fiscal 2010. These licenses vary in length of term, renewal conditions and royalty obligations. The average term of these licenses is three to five years with automatic renewals depending upon whether certain targeted sales goals are met. We may not be able to renew or extend any of these licenses on favorable terms, if at all. If we are unable to renew or extend any of these licenses, we could experience a decrease in royalty income and net income.
Our business could be harmed if we do not deliver quality products in a timely manner.
Our sourcing, logistics and technology functions operate within substantial production and delivery requirements and subjects us to the risks associated with suppliers, transportation, distribution facilities and other risks. If we do not comply with customer product requirements or meet their delivery requirements, our customers could reduce our selling prices, require significant margin support, reduce the amount of business they do with us, or cease to do business with us, all of which could harm our business.
21
Table of Contents
Our sales and operating results are influenced by weather patterns and natural disasters.
Like other companies in the apparel industry, our sales volume may be adversely affected by unseasonable weather conditions or natural disasters, which may cause consumers to alter their purchasing habits or result in a disruption to our operations. Because of the seasonality of our business and the concentration of a significant proportion of our customers in certain geographic regions, the occurrence of such events could disproportionately impact our business, financial condition and operating results.
We are subject to United States federal and state laws and, and if any of the laws or regulations are amended or if new laws or regulations are adopted, compliance could become more expensive and directly affect our income.
We are subject to U.S. federal, state and local laws and regulations affecting our business, including those promulgated under the Occupational Safety and Health Act, the Consumer Product Safety Act, the Flammable Fabrics Act, the Textile Fiber Product Identification Act, the rules and regulations of the Consumer Products Safety Commission, the Department of Homeland Security and various labor, workplace and related laws, as well as environmental laws and regulations. If any of these laws are amended or new laws are adopted, compliance could become more costly, and our failure to comply with such laws may expose us to potential liabilities, which could have an adverse impact on our results of operation.
Because we do business abroad, our business could be harmed if changes in political or economic stability, laws, exchange rates, or foreign trade policies should occur.
Our relationship with our foreign suppliers subjects us to the risks of doing business abroad. Because some of our suppliers are located at great geographic distances from us, our transportation costs are increased and longer lead times are required, which reduces our flexibility. Our finished goods are also subject to import duties, quotas and other restrictions. Other risks in doing business with foreign suppliers include political or economic instability, any significant fluctuations in the value of the dollar against foreign currencies, terrorist activities, and restrictions on the transfer of funds. Our efforts to maintain compliance with local laws and regulations may require us to incur significant expenses, and our failure to comply with such laws may expose us to potential liability, which could have an adverse effect on our results of operations.
Although we have not been affected in a material way by any of the foregoing factors, we cannot predict the likelihood or frequency of any such events occurring and any material disruption may have an adverse affect on our business.
We may face challenges integrating the operations of our recently acquired brands or any businesses we may acquire, which may negatively impact our business.
As part of our strategy of making selective acquisitions, we acquire new brands and product categories, including our acquisition of Rafaella on January 28, 2011. Acquisitions have inherent risks, including the risk that the projected sales and net income from the acquisition may not be generated, the risk that the integration is more costly and takes longer than anticipated, risks of retaining key personnel, and risks associated with unanticipated events and unknown legal liabilities. Any of these and other risks may harm our business. We cannot assure you that any acquisition will not have a material adverse impact on our financial conditions and results of operations.
With respect to previous acquisitions, we faced challenges in consolidating functions and integrating management procedures, personnel and operations in an efficient and effective manner, which if not managed as projected, could have negatively impacted our business. Some of these challenges included increased demands on management related to the significant increase in the size and diversity of our business after the acquisition, the dedication of management’s attention to implement our strategies for the business, the retention and integration of key employees, determining aspects of the acquired business that were to be kept separate and distinct from our other businesses, and difficulties in assimilating corporate culture and practices into ours. We expect that we will face similar challenges as we continue the integration of Rafaella and if we make significant acquisitions in the future.
22
Table of Contents
We have a significant amount of debt, which could have important negative consequences to us, including making it difficult for us to satisfy all of our obligations in the event we experience financial difficulties.
We have a significant amount of debt. As of January, 2011, we had approximately $229.1 million of debt outstanding (excluding amounts outstanding under our letter of credit facility). Our indebtedness could have important consequences, including:
| • | making it more difficult for us to satisfy our obligations with respect to our senior subordinated notes being offered in our concurrent offering, |
| • | increasing our vulnerability to adverse general economic and industry conditions, as we are required to devote a proportionally greater amount of our cash flow to paying principal and interest on our recently issued debt, |
| • | limiting our ability to obtain additional financing to fund capital expenditures, acquisitions and other general corporate requirements, |
| • | requiring us to dedicate a substantial portion of our cash flow from operations to payments on our indebtedness, thereby reducing the availability of our cash flow to fund capital expenditures, acquisitions or other general corporate purposes, |
| • | increasing our vulnerability to adverse changes in governmental regulations, |
| • | limiting our flexibility in planning for, or reacting to, changes in our business and the industry in which we operate, and |
| • | placing us at a competitive disadvantage compared to our less leveraged competitors during periods in which we experience lower earnings and cash flow. |
Our ability to pay interest on our indebtedness and to satisfy our other debt obligations will depend upon, among other things, our future operating performance and cash flow and our ability to refinance indebtedness when necessary. Each of these factors is, to a large extent, dependent on general economic, financial, competitive, legislative, regulatory and other factors beyond our control. If, in the future, we cannot generate sufficient cash from operations to make scheduled payments on our indebtedness or to meet our liquidity needs or other obligations, we will need to refinance our existing debt, obtain additional financing or sell assets. If we are unable to do so, we cannot assure you that we will be able otherwise to renegotiate or refinance any of our debt, or obtain additional debt, on commercially reasonable terms or at all. We cannot assure you that our business will generate cash flow, or that we will be able to obtain funding sufficient to satisfy our debt service requirements.
Our profitability may decline as a result of increasing pressure on margins.
The apparel industry is subject to significant pricing pressure caused by many factors, including intense competition, consolidation in the retail industry, pressure from retailers to reduce the costs of products and changes in consumer spending patterns. These factors may cause us to reduce our sales prices to retailers and consumers, which could cause our gross margin to decline if we are unable to appropriately manage inventory levels and/or reduce our operating costs. If we fail to adequately manage our product costs or operating expenses, our profitability will decline. This could have a material adverse effect on our results of operations, liquidity and financial condition.
23
Table of Contents
Our ability to conduct business in international markets may be affected by legal, regulatory, political and economic risks.
Our ability to capitalize on growth in new international markets and to maintain the current level of operations in our existing international markets is subject to risks associated with international operations. These include:
| • | the burdens of complying with a variety of foreign laws and regulations, |
| • | unexpected changes in regulatory requirements, |
| • | new tariffs or other barriers in some international markets, |
| • | political instability and terrorist attacks, |
| • | changes in diplomatic and trade relationships, and |
| • | general economic fluctuations in specific countries or markets. |
We cannot predict whether quotas, duties, taxes, or other similar restrictions will be imposed by the United States, the European Union, countries in Asia, or other countries upon the import or export of our products in the future, or what effect any of these actions would have on our business, financial condition or results of operations. Changes in regulatory, geopolitical, social or economic policies and other factors may have a material adverse effect on our business in the future or may require us to significantly modify our current business practices.
We operate in a highly competitive and fragmented industry and our failure to successfully compete could result in a loss of one or more significant customers.
The apparel industry is highly competitive and fragmented. Our competitors include numerous apparel designers, manufacturers, importers and licensors, many of which have greater financial and marketing resources than us. We believe that the principal competitive factors in the apparel industry are:
| • | brand name and brand identity, |
| • | timeliness, reliability and quality of services provided, |
| • | market share and visibility, |
| • | the ability to obtain sufficient retail floor space, |
| • | price, and |
| • | the ability to anticipate customer and consumer demands and maintain appeal of products to customers. |
The level of competition and the nature of our competitors varies by product segment with low-margin, mass-market manufacturers being our main competitors in the less expensive segment of the market and U.S. and foreign designers and licensors competing with us in the more upscale segment of the market. If we do not maintain our brand names and identities and continue to provide high quality and reliable services on a timely basis at competitive prices, we may not be able to continue to successfully compete in our industry. If we are unable to compete successfully, we could lose one or more of our significant customers, which, if not replaced, could negatively impact our sales and financial performance.
24
Table of Contents
Our success depends upon the continued protection of our trademarks and other intellectual property rights.
Our registered and common law trademarks, as well as certain of our licensed trademarks, have significant value and are instrumental to our ability to market our products. Our failure to successfully protect our intellectual property rights, or the substantial costs that we may incur in doing so, may have an adverse effect on our operations.
We may have additional tax liabilities.
We are subject to income taxes in the United States and many foreign jurisdictions. In addition to judgments associated with valuation accounts, our current tax provision can be affected by our mix of income and identification or resolution of uncertain tax positions. Because income from domestic and international sources may be taxed at different rates, the shift in mix during a year or over years can cause the effective tax rate to change. We regularly are under audit by tax authorities. Although we believe our tax estimates are reasonable, the final determination of our tax liabilities as a result of tax audits and any related litigation could be materially different from our historical income tax provisions and accruals. The results of an audit or litigation could have a material effect on our financial position, results of operations, or cash flows in the period or periods for which that determination is made. In addition, there have been proposals to reform U.S. tax laws that would significantly impact how U.S. multinational corporations are taxed on foreign earnings. We earn a portion of our income in foreign countries. Although we cannot predict whether or in what form this proposed legislation will pass, if enacted it could have a material adverse impact on our tax expense and cash flow.
We depend on certain key personnel the loss of which could negatively impact our ability to manage our business.
Our future success depends to a significant extent on retaining the services of certain executive officers and directors, in particular George Feldenkreis, our Chairman of the Board and Chief Executive Officer, and Oscar Feldenkreis, our Vice Chairman, President and Chief Operating Officer. They are each party to an employment agreement that expires in 2013. The loss of the services of either George Feldenkreis or Oscar Feldenkreis, or any other key member of management, could have a material adverse effect on our ability to manage our business. Our continued success is dependent upon our ability to attract and retain qualified management and operational personnel to support our future growth. Our inability to do so may have a significant negative impact on our ability to manage our business.
Item 1B. Unresolved Staff Comments
None.
25
Table of Contents
Item 2. Properties
The general location, use, ownership status, approximate size, and lease expiration dates of the principle properties which we currently occupy are set forth below:
| Location |
Use |
Lease Expiration |
Ownership Status |
Approximate Area in Square Feet |
||||||
| Miami, Florida |
Principle Executive and Administrative Offices; Warehouse and Distribution Facility | N/A | Owned | 240,000 | ||||||
| Miami, Florida |
Distribution and Administrative Functions | July 2014 | Leased | 66,000 | ||||||
| Seneca, South Carolina |
Distribution Center | N/A | Owned | 345,000 | ||||||
| Winnsboro, South Carolina |
Distribution Center | N/A | Owned | 380,000 | ||||||
| Tampa, Florida |
Distribution Center | N/A | Owned | 305,000 | ||||||
| Beijing, China |
3 Administrative Office Units | N/A | Owned | 12,000 | ||||||
| New York City, New York |
Office, Design and Showrooms | December 2012 thru December 2017 |
Leased | 193,000 | ||||||
| Portland, Oregon |
Office Space | August 2012 | Leased | 19,427 | ||||||
| Irvine, California |
Office Space | August 2011 | Leased | 5,250 | ||||||
| Commerce, California |
Office Space | December 2012 | Leased | 39,400 | ||||||
| Witham, UK |
Distribution and Administrative Functions | 2016 | Leased | 70,000 | ||||||
In addition, we lease several locations in Texas, Wisconsin, and California totaling approximately 9,400 square feet of office space. We also lease 50 retail stores, comprising approximately 142,000 square feet of selling space.
In addition, we lease several locations internationally totaling approximately 50,000 square feet of office and retail space.
Our principle executive and administrative office, warehouse and distribution facility is encumbered by a $12.7 million mortgage, due on August 1, 2020. The facility in Tampa, Florida is encumbered by a $13.7 million mortgage due on June 7, 2016. During fiscal 2009, we closed our Winnsboro distribution facility and such property is currently listed for sale.
Item 3. Legal Proceedings
The Company is, from time to time, a party to litigation that arises in the normal course of its business operations. The Company is not presently a party to any litigation that it believes might have a material adverse effect on its business operations.
Item 4. Reserved
26
Table of Contents
PART II
Item 5. Market for Registrant’s Common Equity and Related Shareholder Matters
| (a) | Market Information |
Our common stock is currently listed for trading on the NASDAQ Global Select Market under the symbol “PERY” and was previously listed for trading on the Nasdaq Global Market (formerly the Nasdaq National Market) under the symbol “PERY” since June 1999. Prior to that date, our trading symbol was “SUPI” based upon our former name, Supreme International Corporation. The following table sets forth, for the periods indicated, the range of high and low per share bids of our common stock as reported by the NASDAQ Global Select Market. Such quotations represent inter-dealer prices, without retail mark-up, mark-down or commission and may not necessarily represent actual transactions.
| High | Low | |||||||
| Fiscal Year 2011 |
||||||||
| First Quarter |
$ | 26.75 | $ | 14.92 | ||||
| Second Quarter |
25.98 | 16.85 | ||||||
| Third Quarter |
25.04 | 18.32 | ||||||
| Fourth Quarter |
30.01 | 21.35 | ||||||
| Fiscal Year 2010 |
||||||||
| First Quarter |
$ | 7.37 | $ | 3.46 | ||||
| Second Quarter |
9.72 | 5.60 | ||||||
| Third Quarter |
19.15 | 8.06 | ||||||
| Fourth Quarter |
16.92 | 13.34 | ||||||
| (b) | Holders |
As of April 11, 2011, there were approximately 140 registered shareholders of record of our common stock. We believe the number of beneficial owners of our common stock is in excess of 2,300.
| (c) | Dividends |
We have not paid any cash dividends since our inception and do not contemplate doing so in the near future. Payment of cash dividends is prohibited under our senior credit facility and the indenture governing our senior subordinated notes. See footnotes 14 through 16 to the consolidated financial statements of Perry Ellis included in Item 8 of this Report. Any future decision regarding payment of cash dividends will depend on our earnings and financial position and such other factors, as our board of directors deems relevant.
| (d) | Securities Authorized for Issuance under Equity Compensation Plans |
27
Table of Contents
Equity Compensation Plan Information for Fiscal 2011
The following table summarizes as of January 29, 2011 the shares of our common stock subject to outstanding awards or available for future awards under our equity compensation plans.
| Plan Category |
Number of shares to be issued upon exercise of outstanding options, warrants and rights |
Weighted- average exercise price of outstanding options, warrants and rights |
Number of
shares remaining available for future issuance under equity compensation plans (excluding shares reflected in the first column) |
|||||||||
| Equity compensation plans approved by security holders(1) |
1,717,326 | $ | 10.81 | 840,431 | ||||||||
| Equity compensation plans not approved by security holders |
— | — | — | |||||||||
| Total |
1,717,326 | $ | 10.81 | 840,431 | ||||||||
| (1) | Represents awards made pursuant to our 2002 Equity Compensation Plan, our 1993 Stock Option Plan and our 2005 Long Term Plan, as amended and restated. |
| (e) | Performance Graph |
The following graph compares the cumulative total shareholder return on our common stock with the cumulative total shareholder return on the Nasdaq Composite and The S&P Apparel, Accessories & Luxury Goods Index commencing on February 1, 2006 and ending January 29, 2011. The graph assumes that $100 was invested on February 1, 2006 in our common stock or in the Nasdaq Composite Index and The S&P Apparel, Accessories & Luxury Goods Index, and that all dividends are reinvested. Past performance is not necessarily indicative of future performance.
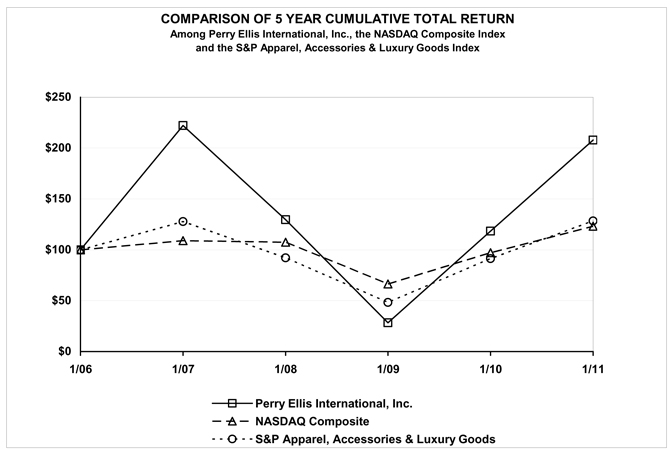
| Company / Index |
Base 2006 |
2007 | 2008 | 2009 | 2010 | 2011 | ||||||||||||||||||
| Perry Ellis International, Inc. |
$ | 100.00 | $ | 222.23 | $ | 129.62 | $ | 28.36 | $ | 118.39 | $ | 207.90 | ||||||||||||
| NASDAQ Composite |
100.00 | 109.00 | 107.45 | 66.46 | 97.13 | 123.13 | ||||||||||||||||||
| S&P Apparel, Accessories & Luxury Goods |
100.00 | 127.73 | 92.14 | 48.33 | 91.33 | 128.43 | ||||||||||||||||||
28
Table of Contents
| (f) | Sales of Unregistered Securities |
On January 28, 2011, the Company issued a warrant to purchase 106,564 shares of the Company’s common stock to Rafaella at an exercise price of $0.01 per share. The warrant was issued as part of the consideration for the acquisition of substantially all of the assets of Rafaella. The warrant is exercisable commencing on the business day immediately following the first business day after the closing of the acquisition on which the closing price of the Company’s common stock equals or exceeds $28.152 and expires two years following the closing date of the acquisition. The warrant was issued in a transaction exempt from registration under the Securities Act pursuant to Section 4(2) thereof because the transaction was a private sale.
| (g) | Purchase of Equity Securities by the Issuer and Affiliated Purchasers. |
Not Applicable.
29
Table of Contents
Item 6. Selected Financial Data
Summary Historical Financial Information
(Amounts in thousands, except for per share data)
The following selected financial data is qualified by reference to, and should be read in conjunction with, the Consolidated Financial Statements of Perry Ellis and related Notes thereto included in Item 8 of this report and “Item 7. Management’s Discussion and Analysis of Financial Condition and Results of Operations.”
| Fiscal Years Ended |
January 29, 2011 |
January 30, 2010 |
January 31, 2009 |
January 31, 2008 |
January 31, 2007 |
|||||||||||||||
| Income Statement Data: |
||||||||||||||||||||
| Net sales |
$ | 763,884 | $ | 729,217 | $ | 825,868 | $ | 838,465 | $ | 807,616 | ||||||||||
| Net royalty income |
26,404 | 24,985 | 25,429 | 25,401 | 22,226 | |||||||||||||||
| Total revenues |
790,288 | 754,202 | 851,297 | 863,866 | 829,842 | |||||||||||||||
| Cost of sales |
507,829 | 505,104 | 573,046 | 572,232 | 554,046 | |||||||||||||||
| Gross profit |
282,459 | 249,098 | 278,251 | 291,634 | 275,796 | |||||||||||||||
| Selling, general and administrative expenses |
220,018 | 200,356 | 236,840 | 215,873 | 204,883 | |||||||||||||||
| Depreciation and amortization |
12,211 | 13,625 | 14,784 | 13,278 | 11,608 | |||||||||||||||
| Impairment on long-lived assets |
392 | 254 | 22,299 | — | — | |||||||||||||||
| Operating income |
49,838 | 34,863 | 4,328 | 62,483 | 59,305 | |||||||||||||||
| Costs on early extinguishment of debt |
730 | 357 | — | — | 2,963 | |||||||||||||||
| Impairment on marketable securities |
— | — | 2,797 | — | — | |||||||||||||||
| Interest expense |
13,203 | 17,371 | 17,491 | 17,594 | 21,114 | |||||||||||||||
| Net income (loss) before income taxes |
35,905 | 17,135 | (15,960 | ) | 44,889 | 35,228 | ||||||||||||||
| Income tax provision (benefit) |
11,393 | 3,615 | (3,682 | ) | 15,785 | 12,311 | ||||||||||||||
| Net income (loss) |
24,512 | 13,520 | (12,278 | ) | 29,104 | 22,917 | ||||||||||||||
| Less: Net income attributed to noncontrolling interest |
400 | 353 | 612 | 931 | 508 | |||||||||||||||
| Net income (loss) attributed to Perry Ellis International, Inc. |
$ | 24,112 | $ | 13,167 | $ | (12,890 | ) | $ | 28,173 | $ | 22,409 | |||||||||
| Net income (loss) attributed to Perry Ellis International, Inc. per share: |
||||||||||||||||||||
| Basic |
$ | 1.84 | $ | 1.04 | $ | (0.89 | ) | $ | 1.92 | $ | 1.55 | |||||||||
| Diluted |
1.70 | 1.01 | (0.89 | ) | 1.80 | 1.45 | ||||||||||||||
| Weighted average number of shares outstanding |
||||||||||||||||||||
| Basic |
13,110 | 12,699 | 14,416 | 14,675 | 14,504 | |||||||||||||||
| Diluted |
14,149 | 13,005 | 14,416 | 15,657 | 15,455 | |||||||||||||||
| Other Financial Data: |
||||||||||||||||||||
| EBITDA (a) |
$ | 62,049 | $ | 48,488 | $ | 16,315 | $ | 75,761 | $ | 70,913 | ||||||||||
| EBITDA margin (b) |
7.9 | % | 6.4 | % | 1.9 | % | 8.8 | % | 8.5 | % | ||||||||||
| Cash flows from operations |
21,004 | 88,795 | (4,982 | ) | 91,292 | 31,596 | ||||||||||||||
| Cash flows from investing |
(94,491 | ) | (2,034 | ) | (44,390 | ) | (19,307 | ) | (16,755 | ) | ||||||||||
| Cash flows from financing |
73,600 | (76,999 | ) | 45,648 | (64,911 | ) | (20,360 | ) | ||||||||||||
| Capital expenditures |
(6,695 | ) | (3,749 | ) | (10,786 | ) | (18,955 | ) | (15,968 | ) | ||||||||||
| Balance Sheet Data (at year end): |
||||||||||||||||||||
| Working capital |
$ | 250,338 | $ | 188,056 | $ | 241,130 | $ | 217,870 | $ | 229,682 | ||||||||||
| Total assets |
685,730 | 561,316 | 599,586 | 586,265 | 593,206 | |||||||||||||||
| Total debt (c) |
229,129 | 155,108 | 229,065 | 175,927 | 237,737 | |||||||||||||||
| Total stockholders’ equity |
302,940 | 270,116 | 252,101 | 276,820 | 248,996 | |||||||||||||||
| a) | EBITDA represents earnings before interest expense, cost on early extinguishment of debt, depreciation and amortization, noncontrolling interest and income taxes as outlined below in tabular format. EBITDA is not a measurement of financial performance under accounting principles generally accepted in the |
30
Table of Contents
| United States of America, and does not represent cash flow from operations. EBITDA is presented solely as a supplemental disclosure because we believe that it is a common measure of operating performance in the apparel industry. The following provides a reconciliation of net income to EBITDA: |
| Fiscal Years Ended |
January 29, 2011 |
January 30, 2010 |
January 31, 2009 |
January 31, 2008 |
January 31, 2007 |
|||||||||||||||
| In thousands | ||||||||||||||||||||
| Net income (loss) attributed to Perry Ellis International, Inc. |
$ | 24,112 | $ | 13,167 | $ | (12,890 | ) | $ | 28,173 | $ | 22,409 | |||||||||
| Depreciation & amortization |
12,211 | 13,625 | 14,784 | 13,278 | 11,608 | |||||||||||||||
| Interest expense |
13,203 | 17,371 | 17,491 | 17,594 | 21,114 | |||||||||||||||
| Income tax provision (benefit) |
11,393 | 3,615 | (3,682 | ) | 15,785 | 12,311 | ||||||||||||||
| Net income attributed to noncontrolling interest |
400 | 353 | 612 | 931 | 508 | |||||||||||||||
| Costs on early extinguishment of debt |
730 | 357 | — | — | 2,963 | |||||||||||||||
| EBITDA |
$ | 62,049 | $ | 48,488 | $ | 16,315 | $ | 75,761 | $ | 70,913 | ||||||||||
| b) | EBITDA margin represents EBITDA as a percentage of total revenues. EBITDA margin percentage of revenue is presented solely as a supplemental disclosure because we believe that it is a common measure of operating performance in the apparel industry. The following provides a reconciliation of gross profit to EBITDA margin as percentage of revenue: |
| Fiscal Years Ended |
January 29, 2011 |
January 30, 2010 |
January 31, 2009 |
January 31, 2008 |
January 31, 2007 |
|||||||||||||||
| In thousands | ||||||||||||||||||||
| Gross profit |
$ | 282,459 | $ | 249,098 | $ | 278,251 | $ | 291,634 | $ | 275,796 | ||||||||||
| Less: |
||||||||||||||||||||
| Selling, general and administrative expenses |
220,018 | 200,356 | 236,840 | 215,873 | 204,883 | |||||||||||||||
| Impairment on long-lived assets |
392 | 254 | 22,299 | — | — | |||||||||||||||
| Impairment on marketable securities |
— | — | 2,797 | — | — | |||||||||||||||
| EBITDA |
$ | 62,049 | $ | 48,488 | $ | 16,315 | $ | 75,761 | $ | 70,913 | ||||||||||
| Total revenues |
$ | 790,288 | $ | 754,202 | $ | 851,297 | $ | 863,866 | $ | 829,842 | ||||||||||
| EBITDA margin percentage of revenues |
7.9 | % | 6.4 | % | 1.9 | % | 8.8 | % | 8.5 | % | ||||||||||
| c) | Total debt includes balances outstanding under Perry Ellis’ senior credit facility, senior subordinated notes, real estate mortgages, and lease payable long term. |
Item 7. Management’s Discussion and Analysis of Financial Condition and Results of Operations
Overview
We began operations in 1967 as Supreme International Corporation with a focus on marketing guayabera shirts, and other men’s apparel products targeted at the Hispanic market in Florida and Puerto Rico. Over time we expanded our product line to offer a variety of men’s sport shirts. In 1988, we added the Natural Issue brand and completed our initial public offering in 1993. In 1996, we began an expansion strategy through the acquisition of brands including the Munsingwear family of brands in 1996, the John Henry and Manhattan brands from Perry Ellis Menswear in 1999 and the Perry Ellis brand in 1999. Following the Perry Ellis acquisition, we changed our name from Supreme International Corporation to Perry Ellis International, Inc. to better reflect the name recognition that the brand provided. In 2002, we acquired the Jantzen brand and in June 2003 we acquired Perry Ellis Menswear, our largest licensee, giving us greater control of the Perry Ellis brand, as well as adding other brands owned by Perry Ellis Menswear. In February 2005, we completed an acquisition, making us one of the largest supplier’s of bottoms in the United States. In January 2006, we completed the acquisition of primarily all of the worldwide intellectual property of the leading California lifestyle company Gotcha International, including the Gotcha, Girl Star and MCD logo trademarks and the intellectual property license agreements. In February 2008, we completed the acquisition of the Laundry by Shelli Segal and C&C California brands giving us a stronger product line in dresses and women’s sportswear. In January 2011, we completed the acquisition of the Rafaella brand further increasing our product line in women’s sportswear.
31
Table of Contents
We are one of the leading apparel companies in the United States. We manage a portfolio of major brands, some of which were established over 100 years ago. We design, source, market and license our products nationally and internationally at multiple price points and across all major levels of retail distribution in approximately 15,000 selling doors. Our portfolio of highly recognized brands includes the Perry Ellis family of brands, Axis, Tricots St. Raphael, Jantzen, John Henry, Cubavera, the Havanera Co., Centro, Solero, Natural Issue, Munsingwear, Grand Slam, Original Penguin by Munsingwear (“Original Penguin”), Mondo di Marco, Redsand, Pro Player, Manhattan, Axist, Savane, Farah, Gotcha, Girl Star, MCD, Laundry by Shelli Segal, C&C California, and Rafaella. We also (i) license the Nike brand for swimwear and swimwear accessories, (ii) license the JAG brand for men’s and women’s swimwear and cover-ups, (iii) license the Callaway Golf and Top-Flite brand for golf apparel, (iv) license the PGA TOUR brand, including Champions Tour, for golf apparel, and (v) license Pierre Cardin for men’s sportswear.
We distribute our products primarily to wholesale customers that represent all major levels of retail distribution including department stores, national and regional chain stores, mass merchants, specialty stores, sporting goods stores, the corporate wear market, e-commerce, as well as clubs and independent retailers in the United States, Canada, Mexico, the United Kingdom and Europe. Our largest customers include Kohl’s, Macy’s, TJ Maxx / Marshalls, Dillard’s, Sam’s, and J.C. Penney. As of March 2, 2011, we operated 38 Perry Ellis and three Original Penguin retail outlet stores located primarily in upscale retail outlet malls across the United States and Puerto Rico. As of March 2, 2011 we also operated one Perry Ellis and one Cubavera retail store located in Miami, Florida and seven Original Penguin retail stores located in upscale demographic markets in the United States. In addition, we leverage our design, sourcing and logistics expertise by offering a limited number of private label programs to retailers. In order to maximize the worldwide exposure of our brands and generate high margin royalty income, we license our brands through three worldwide, 37 domestic, and 94 international license agreements covering over 100 countries.
Our wholesale business, which is comprised of men’s and women’s sportswear, swimwear and swimwear accessories, accounted for 97% of our total revenues in fiscal 2011 and, our licensing business accounted for approximately 3% of our total revenues in fiscal 2011. We have traditionally focused on the men’s sportswear market, which represented approximately 87% of our total revenues in fiscal 2011, while our women’s dresses and casual sportswear and men’s and women’s swimwear markets represented approximately 13% of our total revenues in fiscal 2011. Finally, our U.S. based business represented approximately 91% of total revenues, while our foreign operations represented 9% for fiscal 2011.
Our licensing business is a significant contributor to our operating income. We license the brands we own to third parties for the manufacturing and marketing of various products in distribution channels and countries in which we do not distribute those brands, including men’s and women’s apparel and footwear, men’s suits, underwear, loungewear, outerwear, fragrances, eyewear and accessories. These licensing arrangements heighten the overall awareness of our brands without requiring us to make capital investments or incur additional operating expenses.
We employ a three-dimensional strategy in the design, sourcing, marketing and licensing of our products that focuses on diversity of brands, products and distribution channels. Through this strategy, we provide our products to a broad range of customers, which reduces our reliance on any single distribution channel, customer, or demographic group and minimizes competition among our brands.
Our products have historically been geared towards lighter weight apparel generally worn during the spring and summer months. We believe that this seasonality has been reduced with our introduction of fall, winter, and holiday merchandise. Our swimwear business, however, is highly seasonal in nature, with the significant majority of its sales occurring in our first and fourth quarters. Our higher-priced products generally tend to be less sensitive to either economic or weather conditions. Seasonality can be affected by a variety of factors, including the mix of advance and fill-in orders, the amount of sales to different distribution channels, and overall product mix among traditional merchandise, fashion merchandise and swimwear. We expect that revenues for our second quarter will typically be lower than our other quarters due to the impact of seasonal sales.
32
Table of Contents
We believe that our future growth will come as a result of organic growth from our continued emphasis on our existing brands; new and expanded product lines; domestic and international licensing opportunities; international, direct retail and e-commerce opportunities and selective acquisitions and opportunities that fit strategically with our business model. Our future results may be impacted by risks and trends set forth in “Item 1A. Risk Factors” and elsewhere in this report.
Recent Accounting Pronouncements
See Notes to the Consolidated Financial Statements in “Item 8. Financial Statements and Supplementary Data” for recent accounting pronouncements.
Critical Accounting Policies
Included in the footnotes to the consolidated financial statements in this report is a summary of all significant accounting policies used in the preparation of our consolidated financial statements. We follow the accounting methods and practices as required by accounting principles generally accepted in the United States of America (“GAAP”). In particular, our critical accounting policies and areas we use judgment are in the areas of revenue recognition, the estimated collectability of accounts receivable, the recoverability of obsolete or overstocked inventory, the impairment of long-lived assets that are our trademarks, the recoverability of deferred tax assets, the measurement of retirement related benefits and stock-based compensation.
Revenue Recognition. Sales are recognized at the time legal title to the product passes to the customer, generally FOB Perry Ellis’ distribution facilities, net of trade allowances and a provision for estimated returns and other allowances, considering historical and anticipated trends. Revenues are recorded net of corresponding sales taxes. Royalty income is recognized when earned on the basis of the terms specified in the underlying contractual agreements.
Accounts Receivable. We maintain an allowance for doubtful accounts receivables and an allowance for estimated trade discounts, co-op advertising, allowances provided to retail customers to flow goods through the retail channel, and losses resulting from the inability of our retail customers to make required payments considering historical and anticipated trends. Management reviews these allowances and considers the aging of account balances, historical bad debt experience, changes in customer creditworthiness, current economic trends, customer payment activity and other relevant factors. A small portion of our accounts receivable are insured for collections. Should any of these factors change, the estimates made by management may also change, which could affect the level of future provisions.
Inventories. Our inventories are valued at the lower of cost or market value. Estimates and judgment are required in determining what items to stock and at what levels, and what items to discontinue and how to value them. We evaluate all of our inventory style-size-color stock keeping units, or SKUs, to determine excess or slow-moving SKUs based on orders on hand and projections of future demand and market conditions. For those units in inventory that are so identified, we estimate their market value or net sales value based on current realization trends. If the projected net sales value is less than cost, on an individual SKU basis, we write down inventory to reflect the lower value. This methodology recognizes projected inventory losses at the time such losses are evident rather than at the time goods are actually sold.
Intangible Assets. We review our intangible assets with indefinite useful lives for possible impairments at least annually and perform impairment testing as of February 1st of each year by among other things, obtaining independent third party valuations. We evaluate the “fair value” of our identifiable intangible assets for purposes of recognition and measurement of impairment losses. Evaluating indefinite useful life assets for impairment involves certain judgments and estimates, including the interpretation of current economic indicators and market valuations, and our strategic plans with regard to our operations, historical and anticipated performance of our operations and other factors. If we incorrectly anticipate these trends or unexpected events occur, our results of operations could be materially affected.
33
Table of Contents
Deferred Taxes. We account for income taxes under the liability method. Deferred tax assets and liabilities are recognized based on the differences between financial statement and tax basis of assets and liabilities using presently enacted tax rates. A valuation allowance is recorded, if required, to reduce deferred tax assets to that portion which is expected to more likely than not be realized.
The ultimate realization of the deferred tax asset is dependent upon the generation of future taxable income during the periods prior to the expiration of the related net operating losses. If our estimates and assumptions about future taxable income are not appropriate, the value of our deferred tax asset may not be recoverable, and may result in an increase to our valuation allowance that will impact current earnings.
It is our policy to provide for uncertain tax positions and the related interest and penalties based upon management’s assessment of whether a tax benefit is more likely than not to be sustained upon examination by tax authorities. To the extent that we prevail in matters for which a liability for an unrecognized tax benefit is established or is required to pay amounts in excess of the liability, our effective tax rate in a given financial statement period may be affected.
In addition to judgments associated with valuation accounts, our current tax provision can be affected by our mix of income and identification or resolution of uncertain tax positions. Because income from domestic and international sources may be taxed at different rates, the shift in mix during a year or over years can cause the effective tax rate to change.
Retirement-Related Benefits. The pension obligations related to our defined benefit pension plans are developed from actuarial valuations. Inherent in these valuations are key assumptions, including the discount rate, expected return of plan assets, future compensation increases, and other factors, which are updated on an annual basis. Management is required to consider current market conditions, including changes in interest rates, in making these assumptions. Actual results that differ from the assumptions are accumulated and amortized over future periods, and therefore, generally affect the recognized pension expense or benefit and our pension obligation in future periods. The fair value of plan assets is based on the performance of the financial markets, particularly the equity markets. Therefore, the market value of the plan assets can change dramatically in a relatively short period of time. Additionally, the measurement of the plan’s benefit obligation is highly sensitive to changes in interest rates. As a result, if the equity market declines and/or interest rates decrease, the plan’s estimated accumulated benefit obligation could exceed the fair value of the plan assets and therefore, we would be required to establish an additional minimum liability, which would result in a reduction in shareholders’ equity for the amount of the shortfall.
Stock-Based Compensation. Our stock-based award programs are intended to attract, retain and provide incentives for talented employees, officers and directors, and to align stockholder and employee interests. As of January 29, 2011, we had three stock-based compensation plans.
Share-based awards granted to employees are fair valued on the date of grant and the related expense is recognized over the requisite service period, which is generally the vesting period of the award. Compensation cost must be recognized over the requisite service period if it is probable that the performance condition will be satisfied. We use our best judgment to determine whether it is probable the performance conditions will be satisfied at each reporting period and record compensation costs accordingly; however, the recognition or non-recognition of such compensation cost remains subject to uncertainty. If the performance conditions are not met for performance vesting restricted stock, no compensation costs will be recognized for those shares and any compensation cost recognized previously for those shares will be reversed.
34
Table of Contents
The fair value of these options and Stock Appreciation Rights (“SARS”) is estimated at the date of grant using the Black-Scholes Option Pricing Model. This model was developed for use in estimating the fair value of traded options that have no vesting restrictions and are fully transferable. In addition, option valuation models require the input of highly subjective assumptions including: expected volatility based on the historical price of the our common stock over the expected life of the option; the risk free rate of return based on the U.S. Treasury yield curve in effect at the time of grant for the expected term of the option; the expected life based on the period of time the options are expected to be outstanding using historical data to estimate option exercise and employee termination; and dividend yield based on our history and expectation of dividend payments. If actual results differ significantly from these estimates, stock-based compensation expense and our results of operations could be materially impacted.
Our Results of Operations for Fiscal 2011
The following table sets forth, for the periods indicated, selected items in our consolidated statements of operations expressed as a percentage of total revenues:
| Fiscal Years Ended |
January 29, 2011 |
January 30, 2010 |
January 31, 2009 |
|||||||||
| Net sales |
96.7 | % | 96.7 | % | 97.0 | % | ||||||
| Royalty income |
3.3 | % | 3.3 | % | 3.0 | % | ||||||
| Total revenues |
100.0 | % | 100.0 | % | 100.0 | % | ||||||
| Cost of sales |
64.3 | % | 67.0 | % | 67.3 | % | ||||||
| Gross profit |
35.7 | % | 33.0 | % | 32.7 | % | ||||||
| Selling, general and administrative expenses |
27.8 | % | 26.6 | % | 27.8 | % | ||||||
| Depreciation and amortization |
1.5 | % | 1.8 | % | 1.7 | % | ||||||
| Impairment on long-lived assets |
0.0 | % | 0.0 | % | 2.6 | % | ||||||
| Operating income |
6.3 | % | 4.6 | % | 0.5 | % | ||||||
| Costs on early extinguishment of debt |
0.1 | % | 0.0 | % | 0.0 | % | ||||||
| Impairment on marketable securities |
0.0 | % | 0.0 | % | 0.3 | % | ||||||
| Interest expense |
1.7 | % | 2.3 | % | 2.1 | % | ||||||
| Net income (loss) before income taxes |
4.5 | % | 2.3 | % | –1.9 | % | ||||||
| Income tax provision (benefit) |
1.4 | % | 0.5 | % | –0.4 | % | ||||||
| Net income (loss) |
3.1 | % | 1.8 | % | –1.4 | % | ||||||
| Net income attributed to noncontrolling interest |
0.1 | % | 0.0 | % | 0.1 | % | ||||||
| Net income (loss) attributed to Perry Ellis International, Inc. |
3.1 | % | 1.7 | % | –1.5 | % | ||||||
The following is a discussion of our results of operations for the fiscal year ended January 29, 2011 (“fiscal 2011”) as compared with the fiscal year ended January 30, 2010 (“fiscal 2010”) and fiscal 2010 compared with the fiscal year ended January 31, 2009 (“fiscal 2009”).
Our fiscal 2011 results as compared to our fiscal 2010 results
Net sales. Net sales in fiscal 2011 were $763.9 million, an increase of $34.7 million, or 4.8%, from $729.2 million in fiscal 2010. Net sales increased primarily due to increased sales in the Perry Ellis apparel and accessories business, our new Callaway product, which amounted to $9.0 million, the addition of the new Top-Flite and Solero products, sales from our new Pierre Cardin licensed brand and the overall increase in our direct to consumer business. These increases were partially offset by the reduction of $36.0 million in unprofitable businesses, principally mass market programs.
35
Table of Contents
Royalty income. Royalty income in fiscal 2011 was $26.4 million, an increase of $1.4 million, or 5.6% from $25.0 in fiscal 2010. Royalty income increased reflecting new licenses signed during the first half of fiscal 2011 for our Laundry brands as well as within our new fragrance license for Original Penguin, and organic growth in our current licenses, which was partially offset by the non-renewal of licenses associated with our Ping golf business given its exit, and our Munsingwear corporate license business, which we brought in-house during the second half of fiscal 2011. Approximately 87.7% of our royalty income was attributable to guaranteed minimum royalties with the balance attributable to royalty income in excess of the guaranteed minimums for fiscal 2011.
Gross profit. Gross profit was $282.5 million in fiscal 2011, an increase of $33.4 million, or 13.4%, from $249.1 million in fiscal 2010. As a percentage of total revenue, gross profit margins were 35.7% in fiscal 2011 compared to 33.0% in fiscal 2010, an increase of 271 basis points. The increase in the gross profit percentage was attributed to the margin expansion of Perry Ellis men’s apparel and accessories, the exit of lower margin mass market private label programs and a prior golf license and the improved margin in our contemporary women’s and Original Penguin businesses, as well as, the addition of the new Callaway business.
Wholesale gross profit margins (which exclude the impact of royalty income) were 33.5% in fiscal 2011, compared to 30.7% in fiscal 2010. This increase is primarily attributable to the factors mentioned above.
We also improved EBITDA margin during fiscal 2011, by 142 basis points increasing it to 7.9%, as compared to the same period last year. This increase is primarily due to the increase in our gross profit margin, as explained above, offset by our increase in selling, general and administrative expenses as a percentage of total revenue, as explained below.
Selling, general and administrative expenses. Selling, general and administrative expenses in fiscal 2011 were $220.0 million, an increase of $19.6 million, or 9.8%, from $200.4 million in fiscal 2010. As a percentage of total revenues, selling, general and administrative expenses increased to 27.8% in fiscal 2011 as compared to 26.6% in fiscal 2010, and in line with our expectations. The increase, primarily in our wholesale business, reflects additional promotions and advertising investment in our core brands along with new brands – this includes celebrity endorsements, social media, print advertising as well as promotional events. We believe these investments are integral to building and supporting the brand images in order to complement the superior quality and value of product they bring to the end consumer. Increases were also reflected in investment in our employees through salary increases as well as bonus plans that rewarded improving profitability performance across most of our businesses. Additionally, expenses increased because of our expansion into our new wholesale brands, such as Callaway. We also incurred approximately $2.2 million of expense related to the acquisition of Rafaella.
Depreciation and amortization. Depreciation and amortization in fiscal 2011 was $12.2 million, a decrease of $1.4 million, or 10.3%, from $13.6 million in fiscal 2010. The decrease in depreciation and amortization is attributed to the reduction in capital expenditures over the last two years and the closure of several retail locations. As of January 29, 2011, we owned approximately $138.1 million of property, plant and equipment, at cost, as compared to approximately $132.3 million as of January 30, 2010, at cost.
Impairment on long-lived assets. During the fourth quarter of fiscal 2011, we experienced lower-than-expected performance at certain locations, which was due in part to the economic downturn. As a result, we recorded a $0.4 million impairment charge to reduce the net carrying value of certain long-lived assets (primarily leaseholds) at these locations to their estimated fair value. During fiscal 2010, we recorded a similar impairment charge to reduce the net carrying value of certain long-lived assets (primarily leaseholds) to their estimated fair value in the amount of $0.3 million.
Costs on early extinguishment of debt. During the second quarter of fiscal 2011, we retired $25.0 million of our senior subordinated notes payable. In connection with this retirement, we paid an additional $453,000 in fees and premiums. Additionally we wrote-off approximately $277,000 in unamortized discount and bond fees associated with the retired portion of the senior subordinated notes. During the fourth quarter of fiscal 2010, we retired $20.8 million of our senior subordinated notes payable. In connection with this retirement, we paid an
36
Table of Contents
additional $98,000 in fees and premiums. Additionally we wrote-off approximately $259,000 in unamortized discount and bond fees, associated with the retired portion of the senior subordinated notes. The senior subordinated notes were scheduled to mature on September 15, 2013. During the first quarter of fiscal 2012, the senior subordinated notes in the amount of $104.3 million due September 15, 2013 were called and subsequently retired from the proceeds of our newly issued 7 7/8% Senior Subordinated Notes Due 2019.
Interest expense. Interest expense in fiscal 2011 was $13.2 million, a decrease of $4.2 million, or 24.1%, from $17.4 million in fiscal 2010. We ended fiscal 2011 with borrowings in the amount of $97.3 million on our senior credit facility as compared to no borrowings as of the end of fiscal 2010. The increase in borrowings is primarily attributed to the Rafaella acquisition that occurred during January 2011. The overall decrease in interest expense is primarily attributable to the lower average balance on our senior credit facility and senior subordinated notes payable as compared to the comparable prior year period.
Income taxes. The income tax provision for fiscal 2011 was $11.4 million, a $7.8 million increase as compared to a $3.6 million expense for fiscal 2010. For fiscal 2011, our effective tax rate was 31.7% as compared to 21.1% in fiscal 2010. The increase in the tax rate is attributed to a larger proportion of worldwide income generated in the U.S. as opposed to lower statutory rate foreign jurisdictions as well as an increase in permanent nondeductible items.
Net income attributed to Perry Ellis International, Inc. Net income in fiscal 2011 was $24.1 million, an increase of $10.9 million, or 82.6%, as compared to $13.2 million in fiscal 2010 as a result of the above-mentioned factors.
Our fiscal 2010 results as compared to our fiscal 2009 results
Net sales. Net sales in fiscal 2010 were $729.2 million, a decrease of $96.7 million, or 11.7%, from $825.9 million in fiscal 2009. This decrease was primarily driven by our planned reduction of $26.0 million in our private label and replenishment business; several of our previous customers including Mervyns and Goody’s, which accounted for sales of approximately $13.0 million in fiscal 2009, subsequently filing for bankruptcy and liquidating as a result; the transition of the Perry Ellis dress shirts business to a licensed product; the exit of our PING and Dockers Outwear license agreements; and the exit of numerous specialty store programs. Additionally, net sales declined due to the decline in the overall economy and the resulting decline in retail customer demand. These decreases were partially offset by organic growth in several of our platforms— golf lifestyle, John Henry, Laundry by Shelli Segal and certain Hispanic brands.
Royalty income. Royalty income in fiscal 2010 was $25.0 million, a decrease of $0.4 million, or 1.6% from $25.4 in fiscal 2009. The decrease was due primarily to the loss of some smaller license agreements partially offset by the benefit of new licenses added in the categories of swimwear and dress shirts. Royalty income is derived from agreements entered into by us with our licensees, which average three to five years in length. The vast majority of our license agreements require licensees to pay us a royalty based on net sales and require licensees to pay a guaranteed minimum royalty. Approximately 91.4% of our royalty income was attributable to guaranteed minimum royalties with the balance attributable to royalty income in excess of the guaranteed minimums for fiscal 2010.
Gross profit. Gross profit was $249.1 million in fiscal 2010, a decrease of $29.2 million, or 10.5%, from $278.3 million in fiscal 2009. The decline was primarily due to the decline in net sales. As a percentage of total revenue, gross profit margins were 33.0% in fiscal 2010 compared to 32.7% in fiscal 2009, an increase of 30 basis points. Our overall fiscal 2010 gross margin growth was driven by a mix of higher margin branded product, the exiting of several lower margin private label programs, and the reduction of sales and operational allowance as compared to fiscal 2009.
Wholesale gross profit margins (which exclude the impact of royalty income) were 30.7% in fiscal 2010, compared to 30.6% in fiscal 2009. This slight increase is primarily attributable to the factors mentioned above.
37
Table of Contents
We also improved EBITDA margin during fiscal 2010, by 451 basis points increasing it to 6.4%, as compared to the same period last year. The primary increase is due to trademark and marketable security impairment charges of $20.7 million and $2.8 million, respectively, during fiscal 2009 that did not occur in fiscal 2010, as explained below. Additionally, the increase is also due to the decrease in selling, general and administrative expenses as a percentage of total revenue, as explained below, offset by the decrease in our gross profit margin, as explained above.
Selling, general and administrative expenses. Selling, general and administrative expenses in fiscal 2010 were $200.4 million, a decrease of $36.4 million, or 15.4%, from $236.8 million in fiscal 2009. As a percentage of total revenues, selling, general and administrative expenses decreased to 26.6% in fiscal 2010 as compared to 27.8% in fiscal 2009. The decrease, primarily in our wholesale business, in selling, general and administrative expenses, is attributed to a decrease in distribution costs, a reduction in advertising expenses, a decrease of third party commissions as a result of our exiting of certain specialty store programs and through our efforts to control sample costs. Also, because of our strategic review process, we undertook strategic initiatives and exited underperforming business and as such reduced the overhead associated with those businesses.
Depreciation and amortization. Depreciation and amortization in fiscal 2010 was $13.6 million, a decrease of $1.2 million, or 8.1%, from $14.8 million in fiscal 2009. Depreciation and amortization decreased as compared to the prior year, due primarily to the write-off of long lived assets in the amount of $1.6 million during the fourth quarter of fiscal 2009 and the decreased capital spending during fiscal 2010. As of January 30, 2010, we owned approximately $132.3 million of property, plant and equipment, at cost, as compared to approximately $130.6 million as of January 31, 2009, at cost.
Impairment on long-lived assets. During the fourth quarter of fiscal 2010, we experienced lower-than-expected performance at certain locations, which was due in part to the economic downturn. As a result, we recorded a $0.3 million impairment charge to reduce the net carrying value of certain long-lived assets (primarily leaseholds) at these locations to their estimated fair value. As a result of our annual impairment analysis, during fiscal 2009, we recorded trademark impairment charges of $20.7 million, due to decreases in our projected revenues for certain brands. The impairments result from a decline in the future anticipated cash flows from these trademarks, which is due, in part, to the current deterioration of economic and market conditions in the apparel industry. Also during fiscal 2009, we recorded a $1.6 million impairment charge to reduce the net carrying value of certain long-lived assets (primarily leaseholds) to their estimated fair value.
Costs on early extinguishment of debt. During the fourth quarter of fiscal 2010, we retired $20.8 million of our senior subordinated notes payable. In connection with this retirement, we paid an additional $98,000 in fees and premiums. Additionally we wrote-off approximately $259,000 in unamortized discount and bond fees, associated with the retired portion of the senior subordinated notes. The senior subordinated notes were scheduled to mature in September 15, 2013. We did not retire any of our senior subordinated notes during fiscal 2009.
Interest expense. Interest expense in fiscal 2010 was $17.4 million, a decrease of $0.1 million, or 0.6%, from $17.5 million in fiscal 2009. We ended fiscal 2010 with no borrowings on our senior credit facility as compared to $54.4 as of the end of fiscal 2009. The slight decrease in interest expense is primarily attributable to a lower average balance on our senior credit facility as compared to the prior year, partially offset by the change in fair value of our interest rate swap and interest rate cap in the amount of $1.0 million.
Income taxes. The income tax provision for fiscal 2010 was $3.6 million, a $7.3 million increase as compared to a $3.7 million benefit for fiscal 2009. For fiscal 2010, our effective tax rate was 21.2% as compared to (23.1%) in fiscal 2009. The decrease in the tax rate is attributed to decreases to our unrecognized tax benefits, an increase in the valuation allowance established against specific deferred tax assets and the change in ratio of income between domestic and foreign operations, of which the foreign operations are taxed at lower statutory tax rates.
38
Table of Contents
Net income (loss) attributed to Perry Ellis International, Inc. Net income in fiscal 2010 was $13.2 million, an increase of $26.1 million, or 202.3%, from net loss of ($12.9) million in fiscal 2009 as a result of the above-mentioned factors.
Our Liquidity and Capital Resources
We rely principally on cash flow from operations and borrowings under our senior credit facility to finance our operations, acquisitions and capital expenditures; and to a lesser extent, on letter of credit facilities for the acquisition of a small portion of our inventory purchases. We believe that as a result of our recent acquisition of Rafaella and our planned growth, our working capital requirements will increase for next year. As of January 29, 2011, our total working capital was $250.3 million as compared to $188.1 million as of January 30, 2010. During the first quarter of fiscal 2010, an underutilized $30 million letter of credit facility was terminated. Traditionally, our letter of credit facilities were used for trade financing. We have shifted our inventory financing strategy from relying on letter of credit facilities to direct trade terms with our vendors, and as such, we did not need the excess capacity provided by this letter of credit facility. Additionally during the third quarter of fiscal 2011, a $3.6 million letter of credit facility was terminated in connection with the termination of our Canadian joint venture. We believe that our cash flows from operations and availability under our senior credit facility and remaining letter of credit facilities are sufficient to meet our working capital needs. We also believe that our real estate assets, which had a net book value of $ 24.2 million at January 29, 2011, have a higher market value. These real estate assets may provide us with additional capital resources. Additional borrowings against these real estate assets, however would be subject to certain loan to value criteria established by lending institutions. As of January 29, 2011, we have mortgage loans on these properties totaling $26.4 million.
During March 2011, we sold 2.0 million shares of our common stock at a price to the public of $28.00 per share and an underwriting discount of $1.40 per share, resulting in net proceeds to us before offering expenses of $26.60 per share, or $53.2 million in aggregate net proceeds. We used the net proceeds from the common stock offering to repay a portion of the amounts outstanding under our senior credit facility.
Additionally, in March 2011, we sold $150 million in aggregate principal amount of our 7 7/8% Senior Subordinated Notes Due 2019 at a price to the public of 100.00% of par and an underwriting discount of 2.0%, resulting in aggregate net proceeds to us of $147.0 million. We used the net proceeds of the senior subordinated notes offering first to redeem our outstanding 8 7/8% Senior Subordinated Notes due 2013 at a redemption price of 101.4792% of the outstanding principal amount, plus accrued and unpaid interest, and the remaining net proceeds to repay a portion of the amounts outstanding under our senior credit facility.
Net cash provided by operating activities was $21.0 million in fiscal 2011 as compared to cash provided by operating activities of $88.8 million in fiscal 2010 and cash used by operating activities of $5.0 million in fiscal 2009.
The decrease of $67.8 million in the level of cash from operating activities in fiscal 2011 as compared to fiscal 2010 is primarily attributable to an increase in inventory of $43.1 million as compared to a decrease of inventory of $28.1 million during the same period in fiscal 2010. In line with our expectations, we strategically purchased inventory to secure pricing and capacity which resulted in a 38% increase of inventory as compared to fiscal 2010. The increase was the result of our planning to accelerate receipt of goods in anticipation of possible price increases. As a result of this increase in inventory, for fiscal 2011, our inventory turnover ratio decreased to 4.0 as compared to 4.7 for fiscal 2010. Additionally there were increases in operating cash flows attributed to the decrease in accounts receivable of $14.4 million due to an increase in collection efforts despite the increase in sales toward the end of the fourth quarter, an increase in accounts payable and accrued expenses of $6.7 million, a reduction in other assets and prepaid taxes of $3.2 million; offset by an decrease of $4.4 million in unearned revenues.
The increase of $93.8 million in the level of cash from operating activities in fiscal 2010 as compared to fiscal 2009 is primarily attributable to the increase in net income of $26.1 million, a decrease in accounts receivable of $4.6 million due to an increase in collection efforts despite the increase in sales toward the end of
39
Table of Contents
the fourth quarter, a decrease in inventory of $28.1 million due to tighter controls in inventory planning and an anticipated reduction in certain replenishment programs. As a result of the decrease in inventory, for fiscal 2010, our inventory turnover ratio increased to 4.7 as compared to 4.3 for fiscal 2009. Additionally there were increases in operating cash flows attributed to an increase in accounts payable and accrued expenses of $17.1 million, a reduction in other assets and prepaid taxes of $6.2 million; offset by a decrease of $3.7 million in unearned revenues.
Net cash used in investing activities was $94.5 million in fiscal 2011, primarily reflecting the acquisition of the Rafaella brands and working capital for $80.0 million, the purchases of property and equipment of $6.2 million and the establishment of restricted cash as collateral for letters of credits assumed during the Rafaella acquisition of $9.4 million, partially offset by the proceeds received in the amount of $1.1 million from the sale of an intangible asset during fiscal 2010. Net cash used in investing activities was $2.0 million in fiscal 2010, primarily reflecting the purchases of property and equipment of $2.7 million, partially, offset by the proceeds received in the amount of $0.7 million from the sale of an intangible asset for a total sales price of $1.8 million of which the balance was collected during fiscal 2011. Net cash used in investing activities was $44.4 million in fiscal 2009, which primarily reflects the purchase of property and equipment in the amount of $10.2 million, the acquisition of the C&C California and Laundry by Shelli Segal brands and inventory for $34.0 million and proceeds of $0.1 million from the sale of marketable securities. We anticipate capital expenditures during fiscal 2012 of $10 million to $12 million in technology, systems, retail stores, and other expenditures.
Net cash provided by financing activities in fiscal 2011 was $73.6 million, which primarily reflects the net borrowings on our senior credit facility of $97.3 million which were used primarily to finance the Rafaella acquisition, proceeds from exercises of stock options of $2.7 million, a tax benefit from the exercise of stock options of $2.3 million and the proceeds from our new mortgage loan in the amount of $13.0 million, offset by the payment for the noncontrolling interest in our Canadian joint venture of $4.6 million and payments of $11.5 million on our mortgages and capital leases. Additionally, we repurchased senior subordinated notes in the amount of $25.5 million, including redemption premiums and commissions of $0.5 million Net cash used in financing activities in fiscal 2010 was $77.0 million, which primarily reflects the net payments on our senior credit facility of $54.4 million, the repurchase of senior subordinated notes in the amount of $20.8 million, including redemption premiums and commissions of $0.1 million, the payments of $0.5 million on our mortgages, and the purchase of treasury stock of $1.8 million, partially offset by the proceeds received from the exercise of stock options of $0.6 million and $0.2 million in tax benefit from the exercise of those options. Net cash provided by financing activities in fiscal 2009 was $45.6 million, which primarily reflects the net borrowings on our senior credit facility of $54.4 million and the proceeds received from the exercise of stock options of $3.8 million and $1.6 million in tax benefit from the exercise of those options, offset by the payments of $1.4 million on our mortgages, purchase of treasury stock of $11.6 million and a payment of a loan to a noncontrolling partner of $0.6 million.
During fiscal 2010, our Board of Directors authorized us to purchase, from time to time and as market and business conditions warrant, our senior subordinated notes for cash in the open market or in privately negotiated transactions. The amount of senior subordinated notes that may be repurchased or otherwise retired, if any, would be based on parameters approved by the Board of Directors and will depend on market conditions, trading levels of our senior subordinated notes, our cash position and other considerations. During fiscal 2011 and 2010, we repurchased $25.0 million and $20.8 million, respectively. On March 8, 2011, the senior subordinated notes in the amount of $104.3 million due September 15, 2013 were called and subsequently retired from the proceeds of our newly issued 7 7/ 8% Senior Subordinated Notes Due 2019.
In September 2010, the Board of Directors extended the stock repurchase program, which authorizes us to continue to repurchase up to $20 million of our common stock for cash over the next twelve months. Although the Board of Directors allocated a maximum of $20 million to carry out the program, we are not obligated to purchase any specific number of outstanding shares, and will reevaluate the program on an ongoing basis. Total purchases under this plan, since inception, have amounted to $17.4 million through January 29, 2011. No purchases were made during fiscal 2011 under the program.
40
Table of Contents
Acquisitions
On January 28, 2011, we completed the acquisition of substantially all of the assets of Rafaella Apparel Group, Inc. (“Rafaella”), Rafaella Apparel Far East Limited (“Rafaella Far East”) and Verrazano, Inc. (“Verrazano”) pursuant to the Asset Purchase Agreement dated as of January 7, 2011 (the “Agreement”) by and among Rafaella, Rafaella Far East and Verrazano (collectively, the “Sellers”) and the Company.
The consideration paid by us totaled $80 million in cash and a warrant to purchase 106,564 shares of our common stock valued at approximately $2.6 million. The cash portion of the purchase price is subject to adjustment as set forth in the Agreement based on a post-closing true-up of net working capital. The Agreement provides for the escrow of $3.5 million of the cash portion of the purchase price for a period of one year following the closing date to satisfy certain indemnity claims against the Sellers under the Agreement and an additional $3.0 million for a period of up to approximately 90 days following the closing date in connection with the post-closing true-up adjustments. We funded the acquisition through our senior credit facility, including a $25 million exercise of the accordion feature under the credit facility.
The warrant issued to Rafaella as part of the purchase price became exercisable on the business day immediately following the first business day after the closing on which the closing price of the our common stock equaled or exceeded $28.152 and expires two years following the closing date. The warrant is exercisable for a total of 106,565 shares of the Company’s common stock at an exercise price of $.01 per share. The exercise price per share and number of shares issuable upon exercise are subject to adjustments for stock splits, dividends, subdivisions or combinations involving our common stock.
On February 4, 2008, we completed the acquisition of the C&C California and Laundry by Shelli Segal brands and related assets from Liz Claiborne, Inc. The acquisition was financed through existing cash and borrowings under our existing senior credit facility. The transaction was valued at $34 million. Both brands are ideally positioned to increase our diversification in contemporary women’s apparel. Both brands sell in luxury retail stores, department stores and specialty boutiques. The results of operations of the acquired brands have been included in the Company’s operations beginning as of the date of the acquisition.
Senior Credit Facility
Effective March 31, 2010, we entered into an amendment to our senior credit facility. This amendment modified the senior credit facility to permit the sale of all present and future accounts receivable due from Kohl’s to Bank of America, N. A.
The following is a description of the terms of our senior credit facility with Wachovia Bank, National Association, et al, as amended, and does not purport to be complete and is subject to, and qualified in its entirety by reference to, all the provisions of the senior credit facility: (i) the maximum line is up to $150 million with the opportunity to increase this amount in $25 million increments up to $200 million; (ii) the inventory borrowing limit is $90 million or 60% of the maximum line; (iii) the sublimit for letters of credit is up to $40 million; (iv) the amount of letter of credit facilities allowed outside of the facility is $110 million and (v) the outstanding balance is due at the maturity date of February 1, 2012. At January 29, 2011 we had $97.3 million of outstanding borrowings under the senior credit facility.
Certain Covenants. The senior credit facility contains certain covenants, which, among other things, requires us to maintain a minimum adjusted EBITDA (“Senior Credit Facility Adjusted EBITDA”), as defined in the senior credit facility (as opposed to the definition of EBITDA used by us for other purposes), if availability falls below a certain threshold. These covenants may restrict our ability and the ability of our subsidiaries to, among other things, incur additional indebtedness in certain circumstances, redeem or repurchase capital stock, make certain investments, or sell assets. We are prohibited from paying cash dividends under these covenants. We are not aware of any non-compliance with any of our covenants under the senior credit facility. We could be materially harmed if we violate any covenants as the lenders under the senior credit facility could declare all amounts outstanding thereunder, together with accrued interest, to be immediately due and payable. If we are unable to repay those amounts, the lenders could proceed against our assets. In addition, a violation could also constitute a cross-default under the indenture and mortgage, resulting in all of our debt obligations becoming immediately due and payable, which we may not be able to satisfy.
41
Table of Contents
Borrowing Base. Borrowings under our senior credit facility are limited under its terms to a borrowing base calculation, which generally restricts the outstanding balances to the lesser of either (1) the sum of (a) 85.0% of eligible receivables plus (b) 85.0% of its eligible factored accounts receivables up to $10.0 million plus (c) the lesser of (i) the inventory loan limit of $90 million or up to 60% of the maximum line, or (ii) the lesser of (A) 65.0% of eligible finished goods inventory, or (B) 85.0% of the net recovery percentage (as defined in the senior credit facility) of eligible inventory, or (2) the loan limit; and in each case minus (x) 35.0% of the amount of outstanding letters of credit for eligible inventory, (y) the full amount of all other outstanding letters of credit issued pursuant to the senior credit facility which are not fully secured by cash collateral, and (z) licensing reserves for which we are the licensee of certain branded products.
Interest. Interest on the principal balance under our senior credit facility accrues, at our option, at either (a) the greater of Wachovia’s prime lending rate or the Federal Funds rate; plus 1/2% plus a margin spread of 100 to 175 basis points based upon the sum of our quarterly average excess availability plus excess cash for the immediately preceding fiscal quarter, at the time of borrowing or (b) the rate quoted by Wachovia as the average monthly Eurodollar Rate for 1-month Eurodollar deposits plus a margin spread of 200 to 275 basis points based upon the sum of our quarterly average excess availability plus excess cash for the immediately preceding fiscal quarter, at the time of borrowing.
Security. As security for the indebtedness under the senior credit facility, we granted the lenders a first priority security interest in substantially all of our existing and future assets other than our trademark portfolio and real estate owned, including, without limitation, accounts receivable, inventory, deposit accounts, general intangibles, equipment and capital stock or membership interests, as the case may be, of certain subsidiaries.
Letter of Credit Facilities
As of January 29, 2011 we maintained two U.S. dollar letter of credit facilities totaling $50.0 million and one letter of credit facility totaling $1.0 million utilized by our United Kingdom subsidiary. Each letter of credit is secured primarily by the consignment of merchandise in transit under that letter of credit and certain subordinated liens on our assets. During the third quarter of fiscal 2011, because of the termination of our Canadian joint venture, we cancelled the letter of credit facility utilized by our Canadian joint venture, which totaled an estimated $3.6 million. As of January 29, 2011 there was $45.1 million available under the existing letter of credit facilities.
Additionally, we assumed certain letters of credit in the amount of $9.4 million, in connection with the acquisition of certain net assets from Rafaella. These letters of credit are fully collateralized by restricted cash in the amount of $9.4 million. We expect the letter of credits to expire during the second quarter of fiscal 2012.
8 7/8% $150 Million Senior Subordinated Notes Payable
In fiscal 2004, we issued $150 million 8 7/8% senior subordinated notes, due September 15, 2013. The proceeds of this offering were used to redeem previously issued $100 million 12 1/4% senior subordinated notes and to pay down the outstanding balance of the senior credit facility at that time. The proceeds to us were $146.8 million yielding an effective interest rate of 9.1%.
Certain Covenants. The indenture governing the senior subordinated notes contains certain covenants which restrict our ability and the ability of our subsidiaries to, among other things, incur additional indebtedness in certain circumstances, redeem or repurchase capital stock, make certain investments, or sell assets. We are not aware of any non-compliance with any of our covenants in this indenture. We are prohibited from paying cash dividends under these covenants. We could be materially harmed if we violate any covenants because the indenture’s trustee could declare the outstanding notes, together with accrued interest, to be immediately due and payable, which we may not be able to satisfy. In addition, a violation could also constitute a cross-default under the senior credit facility, the letter of credit facilities and the real estate mortgages resulting in all of our debt obligations becoming immediately due and payable, which we may not be able to satisfy.
42
Table of Contents
During the fourth quarter of fiscal 2010, we retired $20.8 million of our senior subordinated notes payable. In connection with this retirement, we paid an additional $98,000 in redemption premiums and commissions. Additionally, we wrote-off approximately $259,000 in unamortized discount and bond fees associated with the retired portion of our senior subordinated notes.
During June 2010, we retired $25.0 million of our senior subordinated notes payable. In connection with this retirement, we paid an additional $453,000 in redemption premiums and commissions. Additionally, we wrote-off approximately $277,000 in unamortized discount and bond fees associated with the retired portion of our senior subordinated notes.
On March 8, 2011, the senior subordinated notes due September 15, 2013 were called and subsequently retired by the issuance of new notes more fully described herein. In connection with the call, we incurred an early call premium of $1,542,000. We also wrote-off the remaining unamortized discount and bond fees associated with the senior subordinated notes.
7 7/8% $150 Million Senior Subordinated Notes Payable
In March 2011, we issued $150 million 7 7/8% senior subordinated notes, due April 1, 2019. The proceeds of this offering were used to retire the $150 million senior subordinated notes due September 15, 2013 and to repay a portion of the senior credit facility. The proceeds to us were $147.0 million yielding an effective interest rate of 8.0%.
Certain Covenants. The indenture governing the senior subordinated notes contains certain covenants which restrict our ability and the ability of our subsidiaries to, among other things, incur additional indebtedness in certain circumstances, pay dividends or make other distributions on, redeem or repurchase capital stock, make investments or other restricted payments, create liens on assets to secure debt, engage in transactions with affiliates, and effect a consolidation or merger. We are not aware of any non-compliance with any of our covenants in this indenture. We could be materially harmed if we violate any covenants because the indenture’s trustee could declare the outstanding notes, together with accrued interest, to be immediately due and payable, which we may not be able to satisfy. In addition, a violation could also constitute a cross-default under the senior credit facility, the letter of credit facilities and the real estate mortgages resulting in all of our debt obligations becoming immediately due and payable, which we may not be able to satisfy.
Real Estate Mortgage Loans
In fiscal 2003, we acquired our main administrative office, warehouse and distribution facility in Miami and partially financed the acquisition of the facility with an $11.6 million mortgage loan. The real estate mortgage loan contained certain covenants. Interest was fixed at 7.123%. In August 2008, we executed a maturity extension of the real estate mortgage loan until July 1, 2010. In July 2010, we paid off the real estate mortgage loan.
In July 2010, we refinanced our main administrative office, warehouse and distribution facility in Miami with a $13.0 million mortgage loan. The real estate mortgage loan contains certain covenants. We are not aware of any non-compliance with any of our covenants. If we violate any covenants, the lender under the real estate mortgage loan could declare all amounts outstanding thereunder to be immediately due and payable, which we may not be able to satisfy. The loan is due on August 1, 2020. Principal and interest of $83,000 is due monthly based on a 25 year amortization with the outstanding principal due at maturity. Interest is fixed at 5.80%. At January 29, 2011, the balance of the real estate mortgage loan totaled $12.7 million, net of discount, of which $223,000 is due within one year.
In June 2006, we entered into a mortgage loan for $15 million secured by our Tampa facility. The loan is due on June 7, 2016. Principal and interest of $297,000 were due quarterly based on a 20 year amortization with the outstanding principal due at maturity. Interest was set at 6.25% for the first five years, at which point it would have reset based on the terms and conditions of the promissory note. In June 2010, we negotiated with the bank to accelerate the rate reset that was scheduled to occur in June 2011. The interest rate was reduced to 5.75% per annum. The terms were restated to reflect new quarterly payments of principal and interest of $288,000, based on a 20 year amortization with the outstanding principal due at maturity. At January 29, 2011, the balance of the real estate mortgage loan totaled $13.6 million, net of discount, of which $369,000 is due within one year.
43
Table of Contents
Under the terms of the mortgage loans, a covenant violation could constitute a cross-default under our senior credit facility, the letter of credit facilities and indenture relating to our senior subordinated notes resulting in all our debt obligations becoming immediately due and payable, which we may not be able to satisfy.
Contractual Obligations and Commercial Contingent Commitments
The following tables illustrate the balance of our contractual obligations and commercial contingent commitments as of January 29, 2011:
| Payments Due by Period | ||||||||||||||||||||
| (in thousands) | ||||||||||||||||||||
| Contractual Obligations |
Total | Less than 1 year |
1-3 years | 4-5 years | After 5 years | |||||||||||||||
| Senior subordinated notes payable |
$ | 104,250 | $ | — | $ | 104,250 | $ | — | $ | — | ||||||||||
| Senior credit facility |
97,342 | — | 97,342 | — | — | |||||||||||||||
| Real estate mortgages |
26,648 | 592 | 1,334 | 1,499 | 23,223 | |||||||||||||||
| Operating leases |
69,561 | 15,814 | 25,157 | 16,267 | 12,323 | |||||||||||||||
| Capital leases |
538 | 379 | 159 | — | — | |||||||||||||||
| Derivative Liability |
1,832 | 546 | 1,286 | — | — | |||||||||||||||
| Pension Liability |
18,064 | 3,128 | 6,455 | 5,169 | 3,312 | |||||||||||||||
| Royalty minimum guaranties |
22,878 | 6,437 | 12,515 | 3,718 | 208 | |||||||||||||||
| Total contractual cash obligations |
$ | 341,113 | $ | 26,896 | $ | 248,498 | $ | 26,653 | $ | 39,066 | ||||||||||
| Amount of Contingent Commitment Expiration Per Period | ||||||||||||||||||||
| (in thousands) | ||||||||||||||||||||
| Other Commercial Contingent Commitments |
Total | Less than 1 year |
1-3 years | 4-5 years | After 5 years | |||||||||||||||
| Letters of credit |
$ | 10,492 | $ | 10,492 | $ | — | $ | — | $ | — | ||||||||||
| Standby letters of credit |
4,735 | 4,735 | — | — | — | |||||||||||||||
| Total commercial commitments |
$ | 15,227 | $ | 15,227 | $ | — | $ | — | $ | — | ||||||||||
| Total contractual obligations and other commercial contingent commitments |
$ | 356,340 | $ | 42,123 | $ | 248,498 | $ | 26,653 | $ | 39,066 | ||||||||||
On March 8, 2011, the senior subordinated notes in the amount of $104.3 million due September 15, 2013 were called and subsequently retired from the proceeds of our newly issued 7 7/8% Senior Subordinated Notes Due 2019. Also, in connection with the call of the senior subordinated notes, we elected to terminate the $75 million Cap Agreement. We made a $1.6 million termination payment during March 2011.
Management believes that the combination of borrowing availability under the amended senior credit facility, letter of credit facilities, and funds anticipated to be generated from operating activities, will be sufficient to meet our operating and capital needs in the foreseeable future.
At January 29, 2011, we had a liability for unrecognized tax benefits and an accrual for the payment of related interest and penalties totaling $1.2 million. Due to the uncertainties related to these tax matters, we are unable to make a reasonably reliable estimate when cash settlement with a taxing authority will occur in relation to these liabilities.
44
Table of Contents
Off-Balance Sheet Arrangements
We are not a party to any “off-balance sheet arrangements”, as defined by applicable GAAP and SEC rules.
Derivative Financial Instruments
Derivative financial instruments such as interest rate swap contracts and foreign exchange contracts are recognized in the financial statements and measured at fair value regardless of the purpose or intent for holding them. Changes in the fair value of derivative financial instruments are either recognized in income or stockholders’ equity (as a component of comprehensive income), depending on whether the derivative is not designated as a hedge or is designated as a hedge of changes in fair value or cash flows. When designated as a hedge of changes in fair value, the effective portion of the hedge is recognized as an offset in income with a corresponding adjustment to the hedged item. When designated as a hedge of changes in cash flows, the effective portion of the hedge is recognized as an offset in comprehensive income with a corresponding adjustment to the hedged item and recognized in income in the same period as the hedged item is settled. See “Item 7A – Quantitative and Qualitative Disclosures About Market Risk” for further discussion about derivative financial instruments.
Effects of Inflation and Foreign Currency Fluctuations
We do not believe that inflation or foreign currency fluctuations significantly affected our financial position and results of operations as of and for the fiscal year ended January 29, 2011.
Item 7A. Quantitative and Qualitative Disclosures About Market Risk
The market risk inherent in our financial statements represents the potential changes in the fair value, earnings or cash flows arising from changes in interest rates. We manage this exposure through regular operating and financing activities and, when deemed appropriate, through the use of derivative financial instruments. Our policy allows the use of derivative financial instruments for identifiable market risk exposure, including interest rate.
Derivatives on $150 Million Senior Subordinated Notes Payable
In August 2009, we entered into an interest rate swap agreement (the “Swap Agreement”) for an aggregate notional amount of $75 million in order to reduce our debt servicing costs associated with our $150 million 8 7/8% senior subordinated notes. The Swap Agreement was scheduled to terminate on September 15, 2013. Under the Swap Agreement, we were entitled to receive semi-annual interest payments on September 15 and March 15 at a fixed rate of 87/8% and were obligated to make semi-annual interest payments on September 15 and March 15 at a floating rate based on the one-month LIBOR rate plus 632 basis points for the period through September 15, 2013. The Swap Agreement had an optional call provision that allowed the counterparty to settle the Swap Agreement at any time with 30 days notice and subject to declining termination premium payments from the counterparty in the event the call was exercised. The Swap Agreement was a fair value hedge as it had been designated against the 87/8% senior subordinated notes carrying a fixed rate of interest and converted the fixed interest payments to variable interest payments.
During August 2010, we were notified by the counterparty that it would exercise the optional call provision and terminate the Swap Agreement in September 2010. As per the terms of the call provision, we received $1.1 million, its fair value as of the termination date. The fair value of the hedge at the termination date will be amortized over the remaining term of the 87/8% senior subordinated notes payable.
The Swap Agreement resulted in a decrease to interest expense of $1.3 million and $0.3 million for the years ended January 29, 2011 and January 30, 2010, respectively. The fair value of the Swap Agreement recorded on our consolidated balance sheet was $1.2 million as of January 30, 2010.
45
Table of Contents
In August 2009, we entered into an interest rate cap agreement (the “$75 million Cap Agreement”) for an aggregate notional amount of $75 million associated with 87/8% our senior subordinated notes. The $75 million Cap Agreement became effective on December 15, 2010 and was scheduled to terminate on September 15, 2013. The $75 million Cap Agreement was being used to manage cash flow risk associated with our floating interest rate exposure pursuant to the Swap Agreement. The $75 million Cap Agreement did not qualify for hedge accounting treatment. The change in fair value resulted in an increase to interest expense of $1.4 million and $1.2 million for the years ended January 29, 2011 and January 30, 2010, respectively. The fair value of the $75 million Cap Agreement recorded on our consolidated balance sheet was $1.8 million and $1.2 million for the years ended January 29, 2011 and January 30, 2010, respectively. We terminated the $75 million Cap Agreement during March 2011. In connection with the termination, we paid $1.6 million.
The table below provides information about the Company’s derivative financial instruments and other financial instruments that are sensitive to changes in interest rates, including interest rate swaps and debt obligations:
| Expected Maturity Date Fiscal Years Ended (In Millions) | ||||||||||||||||||||||||||||||||
| Less than 1 yr | 1 - 3 yrs | 4 - 5 yrs | After 5 yrs | Fair Value | ||||||||||||||||||||||||||||
| 2012 | 2013 | 2014 | 2015 | 2016 | Thereafter | Total | 2011 | |||||||||||||||||||||||||
| Long-term Liabilities: |
||||||||||||||||||||||||||||||||
| 8 7/8% Senior Subordinated Notes Payable |
$ | 0.0 | $ | 0.0 | $ | 104.3 | $ | 0.0 | $ | 0.0 | $ | 0.0 | $ | 104.3 | $ | 106.3 | ||||||||||||||||
| Fixed Interest Rate |
8.88 | % | 8.88 | % | 8.88 | % | 8.88 | % | 8.88 | % | N/A | 8.88 | % | |||||||||||||||||||
| Real Estate Mortgage |
$ | 0.2 | $ | 0.3 | $ | 0.3 | $ | 0.3 | $ | 0.3 | $ | 11.5 | $ | 12.9 | $ | 12.9 | ||||||||||||||||
| Fixed Interest Rate |
5.80 | % | 5.80 | % | 5.80 | % | 5.80 | % | 5.80 | % | 5.80 | % | 5.80 | % | ||||||||||||||||||
| Real Estate Mortgage |
$ | 0.4 | $ | 0.4 | $ | 0.4 | $ | 0.4 | $ | 0.5 | $ | 11.7 | $ | 13.8 | $ | 13.8 | ||||||||||||||||
| Variable Interest Rate (A) |
5.75 | % | 5.75 | % | 5.75 | % | 5.75 | % | 5.75 | % | 5.75 | % | 5.75 | % | ||||||||||||||||||
| Senior Credit Facility |
$ | 0.0 | $ | 97.3 | $ | 0.0 | $ | 0.0 | $ | 0.0 | $ | 0.0 | $ | 97.3 | $ | 97.3 | ||||||||||||||||
| Average Variable Interest Rate (B) |
2.51 | % | 2.51 | % | N/A | N/A | N/A | N/A | 2.51 | % | ||||||||||||||||||||||
| (A) | Real estate mortgage has a fixed rate for the first five years, at which point it will be reset based on the terms and conditions of the promissory note. |
| (B) | Senior credit facility has a variable rate of interest of either 1) the published prime lending rate or 2) Eurodollar rate with adjustments of both rates based on meeting certain financial conditions. |
The table above does not include our newly issued fixed rate 7 7/8% Senior Subordinated Notes Due 2019.
Commodity Price Risk
We are exposed to market risks for the pricing of cotton and other fibers, which may impact fabric prices. Fabric is a portion of the overall product cost, which includes various components. We manage our fabric prices by using a combination of different strategies including the utilization of sophisticated logistics and supply chain management systems, which allow us to maintain maximum flexibility in our global sourcing of products. This provides us with the ability to re-direct our sourcing of products to the most cost-effective jurisdictions. In addition, we may modify our product offerings to our customers based on the availability of new fibers, yield enhancement techniques and other technological advances that allow us to utilize more cost effective fibers. Finally, we also have the ability to adjust our price points of such products, to the extent market conditions allow.
46
Table of Contents
These factors, along with our foreign-based sourcing offices, allow us to procure product from lower cost countries or capitalize on certain tariff-free arrangements, which help mitigate any commodity price increases that may occur. We have not historically managed, and do not currently intend to manage, commodity price exposures by using derivative instruments.
Item 8. Financial Statements And Supplementary Data
See pages F-1 through F-50 appearing at the end of this report.
Item 9. Changes in and Disagreements with Accountants on Accounting and Financial Disclosure
None.
Item 9A. Controls and Procedures
Evaluation of Disclosure Controls and Procedures
As required by Exchange Act Rule 13a-15(b), we carried out an evaluation, under the supervision and with the participation of our Chairman of the Board and Chief Executive Officer and our Chief Financial Officer, of the effectiveness of the design and operation of our disclosure controls and procedures as of January 29, 2011.
The purpose of disclosure controls is to ensure that information required to be disclosed in our reports filed with the SEC is recorded, processed, summarized and reported within the time periods specified in the SEC’s rules and forms. Disclosure controls are also designed with the objective of ensuring that such information is accumulated and communicated to our management, including our Chief Executive Officer and our Chief Financial Officer, to allow timely decisions regarding required disclosure. The purpose of internal controls over financial reporting is to provide reasonable assurance that our transactions are properly authorized, our assets are safeguarded against unauthorized or improper use and our transactions are properly recorded and reported to permit the preparation of our financial statements in conformity with generally accepted accounting principles.
Our management does not expect that our disclosure controls or our internal controls will prevent all errors and all fraud. A control system, no matter how well conceived and operated, can provide only reasonable rather than absolute assurance that the objectives of the control system are met. The design of a control system must also reflect the fact that there are resource constraints, with the benefits of controls considered relative to their costs. Because of the inherent limitations in all control systems, no evaluation of controls can provide absolute assurance that all control issues and instances of fraud (if any) within the company have been detected. These inherent limitations include the realities that judgments in decision-making can be faulty and that simple errors or mistakes can occur. Controls can also be circumvented by the individual acts of some persons, by collusion of two or more people, or by management override of the control. The design of any system of controls also is based in part upon certain assumptions about the likelihood of future events, and there can be no assurance that any design will succeed in achieving its stated goals under all potential future conditions; over time, controls may become inadequate because of changes in conditions, or the degree of compliance with the policies or procedures may deteriorate. Because of the inherent limitations in a cost-effective control system, misstatements due to error or fraud may occur and not be detected.
Our internal controls are evaluated on an ongoing basis by our internal audit function and by other personnel in our organization. The overall goals of these various evaluation activities are to monitor our disclosure and internal controls and to make modifications as necessary, as disclosure and internal controls are intended to be dynamic systems that change (including improvements and corrections) as conditions warrant. Part of this evaluation is to determine whether there were any significant deficiencies or material weaknesses in our internal controls, or whether we had identified any acts of fraud involving personnel who have a significant role in our internal controls. Significant deficiencies are control issues that could have a significant adverse effect on the ability to record, process, summarize and report financial data in the financial statements. Material weaknesses are
47
Table of Contents
particularly serious conditions where the internal control does not reduce to a relatively low level the risk that misstatements caused by error or fraud may occur in amounts that would be material in relation to the financial statements and not be detected within a timely period by employees in the normal course of performing their assigned functions.
Based upon this evaluation, our Chairman of the Board and Chief Executive Officer and our Chief Financial Officer concluded that, subject to the limitations noted above, our disclosure controls and procedures were effective as of January 29, 2011 in ensuring that the information required to be disclosed by us in the reports that we file or submit under the Securities Exchange Act is (i) recorded, processed, summarized and reported within the time periods specified in the SEC’s rules and forms and (ii) that such information is accumulated and communicated to our management, including our principal executive officer and principal financial officer, as appropriate, to allow timely decisions regarding required disclosure.
48
Table of Contents
MANAGEMENT’S REPORT ON INTERNAL CONTROL
April 13, 2011
To the Stockholders of Perry Ellis International, Inc.
Management of Perry Ellis International is responsible for establishing and maintaining adequate internal control over financial reporting. Internal control over financial reporting is a process designed by, or under the supervision of, our principal executive and principal financial officers and effected by our board of directors, management and other personnel to provide reasonable assurance regarding the reliability of financial reporting and the preparation of financial statements for external purposes in accordance with generally accepted accounting principles and includes those policies and procedures that:
| • | pertain to the maintenance of records that in reasonable detail accurately and fairly reflect the transactions and dispositions of our assets; |
| • | provide reasonable assurance that transactions are recorded as necessary to permit preparation of financial statements in accordance with generally accepted accounting principles, and that our receipts and expenditures are being made only in accordance with authorizations of our management and directors; and |
| • | provide reasonable assurance regarding prevention or timely detection of unauthorized acquisition, use or disposition of our assets that could have a material effect on the financial statements. |
Because of inherent limitations, internal control over financial reporting may not prevent or detect misstatements. Projections of any evaluation of effectiveness to future periods are subject to the risks that controls may become inadequate because of changes in conditions, or that the degree of compliance with the policies or procedures may deteriorate.
Management assessed the effectiveness of our internal control over financial reporting as of January 29, 2011. In making this assessment, management used the criteria set forth by the Committee of Sponsoring Organizations of the Treadway Commission in Internal Control-Integrated Framework.
Management believes that, as of January 29, 2011, our internal control over financial reporting was effective.
| /s/ GEORGE FELDENKREIS | /s/ ANITA BRITT | |||
| George Feldenkreis | Anita Britt | |||
| Chairman of the Board and Chief Executive Officer | Chief Financial Officer |
49
Table of Contents
REPORT OF INDEPENDENT REGISTERED PUBLIC ACCOUNTING FIRM
To the Board of Directors and Stockholders of
Perry Ellis International, Inc.
Miami, Florida
We have audited the internal control over financial reporting of Perry Ellis International, Inc. and subsidiaries (the “Company”) as of January 29, 2011, based on criteria established in Internal Control — Integrated Framework issued by the Committee of Sponsoring Organizations of the Treadway Commission. The Company’s management is responsible for maintaining effective internal control over financial reporting and for its assessment of the effectiveness of internal control over financial reporting, included in the accompanying Management’s Report on Internal Control. Our responsibility is to express an opinion on the Company’s internal control over financial reporting based on our audit.
We conducted our audit in accordance with the standards of the Public Company Accounting Oversight Board (United States). Those standards require that we plan and perform the audit to obtain reasonable assurance about whether effective internal control over financial reporting was maintained in all material respects. Our audit included obtaining an understanding of internal control over financial reporting, assessing the risk that a material weakness exists, testing and evaluating the design and operating effectiveness of internal control based on the assessed risk, and performing such other procedures as we considered necessary in the circumstances. We believe that our audit provides a reasonable basis for our opinion.
A company’s internal control over financial reporting is a process designed by, or under the supervision of, the company’s principal executive and principal financial officers, or persons performing similar functions, and effected by the company’s board of directors, management, and other personnel to provide reasonable assurance regarding the reliability of financial reporting and the preparation of financial statements for external purposes in accordance with generally accepted accounting principles. A company’s internal control over financial reporting includes those policies and procedures that (1) pertain to the maintenance of records that, in reasonable detail, accurately and fairly reflect the transactions and dispositions of the assets of the company; (2) provide reasonable assurance that transactions are recorded as necessary to permit preparation of financial statements in accordance with generally accepted accounting principles, and that receipts and expenditures of the company are being made only in accordance with authorizations of management and directors of the company; and (3) provide reasonable assurance regarding prevention or timely detection of unauthorized acquisition, use, or disposition of the company’s assets that could have a material effect on the financial statements.
Because of the inherent limitations of internal control over financial reporting, including the possibility of collusion or improper management override of controls, material misstatements due to error or fraud may not be prevented or detected on a timely basis. Also, projections of any evaluation of the effectiveness of the internal control over financial reporting to future periods are subject to the risk that the controls may become inadequate because of changes in conditions, or that the degree of compliance with the policies or procedures may deteriorate.
In our opinion, the Company maintained, in all material respects, effective internal control over financial reporting as of January 29, 2011, based on the criteria established in Internal Control — Integrated Framework issued by the Committee of Sponsoring Organizations of the Treadway Commission.
We have also audited, in accordance with the standards of the Public Company Accounting Oversight Board (United States), the consolidated financial statements as of and for the year ended January 29, 2011 of the Company and our report dated April 13, 2011 expressed an unqualified opinion on those financial statements.
/s/ Deloitte & Touche LLP
Certified Public Accountants
Miami, Florida
April 13, 2011
50
Table of Contents
Changes in Internal Controls over Financial Reporting
There have been no changes in our internal controls over financial reporting that occurred during our last fiscal quarter that have materially affected, or are reasonably likely to materially affect, our internal control over financial reporting.
Item 9B. Other Information
Not applicable.
PART III
Item 10. Directors, Executive Officers and Corporate Governance
Information regarding our directors and executive officers required by this item is included in our Proxy Statement relating to our 2011 Annual Meeting under the captions “Election of Directors” and “Management” and is incorporated herein by reference.
Information regarding our audit committee and our audit committee financial expert required by this item is included in our Proxy Statement relating to our 2011 Annual Meeting under the caption “Meetings and Committees of the Board of Directors” and is incorporated herein by reference.
Information regarding compliance with Section 16 of the Securities Exchange Act of 1934 is included in our Proxy Statement relating to our 2011 Annual Meeting under the caption “Section 16(a) Beneficial Ownership Reporting Compliance” and is incorporated herein by reference.
We have adopted a Code of Ethics that applies to all of our directors, officers, and employees. The Code of Ethics is posted on our website at www.pery.com. Amendments to, and waivers granted under, our Code of Ethics, if any, will be posted to our website as well.
Information describing any material changes to the procedures by which security holders may recommend nominees to our Board of Directors is included in our Proxy Statement related to our 2011 Annual Meeting under the caption “Election of Directors.”
Item 11. Executive Compensation
Information required by this item is included in our Proxy Statement related to our 2011 Annual Meeting under the captions “Executive Compensation”, “Compensation Discussion and Analysis,” “Summary Compensation Table”, “Grants of Plan-Based Awards in Last Fiscal year”, “Outstanding Equity Awards Held at End of Fiscal 2011,” “Options Exercised and Stock Vested,” “Pension Benefits and Nonqualified Deferred Compensation,” “Compensation of Directors,” “Employment Agreements,” “Compensation Committee Interlocks and Insider Participation” and “Compensation Committee Report” and is incorporated herein by reference.
Item 12. Security Ownership of Certain Beneficial Owners and Management and Related Stockholder Matters
Information required by this item is included in our Proxy Statement related to our 2011 Annual Meeting under the captions “Security Ownership of Certain Beneficial Owners and Management” and “Equity Compensation Plan Information for Fiscal 2011” and is incorporated herein by reference.
51
Table of Contents
Item 13. Certain Relationships and Related Transactions and Director Independence
Information required by this item is included in our Proxy Statement related to our 2011 Annual Meeting under the captions “Certain Relationships and Related Transactions” and “Meetings and Committees of the Board of Directors” and is incorporated herein by reference.
Item 14. Principal Accounting Fees and Services
Information required by this item is included in our Proxy Statement related to our 2011 Annual Meeting Statement under the caption “Principal Accountant Fees and Services” and is incorporated herein by reference.
Item 15. Exhibits and Financial Statement Schedules
| (a) | Documents filed as part of this report |
| (1) | Consolidated Financial Statements. |
The following Consolidated Financial Statements of Perry Ellis International, Inc. and subsidiaries are included in Part II, Item 8:
| Page | ||||
| F-2 | ||||
| F-3 | ||||
| F-4 | ||||
| F-5 | ||||
| F-6 | ||||
| F-8 | ||||
| (2) | Consolidated Financial Statement Schedule |
All schedules required by applicable Securities and Exchange Commission regulations are either not required under the related instructions, are inapplicable or the required information has been included in the Consolidated Financial Statements and therefore such schedules have been omitted.
| (3) | Exhibits |
| Exhibit |
Exhibit Description |
Where Filed | ||
| 3.1 |
Registrant’s Amended and Restated Articles of Incorporation | Filed as an Exhibit to the Registrant’s Proxy Statement for its 1998 Annual Meeting and incorporated herein by reference. | ||
| 3.2 |
Articles of Amendment to Articles of Incorporation | Filed as an annex to the Registrant’s Proxy Statement for its 2003 Annual Meeting and incorporated herein by reference. | ||
52
Table of Contents
| 3.3 |
Registrant’s Amended and Restated Bylaws | Filed as an Exhibit to the Registrant’s Registration Statement on Form S-1 (File No. 33-60750) and incorporated herein by reference. | ||
| 4.1 |
Form of Common Stock Certificate | Filed as an Exhibit to the Registrant’s Registration Statement on Form S-1 (File No. 33-60750) and incorporated herein by reference. | ||
| 4.5 |
Indenture dated September 22, 2003 between the Registrant and U.S. Bank Trust National Association | Filed an Exhibit to the Registrant’s Registration Statement on Form S-4 (File No. 33-110616) and incorporated herein by reference. | ||
| 4.6 |
Specimen Forms of 8 7/8% Senior Subordinated Notes Due September 15, 2013 | Filed as an Exhibit to the Registrant’s Registration Statement on Form S-4 (File No. 33-110616) and incorporated herein by reference. | ||
| 4.7 |
Indenture by and among Perry Ellis International, Inc., the Subsidiary Guarantors party thereto and U.S. Bank Trust National Association dated March 8, 2011 | Filed as an Exhibit to the Registrant’s Registration Statement on Form S-3 (File No. 333-167728) and incorporated herein by reference | ||
| 4.8 |
First Supplemental Indenture by and among Perry Ellis International, Inc., the Subsidiary Guarantors party thereto and U.S. Bank National Association dated March 8, 2011 | Filed as an Exhibit to the Registrant’s Current Report on Form 8-K dated March 4, 2011 and incorporated herein by reference. | ||
| 4.9 |
Form of Perry Ellis International, Inc. 7.875% Senior Subordinated Note due April 1, 2019 (set forth in Exhibit A to Exhibit 4.8 above) | Filed as an Exhibit to the Registrant’s Current Report on Form 8-K dated March 4, 2011 and incorporated herein by reference. | ||
| 10.1 |
Form of Indemnification Agreement between the Registrant and each of the Registrant’s Directors and Officers (1) | Filed as an Exhibit to the Registrant’s Annual Report on Form 10-K for the fiscal year ended January 31, 2005 and incorporated herein by reference. | ||
| 10.2 |
1993 Stock Option Plan(1) | Filed as an Exhibit to the Registrant’s Registration Statement on Form S-1 (File No. 33-60750) and incorporated herein by reference. | ||
53
Table of Contents
| 10.4 |
Profit Sharing Plan (1) | Filed as an Exhibit to the Registrant’s Registration Statement on Form S-1 (File No. 33-96304) and incorporated herein by reference. | ||
| 10.5 |
Incentive Compensation Plan (1) | Filed as an Exhibit to the Registrant’s Proxy Statement for its 2000 Annual Meeting and incorporated herein by reference. | ||
| 10.6 |
Loan and Security Agreement dated as of October 1, 2002 by and among the Registrant, Jantzen, Inc., and Congress Financial Corporation (the “Senior Credit Facility”) | Filed as an Exhibit to the Registrant’s Current Report on Form 8-K dated September 17, 2010, as amended, and incorporated herein by reference. | ||
| 10.7 |
2002 Stock Option Plan (1) | Filed as an Annex to the Registrant’s Proxy Statement for its 2002 Annual Meeting and incorporated herein by reference. | ||
| 10.8 |
Amendment No. 1 dated June 19, 2003 to the Senior Credit Facility | Filed as an Exhibit to the Registrant’s Current Report on Form 8-K dated September 17, 2010, as amended, and incorporated herein by reference. | ||
| 10.9 |
Amendment No. 2 dated September 22, 2003 to the Senior Credit Facility | Filed as an Exhibit to the Registrant’s Current Report on Form 8-K dated September 17, 2010, as amended, and incorporated herein by reference. | ||
| 10.10 |
Amendment No. 3 dated December 1, 2003 to the Senior Credit Facility | Filed as an Exhibit to the Registrant’s Annual Report on Form 10-K for the quarter ended January 31, 2004 and incorporated herein by reference. | ||
| 10.11 |
Amendment No. 4 dated February 25, 2004 to the Senior Credit Facility | Filed as an Exhibit to the Registrant’s Annual Report on Form 10-K for the quarter ended January 31, 2004 and incorporated herein by reference. | ||
| 10.12 |
Form of Stock Option Agreement (1) | Filed as an Exhibit to the Registrant’s Quarterly Report on Form 10-Q for the quarterly period ended October 31, 2004 and incorporated herein by reference. | ||
54
Table of Contents
| 10.13 |
Amendment No. 6 dated September 30, 2004 to the Senior Credit Facility | Filed as an Exhibit to the Registrant’s Quarterly Report on Form 10-Q for the quarterly period ended October 31, 2004 and incorporated herein by reference. | ||
| 10.17 |
Amendment No. 7 dated February 26, 2005 to the Senior Credit Facility | Filed as an Exhibit to the Registrant’s Current Report on Form 8-K dated February 26, 2005 and incorporated herein by reference. | ||
| 10.22 |
2005 Long Term Incentive Compensation Plan, as amended (1) | Filed as an Exhibit to the Registrant’s Current Report on Form 8-K dated June 7, 2005 and incorporated herein by reference. | ||
| 10.23 |
2005 Management Incentive Compensation Plan (1) | Filed as an Exhibit to the Registrant’s Current Report on Form 8-K dated June 7, 2005 and incorporated herein by reference. | ||
| 10.25 |
Form of Stock Option Agreement pursuant to the 2005 Long-Term Incentive Compensation Plan (1) | Filed as an Exhibit to the Registrant’s Quarterly Report on Form 10-Q for the quarterly period ended July 31, 2005 and incorporated herein by reference. | ||
| 10.26 |
Form of Restricted Stock Agreement pursuant to the 2005 Long-Term Incentive Compensation Plan (1) | Filed as an Exhibit to the Registrant’s Quarterly Report on Form 10-Q for the quarterly period ended July 31, 2005 and incorporated herein by reference. | ||
| 10.27 |
Perry Ellis International, Inc. Fiscal 2006 Management Incentive Plan (1) | Filed as an Exhibit to the Registrant’s Quarterly Report on Form 10-Q for the quarterly period ended July 31, 2005 and incorporated herein by reference. | ||
| 10.28 |
Amendment No. 5 dated July 1, 2004 to the Senior Credit Facility | Filed as an Exhibit to the Registrant’s Annual Report on Form 10-K for the fiscal year ended January 31, 2006 and incorporated herein by reference. | ||
| 10.29 |
Amendment No. 8 dated September 30, 2005 to the Senior Credit Facility | Filed as an Exhibit to the Registrant’s Annual Report on Form 10-K for the fiscal year ended January 31, 2006 and incorporated herein by reference. | ||
55
Table of Contents
| 10.30 |
Amendment No. 9 dated February 24, 2006 to the Senior Credit Facility | Filed as an Exhibit to the Registrant’s Annual Report on Form 10-K for the fiscal year ended January 31, 2006 and incorporated herein by reference. | ||
| 10.32 |
Business lease dated July 1, 2004 between George Feldenkreis and the Registrant for 50,000 square feet on warehouse space | Filed as an Exhibit to the Registrant’s Annual Report on Form 10-K for the fiscal year ended January 31, 2006 and incorporated herein by reference. | ||
| 10.33 |
Business lease between George Feldenkreis and the Registrant for 16,000 square feet of office Space | Filed as an Exhibit to the Registrant’s Annual Report on Form 10-K for the fiscal year ended January 31, 2006 and incorporated herein by reference. | ||
| 10.34 |
Promissory Note dated June 7, 2006 in favor Commercebank, N.A. | Filed as an Exhibit to the Registrant’s Current Report on Form 8-K dated June 13, 2006 and incorporated herein by reference. | ||
| 10.35 |
Mortgage and Security Agreement dated June 7, 2006 in favor Commercebank, N.A. | Filed as an Exhibit to the Registrant’s Current Report on Form 8-K dated June 13, 2006 and incorporated herein by reference. | ||
| 10.36 |
Amendment No. 10 dated August 28, 2006 to the Senior Credit Facility | Filed as an Exhibit to the Registrant’s Quarterly Report on Form 10-Q for the quarterly period ended July 31, 2006 and incorporated herein by reference. | ||
| 10.37 |
Amendment No. 11 dated November 29, 2006 to the Senior Credit Facility | Filed as an Exhibit to the Registrant’s Quarterly Report on Form 10-Q for the quarterly period ended October 31, 2006 and incorporated herein by reference. | ||
| 10.38 |
Amendment No. 12 dated December 6, 2006 to the Senior Credit Facility | Filed as an Exhibit to the Registrant’s Quarterly Report on Form 10-Q for the quarterly period ended October 31, 2006 and incorporated herein by reference. | ||
56
Table of Contents
| 10.42 |
Asset Purchase Agreement, dated January 07, 2008, by and among the Registrant and Liz Claiborne, Inc. | Filed as an Exhibit to the Registrant’s Annual Report on Form 10-K for the fiscal year ended January 31, 2008 and incorporated herein by reference. | ||
| 10.43 |
Employment Agreement dated February 08, 2008 between George Feldenkreis and the Registrant (1) | Filed as an Exhibit to the Registrant’s Annual Report on Form 10-K for the fiscal year ended January 31, 2008 and incorporated herein by reference. | ||
| 10.44 |
Employment Agreement dated February 08, 2008 between Oscar Feldenkreis and the Registrant (1) | Filed as an Exhibit to the Registrant’s Annual Report on Form 10-K for the fiscal year ended January 31, 2008 and incorporated herein by reference. | ||
| 10.46 |
Amended Form of Stock Restricted Agreement pursuant to the 2005 Long-Term Incentive Compensation Plan (1) | Filed as an Exhibit to the Registrant’s Annual Report on Form 10-K for the fiscal year ended January 31, 2008 and incorporated herein by reference. | ||
| 10.47 |
Amendment No. 13 to Loan and Security Agreement dated as of October 30, 2008 | Filed as an Exhibit to the Registrant’s Quarterly Report on Form 10-Q for the quarterly period ended October 31, 2008 and incorporated herein by reference. | ||
| 10.48 |
Employment Agreement dated March 2, 2009 between Anita Britt and the Registrant (1) | Filed as an Exhibit to the Registrant’s Current Report on Form 8-K dated September 17, 2010, as amended, and incorporated herein by reference. | ||
| 10.49 |
Employment Agreement dated June 26, 2009 between Stephen Harriman and the Registrant (1) | Filed as an Exhibit to the Registrant’s Current Report on Form 8-K dated July 1, 2009 and incorporated herein by reference. | ||
| 10.50 |
Severance Agreement and General Release dated August 5, 2009 between Paul Rosengard and the Registrant (1) | Filed as an Exhibit to the Registrant’s Current Report on Form 8-K dated September 17, 2010, as amended, and incorporated herein by reference. | ||
| 10.51 |
Amendment No. 14 dated October 27, 2009 to Senior Credit Facility Agreement | Filed as an Exhibit to the Registrant’s Current Report on Form 8-K dated November 2, 2009 and incorporated herein by reference. | ||
57
Table of Contents
| 10.52 |
Amendment No. 15 dated March 31, 2010 to Senior Credit Facility Agreement | Filed as an Exhibit to the Registrant’s Current Report on Form 8-K dated April 6, 2010 and incorporated herein by reference. | ||
| 10.53 |
Form of Stock-Settled Stock Appreciation Right Agreement pursuant to the 2005 Long-Term Incentive Compensation Plan. (1) | Filed as an Exhibit to the Registrant’s Quarterly Report on Form 10-Q for the quarterly period ended May 1, 2010, and incorporated herein by reference. | ||
| 10.54 |
Asset Purchase Agreement by and among Rafaella Apparel Group, Inc., Rafaella Apparel Far East Limited and Verrazano, Inc. and Perry Ellis International, Inc. dated as of January 7, 2011 | Filed as an Exhibit to the Registrant’s Current Report on Form 8-K dated January 12, 2011 and incorporated herein by reference. | ||
| 10.55 |
Warrant for the Purchase of Shares of Common Stock dated as of January 28, 2011 issued to Rafaella Apparel Group, Inc. | Filed as an Exhibit to the Registrant’s Current Report on Form 8-K dated February 03, 2011 and incorporated herein by reference. | ||
| 12.1 |
Computation of Earnings to Fixed Charges | Filed as an Exhibit to the Registrant’s Current Report on Form 8-K dated February 28, 2011 and incorporated herein by reference. | ||
| 21.1 |
Subsidiaries of the Registrant | Filed herewith. | ||
| 23.1 |
Consent of Deloitte & Touche LLP, registered public accounting firm regarding financial statements and internal controls over financial reporting of the Registrant | Filed herewith. | ||
| 31.1 |
Certification of Chief Executive Officer pursuant to Rule 13a-14(a) and Rule 15d-14(a), promulgated under the Securities Exchange Act of 1934, as amended | Filed herewith. | ||
| 31.2 |
Certification of Chief Financial Officer pursuant to Rule 13a-14(a) and Rule 15d-14(a), promulgated under the Securities Exchange Act of 1934, as amended | Filed herewith. | ||
| 32.1 |
Certification of Chief Executive Officer pursuant to 18 U.S.C. Section 1350, as adopted pursuant to Section 906 of the Sarbanes-Oxley Act of 2002 | Filed herewith. | ||
| 32.2 |
Certification of Chief Financial Officer pursuant to 18 U.S.C. Section 1350, as adopted pursuant to Section 906 of the Sarbanes-Oxley Act of 2002 | Filed herewith. | ||
| (1) | Management Contract or Compensation Plan. |
| (b) | Item 601 Exhibits |
The exhibits required by Item 601 of Regulation S-K are set forth in (a) (3) above.
| (c) | Financial Statement Schedules |
The financial statement schedules required by Regulation S-K are set forth in (a) (2) above.
58
Table of Contents
SIGNATURES
Pursuant to the requirements of Section 13 or 15(d) of the Securities Exchange Act of 1934, the Registrant has duly caused this report to be signed on its behalf by the undersigned, thereunto duly authorized.
| PERRY ELLIS INTERNATIONAL, INC. | ||||||
| Dated: April 13, 2011 | By: | /s/ GEORGE FELDENKREIS | ||||
| George Feldenkreis | ||||||
| Chairman of the Board and | ||||||
| Chief Executive Officer | ||||||
Pursuant to the requirements of the Securities Exchange Act of 1934, this report has been signed below by the following persons on behalf of the Registrant and in the capacities and on the dates indicated.
| Name and Signature |
Title |
Date | ||
| /s/ GEORGE FELDENKREIS George Feldenkreis |
Chairman of the Board and Chief Executive Officer (Principal Executive Officer) |
April 13, 2011 | ||
| /s/ OSCAR FELDENKREIS Oscar Feldenkreis |
Vice Chairman of the Board, President, Chief Operating Officer and Director |
April 13, 2011 | ||
| /s/ ANITA BRITT Anita Britt |
Chief Financial Officer (Principal Financial and Accounting Officer) |
April 13, 2011 | ||
| /s/ JOE ARRIOLA Joe Arriola |
Director |
April 13, 2011 | ||
| /s/ GARY DIX Gary Dix |
Director |
April 13, 2011 | ||
| /s/ JOSEPH P. LACHER Joseph P. Lacher |
Director |
April 13, 2011 | ||
| /s/ JOSEPH NATOLI Joseph Natoli |
Director |
April 13, 2011 | ||
| /s/ EDUARDO M. SARDINA Eduardo M. Sardina |
Director |
April 13, 2011 | ||
59
Table of Contents
PERRY ELLIS INTERNATIONAL, INC. AND SUBSIDIARIES
| F-2 | ||||
| F-3 | ||||
| F-4 | ||||
| F-5 | ||||
| F-6 | ||||
| F-8 | ||||
F-1
Table of Contents
REPORT OF INDEPENDENT REGISTERED PUBLIC ACCOUNTING FIRM
To the Board of Directors and Stockholders of
Perry Ellis International, Inc.
Miami, Florida
We have audited the accompanying consolidated balance sheets of Perry Ellis International, Inc. and subsidiaries (the “Company”) as of January 29, 2011 and January 30, 2010, and the related consolidated statements of operations, changes in stockholders’ equity, and cash flows for each of the three years in the period ended January 29, 2011. These financial statements are the responsibility of the Company’s management. Our responsibility is to express an opinion on these financial statements based on our audits.
We conducted our audits in accordance with the standards of the Public Company Accounting Oversight Board (United States). Those standards require that we plan and perform the audit to obtain reasonable assurance about whether the financial statements are free of material misstatement. An audit includes examining, on a test basis, evidence supporting the amounts and disclosures in the financial statements. An audit also includes assessing the accounting principles used and significant estimates made by management, as well as evaluating the overall financial statement presentation. We believe that our audits provide a reasonable basis for our opinion.
In our opinion, such consolidated financial statements present fairly, in all material respects, the financial position of Perry Ellis International, Inc. and subsidiaries at January 29, 2011 and January 30, 2010, and the results of their operations and their cash flows for each of the three years in the period ended January 29, 2011, in conformity with accounting principles generally accepted in the United States of America.
We have also audited, in accordance with the standards of the Public Company Accounting Oversight Board (United States), the Company’s internal control over financial reporting as of January 29, 2011, based on the criteria established in Internal Control—Integrated Framework issued by the Committee of Sponsoring Organizations of the Treadway Commission and our report dated April 13, 2011 expressed an unqualified opinion on the Company’s internal control over financial reporting.
| /s/ Deloitte & Touche LLP |
| Certified Public Accountants |
| Miami, Florida |
April 13, 2011
F-2
Table of Contents
PERRY ELLIS INTERNATIONAL, INC. AND SUBSIDIARIES
CONSOLIDATED BALANCE SHEETS
(amounts in thousands, except share data)
| January 29, 2011 |
January 30, 2010 |
|||||||
| ASSETS |
||||||||
| Current Assets: |
||||||||
| Cash and cash equivalents |
$ | 18,524 | $ | 18,269 | ||||
| Restricted cash |
9,369 | — | ||||||
| Accounts receivable, net |
129,534 | 139,934 | ||||||
| Inventories |
178,217 | 112,315 | ||||||
| Deferred income taxes |
9,926 | 8,783 | ||||||
| Prepaid income taxes |
3,867 | 4,744 | ||||||
| Other current assets |
13,623 | 11,295 | ||||||
| Total current assets |
363,060 | 295,340 | ||||||
| Property and equipment, net |
55,077 | 60,467 | ||||||
| Intangible assets |
262,647 | 200,315 | ||||||
| Other assets |
4,946 | 5,194 | ||||||
| TOTAL |
$ | 685,730 | $ | 561,316 | ||||
| LIABILITIES AND EQUITY |
||||||||
| Current Liabilities: |
||||||||
| Accounts payable |
$ | 73,890 | $ | 65,203 | ||||
| Accrued expenses and other liabilities |
23,399 | 13,640 | ||||||
| Accrued interest payable |
3,744 | 4,482 | ||||||
| Current portion - real estate mortgage |
592 | 11,021 | ||||||
| Unearned revenues |
4,438 | 6,002 | ||||||
| Other current liabilities |
6,659 | 6,936 | ||||||
| Total current liabilities |
112,722 | 107,284 | ||||||
| Senior subordinated notes payable, net |
105,221 | 129,870 | ||||||
| Senior credit facility |
97,342 | — | ||||||
| Real estate mortgages |
25,793 | 13,712 | ||||||
| Deferred pension obligation |
13,120 | 17,237 | ||||||
| Unearned revenues and other long-term liabilities |
17,587 | 20,639 | ||||||
| Deferred income taxes |
11,005 | 2,458 | ||||||
| Total long-term liabilities |
270,068 | 183,916 | ||||||
| Total liabilities |
382,790 | 291,200 | ||||||
| Commitment and contingencies |
||||||||
| Equity: |
||||||||
| Preferred stock $.01 par value; 5,000,000 shares authorized; |
— | — | ||||||
| Common stock $.01 par value; 100,000,000 shares authorized; |
166 | 161 | ||||||
| Additional paid-in-capital |
119,560 | 107,527 | ||||||
| Retained earnings |
203,950 | 179,838 | ||||||
| Accumulated other comprehensive loss |
(3,321 | ) | (3,655 | ) | ||||
| Total |
320,355 | 283,871 | ||||||
| Treasury stock at cost; 2,462,196 shares as of January 29, 2011 and 2,462,196 shares as of January 30, 2010 |
(17,415 | ) | (17,415 | ) | ||||
| Total Perry Ellis International, Inc. equity |
302,940 | 266,456 | ||||||
| Noncontrolling interest |
— | 3,660 | ||||||
| Total equity |
302,940 | 270,116 | ||||||
| TOTAL |
$ | 685,730 | $ | 561,316 | ||||
See footnotes to consolidated financial statements
F-3
Table of Contents
PERRY ELLIS INTERNATIONAL, INC. AND SUBSIDIARIES
CONSOLIDATED STATEMENTS OF OPERATIONS
FOR THE YEARS ENDED
(amounts in thousands, except per share data)
| January 29, 2011 |
January 30, 2010 |
January 31, 2009 |
||||||||||
| Revenues: |
||||||||||||
| Net sales |
$ | 763,884 | $ | 729,217 | $ | 825,868 | ||||||
| Royalty income |
26,404 | 24,985 | 25,429 | |||||||||
| Total revenues |
790,288 | 754,202 | 851,297 | |||||||||
| Cost of sales |
507,829 | 505,104 | 573,046 | |||||||||
| Gross profit |
282,459 | 249,098 | 278,251 | |||||||||
| Operating expenses |
||||||||||||
| Selling, general and administrative expenses |
220,018 | 200,356 | 236,840 | |||||||||
| Depreciation and amortization |
12,211 | 13,625 | 14,784 | |||||||||
| Impairment on long-lived assets |
392 | 254 | 22,299 | |||||||||
| Total operating expenses |
232,621 | 214,235 | 273,923 | |||||||||
| Operating income |
49,838 | 34,863 | 4,328 | |||||||||
| Costs on early extinguishment of debt |
730 | 357 | — | |||||||||
| Impairment on marketable securities |
— | — | 2,797 | |||||||||
| Interest expense |
13,203 | 17,371 | 17,491 | |||||||||
| Net income (loss) before income taxes |
35,905 | 17,135 | (15,960 | ) | ||||||||
| Income tax provision (benefit) |
11,393 | 3,615 | (3,682 | ) | ||||||||
| Net income (loss) |
24,512 | 13,520 | (12,278 | ) | ||||||||
| Less: Net income attributed to noncontrolling interest |
400 | 353 | 612 | |||||||||
| Net income (loss) attributed to Perry Ellis International, Inc. |
$ | 24,112 | $ | 13,167 | $ | (12,890 | ) | |||||
| Net income (loss) attributed to Perry Ellis International, Inc. per share: |
||||||||||||
| Basic |
$ | 1.84 | $ | 1.04 | $ | (0.89 | ) | |||||
| Diluted |
$ | 1.70 | $ | 1.01 | $ | (0.89 | ) | |||||
| Weighted average number of shares outstanding |
||||||||||||
| Basic |
13,110 | 12,699 | 14,416 | |||||||||
| Diluted |
14,149 | 13,005 | 14,416 | |||||||||
See footnotes to consolidated financial statements
F-4
Table of Contents
PERRY ELLIS INTERNATIONAL, INC. AND SUBSIDIARIES
CONSOLIDATED STATEMENTS OF CHANGES IN STOCKHOLDERS’ EQUITY
FOR THE YEARS ENDED JANUARY 29, 2011, JANUARY 30, 2010 AND JANUARY 31, 2009
(amounts in thousands, except share data)
| ADDITIONAL | ACCUMULATED OTHER COMPRE- HENSIVE |
COMPRE- HENSIVE |
NON | |||||||||||||||||||||||||||||||||
| COMMON STOCK | PAID-IN | TREASURY | INCOME | INCOME | RETAINED | CONTROLLING | ||||||||||||||||||||||||||||||
| SHARES | AMOUNT | CAPITAL | STOCK | (LOSS) | (LOSS) | EARNINGS | INTEREST | TOTAL | ||||||||||||||||||||||||||||
| BALANCE, February 1, 2008 |
14,772,721 | $ | 147 | $ | 96,389 | $ | (4,088 | ) | $ | 1,518 | $ | 179,561 | $ | 3,293 | $ | 276,820 | ||||||||||||||||||||
| Exercise of stock options |
382,773 | 4 | 3,821 | — | — | — | — | 3,825 | ||||||||||||||||||||||||||||
| Tax benefit for exercise of non-qualified stock options |
— | — | 1,582 | — | — | — | — | 1,582 | ||||||||||||||||||||||||||||
| Restricted shares and options issued as compensation |
840,587 | 9 | 2,141 | — | — | — | — | 2,150 | ||||||||||||||||||||||||||||
| Payment of loan to noncontrolling interest |
— | — | — | — | — | — | (598 | ) | (598 | ) | ||||||||||||||||||||||||||
| Net income (loss) |
— | — | — | — | — | $ | (12,890 | ) | (12,890 | ) | 612 | (12,278 | ) | |||||||||||||||||||||||
| Purchase of treasury stock |
— | — | — | (11,576 | ) | — | — | — | (11,576 | ) | ||||||||||||||||||||||||||
| Other comprehensive loss |
— | — | — | — | (7,824 | ) | (7,824 | ) | — | — | (7,824 | ) | ||||||||||||||||||||||||
| Comprehensive loss |
(20,714 | ) | ||||||||||||||||||||||||||||||||||
| BALANCE, JANUARY 31, 2009 |
15,996,081 | 160 | 103,933 | (15,664 | ) | (6,306 | ) | 166,671 | 3,307 | 252,101 | ||||||||||||||||||||||||||
| Exercise of stock options |
80,202 | 1 | 635 | — | — | — | — | 636 | ||||||||||||||||||||||||||||
| Tax benefit for exercise of non-qualified stock options |
— | — | 205 | — | — | — | — | 205 | ||||||||||||||||||||||||||||
| Restricted shares and options issued as compensation |
18,290 | — | 2,754 | — | — | — | — | 2,754 | ||||||||||||||||||||||||||||
| Net income |
— | — | — | — | — | 13,167 | 13,167 | 353 | 13,520 | |||||||||||||||||||||||||||
| Purchase of treasury stock |
— | — | — | (1,751 | ) | — | — | — | (1,751 | ) | ||||||||||||||||||||||||||
| Other comprehensive income |
— | — | — | — | 2,651 | 2,651 | — | — | 2,651 | |||||||||||||||||||||||||||
| Comprehensive income |
15,818 | |||||||||||||||||||||||||||||||||||
| BALANCE, JANUARY 30, 2010 |
16,094,573 | 161 | 107,527 | (17,415 | ) | (3,655 | ) | 179,838 | 3,660 | 270,116 | ||||||||||||||||||||||||||
| Exercise of stock options |
427,030 | 4 | 2,673 | — | — | — | — | 2,677 | ||||||||||||||||||||||||||||
| Tax benefit for exercise of non-qualified stock options |
— | — | 2,270 | — | — | — | — | 2,270 | ||||||||||||||||||||||||||||
| Restricted shares and options issued as compensation |
88,363 | 1 | 4,491 | — | — | — | — | 4,492 | ||||||||||||||||||||||||||||
| Net income |
— | — | — | — | — | 24,112 | 24,112 | 400 | 24,512 | |||||||||||||||||||||||||||
| Warrants issued in connection with acquisition |
— | — | 2,599 | — | — | — | — | 2,599 | ||||||||||||||||||||||||||||
| Other comprehensive income |
— | — | — | — | 334 | 334 | — | 497 | 831 | |||||||||||||||||||||||||||
| Payment of noncontrolling interest |
— | — | — | — | — | — | (4,557 | ) | (4,557 | ) | ||||||||||||||||||||||||||
| Comprehensive income |
$ | 24,446 | ||||||||||||||||||||||||||||||||||
| BALANCE, JANUARY 29, 2011 |
16,609,966 | $ | 166 | $ | 119,560 | $ | (17,415 | ) | $ | (3,321 | ) | $ | 203,950 | $ | — | $ | 302,940 | |||||||||||||||||||
See footnotes to consolidated financial statements
F-5
Table of Contents
PERRY ELLIS INTERNATIONAL, INC. AND SUBSIDIARIES
CONSOLIDATED STATEMENTS OF CASH FLOWS
FOR THE YEARS ENDED
(amounts in thousands)
| January 29, 2011 |
January 30, 2010 |
January 31, 2009 |
||||||||||
| CASH FLOWS FROM OPERATING ACTIVITIES: |
||||||||||||
| Net income (loss) |
$ | 24,512 | $ | 13,520 | $ | (12,278 | ) | |||||
| Adjustments to reconcile net income (loss) to net cash provided by (used in) operating activities: |
||||||||||||
| Depreciation and amortization |
12,044 | 13,393 | 14,441 | |||||||||
| Provision for bad debts |
96 | 1,307 | 1,525 | |||||||||
| Tax benefit from exercise of stock options |
(2,270 | ) | (205 | ) | (1,582 | ) | ||||||
| Impairment on long-lived assets |
392 | 254 | 22,299 | |||||||||
| Amortization of debt issue cost |
429 | 531 | 684 | |||||||||
| Amortization of discounts |
1 | 186 | 186 | |||||||||
| Deferred income taxes |
7,189 | 3,902 | (7,513 | ) | ||||||||
| Stock options and restricted shares issued as compensation |
4,492 | 2,754 | 2,150 | |||||||||
| Gain on sale of intangible assets |
— | (886 | ) | — | ||||||||
| Change in fair value and settlement of derivatives |
2,153 | 985 | — | |||||||||
| Costs on early extinguishment of debt |
730 | 357 | — | |||||||||
| Loss on marketable securities |
— | — | 2,797 | |||||||||
| Changes in operating assets and liabilities |
||||||||||||
| (net of effects of acquisition transactions): |
||||||||||||
| Accounts receivable, net |
14,405 | 4,606 | (9,160 | ) | ||||||||
| Inventories |
(43,133 | ) | 28,147 | 2,637 | ||||||||
| Other current assets and prepaid income taxes |
3,248 | 6,168 | (9,679 | ) | ||||||||
| Other assets |
(486 | ) | 35 | 1,304 | ||||||||
| Accounts payable and accrued expenses |
6,736 | 17,130 | (9,540 | ) | ||||||||
| Income taxes payable |
— | — | (793 | ) | ||||||||
| Accrued interest payable |
(738 | ) | (854 | ) | 136 | |||||||
| Other current and long term liabilities |
(839 | ) | 1,022 | (348 | ) | |||||||
| Unearned revenues |
(4,395 | ) | (3,663 | ) | (1,744 | ) | ||||||
| Deferred pension obligation |
(3,562 | ) | 106 | (504 | ) | |||||||
| Net cash provided by (used in) operating activities |
21,004 | 88,795 | (4,982 | ) | ||||||||
| CASH FLOWS FROM INVESTING ACTIVITIES: |
||||||||||||
| Purchase of property and equipment |
(6,237 | ) | (2,734 | ) | (10,189 | ) | ||||||
| Proceeds on sale of marketable securities |
— | — | 138 | |||||||||
| Proceeds on sale of intangible assets |
1,100 | 700 | — | |||||||||
| Payment of restricted funds as collateral |
(9,369 | ) | — | — | ||||||||
| Reacquisition of license rights |
— | — | (388 | ) | ||||||||
| Payment for acquired businesses |
(79,985 | ) | — | (33,951 | ) | |||||||
| Net cash used in investing activities |
(94,491 | ) | (2,034 | ) | (44,390 | ) | ||||||
| CASH FLOWS FROM FINANCING ACTIVITIES: |
||||||||||||
| Borrowings from senior credit facility |
576,319 | 646,234 | 331,558 | |||||||||
| Payments on senior credit facility |
(478,977 | ) | (700,649 | ) | (277,143 | ) | ||||||
| Deferred financing fees |
(158 | ) | — | (363 | ) | |||||||
| Payments on real estate mortgage |
(11,219 | ) | (469 | ) | (1,435 | ) | ||||||
| Proceeds from refinancing of real estate mortgage |
13,000 | — | — | |||||||||
| Payments on senior subordinate notes |
(25,454 | ) | (20,848 | ) | — | |||||||
| Payments on capital leases |
(301 | ) | (357 | ) | (202 | ) | ||||||
| Payment of noncontrolling interest |
(4,557 | ) | — | (598 | ) | |||||||
| Proceeds from exercise of stock options |
2,677 | 636 | 3,825 | |||||||||
| Tax benefit from exercise of stock options |
2,270 | 205 | 1,582 | |||||||||
| Purchase of treasury stock |
— | (1,751 | ) | (11,576 | ) | |||||||
| Net cash provided by (used in) financing activities |
73,600 | (76,999 | ) | 45,648 | ||||||||
| Effect of exchange rate changes on cash and cash equivalents |
142 | (306 | ) | (823 | ) | |||||||
| NET INCREASE (DECREASE) IN CASH AND CASH EQUIVALENTS |
255 | 9,456 | (4,547 | ) | ||||||||
| CASH AND CASH EQUIVALENTS AT BEGINNING OF YEAR |
18,269 | 8,813 | 13,360 | |||||||||
| CASH AND CASH EQUIVALENTS AT END OF YEAR |
$ | 18,524 | $ | 18,269 | $ | 8,813 | ||||||
Continued
F-6
Table of Contents
PERRY ELLIS INTERNATIONAL, INC. AND SUBSIDIARIES
CONSOLIDATED STATEMENTS OF CASH FLOWS
FOR THE YEARS ENDED
(amounts in thousands)
| January 29, 2011 |
January 30, 2010 |
January 31, 2009 |
||||||||||
| SUPPLEMENTAL DISCLOSURE OF CASH FLOW INFORMATION: |
||||||||||||
| Cash paid during the period for: |
||||||||||||
| Interest |
$ | 14,985 | $ | 17,054 | $ | 17,169 | ||||||
| Income taxes |
$ | 787 | $ | 1,070 | $ | 13,348 | ||||||
| NON-CASH FINANCING AND INVESTING ACTIVITIES: |
||||||||||||
| Capital lease financing |
$ | 27 | $ | 1,001 | $ | 176 | ||||||
| Accrued purchases of property and equipment |
$ | 430 | $ | 14 | $ | 597 | ||||||
| Unrealized gain (loss) on marketable securities included in comprehensive income |
$ | — | $ | — | $ | 1,096 | ||||||
| Unrealized gain (loss) on pension liability included in comprehensive income |
$ | 340 | $ | 353 | $ | (3,223 | ) | |||||
| Warrants issued in connection with acquisition |
$ | 2,599 | $ | — | $ | — | ||||||
See footnotes to consolidated financial statements
F-7
Table of Contents
PERRY ELLIS INTERNATIONAL, INC. AND SUBSIDIARIES
FOOTNOTES TO CONSOLIDATED FINANCIAL STATEMENTS
FOR THE YEARS ENDED JANUARY 29, 2011, JANUARY 30, 2010 AND JANUARY 31, 2009
| 1. | General |
Perry Ellis International, Inc. and Subsidiaries (the “Company”) is one of the leading apparel companies in the United States and manages a portfolio of major brands, some of which were established over 100 years ago. The Company designs, sources, markets and licenses products nationally and internationally at multiple price points and across all major levels of retail distribution. The Company’s portfolio of highly recognized brands includes the Perry Ellis® family of brands, Axis®, Tricots St. Raphael®, Jantzen®, John Henry®, Cubavera®, the Havanera Co.®, Centro®, Solero®, Natural Issue®, Munsingwear®, Grand Slam®, Original Penguin® by Munsingwear® (“Original Penguin”), Mondo di Marco®, Redsand®, Pro Player®, Manhattan®, Axist®, Savane®, Farah®, Gotcha®, Girl Star®, MCD®, Laundry by Shelli Segal®, C&C California® and Rafaella®. The Company also (i) licenses the Nike® brand for swimwear and swimwear accessories, (ii) licenses the JAG® brand for men’s and women’s swimwear and cover-ups, (iii) licenses the Callaway Golf® and Top-Flite® brands for golf apparel, (iv) licenses the PGA TOUR® brand, including Champions Tour®, for golf apparel, and (v) licenses Pierre Cardin® for men’s sportswear.
The consolidated statement of cash flows for the years ended January 30, 2010 and January 31, 2009 have been restated to correct the presentation of net income. The Company had previously presented net income attributable to Perry Ellis International, Inc. and included a reconciling item to add back income attributable to noncontrolling interests in the consolidated statement of cash flows. This change in the presentation has no impact on net cash provided by (used in) operating activities or net increase (decrease) in cash and cash equivalents on the consolidated statements of cash flows.
| 2. | Summary of Significant Accounting Policies |
The following is a summary of the Company’s significant accounting policies:
PRINCIPLES OF CONSOLIDATION – The consolidated financial statements include the accounts of Perry Ellis International, Inc. and its wholly-owned and controlled subsidiaries. All intercompany transactions and balances have been eliminated in consolidation. The ownership interest in consolidated subsidiaries of non-controlling shareholders is reflected as noncontrolling interest. The Company’s consolidation principles would also consolidate any entity in which the Company would be deemed a primary beneficiary.
USE OF ESTIMATES – The preparation of financial statements in conformity with accounting principles generally accepted in the United States of America requires management to make estimates and assumptions that affect the amounts in the consolidated financial statements and the accompanying footnotes. Actual results could differ from those estimates.
CASH AND CASH EQUIVALENTS – Cash and cash equivalents include cash, deposits and liquid short-term investments that have a maturity of three months or less when purchased.
RESTRICTED CASH – Restricted cash consists of cash balances held as collateral against letters of credit that were assumed during the acquisition of certain net assets from Rafaella Apparel Group, Inc. At January 29, 2011, the company had $9.4 million of restricted cash. There was no restricted cash held at January 30, 2010. The Company expects to fully utilize the restricted cash by the end of the second quarter of fiscal 2012, as all letters of credit are expected to terminate during that period.
MARKETABLE SECURITIES – All marketable securities are classified as available-for-sale. Investments are stated at fair value. The estimated fair value of the marketable securities is based on quoted prices in an active market. Gains and losses on investment transactions are determined using the specific identification
F-8
Table of Contents
method and are recognized in income based on trade dates. Unrealized gains and losses on securities available-for-sale are included in accumulated other comprehensive income until realized. Management evaluates securities held with unrealized losses for other-than-temporary impairment at least on a quarterly basis. Consideration is given to (a) the length of time and the extent to which the fair value has been less than cost; (b) the financial condition and near-term prospects of the issuer; and (c) the intent and ability of the Company to retain its investment in the issuer for a period of time sufficient to allow for any anticipated recovery in fair value.
INVENTORIES – Inventories are stated at the lower of cost (weighted moving average cost) or market. Cost principally consists of the purchase price (adjusted for lower of cost or market), customs, duties, freight, insurance and commissions to buying agents.
PROPERTY AND EQUIPMENT – Property and equipment are stated at cost. Depreciation is computed using the straight-line method over the estimated useful lives of the assets. Amortization of leasehold improvements and capital leases is computed using the straight-line method over the shorter of the lease term or estimated useful lives of the assets or improvements. The useful lives are as follows:
| Asset Class |
Average Useful Lives in Years | |
| Furniture, fixtures and equipment |
3-10 | |
| Vehicles |
7 | |
| Leasehold improvements |
4-15 | |
| Buildings |
39 |
INTANGIBLE ASSETS – Intangible assets represent costs incurred in connection with the acquisition of brand names and license rights. As of January 30, 2010, intangible assets represented one class of indefinite lived assets, trademarks. As of January 29, 2011, intangible assets represented primarily one class of indefinite lived assets, trademarks. However, due to the acquisition of certain net assets from Rafaella Apparel Group, Inc., the Company expects to identify additional intangible assets including customer lists and goodwill. (See Footnote 3 to consolidated financial statements for further information.) The trademarks were identified as intangible assets with an indefinite useful life, and accordingly, are not being amortized. The Company assesses the carrying value of intangible assets at least annually.
FAIR VALUE MEASUREMENTS – A description of the Company’s policies regarding fair value measurement is summarized below.
Fair Value Hierarchy – requires disclosure about how fair value is determined for assets and liabilities and establishes a hierarchy for which these assets and liabilities must be grouped, based on significant levels of observable or unobservable inputs. Observable inputs reflect market data obtained from independent sources, while unobservable inputs reflect the Company’s market assumptions. This hierarchy requires the use of observable market data when available. These two types of inputs have created the following fair-value hierarchy:
| • | Level 1 – Quoted prices for identical instruments in active markets. |
| • | Level 2 – Quoted prices for similar instruments in active markets; quoted prices for identical or similar instruments in markets that are not active; and model-derived valuations in which all significant inputs and significant value drivers are observable in active markets. |
| • | Level 3 – Valuations derived from valuation techniques in which one or more significant inputs or significant value drivers are unobservable. |
Determination of Fair Value – The Company generally uses quoted market prices (unadjusted) in active markets for identical assets or liabilities for which the Company has the ability to determine fair value, and classifies such items in Level 1. Fair values determined by Level 2 inputs utilize inputs other than quoted market prices included in Level 1 that are observable for the asset or liability, either directly or indirectly. Level 2 inputs include quoted market prices in active markets for similar assets or liabilities, and inputs other than quoted market prices that are observable for the asset or liability. Level 3 inputs are unobservable inputs for the asset or liability, and include situations where there is little, if any, market activity for the asset or liability.
F-9
Table of Contents
If quoted market prices are not available, fair value is based upon internally developed valuation techniques that use, where possible, current market-based or independently sourced market parameters, such as interest rates, currency rates, etc. Assets or liabilities valued using such internally generated valuation techniques are classified according to the lowest level input or value driver that is significant to the valuation. Thus, an item may be classified in Level 3 even though there may be some significant inputs that are readily observable.
The following describes the valuation methodologies used by the Company to measure fair value, including an indication of the level in the fair value hierarchy in which each asset or liability is generally classified.
Marketable Securities – The Company used quoted market prices in active markets to determine the fair value of marketable securities, which were classified in Level 1 of the fair value hierarchy.
Interest rate swap – This derivative was a pay-variable, receive-fixed interest rate swap based on the LIBOR rate curve and was designated as a fair value hedge. Fair value was based on a model-driven valuation using the LIBOR rate curve, which was observable at commonly quoted intervals for the full term of the swap. Therefore, our interest rate swap was classified within Level 2 of the fair value hierarchy.
Interest rate cap – This derivative did not qualify as a fair value hedge. Fair value was based on a model-driven valuation using the LIBOR rate curve and an implied market volatility, both of which were observable at commonly quoted intervals for the full term of the cap. Therefore, the Company’s interest rate cap was classified within Level 2 of the fair value hierarchy.
DERIVATIVES – Derivative financial instruments such as interest rate swap contracts and foreign exchange contracts are recognized in the financial statements and measured at fair value regardless of the purpose or intent for holding them. Changes in the fair value of derivative financial instruments are either recognized in income or stockholders’ equity (as a component of comprehensive income), depending on whether the derivative is not designated as a hedge or is designated as a hedge of changes in fair value or cash flows. When designated as a hedge of changes in fair value, the effective portion of the hedge is recognized as an offset in income with a corresponding adjustment to the hedged item. When designated as a hedge of changes in cash flows, the effective portion of the hedge is recognized as an offset in comprehensive income with a corresponding adjustment to the hedged item and recognized in income in the same period as the hedged item is settled.
LEASES – The Company requires that its leases be evaluated and classified as either operating or capital leases for financial reporting purposes. Capital leases, which transfer substantially all of the risks and benefits incidental to ownership of the leased item, are capitalized at the inception of the lease at the fair value of the leased property or, if lower, at the present value of the minimum lease payments. Lease payments are apportioned between the finance charges and reduction of the lease liability so as to achieve a constant rate of interest on the remaining balance of the liability. Finance charges are charged directly against income as a component of interest expense. Capitalized leased assets are depreciated over the shorter of the estimated useful life of the asset or the lease term. Leases where the lessor retains substantially all the risks and benefits of ownership of the asset are classified as operating leases. Operating lease payments, other than contingent rentals, are recognized as an expense in the income statement on a straight-line basis over the lease term, whereby an equal amount of rent expense is attributed to each period during the term of the lease, regardless of when actual payments are made. This generally results in rent expense in excess of cash payments during the early years of a lease and rent expense less than cash payments in the later years. The difference between rent expense recognized and actual rental payments is recorded as deferred rent and included in liabilities. Percentage rent expense is generally based on sales levels and is accrued when determined that it is probable that such sales levels will be achieved.
F-10
Table of Contents
DEFERRED DEBT ISSUE COSTS – Costs incurred in connection with financing transactions have been capitalized and are being amortized on a straight-line basis, which approximates the interest method, over the term of the related debt instrument. Unamortized debt issue costs are included in other assets in the consolidated balance sheet.
LONG-LIVED ASSETS – Property and equipment, along with other long-lived assets, are evaluated for impairment periodically whenever events or changes in circumstances indicate that their related carrying amounts may not be recoverable. In evaluating long-lived assets for recoverability, the Company uses its best estimate of future cash flows expected to result from the use of the asset and its eventual disposition. To the extent that estimated future undiscounted net cash flows attributable to the asset are less than the carrying amount, an impairment loss is recognized equal to the difference between the carrying value of such asset and its fair value. Fair value is estimated based on the future expected discounted cash flows for the assets. Judgments regarding the existence of impairment indicators are based on market and operational performance. Preparation of estimated expected future cash flows is inherently subjective and is based on management’s best estimate of assumptions concerning future conditions.
The Company had experienced lower-than-expected performance at certain locations, which was due in part to the current economic conditions. As a result, the Company recorded a $0.4 million, $0.3 million and $1.6 million impairment charge, in fiscal 2011, 2010 and 2009, respectively, to reduce the net carrying value of certain long-lived assets (primarily leaseholds) at these locations to their estimated fair value. These impairments are reflected with the Company’s wholesale reporting segment.
RETIREMENT-RELATED BENEFITS – The Company accounts for its defined benefit pension plan using actuarial models. These models use an attribution approach that generally spreads the individual events over the service lives of the employees in the plan. The principle underlying the required attribution approach is that employees render service over their service lives on a relatively consistent basis and therefore, the income statement effects of pensions or non-pension postretirement benefit plans are earned in, and should follow, the same pattern.
The principal components of the net periodic pension calculations are the expected long-term rate of return on plan assets, discount rate and the rate of compensation increases. The Company uses long-term historical actual return information, the mix of investments that comprise plan assets, and future estimates of long-term investment returns by reference to external sources to develop its expected return on plan assets. The discount rate assumptions used for pension and non-pension postretirement benefit plan accounting reflects the rates available on high-quality fixed income debt instruments at the Company’s fiscal year end.
ADVERTISING AND RELATED COSTS – The Company’s accounting policy relating to advertising and related costs is to expense these costs in the period incurred. Advertising and related costs were $11.6 million, $10.6 million and $19.7 million for the years ended January 29, 2011, January 30, 2010, and January 31, 2009, respectively, and are included in selling, general and administrative expenses.
COST OF SALES – Cost of sales includes costs to acquire and source inventory, produce inventory for sale, and provisions for inventory shrinkage and obsolescence. These costs include costs of purchased products, inbound freight, custom duties, buying commissions, cargo insurance, customs inspection and licensed product royalty expenses.
SELLING, GENERAL AND ADMINISTRATIVE EXPENSES – Selling expenses include costs incurred in the selling of merchandise. General and administrative expenses include costs incurred in the administration or general operations of the business. Selling, general and administrative expenses include employee and related costs, advertising, professional fees, distribution, warehouse costs, and other related selling costs.
F-11
Table of Contents
TREASURY STOCK – Treasury stock is recorded at acquisition cost. Gains and losses on disposition are recorded as increases or decreases to additional paid-in capital with losses in excess of previously recorded gains charged directly to retained earnings.
REVENUE RECOGNITION – Sales are recognized at the time title transfers to the customer, generally upon shipment. Trade allowances and a provision for estimated returns and other allowances are recorded at the time sales are made, considering historical and anticipated trends. The Company records revenues net of corresponding sales taxes. The Company operates predominantly in North America, with over 94% of its sales in this market. Two customers accounted for approximately 19% and 11%, respectively, of net sales for fiscal 2011. Two customers accounted for approximately 20% and 11%, respectively, of net sales for fiscal 2010. Two customers accounted for approximately 17% and 12%, respectively, of net sales for fiscal 2009. A significant decrease in business from or loss of any of the major customers could harm the financial condition of the Company by causing a significant decline in revenues attributable to such customers. The Company does not believe that concentrations of credit risk represent a material risk of loss with respect to its financial position as of January 29, 2011.
Royalty income is recognized when earned on the basis of the terms specified in the underlying contractual agreements. A liability for unearned royalty income is recognized when licensees pay contractual obligations before being earned or when up front fees are collected. This liability is recognized as royalty income over the applicable term of the respective license agreement.
ADVERTISING REIMBURSEMENTS – The majority of the Company’s license agreements require licensees to reimburse the Company for advertising placed on behalf of the licensees based on a percentage of the licensees’ net sales. The Company records earned advertising reimbursements received from its licensees as a reduction of the related advertising costs in selling, general and administrative expenses. For the fiscal years 2011, 2010 and 2009, the Company has reduced selling, general and administrative expenses by $6.1 million, $5.8 million and $5.5 million of licensee reimbursements, respectively. Unearned advertising reimbursements result when a licensee pays required reimbursements prior to the Company incurring the advertising expense. A liability is recorded for these unearned advertising reimbursements.
FOREIGN CURRENCY TRANSLATION – For the Company’s international operations, local currencies are generally considered their functional currencies. The Company translates assets and liabilities to their U.S. dollar equivalents at rates in effect at the balance sheet date and revenue and expenses are translated at average monthly exchange rates. Translation adjustments resulting from this process are recorded in stockholders’ equity as a component of accumulated other comprehensive income (loss).
INCOME TAXES – Deferred income taxes result primarily from timing differences in the recognition of expenses for tax and financial reporting purposes, which requires the liability method of computing deferred income taxes. Under the liability method, deferred taxes are adjusted for tax rate changes as they occur.
The Company records net deferred tax assets to the extent it believes these assets will more likely than not be realized. In the event that a net deferred tax asset is not realizable, a valuation allowance would be recorded. In making such determination, it considers all available positive and negative evidence, including future reversals of existing taxable temporary differences, projected future taxable income, tax planning strategies and recent financial operations. In the event the Company were to determine that it would be able to realize its deferred income tax assets in the future in excess of its net recorded amount, an adjustment to the valuation allowance would be recorded, which would reduce the provision for income taxes in the period of such determination.
In regards to the accounting for uncertainty in income taxes recognized in the financial statements a tax benefit from an uncertain tax position may be recognized when it is more likely than not that the position will be sustained upon examination, including resolutions of any related appeals or litigation processes, based on its technical merits.
F-12
Table of Contents
NET INCOME (LOSS) PER SHARE – Basic net income (loss) per share is computed by dividing net income (loss) by the weighted average shares of outstanding common stock. The calculation of diluted net income (loss) per share is similar to basic earnings per share except that the denominator includes potentially dilutive common stock. The potentially dilutive common stock included in the Company’s computation of diluted net income (loss) per share includes the effects of stock options, stock appreciation rights (“SARS”), warrants and unvested restricted shares as determined using the treasury stock method.
The following table sets forth the computation of basic and diluted income (loss) per share:
| 2011 | 2010 | 2009 | ||||||||||
| (in thousands, except per share data) | ||||||||||||
| Numerator: |
||||||||||||
| Net income (loss) attributed to Perry Ellis International, Inc. |
$ | 24,112 | $ | 13,167 | $ | (12,890 | ) | |||||
| Denominator: |
||||||||||||
| Basic - weighted average shares |
13,110 | 12,699 | 14,416 | |||||||||
| Dilutive effect: equity awards |
1,039 | 306 | — | |||||||||
| Diluted - weighted average shares |
14,149 | 13,005 | 14,416 | |||||||||
| Basic income (loss) per share |
$ | 1.84 | $ | 1.04 | $ | (0.89 | ) | |||||
| Diluted income (loss) per share |
$ | 1.70 | $ | 1.01 | $ | (0.89 | ) | |||||
| Antidilutive effect: (1) |
316 | 1,586 | 2,344 | |||||||||
| (1) | Represents weighted average of stock options to purchase shares of common stock, SARS and restricted stock that were not included in computing diluted income per share because their effects were antidilutive for the respective periods. |
ACCOUNTING FOR STOCK-BASED COMPENSATION – Accounting for stock-based compensation requires that the cost resulting from all share-based payment transactions be recognized in the financial statements. The Company uses fair value as the measurement objective in accounting for share-based payment arrangements and applies a fair-value-based measurement method in accounting for share-based payment transactions with employees except for equity instruments held by employee share ownership plans.
For fiscal 2011, 2010 and 2009, approximately $4.5 million, $2.8 million and $2.2 in compensation expense has been recognized in selling, general and administrative expenses in the consolidated statement of operations related to stock options, SARS and restricted stock, respectively. Compensation expense for these awards is based on the fair value at the original grant date. During fiscal 2011, 2010, and 2009, the Company received cash of $2.7 million, $0.6 million, and $3.8 million, respectively, from the exercise of stock options and realized a tax benefit of approximately $2.3 million, $0.2 million, and $1.6 million, respectively from such exercises.
The fair value of the options was estimated at the date of grant using the Black-Scholes Option Pricing Model. This model was developed for use in estimating the fair value of traded options that have no vesting restrictions and are fully transferable. In addition, option valuation models require the input of highly subjective assumptions including: expected volatility based on the expected price of the Company’s common stock over the expected life of the option; the risk free rate of return based on the U.S. Treasury yield curve in effect at the time of grant for the expected term of the option; the expected life based on the period of time the options are expected to be outstanding using historical data to estimate option exercises and employee terminations; and dividend yield based on the Company’s history and expectation of dividend payments. Using the Black-Scholes Option Pricing Model, the estimated weighted-average fair value per option granted in fiscal years 2011, 2010 and 2009 was $13.47, $2.88 and $11.26, respectively.
F-13
Table of Contents
The following weighted-average assumptions for 2011, 2010 and 2009 were derived from the Black-Scholes model and used to determine the fair value of stock options:
| 2011 | 2010 | 2009 | ||||
| Risk free interest |
2.9% - 3.3% | 2.3% - 2.7% | 4.5% | |||
| Dividend Yield |
0.0% | 0.0% | 0.0% | |||
| Volatility factors |
66.1% - 66.3% | 65.3% - 66.7% | 57.4% | |||
| Weighted-average life (years) |
4.0 - 6.0 | 6.0 | 6.0 |
COMPREHENSIVE INCOME (LOSS) – Comprehensive income (loss) was comprised of the following for the year ended:
| January 29, 2011 |
January 30, 2010 |
January 31, 2009 |
||||||||||
| (in thousands) | ||||||||||||
| Net income (loss) |
$ | 24,512 | $ | 13,520 | $ | (12,278 | ) | |||||
| Other Comprehensive (loss) income: |
||||||||||||
| Foreign currency translation adjustments, net |
491 | 2,298 | (5,697 | ) | ||||||||
| Unrealized loss on pension liability, net of tax |
340 | 353 | (3,223 | ) | ||||||||
| Unrealized loss on marketable securities, net of tax |
— | — | (775 | ) | ||||||||
| Reclassification adjustment, net of tax |
— | — | 1,871 | |||||||||
| Total other comprehensive income (loss) |
831 | 2,651 | (7,824 | ) | ||||||||
| Comprehensive income (loss) |
25,343 | 16,171 | (20,102 | ) | ||||||||
| Less: comprehensive income attributable to the noncontrolling interest |
897 | 353 | 612 | |||||||||
| Comprehensive income (loss) attributable to |
||||||||||||
| Perry Ellis International, Inc. |
$ | 24,446 | $ | 15,818 | $ | (20,714 | ) | |||||
Accumulated other comprehensive loss was comprised of the following at:
| January 29, | January 30, | |||||||
| 2011 | 2010 | |||||||
| (in thousands) | ||||||||
| Foreign currency translation |
$ | (791 | ) | $ | (785 | ) | ||
| Unrealized loss on pension liability, net of tax |
(2,530 | ) | (2,870 | ) | ||||
| $ | (3,321 | ) | $ | (3,655 | ) | |||
RECENT ACCOUNTING PRONOUNCEMENTS – In June 2009, the Financial Accounting Standard Board (“FASB”) issued SFAS No. 166, “Accounting for Transfers of Financial Assets—an amendment of FASB Statement No. 140” (now part of FASB Accounting Standards Codification (“ASC”) 860). The objective of this standard is to improve the relevance, representational faithfulness, and comparability of the information that a reporting entity provides in its financial reports about a transfer of financial assets; the effects of a transfer on its financial position, financial performance, and cash flows; and a transferor’s continuing involvement in transferred financial assets. Additionally, on and after the effective date, the concept of a qualifying special-purpose entity is no longer relevant for accounting purposes. This standard is effective as of the beginning of each reporting entity’s first annual reporting period that begins after November 15, 2009, for interim periods within that first
F-14
Table of Contents
annual reporting period, and for interim and annual reporting periods thereafter. Earlier application is prohibited. The recognition and measurement provisions of this standard are to be applied to transfers that occur on or after the effective date. The adoption of this standard did not have a material impact on the results of operations or the financial position of the Company.
In June 2009, the FASB issued SFAS No. 167, “Amendments to FASB Interpretation No. 46(R)” (now part of ASC 810). This standard amends FASB Interpretation 46(R) to require an enterprise to perform an analysis to determine whether an enterprise’s variable interest or interests give it a controlling financial interest in a variable interest entity by replacing the quantitative-based risks and rewards calculation for determining which enterprise, if any, has a controlling financial interest in a variable interest entity with an approach focused on identifying which enterprise has the power to direct the activities of a variable interest entity that most significantly impact the entity’s economic performance and has the obligation to absorb losses of or the right to receive benefits from the entity. This standard also requires ongoing reassessments of whether an enterprise is the primary beneficiary of a variable interest entity. This standard is effective as of the beginning of each reporting entity’s first annual reporting period that begins after November 15, 2009, for interim periods within that first annual reporting period, and for interim and annual reporting periods thereafter. Earlier application is prohibited. The adoption of this standard did not have a material impact on the results of operations or the financial position of the Company.
In October 2009, the FASB issued ASU No. 2009-13, “Revenue Recognition (Topic 605)—Multiple Deliverable Revenue Arrangements.” ASU No. 2009-13 eliminates the residual method of allocation and requires that arrangement consideration be allocated at the inception of the arrangement to all deliverables using the relative selling price method and expands the disclosures related to multiple-deliverable revenue arrangements. ASU No. 2009-13 is effective prospectively for revenue arrangements entered into or materially modified in fiscal years beginning on or after June 15, 2010, with earlier adoption permitted. The adoption of ASU No. 2009-13 did not have a material impact on the results of operations or financial position of the Company.
In January 2010, the FASB issued ASU No. 2010-06, “Fair Value Measurements and Disclosures (Topic 820)—Improving Disclosures about Fair Value Measurements.” ASU 2010-06 requires new disclosures regarding transfers in and out of the Level 1 and 2 and activity within Level 3 fair value measurements and clarifies existing disclosures of inputs and valuation techniques for Level 2 and 3 fair value measurements. ASU 2010-06 also includes conforming amendments to employers’ disclosures about post-retirement benefit plan assets. The new disclosures and clarifications of existing disclosures are effective for interim and annual reporting periods beginning after December 15, 2009, except for the disclosure of activity within Level 3 fair value measurements, which is effective for fiscal years beginning after December 15, 2010, and for interim periods within those years. The adoption of this standard, except for the disclosure of activity within Level 3 fair value measurements, did not have a material impact on the Company’s financial statements. The Company has not completed its assessment of the impact, if any, that the disclosure of activity within Level 3 fair value measurements will have on its financial statements.
In February 2010, the FASB issued ASU 2010-09, “Subsequent Events (Topic 855)—Amendments to Certain Recognition and Disclosure Requirements.” ASU 2010-09 requires an entity that is an SEC filer to evaluate subsequent events through the date that the financial statements are issued and removes the requirement that an SEC filer disclose the date through which subsequent events have been evaluated. ASC 2010-09 was effective upon issuance. The adoption of this standard did not have a material impact on the results of operations or the financial position of the Company.
In December 2010, the FASB issued ASU 2010-28, “Intangibles - Goodwill and Other (Topic 350): When to Perform Step 2 of the Goodwill Impairment Test for Reporting Units with Zero or Negative Carrying Amounts.” ASU 2010-28 provides amendments to Topic 350 to modify Step 1 of the goodwill impairment test for reporting units with zero or negative carrying amounts to clarify that, for those reporting units, an entity is required to perform Step 2 of the goodwill impairment test if it is more likely than not that a goodwill impairment exists. In determining whether it is more likely than not that a goodwill impairment exists, an entity should consider whether there are any adverse qualitative factors indicating that an impairment may exist. For public entities, the amendments in this ASU are effective for fiscal years, and interim periods within those years, beginning after December 15, 2010. Early adoption is not permitted. The Company has not completed its assessment of the impact, if any, that the adoption of ASU No. 2010-28 will have on its results of operations or its financial position.
F-15
Table of Contents
In December 2010, the FASB issued ASU 2010-29, “Business Combinations (Topic 805): Disclosure of Supplementary Pro Forma Information for Business Combinations.” ASU 2010-29 provides amendments to Topic 805 to specify that if a public entity presents comparative financial statements, the entity should disclose revenue and earnings of the combined entity as though the business combination(s) that occurred during the current year had occurred as of the beginning of the comparable prior annual reporting period only. The amendments also expand the supplemental pro forma disclosures under Topic 805 to include a description of the nature and amount of material, nonrecurring pro forma adjustments directly attributable to the business combination included in the reported pro forma revenue and earnings. The amendments are effective prospectively for business combinations for which the acquisition date is on or after the beginning of the first annual reporting period beginning on or after December 15, 2010. Early adoption is permitted. The Company has not completed its assessment of the impact, if any, that the adoption of ASU No. 2010-29 will have on its results of operations or its financial position.
| 3. | Acquisitions |
On January 28, 2011, the Company completed the acquisition of substantially all of the assets of Rafaella Apparel Group, Inc. (“Rafaella”), Rafaella Apparel Far East Limited (“Rafaella Far East”) and Verrazano, Inc. (“Verrazano”) pursuant to the Asset Purchase Agreement dated as of January 7, 2011 (the “Agreement”) by and among Rafaella, Rafaella Far East and Verrazano (collectively, the “Sellers”) and the Company.
The Sellers have been a leading designer, sourcer, marketer and distributor of a full line of women’s sportswear, and the assets acquired by the Company include all of the Seller’s assets used, useful or necessary in the conduct of the Seller’s business, such as, among other things, inventory, receivables, purchase orders and intellectual property. The Company assumed certain liabilities, including, among other things, certain accounts payable, accrued liabilities and certain letters of credit.
The consideration paid by the Company totaled $80 million in cash and a warrant to purchase 106,564 shares of the Company’s common stock valued at approximately $2.6 million. The cash portion of the purchase price is subject to adjustment as set forth in the Agreement based on a post-closing true-up of net working capital for a period of up to approximately 90 days following the closing date. The Agreement provides for the escrow of $3.0 million in connection with the post-closing true-up adjustment. While $3.0 million is currently held in escrow related to the post closing adjustment, such adjustment is not limited to the amount held in escrow. An estimate of the post closing true-up adjustment has been included in other current assets. Also held, is an additional $3.5 million of the cash portion of the purchase price for a period of one year following the closing date to satisfy certain indemnity claims against the Sellers under the Agreement. The Company funded the acquisition through its senior credit facility.
The warrant issued to Rafaella as part of the purchase price became exercisable on the business day immediately following the first business day after the closing on which the closing price of the Company’s common stock equaled or exceeded $28.152 and expires two years following the closing date. The warrant is exercisable for a total of 106,565 shares of the Company’s common stock at an exercise price of $.01 per share. The exercise price per share and number of shares issuable upon exercise are subject to adjustments for stock splits, dividends, subdivisions or combinations involving the common stock.
The Company incurred approximately $2.2 million in acquisition expenses during fiscal 2011. These expenses have been included in selling general and administrative expenses in the consolidated statement of income.
F-16
Table of Contents
No operations have been included in the operations for fiscal 2011 related to this acquisition, since it occurred at the end of the fiscal year.
The following table summarizes the preliminary fair values of the assets acquired and liabilities assumed. The following purchase accounting adjustments include fair value adjustments and the allocation of purchase price based on fair value:
| (in thousands) | ||||
| Total purchase price |
||||
| Cash consideration paid |
$ | 79,985 | ||
| Total purchase price |
79,985 | |||
| Warrants |
2,599 | |||
| Total adjusted purchase price |
$ | 82,584 | ||
| Total allocation of the purchase price is as follows: |
||||
| Inventory |
$ | 22,698 | ||
| Accounts receivables |
4,946 | |||
| Other current assets |
3,514 | |||
| Fixed assets |
267 | |||
| Intangibles |
62,332 | |||
| Accounts payable and accrued expenses |
(11,173 | ) | ||
| Fair value of net assets acquired |
$ | 82,584 | ||
The Company is in the process of completing the allocation of the purchase price to the various components of the net assets acquired and expects to finalize this allocation during fiscal 2012. Once finalized, the Company expects intangible assets to be allocated amongst customer lists, tradename, and goodwill.
On February 4, 2008, the Company completed the acquisition of the C&C California and Laundry by Shelli Segal brands and related assets from Liz Claiborne, Inc. The acquisition was financed through existing cash and borrowings under the Company’s existing senior credit facility. The results of operations of the acquired brands have been included in the Company’s operations beginning as of the date of the acquisition. The aggregate purchase price was approximately $34.0 million, which represents the sum of (i) $32.7 million paid in cash, and (ii) acquisition costs of $1.2 million.
F-17
Table of Contents
The following table summarizes the fair values of the assets acquired and liabilities assumed. The following purchase accounting adjustments include fair value adjustments and the allocation of purchase price based on fair value:
| (in thousands) | ||||
| Total purchase price |
||||
| Cash consideration paid |
$ | 32,747 | ||
| Total purchase price |
32,747 | |||
| Total direct merger costs |
1,204 | |||
| Total adjusted purchase price |
$ | 33,951 | ||
The total allocation of the purchase price is as follows:
| Inventory |
$ | 6,872 | ||
| Equipment |
177 | |||
| Intangible assets |
28,916 | |||
| Assumed liabilities |
(2,014 | ) | ||
| Fair value of net assets acquired |
$ | 33,951 | ||
Intangible assets consist of non-amortizing trademark intangibles.
| 4. | Share Repurchase |
During November 2007, the Company’s Board of Directors previously authorized the Company to purchase, from time to time and as market and business conditions warrant, up to $20 million of its common stock for cash in the open market or in privately negotiated transactions over a 12-month period. In September 2008, 2009 and 2010, the Board of Directors extended the stock repurchase program for the next twelve months. Although the Board of Directors allocated a maximum of $20 million to carry out the program, the Company is not obligated to purchase any specific number of outstanding shares, and will reevaluate the program on an ongoing basis.
The Company repurchased 418,000 and 1,769,296 shares of its common stock during fiscal 2010 and 2009, respectively, at a cost of approximately of $1.8 million and $11.6 million. The Company did not repurchase any shares of its common stock during fiscal 2011.
| 5. | Accounts Receivable |
Accounts receivable consisted of the following as of:
| January 29, 2011 |
January 30, 2010 |
|||||||
| (in thousands) | ||||||||
| Trade accounts |
$ | 126,879 | $ | 134,922 | ||||
| Royalties and other receivables |
4,450 | 6,873 | ||||||
| Total |
131,329 | 141,795 | ||||||
| Less: Allowance for doubtful accounts |
(1,795 | ) | (1,861 | ) | ||||
| Total |
$ | 129,534 | $ | 139,934 | ||||
F-18
Table of Contents
The activity for the allowance for doubtful accounts is as follows:
| 2011 | 2010 | 2009 | ||||||||||
| (in thousands) | ||||||||||||
| Allowance for doubtful accounts |
||||||||||||
| Beginning balance |
$ | 1,861 | $ | 1,029 | $ | 1,452 | ||||||
| Provision |
96 | 1,307 | 1,525 | |||||||||
| Write-offs net of recoveries |
(162 | ) | (475 | ) | (1,948 | ) | ||||||
| Ending balance |
$ | 1,795 | $ | 1,861 | $ | 1,029 | ||||||
The Company maintains an allowance for doubtful accounts for estimated losses resulting from the inability of trade customers to make required payments. The Company provides an allowance for specific customer accounts where collection is doubtful and also provides a general allowance for other accounts based on historical collection and write-off experience. Judgment is subjective because some retail customers may experience financial difficulties. If their financial condition were to worsen, additional allowances might be required.
| 6. | Inventories |
Inventories consisted of the following as of:
| January 29, 2011 |
January 30, 2010 |
|||||||
| (in thousands) | ||||||||
| Finished goods |
$ | 176,020 | $ | 110,420 | ||||
| Raw materials and in process |
2,197 | 1,895 | ||||||
| Total |
$ | 178,217 | $ | 112,315 | ||||
The Company’s inventories are valued at the lower of cost (weighted moving average cost) or market. The Company evaluates all of its inventory stock keeping units (SKUs) to determine excess or slow moving SKUs based on orders on hand and projections of future demand and market conditions. For those units in inventory that are so identified as excess or slow moving, the Company estimates their market value based on current sales trends. If the projected net sales value is less than cost, on an individual SKU basis, the Company writes down inventory to reflect the lower value. This methodology recognizes projected inventory losses at the time such losses are evident rather than at the time goods are actually sold.
| 7. | Marketable Securities |
During fiscal 2007, the Company purchased 369,700 common shares in the open market of a then current licensee for approximately $2.6 million. Total royalty income from this licensee was approximately $1.2 million for the year ended January 31, 2009.
In July 2007, the Company purchased 50,000 common shares in the open market of an unrelated entity for $364,000. These shares were sold in December 2008 due to an acquisition of the entity by a third party. The proceeds received were $95,000 and the gross realized loss recognized on the sale was $269,000, which had been previously recorded as an other than temporary impairment. The realized loss was reclassified from accumulated other comprehensive (loss) income to impairment on marketable securities.
During fiscal 2009, the Company determined that the remaining 369,700 common shares of marketable securities which were classified as available for sale were deemed to be other than temporarily impaired due to the percentage and duration of the loss and recorded an other than temporary impairment charge in the amount of $2.6 million, during the second and third quarters of fiscal 2009. As of January 31, 2009, the remaining investment in these marketable securities was written-off, as a result of the subsequent filing of bankruptcy by the entity.
F-19
Table of Contents
| 8. | Property and Equipment |
Property and equipment consisted of the following as of:
| January 29, 2011 |
January 30, 2010 |
|||||||
| (in thousands) | ||||||||
| Furniture, fixture and equipment |
$ | 84,146 | $ | 79,304 | ||||
| Buildings |
19,348 | 19,348 | ||||||
| Vehicles |
850 | 862 | ||||||
| Leasehold improvements |
24,569 | 23,668 | ||||||
| Land |
9,189 | 9,163 | ||||||
| Total |
138,102 | 132,345 | ||||||
| Less: accumulated depreciation and amortization |
(83,025 | ) | (71,878 | ) | ||||
| Total |
$ | 55,077 | $ | 60,467 | ||||
The above table of property and equipment includes assets held under capital leases as of:
| January 29, 2011 |
January 30, 2010 |
|||||||
| (in thousands) | ||||||||
| Furniture, fixture and equipment |
$ | 1,027 | $ | 1,000 | ||||
| Less: accumulated depreciation and amortization |
(555 | ) | (213 | ) | ||||
| Total |
$ | 472 | $ | 787 | ||||
Depreciation and amortization expense relating to property and equipment amounted to $12.0 million, $13.4 million and $14.4 million for the fiscal years ended January 29, 2011 January 30, 2010 and January 31, 2009, respectively.
| 9. | Trademarks |
Trademarks are included in intangible assets, are considered indefinite-lived assets and totaled $200.3 million at January 29, 2011 and January 30, 2010, respectively.
These trademarks are not subject to amortization but are reviewed at least annually for potential impairment. The fair value of each trademark asset is compared to the carrying value of the trademark. The Company recognizes an impairment loss when the estimated fair value of the trademark asset is less than the carrying value. The Company’s annual impairment test is performed annually on February 1st.
The Company estimates the fair value of the trademarks based on an income approach using the relief-from-royalty method. This methodology assumes that, in lieu of ownership, a third party would be willing to pay a royalty in order to exploit the related benefits of trademark assets. The cash flow models the Company uses to estimate the fair values of its trademarks involve several assumptions. Changes in these assumptions could materially impact its fair value estimates. Assumptions critical to the fair value estimates are: (i) discount rates used to derive the present value factors used in determining the fair value of the trademarks; (ii) royalty rates used
F-20
Table of Contents
in the trademark valuations; (iii) projected revenue growth rates; and (iv) projected long-term growth rates used in the derivation of terminal year values. These and other assumptions are impacted by economic conditions and expectations of management and could change in the future based on period-specific facts and circumstances. The Company bases its fair value estimates on assumptions it believes to be reasonable, but which are unpredictable and inherently uncertain.
As a result of the annual trademark impairment analysis performed during the fiscal year ended January 31, 2009, the Company determined that the carrying value of certain trademarks exceeded their estimated fair value. Accordingly, the Company recorded a non-cash pre-tax charge of $20.7 million to reduce the value of these trademarks to their estimated fair values. The impairments result from a decline in the future anticipated cash flows from these trademarks, which is due, in part, to the deterioration of the economic and market conditions in the apparel industry during fiscal 2009. Based on the annual trademark impairment analysis performed during the fiscal years ended January 29, 2011 and January 30, 2010, the Company determined that the estimated fair value of the trademarks exceeded their carrying value.
The trademark impairment charges are reported as a component of impairment on long-lived assets in the statement of operations.
| 10. | Other Current Liabilities |
Other current liabilities consisted of the following as of:
| January 29, 2011 |
January 30, 2010 |
|||||||
| (in thousands) | ||||||||
| Unearned advertising reimbursement |
$ | 2,263 | $ | 2,525 | ||||
| State sales and use tax |
965 | 938 | ||||||
| Other |
3,431 | 3,473 | ||||||
| Total |
$ | 6,659 | $ | 6,936 | ||||
| 11. | Accrued Expenses and Other Liabilities |
Accrued expenses consisted of the following as of:
| January 29, 2011 |
January 30, 2010 |
|||||||
| (in thousands) | ||||||||
| Salaries and commissions |
$ | 13,270 | $ | 5,021 | ||||
| Royalties |
2,071 | 2,608 | ||||||
| Buying commissions |
209 | 286 | ||||||
| Other |
7,849 | 5,725 | ||||||
| Total |
$ | 23,399 | $ | 13,640 | ||||
F-21
Table of Contents
| 12. | Unearned Revenues and Other Long Term Liabilities |
Other long term liabilities consisted of the following as of:
| January 29, 2011 |
January 30, 2010 |
|||||||
| (in thousands) | ||||||||
| Deferred gain long term |
$ | 4,707 | $ | 5,664 | ||||
| Unearned revenue |
3,812 | 5,428 | ||||||
| Deferred advertising |
3,688 | 4,900 | ||||||
| Other |
5,380 | 4,647 | ||||||
| Total |
$ | 17,587 | $ | 20,639 | ||||
| 13. | Derivative Financial Instruments |
The Company has an interest rate risk management policy with the objective of managing its interest costs. To meet this objective, the Company may employ hedging and derivatives strategies to limit the effects of changes in interest rates on its operating income and cash flows, and to lower its overall fixed rate interest cost on its senior subordinated notes.
The Company believes its interest rate risk management policy is generally effective. Nonetheless, the Company’s profitability may be adversely affected during particular periods as a result of changing interest rates. In addition, hedging transactions using derivative instruments involve risks such as counter-party credit risk. The counter-parties to the Company’s arrangements are major financial institutions.
When entered into, derivative financial instruments such as interest rate swap contracts and foreign exchange contracts are recognized in the financial statements and measured at fair value regardless of the purpose or intent for holding them. Changes in the fair value of derivative financial instruments are either recognized in income or stockholders’ equity (as a component of comprehensive income), depending on whether the derivative is not designated as a hedge or is designated as a hedge of changes in fair value or cash flows. When designated as a hedge of changes in fair value, the effective portion of the hedge is recognized as an offset in income with a corresponding adjustment to the hedged item. When designated as a hedge of changes in cash flows, the effective portion of the hedge is recognized as an offset in comprehensive income with a corresponding adjustment to the hedged item and recognized in income in the same period as the hedged item is settled.
Derivatives on senior subordinated notes payable
In August 2009, the Company entered into an interest rate swap agreement (the “Swap Agreement”) for an aggregate notional amount of $75 million in order to reduce the debt servicing costs associated with its $150 million 87/8% senior subordinated notes. The Swap Agreement was scheduled to terminate on September 15, 2013. Under the Swap Agreement, the Company was entitled to receive semi-annual interest payments on September 15 and March 15 at a fixed rate of 87/8% and was obligated to make semi-annual interest payments on September 15 and March 15 at a floating rate based on the one-month LIBOR rate plus 632 basis points for the period through September 15, 2013. The Swap Agreement had an optional call provision that allowed the counterparty to settle the Swap Agreement at any time with 30 days notice and subject to declining termination premium payments from the counterparty in the event the call was exercised. The Swap Agreement was a fair value hedge as it had been designated against the 87/8% senior subordinated notes carrying a fixed rate of interest and converted the fixed interest payments to variable interest payments.
F-22
Table of Contents
During August 2010, the Company was notified by the counterparty, that it would exercise the optional call provision and terminate the Swap Agreement in September 2010. As per the terms of the call provision, the Company received $1.1 million, its fair value as of the termination date. The fair value of the hedge item at the termination date will be amortized over the remaining term of the senior subordinated notes payable.
The location and amount of gains (losses) on derivative instruments and related hedged items reported in the consolidated statements of operations were as follows:
| Fair Value Hedging Relationship |
Location of Gain (Loss) Recognized in Income |
January 29, 2011 |
January 30, 2010 |
|||||||
| (in thousands) | ||||||||||
| Derivative : Swap Agreement |
Interest expense | $ | 1,572 | $ | 1,311 | |||||
| Hedged item: Fixed rate debt |
Interest expense | (319 | ) | (987 | ) | |||||
| Total (1) |
$ | 1,253 | $ | 324 | ||||||
| (1) | Includes $392,000 and ($195,000) for the years ended January 29, 2011 and January 30, 2010, respectively, related to the ineffectiveness of the hedging relationship. |
In August 2009, the Company entered into an interest rate cap agreement (the “$75 million Cap Agreement”) for an aggregate notional amount of $75 million associated with the 87/8% senior subordinated notes. The $75 million Cap Agreement became effective on December 15, 2010 and was scheduled to terminate on September 15, 2013. The $75 million Cap Agreement was being used to manage cash flow risk associated with the Company’s floating interest rate exposure pursuant to the Swap Agreement. The $75 million Cap Agreement did not qualify for hedge accounting treatment.
The location and amount of (losses) on derivative instruments not designated as hedging instruments reported in the consolidated statements of operations were as follows:
| Derivatives Not Designed As Hedging Instruments |
Location of (Loss) |
January 29, 2011 |
January 30, 2010 |
|||||||
| (in thousands) | ||||||||||
| Derivative : $75 Million Cap Agreement |
Interest expense | $ | (1,397 | ) | $ | (1,243 | ) | |||
| Total |
$ | (1,397 | ) | $ | (1,243 | ) | ||||
See footnote 21 to the consolidated financial statements for disclosure of the fair value and line item caption of derivative instruments recorded on the consolidated balance sheets.
| 14. | Letter of Credit Facilities |
As of January 29, 2011 we maintained two U.S. dollar letter of credit facilities totaling $50.0 million and one letter of credit facility totaling $1.0 million utilized by our United Kingdom subsidiary. Each letter of credit is secured primarily by the consignment of merchandise in transit under that letter of credit and certain subordinated liens on our assets. During the third quarter of fiscal 2011, because of the termination of our Canadian joint venture, we cancelled the letter of credit facility utilized by our Canadian joint venture which totaled an estimated $3.6 million. During the first quarter of fiscal 2010, one credit line totaling an estimated $30.0 million was cancelled. As of January 29, 2011 there was $45.1 million available under the existing letter of credit facilities.
F-23
Table of Contents
Amounts under letter of credit facilities consist of the following as of:
| January 29, 2011 |
January 30, 2010 |
|||||||
| (in thousands) | ||||||||
| Total letter of credit facilities |
$ | 50,953 | $ | 54,481 | ||||
| Outstanding letters of credit |
(5,858 | ) | (5,496 | ) | ||||
| Total credit available |
$ | 45,095 | $ | 48,985 | ||||
Additionally, the Company assumed certain letters of credit in the amount of $9.4 million, in connection with the acquisition of certain net assets from Rafaella Apparel Group, Inc. These letters of credit are fully collateralized by restricted cash in the amount of $9.4 million. The Company expects these letters of credit to expire during the second quarter of fiscal 2012.
| 15. | Senior Credit Facility |
Effective March 31, 2010, the Company entered into an amendment to its senior credit facility. This amendment modified the senior credit facility to permit the sale of certain accounts receivable.
The following is a description of the terms of its senior credit facility with Wachovia Bank, National Association, et al, as amended, and does not purport to be complete and is subject to, and qualified in its entirety by reference to, all the provisions of the senior credit facility: (i) the maximum line is up to $150 million with the opportunity to increase this amount in $25 million increments up to $200 million; (ii) the inventory borrowing limit is $90 million or up to 60% of the maximum line; (iii) the sublimit for letters of credit is up to $40 million; (iv) the amount of letter of credit facilities allowed outside of the facility is $110 million and (v) the outstanding balance is due at the maturity date of February 1, 2012. At January 29, 2011, the Company had $97.3 million of outstanding borrowings under the senior credit facility.
Certain Covenants. The senior credit facility contains certain covenants, which, among other things, requires the Company to maintain a minimum adjusted EBITDA (“Senior Credit Facility Adjusted EBITDA”), as defined in the senior credit facility (as opposed to the definition of EBITDA used by the Company for other purposes), if availability falls below a certain threshold. These covenants may restrict the Company’s ability and the ability of its subsidiaries to, among other things, incur additional indebtedness in certain circumstances, redeem or repurchase capital stock, make certain investments, or sell assets. The Company prohibited from paying cash dividends under these covenants. The Company is not aware of any non-compliance with any of its covenants under the senior credit facility. The Company could be materially harmed if it violates any covenants as the lenders under the senior credit facility could declare all amounts outstanding thereunder, together with accrued interest, to be immediately due and payable. If the Company is unable to repay those amounts, the lenders could proceed against its assets. In addition, a violation could also constitute a cross-default under the indenture and mortgage, resulting in all of its debt obligations becoming immediately due and payable, which it may not be able to satisfy.
Borrowing Base. Borrowings under the Company’s senior credit facility are limited under its terms to a borrowing base calculation, which generally restricts the outstanding balances to the lesser of either (1) the sum of (a) 85.0% of eligible receivables plus (b) 85.0% of its eligible factored accounts receivables up to $10.0 million plus (c) the lesser of (i) the inventory loan limit of $90 million, or 60% of the maximum line, or (ii) the lesser of (A) 65.0% of eligible finished goods inventory, or (B) 85.0% of the net recovery percentage (as defined in the senior credit facility) of eligible inventory, or (2) the loan limit; and in each case minus (x) 35.0% of the amount of outstanding letters of credit for eligible inventory, (y) the full amount of all other outstanding letters of credit issued pursuant to the senior credit facility which are not fully secured by cash collateral, and (z) licensing reserves for which the Company is the licensee of certain branded products.
F-24
Table of Contents
Interest. Interest on the principal balance under the Company’s senior credit facility accrues, at its option, at either (a) the greater of Wachovia’s prime lending rate or the Federal Funds rate; plus 1/2% plus a margin spread of 100 to 175 basis points based upon the sum of our quarterly average excess availability plus excess cash for the immediately preceding fiscal quarter, at the time of borrowing or (b) the rate quoted by Wachovia as the average monthly Eurodollar Rate for 1-month Eurodollar deposits plus a margin spread of 200 to 275 basis points based upon the sum of its quarterly average excess availability plus excess cash for the immediately preceding fiscal quarter, at the time of borrowing.
Security. As security for the indebtedness under the senior credit facility, the Company granted the lenders a first priority security interest in substantially all of its existing and future assets other than its trademark portfolio and real estate owned, including, without limitation, accounts receivable, inventory, deposit accounts, general intangibles, equipment and capital stock or membership interests, as the case may be, of certain subsidiaries.
| 16. | Senior Subordinated Notes Payable |
In fiscal 2004, the Company issued $150 million 87/8% senior subordinated notes, due September 15, 2013. The proceeds of this offering were used to redeem previously issued $100 million 12 1/4% senior subordinated notes and to pay down the outstanding balance of the senior credit facility at that time. The proceeds to the Company were $146.8 million yielding an effective interest rate of 9.1%.
Certain Covenants. The indenture governing the senior subordinated notes contains certain covenants which restrict the Company’s ability and the ability of its subsidiaries to, among other things, incur additional indebtedness in certain circumstances, redeem or repurchase capital stock, make certain investments, or sell assets. The Company is not aware of any non-compliance with any of its covenants in this indenture. The Company is prohibited from paying cash dividends under these covenants. The Company could be materially harmed if it violates any covenants because the indenture’s trustee could declare the outstanding notes, together with accrued interest, to be immediately due and payable, which it may not be able to satisfy. In addition, a violation could also constitute a cross-default under the senior credit facility, the letter of credit facilities and the real estate mortgages resulting in all of its debt obligations becoming immediately due and payable, which it may not be able to satisfy.
During fiscal 2010, the Company’s Board of Directors authorized the Company to purchase, from time to time and as market and business conditions warrant, its senior subordinated notes for cash in the open market or in privately negotiated transactions. The amount of senior subordinated notes that may be repurchased or otherwise retired, if any, were to be decided upon based on parameters approved by of the Company’s Board of Directors and were to depend on market conditions, trading levels of the Company’s senior subordinated notes, the Company’s cash position and other considerations.
During the fourth quarter of fiscal 2010, the Company retired $20.8 million of its senior subordinated notes payable. In connection with this retirement, the Company paid an additional $98,000 in redemption premiums and commissions. Additionally the Company wrote-off approximately $259,000 in unamortized discount and bond fees associated with the retired portion of the senior subordinated notes.
During the second quarter of fiscal 2011, the Company retired $25.0 million of its senior subordinated notes payable. In connection with this retirement, the Company paid an additional $453,000 in redemption premiums and commissions. Additionally the Company wrote-off approximately $277,000 in unamortized discount and bond fees associated with the retired portion of the senior subordinated notes.
| 17. | Real Estate Mortgages |
In fiscal 2003, The Company acquired its main administrative office, warehouse and distribution facility in Miami and partially financed the acquisition of the facility with an $11.6 million mortgage loan. The real estate mortgage loan contained certain covenants. Interest was fixed at 7.123%. In August 2008, the Company executed a maturity extension of the real estate mortgage loan until July 1, 2010. In July 2010, the Company paid off the real estate mortgage loan.
F-25
Table of Contents
In July 2010, the Company refinanced its main administrative office, warehouse and distribution facility in Miami with a $13.0 million mortgage loan. The real estate mortgage loan contains certain covenants. The Company is not aware of any non-compliance with any of its covenants. If the Company violates any covenants, the lender under the real estate mortgage loan could declare all amounts outstanding thereunder to be immediately due and payable, which the Company may not be able to satisfy. The loan is due on August 1, 2020. Principal and interest of $83,000 is due monthly based on a 25 year amortization with the outstanding principal due at maturity. Interest is fixed at 5.80%. At January 29, 2011, the balance of the real estate mortgage loan totaled $12.7 million, net of discount, of which $223,000 is due within one year.
In June 2006, the Company entered into a mortgage loan for $15 million secured by its Tampa facility. The loan is due on June 7, 2016. Principal and interest of $297,000 were due quarterly based on a 20 year amortization with the outstanding principal due at maturity. Interest was set at 6.25% for the first five years, at which point it would have reset based on the terms and conditions of the promissory note. In June 2010, the Company negotiated with the bank to accelerate the rate reset that was scheduled to occur in June 2011. The interest rate was reduced to 5.75% per annum. The terms were restated to reflect new quarterly payments of principal and interest of $288,000, based on a 20 year amortization with the outstanding principal due at maturity. At January 29, 2011, the balance of the real estate mortgage loan totaled $13.6 million, net of discount, of which $369,000 is due within one year.
Under the terms of the mortgage loans, a covenant violation could constitute a cross-default under the Company’s senior credit facility, the letter of credit facilities and indenture relating to its senior subordinated notes resulting in all of its debt obligations becoming immediately due and payable, which the Company may not be able to satisfy.
The contractual maturities of the real estate mortgages are as follows:
| Amount | ||||
| (in thousands) | ||||
| Fiscal year ending: |
||||
| 2012 |
$ | 592 | ||
| 2013 |
647 | |||
| 2014 |
687 | |||
| 2015 |
728 | |||
| 2016 |
771 | |||
| Thereafter |
23,223 | |||
| 26,648 | ||||
| Less discount |
(263 | ) | ||
| Total |
$ | 26,385 | ||
F-26
Table of Contents
| 18. | Income Taxes |
For financial reporting purposes, income (loss) before noncontrolling interest and income tax (benefit) provision includes the following components:
| January 29, | January 30, | January 31, | ||||||||||
| 2011 | 2010 | 2009 | ||||||||||
| (in thousands) | ||||||||||||
| Domestic |
$ | 22,629 | $ | 7,416 | $ | (18,185 | ) | |||||
| Foreign |
13,276 | 9,719 | 2,225 | |||||||||
| Total |
$ | 35,905 | $ | 17,135 | $ | (15,960 | ) | |||||
The income tax provision (benefit) consists of the following components for each of the years ended:
| January 29, | January 30, | January 31, | ||||||||||
| 2011 | 2010 | 2009 | ||||||||||
| (in thousands) | ||||||||||||
| Current income taxes: |
||||||||||||
| Federal |
$ | 1,994 | $ | (1,554 | ) | $ | 1,726 | |||||
| State |
780 | (179 | ) | 434 | ||||||||
| Foreign |
1,430 | 1,446 | 1,671 | |||||||||
| Total current income taxes |
4,204 | (287 | ) | 3,831 | ||||||||
| Deferred income taxes: |
||||||||||||
| Federal |
6,708 | 3,106 | (6,227 | ) | ||||||||
| State |
481 | 796 | (1,286 | ) | ||||||||
| Total deferred income taxes |
7,189 | 3,902 | (7,513 | ) | ||||||||
| Total |
$ | 11,393 | $ | 3,615 | $ | (3,682 | ) | |||||
The Company’s effective income tax rate was as follows for each of the years ended:
| January 29, | January 30, | January 31, | ||||||||||
| 2011 | 2010 | 2009 | ||||||||||
| Statutory federal income tax rate |
35.0 | % | 35.0 | % | 35.0 | % | ||||||
| Increase resulting from State income taxes, net of federal income tax benefit |
3.2 | % | 1.2 | % | 4.5 | % | ||||||
| Foreign tax rate differential |
–9.1 | % | –17.6 | % | 0.1 | % | ||||||
| Change in reserves |
0.2 | % | –8.9 | % | –1.4 | % | ||||||
| Change in valuation allowance |
–0.7 | % | 10.9 | % | –9.0 | % | ||||||
| Non-deductible items |
2.3 | % | 2.4 | % | –5.6 | % | ||||||
| Other |
0.8 | % | –1.9 | % | –0.5 | % | ||||||
| Total |
31.7 | % | 21.1 | % | 23.1 | % | ||||||
F-27
Table of Contents
Deferred income taxes are provided for the temporary differences between financial reporting basis and the tax basis of the Company’s assets and liabilities. The tax effects of temporary differences as of the years ended are as follows:
| January 29, | January 30, | |||||||
| 2011 | 2010 | |||||||
| (in thousands) | ||||||||
| Deferred tax assets: |
||||||||
| Inventory |
$ | 4,166 | $ | 3,931 | ||||
| Accounts receivable |
1,768 | 2,075 | ||||||
| Accrued expenses |
2,723 | 2,360 | ||||||
| Advance payments |
3,134 | 3,971 | ||||||
| Net operating losses |
16,960 | 21,470 | ||||||
| Deferred pension obligation |
5,061 | 6,691 | ||||||
| Stock compensation |
3,284 | 1,987 | ||||||
| Other |
4,157 | 3,131 | ||||||
| 41,253 | 45,616 | |||||||
| Deferred tax liabilities |
||||||||
| Fixed assets |
— | (645 | ) | |||||
| Intangible assets |
(36,047 | ) | (32,005 | ) | ||||
| Prepaid expenses |
(1,187 | ) | (1,275 | ) | ||||
| (37,234 | ) | (33,925 | ) | |||||
| Valuation allowance |
(5,098 | ) | (5,366 | ) | ||||
| Net deferred tax (liability) asset |
$ | (1,079 | ) | $ | 6,325 | |||
As of January 30, 2010, the Company had a gross deferred tax asset relating to foreign tax credit carryforwards in the amount of $0.3 million. These credits originated in fiscal year 2004. Management believes it is more likely than not that the deferred tax asset associated with these foreign tax credits will not be realized during the carryforward period. As such, the Company maintains a valuation allowance in the amount of $0.3 million against the foreign tax credit amounts it does not expect to realize. These amounts remained unchanged as of January 29, 2011.
During fiscal 2009, the Company realized a $1.0 million income tax benefit associated with realized and unrealized losses associated with marketable securities. Management believes it is more likely than not that the related deferred tax asset associated with these losses will not be realized due to tax limitations imposed on the utilization of capital losses. As such, the Company has established a valuation allowance against the losses not expected to be realized. The balance of the valuation allowance associated with realized and unrealized losses from marketable securities for fiscal 2011 and 2010 was $1.0 and $1.0 million, respectively. During fiscal 2011 the valuation allowance did not change and during fiscal 2010 the valuation allowance increased $0.3 million.
During fiscal years 2011 and 2010, the Company realized tax-effected losses of $0.1 and $1.1 million, respectively, associated with the operations of its U.K. subsidiary. For U.K. tax purposes, the operating loss has an indefinite carryforward period. Based upon operating results from the three most recent fiscal years, including fiscal 2011, management of the Company has determined that its U.K. subsidiary represents a cumulative loss company. Therefore, management has determined that a valuation allowance for deferred income tax assets is necessary. The balance of the valuation allowance associated with U.K. operating loss carryforward for fiscal 2011 and 2010 was $2.0 and $2.0 million, respectively after rounding. During fiscal 2011 the valuation allowance did not change and during fiscal 2010 the valuation allowance increased $1.1 million.
In connection with the 2003 Perry Ellis Menswear acquisition, the Company originally acquired a net deferred tax asset of approximately $53.5 million, net of a $20.3 million valuation allowance. Additionally, the acquisition of Perry Ellis Menswear caused an “ownership change” for federal income tax purposes. As a result, the use of any net operating losses existing at the date of the ownership change to offset future taxable income of the Company is limited by Section 382 of the Internal Revenue Code of 1986, as amended (“Section 382”). As of the acquisition date, Perry Ellis Menswear had available federal net operating losses of which approximately $56.0 million expired unutilized as a result of the annual usage limitations under Section 382.
F-28
Table of Contents
The following table reflects the expiration of the remaining federal net operating losses:
| Fiscal Year |
(in thousands) | |||
| 2012 |
$ | 2,409 | ||
| 2013 - 2019 |
12,872 | |||
| 2020 - 2023 |
19,726 | |||
| Thereafter |
— | |||
| $ | 35,007 | |||
In addition to the Company’s U.S. federal net operating loss, the Company has reflected in its income tax provision (benefit) deferred tax assets associated with net operating losses generated in various U.S. state jurisdictions. However, with respect to jurisdictions where the Company either has limited operations or statutory limitations on the use of acquired net operating losses, the ability to utilize such losses is restricted. Therefore, management has determined that a valuation allowance for deferred income tax assets is necessary, as a portion of the assets are not expected to be fully realized. The balance of the valuation allowance associated with U.S. state net operating losses for fiscal 2011 and 2010 was $1.7 and $2.0 million respectively. During fiscal 2011 and 2010 the valuation allowance decreased by $0.3 million and increased by $0.6 million, respectively.
Deferred taxes have not been recognized on unremitted earnings of certain of the Company’s foreign subsidiaries based on the “indefinite reversal” criteria. No provision is made for income tax that would be payable upon the distribution of earnings, and it is not practicable to determine the amount of the related unrecognized deferred income tax liability.
The federal and state income tax provisions do not reflect the tax savings resulting from deductions associated with the Company’s stock option plans. These savings were $2.3 million, $0.2 million and $1.6 million for fiscal 2011, 2010 and 2009, respectively.
The Company or one of its subsidiaries files income tax returns in the U.S. federal jurisdiction, and various states and foreign jurisdictions. The Company’s U.S. federal income tax returns for 2008 through 2011 are open tax years. The Company’s state tax filings are subject to varying statutes of limitations. The Company’s unrecognized state tax benefits are related to state tax returns open from 2005 through 2011, depending on each state’s particular statute of limitation. During the fiscal year ended January 29, 2011, the Company is still discussing with the State of New Jersey the settlement of income tax liabilities pertaining to the 2004 through 2007 tax years as part of a voluntary disclosure agreement. Furthermore, various state and local income tax returns are also under examination by taxing authorities. There are currently no U.S. federal income tax returns under examination.
As of February 1, 2010, the Company had a $1.1 million liability recorded for unrecognized tax benefits, which included interest and penalties of $0.3 million. All of the unrecognized tax benefits, if recognized, would affect the Company’s effective tax rate. As of January 29, 2011, the Company had a $1.2 million liability recorded for unrecognized tax benefits, which included interest and penalties of $0.3 million. All of the unrecognized tax benefits, if recognized, would affect the Company’s effective tax rate.
F-29
Table of Contents
A reconciliation of the beginning balance of the Company’s unrecognized tax benefits and the ending amount of the unrecognized tax benefits are as follows as of:
| January 29, | January 30, | January 31, | ||||||||||
| 2011 | 2010 | 2009 | ||||||||||
| (in thousands) | ||||||||||||
| Balance at beginning of period |
$ | 1,118 | $ | 3,460 | $ | 3,900 | ||||||
| Additions based on tax positions related to the current year |
70 | 44 | 140 | |||||||||
| Additions for tax positions of prior years |
70 | 322 | 438 | |||||||||
| Reductions for tax positions of prior years |
— | (248 | ) | (165 | ) | |||||||
| Reductions due to lapses of statute of limitations |
(76 | ) | (1,650 | ) | — | |||||||
| Settlements |
— | (810 | ) | (853 | ) | |||||||
| Balance at end of period |
$ | 1,182 | $ | 1,118 | $ | 3,460 | ||||||
The Company recognizes interest and penalties accrued related to unrecognized tax benefits as a component of income tax expense. During the fiscal years 2011, 2010 and 2009 the Company recognized approximately $0.1 million, $(0.5) million and $0.2 million in interest and penalties respectively. The Company had approximately $0.3 million and $0.3 million for the payment of interest and penalties accrued at January 30, 2011 and January 31, 2010, respectively after rounding.
It is reasonably possible that within the next twelve months the Company may settle its voluntary disclosure process with the State of New Jersey. The Company does not currently anticipate that such resolution will significantly increase or decrease tax expense within the next twelve months. Furthermore, the statute of limitations related to the Company’s 2008 U.S. federal tax year will expire within the next twelve months. The lapse in the statute of limitations would be expected to decrease tax expense within the next twelve months. The expiration of the statute of limitations related to the Company’s 2008 U.S. federal and state tax year could result in a tax benefit of up to approximately $0.2 million.
| 19. | Retirement Plan |
The Company has a 401(k) Plan (the “Plan”) which includes a discretionary company match which has ranged from 0% to 50% of the first 6% contributed to the plan which eligible employees may participate. Eligible employees may participate in the Plan upon the attainment of age 21, and completion of three continuous months of service. Participants may elect to contribute up to 60% of their compensation, subject to maximum statutory limits. The Company’s discretionary contributions to the Plan were approximately $87,000, $12,000 and $1.1 million for the fiscal years ended January 29, 2011, January 30, 2010 and January 31, 2009, respectively.
| 20. | Benefit Plans |
The Company sponsors two qualified pension plans as a result of the Perry Ellis Menswear acquisition that occurred in June 2003. During 2009, the Company modified the valuation date of plan obligations and assets from the end of December to the end of January. The impact of this change was an immaterial increase in expense.
F-30
Table of Contents
The following tables provide a reconciliation of the changes in the plans’ benefit obligations and fair value of assets over the plan years beginning February 1, 2009 and ending January 29, 2011, and a statement of the funded status as of January 29, 2011. The plans were frozen and merged as of December 31, 2003.
| January 29, | January 30, | |||||||
| For the fiscal year ending: |
2011 | 2010 | ||||||
| (in thousands) | ||||||||
| Change in benefit obligation |
||||||||
| Benefit obligation at beginning of plan year |
$ | 40,329 | $ | 37,858 | ||||
| Service cost |
250 | 250 | ||||||
| Interest cost |
2,132 | 2,357 | ||||||
| Actuarial loss (gain) |
679 | 2,973 | ||||||
| Lump sums plus annuities paid |
(3,058 | ) | (3,109 | ) | ||||
| Benefit obligation at end of plan year |
$ | 40,332 | $ | 40,329 | ||||
| Change in plan assets |
||||||||
| Fair value of plan assets at beginning of plan year |
$ | 23,092 | $ | 20,150 | ||||
| Actual return on plan assets |
2,940 | 6,051 | ||||||
| Company contributions |
4,238 | — | ||||||
| Lump sums plus annuities paid |
(3,058 | ) | (3,109 | ) | ||||
| Fair value of plan assets at end of plan year |
$ | 27,212 | $ | 23,092 | ||||
| Unfunded status at end of plan year |
$ | 13,120 | $ | 17,237 | ||||
The net unfunded amount is classified as a long term liability in the caption deferred pension obligation on the consolidated balance sheet. At January 29, 2011, the deferred loss included in accumulated other comprehensive loss was $4.2 million before tax and $2.5 million on an after-tax basis. At January 30, 2010, the deferred loss included in accumulated other comprehensive loss was $4.7 million before tax and $2.9 million on an after-tax basis. At January 31, 2009, the deferred loss included in accumulated other comprehensive loss was $5.3 million before tax and $3.2 million on an after-tax basis.
The following table provides the components of net benefit cost for the plans for the fiscal year ended:
| January 29, | January 30, | January 31, | ||||||||||
| 2011 | 2010 | 2009 | ||||||||||
| (in thousands) | ||||||||||||
| Service cost |
$ | 250 | $ | 250 | $ | 271 | ||||||
| Interest cost |
2,132 | 2,357 | 2,519 | |||||||||
| Expected return on plan assets |
(1,982 | ) | (1,557 | ) | (3,055 | ) | ||||||
| Amortization of unrecognized net loss (gain) |
48 | 66 | (238 | ) | ||||||||
| Net periodic benefit cost |
$ | 448 | $ | 1,116 | $ | (503 | ) | |||||
The prior service costs are amortized on a straight-line basis over the average remaining service period of active participants. Gains and losses in excess of 10% of the greater of the benefit obligation and the market-related value of assets are amortized over the average remaining service period of active participants.
The assumptions used in the measurement of the Company’s benefit obligation are shown in the following table for the plan years ended:
| January 29, | January 30, | |||||||
| 2011 | 2010 | |||||||
| Discount rate |
5.25 | % | 5.50 | % | ||||
| Rate of compensation increase |
N/A | N/A | ||||||
F-31
Table of Contents
The assumptions used in the measurement of the net periodic benefit cost are as follows:
| January 29, | January 30, | |||||||
| 2011 | 2010 | |||||||
| Discount rate |
5.50 | % | 6.00 | % | ||||
| Expected return on plan assets |
8.50 | % | 8.50 | % | ||||
| Rate of compensation increase |
N/A | N/A | ||||||
The pension plan weighted-average asset allocations at January 29, 2011 and January 30, 2010 by asset category are as follows:
| January 29, | January 30, | |||||||
| 2011 | 2010 | |||||||
| Asset category: |
||||||||
| Equity securities |
57.80 | % | 62.80 | % | ||||
| Debt securities |
29.20 | % | 33.40 | % | ||||
| Other |
13.00 | % | 3.80 | % | ||||
| Total |
100.00 | % | 100.00 | % | ||||
The Company’s Investment Committee establishes investment guidelines and strategies, and regularly monitors the performance of the investments. The Company’s investment strategy with respect to pension assets is to invest the assets in accordance with applicable laws and regulations. The long-term primary objectives for the Company’s pension assets are to (1) provide for a reasonable amount of long-term growth of capital, without undue exposure to risk; and protect the assets from erosion of purchasing power, and (2) provide investment results that meet or exceed the plans’ actuarially assumed long-term rate of return.
The fair value of plan assets by asset category is as follows:
| Fair Value Measurements | ||||||||||||||||
| At January 29, 2011 | ||||||||||||||||
| Level 1 | Level 2 | Level 3 | Total | |||||||||||||
| (in thousands) | ||||||||||||||||
| Asset category: |
||||||||||||||||
| Equity securities |
$ | 15,729 | $ | — | $ | — | $ | 15,729 | ||||||||
| Debt securities |
7,946 | — | — | 7,946 | ||||||||||||
| Other |
3,537 | — | — | 3,537 | ||||||||||||
| Total |
$ | 27,212 | $ | — | $ | — | $ | 27,212 | ||||||||
| At January 30, 2010 | ||||||||||||||||
| Level 1 | Level 2 | Level 3 | Total | |||||||||||||
| (in thousands) | ||||||||||||||||
| Asset category: |
||||||||||||||||
| Equity securities |
$ | 14,491 | $ | — | $ | — | $ | 14,491 | ||||||||
| Debt securities |
7,712 | — | — | 7,712 | ||||||||||||
| Other |
889 | — | — | 889 | ||||||||||||
| Total |
$ | 23,092 | $ | — | $ | — | $ | 23,092 | ||||||||
F-32
Table of Contents
The expected future benefit payments are as follows for fiscal years ended:
| Expected Future Benefits Payments |
(in thousands) | |||
| 2012 |
$ | 3,124 | ||
| 2013 |
3,107 | |||
| 2014 |
3,102 | |||
| 2015 |
3,056 | |||
| 2016 |
3,000 | |||
| Thereafter |
14,682 | |||
The Company’s contributions for fiscal 2012 are expected to be approximately $3.1 million. The Company will review the funding status during fiscal 2012 and the incremental funding provisions may change in future periods.
| 21. | Fair Value Measurements |
The carrying amounts of accounts receivable, accounts payable, accrued expenses, and accrued interest payable approximate fair value due to their short-term nature. The carrying amount of the real estate mortgages approximates fair value since they were recently entered into and thus the interest rates approximate market. The carrying amount of the senior credit facility approximates fair value due to the frequent resets of its floating interest rate. As of January 29, 2011 and January 30, 2010, the fair value of the senior subordinated notes payable was approximately $106.3 million and $129.9 million, respectively, based on quoted market prices. These estimated fair value amounts have been determined using available market information.
F-33
Table of Contents
The following tables present the Company’s assets and liabilities that are measured at fair value on a recurring basis and the levels of inputs used to measure fair value.
| Fair Value Measurements | ||||||||||||||||||
| At January 29, 2011 Using | ||||||||||||||||||
| Balance Sheet Location |
Level 1 | Level 2 | Level 3 | Total | ||||||||||||||
| (in thousands) | ||||||||||||||||||
| Liabilities: |
||||||||||||||||||
| Interest rate cap |
Other current liabilities | $ | — | $ | 546 | $ | — | $ | 546 | |||||||||
| Interest rate cap |
Unearned revenues and other long term liabilities | — | 1,286 | — | 1,286 | |||||||||||||
| Total liabilities at fair value |
$ | — | $ | 1,832 | $ | — | $ | 1,832 | ||||||||||
| Fair Value Measurements | ||||||||||||||||||
| At January 30, 2010 Using | ||||||||||||||||||
| Balance Sheet Location |
Level 1 | Level 2 | Level 3 | Total | ||||||||||||||
| (in thousands) | ||||||||||||||||||
| Assets: |
||||||||||||||||||
| Interest rate swap |
Other current assets | $ | — | $ | 1,092 | $ | — | $ | 1,092 | |||||||||
| Interest rate swap |
Other assets | — | 90 | — | 90 | |||||||||||||
| Total assets at fair value |
$ | — | $ | 1,182 | $ | — | $ | 1,182 | ||||||||||
| Liabilities: |
||||||||||||||||||
| Interest rate cap |
Other current liabilities | $ | — | $ | 449 | $ | — | $ | 449 | |||||||||
| Interest rate cap |
Unearned revenues and other long term liabilities | — | 731 | — | 731 | |||||||||||||
| Total liabilities at fair value |
$ | — | $ | 1,180 | $ | — | $ | 1,180 | ||||||||||
See footnote 13 to the consolidated financial statements for disclosures of the accounting designation of the two derivatives in the above table.
| 22. | Related Party Transactions |
The Company leases under certain lease arrangements approximately 66,000 square feet comprised of approximately 16,000 square feet for administrative offices and approximately 50,000 square feet for warehouse distribution. These facilities are in close proximity to the corporate office of the Company, and are owned by the Chairman of the Board of Directors and Chief Executive Officer (“Chairman”). Rent expense, including insurance and taxes, for these leases amounted to approximately $593,000, or $8.98 per square foot, $588,000, or $8.90 per square foot and $670,000, or $10.15 per square foot for the years ended January 29, 2011, January 30, 2010 and January 31, 2009, respectively. At inception of the leases, the Company’s Audit Committee reviewed the terms of the two ten year leases to ensure that they were reasonable and at, or below, market. This review included information from third party sources.
During the years ended January 29, 2011, January 30, 2010 and January 31, 2009, the Company was a party to aircraft charter agreements with third parties, who chartered the aircraft from an entity controlled by the Chairman and the President and Chief Operating Officer (the “President”). There is no minimum usage requirement, and the charter agreement can be terminated with 60 days notice. The Company paid, under these agreements, to these third parties $1.3 million, $1.0 million and $1.0 million for the years ended January 29, 2011, January 30, 2010 and January 31, 2009, respectively. On an annual basis, the Company’s Governance or Audit Committee reviews the terms of the current arrangement to ensure that it is at, or below, market. This review includes information from third party sources.
F-34
Table of Contents
The Company is a party to licensing agreements with Isaco International, Inc. (“Isaco”), pursuant to which Isaco has been granted the exclusive license to use various Perry Ellis trademarks in the United States and Puerto Rico to market a line of men’s underwear, hosiery and loungewear. The principal shareholder of Isaco is the father-in-law of the Company’s President. Royalty income earned from the Isaco license agreements amounted to approximately $2.1 million, $2.0 million and $1.9 million for the years ended January 29, 2011, January 30, 2010 and January 31, 2009, respectively. The Company’s Governance or Audit Committee reviews renewals or extension of the licensing agreements, to ensure that they are consistent with the terms and conditions of other license agreements of the Company.
The Company was party to a licensing agreement with Tropi-Tracks LLC (“Tropi-Tracks”), pursuant to which Tropi-Tracks was granted an exclusive license to use the Jantzen brand name in the United States, Canada, and Mexico to market a line of men’s, women’s and junior’s casual and leisure footwear. Salomon Hanono, one of the former members of the Board of Directors of the Company, whose term expired during fiscal 2009, is a member of Tropi-Tracks. The license was terminated in June 2009, with a six month non-exclusive sell-off period. Royalty income earned from the Tropi-Tracks license agreement amounted to $21,000 and 97,000 for the years ended January 30, 2010 and January 31, 2009, respectively. The Company’s Governance or Audit Committee reviewed renewals or extensions of the licensing agreement, to ensure that they were consistent with the terms and conditions of other license agreements of the Company.
The Company is party to an agreement with Sprezzatura Insurance Group LLC. Joseph Hanono, the son of the Company’s Secretary-Treasurer, is a member of Sprezzatura Insurance Group. The Company paid under this agreement, to this third party $478,000, $448,000 and $366,000 in insurance premiums for property and casualty for the years ended January 29, 2011, January 30, 2010 and January 31, 2009, respectively. On an annual basis, the Company’s Governance or Audit Committee reviews the terms of the current arrangement.
| 23. | Stock Options, Warrants And Restricted Shares |
Stock Options – In 1993, the Company adopted the 1993 Stock Option Plan (the “1993 Plan”), which was amended in 1998 and 1999 to increase the number of shares reserved for issuance thereunder. As amended, the 1993 Plan authorized the Company to grant stock options (“Option” or “Options”) to purchase up to an aggregate of 1,500,000 shares of the Company’s common stock. In 2002, prior to the termination of the 1993 Plan in 2003, the Company adopted the 2002 Stock Option Plan (the “2002 Plan”). The 2002 Plan was amended in 2003 to increase the number of shares reserved for issuance thereunder, among other changes. As amended, the 2002 Plan allowed the Company to grant Options to purchase up to an aggregate of 1,500,000 shares of the Company’s common stock. In 2005, the Company adopted the 2005 Long-Term Incentive Compensation Plan (the “2005 Plan”, and collectively with the 1993 Plan and the 2002 Plan, the “Stock Option Plans”). The 2005 Plan allows the Company to grant Options and other awards to purchase or receive up to an aggregate of 2,250,000 shares of the Company’s common stock, reduced by any awards outstanding under the 2002 Plan. On March 13, 2008, the Board of Directors unanimously adopted, subject to shareholder approval at the Annual Meeting, an amendment and restatement of the 2005 Plan that increases the number of shares available for grants by an additional 2,250,000 shares to an aggregate of 4,750,000 shares of common stock. The amendment was approved by the shareholders at the 2008 Annual Meeting. All Stock Option Plans are designed to serve as an incentive for attracting and retaining qualified and competent employees, directors, consultants, and independent contractors of the Company.
The 2005 Plan provides for the granting of Incentive Stock Options and Nonstatutory Stock Options. An Incentive Stock Option is an option to purchase common stock, which meets the requirements as set forth under Section 422 of the Internal Revenue Code of 1986, as amended (“Section 422”). A Nonstatutory Stock Option is an option to purchase common stock, which meets the requirements of the 2005 Plan, but does not meet the definition of an “incentive stock option” under Section 422.
F-35
Table of Contents
The 2005 Plan is administered by the Compensation Committee of the Board of Directors (the “Committee”), which is comprised of two or more non-employee directors. The Committee determines the participants, the allotment of shares, and the term of the options. The Committee also determines the exercise price of the options; provided, however that the per share exercise price of options granted under the 2005 Plan may not be less than the fair market value of the common stock on the date of grant, and in the case of an incentive stock option granted to a 10% shareholder, the per share exercise price will not be less than 110% of such fair market value.
The following table lists information regarding shares under the 1993 Plan, 2002 Plan and 2005 Plan as of January 29, 2011:
| Shares Underlying Outstanding Grants |
Unvested Restricted Shares |
Shares Available for Grant |
||||||||||
| 1993 Stock Option Plan |
460,000 | — | — | |||||||||
| 2002 Stock Option Plan |
178,803 | — | — | |||||||||
| 2005 Stock Option Plan |
1,078,523 | 926,009 | 840,431 | |||||||||
| 1,717,326 | 926,009 | 840,431 | ||||||||||
During fiscal 2011, the Company granted SARS to purchase shares of common stock to certain key employees. The Company awarded an aggregate of 258,879 SARS with exercise prices ranging from $24.34 to $30.00, which generally vest over a three year period and have a seven year term. The total fair value of the SARS, based on the Black-Scholes Option Pricing Model, amounted to approximately $3.5 million, which will be recorded as compensation expense on a straight-line basis over the vesting period of each SARS.
In addition, the Company awarded to a director 3,720 SARs with an exercise price of $25.60, which vest over a three year period and have a seven year term. The total fair value of the SARs, based on the Black-Scholes Option Pricing Model, amounted to approximately $50,000, which will be recorded as compensation expense on a straight-line basis over the vesting period.
F-36
Table of Contents
A summary of the stock option and SARS activity for grants issued under the 1993 Plan, 2002 Plan and 2005 Plan is as follows for the years ended:
| Option and SARS Price Per Share | ||||||||||||||||||||||||||||
| Weighted Average | Aggregate | |||||||||||||||||||||||||||
| Number | Weighted Average | Remaining | Intrinsic Value | |||||||||||||||||||||||||
| of Shares | Low | High | Weighted | Exercise Price | Contractual Life | (in thousands) | ||||||||||||||||||||||
| Outstanding February 1, 2008 |
1,868,066 | $ | 10.01 | 3.39 | $ | 14,656 | ||||||||||||||||||||||
| Vested or expected to vest |
1,868,066 | $ | 10.01 | 3.39 | $ | 14,656 | ||||||||||||||||||||||
| Options Exercisable |
1,746,319 | $ | 9.28 | 3.04 | $ | 14,505 | ||||||||||||||||||||||
| Granted |
13,197 | $ | 17.27 | $ | 22.76 | $ | 19.39 | |||||||||||||||||||||
| Exercised |
(381,648 | ) | $ | 5.88 | $ | 17.97 | $ | 9.99 | ||||||||||||||||||||
| Cancelled |
(24,650 | ) | $ | 12.77 | $ | 33.25 | $ | 16.03 | ||||||||||||||||||||
| Outstanding January 31, 2009 |
1,474,965 | $ | 10.00 | 3.17 | $ | 10 | ||||||||||||||||||||||
| Vested or expected to vest |
1,474,965 | $ | 10.00 | 3.17 | $ | 10 | ||||||||||||||||||||||
| Options Exercisable |
1,397,076 | $ | 9.34 | 2.90 | $ | 10 | ||||||||||||||||||||||
| Granted |
1,187,026 | $ | 4.53 | $ | 15.38 | $ | 4.75 | |||||||||||||||||||||
| Exercised |
(80,202 | ) | $ | 3.46 | $ | 13.39 | $ | 7.92 | ||||||||||||||||||||
| Cancelled |
(671,323 | ) | $ | 4.63 | $ | 27.16 | $ | 6.96 | ||||||||||||||||||||
| Outstanding January 30, 2010 |
1,910,466 | $ | 7.90 | 6.85 | $ | 16,128 | ||||||||||||||||||||||
| Vested or expected to vest |
1,910,466 | $ | 7.90 | 6.85 | $ | 16,128 | ||||||||||||||||||||||
| Options Exercisable |
749,160 | $ | 11.77 | 3.41 | $ | 3,484 | ||||||||||||||||||||||
| Granted |
262,599 | $ | 24.34 | $ | 30.00 | $ | 25.30 | |||||||||||||||||||||
| Exercised |
(427,030 | ) | $ | 4.53 | $ | 17.27 | $ | 6.27 | ||||||||||||||||||||
| Cancelled |
(28,709 | ) | $ | 4.89 | $ | 25.60 | $ | 16.33 | ||||||||||||||||||||
| Outstanding January 29, 2011 |
1,717,326 | $ | 10.81 | 5.62 | $ | 30,208 | ||||||||||||||||||||||
| Vested or expected to vest |
1,717,326 | $ | 10.81 | 5.62 | $ | 30,208 | ||||||||||||||||||||||
| Options and SARS Exercisable |
711,616 | $ | 11.79 | 2.68 | $ | 11,816 | ||||||||||||||||||||||
The aggregate intrinsic value for stock options and SARS in the preceding table represents the total pre-tax intrinsic value based on the Company’s closing stock price of $28.37, $16.03, and $3.84 at January 29, 2011, January 30, 2010 and January 31, 2009, respectively. This amount represents the total pre-tax intrinsic value that would have been received by the holders of the stock-based awards had the awards been exercised and sold as of that date. The total intrinsic value of stock options and SARS exercised in fiscal 2011, 2010 and 2009 was approximately $7.7 million, $0.6 million and $4.4 million, respectively. The total fair value of stock options and SARS vested in fiscal 2011, 2010 and 2009 was approximately $1.3 million, $0.3 million and $0.5 million, respectively.
F-37
Table of Contents
Additional information regarding options and SARS outstanding and exercisable as of January 29, 2011, is as follows:
| Options and SARS Outstanding | Options and SARS Exercisable | |||||||||||||||||||||
| Weighted | ||||||||||||||||||||||
| Average | ||||||||||||||||||||||
| Remaining | Weighted | Weighted | ||||||||||||||||||||
| Range of Exercise Prices |
Number | Contractual Life | Average | Number | Average | |||||||||||||||||
| Outstanding | (in years) | Exercise Price | Exercisable | Exercise Price | ||||||||||||||||||
| $ | 4.00 - $ 6.00 | 764,815 | 8.13 | $ | 4.65 | 27,970 | $ | 4.80 | ||||||||||||||
| $ | 6.01 - $14.00 | 490,804 | 1.94 | $ | 9.66 | 490,804 | $ | 9.66 | ||||||||||||||
| $ | 14.01 - $21.00 | 168,109 | 3.63 | $ | 16.54 | 158,940 | $ | 16.51 | ||||||||||||||
| $ | 21.01 - $31.00 | 293,598 | 6.39 | $ | 25.48 | 33,902 | $ | 11.79 | ||||||||||||||
| 1,717,326 | 711,616 | |||||||||||||||||||||
Restricted Stock – Under the 2005 Plan, restricted stock awards shall be granted subject to restrictions on transferability, risk of forfeiture and other restrictions, if any, as the Committee may impose, or as otherwise provided in the 2005 Plan, covering a period of time specified by the Committee. The terms of any restricted stock awards granted under the 2005 Plan shall be set forth in a written Award Agreement which shall contain provisions determined by the Committee and not inconsistent with the 2005 Plan. The restrictions may lapse separately or in combination at such times, under such circumstances (including based on achievement of performance goals and/or future service requirements), in such installments or otherwise, as the Committee may determine at the date of grant or thereafter. Except to the extent restricted under the terms of the 2005 Plan and any Award Agreement relating to a restricted stock award, a participant granted restricted stock shall have all of the rights of a shareholder, including the right to vote the restricted stock and the right to receive dividends thereon (subject to any mandatory reinvestment or other requirement imposed by the Committee). During the Restriction Period (as defined in the 2005 Plan), the restricted stock may not be sold, transferred, pledged, hypothecated, margined or otherwise encumbered by the participant.
During fiscal 2011, the Company granted performance based restricted stock to certain key employees pursuant to the Company’s 2005 Long Term Incentive Compensation Plan, as amended, and subject to certain conditions in the grant agreement. Such stock generally vests 100% in April 2013, provided that each employee is still an employee of the Company on such date, and the Company has met certain performance criteria. A total of 40,704 shares of restricted stock were issued at an estimated value of $1.0 million. Additionally, the Company granted an aggregate of 38,034 shares of restricted stock to certain key employees, with an estimated value of $0.8 million, which vests over a three year period. These grants will be recorded as compensation expense on a straight-line basis over the vesting period.
Also, during fiscal 2011, the Company awarded to five directors 13,309 shares of restricted stock, which vest over a three year period at an estimated value of $0.3 million. This value will be recorded as compensation expense on a straight-line basis over the vesting period of the restricted stock.
During fiscal 2010, the Company awarded one employee 10,000 shares of restricted stock, which vest over a four year period at an estimated value of $42,000. This value will be recorded as compensation expense on a straight-line basis over the vesting period of the restricted stock. Also, during fiscal 2010 the Company awarded five directors an aggregate of 32,765 shares of restricted stock, which vest over a three year period at an estimated value of $250,000.
The Company amended the employment agreement with its Chairman of the Board of Directors and Chief Executive Officer to grant up to 375,000 shares of performance based restricted stock, which are subject to certain conditions in the grant agreement. Such stock generally vests 100% on his 80th birthday, provided that he is still an employee of the Company on such date, and the Company has met certain performance criteria. In February 2008, 300,000 shares of restricted stock were issued at an estimated value of $5.4 million. In September 2008, 75,000 shares of restricted stock were issued at an estimated value of $1.4 million.
F-38
Table of Contents
The Company amended the employment agreement with its President and Chief Operating Officer to grant up to 375,000 shares of performance based restricted stock, which are subject to certain conditions in the grant agreement. Such stock generally vests 100% on his 60th birthday, provided that he is still an employee of the Company on such date, and the Company has met certain performance criteria. In February 2008, 300,000 shares of restricted stock were issued at an estimated value of $5.4 million. In September 2008, 75,000 shares of restricted stock were issued at an estimated value of $1.4 million.
The Company granted performance based restricted stock to certain key employees pursuant to the Company’s 2005 Long Term Incentive Compensation Plan, and subject to certain conditions in the grant agreement. Such stock generally vests 100% on February 1, 2013, provided that each employee is still an employee of the Company on such date, and the Company has met certain performance criteria. In October 2008, 75,250 shares of restricted stock were issued to 23 employees at an estimated value of $1.1 million.
During fiscal 2009, the Company awarded seven directors an aggregate 18,900 shares of restricted stock, which generally vest over a three year period. The total fair value of the restricted shares amounted to approximately $350,000. Also, in fiscal 2009 the Company awarded one employee an aggregate of 5,000 shares of restricted stock, which generally vest over a five year period. The total fair value of the restricted shares amounted to approximately $109,000.
The values of the restricted stock will be recorded as compensation expense on a straight-line basis over the vesting period of the restricted shares. The fair value of restricted stock grants is estimated on the date of grant and is generally equal to the closing stock price of the Company’s common stock on the date of grant.
As of January 29, 2011, the total unrecognized compensation cost related to unvested stock options outstanding under the Stock Option Plans is approximately $3.9 million. That cost is expected to be recognized over a weighted-average period of 2 years. As of January 29, 2011, the total unrecognized compensation cost related to unvested time-based restricted stock was approximately $11.6 million which is expected to be recognized over a weighted-average period of 6 years.
The following table summarizes the restricted stock-based award activity for the years:
| Weighted | ||||||||||||
| Weighted | Average | |||||||||||
| Restricted | Average | Remaining | ||||||||||
| Shares | Grant Price | Vesting Period | ||||||||||
| Unvested as of February 1, 2008 |
43,183 | $ | 22.31 | 3.13 | ||||||||
| Granted |
849,150 | |||||||||||
| Vested |
(15,182 | ) | ||||||||||
| Forfeited |
(8,600 | ) | ||||||||||
| Unvested as of January 31, 2009 |
868,551 | $ | 17.99 | 8.06 | ||||||||
| Granted |
42,765 | |||||||||||
| Vested |
(26,803 | ) | ||||||||||
| Forfeited |
(24,475 | ) | ||||||||||
| Unvested as of January 30, 2010 |
860,038 | $ | 16.62 | 7.05 | ||||||||
| Granted |
92,047 | |||||||||||
| Vested |
(22,392 | ) | ||||||||||
| Forfeited |
(3,684 | ) | ||||||||||
| Unvested as of January 29, 2011 |
926,009 | $ | 18.22 | 5.92 | ||||||||
F-39
Table of Contents
| 24. | Segment Information |
The Company’s principal segments are grouped between the generation of revenues from products and royalties. The Licensing segment derives its revenues from royalties associated from the use of its brand names, principally Perry Ellis, Jantzen, John Henry, Original Penguin, Gotcha, Farah, Savane, Pro Player, Manhattan and Munsingwear. The Product segment derives its revenues from the design, import and distribution of apparel to department stores and other retail outlets, principally throughout the United States. See footnote 2 to the consolidated financial statements for disclosure of major customers.
The Company allocates certain corporate selling general and administrative expenses based primarily on the revenues generated by the segments.
| January 29, | January 30, | January 31, | ||||||||||
| 2011 | 2010 | 2009 | ||||||||||
| (in thousands) | ||||||||||||
| Revenues: |
||||||||||||
| Product |
$ | 763,884 | $ | 729,217 | $ | 825,868 | ||||||
| Licensing |
26,404 | 24,985 | 25,429 | |||||||||
| Total Revenues |
$ | 790,288 | $ | 754,202 | $ | 851,297 | ||||||
| Operating Income (Loss) |
||||||||||||
| Product |
$ | 27,319 | $ | 13,468 | $ | 6,228 | ||||||
| Licensing |
22,519 | 21,395 | (1,900 | ) | ||||||||
| Total Operating Income |
$ | 49,838 | $ | 34,863 | $ | 4,328 | ||||||
| Interest Expense |
||||||||||||
| Product |
$ | 6,380 | $ | 7,724 | $ | 8,623 | ||||||
| Licensing |
6,823 | 9,647 | 8,868 | |||||||||
| Total Interest Expense |
$ | 13,203 | $ | 17,371 | $ | 17,491 | ||||||
| Depreciation and Amortization |
||||||||||||
| Product |
$ | 11,814 | $ | 13,159 | $ | 14,304 | ||||||
| Licensing |
397 | 466 | 480 | |||||||||
| Total Depreciation and Amortization |
$ | 12,211 | $ | 13,625 | $ | 14,784 | ||||||
| Net Income (Loss) Before Income Taxes |
||||||||||||
| Product |
$ | 20,697 | $ | 5,634 | $ | (5,192 | ) | |||||
| Licensing |
15,208 | 11,501 | (10,768 | ) | ||||||||
| Total Net (Loss) Income Before Income Taxes |
$ | 35,905 | $ | 17,135 | $ | (15,960 | ) | |||||
| Identifiable Assets |
||||||||||||
| Product |
$ | 399,773 | $ | 311,516 | ||||||||
| Licensing |
249,329 | 209,042 | ||||||||||
| Corporate |
36,628 | 40,758 | ||||||||||
| Total Identifiable Assets |
$ | 685,730 | $ | 561,316 | ||||||||
F-40
Table of Contents
Revenues from external customers and long-lived assets excluding deferred taxes related to continuing operations in the United States and foreign countries are as follows:
| January 29, 2011 |
January 30, 2010 |
January 31, 2009 |
||||||||||
| (in thousands) | ||||||||||||
| Revenues |
||||||||||||
| United States |
$ | 721,998 | $ | 693,398 | $ | 785,643 | ||||||
| International |
68,290 | 60,804 | 65,654 | |||||||||
| Total revenues |
$ | 790,288 | $ | 754,202 | $ | 851,297 | ||||||
| January 29, 2011 |
January 30, 2010 |
|||||||
| (in thousands) | ||||||||
| Long-lived assets at years ended, |
||||||||
| United States |
$ | 270,680 | $ | 215,774 | ||||
| International |
47,044 | 45,008 | ||||||
| Total long-lived assets |
$ | 317,724 | $ | 260,782 | ||||
| 25. | Commitments and Contingencies |
The Company has licensing agreements, as licensee, for the use of certain branded and designer labels. The license agreements expire on varying dates through June 2015. Total royalty payments under these license agreements amounted to approximately $10.4 million, $9.2 million and $9.1 million for the years ended January 29, 2011, January 30, 2010, January 31, 2009, respectively, and were classified as cost of sales. Under certain licensing agreements, the Company has to pay certain guaranteed minimum payments. Future minimum payments under these contracts amount to $22.9 million.
The Company leases two warehouse facilities, one of which includes office space, in Miami, Florida totaling approximately 66,000 square feet from its Chairman, to handle specialty operations. The leases expire in July 2014. The aggregate annual base payment for these leases is approximately $524,000.
F-41
Table of Contents
The Company leases several locations for offices, showrooms and retail stores throughout the United States. Lease terms generally range from approximately 3 to 10 years, including anticipated renewal options. The leases generally provide for minimum annual rental payments and are subject to escalations based upon increases in the consumer price index, contractual base rent increases, real estate taxes and other costs. In addition, certain leases contain contingent rental provisions based upon the sales of the underlying retail stores. Certain leases also provide for rent deferral during the initial term of such lease, landlord contributions, and/or scheduled minimum rent increases during the terms of the leases. For financial reporting purposes, rent expense associated with operating leases is recorded on a straight-line basis over the life of the lease. These leases expire through 2021. Minimum aggregate annual commitments for the Company’s non-cancelable unrelated operating lease commitments are as follows:
| Year Ending |
Amount | |||
| (in thousands) | ||||
| 2012 |
$ | 15,814 | ||
| 2013 |
15,337 | |||
| 2014 |
9,820 | |||
| 2015 |
8,524 | |||
| 2016 |
7,743 | |||
| Thereafter |
12,323 | |||
| Total |
$ | 69,561 | ||
Rent expense for these operating leases, including the related party rent payments discussed in footnote 22 to the consolidated financial statements amounted to $14.1 million, $14.5 million, and $13.8 million for the years ended January 29, 2011, January 30, 2010, January 31, 2009, respectively.
Capital lease obligations primarily relate to equipment as indicated in footnote 8 to the consolidated financial statements. The current portion of the capital lease obligation in the amount of $379,000 is included in accrued expenses and other liabilities, while the long term portion of $159,000 is included in unearned revenues and other long term liabilities. Minimum aggregate annual commitments for the Company’s capital lease obligations are as follows:
| Year Ending |
Amount | |||
| (in thousands) | ||||
| 2012 |
$ | 379 | ||
| 2013 |
159 | |||
| Total |
$ | 538 | ||
The Company renewed its employment agreement with the Chairman of the Board of Directors and Chief Executive Officer during fiscal 2006. The base salary, which was subject to annual increases, was $0.9 million per year through the remainder of the agreement. During February 2008, the employment agreement was amended, to extend the expiration date to January 2013, increase the base salary to at least $1.0 million and grant up to 375,000 performance based restricted shares, which are subject to certain conditions in the employment agreement.
The Company renewed its employment agreement with the President and Chief Operating Officer during fiscal 2006. The base salary, which was subject to annual increases, was $0.8 million for the first year and $0.9 million per year through the remainder of the agreement. During February 2008, the employment agreement was amended, to extend the expiration date to January 2013, increase the base salary to at least $1.0 million and grant up to 375,000 performance based restricted shares, which are subject to certain conditions in the employment agreement.
The Company is, from time to time, a party to litigation that arises in the normal course of its business operations. The Company is not presently a party to any litigation that it believes might have a material adverse effect on its business operations.
F-42
Table of Contents
| 26. | Summarized Quarterly Financial Data (Unaudited) |
| First | Second | Third | Fourth | Total | ||||||||||||||||
| Quarter | Quarter | Quarter | Quarter | Year | ||||||||||||||||
| (Dollars in thousands, except per share data) | ||||||||||||||||||||
| FISCAL YEAR ENDED JANUARY 29, 2011 |
||||||||||||||||||||
| Net Sales |
$ | 214,242 | $ | 155,622 | $ | 194,856 | $ | 199,164 | $ | 763,884 | ||||||||||
| Royalty Income |
6,107 | 6,132 | 6,421 | 7,744 | 26,404 | |||||||||||||||
| Total Revenues |
220,349 | 161,754 | 201,277 | 206,908 | 790,288 | |||||||||||||||
| Gross Profit |
78,744 | 58,153 | 71,587 | 73,975 | 282,459 | |||||||||||||||
| Net income (loss) |
11,376 | (1,888 | ) | 7,313 | 7,711 | 24,512 | ||||||||||||||
| Net income (loss) attributed to Perry Ellis International, Inc. |
11,199 | (1,973 | ) | 7,175 | 7,711 | 24,112 | ||||||||||||||
| Net income (loss) attributed to Perry Ellis International, Inc. per share: |
||||||||||||||||||||
| Basic |
$ | 0.87 | ($0.15 | ) | $ | 0.54 | $ | 0.58 | $ | 1.84 | ||||||||||
| Diluted |
$ | 0.81 | ($0.15 | ) | $ | 0.51 | $ | 0.54 | $ | 1.70 | ||||||||||
| FISCAL YEAR ENDED JANUARY 30, 2010 |
||||||||||||||||||||
| Net Sales |
$ | 214,038 | $ | 152,980 | $ | 172,154 | $ | 190,045 | $ | 729,217 | ||||||||||
| Royalty Income |
6,006 | 6,189 | 6,397 | 6,393 | 24,985 | |||||||||||||||
| Total Revenues |
220,044 | 159,169 | 178,551 | 196,438 | 754,202 | |||||||||||||||
| Gross Profit |
69,234 | 49,208 | 60,987 | 69,669 | 249,098 | |||||||||||||||
| Net income (loss) |
5,792 | (5,154 | ) | 4,306 | 8,576 | 13,520 | ||||||||||||||
| Net income (loss) attributed to Perry Ellis International, Inc. |
5,849 | (5,308 | ) | 4,138 | 8,488 | 13,167 | ||||||||||||||
| Net income (loss) attributed to Perry Ellis International, Inc. per share: |
||||||||||||||||||||
| Basic |
$ | 0.46 | ($0.42 | ) | $ | 0.33 | $ | 0.67 | $ | 1.04 | ||||||||||
| Diluted |
$ | 0.46 | ($0.42 | ) | $ | 0.31 | $ | 0.64 | $ | 1.01 | ||||||||||
| FISCAL YEAR ENDED JANUARY 31, 2009 |
||||||||||||||||||||
| Net Sales |
$ | 237,762 | $ | 187,404 | $ | 216,232 | $ | 184,470 | $ | 825,868 | ||||||||||
| Royalty Income |
5,787 | 6,295 | 6,583 | 6,764 | 25,429 | |||||||||||||||
| Total Revenues |
243,549 | 193,699 | 222,815 | 191,234 | 851,297 | |||||||||||||||
| Gross Profit |
84,567 | 62,237 | 75,900 | 55,547 | 278,251 | |||||||||||||||
| Net income (loss) |
9,434 | (5,379 | ) | 5,237 | (21,570 | ) | (12,278 | ) | ||||||||||||
| Net income (loss) attributed to Perry Ellis International, Inc. |
9,107 | (5,379 | ) | 4,999 | (21,617 | ) | (12,890 | ) | ||||||||||||
| Net income (loss) attributed to Perry Ellis International, Inc. per share: |
||||||||||||||||||||
| Basic |
$ | 0.63 | ($0.36 | ) | $ | 0.34 | ($1.58 | ) | ($0.89 | ) | ||||||||||
| Diluted |
$ | 0.60 | ($0.36 | ) | $ | 0.33 | ($1.58 | ) | ($0.89 | ) | ||||||||||
See footnotes 2 and 9 to the consolidated financial statements for further information regarding the impairment on long-lived assets, which occurred during the fourth quarter ended January 31, 2009.
| 27. | Subsequent Events |
On March 2, 2011 the Company entered into underwriting agreements with Merrill Lynch, Pierce, Fenner & Smith Incorporated and Deutsche Bank Securities Inc., as representatives of the underwriters that are parties thereto (the “Underwriting Agreements”) in connection with the common stock and senior subordinated note offerings.
Pursuant to the Underwriting Agreement relating to the common stock offering, the Company agreed to sell, and the underwriters agreed to purchase, 2.0 million shares of the Company’s common stock at a price to the public of $28.00 per share and an underwriting discount of $1.40 per share, resulting in net proceeds to the Company before offering expenses of $26.60 per share, or $53.2 million in aggregate net proceeds to the Company. The Company used the net proceeds from the common stock offering to repay a portion of the amounts outstanding under its senior credit facility.
F-43
Table of Contents
Pursuant to the Underwriting Agreement relating to the senior subordinated notes offering, the Company agreed to sell, and the underwriters agreed to purchase, $150 million in aggregate principal amount of the Company’s 77/8% Senior Subordinated Notes Due 2019 at a price to the public of 100.00% of par and an underwriting discount of 2.0%, resulting in aggregate net proceeds to the Company of $147.0 million. The Company used the net proceeds of the senior subordinated notes offering first to redeem its outstanding 87/8% Senior Subordinated Notes Due 2013 at a redemption price of 101.4792% of the outstanding principal amount, plus accrued and unpaid interest, and the remaining net proceeds to repay a portion of the amounts outstanding under its senior credit facility. The Company will write-off the remaining unamortized discount and bond fees associated with the senior subordinated notes.
In connection with the redemption of the 8 7/ 8% Senior Subordinated Notes Due 2013, the Company elected to terminate the $75 million Cap Agreement. The $75 million Cap Agreement was being used to manage cash flow risk associated with the Company’s floating interest rate exposure pursuant to the Swap Agreement. The Company made a $1.6 million termination payment during March 2011.
| 28. | Consolidating Condensed Financial Statements |
The Company and several of its subsidiaries (the “Guarantors”) have fully and unconditionally guaranteed the senior subordinated notes on a joint and several basis. The following are consolidating condensed financial statements, which present, in separate columns: Perry Ellis International, Inc., (Parent Only), the Guarantors on a combined, or where appropriate, consolidated basis, and the Non-Guarantors on a consolidated basis. Additional columns present eliminating adjustments and consolidated totals as of January 29, 2011 and January 30, 2010 and for each of the years ended January 29, 2011, January 30, 2010 and January 31, 2009. The combined Guarantors are 100% owned subsidiaries of Perry Ellis International, Inc., and have fully and unconditionally guaranteed the senior subordinated notes payable on a joint and several basis. The Company has not presented separate financial statements and other disclosures concerning the combined Guarantors because management has determined that such information is not material to investors.
F-44
Table of Contents
PERRY ELLIS INTERNATIONAL, INC. AND SUBSIDIARIES
CONSOLIDATING CONDENSED BALANCE SHEETS
AS OF JANUARY 29, 2011
(amounts in thousands)
| Parent Only | Guarantors | Non- Guarantors |
Eliminations | Consolidated | ||||||||||||||||
| ASSETS |
||||||||||||||||||||
| Current Assets: |
||||||||||||||||||||
| Cash and cash equivalents |
$ | — | $ | — | $ | 19,174 | $ | (650 | ) | $ | 18,524 | |||||||||
| Restricted cash |
— | 9,369 | — | — | 9,369 | |||||||||||||||
| Accounts receivable, net |
— | 72,765 | 56,769 | — | 129,534 | |||||||||||||||
| Intercompany receivable |
89,317 | — | — | (89,317 | ) | — | ||||||||||||||
| Inventories |
— | 160,923 | 17,294 | — | 178,217 | |||||||||||||||
| Other current assets |
13,421 | 23,272 | 4,210 | (13,487 | ) | 27,416 | ||||||||||||||
| Total current assets |
102,738 | 266,329 | 97,447 | (103,454 | ) | 363,060 | ||||||||||||||
| Property and equipment, net |
— | 51,303 | 3,774 | — | 55,077 | |||||||||||||||
| Intangible assets |
— | 219,047 | 43,600 | — | 262,647 | |||||||||||||||
| Investment in subsidiaries |
302,387 | — | — | (302,387 | ) | — | ||||||||||||||
| Other assets |
3,036 | 1,839 | 71 | — | 4,946 | |||||||||||||||
| TOTAL |
$ | 408,161 | $ | 538,518 | $ | 144,892 | $ | (405,841 | ) | $ | 685,730 | |||||||||
| LIABILITIES AND EQUITY |
||||||||||||||||||||
| Current Liabilities: |
||||||||||||||||||||
| Accounts payable, accrued expenses and other current liabilities |
$ | — | $ | 114,685 | $ | 14,677 | $ | (16,640 | ) | $ | 112,722 | |||||||||
| Intercompany payable - Parent |
— | 8,114 | 82,591 | (90,705 | ) | — | ||||||||||||||
| Total current liabilities |
— | 122,799 | 97,268 | (107,345 | ) | 112,722 | ||||||||||||||
| Notes payable and senior credit facility |
105,221 | 97,342 | — | — | 202,563 | |||||||||||||||
| Other long-term liabilities |
— | 58,022 | 6,980 | 2,503 | 67,505 | |||||||||||||||
| Total long-term liabilities |
105,221 | 155,364 | 6,980 | 2,503 | 270,068 | |||||||||||||||
| Total liabilities |
105,221 | 278,163 | 104,248 | (104,842 | ) | 382,790 | ||||||||||||||
| Equity |
302,940 | 260,355 | 40,644 | (300,999 | ) | 302,940 | ||||||||||||||
| TOTAL |
$ | 408,161 | $ | 538,518 | $ | 144,892 | $ | (405,841 | ) | $ | 685,730 | |||||||||
F-45
Table of Contents
PERRY ELLIS INTERNATIONAL, INC. AND SUBSIDIARIES
CONSOLIDATING CONDENSED BALANCE SHEETS
AS OF JANUARY 30, 2010
(amounts in thousands)
| Parent Only | Guarantors | Non- Guarantors |
Eliminations | Consolidated | ||||||||||||||||
| ASSETS |
||||||||||||||||||||
| Current Assets: |
||||||||||||||||||||
| Cash and cash equivalents |
$ | — | $ | 8,313 | $ | 12,459 | $ | (2,503 | ) | $ | 18,269 | |||||||||
| Accounts receivable, net |
377 | 104,411 | 35,146 | — | 139,934 | |||||||||||||||
| Intercompany receivable - Guarantors |
63,759 | — | — | (63,759 | ) | — | ||||||||||||||
| Inventories |
— | 100,167 | 12,148 | — | 112,315 | |||||||||||||||
| Other current assets |
15,389 | 18,319 | 6,671 | (15,557 | ) | 24,822 | ||||||||||||||
| Total current assets |
79,525 | 231,210 | 66,424 | (81,819 | ) | 295,340 | ||||||||||||||
| Property and equipment, net |
10,558 | 46,272 | 3,637 | — | 60,467 | |||||||||||||||
| Intangible assets, net |
— | 156,715 | 43,600 | — | 200,315 | |||||||||||||||
| Investment in subsidiaries |
278,275 | — | — | (278,275 | ) | — | ||||||||||||||
| Other |
3,729 | 1,394 | 71 | — | 5,194 | |||||||||||||||
| TOTAL |
$ | 372,087 | $ | 435,591 | $ | 113,732 | $ | (360,094 | ) | $ | 561,316 | |||||||||
| LIABILITIES AND STOCKHOLDERS’ EQUITY |
||||||||||||||||||||
| Current Liabilities: |
||||||||||||||||||||
| Accounts payable, accrued expenses and other current liabilities |
$ | 15,786 | $ | 97,326 | $ | 12,477 | $ | (18,305 | ) | $ | 107,284 | |||||||||
| Intercompany payable - Parent |
— | 10,369 | 57,102 | (67,471 | ) | — | ||||||||||||||
| Total current liabilities |
15,786 | 107,695 | 69,579 | (85,776 | ) | 107,284 | ||||||||||||||
| Notes payable and senior credit facility |
88,620 | 41,250 | — | — | 129,870 | |||||||||||||||
| Other long-term liabilities |
1,225 | 42,619 | 7,967 | 2,235 | 54,046 | |||||||||||||||
| Total long-term liabilities |
89,845 | 83,869 | 7,967 | 2,235 | 183,916 | |||||||||||||||
| Total liabilities |
105,631 | 191,564 | 77,546 | (83,541 | ) | 291,200 | ||||||||||||||
| Total Perry Ellis International, Inc. stockholders’ equity |
266,456 | 244,027 | 32,526 | (276,553 | ) | 266,456 | ||||||||||||||
| Noncontrolling interest |
— | — | 3,660 | — | 3,660 | |||||||||||||||
| Equity |
266,456 | 244,027 | 36,186 | (276,553 | ) | 270,116 | ||||||||||||||
| TOTAL |
$ | 372,087 | $ | 435,591 | $ | 113,732 | $ | (360,094 | ) | $ | 561,316 | |||||||||
F-46
Table of Contents
PERRY ELLIS INTERNATIONAL, INC. AND SUBSIDIARIES
CONSOLIDATING CONDENSED STATEMENTS OF OPERATIONS
FOR THE YEAR ENDED JANUARY 29, 2011
(amounts in thousands)
| Parent Only | Guarantors | Non- Guarantors |
Eliminations | Consolidated | ||||||||||||||||
| Revenue |
$ | — | $ | 695,878 | $ | 94,410 | $ | — | $ | 790,288 | ||||||||||
| Gross profit |
— | 237,518 | 44,941 | — | 282,459 | |||||||||||||||
| Impairment on long-lived assets |
— | 392 | — | — | 392 | |||||||||||||||
| Operating income |
— | 42,722 | 7,116 | — | 49,838 | |||||||||||||||
| Costs on early extinguishment of debt |
— | 730 | — | — | 730 | |||||||||||||||
| Interest, noncontrolling interest and income taxes |
— | 26,004 | (1,008 | ) | — | 24,996 | ||||||||||||||
| Equity in earnings of subsidiaries, net |
24,112 | — | — | (24,112 | ) | — | ||||||||||||||
| Net income attributed to Perry Ellis International, Inc. |
24,112 | 15,988 | 8,124 | (24,112 | ) | 24,112 | ||||||||||||||
PERRY ELLIS INTERNATIONAL, INC. AND SUBSIDIARIES
CONSOLIDATING CONDENSED STATEMENTS OF OPERATIONS
FOR THE YEAR ENDED JANUARY 30, 2010
(amounts in thousands)
| Parent Only | Guarantors | Non- Guarantors |
Eliminations | Consolidated | ||||||||||||||||
| Revenue |
$ | — | $ | 673,171 | $ | 81,031 | $ | — | $ | 754,202 | ||||||||||
| Gross profit |
— | 214,044 | 35,054 | — | 249,098 | |||||||||||||||
| Impairment on long-lived assets |
— | 254 | — | — | 254 | |||||||||||||||
| Operating income (loss) |
— | 36,945 | (2,082 | ) | — | 34,863 | ||||||||||||||
| Costs on early extinguishment of debt |
— | 357 | — | — | 357 | |||||||||||||||
| Interest, noncontrolling interest and income taxes |
1,646 | 21,082 | (1,389 | ) | — | 21,339 | ||||||||||||||
| Equity in earnings of subsidiaries, net |
14,813 | — | — | (14,813 | ) | — | ||||||||||||||
| Net income (loss) attributed to Perry Ellis International, Inc. |
13,167 | 15,506 | (693 | ) | (14,813 | ) | 13,167 | |||||||||||||
PERRY ELLIS INTERNATIONAL, INC. AND SUBSIDIARIES
CONSOLIDATING CONDENSED STATEMENTS OF OPERATIONS
FOR THE YEAR ENDED JANUARY 31, 2009
(amounts in thousands)
| Parent Only | Guarantors | Non- Guarantors |
Eliminations | Consolidated | ||||||||||||||||
| Revenue |
$ | — | $ | 760,136 | $ | 91,161 | $ | — | $ | 851,297 | ||||||||||
| Gross profit |
— | 234,536 | 43,715 | — | 278,251 | |||||||||||||||
| Impairment on long-lived assets |
— | 14,750 | 7,549 | — | 22,299 | |||||||||||||||
| Operating income (loss) |
37 | 11,050 | (6,759 | ) | — | 4,328 | ||||||||||||||
| Impairment on marketable securities |
2,797 | — | — | — | 2,797 | |||||||||||||||
| Interest, noncontrolling interest and income taxes |
343 | 14,563 | (485 | ) | — | 14,421 | ||||||||||||||
| Equity in loss of subsidiaries, net |
(9,787 | ) | — | — | 9,787 | — | ||||||||||||||
| Net loss attributed to Perry Ellis International, Inc. |
(12,890 | ) | (3,513 | ) | (6,274 | ) | 9,787 | (12,890 | ) | |||||||||||
F-47
Table of Contents
PERRY ELLIS INTERNATIONAL, INC. AND SUBSIDIARIES
CONSOLIDATED CONDENSED STATEMENTS OF CASH FLOWS
FOR THE YEAR ENDED JANUARY 29, 2011
(amounts in thousands)
| Parent Only | Guarantors | Non- Guarantors |
Eliminations | Consolidated | ||||||||||||||||
| NET CASH PROVIDED BY (USED IN) OPERATING ACTIVITIES |
$ | 3,865 | $ | 31,496 | $ | (14,220 | ) | $ | (137 | ) | $ | 21,004 | ||||||||
| CASH FLOWS FROM INVESTING |
||||||||||||||||||||
| Purchase of property and equipment |
— | (4,998 | ) | (1,239 | ) | — | (6,237 | ) | ||||||||||||
| Payment of restricted funds as collateral |
— | (9,369 | ) | — | — | (9,369 | ) | |||||||||||||
| Payment for acquired businesses, net of cash acquired |
— | (79,985 | ) | — | — | (79,985 | ) | |||||||||||||
| Proceeds on sale of intangible assets |
— | — | 1,100 | — | 1,100 | |||||||||||||||
| Net cash (used in) provided by investing activities |
— | (94,352 | ) | (139 | ) | — | (94,491 | ) | ||||||||||||
| CASH FLOWS FROM FINANCING |
||||||||||||||||||||
| Payments on senior credit facility |
— | (478,977 | ) | — | — | (478,977 | ) | |||||||||||||
| Borrowings from senior credit facility |
— | 576,319 | — | — | 576,319 | |||||||||||||||
| Payments on senior subordinate notes |
(454 | ) | (25,000 | ) | — | — | (25,454 | ) | ||||||||||||
| Payments on real estate mortgage |
— | (11,219 | ) | — | — | (11,219 | ) | |||||||||||||
| Deferred financing fees |
— | (158 | ) | — | — | (158 | ) | |||||||||||||
| Proceeds from refinancing of real estate mortgage |
— | 13,000 | — | — | 13,000 | |||||||||||||||
| Payments on capital leases |
— | (301 | ) | — | — | (301 | ) | |||||||||||||
| Payment of noncontrolling interest |
— | — | (4,557 | ) | (4,557 | ) | ||||||||||||||
| Proceeds from exercise of stock options |
2,677 | — | — | — | 2,677 | |||||||||||||||
| Tax benefit from exercise of stock options |
2,270 | — | — | — | 2,270 | |||||||||||||||
| Intercompany transactions |
(8,500 | ) | (19,121 | ) | 25,297 | 2,324 | — | |||||||||||||
| Net cash (used in) provided by financing activities |
(4,007 | ) | 54,543 | 20,740 | 2,324 | 73,600 | ||||||||||||||
| Effect of exchange rate changes on cash and cash equivalents |
142 | — | 334 | (334 | ) | 142 | ||||||||||||||
| NET INCREASE IN CASH AND CASH EQUIVALENTS |
— | (8,313 | ) | 6,715 | 1,853 | 255 | ||||||||||||||
| CASH AND CASH EQUIVALENTS AT BEGINNING OF PERIOD |
— | 8,313 | 12,459 | (2,503 | ) | 18,269 | ||||||||||||||
| CASH AND CASH EQUIVALENTS AT END OF PERIOD |
$ | — | $ | — | $ | 19,174 | $ | (650 | ) | $ | 18,524 | |||||||||
F-48
Table of Contents
PERRY ELLIS INTERNATIONAL, INC. AND SUBSIDIARIES
CONSOLIDATED CONDENSED STATEMENTS OF CASH FLOWS
FOR THE YEAR ENDED JANUARY 30, 2010
(amounts in thousands)
| Parent Only | Guarantors | Non- Guarantors |
Eliminations | Consolidated | ||||||||||||||||
| NET CASH PROVIDED BY (USED IN) OPERATING ACTIVITIES |
$ | 13,254 | $ | 94,149 | $ | (20,691 | ) | $ | 2,083 | $ | 88,795 | |||||||||
| CASH FLOWS FROM INVESTING |
||||||||||||||||||||
| Purchase of property and equipment |
(1,022 | ) | (1,531 | ) | (181 | ) | — | (2,734 | ) | |||||||||||
| Proceeds on sale of intangible assets |
— | — | 700 | — | 700 | |||||||||||||||
| Net cash (used in) provided by investing activities |
(1,022 | ) | (1,531 | ) | 519 | — | (2,034 | ) | ||||||||||||
| CASH FLOWS FROM FINANCING |
||||||||||||||||||||
| Payments on senior credit facility |
— | (700,649 | ) | — | — | (700,649 | ) | |||||||||||||
| Borrowings from senior credit facility |
— | 646,234 | — | — | 646,234 | |||||||||||||||
| Payments on senior subordinate notes |
(11,776 | ) | (9,072 | ) | — | — | (20,848 | ) | ||||||||||||
| Payments on real estate mortgage |
— | (469 | ) | — | — | (469 | ) | |||||||||||||
| Payments on capital leases |
(357 | ) | — | — | — | (357 | ) | |||||||||||||
| Proceeds from exercise of stock options |
636 | — | — | — | 636 | |||||||||||||||
| Tax benefit from exercise of stock options |
205 | — | — | — | 205 | |||||||||||||||
| Purchase of treasury stock |
(1,751 | ) | — | — | — | (1,751 | ) | |||||||||||||
| Intercompany transactions |
1,117 | (22,158 | ) | 24,813 | (3,772 | ) | — | |||||||||||||
| Net cash (used in) provided by financing activities |
(11,926 | ) | (86,114 | ) | 24,813 | (3,772 | ) | (76,999 | ) | |||||||||||
| Effect of exchange rate changes on cash and cash equivalents |
(306 | ) | 4 | (1,786 | ) | 1,782 | (306 | ) | ||||||||||||
| NET INCREASE IN CASH AND CASH EQUIVALENTS |
— | 6,508 | 2,855 | 93 | 9,456 | |||||||||||||||
| CASH AND CASH EQUIVALENTS AT BEGINNING OF PERIOD |
— | 1,805 | 9,604 | (2,596 | ) | 8,813 | ||||||||||||||
| CASH AND CASH EQUIVALENTS AT END OF PERIOD |
$ | — | $ | 8,313 | $ | 12,459 | $ | (2,503 | ) | $ | 18,269 | |||||||||
F-49
Table of Contents
PERRY ELLIS INTERNATIONAL, INC. AND SUBSIDIARIES
CONSOLIDATED CONDENSED STATEMENTS OF CASH FLOWS
FOR THE YEAR ENDED JANUARY 31, 2009
(amounts in thousands)
| Parent Only | Guarantors | Non- Guarantors |
Eliminations | Consolidated | ||||||||||||||||
| NET CASH PROVIDED BY (USED IN) OPERATING ACTIVITIES |
$ | (12,580 | ) | $ | 9,176 | $ | (2,454 | ) | $ | 876 | $ | (4,982 | ) | |||||||
| CASH FLOWS FROM INVESTING |
||||||||||||||||||||
| Purchase of property and equipment |
— | (8,687 | ) | (1,502 | ) | — | (10,189 | ) | ||||||||||||
| Proceeds on sale of marketable securities |
138 | — | — | — | 138 | |||||||||||||||
| Payment for acquired businesses |
— | (33,951 | ) | — | — | (33,951 | ) | |||||||||||||
| Reacquisition of license rights |
— | (388 | ) | — | — | (388 | ) | |||||||||||||
| Net cash provided by (used in) investing activities |
138 | (43,026 | ) | (1,502 | ) | — | (44,390 | ) | ||||||||||||
| CASH FLOWS FROM FINANCING |
||||||||||||||||||||
| Deferred financing fees |
— | (363 | ) | — | — | (363 | ) | |||||||||||||
| Payments on senior credit facility |
— | (277,143 | ) | — | — | (277,143 | ) | |||||||||||||
| Borrowings from senior credit facility |
— | 331,558 | — | — | 331,558 | |||||||||||||||
| Payments on real estate mortgage |
— | (434 | ) | (1,001 | ) | — | (1,435 | ) | ||||||||||||
| Payments on capital leases |
(202 | ) | — | — | — | (202 | ) | |||||||||||||
| Proceeds from exercise of stock options |
3,825 | — | — | — | 3,825 | |||||||||||||||
| Tax benefit from exercise of stock options |
1,582 | — | — | — | 1,582 | |||||||||||||||
| Purchase of treasury stock |
(11,576 | ) | — | — | — | (11,576 | ) | |||||||||||||
| Payment of loan to noncontrolling partner |
— | — | (598 | ) | — | (598 | ) | |||||||||||||
| Intercompany transactions |
19,636 | (25,876 | ) | 5,780 | 460 | — | ||||||||||||||
| Net cash provided by financing activities |
13,265 | 27,742 | 4,181 | 460 | 45,648 | |||||||||||||||
| Effect of exchange rate changes on cash and cash equivalents |
(823 | ) | (192 | ) | 652 | (460 | ) | (823 | ) | |||||||||||
| NET (DECREASE) INCREASE IN CASH AND CASH EQUIVALENTS |
— | (6,300 | ) | 877 | 876 | (4,547 | ) | |||||||||||||
| CASH AND CASH EQUIVALENTS AT BEGINNING OF PERIOD |
— | 8,105 | 8,727 | (3,472 | ) | 13,360 | ||||||||||||||
| CASH AND CASH EQUIVALENTS AT END OF PERIOD |
$ | — | $ | 1,805 | $ | 9,604 | $ | (2,596 | ) | $ | 8,813 | |||||||||
F-50
Table of Contents
Exhibit Index
| Exhibit No |
Description of Exhibit | |
| 21.1 |
Subsidiaries of Registrant | |
| 23.1 |
Consent of Deloitte & Touche LLP | |
| 31.1 |
Certification of Chief Executive Officer pursuant to Rule 13a-14(a) and Rule 15d-14(a), promulgated under the Securities Exchange Act of 1934, as amended | |
| 31.2 |
Certification of Chief Financial Officer pursuant to Rule 13a-14(a) and Rule 15d-14(a), promulgated under the Securities Exchange Act of 1934, as amended | |
| 32.1 |
Certification of Chief Executive Officer pursuant to 18 U.S.C Section 1350, as adopted pursuant to Section 906 of the Sarbanes-Oxley Act of 2002 | |
| 32.2 |
Certification of Chief Financial Officer pursuant to 18 U.S.C Section 1350, as adopted pursuant to Section 906 of the Sarbanes-Oxley Act of 2002 | |