Attached files
| file | filename |
|---|---|
| 8-K - FORM 8-K - QR Energy, LP | h81347e8vk.htm |
| EX-99.2 - EX-99.2 - QR Energy, LP | h81347exv99w2.htm |
Exhibit 99.1
| IPAA OGIS New York • April 2011 |
| Forward-Looking Statements This presentation contains forward-looking statements relating to QR Energy's operations that are based on management's current expectations, estimates and projections about its operations. Words and phrases such as "expect," "estimates," "guidance," "opportunities," "potential," "may," "believe" and "target," references to future years, and variations of such words and similar expressions are intended to identify such forward-looking statements. QR Energy believes that its expectations and forecasts are based on reasonable assumptions, however, no assurance can be given that such expectations and forecasts will prove to be correct. A number of risks and uncertainties, many of which are beyond our control, could cause actual results to differ materially from the expectations and forecasts, anticipated results and other forward-looking information expressed in this presentation, including risks relating to the QR Energy's financial performance and results, availability of sufficient cash flow to execute our business plan, our level of indebtedness, a significant reduction in the borrowing base under our bank credit facility, our ability to raise capital, prices and demand for oil and natural gas, our ability to replace reserves and efficiently develop our current reserves, adverse market conditions, competition and governmental regulations. For a more complete list of these risks, please read QR Energy's filings with the Securities and Exchange Commission, which are available on QR Energy's Investor Relations website, http://ir.qrenergylp.com, or on the Securities and Exchange Commission's website, www.sec.gov. The reader should not place undue reliance on these forward-looking statements, which speak only as of the date of this presentation. Unless legally required, QR Energy undertakes no obligation to update publicly any forward-looking statements, whether as a result of new information, future events or otherwise. Unpredictable or unknown factors not discussed herein also could have material adverse effects on forward-looking statements. Page 2 |
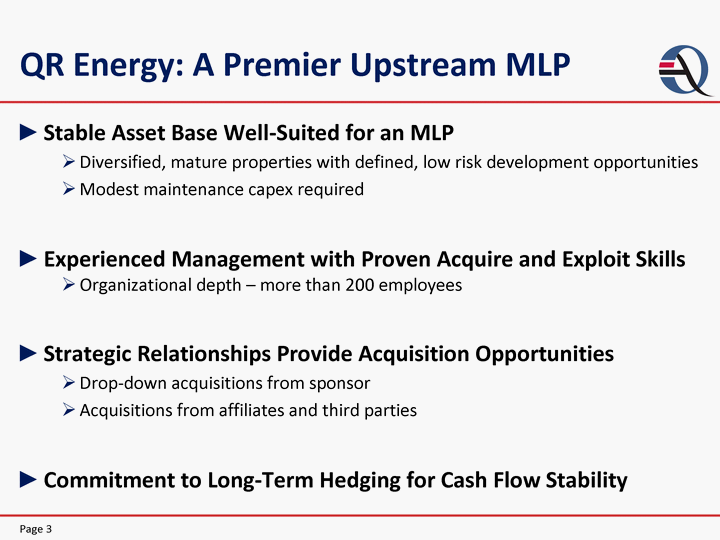
| QR Energy: A Premier Upstream MLP Stable Asset Base Well-Suited for an MLP Diversified, mature properties with defined, low risk development opportunities Modest maintenance capex required Experienced Management with Proven Acquire and Exploit Skills Organizational depth - more than 200 employees Strategic Relationships Provide Acquisition Opportunities Drop-down acquisitions from sponsor Acquisitions from affiliates and third parties Commitment to Long-Term Hedging for Cash Flow Stability Page 3 |
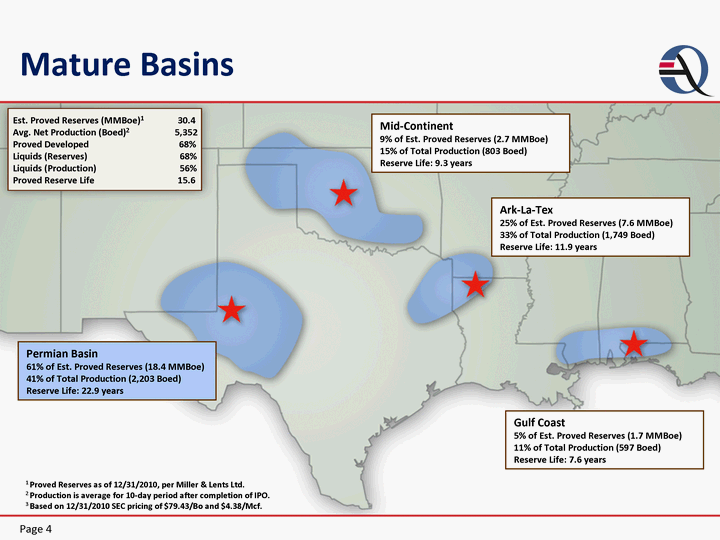
| Page 4 Est. Proved Reserves (MMBoe)1 30.4 Avg. Net Production (Boed)2 5,352 Proved Developed 68% Liquids (Reserves) 68% Liquids (Production) 56% Proved Reserve Life 15.6 Permian Basin 61% of Est. Proved Reserves (18.4 MMBoe) 41% of Total Production (2,203 Boed) Reserve Life: 22.9 years Mid-Continent 9% of Est. Proved Reserves (2.7 MMBoe) 15% of Total Production (803 Boed) Reserve Life: 9.3 years Ark-La-Tex 25% of Est. Proved Reserves (7.6 MMBoe) 33% of Total Production (1,749 Boed) Reserve Life: 11.9 years Gulf Coast 5% of Est. Proved Reserves (1.7 MMBoe) 11% of Total Production (597 Boed) Reserve Life: 7.6 years 1 Proved Reserves as of 12/31/2010, per Miller & Lents Ltd. 2 Production is average for 10-day period after completion of IPO. 3 Based on 12/31/2010 SEC pricing of $79.43/Bo and $4.38/Mcf. Mature Basins |
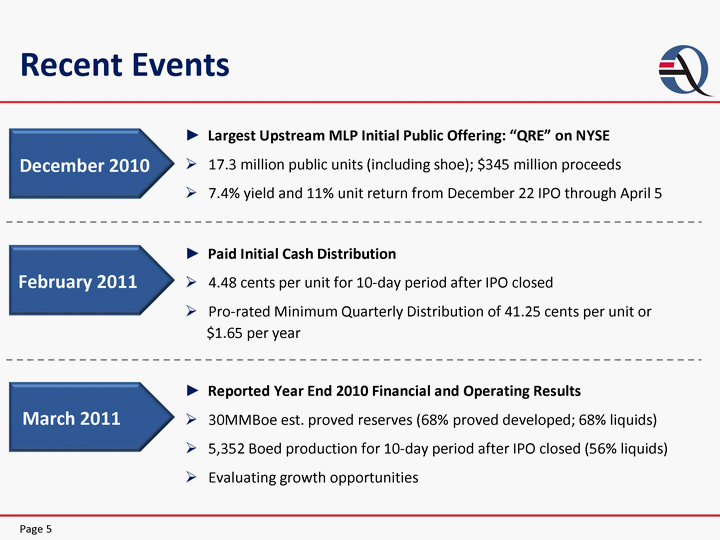
| Largest Upstream MLP Initial Public Offering: "QRE" on NYSE 17.3 million public units (including shoe); $345 million proceeds 7.4% yield and 11% unit return from December 22 IPO through April 5 December 2010 Page 5 February 2011 March 2011 Paid Initial Cash Distribution 4.48 cents per unit for 10-day period after IPO closed Pro-rated Minimum Quarterly Distribution of 41.25 cents per unit or $1.65 per year Reported Year End 2010 Financial and Operating Results 30MMBoe est. proved reserves (68% proved developed; 68% liquids) 5,352 Boed production for 10-day period after IPO closed (56% liquids) Evaluating growth opportunities Recent Events |
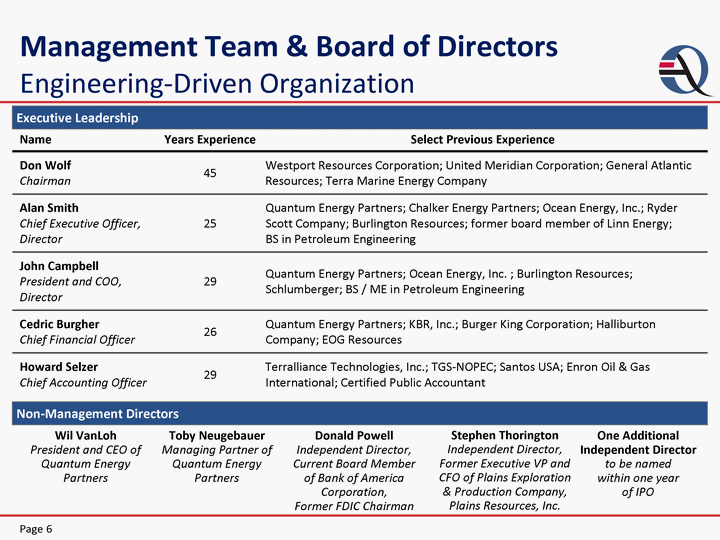
| Executive Leadership Name Years Experience Select Previous Experience Don Wolf Chairman 45 Westport Resources Corporation; United Meridian Corporation; General Atlantic Resources; Terra Marine Energy Company Alan Smith Chief Executive Officer, Director 25 Quantum Energy Partners; Chalker Energy Partners; Ocean Energy, Inc.; Ryder Scott Company; Burlington Resources; former board member of Linn Energy; BS in Petroleum Engineering John Campbell President and COO, Director 29 Quantum Energy Partners; Ocean Energy, Inc. ; Burlington Resources; Schlumberger; BS / ME in Petroleum Engineering Cedric Burgher Chief Financial Officer 26 Quantum Energy Partners; KBR, Inc.; Burger King Corporation; Halliburton Company; EOG Resources Howard Selzer Chief Accounting Officer 29 Terralliance Technologies, Inc.; TGS-NOPEC; Santos USA; Enron Oil & Gas International; Certified Public Accountant Management Team & Board of Directors Engineering-Driven Organization Non-Management Directors Page 6 Toby Neugebauer Managing Partner of Quantum Energy Partners Wil VanLoh President and CEO of Quantum Energy Partners One Additional Independent Director to be named within one year of IPO Donald Powell Independent Director, Current Board Member of Bank of America Corporation, Former FDIC Chairman Stephen Thorington Independent Director, Former Executive VP and CFO of Plains Exploration & Production Company, Plains Resources, Inc. |
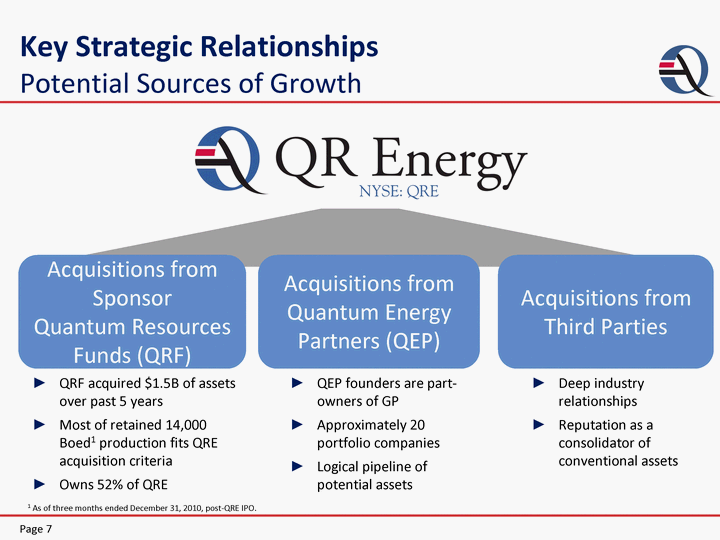
| Key Strategic Relationships Potential Sources of Growth Acquisitions from Sponsor Quantum Resources Funds (QRF) QRF acquired $1.5B of assets over past 5 years Most of retained 14,000 Boed1 production fits QRE acquisition criteria Owns 52% of QRE Acquisitions from Quantum Energy Partners (QEP) QEP founders are part- owners of GP Approximately 20 portfolio companies Logical pipeline of potential assets Acquisitions from Third Parties Deep industry relationships Reputation as a consolidator of conventional assets Page 7 1 As of three months ended December 31, 2010, post-QRE IPO. |
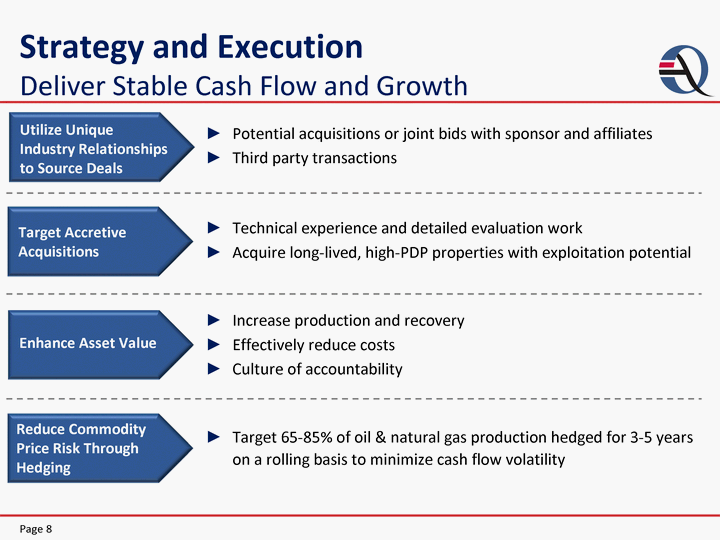
| Strategy and Execution Deliver Stable Cash Flow and Growth Technical experience and detailed evaluation work Acquire long-lived, high-PDP properties with exploitation potential Potential acquisitions or joint bids with sponsor and affiliates Third party transactions Target 65-85% of oil & natural gas production hedged for 3-5 years on a rolling basis to minimize cash flow volatility Increase production and recovery Effectively reduce costs Culture of accountability Enhance Asset Value Utilize Unique Industry Relationships to Source Deals Page 8 Reduce Commodity Price Risk Through Hedging Target Accretive Acquisitions |
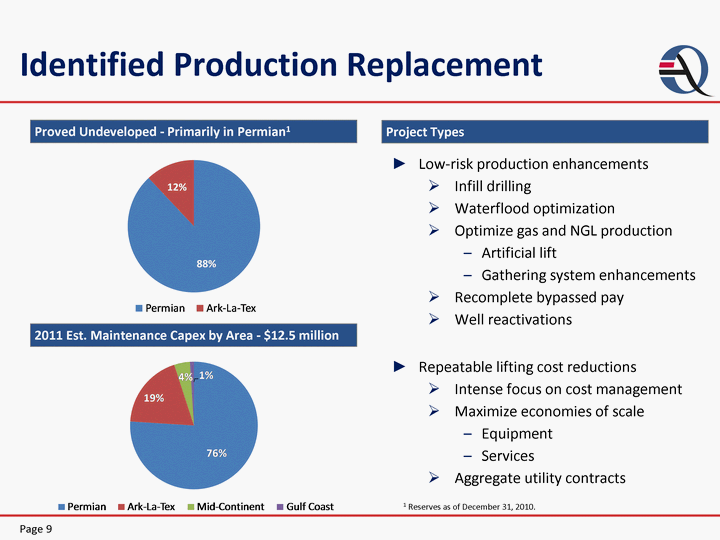
| Identified Production Replacement Proved Undeveloped - Primarily in Permian1 Project Types Low-risk production enhancements Infill drilling Waterflood optimization Optimize gas and NGL production Artificial lift Gathering system enhancements Recomplete bypassed pay Well reactivations Repeatable lifting cost reductions Intense focus on cost management Maximize economies of scale Equipment Services Aggregate utility contracts Page 9 1 Reserves as of December 31, 2010. 68% 32% 2011 Est. Maintenance Capex by Area - $12.5 million |
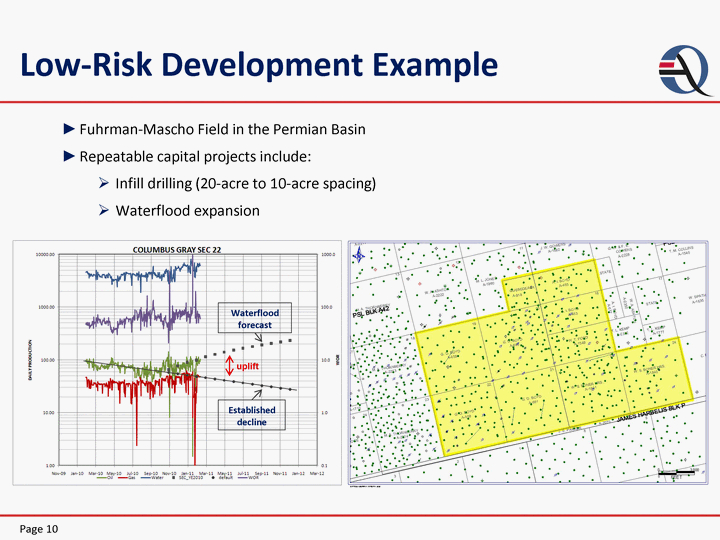
| Low-Risk Development Example Page 10 uplift Waterflood forecast Established decline Fuhrman-Mascho Field in the Permian Basin Repeatable capital projects include: Infill drilling (20-acre to 10-acre spacing) Waterflood expansion |
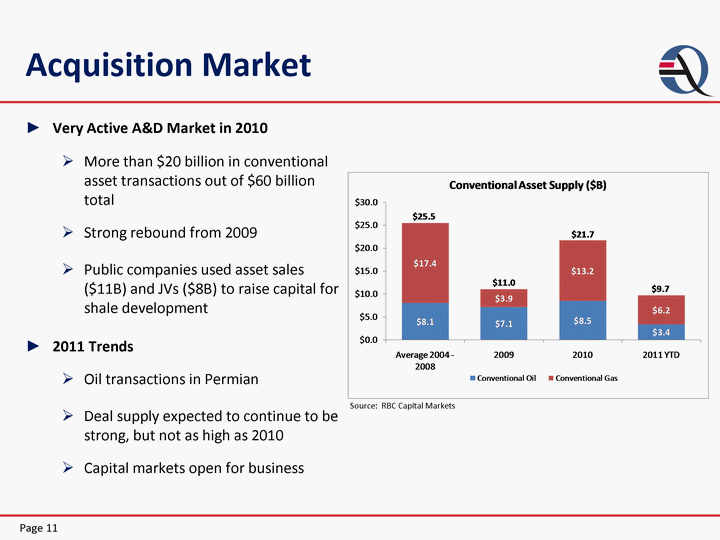
| Acquisition Market Very Active A&D Market in 2010 More than $20 billion in conventional asset transactions out of $60 billion total Strong rebound from 2009 Public companies used asset sales ($11B) and JVs ($8B) to raise capital for shale development 2011 Trends Oil transactions in Permian Deal supply expected to continue to be strong, but not as high as 2010 Capital markets open for business Source: RBC Capital Markets Page 11 |
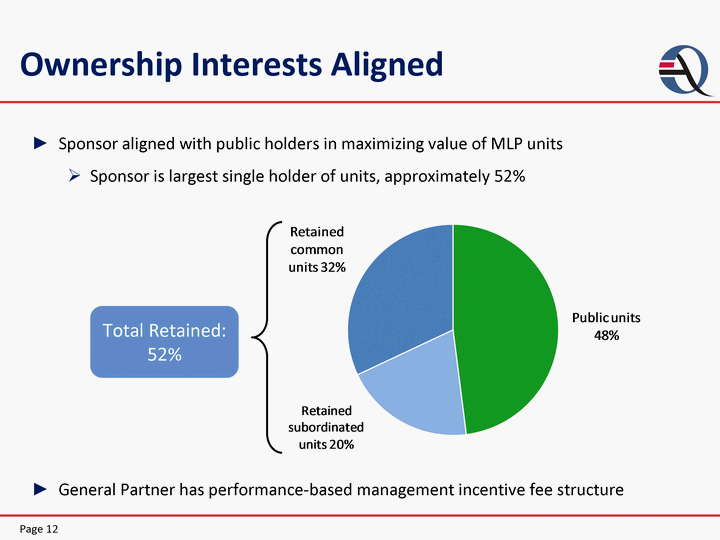
| Sponsor aligned with public holders in maximizing value of MLP units Sponsor is largest single holder of units, approximately 52% General Partner has performance-based management incentive fee structure Ownership Interests Aligned Page 12 Total Retained: 52% |
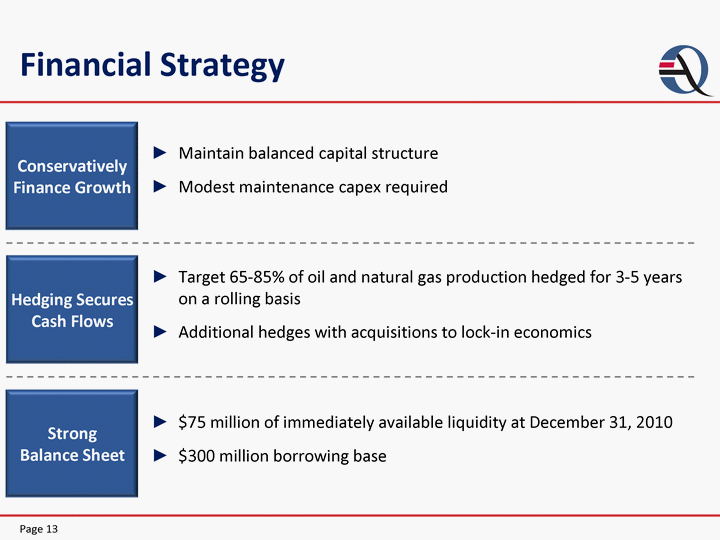
| Strong Balance Sheet $75 million of immediately available liquidity at December 31, 2010 $300 million borrowing base Conservatively Finance Growth Maintain balanced capital structure Modest maintenance capex required Hedging Secures Cash Flows Target 65-85% of oil and natural gas production hedged for 3-5 years on a rolling basis Additional hedges with acquisitions to lock-in economics Financial Strategy Page 13 |
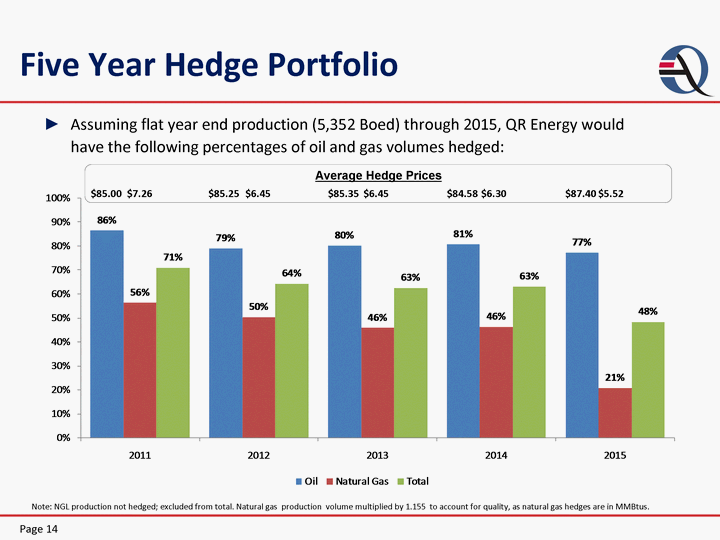
| Average Hedge Prices $7.26 $6.45 $6.45 $5.52 $85.00 $85.25 $85.35 $87.40 $6.30 $84.58 Five Year Hedge Portfolio Note: NGL production not hedged; excluded from total. Natural gas production volume multiplied by 1.155 to account for quality, as natural gas hedges are in MMBtus. Page 14 Assuming flat year end production (5,352 Boed) through 2015, QR Energy would have the following percentages of oil and gas volumes hedged: |
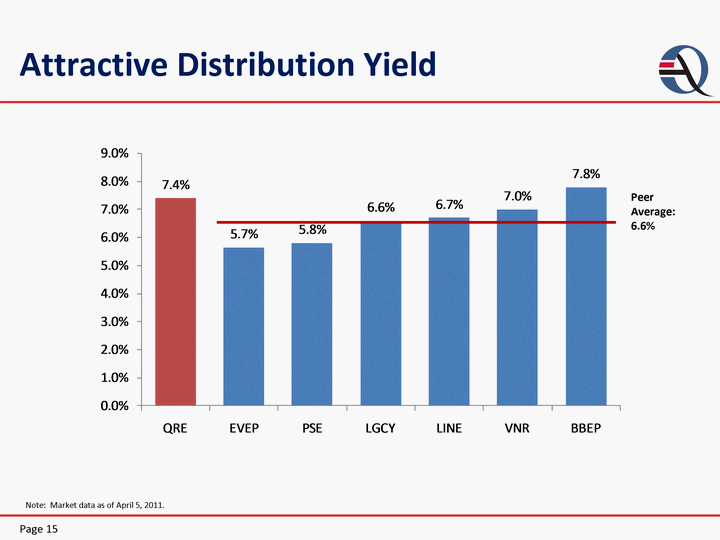
| Attractive Distribution Yield Note: Market data as of April 5, 2011. Page 15 Peer Average: 6.6% |
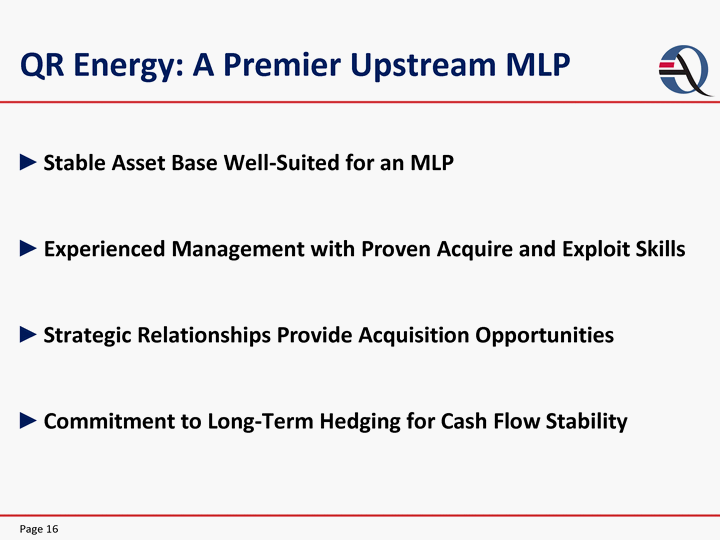
| QR Energy: A Premier Upstream MLP Stable Asset Base Well-Suited for an MLP Experienced Management with Proven Acquire and Exploit Skills Strategic Relationships Provide Acquisition Opportunities Commitment to Long-Term Hedging for Cash Flow Stability Page 16 |
