Attached files
| file | filename |
|---|---|
| 8-K - TRI-VALLEY CORPORATION 8-K - TRI VALLEY CORP | a6679605.htm |
Exhibit 99.1
Tri-Valley Corporation Maston Cunningham, President & CEO NYSE Amex: TIV April 2011
Special Note Regarding Forward-Looking Statements All statements contained in this presentation that refer to future events or other non-historical matters are forward-looking statements. We have attempted to identify forward-looking statements by terminology including “anticipates,” “believes,” “can,” “continue,” “could,” “estimates,” “expects,” “intends,” “may,” “plans,” “potential,” or “predicts,” or the negative of these terms or other comparable terminology. Although we do not make forward-looking statements unless we believe we have a reasonable basis for doing so, we cannot guarantee their accuracy. These statements are only predictions based on management’s expectations as of the date of this presentation, and involve known and unknown risks, uncertainties and other factors, including: our ability to obtain additional funding; fluctuations in oil and natural gas prices; imprecise estimates of oil reserves; drilling hazards such as equipment failures, fires, explosions, blow-outs, and pipe failure; shortages or delays in the delivery of drilling rigs and other equipment; problems in delivery to market; adverse weather conditions; compliance with governmental and regulatory requirements; geographical concentration of oil and gas reserves in the State of California; changes in or inability to maintain strategic and joint venture partnerships; pending and threatened lawsuits against us; potential rescission rights stemming from our potential violation of Section 5 of the Securities Act of 1933; and such other risks and factors that are discussed in our filings with the Securities and Exchange Commission from time to time, including, but not limited to, under “Item 1A. Risk Factors” and “Item 7. Management’s Discussion and Analysis of Financial Condition and Results of Operations,” contained in the Company’s Annual Report on Form 10-K for the year ended December 31, 2010. Except as required by law, we undertake no obligation to update or revise publicly any of the forward-looking statements after the date of this presentation to conform such statements to actual results or to reflect events or circumstances occurring after the date of this presentation. 2
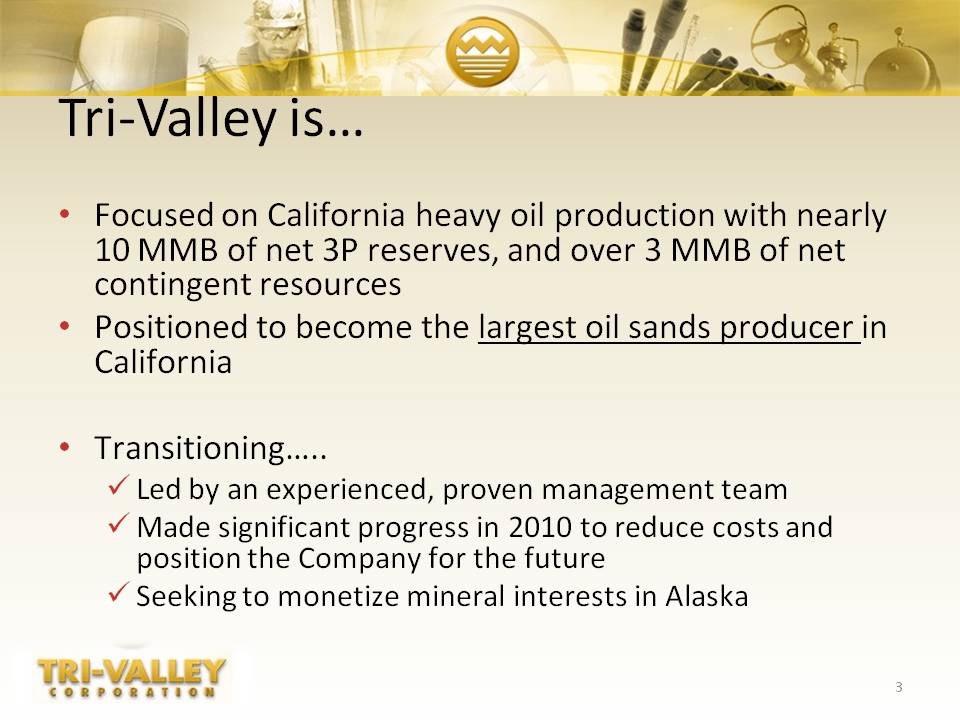
Tri-Valley is…Focused on California heavy oil production with nearly 10 MMB of net 3P reserves, and over 3 MMB of net contingent resources Positioned to become the largest oil sands producer in CaliforniaTransitioning…..Led by an experienced, proven management team Made significant progress in 2010 to reduce costs and position the Company for the futureSeeking to monetize mineral interests in Alaska 3
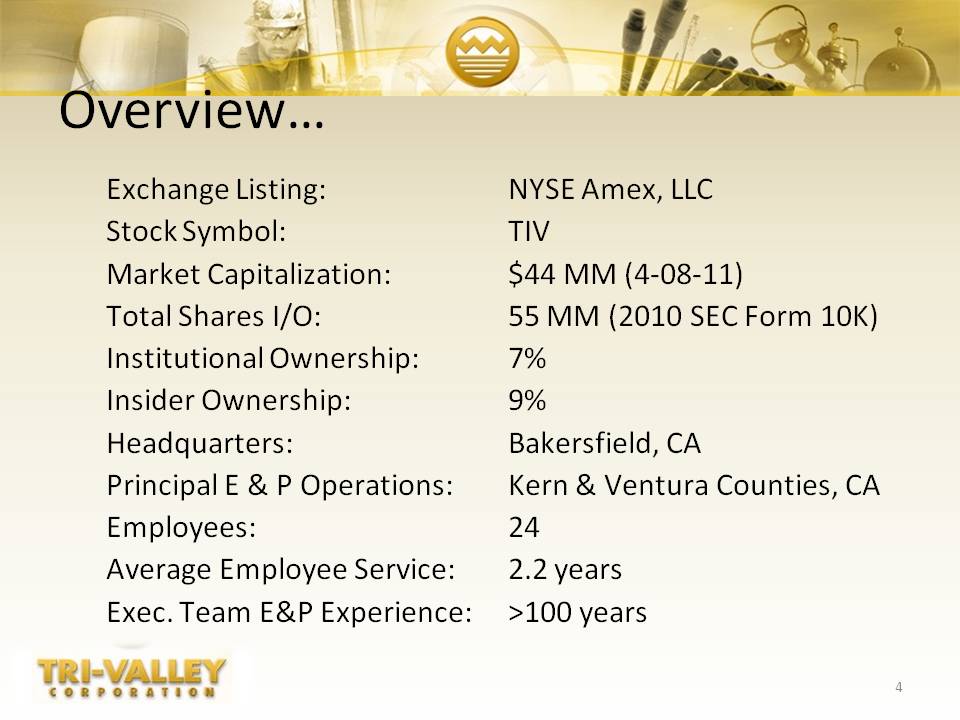
Overview… Exchange Listing: NYSE Amex, LLC Stock Symbol: TIV Market Capitalization:$44 MM (4-08-11)Total Shares I/O: 55 MM (2010 SEC Form 10K) Institutional Ownership: 7% Insider Ownership: 9% Headquarters: Bakersfield, CA Principal E & P Operations: Kern & Ventura Counties, CAEmployees: 24 Average Employee Service: 2.2 years Exec. Team E&P Experience: >100 years 4
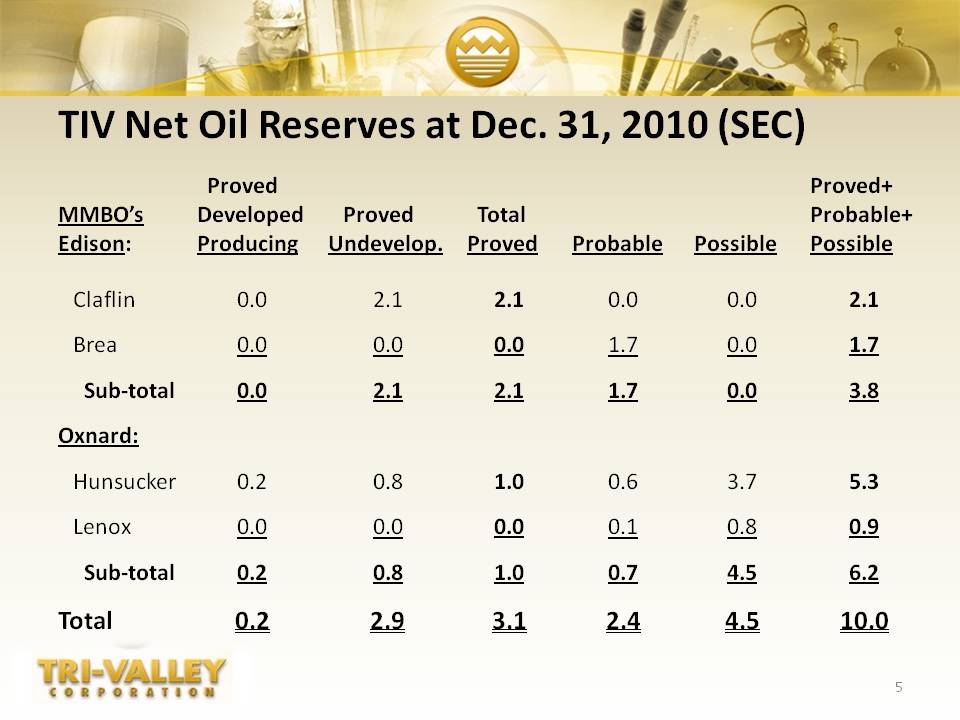
TIV Net Oil Reserves at Dec. 31, 2010 (SEC) 5 MMBO’s Edison: Proved Developed Producing Proved Undevelop. Total Proved Probable Possible Proved+ Probable+ Possible Claflin 0.0 2.1 2.1 0.0 0.0 2.1 Brea 0.0 0.0 0.0 1.7 0.0 1.7 Sub-total 0.0 2.1 2.1 1.7 0.0 3.8 Oxnard: Hunsucker 0.2 0.8 1.0 0.6 3.7 5.3 Lenox 0.0 0.0 0.0 0.1 0.8 0.9 Sub-total 0.2 0.8 1.0 0.7 4.5 6.2 Total 0.2 2.9 3.1 2.4 4.5 10.0
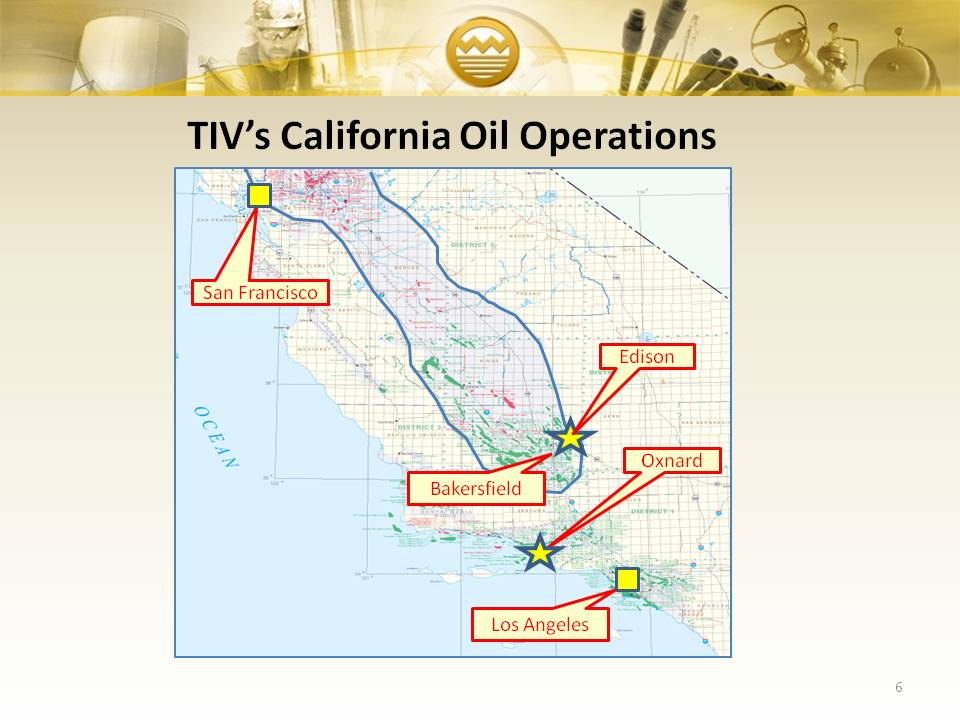
Edison 6 TIV’s California Oil Operations Oxnard San Francisco Los Angeles Bakersfield
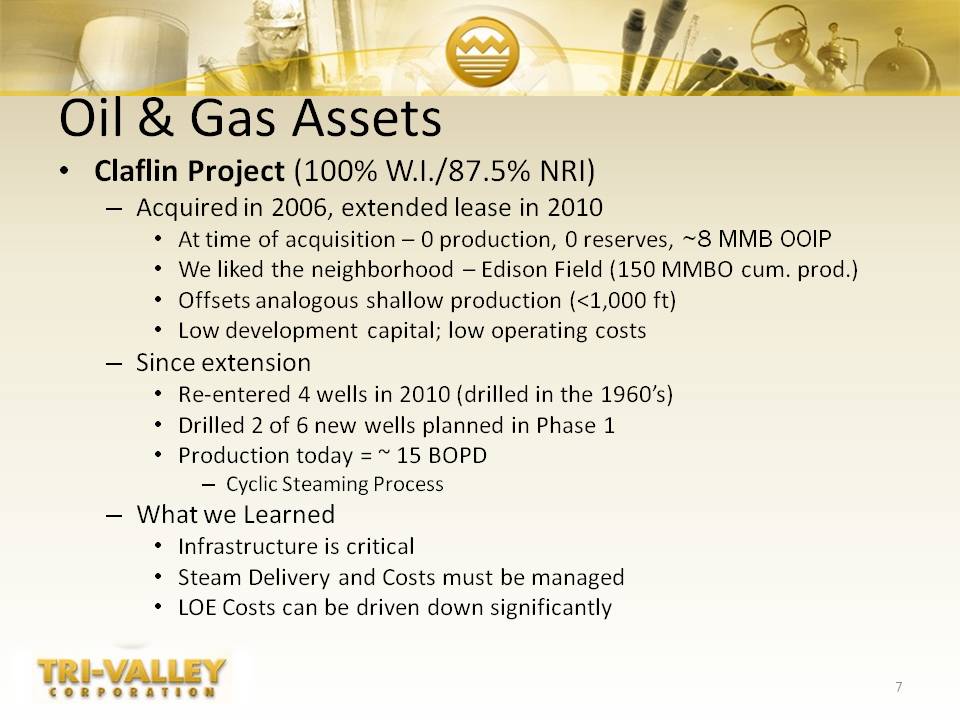
Oil & Gas Assets Claflin Project (100% W.I./87.5% NRI)Acquired in 2006, extended lease in 2010At time of acquisition – 0 production, 0 reserves, ~8 MMB OOIPWe liked the neighborhood – Edison Field (150 MMBO cum. prod.)Offsets analogous shallow production (<1,000 ft)Low development capital; low operating costsSince extensionRe-entered 4 wells in 2010 (drilled in the 1960’s) Drilled 2 of 6 new wells planned in Phase 1 Production today = ~ 15 BOPDCyclic Steaming ProcessWhat we LearnedInfrastructure is criticalSteam Delivery and Costs must be managedLOE Costs can be driven down significantly 7
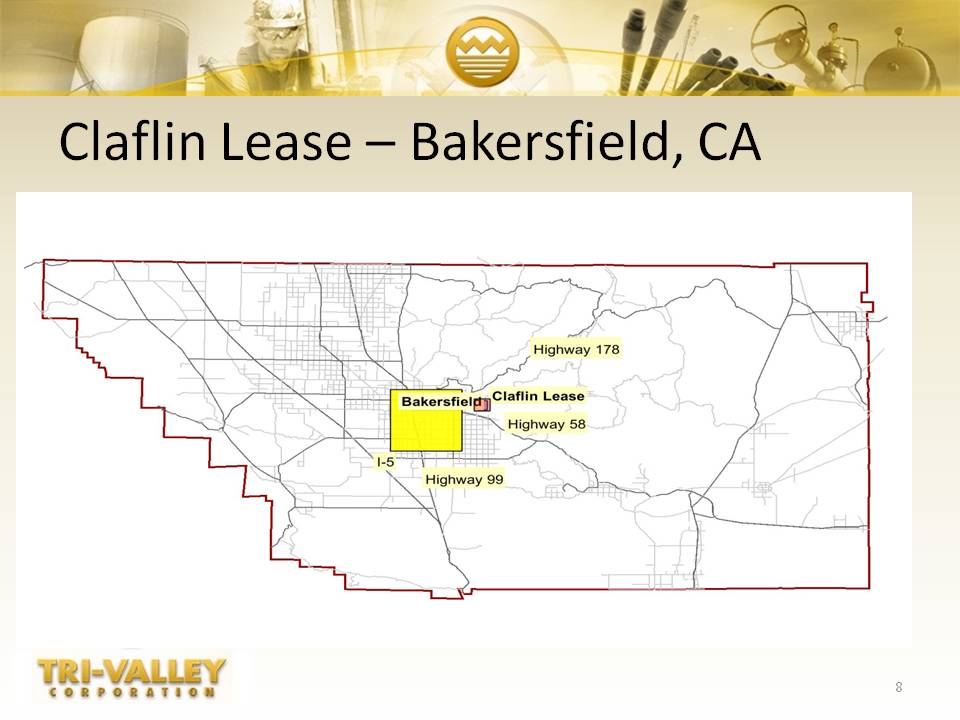
Claflin Lease -- Bakersfield, CA Highway 58 Highway 178 Highway 99 I-5
Claflin 2.0 MMB net PUD reserves (SEC); 16° API gravity22 Wells (13v/9h) to be drilled and equipped plus complete 3-D seismic study during 2011Exit rate at year-end 2011 estimated at 800 BOPD Peak production is estimated at 1,200 BOPD in 2012$8.9 Million of average annual net operating profit for first three yearsTIV has acquired the Brea lease, a similar adjoining property to develop in 2012 9
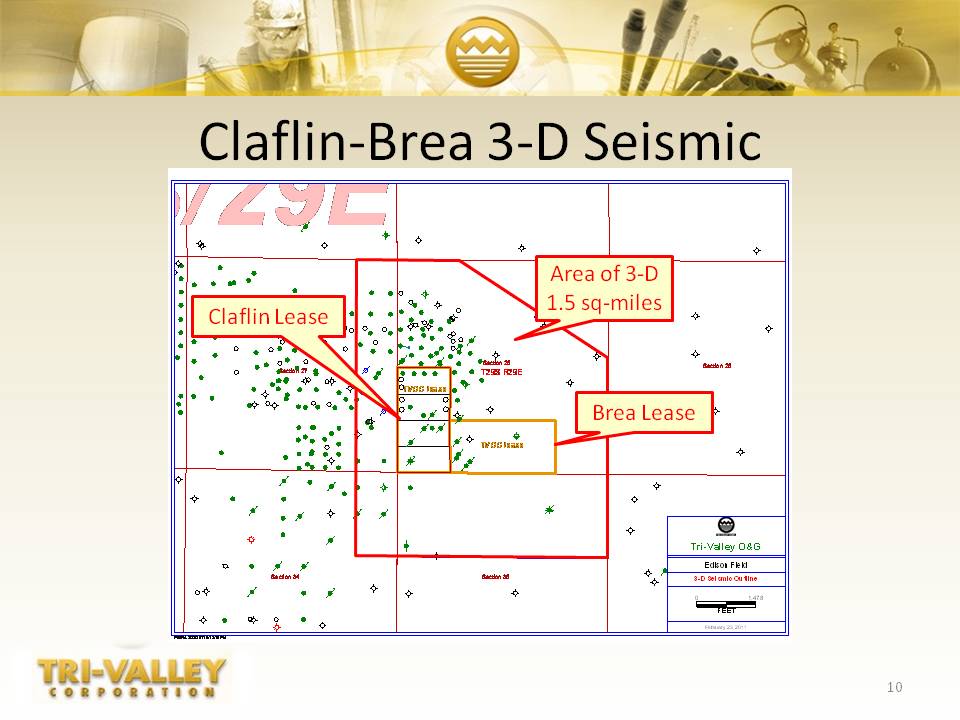
10 Claflin-Brea 3-D Seismic 10 Area of 3-D 1.5 sq-miles Brea Lease Claflin Lease TVOG lease T29S R29E Section 26 Tri-Valley O & G Edison Field 3-D Seismic Outline February 23, 2011
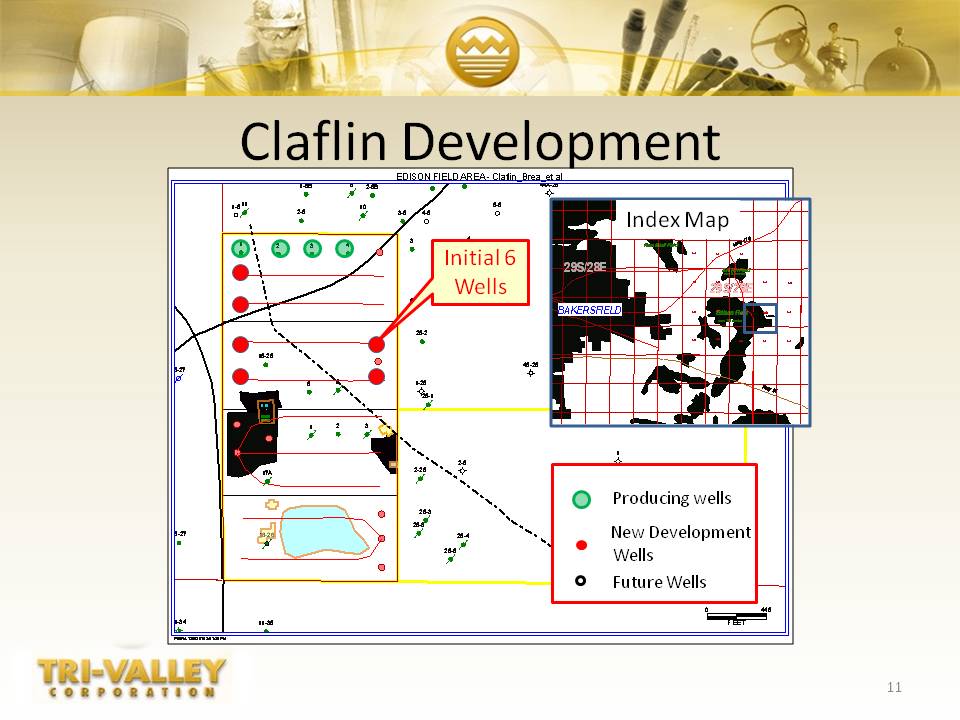
11 Claflin Development 11 Initial 6 Wells Index Map Producing wells New Development Wells Future Wells
Oil & Gas Assets Pleasant Valley Project – Upper Vaca Tar (Oil Sands) Acquired three leases in 2005 (TIV 25%/OPUS 75%)At time of acquisition – 0 production, 0 reserves, 128 MMB OOIPKnown oilfield with enhanced recovery potentialWas evaluated in 2000 for SAGD by Dr. Roger Butler (SAGD inventor)50% or greater recovery of OOIP may be possible with SAGDSince Acquisition:Drilled 8 new horizontal wells (first operator to do so)Production today = ~ 300 BOPD (gross)Cyclic Steam Production Process being optimizedSAGD pilot planned in second half 2011 What we’ve learned:Upper Vaca Tar is similar to the Canadian Oil Sands We need to approach it in similar fashionSAGD Development could be keyLeverage Canadian SAGD experienceTIV and OPUS must work together to attract development capital 12
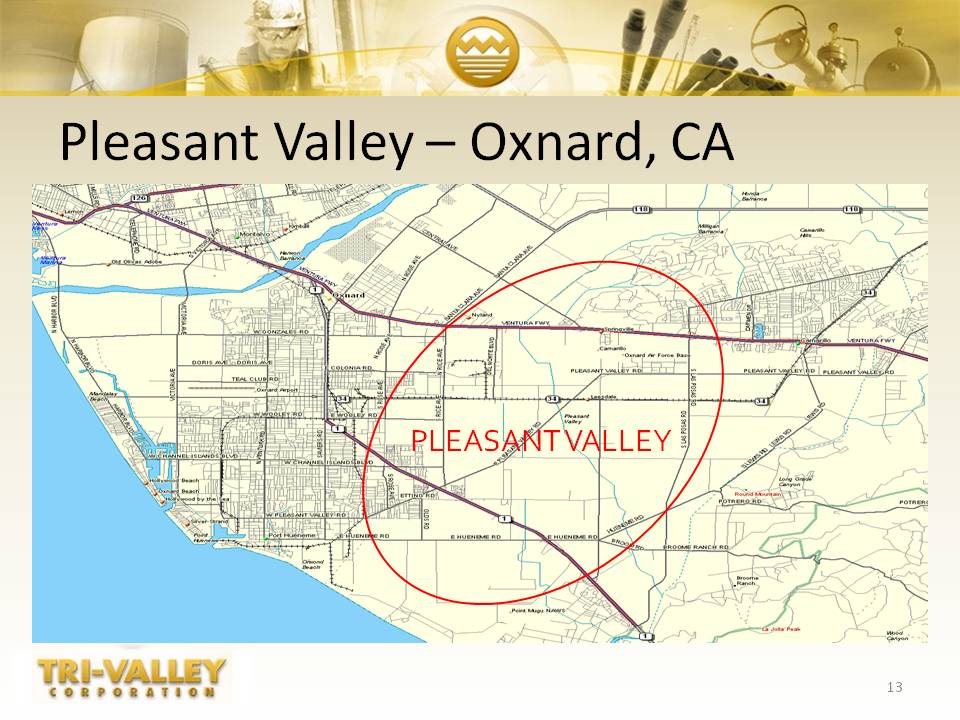
Pleasant Valley - Oxnard, CA 13
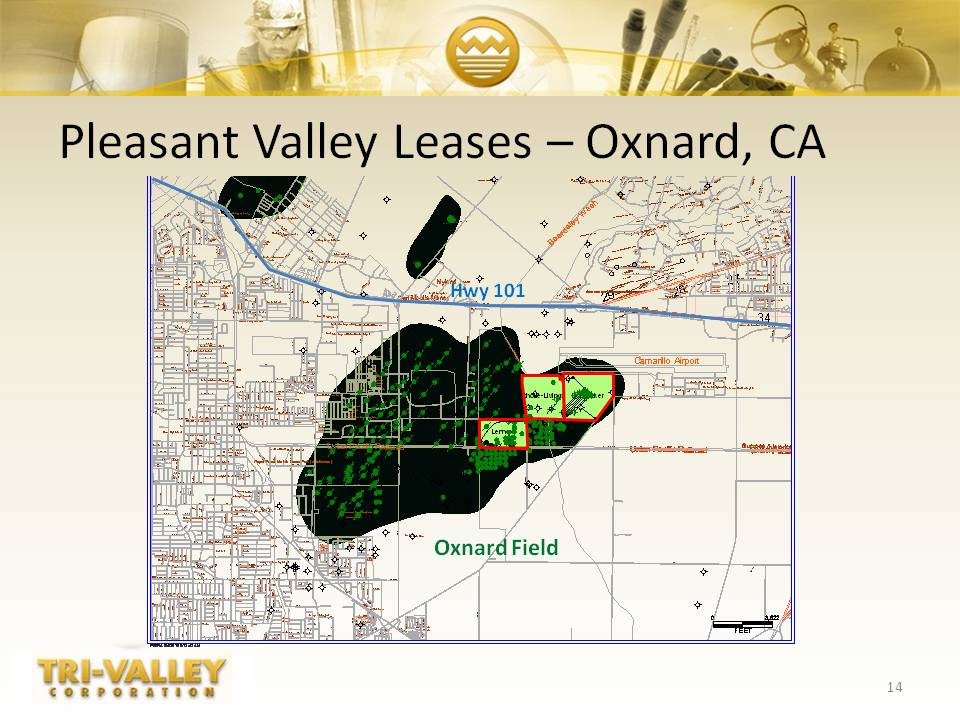
Pleasant Valley Leases - Oxnard, CA 14 Oxnard Field Hwy 101
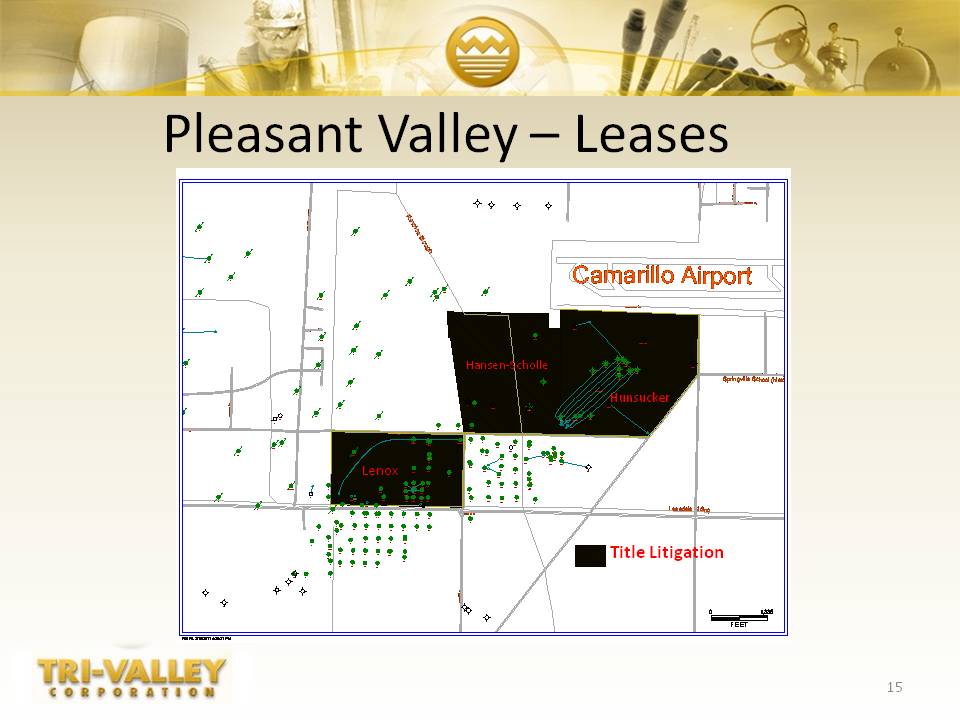
Pleasant Valley - Leases 15 Title Litigation Camarillo Airport Lenox Hansen-Scholle Hunsucker
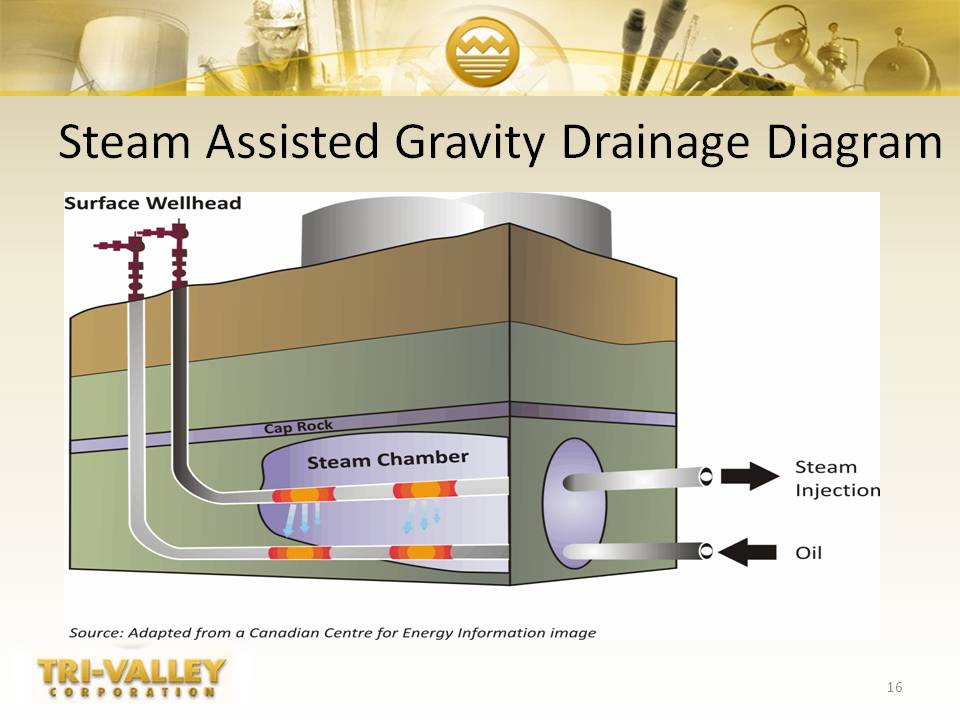
Steam Assisted Gravity Drainage Diagram 16 Steam Injection Oil Surface Wellhead Steam Chamber Cap Rock Source: Adapted from a Canadian Centre for Energy Information image 16
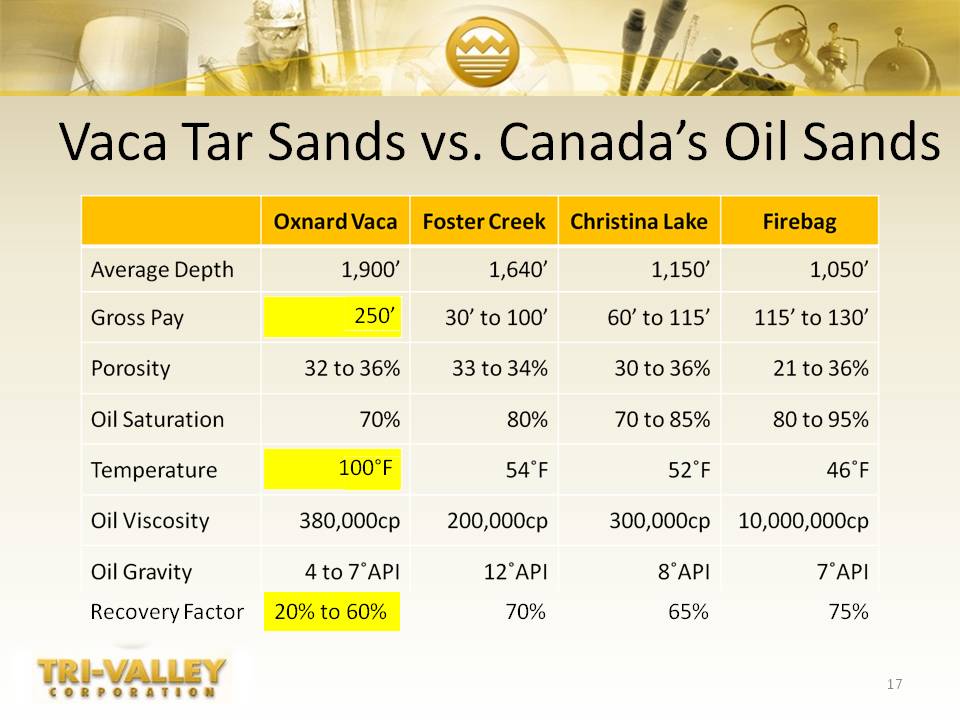
Oxnard Vaca Foster Creek Christina Lake Firebag Average Depth Gross Pay Porosity Oil Saturation Temperature Oil Viscosity Oil Gravity Recovery Factor 1,900’ 1, 640’ 1,150’ 1,050’ 250’ 30’ to 100’ 60’ to 115’ 115’ to 130’ 32 to 36% 33 to 34% 30 to 36% 21 to 36% 70% 80% 70 to 85% 80 to 95% 100°F 54°F 52°F 46°F 380,000cp 200,000cp 300,000cp 10,000,000cp 4 to 7 API 12 API 8 API 7 API 20% to 60% 70% 65% 75% 17
Other Assets 18
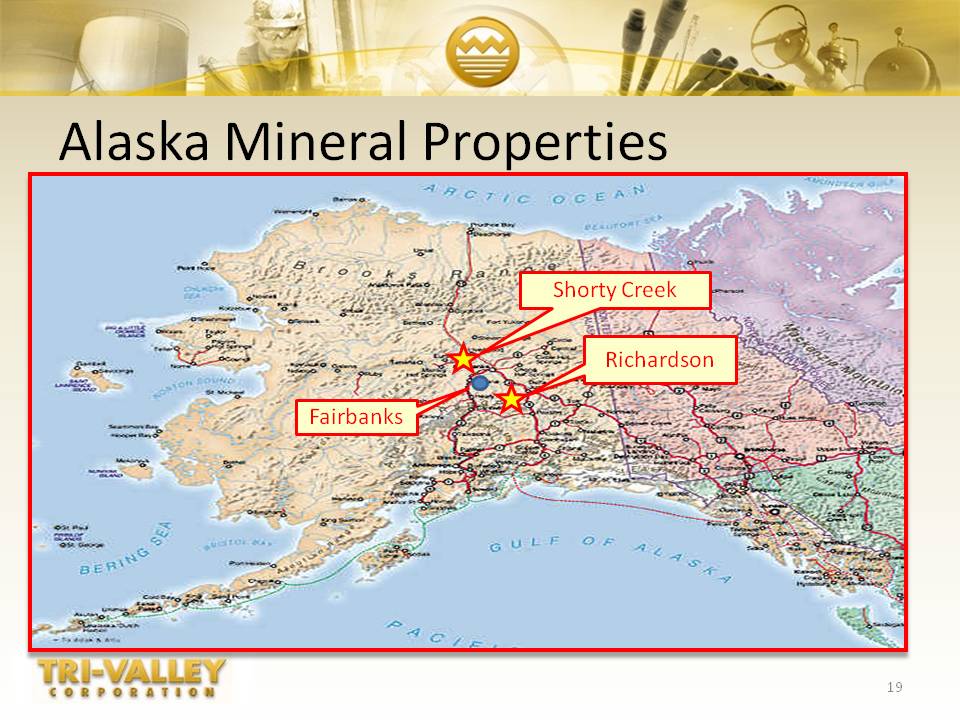
Alaska Mineral Properties 19 Fairbanks Shorty Creek Richardson 19
Shorty Creek Shorty Creek is a potential world-class porphyry depositContiguous to ITH’s Livengood property containing 13.3 Million oz of gold resource (indicated and inferred) at 0.5 grams/ton cut-off (heap leach quality)Asarco had multiple intercepts during 1988-89 programDrilled 20 holes, eight had gold intercepts ranging from 0.53 grams gold /ton up to 4.5 grams gold/tonSix anomalies have been identified for further exploration work in the 2010 NI 43-101 Report evaluation, which indicates a large porphyry copper, gold, and molybdenum system up to eight miles in diameter 20
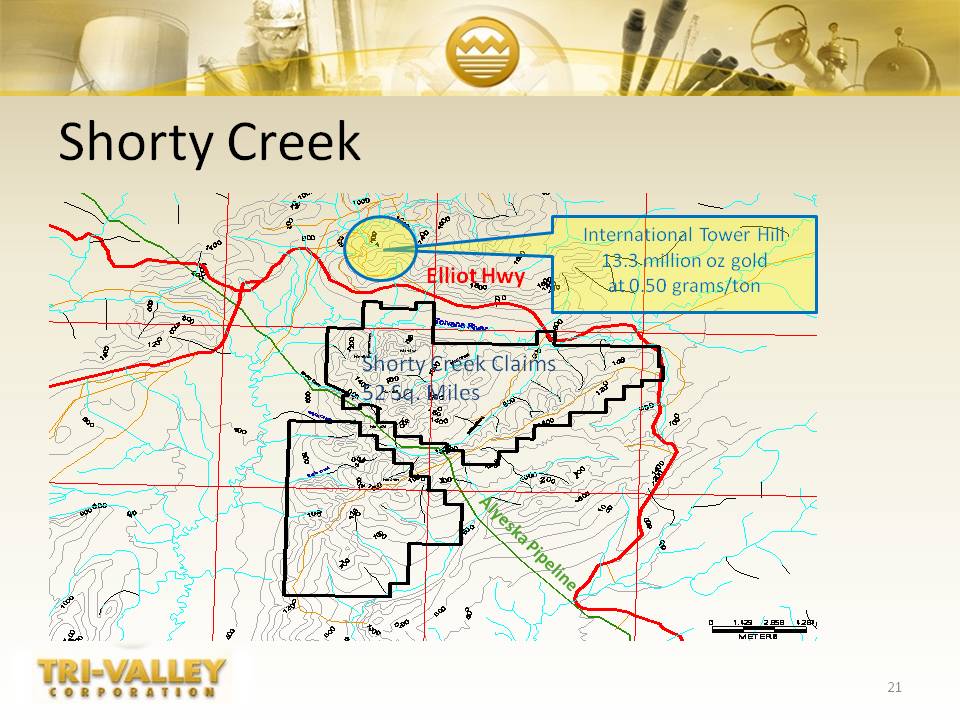
Shorty Creek Shorty Creek Claims 52 Sq. Miles International Tower Hill13.3 million oz goldat 0.50 grams/ton Alyeska Pipeline Elliot Hwy 21
Shorty Creek Exploration Drilling and other exploration work on the six anomalies identified in the NI 43-101 Report may ultimately require $10-15 Million in new investmentIdeal joint venture opportunity for a major or mid-tier gold or copper producer to earn a majority interest 22
Richardson Have identified six anomalies with surface geochem sampling, limited core drilling, and some previous miningAll of the anomalies are associated with the Intrusion Related Gold Deposit ModelNI 43-101 study has been completed and report is being finalized; expect to upload report to website by April 30Drilling and other Exploration work on identified anomalies may require $10-15 MM in new investmentAlso a joint venture opportunity for a major or mid-tier gold producer to earn a majority interest 23
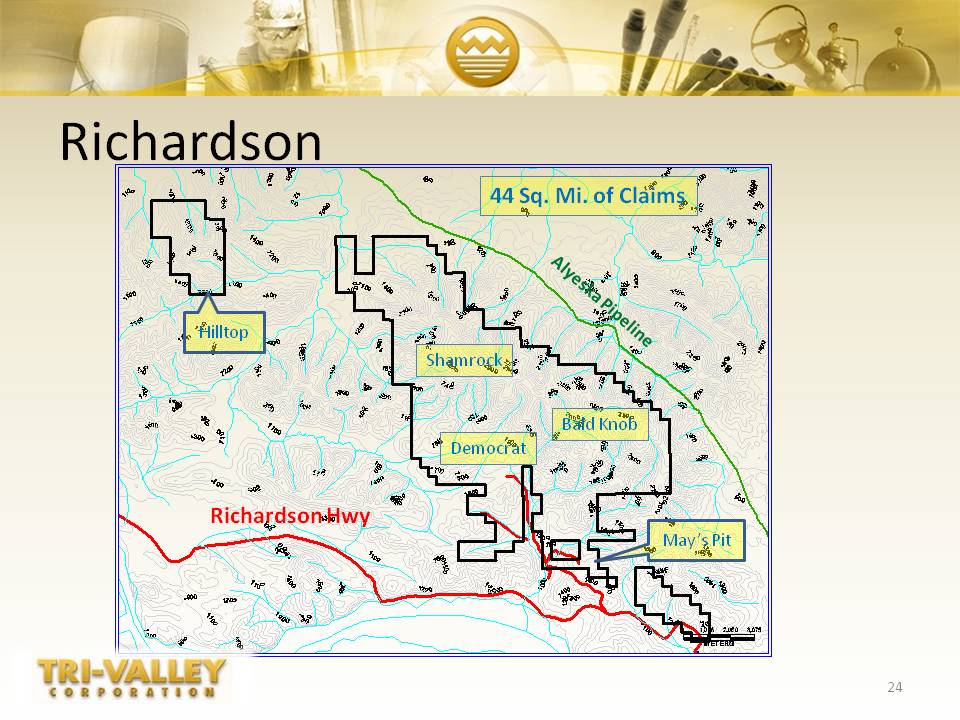
Richardson 24 Richardson Hwy 44 Sq. Mi. of Claims Shamrock Bald Knob Democrat Alyeska Pipeline Hilltop May’s Pit
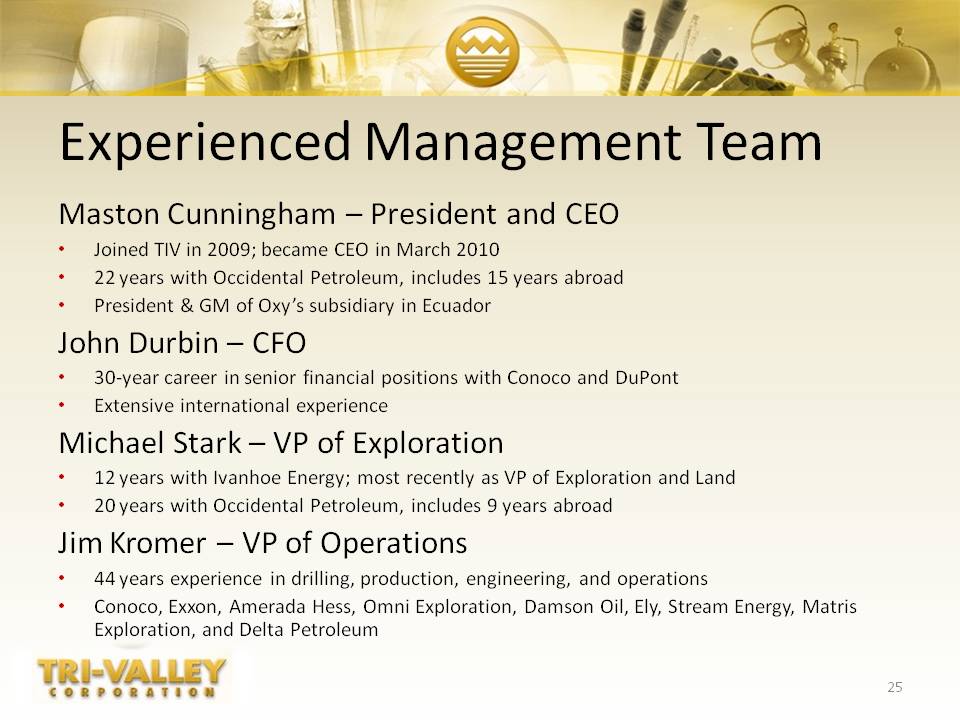
Experienced Management Team Maston Cunningham – President and CEOJoined TIV in 2009; became CEO in March 201022 years with Occidental Petroleum, includes 15 years abroad President & GM of Oxy’s subsidiary in EcuadorJohn Durbin – CFO30-year career in senior financial positions with Conoco and DuPontExtensive international experienceMichael Stark – VP of Exploration12 years with Ivanhoe Energy; most recently as VP of Exploration and Land 20 years with Occidental Petroleum, includes 9 years abroadJim Kromer – VP of Operations44 years experience in drilling, production, engineering, and operationsConoco, Exxon, Amerada Hess, Omni Exploration, Damson Oil, Ely, Stream Energy, Matris Exploration, and Delta Petroleum 25
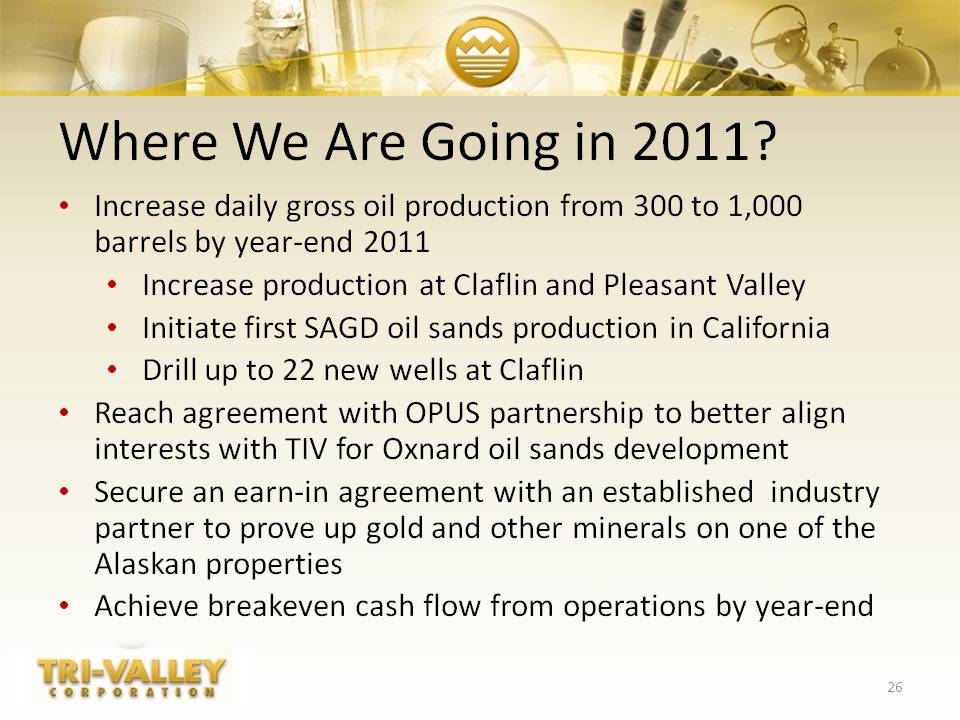
Where We Are Going in 2011? Increase daily gross oil production from 300 to 1,000 barrels by year-end 2011Increase production at Claflin and Pleasant ValleyInitiate first SAGD oil sands production in CaliforniaDrill up to 22 new wells at ClaflinReach agreement with OPUS partnership to better align interests with TIV for Oxnard oil sands developmentSecure an earn-in agreement with an established industry partner to prove up gold and other minerals on one of the Alaskan propertiesAchieve breakeven cash flow from operations by year-end 26
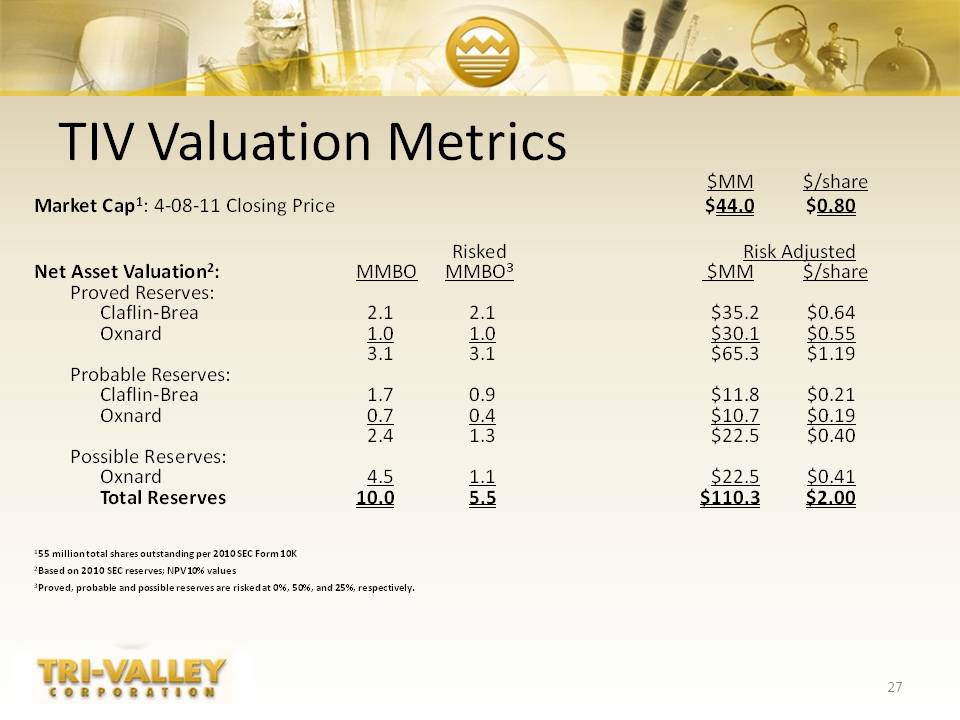
TIV Valuation Metrics $MM $/share Market Cap1: 4-08-11 Closing Price $44.0 $0.80 Risked Risk Adjusted Net Asset Valuation2: MMBO MMBO3 $MM $/share Proved Reserves: Claflin-Brea 2.1 2.1 $35.2 $0.64 Oxnard 1.0 1.0 $30.1 $0.55 3.1 3.1 $65.3 $1.19 Probable Reserves: Claflin-Brea 1.7 0.9 $11.8 $0.21 Oxnard 0.7 0.4 $10.7 $0.19 2.4 1.3 $22.5 $0.40 Possible Reserves: Oxnard 4.5 1.1 $22.5 $0.41 Total Reserves 10.0 5.5 $110.3 $2.00 155 million total shares outstanding per 2010 SEC Form 10K 2Based on 2010 SEC reserves; NPV10% values 3Proved, probable and possible reserves are risked at 0%, 50%, and 25%, respectively. 27
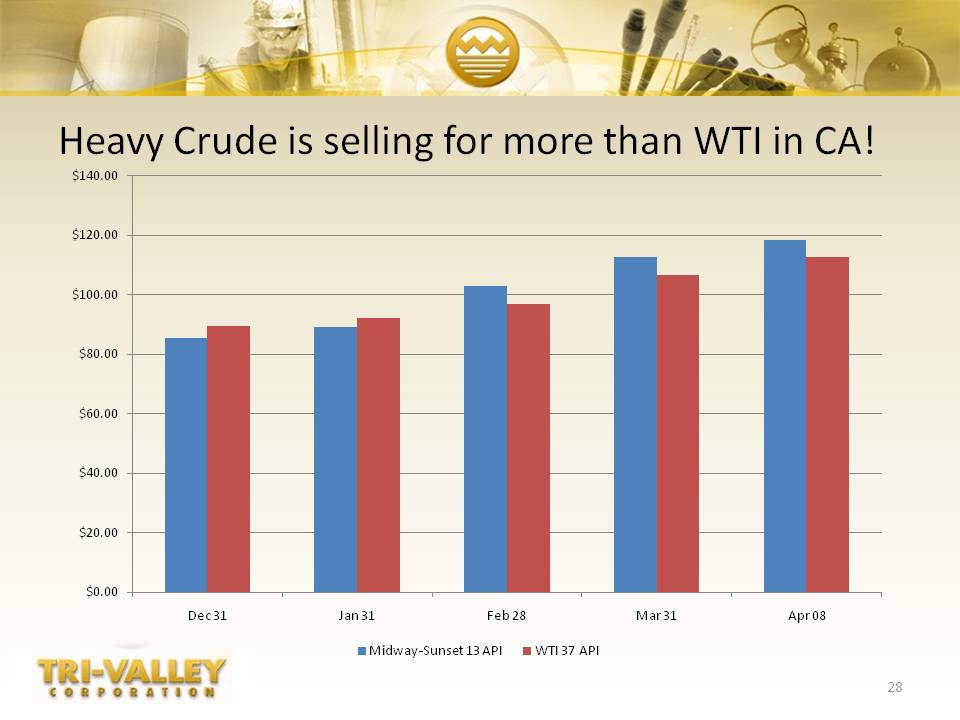
28 Heavy Crude is selling for more than WTI in CA! $140.00 Dec 31 Jan 31 Feb 28 Mar 31 Apr 08 $0.00 $20.00 $40.00 $60.00 $80.00 $100.00 $120.00 Midway-Sunset 13 API WTI 37 API