Attached files
| file | filename |
|---|---|
| EX-32 - EXHIBIT 32 - LAPOLLA INDUSTRIES INC | ex32.htm |
| EX-31.2 - EXHIBIT 31.2 - LAPOLLA INDUSTRIES INC | ex31_2.htm |
| EX-23.1 - EXHIBIT 23.1 - LAPOLLA INDUSTRIES INC | ex23_1.htm |
| EX-31.1 - EXHIBIT 31.1 - LAPOLLA INDUSTRIES INC | ex31_1.htm |
UNITED STATES
SECURITIES AND EXCHANGE COMMISSION
Washington, D.C. 20549
FORM 10-K
ANNUAL REPORT PURSUANT TO SECTION 13 OR 15(d) OF THE SECURITIES EXCHANGE ACT OF 1934
For The Fiscal Year Ended December 31, 2010
Commission File No. 001-31354
|
Lapolla Industries, Inc.
|
(Exact Name of Registrant as Specified in Its Charter)
|
Delaware
(State of Incorporation)
|
13-3545304
(I.R.S. Employer Identification No.)
|
|
|
Intercontinental Business Park
15402 Vantage Parkway East, Suite 322
Houston, Texas
(Address of Principal Executive Offices)
|
77032
(Zip Code)
|
(281) 219-4700
(Registrant’s Telephone Number)
Securities registered pursuant to Section 12 (b) of the Act: None
Securities registered pursuant to Section 12 (g) of the Act:
|
Common Stock, $.01 par value and Warrants
|
|
(Title of Each Class)
|
Indicate by check mark if the Registrant is a well-known seasoned issuer as defined in Rule 405 of the Securities Act. YES ¨ NO þ
Indicate by check mark if the Registrant is not required to file reports pursuant to Section 13 or Section 15(d) of the Act. YES ¨ NO þ
Indicate by check mark whether the Registrant (1) has filed all reports required to be filed by Section 13 or 15(d) of the Securities Exchange Act of 1934 during the preceding 12 months, and (2) has been subject to such filing requirements for the past 90 days. YES þ NO ¨
Indicate by check mark whether the Registrant has submitted electronically and posted on its corporate Web site, if any, every Interactive Data File required to be submitted and posted pursuant to Rule 405 of Regulation S-T (§ 232.405 of this chapter) during the preceding 12 months (or for such shorter period that the Registrant was required to submit and post such files). YES þ NO ¨
Indicate by check mark if disclosure of delinquent filers pursuant to Item 405 of Regulation S-K is not contained herein, and will not be contained, to the best of Registrant’s knowledge, in definitive proxy or information statements incorporated by reference in Part III of this Form 10-K or any amendment to this Form 10-K. þ
Indicate by check mark whether the registrant is a large accelerated filer, an accelerated filer, or a non-accelerated filer. See the definitions of “large accelerated filer”, “accelerated filer”, and “smaller reporting company” in Rule 12b-2 of the Exchange Act (Check one):
|
Large Accelerated Filer ¨
|
Accelerated Filer ¨
|
Non-Accelerated Filer ¨
|
Smaller Reporting Company þ
|
Indicate by check mark whether the Registrant is a shell company (as defined by Rule 12b-2 of the Exchange Act). YES ¨ NO þ
As of June 30, 2010, the aggregate market value of the Registrant’s common stock held by non-affiliates of the Registrant was approximately $15,142,825 based on the closing sales price as quoted on the NASD OTC Bulletin Board.
Common Stock outstanding as of March 29, 2011 — 80,837,310 shares.
DOCUMENTS INCORPORATED BY REFERENCE
None.
LAPOLLA INDUSTRIES, INC.
FORM 10-K
FOR THE YEAR ENDED DECEMBER 31, 2010
INDEX
|
Page
|
||
|
PART I
|
||
|
Item 1.
|
1
|
|
|
Item 1A.
|
3
|
|
|
Item 2.
|
3
|
|
|
Item 3.
|
3
|
|
|
PART II
|
||
|
Item 5.
|
4
|
|
|
Item 7.
|
5
|
|
|
Item 7A.
|
9
|
|
|
Item 8.
|
9
|
|
|
Item 9.
|
10
|
|
|
Item 9A.
|
10
|
|
|
Item 9B.
|
10
|
|
|
PART III
|
||
|
Item 10.
|
11
|
|
|
Item 11.
|
13
|
|
|
Item 12.
|
18
|
|
|
Item 13.
|
19
|
|
|
Item 14.
|
20
|
|
|
PART IV
|
||
|
Item 15.
|
21
|
|
| 22 | ||
| 23 | ||
| 24 | ||
FORWARD LOOKING STATEMENTS
Statements made by us in this report that are not historical facts constitute "forward-looking statements" within the meaning of Section 27A of the Securities Act of 1933, as amended, Section 21E of the Securities Exchange Act of 1934, as amended, and the Private Securities Litigation Reform Act of 1995.These forward-looking statements are necessarily estimates reflecting the best judgment of management and express our opinions about trends and factors which may impact future operating results. You can identify these and other forward-looking statements by the use of words such as “may,” “will,” “should,” “expects,” “plans,” “anticipates,” “believes,” “estimates,” “predicts,” “intends,” “potential,” “continue,” or the negative of such terms, or other comparable terminology. Such statements rely on a number of assumptions concerning future events, many of which are outside of our control, and involve risks and uncertainties that could cause actual results to differ materially from opinions and expectations. Any such forward-looking statements, whether made in this report or elsewhere, should be considered in context with the various disclosures made by us about our businesses including, without limitation, the risk factors discussed below. Although we believe our expectations are based on reasonable assumptions, judgments, and estimates, forward-looking statements involve known and unknown risks, uncertainties, contingencies, and other factors that could cause our or our industry's actual results, level of activity, performance or achievement to differ materially from those discussed in or implied by any forward-looking statements made by or on the Company and could cause our financial condition, results of operations, or cash flows to be materially adversely affected. Except as required under the federal securities laws and the rules and regulations of the U.S. Securities and Exchange Commission (“SEC”), we do not have any intention or obligation to update publicly any forward-looking statements, whether as a result of new information, future events, changes in assumptions, or otherwise.
PART I
As used in this report, “Lapolla” and the “Company” or “Us” or “We” refer to Lapolla Industries, Inc., unless the context otherwise requires. Our Internet website address is www.lapollaindustries.com. We make our periodic and current reports, together with amendments to these reports, available on our website, free of charge, as soon as reasonably practicable after such material is electronically filed with, or furnished to, the SEC. The information on our website is not incorporated by reference in this Annual Report on Form 10-K.
General Overview
Lapolla is a leading manufacturer and distributor of foam, coatings, and equipment, focused on developing and commercializing foam and coatings targeted at commercial and industrial and residential applications in the insulation and construction industries. Being back integrated in both foam and coating systems puts Lapolla in a strong competitive position as both product lines reduce energy consumption and ultimately lead to direct savings for consumers. Our products address growing consumer awareness of the building envelope. The building envelope is the separation between the interior and the exterior environments of a building and serves as the outer shell to protect the indoor environment as well as to facilitate its climate control. We provide superior insulation, an air barrier, and a vapor barrier with our products. We invest substantial resources to acquire, develop and commercialize a variety of foam and coatings products and related sales and marketing programs on a regular basis.
Operating Segments
We operate our business on the basis of two reportable segments — Foam and Coatings. The Foam segment involves producing building envelope insulation foam for interior application and roofing systems. The Coatings segment involves producing protective elastomeric coatings and primers. Both segments involve supplying equipment and related ancillary items used for application of our products. The following table sets forth, for the years indicated, sales for our Foam and Coatings segments:
|
2010
|
2009
|
|||||||
|
Foam
|
$ | 61,597,220 | $ | 43,080,741 | ||||
|
Coatings
|
$ | 8,899,409 | $ | 6,945,729 | ||||
Foam Segment
Our foam business involves supplying spray foam insulation and roofing foam to the construction industry. Spray foam insulation applications consist of perimeter wall, crawl space, and attic space commercial and industrial, and residential, applications. Roofing applications consist of new and retrofit commercial and industrial, and residential, applications. The start up of our own Foam Resin Plant in 2007 enabled Lapolla to benefit from the economics of manufacturing spray polyurethane foam systems as we opened up new sales opportunities through previously unavailable channels (e.g. distribution). Lapolla provides open and closed cell spray foam insulation, as well as closed cell technology for roofing, applications. We have attained certain third party credentials for our in-house manufactured spray foam systems, which is leading to greater acceptance of our proprietary foam products in our target markets. This segment also supplies adhesives and equipment for applications. We use our own distribution facilities, as well as public warehousing in certain local markets nationally to better serve our customers. Performance, availability, product credentials, approvals, technical and customer service, and pricing are major competitive factors in the spray foam business.
Coatings Segment
Our coatings business involves supplying a variety of protective coatings for roofing systems for new and retrofit commercial and industrial applications to the roofing industry. We use our own distribution facilities, as well as public warehousing in certain local markets nationally to better serve our customers. Product credentials, approvals and performance, pricing, technology, technical customer service, and availability are major competitive factors in our coatings business.
See also Note 20, “Business Segment Information,” in the notes to the financial statements listed under Item 15 of Part IV of this report.
International Operations
Our international sales, consisting primarily of our Canadian operations, represented approximately 12% and 10% of our total product sales for the year ended December 31, 2010 and 2009, respectively. We opened a registered Canadian branch office in Ontario in 2009 and a resident management team provides leadership and infrastructure for the customer-focused, rapid introduction of our products in the Canadian markets. We are also pursuing growth in our overseas international business and have entered into relationships in several European countries. We expect 2011 and beyond to reflect increased international growth and revenues.
Sales and Marketing
We maintain a growing national and limited international sales and marketing focus. Sales are concentrated on distributors and contractors in the insulation and roofing industries. Lapolla utilizes direct sales, independent representatives, distributors, and public bonded warehouses strategically positioned on a state or regional basis to serve customers. Insulation foam and reflective roof coatings are aggressively growing through enhanced consumer awareness due to nationally promoted programs from federal, state, municipal and other government agencies, energy companies, and private organizations. Some of these programs include the American Recovery and Reinvestment Act of 2009, Cool Roof Rating Council, Energy Star and state and utility company funded rebates to energy conscious building owners for following very specific recommendations, using reflectivity and emmissivity as the general goal in reducing the environmental impact of the “heat island effect”. Lapolla places a high priority on sales trending to create preparedness and processes to better serve customers. Information is gathered from sales, customers, management experience and historical trending to predict needed supply for stock and warehousing to meet the needs of our customers on a timely basis. Public warehousing, distribution and direct sales allow us to supply our customers in a timely and efficient fashion. The combined volumes of our products are disbursed throughout a broad customer base. This broad base assures lack of vulnerability to the loss of one key customer. Although sales plans include the addition of new and individually large volume customers, none today represent a significant adverse effect through such a loss.
Raw Materials
We place a high priority on forecasting material demand to meet customer demands in the most expedient and cost effective manner. The primary materials being used to manufacture our foam and coatings products are polyols, catalysts, resins, and titanium dioxide. The suppliers of the necessary raw materials are industry leaders in both the specific chemistries and basic in the manufacturing of the raw materials for supply. We maintain strong relationships and have commitments for continuing supply through times of shortage. A lengthy interruption of the supply of one of these materials could adversely affect our ability to manufacture and supply commercial product. With our volume potential, Lapolla continues to be a potentially lucrative target for vendors to assure their own growth and demand in 2009 and beyond. Our foam resins and acrylic coatings are manufactured in our Houston, Texas facility. We maintain sufficient manufacturing capacity at this facility to support our current forecasted demand as well as a substantial safety margin of additional capacity to meet peaks of demand and sales growth in excess of our current expectations.
Patents and Trademarks
We rely on our own proprietary technologies in our foam and coatings segments for finished goods formulations. Additionally, we also rely on trade secrets and proprietary know-how that we seek to protect, in part, through confidentiality agreements with our partners, customers, employees and consultants. We market our products under various trademarks, for which we have registered and unregistered trademark protection in the United States. These trademarks are considered to be valuable because of their contribution to market identification of our products.
Competition
Competition is based on a combination of product credentials, approvals, price, technology, availability, performance, and limited warranties. Lapolla is expanding through aggressive sales and marketing, competitive pricing, a selective sales force comprised of direct salespersons, independent representatives, and distributors, building owner and contractor brand awareness, and acquisitions. Lapolla differentiates itself from competitors by offering personalized sales support and providing efficient response time on issues ranging from technical service to delivery of products. We are one of the largest suppliers of spray polyurethane foam for insulation and roofing foam nationally with global expansion plans underway. The foam manufacturing industry consists of a few large and medium sized manufacturing companies with global, national and regional presence primarily relying on distributors to service markets. We are able to access distribution channels and penetrate target markets through direct sales more effectively as a manufacturer of foam resins. Our products are supplied primarily to large, medium and small insulation, roofing, and general contractors. Within the coatings industry, as manufacturers specifically focused on energy efficient acrylic coatings for roofing and construction as their primary line, Lapolla is a major player in a very fragmented market. Product credentials and approvals differentiate product lines and suppliers that are more readily suited to broad use and industry acceptance. We are currently listed with certain credentials and approvals to assure minimal restrictions in markets and uses. Lapolla utilizes advertising campaigns, articles in industry periodicals, trade show exposure, public relations, printed case studies, internet and website exposure, mailers and direct sales, distribution, and marketing to obtain greater product branding and recognition.
Employees
At December 31, 2010, we employed 79 full time individuals, none of which are represented by a union. We believe that our relations with our employees are generally very good.
Environmental Matters
We are subject to federal, state, and local environmental laws and regulations and believe that our operations comply in all material respects where we have a business presence. No significant expenditures are anticipated in order to comply with environmental laws and regulations that would have a material impact on our Company in 2011. We are not aware of any pending litigation or significant financial obligations arising from current or past environmental practices that are likely to have a material adverse effect on our financial position. However, we cannot assure you that environmental problems relating to properties operated by us will not develop in the future, and we cannot predict whether any such problems, if they were to develop, could require significant expenditures on our part. In addition, we are unable to predict what legislation or regulations may be adopted or enacted in the future with respect to environmental protection and waste disposal.
Seasonality
Lapolla’s business, taken as a whole, is materially affected by seasonal factors. Specifically, sales of our products tend to be lowest during the first and fourth fiscal quarters, with sales during the second and third fiscal quarters being comparable and marginally higher. Although our foam resins and acrylic coatings are restricted by cold temperatures, we have developed certain formulations that allow for a broader range of application in colder temperatures. By broadening and diversifying our foam and coatings products to those that are less sensitive to temperature during application, we increase the likelihood of less seasonal downward sales trending during the winter months. Inclement weather does impede sales, but it also produces a pent up demand that can be realized in the subsequent short term.
Historical Information
We were incorporated in the state of Delaware on October 20, 1989 and underwent a variety of name changes and operations. For our current operations, we acquired 100% of the capital stock of Infiniti Paint Co., Inc., a Florida corporation, effective September 1, 2001, which was engaged in the business of developing, marketing, selling, and distributing acrylic roof coatings, roof paints, polyurethane foam systems, sealants, and roof adhesives in the Southeastern United States. On December 20, 2004, we changed our name from Urecoats Industries, Inc. to IFT Corporation. During the latter part of 2004, our Infiniti Subsidiary built and began operating a manufacturing plant in the Southeastern United States. On February 11, 2005, we acquired 100% of the capital stock of Lapolla Industries, Inc., an Arizona corporation, which was engaged in the business of manufacturing acrylic roof coatings and sealants, and distributing polyurethane foam systems in the Southwestern United States. On April 1, 2005, our Infiniti subsidiary merged with and into our Lapolla subsidiary whereas the existence of our Infiniti subsidiary ceased. On October 1, 2005, our Lapolla subsidiary merged with and into the Company, under its former name of IFT Corporation, whereas the existence of our Lapolla subsidiary ceased. On November 8, 2005, the Company changed its name to Lapolla Industries, Inc.
As a leading national manufacturer and supplier of foam and coatings, we operate in a business environment that includes certain risks. The risks described in this section could adversely affect our sales, operating results and financial condition. Although the factors listed below are considered to be the most significant factors, they should not be considered a complete statement of all potential risks and uncertainties. Unlisted factors may present significant additional obstacles which may adversely affect our business.
· Global Economic Conditions - The current stabilizing global economic crisis described below should also be considered when reviewing each of the subsequent paragraphs setting forth the various aspects of our business, operations, and products. The inconsistent global economic recovery is causing unpredictable credit markets, irregular levels of liquidity, and rates of default and bankruptcy continue; however, increased consumer and business spending persists. Although the ultimate outcome of these events cannot be predicted, it may have a material adverse effect on the Company and our ability to borrow money in the credit markets and potentially to draw on our revolving credit facility or otherwise obtain financing on favorable terms. Similarly, current or potential customers and suppliers may no longer be in business, may be unable to fund purchases or determine to reduce purchases, all of which could lead to reduced demand for our products, reduced gross margins, and increased customer payment delays or defaults. Further, suppliers may not be able to supply us with needed raw materials on a timely basis, may increase prices or go out of business, which could result in our inability to meet customer demand in a timely manner or affect our gross margins. We are also limited in our ability to reduce costs to offset the results of a prolonged or severe economic downturn given certain fixed costs associated with our operations.
· Cost and Availability of Raw Materials - Our operating results are significantly affected by the cost of raw materials. We may not be able to fully offset the impact of higher raw materials through price increases or productivity improvements. Certain raw materials are critical to our production processes, such as polyols, catalysts, and titanium dioxide. The Company has supply arrangements to meet the planned operating requirements for the future. However, an inability to obtain these critical raw materials at any future date would adversely impact our ability to produce products.
· Retention of Key Personnel - Our success depends upon our retention of key managerial, technical, and selling personnel. The loss of the services of key personnel might significantly delay or prevent the achievement of our development and strategic objectives. Competition for such highly skilled employees in our industry is high, and we cannot be certain that we will be successful in recruiting or retaining such personnel. We also believe that our success depends to a significant extent on the ability of our key personnel to operate effectively, both individually and as a group. If we are unable to identify, hire and integrate new employees in a timely and cost-effective manner, our operating results may suffer.
· Acquisitions - As part of our business strategy, we regularly consider and, as appropriate, make acquisitions of technologies, products and businesses that we believe are synergistic. Our primary acquisition criterion is sales volume in our core foam and coatings competencies. Acquisitions may involve risks and could result in difficulties in integrating the operations, personnel, technologies and products of the companies acquired, some of which may result in significant charges to earnings. If we are unable to successfully integrate our acquisitions with our existing businesses, we may not obtain the advantages that the acquisitions were intended to create, which may materially adversely affect our business, results of operations, financial condition and cash flows, our ability to develop and introduce new products and the market price of our stock. In connection with acquisitions, we could experience disruption in our business or employee base, or key employees of companies that we acquire may seek employment elsewhere, including with our competitors. Furthermore, the products of companies we acquire may overlap with our products or those of our customers, creating conflicts with existing relationships or with other commitments that are detrimental to the integrated businesses.
· SEC Reviews - The reports of publicly-traded companies are subject to review by the SEC from time to time for the purpose of assisting companies in complying with applicable disclosure requirements and to enhance the overall effectiveness of companies’ public filings, and comprehensive reviews of such reports are now required at least every three years under the Sarbanes-Oxley Act of 2002. SEC reviews may be initiated at any time. While we believe that our previously filed SEC reports comply, and we intend that all future reports will comply in all material respects with the published rules and regulations of the SEC, we could be required to modify or reformulate information contained in prior filings as a result of an SEC review. Any modification or reformulation of information contained in such reports could be significant and could result in material liability to us and have a material adverse impact on the trading price of our common stock.
The Company has operating leases as follows:
|
Location
|
Description of Operations
|
Terms
|
|
Houston, Texas
|
Corporate, Customer Service, Distribution, Manufacturing, Marketing, Sales, and Training
|
01-01-2010 to 04-30-2016
|
|
Rutledge, Georgia
|
Customer Service, Distribution, Spray Rig Assembly, and Training
|
07-01-2008 to 12-31-2012
|
|
Ontario, Canada
|
Customer Service, Distribution, Sales, and Training
|
11-10-2010 to 11-09-2014
|
|
Margate, Florida
|
Sales and Technical Services
|
12-01-10 to 11-30-11
|
|
Englewood Cliffs, New Jersey
|
Sales
|
Month-to-Month
|
Our present facilities are adequate for our currently known and projected near term needs.
Item 3. Legal Proceedings
Legal Proceedings
We are involved in various lawsuits and claims arising in the ordinary course of business. These other matters are, in our opinion, immaterial both individually and in the aggregate with respect to our financial position, liquidity or results of operations.
PART II
Market Information
The following table shows the quarterly price range of our common stock during the periods listed.
|
2010
|
2009
|
|||||||||||||||
|
Calendar Quarter
|
High
|
Low
|
High
|
Low
|
||||||||||||
|
First
|
$ | 0.66 | $ | 0.36 | $ | 0.55 | $ | 0.24 | ||||||||
|
Second
|
$ | 0.66 | $ | 0.42 | $ | 0.55 | $ | 0.32 | ||||||||
|
Third
|
$ | 0.75 | $ | 0.48 | $ | 0.65 | $ | 0.26 | ||||||||
|
Fourth
|
$ | 0.65 | $ | 0.46 | $ | 0.50 | $ | 0.30 | ||||||||
Our common stock is traded on the NASDAQ O-T-C Bulletin Board under the symbol “LPAD”. As of March 29, 2011, there were approximately 3,750 holders of record of our common stock. We did not declare any dividends on our common stock during the past two years and do not anticipate declaring such dividends in 2011.
Securities Authorized for Issuance Under Equity Compensation Plans
The following table summarizes information about our common stock that may be issued upon the exercise of options, warrants and rights under all equity compensation plans, as of December 31, 2010:
|
Equity Compensation Plan Information
|
||||||||||||
|
Plan Category
|
Number of Securities to
Be Issued Upon Exercise
Of Outstanding Options,
Warrants and Rights
(a)
|
Weighted-Average
Exercise Price of
Outstanding Options,
Warrants and Rights
(b)
|
Number of Securities
Remaining Available for
Future Issuance Under
Equity Compensation Plans
(excluding Securities
Reflected in Column (a))
(c)
|
|||||||||
|
Equity Compensation Plans
|
||||||||||||
|
Approved by Security Holders (1)
|
6,140,333 | $ | 0.61 | 3,859,667 | ||||||||
|
Equity Compensation Plans Not
|
||||||||||||
|
Approved by Security Holders (2)
|
3,140,000 | $ | 0.65 | — | ||||||||
|
Total
|
9,280,333 | $ | 0.62 | 3,859,667 | ||||||||
(2) Represents 2,500,000 outstanding detachable Warrants issued by the Company in connection with certain prior financing agreements with ComVest (Refer to the Footnotes in the Stockholders Holding 5% or More section for more detailed information) and 640,000 outstanding restricted shares of common stock granted by the Company pursuant to a Director Plan (Refer to Note 18 – Share-Based Payment Arrangements, Director Plan, of our Notes to Financial Statements included in our annual report on Form 10-K for the year ended December 31, 2010 for a description of this plan).
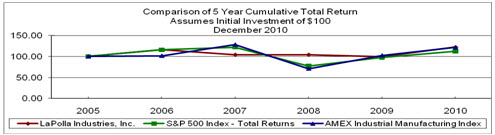
Performance Graph
Set forth below is a line graph comparing the yearly percentage change in the cumulative total stockholder return on our common stock with the cumulative total return of the S&P 500 Stock Index and the AMEX Industrial Manufacturing Index for the period beginning December 31, 2005 and ending December 31, 2010. The graph assumes that all dividends have been reinvested. We did not declare any dividends during the past five years.
Recent Sales of Unregistered Securities.
In private transactions relying on Section 4(2) of the Securities Exchange Act of 1933, as amended, we issued and/or exchanged an aggregate of 19,760,573 shares of our restricted common stock to directors and our majority stockholder. Refer to Note 17 - Securities Transactions, Items (c) and (d) in the Notes to the Financial Statements listed under Item 15 of Part IV of this report for more detailed information.
Item 7. Management's Discussion and Analysis of Financial Condition and Results of Operations.
Management's Discussion and Analysis
of Financial Condition and Results of Operations for the Three-Year Period Ended December 31, 2010
Overview
This financial review presents our operating results for each of the three years in the period ended December 31, 2010, and our financial condition at December 31, 2010. Except for the historical information contained herein, the following discussion contains forward-looking statements which are subject to known and unknown risks, uncertainties and other factors that may cause our actual results to differ materially from those expressed or implied by such forward-looking statements. We discuss such risks, uncertainties and other factors throughout this report and specifically under Item 1A of Part I of this report, “Risk Factors.” In addition, the following review should be read in connection with the information presented in our financial statements and the related notes to our financial statements. Refer to Item 8 of this Form 10-K, Note 1 – Summary of Significant Accounting Policies for further information regarding significant accounting policies and Note 20 – Business Segment Information in our financial statements listed under Item 15 of Part IV of this report for further information regarding our business segment structure.
Overall Results of Operations
Sales
The following is a summary of sales for the years ending December 31:
|
2010
|
2009
|
2008
|
||||||||||
|
Sales
|
$ | 70,496,629 | $ | 50,026,470 | $ | 48,141,182 | ||||||
Sales increased $20,470,159, or 40.9%, from 2009 to 2010, compared to an increase of $1,885,288, or 3.9%, from 2008 to 2009. From 2009 to 2010, sales increased $18,516,479, or 43.0%, for our foams, and $1,953,680, or 28.1%, for our coatings, due to higher demand attributed to cost conscious residential and commercial building owners transitioning from traditional fiberglass insulation and roofing systems to energy efficient SPF and acrylic coatings. From 2008 to 2009, sales increased $5,334,121, or 14.1%, for our foams, and sales decreased $3,448,833, or 33.2%, for our coatings, due to a general slowdown specifically in the roofing construction business from the tightened credit markets and recession. Management expected coatings sales to pick up in 2010 due to pent up demand from 2009. Highly volatile energy prices from 2008 throughout 2010 heightened the public’s interest for green building materials and sustainable energy solutions. Our acquisition of AirTight, a turn-key, equipment, startup, and training company, provided additional market penetration while converting additional existing insulators to foam, resulting in approximately $11.4 Million, $8.5 Million, and $4.6 Million (acquired AirTight assets on July 1, 2008), in sales in 2010, 2009, and 2008, respectively. Pricing changes reduced approximately $1,152,907 and $122,316, and added approximately $952,000 in sales, while sales volumes increased approximately $19,317,252, $2,007,604, and $15,348,383, for 2010, 2009, and 2008, respectively.
Cost of Sales
Cost of sales increased $16,244,543, or 43.3%, from 2009 to 2010, compared to a decrease of $1,449,692, or 3.7%, from 2008 to 2009. From 2009 to 2010, cost of sales increased $14,884,604, or 46.5%, for our foams, and $1,359,940, or 24.5%, for our coatings, due primarily to increases of $18,516,479, or 43.0%, and $1,953,680, or 28.1%, in our foam and coatings sales, respectively. We had a 58.6% increase in freight costs, along with a 2.9% increase in material costs, in 2010. Freight and material costs increased in 2010 due primarily to increased sales volumes. From 2008 to 2009, cost of sales increased $842,843, or 2.7%, for our foams, and decreased $2,379,213, or 30.0%, for our coatings, due primarily to an increase of $5,334,121, or 14.1%, and a decrease of $3,448,833, or 33.2%, in our foam and coatings sales, respectively. We had a 15.5% decrease in freight costs, along with a 2.7% decrease in material costs, in 2009. Freight costs had escalated in 2008 as surging oil prices justified higher trip rates as well as increased fuel surcharges during that time frame.
Gross Profit
Our gross profit increased $4,225,616, or 33.9% from 2009 to 2010, due to our sales growth, compared to, an increase of $3,334,980, or 36.8% from 2008 to 2009, due to our sales growth and reduced material costs. Gross margin percentage decreased 1.2% from 2009 to 2010 due primarily to increased freight costs, compared to a gross margin percentage increase of 6.1% from 2008 to 2009 due to reductions in material costs and increased manufacturing efficiencies primarily related to our foam resins.
Operating Expenses
Our total operating expenses are comprised of selling, general and administrative expenses, or SG&A, professional fees, depreciation, amortization of other intangible assets, and consulting fees. These total operating expenses increased $246,229, or 1.8% from 2009 to 2010, due to increases of $92,633 for SG&A, $78,036 for professional fees, $27,567 for depreciation, $21,127 for amortization of other intangible assets, and $26,866 for consulting fees, compared to, an increase of $1,105,300, or 9.0% from 2008 to 2009, due to increases of $925,995 for SG&A, $80,314 for depreciation, $218,719 for amortization of other intangible assets, $115,713 for consulting fees, offset by a decrease of $235,438 for professional fees.
SG&A increased $92,633, or 0.8%, from 2009 to 2010 due to increases of $67,357 for advertising, $487,364 for sales commissions, $238,881 for corporate, $10,174 for investor relations, $891,800 for payroll and related employee benefits, and $56,835 for travel and related services, offset by decreases of $649,691 for bad debts, $23,506 for distribution, $174,810 for insurances, $360,660 for marketing, promotions, and trade shows, $13,107 for rents, and $438,005 for share based compensation. The $487,364 increase in sales commissions was due to the 40.9% increase in sales. The $238,881 increase in corporate was primarily due to the establishment of the executive management EBITDA bonus program in 2010. The $892,800 increase in payroll and related employee benefits was due to increases in salaries and hiring of additional sales personnel to manage the 40.9% increase in sales volumes. The $649,691 decrease in bad debts in 2010 was due to an improved economic environment, tighter credit controls, and increased use of credit insurance. The $174,810 decrease in insurances was from reduced loss ratios under our various insurances, resulting in more competitive renewal costs. The $360,660 decrease in marketing, promotions, and trade shows, was from implementation of more efficient strategies. The $438,005 decrease in share-based compensation resulted from a reduction in outstanding stock option and restricted common stock incentive grants. SG&A increased $925,995, or 8.2%, from 2008 to 2009 due to increases of $868,736 for payroll and related employee benefits, $69,436 for insurances, $163,632 for travel and related services, $538,103 for marketing, promotions and trade shows, $203,071 for rents, $264,885 for bad debts, and $320,883 for corporate, offset by decreases of $265,033 for commissions, $143,014 for advertising, $78,949 for recruiting fees, $841,784 for share based compensation, and $173,971 for investor relations. The $264,885 increase in bad debts in 2009 includes some customer bankruptcies and defaults primarily from the first half of 2009 due to the tightening of the credit markets and recession. The $538,103 increase in marketing, promotions and trade shows was due to a broader based marketing program related to AirTight. The $327,790 increase in corporate expenses was primarily due to an increase in bank and credit card fees. The $868,736 increase in payroll and related employee benefits increased due to a full year of AirTight personnel (we acquired AirTight assets on July 1, 2008) and primarily hiring additional sales personnel. The $203,071 increase in rents is due in part to our expansion into the Canadian market.
Professional fees increased $78,036, or 27,7%, from 2009 to 2010 primarily due to increased legal fees related to review of various business agreements, compared to, a decrease of $235,438, or 45.5%, from 2008 to 2009 due to a continuation of cost reduction efforts initiated in 2008.
Depreciation expense increased $27,567, or 9.7% from 2009 to 2010 due to an increase in depreciable assets, primarily vehicles for our growing sales force, compared to, an increase of $80,314, or 39% from 2008 to 2009, primarily due to an increase in depreciable assets acquired in connection with the AirTight asset acquisition.
Amortization of other intangible assets expense increased $21,126, or 5.8%, from 2009 to 2010 due to an increase in amortizable assets primarily approvals and certifications, compared to, an increase of $218,716, or 149.4%, from 2008 to 2009, due primarily to an increase in amortizable assets acquired in connection with the AirTight asset acquisition.
Consulting fees increased $26,866, or 14.7%, from 2009 to 2010, compared to, an increase of $115,713, or 171.7%, from 2008 to 2009, due to retaining outside professionals for advisory and information technology services.
Other Income (Expense)
Our total other income (expense) are comprised of interest expense, interest expense – related party, interest expense – amortization of discount, gain or loss on derivative liability, and other, net. The total other income (expense) decreased $945,605, or 48.7% from 2009 to 2010, due to decreases of $372,730 for interest expense, $247,059 for interest expense - related party, and $209,853 for interest expense - amortization of discount, and an increase of $154,765 for other, net, offset by a reduction of $38,801 in gain on derivative liability, compared to, an increase of $1,125,972, or 137.8% from 2008 to 2009, due to increases of $393,226 for interest expense, $178,403 for interest expense – related party, and $419,519 for interest expense – amortization of discount, offset by an increase of $28,584 in other, net and a gain of $318,425 on derivative liability.
Interest expense decreased $372,730, or 31.4%, from 2009 to 2010 due to the Company obtaining asset based bank financing at competitive interest rates during the latter half of 2010, compared to, an increase of $393,226, or 49.6%, from 2008 to 2009 due primarily to an increase in the interest from the capital utilized from our former mezzanine styled credit instruments.
Interest expense – related party decreased $247,059, or 99.9%, from 2009 to 2010 due to a decrease in capital utilized from our Chairman of the Board, compared to, an increase of $178,403, or 259.1%, from 2008 to 2009 due to an increase in capital utilized from our Chairman of the Board.
Interest expense – amortization of discount decreased $209,853, or 23.0%, from 2009 to 2010 due to the Company paying off its mezzanine styled debt during the latter part of 2010 in connection with obtaining asset based bank financing on more favorable terms, compared to, an increase of $419,519, or 85.2%, from 2008 to 2009 due to the discount associated with our mezzanine styled credit instruments.
Derivative liability gain decreased $38,801, or 12.2%, from 2009 to 2010 due primarily to the volatility in the Company's common stock in relation to the outstanding detachable warrants granted in connection with the Company's former mezzanine styled debt instruments, compared to, a gain of $318,425 from 2008 to 2009 due to recognizing the value attributed to the embedded derivatives in our prior mezzanine styled convertible term note and related detachable warrants in 2009. We did not have any derivate liability in 2008.
Other, net increased $154,765, or 184.3%, from 2009 to 2010 due primarily to an increase in collection of finance charges related to extensions of credit on aged accounts receivable, compared to, an increase of $28,584, or 51.6%, from 2008 to 2009 due to an increase in royalties from the sale of our retail distribution channel in 2007, which royalties end in 2012.
Net Income (Loss)
Net income was $2,101,064 for 2010, compared to a net loss of $2,823,927 for 2009, due primarily to a $20,470,159, or 40.9% increase in sales resulting in a $4,225,616, or 33.9%, increase in gross profit, decreases of $649,691, or 60.5%, in bad debts, $174,810, or 31.2%, in insurance costs, $360,660, or 28.0%, in marketing, promotions, and trade shows, $438,005, or 81.3%, in share-based compensation, $372,730, or 31.4%, in interest expense, $247,059, or 99.9%, in interest expense - related party, $209,853, or 23.0%, in interest expense - amortization of discount, and $154,765, or 173.8%, in other, net. The foregoing was partially offset by increases of $487,364, or 59.0% in sales commissions, $238,881, or 17.3%, in corporate, $891,800, or 17.4%, in payroll and related employee benefits, $21,126, or 5.8%, in amortization of other intangible assets. Net income per share was $0.03 for 2010 compared to a net loss per share of $0.06 for 2009. Net loss decreased $1,190,390, or 29.7%, from 2008 to 2009 due primarily to a $1,885,288, or 3.9% increase in sales and a $1,536,370, or 3.9%, decrease in cost of sales, resulting in an increase of $3,421,658, or 37.8%, in gross profit, and decreases of $265,033, or 24.3%, in sales commissions, $143,014, or 47.7%, in advertising, $841,784, or 61.0%, in share based compensation, and $173,971, or 80%, in investor relations, $235,438, or 45.5%, in professional fees, and a gain of $318,425 in derivative liability. The foregoing was partially offset by increases of $868,736, or 20.3%, in payroll and related employee benefits, $163,632, or 38.3%, in travel and related services, $538,103, or 73.1%, in marketing, promotions and trade shows, $203,071, or 61.1%, in rents, $264,885, or 19.2%, in bad debts, $327,790, or 33.1%, in corporate expenses, $125,130, or 85.5%, in amortization of other intangible assets, $218,716, or 149.4%, $115,713, or 171.7% in consulting fees, $393,226, or 49.6%, in interest expense, $178,403, or 259.1% in interest expense - related party, and $419,519, or 85.2%, in interest expense - amortization of discount. Net loss per share decreased $0.02, or 34%, from 2008 to 2009.
Net Income (Loss) Available to Common Stockholders
Net income available to common stockholders and related income per share was $772,934 and $0.01 for the year ended December 31, 2010, respectively, compared to, a net loss available to common stockholders and related loss per share of $3,640,952 and $0.06 for the year ended December 31, 2009, respectively. We had a $511,106, or 62.6%, increase in our preferred stock dividends from 2009 to 2010 due to an increase in the amount of Series D Preferred Stock outstanding during 2010, compared to, a $575, or 0.0%, decrease in our preferred stock dividends from 2008 to 2009 due to a decrease in the amount of Series D Preferred Stock outstanding during 2009.
Results of Business Segments
The following is a summary of sales by segment for the years ending December 31:
|
Segments
|
2010
|
2009
|
2008
|
|||||||||
|
Foam
|
$ | 61,597,220 | $ | 43,080,741 | $ | 37,746,620 | ||||||
|
Coatings
|
$ | 8,899,409 | $ | 6,945,729 | $ | 10,394,562 | ||||||
Foam Segment
Foam sales increased $18,516,479, or 43.0%, from 2009 to 2010, compared to, an increase of $5,334,121, or 14.1%, from 2008 to 2009, due to energy conscious building owners and consumers continuing to seek relief from costly energy prices, as spray polyurethane foam (SPF) gains market share from the paradigm shift away from traditional insulation systems such as fiberglass. AirTight furthered our market penetration into the foam segment through its start-up training and rig building operations. By providing new market entrants as well as existing fiberglass insulation companies with the know-how to successfully enter the SPF markets through our AirTight program, Lapolla's growth from equipment sales has escalated resulting in substantial market gains from sales of SPF. Foam equipment sales increased $1,574,577, or 76.9%, from 2009 to 2010, compared to, an increase of $226,694, or 12.5%, from 2008 to 2009. Foam cost of sales increased $14,884,604, or 46.5%, due to a $18,516,479, or 43.0%, increase in sales, offset by higher freight costs, from 2009 to 2010, compared to, an increase of $842,843, or 2.7%, from 2008 to 2009, due to a $5,334,121, or 14.1%, increase in sales, offset by reductions in material costs. Foam gross profit increased $3,631,875, or 32.8%, due to higher sales volumes, and gross margin percentage decreased 1.8%, primarily from higher freight costs, from 2009 to 2010, compared to, a gross profit increase of $4,491,278, or 68.3%, due to higher sales volumes, and a gross margin percentage increase of 8.3%, primarily from manufacturing efficiencies and economies of scale related to the full year production of in-house manufactured resins, from 2008 to 2009. Foam segment profit increased $3,745,166, or 299.5%, from 2009 to 2010, primarily due to a $18,516,479, or 43.0%, increase in sales, compared to, a segment profit of $1,250,640 in 2009 and segment loss of $127,047 in 2008. The steady rise to a foam segment profit in 2009 and 2010 compared to the segment loss in 2008 was primarily due to achieving targeted market share gains.
Coatings Segment
Coatings sales increased $1,953,680, or 28.1%, from 2009 to 2010, due to increased demand from general economic improvements and loosening of credit markets, compared to, a decrease of $3,448,833, or 33.2%, from 2008 to 2009, due to a general slowdown in the roofing construction business from the tightened credit markets and recession. Coating equipment sales increased $147,343, or 72.6%, from 2009 to 2010, due to an increase in demand, compared to, a decrease of $120,301, or 37.2%, from 2008 to 2009, due to a decrease in demand. Coatings cost of sales increased $1,359,939, or 24.5%, due to a $1,953,680, or 28.1%, increase in sales and higher material costs, from 2009 to 2010, compared to, a decrease of $2,379,213, or 30.0%, from 2008 to 2009, due to a $3,448,833, or 33.2%, decrease in sales. Coatings gross profit increased $593,741, or 42.2%, due to higher sales volumes, and gross margin percentage increased 2.2%, primarily from manufacturing efficiencies, partially offset by higher material costs, from 2009 to 2010, compared to, a gross profit decrease of $1,069,620, or 43.2% and a gross margin percentage decrease of 3.6%, primarily from lower sales volumes, from 2008 to 2009. Coating segment profit increased $776,160, or 544.6%, from 2009 to 2010, due to higher sales volumes, compared to, a segment loss of $142,508 in 2009 due to lower sales volumes primarily from the tightened credit markets and recession, and a segment profit of $683,250 in 2008 due to high sales volumes, partially offset by the onset of the tightening credit markets and recession.
Total Segments
Total sales increased 20,470,159, or 40.9%, from 2009 to 2010, compared to, an increase of $1,885,288, or 3.9%, from 2008 to 2009. Total equipment sales increased $1,721,920, or 76.5%, from 2009 to 2010, compared to, an increase of $106,393, or 5.0%, from 2008 to 2009. Total cost of sales increased $16,244,543, or 43.3%, from 2009 to 2010, compared to, a decrease of $1,536,370, or 3.9%, from 2008 to 2009. Total gross profits increased $4,225,616, or 33.9%, and gross margin percentage decreased 1.2%, from 2009 to 2010, compared to, a gross profits increase of $3,421,658, or 37.8%, and a gross margin percentage increase of 6.1%, from 2008 to 2009. Total segment profits increased $4,566,157, or 412.1%, from 2009 to 2010, compared to, an increase of $551,929, or 99.2%, from 2008 to 2009.
Outlook for 2011
The Company’s outlook remains very aggressive and positive, as we expect sales to continue to grow to record levels in 2011. Our optimism is based on our market share gains in the insulation and construction markets which are driven by growing consumer awareness about energy efficient foams and coatings. The markets for our products are highly competitive; however, we believe that our competitive advantages are rooted in our product formulations, credentials, approvals, performance, pricing, and technical customer service. In addition, we offer the flexibility, quality of products and responsiveness that a smaller company can offer. This outlook is based on a number of assumptions relating to our business and operations which are subject to change, some of which are outside our control. A variation in our assumptions may result in a change in this outlook.
Liquidity and Capital Resources
Cash on hand decreased $400,523, from 2009 to 2010, due to the automatic sweep of our bank accounts to pay down our new Revolver Loan pursuant to our agreement with our banking institution, compared to, an increase of $357,976, from 2008 to 2009 when we did not have an automatic sweep feature in place and paid down our prior revolving credit note on a periodic basis. Stockholders' Equity increased $2,546,362, or 67.7%, from 2009 to 2010, due primarily to net income of $2,101,064 and $100,831 in share-based compensation, offset primarily by $1,328,131 in accrued preferred stock dividends and a $100,000 voluntary redemption of preferred stock, compared to, an increase of $1,484,003, or 65.1%, from 2008 to 2009, due primarily to the issuance of $5,834,160 in preferred stock and $278,836 in share-based compensation, offset primarily by a net loss of $2,823,927, recognition of the net fair value on derivative liabilities related to mezzanine styled financing (convertible debt and warrants) of $890,292 and a $100,000 voluntary redemption of preferred stock. During 2010, we refinanced our mezzanine styled credit instruments, which matured on August 31, 2010, with asset based bank financing on substantially improved financial terms. Our bank financing provided us with a Term Loan of $2.5 Million, which was used to pay off our matured convertible term loan, and a Revolver Loan for $10 Million, which was used to pay off our matured revolving credit note and make available working capital to meet our continuing operating requirements. Although our excess cash flow has improved substantially from 2008 to 2010 due primarily to the increased gross profit associated with our record sales volumes, as well as cost controls keeping our operating expenses in line with our budget, we continue to experience record sales growth into 2011, and the associated increases in accounts receivable, inventory, and expenses to support our rapid incline may require additional cash liquidity. As a result, we are seeking a $3 Million increase under our Revolver Loan, which may be required by us to sustain our aggressive growth. Management believes that the cash on hand, cash generated from operations, and the Revolver Loan, subject to borrowing base limitations (as described below) from our banking institution, will be sufficient to fund operations, including any capital expenditures (budgeted $250,000), through fiscal 2011. Notwithstanding the foregoing, we may seek to raise additional capital through private placements of debt, or common or preferred stock with accredited sophisticated investors, to fund our aggressive strategic growth plans. If the Company chooses to raise additional capital, anti-dilution provisions under the outstanding detachable warrants issued in connection with our prior mezzanine styled financing may be triggered if any security sold is convertible into or exchangeable for our common stock based on the price of the common stock sold. Moreover, pursuant to our bank financing Loan Agreement, we must prepay any amount outstanding under the Term Loan out of the net proceeds of the capital raised. The Loan Agreement limitation may adversely impact our ability to raise additional capital.
Net cash provided by operations was $2,749,855 in 2010, compared to, net cash used by our operations of $2,688,144 in 2009. The cash provided by operations for 2010 as compared to cash used in 2009 was attributable to net income of $2,101,064 for the year, including the effect of adjustments to reconcile net income to cash provided by or used in operating activities and adjusting for non-cash items, primarily decreases of $720,279 in provision for losses on accounts receivable due to improved economic conditions, better utilization of credit insurance, and tightened credit controls, $209,853 in amortization of discount on convertible note and revolving credit note due to both being paid off in 2010, and $438,005 in share-based compensation due to renegotiation of the CEO and President's employment agreement in 2010 which stopped certain canceled unvested stock options from being expensed. The foregoing was augmented by increases of $3,175,303 in trade receivables, $878,852 in inventories, $368,358 in prepaid expenses and other current assets, $386,232 in deposits and other non-current assets, $2,771,464 in accounts payable, and $870,530 in accrued expenses and other current liabilities, due to an increase of $20,470,159 in sales. Net cash used in operations was $2,688,144 in 2009, reflecting a decrease of $4,689,326 when compared to the net cash used of $7,377,470 in 2008. The cash used in operations for 2009 as compared to 2008 was attributable to the net loss of $2,823,927 for the year, including the effect of adjustments to reconcile net loss to cash provided by or used in operating activities and adjusting for non-cash items, primarily increases of $218,712 in amortization of other intangible assets due to a full year of expense relating to the AirTight assets acquired in July 2008 and approval and certification costs necessary for market entry of products, $264,875 in provisions for losses on accounts receivable due to the general slowdown of the economy from 2008 to the first half of 2009, and $841,784 in share-based compensation due to a decrease in utilization of stock options. The foregoing was augmented by an increase of $976,429 in trade receivables due to an increase of $1,885,288 in sales, offset by decreases of $290,774 in inventories due to more efficient utilization, $151,766 in prepaid expenses and other current assets and $252,718 in deposits and other non-current assets due to reclassification of approval and certification costs into an other intangible asset, $1,351,190 in accounts payable, and $847,060 in accrued expenses and other current liabilities due to tighter cost controls.
Contractual Obligations
|
Payments Due By Period
|
||||||||||||||||||||
|
Less Than
1 Year
|
1 to 3
Years
|
4 to 5
Years
|
More Than
5 Years
|
Total
|
||||||||||||||||
|
Term Loan
|
$ | 1,250,000 | $ | 937,500 | $ | — | $ | — | $ | 2,187,500 | ||||||||||
|
Revolving Loan
|
— | 7,578,262 | — | — | 7,578,262 | |||||||||||||||
|
Long-Term Debt Obligations
|
45,464 | 70,062 | — | — | 115,526 | |||||||||||||||
|
Estimated Interest Payments on Long-Term Debt and Loan Obligations
|
445,409 | 650,899 | — | — | 1,096,308 | |||||||||||||||
|
Purchase Order Obligations
|
239,139 | — | — | — | 239,139 | |||||||||||||||
|
Operating Lease Obligations
|
336,155 | 1,044,873 | 377,874 | — | 1,758,902 | |||||||||||||||
|
Total
|
$ | 2,316,167 | $ | 10,281,596 | $ | 377,874 | $ | — | $ | 12,975,637 | ||||||||||
The Company has three material debt covenants to comply with: (i) Capital expenditures are limited to $500,000 on an annual basis, (ii) A borrowing base calculation defined as an amount determined by a detailed calculation equal to 85% of eligible accounts receivable, plus 55% of eligible inventory cannot be exceeded (“Borrowing Base”); and (iii) a monthly EBITDA calculation must be met for 2010 only. A fixed charge coverage ratio of at least 1.1 to 1.0 replaces the monthly EBITDA calculation and will be tested monthly beginning as of January 2011. We were in compliance with our debt covenants at December 31, 2010. The Company is required to submit its Borrowing Base calculation to its financing institution daily. If, at any time, the Company’s Borrowing Base calculation is less than the amount outstanding under the Revolver Loan, and that amount remains unpaid or is not increased from future Borrowing Base calculations to an amount equal to the balance outstanding under the Revolver Loan at any given time, the financing institution, in its discretion, may accelerate any and all amounts outstanding under the Bank Loans.
Net cash used in investing activities was $786,715 in 2010, reflecting an increase of $460,362 when compared to $326,353 in 2009. We invested $606,544 in property, plant and equipment in 2010, of which $157,634 was for vehicles for our CEO and President and sales personnel, $32,434 was for leasehold improvements, $68,510 was for office furniture and equipment, $154,834 was for computers and software to upgrade servers and accounting software, and $152,406 was for machinery and equipment for improvements to our manufacturing facilities, as well as $180,172 for the adjusted purchase price of the AirTight’s assets acquired in July 2008. Net cash used in investing activities was $326,353 in 2009, reflecting an increase of $67,561 when compared to $258,792 in 2008. We invested $236,268 in property, plant and equipment in 2009, of which $110,852 was for vehicles for sales personnel, $6,114 was for leasehold improvements, $7,278 was for office furniture and equipment, $74,077 was for computers and software, $24,064 was for machinery and equipment, and $17,111 was for construction in progress.
Net cash used in financing activities was $2,341,086 in 2010, compared to, net cash provided by financing activities of $3,376,066 in 2009. Under our prior mezzanine styled credit instruments, we borrowed $800,000 under the revolving credit note and subsequently paid off the $9,330,191 balance on the matured revolving credit note and $2,500,000 balance on the matured convertible term note upon attaining replacement financing, which included a $2,500,000 Term Loan (of which we made principal repayments of $312,501 as of December 31, 2010) and $10,000,000 Revolver Loan, with a banking institution on September 1, 2010. We made principal repayments of $101,656 on our long term debt, and paid $875,000 for preferred stock dividends to our Chairman of the Board (prior to obtaining bank financing, which financing puts a restriction on repayment of future dividends until the Term Loan is paid off and certain debt-to-equity ratios are satisfied) and $100,000 for the voluntary redemption of 100 shares of our preferred stock by a director. Net cash provided by financing activities was $3,376,066 in 2009, reflecting a decrease of $3,963,188 when compared to $7,339,254 in 2008. Net cash was provided by our Chairman to finance our operations and capital expenditures in 2009. Our Chairman provided $4,300,000 under a financial commitment in the form of short term loans. During 2009, we made principal repayments of $500,000 under our mezzanine styled convertible term note and paid $183,887 for preferred stock dividends to our Chairman of the Board.
Indemnification
Our Restated Certificate of Incorporation, as amended from time to time, provides that we will indemnify, to the fullest extent permitted by the Delaware General Corporation Law, each person that is involved in or is, or is threatened to be, made a party to any action, suit or proceeding by reason of the fact that he or she, or a person of whom he or she is the legal representative, is or was a director or officer of the Company or was serving at our request as a director, officer, employee or agent of another corporation or of a partnership, joint venture, trust or other enterprise. We have purchased insurance policies covering personal injury, property damage and general liability intended to reduce our exposure for indemnification and to enable us to recover a portion of any future amounts paid.
Market Risk
We do not issue or invest in financial instruments or their derivatives for trading or speculative purposes. Although we maintain limited operations in Canada, our operations are primarily conducted in the United States, and, as such, we are not subject to material foreign currency exchange risks. We have outstanding debt and related interest expense, however, market risk in interest rate exposure in the United States and Canada is currently not material to our operations. We utilize letters of credit to mitigate any risk of collection in our business outside of the United States and Canada.
The information required by this Item is incorporated herein by reference to the financial statements set forth in Item 15 of Part IV of this report, “Exhibits and Financial Statement Schedules.”
None.
(a) Evaluation of Disclosure Controls and Procedures
We maintain disclosure controls and procedures that are designed to ensure that information required to be disclosed in our Exchange Act reports is recorded, processed, summarized and reported within the time periods specified in the SEC’s rules and forms, and that such information is accumulated and communicated to our management, including our Principal Executive Officer and our Principal Financial Officer, as appropriate, to allow timely decisions regarding required disclosures. Our management, including our Principal Executive Officer and our Principal Financial Officer, does not expect that our disclosure controls or procedures will prevent all error and all fraud. A control system, no matter how well conceived and operated, can provide only reasonable, not absolute, assurance that the objectives of the control system are met. Further, the benefits of controls must be considered relative to their costs. Because of the inherent limitations in all control systems, no evaluation of controls can provide absolute assurance that all control issues and instances of fraud, if any, have been detected. These inherent limitations include the realities that judgments in decision-making can be faulty, and that breakdowns can occur because of simple error or mistake. Additionally, controls can be circumvented by the individual acts of some persons, by collusion of two or more people, or by management override of the control. The design of any system of controls is also based in part upon certain assumptions about the likelihood of future events, and there can be no assurance that any design will succeed in achieving its stated goals under all potential future conditions. Because of the inherent limitations in a cost-effective control system, misstatements due to error or fraud may occur and not be detected. We carried out an evaluation, under the supervision and with the participation of our management, including our Principal Executive Officer and our Principal Financial Officer, of the effectiveness of the design and operation of our disclosure controls and procedures as of December 31, 2010, the end of the annual period covered by this report. The evaluation of our disclosure controls and procedures included a review of the disclosure controls’ and procedures’ objectives, design, implementation and the effect of the controls and procedures on the information generated for use in this report. In the course of our evaluation, we sought to identify data errors, control problems or acts of fraud and to confirm the appropriate corrective actions, including process improvements, were being undertaken. Based on the foregoing, our Principal Executive Officer and our Principal Financial Officer concluded that, as of the end of the period covered by this report, our disclosure controls and procedures were effective and operating at the reasonable assurance level.
(b) Management’s Report on Internal Control Over Financial Reporting
We are responsible for establishing and maintaining adequate internal control over financial reporting, as is defined in the Exchange Act, pursuant to the SEC’s rules and regulations. We maintain a system of internal control over financial reporting based on criteria established by Committee of Sponsoring Organizations of the Treadway Commission ("COSO"). These internal controls are designed to provide reasonable assurance that the reported financial information is presented fairly, that disclosures are adequate and that the judgments inherent in the preparation of financial statements are reasonable. There are inherent limitations in the effectiveness of any system of internal control, including the possibility of human error and overriding of controls. Consequently, an effective internal control system can only provide reasonable, not absolute, assurance, with respect to reporting financial information. We conducted an evaluation of the effectiveness of our internal control over financial reporting based on the framework and criteria established by COSO. Based on this evaluation, we concluded that our internal control over financial reporting was, as of the December 31, 2010, the end of the annual period covered by this report, effective. There were no changes in our internal control over financial reporting during our fourth fiscal quarter that has materially affected, or is reasonably likely to materially affect, our internal control over financial reporting.
None.
PART III
Item 10. Directors, Executive Officers and Corporate Governance
Directors and Executive Officers
Set forth below are descriptions of the backgrounds of each incumbent nominee, their ages, and their principal occupations for at least the past five years and their public-company directorships as of the record date. There are no familial relationships among any of our directors or among any of our directors and executive officers.
 |
Richard J. Kurtz
|
70
|
Director since November 23, 1998
|
|
Chairman of the Board
Mr. Kurtz has been chief executive officer of the Kamson Corporation, a privately held corporation, in business for the past 33 years. The Kamson Corporation has its principal executive offices located in Englewood Cliffs, New Jersey and currently owns and operates eighty one (81) investment properties in the Northeastern U.S. Mr. Kurtz is a graduate of the University of Miami and a member of its President's Club. Most notably, the Chamber of Commerce in Englewood Cliffs and the Boy Scouts of America chose him Man of the Year. Mr. Kurtz resides in Alpine, New Jersey and is currently vice president and a member of the Board of Directors for the Jewish Community Center on the Palisades in Tenafly, New Jersey. He is also an elected member of the Board of Trustees and Foundation Board for the Englewood Hospital and Medical Center of New Jersey and the Board of Governors for the Jewish Home and Rehabilitation Center.
|
|||
 |
Lt. Gen. Arthur J. Gregg (US Army) (Ret.)
|
82
|
Director since February 21, 2000
|
|
Lt. Gen. Gregg has more than sixty years of distinguished military and business experience. His record of performance repeatedly demonstrates the ability to lead organizations to success. As a result of his extensive military and executive experience, he has considerable contacts and respect within federal government agencies and private industry. Lt. Gen. Gregg has retired from active management but continues an active schedule as a member of several corporate and nonprofit boards. He chairs four of these boards. His education includes Harvard University, John F. Kennedy School of Government Concentrated Executive Program in National Security; Saint Benedict College Atchison, Kansas, Bachelor of Science in Business Administration (Summa cum Laude); Army War College, Carlisle Barracks, Pennsylvania, One-year graduate level college; Command and General Staff College, Fort Leavenworth, Kansas, One-year graduate level college.
|
|||
 |
Jay C. Nadel
|
52
|
Director since January 16, 2007
|
|
Mr. Nadel is chairman of the board of Englewood Hospital and Medical Center since September 2006. In addition to being an independent consultant since 2004, Mr. Nadel is an employee of Sloan Securities since January 2006. As a CPA and senior financial services executive, Mr. Nadel has extensive business management and operations experience. From 2002 to 2004, he was executive vice president of Bank of New York’s Clearing Services where he oversaw strategic planning; from 1986 to 2001, he was a partner in the investment firm of Weiss, Peck & Greer/Robeco, wherein he was chairman of the operations committee and managing director of the firm’s Clearing Services Division; and from 1980 to 1986, he was a manager at KPMG Peat Marwick, New York, where he provided audit services. Mr. Nadel is a Certified Public Accountant since 1980 and has a Bachelor of Science degree from the University of Maryland.
|
|||
 |
Augustus J. Larson
|
56
|
Director since January 16, 2007
|
|
Mr. Larson is president of Larson Capital, LLC, a commercial real estate finance and investment company in Far Hills, New Jersey. He founded Larson Capital, LLC in 2004. From 2001 to 2003, Mr. Larson was managing director of PW Funding and directed its commercial and multi-family real estate loan production in the metro New Jersey and New York markets. He is currently a presiding director of the newly formed Somerset County region Team Capital Bank in Somerville, New Jersey, and as such is also a member of the of the Management Board of Team Capital Bank, which is a federally chartered savings bank providing commercial banking services in eastern Pennsylvania and New Jersey. Mr. Larson is a councilman in the Borough of Far Hills, New Jersey. He has a Bachelor of Arts from Colgate University in New York. He is also a certified mortgage banker and an active member in numerous professional and charitable organizations.
|
|||
 |
Howard L. Brown
|
65
|
Director since May 22, 2007
|
|
Mr. Brown has over 36 years experience in sales, distribution, financial forecasting and planning, mergers and acquisitions and quality assurance. He was chairman and chief executive officer of Allied Office Products, headquartered in Clifton, New Jersey, the country's largest independent dealer of office products and services, which was sold to Office Depot in 2006. Allied, prior to the sale, had grown annual sales to more than $350 Million from over 30 acquisitions beginning in 1998. In May of 2010 Mr. Brown started HiTouch Business Services and in November of 2010 acquired MyOfficeProducts, Inc. which combined are currently doing in excess of $200 Million in revenue. Mr. Brown is a graduate of Syracuse University and a philanthropist.
|
|||
 |
Douglas J. Kramer
|
47
|
Director, CEO and President
|
|
Mr. Kramer joined the Company in February 2005 as president and chief operating officer and was named Chief Executive Officer and President in July 2006. He was appointed to the Board on January 16, 2007. Mr. Kramer has 23 years Industry Experience. Prior to joining Lapolla, he was vice president of the Construction Products Division for Foam Enterprises, LLC, a wholly-owned subsidiary of the BASF Corporation, where he was employed from 1997 to 2004. Mr. Kramer has a background in Liberal Arts from Penn State University and the University of Texas.
|
|||
 |
Michael T. Adams
|
45
|
Director, CGO, EVP and Secretary
|
|
Mr. Adams has more than fifteen years experience with Lapolla. He was appointed to the Board on December 20, 2004. Mr. Adams was appointed Chief Governance Officer in July 2006, and has been Executive Vice President and Secretary since January 1999. During his term with Lapolla, Mr. Adams also served as president and interim chief executive officer, treasurer and interim chief financial officer, and held various officer positions in the Company’s former subsidiaries since he first joined the Company in January 1997. He is also actively involved and a member of his local community association’s board of directors in New Caney, Texas. Mr. Adams earned his Bachelor of Science and Master of Science in business administration, and Juris Doctor degrees from Nova Southeastern University, Fort Lauderdale, Florida.
|
|||
 |
Charles A. Zajaczkowski
|
51
|
CFO and Treasurer
|
|
Mr. Zajaczkowski joined Lapolla on May 10, 2010 as CFO and Treasurer. Before joining Lapolla, he worked for PMC Global Incorporated, a company operating a diverse array businesses on a worldwide basis, for over 15 years in a variety of capacities, including president of Komo Machine, Inc. from 2003 through 2009, president of future coatings, inc from 2001 to 2003, controller of PMC, Inc. from 2000 to 2001, and chief financial officer of IPI International, Inc. from 1995 to 2000. He earned his Bachelor of Science degree in Business Administration from Delaware State College in Dover, Delaware and Associate of Applied Sciences in Mechanical Engineering from Delaware Technical and Community College in Newark, Delaware.
|
|||
- Executive Officers are appointed by and hold office at the pleasure of the Board of Directors.
- Michael T. Adams acted as the Interim CFO and Treasurer from November 11, 2009 until May 10, 2010.
Section 16(a) Beneficial Ownership Reporting Compliance
Section 16(a) of the Securities Exchange Act of 1934, as amended (“Exchange Act”), requires our executive officers, directors and persons who own more than ten percent of a registered class of our equity securities to file reports of ownership and changes in ownership with the SEC. Executive officers, directors and greater than ten-percent stockholders are required by SEC regulation to furnish us with copies of all Section 16(a) forms they file. Based solely on our review of the copies of such forms furnished to us or the written representations from certain of the reporting persons that no other reports were required, we do not believe that during the fiscal year ended December 31, 2010, all executive officers, directors and greater than ten-percent beneficial owners complied with the reporting requirements of Section 16(a).
Code of Business Ethics and Conduct
We have adopted a Code of Business Ethics and Conduct ("Code of Conduct"), which contains general guidelines for conducting our business and is designed to help directors, employees and independent consultants resolve ethical issues in an increasingly complex business environment. The Code of Conduct applies to all directors, consultants and employees, including our principal executive officer and our principal financial officer and any other employee with any responsibility for the preparation and filing of documents with the SEC. The Code of Conduct covers topics including, but not limited to, conflicts of interest, confidentiality of information and compliance with laws and regulations. A copy of the Code of Conduct is available in the Corporate Governance section of our website at www.lapollaindustries.com. The information on our website is not incorporated by reference in this annual report. We may post amendments to or waivers of the provisions of the Code of Conduct, if any, made with respect to any directors and employees on that website. Our stockholders may request a copy of our Code of Conduct by writing to Lapolla Industries, Inc., Attn: Corporate Secretary, Intercontinental Business Park, 15402 Vantage Parkway East, Suite 322, Houston, Texas 77032.
Nominating Function
The Corporate Governance Committee handles the nominating function for Board of Directors, including but not limited to, evaluating candidates for membership on the Board and making recommendations to the Board regarding candidates and composition of the Board. There have been no changes to the procedures by which security holders may recommend nominees to the Company’s Board of Directors since the last disclosure of such procedures in the Company Proxy Statement filed with the SEC on April 30, 2007. Our Director Selection Process criterion is available on our website at http://www.lapollaindustries.com/pdf/directorselection.pdf.
Audit Committee
The Board of Directors has a standing Audit Committee, which is comprised of Augustus J. Larson, Chairperson, and Lt. Gen. Arthur J. Gregg, US Army (Ret). Each member of our Audit Committee meets the independence criteria by applicable SEC rules for audit committee membership and is an “independent director”. In addition, Mr. Larson is our “audit committee financial expert” as such term is described in applicable SEC regulations. Refer to Directors above for information on Mr. Larson’s and Lt. Gen. Gregg's qualifications.
Item 11. Executive Compensation
Executive Compensation Discussion and Analysis
This Executive Compensation Discussion and Analysis section discusses the compensation policies and programs for our named executive officers consisting of our CEO and President (Mr. Kramer), CGO, EVP, and Secretary (Mr. Adams), and our CFO and Treasurer (Mr. Zajaczkowski). The Compensation Committee administers the compensation policies and programs for our named executive officers, as well as the cash- and equity-based incentive compensation plans in which those persons participate.
Compensation Objectives
The Compensation Committee’s philosophy is to provide a compensation package that attracts, motivates and retains executive talent, and delivers rewards for superior performance as well as consequences for underperformance. The objectives of the Compensation Committee’s compensation practices are to (a) provide a total compensation program that is competitive in the industries in which we compete for executive talent; (b) place a significant portion of executive compensation at risk by linking such compensation to the achievement of corporate financial performance objectives and individual objectives; (c) provide long-term incentive compensation that focuses executives’ efforts on building stockholder value by aligning their interests with our stockholders; and (d) provide incentives that promote executive retention. In designing and administering our executive compensation programs, we attempt to strike an appropriate balance among these elements, as discussed below.
The major compensation elements for our named executive officers are base salary, annual bonuses, equity awards, insurance benefits, and vehicle allowances. Each of these elements is an integral part of and supports our overall compensation objectives. Base salaries (other than increases), insurance benefits and perquisites form stable parts of our named executive officers’ compensation packages that are not necessarily dependent on our performance during a particular year. We set these compensation elements at competitive levels so that we are able to attract, motivate and retain highly qualified executive officers. Consistent with our performance-based philosophy, we reserve the largest potential compensation for performance- and incentive-based awards. These awards include annual bonuses and long-term awards that are primarily based on our financial performance and consisting of compensation in the form of cash, stock bonuses, and stock options to provide incentives that are tied to both our short-term and long-term performance. Our performance-based annual bonuses reward short-term and long-term performance, while our stock options reward long-term performance and align the interests of management with our stockholders. We additionally provide for retention of certain named executive officers through bonuses in the case of a change in control.
Compensation Committee Determination of Compensation Awards
The Compensation Committee has primary authority for determining the compensation awards to be made to our executive officers. The Compensation Committee annually determines the total compensation levels for our executive officers by considering several factors, including each executive officer’s role and responsibilities, how the executive officer is performing against those responsibilities, and the Company’s performance.
Components of Compensation
Base Salary
Base salaries provide our executive officers with a degree of financial certainty and stability. In order to attract and retain highly qualified executives, we provide base salaries based on individual negotiations and general competitive hiring practices. Salaries are usually set by agreement with the named executive officers but also periodically reviewed in the case of executive promotions or other significant changes in responsibilities. The named executive officers received an average salary increase of 7% from 2009 to 2010. No formulaic base salary increases are provided to the named executive officers. Mr. Adams received a 12.5% increase in his base salary during 2010 based on prior individual negotiations in 2009.
Annual Bonus
The primary purpose of our annual bonus, payable in cash or stock bonuses, is to motivate our named executive officers to meet or exceed our company-wide short-term performance objectives. The named executive officers are each eligible for annual bonus consideration designed to reward the named executive officers for their contributions to individual and corporate objectives. Annual bonuses are paid on a pro rata basis during the year with a final payment in March of the year following the performance period. For 2010, the Compensation Committee set budgeted earnings before interest, taxes, depreciation and amortization ("'EBITDA") as the threshold for eligibility. Each named executive officer is entitled to an annual bonus of 25% of base salary if the Company achieves its budgeted EBITDA for the Company’s fiscal year, as established by the Board of Directors upon recommendation of the Compensation Committee. The annual bonus shall be increased to 30% if the Company achieves 110% of its budgeted EBITDA, 35% if the Company achieves 120% of its budgeted EBITDA, and if the Company achieves greater than 120% of its budgeted EBITDA, an annual bonus greater than 35% may be paid, upon review and approval by the Compensation Committee, in its discretion. Management achieved the budgeted EBITDA in 2010 and annual bonuses equal to 25% of base salary were earned by the named executive officers aggregating to $184,063, of which $100,000 was for Mr. Kramer, $49,063 was for Mr. Adams, and $35,000 was for Mr. Zajaczkowski.
Long-Term Incentive Awards — Stock Options
Our named executive officers are eligible to participate in our Equity Incentive Plan, as amended (“Equity Plan”). In addition to our named executive officers, our key employees are eligible to receive stock option grants (each option to purchase one share of common stock) under our Equity Plan throughout the fiscal year in connection with certain events, such as a new hire, retention of an employee, integration of acquisitions or the achievement of certain individual performance objectives. Such grants provide an incentive for our named executive officers and key employees to increase our market value, as represented by our market price, as well as serving as a method for motivating and retaining them. The Compensation Committee believes that an award of stock options more closely aligns the interests of the recipient with those of our stockholders because the recipient will only realize a return on the stock option if our stock price increases over the term of the stock option. The exercise price of our stock option grants under the Equity Plan is equal to 100% of the closing price of our stock on the grant date. We did not grant any stock options to our named executive officers or key employees during 2010.
Perquisites and Other Benefits
We also provide other benefits to our named executive officers that are not tied to any formal individual or company performance criteria and are intended to be part of a competitive overall compensation program. For 2010, these benefits included payment of health, dental, life, and long term disability insurance, and company provided automobiles or auto allowances.
Transaction and Change in Control Bonuses
We have provided a transaction bonus for Mr. Kramer and Mr. Adams, and a change in control bonus for Mr. Zajaczkowski, in their employment agreements, which are activated upon consummation of a change in control. See Severance and Change in Control Arrangements below for more information.
Severance and Change of Control Arrangements
We ordinarily enter into employment agreements with our named executive officers and occasionally key employees providing for specific terms of employment. Accordingly, employment of any employee without an employment agreement may be terminated at any time. We provide certain benefits to our named executive officers upon certain qualifying terminations and with terminations under certain circumstances following a change of control, which benefits are designed to retain our named executive officers, provide continuity of management in the event of an actual or threatened change of control, and to ensure that our named executive officers’ compensation and benefits expectations would be met in such event. A description of the material terms of our change of control agreements is on page 14 of this report under “Potential Payments Upon Termination or Change-in-Control.”
Policy on Deductibility of Compensation
Section 162(m) of the Internal Revenue Code of 1986, as amended (“Code”), limits the tax deductibility by a company of annual compensation in excess of $1,000,000 paid to the CEO and any other four of the most highly compensated executive officers. However, performance-based compensation that has been approved by stockholders is excluded from the $1,000,000 limit primarily if the compensation is payable only upon attainment of pre-established, objective performance goals and our board of directors committee that establishes such goals consists only of “outside directors.” Additionally, stock options will qualify for the performance-based exception where the exercise price of the option is not less than the fair market value of the stock on grant date, and the plan includes a per-executive limitation on the number of shares for which options may be granted during a specified period. Stock awards and option grants under our Equity Plan are intended to meet the criteria of Section 162(m) of the Code. We believe all of the members of our Compensation Committee qualify as outside directors pursuant to Section 162(m) of the Code. The Compensation Committee considers the anticipated tax treatment when reviewing executive compensation and compensation programs. The deductibility of some types of compensation payments can depend upon the timing of an executive’s vesting or exercise of previously granted rights. Sections 280G and 4999 of the Code impose certain adverse tax consequences on compensation treated as excess parachute payments. An executive is treated as having received excess parachute payments for purposes of Sections 280G and 4999 of the Code if he or she receives compensatory payments or benefits that are contingent on a change in the ownership or control of a corporation, and the aggregate amount of such contingent compensatory payments and benefits equal or exceeds three times the executive’s base amount. If the executive’s aggregate contingent compensatory payments and benefits equal or exceed three times the executive’s base amount, the portion of the payments and benefits in excess of one times the base amount are treated as excess parachute payments. An executive’s base amount generally is determined by averaging the executive’s Form W-2 taxable compensation from the corporation for the five calendar years preceding the calendar year in which the change in ownership or control occurs. An executive’s excess parachute payments are subject to a 20% excise tax under Section 4999 of the Code, in addition to any applicable federal income and employment taxes. Also, the corporation’s compensation deduction in respect of the executive’s excess parachute payments is disallowed under Section 280G of the Code. If we were to be subject to a change of control, certain amounts received by our executives could be excess parachute payments under Sections 280G and 4999 of the Code.
Executive Compensation
The following table shows the compensation earned by, or awarded or paid to, each of our named executive officers for services rendered in all capacities to us for the year ended December 31, 2010.
SUMMARY COMPENSATION TABLE
|
Name and
Principal Position
(a)
|
Year
($)
(b)
|
Salary
($)
(c)
|
Bonus
($)
(d)
|
Stock
Awards
($)
(e)
|
Options
Awards
($)
(f)
|
All Other
Compensation
($) (1)
(i)
|
Total
($)
(j)
|
||||||||||||||||||
|
Douglas J. Kramer
|
2010
|
400,000 | 100,000 | — | — | 23,251 | 523,251 | ||||||||||||||||||
|
CEO and President
|
2009
|
400,000 | — | — | 162,834 | 26,956 | 589,790 | ||||||||||||||||||
|
2008
|
350,000 | — | — | 662,816 | 19,545 | 1,032,361 | |||||||||||||||||||
|
Michael T. Adams
|
2010
|
193,610 | 49,063 | — | — | 25,825 | 268,498 | ||||||||||||||||||
|
CGO, EVP and Secretary (2)
|
2009
|
175,000 | 10,000 | — | — | 24,774 | 209,774 | ||||||||||||||||||
|
2008
|
158,750 | — | — | — | 24,064 | 182,814 | |||||||||||||||||||
|
Charles A. Zajaczkowski
|
2010
|
101,539 | 35,000 | — | — | 9,211 | 145,750 | ||||||||||||||||||
|
CFO and Treasurer (3)
|
2009
|
— | — | — | — | — | — | ||||||||||||||||||
|
2008
|
— | — | — | — | — | — | |||||||||||||||||||
Notes:
(1) For 2010, amounts disclosed are perquisites valued at an aggregate of $58,286, of which $4,856 and $794 was for personal use of a Company provided automobile to Mr. Kramer and Mr. Zajaczkowski, respectively; $9,000 and $3,877 was for a car allowance for Mr. Adams and Mr. Zajaczkowski, respectively; $18,395, $16,825, and $4,540, was for medical, dental, vision, life, and long term disability insurances for Mr. Kramer, Mr. Adams, and Mr. Zajaczkowski, respectively.
(2) Mr. Adams was Interim CFO and Treasurer from November 11, 2009 to May 10, 2010.
(3) Mr. Zajaczkowski joined the Company as CFO and Treasurer on May 10, 2010.
Grants of Plan-Based Awards
We did not make any plan-based award grants to our named executive officers during 2010.
Outstanding Equity Awards
The following table sets forth summary information for outstanding equity awards held by our named executive officers at December 31, 2010.
OUTSTANDING EQUITY AWARDS AT FISCAL YEAR-END
Option Awards
|
Number of Securities
Underlying Unexercised
Options (#)
|
Equity Incentive Plan
Awards: Number of
Securities Underlying
Unexercised Unearned
|
Option
Exercise
|
Option
Expiration
|
||||||||||||||
|
Name
(a)
|
Exercisable
(b)
|
Unexercisable
(c)
|
Options (#)
(d)
|
Price ($)
(e)
|
Date
(f)
|
||||||||||||
|
Douglas J. Kramer
|
333,200 | 1,666,800 | — | 0.67 |
12/31/2012
|
||||||||||||
|
Douglas J. Kramer
|
62,475 | 437,525 | — | 0.74 |
12/31/2013
|
||||||||||||
|
Michael T. Adams
|
80,000 | — | — | 0.67 |
7/11/2011
|
||||||||||||
|
Michael T. Adams
|
— | — | 300,000 | 0.35 |
12/31/2015
|
||||||||||||
We did not have any outstanding stock awards held by our named executive officers at December 31, 2010. Nor did any of our named executive officers exercise any stock options during 2010.
Potential Payments Upon Termination or Change-in-Control
We entered into long term employment and stock option agreements with our currently employed named executive officers that provide certain benefits in the event of termination due to dismissal for other than cause, disability and death, or change in control.
Termination
Under Mr. Kramer’s agreement, as amended, entitlements upon termination vary depending upon: (1) termination by us without cause or by Mr. Kramer with good reason, (A) severance equal to the lesser of (i) 24 months base salary; or (ii) base salary for remainder of term; (B) product of (i) value of any equity or equity based awards granted which he can show he reasonably would have received had he remained employed by us through the end of the calendar year of termination date, or 4 months after termination date, using a predetermined formula, but only to extent not previously vested, exercised and/or paid; (C) any other amounts or benefits which he is entitled to receive through termination date under any other program maintained by us for his benefit; and (D) continued participation in any plan for medical, hospitalization and dental coverage for him as of termination date for 12 months from termination date; (2) termination by us for cause or by him without good reason, in which case, Mr. Kramer shall have no right to any bonuses, salaries, benefits or other compensation other than those accrued through termination date; and (3) termination on account of death or disability, Mr. Kramer will receive the same benefits as if his agreement was terminated without cause (see (1) above).
Under Mr. Adams’ agreement, as amended, entitlements upon termination vary depending upon: (a) dismissal for other than cause, (i) an amount equal to 6 months annual base salary paid in equal monthly installments, (ii) the product of (I) any awards which he can show that he reasonably would have received had he remained in such executive capacity with us through the end of the calendar year or 6 months after the date of termination, whichever is greater, using a predetermined formula, but only to the extent not previously vested, exercised and/or paid, (iii) medical and dental benefits to the him only for 6 months following the date of termination, and (iv) to the extent not paid, any other amounts or benefits which he is entitled to receive through the date of termination under any plan, including accrued vacation to the extent unpaid; or (b) disability or death, (i) an amount equal to 6 months annual base salary.
Under Mr. Zajaczkowski's agreement, entitlements upon termination vary depending upon: (a) dismissal for other than cause, (i) an amount equal to 4 months annual base salary paid in equal monthly installments, (ii) medical and dental benefits to him only for 4 months following the date of termination, (iii) the amount of the annual bonus and change in control bonus which he can show that he reasonably would have received had he remained in his executive capacity with the Company for 4 months after termination and (iv) to the extent not paid, any other amounts or benefits which he is entitled to receive through the date of termination under any plan, including accrued vacation to the extent unpaid; or (b) disability or death, (i) an amount equal to 4 months annual base salary.
Change-in-Control
If Lapolla or any successor terminates any of the current named executive officers’ employment agreements at any time during their respective employment periods following a Change-in-Control: each of them will be entitled to: (i) any base salary which would otherwise be payable over the remaining term of each of their agreements in one lump sum; and (ii) any annual bonus or other benefits under any Company plan or program, which have not been earned, vested or exercisable in accordance with their terms will become fully earned, vested and exercisable at the time of such termination. Additionally, we have also provided a transaction bonus equal to 8½ % for Mr. Kramer and 1½ % for Mr. Adams, as well as a change-in-control bonus equal to (a) 50% of his annual base salary if such change-in-control occurs within 18 months from his effective date of employment, which was May 10, 2010, or (b) 100% of his annual base salary if such change-in-control occurs after 18 months from his effective date of employment. A “Change in Control” is defined as an Ownership Change Event or series of related Ownership Change Events (collectively, a "Transaction") in which the stockholders of the Company immediately before the Transaction do not retain immediately after the Transaction, direct or indirect beneficial ownership of more than 50% of the total combined voting power of the outstanding voting securities of the Company or, in the case of an Ownership Change Event, the entity to which the assets of the Company were transferred. An "Ownership Change Event" will be deemed to have occurred if any of the following occurs with respect to the Company: (i) the direct or indirect sale or exchange by the stockholders of the Company of all or substantially all of the voting stock of the Company; (ii) a merger or consolidation in which the Company is a party; (iii) the sale, exchange, or transfer of all or substantially all of the assets of the Company (other than a sale, exchange or transfer to one or more subsidiaries of the Company); or (iv) a liquidation or dissolution of the Company. The sole exception to Change in Control and Ownership Change Event is any Change in Control that may result from the death or incapacity of Richard J. Kurtz wherein his interest is transferred to his heirs only. In such event, no Change in Control or Ownership Change Event will be deemed to have occurred.
Acceleration of Benefits Under Certain Other Plans
Our Equity Plan also contains provisions for the accelerated vesting of stock options to participating named executive officers in the event of a change-in-control. In the event of a change in control, the surviving, continuing, successor, or purchasing entity or parent thereof, as the case may be ("Acquiror"), may, without the consent of any participant, either assume the Company's rights and obligations under outstanding options or substitute for outstanding options substantially equivalent options to purchase the Acquiror's stock. In the event the Acquiror elects not to assume or substitute for outstanding options in connection with a change-in-control, the Compensation Committee shall provide that any unexercised and/or unvested portions of outstanding options shall be immediately vested and exercisable in full as of the date 30 days prior to the date of the change-in-control. Vesting and/or exercise of any option shall be conditioned upon the consummation of the change-in-control. Any Options which are not assumed by the Acquiror in connection with the change-in-control nor exercised as of the time of consummation thereof will terminate and cease to be outstanding effective as of the time of consummation of the change-in-control. The following table presents our reasonable estimate of the benefits payable to our named executive officers (1) under their employment agreements assuming that dismissal for other than cause, disability or death, or change-in-control occurred on December 31, 2010; and (2) under our Equity Plan assuming that a change-in-control occurred on December 31, 2010. Excluded from this table are any values relating to the transaction bonuses under the applicable employment agreements (as described above) as such values are incalculable based on the highly speculative nature of this particular benefit. Although we believe we have made reasonable estimates regarding the amounts payable, there can be no assurance that in the event of a dismissal for other than cause, disability or death, or change-in-control, our named executive officers will receive the amounts reflected below.
|
Name
|
Trigger
|
Salary ($)
|
Value of Option Acceleration ($) (3)
|
Continuation of Employee Benefits ($) (4)
|
Bonus ($) (5)
|
Total Value ($)
|
|||||||||||||||
|
Douglas J. Kramer
|
Dismissal Other Than for Cause or Executive for Good Reason
|
400,000 | (1) | — | 28,339 | 100,000 | 528,339 | ||||||||||||||
|
CEO and President
|
Disability or Death
|
400,000 | (1) | — | 28,339 | — | 428,339 | ||||||||||||||
|
Change in Control
|
1,200,000 | (2) | — | — | 100,000 | 1,300,000 | |||||||||||||||
|
Michael T. Adams
|
Dismissal Other Than for Cause
|
100,000 | (1) | — | 29,554 | 50,000 | 179,554 | ||||||||||||||
|
CGO, EVP and Secretary
|
Disability or Death
|
100,000 | (1) | — | 29,554 | — | 129,554 | ||||||||||||||
|
Change in Control
|
200,000 | (2) | 75,000 | — | 50,000 | 325,000 | |||||||||||||||
|
Charles A. Zajaczkowski
|
Dismissal Other Than for Cause
|
53,334 | (1) | — | 1,754 | 40,000 | 95,088 | ||||||||||||||
|
CFO and Treasurer
|
Disability or Death
|
53,334 | (1) | — | 1,754 | — | 55,088 | ||||||||||||||
|
Change in Control
|
320,000 | (2) | — | — | 120,000 | (6) | 440,000 | ||||||||||||||
Notes:
(1) Represents an amount equal to base salary of 24 months for Mr. Kramer; 6 months for Mr. Adams; and 4 months for Mr. Zajaczkowski, respectively.
(2) Represents an amount equal to the base salary for the remainder of the respective executive's employment agreement term: (a) Mr. Kramer, $400,000 base salary, expires 12/31/13; (b) Mr. Adams, $200,000 base salary, expires 12/31/11; and (c) Mr. Zajaczkowski, $160,000 base salary, expires 12/31/12.
(3) Represents aggregate value of accelerated vesting of unvested stock options based on the spread between the closing price of our common stock on December 31, 2010 and the exercise prices of the stock options. Based on the closing price of our common stock on December 31, 2010 of $0.60 per share, Mr. Adams has in-the-money unvested stock options, which, after subtracting the closing price of $0.60 from the $.35 exercise price on the 300,000 stock options granted on May 18, 2009 (which vest only upon a change in control), has a spread value of $75,000 at December 31, 2010.
(4) Represents aggregate value of employee benefits of: (a) 12 months, or $5,262, for Mr. Kramer, 6 months, or $2,631, for Mr. Adams, 4 months, or $1,754, for Mr. Zajaczkowski, for medical and dental insurance; and (b) 2 weeks for Mr. Kramer, or $23,077, and 7 weeks for Mr. Adams, or $26,923, for unused accrued vacation.
(5) Represents aggregate value of annual EBITDA bonuses for 2011 year at 25% level of each executive's respective annual salary (Refer to Footnote (2) for salaries).
(6) Represents amount included in Footnote (5) plus change in control bonus equal to 50% of Mr. Zajaczkowski's base salary (Refer to Footnote (2) for his salary).
Non-Employee Director Compensation
Standard Compensation Arrangements
All directors are required to attend any annual meeting of stockholders. Each director who is not an employee is reimbursed for actual expenses incurred in attending annual stockholder, board and committee meetings. Non-employee directors were paid $1,500 per quarter for the first two quarters of 2010. Effective July 1, 2010, the Board adopted a Director Restricted Stock Plan that provides each outside director will receive: (i) cash payments of $2,500 each quarter; and (ii) a stock grant of 100,000 shares, except Mr. Nadel who will receive a stock grant of 500,000 shares. All stock grants vest over a five-year period, with one fifth vesting at the end of each year beginning in 2010; provided, however, if there is a change in the control of the Company, all stock grants, which have not vested, will vest immediately upon the change in control. The following table summarizes compensation for non-employee directors for the year ended December 31, 2010, including costs incurred during 2010 for stock awards and stock options granted that vested in 2010.
DIRECTOR COMPENSATION TABLE
|
Name
(a)
|
Fees Earned or
Paid in Cash ($)
(b) (1)
|
Stock Awards ($)
(c) (2) (3)
|
Option Awards ($)
(d) (4) (5)
|
All Other
Compensation ($)
(g) (6)
|
Total ($)
(h)
|
|||||||||||||||
|
Richard J. Kurtz
|
— | — | 1,743 | 1,328,331 | 1,330,074 | |||||||||||||||
|
Arthur J. Gregg
|
8,000 | 13,000 | 1,770 | — | 16,270 | |||||||||||||||
|
Jay C. Nadel
|
8,000 | 83,800 | 3,539 | — | 62,839 | |||||||||||||||
|
Augustus J. Larson
|
8,000 | 13,000 | 1,062 | — | 15,562 | |||||||||||||||
|
Howard L. Brown
|
8,000 | 13,000 | 3,680 | — | 18,180 | |||||||||||||||
Notes:
(1) Represents cash payments paid to directors under standard compensation arrangements.
(2) Represents the amounts of compensation cost recognized by us in fiscal year 2010 related to stock awards granted to non-employee directors, as prescribed under GAAP. For a discussion of this program and valuation assumptions, see Note 18 – Share-Based Payment Arrangements, Director Plan, of our Notes to Financial Statements included in our annual report on Form 10-K for the year ended December 31, 2010. The information below shows the overall amount of compensation cost attributable to awards at 12/31/10:
|
Director
|
Grant
Date
|
Closing
Price ($)
|
Number of
Stock Award
Shares Granted
|
Number of Stock
Award Shares
Vested
at 12/31/2010
|
Number of Stock
Award Shares
Unvested
at 12/31/2010
|
2010 Fiscal Year
Compensation
Cost ($)
|
|||||||||||||||
|
Arthur J. Gregg
|
7/1/10
|
.65 | 100,000 | 20,000 | 80,000 | 13,000 | |||||||||||||||
|
Jay C. Nadel
|
7/1/10
|
.65 | 500,000 | 100,000 | 400,000 | 65,000 | |||||||||||||||
|
Augustus J. Larson
|
7/1/10
|
.65 | 100,000 | 20,000 | 80,000 | 13,000 | |||||||||||||||
|
Howard L. Brown
|
7/1/10
|
.65 | 100,000 | 20,000 | 80,000 | 13,000 | |||||||||||||||
(3) For Mr. Nadel, includes the amount of compensation cost of $18,800 recognized in fiscal year 2010 related to the stock award transferred to Mr. Nadel by the Chairman pursuant to a private agreement entered into on 2/19/08, as prescribed under GAAP. The closing price of the Company's common stock as traded on the OTCBB on the date of the transaction was $.70 per share, there were 1,084,000 shares granted, all of which have fully vested at 12/31/10. For more information and valuation assumptions, see Note 18 – Share-Based Payment Arrangements, Related Party Director Plan, of our Notes to Financial Statements included in our annual report on Form 10-K for the year ended December 31, 2010. See also Footnote 2 below.
(4) Represents amount of compensation cost of $1,753 recognized in fiscal year 2010 related to the 800,000 options granted in fiscal year 2010 to Mr. Kurtz, Chairman, as prescribed under GAAP. The option award was granted on 12/28/10, at an exercise price of $.60 per share (100% of the closing price) on the date of grant, and vests in equal increments at the end of each year from the date of grant over a 3 year period. The number of shares of stock underlying this unvested option award was 800,000 at 12/31/10. For a discussion of the Equity Incentive Plan and particular valuation assumptions, see Note 18 – Share-Based Payment Arrangements, Equity Incentive Plan, of our Notes to Financial Statements included in our annual report on Form 10-K for the year ended December 31, 2010.
(5) Represents amounts of compensation cost recognized in fiscal year 2010 related to grants of stock options in fiscal year 2007, as prescribed under GAAP. For a discussion of the Equity Incentive Plan and valuation assumptions, see Note 18 – Share-Based Payment Arrangements, Equity Incentive Plan, of our Notes to Financial Statements included in our annual report on Form 10-K for the year ended December 31, 2010. The information below shows the overall amount of compensation cost attributable to each award at 12/31/10.
|
Director
|
Grant
Date
|
Exercise
Price ($)
|
Number of Shares
of Stock Underlying
Vested Option
Awards Granted
|
Number of Shares
of Stock Underlying
Unvested Option
Awards Granted
|
Number of Shares
of Stock Underlying
Vested and
Unvested Option
Awards Granted
|
2010 Fiscal Year
Compensation Cost ($)
|
|||||||||||||||
|
Arthur J. Gregg
|
1/16/2007
|
.60 | 225,000 | (i) | — | 225,000 | 1,770 | ||||||||||||||
|
Jay C. Nadel
|
1/16/2007
|
.60 | 450,000 | (i) | — | 450,000 | 3,539 | ||||||||||||||
|
Augustus J. Larson
|
1/16/2007
|
.60 | 135,000 | (i) | — | 135,000 | 1,062 | ||||||||||||||
|
Howard L. Brown
|
5/22/2007
|
.60 |
500,000 (iI)
|
— | 500,000 | 3,680 | |||||||||||||||
The grant date fair value of the options to purchase the shares above of our common stock on January 16, 2007, was approximately $.59 per share, based on a lattice-based model of option valuation to determine grant date fair value, as prescribed under GAAP. The actual value, if any, a director may realize will depend on the excess of the stock price over the exercise price on the date the option is exercised. There is no assurance that the value realized by a director will be at or near the value estimated by the lattice-based valuation model. The following assumptions were used in the lattice-based valuation model: market price of stock, $.60; exercise price of option, $.60; expected stock volatility, 269.54%; risk-free interest rate, 4.193% (based on 5-year treasury bond rate); and expected life, 3 years (Lt. Gen. Gregg (Ret), Mr. Nadel, and Mr. Larson), and 2.8 years (Mr. Brown); and dividend yield, 0%. The vesting conditions and exercise restrictions of these options are as follows:
|
|
(i) For Mr. Gregg, Mr. Nadel, and Mr. Larson, their options vested in equal increments at the end of each year of service on the Board and certain standing committees over a 3 year period starting on the Grant Date and are exercisable at the rate of 33⅓% each year after vested.
|
|
|
(iv) Mr. Brown, who was at the time his options were granted on 1/16/07 an advisor/consultant to the Board, 250,000 options (of the 500,000 granted) were eligible to vest at the end of each year of service and exercisable at the rate of 50% each year only after all 500,000 options vested. However, upon being elected to the Board at the Annual Meeting of Stockholders held on May 22, 2007, his advisor/consultant role terminated and his original vesting and exercise criteria changed. On May 22, 2007, 86,300 options vested and are exercisable after the end of two years, and 137,900 options vested each on January 15, 2008, 2009, and 2010, respectively, based on his service as a member of the Board and certain standing committees and are exercisable at the rate of 33⅓% each year after vested.
|
COMPENSATION COMMITTEE INTERLOCKS AND INSIDER PARTICIPATION
No member of the Compensation Committee is a current or former officer or employee of us or any of our former subsidiaries. None of our executive officers served on the board of directors or compensation committee of any entity that has one or more executive officers serving on our Board of Directors or on the Compensation Committee.
COMPENSATION COMMITTEE REPORT
The Compensation Committee has reviewed and discussed the Compensation Discussion and Analysis with management, and based on the review and discussions, the Compensation Committee recommended to our board of directors that the Compensation Discussion and Analysis be included in our annual report on Form 10-K for the year ended December 31, 2010.
COMPENSATION COMMITTEE,
Lt. Gen. Arthur J. Gregg, US Army (Ret), Chairperson
Augustus J. Larson
Howard L. Brown
Directors and Executive Officers
The following table sets forth information as of March 14, 2011, regarding the beneficial ownership of common stock by (i) each director, (ii) CEO and President, CGO, and CFO, and (iii) all of our directors, named executive officers and executive officers as a group. Beneficial ownership is determined under the rules of the SEC and generally includes voting or investment power over securities. Except in cases where community property laws apply, we believe that each stockholder identified in the table possesses sole voting and investment power over all shares of common stock shown as beneficially owned by the stockholder. Shares of common stock subject to vesting or options that are currently exercisable or exercisable within 60 days of March 14, 2011 are considered outstanding and beneficially owned by the person granted the shares or holding the options for the purpose of computing the percentage ownership of that person but are not treated as outstanding for the purpose of computing the percentage ownership of any other person.
SECURITY OWNERSHIP OF MANAGEMENT TABLE
|
Beneficial Owner
|
Shares of
Common Stock
Owned
|
Rights to
Acquire Shares of
Common Stock (1)
|
Total Shares
of Common Stock
Beneficially Owned
|
Percent
of Class (2)
|
||||||||||||
|
Directors:
|
||||||||||||||||
|
Richard J. Kurtz, Chairman of the Board
|
59,164,722 | 200,000 | 59,364,722 | 67.39 | % | |||||||||||
|
Nine Duck Pond Road, Alpine, NJ 07620
|
||||||||||||||||
|
Lt. Gen. Arthur J. Gregg, US Army (Ret)
|
20,000 | 150,000 | 170,000 | 0.19 | % | |||||||||||
|
Jay C. Nadel
|
1,215,934 | 578,284 | 1,794,218 | 2.04 | % | |||||||||||
|
Augustus J. Larson
|
20,000 | 90,000 | 110,000 | 0.12 | % | |||||||||||
|
Howard L. Brown
|
20,000 | 224,200 | 244,200 | 0.28 | % | |||||||||||
|
Douglas J. Kramer (3)
|
— | 562,475 | 562,475 | 0.64 | % | |||||||||||
|
Michael T. Adams (4)
|
— | 80,000 | 80,000 | 0.09 | % | |||||||||||
|
Executive Officers:
|
||||||||||||||||
|
Charles A. Zajaczkowski
|
— | — | — | — | ||||||||||||
|
All directors and executive
|
||||||||||||||||
|
officers as a group
|
60,440,656 | 1,884,958 | 62,325,614 | 70.75 | % | |||||||||||
Notes:
(1) Represents common stock which the person has the right to acquire within 60 days after March 14, 2011. For executive officers: (a) Mr. Kramer has 2,500,000 vested stock options, of which 562,475 are exercisable, and (b) Mr. Adams has 80,000 vested and exercisable stock options; and directors: (a) Mr. Kurtz has 200,000 vested and exercisable stock options, (b) Mr. Gregg as 225,000 vested stock options, of which 150,000 are exercisable, (c) Mr. Nadel has 450,000 vested stock options, of which 300,000 are exercisable, and 278,284 shares of restricted common stock pursuant to his advisory and consultant agreement (Refer to Note 23 - Subsequent Events, Item (a), of our Notes to Financial Statements included in our annual report on Form 10-K for the year ended December 31, 2010), (d) Mr. Larson has 135,000 vested stock options, of which 90,000 are exercisable, and (e) Mr. Brown has 500,000 vested stock options, of which 224,200 are exercisable. Refer to Item 11 – Executive and Director Compensation for more information.
(2) Based on 88,090,334 shares of our common stock outstanding at March 14, 2011 (Includes those shares in the “Rights to Acquire Shares of Common Stock” column in this table and the Security Ownership of Certain Beneficial Owners Table below).
(3) Mr. Kramer is also our CEO and President.
(4) Mr. Adams is also our CGO, EVP and Secretary.
SECURITY OWNERSHIP OF CERTAIN BENEFICIAL OWNERS TABLE
Except as set forth in the above and below tables, our management knows of no person who is the beneficial owner of more than 5% of our issued and outstanding common stock.
|
Name and Address of Beneficial Owners (1)
|
Shares of
Common Stock
Owned
|
Rights to
Acquire Shares of
Common Stock (1) (2)
|
Total Shares of
Common Stock
Beneficially Owned
|
Percent
of Class (3)
|
||||||||||||
|
ComVest Capital LLC
|
— | 2,500,000 | 2,500,000 | 2.84 | % | |||||||||||
|
ComVest Capital Management LLC
|
||||||||||||||||
|
ComVest Group Holdings, LLC
|
||||||||||||||||
|
Michael S. Falk
|
||||||||||||||||
|
One North Clematis, Suite 300
|
||||||||||||||||
|
West Palm Beach, Florida 33401
|
||||||||||||||||
Notes:
(1) Based on the information provided pursuant to a joint statement on a Schedule 13G filed with SEC on February 26, 2007, the name of the Reporting Person is ComVest Capital LLC, a Delaware limited liability company ("ComVest"). ComVest is a private investment company. The managing member of ComVest is ComVest Capital Management LLC, a Delaware limited liability company ("Management"), the managing member of which is ComVest Group Holdings, LLC, a Delaware limited liability company ("CGH"). Michael Falk ("Falk") is the Chairman and principal member of CGH. Falk is a citizen of the United States of America. The group of beneficial owners share the same principal business address provided in this table.
(2) Based on 88,090,334 shares of our common stock outstanding at March 14, 2011 (Includes those shares in the “Rights to Acquire Shares of Common Stock” column in this table and the Security Ownership of Management Table above).
(3) The Company entered into a Revolving Credit and Term Loan Agreement on February 21, 2007 with ComVest Capital LLC (“ComVest”), as amended from time to time, under which ComVest agreed to a revolving credit note and convertible term note (both of which matured and were paid off by the Company in connection with replacement financing during 2010) and the Company agreed to issue certain detachable warrants to ComVest ("Warrants") and register the underlying shares issuable under the convertible term note and the Warrants. The Warrants are for the purchase of an aggregate of 2,500,000 shares of common stock, of which 1,500,000 are exercisable at an adjusted price of $.59 per share and 1,000,000 are exercisable at an adjusted price of $.74 per share, all of which expire on June 30, 2013.
See also Part II, Item 5, Securities Authorized for Issuance Under equity Compensation Plans, in this report for information about our common stock that may be issued upon the exercise of options, warrants and rights under all of our equity compensation plans, as of December 31, 2010.
Transactions with Related Persons
(a) On February 1, 2010, the Company accepted the voluntary redemption of 100 shares of Series D Preferred Stock, par value $1.00, at the stated value of $1,000 per share, from Mr. Brown, a director, for $100,000 in cash.
(b) On February 18, 2010, the Company recorded the remaining grant-date fair value compensation cost of $18,800 to complete the private agreement whereby Mr. Kurtz agreed to transfer approximately 1,084,000 shares, in two installments, of his restricted common stock to Mr. Nadel in order to secure his continued participation required with his role as a Board member for a two year period entered into on February 19, 2008. The first installment of 500,000 shares was transferred to Mr. Nadel on February 19, 2008 and second installment of 584,000 shares was transferred to Mr. Nadel on February 18, 2009 by Mr. Kurtz. The installments vest one year after the date of each installment. The closing price of the Company’s common stock as traded on the NASDAQ OTCBB on the date of the private agreement was $.70 per share. The grant-date fair value related to this transaction is $758,800.
(c) On March 31, 2010, Mr. Kurtz, Chairman of the Board and majority stockholder, converted $19,000 of indebtedness owed by the Company to him, of which $18,800 represented a loan payable – related party and $200 represented related accrued interest, into 19 shares of Series D Preferred Stock, par value $1.00, at the stated value of $1,000 per share.
(d) On May 5, 2010, the Company and Douglas J. Kramer, CEO and President, entered into an amendment to that certain executive employment agreement dated May 5, 2008 and option agreement of even date, effective as of January 1, 2010, to: (i) acknowledge his prior agreed salary increase to $400,000, effective January 1, 2009; (ii) extend his employment term to December 31, 2013; (iii) change his transaction bonus upon a change in control to 8.5%; (iv) add an annual bonus based on meeting Board approved operating budget requirements; and (v) cancel his remaining 1,500,000 unvested stock options ("Kramer Amendment"). The full text of the Kramer Amendment is attached as Exhibit 10.50.
(e) Effective May 10, 2010, the Company entered into an executive employment agreement with Charles Zajaczkowski to serve as Chief Financial Officer and Corporate Treasurer, which provides: (i) employment term to December 31, 2012; (ii) annual base salary of $160,000; (iii) annual bonus based on meeting Board approved operating budget requirements; and (iv) change in control bonus equal to 50% of his annual base salary if such change-in-control occurs within 18 months from his effective date of employment, which was May 10, 2010, or 100% of his annual base salary if such change-in-control occurs after 18 months from his effective date of employment ("Zajaczkowski Agreement"). The full text of the Zajaczkowski Agreement is attached as Exhibit 10.51.
(f) On June 11, 2010, the Company and Michael T. Adams, CGO, EVP, and Secretary, entered into an amendment to that certain executive employment agreement dated May 18, 2009, effective as of January 1, 2010, to: (i) acknowledge his prior agreed salary increase from to $187,500, effective January 1, 2010, which shall be increased to $200,000, effective July 1, 2010, if the Company is at or above budget on June 30, 2010; and (ii) add an annual bonus based on meeting Board approved operating budget requirements ("Adams Amendment"). The full text of the Adams Amendment is attached as Exhibit 10.52.
(g) On June 30, 2010, Mr. Kurtz, Chairman of the Board and majority stockholder, exchanged $1,406,670 of accrued Series D Preferred Stock dividends outstanding at December 31, 2009, into 1,407 shares of Series D Preferred Stock, par value $1.00, at the stated value of $1,000 per share.
(h) Effective July 1, 2010, the Board adopted a Director Share Based Compensation Program that provides: (i) each outside director will receive cash payments of $2,500 each quarter, payable at the end of each quarter; and (ii) each outside directors will receive a stock grant of 100,000 shares, except Mr. Nadel who will receive a stock grant of 500,000 shares. All stock grants will vest over a five-year period, with one fifth vesting at the end of each year beginning in 2010. However, if there is a change in the control of the Company, all stock grants, which have not vested, will vest immediately upon the change in control. The Company recorded $52,000 in share based compensation expense during 2010 under this plan.
(i) On November 16, 2010, the Chairman of the Board and principal stockholder of Lapolla exchanged $10,000,000, or 10,000 shares, of his Series D Preferred Stock, par value $1.00, with a Stated Value of $1,000 per share, accruing dividends at 10% per annum, payable quarterly in arrears, plus unpaid and accrued outstanding Series D Preferred Stock dividends of $388,304 as of said date, for restricted common stock at a price per share of $.53 per share (the closing price of the Company's shares on the OTC Bulletin Board was $.51 per share on the date of the transaction), or for 19,600,573 shares. The transaction was approved unanimously by all six disinterested members of the Board of Directors of Lapolla.
(j) During 2010, the Company paid an aggregate of $32,000 in cash to non-employee directors for director services rendered, of which Mr. Gregg, Mr. Nadel, Mr. Larson, and Mr. Nadel each received $8,000.
(k) During 2010, the Company paid an aggregate of $875,000 to Mr. Kurtz, Chairman of the Board, majority stockholder, and sole Series D Preferred Stock holder, for accrued Series D Preferred stock dividends.
See also Note 23 - Subsequent Events, Items (a) and (b), of our Notes to Financial Statements included in our annual report on Form 10-K for the year ended December 31, 2010, for more information.
Review, Approval or Ratification of Transactions with Related Persons.
The Company does not maintain a formal policy or procedure for review, approval or ratification of transactions with related persons. The Company does regularly communicate through Board and Standing Committee meetings and Unanimous Resolutions, wherein transactions with related persons are reviewed and approved and/or ratified, or disapproved. In addition, transactions involving our directors are disclosed and reviewed by our Corporate Governance Committee in its assessment of our directors’ independence. To the extent such transactions are related to ongoing business relationships, the transactions are disclosed and, as applicable, reviewed annually. The Board of Directors intends to approve only those related party transactions that are in the best interests of our stockholders.
Director Independence
Lapolla is a “controlled company” because more than 50% of the voting power of Lapolla is held by Mr. Kurtz, our Chairman of the Board and majority stockholder. As such, we are not required to have a majority of independent directors. However, the members of our Audit Committee are required to meet applicable SEC independence standards and do meet such requirements. Lapolla uses its own definition for determining whether its directors and members of specific committees of the board of directors, are independent. In short, in order to be considered to be independent, a member of the board of directors or any board committee may not, other than in his or her capacity as a member of the board of directors or any board committee: (i) accept any consulting, advisory, or other compensatory fee from the Company; or (ii) be an affiliated person of the Company or any subsidiary thereof. Independent directors are not officers of the Company and are in view of the Company’s Board of Directors, free of any relationship that would interfere with the exercise of independent judgment. Our Board of Directors has reviewed the relationships between the Company, including any affiliates, and each board member (and each such director’s immediate family members). Based on its review, the Board of Directors has affirmatively determined that Mr. Kurtz, Mr. Nadel, Mr. Brown, Mr. Kramer, and Mr. Adams are not, and Lt. Gen. Gregg (Ret) and Mr. Larson are, independent directors at this time. Mr. Kurtz was determined to not be independent based on his majority stockholder and Chairman of the Board status. Mr. Nadel, who was independent during the 2010 year, entered into an advisory/consultant agreement with the Company, as well as appointed Vice Chairman of the Board, thereby disqualifying him by definition on February 22, 2011, Mr. Brown was not independent based on his initially being retained as an advisor/consultant to the Board of Directors on January 16, 2007 even though his advisory/consulting role terminated upon his becoming elected to the Board of Directors on May 22, 2007 and the stock option compensation he received was during that brief time period was de minimis. Mr. Kramer and Mr. Adams are both not independent based on being executive officers of Lapolla. There was no information considered by our Board of Directors, other than what has been disclosed in this report, in determining that Lt. Gen. Gregg (Ret) and Mr. Larson were “independent” within the Company’s independence standards.
Independent Registered Public Accounting Firm Fees
Hein & Associates, LLP (“Hein”), our independent registered public accounting firm, audited our financial statements for the year ended December 31, 2010 and 2009. The Audit Committee of the Board of Directors selects the independent registered public accounting firm. Aggregate fees billed to us by independent registered public accounting firms for the fiscal years ended December 31,
|
Fee Category
|
2010
|
2009
|
||||||
|
Audit Fees
|
$ | 147,000 | (1) | $ | 144,000 | (1) | ||
|
Audit-Related Fees
|
— | — | ||||||
|
Tax Fees
|
— | — | ||||||
|
All Other Fees
|
1,103 | (2) | 33,000 | (2) | ||||
|
Total
|
$ | 148,103 | $ | 177,000 | ||||
Notes:
|
(1)
|
Represents the aggregate fees billed to us by Hein for professional services rendered for the audit of our annual financial statements, and for the reviews of our financial statements included in our Form 10-Q filings for the second, third and fourth fiscal quarters.
|
|
(2)
|
Represents the aggregate fees billed to us by Hein for professional services rendered for non-audit services related to Federal tax research and Internal Revenue Code, as amended, Section 382 analysis, which services were pre-approved by the Audit Committee.
|
As part of its required duties, the Audit Committee pre-approves audit and non-audit services performed by our independent registered public accounting firm to assure that the provision of such services does not impair the independent registered public accounting firm’s independence. The policy generally provides that services in the defined categories of audit services, audit-related services, tax services and all other services, are deemed pre-approved up to specified amounts, and sets requirements for specific case-by-case pre-approval of discrete projects that are not otherwise pre-approved or for services over the pre-approved amounts. Pre-approval may be given as part of the Audit Committee’s approval of the scope of the engagement of the independent registered public accounting firm or on an individual basis. The pre-approval of services may be delegated to one or more of the Audit Committee’s members, but the decision must be presented to the full Audit Committee at its next scheduled meeting. The policy prohibits retention of the independent registered public accounting firm to perform the prohibited non-audit functions defined in Section 201 of the Sarbanes-Oxley Act of 2002 or the rules of the SEC, and also considers whether proposed services are compatible with the independence of the independent registered public accounting firm. All services provided by our independent registered public accounting firm in 2010 were pre-approved in accordance with the Audit Committee’s pre-approval requirements.
PART IV
a) 1. Financial Statements and Supplementary Data:
The following financial statements are included herein under Item 8 of Part II of this report, “Financial Statements and Supplementary Data”:
|
Index to Financial Statements
|
(i)
|
|
Report of Independent Registered Public Accounting Firm
|
F-1
|
|
Balance Sheets at December 31, 2010 and December 31, 2009
|
F-2
|
|
Statements of Operations for Each of the Years in the Two Year Period Ended December 31, 2010
|
F-3
|
|
Statements of Stockholders’ Equity and Comprehensive Income for Each of the Years in the Two Year Period Ended December 31, 2010
|
F-4
|
|
Statements of Cash Flows for Each of the Years in the Two Year Period Ended December 31, 2010
|
F-5
|
|
Notes to Financial Statements
|
F-6
|
(a) 2. Financial Statement Schedules:
The following additional information should be read with the financial statements under Item 15(a)1 of Part IV of this report:
|
Schedule for the Years Ended December 31, 2010 and 2009:
|
|
|
Schedule Number
|
|
|
Valuation and Qualifying Accounts
|
22
|
All other schedules have been omitted for the reason that the required information is presented in the financial statements or notes thereto, the amounts involved are not significant or the schedules are not applicable.
(a) 3. Exhibits:
See Index of Exhibits below.
(b) Item 601 Exhibits:
Reference is hereby made to the Index of Exhibits under Item 15(a)3 of Part IV of this report.
Pursuant to the requirements of Section 13 or 15(d) of the Securities Exchange Act of 1934, the Registrant has duly caused this report to be signed on its behalf by the undersigned, thereunto duly authorized.
|
Date:
|
April 8, 2011
|
LAPOLLA INDUSTRIES, INC.
|
|
|
By:
|
/s/ Douglas J. Kramer, CEO
|
||
|
Douglas J. Kramer
|
|||
|
CEO and President
|
|||
|
Date:
|
April 8, 2011
|
LAPOLLA INDUSTRIES, INC.
|
|
|
By:
|
/s/ Charles A. Zajaczkowski, CFO
|
||
|
Charles A. Zajaczkowski
|
|||
|
CFO and Treasurer
|
|||
Pursuant to the requirements of the Securities Exchange Act of 1934, this report has been signed below by the following persons on behalf of the Registrant and in the capacities and on the date indicated.
|
Date:
|
April 8, 2011
|
LAPOLLA INDUSTRIES, INC.
|
|
|
By:
|
/s/ Richard J. Kurtz, Chairman
|
||
|
Richard J. Kurtz
|
|||
|
Chairman of the Board
|
|||
|
Date:
|
April 8, 2011
|
LAPOLLA INDUSTRIES, INC.
|
|
|
By:
|
/s/ Jay C. Nadel, Vice Chairman and Director
|
||
|
Jay C. Nadel
|
|||
|
Vice Chairman of the Board and Director
|
|||
|
Date:
|
April 8, 2011
|
LAPOLLA INDUSTRIES, INC.
|
|
|
By:
|
/s/ Arthur J. Gregg, Director
|
||
|
Arthur J. Gregg
|
|||
|
Director
|
|||
|
Date:
|
April 8, 2011
|
LAPOLLA INDUSTRIES, INC.
|
|
|
By:
|
/s/ Augustus J. Larson, Director
|
||
|
Augustus J. Larson
|
|||
|
Director
|
|||
|
Date:
|
April 8, 2011
|
LAPOLLA INDUSTRIES, INC.
|
|
|
By:
|
/s/ Howard L. Brown, Director
|
||
|
Howard L. Brown
|
|||
|
Director
|
|||
|
Date:
|
April 8, 2011
|
LAPOLLA INDUSTRIES, INC.
|
|
|
By:
|
/s/ Douglas J. Kramer, Director
|
||
|
Douglas J. Kramer
|
|||
|
Director
|
|||
|
Date:
|
April 8, 2011
|
LAPOLLA INDUSTRIES, INC.
|
|
|
By:
|
/s/ Michael T. Adams, Director
|
||
|
Michael T. Adams
|
|||
|
Director, CGO, EVP, and Secretary
|
|||
LAPOLLA INDUSTRIES, INC.
SCHEDULE II–VALUATION AND QUALIFYING ACCOUNTS
For the Years Ended December 31, 2010 and 2009
|
Additions
|
||||||||||||||||||||
|
Classification
|
Balance at
Beginning
of Period
|
Charged to
Costs and
Expenses
|
Charged
to Other
Accounts
|
Deductions
|
Balance
at End of
Period
|
|||||||||||||||
|
Year Ended December 31, 2010
|
||||||||||||||||||||
|
Allowance for Doubtful Accounts (1)
|
$ | 734,962 | $ | 423,956 | $ | — | $ | (220,087 | ) | $ | 938,831 | |||||||||
|
Deferred Tax Assets Valuation Allowance
|
21,769,300 | — | (871,820 | ) | — | 20,897,480 | ||||||||||||||
|
Year Ended December 31, 2009
|
||||||||||||||||||||
|
Allowance for Doubtful Accounts (1)
|
$ | 492,451 | $ | 1,144,235 | $ | — | $ | (901,724 | ) | $ | 734,962 | |||||||||
|
Deferred Tax Assets Valuation Allowance
|
20,809,165 | — | 960,135 | — | 21,769,300 | |||||||||||||||
Notes:
(1) Write-offs of uncollectible accounts are included in Deductions column.
|
Exhibit No.
|
|
Description
|
|
3.1
|
|
Restated Certificate of Incorporation dated June 28, 1994 as filed with the State of Delaware on June 16, 1994 (incorporated by reference to Exhibit 3.1 to Form 10-KSB dated December 31, 1998, filed April 16, 1999).
|
|
3.2
|
|
Certificate of Amendment of Restated Certificate of Incorporation dated February 12, 1999 as filed with State of Delaware February 12, 1999 (incorporated by reference to Exhibit 3.2 to Form 10-KSB dated December 31, 1998, filed April 16, 1999).
|
|
3.3
|
|
Certificate of Amendment of Restated Certificate of Incorporation dated June 21, 2000 as filed with the State of Delaware on June 26, 2000 (incorporated by reference to Exhibit 3(i) to Form 10-KSB dated December 31, 2000, filed March 30, 2001).
|
|
3.4
|
|
Certificate of Amendment of Restated Certificate of Incorporation dated May 28, 2002 as filed with the State of Delaware on May 28, 2002 (incorporated by reference to Exhibit 3.1 to Form 10-Q dated June 30, 2002, filed August 19, 2002).
|
|
3.5
|
Certificate of Amendment of Restated Certificate of Incorporation dated December 30, 2004 as filed with the State of Delaware on December 30, 2004 (incorporated by reference to Exhibit 3.5 to Form 10-K dated December 31, 2004, filed March 30, 2005).
|
|
|
3.6
|
Certificate of Amendment of Restated Certificate of Incorporation dated November 8, 2005 as filed with the State of Delaware on November 8, 2005 (incorporated by reference to Exhibit 3.6 to Form 10-K dated December 31, 2005, filed March 31, 2006).
|
|
|
3.7
|
Certificate of Amendment of Restated Certificate of Incorporation dated May 22, 2007 as filed with the State of Delaware on June 18, 2007 (incorporated by reference to Exhibit 4.1 to Form 10-Q dated June 30, 2007, filed August 20, 2007).
|
|
|
3.8
|
Certificate of Amendment of Restated Certificate of Incorporation dated June 10, 2008 as filed with the State of Delaware on June 10, 2008 (incorporated by reference to Exhibit 4.1 to Form 10-Q dated June 30, 2008, filed August 19, 2008).
|
|
|
3.8
|
|
Proforma Restated Certificate of Incorporation, as amended, and currently in effect (incorporated by reference to Exhibit 4.2 to Form 10-Q dated June 30, 2008, filed August 19, 2008).
|
|
3.9
|
|
Bylaws, as amended, and currently in effect, of the Company (incorporated by reference to Exhibit 3.11 to Form 10-KSB dated December 31, 2005, filed March 31, 2006).
|
|
4.1
|
|
Certificate of Designation of Preferences of Series B Convertible Preferred Stock dated September 30, 2001 filed with the State of Delaware November 2, 2001 (incorporated by reference to Exhibit 3.1 to Form 8-K dated September 30, 2001, filed October 25, 2001).
|
|
4.2
|
|
Amendment to Certificate of Designation of Preferences of Series B Convertible Preferred Stock dated December 31, 2001 (incorporated by reference to Exhibit 3.1.1 to Form 8-K dated December 31, 2001, filed January 31, 2002).
|
|
4.3
|
|
Certificate of Designation of Preferences of Series C Convertible Preferred Stock dated January 8, 2002 filed with the State of Delaware on February 28, 2002 (incorporated by reference to Exhibit 3.2 to Form 8-K dated January 8, 2002, filed January 31, 2002).
|
|
4.4
|
|
Amendment to Certificate of Designation of Preferences of Series C Convertible Preferred Stock dated September 27, 2006 filed with the State of Delaware on November 1, 2006 (incorporated by reference to Exhibit 4.1 to Form 10-Q dated September 30, 2006, filed November 1, 2006).
|
|
4.5
|
Certificate of Designation of Preferences of Series D Preferred Stock dated September 28, 2006 as filed with the State of Delaware on November 1, 2006 (incorporated by reference to Exhibit 4.2 to Form 10-Q dated September 30, 2006, filed November 1, 2006).
|
|
|
10.3
|
Securities Purchase Agreement dated December 31, 2001 between the Company and Richard J. Kurtz (incorporated by reference to Exhibit 10.2 to Form 8-K dated December 31, 2001, filed January 31, 2002).
|
|
|
10.6
|
Securities Purchase Agreement dated September 29, 2006 between the Company and Richard J. Kurtz (incorporated by reference to Exhibit 10.1 to Form 10-Q dated September 30, 2006, filed January 31, 2002).
|
|
|
10.7
|
Securities Purchase Agreement dated December 31, 2006 between the Company and Richard J. Kurtz (incorporated by reference to Exhibit 10.7 to Form 10-K dated December 31, 2006, filed March 30, 2007).
|
|
|
10.8
|
|
Equity Incentive Plan (incorporated by reference to Exhibit 10.1 to Form 8-K dated July 12, 2005, filed July 18, 2005).
|
|
10.9
|
Amendment to Equity Incentive Plan (incorporated by reference to Exhibit 10.1 to Form 8-K dated July 12, 2005, filed July 18, 2005).
|
|
|
10.10
|
Second Amendment to Equity Incentive Plan dated May 5, 2008 (incorporated by reference to Appendix B to DEF 14C dated and filed on May 19, 2008).
|
|
|
10.11
|
Equity Incentive Plan, as amended, and currently in effect (incorporated by reference to Exhibit 10.2 to Form 10-Q dated June 30, 2008, filed August 20, 2008).
|
|
|
10.12
|
|
Director Compensation Plan (incorporated by reference to Exhibit 10.9 to Form 10-K for December 31, 2004, filed March 30, 2005).
|
|
10.13
|
Amendment to Director Compensation Plan (incorporated by reference Exhibit 10.10 to Form 8-K dated July 25, 2005, filed July 29, 2005).
|
|
|
10.14
|
Director Compensation Plan, as amended (incorporated by reference Exhibit 10.11 to Form 8-K dated July 25, 2005, filed July 29, 2005).
|
|
|
10.15
|
Option Agreement dated July 12, 2005 between Douglas J. Kramer and the Company (incorporated by reference to Exhibit 10.3 to Form 8-K dated July 12, 2005, filed July 18, 2005).
|
|
|
10.16
|
Amendment to Option Agreement dated July 28, 2005 between Douglas J. Kramer and the Company (incorporated by reference to Exhibit 10.2 to Form 8-K dated July 25, 2005, filed July 29, 2005).
|
|
|
10.17
|
Option Agreement dated May 5, 2008 between Douglas J. Kramer and the Company (incorporated by reference to Appendix C to DEF 14C dated and filed on May 19, 2008).
|
|
|
10.18
|
Option Agreement dated July 12, 2005 between Michael T. Adams and the Company (incorporated by reference to Exhibit 10.2 to Form 8-K dated July 12, 2005, filed July 18, 2005).
|
|
|
10.19
|
Amendment to Option Agreement dated July 28, 2005 between Michael T. Adams and the Company (incorporated by reference to Exhibit 10.1 to Form 8-K dated July 25, 2005, filed July 29, 2005).
|
|
|
10.20
|
Option Agreement dated March 3 2008 between Paul Smiertka and the Company (incorporated by reference to Exhibit 10.2 to Form 8-K dated March 3, 2008, filed May 4, 2008).
|
|
|
10.21
|
Executive Employment Agreement dated July 25, 2005 between Douglas J. Kramer and the Company (incorporated by to reference Exhibit 10.8 to Form 8-K dated July 25, 2005, filed July 29, 2005).
|
|
|
Executive Employment Agreement dated May 5, 2008 between Douglas J. Kramer and the Company (incorporated by to reference Exhibit 10.8 to Form 8-K dated July 25, 2005, filed July 29, 2005).
|
||
|
10.22
|
Executive Employment Agreement dated July 25, 2005 between Michael T. Adams and the Company (incorporated by to reference Exhibit 10.7 to Form 8-K dated July 25, 2005, filed July 29, 2005).
|
|
|
10.23
|
Executive Employment Agreement dated March 3, 2008 between Paul Smiertka and the Company (incorporated by to reference Exhibit 10.1 to Form 8-K dated March 3, 2008, filed May 4, 2008).
|
|
|
10.24
|
Revolving Credit and Term Loan Agreement between Lapolla and ComVest dated February 21, 2007 (incorporated by reference to Exhibit 10.1 to Form 8-K dated and filed February 23, 2007, filed February 2, 2007).
|
|
|
10.25
|
Convertible Term Note between Lapolla and ComVest dated February 21, 2007 (incorporated by reference to Exhibit 10.2 to Form 8-K dated and filed February 23, 2007, filed February 2, 2007).
|
|
|
10.26
|
Revolving Credit Note between Lapolla and ComVest dated February 21, 2007 (incorporated by reference to Exhibit 10.3 to Form 8-K dated and filed February 23, 2007, filed February 2, 2007).
|
INDEX OF EXHIBITS
(continued)
|
Exhibit No.
|
|
Description
|
|
10.27
|
Warrant No. CV-1 To Purchase Shares of Common Stock to ComVest dated February 21, 2007 (incorporated by reference to Exhibit 10.4 to Form 8-K dated and filed February 23, 2007, filed February 2, 2007).
|
|
|
10.28
|
Warrant No. CV-2 To Purchase Shares of Common Stock to ComVest dated February 21, 2007 (incorporated by reference to Exhibit 10.5 to Form 8-K dated and filed February 23, 2007, filed February 2, 2007).
|
|
|
10.29
|
Warrant No. CV-3 To Purchase Shares of Common Stock to ComVest dated February 21, 2007 (incorporated by reference to Exhibit 10.6 to Form 8-K dated and filed February 23, 2007, filed February 2, 2007).
|
|
|
10.30
|
Collateral Agreement between Lapolla and ComVest dated February 21, 2007 (incorporated by reference to Exhibit 99.1 to Form 8-K dated and filed February 23, 2007, filed February 2, 2007).
|
|
|
10.31
|
Registration Rights Agreement between Lapolla and ComVest dated February 21, 2007 (incorporated by reference to Exhibit 99.2 to Form 8-K dated and filed February 23, 2007, filed February 2, 2007).
|
|
|
10.32
|
Amendment No. 1 to Revolving Credit and Term Loan Agreement between Lapolla and ComVest dated June 12, 2007 (incorporated by reference to Exhibit 10.7 to Form 8-K dated June 12, 2007, filed June 14, 2007).
|
|
|
10.33
|
Amended and Restated Convertible Term Note between Lapolla and ComVest dated June 12, 2007 (incorporated by reference to Exhibit 10.8 to Form 8-K dated June 12, 2007, filed June 14, 2007).
|
|
|
10.34
|
Amended and Restated Revolving Credit Note between Lapolla and ComVest dated June 12, 2007 (incorporated by reference to Exhibit 10.9 to Form 8-K dated June 12, 2007, filed June 14, 2007).
|
|
|
10.35
|
Warrant No. CV-4 To Purchase Shares of Common Stock to ComVest dated June 12, 2007 (incorporated by reference to Exhibit 10.10 to Form 8-K dated June 12, 2007, filed June 14, 2007).
|
|
|
10.36
|
Extension Under Registration Rights Agreement dated June 12, 2007 (incorporated by reference to Exhibit 99.3 to Form 8-K dated June 12, 2007, filed June 14, 2007).
|
|
|
10.37
|
Amended and Restated Revolving Credit and Term Loan Agreement between Lapolla and ComVest dated June 30, 2008 (incorporated by reference to Exhibit 10.1 to Form 8-K dated June 30, 2008, filed July 7, 2008).
|
|
|
10.38
|
Amended and Restated Convertible Term Note between Lapolla and ComVest dated June 30, 2008 (incorporated by reference to Exhibit 10.2 to Form 8-K dated June 30, 2008, filed July 7, 2008).
|
|
|
10.39
|
Amended and Restated Revolving Credit Note between Lapolla and ComVest dated June 30, 2008 (incorporated by reference to Exhibit 10.4 to Form 8-K dated June 30, 2008, filed July 7, 2008).
|
|
|
10.40
|
Guaranty between Richard J. Kurtz and ComVest dated June 30, 2008 (incorporated by reference to Exhibit 10.3 to Form 8-K dated June 30, 2008, filed July 7, 2008).
|
|
|
10.41
|
Debt-to-Equity Conversion Confirmation between Richard J. Kurtz and the Company dated June 30, 2008 (incorporated by reference to Exhibit 10.5 to Form 8-K dated June 30, 2008, filed July 7, 2008).
|
|
|
10.42
|
Warrant No. CV-5 To Purchase Shares of Common Stock to ComVest dated June 30, 2008 (incorporated by reference to Exhibit 10.9 to Form 8-K dated June 30, 2008, filed July 7, 2008).
|
|
|
10.43
|
Warrants Amendment Letter for Warrants CV-1 through CV-3 To Purchase Shares of Common Stock between ComVest and the Company dated June 30, 2008 (incorporated by reference to Exhibit 10.10 to Form 8-K dated June 30, 2008, filed July 7, 2008).
|
|
|
10.44
|
Amended and Restated Asset Purchase Agreement dated July 1, 2008 between the Company, Air-Tight Marketing and Distribution, Inc., and Larry P. Medford and Ted J. Medford (incorporated by reference to Exhibit 10.1 to Form 8-K dated July 1, 2008, filed July 8, 2008).
|
|
|
10.45
|
Employment Agreement dated July 1, 2008 between Ted J. Medford and the Company (incorporated by reference to Exhibit 10.2 to Form 8-K dated July 1, 2008, filed July 8, 2008).
|
|
|
10.46
|
Option Agreement dated July 1, 2008 between Ted J. Medford and the Company (incorporated by reference to Exhibit 10.3 to Form 8-K dated July 1, 2008, filed July 8, 2008).
|
|
|
10.47
|
Employment Agreement dated May 18, 2009 between Michael T. Adams and the Company (incorporated by reference to Exhibit 10.1 to Form 8-K dated May 18, 2009, filed May 20, 2009).
|
|
|
10.48
|
Option Agreement dated May 18, 2009 between Michael T. Adams and the Company (incorporated by reference to Exhibit 10.2 to Form 8-K dated May 18, 2009, filed May 20, 2009).
|
|
|
10.49
|
2010 Year Financial Commitment from Richard J. Kurtz dated March 23, 2010 (incorporated by reference to Exhibit 10.48 to Form 10-K for the year ended December 31, 2009, filed March 31, 2010).
|
|
|
10.50
|
First Amendment, effective January 1, 2010, to Employment Agreement dated May 5, 2008 between Douglas J. Kramer and the Company (incorporated by reference to Exhibit 10.1 to Form 8-K dated May 5, 2010, filed May 11, 2010).
|
|
|
10.51
|
Employment Agreement, effective May 10, 2010, between Charles A. Zajaczkowski and the Company (incorporated by reference to Exhibit 10.2 to Form 8-K dated May 5, 2010, filed May 11, 2010).
|
|
|
10.52
|
First Amendment, effective January 1, 2010, to Employment Agreement dated May 18, 2008 between Michael T. Adams and the Company (incorporated by reference to Exhibit 10.1 to Form 8-K dated June 11, 2010, filed June 16, 2010).
|
|
|
10.53
|
Bank of American Loan and Security Agreement dated August 31, 2010 and effective September 1, 2010 (incorporated by reference to Exhibit 10.1 to Form 8-K dated September 1, 2010, filed September 7, 2011).
|
|
|
10.54
|
Guarantee Agreement between Richard J. Kurtz as Guarantor of Term Loan and Bank of America (incorporated by reference to Exhibit 10.2 to Form 8-K dated September 1, 2010, filed September 7, 2011).
|
|
|
10.55
|
First Amendment dated November 10, 2010 and effective August 31, 2010, to Bank of America Loan Agreement dated August 31, 2010 (incorporated by reference to Exhibit 10.1 to Form 8-K dated November 10, 2010, filed November 18, 2010).
|
|
|
14.1
|
|
Code of Business Ethics and Conduct, as amended, and currently in effect (incorporated by reference to Exhibit 14.1 to Form 10-K dated December 31, 2005 filed March 31, 2006).
|
|
Consent of Hein & Associates LLP for incorporation by reference in Registration Statement (Form S-3 No. 333-143922) of March 31, 2010 report.
|
||
|
|
Certification of Principal Executive Officer Required Under Rule 13a-14(a) of the Securities Exchange Act of 1934, as amended.
|
|
|
|
Certification of Principal Financial Officer Required Under Rule 13a-14(a) of the Securities Exchange Act of 1934, as amended.
|
|
|
|
Certification of Principal Executive Officer and Principal Financial Officer Required Under Rule 13a-14(b) of the Securities Exchange Act of 1934, as amended, and 18 U.S.C. Section 1350.
|
2010 Annual Audit
Lapolla Industries, Inc.
Intercontinental Business Park
15402 Vantage Parkway East, Suite 322
Houston, Texas 77032
www.lapollaindustries.com
LAPOLLA INDUSTRIES, INC.
INDEX TO FINANCIAL STATEMENTS
|
Page
|
|
|
REPORT OF INDEPENDENT REGISTERED PUBLIC ACCOUNTING FIRM
|
F-1
|
|
BALANCE SHEETS
|
|
|
Years Ended December 31, 2010 and 2009
|
F-2
|
|
STATEMENTS OF OPERATIONS
|
|
|
Years Ended December 31, 2010 and 2009
|
F-3
|
|
STATEMENTS OF STOCKHOLDERS’ EQUITY AND COMPREHENSIVE INCOME
|
|
|
Years Ended December 31, 2010 and 2009
|
F-4
|
|
STATEMENTS OF CASH FLOWS
|
|
|
Years Ended December 31, 2010 and 2009
|
F-5
|
|
NOTES TO FINANCIAL STATEMENTS
|
F-6
|
REPORT OF INDEPENDENT REGISTERED PUBLIC ACCOUNTING FIRM
Board of Directors
Lapolla Industries, Inc.
Houston, Texas
We have audited the accompanying balance sheets of Lapolla Industries, Inc. as of December 31, 2010 and 2009 and the related statements of operations, change in stockholders’ equity and comprehensive income, and cash flows for each of the years ended December 31, 2010 and 2009. Our responsibility is to express an opinion on these financial statements based on our audit.
We conducted our audit in accordance with the standards of the Public Company Accounting Oversight Board (United States). Those standards require that we plan and perform the audit to obtain reasonable assurance about whether the financial statements are free of material misstatement. An audit includes examining on a test basis, evidence supporting the amounts and disclosures in the financial statements. An audit also includes assessing the accounting principles used and significant estimates made by management, as well as evaluating the overall financial statement presentation. We believe that our audits provide a reasonable basis for our opinion.
In our opinion, the financial statements referred to above present fairly, in all material respects, the financial position of Lapolla Industries, Inc. as of December 31, 2010 and 2009, and the results of their operations and their cash flows for each of the years ended December 31, 2010 and 2009 in conformity with accounting principles generally accepted in the United States of America.
Also, in our opinion, the Schedule II presents fairly, in all material respects, the information set forth therein in relation to the financial statements taken as a whole.
We were not engaged to examine management's assertion about the effectiveness of Lapolla Industries, Inc.'s internal control over financial reporting as of December 31, 2010 included in Item 9A(b) of Part II in the Company's Annual Report on Form 10-K for the year ended December 31, 2010 and, accordingly, we do not express an opinion thereon.
/s / HEIN & ASSOCIATES LLP
Houston, Texas
April 8, 2011
LAPOLLA INDUSTRIES, INC.
BALANCE SHEETS
|
As of December 31,
|
||||||||
|
2010
|
2009
|
|||||||
|
Assets
|
|
|||||||
|
Current Assets:
|
||||||||
|
Cash
|
$ | 298 | $ | 400,821 | ||||
|
Trade Receivables, Net
|
11,013,824 | 8,262,477 | ||||||
|
Inventories
|
5,353,015 | 4,474,163 | ||||||
|
Prepaid Expenses and Other Current Assets
|
1,259,498 | 891,140 | ||||||
|
Total Current Assets
|
17,626,635 | 14,028,601 | ||||||
|
Property, Plant and Equipment
|
2,547,148 | 2,422,499 | ||||||
|
Other Assets:
|
||||||||
|
Goodwill
|
4,234,828 | 4,234,828 | ||||||
|
Other Intangible Assets, Net
|
1,733,449 | 1,934,071 | ||||||
|
Deposits and Other Non-Current Assets, Net
|
365,930 | 165,328 | ||||||
|
Total Other Assets
|
6,334,207 | 6,334,227 | ||||||
|
Total Assets
|
$ | 26,507,990 | $ | 22,785,327 | ||||
|
Liabilities and Stockholders' Equity
|
||||||||
|
Current Liabilities:
|
||||||||
|
Accounts Payable
|
$ | 8,398,341 | $ | 5,626,877 | ||||
|
Accrued Expenses and Other Current Liabilities
|
1,626,541 | 2,098,053 | ||||||
|
Current Portion of Convertible Term Note
|
— | 2,235,837 | ||||||
|
Current Portion of Term Loan
|
1,250,000 | — | ||||||
|
Current Portion of Revolving Credit Note
|
— | 8,091,835 | ||||||
|
Current Portion of Asset Purchase Promissory Note
|
— | 180,172 | ||||||
|
Current Portion of Derivate Liability
|
292,240 | 571,864 | ||||||
|
Current Portion of Long-Term Debt
|
45,464 | 73,657 | ||||||
|
Total Current Liabilities
|
11,612,586 | 18,878,295 | ||||||
|
Other Liabilities:
|
||||||||
|
Non-Current Portion of Term Loan
|
937,500 | — | ||||||
|
Non-Current Portion of Revolver Loan
|
7,578,262 | — | ||||||
|
Non Current Portion of Long-Term Debt
|
70,062 | 143,814 | ||||||
|
Total Other Liabilities
|
8,585,824 | 143,814 | ||||||
|
Total Liabilities
|
20,198,410 | 19,022,109 | ||||||
|
Commitments and Contingencies (Note 15)
|
||||||||
|
Stockholders' Equity:
|
||||||||
|
Preferred Stock, $1.00 Par Value; 2,000,000 Shares Authorized, of which Designation:
|
||||||||
|
Series D, 25,000 Shares Authorized; 5,242 and 13,916 Issued and Outstanding for 2010 and 2009, respectively; $5,242,000 and $13,916,000 aggregate liquidation preference for 2010 and 2009, respectively.
|
5,242 | 13,916 | ||||||
|
Common Stock, $.01 Par Value; 98,000,000 Shares Authorized; 83,705,376 and 63,944,799 Issued and Outstanding for 2010 and 2009, respectively.
|
837,054 | 639,448 | ||||||
|
Additional Paid-In Capital
|
82,081,100 | 81,802,159 | ||||||
|
Accumulated (Deficit)
|
(76,587,648 | ) | (78,688,712 | ) | ||||
|
Accumulated Other Comprehensive (Loss)
|
(26,168 | ) | (3,593 | ) | ||||
|
Total Stockholders' Equity
|
6,309,580 | 3,763,218 | ||||||
|
Total Liabilities and Stockholders' Equity
|
$ | 26,507,990 | $ | 22,785,327 | ||||
The Accompanying Notes are an Integral Part of the Financial Statements
LAPOLLA INDUSTRIES, INC.
STATEMENTS OF OPERATIONS
|
Year Ended December 31,
|
||||||||
|
2010
|
2009
|
|||||||
|
Sales
|
$ | 70,496,629 | $ | 50,026,470 | ||||
|
Cost of Sales
|
53,793,826 | 37,549,283 | ||||||
|
Gross Profit
|
16,702,803 | 12,477,187 | ||||||
|
Operating Expenses:
|
||||||||
|
Selling, General and Administrative
|
12,336,719 | 12,244,086 | ||||||
|
Professional Fees
|
359,572 | 281,536 | ||||||
|
Depreciation
|
311,487 | 283,920 | ||||||
|
Amortization of Other Intangible Assets
|
386,252 | 365,125 | ||||||
|
Consulting Fees
|
209,963 | 183,097 | ||||||
|
Total Operating Expenses
|
13,603,993 | 13,357,764 | ||||||
|
Operating Income (Loss)
|
3,098,810 | (880,578 | ) | |||||
|
Other Income (Expense):
|
||||||||
|
Interest Expense
|
813,660 | 1,186,390 | ||||||
|
Interest Expense – Related Party
|
200 | 247,259 | ||||||
|
Interest Expense – Amortization of Discount
|
702,233 | 912,085 | ||||||
|
(Gain) Loss on Derivative Liability
|
(279,624 | ) | (318,425 | ) | ||||
|
Other, Net
|
(238,724 | ) | (83,959 | ) | ||||
|
Total Other Income (Expense)
|
997,745 | 1,943,350 | ||||||
|
Net Income (Loss)
|
$ | 2,101,064 | $ | (2,823,927 | ) | |||
|
Dividends on Preferred Stock
|
(1,328,131 | ) | (817,025 | ) | ||||
|
Net Income (Loss) Available to Common Stockholders
|
$ | 772,934 | $ | (3,640,952 | ) | |||
|
Net Income (Loss) Per Share - Basic.
|
$ | 0.01 | $ | (0.06 | ) | |||
|
Weighted Average Shares Outstanding
|
66,649,323 | 63,944,803 | ||||||
|
Net Income (Loss) Per Share - Diluted
|
$ | 0.01 | $ | (0.06 | ) | |||
|
Weighted Average Shares Outstanding
|
67,156,700 | 63,944,803 | ||||||
The Accompanying Notes are an Integral Part of the Financial Statements
LAPOLLA INDUSTRIES, INC.
STATEMENTS OF STOCKHOLDERS' EQUITY
AND COMPREHENSIVE INCOME
|
Preferred Stock
|
Common Stock
|
Additional
|
Accumulated
Other
|
Total
|
||||||||||||||||||||||||||||||||
|
As of the Year Ended
|
Series
A
|
Series
D
|
Par
$1.00
|
Shares
|
Par
$0.01
|
Paid-In
Capital
|
Accumulated
(Deficit)
|
Comprehensive
Income (Loss)
|
Stockholders'
Equity
|
|||||||||||||||||||||||||||
|
December 31, 2008
|
62,500 | 8,176 | $ | 63,211 | 63,944,803 | $ | 639,448 | $ | 78,106,472 | $ | (76,529,915 | ) | $ | — | $ | 2,279,216 | ||||||||||||||||||||
|
Comprehensive (Loss), Net of Tax:
|
||||||||||||||||||||||||||||||||||||
|
Net (Loss)
|
— | — | — | — | — | — | (2,823,927 | ) | — | (2,823,927 | ) | |||||||||||||||||||||||||
|
Currency Translation (Loss)
|
— | — | — | — | — | — | — | (3,593 | ) | (3,593 | ) | |||||||||||||||||||||||||
|
Comprehensive (Loss)
|
— | — | — | — | — | — | — | — | (2,827,520 | ) | ||||||||||||||||||||||||||
|
Issuance of Common Stock
|
— | — | — | — | — | — | — | — | — | |||||||||||||||||||||||||||
|
Issuance of Preferred Stock
|
— | 5,840 | 5,840 | — | — | 5,834,160 | — | — | 5,840,000 | |||||||||||||||||||||||||||
|
Voluntary Redemption of Preferred Stock
|
— | (100 | ) | (100 | ) | — | — | (99,900 | ) | — | — | (100,000 | ) | |||||||||||||||||||||||
|
Derecognition of Preferred Stock
|
(62,500 | ) | — | (55,035 | ) | — | — | 55,035 | — | — | — | |||||||||||||||||||||||||
|
Share-Based Compensation Expense
|
— | — | — | — | — | 278,836 | — | — | 278,836 | |||||||||||||||||||||||||||
|
Fair Value of Derivative Liability
|
— | — | — | — | — | (1,555,423 | ) | 665,131 | — | (890,292 | ) | |||||||||||||||||||||||||
|
Preferred Stock Accrued Dividends and Other Adjustments
|
— | — | — | — | — | (817,021 | ) | — | — | (817,021 | ) | |||||||||||||||||||||||||
|
December 31, 2009
|
— | 13,916 | $ | 13,916 | 63,944,803 | $ | 639,448 | $ | 81,802,159 | $ | (78,688,711 | ) | $ | (3,593 | ) | $ | 3,763,219 | |||||||||||||||||||
|
Comprehensive Income, Net of Tax:
|
||||||||||||||||||||||||||||||||||||
|
Net Income
|
— | — | — | — | — | — | 2,101,064 | — | 2,101,064 | |||||||||||||||||||||||||||
|
Currency Translation (Loss)
|
— | — | — | — | — | — | — | (22,575 | ) | (22,575 | ) | |||||||||||||||||||||||||
|
Comprehensive Income
|
— | — | — | — | — | — | — | — | 2,078,489 | |||||||||||||||||||||||||||
|
Issuance of Common Stock - Director Plan
|
— | — | — | 160,000 | 1,600 | (1,600 | ) | — | — | — | ||||||||||||||||||||||||||
|
Conversion of Preferred Dividends to Preferred Stock
|
— | 1,407 | 1,407 | — | — | 1,405,263 | — | — | 1,406,670 | |||||||||||||||||||||||||||
|
Conversion of Loan Payable - Related Party to Preferred Stock
|
— | 19 | 19 | — | — | 181 | — | — | 200 | |||||||||||||||||||||||||||
|
Exchange of Preferred Stock for Common Stock
|
— | (10,000 | ) | (10,000 | ) | 19,600,573 | 196,006 | 202,299 | — | — | 388,304 | |||||||||||||||||||||||||
|
Voluntary Redemption of Preferred Stock
|
— | (100 | ) | (100 | ) | — | — | (99,900 | ) | — | — | (100,000 | ) | |||||||||||||||||||||||
|
Share-Based Compensation Expense
|
— | — | — | — | — | 100,831 | — | — | 100,831 | |||||||||||||||||||||||||||
|
Preferred Stock Accrued Dividends and Other Adjustments
|
— | — | — | — | — | (1,328,133 | ) | — | — | (1,328,133 | ) | |||||||||||||||||||||||||
|
December 31, 2010
|
— | 5,242 | $ | 5,242 | 83,705,376 | $ | 837,054 | $ | 82,081,100 | $ | (76,587,648 | ) | $ | (26,168 | ) | $ | 6,309,580 | |||||||||||||||||||
The Accompanying Notes are an Integral Part of the Financial Statements
LAPOLLA INDUSTRIES, INC.
STATEMENTS OF CASH FLOWS
|
Year Ended December 31,
|
||||||||
|
2010
|
2009
|
|||||||
|
Cash Flows From Operating Activities
|
||||||||
|
Net Income (Loss):
|
||||||||
|
Continuing Operations
|
$ | 2,101,064 | $ | (2,823,927 | ) | |||
|
Adjustments to Reconcile Net Income (Loss) to Net Cash Provided by (Used in) Operating Activities:
|
||||||||
|
Depreciation
|
481,894 | 478,785 | ||||||
|
Amortization of Other Intangible Assets
|
386,252 | 365,125 | ||||||
|
Provision for Losses on Accounts Receivable
|
423,956 | 1,144,235 | ||||||
|
Amortization of Discount on Convertible Term and Revolving Credit Notes
|
702,233 | 912,086 | ||||||
|
Share Based Compensation Expense
|
100,831 | 538,836 | ||||||
|
Gain on Derivative Liability
|
(279,624 | ) | (318,425 | ) | ||||
|
Changes in Assets and Liabilities:
|
||||||||
|
Trade Receivables
|
(3,175,303 | ) | (976,429 | ) | ||||
|
Inventories
|
(878,852 | ) | 290,774 | |||||
|
Prepaid Expenses and Other Current Assets
|
(368,358 | ) | 151,766 | |||||
|
Deposits and Other Non Current Assets
|
(386,232 | ) | (252,718 | ) | ||||
|
Accounts Payable
|
2,771,464 | (1,351,190 | ) | |||||
|
Accrued Expenses and Other Current Liabilities
|
870,530 | (847,062 | ) | |||||
|
Net Cash Provided by (Used in) Operating Activities
|
2,749,855 | (2,688,144 | ) | |||||
|
Cash Flows From Investing Activities
|
||||||||
|
Additions to Property, Plant and Equipment
|
(606,544 | ) | (236,268 | ) | ||||
|
Payment for AirTight Asset Purchase
|
(180,172 | ) | (90,085 | ) | ||||
|
Net Cash (Used in) Investing Activities
|
$ | (786,716 | ) | $ | (326,353 | ) | ||
|
Cash Flows From Financing Activities
|
||||||||
|
Proceeds from Revolving Credit Note
|
800,000 | — | ||||||
|
Principal Repayments to Revolving Credit Note
|
(9,330,191 | ) | — | |||||
|
Proceeds from Revolver Loan
|
8,631,031 | — | ||||||
|
Principal Repayments to Revolver Loan
|
(1,052,769 | ) | — | |||||
|
Principal Repayments to Convertible Term Note
|
(2,500,000 | ) | (500,000 | ) | ||||
|
Proceeds from Term Loan
|
2,500,000 | — | ||||||
|
Principal Repayments to Term Loan
|
(312,501 | ) | — | |||||
|
Proceeds from Loans Payable – Related Party
|
— | 4,300,000 | ||||||
|
Principal Repayments on Long Term Debt
|
(101,657 | ) | (115,965 | ) | ||||
|
Payment of Preferred Stock Dividends
|
(875,000 | ) | (207,969 | ) | ||||
|
Payments for Voluntary Redemption of Preferred Stock
|
(100,000 | ) | (100,000 | ) | ||||
|
Net Cash (Used in) Provided by Financing Activities
|
(2,341,087 | ) | 3,376,066 | |||||
|
Net Effect of Exchange Rate Changes on Cash
|
(22,575 | ) | (3,593 | ) | ||||
|
Net Increase (Decrease) In Cash
|
(400,523 | ) | 357,976 | |||||
|
Cash at Beginning of Year
|
400,821 | 42,845 | ||||||
|
Cash at End of Year
|
$ | 298 | $ | 400,821 | ||||
|
Supplemental Disclosure of Cash Flow Information:
|
||||||||
|
Cash Payments for Income Taxes
|
$ | -0- | $ | -0- | ||||
|
Cash Payments for Interest
|
759,304 | 1,358,925 | ||||||
|
Supplemental Schedule of Non Cash Investing and Financing Activities:
|
||||||||
|
Conversion of Accrued Preferred Stock Dividends to Preferred Stock
|
$ | 1,406,670 | $ | — | ||||
|
Conversion of Loan Payable - Related Party to Preferred Stock
|
200 | 5,840,000 | ||||||
|
Conversion of Accrued Preferred Stock Dividends to Common Stock
|
388,304 | — | ||||||
The Accompanying Notes are an Integral Part of the Financial Statements
Note 1. Summary of Organization, Basis of Presentation, and Critical Accounting Policies, Estimates, and Assumptions.
This summary briefly describes the Company’s organization, basis of presentation, and critical accounting policies, estimates, and assumptions, which are presented to assist in understanding these financial statements. The financial statements and notes are representations of management who are responsible for their integrity and objectivity. The accounting policies used conform to Generally Accepted Accounting Principles (GAAP) in the United States of America and have been consistently applied in the preparation of these financial statements. Judgments and estimates of uncertainties are required in applying our accounting policies in many areas. However, application of the critical accounting policies discussed below requires management’s significant judgments, often as the result of the need to make estimates of matters that are inherently uncertain. If actual results were to differ materially from the estimates made, the reported results could be materially affected.
Organization History
The Company was incorporated in the state of Delaware on October 20, 1989. The Company acquired 100% of the capital stock of Infiniti Products, Inc. (f/k/a Infiniti Paint Co., Inc.), a Florida corporation, effective September 1, 2001, which was engaged in the business of developing, marketing, selling, and distributing primarily acrylic roof coatings and polyurethane foam systems in the Southeastern United States (“Infiniti”). During the latter part of 2004, Infiniti built and began operating an acrylic roof coatings manufacturing plant in the Southeastern United States. On February 11, 2005, the Company acquired 100% of the capital stock of Lapolla Industries, Inc., an Arizona corporation (“Lapolla AZ”), which was engaged in the business of manufacturing acrylic roof coatings and sealants, and distributing polyurethane foam systems in the Southwestern United States. On April 1, 2005, Infiniti merged with and into Lapolla AZ whereas the existence of Infiniti ceased. On October 1, 2005, Lapolla AZ merged with and into the Company, under its former name of IFT Corporation, whereas the existence of Lapolla AZ ceased. On November 8, 2005, the Company changed its name to Lapolla Industries, Inc. On July 1, 2008, the Company acquired certain assets and liabilities of Air-Tight Marketing and Distribution, Inc. On November 5, 2004, the Company discontinued the operations of its former RSM Technologies, Inc. subsidiary. The Company established its first international branch, opening a Canadian headquarters in Toronto, Ontario, in the second half of 2009.
Reclassifications
Certain reclassifications of prior year amounts have been made to conform to the current year presentation.
Trade Receivables and Credit Risk
Financial instruments that potentially subject the Company to significant concentrations of credit risk consist primarily of trade receivables. The Company’s customers consist of contractors and distributors. Trade receivables consist primarily of uncollateralized customer obligations, including personal guarantees when obtainable, due under normal trade terms which usually require payment within 30 days of the invoice date. However, these payment terms are extended in select cases and many customers do not pay within stated trade terms. The Company has trade receivables from a diversified customer base. In addition, the Company has a credit insurance policy in place covering most customer account balances. The Company believes no significant concentration of credit risk exists. The Company evaluates the creditworthiness of its customers’ financial position and monitors accounts on a regular basis. Provisions to the allowance for doubtful accounts are reviewed quarterly and adjustments are made periodically (as circumstances warrant) based upon management’s best estimate of collectability of accounts. No customer represents more than 10% of sales for each of the years ended December 31, 2010 and 2009. No customer represented more than 10% of trade receivables at December 31, 2010 or 2009.
Goodwill and Other Intangible Assets
Goodwill represents the excess of the cost over the fair value of net tangible and identifiable intangible assets of acquired businesses. Identifiable intangible assets acquired in business combinations are recorded based upon their fair value at the date of acquisition. According to GAAP, goodwill is required to be tested for impairment, on an annual basis and between annual tests in certain circumstances, and written down when impaired. The goodwill impairment test is performed by comparing the fair value of the associated reporting unit to its carrying value. GAAP also requires that intangible assets with estimable useful lives be amortized over their respective estimated lives to their estimated residual values, and reviewed for impairment, unless these lives are determined to be indefinite.
Fair Value of Financial Instruments
The Company adopted authoritative GAAP guidance regarding disclosures about fair value of financial instruments, which requires the disclosure of the fair value of off-and-on balance sheet financial instruments. Unless otherwise indicated, the fair values of all reported assets and liabilities, which represent financial instruments (none of which are held for trading purposes), approximate the carrying values of such amounts. The Company adopted authoritative GAAP guidance regarding fair value measurements, which defines fair value as the exchange price that would be received for an asset or paid to transfer a liability in the principal or most advantageous market in an orderly transaction between market participants at the measurement date. This guidance establishes three levels of inputs that may be used to measure fair value: (a) Level 1 - Quoted prices in active markets for identical assets or liabilities. The Company had no Level 1 assets or liabilities at December 31, 2010; (b) Level 2 - Observable inputs other than Level 1 prices, such as quoted prices for similar assets or liabilities, quoted prices in markets with insufficient volume or infrequent transactions (less active markets), or model-derived valuations in which all significant inputs are observable or can be derived principally from or corroborated with observable market data for substantially the full term of the assets or liabilities. The Company had no Level 2 assets or liabilities at December 31, 2010; and (c) Level 3 - Unobservable inputs to the valuation methodology that are significant to the measurement of the fair value of assets or liabilities. The Company had Level 3 assets or liabilities at December 31, 2010. See Note 9 to our financial statements for level 3 assets and liabilities. The carrying value of cash and cash equivalents, trade receivables and payables, prepaid expenses and other current assets, amounts due to related parties, and other payables and accruals approximate fair value due to the short period of time to maturity.
LAPOLLA INDUSTRIES, INC.
NOTES TO FINANCIAL STATEMENTS
(Continued)
Note 1. Summary of Organization, Basis of Presentation, and Critical Accounting Policies, Estimates, and Assumptions - continued.
Derivatives and Fair Value
The Company recognizes derivatives on the balance sheet at fair value with changes in the values of these derivative liabilities reflected in the statements of operations. The fair value of our derivative liabilities was estimated to be $292,240 and $571,864 as of December 31, 2010 and 2009, respectively. We review the underlying assumptions on our derivative liabilities quarterly and they are subject to change based primarily on management’s assessment at that time. Accordingly, changes to these assessments could materially affect the valuation, which could positively or negatively affect our financial performance in future periods. Disclosures related to our derivative liabilities are included in Note 9 to our financial statements.
Litigation
In the normal course of business, the Company is occasionally involved in legal proceedings. The Company accrues a liability for such matters when it is probable that a liability has been incurred and the amount can be reasonably estimated. When only a range of possible loss can be established, the most probable amount in the range is accrued. If no amount within this range is a better estimate than any other amount within the range, the minimum amount in the range is accrued. The accrual for a litigation loss contingency might include, for example, estimates of potential damages, outside legal fees and other directly related costs expected to be incurred.
Cash and Cash Equivalents
The Company considers cash deposited with financial institutions and marketable securities with a maturity of three months or less at the date of acquisition to be cash and cash equivalents.
Inventories
Cost is determined on an actual and/or standard cost basis that approximates the first-in, first-out (FIFO) method using a perpetual inventory system. Inventories are valued at the lower of cost or market (replacement cost), which does not exceed net realizable value.
Income Taxes
The Company’s provision for income taxes is determined using the U.S. federal statutory rate. The Company recognizes deferred tax assets and liabilities for temporary differences between the financial reporting basis and the tax basis of our assets and liabilities along with net operating loss and tax credit carryovers. The Company’s deferred tax asset was approximately $21.0 Million and $21.8 Million at December 31, 2010 and 2009, respectively. Although the Company reported net income for the 2010 year, the Company's prior history of net losses, applicable rules require the Company to attain at least two full years of net income before it can reduce its valuation allowance to record a deferred tax asset. As a result, the Company recorded a valuation allowance against the deferred tax asset of $21.0 Million and $21.8 Million at December 31, 2010 and 2009, respectively, reducing its net carrying value to zero. Effective at the beginning of 2007, the Company adopted standards that changed the accounting for uncertain tax positions. The implementation of these standards did not result in a cumulative effect adjustment to the Company’s accumulated deficit. As of the date of adoption, the Company had no unrecognized income tax benefits. Accordingly, the annual effective tax rate was not affected. Should the Company incur interest and penalties relating to tax uncertainties, such amounts would be classified as a component of interest expense and operating expense, respectively. At December 31, 2010, the Company had no increase or decrease in unrecognized income tax benefits for the year. There was no accrued interest or penalties relating to tax uncertainties at December 31, 2010. Unrecognized tax benefits are not expected to increase or decrease within the next twelve months.
Depreciable Lives of Property, Plant and Equipment
Property, plant and equipment is recorded at cost and depreciated using the straight-line method, which deducts equal amounts of the cost of each asset from earnings every year over its estimated economic useful life. Economic useful life is the duration of time an asset is expected to be productively employed by the Company, which may be less than its physical life. Assumptions on the following factors, among others, affect the determination of estimated economic useful life: wear and tear, obsolescence, technical standards, contract life, market demand, competitive position, raw material availability, and geographic location. The estimated economic useful life of an asset is monitored to determine its appropriateness, especially in light of changed business circumstances. For example, changes in technology and changes in the estimated future demand for products, may result in a shorter estimated useful life than originally anticipated. In these cases, we would depreciate the remaining net book value over the new estimated remaining life, thereby increasing depreciation expense per year on a prospective basis. Net property, plant and equipment totaled $2,547,148 and depreciation expense totaled $481,894 as of and for the year ended December 31, 2010. Net property, plant and equipment totaled $2,422,499 and depreciation expense totaled $478,785 as of and for the year ended December 31, 2009.
LAPOLLA INDUSTRIES, INC.
NOTES TO FINANCIAL STATEMENTS
(Continued)
Note 1. Summary of Organization, Basis of Presentation, and Critical Accounting Policies, Estimates, and Assumptions - continued.
Impairment of Long-Lived Assets
Property, Plant and Equipment
Property, plant, and equipment held for use is grouped for impairment testing at the lowest level for which there is an identifiable cash flow. Impairment testing of the asset group occurs whenever events or changes in circumstances indicate that the carrying amount of the assets may not be recoverable. Such circumstances would include a significant decrease in the market value of a long-lived asset grouping, a significant adverse change in the manner in which the asset grouping is being used or in its physical condition, a history of operating or cash flow losses associated with the use of the asset grouping, or changes in the expected useful life of the long-lived assets. If such circumstances are determined to exist, an estimate of undiscounted future cash flows produced by that asset group is compared to the carrying value to determine whether impairment exists. If an asset group is determined to be impaired, the loss is measured based on the difference between the asset group’s fair value and its carrying value. An estimate of the asset group’s fair value is based on the discounted value of its estimated cash flows. Assets to be disposed of by sale are reported at the lower of carrying amount or fair value less cost to sell. The assumptions underlying cash flow projections represent our best estimates at the time of the impairment review. Factors that we must estimate include industry and market conditions, sales volume and prices, costs to produce, etc. Changes in key assumptions or actual conditions that differ from estimates could result in an impairment charge. Management believes it uses reasonable and supportable assumptions when performing impairment reviews and cannot predict the occurrence of future events and circumstances that could result in impairment charges.
Goodwill
Goodwill represents the excess of the aggregate purchase price over the fair value of net tangible and identifiable intangible asset of an acquired business. Goodwill was $4,234,828 at December 31, 2010 and 2009. The Company operates two reporting units, Foam and Coatings. Disclosures related to goodwill are included in Note 6 to the financial statements. The Company evaluates goodwill for impairment on an annual basis, or more frequently if Management believes indicators of impairment exist, by comparing the carrying value of each of reportable unit to their estimated fair values. The annual evaluation is performed in the fourth quarter of each calendar year. The impairment test requires the Company to compare the fair value of each reporting unit to its carrying value, including assigned goodwill. In the fourth quarter of 2010 and 2009, the Company conducted the required annual test of goodwill for impairment. Management primarily uses an income approach valuation model, representing the present value of future cash flows to determine fair value of a reporting unit. The valuation model uses a three-year growth period each reporting unit. Management has determined the income approach valuation model represents the most appropriate valuation methodology due to the capital intensive nature of the business, cash flows generated by the reporting units, and limited comparables within the industry. The principal assumptions used in the Company’s income approach valuation model include revenue growth rate, operating profit margins, discount rate, and long term growth rate. Revenue growth rate and operating profit assumptions are consistent with those utilized in the Company’s operating plan and long term financial planning process. The discount rate assumption is calculated based upon an estimated weighted average cost of capital which includes factors such as the risk free rate of return, cost of debt, and expected equity premiums. Long term growth rate is determined from market and industry growth trends. Also, the expected cash flows consider historical experience and current and future expected market and industry conditions. Management judgment is required in the determination of each assumption used in the valuation model, and actual results could differ from the estimates. Upon completion of the 2010 and 2009 annual impairment assessments, the Company determined no impairment was indicated as the estimated fair value of each of the reporting units exceeded its respective carrying value. At December 31, 2010, the aggregate amount of carrying value that exceeded the fair value of the Company's reporting units was approximately $15,000,000, of which $14,400,000 was for Foam and $600,000 was for Coatings. As of December 31, 2010, the Company does not believe any significant indicators of impairment exist for goodwill that would require additional analysis before the 2011 annual evaluation.
Other Intangible Assets
The Company had other intangible assets, net of $1,733,449 and $1,934,071 at December 31, 2010 and 2009, respectively, consisting of customer lists, product formulations, trade names, and non-competes that were acquired as part of business combinations, and trademarks and approvals and certifications obtained as part of entering into new markets. Amortization of other intangible assets totaled $386,252 and $365,126 at December 31, 2010 and 2009, respectively. Other intangible assets are tested for impairment as part of the long-lived asset grouping impairment tests. Impairment testing of the asset group occurs whenever events or changes in circumstances indicate that the carrying amount of the assets may not be recoverable. See impairment discussion above under Property, Plant and Equipment for a description of how impairment losses are determined. Disclosures related to other intangible assets are included in Note 6 to the financial statements. Significant management judgment is required in the forecasts of future operating results that are used in the Company’s impairment evaluations. The estimates used are consistent with the plans and estimates that Management uses to manage its business. It is possible, however, that the plans may change and estimates used may prove to be inaccurate. If the Company’s actual results, or the plans and estimates used in future impairment analyses, are lower than the original estimates used to assess the recoverability of these assets, then the Company could incur future impairment charges, which would adversely affect financial performance.
Revenue Recognition
Sales are recognized as risk and title to products transfers to the customer (which generally occurs at the time shipment is made), the sales price is fixed or determinable, and collectability is reasonably assured. Sales channels include direct sales, distributors, and independent representatives. Irrespective of the sales channel, returns and allowances are not a business practice in the industry. Amounts billed for shipping and handling are included in revenues (freight). Freight included in revenue was $712,834 and $462,270 in 2010 and 2009, respectively. Costs incurred for shipping and handling are included in cost of sales. Freight included in cost of sales was $3,525,607 and $2,357,811 in 2010 and 2009, respectively. Revenues are recorded net of sales tax.
LAPOLLA INDUSTRIES, INC.
NOTES TO FINANCIAL STATEMENTS
(Continued)
Note 1. Summary of Organization, Basis of Presentation, and Critical Accounting Policies, Estimates, and Assumptions - continued.
Research and Development
Research and development costs related to both future and present products are charged to operations as incurred.
Share-Based Compensation
The Company accounts for stock based compensation in accordance with GAAP, which requires the Company to measure and recognize the cost of employee or director services received in exchange for an award of equity instruments based on the grant-date fair value of the award. The fair value of share based awards is estimated at the grant date using a lattice-based valuation model and the portion that is ultimately expected to vest is recognized as compensation cost over the requisite service period. The determination of fair value is affected by the Company’s stock price as well as assumptions regarding a number of complex and subjective variables, including expected stock price volatility, risk-free interest rate, expected dividends and projected employee stock option exercise behaviors. Employee stock option exercise behavior is based on actual historical exercise activity and assumptions regarding future exercise activity of unexercised, outstanding options. The Company applies an estimated forfeiture rate to unvested awards for the purpose of calculating compensation cost. These estimates are subject to revision in future periods if actual forfeitures differ from the estimates and changes impact compensation cost in the period in which the change in estimate occurs. Disclosures related to share based compensation are included in Note 18 to our financial statements. Share based compensation expense was $100,831 and $538,836 in 2010 and 2009, respectively. The share based compensation expense decrease positively affected the Company’s financial performance for 2010. If additional share based awards are granted, financial performance may be negatively affected, and if outstanding share based awards are forfeited or canceled, resulting in non-vesting of such stock awards, financial performance may be positively affected. In either instance, the Company’s financial performance may change depending on share based award activities in future periods.
Allowance for Doubtful Accounts
The Company presents trade receivables, net of allowances for doubtful accounts, to ensure trade receivables are not overstated due to uncollectible accounts. Allowances, when required, are calculated based on a detailed review of certain individual customer accounts and an estimation of the overall economic conditions affecting our customer base. The Company reviews a customer’s credit history before extending credit. The allowance for doubtful accounts was $938,831 and $734,962 at December 31, 2010 and 2009, respectively. If the financial condition of customers were to deteriorate based on worsening overall economic conditions, resulting in an impairment of their ability to make payments to the Company, then additional allowances may be required in future periods.
Cost of Sales and Selling, General and Administrative Costs
The Cost of Sales line item includes all the material, overhead, packaging, and freight costs associated with products shipped, including resale finished goods and raw materials, as well as payroll costs associated with manufacturing the finished goods, inbound freight, sales tax expense, product containers, labels, and other miscellaneous items that are indirectly used in the manufacturing, packaging, and shipping (outbound freight) of finished goods, including inspection, and internal transfer costs, as well as depreciation of machinery, amortization of approvals and certifications, and an allocated portion of overhead. The Selling, General and Administrative line item includes selling, advertising, marketing, customer service, and technical support, as well as the costs of providing corporate functional support for all other areas of our business.
Advertising and Marketing Expenses
Advertising and marketing costs are generally expensed as incurred. Expenditures for certain advertising and marketing activities related to trade shows and trade magazines are deferred within the Company’s fiscal year when the benefits clearly extend beyond the interim period in which the expenditure is made, generally not to exceed 90 days. Other advertising and marketing expenditures that do not meet the deferred criteria are expensed when the advertising and marketing occurs. Total advertising and marketing costs expensed were approximately $1,250,283 and $1,443,516 in 2010 and 2009, respectively.
Debt Issuance Costs
The Company capitalizes debt issuance costs, which are included in “Other Non-Current Assets” in the Company’s balance sheets. These costs are amortized using the effective interest method. Amortization of debt issuance costs is included in “Interest Expense – Amortization of Discount” in the statements of operations.
Net Income (Loss) Per Common Share
Basic income (loss) per share is based upon the net income (loss) applicable to common shares after preferred dividend requirements and upon the weighted average number of common shares outstanding during the period. Diluted income (loss) per share reflects the effect of the assumed conversions of convertible securities and exercise of stock options only in periods in which such effect would have been dilutive. For 2010, the securities that could potentially dilute net income per share in the future that were included in the computation of net income per share – diluted were: (a) 2,500,000 shares of common stock issuable upon exercise of warrants, and (b) 1,770,208 shares of common stock issuable upon exercise of vested and exercisable stock options. For the year ended December 31, 2009, basic and diluted net (loss) per share are the same since (a) the Company has reflected net losses for the periods presented and (b) the potential issuance of shares of common stock of the Company would be anti-dilutive. The securities that could potentially dilute net (loss) per share in the future that were not included in the computation of net (loss) per share – diluted for the year ended December 31, 2009 were: (a) 3,246,753 shares of common stock issuable related to the convertible term note, (b) $2,500,000 shares of common stock issuable upon exercise of vested warrants, and (c) 1,591,973 issuable upon exercise of vested and exercisable stock options.
LAPOLLA INDUSTRIES, INC.
NOTES TO FINANCIAL STATEMENTS
(Continued)
Note 1. Summary of Organization, Basis of Presentation, and Critical Accounting Policies, Estimates, and Assumptions - continued.
Recently Adopted Accounting Standards
In December 2010, the Financial Accounting Standards Board ("FASB") issued an accounting standards update that requires an entity to perform Step 2 of the goodwill impairment test for its reporting units with a zero or a negative carrying amount if there are qualitative factors indicating that it is more likely than not that a goodwill impairment exists. This guidance is effective for fiscal years beginning after December 15, 2010, and applied as a change in accounting principle with any impairment recorded as a cumulative-effect adjustment to beginning retained earnings. The Company adopted the provisions of the guidance in the fourth quarter of 2010. The adoption of this guidance did not have a material impact on the Company’s financial statements.
In December 2010, the FASB issued an accounting standards update that requires an entity to disclose pro forma revenue and earnings of the combined entity for both the year in which a business combination occurred and the prior year as if the business combination had occurred as of the beginning of prior year only. This guidance is effective prospectively for business combinations occurring in fiscal years beginning after December 15, 2010. The Company adopted the provisions of the guidance in the fourth quarter of 2010. The adoption of this guidance did not have a material impact on the Company’s financial statements.
In January 2010, the FASB issued amended standards that require additional fair value disclosures. These disclosure requirements are effective in two phases. In the first quarter of 2010, the Company adopted the requirements for disclosures about inputs and valuation techniques used to measure fair value as well as disclosures about significant transfers. Beginning in the first quarter of 2011, these amended standards will require presentation of disaggregated activity within the reconciliation for fair value measurements using significant unobservable inputs (Level 3). These amended standards do not affect the Company’s statements of operations or balance sheets.
In October 2009, the Financial Accounting Standards Board (“FASB”) issued new standards for revenue recognition with multiple deliverables. These new standards impact the determination of when the individual deliverables included in a multiple-element arrangement may be treated as separate units for accounting purposes. Additionally, these new standards modify the manner in which the arrangement consideration is allocated across the separately identified deliverables by no longer permitting the residual method of allocating arrangement consideration. These new standards are required to be adopted in the first quarter of 2011; however, early adoption is permitted. The Company does not expect these new standards to significantly impact our financial statements.
Note 2. Trade Receivables.
Trade receivables are comprised of the following for the years ending December 31:
|
2010
|
2009
|
|||||||
|
Trade Receivables
|
$ | 11,952,655 | $ | 8,997,439 | ||||
|
Less: Allowance for Doubtful Accounts
|
(938,831 | ) | (734,962 | ) | ||||
|
Trade Receivables, Net
|
$ | 11,013,824 | $ | 8,262,477 | ||||
Note 3. Inventories.
The following is a summary of inventories for the years ending December 31:
|
2010
|
2009
|
|||||||
|
Raw Materials
|
$ | 1,663,674 | $ | 1,232,259 | ||||
|
Finished Goods
|
3,689,341 | 3,241,904 | ||||||
|
Total
|
$ | 5,353,015 | $ | 4,474,163 | ||||
Note 4. Property, Plant and Equipment.
The following is a summary of property, plant and equipment for the years ending December 31:
|
2010
|
2009
|
Estimated Useful Life
|
|||||||
|
Vehicles
|
$ | 872,993 | $ | 715,359 |
5 Years
|
||||
|
Leasehold Improvements
|
176,426 | 143,992 |
13 – 15 Years
|
||||||
|
Office Furniture and Equipment
|
266,788 | 198,278 |
3 – 7 Years
|
||||||
|
Computers and Software
|
861,765 | 706,931 |
3 – 5 Years
|
||||||
|
Machinery and Equipment
|
2,362,827 | 2,118,227 |
3 – 20 Years
|
||||||
|
Plant Construction in Progress
|
83,667 | 175,861 | |||||||
|
Total Property, Plant and Equipment
|
$ | 4,624,466 | $ | 4,058,648 | |||||
|
Less: Accumulated Depreciation
|
(2,077,318 | ) | (1,636,149 | ) | |||||
|
Total Property, Plant and Equipment, Net
|
$ | 2,547,148 | $ | 2,422,499 | |||||
Depreciation expense was $481,894 and $478,785 for the years ended 2010 and 2009, of which $170,407 and $194,865 were included in cost of sales for 2010 and 2009, respectively.
LAPOLLA INDUSTRIES, INC.
NOTES TO FINANCIAL STATEMENTS
(Continued)
Note 5. Dependence on Few Suppliers.
The Company is dependent on a few suppliers for certain of its raw materials and finished goods. For 2010 and 2009, raw materials and finished goods purchased from the Company’s three largest suppliers accounted for approximately 60% and 51% of purchases, respectively.
Note 6. Goodwill and Other Intangible Assets.
The following is a summary of Goodwill for the years ending December 31:
Goodwill
|
2010
|
2009
|
|||||||
|
Foam
|
$ | 2,932,208 | $ | 2,932,208 | ||||
|
Coatings
|
1,302,620 | 1,302,620 | ||||||
| $ | 4,234,828 | $ | 4,234,828 | |||||
The following is a summary of Other Intangible Assets for the years ending December 31:
Other Intangible Assets
|
2010
|
2009
|
||||||||||||||||
|
Gross
Amount
|
Accumulated
Amortization
|
Gross
Amount
|
Accumulated
Amortization
|
Amortization
Period
|
|||||||||||||
|
Customer Lists
|
$ | 859,235 | $ | (464,236 | ) | $ | 859,235 | $ | (303,927 | ) |
5 Years
|
||||||
|
Product Formulation
|
138,471 | (53,850 | ) | 138,471 | (44,618 | ) |
15 Years
|
||||||||||
|
Trade Names
|
740,325 | (121,147 | ) | 740,325 | (71,792 | ) |
15 Years
|
||||||||||
|
Non-Competes
|
210,000 | (105,000 | ) | 210,000 | (63,000 | ) |
5 Years
|
||||||||||
|
Approvals and Certifications
|
745,391 | (215,740 | ) | 562,963 | (93,586 | ) |
5 Years
|
||||||||||
| $ | 2,693,422 | $ | (959,973 | ) | $ | 2,510,994 | $ | (576,923 | ) | ||||||||
Based on the other intangible assets in service as of December 31, 2010, estimated amortization expense for the years ending December 31, 2010 through December 31, 2014 and thereafter is as follows:
|
2011
|
2012
|
2013
|
2014
|
Thereafter
|
||||||||||||||||
|
Customer Lists
|
$ | 158,000 | $ | 158,000 | $ | 78,999 | $ | — | $ | — | ||||||||||
|
Product Formulation
|
9,231 | 9,231 | 9,231 | 9,231 | 47,697 | |||||||||||||||
|
Trade Names
|
49,355 | 49,355 | 49,355 | 49,355 | 421,758 | |||||||||||||||
|
Non-Competes
|
42,000 | 42,000 | 21,000 | — | — | |||||||||||||||
|
Approvals and Certifications
|
$ | 147,674 | $ | 147,674 | $ | 147,674 | $ | 21,781 | $ | — | ||||||||||
The Company evaluates the amortization period of goodwill and other intangible assets on an ongoing basis, in light of any changes in business conditions, events or circumstances, which may indicate the potential impairment of goodwill and other intangible assets.
Note 7. Accrued Expenses and Other Current Liabilities.
The following is a summary of accrued expenses and other current liabilities for the years ending December 31:
|
2010
|
2009
|
|||||||
|
Accrued Payroll
|
$ | 234,350 | $ | — | ||||
|
Accrued Commissions
|
82,012 | 41,788 | ||||||
|
Accrued Inventory Purchases
|
442,855 | 36,116 | ||||||
|
Accrued Taxes and Other
|
417,095 | 341,966 | ||||||
|
Accrued Insurance
|
316,792 | 190,913 | ||||||
|
Accrued Dividends Payable
|
64,827 | 1,406,670 | ||||||
|
Deferred Finance Charge Income
|
68,610 | 80,600 | ||||||
|
Total Accrued Expenses and Other Current Liabilities
|
$ | 1,626,541 | $ | 2,098,053 | ||||
LAPOLLA INDUSTRIES, INC.
NOTES TO FINANCIAL STATEMENTS
(Continued)
Note 8. Financing Instruments
(a) Loan and Security Agreement. The Company entered into a Loan and Security Agreement with Bank of America, N.A., on August 31, 2010, which became effective when funded by Bank of America, on September 1, 2010, under which Bank of America agreed to loan up to $2,500,000 under a term loan, which matures on August 31, 2012 ("Term Loan") and $10,000,000 under a revolver loan, which matures on August 31, 2013 ("Revolver Loan") (the "Term Loan" and "Revolver Loan" are collectively referred to as "Bank Loans"). To secure the prompt payment and performance of all obligations under the Bank Loans, the Company granted Bank of America a continuing security interest in and lien upon all property of the Company. On September 1, 2010, the Company initially borrowed $10,576,851 under the Bank Loans, of which $8,076,851 was from the Revolver Loan and $2,500,000 was from the Term Loan. The borrowing was comprised entirely of a Base Rate Loan (defined as any loan that bears interest based on the Base Rate). The Base Rate is for any day, a per annum rate equal to the greater of (a) the Prime Rate for such day; (b) the Federal Funds Rate for such day, plus 0.50%; or (c) LIBOR for a 30 day interest period as determined on such day, plus 1.50%. The Company has the ability to change the applicable margin from the Base Rate based on the type of loan to a LIBOR rate of 3.00 for the Revolver Loan and 3.75% for the Term Loan. The Company has three material debt covenants to comply with: (i) Capital expenditures are limited to $500,000 on an annual basis, (ii) A borrowing base calculation defined as an amount determined by a detailed calculation equal to 85% of eligible accounts receivable, plus 55% of eligible inventory cannot be exceeded (“Borrowing Base”); and (iii) a monthly EBITDA calculation must be met for 2010 only. A fixed charge coverage ratio of at least 1.1 to 1.0 replaces the monthly EBITDA calculation and will be tested monthly beginning as of January 2011. The Company is required to submit its Borrowing Base calculation to its financing institution daily. If, at any time, the Company’s Borrowing Base calculation is less than the amount outstanding under the Revolver Loan, and that amount remains unpaid or is not increased from future Borrowing Base calculations to an amount equal to the balance outstanding under the Revolver Loan at any given time, the financing institution, in its discretion, may accelerate any and all amounts outstanding under the Bank Loans. The Company was in compliance with its debt covenants at December 31, 2010. A brief summary of certain terms and conditions of the Bank Loans are provided below:
(i) Revolver Loan. The Revolver Loan obligates Bank of America to make revolver loans and to issue letters of credit in an amount up to the $10,000,000 commitment and matures on August 31, 2013. The proceeds of revolver loans shall be used by the Company solely: (a) to satisfy existing debt; (b) to pay fees and transaction expenses associated with the closing of this credit facility; (c) to pay obligations in accordance with the agreement; and (d) for working capital and other lawful corporate purposes of the Company. At December 31, 2010, the balance outstanding on the Revolver Loan was $7,578,262 and the weighted-average interest rate was 3.95%; and
(ii) Term Loan. The Term Loan obligated Bank of America to make up to $2,500,000 available to the Company upon closing of the Bank Loans. The Term Loan was personally guaranteed by the Chairman of the Board and majority stockholder ("Guarantee"). Principal of the Term Loan shall be repaid in consecutive monthly installments on the first business day of each month, commencing on October 1, 2010, each such installment to be in an amount equal to 1/24 of the principal balance of the original amount of the Term Loan, until the Term Loan maturity date of August 31, 2012, or earlier based on mandatory prepayment events, on which date all principal, interest and other amounts owing with respect to the Term Loan shall be due and payable in full. Once repaid, whether such repayment is voluntary or required, no portion of the Term Loan may be reborrowed. The Company may, at its option from time to time after April 15, 2011, prepay the Term Loan. At December 31, 2010, the balance outstanding on the Term Loan was $2,187,500 and the interest rate was 4.125%;
(b) Revolving Credit and Term Loan Agreement. The Company entered into a Revolving Credit and Term Loan Agreement on February 21, 2007 with ComVest, as amended from time to time, under which ComVest agreed to loan up to $9,500,000 under a revolving credit note and $3,000,000 under a convertible term note ("Loan Agreements”), and Lapolla agreed to issue certain detachable warrants, as amended and increased from time to time (“Warrants”) to ComVest and register the underlying shares issuable under the convertible term note and the Warrants. The debt instruments were recorded at fair value of $851,917, at an effective interest rate of approximately 30%, and the resulting discounts were amortized to interest expense using the effective interest method over the term of the agreements. A brief summary of certain terms and conditions of the matured and paid off Loan Agreements and other related agreements are provided below:
(i) Revolving Credit Note. Under the revolving credit note, as amended from time to time, ComVest agreed to provide the Company with a secured revolving credit facility, from June 30, 2008 to August 31, 2010, in an aggregate principal amount the lesser of (i) the borrowing base (an amount determined by a detailed calculation equal to 85% of eligible accounts receivable, plus 50% of eligible inventory) provided to ComVest, or (ii) $9,500,000. The revolving credit note's interest rate was calculated according to a coverage ratio formula with a coverage ratio ranging from 1.0 to 2.0 and Prime rate ranging from Prime plus 1% to Prime plus 0%. Unamortized discount was $-0- and $438,357 at December 31, 2010 and 2009, respectively.
(ii) Convertible Term Note. The convertible term note, as amended from time to time, had a fixed interest rate of 10% per annum and the principal was payable (i) in thirteen (13) equal monthly installments of $83,333.33 each, due and payable on the first day of each calendar month commencing July 1, 2009 and continuing through and including August 1, 2010, and (ii) in the final installment due and payable on August 31, 2010 in an amount equal to the entire remaining principal balance, and was convertible optionally by ComVest at any time or mandatorily by Lapolla subject to satisfaction of certain conditions to common stock at the rate of $.77 per share. The convertible term note was personally guaranteed by the Chairman of the Board. Unamortized discount was $-0- and $264,163 at December 31, 2010 and 2009, respectively.
(iii) Warrants. The detachable and remaining outstanding Warrants are for the purchase of an aggregate of 2,500,000 shares of common stock, of which 1,500,000 are exercisable at a price of $.59 per share and 1,000,000 are exercisable at a price of $.74 per share, expire on June 30, 2013, and have an aggregate fair value of $292,240. See also Note 9 - Derivatives and Fair Value for more information.
(iv) Registration Rights. The Company determined that no liability was recognizable at December 31, 2010 for registration payment arrangements based on the fact that the Registration Statement was effective at December 31, 2010.
LAPOLLA INDUSTRIES, INC.
NOTES TO FINANCIAL STATEMENTS
(Continued)
Note 9. Derivatives and Fair Value.
The Company has evaluated the application of GAAP with respect to the embedded conversion feature associated with the ComVest convertible term note (matured and paid off in 2010) and associated Warrants (detachable and remaining outstanding at December 31, 2010) to purchase common stock and determined these instruments were required to be accounted for as derivatives as of January 1, 2009 due to the down round protection feature on the conversion price and the exercise price. The Company records the fair value of these derivatives on its balance sheet at fair value with changes in the values of these derivatives reflected in the statements of operations as “(Gain) Loss on Derivative Liabilities.” These derivative instruments are not designated as hedging instruments under GAAP and are disclosed on the balance sheet under “Derivative Liabilities”. At December 31, 2010 and 2009, all of the Company’s derivative liabilities were categorized as Level 3 fair value assets, respectively.
Level 3 Valuation Techniques
Financial assets are considered Level 3 when their fair values are determined using pricing models, discounted cash flow methodologies or similar techniques and at least one significant model assumption or input is unobservable. Level 3 financial liabilities consist of the embedded conversion feature and freestanding warrants that contain down round provisions for which there is no current market for these securities such that the determination of fair value requires significant judgment or estimation. We have valued the embedded conversion feature and the freestanding warrants using a lattice model, with the assistance of a valuation consultant, for which management understands the methodologies. This model incorporates transaction details such as the Company’s stock price, contractual terms, maturity, risk free rates, as well as assumptions about future financings, volatility, and holder behavior as of January 1, and December 31, 2010 and 2009, respectively. For 2010, the primary assumptions include projected annual volatility of 123% and holder exercise targets at 150% of exercise price for the Warrants, decreasing as the warrants approach maturity. The fair value of the derivatives as of December 31, 2010 was estimated to be $292,240. For 2009, the primary assumptions included projected annual volatility of 145% and holder exercise targets at 135% of the conversion price for the convertible term note and 150% of exercise price for the Warrants, decreasing as the Warrants approach maturity. The fair value of the derivatives as of January1, 2009 upon implementation of EITF 07-05 was estimated by management to be $890,289. Amounts previously recorded to paid-in capital associated with these derivatives of $1,555,420 were reversed and the remaining $665,131 was recorded as a cumulative adjustment to accumulated deficit. The fair value of the derivatives as of December 31, 2009 was estimated to be $571,864. The foregoing assumptions are reviewed quarterly and subject to change based primarily on management’s assessment of the probability of the events described occurring. Accordingly, changes to these assessments could materially affect the valuation.
Financial Assets and Liabilities Measured at Fair Value on a Recurring Basis
Financial assets and liabilities measured at fair value on a recurring basis are summarized below and disclosed on the balance sheet under derivative liabilities:
|
Fair Value Measurement Using
|
||||||||||||||||||||||||
|
As of December 31, 2010
|
As of December 31, 2009
|
|||||||||||||||||||||||
|
Carrying Value
|
Level 3
|
Total
|
Carrying Value
|
Level 3
|
Total
|
|||||||||||||||||||
|
Warrant Liabilities
|
$ | 292,240 | $ | 292,240 | $ | 292,240 | $ | 571,864 | $ | 571,864 | $ | 571,864 | ||||||||||||
|
Total Derivative Liabilities
|
$ | 292,240 | $ | 292,240 | $ | 292,240 | $ | 571,864 | $ | 571,864 | $ | 571,864 | ||||||||||||
The table below provides a summary of the changes in fair value, including net transfers in and/or out, of all financial assets measured at fair value on a recurring basis using significant unobservable inputs (Level 3):
|
Fair Value Measurements Using Level 3 Inputs
|
||||||||||||||||
|
2010
|
2009
|
|||||||||||||||
|
Derivative Liabilities
|
Totals
|
Derivative Liabilities
|
Totals
|
|||||||||||||
|
Beginning Balance on January 1,
|
$ | 571,864 | $ | 571,864 | $ | 890,289 | $ | 890,289 | ||||||||
|
Total Gains or Losses (realized/unrealized) included in Net Income (Loss)
|
(279,624 | ) | (279,624 | ) | (318,425 | ) | (318,425 | ) | ||||||||
|
Purchases, Issuances and Settlements
|
— | — | — | — | ||||||||||||
|
Transfers in and/or out of Level 3
|
— | — | — | — | ||||||||||||
|
Ending Balance on December 31,
|
$ | 292,240 | $ | 292,240 | $ | 571,864 | $ | 571,864 | ||||||||
Note 12. Long Term Debt.
The following is a summary of long term debt for the years ending December 31:
|
2010
|
2009
|
|||||||
|
Various notes payable on vehicles and equipment, due in monthly installments of $5,132 including interest, maturing through 2014.
|
$ | 115,526 | $ | 217,470 | ||||
|
Less: Current Maturities
|
(45,464 | ) | (73,656 | ) | ||||
|
Total Long-Term Debt
|
$ | 70,062 | $ | 143,814 | ||||
|
Debt Maturity Schedule:
|
||||||||
|
Years Ending December 31,
|
||||||||
|
2011
|
$ | 45,464 | ||||||
|
2012
|
45,418 | |||||||
|
2013
|
21,443 | |||||||
|
2014
|
3,202 | |||||||
|
Total
|
$ | 115,526 | ||||||
LAPOLLA INDUSTRIES, INC.
NOTES TO FINANCIAL STATEMENTS
(Continued)
Note 13. Related Party Transactions.
(a) On February 1, 2010, the Company accepted the voluntary redemption of 100 shares of Series D Preferred Stock, par value $1.00, at the stated value of $1,000 per share, from Mr. Brown, a director, for $100,000 in cash.
(b) On February 18, 2010, the Company recorded the remaining grant-date fair value compensation cost of $18,800 to complete the private agreement whereby Mr. Kurtz agreed to transfer approximately 1,084,000 shares, in two installments, of his restricted common stock to Mr. Nadel in order to secure his continued participation required with his role as a Board member for a two year period entered into on February 19, 2008. The first installment of 500,000 shares was transferred to Mr. Nadel on February 19, 2008 and second installment of 584,000 shares was transferred to Mr. Nadel on February 18, 2009 by Mr. Kurtz. The installments vest one year after the date of each installment. The closing price of the Company’s common stock as traded on the OTCBB on the date of the agreement was $.70 per share. The grant-date fair value for this transaction is $758,800.
(c) On March 31, 2010, Mr. Kurtz, Chairman of the Board and majority stockholder, converted $19,000 of indebtedness owed by the Company to him, of which $18,800 represented a loan payable – related party and $200 represented related accrued interest, into 19 shares of Series D Preferred Stock, par value $1.00, at the stated value of $1,000 per share.
(d) On May 5, 2010, the Company and Douglas J. Kramer, CEO and President, entered into an amendment to that certain executive employment agreement dated May 5, 2008 and option agreement of even date, effective as of January 1, 2010, to: (i) acknowledge his prior agreed salary increase to $400,000, effective January 1, 2009; (ii) extend his employment term to December 31, 2013; (iii) change his transaction bonus upon a change in control to 8.5%; (iv) add an annual bonus based on meeting Board approved operating budget requirements; and (v) cancel his remaining 1,500,000 unvested stock options.
(e) Effective May 10, 2010, the Company entered into an executive employment agreement with Charles Zajaczkowski to serve as Chief Financial Officer and Corporate Treasurer, which provides: (i) employment term to December 31, 2012; (ii) annual base salary of $160,000; (iii) annual bonus based on meeting Board approved operating budget requirements; and (iv) change in control bonus equal to 50% of his annual base salary if such change-in-control occurs within 18 months from his effective date of employment, which was May 10, 2010, or 100% of his annual base salary if such change-in-control occurs after 18 months from his effective date of employment.
(f) On June 11, 2010, the Company and Michael T. Adams, CGO, EVP, and Secretary, entered into an amendment to that certain executive employment agreement dated May 18, 2009, effective as of January 1, 2010, to: (i) acknowledge his prior agreed salary increase from to $187,500, effective January 1, 2010, which shall be increased to $200,000, effective July 1, 2010, if the Company is at or above budget on June 30, 2010; and (ii) add an annual bonus based on meeting Board approved operating budget requirements. See also Item (l) below.
(g) On June 30, 2010, Mr. Kurtz, Chairman of the Board and majority stockholder, exchanged $1,406,670 of accrued Series D Preferred Stock dividends outstanding at December 31, 2009, into 1,407 shares of Series D Preferred Stock, par value $1.00, at the stated value of $1,000 per share.
(h) Effective July 1, 2010, the Board adopted a Director Share Based Compensation Program that provides: (i) each outside director will receive cash payments of $2,500 each quarter, payable at the end of each quarter; and (ii) each outside directors will receive a stock grant of 100,000 shares, except Mr. Nadel who will receive a stock grant of 500,000 shares. All stock grants will vest over a five-year period, with one fifth vesting at the end of each year beginning in 2010. However, if there is a change in the control of the Company, all stock grants, which have not vested, will vest immediately upon the change in control. The Company recorded $52,000 in share based compensation expense during 2010 under this plan.
(i) On November 16, 2010, the Chairman of the Board and principal stockholder of Lapolla exchanged $10,000,000, or 10,000 shares, of his Series D Preferred Stock, par value $1.00, with a Stated Value of $1,000 per share, accruing dividends at 10% per annum, payable quarterly in arrears, plus unpaid and accrued outstanding Series D Preferred Stock dividends of $388,304 as of said date, for restricted common stock at a price per share of $.53 per share (the closing price of the Company's shares on the OTC Bulletin Board was $.51 per share on the date of the transaction), or for 19,600,573 shares.
(j) During 2010, the Company paid an aggregate of $32,000 in cash to non-employee directors for director services rendered, of which Mr. Gregg, Mr. Nadel, Mr. Larson, and Mr. Nadel each received $8,000.
(k) During 2010, the Company paid an aggregate of $875,000 to Mr. Kurtz, Chairman of the Board, majority stockholder, and sole Series D Preferred Stock holder, for accrued Series D Preferred stock dividends.
(l) On May 18, 2009, the Company entered into a new executive employment and stock option agreement with Mr. Adams, CGO, EVP and Secretary, which provides: (i) employment term to December 31, 2011; (ii) annual base salary of $175,000; and (iii) transaction bonus equal to 1½%; (iv) 300,000 stock options; (v) exercise price of $.35 per share; (vi) good until December 31, 2015; and (vii) vests only upon a change in control.
(m) On November 20, 2009, the Company accepted the voluntary redemption of 50 shares of Series D Preferred Stock, par value $1.00, at the stated value of $1,000 per share, from Mr. Brown, a director, for $50,000 in cash.
(n) On November 20, 2009, the Company paid Mr. Kurtz, Chairman and majority stockholder, $500,000 in cash, of which $316,113 was for accrued interest on his Note Payable – Related Party and $183,887 was for accrued Series D Preferred Stock dividends.
(o) On December 4, 2009, the Company accepted the voluntary redemption of 50 shares of Series D Preferred Stock, par value $1.00, at the stated value of $1,000 per share, from Mr. Brown, a director, for $50,000 in cash.
(p) On December 31, 2009, Mr. Kurtz, Chairman of the Board and majority stockholder, converted $5,840,000 of indebtedness owed by the Company to him, of which $5,100,000 was for a Note Payable – Related Party and $740,000 was for a Loan Payable – Related Party, into 5,840 shares of Series D Preferred Stock, par value $1.00, at the stated value of $1,000 per share.
LAPOLLA INDUSTRIES, INC.
NOTES TO FINANCIAL STATEMENTS
(Continued)
Note 14. Deferred Income Taxes.
Deferred income taxes reflect the net tax effects of temporary differences between the carrying amounts of assets and liabilities, for financial reporting purposes, and amounts used for Federal income tax purposes. Significant components of the Company's continuing operations deferred tax asset at December 31:
|
Deferred Tax Assets:
|
2010
|
2009
|
||||||
|
Net Operating Loss Carry-Forward
|
$ | 61,926,290 | $ | 64,027,354 | ||||
|
Statutory Tax Rate
|
34 | % | 34 | % | ||||
|
Total Deferred Tax Assets
|
21,054,939 | 21,769,300 | ||||||
|
Valuation Allowance for Deferred Tax Assets
|
(21,054,939 | ) | (21,769,300 | ) | ||||
|
Net Deferred Taxes
|
$ | — | $ | — | ||||
At December 31, 2010, the Company had available, net operating loss carry-forwards of approximately $61,926,290 for Federal income tax purposes. Utilization by the Company is subject to limitations based on the Company's future income, and pursuant to Section 382 of the Internal Revenue Code, as amended, the usage of some of these net operating loss carry-forwards may be limited due to changes in ownership that have occurred or may occur in the future. The loss carry-forwards, if not used, will expire as follows: $5,319,718 in 2018, $1,067,538 in 2019, $4,557,566 in 2020, $7,870,612 in 2021, $10,869,699 in 2022, $9,811,811 in 2023, $4,244,336 in 2024, $3,607,642 in 2025, $2,744,261 in 2026, $4,994,863 in 2027, $4,014,317 in 2028, and $2,823,927 in 2029.
Note 15. Commitments and Contingencies.
Leases
The Company conducts operations in leased facilities located in Texas, New Jersey, Georgia, Florida, and Canada. The Texas and Canada leases include lease concessions which amounts are included as part of the aggregate minimum lease payments and recognized on a straight-line basis over the minimum lease terms. Future minimum lease payments required under the non-cancelable operating leases as and for the years ending December 31 are as follows: $336,155 for 2011; $399,224 for 2012; $316,394 for 2013; $329,256 for 2014; $283,405 for 2015; and $94,468 for 2016. Rent expense for the years ended December 31, 2010 and 2009 was $375,981 and $414,686, respectively.
Legal Proceedings
We are involved in various lawsuits and claims arising in the ordinary course of business. These other matters are, in our opinion, immaterial both individually and in the aggregate with respect to our financial position, liquidity or results of operations.
Note 16. Net Income (Loss) Per Common Share – Basic and Diluted.
Basic net income (loss) per share is computed by dividing net income (loss) available to common stockholders by the weighted average number of shares of common stock outstanding during the period. Diluted net income (loss) per share is computed by dividing net income (loss) available to common stockholders by the weighted average number of shares of common stock and common stock equivalents outstanding during the period.
Common stock equivalents were not considered in calculating diluted net loss per common share for the year ended December 31, 2009 as their effect would be anti-dilutive. Common stock equivalents were taken into consideration in calculating diluted net income per common share for the year ended December 31, 2010. The computation of the Company’s basic and diluted earnings per share for the year ended December 31, 2010 is as follows:
|
Net income available to common shareholders (A)
|
$ | 888,933 | ||
|
|
||||
|
Weighted average common shares outstanding (B)
|
66,649,323 | |||
|
Dilutive effect of employee equity incentive plans
|
481,891 | |||
|
Dilutive effect of warrants
|
25,486 | |||
|
Weighted average common shares outstanding, assuming dilution (C)
|
$ | 67,156,700 | ||
|
|
||||
|
Basic earnings per common share (A)/(B)
|
$ | 0.01 | ||
|
Diluted earnings per common share (A)/(C)
|
$ | 0.01 |
The above calculation excluded 1,526,008 of stock options and warrants from the calculation of diluted earnings per common share as the exercise prices of these stock options and warrants were greater than or equal to the market value of the common shares. Such options and warrants could be included in the calculation in the future if the market value of the Company’s common shares increases and is greater than the exercise price of these options and warrants.
LAPOLLA INDUSTRIES, INC.
NOTES TO FINANCIAL STATEMENTS
(Continued)
Note 17. Securities Transactions.
(a) During 2010, the Company accepted the voluntary redemption of an aggregate of 100 shares of Series D Preferred Stock, par value $1.00, at the stated value of $1,000 per share, from a director, for an aggregate of $100,000 in cash. See also Note 13 - Related Party Transactions, Item (a).
(b) During 2010, the Company issued an aggregate of 1,426 shares of Series D Preferred Stock, par value $1.00 per share, to a director in exchange for cancellation of $18,800 in loans payable - related party, $200 in accrued interest, and $1,406,670 in accrued preferred stock dividends, at $1,000 stated value per share. See also Note 13 - Related Party Transactions, Items (b), (c), and (g).
(c) During 2010, the Company issued an aggregate of 19,600,573 shares of restricted common stock, par value $.01 per share, to a director in exchange for $10,000,000 of Series D Preferred Stock and cancellation of $388,304 of accrued preferred stock dividends. See also Note 13 - Related Party Transactions, Item (i).
(d) During 2010, the Company issued an aggregate of 160,000 shares of restricted common stock to non-employee directors pursuant to a Director Share Based Compensation Program. See also Note 13 - Related Party Transactions, Item (h).
(e) During 2009, the Company issued an aggregate of 5,840 shares of Series D Preferred Stock, par value $1.00 per share, to a director in exchange for cancellation of a $5,100,000 note payable - related party and $740,000 in loans payable - related party. See also Note 13 - Related Party Transactions, Item (p).
(f) During 2009, the Company accepted the voluntary redemption of an aggregate of 100 shares of Series D Preferred Stock, par value $1.00, at the stated value of $1,000 per share, from a director, for $100,000 in cash. See also Note 13 - Related Party Transactions, Items (m) and (o).
Note 18. Share–Based Payment Arrangements.
The Company reports share-based compensation arrangements under GAAP using a lattice-based option valuation model to calculate compensation expense over the requisite service period of grants. At December 31, 2010, the Company had two share-based compensation plans, the Equity Incentive Plan (“Equity Plan”) and Director Restricted Stock Plan ("Director Plan"), in effect, and warrants issued during 2007 and 2008 outstanding. Compensation cost charged against income for all compensation and incentive plans for 2010 and 2009 was $100,831 and $538,836, respectively.
Equity Incentive Plan
The Company’s Equity Plan, which is shareholder-approved, permits the grant of stock awards to eligible participants for up to 10,000,000 shares of common stock. The purpose of the Equity Plan is to advance the interests of the Company and its stockholders by providing an incentive to attract, retain and reward employees, directors and consultants performing services for the Company and by motivating such persons to contribute to the growth and profitability of the Company. The Equity Plan provides financial performance measures upon which specific performance goals would be based and limits on the numbers of shares or compensation that could be made. Option awards are generally granted with an exercise price equal to the market price of the Company’s stock at the date of grant. Stock awards may provide for accelerated vesting if there is a change in control. The fair value of each stock options is estimated on the date of grant using a lattice-based valuation model that uses the assumptions noted in the following table. Because lattice-based valuation models incorporate ranges of assumptions for inputs, those ranges are disclosed. Expected volatilities are based on the historical volatility of the Company’s common stock. The Company uses historical data to estimate option exercise and employee termination within the valuation model. The expected term of options granted is derived from the output of the valuation model and represents the periods that options granted are expected to be outstanding; the range given below results from certain groups of employees exhibiting different behavior. The risk-free rate for periods within the contractual life of the option is based on the U.S. Treasury yield curve in effect at the time of grant.
|
|
2010
|
2009
|
||||||
|
Expected Volatility
|
155.09 | % | 252.64 | % | ||||
|
Weighted-Average Volatility
|
155.09 | % | 252.64 | % | ||||
|
Expected Dividends
|
— | — | ||||||
|
Expected Term (in years)
|
4.77 | 2.7 | ||||||
|
Risk Free Rate
|
2.14 | % | 2.45 | % | ||||
As of December 31, 2010, total compensation cost related to non-vested stock options was $2,159,258, which is expected to be recognized over the 2.46 years after December 31, 2010 (29.6 months on a weighted-average basis).
Stock option activity under the Company’s Equity Plan as of the years ended December 31, is summarized below:
|
2010
|
2009
|
|||||||||||||||
|
Options
|
Number
of Options
|
Weighted-Average
Exercise Price
|
Number
of options
|
Weighted-Average
Exercise Price
|
||||||||||||
|
Outstanding-Beginning of Year
|
7,015,333 | $ | 0.64 | 7,290,333 | $ | 0.66 | ||||||||||
|
Granted
|
800,000 | 0.60 | 320,000 | 0.35 | ||||||||||||
|
Exercised
|
— | — | — | — | ||||||||||||
|
Canceled, Expired or Forfeited
|
(1,675,000 | ) | 0.74 | (595,000 | ) | 0.67 | ||||||||||
|
Outstanding-End of Year
|
6,140,333 | 0.61 | 7,015,333 | 0.64 | ||||||||||||
|
Exercisable-End of Year
|
1,770,208 | $ | 0.57 | 1,591,973 | $ | 0.57 | ||||||||||
The weighted-average grant-date fair value of options granted during 2010 and 2009 was $.60 and $.35, respectively. There were 3,859,667 options available for grant at December 31, 2010. Refer to Equity Plan and Warrants Summary below for range of exercise prices.
LAPOLLA INDUSTRIES, INC.
NOTES TO FINANCIAL STATEMENTS
(Continued)
Note 18. Share–Based Payment Arrangements - continued.
Warrants
The Company did not issue any warrants during 2010 and 2009. During 2007 and 2008, the Company issued an aggregate of 2,500,000 detachable warrants in connection with its mezzanine styled credit instruments, which have been modified and repriced from time to time based on embedded anti-dilution down round price protections. See Note 9 - Derivatives and Fair Value for more information. Warrant activity as of the year ended December 31, is summarized below:
|
2010
|
2009
|
|||||||||||||||
|
Options
|
Number
of Warrants
|
Weighted-Average
Exercise Price
|
Number
of Warrants
|
Weighted-Average
Exercise Price
|
||||||||||||
|
Outstanding-Beginning of Year
|
2,500,000 | $ | 0.67 | 2,500,000 | $ | 0.67 | ||||||||||
|
Granted
|
— | — | — | — | ||||||||||||
|
Exercised
|
— | — | — | — | ||||||||||||
|
Canceled, Expired or Forfeited
|
— | — | — | — | ||||||||||||
|
Outstanding-End of Year
|
2,500,000 | $ | 0.65 | 2,500,000 | $ | 0.67 | ||||||||||
|
Exercisable-End of Year
|
2,500,000 | $ | 0.65 | 2,500,000 | $ | 0.67 | ||||||||||
Equity Plan and Warrants Summary
The following table summarizes stock options and warrants outstanding at:
|
Outstanding
|
Exercisable
|
Outstanding
|
Exercisable
|
|||||||||||||||||||||||||||||||||||||||
|
Range of
Exercise
Prices
|
Number
Outstanding
at 12/31/10
|
Weighted
Average
Remaining
Contractual
Life (Years)
|
Weighted
Average
Exercise
Price
|
Number
Exercisable
at 12/31/10
|
Weighted
Average
Exercise
Price
|
Number
Outstanding
at 12/31/09
|
Weighted
Average
Remaining
Contractual
Life (Years)
|
Weighted
Average
Exercise
Price
|
Number
Exercisable
at 12/31/09
|
Weighted
Average
Exercise
Price
|
||||||||||||||||||||||||||||||||
| $ | .36 - $.59 | 2,350,000 | 2.48 | $ | .51 | 2,050,000 | $ | .53 | 850,000 | 3.48 | $ | .36 | 429,166 | $ | .36 | |||||||||||||||||||||||||||
| $ | .60 - $.64 | 2,327,000 | 1.37 | $ | .60 | 711,200 | $ | .41 | 3,027,000 | 2.15 | $ | .60 | 1,986,974 | $ | .60 | |||||||||||||||||||||||||||
| $ | .65 - $.80 | 3,963,333 | 1.95 | $ | .70 | 1,509,008 | $ | .72 | 5,638,333 | 2.95 | $ | .74 | 1,675,833 | $ | .68 | |||||||||||||||||||||||||||
Director Plan
The Company’s Board of Directors adopted a Director Plan, which is not shareholder-approved, that permits the grant of up to 800,000 shares of restricted common stock to non-employee directors only in 2010. Effective July 1, 2010, the Board granted 800,000 shares of restricted common stock to four non-employee directors, of which 100,000 was granted to Mr. Gregg, Mr. Brown, and Mr. Larson, and 500,000 was granted to Mr. Nadel. All stock grants vest over a 5 period, with one-fifth vesting at the end of each year beginning in 2010, for serving on the Board of Directors. The Company does not consider the shares of restricted common stock granted under the Director Plan as outstanding at the time of grant due to vesting restrictions. The shares of restricted common stock when granted are held in reserve by the Company until such time that they are earned and vested, after which the Company issues the vested portion of the shares and delivers them to the respective directors. At December 31, 2010, there were 640,000 shares of restricted common stock granted and unvested (160,000 shares were earned and vested and delivered to directors). The compensation cost charged against income for the Director Plan in 2010 was $52,000. The fair value of each award was calculated by taking the closing price of the Company's common stock as trade on the OTCBB on the effective date of the grant which was $.65 per share, or an aggregate amount of $520,000. The Company is using the straight-line method for attribution of compensation expense. The expected term of the awards is the last day on which the last increment of stock options are scheduled to vest, or December 31, 2015. A summary of awards activity under the Director Plan at December 31, 2010, and changes during the year then ended, are as follows:
|
Nonvested Awards
|
Shares
|
Weighted-Average
|
||||||
|
Grant-Date Fair Value
|
||||||||
|
Nonvested at time of adoption of Director Plan
|
— | $ | — | |||||
|
Granted
|
800,000 | 520,000 | ||||||
|
Vested
|
(160,000 | ) | (104,000 | ) | ||||
|
Forfeited, Canceled or Expired
|
— | — | ||||||
|
Nonvested at December 31, 2010
|
640,000 | $ | 416,000 | |||||
As of December 31, 2010, there was $416,000 of total unrecognized compensation cost related to nonvested share-based compensation arrangements granted under the Director Plan. The cost is expected to be recognized over a weighted-average period of 4 years.
Related Party Director Plan
During 2010, the Company recorded the remaining grant-date fair value compensation cost to complete the agreement whereby Mr. Kurtz agreed to transfer approximately 1,084,000 shares, in two installments, of his restricted common stock to Mr. Nadel in order to secure his continued participation required with his role as a Board member for a two year period entered into on February 19, 2008. The first installment of 500,000 shares was transferred to Mr. Nadel on February 19, 2008 and second installment of 584,000 shares was transferred to Mr. Nadel on February 18, 2009 by Mr. Kurtz. The installments vest one year after the date of each installment. The closing price of the Company’s common stock as traded on the OTCBB on the date of the private agreement was $.70 per share. The grant-date fair value calculated by adding the number of shares transferred times the closing price of the common stock on the date of grant is $758,800. The Compensation cost charged against income for this Related Party Director Plan was $18,800, $260,000, and $480,000 for 2010, 2009, and 2008, respectively.
LAPOLLA INDUSTRIES, INC.
NOTES TO FINANCIAL STATEMENTS
(Continued)
Note 19. Preferred Stock.
Series D Preferred Stock
The Board designated a new series of preferred stock, Series D Preferred Stock (“Series D Preferred”), effective September 28, 2006, $1.00 par value per share. The Board authorized 25,000 shares for issuance having a stated and liquidation value, per each share of Series D Preferred of $1,000, which includes the par of $1.00 per share. Holders of the outstanding Series D Preferred have no voting rights, except as required by law, including but not limited to the General Corporation Law of Delaware, and as expressly provided in the certificate of designation. The registered holders of the outstanding Series D Preferred are entitled to receive cumulative dividends at the rate of 10% per annum of the stated value per each share of Series D Preferred, payable quarterly in arrears on the last day of each fiscal quarter of each year; such dividends shall accrue from day-to-day, whether or not earned or declared and may be accumulated or paid in the discretion of the Board on each share of Series D Preferred from date of issuance; and may be paid in cash when and as declared by the Board out of funds legally available. At December 31, 2010 and 2009, an aggregate of 5,242 and 13,916 shares of Series D Preferred were outstanding with an aggregate consideration of $5,242,000 and $13,916,000, respectively. There were $64,827 and $1,406,670 dividends accrued and $875,000 and $207,969 paid at December 31, 2010 and 2009, respectfully.
Note 20. Business Segment Information.
The Company is a leading manufacturer and supplier operating two segments: Foam and Coatings. The Company’s segments are organized based on manufacturing competencies. The Foam segment primarily supplies both roofing and building envelope insulation applications. Roofing applications consist of foam and coatings systems in new and retrofit commercial and industrial applications. Insulation is used in commercial and industrial, as well as residential, applications. We manufacture our own roofing and wall insulation foams. Additionally, this segment also supplies polyurethane as an adhesive for board stock insulation to roofing substrates for commercial and industrial applications, sundry items, and application equipment.
The Coatings segment primarily supplies a variety of protective coatings for roofing systems for new and retrofit commercial and industrial applications, as well as residential, applications. Additionally, this segment also supplies caulking for general application in the construction industry, and sundry items. We manufacture our own roof coatings. After our acquisition of AirTight’s assets in July 2008, we began making and selling our own spray rigs, which are required for the application of our foam and large scale coating jobs. This is a basic assembly operation and we undertake this task to provide turn key service to our customers. Prior to the acquisition of AirTight’s assets, we were just a distributor of spray rigs. We allocate these amounts to either our foam or coatings segments, as applicable. The Company maintains centralized manufacturing operations in Houston, Texas for its Foam and Coatings, and Rutledge, Georgia for its spray rigs. Each of the businesses in which the Company is engaged is highly competitive. However, diversification of products within these segments and national, including limited international, markets served tends to minimize the impact on the Company’s total sales and earnings of changes in demand for a particular product. The accounting policies of the segments are the same as those described in the summary of significant accounting policies. The Company allocates resources to segments and evaluates the performance of segments based upon reported segment income before income taxes. A substantial amount of administrative expenses are allocated to the segments. The portion not allocated to the segments represents the unallocated cost of certain corporate expenses and are included in Unallocated Amounts. There are no intersegment sales or transfers. The following are selected results of reportable segments:
|
Segments
|
||||||||||||
|
2010
|
Foam
|
Coatings
|
Totals
|
|||||||||
|
Sales
|
$ | 61,597,220 | $ | 8,899,409 | $ | 70,496,629 | ||||||
|
Depreciation
|
244,892 | 35,446 | 280,338 | |||||||||
|
Amortization of Other Intangible Assets
|
304,208 | 43,419 | 347,625 | |||||||||
|
Interest Expense
|
663,996 | 94,050 | 758,046 | |||||||||
|
Segment Profit
|
4,995,806 | 678,482 | 5,674,289 | |||||||||
|
Segment Assets (1)
|
22,586,509 | 3,318,402 | 25,904,911 | |||||||||
|
Expenditures for Segment Assets
|
$ | 295,240 | $ | 41,356 | $ | 336,596 | ||||||
|
2009
|
Foam
|
Coatings
|
Totals
|
|||||||||
|
Sales
|
$ | 43,080,741 | $ | 6,945,729 | $ | 50,026,470 | ||||||
|
Depreciation
|
218,677 | 36,852 | 255,529 | |||||||||
|
Amortization of Other Intangible Assets
|
282,318 | 46,297 | 328,615 | |||||||||
|
Interest Expense
|
1,006,645 | 166,221 | 1,172,866 | |||||||||
|
Segment Profit (Loss)
|
1,250,640 | (142,508 | ) | 1,108,132 | ||||||||
|
Segment Assets (1)
|
18,365,883 | 3,538,578 | 21,904,461 | |||||||||
|
Expenditures for Segment Assets
|
$ | 121,278 | $ | 26,582 | $ | 147,860 | ||||||
The following are reconciliations of reportable segment profit or loss, and assets, to the Company’s totals for the years indicated:
|
Segments Profit
|
||||||||
|
2010
|
2009
|
|||||||
|
Total Profit for Reportable Segments
|
$ | 5,674,289 | $ | 1,108,132 | ||||
|
Unallocated Amounts:
|
||||||||
|
Corporate Expenses
|
(3,573,225 | ) | (3,932,059 | ) | ||||
|
Income (Loss) Before Income Taxes
|
$ | 2,101,064 | $ | (2,823,927 | ) | |||
|
Assets
|
2010 | 2009 | ||||||
|
Total Assets for Reportable Segments (1)
|
$ | 25,877,943 | $ | 21,904,461 | ||||
|
Other Unallocated Amounts (2)
|
630,047 | 880,866 | ||||||
|
Total
|
$ | 26,507,990 | $ | 22,785,327 | ||||
Notes:
(1) Segment assets are the total assets used in the operation of each segment.
(2) Includes corporate assets which are principally cash and prepaid expenses.
LAPOLLA INDUSTRIES, INC.
NOTES TO FINANCIAL STATEMENTS
(Continued)
Note 23. Subsequent Events.
(a) On February 22, 2011, an agreement was entered into between the Company and Mr. Nadel, a member of the Board, wherein Mr. Nadel became a consultant to, as well as Vice Chairman of, the Company ("Nadel Agreement"), for a period of 3 years. In addition to any other compensation Mr. Nadel is currently receiving from the Company, Mr. Nadel is to receive an aggregate of 5,000,000 shares of restricted common stock (the "Shares"), which vest in monthly increments over a 3 years, and $200,000 in consulting fees per year. Mr. Nadel is to perform such consulting and advisory services, within Nadel’s area of expertise, as may be requested by Mr. Kurtz, Chairman or the Company, in consultation with the Chairman and Mr. Kramer, President and CEO. Such services include business development and planning, assisting management on strategic initiatives and other items as requested by the Chairman or the Company in consultation with the Chairman.
(b) On February 22, 2011, the Company exchanged an aggregate of 1,653 shares of its Series D Preferred Stock, par value $1.00, with a stated value of $1,000 per share, accruing dividends at 10% per annum, to reimburse the Chairman for the aggregate value of the 2,900,000 shares of restricted common stock he provided to meet the number of Shares (described above and defined in the Agreement) requirement in the Nadel Agreement of $1,653,000 (calculated by taking the 2,900,000 shares of common stock times the closing price of the Company's common stock as traded on the OTCBB of $.57 per share on February 22, 2011).
F-19