Attached files
| file | filename |
|---|---|
| 8-K - UIL FORM 8-K DATED APRIL 6, 2011 - UIL HOLDINGS CORP | uil_form8kdated04062011.htm |
April 2011
April 2011 Marketing
Exhibit 99
April 2011
2
Important Note to Investors
James P. Torgerson
President and Chief Executive Officer
Susan E. Allen
Vice President Investor Relations
Safe Harbor Provision
Certain statements contained herein, regarding matters that are not historical facts, are forward-looking statements (as defined in the
Private Securities Litigation Reform Act of 1995). These include statements regarding management’s intentions, plans, beliefs,
expectations or forecasts for the future. Such forward-looking statements are based on UIL Holdings’ expectations and involve risks and
uncertainties; consequently, actual results may differ materially from those expressed or implied in the statements. Such risks and
uncertainties include, but are not limited to, general economic conditions, legislative and regulatory changes, changes in demand for
electricity, gas and other products and services, unanticipated weather conditions, changes in accounting principles, policies or guidelines,
and other economic, competitive, governmental, and technological factors affecting the operations, markets, products and services of UIL
Holdings’ subsidiaries, The United Illuminating Company, The Southern Connecticut Gas Company, Connecticut Natural Gas
Corporation and The Berkshire Gas Company. Such risks and uncertainties with respect to UIL Holdings’ recent acquisition of The
Southern Connecticut Gas Company, Connecticut Natural Gas Corporation and The Berkshire Gas Company include, but are not limited
to, the possibility that the expected benefits will not be realized, or will not be realized within the expected time period. The foregoing and
other factors are discussed and should be reviewed in UIL Holdings’ most recent Annual Report on Form 10-K and other subsequent
periodic filings with the Securities and Exchange Commission. Forward-looking statements included herein speak only as of the date hereof
and UIL Holdings undertakes no obligation to revise or update such statements to reflect events or circumstances after the date hereof or to
reflect the occurrence of unanticipated events or circumstances.
April 2011
3
3
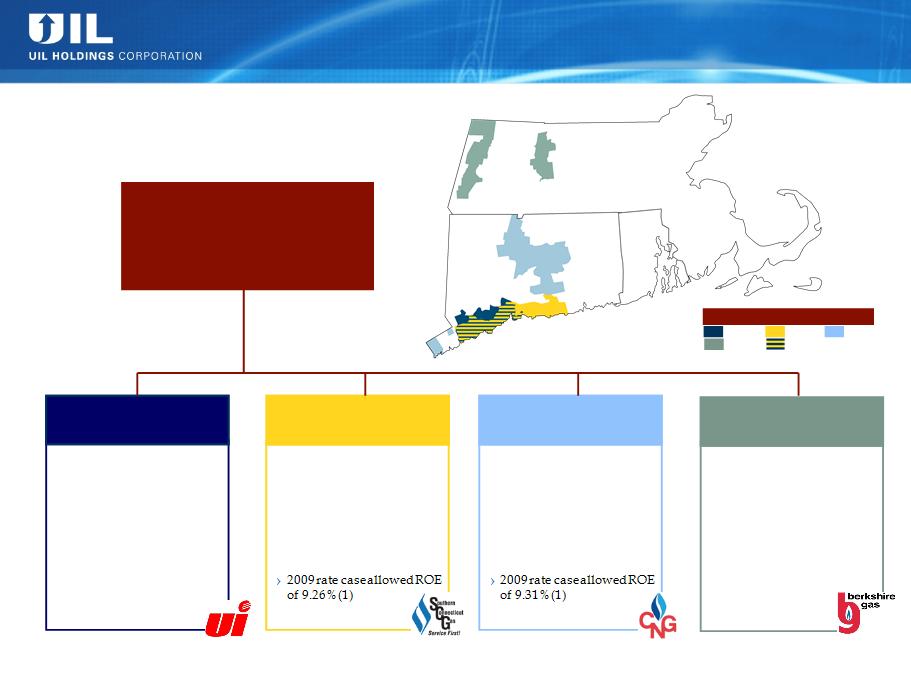
UIL - Corporate Structure, Service Areas
› Service territory: 335 sq
miles
miles
› ~325,000 customers
› 1,095 employees
› Allowed Distribution ROE
of 8.75%
of 8.75%
› Earned ’10 Transmission
ROE (composite) of 12.5%
ROE (composite) of 12.5%
› 50% interest in GenConn
Energy LLC
Energy LLC
The United Illuminating
Company (UI)
Company (UI)
Note: (1) Includes 10 basis point penalty reduction. Previously authorized 10.0% & 10.1% at SCG & CNG respectively, in effect pending approval of settlement agreement.
UIL Holdings
Corporation
Corporation
Service Area Key
SCG
CNG
UI
Berkshire
Overlapping Territory
› Service territory: 716 sq
miles - Greater Hartford-
New Britain & Greenwich
miles - Greater Hartford-
New Britain & Greenwich
› ~160,000 customers
› 319 employees
› 2,011 miles of mains with
~124,000 services
~124,000 services
Connecticut Natural Gas
(CNG)
(CNG)
› Service territory: 738 sq
miles in Western MA
including Pittsfield and
North Adams
miles in Western MA
including Pittsfield and
North Adams
› ~36,000 customers
› 120 employees
› 738 miles of mains
› Allowed ROE of 10.50%
Berkshire Gas Company
(Berkshire)
(Berkshire)
› Service territory: 512 sq
miles from Westport, CT to
Old Saybrook, CT
miles from Westport, CT to
Old Saybrook, CT
› ~178,000 customers
› 290 employees
› 2,269 miles of mains with
~131,000 services
~131,000 services
Southern Connecticut Gas
(SCG)
(SCG)

April 2011
4
Investment Highlights
Attractive Dividend
(5.7% Yield)(2)
› Current annual dividend of $1.728 per share
› Core regulated earnings combined with the enhanced cash flow and expected earnings per
share accretion from the acquisition provide continued support for UIL’s dividend
share accretion from the acquisition provide continued support for UIL’s dividend
Visible Regulated
Growth
Opportunities
Growth
Opportunities
› Approximately $2.1B of regulated electric capital investment in The United Illuminating
Company (UI) 10-year plan(1)
Company (UI) 10-year plan(1)
» Includes $0.6B of highly attractive transmission projects
Strong Balance Sheet
› Maintenance of investment grade credit ratings is an important objective
› Expect no need for external equity for at least the next 3 years
FERC-Regulated
Electric
Transmission
Electric
Transmission
› 2010 earned composite return on equity of 12.5%
› Proven ability to partner reaching beyond service territory
› New England renewable portfolio standards driving need for major transmission build
Attractive Regulated
Electric and Gas
Utility
Electric and Gas
Utility
› Proven ability to earn allowed electric returns
› Highly experienced with Connecticut regulatory proceedings
› Constructive long-term rate plan for Berkshire in Massachusetts
Notes: (1) As of ’10 EEI Financial conference. The updated annual long-term capital spending update will be presented at the Fall ‘11 EEI Financial conference.
(2) As of 3/31/11.
April 2011
5
2010 Accomplishments/Milestones
ü 13% increase in 2010 net income, excluding acquisition & transition related
activities, compared to 2009
activities, compared to 2009
ü Transformative gas companies acquisition completed within six months of
announcement
announcement
ü GenConn Devon became operational
ü GenConn Middletown - 97.5% complete as 3/31/11
ü Investing in Connecticut portion of New England East West Solution projects
ü Executing on 10-year capital expenditure plan - driving long-term earnings
growth
growth
April 2011
6
Gas Company Integration
Closed on acquisition of Southern Connecticut Gas, Connecticut Natural
Gas and Berkshire Gas Company on November 16, 2010
Gas and Berkshire Gas Company on November 16, 2010
Working diligently internalizing the Transition Services Agreement (TSA)
› Support services such as IT, Finance and Human Resources provided by
Iberdrola, USA (IUSA) with the ability to terminate any service given 90 days
notice
Iberdrola, USA (IUSA) with the ability to terminate any service given 90 days
notice
Integration activities are well underway
› Implementation of these initiatives is expected to continue through this year with
most completed before 2012
most completed before 2012
2012 savings opportunities - identified & quantified
› IUSA 2009 allocated corporate overheads, support costs and shared services
totaled $23M
totaled $23M
» $11.6M of expected savings to be in place in 2012
UIL Becomes A Stronger, More Diverse Energy Company

April 2011
7
2012 Shared Services Identified Savings
Expected $11.6M of Identified Savings
net
April 2011
8
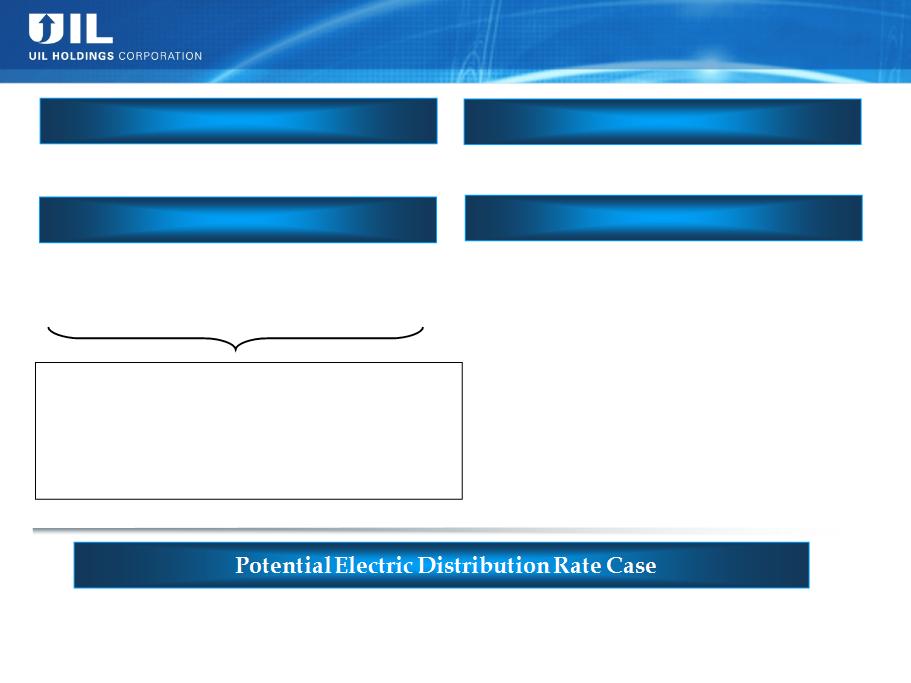
› No current DPUC schedule
› Continued until final decision on pilot to be
made as part of UI’s ’10 rate year decoupling
filing
made as part of UI’s ’10 rate year decoupling
filing
› Approximately $1.3M owed to customers for
the 2010 rate year
the 2010 rate year
Regulatory Update
› DPUC docket opened 12/28/10
› Pending at the CT Supreme Court
› Previous allowed returns in effect pending
appeals - SCG 10%, CNG 10.1%
appeals - SCG 10%, CNG 10.1%
|
|
|
|
|
|
SCG Potential Overearnings
Generic ROE Proceeding
UI Electric Decoupling
SCG/CNG Rate Case Appeals
› Potential for UI to file distribution rate case for rates in effect in 2012 to reflect
significant investments in distribution infrastructure
significant investments in distribution infrastructure
On 3/24/11, SCG, CNG & the Office of Consumer Counsel
filed a motion with the DPUC to reopen SCG & CNG rate
cases for the purposes of reviewing and approving a
settlement agreement. If approved, the settlement would,
among other things;
filed a motion with the DPUC to reopen SCG & CNG rate
cases for the purposes of reviewing and approving a
settlement agreement. If approved, the settlement would,
among other things;
› resolve all pending issues - SCG & CNG rate cases
› terminate SCG potential overearnings investigation
April 2011
9
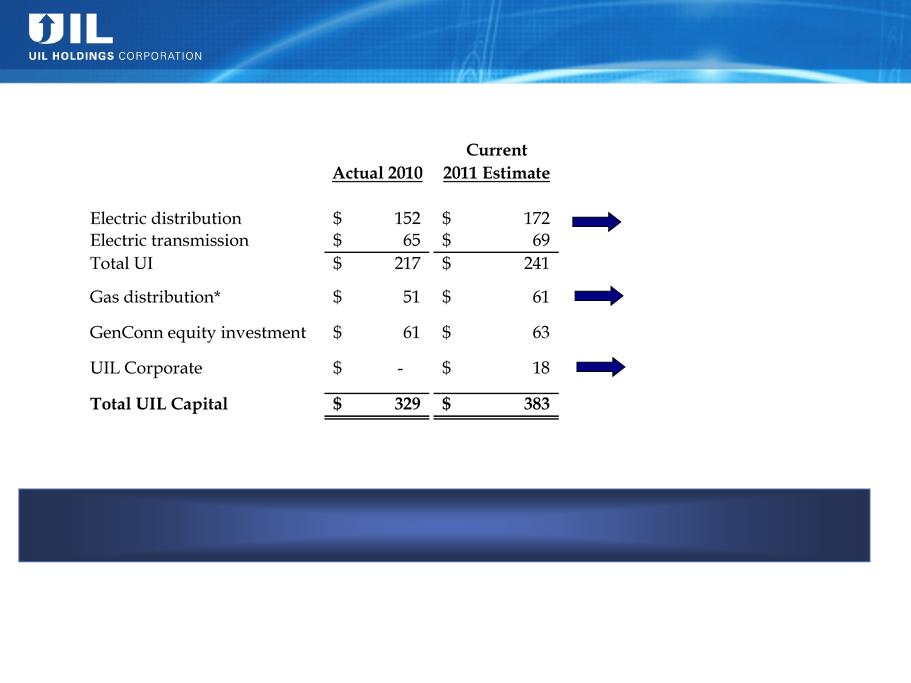
2011 Capex Update
($ millions)
The annual long-term capital spending update will be presented at the Fall EEI
Financial conference
Financial conference
Central Facility
New business main & services,
system improvements, fleet, IT
system improvements, fleet, IT
Capital costs relating to the
integration of the gas companies,
mainly IT-related
integration of the gas companies,
mainly IT-related
Major Variance Explanations
* 2010 Gas distribution CapEx reflects the full year amount; UIL ownership was for 6 weeks effective with the closing on the acquisition.
Amounts may not add due to rounding.
April 2011
10
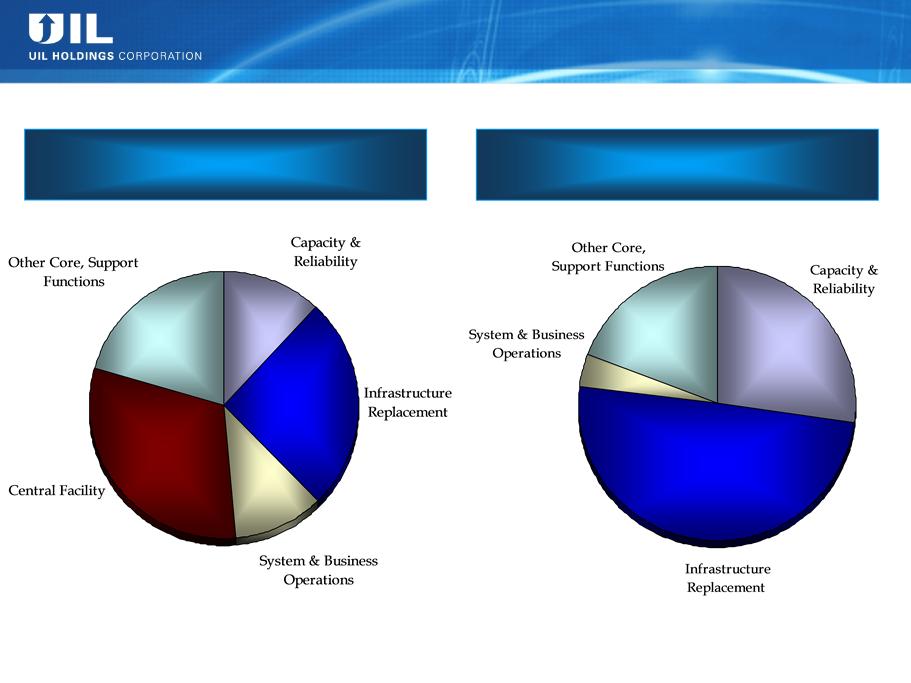
2011 Electric Distribution & Transmission Capex Detail
Electric transmission investments
Electric distribution investments
31%
12%
26%
11%
50%
19%
27%
4%
20%
April 2011
11
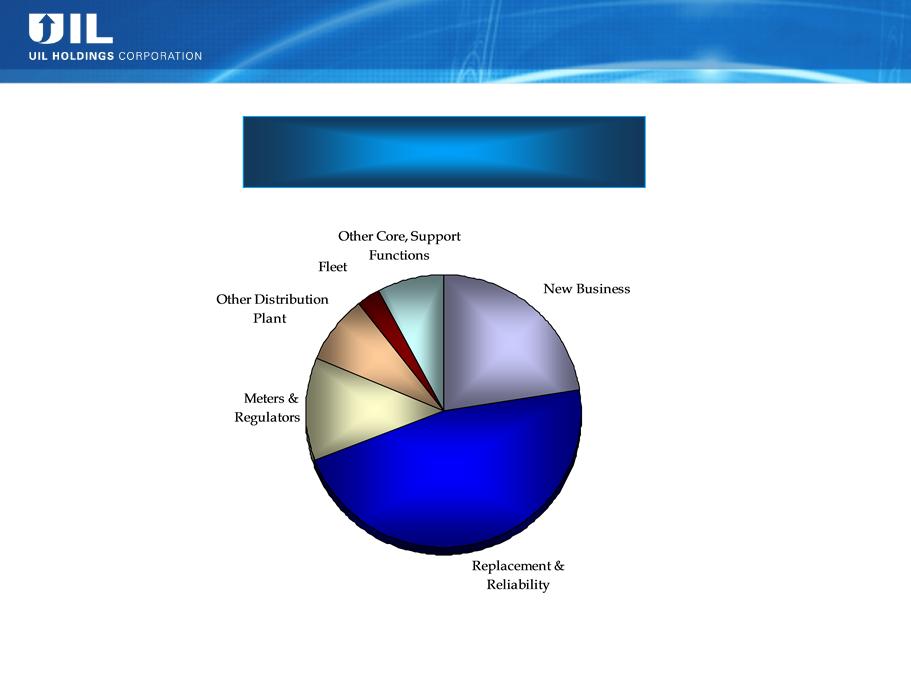
2011 Gas Distribution Capex Detail
Gas distribution investments
47%
22%
12%
8%
8%
3%
April 2011
12
Examples of Current Distribution Projects
Central Facility - UI Office &
Operations Building
Operations Building
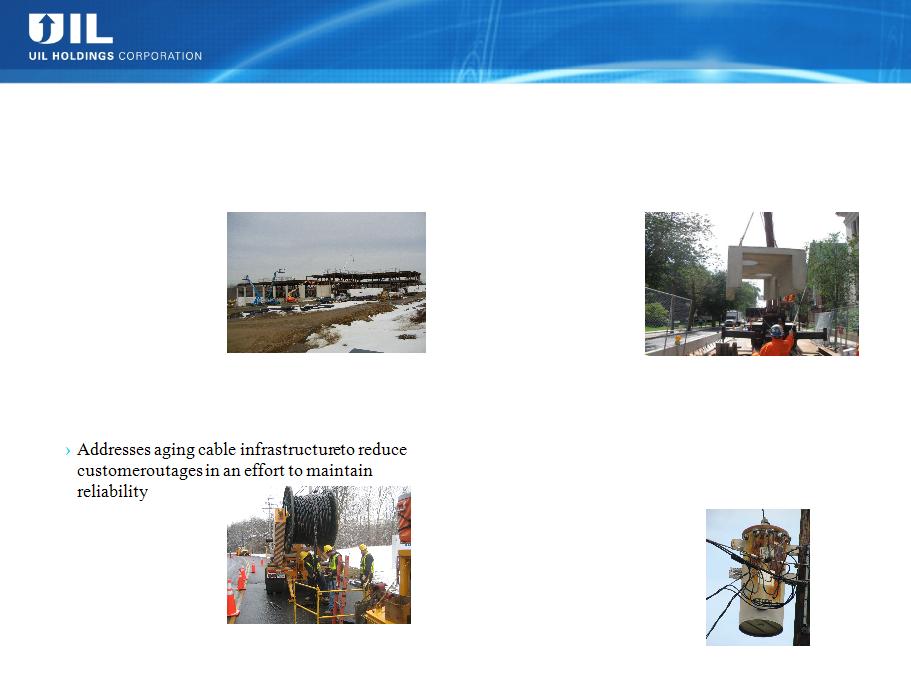
Splice Chamber Remediation
Paper Insulated Lead Cable (PILC)
Replacement
Replacement
Distribution Transformer Replacement
Program
Program
› Consolidate all UI “Work Centers” onto a single
site referred to as the Central Facility
site referred to as the Central Facility
› Under construction
› Planned in-service
2012
2012
~ $115M*
› Rebuild deteriorated underground splicing chambers
› Under construction
› Annual program
over 10 years
over 10 years
~ $7M per year
› Under construction
› Annual program
over 10 years
over 10 years
~ $3M per year
› Infrastructure program to replace transformers due
to poor physical condition, inadequate capacity,
and/or contain unacceptable levels of PCB's
to poor physical condition, inadequate capacity,
and/or contain unacceptable levels of PCB's
› Under construction
› Annual program over
10 years
10 years
~ $7M per year
* Dollars shown are rounded/approximate expected total project CapEx (generally including both spend to date and future expected spend).
April 2011
13
Near-term Electric Transmission Reliability Upgrades
Grand Avenue 115 kV Switching
Station Rebuild
Station Rebuild
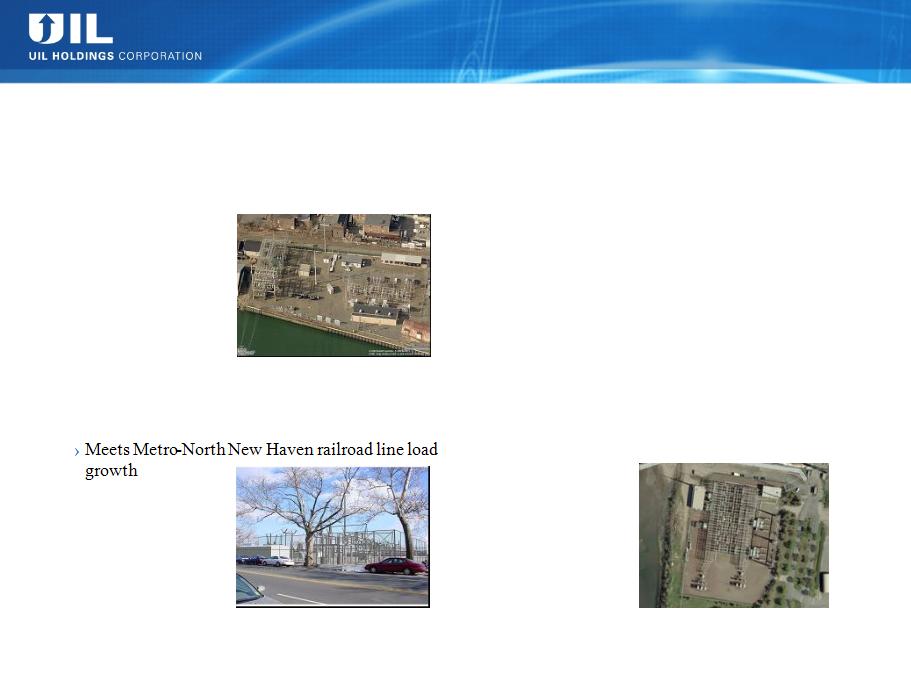
New Shelton 115/ 13.8 kV
Substation
Substation
New Union Avenue 115/ 26.4 kV
Substation
Substation
East Shore 115 kV Substation Upgrades
› Addresses short circuit capability issues and
aged/obsolete infrastructure
aged/obsolete infrastructure
› Under construction
› Planned in-service
2012
2012
~ $60M*
› Meets Greater Shelton area load growth
› In Planning
› Planned in-service
2015
2015
~ $20M*
› In engineering
› Planned in-service
2012
2012
~ $15M*
› Addresses infrastructure condition, maintenance
short circuit capability concerns
short circuit capability concerns
› Phased upgrades,
in engineering and
construction
in engineering and
construction
› Planned in-service
2011-2013
2011-2013
~ $25M*
* Dollars shown are rounded/approximate expected total project CapEx (generally including both spend to date and future expected spend); excluding AFUDC.
April 2011
14
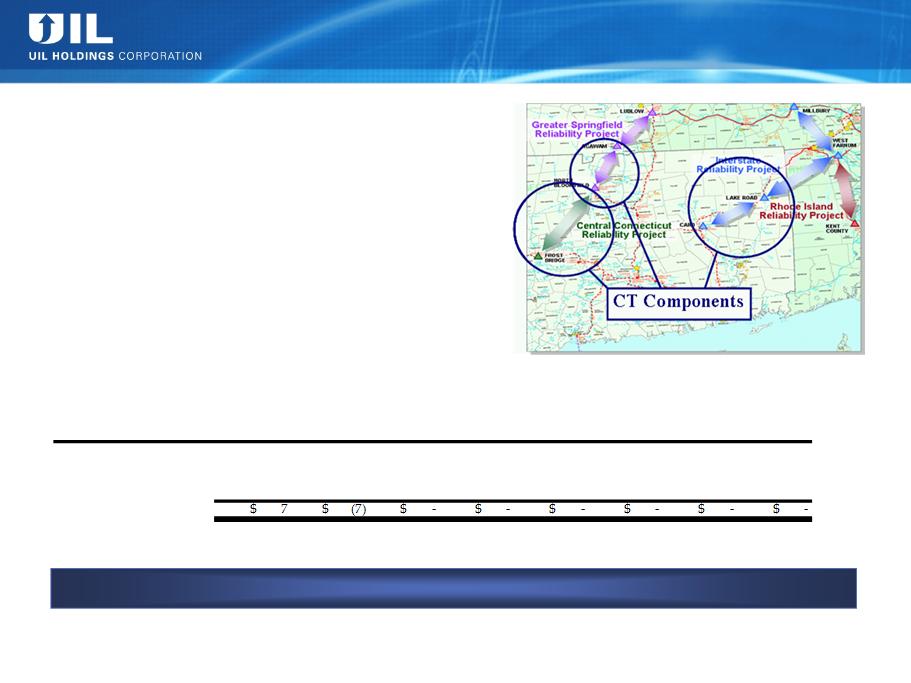
UI Transmission - NEEWS Investment
UI Participation in CL&P Project:
› UI’s portion of investment: greater of
$60M or 8.4% of CL&P’s costs for the
CT portions …
$60M or 8.4% of CL&P’s costs for the
CT portions …
› 8.4% currently estimated at
approximately $69M (increased from
original estimate of $60M)
approximately $69M (increased from
original estimate of $60M)
› First deposit made in December 2010
UI’s anticipated investment increased from $60M to $69M
Refreshed UI Investment Amounts and Timeline:
($ millions)
Potential UI Investment*
2010A
2011P
2012P
2013P
2014P
2015P
2016P
Total
Current Projection
7
$
3
$
9
$
8
$
12
$
23
$
7
$
69
$
Previous Projection
-
$
10
$
9
$
8
$
12
$
23
$
7
$
69
$
Difference
* Based on NU's latest projection of UI's Investment in CL&P's portion of the NEEWS Projects.
April 2011
15
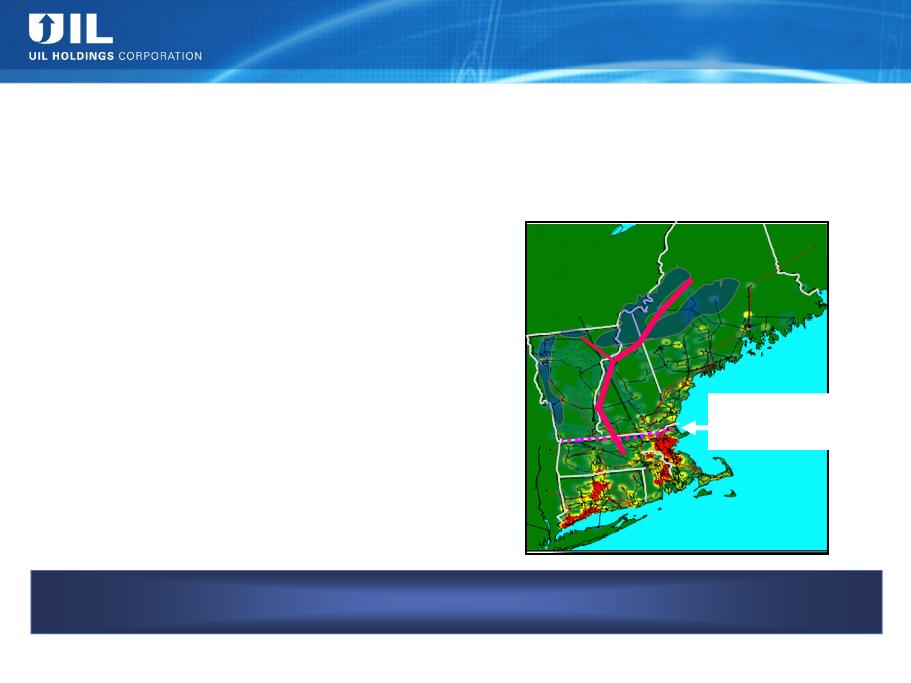
Renewable-Enabling Transmission
15
Collaborative effort: UI, NU, NSTAR and NGrid …
to research / identify the most economical means of satisfying future RPS obligations
Significant Region-Wide Need:
› RPS requirement > 3x current
available renewables*
available renewables*
› CT requirement is > UI’s entire load
› Gap will be filled by renewables
remote from load
remote from load
N.E. Governors’ Blueprint:
› Significant transmission build-out
indicated
indicated
› Potential $7 to $10B range - could be
higher or lower to satisfy a 4,000 to
12,000 MW need
higher or lower to satisfy a 4,000 to
12,000 MW need
› Cost to New England likely much less
than Midwestern wind
than Midwestern wind
Potential Solutions Under Study
› Need will likely be satisfied by a portfolio
of projects
of projects
› One promising example is shown below
* From ISO-NE presentation dated 5/15/09 - driven by 2008 data.
Vast majority of
potential onshore
renewables (wind)
potential onshore
renewables (wind)
are in northern NE
North-South Interface:
80% of NE electric
load is below this line
load is below this line
April 2011
16
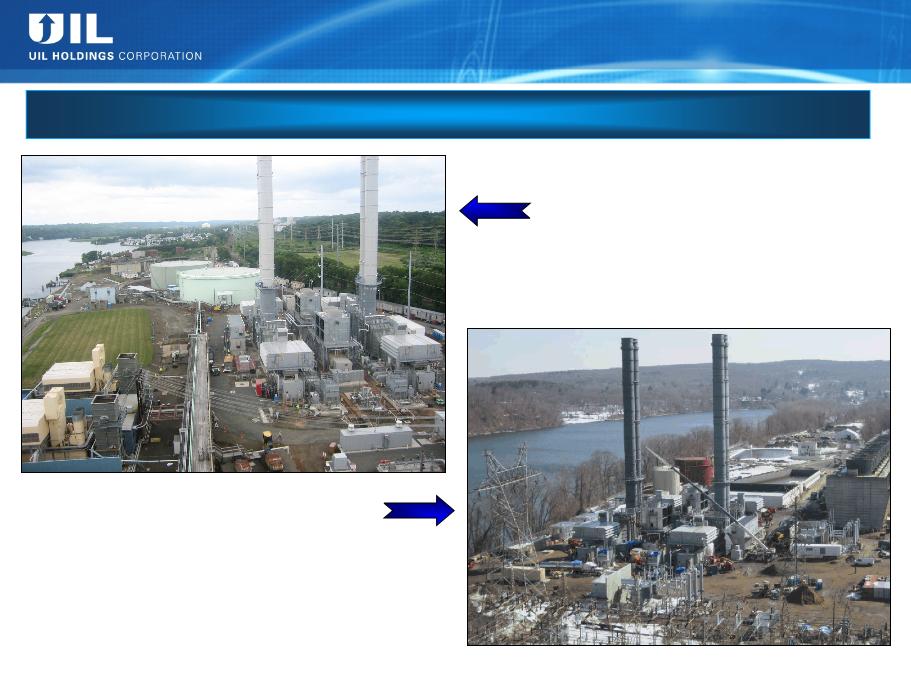
UI GenConn Energy
Devon Facility
› Operating
› Contractual requirements met on
9/10/10
9/10/10
Middletown Facility
› 97.5% complete as of 3/31/11
› Expected to be operational in June 2011
50/50 Joint Venture between UI and NRG
April 2011
17
17
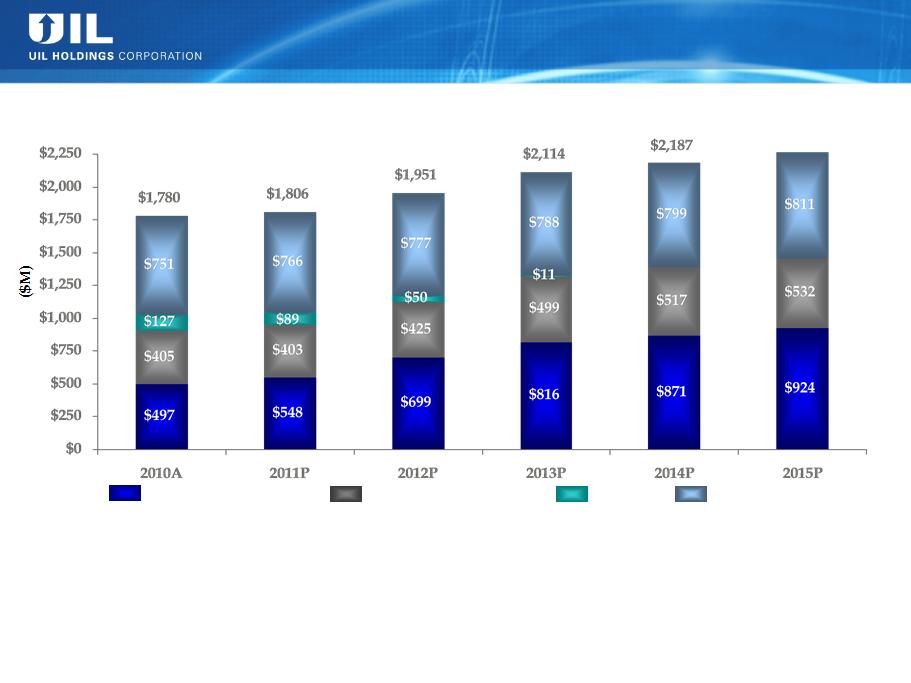
Updated Near-Term Average Rate Base Profile
28%
23%
7%
30%
22%
5%
36%
2%
40%
1%
24%
38%
37%
39%
43%
22%
37%
24%
36%
41%
23%
Electric distribution
CTA
Gas distribution*
Electric transmission
UI’s 50% Share ($M): 2010A 2011P 2012P 2013P 2014P 2015P
Avg. GenConn RB Equivalent: $ 51 $ 143 $ 174 $ 166 $ 158 $ 150
Avg. Gen Conn Equity “Rate Base” $ 25 $ 72 $ 87 $ 83 $ 79 $ 75
Rate Base (Excluding GenConn Equity Investments):
GenConn Equity Investments:
* 2010 Gas distribution average rate base reflects the full year; UIL ownership was for 6 weeks effective with the closing on the acquisition. For comparability purposes, Gas distribution
excludes the impacts of 338(h)(10) election.
excludes the impacts of 338(h)(10) election.
Amounts may not add due to rounding.
42%
$2,267

April 2011
18
Financial Results

April 2011
19
2010 vs. 2009 Financial Results
$M
Amounts may not add due to rounding.

April 2011
20
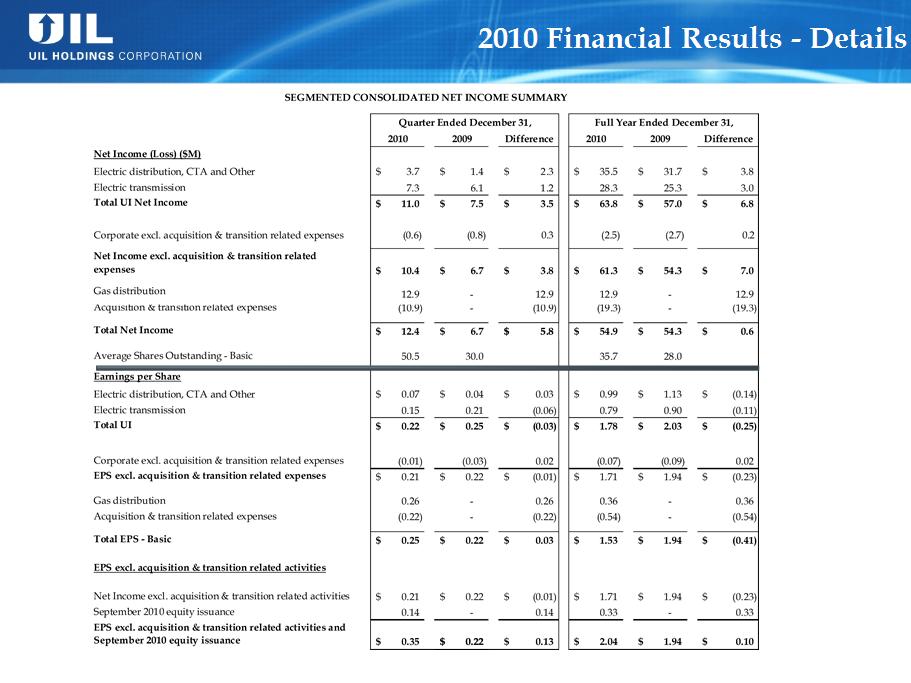
2010 Financial Results - Details
Electric distribution, CTA & other
› 12% increase in net income compared to ’09
» Increased operating income due to rate increase effective 1/1/10, partially offset by lower CTA rate
base
base
» Earnings of $1.2M from UI’s equity investment in GenConn
» Average earned ROE of 9.18% after sharing
Electric transmission
› 12% increase in net income compared to ’09
» Increase in AFUDC coupled with higher rate base
» Weighted average ROE of 12.5%
Gas distribution
› Net income of $12.9M from acquisition close (11/17/10 - 12/31/10)
› Average earned ROEs; SCG 10.62%, CNG 9.19%
› Net increase of 1.3% in customers in 2010
Acquisition & transition related expenses - $19.3M after-tax
Bonus depreciation effect on ’10 results based on current expectations, ($0.5)-($0.7)
million
million
EPS dilution from Sept. ’10 equity issuance - $0.33 per share

April 2011
21
Bonus Depreciation 2010 & 2011*
Efficient use of cash benefits from bonus depreciation
› Expected pension contributions of $65-$75M to the electric and gas pension
plans in 2011
plans in 2011
› Reduces pension costs and increases rate base
Expect no need for external equity for at least the next 3 years
* Based on current expectations
** Related to the tax year
Cash**
Approx.
EPS Impact
2010 estimate
2011 estimate
$70 - $80 million
($0.03) - ($0.05)
April 2011
22
UI Equity Bridge Loan
UIL Debt retired 2/15/11
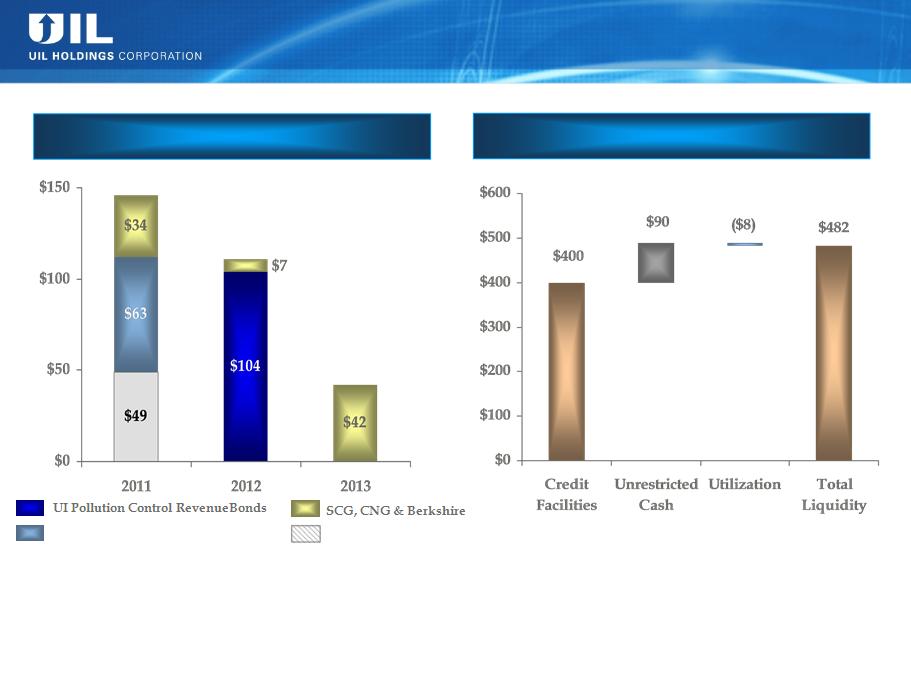
Debt Maturity and Liquidity Profile
Liquidity Overview (12/31/10)
Near-Term Debt Maturities
($M)
*
* To be remarketed
Amounts may not add due to rounding.
No
Expect no need for external equity for at least the next 3 years
($M)
April 2011
23
23
Credit Ratings
Maintenance of investment grade credit ratings is an important objective
|
Issuer
|
S&P
|
Moody’s
|
|
UIL Holdings
|
BBB
(Stable) |
Baa3
(Stable) |
|
United
Illuminating |
BBB
(Stable) |
Baa2
(Stable) |
|
SCG
|
BBB
(Stable) |
Baa2
(Stable) |
|
CNG
|
BBB
(Stable) |
Baa1
(Stable) |
|
Berkshire
|
BBB
(Stable) |
Baa2
(Stable) |
April 2011
24
Assumptions
› Bonus depreciation is expected to have a net impact of ($0.03)-
($0.05) per share
($0.05) per share
› Includes one-time costs for the transition of the gas
distribution business support services from IUSA, as well as
the on-going integration costs
distribution business support services from IUSA, as well as
the on-going integration costs
2011 Operational Snapshot
› Integration of all of the regulated businesses with an emphasis on process integration initiatives and best practices
› Exiting the TSA by year-end for vast majority of services
› Positioning to realize half of IUSA’s ‘09 allocated corporate charges of $23M à expected savings of $11.6M in 2012
› Continued focus on management of O&M expenses at each of our regulated businesses
› Execution of capital expenditure plan at each of our regulated businesses
* Bonus depreciation estimate as of 4/6/11

April 2011
25
Assumptions
› Bonus depreciation is expected to have a net impact of ($0.06)-
($0.08) per share
($0.08) per share
2012 Operational Snapshot
› Integration of all of the regulated businesses with an emphasis on process integration initiatives and best practices
› Completely exiting the TSA
› Continued focus on management of O&M expenses at each of our regulated businesses
› Execution of capital expenditure plan at each of our regulated businesses
* Bonus depreciation estimate as of 4/6/11

April 2011
26
Closing Remarks
Ø Closed on gas company acquisitions & moving forward with integration
activities with 2011 being a transition year
activities with 2011 being a transition year
Ø GenConn Devon operational - Middletown expected to be fully operational by
June 2011
June 2011
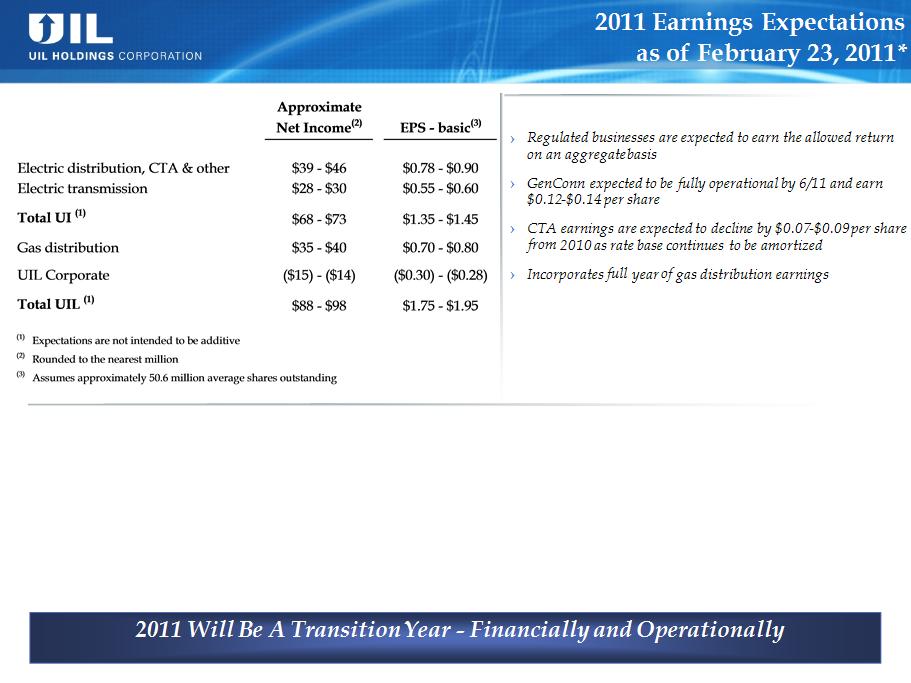
Ø Expecting to earn allowed returns on all regulated businesses on an aggregate
basis
basis
Ø Continued management of O&M expenses
Ø Executing on capital expenditure plan - realizing rate base growth
Ø Continue to seek out Transmission opportunities in our service territory and
beyond
beyond
Ø Expect no need for external equity for at least the next 3 years

April 2011
Q&A

April 2011
Appendix
April 2011
29
April 2011
30
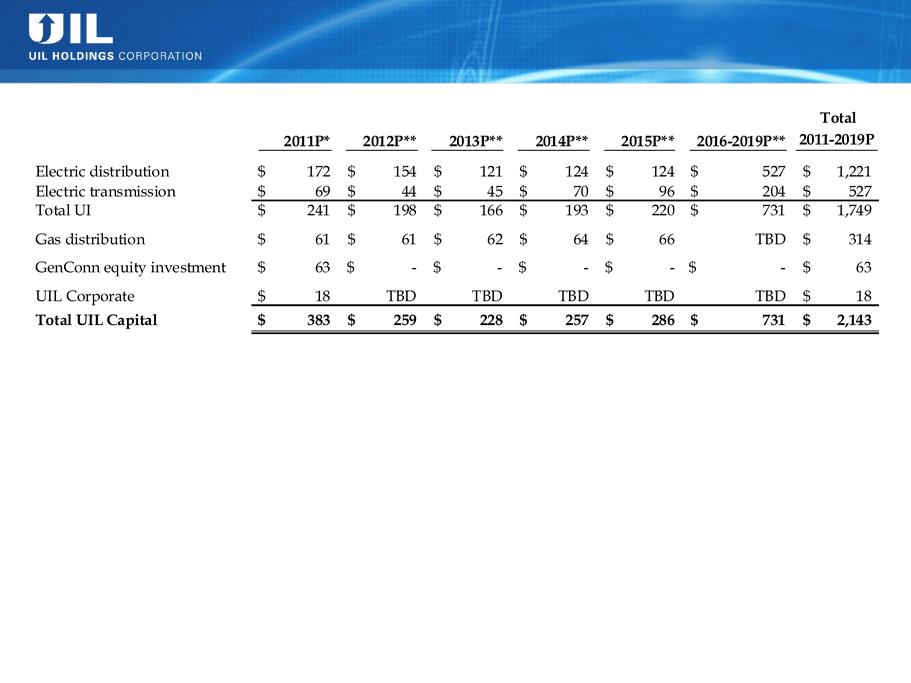
UIL Base 2011-2019 CapEx Forecast
* Updated - February 23, 2011
** Per November ’10 EEI presentation. UI base 10-yr (2010-2019) capex forecast, including GenConn - $2.1B.
Amounts may not add due to rounding.

April 2011
31
Expected Impacts of Bonus Depreciation - 2010 & 2011
Based on Current Expectations
Based on Current Expectations

April 2011
32
Final 338(h)(10) Cash Value
($ Millions)
($ Millions)
April 2011
33
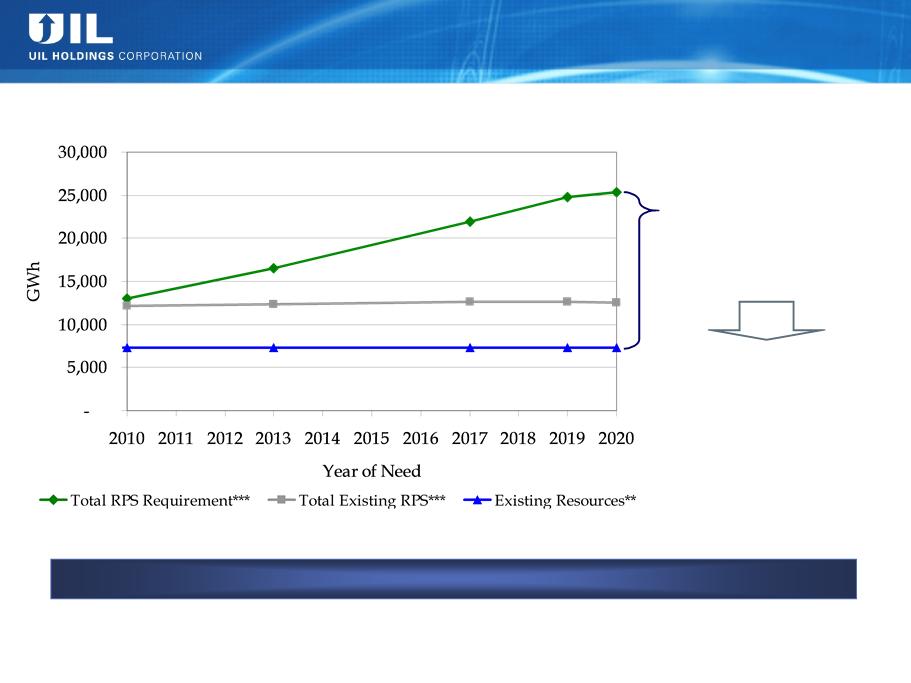
Region-Wide RPS* Obligations
* RPS = Renewable Portfolio Standard.
** From ISO-NE Presentation dated 5/15/09 - driven by 2008 data.
*** From ISO-NE Presentation dated 5/25/10 - “existing” includes RPS obligations through 2009. Total RPS Requirement excludes Vermont renewables, combined heat & power, and energy
efficiency obligations.
efficiency obligations.
Region-Wide
Compliance Gap
Compliance Gap
(v. “existing” renewable resources**)
forecasted/estimated at
~ 18,000GWh
Region-Wide RPS Obligation thru 2020:
› Unlikely to be
satisfied by
renewables currently
in the ISO-NE queue
satisfied by
renewables currently
in the ISO-NE queue
› Will require
significant additional
transmission
significant additional
transmission
Satisfaction will likely require significant new transmission in the region.
April 2011
34
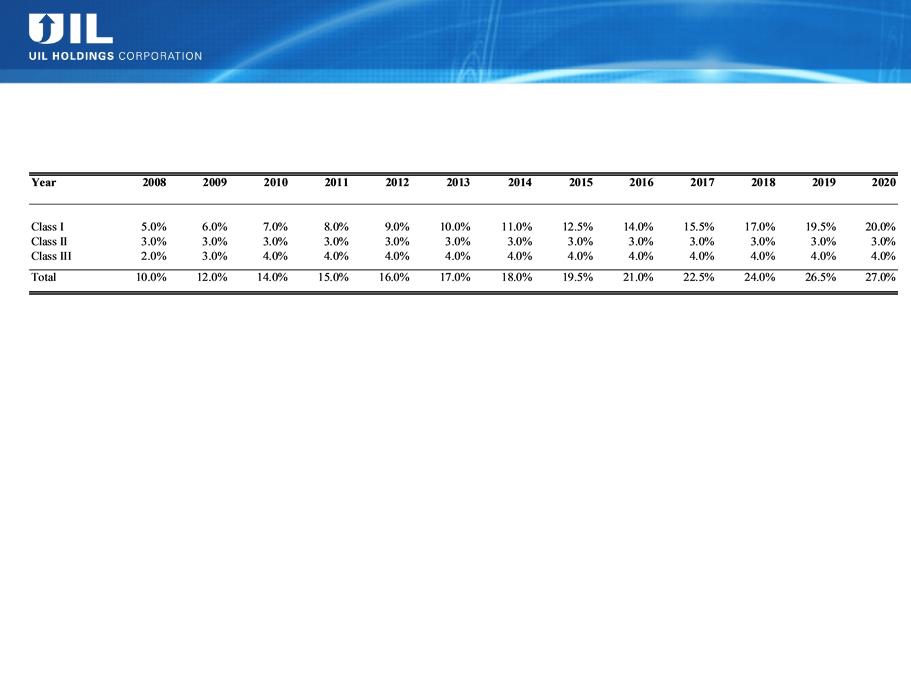
CT RPS Requirements
Connecticut RPS Requirements
(Percentage of Retail Load)
Class I resources include energy derived from solar, wind, fuel cell, methane gas from landfills, ocean thermal, wave,
tidal, run-of-river hydropower (<5MW, began operation after July 1, 2003), sustainable biomass (NOx emission <0.075
lbs/MMBtu of heat input)
tidal, run-of-river hydropower (<5MW, began operation after July 1, 2003), sustainable biomass (NOx emission <0.075
lbs/MMBtu of heat input)
Class II resources include other biomass (NOx emission <0.2 lbs/MMBtu of heat input, began operation before July 1,
1998), small run-of-river hydroelectric (<5MW, began operation before July 1, 2003) and municipal solid waste trash-to-
energy facilities
1998), small run-of-river hydroelectric (<5MW, began operation before July 1, 2003) and municipal solid waste trash-to-
energy facilities
Class III include customer-sited combined heat and power (with operating efficiency >50% of facilities installed after
January 1, 2006), waste heat recovery systems (installed on or after April 1, 2007), electricity savings from conservation
and load management programs (began on or after January 1, 2006)
January 1, 2006), waste heat recovery systems (installed on or after April 1, 2007), electricity savings from conservation
and load management programs (began on or after January 1, 2006)