Attached files
| file | filename |
|---|---|
| 8-K - 8-K - Duke Energy CORP | a11-9754_18k.htm |
Exhibit 99.1
|
|
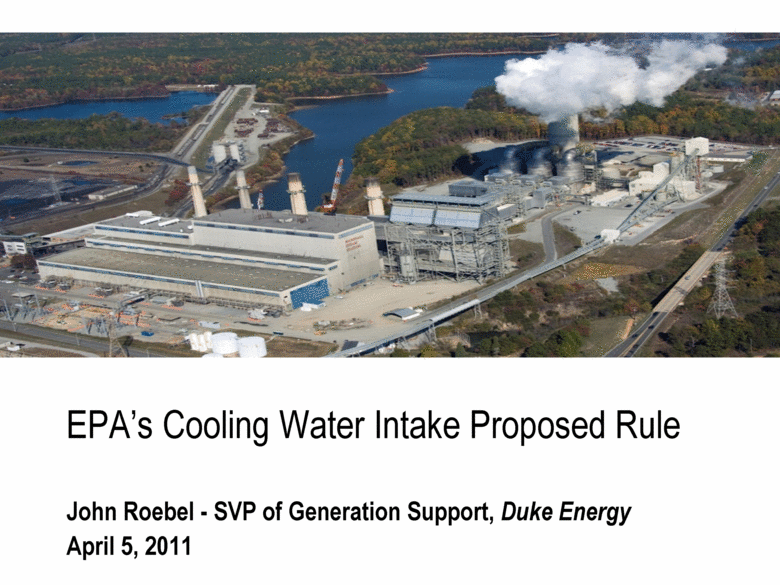
EPA’s Cooling Water Intake Proposed Rule John Roebel - SVP of Generation Support, Duke Energy April 5, 2011 |
|
|
2 SAFE HARBOR STATEMENT This document contains forward-looking statements within the meaning of the Private Securities Litigation Reform Act of 1995. Forward-looking statements are typically identified by words or phrases such as “may,” “will,” “should,” “anticipate,” “estimate,” “expect,” “project,” “intend,” “plan,” “believe,” “target,” “forecast,” and other words and terms of similar meaning. Forward-looking statements involve estimates, expectations, projections, goals, forecasts, assumptions, risks and uncertainties. Duke Energy cautions readers that any forward-looking statement is not a guarantee of future performance and that actual results could differ materially from those contained in the forward-looking statement. You should refer to the additional information contained in Duke Energy’s 2010 Form 10-K filed with the SEC and our other SEC filings concerning factors that could cause those results to be different than contemplated in today's discussion. REG G DISCLOSURE In addition, today's discussion includes certain non-GAAP financial measures as defined under SEC Regulation G. A reconciliation of those measures to the most directly comparable GAAP measures is available on our Investor Relations website at www.duke-energy.com/investors/. |
|
|
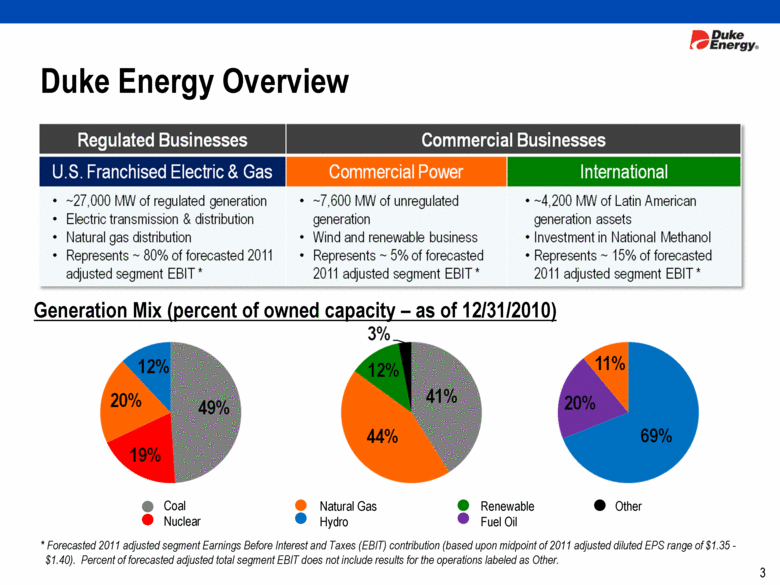
3 * Forecasted 2011 adjusted segment Earnings Before Interest and Taxes (EBIT) contribution (based upon midpoint of 2011 adjusted diluted EPS range of $1.35 - $1.40). Percent of forecasted adjusted total segment EBIT does not include results for the operations labeled as Other. Generation Mix (percent of owned capacity – as of 12/31/2010) Duke Energy Overview Coal Nuclear Natural Gas Hydro Renewable Fuel Oil Other |
|
|
4 Overview of Proposed 316(b) Rule U.S. Environmental Protection Agency (EPA) proposed 316(b) cooling water intake rules on March 28, 2011 Subject to 90 day comment period after publication Final rules anticipated in July 2012 Impingement requirements Prevention of aquatic mortality due to contact with intake screens and equipment Entrainment requirements Prevention of aquatic mortality due to passage through the plant’s cooling system past the intake |
|
|
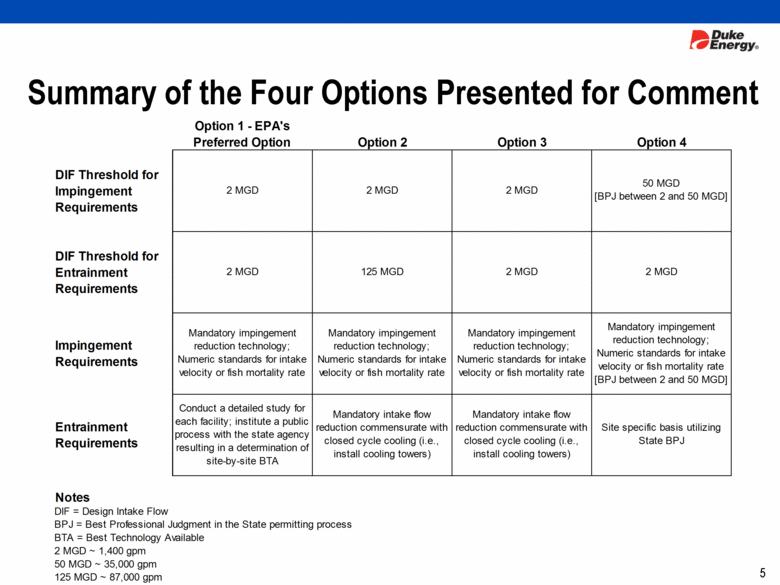
5 Summary of the Four Options Presented for Comment Option 1 - EPA's Preferred Option Option 2 Option 3 Option 4 DIF Threshold for Impingement Requirements 2 MGD 2 MGD 2 MGD 50 MGD [BPJ between 2 and 50 MGD] DIF Threshold for Entrainment Requirements 2 MGD 125 MGD 2 MGD 2 MGD Impingement Requirements Mandatory impingement reduction technology; Numeric standards for intake velocity or fish mortality rate Mandatory impingement reduction technology; Numeric standards for intake velocity or fish mortality rate Mandatory impingement reduction technology; Numeric standards for intake velocity or fish mortality rate Mandatory impingement reduction technology; Numeric standards for intake velocity or fish mortality rate [BPJ between 2 and 50 MGD] Entrainment Requirements Conduct a detailed study for each facility; institute a public process with the state agency resulting in a determination of site-by-site BTA Mandatory intake flow reduction commensurate with closed cycle cooling (i.e., install cooling towers) Mandatory intake flow reduction commensurate with closed cycle cooling (i.e., install cooling towers) Site specific basis utilizing State BPJ Notes DIF = Design Intake Flow BPJ = Best Professional Judgment in the State permitting process BTA = Best Technology Available 2 MGD ~ 1,400 gpm 50 MGD ~ 35,000 gpm 125 MGD ~ 87,000 gpm |
|
|
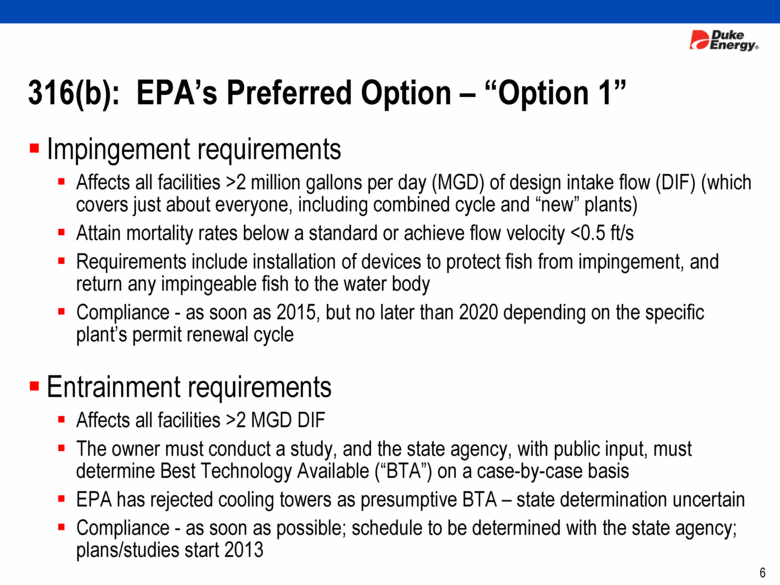
6 316(b): EPA’s Preferred Option – “Option 1” Impingement requirements Affects all facilities >2 million gallons per day (MGD) of design intake flow (DIF) (which covers just about everyone, including combined cycle and “new” plants) Attain mortality rates below a standard or achieve flow velocity <0.5 ft/s Requirements include installation of devices to protect fish from impingement, and return any impingeable fish to the water body Compliance - as soon as 2015, but no later than 2020 depending on the specific plant’s permit renewal cycle Entrainment requirements Affects all facilities >2 MGD DIF The owner must conduct a study, and the state agency, with public input, must determine Best Technology Available (“BTA”) on a case-by-case basis EPA has rejected cooling towers as presumptive BTA – state determination uncertain Compliance - as soon as possible; schedule to be determined with the state agency; plans/studies start 2013 |
|
|
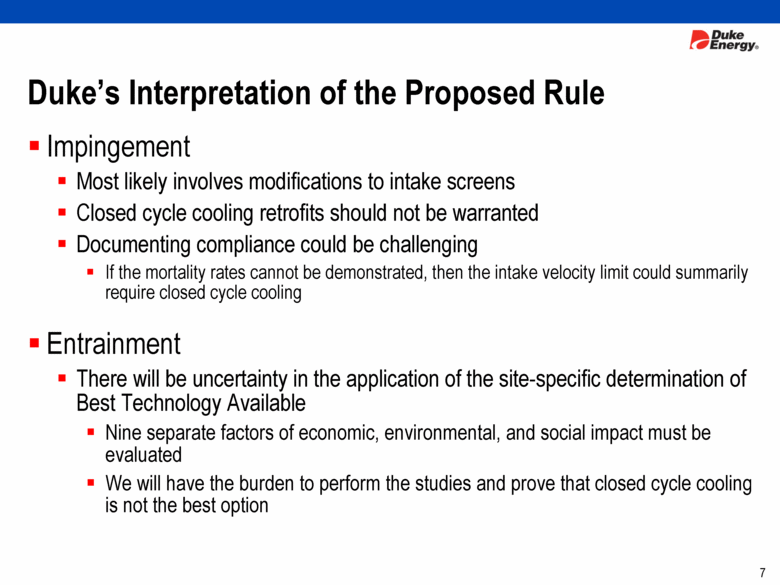
7 Duke’s Interpretation of the Proposed Rule Impingement Most likely involves modifications to intake screens Closed cycle cooling retrofits should not be warranted Documenting compliance could be challenging If the mortality rates cannot be demonstrated, then the intake velocity limit could summarily require closed cycle cooling Entrainment There will be uncertainty in the application of the site-specific determination of Best Technology Available Nine separate factors of economic, environmental, and social impact must be evaluated We will have the burden to perform the studies and prove that closed cycle cooling is not the best option |
|
|
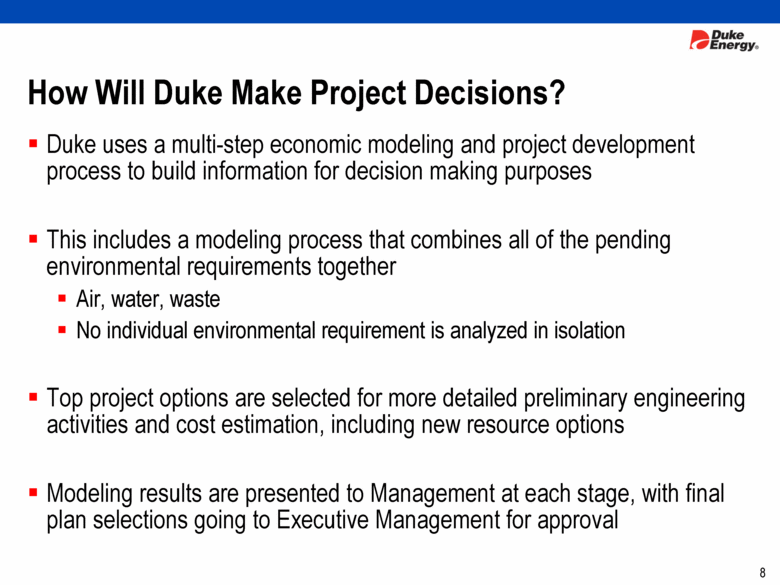
8 How Will Duke Make Project Decisions? Duke uses a multi-step economic modeling and project development process to build information for decision making purposes This includes a modeling process that combines all of the pending environmental requirements together Air, water, waste No individual environmental requirement is analyzed in isolation Top project options are selected for more detailed preliminary engineering activities and cost estimation, including new resource options Modeling results are presented to Management at each stage, with final plan selections going to Executive Management for approval |
|
|
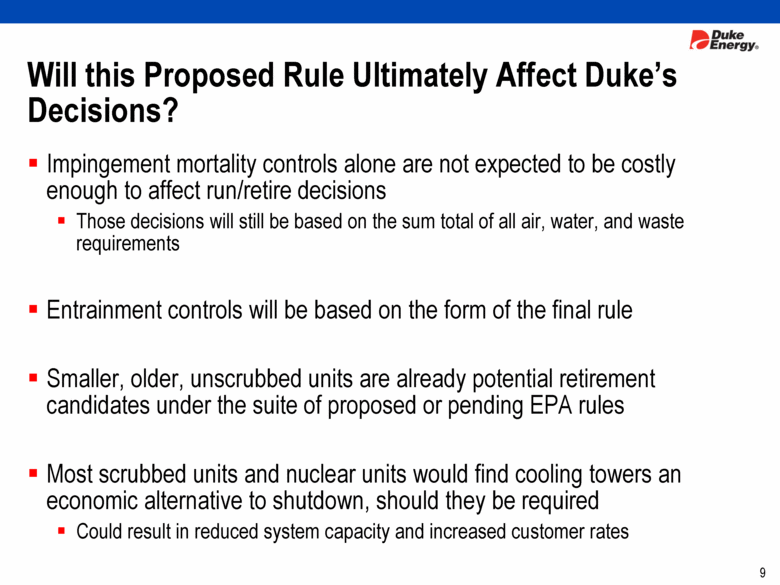
9 Will this Proposed Rule Ultimately Affect Duke’s Decisions? Impingement mortality controls alone are not expected to be costly enough to affect run/retire decisions Those decisions will still be based on the sum total of all air, water, and waste requirements Entrainment controls will be based on the form of the final rule Smaller, older, unscrubbed units are already potential retirement candidates under the suite of proposed or pending EPA rules Most scrubbed units and nuclear units would find cooling towers an economic alternative to shutdown, should they be required Could result in reduced system capacity and increased customer rates |
|
|
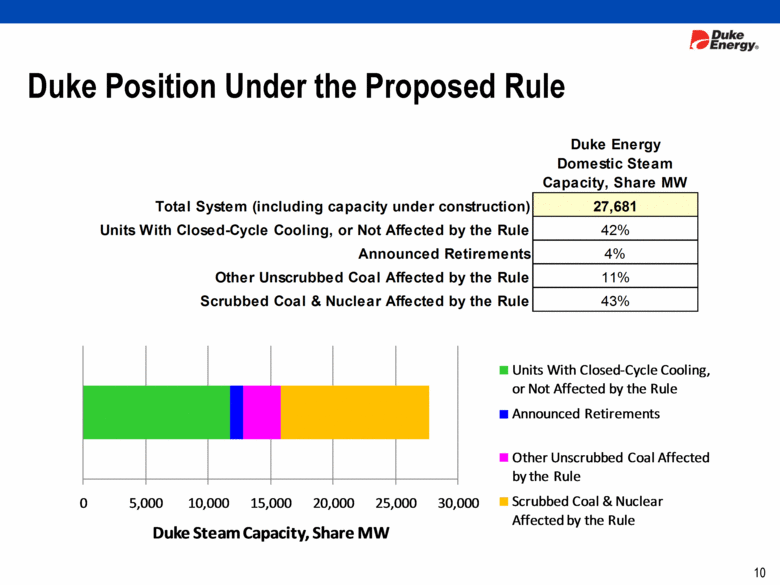
Duke Position Under the Proposed Rule 10 Total System (including capacity under construction) 27,681 Units With Closed-Cycle Cooling, or Not Affected by the Rule 42% Announced Retirements 4% Other Unscrubbed Coal Affected by the Rule 11% Scrubbed Coal & Nuclear Affected by the Rule 43% Duke Energy Domestic Steam Capacity, Share MW Units With Closed-Cycle Cooling, or Not affected by the Rule Announced Retirements Other Unscrubbed Coal Affected by the Rule Scrubbed Coal & Nuclear Affected by the Rule Duke Steam Capacity, Share MW |
|
|
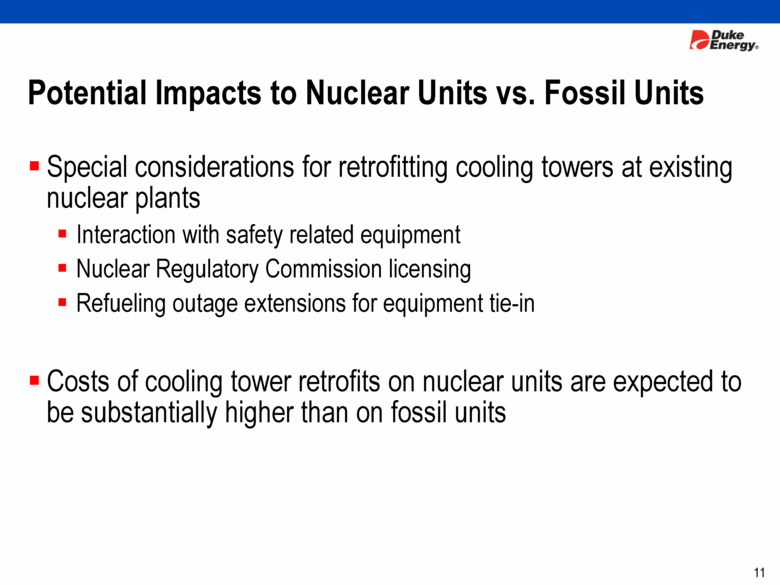
11 Potential Impacts to Nuclear Units vs. Fossil Units Special considerations for retrofitting cooling towers at existing nuclear plants Interaction with safety related equipment Nuclear Regulatory Commission licensing Refueling outage extensions for equipment tie-in Costs of cooling tower retrofits on nuclear units are expected to be substantially higher than on fossil units |
|
|
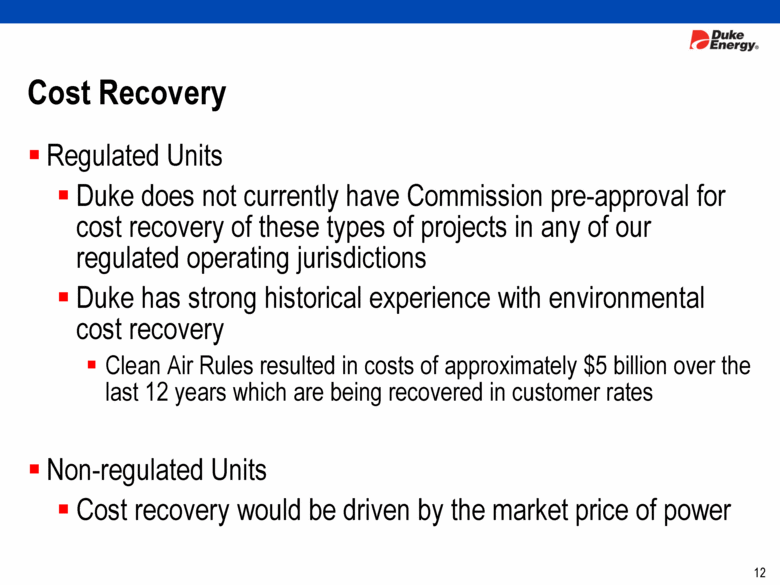
12 Cost Recovery Regulated Units Duke does not currently have Commission pre-approval for cost recovery of these types of projects in any of our regulated operating jurisdictions Duke has strong historical experience with environmental cost recovery Clean Air Rules resulted in costs of approximately $5 billion over the last 12 years which are being recovered in customer rates Non-regulated Units Cost recovery would be driven by the market price of power |
|
|
APPENDIX |
|
|
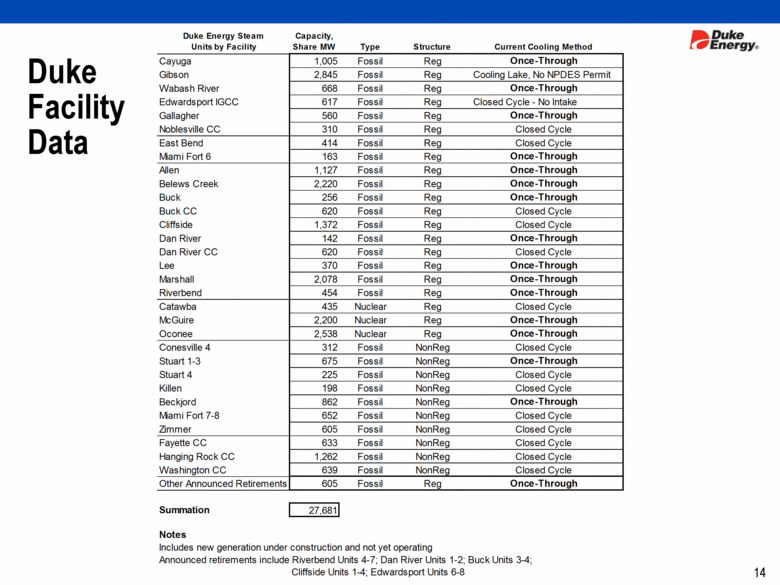
Duke Facility Data 14 Duke Energy Steam Units by Facility Capacity, Share MW Type Structure Current Cooling Method Cayuga 1,005 Fossil Reg Once-Through Gibson 2,845 Fossil Reg Cooling Lake, No NPDES Permit Wabash River 668 Fossil Reg Once-Through Edwardsport IGCC 617 Fossil Reg Closed Cycle - No Intake Gallagher 560 Fossil Reg Once-Through Noblesville CC 310 Fossil Reg Closed Cycle East Bend 414 Fossil Reg Closed Cycle Miami Fort 6 163 Fossil Reg Once-Through Allen 1,127 Fossil Reg Once-Through Belews Creek 2,220 Fossil Reg Once-Through Buck 256 Fossil Reg Once-Through Buck CC 620 Fossil Reg Closed Cycle Cliffside 1,372 Fossil Reg Closed Cycle Dan River 142 Fossil Reg Once-Through Dan River CC 620 Fossil Reg Closed Cycle Lee 370 Fossil Reg Once-Through Marshall 2,078 Fossil Reg Once-Through Riverbend 454 Fossil Reg Once-Through Catawba 435 Nuclear Reg Closed Cycle McGuire 2,200 Nuclear Reg Once-Through Oconee 2,538 Nuclear Reg Once-Through Conesville 4 312 Fossil NonReg Closed Cycle Stuart 1-3 675 Fossil NonReg Once-Through Stuart 4 225 Fossil NonReg Closed Cycle Killen 198 Fossil NonReg Closed Cycle Beckjord 862 Fossil NonReg Once-Through Miami Fort 7-8 652 Fossil NonReg Closed Cycle Zimmer 605 Fossil NonReg Closed Cycle Fayette CC 633 Fossil NonReg Closed Cycle Hanging Rock CC 1,262 Fossil NonReg Closed Cycle Washington CC 639 Fossil NonReg Closed Cycle Other Announced Retirements 605 Fossil Reg Once-Through Summation 27,681 Notes Includes new generation under construction and not yet operating Announced retirements include Riverbend Units 4-7; Dan River Units 1-2; Buck Units 3-4; Cliffside Units 1-4; Edwardsport Units 6-8 |
|
|
15 [LOGO] |
Duke Energy Corporation
Non-GAAP Reconciliations
Bernstein Environmental Utilities Conference
April 5, 2011
2011 Adjusted Diluted EPS Outlook
The materials for Duke Energy’s Bernstein Environmental Utilities Conference presentation on April 5, 2011, include a discussion of the forecasted 2011 adjusted diluted EPS outlook range of $1.35-$1.40 per share. Adjusted diluted EPS is a non-GAAP financial measure as it represents diluted EPS from continuing operations attributable to Duke Energy Corporation shareholders, adjusted for the per-share impact of special items and the mark-to-market impacts of economic hedges in the Commercial Power segment. Special items represent certain charges and credits which management believes will not be recurring on a regular basis, although it is reasonably possible such charges and credits could recur. Mark-to-market adjustments reflect the mark-to-market impact of derivative contracts, which is recognized in GAAP earnings immediately as such derivative contracts do not qualify for hedge accounting or regulatory accounting treatment, used in Duke Energy’s hedging of a portion of the economic value of its generation assets in the Commercial Power segment. The economic value of the generation assets is subject to fluctuations in fair value due to market price volatility of the input and output commodities (e.g., coal, power) and, as such, the economic hedging involves both purchases and sales of those input and output commodities related to the generation assets. Because the operations of the generation assets are accounted for under the accrual method, management believes that excluding the impact of mark-to-market changes of the economic hedge contracts from adjusted earnings until settlement better matches the financial impacts of the hedge contract with the portion of the economic value of the underlying hedged asset. The most directly comparable GAAP measure for adjusted diluted EPS is reported diluted EPS from continuing operations attributable to Duke Energy Corporation common shareholders, which includes the impact of special items and the mark-to-market impacts of economic hedges in the Commercial Power segment. Due to the forward-looking nature of this non-GAAP financial measure for future periods, information to reconcile it to the most directly comparable GAAP financial measure is not available at this time, as management is unable to project special items or mark-to-market adjustments for future periods.
Forecasted Adjusted Segment EBIT for 2011
The materials for Duke Energy’s Bernstein Environmental Utilities Conference presentation on April 5, 2011, include a discussion of forecasted 2011 adjusted segment EBIT for Duke Energy’s reportable segments as a percentage of forecasted adjusted total segment EBIT, based upon the original adjusted segment EBIT forecast embedded within the original forecasted 2011 adjusted diluted EPS outlook range of $1.35-$1.40 per share.
The primary performance measure used by management to evaluate segment performance is segment EBIT from continuing operations, which at the segment level represents all profits from continuing operations (both operating and non-operating), including any equity in earnings of unconsolidated affiliates, before deducting interest and taxes, and is net of the income attributable to non-controlling interests. Management believes segment EBIT from continuing operations, which is the GAAP measure used to report segment results, is a good indicator of each segment’s operating performance as it represents the results of Duke Energy’s ownership interests in continuing operations without regard to financing methods or capital structures. Duke Energy also uses adjusted segment EBIT as a measure of historical and anticipated future segment performance. When used for future periods, adjusted segment EBIT may also include any amounts that may be reported as discontinued operations or extraordinary items.
Adjusted segment EBIT is a non-GAAP financial measure as it represents reported segment EBIT adjusted for the impact of special items and the mark-to market impacts of economic hedges in the Commercial Power segment. Special items represent certain charges and credits which management believes will not be recurring on a regular basis, although it is reasonably possible such charges and credits could recur. Mark-to-market adjustments reflect the mark-to-market impact of derivative contracts, which is recognized in GAAP earnings immediately as such derivative contracts do not qualify for hedge accounting or regulatory accounting, used in Duke Energy’s hedging of a portion of the economic value of certain of its generation assets in the Commercial Power segment (as discussed separately above under “2011 Adjusted Diluted EPS Outlook”). Management believes that the presentation of adjusted segment EBIT provides useful information to investors, as it provides them an additional relevant comparison of a segment’s performance across periods. The most directly comparable GAAP measure for adjusted segment EBIT is reported segment EBIT, which represents segment results from continuing operations, including any special items and the mark-to-market impacts of economic hedges in the Commercial Power segment. Due to the forward-looking nature of this non-GAAP financial measure for full year 2011, information to reconcile it to the most directly comparable GAAP financial measure is not available at this time, as management is unable to project special items or mark-to-market adjustments for future periods.

