Attached files
Table of Contents
As filed with the Securities and Exchange Commission on April 4, 2011
Registration No. 333-171377
UNITED STATES
SECURITIES AND EXCHANGE COMMISSION
Washington, D.C. 20549
Amendment No. 3 to
Form S-1
REGISTRATION STATEMENT
UNDER
THE SECURITIES ACT OF 1933
Responsys, Inc.
(Exact name of registrant as specified in its charter)
| Delaware | 7372 | 77-0476820 | ||
| (State or other jurisdiction of incorporation or organization) |
(Primary Standard Industrial Classification Code Number) |
(IRS Employer Identification No.) |
Responsys, Inc.
900 Cherry Avenue, 5th Floor
San Bruno, California 94066
(650) 745-1700
(Address, including zip code, and telephone number, including area code, of Registrant’s principal executive offices)
Daniel D. Springer
Chief Executive Officer
Responsys, Inc.
900 Cherry Avenue, 5th Floor
San Bruno, California 94066
(650) 745-1700
(Name, address, including zip code, and telephone number, including area code, of agent for service)
Please send copies of all communications to:
| Gordon K. Davidson, Esq. Jeffrey R. Vetter, Esq. Fenwick & West LLP 801 California Street Mountain View, California 94041 (650) 988-8500 |
Julian K. Ong, Esq. Responsys, Inc. 900 Cherry Avenue, 5th Floor San Bruno, California 94066 (650) 745-1700 |
Sarah K. Solum, Esq. Davis Polk & Wardwell LLP 1600 El Camino Real Menlo Park, California 94025 (650) 752-2000 |
Approximate date of commencement of proposed sale to the public: As soon as practicable after the effective date of this registration statement.
If any of the securities being registered on this Form are to be offered on a delayed or continuous basis pursuant to Rule 415 under the Securities Act, check the following box: ¨
If this Form is filed to register additional securities for an offering pursuant to Rule 462(b) under the Securities Act, check the following box and list the Securities Act registration statement number of the earlier effective registration statement for the same offering. ¨
If this Form is a post-effective amendment filed pursuant to Rule 462(c) under the Securities Act, check the following box and list the Securities Act registration statement number of the earlier effective registration statement for the same offering. ¨
If this Form is a post-effective amendment filed pursuant to Rule 462(d) under the Securities Act, check the following box and list the Securities Act registration statement number of the earlier effective registration statement for the same offering. ¨
Indicate by check mark whether the registrant is a large accelerated filer, an accelerated filer, a non-accelerated filer, or a smaller reporting company. See the definitions of “large accelerated filer”, “accelerated filer” and “smaller reporting company” in Rule 12b-2 of the Exchange Act. (Check one):
| Large accelerated filer ¨ | Accelerated filer ¨ | |
| Non-accelerated filer x (Do not check if a smaller reporting company) | Smaller reporting company ¨ |
CALCULATION OF REGISTRATION FEE
| Title of Each Class of Securities to be Registered |
Amount to be |
Proposed Maximum |
Proposed Maximum Offering Price(2) |
Amount of Fee(3) | ||||
| Common Stock, $0.0001 par value |
7,612,602 | $10.00 | $76,126,020 | $6,151 | ||||
| (1) | Includes 992,948 shares that may be purchased pursuant to the over-allotment option to be granted to the underwriters. |
| (2) | Estimated solely for the purpose of computing the amount of the registration fee pursuant to Rule 457(a) under the Securities Act. |
| (3) | The registrant previously paid $4,278 with respect to a proposed maximum aggregate offering price of $60,000,000 at a rate of $71.30 per $1,000,000, which was the rate in effect at the time of payment. An additional $1,873 is being paid with respect to the additional $16,126,020 proposed maximum aggregate offering price at the rate currently in effect. |
The registrant hereby amends this registration statement on such date or dates as may be necessary to delay its effective date until the registrant shall file a further amendment which specifically states that this registration statement shall thereafter become effective in accordance with Section 8(a) of the Securities Act of 1933 or until the registration statement shall become effective on such date as the Commission, acting pursuant to said Section 8(a), may determine.
Table of Contents
The information in this prospectus is not complete and may be changed. We and the selling stockholders may not sell these securities until the registration statement filed with the Securities and Exchange Commission is effective. This prospectus is not an offer to sell these securities and neither we nor the selling stockholders are soliciting offers to buy these securities in any state where the offer or sale is not permitted.
PROSPECTUS (Subject to Completion)
Issued April 4, 2011
6,619,654 Shares

COMMON STOCK
Responsys, Inc. is offering 5,500,000 shares of common stock and the selling stockholders are offering 1,119,654 shares of common stock. We will not receive any proceeds from the sale of shares by the selling stockholders. This is our initial public offering and no public market exists for our shares. We anticipate that the initial public offering price will be between $8.50 and $10.00 per share.
Investing in our common stock involves risks. See “Risk Factors” beginning on page 9.
We have applied to list our common stock on the NASDAQ Global Market under the symbol “MKTG.”
| Price to Public |
Underwriting Discounts and Commissions |
Proceeds to Responsys |
Proceeds to Selling Stockholders |
|||||||||||||
| Per share |
$ | $ | $ | $ | ||||||||||||
| Total |
$ | $ | $ | $ | ||||||||||||
The underwriters may also exercise their option to purchase up to an additional 992,948 shares of common stock from us and the selling stockholders at the public offering price, less underwriting discounts and commissions, within 30 days from the date of this prospectus to cover over-allotments, if any.
Neither the Securities and Exchange Commission nor any other regulatory body has approved or disapproved of these securities or determined if this prospectus is truthful or complete. Any representation to the contrary is a criminal offense.
The underwriters expect to deliver the shares of common stock to purchasers on , 2011.
| Morgan Stanley | Credit Suisse |
| William Blair & Company |
JMP Securities |
Pacific Crest Securities |
, 2011
Table of Contents

Table of Contents
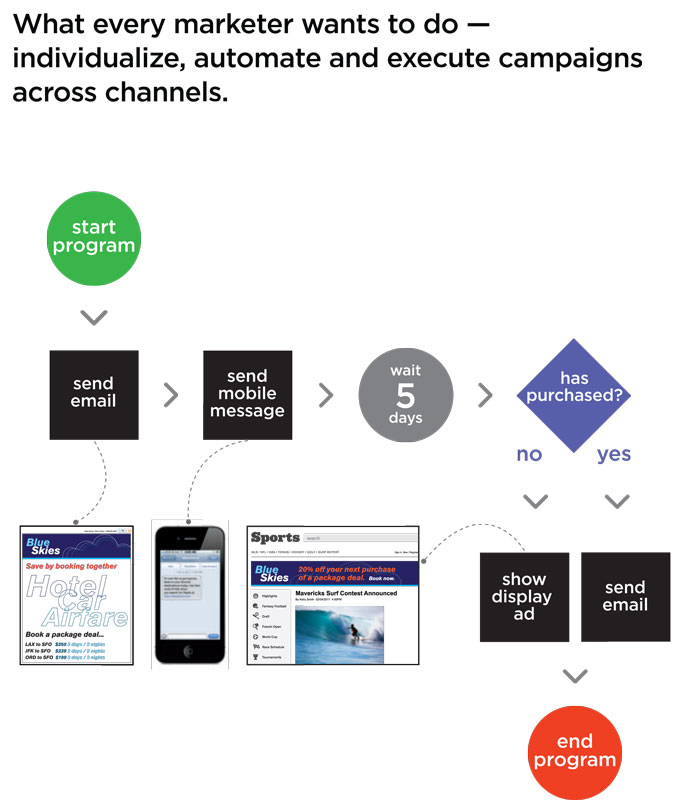
Table of Contents
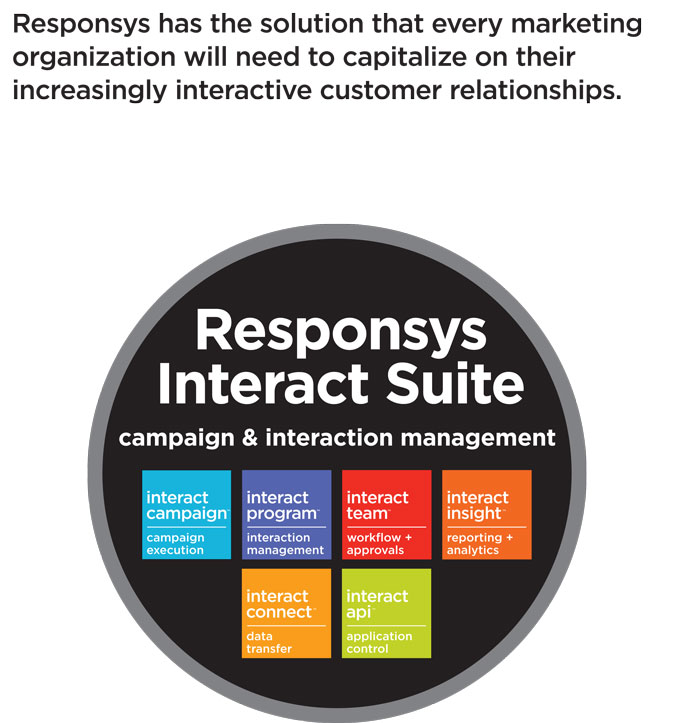
Table of Contents
Neither we, nor the selling stockholders, nor the underwriters have authorized anyone to provide any information or to make any representations other than those contained in this prospectus or in any free writing prospectuses we have prepared. We take no responsibility for, and can provide no assurance as to the reliability of, any other information that others may give you. We and the selling stockholders are offering to sell, and seeking offers to buy, shares of our common stock only in jurisdictions where offers and sales are permitted. The information in this prospectus is accurate only as of the date of this prospectus, regardless of the time of delivery of this prospectus or any sale of shares of our common stock. Our business, financial condition, results of operations and prospects may have changed since that date.
Until , 2011 (25 days after the commencement of this offering), all dealers that buy, sell or trade shares of our common stock, whether or not participating in this offering, may be required to deliver a prospectus. This delivery requirement is in addition to the obligation of dealers to deliver a prospectus when acting as underwriters and with respect to their unsold allotments or subscriptions.
For investors outside the United States: Neither we, nor the selling stockholders, nor the underwriters have done anything that would permit this offering or possession or distribution of this prospectus in any jurisdiction where action for that purpose is required, other than in the United States. Persons outside the United States who come into possession of this prospectus must inform themselves about, and observe any restrictions relating to, the offering of the shares of common stock and the distribution of this prospectus outside of the United States.
Table of Contents
This summary highlights information contained in greater detail elsewhere in this prospectus. This summary is not complete and does not contain all of the information you should consider in making your investment decision. You should read the entire prospectus carefully before making an investment in our common stock. You should carefully consider, among other things, our consolidated financial statements and the related notes and the sections entitled “Risk Factors” and “Management’s Discussion and Analysis of Financial Condition and Results of Operations,” in each case included elsewhere in this prospectus.
RESPONSYS, INC.
Responsys is a leading provider of on-demand software that enables companies to engage in relationship marketing across the interactive channels that consumers are embracing today—email, mobile, social and the web. Our on-demand software, the Responsys Interact Suite, provides marketers with a set of applications to create, execute, optimize and automate marketing campaigns across these key interactive channels. Our solution consists of our on-demand software and professional services, all focused on enabling the marketing success of our customers. We sell our on-demand software and professional services primarily through a direct sales force and target enterprise and larger mid-market companies that seek to implement more advanced marketing programs across interactive channels. For the years ended December 31, 2008, 2009 and 2010, our total revenue was $50.1 million, $66.6 million and $94.1 million, respectively, representing year-over-year growth of 33% and 41% in 2009 and 2010, respectively. As of December 31, 2010, we had 277 customers of varied size across a wide variety of industries, including retail and consumer, travel, financial services and technology.
Marketing is undergoing a significant shift as rapid adoption of digital technology has dramatically changed consumer behavior. Interactive channels, including email, mobile, social and the web, are rapidly supplanting traditional media channels as consumers’ primary source of entertainment and information. This has created both an opportunity and an imperative for companies to market to their customers by engaging them across all of these interactive channels. According to Forrester Research, Inc., or Forrester, U.S. spending on interactive marketing is expected to increase to nearly $55 billion and represent 21% of all marketing spending by 2014, as marketers shift dollars away from traditional media toward interactive channels.(1) According to Forrester, U.S. interactive marketing spend on email, mobile and social media, the primary interactive channels currently used for relationship marketing, is expected to grow from $2.9 billion in 2010 to nearly $6.5 billion by 2014, representing a compound annual growth rate of 22%.(1)
Interactive channels enable marketers to substantially improve the effectiveness of their relationship marketing efforts by executing more relevant and timely campaigns to their customers and known prospects. However, this shift to interactive marketing has also caused the execution of marketing campaigns to become increasingly complex, real-time and dependent on technology. We believe that to capture the opportunity provided by interactive channels, they need a solution built for relationship marketing across those interactive channels. Our Interact Suite is a software-as-a-service, or SaaS, platform that empowers relationship marketers to effectively execute marketing campaigns across the key interactive channels—email, mobile, social and the web.
Our Solution
Our solution consists of our on-demand software, the Responsys Interact Suite, and professional services. The Responsys Interact Suite is comprised of several integrated applications that enable the design, management
| (1) | Source: Forrester, US Interactive Marketing Forecast 2009 to 2014, July 6, 2009, as updated January 11, 2010. |
1
Table of Contents
and automation of tasks and processes for executing email and marketing campaigns across interactive channels, including:
| • | Interact Campaign for marketing campaign creation and execution; |
| • | Interact Program for marketing program design and automation; |
| • | Interact Team for managing marketing workflow and approvals; and |
| • | Interact Insight for marketing reporting and analysis. |
We also offer additional integration components for the Responsys Interact Suite that enable enhanced data and application automation, including:
| • | Interact Connect for enabling customers to use data from other systems to improve the relevance of their marketing campaigns; and |
| • | Interact API for allowing customers to create customized functionality using our application programming interfaces. |
In combination, these applications and components allow marketing teams to create, manage, and automate required tasks and processes for executing email and other marketing campaigns across interactive channels.
We complement our on-demand software with a range of professional services, including strategic, creative, deliverability, campaign and education services, that are designed to drive marketing success for our customers. Our experienced professional services team brings region- and industry-specific methodologies and best practices to help our customers accelerate the implementation and execution of their marketing efforts across interactive channels, or cross-channel marketing, increase their revenue from interactive channels and improve their return on overall marketing spend. Together, our on-demand software and professional services provide the technology and expertise to enable our customers to achieve success in their interactive marketing efforts.
The key benefits of our solution include:
| • | Broad application suite. The Responsys Interact Suite provides marketers with a set of applications for campaign management, automation of marketing programs, workflow management, tools for reporting and analysis, and data integration across the key interactive channels—email, mobile, social and the web. |
| • | Leading email and cross-channel campaign execution. Interact Campaign, the core application in our Interact Suite, is designed to help marketers effectively execute campaigns across email and other interactive channels to consumers who have given them permission to send marketing communications through those channels. Our applications allow marketers to design and deliver personalized content across each channel and track and analyze the results. Forrester named Responsys as a leader in email marketing in The Forrester Wave™: Email Marketing Service Providers, Q4 2009, December 23, 2009. |
| • | Advanced campaign and program automation. To manage the increased volume of communications and growing set of channels, Interact Program gives marketers the ability to design, orchestrate, and automate complex campaigns with multiple stages and across multiple interactive channels with minimal IT resources. We believe our Interact Program application is a key differentiator for us. |
| • | Data model flexibility. Unlike most alternative solutions that often require that a company’s data be transformed into a predefined format, our open relational data model allows our customers to easily use and leverage data from their internal systems and those of third-party providers for improved targeting and automation of marketing campaigns. |
2
Table of Contents
| • | Commitment to the marketing success of our customers. We complement our on-demand software with a range of professional services to help drive marketing success for our customers. Furthermore, to align our success with that of our customers, our account managers work closely with our customers to help them achieve their marketing goals. |
| • | On-demand software model. We deliver our applications and functionality on demand over the internet, with no hardware or software installation required by our customers. In using an on-demand platform, we are able to provide a reliable, cost-effective solution to our customers, and relieve them of the costs and burdens that have often prevented marketers from executing complex, cross-channel marketing campaigns. |
Our Growth Strategy
The key elements of our growth strategy are:
Expand our relationships with existing customers. As our offerings become increasingly integral to our customers’ marketing success, we believe that we gain a variety of opportunities to grow our business with them.
| • | Increasing messaging volumes. We intend to grow messaging volume and increase messaging frequency from our customer base by helping them increase the number of people they can market to, the channels across which they market and the effectiveness of their marketing communications. |
| • | Cross-selling functionality. We intend to cross-sell additional functionality and services to our customers as their marketing programs become more complex and extend from email into additional interactive marketing channels. For example, to date, our customers have primarily used email messages for their interactive marketing campaigns, but we plan to sell them functionality that will allow them to also use additional channels such as mobile, social and the web for their campaigns. |
| • | Expanding deployments with existing customers. We intend to expand the adoption of our solution within existing customers’ organizations, particularly with divisions that have not previously used our platform. |
Expand our customer base. We believe that many organizations are still in the early stages of adopting relationship marketing across interactive channels, which provides us with a significant opportunity to acquire new customers.
| • | Enabling new groups of customers. We believe a significant portion of the market includes companies that either have not previously had a need for technology-based marketing or are currently using less sophisticated applications that were not designed for more advanced email and cross-channel interactive marketing. |
| • | Expanding into adjacent customer segments. While we currently target enterprise and larger mid-market customers, we intend to expand our presence in the mid-market customer segment to target companies that, for example, are likely to send over one million email messages per month. We have added sales and lead generation personnel to target this additional customer segment. |
| • | Expanding international footprint. We intend to increase our presence in international markets through additional investments in sales, marketing and support capabilities, and acquisitions of companies serving additional geographies. These investments will allow us to serve more English-speaking markets in Europe and Asia and to localize our on-demand software for use in other areas. |
3
Table of Contents
Develop new capabilities and channels. We believe there are many additional opportunities for growth beyond our current footprint.
| • | Adding new capabilities and functionality. We intend to develop new capabilities and functionality for the Responsys Interact Suite to enable marketing through channels such as web-based and social media display advertising and drive increased usage. |
| • | Expanding partnerships. We believe we can drive additional efficiency in our business by expanding the breadth of our partner network and driving greater revenue from new indirect sales partnerships. |
Summary Risk Factors
Our business is subject to numerous risks described in the section entitled “Risk Factors” and elsewhere in this prospectus. You should carefully consider these risks before making an investment. Some of these risks include:
| • | we may not maintain profitability in the future; |
| • | the market in which we participate is intensely competitive, and our results could be adversely affected by pricing pressure or other competitive dynamics; |
| • | we may experience quarterly fluctuations in our operating results due to a number of factors which make our future results difficult to predict and could cause our operating results to fall below expectations or our guidance; |
| • | our quarterly results reflect seasonality in the sale of our on-demand software and professional services, which could result in sequential revenue declines; |
| • | because we recognize subscription revenue from our customers over the terms of their agreements, downturns or upturns in sales may not be immediately reflected in our operating results; |
| • | if we are unable to attract new customers or sell additional functionality and services to our existing customers, our revenue growth will be adversely affected; and |
| • | our future growth could be constrained if mobile, social and the web do not become significant relationship marketing channels or if existing customers using our older platform do not want to migrate to our newer platform. |
Corporate Information
We were incorporated in the state of California in 1998. In March 2011 we reincorporated in the state of Delaware and implemented a 1-for-4 reverse split of our outstanding capital stock. Unless expressly indicated or the context requires otherwise, the terms “Responsys,” “company,” “we,” “us” and “our” in this prospectus refer to Responsys, Inc., a Delaware corporation or, as applicable, its predecessor in California and, where appropriate, its wholly-owned subsidiaries. Our principal executive offices are located at 900 Cherry Avenue, 5th Floor, San Bruno, California 94066, and our telephone number is (650) 745-1700. Our website address is www.responsys.com. The information on, or that can be accessed through, our website is not part of this prospectus.
Responsys, the Responsys logo, Responsys Interact, Interact Campaign, Interact Program, Interact Team, Interact Insight, Interact Connect and Interact API are registered or common law trademarks, service marks, or trade names of Responsys, Inc. Other trademarks, service marks, or trade names appearing in this prospectus are the property of their respective owners.
4
Table of Contents
THE OFFERING
| Common stock offered by us |
5,500,000 shares |
| Common stock offered by the selling stockholders |
1,119,654 shares |
| Total common stock offered |
6,619,654 shares |
| Over-allotment option offered by us and the selling stockholders |
992,948 shares (25,000 shares offered by a selling stockholder and the remaining 967,948 offered by us) |
| Common stock to be outstanding after this offering |
44,106,658 shares (45,074,606 shares if the underwriters exercise their over-allotment in full) |
| Use of proceeds |
We intend to use the net proceeds of this offering for general corporate purposes, including working capital and potential acquisitions. We will not receive any of the proceeds from the sale of shares of common stock by the selling stockholders. See “Use of Proceeds.” |
| Risk factors |
You should read the “Risk Factors” section of this prospectus and the other information included in this prospectus for a discussion of factors you should consider carefully before investing in shares of our common stock. |
| Proposed NASDAQ Global Market Symbol |
“MKTG” |
The number of shares of common stock to be outstanding after this offering is based on 38,606,658 shares of our common stock outstanding as of December 31, 2010, and excludes:
| • | 10,937,216 shares of common stock issuable upon the exercise of options outstanding as of December 31, 2010 under our 1999 Stock Plan, with a weighted-average exercise price of approximately $1.55 per share; |
| • | 810,565 shares of common stock reserved for future issuances as of December 31, 2010 under our 1999 Stock Plan (which includes 15,000 shares of common stock issued and 305,125 shares of common stock issuable upon exercise of options granted at an exercise price of $9.25 per share between January 1, 2011 and March 31, 2011); |
| • | 28,302 shares of convertible preferred stock issuable upon exercise of an outstanding warrant as of December 31, 2010 that will convert into a warrant to purchase the same number of shares of common stock upon closing of this offering, with an exercise price of $6.36 per share; |
| • | 148,047 shares of common stock that are issued and outstanding but were subject to a right of repurchase by us as of December 31, 2010; |
| • | 148,648 shares of common stock that were issued on January 3, 2011 in connection with our acquisition of the remaining equity interests in Responsys Pty Ltd (formerly Eservices Group Pty Ltd), or Eservices; and |
5
Table of Contents
| • | 10,000,000 shares of common stock reserved for future issuance under our 2011 Equity Incentive Plan, which will become effective at or prior to the closing of this offering and contains provisions that will automatically increase its share reserve each year, as more fully described in “Management—Employee Benefit Plans.” |
Unless expressly indicated or the context requires otherwise, all information in this prospectus assumes:
| • | the conversion of all outstanding shares of our convertible preferred stock into 30,158,928 shares of common stock in connection with this offering; |
| • | the conversion of an outstanding warrant to purchase shares of our convertible preferred stock into a warrant to purchase an aggregate of 28,302 shares of common stock in connection with this offering; |
| • | no exercise by the underwriters of their right to purchase up to an additional 992,948 shares of common stock to cover over-allotments (which includes 25,000 shares offered by a selling stockholder and the remaining 967,948 offered by us); |
| • | our reincorporation in Delaware and a 1-for-4 reverse split of our outstanding capital stock, which were effected in March 2011; and |
| • | the filing of our restated certificate of incorporation and the effectiveness of our restated bylaws in connection with this offering. |
6
Table of Contents
SUMMARY CONSOLIDATED FINANCIAL DATA
The following table summarizes our consolidated financial data. We have derived the summary consolidated statements of income data for the years ended December 31, 2008, 2009 and 2010 from our audited consolidated financial statements included elsewhere in this prospectus. Our historical results are not necessarily indicative of our results to be expected in any future period. The summary of our consolidated financial data set forth below should be read together with our consolidated financial statements and the related notes, as well as the section entitled “Management’s Discussion and Analysis of Financial Condition and Results of Operations,” appearing elsewhere in this prospectus. In January 2011, we completed our acquisition of the remaining equity interests of Eservices. The audited consolidated financial statements of Eservices for the year ended June 30, 2010, unaudited condensed financial statements of Eservices for the six months ended December 31, 2009 and 2010 and unaudited pro forma condensed combined financial information have been included elsewhere in this prospectus.
| Year Ended December 31, | ||||||||||||
| 2008 | 2009 | 2010 | ||||||||||
| (in thousands, except per share data) | ||||||||||||
| Consolidated Statements of Income Data: |
||||||||||||
| Revenue: |
||||||||||||
| Subscription |
$ | 41,047 | $ | 53,044 | $ | 69,284 | ||||||
| Professional services |
9,067 | 13,599 | 24,787 | |||||||||
| Total revenue |
50,114 | 66,643 | 94,071 | |||||||||
| Cost of revenue:(1) |
||||||||||||
| Subscription |
12,399 | 15,109 | 20,221 | |||||||||
| Professional services |
8,926 | 12,478 | 20,697 | |||||||||
| Total cost of revenue |
21,325 | 27,587 | 40,918 | |||||||||
| Gross profit |
28,789 | 39,056 | 53,153 | |||||||||
| Operating expenses: |
||||||||||||
| Research and development(1) |
5,068 | 8,052 | 10,597 | |||||||||
| Sales and marketing(1) |
15,681 | 15,494 | 20,849 | |||||||||
| General and administrative(1) |
4,639 | 5,746 | 8,225 | |||||||||
| Total operating expenses |
25,388 | 29,292 | 39,671 | |||||||||
| Operating income |
3,401 | 9,764 | 13,482 | |||||||||
| Total other income (expense) |
(811 | ) | 185 | 1,171 | ||||||||
| Income before income taxes |
2,590 | 9,949 | 14,653 | |||||||||
| Benefit (provision) for income taxes |
17,857 | (4,063 | ) | (5,821 | ) | |||||||
| Equity in net loss of unconsolidated affiliates |
— | — | (234 | ) | ||||||||
| Net income |
$ | 20,447 | $ | 5,886 | $ | 8,598 | ||||||
| Net income attributable to common stockholders(2): |
||||||||||||
| Basic |
$ | 2,980 | $ | 186 | $ | 802 | ||||||
| Diluted |
$ | 5,009 | $ | 299 | $ | 1,179 | ||||||
| Net income per share attributable to common stockholders(2): |
||||||||||||
| Basic |
$ | 0.43 | $ | 0.02 | $ | 0.09 | ||||||
| Diluted |
$ | 0.35 | $ | 0.02 | $ | 0.08 | ||||||
| Shares used in computation of net income per share attributable to common stockholders(2): |
||||||||||||
| Basic |
7,007 | 7,518 | 8,527 | |||||||||
| Diluted |
14,408 | 14,302 | 14,464 | |||||||||
7
Table of Contents
| Year Ended December 31, | ||||||||||||
| 2008 | 2009 | 2010 | ||||||||||
| (in thousands, except per share data) | ||||||||||||
| Pro forma net income per share attributable to common stockholders (unaudited)(2)(6): |
||||||||||||
| Basic |
$ | 0.22 | ||||||||||
| Diluted |
$ | 0.19 | ||||||||||
| Pro forma weighted-average shares outstanding used in calculating net income per share attributable to common stockholders (unaudited)(2)(6): |
||||||||||||
| Basic |
38,686 | |||||||||||
| Diluted |
44,623 | |||||||||||
| As of December 31, 2010 | ||||||||||||
| Actual | Pro Forma(3)(5) | Pro Forma As Adjusted(4)(5) |
||||||||||
| (in thousands) | ||||||||||||
| Consolidated Balance Sheet Data: |
||||||||||||
| Cash and cash equivalents(7) |
$ | 13,884 | $ | 13,884 | $ | 59,372 | ||||||
| Working capital |
27,047 | 27,047 | 72,535 | |||||||||
| Total assets |
71,900 | 71,900 | 117,388 | |||||||||
| Total liabilities |
18,725 | 18,725 | 18,725 | |||||||||
| Total stockholders’ equity |
53,175 | 53,175 | 98,663 | |||||||||
| (1) | Total cost of revenue and operating expenses include stock-based compensation expense as follows: |
| Year Ended December 31, | ||||||||||||
| 2008 | 2009 | 2010 | ||||||||||
| (in thousands) | ||||||||||||
| Total cost of revenue |
$ | 308 | $ | 332 | $ | 523 | ||||||
| Research and development |
264 | 280 | 331 | |||||||||
| Sales and marketing |
400 | 461 | 694 | |||||||||
| General and administrative |
478 | 563 | 958 | |||||||||
| (2) | See note 2 of the notes to our consolidated financial statements for a description of how we compute basic and diluted net income attributable to common stockholders and net income per share attributable to common stockholders and pro forma basic and diluted net income per share attributable to common stockholders. |
| (3) | The pro forma balance sheet as of December 31, 2010 reflects the automatic conversion of all of our convertible preferred stock outstanding into shares of common stock in connection with this offering. |
| (4) | The pro forma as adjusted balance sheet data reflects the items described in footnote (3) above and our receipt of estimated net proceeds from the sale of shares of common stock that we are offering at an assumed initial public offering price of $9.25 per share, which is the midpoint of the range listed on the cover page of this prospectus, after deducting the estimated underwriting discounts and commissions and estimated offering expenses payable by us. A $1.00 increase (decrease) in the assumed initial public offering price of $9.25 per share would increase (decrease) each of cash and cash equivalents, working capital, total assets and total stockholders’ equity by $5.1 million, assuming that the number of shares offered by us, as set forth on the cover page of this prospectus, remains the same, and after deducting the estimated underwriting discounts and commissions and estimated offering expenses payable by us. |
| (5) | The pro forma and pro forma as adjusted information discussed above is illustrative only and following the closing of this offering will be adjusted based on the actual public offering price and other terms of this offering determined at pricing. |
| (6) | The pro forma basic and diluted weighted-average shares outstanding in calculating net income per share attributable to common stockholders does not include 148,648 shares of common stock that were issued on January 3, 2011 in connection with our acquisition of the remaining equity interest in Eservices and 15,000 shares of common stock that were issued on March 11, 2011 under our 1999 Stock Plan. |
| (7) | Cash and cash equivalents does not reflect the use of $7.1 million of cash to acquire the remaining equity interests in Eservices in January 2011. |
8
Table of Contents
Investing in our common stock involves a high degree of risk. You should consider carefully the risks and uncertainties described below, together with all of the other information in this prospectus, including the consolidated financial statements and the related notes appearing at the end of this prospectus, before deciding to invest in shares of our common stock. The risks and uncertainties described below are not the only ones we face. Additional risks and uncertainties that we are unaware of, or that we currently believe are not material, also may become important factors that impair us. If any of the following risks actually occurs, our business, financial condition, results of operations and future prospects could be materially and adversely affected. In that event, the market price of our common stock could decline, and you could lose part or even all of your investment.
Risks Related to Our Business and Industry
We may not maintain profitability in the future.
Although we have been profitable in recent periods, as of December 31, 2010, our accumulated deficit was $22.8 million due to historical net losses. We expect to make significant future expenditures related to the development and expansion of our business which will reduce profitability compared to past periods. In addition, as a public company, we will incur significant accounting, legal and other expenses that we did not incur as a private company. As a result of these increased expenditures, we will have to generate and sustain increased revenue to maintain future profitability. While our revenue has grown in recent periods, this growth may not be sustainable, and we may not achieve sufficient revenue to maintain profitability. You should not consider our revenue growth in recent periods as indicative of our future performance. In future periods, our revenue could decline or grow more slowly than we expect. We also may incur significant losses in the future for a number of reasons, including due to the other risks described in this prospectus, and we may encounter unforeseen expenses, difficulties, complications, delays and other unknown factors. Accordingly, we may not be able to maintain profitability, and we may incur losses in the future.
The market in which we participate is intensely competitive, and our results could be adversely affected by pricing pressure or other competitive dynamics.
The market for interactive marketing solutions is highly fragmented, highly competitive and rapidly changing. With the introduction of new technologies and the influx of new entrants to the market, we expect competition to persist and intensify in the future, which could harm our ability to increase sales and maintain our prices. We face intense competition from software companies that develop marketing technologies and from marketing services companies that provide interactive marketing services. Our primary competitors include: technology providers such as Aprimo, Inc., which has been acquired by Teradata Corporation, BlueHornet, a subsidiary of Digital River, Inc., Eloqua Corporation, ExactTarget, Inc., Silverpop Systems Inc., StrongMail Systems, Inc. and Unica Corporation, which has been acquired by International Business Machines Corporation, or IBM; and marketing services providers such as Acxiom Digital, Epsilon Data Management LLC, Experian CheetahMail and Yesmail, a division of infoGROUP Inc.
We may also face competition from new companies entering our market, which may include large established businesses, such as Google Inc., IBM, Microsoft Corporation, Oracle Corporation, salesforce.com, inc., SAP AG or Yahoo! Inc., each of which currently offers, or may in the future offer, email marketing or related applications such as applications for customer relationship management, analysis of internet data and marketing automation. If these companies decide to develop, market or resell competitive interactive marketing products or services, acquire one of our existing competitors or form a strategic alliance with one of our competitors, our ability to compete effectively could be significantly compromised and our operating results could be harmed. We may also experience competition from the in-house information technology capabilities of current and prospective customers.
9
Table of Contents
Our current and potential competitors may have significantly more financial, technical, marketing and other resources than we have, be able to devote greater resources to the development, promotion, sale and support of their products and services, have more extensive customer bases and broader customer relationships than we have, and may have longer operating histories and greater name recognition than we have. As a result, these competitors may be better able to respond quickly to new technologies and to undertake more extensive marketing campaigns. In some cases, these vendors may also be able to offer interactive marketing applications at little or no additional cost by bundling them with their existing applications. If we are unable to compete with such companies, the demand for our on-demand software could substantially decline.
We may experience quarterly fluctuations in our operating results due to a number of factors which make our future results difficult to predict and could cause our operating results to fall below expectations or our guidance.
Our quarterly operating results may fluctuate due to a variety of factors, many of which are outside of our control. As a result, comparing our operating results on a period-to-period basis may not be meaningful. You should not rely on our past results as indicative of our future performance. If our revenue or operating results fall below the expectations of investors or securities analysts, or below any guidance we may provide to the market, the price of our common stock could decline substantially.
Our operating results have varied in the past. In addition to other risk factors listed in this section, factors that may affect our quarterly operating results include the following:
| • | demand for our software and related services and the size and timing of sales; |
| • | the volume of email messages sent above contracted levels for a particular quarter and the amount of any associated additional charges; |
| • | customer renewal rates, and the pricing and volume commitments at which agreements are renewed; |
| • | customers delaying purchasing decisions in anticipation of new products or product enhancements by us or our competitors; |
| • | market acceptance of our current and future products and services; |
| • | changes in spending on interactive marketing or information technology and software by our current and/or prospective customers; |
| • | budgeting cycles of our customers; |
| • | changes in the competitive dynamics of our industry, including consolidation among competitors or customers; |
| • | our lengthy sales cycle; |
| • | lengthy or delayed implementation times for new customers or customers that upgrade to our current platform; |
| • | the timing of recognizing revenue in any given quarter as a result of revenue recognition rules; |
| • | the amount of services sold and the amount of fixed fee services, which can affect gross margin; |
| • | our ability to control costs, including our operating expenses; |
| • | the amount and timing of operating expenses, particularly sales and marketing, related to the maintenance and expansion of our business, operations and infrastructure; |
| • | network outages or security breaches and any associated expenses; |
| • | foreign currency exchange rate fluctuations; |
| • | write-downs, impairment charges or incurrence of unforeseen liabilities in connection with acquisitions; |
10
Table of Contents
| • | failure to successfully manage any acquisitions; and |
| • | general economic and political conditions in our domestic and international markets. |
Based upon all of the factors described above, we have a limited ability to forecast the amount and mix of future revenue and expenses, and as a result, our operating results may from time to time fall below our estimates or the expectations of public market analysts and investors.
Our quarterly results reflect seasonality in the sale of our on-demand software and professional services, which can make it difficult to achieve sequential revenue growth or could result in sequential revenue declines.
We have historically experienced higher levels of revenue and gross profit during the fourth quarter, primarily due to our customers’ increased marketing activity during the holiday shopping season, as compared to the preceding and subsequent quarters, and we anticipate that this trend will continue for the first three quarters of 2011. Since the majority of our expenses is personnel-related and includes salaries, stock-based compensation, benefits and incentive-based compensation plan expenses, we have not experienced significant seasonal fluctuations in the timing of our expenses from period to period. Although these seasonal factors can be common in the marketing sector, historical patterns should not be considered indicative of our future sales activity or performance.
Because we recognize subscription revenue from our customers over the term of their agreements, downturns or upturns in sales may not be immediately reflected in our operating results.
We recognize subscription revenue over the term of our customer agreements, which are typically one year, with some up to three years. As a result, most of our quarterly subscription revenue results from agreements entered into during previous quarters. Consequently, a shortfall in demand for our on-demand software and related services in any quarter may not significantly reduce our subscription revenue for that quarter, but could negatively affect subscription revenue in future quarters. We may be unable to adjust our cost structure to compensate for this potential shortfall in subscription revenue. Accordingly, the effect of significant downturns in sales of subscriptions to our on-demand software and related services may not be fully reflected in our results of operations until future periods. Our subscription model also makes it difficult for us to rapidly increase our subscription revenue through additional sales in any period, as subscription revenue from new customers must be recognized over the applicable subscription terms.
If we are unable to attract new customers or sell additional functionality and services to our existing customers, our revenue growth will be adversely affected.
To increase our revenue, we must add new customers, sell additional functionality to existing customers and encourage existing customers to renew their subscriptions on favorable terms. As the interactive marketing industry matures, as interactive channels develop further, or as competitors introduce lower cost and/or differentiated products or services that are perceived to compete with ours, our ability to compete with respect to pricing, technology and functionality could be impaired. In such event, we may be unable to renew our agreements with existing customers or attract new customers or new business from existing customers on terms that would be favorable or comparable to prior periods, which could have a material adverse effect on our revenue, gross margin and other operating results.
Our future growth could be constrained if mobile, social and the web do not become significant relationship marketing channels or if existing customers do not want to migrate to our newer platform.
The growth of our business depends in part on the acceptance and growth of mobile, social and the web as relationship marketing channels. While email has been used successfully for relationship marketing, relationship marketing via mobile, social and the web is just emerging. We released our mobile and social offerings on our
11
Table of Contents
newer platform in April 2010 and competitive solutions will continue to emerge. Even if mobile, social and the web become widely adopted relationship marketing channels, we cannot assure you that our mobile and social offerings will gain traction with current or new customers. The majority of our current customers became customers before we released our newer platform in late 2009 and would be required to migrate to our newer platform in order to execute fully integrated campaigns across mobile, social and web channels. These customers may not desire to expend the time and resources that would be required to effect this migration.
The market for interactive marketing software is at an early stage of development, and if it does not develop or develops more slowly than we expect, our business will be harmed.
It is uncertain whether businesses will make significant investments in interactive marketing software, and if they do, whether they will purchase subscriptions to on-demand software for this function. The market for on-demand software, in general, and for interactive marketing software, in particular, is relatively new, and it is uncertain whether such software will achieve and sustain high levels of demand and market acceptance. Our success will substantially depend on the willingness of enterprises to increase their use of on-demand software in general, and for marketing in particular. Many enterprises have invested substantial personnel and financial resources to integrate traditional on-premise enterprise software into their businesses and therefore may be reluctant or unwilling to migrate to on-demand software. Furthermore, some enterprises may be reluctant or unwilling to use on-demand software because they have concerns regarding the security and other risks associated with the technology delivery model. If enterprises do not perceive the overall benefits of on-demand software, then the market may develop more slowly than we expect, either of which would significantly and adversely affect our operating results. Accordingly, we cannot assure you that an on-demand model for interactive marketing software will achieve and sustain the high level of market acceptance that is critical for the success of our business
Our growth depends largely on our ability to sell our on-demand software and related services to new enterprise customers, which makes our sales cycle unpredictable, time-consuming and expensive.
The enterprise customers we target typically undertake a significant evaluation process in regard to purchases of enterprise software, which can last from several months to a year or longer. Events may occur during the sales cycle that could affect the size or timing of a purchase, and this may lead to more unpredictability in our business and operating results. We may spend substantial time, effort and money on our sales efforts without any assurance that our efforts will produce any sales.
In addition, we may face unexpected implementation challenges with some enterprise customers or more complicated implementations of our on-demand software. It may be difficult or expensive to implement our on-demand software if the customer has unexpected data, hardware or software technology issues, or complex or unanticipated business requirements. Any difficulties or delays in the initial implementation could cause customers to reject our on-demand software or delay or cancel future purchases, in which case our business, operating results and financial condition would be harmed. In addition, implementation delays may also require us to delay revenue recognition until the technical or implementation requirements have been met.
The forecasts of market growth included in this prospectus may prove to be inaccurate, and even if the markets in which we compete achieve the forecasted growth, we cannot assure you our business will grow at similar rates, or at all.
Growth forecasts are subject to significant uncertainty and are based on assumptions and estimates which may not prove to be accurate. Forecasts relating to anticipated spending on the channels used for relationship marketing may prove to be inaccurate. Even if the forecasted growth occurs, we may not grow our business at a similar rate, or at all. Our growth is subject to many factors, including our success in implementing our business strategy, which is subject to many risks and uncertainties. Accordingly, the forecasts included in this prospectus should not be taken as indicative of our future growth.
12
Table of Contents
We derive a significant percentage of our total revenue from the retail and consumer, travel, financial services and technology industries, and any downturn in these industries could harm our business.
A significant number of our customers are concentrated in the retail and consumer, travel, financial services and technology industries. In particular, we derived approximately half of our revenue from the retail and consumer industry for the year ended December 31, 2010. A substantial downturn in these industries may cause our customers to reduce their spending on information technology or interactive marketing. Customers in these industries may delay or cancel information technology or interactive marketing projects, seek to lower their costs by renegotiating vendor contracts, or decrease their usage of our services. Moreover, competitors may respond to market conditions by lowering prices and attempting to lure away our customers. In addition, the increased pace of consolidation in certain industries may result in reduced overall spending on our services.
A limited number of customers account for a significant portion of our revenue, and the loss of a major customer or group of customers could harm our operating results.
Our 20 largest customers accounted for approximately 35.1% and 37.0% of our total revenue for the years ended December 31, 2009 and 2010, respectively. We cannot be certain that customers that have accounted for significant revenue in past periods, individually or as a group, will renew, will not cancel or will not reduce their usage of our services and, therefore, continue to generate revenue in any future period. If we lose a major customer or group of customers, our revenue could decline.
Prolonged economic uncertainties or downturns could materially harm our business.
General worldwide economic conditions have experienced a significant downturn. These conditions make it extremely difficult for our customers and us to accurately forecast and plan future business activities, and they could cause our customers to slow spending on our on-demand software and professional services, which would delay and lengthen sales cycles, or stop purchasing altogether. Furthermore, during challenging economic times our customers may face issues in gaining timely access to sufficient credit, which could result in an impairment of their ability to make timely payments to us. If that were to occur, we may be required to increase our allowance for doubtful accounts and our financial results would be harmed.
We cannot predict the timing, strength or duration of any economic slowdown or recovery. If the condition of the general economy or markets in which we operate worsens from present levels, our business could be harmed. In addition, even if the overall economy improves, we cannot assure you that the market for interactive marketing software and professional services will experience growth or that we will experience growth.
We have been dependent on the use of email as a means for interactive marketing, and any decrease in the use of email for this purpose would harm our business.
Historically, our customers have primarily used our on-demand software for their email-based interactive marketing campaigns targeted at consumers who have given our customers permission to send them emails. We expect that email will continue to be the primary channel used by our customers for the foreseeable future. Government regulations and evolving practices regarding the use of email for marketing purposes could adversely affect the use of this channel for interactive marketing. Consumers’ use of email also depends on the ability of internet service providers, or ISPs, to prevent unsolicited bulk email, or “spam,” from overwhelming consumers’ inboxes. ISPs continually develop new technologies to filter messages deemed to be unwanted before they reach users’ inboxes, which may interfere with our customers’ marketing campaigns. If security problems become widespread, or if ISPs cannot effectively control spam, the use of email as a means of marketing communications may decline. Any decrease in the use of email would reduce demand for our email marketing services and harm our business.
13
Table of Contents
If our security measures are breached, our platform may be perceived as not being secure, customers may curtail or stop using our on-demand software, and we may incur significant liabilities.
Security breaches could expose us to a risk of loss or unauthorized disclosure of customer information, litigation, indemnity obligations and other liability. If our security measures are breached as a result of third-party action, employee error, malfeasance or otherwise, and, as a result, someone obtains unauthorized access to our system or customer information, our reputation will be damaged, our business may suffer and we could incur significant liability. Because techniques used to obtain unauthorized access or to sabotage systems change frequently and generally are not recognized until launched against a target, we may be unable to anticipate these techniques or to implement adequate preventative measures. If an actual or perceived breach of our security occurs, the market perception of the effectiveness of our security measures could be harmed and we could lose potential sales and existing customers.
Failure to effectively expand our sales and marketing capabilities could harm our ability to increase our customer base and achieve broader market acceptance of our on-demand software.
Increasing our customer base and achieving broader market acceptance of our on-demand software will depend to a significant extent on our ability to expand our sales and marketing operations and activities. We expect to be substantially dependent on our direct sales force to obtain new customers. We plan to continue to expand our direct sales force both domestically and internationally. We believe that there is significant competition for direct sales personnel with the sales skills and technical knowledge that we require. Our ability to achieve significant growth in revenue in the future will depend, in large part, on our success in recruiting, training and retaining sufficient numbers of direct sales personnel. New hires require significant training and time before they achieve full productivity. Our recent hires and planned hires may not become as productive as quickly as we would like, and we may be unable to hire or retain sufficient numbers of qualified individuals in the future in the markets where we do business. Our business will be seriously harmed if these expansion efforts do not generate a corresponding significant increase in revenue.
We may use third parties to grow our business. If we are unable to maintain successful relationships with them, our business could be harmed.
In addition to our direct sales force, we use third parties such as advertising agencies to help promote our on-demand software. Although we do not currently derive a significant amount of revenue through third parties, we may in the future seek to expand sales of subscriptions to our on-demand software through these and other indirect sales channels.
These third parties may offer customers the solutions of several different companies, including solutions that compete with ours. We also expect that these third parties will not have an exclusive relationship with us. Thus, we will not be certain that they will prioritize or provide adequate resources for selling our solution. In addition, establishing and retaining qualified third parties and training them in our on-demand software and services require significant time and resources. If we are unable to maintain successful relationships with any of these third parties, our business could be harmed.
We rely on third-party hardware, software and infrastructure that may be difficult to replace or which could cause errors or failures of our service.
We rely on hardware and infrastructure purchased or leased and software licensed from third parties in order to offer our on-demand software and related services. For example, we rely on third-party providers to support and provide our mobile messaging offerings. This hardware, software and infrastructure may not continue to be available on commercially reasonable terms, or at all. Any loss of the right to use any of this hardware, software or infrastructure could result in delays in the provisioning of affected components of our on-demand software until equivalent technology is either developed by us, or, if available, is identified, obtained and integrated,
14
Table of Contents
which could harm our business. Furthermore, any errors or defects in third-party hardware, software or infrastructure could result in errors or a failure of our service which could harm our business.
If we are unable to integrate our on-demand software with certain third-party applications, the functionality of our software could be adversely affected.
The functionality of our on-demand software depends, in part, on our ability to integrate it with third-party applications and data management systems that our customers use and from which they obtain consumer data. In addition, we rely on access to third-party application programming interfaces, or APIs, to provide our social media channel offerings through social media platforms, which currently consist of Facebook and Twitter. Third-party providers of marketing applications and APIs may change the features of their applications and platforms, restrict our access to their applications and platforms or alter the terms governing use of their applications and APIs and access to those applications and platforms in an adverse manner. Such changes could functionally or financially limit or terminate our ability to use these third-party applications and platforms with our on-demand software, which could negatively impact our offerings and harm our business. Further, if we fail to integrate our software with new third-party applications and platforms that our customers use for marketing purposes, or to adapt to the data transfer requirements of such third-party applications and platforms, we may not be able to offer the functionality that our customers need, which would negatively impact our offerings and, as a result, harm our business.
Interruptions or delays in service from third-party data center hosting facilities and other third parties could impair the delivery of our service and harm our business.
We currently serve our customers from third-party data center hosting facilities located in Northern California and the United Kingdom. We also rely on bandwidth providers, ISPs and mobile networks to deliver messages to the customers of our customers. Any damage to, or failure of, the systems of our third-party providers could result in interruptions to our service. If for any reason our arrangement with one or more of our data centers is terminated we could experience additional expense in arranging for new facilities and support. In addition, the failure of our data centers to meet our capacity requirements could result in interruptions in the availability of our on-demand software, impair the functionality of our on-demand software or impede our ability to scale our operation. As we continue to add data centers, restructure our data management plans, and increase capacity in existing and future data centers, we may move or transfer our data and our customers’ data. For example, in 2011 we plan to wind down our use of the hosting facility in the United Kingdom. Despite precautions taken during such processes and procedures, any unsuccessful data transfers may impair the delivery of our service, and we may experience costs or downtime in connection with the transfer of data to other facilities. Interruptions in the availability of, or impaired functionality of, our on-demand software may reduce our revenue, cause us to issue credits, make refunds or pay penalties, harm our reputation, cause customers to terminate their subscriptions, and adversely affect our renewal rates and our ability to attract new customers. Our business will also be harmed if our customers and potential customers believe our service is unreliable.
Despite precautions taken at our data centers, the occurrence of a natural disaster, an act of terrorism, vandalism or sabotage, a decision to close the facilities without adequate notice, or other unanticipated problems at these facilities could result in lengthy interruptions in the availability of our on-demand software. Even with current and planned disaster recovery arrangements, our business could be harmed.
As a result of our customers’ increased usage of our on-demand software, we will need to continually improve our computer network and infrastructure to avoid service interruptions or slower system performance.
As usage of our on-demand software grows and as customers use it for more complicated tasks, we will need to devote additional resources to improving our computer network, our application architecture and our infrastructure in order to maintain the performance of our platform. In addition, we typically experience
15
Table of Contents
increased system usage during the fourth quarter, with customers increasing their marketing activity for the holiday shopping season. Any failure or delays in our computer systems could cause service interruptions or slower system performance. If sustained or repeated, these performance issues could reduce the attractiveness of our platform to customers. This could result in lost customer opportunities and lower renewal rates, any of which could hurt our revenue growth, customer loyalty and our reputation. We may need to incur additional costs to upgrade or expand our computer systems and architecture in order to accommodate increased demand if our systems cannot handle current or higher volumes of usage.
Material defects or errors in the on-demand software we use to deliver our platform could harm our reputation, result in significant costs to us and impair our ability to sell our software.
The software applications underlying our platform are inherently complex and may contain material defects or errors, which may cause disruptions in availability or other performance problems. Any such errors, defects, disruptions in service or other performance problems with our platform, whether in connection with the day-to-day operation, upgrades or otherwise, could damage our customers’ businesses and cause harm to our reputation. If we have any errors, defects, disruptions in service or other performance problems with our software, customers could elect not to renew, or delay or withhold payment to us, we could lose future sales or customers may make warranty claims against us, which could result in an increase in our provision for doubtful accounts, an increase in the length of collection cycles for accounts receivable or costly litigation.
The costs incurred in correcting any material defects or errors in our software may be substantial and could adversely affect our operating results. After the release of our software, defects or errors may also be identified from time to time by our internal team and by our customers. We implement bug fixes and upgrades as part of our regularly scheduled system maintenance. If we do not complete this maintenance according to schedule or if customers are otherwise dissatisfied with the frequency and/or duration of our maintenance services and related system outages, customers could elect not to renew, or delay or withhold payment to us, or cause us to issue credits, make refunds or pay penalties.
Existing federal, state and foreign laws regulating email and text messaging marketing practices impose certain obligations on the senders of commercial emails and text messages, which could minimize the effectiveness of our on-demand software or increase our operating expenses to the extent financial penalties are triggered.
The Controlling the Assault of Non-Solicited Pornography and Marketing Act of 2003, or the CAN-SPAM Act, establishes certain requirements for commercial email messages and specifies penalties for the transmission of commercial email messages that are intended to deceive the recipient as to source or content. The CAN-SPAM Act, among other things, obligates the sender of commercial emails to provide recipients with the ability to opt out of receiving future emails from the sender. In addition, some states have passed laws regulating commercial email practices that are, in some cases, significantly more punitive and difficult to comply with than the CAN-SPAM Act. Utah and Michigan, for example, have enacted do-not-email registries to protect minors from receiving unsolicited commercial email that markets certain covered content, such as adult or other products the minor cannot legally obtain. It is not settled whether all or a portion of such state laws may be preempted by the CAN-SPAM Act. In addition, certain foreign jurisdictions, such as Australia, Canada and the European Union, have enacted laws that regulate sending email, and some of these laws are more restrictive than U.S. laws. For example, some foreign laws prohibit sending unsolicited email unless the recipient has provided the sender advance consent to receipt of such email, or in other words has “opted-in” to receiving it. A requirement that recipients opt into, or the ability of recipients to opt out of, receiving commercial emails may minimize the effectiveness of our on-demand software. In addition, the CAN-SPAM Act and regulations implemented by the Federal Communications Commission pursuant to the CAN-SPAM Act, and the Telephone Consumer Protection Act, also known as the Federal Do-Not-Call law, among other requirements, prohibit companies from sending specified types of commercial text messages unless the recipient has given his or her prior express consent. Non-compliance with these laws and regulations carries significant financial penalties. If we were to be found in
16
Table of Contents
violation of federal law, applicable state laws not preempted by the CAN-SPAM Act, or foreign laws regulating the distribution of commercial email or text messages, whether as a result of violations by our customers or any determination that we are directly subject to and in violation of these requirements, we could be required to pay penalties, which would adversely affect our financial performance and significantly harm our reputation and our business.
In addition, U.S., state or foreign jurisdictions may in the future enact legislation or laws restricting the ability to conduct interactive marketing activities in mobile, social and web channels. Any such restrictions could require us to change one or more aspects of the way we operate our business, which could impair our ability to attract and retain customers or increase our operating costs or otherwise harm our business.
The standards that private entities use to regulate the use of email have in the past interfered with, and may in the future interfere with, the effectiveness of our on-demand software and our ability to conduct business.
Our customers rely on email to communicate with their customers. Various private entities attempt to regulate the use of email for commercial solicitation. These entities often advocate standards of conduct or practice that significantly exceed current legal requirements and classify certain email solicitations that comply with current legal requirements as spam. Some of these entities maintain “blacklists” of companies and individuals, and the websites, ISPs and internet protocol addresses associated with those entities or individuals that do not adhere to those standards of conduct or practices for commercial email solicitations that the blacklisting entity believes are appropriate. If a company’s internet protocol addresses are listed by a blacklisting entity, emails sent from those addresses may be blocked if they are sent to any internet domain or internet address that subscribes to the blacklisting entity’s service or purchases its blacklist.
From time to time, some of our internet protocol addresses may become listed with one or more blacklisting entities due to the messaging practices of our customers. There can be no guarantee that we will be able to successfully remove ourselves from those lists. Blacklisting of this type could interfere with our ability to market our on-demand software and services and communicate with our customers and, because we fulfill email delivery on behalf of our customers, could undermine the effectiveness of our customers’ email marketing campaigns, all of which could have a material negative impact on our business and results of operations.
Evolving regulations concerning data privacy may restrict our customers’ ability to solicit, collect, process, disclose and use data necessary to conduct effective marketing campaigns and analyze the results or may increase their costs, which could harm our business.
Federal, state and foreign governments have enacted, and may in the future enact, laws and regulations concerning the solicitation, collection, processing, disclosure or use of consumers’ personal information. Such laws and regulations may require companies to implement privacy and security policies, permit users to access, correct and delete personal information stored or maintained by such companies, inform individuals of security breaches that affect their personal information, and, in some cases, obtain individuals’ consent to use personal information for certain purposes. Other proposed legislation could, if enacted, impose additional requirements and prohibit the use of certain technologies that track individuals’ activities on web pages or that record when individuals click through to an internet address contained in an email message. Such laws and regulations could restrict our customers’ ability to collect and use email addresses, page viewing data, and personal information, which may reduce demand for our solution.
Our applications collect, store and report personal information, which raises privacy concerns and could result in liability to us or inhibit sales of subscriptions to our on-demand software.
Many federal, state and foreign government bodies and agencies have adopted or are considering adopting laws and regulations regarding the collection, use and disclosure of personal information. Because many of the
17
Table of Contents
features of our applications use, store and report on personal information from our customers, any inability to adequately address privacy concerns, even if unfounded, or comply with applicable privacy laws, regulations and policies, could result in liability to us, damage our reputation, inhibit sales and harm our business. Furthermore, the costs of compliance with, and other burdens imposed by, such laws, regulations and policies that are applicable to the businesses of our customers may limit the use and adoption of our on-demand software and reduce overall demand for it. Privacy concerns, whether or not valid, may inhibit market adoption of our on-demand software.
If our on-demand software is perceived to cause or is otherwise unfavorably associated with invasions of privacy, whether or not illegal, it may subject us or our customers to public criticism. Existing and potential future privacy laws and increasing sensitivity of consumers to unauthorized disclosures and use of personal information may create negative public reactions related to interactive marketing, including marketing practices of our customers. Public concerns regarding data collection, privacy and security may cause some of our customers’ customers to be less likely to visit their websites or otherwise interact with them. If enough consumers choose not to visit our customers’ websites or otherwise interact with them, our customers could stop using our on-demand software. This, in turn, would reduce the value of our service and inhibit or reverse the growth of our business.
Any decrease in opt in rates or usage habits could reduce the demand for our on-demand software.
It is our policy that our customers may only use our on-demand software to provide marketing content to recipients that have elected to receive marketing communications from them through specified interactive channels such as email, mobile and social. If recipients decrease their overall opt in rates for these marketing communications or reduce the extent to which they use, or otherwise cease use of, the channels over which these marketing communications are sent, our customers will have a smaller or less addressable group of potential customers to target and they may decide it is not cost effective for them to continue to use our on-demand software. Accordingly, if opt in rates decline for any reason, including privacy concerns, negative publicity or changes in laws or regulations, or consumer usage of certain interactive marketing channels declines, demand for our on-demand software could decline and our business could be harmed.
Our customers’ violation of our policies and misuse of our on-demand software to transmit negative messages or website links to harmful applications or engage in illegal activity could damage our reputation, and we may face liability for unauthorized, inaccurate or fraudulent information distributed via, or illegal activity conducted using, our on-demand software.
We rely on representations made to us by our customers that their use of our on-demand software will comply with our policies and applicable law. We do not audit our customers to confirm compliance with these representations. Our customers could use our on-demand software to engage in bad acts including transmitting negative messages or website links to harmful applications, sending unsolicited commercial email and reproducing and distributing copyrighted material without permission, reporting inaccurate or fraudulent data or engaging in illegal activity. Any such use of our on-demand software could damage our reputation and we could face claims for damages, copyright or trademark infringement, defamation, negligence or fraud. Moreover, our customers’ promotion of their products and services through our on-demand software may not comply with federal, state and foreign laws. We cannot predict whether our role in facilitating these activities would expose us to liability under these laws or subject us to other regulatory action.
Even if claims asserted against us do not result in liability, we may incur substantial costs in investigating and defending such claims. If we are found liable for our customers’ activities, we could be required to pay fines or penalties, redesign our on-demand software or otherwise expend resources to remedy any damages caused by such actions and to avoid future liability.
18
Table of Contents
As internet commerce develops, federal, state and foreign governments may propose and implement new taxes and new laws to regulate internet commerce, which may negatively affect our business.
As internet commerce continues to evolve, increasing regulation by federal, state or foreign governments becomes more likely. Our business could be negatively impacted by the application of existing laws and regulations or the enactment of new laws applicable to interactive marketing. The cost to comply with such laws or regulations could be significant and would increase our operating expenses, and we may be unable to pass along those costs to our customers in the form of increased subscription fees. In addition, federal, state and foreign governmental or regulatory agencies may decide to impose taxes on services provided over the internet or via email. Such taxes could discourage the use of the internet and email as a means of commercial marketing, which would adversely affect the viability of our on-demand software.
Our operating results may be harmed if we are required to collect sales taxes for our subscription services in jurisdictions where we have not historically done so or if our accruals for sales taxes are insufficient.
States and some local taxing jurisdictions have differing rules and regulations governing sales and use taxes, and these rules and regulations are subject to varying interpretations that may change over time. In particular, the applicability of sales taxes to our subscription services in various jurisdictions is unclear. We have recorded sales tax liabilities of $0.4 million as of December 31, 2010 in respect of sales and use tax liabilities in various states and local jurisdictions. It is possible that we could face sales tax audits and that our liability for these taxes could exceed our estimates as state tax authorities could still assert that we are obligated to collect additional amounts as taxes from our customers and remit those taxes to those authorities. We could also be subject to audits with respect to states and international jurisdictions for which we have not accrued tax liabilities. A successful assertion that we should be collecting additional sales or other taxes on our services in jurisdictions where we have not historically done so and do not accrue for sales taxes could result in substantial tax liabilities for past sales, discourage customers from purchasing our application or otherwise harm our business and operating results.
We have limited experience with non-volume based pricing models, which we use for some of our newer offerings. If we incorrectly structure these pricing models or are unable to price our offerings in a manner acceptable by our customers, our revenue and operating results may be harmed.
We currently utilize volume-based pricing models for our email and mobile messaging offerings. We have limited experience with non-volume based pricing models for our newer offerings such as our social offering. If our customers, which have historically used our offerings primarily for their email-based interactive marketing campaigns, do not accept the other pricing models that we utilize for certain of our newer offerings and may utilize for future offerings, our ability to sell additional functionality on a cost-effective and competitive basis may be hindered, and our revenue and operating results may be adversely affected.
If we fail to develop or protect our brand cost-effectively, our business may be harmed.
We believe that developing and maintaining awareness and integrity of our brand in a cost-effective manner are important to achieving widespread acceptance of our existing and future offerings and are important elements in attracting new customers. We believe that the importance of brand recognition will increase as competition in our market further intensifies. Successful promotion of our brand will depend on the effectiveness of our marketing efforts and on our ability to provide reliable and useful products and services at competitive prices. Brand promotion activities may not yield increased revenue, and even if they do, the increased revenue may not offset the expenses we incur in building our brand. If we fail to promote and maintain our brand successfully or to maintain loyalty among our customers, or if we incur substantial expenses in an unsuccessful attempt to promote and maintain our brand, we may fail to attract new customers or to retain our existing customers and our business may be harmed. We have registered certain of our trademarks worldwide. However, competitors may adopt similar trademarks to ours or purchase keywords that are confusingly similar to our brand names as terms
19
Table of Contents
in internet search engine advertising programs, which could impede our ability to build our brand identity and lead to confusion among potential customers of our services.
If we fail to respond to evolving technological changes, our on-demand software could become obsolete or less competitive.
Our industry is characterized by new and rapidly evolving technologies, standards, regulations, customer requirements and frequent product introductions. Accordingly, our future success depends upon, among other things, our ability to develop and introduce new products and services. The process of developing new technologies, products and services is complex, and if we are unable to develop enhancements to, and new features for, our existing on-demand software or acceptable new functionality that keeps pace with technological developments, industry standards, interactive marketing trends or customer requirements, our solution may become obsolete, less marketable and less competitive, and our business could be significantly harmed.
We have experienced rapid growth in recent periods. If we fail to manage our growth effectively, our financial performance may suffer.
We have expanded our overall business, customer base, employee headcount and operations in recent periods. We increased our total number of regular full-time employees from 168 as of December 31, 2007 to 488 as of December 31, 2010. We recently completed our acquisition of Eservices in Australia, which allowed us to add more customers and significantly expanded our operations in the Asia Pacific region. We also have a fifty-percent owned unconsolidated affiliate with operations in Denmark. Our expansion has placed, and our expected future growth will continue to place, a significant strain on our managerial, customer operations, research and development, sales and marketing, administrative, financial and other resources. If we are unable to manage our growth successfully, our operating results could suffer.
We rely on our management team and other key employees, and need additional personnel, to grow our business, and the loss of one or more key employees, or our inability to attract and retain qualified personnel, could harm our business.
Our success and future growth depend on the skills, working relationships and continued services of our management team and other key personnel. The loss of any member of our senior management team, including our Chief Executive Officer, could adversely affect our business.
Our future success will also depend on our ability to attract, retain and motivate highly skilled research and development, operations, sales, technical and other personnel in the United States and abroad. Even in today’s economic climate, competition for these types of personnel is intense. All of our employees in the United States work for us on an at-will basis. As a result of these factors, we may be unable to attract or retain qualified personnel. Our inability to attract and retain the necessary personnel could adversely affect our business.
We are currently expanding and improving our information technology infrastructure and systems. If these implementations are not successful, our operations could be disrupted, which could cause our operating results to suffer.
We are currently expanding and improving our information technology infrastructure and systems to assist us in the management of our growing organizational operations and accommodate our employee, customer and business growth. We anticipate that these improvements will be a long-term investment and that the process will require management time, support and cost. Moreover, there are inherent risks associated with upgrading, improving and expanding information technology systems. We cannot be sure that the improvements to our infrastructure and systems will be fully or effectively implemented on a timely basis, if at all. If we do not successfully implement upgrades and other changes on a timely basis or at all, our operations may be disrupted and our quality of service could decline. As a result, our operations and operating results could suffer. In
20
Table of Contents
addition, any new system deployments may not operate as we expect them to, and we may be required to expend significant resources to correct problems or find alternative sources for performing these functions.
Our independent registered public accounting firm noted a material weakness in our internal control over financial reporting. Failure to achieve and maintain effective internal control over financial reporting could result in our failure to accurately report our financial results.
During the audits of our financial statements for the years ended December 31, 2008, 2009 and 2010 our independent registered public accounting firm noted in its reports to our audit committee that we had a material weakness in the design and operating effectiveness of our internal control over financial reporting due primarily to insufficient personnel within our accounting function possessing an appropriate level of experience to provide reasonable assurance that transactions were being appropriately recorded and regarding the reliability of financial reporting and the preparation of financial statements. The material weakness resulted in a number of audit adjustments to our financial statements for the periods under audit.
We took steps during 2010 and 2011 intended to begin the remediation of this material weakness, which relates in large part to inadequate staffing. In 2010 we added seven staff members to our finance organization, including a director of technical accounting and a revenue controller to fill key roles, and implemented additional procedures and training programs for all personnel involved in the preparation of our financial statements. We are continuing to add additional headcount in 2011. Our corporate controller will be leaving in April 2011. We have appointed an interim controller and will be seeking to hire a permanent controller, as well as additional accounting personnel, to continue to address our material weakness. We will not be able to fully address this material weakness until these steps have been completed. If we fail to further increase and maintain the number and expertise of our staff for our accounting and finance functions and to improve and maintain internal control over financial reporting adequate to meet the demands that will be placed upon us as a public company, including the requirements of the Sarbanes-Oxley Act of 2002, or the Sarbanes-Oxley Act, we may be unable to report our financial results accurately and prevent fraud.
Furthermore, SEC rules require that, as a publicly-traded company following completion of this offering, we file periodic reports containing our financial statements within a specified time following the completion of quarterly and annual periods. If we are not able to comply with the SEC reporting requirements in a timely manner, or if we or our independent registered public accounting firm continue to note or identify deficiencies in our internal control over financial reporting that are deemed to be material weaknesses, the market price of our stock could decline and we could be subject to sanctions, including delisting or investigations by The NASDAQ Stock Market, the SEC or other regulatory authorities, which would require additional financial and management resources.
Even if we are able to report our financial statements accurately and in a timely manner, if we do not make all the necessary improvements to address the material weakness, continued disclosure of a material weakness will be required in future filings with the SEC, which could cause our reputation to be harmed and our stock price to decline.
Our inability to acquire and integrate other businesses, products or technologies could seriously harm our competitive position.
In order to remain competitive, obtain key competencies or accelerate our time to market, we may seek to acquire additional businesses, products or technologies. To date, we have completed several small acquisitions of companies that provide professional services, and our larger acquisition of Eservices, in January 2011. We have limited experience in successfully acquiring and integrating businesses, products and technologies. If we identify an appropriate acquisition candidate, we may not be successful in negotiating the terms of the acquisition, financing the acquisition, or effectively integrating the acquired business, product or technology into our existing business and operations. For instance, we may not fully realize the anticipated benefits of our acquisition of Eservices, which will depend in part on combining service offerings and entering into new markets. Our due
21
Table of Contents
diligence may fail to identify all of the problems, liabilities or other shortcomings or challenges of an acquired business, product or technology, including issues related to intellectual property, product quality or product architecture, regulatory compliance practices, revenue recognition or other accounting practices, or employee or customer issues. Additionally, in connection with any acquisitions we are able to complete, we may not achieve the synergies or other benefits we expected to achieve and we may incur write-downs, impairment charges or unforeseen liabilities which could negatively affect our operating results or financial position or could otherwise harm our business. If we finance acquisitions by issuing convertible debt or equity securities, our existing stockholders may be diluted, which could affect the market price of our stock. Further, contemplating or completing an acquisition and integrating an acquired business, product or technology will significantly divert management and employee time and resources.
If we are unable to protect the confidentiality of our proprietary information, the value of our on-demand software could be adversely affected.
We rely largely on our unpatented technology and trade secrets to protect our proprietary information. We generally seek to protect this information by confidentiality, non-disclosure and assignment of invention agreements with our employees, contractors and parties with which we do business. These agreements may be breached and we may not have adequate remedies for any such breach. We cannot be certain that the steps we have taken will prevent unauthorized use or reverse engineering of our technology. Moreover, our trade secrets may be disclosed to or otherwise become known or be independently developed by competitors. To the extent that our employees, contractors, or other third parties with whom we do business use intellectual property owned by others in their work for us, disputes may arise as to the rights in related or resulting know-how and inventions. If, for any of the above reasons, our intellectual property is disclosed or misappropriated, it would harm our ability to protect our rights and have a material adverse effect on our business.
Our business may suffer if it is alleged or determined that our technology infringes the intellectual property rights of others.
Our industry is characterized by the existence of a large number of patents and by litigation based on allegations of infringement or other violations of intellectual property rights. Moreover, in recent years, individuals and groups have purchased patents and other intellectual property assets for the purpose of making claims of infringement in order to extract settlements from companies like ours. From time to time, third parties have claimed and may continue to claim that we are infringing upon their patents or other intellectual property rights. In addition, we may be contractually obligated to indemnify our customers in the event of infringement of a third party’s intellectual property rights. Responding to such claims, regardless of their merit, can be time consuming, costly to defend in litigation, divert management’s attention and resources, damage our reputation and brand, and cause us to incur significant expenses. Even if we are indemnified against such costs, the indemnifying party may be unable to uphold its contractual obligations. Further, claims of intellectual property infringement might require us to redesign our application, delay releases, enter into costly settlement or license agreements or pay costly damage awards, or face a temporary or permanent injunction prohibiting us from marketing or selling our on-demand software. If we cannot or do not license the infringed technology on reasonable terms or at all, or substitute similar technology from another source, our revenue and operating results could be adversely impacted. Additionally, our customers may not purchase our on-demand software if they are concerned that they may infringe third-party intellectual property rights. The occurrence of any of these events may have a material adverse effect on our business.
The success of our business depends on our ability to protect and enforce our intellectual property rights. We rely on a combination of trademark, trade dress, copyright, unfair competition and trade secret laws, as well as confidentiality procedures and contractual restrictions, to establish and protect our proprietary rights. These laws, procedures and restrictions provide only limited protection and any of our intellectual property rights may be challenged, invalidated, circumvented, infringed or misappropriated. Further, the laws of certain countries do not protect proprietary rights to the same extent as the laws of the United States and, therefore, in certain
22
Table of Contents
jurisdictions, we may be unable to protect our proprietary technology adequately against unauthorized third party copying, infringement or use, which could adversely affect our competitive position.
In order to protect or enforce our intellectual property rights, we may initiate litigation against third parties. Litigation may be necessary to protect our trade secrets or know-how, or determine the enforceability, scope and validity of the proprietary rights of others. Any lawsuits that we initiate could be expensive, take significant time and divert management’s attention from other business concerns. Additionally, we may provoke third parties to assert claims against us. We may not prevail in any lawsuits that we initiate and the damages or other remedies awarded, if any, may not be commercially valuable. The occurrence of any of these events may have a material adverse effect on our business.
We use open source software in our on-demand software, which may subject us to litigation, require us to re-engineer our applications or otherwise divert resources away from our development efforts.
We use open source software in connection with our on-demand software. From time to time, companies that incorporate open source software into their products have faced claims challenging the ownership of open source software and/or compliance with open source license terms. Therefore, we could be subject to suits by parties claiming ownership of what we believe to be open source software or noncompliance with open source licensing terms. Some open source software licenses require users who distribute open source software as part of their software to publicly disclose all or part of the source code to such software and/or make available any derivative works of the open source code on unfavorable terms or at no cost. While we monitor our use of open source software and try to ensure that none is used in a manner that would require us to disclose the source code or that would otherwise breach the terms of an open source agreement, such use could inadvertently occur and we may be required to release our proprietary source code, pay damages for breach of contract, re-engineer our applications, discontinue sales in the event re-engineering cannot be accomplished on a timely basis or take other remedial action that may divert resources away from our development efforts, any of which could adversely affect our business.
We face risks associated with our international operations, including unfavorable regulatory, political, tax and labor conditions, which could limit our growth.
Our ability to grow our business and our future success will depend to a significant extent on our ability to expand our operations and customer base worldwide. We recently completed our acquisition of Eservices, located in Australia, commenced operations via a joint venture in Denmark, and commenced software development work via a subsidiary in India. Operating in foreign countries requires significant resources and management attention, and we have limited experience entering new geographic markets. We cannot assure you that our international efforts will be successful. International sales and operations may be subject to risks such as:
| • | difficulties in staffing and managing foreign operations; |
| • | burdens of complying with a wide variety of laws and regulations; |
| • | adverse tax burdens and foreign exchange controls making it difficult to repatriate earnings and cash; |
| • | political instability; |
| • | terrorist activities; |
| • | currency exchange rate fluctuations; |
| • | generally longer receivable collection periods than in the United States; |
| • | trade restrictions; |
| • | differing employment practices and laws and labor disruptions; |
| • | preference for local vendors; |
23
Table of Contents
| • | technology compatibility; |
| • | the imposition of government controls; |
| • | lesser degrees of intellectual property protection; |
| • | a legal system subject to undue influence or corruption; and |
| • | a business culture in which improper sales practices may be prevalent. |
We cannot assure you that these factors will not have a material adverse effect on our future international sales and, consequently, on our business.
Catastrophic events could disrupt and cause harm to our business.
We are located in California, an area susceptible to earthquakes. A major earthquake or other natural disaster, fire, act of terrorism or other catastrophic event that results in the destruction or disruption of any of our critical business operations or information technology systems could severely affect our ability to conduct normal business operations and, as a result, our future operating results could be harmed.
Our business is subject to changing regulations regarding corporate governance, disclosure controls, internal control over financial reporting and other compliance areas that will increase both our costs and the risk of noncompliance.
As a public company, we will be subject to the reporting requirements of the Securities Exchange Act of 1934, or the Exchange Act, the Sarbanes-Oxley Act of 2002, or the Sarbanes-Oxley Act, the recently enacted Dodd-Frank Wall Street Reform and Consumer Protection Act, or the Dodd-Frank Act, and the rules and regulations of The NASDAQ Stock Market. The requirements of these rules and regulations will increase our legal, accounting and financial compliance costs, will make some activities more difficult, time-consuming and costly and may also place undue strain on our personnel, systems and resources.
The Sarbanes-Oxley Act requires, among other things, that we maintain effective disclosure controls and procedures and internal control over financial reporting. Commencing with our fiscal year ending December 31, 2012, we must perform system and process evaluation and testing of our internal control over financial reporting to allow management and our independent registered public accounting firm to report on the effectiveness of our internal control over financial reporting, as required by Section 404 of the Sarbanes-Oxley Act. Our compliance with Section 404 of the Sarbanes-Oxley Act will require that we incur substantial accounting expense and expend significant management efforts. Prior to this offering, we have never been required to test our internal controls within a specified period, and, as a result, we may experience difficulty in meeting these reporting requirements in a timely manner, particularly if material weaknesses or significant deficiencies persist.
If we are not able to comply with the requirements of Section 404 of the Sarbanes-Oxley Act in a timely manner, the market price of our stock could decline and we could be subject to sanctions or investigations by the stock exchange on which our common stock is listed, the SEC or other regulatory authorities, which would require additional financial and management resources.
Any failure to develop or maintain effective controls, or any difficulties encountered in their implementation or improvement, could harm our operating results or cause us to fail to meet our reporting obligations. Any failure to implement and maintain effective internal controls also could adversely affect the results of periodic management evaluations and annual auditor attestation reports regarding the effectiveness of our internal control over financial reporting that we will be required to include in our periodic reports filed with the SEC, beginning for our fiscal year ending December 31, 2012 under Section 404 of the Sarbanes-Oxley Act. Ineffective disclosure controls and procedures or internal control over financial reporting could also cause investors to lose confidence in our reported financial and other information, which would likely have a negative effect on the trading price of our common stock.
24
Table of Contents
Implementing any appropriate changes to our internal controls may require specific compliance training of our directors, officers and employees, entail substantial costs in order to modify our existing accounting systems, and take a significant period of time to complete. Such changes may not, however, be effective in maintaining the adequacy of our internal controls, and any failure to maintain that adequacy, or consequent inability to produce accurate financial statements on a timely basis, could increase our operating costs and could materially impair our ability to operate our business. In the event that we are not able to demonstrate compliance with Section 404 of the Sarbanes-Oxley Act in a timely manner, that our internal controls are perceived as inadequate or that we are unable to produce timely or accurate financial statements, investors may lose confidence in our operating results and our stock price could decline.
Changes in financial accounting standards or practices may cause adverse, unexpected financial reporting fluctuations and affect our reported results of operations.
A change in accounting standards or practices can have a significant effect on our reported results and may even affect our reporting of transactions completed before the change is effective. New accounting pronouncements and varying interpretations of accounting pronouncements have occurred and may occur in the future. Changes to existing rules or the questioning of current practices may adversely affect our reported financial results or the way we conduct our business. For example, we have recently adopted and retroactively applied a new revenue recognition standard, which may in the future be subject to varying interpretations that could materially impact how we recognize revenue. Accounting for revenue from sales of subscriptions to software is particularly complex, is often the subject of intense scrutiny by the SEC, and will evolve as the Financial Accounting Standards Board, or FASB, continues to consider applicable accounting standards in this area.
We may not be able to secure additional financing on favorable terms, or at all, to meet our future capital needs.
In the future, we may require additional capital to respond to business opportunities, challenges, acquisitions or unforeseen circumstances and may determine to engage in equity or debt financings or enter into credit facilities for other reasons. We may not be able to timely secure additional debt or equity financing on favorable terms, or at all. Any debt financing obtained by us in the future could involve restrictive covenants relating to our capital raising activities and other financial and operational matters, which may make it more difficult for us to obtain additional capital and to pursue business opportunities, including potential acquisitions. If we raise additional funds through further issuances of equity, convertible debt securities or other securities convertible into equity, our existing stockholders could suffer significant dilution in their percentage ownership of our company, and any new equity securities we issue could have rights, preferences and privileges senior to those of holders of our common stock, including shares of common stock sold in this offering. If we are unable to obtain adequate financing or financing on terms satisfactory to us, when we require it, our ability to continue to grow or support our business and to respond to business challenges could be significantly limited.
Our cash balances are managed through various institutions and the value of these investments could decline.
We maintain our cash and cash equivalents with a number of financial institutions around the world. In the event that any of these institutions experiences financial difficulty, we could find it more difficult to quickly access these funds. In addition, our results could vary materially from expectations depending on gains or losses realized on the sale or exchange of investments, impairment charges related to debt securities as well as other investments, and interest rates. The volatility in the financial markets and overall economic conditions increases the risk that the actual amounts realized in the future on our investments could differ significantly from the fair values currently assigned to them.
25
Table of Contents
We may not be able to utilize a significant portion of our net operating loss or research tax credit carryforwards, which could adversely affect our operating results.
As of December 31, 2010, we had federal and state net operating loss carryforwards of $25.2 million and $22.9 million, respectively, due to prior period losses, which expire beginning in 2021 and 2015 for federal and state purposes, respectively. We also have federal research tax credit carryforwards of approximately $0.8 million that will begin to expire in 2012. Realization of these net operating loss and research tax credit carryforwards depends on many factors, including our future income and, for example, whether the State of California continues to suspend the use of California net operating loss carryforwards. There is a risk that due to regulatory changes or unforeseen reasons our existing carryforwards could expire or otherwise be unavailable to offset future income tax liabilities, which would adversely affect our operating results.
Changes in tax laws or regulations that are applied adversely to us or our customers could increase the costs of our on-demand software and professional services and adversely impact our business.
New income, sales, use or other tax laws, statutes, rules, regulations or ordinances could be enacted at any time. Those enactments could adversely affect our domestic and international business operations, and our business and financial performance. Further, existing tax laws, statutes, rules, regulations or ordinances could be interpreted, changed, modified or applied adversely to us. These events could require us or our customers to pay additional tax amounts on a prospective or retroactive basis, as well as require us or our customers to pay fines and/or penalties and interest for past amounts deemed to be due. If we raise our prices to offset the costs of these changes, existing and potential future customers may elect not to continue or purchase our on-demand software and professional services in the future. Additionally, new, changed, modified or newly interpreted or applied tax laws could increase our customers’ and our compliance, operating and other costs, as well as the costs of our on-demand software and professional services. Further, these events could decrease the capital we have available to operate our business. Any or all of these events could adversely impact our business and financial performance.
Risks Related to this Offering and Ownership of Our Common Stock
There has been no prior market for our common stock, our stock price may be volatile or may decline regardless of our operating performance, and you may not be able to resell your shares at or above the initial public offering price.
There has been no public market for our common stock prior to this offering. The initial public offering price for our common stock will be determined through negotiations between the underwriters and us and may vary from the market price of our common stock following this offering. If you purchase shares of our common stock in this offering, you may not be able to resell those shares at or above the initial public offering price. An active or liquid market in our common stock may not develop upon closing of this offering or, if it does develop, it may not be sustainable. The trading prices of the securities of technology companies have been highly volatile. The market price of our common stock may fluctuate significantly in response to numerous factors, many of which are beyond our control, including:
| • | actual or anticipated fluctuations in our revenue and other operating results; |
| • | the financial projections we may provide to the public, any changes in these projections or our failure to meet these projections; |
| • | failure of securities analysts to initiate or maintain coverage of us, changes in financial estimates by any securities analysts who follow our company, or our failure to meet these estimates or the expectations of investors; |
| • | announcements by us or our competitors of significant technical innovations, acquisitions, strategic partnerships, joint ventures or capital commitments; |
26
Table of Contents
| • | announcements by us of negative conclusions about our internal controls and our ability to accurately report our financial results; and |
| • | changes in operating performance and stock market valuations of software or other technology companies, or those in our industry in particular; |
| • | price and volume fluctuations in the overall stock market, including as a result of trends in the economy as a whole; |
| • | lawsuits threatened or filed against us; and |
| • | other events or factors, including those resulting from war, incidents of terrorism or responses to these events. |
In addition, the stock markets have experienced extreme price and volume fluctuations that have affected and continue to affect the market prices of equity securities of many technology companies. Stock prices of many technology companies have fluctuated in a manner unrelated or disproportionate to the operating performance of those companies. In the past, stockholders have instituted securities class action litigation following periods of market volatility. If we were to become involved in securities litigation, it could subject us to substantial costs, divert resources and the attention of management from our business and adversely affect our business.
Most of our total outstanding shares may be sold into the market when the “lock up” period ends. If there are substantial sales of shares of our common stock, the price of our common stock could decline.
The price of our common stock could decline if there are substantial sales of our common stock, particularly sales by our directors, executive officers and significant stockholders, or if there is a large number of shares of our common stock available for sale. After this offering, we will have outstanding 44,106,658 shares of our common stock, based on the number of shares outstanding as of December 31, 2010. This includes the shares that we and the selling stockholders are selling in this offering, which may be resold in the public market immediately. The remaining 37,487,004 shares of our outstanding shares after this offering are currently restricted as a result of market standoff agreements. In addition, certain of these shares are also subject to lock-up agreements, as more fully described in “Underwriters.” In each case, these shares will become sellable 181 days after the date of this prospectus, subject to extension in some circumstances. Shares held by directors, executive officers and other affiliates will be subject to volume limitations under Rule 144 under the Securities Act and various vesting agreements.
After this offering, the holders of an aggregate of 32,494,245 shares of our common stock and 28,302 shares subject to a warrant to purchase our common stock outstanding as of December 31, 2010 will have rights, subject to some conditions, to require us to file registration statements covering their shares or to include their shares in registration statements that we may file for ourselves or our stockholders. All of these shares are subject to market standoff and/or lock-up agreements restricting their sale for 180 days after the date of this prospectus subject to extension in some circumstances. We also intend to register shares of common stock that we have issued and may issue under our employee equity incentive plans. Once we register these shares, they will be able to be sold freely in the public market upon issuance, subject to existing market standoff and/or lock-up agreements. Morgan Stanley & Co. Incorporated may, in its sole discretion, permit our officers, directors, employees and current stockholders who are subject to the contractual lock-up to sell shares prior to the expiration of the lock-up agreements. See “Underwriters” for more information.
The market price of the shares of our common stock could decline as a result of sales of a substantial number of our shares in the public market or the perception in the market that the holders of a large number of shares intend to sell their shares.
We have broad discretion in the use of the net proceeds from this offering and may not use them effectively.
We cannot specify with any certainty the particular uses of the net proceeds that we will receive from this offering. Our management will have broad discretion in the application of the net proceeds, including working
27
Table of Contents
capital, possible acquisitions and other general corporate purposes, and we may spend or invest these proceeds in a way with which our stockholders disagree. The failure by our management to apply these funds effectively could harm our business and financial condition. Pending their use, we may invest the net proceeds from this offering in a manner that does not produce income or that loses value. These investments may not yield a favorable return to our investors.
If securities or industry analysts do not publish research or publish inaccurate or unfavorable research about our business, our stock price and trading volume could decline.
The trading market for our common stock will depend in part on the research and reports that securities or industry analysts publish about us or our business. We currently do not have and may never obtain research coverage by securities analysts, and industry analysts that currently cover us may cease to do so. If no securities analysts commence coverage of our company, or if industry analysts cease coverage of our company, the trading price for our stock would be negatively impacted. In the event we obtain securities analyst coverage, if one or more of the analysts who cover us downgrade our stock or publish inaccurate or unfavorable research about our business, our stock price would likely decline. If one or more of these analysts cease coverage of our company or fail to publish reports on us regularly, demand for our stock could decrease, which might cause our stock price and trading volume to decline.
Our directors, executive officers and principal stockholders will continue to have substantial control over us after this offering and could delay or prevent a change in corporate control.
After this offering, our directors, executive officers and holders of more than 5% of our common stock, together with their affiliates, will beneficially own, in the aggregate, 73% of our outstanding common stock. As a result, these stockholders, acting together, would have the ability to control the outcome of matters submitted to our stockholders for approval, including the election of directors and any merger, consolidation or sale of all or substantially all of our assets. In addition, these stockholders, acting together, would have the ability to control the management and affairs of our company. Accordingly, this concentration of ownership might harm the market price of our common stock by:
| • | delaying, deferring or preventing a change in control of us; |
| • | impeding a merger, consolidation, takeover or other business combination involving us; or |
| • | discouraging a potential acquiror from making a tender offer or otherwise attempting to obtain control of us. |
We do not intend to pay dividends for the foreseeable future.
We have never declared or paid cash dividends on our capital stock. We currently intend to retain any future earnings to finance the operation and expansion of our business, and we do not expect to declare or pay any dividends in the foreseeable future. As a result, you may only receive a return on your investment in our common stock if the market price of our common stock increases.
If you purchase shares of our common stock in this offering, you will experience substantial and immediate dilution.
If you purchase shares of our common stock in this offering, you will experience substantial and immediate dilution in the pro forma net tangible book value per share after giving effect to this offering of $7.05 per share as of December 31, 2010, based on an assumed initial public offering price of $9.25 per share, which is the midpoint of the range set forth on the cover page of this prospectus, because the price that you pay will be substantially greater than the pro forma net tangible book value per share of the common stock that you acquire. This dilution is due in large part to the fact that our earlier investors paid substantially less than the initial public offering price when they purchased their shares of our capital stock. You will experience additional dilution upon exercise of any warrant, upon exercise of options to purchase common stock under our equity incentive plans, if we issue restricted stock to our employees under our equity incentive plans or if we otherwise issue additional shares of our common stock.
28
Table of Contents
Delaware law and provisions in our restated certificate of incorporation and bylaws that will be in effect at the closing of this offering could make a merger, tender offer or proxy contest difficult, thereby depressing the trading price of our common stock.
Following the closing of this offering, our status as a Delaware corporation and the anti-takeover provisions of the Delaware General Corporation Law may discourage, delay or prevent a change in control by prohibiting us from engaging in a business combination with an interested stockholder for a period of three years after the person becomes an interested stockholder, even if a change of control would be beneficial to our existing stockholders. In addition, our restated certificate of incorporation and bylaws that will be in effect at the closing of this offering will contain provisions that may make the acquisition of our company more difficult without the approval of our board of directors, including the following:
| • | our board of directors will be classified into three classes of directors with staggered three-year terms; |
| • | only our chairperson of the board, our chief executive officer, our president or a majority of our board of directors will be authorized to call a special meeting of stockholders; |
| • | our stockholders will only be able to take action at a meeting of stockholders and not by written consent; |
| • | vacancies on our board of directors will be able to be filled only by our board of directors and not by stockholders; |
| • | directors may be removed from office only for cause; |
| • | our restated certificate of incorporation will authorize undesignated preferred stock, the terms of which may be established, and shares of which may be issued, without stockholder approval; and |
| • | advance notice procedures will apply for stockholders to nominate candidates for election as directors or to bring matters before an annual meeting of stockholders. |
For information regarding these and other provisions, see “Description of Capital Stock.”
29
Table of Contents
SPECIAL NOTE REGARDING FORWARD-LOOKING STATEMENTS AND INDUSTRY DATA
This prospectus includes forward-looking statements. All statements contained in this prospectus other than statements of historical fact, including statements regarding our future results of operations and financial position, our business strategy and plans and our objectives for future operations, are forward-looking statements. The words “believe,” “may,” “will,” “estimate,” “continue,” “anticipate,” “intend” and “expect” and similar expressions are intended to identify forward-looking statements. We have based these forward-looking statements largely on our current expectations and projections about future events and trends that we believe may affect our financial condition, results of operations, business strategy, short-term and long-term business operations and objectives, and financial needs. These forward-looking statements are subject to a number of risks, uncertainties and assumptions, including those described in the “Risk Factors” section. Moreover, we operate in a very competitive and rapidly changing environment. New risks emerge from time to time. It is not possible for our management to predict all risks, nor can we assess the impact of all factors on our business or the extent to which any factor, or combination of factors, may cause actual results to differ materially from those contained in any forward-looking statements we may make. In light of these risks, uncertainties and assumptions, the future events and trends discussed in this prospectus may not occur and actual results could differ materially and adversely from those anticipated or implied in the forward-looking statements.
You should not rely upon forward-looking statements as predictions of future events. The events and circumstances reflected in the forward-looking statements may not be achieved or occur. Although we believe that the expectations reflected in the forward-looking statements are reasonable, we cannot guarantee future results, levels of activity, performance or achievements. We are under no duty to update any of these forward-looking statements after the date of this prospectus or to conform these statements to actual results or revised expectations.
This prospectus also contains estimates and information concerning our industry, including market position, market size and growth rates of the markets in which we participate, that are based on industry publications and reports, including those generated by Forrester Research, Inc., the Direct Marketing Association and Gartner, Inc. This information involves a number of assumptions and limitations, and you are cautioned not to give undue weight to these estimates as there is no assurance that any of them will be achieved. Although we have not independently verified the accuracy or completeness of the data contained in these industry publications and reports, based on our industry experience we believe that the publications and reports are reliable and that the conclusions contained in the publications and reports are reasonable. A variety of factors, including those described in the “Risk Factors” section could cause results to differ materially from those expressed in these publications and reports.
30
Table of Contents
We estimate that our net proceeds from the sale of the common stock that we are offering will be approximately $45.5 million, or approximately $53.8 million if the underwriters exercise their right to purchase additional shares to cover over-allotments in full, assuming an initial public offering price of $9.25 per share, the midpoint of the range listed on the cover page of this prospectus, and after deducting estimated underwriting discounts and commissions and estimated offering expenses payable by us. A $1.00 increase (decrease) in the assumed initial public offering price of $9.25 per share would increase (decrease) the net proceeds to us from this offering by $5.1 million, assuming the number of shares offered by us, as set forth on the cover page of this prospectus, remains the same, after deducting estimated underwriting discounts and commissions and estimated offering expenses payable by us. We will not receive any proceeds from the sale of shares of common stock by the selling stockholders.
The principal purposes of this offering are to create a public market for our common stock, obtain additional capital, facilitate our future access to the public equity markets, increase awareness of our company among potential customers and improve our competitive position. We intend to use the net proceeds to us from this offering for working capital and other general corporate purposes such as expanding our international operations, product development, sales and marketing, and general and administrative matters. Additionally, we may choose to expand our current business through acquisitions of or investments in other businesses, products or technologies, using cash or shares of our common stock. However, we have no commitments with respect to any such acquisitions or investments at this time.
Pending the use of the proceeds from this offering, we intend to invest the proceeds in short-term, interest-bearing, investment-grade instruments, certificates of deposit or direct or guaranteed obligations of the U.S. government.
We have never declared or paid cash dividends on our capital stock. We currently intend to retain any future earnings for use in the operation of our business and do not intend to declare or pay any dividends in the foreseeable future. Any further determination to pay dividends on our capital stock will be at the discretion of our board of directors and will depend on our financial condition, results of operations, capital requirements and other factors that our board of directors considers relevant.
31
Table of Contents
The following table sets forth our capitalization as of December 31, 2010:
| • | on an actual basis; |
| • | on a pro forma basis to give effect to the automatic conversion of all outstanding shares of our convertible preferred stock into common stock; and |
| • | on a pro forma as adjusted basis to give effect to (1) the issuance and sale by us of 5,500,000 shares of common stock in this offering, and the receipt of the net proceeds from our sale of these shares at an assumed initial public offering price of $9.25 per share, the midpoint of the range listed on the cover page of this prospectus, after deducting estimated underwriting discounts and commissions and estimated offering expenses payable by us and (2) the restatement of our certificate of incorporation in connection with this offering. |
You should read this table in conjunction with the section entitled “Management’s Discussion and Analysis of Financial Condition and Results of Operations” and our consolidated financial statements and related notes included elsewhere in this prospectus.
| As of December 31, 2010 | ||||||||||||
| Actual | Pro Forma |
Pro Forma As Adjusted(1) |
||||||||||
| (in thousands, except per share data) | ||||||||||||
| Stockholders’ equity: |
||||||||||||
| Convertible preferred stock, $.0001 par value, 38,729 shares authorized; 30,159 shares issued and outstanding (actual); 5,000 shares authorized and no shares issued or outstanding (pro forma and pro forma as adjusted) |
$ | 62,028 | $ | — | $ | — | ||||||
| Common stock, $.0001 par value, 62,500 shares authorized and 8,448 shares issued and outstanding (actual); 62,500 shares authorized and 38,607 shares issued and outstanding (pro forma); and 250,000 shares authorized and 44,107 shares issued and outstanding (pro forma as adjusted) |
1 | 4 | 4 | |||||||||
| Additional paid-in capital |
12,860 | 74,885 | 120,373 | |||||||||
| Accumulated deficit |
(22,765 | ) | (22,765 | ) | (22,765 | ) | ||||||
| Accumulated other comprehensive income |
1,051 | 1,051 | 1,051 | |||||||||
| Total stockholders’ equity |
53,175 | 53,175 | 98,663 | |||||||||
| Total capitalization |
$ | 53,175 | $ | 53,175 | $ | 98,663 | ||||||
| (1) | A $1.00 increase (decrease) in the assumed initial public offering price of $9.25 per share would increase (decrease) each of additional paid-in capital, total stockholders’ equity and total capitalization by $5.1 million, assuming that the number of shares offered by us, as set forth on the cover page of this prospectus, remains the same, and after deducting the estimated underwriting discounts and commissions and estimated offering expenses payable by us. If the underwriters’ option to purchase additional shares to cover over-allotments is exercised in full, the pro forma as adjusted amount of each of additional paid-in capital, total stockholders’ equity and total capitalization would increase by approximately $8.3 million, after deducting estimated underwriting discounts and commissions and estimated offering expenses payable by us, and we would have 44,106,658 shares of our common stock issued and outstanding, pro forma as adjusted. The pro forma and pro forma as adjusted information discussed above is illustrative only and following the closing of this offering will be adjusted based on the actual public offering price and other terms of this offering determined at pricing. |
32
Table of Contents
The table above excludes the following shares:
| • | 10,937,216 shares of common stock issuable upon the exercise of options outstanding as of December 31, 2010 under our 1999 Stock Plan, with a weighted-average exercise price of approximately $1.55 per share; |
| • | 810,565 shares of common stock reserved for future issuance as of December 31, 2010 under our 1999 Stock Plan (which includes 15,000 shares of common stock issued and 305,125 shares of common stock issuable upon exercise of options granted at an exercise price of $9.25 per share between January 1, 2011 and March 31, 2011); |
| • | 28,302 shares of convertible preferred stock issuable upon exercise of an outstanding warrant as of December 31, 2010 that will convert into a warrant to purchase the same number of shares of common stock in connection with this offering, with an exercise price of $6.36 per share; |
| • | 148,047 shares of common stock that are issued and outstanding but were subject to a right of repurchase by us as of December 31, 2010; |
| • | 148,648 shares of common stock that were issued on January 3, 2011 in connection with our acquisition of the remaining equity interests in Eservices; and |
| • | 10,000,000 shares of common stock reserved for future issuance under our 2011 Equity Incentive Plan, which will become effective at or prior to the closing of this offering. |
33
Table of Contents
If you invest in our common stock, your interest will be diluted to the extent of the difference between the initial public offering price per share of our common stock and the pro forma as adjusted net tangible book value per share of our common stock immediately after this offering.
Our pro forma net tangible book value as of December 31, 2010 was $51.3 million, or $1.33 per share of common stock. Our pro forma net tangible book value per share represents the amount of our total tangible assets reduced by the amount of our total liabilities and divided by the total number of shares of our common stock outstanding as of December 31, 2010, after giving effect to the automatic conversion of all outstanding shares of our convertible preferred stock into common stock in connection with this offering.
After giving effect to our sale in this offering of 5,500,000 shares of common stock at an assumed initial public offering price of $9.25 per share (the midpoint of the range set forth on the cover page of this prospectus), after deducting estimated underwriting discounts and commissions and estimated offering expenses payable by us, our pro forma net tangible book value as of December 31, 2010 would have been approximately $96.8 million, or $2.20 per share of common stock. This represents an immediate increase in pro forma net tangible book value of $0.87 per share to our existing stockholders and immediate dilution of $7.05 per share to investors purchasing shares in this offering. The following table illustrates this per share dilution.
| Assumed initial offering price per share |
$ | 9.25 | ||||||
| Pro forma net tangible book value per share as of December 31, 2010 |
$ | 1.33 | ||||||
| Increase in pro forma net tangible book value per share attributable to investors purchasing shares in this offering |
0.87 | |||||||
| Pro forma as adjusted net tangible book value per share after this offering |
2.20 | |||||||
| Dilution in pro forma net tangible book value per share to investors in this offering |
$ | 7.05 | ||||||
A $1.00 increase (decrease) in the assumed initial public offering price of $9.25 per share would increase (decrease) our pro forma as adjusted net tangible book value per share after this offering by $0.12, assuming that the number of shares offered by us, as set forth on the cover page of this prospectus, remains the same, and after deducting the estimated underwriting discounts and commissions and estimated offering expenses payable by us.
If the underwriters exercise their over-allotment option in full, the pro forma net tangible book value per share after giving effect to this offering would be approximately $2.33 per share, and the dilution in pro forma net tangible book value per share to investors in this offering would be approximately $6.92 per share.
The following table summarizes, as of December 31, 2010, the differences between the number of shares of common stock purchased from us, after giving effect to the conversion of our convertible preferred stock into common stock, the total cash consideration paid and the average price per share paid by our existing stockholders and by our new investors purchasing shares in this offering at the assumed initial public offering price of $9.25 per share (the midpoint of the range set forth on the cover page of this prospectus), before deducting estimated underwriting discounts and commissions and estimated offering expenses payable by us:
| Shares Purchased | Total Consideration | Average Price Per Share |
||||||||||||||||||
| Number | Percent | Amount | Percent | |||||||||||||||||
| Existing stockholders |
38,606,658 | 88 | % | $ | 64,412,654 | 56 | % | $ | 1.67 | |||||||||||
| New investors |
5,500,000 | 12 | 50,875,000 | 44 | 9.25 | |||||||||||||||
| Totals |
44,106,658 | 100 | % | $ | 115,287,654 | 100 | % | |||||||||||||
34
Table of Contents
A $1.00 increase (decrease) in the assumed initial public offering price of $9.25 per share would increase (decrease) total consideration paid by new investors by $5.1 million, assuming that the number of shares offered by us, as set forth on the cover page of this prospectus, remains the same, and after deducting estimated underwriting discounts and commissions and estimated offering expenses payable by us.
If the underwriters exercise their over-allotment option in full, our existing stockholders would own 83% and our new investors would own 17% of the total number of shares of our common stock outstanding after this offering.
Sales of shares of common stock by the selling stockholders in this offering will reduce the number of shares of common stock held by existing stockholders to 37,487,004, or approximately 85% of the total shares of common stock outstanding after this offering, and will increase the number of shares held by new investors to 6,619,654, or approximately 15% of the total shares of common stock outstanding after this offering.
The above table and discussion are based on 38,606,658 shares of our common stock outstanding as of December 31, 2010, and exclude the following shares:
| • | 10,937,216 shares of common stock issuable upon the exercise of options outstanding as of December 31, 2010 under our 1999 Stock Plan, with a weighted-average exercise price of approximately $1.55 per share; |
| • | 810,565 shares of common stock reserved for future issuance as of December 31, 2010 under our 1999 Stock Plan (which includes 15,000 shares of common stock issued and 305,125 shares of common stock issuable upon exercise of options granted at an exercise price of $9.25 per share between January 1, 2011 and March 31, 2011); |
| • | 28,302 shares of convertible preferred stock issuable upon exercise of an outstanding warrant as of December 31, 2010 that will convert into a warrant to purchase the same number of shares of common stock in connection with this offering, with an exercise price of $6.36 per share; |
| • | 148,047 shares of common stock that are issued and outstanding but were subject to a right of repurchase by us as of December 31, 2010; |
| • | 148,648 shares of common stock that were issued on January 3, 2011 in connection with our acquisition of the remaining equity interests in Eservices; and |
| • | 10,000,000 shares of common stock reserved for future issuance under our 2011 Equity Incentive Plan, which will become effective at or prior to the closing of this offering. |
To the extent that any outstanding options or warrants are exercised, there will be further dilution to new investors.
35
Table of Contents
SELECTED CONSOLIDATED FINANCIAL DATA
The consolidated statements of income data for each of the years ended December 31, 2008, 2009 and 2010 and the consolidated balance sheet data as of December 31, 2009 and 2010 are derived from our audited consolidated financial statements included elsewhere in this prospectus. The consolidated statements of income data for the year ended December 31, 2007 and the consolidated balance sheet data as of December 31, 2008 are derived from our audited consolidated financial statements not included in this prospectus. The consolidated statements of income data for the years ended December 31, 2006 and the consolidated balance sheet data as of December 31, 2006 and 2007 are derived from our unaudited consolidated financial statements not included in this prospectus. Our historical results are not necessarily indicative of our results to be expected in any future period.
In January 2011, we completed our acquisition of the remaining equity interests of Eservices. The audited consolidated financial statements of Eservices for the year ended June 30, 2010, unaudited condensed financial statements of Eservices for the six months ended December 31, 2009 and 2010 and our unaudited pro forma condensed combined financial information have been included elsewhere in this prospectus.
You should read this information together with “Management’s Discussion and Analysis of Financial Condition and Results of Operations” and our consolidated financial statements and the related notes included elsewhere in this prospectus.
| Year Ended December 31, | ||||||||||||||||||||
| 2006 | 2007 | 2008 | 2009 | 2010 | ||||||||||||||||
| Consolidated Statements of Income Data: | (in thousands, except per share data) | |||||||||||||||||||
| Revenue |
||||||||||||||||||||
| Subscription |
$ | 17,864 | $ | 29,930 | $ | 41,047 | $ | 53,044 | $ | 69,284 | ||||||||||
| Professional services |
5,391 | 7,674 | 9,067 | 13,599 | 24,787 | |||||||||||||||
| Total revenue |
23,255 | 37,604 | 50,114 | 66,643 | 94,071 | |||||||||||||||
| Cost of revenue |
||||||||||||||||||||
| Subscription |
5,030 | 8,466 | 12,399 | 15,109 | 20,221 | |||||||||||||||
| Professional services |
5,052 | 6,314 | 8,926 | 12,478 | 20,697 | |||||||||||||||
| Total cost of revenue(1) |
10,082 | 14,780 | 21,325 | 27,587 | 40,918 | |||||||||||||||
| Gross profit |
13,173 | 22,824 | 28,789 | 39,056 | 53,153 | |||||||||||||||
| Operating expenses: |
||||||||||||||||||||
| Research and development(1) |
3,486 | 3,308 | 5,068 | 8,052 | 10,597 | |||||||||||||||
| Sales and marketing(1) |
7,977 | 11,098 | 15,681 | 15,494 | 20,849 | |||||||||||||||
| General and administrative(1) |
1,944 | 3,181 | 4,639 | 5,746 | 8,225 | |||||||||||||||
| Total operating expenses |
13,407 | 17,587 | 25,388 | 29,292 | 39,671 | |||||||||||||||
| Operating income (loss) |
(234 | ) | 5,237 | 3,401 | 9,764 | 13,482 | ||||||||||||||
| Total other income (expense), net |
223 | 298 | (811 | ) | 185 | 1,171 | ||||||||||||||
| Income (loss) before income taxes |
(11 | ) | 5,535 | 2,590 | 9,949 | 14,653 | ||||||||||||||
| Benefit (provision) for income taxes |
— | (109 | ) | 17,857 | (4,063 | ) | (5,821 | ) | ||||||||||||
| Equity in net loss of unconsolidated affiliates |
— | — | — | — | (234 | ) | ||||||||||||||
| Net income (loss) |
$ | (11 | ) | $ | 5,426 | $ | 20,447 | $ | 5,886 | $ | 8,598 | |||||||||
| Net income (loss) attributable to common stockholders:(2) |
||||||||||||||||||||
| Basic |
$ | (11 | ) | $ | 85 | $ | 2,980 | $ | 186 | $ | 802 | |||||||||
| Diluted |
$ | (11 | ) | $ | 146 | $ | 5,009 | $ | 299 | $ | 1,179 | |||||||||
| Net income (loss) per share attributable to common stockholders:(2) |
||||||||||||||||||||
| Basic |
$ | (0.00 | ) | $ | 0.01 | $ | 0.43 | $ | 0.02 | $ | 0.09 | |||||||||
| Diluted |
$ | (0.00 | ) | $ | 0.01 | $ | 0.35 | $ | 0.02 | $ | 0.08 | |||||||||
| Shares used in computation of net income (loss) per share attributable to common stockholders:(2) |
||||||||||||||||||||
| Basic |
5,297 | 6,304 | 7,007 | 7,518 | 8,527 | |||||||||||||||
| Diluted |
5,297 | 13,857 | 14,408 | 14,302 | 14,464 | |||||||||||||||
36
Table of Contents
| Year Ended December 31, | ||||||||||||||||||||
| 2006 | 2007 | 2008 | 2009 | 2010 | ||||||||||||||||
| Consolidated Statements of Income Data: | (in thousands, except per share data) | |||||||||||||||||||
| Pro forma net income per share attributable to common stockholders (unaudited):(2)(3) |
||||||||||||||||||||
| Basic |
$ | 0.22 | ||||||||||||||||||
| Diluted |
$ | 0.19 | ||||||||||||||||||
| Pro forma weighted-average shares outstanding used in calculating net income per share attributable to common stockholders (unaudited):(2)(3) |
||||||||||||||||||||
| Basic |
38,686 | |||||||||||||||||||
| Diluted |
44,623 | |||||||||||||||||||
| (1) | Total cost of revenue and operating expenses include stock-based compensation expense as follows: |
| Year Ended December 31, | ||||||||||||||||||||
| 2006 | 2007 | 2008 | 2009 | 2010 | ||||||||||||||||
| (in thousands) | ||||||||||||||||||||
| Total cost of revenue |
$ | 112 | $ | 111 | $ | 308 | $ | 332 | $ | 523 | ||||||||||
| Research and development |
8 | 41 | 264 | 280 | 331 | |||||||||||||||
| Sales and marketing |
43 | 119 | 400 | 461 | 694 | |||||||||||||||
| General and administrative |
34 | 91 | 478 | 563 | 958 | |||||||||||||||
| (2) | See note 2 of the notes to our consolidated financial statements for a description of how we compute basic and diluted net income (loss) attributable to common stockholders and net income (loss) per share attributable to common stockholders and pro forma basic and diluted net income (loss) per share attributable to common stockholders. |
| (3) | The pro forma basic and diluted weighted-average shares outstanding in calculating net income per share attributable to common stockholders does not include 148,648 shares of common stock that were issued on January 3, 2011 in connection with our acquisition of the remaining equity interest in Eservices and 15,000 shares of common stock that were issued on March 11, 2011 under our 1999 Stock Plan. |
| As of December 31, |
||||||||||||||||||||
| 2006 | 2007 | 2008 | 2009 | 2010 | ||||||||||||||||
| (in thousands) | ||||||||||||||||||||
| Consolidated Balance Sheet Data: |
||||||||||||||||||||
| Cash and cash equivalents(1) |
$ | 4,645 | $ | 8,350 | $ | 7,130 | $ | 15,750 | $ | 13,884 | ||||||||||
| Working capital |
4,384 | 7,277 | 12,724 | 26,489 | 27,047 | |||||||||||||||
| Total assets |
14,619 | 23,810 | 47,373 | 57,995 | 71,900 | |||||||||||||||
| Total liabilities |
6,777 | 10,151 | 11,336 | 13,178 | 18,725 | |||||||||||||||
| Total stockholders’ equity |
7,842 | 13,659 | 36,037 | 44,817 | 53,175 | |||||||||||||||
| (1) | Cash and cash equivalents as of December 31, 2010 does not reflect the use of $7.1 million of cash to acquire the remaining equity interests in Eservices in January 2011. |
37
Table of Contents
MANAGEMENT’S DISCUSSION AND ANALYSIS OF FINANCIAL
CONDITION AND RESULTS OF OPERATIONS
The following discussion and analysis of our financial condition and results of operations should be read in conjunction with our consolidated financial statements and related notes that appear in this prospectus. In January 2011, we completed our acquisition of the remaining equity interests of Eservices. The audited consolidated financial statements of Eservices for the year ended June 30, 2010, unaudited condensed financial statements of Eservices for the six months ended December 31, 2009 and 2010 and unaudited pro forma condensed combined financial information are included elsewhere in this prospectus. In addition to historical consolidated financial information, the following discussion contains forward-looking statements that reflect our plans, estimates and beliefs. Our actual results could differ materially from those discussed in the forward-looking statements. Factors that could cause or contribute to these differences include those discussed below and elsewhere in this prospectus, particularly in “Risk Factors.”
Overview
We are a leading provider of on-demand software that enables companies to engage in relationship marketing across the interactive channels that consumers are embracing today—email, mobile, social and the web. The Responsys Interact Suite, the core element of our solution, provides marketers with a set of integrated applications to create, execute, optimize and automate marketing campaigns. Our solution is comprised of our on-demand software and our professional services, all focused on enabling the marketing success of our customers.
The following is a timeline of significant milestones in our corporate history:
| • | We were founded in 1998 to provide on-demand software designed to enable marketers to design, execute and manage email campaigns. Our core product, Interact Campaign, was commercially released in 1999. |
| • | In 2004, under a new management team, we broadened our strategy from solely an email campaign management platform to a set of integrated applications for creating, executing, optimizing and automating email marketing campaigns. |
| • | In 2006, we acquired Inbox Marketing, Inc., a professional services firm, to increase the size and breadth of our professional services organization. |
| • | In 2007, we launched Interact Team to help marketers manage the campaign creation and deployment process by automating the design and tracking of campaign materials, communications, handoffs and approvals. |
| • | In 2008, we launched Interact Connect, which enables marketers to automate the transfer of data to and from our on-demand software platform and their customer data management systems and those of third parties. |
| • | In 2009, we achieved a key technology milestone by releasing our next-generation on-demand software platform, which integrated all of our core applications into one platform, the Responsys Interact Suite. Substantially all of our new customers added since this time are on this platform and we are migrating our other existing customers to this platform over time. This suite includes a new application, Interact Program, for visually designing, managing and automating complex marketing programs with multiple stages across multiple channels. In 2009, we also acquired Smith-Harmon, Inc. to increase the size and breadth of our professional services organization. |
| • | In April 2010, we added mobile and social functionality to Interact Campaign to coordinate the creation, scheduling, automation and tracking of short message service, or text message, marketing campaigns and promotions to consumers who engage with our customers’ brands as Facebook fans or Twitter followers. |
| • | In July 2010, we acquired a non-controlling, fifty-percent equity interest in Eservices Group Pty Ltd, or Eservices, a privately-held company headquartered in Melbourne, Australia, and in January 2011 we |
38
Table of Contents
| acquired the remaining equity interests in Eservices. Following the acquisition, the company was renamed Responsys Pty Ltd. As of and for the year ended December 31, 2010, the investment is reflected in our consolidated financial statements using the equity method. We have consolidated our results with those of Eservices beginning in January 2011. We acquired Eservices to expand the scope of our business internationally, increase our customer base and grow our professional services and sales teams. |
We derive revenue from subscriptions to our on-demand software and related professional services. As part of a subscription, a customer commits to a minimum monthly or quarterly fee that permits a customer to send up to a specified number of email messages. If a customer sends additional messages above the contracted level, the customer is required to pay additional per-message fees. No refunds or credits are given if a customer sends fewer messages than the contracted level. Customer agreements are non-cancellable for a minimum period, generally one year but ranging up to three years. Revenue from messages sent above contracted levels during the last three years has historically ranged from approximately 20% to 25% of our subscription revenue in any given 12-month period but varies from quarter to quarter due to seasonal, macroeconomic and other factors. We have historically had higher subscription revenue in our fourth quarter than other quarters in a given 12-month period, primarily due to revenue from messages sent above contracted levels. Subscription revenue accounted for 79.6% and 73.7% of our total revenue during the years ended December 31, 2009 and 2010, respectively. Subscription revenue is driven primarily by the number of customers, demand from existing customers, contracted value of the subscription agreements and number of messages sent above contracted levels. To date, our customers have primarily used email messages for their marketing campaigns, and email will continue to be the primary driver of our subscription revenue in the foreseeable future. However, if customers increase their use of other interactive channels in the future, we anticipate that revenue associated with email campaigns will decrease as a percentage of subscription revenue. Although revenue associated with our mobile, social and web channels has not been material to date, we believe that our cross-channel capabilities have been important factors in our new customers’ purchasing decisions.
Deferred revenue primarily consists of the unearned portion of billed professional services fees or fees for our on-demand software. As we bill nearly all our customers on a monthly or quarterly basis, our deferred revenue balance does not serve as a primary source of our future subscription revenue.
We sell subscriptions to our on-demand software and professional services primarily through a direct sales force. We target enterprise and larger mid-market companies that seek to implement more advanced marketing programs across interactive channels. Our customers are of varied size across a wide variety of industries, including retail and consumer, travel, financial services and technology. Our revenue from outside the United States as a percentage of total revenue was 15.4%, 13.5% and 10.8% for the years ended December 31, 2008, 2009 and 2010, respectively.
Our revenue growth over these periods has been driven by an increased number of customers with higher subscription fees. Although the overall number of customers has not changed substantially over the past three years, we have added larger enterprise customers with higher subscription commitments, higher messaging volumes and greater professional services demands. Our subscription revenue fluctuates as a result of seasonal variations in our business, principally due to timing of our customers’ sales and marketing cycles. We have historically had higher subscription revenue in our fourth quarter than in other quarters during a given 12-month period, primarily due to revenue from messages sent above contracted levels by our retail and consumer customers, and we currently anticipate that subscription revenue for the quarter ending March 31, 2011 will be between 10% and 15% lower than subscription revenue for the quarter ended December 31, 2010. Our cost of revenue and operating expenses have increased in absolute dollars over this period due to our need to increase bandwidth and capacity to support larger messaging volumes and the overall increased size of our business. Our 2008 net income reflects a one-time benefit of approximately $20.0 million from the release of our valuation allowance related to our deferred tax assets. We expect that our cost of revenue and operating expenses will continue to increase in absolute dollars and as a percentage of total revenue as we continue to invest in our growth and incur additional costs as a public company.
39
Table of Contents
Key Metrics
We regularly review a number of metrics to evaluate growth trends, measure our performance, establish budgets and make strategic decisions. We discuss revenue, gross margin, and the components of operating income and margin below under “Basis of Presentation,” and we discuss other key metrics below.
Subscription Dollar Retention Rate
We believe that our ability to retain our customers and expand their use of our software over time is an indicator of the stability of our revenue base and the long-term value of our customer relationships. We assess our performance in this area using a metric we refer to as our Subscription Dollar Retention Rate. Our Subscription Dollar Retention Rate metric is calculated by dividing (a) Retained Subscription Revenue by (b) Retention Base Revenue. We define Retention Base Revenue as subscription revenue from all customers in the prior period, and we define Retained Subscription Revenue as subscription revenue from that same group of customers in the current period. Our Subscription Dollar Retention Rate has averaged above 100% over the four quarters in each of the last three years.
Number of Customers
We believe that our ability to expand our customer base is an indicator of our market penetration and growth of our business as we continue to invest in our direct sales force and marketing initiatives. We define our number of customers as of the end of a particular quarter as the number of direct-billed subscription customers with $3,000 or more in committed subscription revenue for that quarter. We had 277 customers as of December 31, 2010. For more information about our customers, see “Business—Customers.”
Basis of Presentation
Revenue
Subscription Revenue
We derive our subscription revenue from subscriptions to our on-demand software. Subscription revenue primarily consists of revenue from contractually committed messaging and other fees and revenue from messages sent above contracted levels. Customer agreements are non-cancellable for a minimum period, generally one year but ranging up to three years. Our contracts provide our customers with access to our on-demand software and the ability to send up to a specified number of messages during each month or quarter in the contract term. If customers exceed the specified messaging volume, per-message fees are billed for the excess volume, generally at rates equal to or greater than the contracted minimum per-message fee. If customers send less than the specified number of messages, no rollover credit or refunds are given.
We recognize the aggregate minimum subscription fee payable ratably on a straight-line basis over the subscription term, provided that an enforceable contract has been signed by both parties, access to our software has been granted to the customer, the fee for the subscription is fixed or determinable and collection is reasonably assured. We do not recognize revenue in excess of the amount we have the right to invoice. Revenue for messages sent above contracted levels is recognized in the period in which the messages are sent. We also derive revenue from setup fees when the services are first activated. The setup fees are recorded as deferred revenue and recognized as revenue ratably over the estimated life of the customer relationship.
For a discussion of how we expect seasonal factors to affect our subscription revenue, see “—Quarterly Results of Operations” below.
Professional Services Revenue
Professional services revenue consists primarily of fees associated with campaign services, creative and strategic marketing services, technical services and education services. For more information about our professional services, see “Business—Our Services.” Our professional services are not required for customers to
40
Table of Contents
begin using our on-demand software. Our professional services engagements are typically billed on a fixed fee, time and materials or unit basis.
Cost of Revenue
Cost of Subscription Revenue
Cost of subscription revenue primarily consists of hosting costs, data communications expenses, personnel and related costs, including salaries and employee benefits, allocated overhead, software license fees, costs associated with website development activities, amortization expenses associated with capitalized software and depreciation and amortization expenses associated with computer equipment. To date, the expenses associated with capitalized software have not been material to our cost of subscription revenue. Expenses related to hosting and data communications are affected by the number of customers using our on-demand software, the complexity and frequency of their use, the volume of messages sent and the amount of data processed and stored. We plan to continue to significantly expand our capacity to support our growth, which will result in higher cost of subscription revenue in absolute dollars and as a percentage of subscription revenue.
Cost of Professional Services Revenue
Cost of professional services revenue primarily consists of personnel and related costs and allocated overhead. Our cost associated with providing professional services is significantly higher as a percentage of revenue than our cost of subscription revenue due to the labor costs associated with providing professional services. As it takes several months to ramp up a productive professional consultant, we generally increase our professional services capacity ahead of associated professional services revenue, which can result in lower margins in the given investment period. We expect the number of professional services personnel to increase in the future, which will result in higher cost of professional services revenue in absolute dollars and as a percentage of professional services revenue.
Operating Expenses
Research and Development
Research and development expenses primarily consist of personnel and related costs for our product development and product management personnel and allocated overhead. Our research and development efforts have been devoted primarily to increasing the functionality and enhancing the ease of use of our on-demand software and to improving scalability and performance. We expect that in the future, research and development expenses will increase as we extend our on-demand software offerings and develop new technologies and capabilities.
Sales and Marketing
Sales and marketing expenses primarily consist of personnel and related costs for our sales and marketing employees, including bonuses and commissions, the cost of marketing programs, promotional events and webinars, amortization of our acquired customer lists and allocated overhead. We expense sales commissions when the customer contract is signed because our obligation to pay a sales commission arises at that time. We plan to continue to invest in sales and marketing by increasing the number of direct sales personnel in order to add new customers and increase penetration within our existing customer base, expanding our domestic and international sales and marketing activities, building brand awareness and sponsoring additional marketing events. We expect that in the future, sales and marketing expenses will increase and continue to be our largest cost.
General and Administrative
General and administrative expenses consist primarily of personnel and related costs for administrative personnel and allocated overhead. In addition, general and administrative expenses include professional fees, bad
41
Table of Contents
debt expenses, sales and use tax expense and other corporate expenses. We anticipate that we will incur additional costs for personnel, systems and external professional services as we grow and operate as a public company, including higher legal, insurance and financial reporting expenses, and the additional costs to achieve and maintain compliance with Section 404 of the Sarbanes-Oxley Act. Accordingly, we expect that in the future, general and administrative expenses will increase.
Other Income (Expense)
Other income (expense) primarily consists of interest income, interest expense, foreign exchange gains (losses) and, for the year ended December 31, 2009, fair market value adjustments of our preferred stock warrant liability, and for the year ended December 31, 2010, fair value adjustments of our call and put options to purchase the remaining equity interests in Eservices. Interest income represents interest received on our cash and cash equivalents. Interest expense is associated with our outstanding capital leases. Foreign exchange gains (losses) relate to expenses and transactions denominated in currencies other than our functional currency.
Equity in Net Loss of Unconsolidated Affiliates
Equity in net loss of unconsolidated affiliates represents our proportionate share of operating results from our non-controlling equity investments in Eservices and Responsys Denmark A/S.
Results of Operations
The following tables set forth selected consolidated statements of income data for each of the periods indicated.
| Year Ended December 31, | ||||||||||||
| 2008 | 2009 | 2010 | ||||||||||
| (in thousands) | ||||||||||||
| Revenue: |
||||||||||||
| Subscription |
$ | 41,047 | $ | 53,044 | $ | 69,284 | ||||||
| Professional services |
9,067 | 13,599 | 24,787 | |||||||||
| Total revenue |
50,114 | 66,643 | 94,071 | |||||||||
| Cost of revenue:(1) |
||||||||||||
| Subscription |
12,399 | 15,109 | 20,221 | |||||||||
| Professional services |
8,926 | 12,478 | 20,697 | |||||||||
| Total cost of revenue |
21,325 | 27,587 | 40,918 | |||||||||
| Gross profit |
28,789 | 39,056 | 53,153 | |||||||||
| Operating expenses: |
||||||||||||
| Research and development(1) |
5,068 | 8,052 | 10,597 | |||||||||
| Sales and marketing(1) |
15,681 | 15,494 | 20,849 | |||||||||
| General and administrative(1) |
4,639 | 5,746 | 8,225 | |||||||||
| Total operating expenses |
25,388 | 29,292 | 39,671 | |||||||||
| Operating income |
3,401 | 9,764 | 13,482 | |||||||||
| Total other income (expense), net |
(811 | ) | 185 | 1,171 | ||||||||
| Income before income taxes |
2,590 | 9,949 | 14,653 | |||||||||
| Benefit (provision) for income taxes |
17,857 | (4,063 | ) | (5,821 | ) | |||||||
| Equity in net loss of unconsolidated affiliates |
— | — | (234 | ) | ||||||||
| Net income |
$ | 20,447 | $ | 5,886 | $ | 8,598 | ||||||
42
Table of Contents
| (1) | Total cost of revenue and operating expenses include the following amounts related to stock-based compensation: |
| Year Ended December 31, | ||||||||||||
| 2008 | 2009 | 2010 | ||||||||||
| (in thousands) | ||||||||||||
| Total cost of revenue |
$ | 308 | $ | 332 | $ | 523 | ||||||
| Research and development |
264 | 280 | 331 | |||||||||
| Sales and marketing |
400 | 461 | 694 | |||||||||
| General and administrative |
478 | 563 | 958 | |||||||||
The following tables set forth selected consolidated statements of income data for each of the periods indicated as a percentage of total revenue.
| Year Ended December 31, | ||||||||||||
| 2008 | 2009 | 2010 | ||||||||||
| Revenue: |
||||||||||||
| Subscription |
81.9 | % | 79.6 | % | 73.7 | % | ||||||
| Professional services |
18.1 | 20.4 | 26.3 | |||||||||
| Total revenue |
100.0 | 100.0 | 100.0 | |||||||||
| Cost of revenue: |
||||||||||||
| Subscription |
24.7 | 22.7 | 21.5 | |||||||||
| Professional services |
17.8 | 18.7 | 22.0 | |||||||||
| Total cost of revenue |
42.5 | 41.4 | 43.5 | |||||||||
| Gross profit |
57.5 | 58.6 | 56.5 | |||||||||
| Operating expenses: |
||||||||||||
| Research and development |
10.1 | 12.1 | 11.3 | |||||||||
| Sales and marketing |
31.3 | 23.2 | 22.2 | |||||||||
| General and administrative |
9.3 | 8.6 | 8.7 | |||||||||
| Total operating expenses |
50.7 | 43.9 | 42.2 | |||||||||
| Operating income |
6.8 | 14.7 | 14.3 | |||||||||
| Total other income (expense), net |
(1.6 | ) | 0.3 | 1.2 | ||||||||
| Income before income taxes |
5.2 | 15.0 | 15.5 | |||||||||
| Benefit (provision) for income taxes |
35.6 | (6.1 | ) | (6.2 | ) | |||||||
| Equity in net loss of unconsolidated affiliates |
— | — | (0.2 | ) | ||||||||
| Net income |
40.8 | % | 8.9 | % | 9.1 | % | ||||||
Comparison of Years Ended December 31, 2008, 2009 and 2010
Revenue
| Year Ended December 31, | ||||||||||||
| 2008 | 2009 | 2010 | ||||||||||
| (dollars in thousands) | ||||||||||||
| Subscription revenue |
$ | 41,047 | $ | 53,044 | $ | 69,284 | ||||||
| Percentage of total revenue |
81.9 | % | 79.6 | % | 73.7 | % | ||||||
| Professional services revenue |
$ | 9,067 | $ | 13,599 | $ | 24,787 | ||||||
| Percentage of total revenue |
18.1 | % | 20.4 | % | 26.3 | % | ||||||
43
Table of Contents
Subscription revenue. Subscription revenue for the year ended December 31, 2010 increased by $16.2 million, or 30.6%, over the year ended December 31, 2009. The increase was primarily due to a $7.4 million increase from new customers and a $5.4 million increase from existing customers. In addition, revenue from messages sent above contracted levels increased in absolute dollars from $12.8 million to $15.9 million, but decreased from 24.0% of subscription revenue to 22.9% of subscription revenue, for the years ended December 31, 2009 and 2010, respectively. Among our existing customers, approximately 26.1% of the increase was due to increased demand from a large customer that was added in early 2009 that continued to increase its use of our on-demand software in 2010.
Subscription revenue for the year ended December 31, 2009 increased by $12.0 million, or 29.2%, over the year ended December 31, 2008. The increase was primarily due to a $5.2 million increase from new customers and a $2.3 million increase from existing customers. In addition, revenue from messages sent above contracted levels increased from $8.5 million, or 20.8% of subscription revenue, to $12.8 million, or 24% of subscription revenue, for the years ended December 31, 2008 and 2009, respectively.
Professional services revenue. Professional services revenue for the year ended December 31, 2010 increased by $11.2 million, or 82.3%, over the year ended December 31, 2009. The increase was primarily due to an $8.0 million increase from existing customers increasing their use of our professional services generally and a $2.8 million increase from new customers. Among our existing customers, approximately 56.6% of the increase was due to increased demand from three large customers that were added in early and mid-2009 and that continued to ramp their use of our professional services in 2010.
Professional services revenue for the year ended December 31, 2009 increased by $4.5 million, or 50.0%, over the year ended December 31, 2008. The increase was primarily due to a $3.5 million increase from new customers and a $0.8 million increase from existing customers.
Cost of Revenue
| Year Ended December 31, | ||||||||||||
| 2008 | 2009 | 2010 | ||||||||||
| (dollars in thousands) | ||||||||||||
| Cost of subscription revenue |
$ | 12,399 | $ | 15,109 | $ | 20,221 | ||||||
| Percentage of subscription revenue |
30.2 | % | 28.5 | % | 29.2 | % | ||||||
| Gross margin |
69.8 | % | 71.5 | % | 70.8 | % | ||||||
| Cost of professional services revenue |
$ | 8,926 | $ | 12,478 | $ | 20,697 | ||||||
| Percentage of professional services revenue |
98.4 | % | 91.8 | % | 83.5 | % | ||||||
| Gross margin |
1.6 | % | 8.2 | % | 16.5 | % | ||||||
Cost of subscription revenue. Cost of subscription revenue for the year ended December 31, 2010 increased by $5.1 million, or 33.8%, over the year ended December 31, 2009. The increase was primarily due to a $2.5 million increase in personnel expenses due to the addition of employees, a $1.2 million increase in bandwidth expenses due to an expansion of our capacity in order to accommodate growth, a $1.0 million increase in depreciation and maintenance expenses associated with equipment for our data center and a $0.3 million increase in information technology expenses to support our larger operations team.
Cost of subscription revenue for the year ended December 31, 2009 increased by $2.7 million, or 21.9%, over the year ended December 31, 2008. The increase was primarily due to a $1.7 million increase in depreciation and maintenance expense associated with equipment for our data center, a $0.7 million increase in bandwidth expenses as a result of expansion of our capacity to accommodate growth and increased activity by existing customers and a $0.7 million increase in personnel expenses due to the addition of employees. The increases were partially offset by a $0.7 million decrease in outside consulting expenses as we decreased the use of outside consultants.
44
Table of Contents
Cost of professional services revenue. Cost of professional services revenue for the year ended December 31, 2010 increased by $8.2 million, or 65.9%, over the year ended December 31, 2009. The increase was primarily due to a $5.8 million increase in personnel expenses due to the addition of employees, a $0.8 million increase in outside consulting expenses due to an increased demand for our services, a $0.7 million increase in information technology expenses to support our larger professional services team and a $0.5 million increase in travel and entertainment expenses.
Cost of professional services revenue for the year ended December 31, 2009 increased by $3.6 million, or 39.8%, over the year ended December 31, 2008. The increase was primarily due to an increase of $3.5 million in personnel expenses due to the addition of employees, a $0.3 million increase in information technology to support our larger professional services team and a $0.2 million increase in facilities expenses.
Operating Expenses
Research and Development
| Year Ended December 31, | ||||||||||||
| 2008 | 2009 | 2010 | ||||||||||
| (dollars in thousands) | ||||||||||||
| Research and development |
$ | 5,068 | $ | 8,052 | $ | 10,597 | ||||||
| Percentage of total revenue |
10.1 | % | 12.1 | % | 11.3 | % | ||||||
Research and development expenses for the year ended December 31, 2010 increased by $2.5 million, or 31.6%, over the year ended December 31, 2009. The increase was primarily due to a $1.7 million increase in personnel expenses due to the addition of employees, a $0.3 million increase in hardware and software expenses and a $0.2 million increase in outside consulting services expenses.
Research and development expenses for the year ended December 31, 2009 increased by $3.0 million, or 58.9%, over the year ended December 31, 2008. The increase was primarily due to a $2.1 million increase in personnel expenses due to the addition of employees and a $0.5 million decrease in capitalized research and development costs.
Sales and Marketing
| Year Ended December 31, | ||||||||||||
| 2008 | 2009 | 2010 | ||||||||||
| (dollars in thousands) | ||||||||||||
| Sales and marketing |
$ | 15,681 | $ | 15,494 | 20,849 | |||||||
| Percentage of total revenue |
31.3 | % | 23.2 | % | 22.2 | % | ||||||
Sales and marketing expenses for the year ended December 31, 2010 increased by $5.4 million, or 34.6%, over the year ended December 31, 2009. The increase was primarily due to a $2.4 million increase in personnel expenses due to the addition of employees, a $0.8 million increase in commission and bonus expenses as a result of an increase in new customers and increased revenue from existing customers, a $0.5 million increase in advertising and promotion expenses due to expansion of our domestic and international sales and marketing activities, a $0.7 million increase in travel and entertainment expenses, a $0.2 million increase in information technology expenses and a $0.2 million increase in stock-based compensation.
Sales and marketing expenses for the year ended December 31, 2009 decreased by $0.2 million from the year ended December 31, 2008. The decrease was primarily due to a $0.2 million decrease in amortization expense for certain intangible assets that became fully amortized at the beginning of 2009.
45
Table of Contents
General and Administrative
| Year Ended December 31, | ||||||||||||
| 2008 | 2009 | 2010 | ||||||||||
| (dollars in thousands) | ||||||||||||
| General and administrative |
$ | 4,639 | $ | 5,746 | $ | 8,225 | ||||||
| Percentage of total revenue |
9.3 | % | 8.6 | % | 8.7 | % | ||||||
General and administrative expenses for the year ended December 31, 2010 increased by $2.5 million, or 43.1%, over the year ended December 31, 2009. The increase was primarily due to a $1.4 million increase in legal and accounting expenses as a result of a multi-year audit and legal activity to support company growth, a $0.5 million increase in personnel expenses due to the addition of employees, a $0.4 million increase in expenses due to the acquisition of a non-controlling interest in Eservices, a $0.4 million increase in stock-based compensation and a $0.5 million increase in outside consulting expenses, partially offset by a $0.9 million decrease in sales and use tax liability.
General and administrative expenses for the year ended December 31, 2009 increased by $1.1 million, or 23.9%, over the year ended December 31, 2008. The increase was primarily due to a $0.5 million increase in bad debt expense and a $0.3 million increase in personnel expenses due to an increase in headcount.
Total Other Income (Expense), Net
| Year Ended December 31, | ||||||||||||
| 2008 | 2009 | 2010 | ||||||||||
| (dollars in thousands) | ||||||||||||
| Total other income (expense), net |
$ | (811 | ) | $ | 185 | $ | 1,171 | |||||
Other income (expense), net for the year ended December 31, 2010 increased by $1.0 million over the year ended December 31, 2009. The increase was primarily due to a $1.5 million adjustment in the fair value of our call and put options to purchase the remaining equity interest in Eservices.
Other income (expense), net for the year ended December 31, 2009 decreased by $1.0 million over the year ended December 31, 2008. The change in total other income (expense), net was primarily due to favorable Euro and British Pound Sterling currency exchange fluctuations.
Benefit (Provision) for Income Taxes
| Year Ended December 31, | ||||||||||||
| 2008 | 2009 | 2010 | ||||||||||
| (dollars in thousands) | ||||||||||||
| Benefit (provision) for income taxes |
$ | 17,857 | $ | (4,063 | ) | $ | (5,821 | ) | ||||
| Effective tax rate |
* | 40.8 | % | 39.7 | % | |||||||
| * | Not meaningful |
Provision for income taxes for the year ended December 31, 2010 increased by $1.8 million over the year ended December 31, 2009. The effective tax rate was 40.8% and 39.7% for the years ended December 31, 2009 and 2010, respectively.
Provision for income taxes for the year ended December 31, 2009 was $4.1 million compared to a benefit for income taxes for the year ended December 31, 2008 of $17.9 million. The provision for income taxes for the year ended December 31, 2009 is comprised primarily of U.S. federal and state taxes. In 2008, we determined that it was more likely than not that deferred tax assets would be realized and adjusted the valuation allowance, which resulted in an income tax benefit of $20.0 million.
46
Table of Contents
Equity in Net Loss of Unconsolidated Affiliates
| Year Ended December 31, | ||||||||||||
| 2008 | 2009 | 2010 | ||||||||||
| (dollars in thousands) | ||||||||||||
| Equity in Net Loss of Unconsolidated Affiliates |
$ | — | $ | — | $ | (234 | ) | |||||
We recognized an equity loss in unconsolidated affiliates for the year ended December 31, 2010 of $0.2 million as a result of our non-controlling equity investments made in Eservices and Responsys Denmark A/S.
Quarterly Results of Operations
The following tables set forth selected unaudited quarterly consolidated statements of income data for the eight most recent quarters in the period ended December 31, 2010, as well as the percentage of total revenue for each line item shown. The financial information presented for the interim periods has been prepared on the same basis as the audited consolidated financial statements included elsewhere in this prospectus and, in the opinion of management, includes all adjustments, consisting of normal recurring adjustments, necessary for the fair presentation of the results of operations for such periods. This data should be read in conjunction with the audited consolidated financial statements and the related notes included elsewhere in this prospectus. These quarterly operating results are not necessarily indicative of our operating results to be expected for any future period.
| Three Months Ended, | ||||||||||||||||||||||||||||||||
| Mar. 31, 2009 |
June 30, 2009 |
Sep. 30, 2009 |
Dec. 31, 2009 |
Mar. 31, 2010 |
June 30, 2010 |
Sep. 30, 2010 |
Dec. 31, 2010 |
|||||||||||||||||||||||||
| (in thousands) | ||||||||||||||||||||||||||||||||
| Revenue: |
||||||||||||||||||||||||||||||||
| Subscription |
$ | 11,793 | $ | 12,625 | $ | 13,038 | $ | 15,588 | $ | 14,853 | $ | 15,479 | $ | 16,606 | $ | 22,346 | ||||||||||||||||
| Professional services |
3,025 | 3,041 | 3,231 | 4,302 | 4,528 | 6,097 | 5,836 | 8,326 | ||||||||||||||||||||||||
| Total revenue |
14,818 | 15,666 | 16,269 | 19,890 | 19,381 | 21,576 | 22,442 | 30,672 | ||||||||||||||||||||||||
| Cost of revenue(1): |
||||||||||||||||||||||||||||||||
| Subscription |
3,638 | 3,750 | 3,729 | 3,992 | 4,321 | 4,884 | 5,348 | 5,668 | ||||||||||||||||||||||||
| Professional services |
3,080 | 2,985 | 2,984 | 3,429 | 4,247 | 4,426 | 5,291 | 6,733 | ||||||||||||||||||||||||
| Total cost of revenue |
6,718 | 6,735 | 6,713 | 7,421 | 8,568 | 9,310 | 10,639 | 12,401 | ||||||||||||||||||||||||
| Gross profit |
8,100 | 8,931 | 9,556 | 12,469 | 10,813 | 12,266 | 11,803 | 18,271 | ||||||||||||||||||||||||
| Operating expenses: |
||||||||||||||||||||||||||||||||
| Research and development(1) |
1,716 | 1,936 | 2,370 | 2,030 | 2,162 | 2,628 | 2,695 | 3,112 | ||||||||||||||||||||||||
| Sales and marketing(1) |
3,565 | 3,549 | 3,515 | 4,865 | 4,739 | 5,025 | 5,355 | 5,730 | ||||||||||||||||||||||||
| General and administrative(1) |
1,241 | 1,351 | 1,476 | 1,678 | 1,687 | 1,936 | 2,789 | 1,813 | ||||||||||||||||||||||||
| Total operating expenses |
6,522 | 6,836 | 7,361 | 8,573 | 8,588 | 9,589 | 10,839 | 10,655 | ||||||||||||||||||||||||
| Operating income |
1,578 | 2,095 | 2,195 | 3,896 | 2,225 | 2,677 | 964 | 7,616 | ||||||||||||||||||||||||
| Total other income (expense), net |
(34 | ) | 359 | (100 | ) | (40 | ) | (218 | ) | (70 | ) | (241 | ) | 1,700 | ||||||||||||||||||
| Income before income taxes |
1,544 | 2,454 | 2,095 | 3,856 | 2,007 | 2,607 | 723 | 9,316 | ||||||||||||||||||||||||
| Provision for income taxes |
(627 | ) | (928 | ) | (865 | ) | (1,643 | ) | (877 | ) | (984 | ) | (200 | ) | (3,760 | ) | ||||||||||||||||
| Equity in net loss of unconsolidated affiliates |
— | — | — | — | — | — | (171 | ) | (63 | ) | ||||||||||||||||||||||
| Net income |
$ | 917 | $ | 1,526 | $ | 1,230 | $ | 2,213 | $ | 1,130 | $ | 1,623 | $ | 352 | $ | 5,493 | ||||||||||||||||
47
Table of Contents
| (1) | Total cost of revenue and operating expenses include the following amounts related to stock-based compensation: |
| Three Months Ended, | ||||||||||||||||||||||||||||||||
| Mar. 31, 2009 |
June 30, 2009 |
Sep. 30, 2009 |
Dec. 31, 2009 |
Mar. 31, 2010 |
June 30, 2010 |
Sep. 30, 2010 |
Dec. 31, 2010 |
|||||||||||||||||||||||||
| (in thousands) | ||||||||||||||||||||||||||||||||
| Total cost of revenue |
$ | 69 | $ | 76 | $ | 92 | $ | 95 | $ | 108 | $ | 104 | $ | 106 | $ |
205 |
| |||||||||||||||
| Research and development |
68 | 64 | 74 | 74 | 82 | 78 | 79 | 92 | ||||||||||||||||||||||||
| Sales and marketing |
95 | 94 | 133 | 139 | 141 | 134 | 140 | 279 | ||||||||||||||||||||||||
| General and administrative |
116 | 116 | 163 | 168 | 205 | 192 | 202 | 359 | ||||||||||||||||||||||||
The following tables set forth selected consolidated statements of income data for each of the periods indicated as a percentage of total revenue.
| Three Months Ended, | ||||||||||||||||||||||||||||||||
| Mar. 31, 2009 |
June 30, 2009 |
Sep. 30, 2009 |
Dec. 31, 2009 |
Mar. 31, 2010 |
June 30, 2010 |
Sep. 30, 2010 |
Dec. 31, 2010 |
|||||||||||||||||||||||||
| Revenue: |
||||||||||||||||||||||||||||||||
| Subscription |
79.6 | % | 80.6 | % | 80.1 | % | 78.4 | % | 76.6 | % | 71.7 | % | 74.0 | % | 72.9 | % | ||||||||||||||||
| Professional services |
20.4 | 19.4 | 19.9 | 21.6 | 23.4 | 28.3 | 26.0 | 27.1 | ||||||||||||||||||||||||
| Total revenue |
100.0 | 100.0 | 100.0 | 100.0 | 100.0 | 100.0 | 100.0 | 100.0 | ||||||||||||||||||||||||
| Cost of revenue: |
||||||||||||||||||||||||||||||||
| Subscription |
24.6 | 23.9 | 22.9 | 20.1 | 22.3 | 22.6 | 23.8 | 18.5 | ||||||||||||||||||||||||
| Professional services |
20.8 | 19.1 | 18.3 | 17.2 | 21.9 | 20.5 | 23.6 | 22.0 | ||||||||||||||||||||||||
| Total cost of revenue |
45.4 | 43.0 | 41.2 | 37.3 | 44.2 | 43.1 | 47.4 | 40.5 | ||||||||||||||||||||||||
| Gross profit |
54.6 | 57.0 | 58.8 | 62.7 | 55.8 | 56.9 | 52.6 | 59.5 | ||||||||||||||||||||||||
| Operating expenses: |
||||||||||||||||||||||||||||||||
| Research and development |
11.6 | 12.4 | 14.6 | 10.2 | 11.2 | 12.2 | 12.0 | 10.1 | ||||||||||||||||||||||||
| Sales and marketing |
24.1 | 22.7 | 21.6 | 24.5 | 24.5 | 23.3 | 23.9 | 18.7 | ||||||||||||||||||||||||
| General and administrative |
8.4 | 8.6 | 9.1 | 8.4 | 8.7 | 9.0 | 12.4 | 5.9 | ||||||||||||||||||||||||
| Total operating expenses |
44.1 | 43.7 | 45.3 | 43.1 | 44.4 | 44.5 | 48.3 | 34.7 | ||||||||||||||||||||||||
| Operating income |
10.5 | 13.3 | 13.5 | 19.6 | 11.4 | 12.4 | 4.3 | |
24.8 |
| ||||||||||||||||||||||
| Total other income (expense), net |
(0.2 | ) | 2.3 | (0.6 | ) | (0.2 | ) | (1.1 | ) | (0.3 | ) | (1.1 | ) | 5.5 | ||||||||||||||||||
| Income before income taxes |
10.3 | 15.6 | 12.9 | 19.4 | 10.3 | 12.1 | 3.2 | 30.3 | ||||||||||||||||||||||||
| Provision for income taxes |
(4.2 | ) | (5.9 | ) | (5.3 | ) | (8.3 | ) | (4.5 | ) | (4.6 | ) | (0.9 | ) | (12.3 | ) | ||||||||||||||||
| Equity in net loss of unconsolidated affiliates |
— | — | — | — | — | — | (0.8 | ) | (0.2 | ) | ||||||||||||||||||||||
| Net income |
6.1 | % | 9.7 | % | 7.6 | % | 11.1 | % | 5.8 | % | 7.5 | % | 1.5 | % | 17.8 | % | ||||||||||||||||
In general, our revenue has increased as a result of an increase in customers, increased demand from existing customers, increases in revenue from messages sent above contracted levels and expansion of our professional services activity. In most of the quarters presented, we added sales personnel to focus on adding new customers and increasing penetration within our existing customer base and added services personnel to support our growth in professional services.
Our subscription revenue fluctuates as a result of seasonal variations in our business, principally due to timing of our customers’ sales and marketing cycles. Based on our mix of customers in the retail and consumer industry, we have historically had higher subscription revenue in our fourth quarter than other quarters in a given 12-month period, primarily due to revenue from messages sent above contracted levels. In accordance with this trend, our subscription revenue in the fourth quarter of 2009 exceeded subscription revenue in the preceding three
48
Table of Contents
quarters as well as the first and second quarters of 2010. Our subscription revenue continued to grow in each quarter of 2010 and grew significantly more in the fourth quarter due to the seasonality noted above. We expect to experience seasonality in the future and subscription revenue in the fourth quarter of 2010 may be higher than in each of the first three quarters of 2011.
Our gross profit in absolute dollars increased sequentially in all but two quarters presented. Gross margin has generally increased as we realized improved economies of scale in our operations and professional services organizations, with the exception of the first and third quarters of 2010, which primarily resulted from additions of employees in our professional services organization. Investments in the professional services organization can increase the costs of professional services without a commensurate increase in revenue as newly hired employees ramp in productivity.
Total operating expenses have increased in absolute dollars in seven of the eight quarters presented, primarily due to increased salaries and benefits associated with additions of employees to support the growth of our business. Research and development expenses for the quarter ended December 31, 2009 decreased by $0.3 million as we capitalized additional development costs in accordance with FASB ASC No. 350-40. Sales and marketing expenses increased in the fourth quarter of 2009 due to an increase in sales commissions, and an increase in advertising and promotion expenses due primarily to our annual customer conference. General and administrative expenses decreased for the fourth quarter of 2010 due to a $0.9 million decrease in sales tax liability.
See “—Overview” and “—Basis of Presentation” for a discussion of trends and planned investments in our growth that will impact our future quarterly results.
Liquidity and Capital Resources
| Year Ended December 31, | ||||||||||||
| 2008 | 2009 | 2010 | ||||||||||
| (in thousands) | ||||||||||||
| Net cash provided by operating activities |
$ | 5,255 | $ | 12,902 | $ | 19,420 | ||||||
| Net cash used in investing activities |
(6,390 | ) | (3,960 | ) | (15,685 | ) | ||||||
| Net cash provided by (used in) financing activities |
106 | (341 | ) | (5,715 | ) | |||||||
| Effect of foreign exchange rate changes on cash and cash equivalents |
(191 | ) | 19 | 114 | ||||||||
| Net increase (decrease) in cash and cash equivalents |
$ | (1,220 | ) | $ | 8,620 | $ | (1,866 | ) | ||||
To date, we have financed our operations primarily through private placements of preferred stock and common stock and cash from operating activities. As of December 31, 2010, we had $13.9 million of cash and cash equivalents and $27.0 million of working capital.
Net cash provided by operating activities. Cash provided by operating activities is significantly influenced by the amount of cash we invest in personnel and infrastructure to support the anticipated growth of our business, the increase in the number of customers using our on-demand software and professional services and the amount and timing of customer payments. Cash provided by operations has historically resulted from net income driven by sales of subscriptions to our on-demand software and professional services and adjusted for non-cash expense items such as depreciation and amortization of property and equipment, stock-based compensation and changes in our deferred tax assets.
For the year ended December 31, 2010, net cash provided by operating activities was a result of $8.6 million of net income primarily due to the increased growth of our revenue derived from sales of subscriptions to our on-demand software and professional services, and $11.5 million from non-cash items, partially offset by a $0.7 million decrease due to changes in our operating assets and liabilities. As a result of our growth, we experienced an increase in our accounts receivable balance in the amount of $4.4 million, which was partially offset by an increase of $3.4 million in our deferred revenue balance.
49
Table of Contents
For the year ended December 31, 2009, net cash provided by operating activities was the result of $5.9 million of net income primarily due to the increased growth of our revenue derived from sales of subscriptions to our on-demand software and professional services, increased by $9.6 million for non-cash items. In addition, we had a decrease in net cash provided by operating activities due to changes in our operating assets and liabilities in the amount of $2.6 million, which was primarily the result of an increase in our accounts receivable balance in the amount of $4.0 million due to our growth, partially offset by an increase of $0.5 million in deferred revenue for amounts billed but not yet recognized. This was partially offset by an increase in accrued compensation in the amount of $1.3 million, which was caused by an increase in employee bonuses and sales commissions.
For the year ended December 31, 2008, net cash provided by operating activities was the result of $20.4 million of net income primarily due to the increased growth of our revenue derived from sales of subscriptions to our on-demand software and professional services, reduced by $13.2 million for non-cash items. The non-cash items for the year ended December 31, 2008 primarily consisted of $18.1 million from the release of our valuation allowance on our deferred tax assets. In addition, we had a decrease in net cash provided by operating activities due to changes in our operating assets and liabilities in the amount of $2.0 million, which was primarily the result of an increase in our accounts receivable balance in the amount of $2.0 million due to our growth.
Net cash used in investing activities. For the year ended December 31, 2010, cash used in investing activities consisted of $7.9 million for purchases of property and equipment, $7.0 million used to make equity investments in unconsolidated affiliates, $0.4 million of capitalized software costs and $0.3 million for an additional payment on the Smith-Harmon acquisition. In general, our purchases of property and equipment are primarily for data center equipment and network infrastructure to support our customer base, as well as equipment for supporting our increasing employee headcount.
For the year ended December 31, 2009, cash used in investing activities consisted of $2.2 million for purchases of property and equipment, $0.8 million of capitalized software costs and $0.9 million for the initial payment for the Smith-Harmon acquisition.
For the year ended December 31, 2008, cash used in investing activities consisted of $4.8 million for purchases of property and equipment, $1.3 million of capitalized software costs and $0.3 million for the final payment for the acquisition of Loyalty Matrix.
Net cash provided by (used in) financing activities. For the year ended December 31, 2010, cash provided by (used in) financing activities consisted of $5.7 million in payments for the repurchase of our common stock, $0.7 million in payments for direct costs incurred in connection with the preparation of this registration statement, and $0.4 million in payments in connection with our capital lease obligations, partially offset by $0.3 million in proceeds from the issuance of our common stock in connection with stock option exercises, $0.6 million in proceeds from the early exercise of stock options and $0.2 million from excess tax benefits from our stock-based compensation.
For the year ended December 31, 2009, cash provided by (used in) financing activities consisted of $(0.5) million in payments on our capital lease obligations and $0.2 million in proceeds from the issuance of our common stock in connection with stock option exercises.
For the year ended December 31, 2008, cash provided by financing activities consisted of $0.1 million in proceeds from the issuance of our common stock in connection with stock option exercises.
Capital resources. We believe that our existing sources of liquidity will be sufficient to fund our operations for at least the next 12 months. Our future capital requirements will depend on many factors, including our rate of revenue growth, the expansion of our sales and marketing activities and the timing and extent of spending to
50
Table of Contents
support product development efforts and expansion into new territories, the timing of introductions of new features and enhancements to our on-demand software. To the extent that existing cash and cash equivalents and cash from operations are insufficient to fund our future activities, we may need to raise additional funds through public or private equity or debt financing. We may also seek to invest in, or acquire complementary businesses, applications or technologies, any of which could also require us to seek additional equity or debt financing. Additional funds may not be available on terms favorable to us or at all.
Commitments
We generally do not enter into long-term minimum purchase commitments. Our principal commitments consist of obligations under capital leases for equipment and operating leases for our facilities. The following table summarizes our commitments to settle contractual obligations in cash under capital and operating leases as of December 31, 2010.
| Total | Payment Due by Period | |||||||||||||||||||
| Less than 1 Year |
1-3 Years |
3-5 Years |
More than 5 Years |
|||||||||||||||||
| (in thousands) | ||||||||||||||||||||
| Operating lease obligations |
$ | 5,161 | $ | 2,176 | $ | 2,911 | $ | 74 | $ | — | ||||||||||
| Capital lease obligations |
417 | 417 | — | — | — | |||||||||||||||
| Total contractual obligations |
$ | 5,578 | $ | 2,593 | $ | 2,911 | $ | 74 | $ | — | ||||||||||
Subsequent to December 31, 2010, we acquired an operating lease as part of our acquisition of Eservices and we entered into a lease agreement for a new office space in Chicago, Illinois with lease payments of approximately $0.6 million and $0.5 million, respectively, over the terms of the leases. The remaining term of the Eservices lease is approximately 2 years and the Chicago lease is for approximately 2 years.
In July 2010, we acquired 50% of the common shares of Eservices, a privately-held company headquartered in Melbourne, Australia for $6.7 million (AUD $7.8 million) in cash, of which, $0.4 million was unpaid as of December 31, 2010. On January 3, 2011, we completed the acquisition of the remaining equity interests of Eservices. The acquisition was consummated pursuant to the Share Sale and Shareholders Agreement dated as of July 1, 2010, as amended January 1, 2011, which accelerated the purchase of the remaining 50% of the common shares of Eservices for $8.3 million (AUD $8.0 million), which consisted of $7.1 million paid in cash and 148,648 shares of our common stock valued at approximately $1.2 million.
From time to time, in the normal course of business, we indemnify third parties with whom we enter into contractual relationships, including customers, lessors, and parties to other transactions, with respect to certain matters. We have agreed, under certain conditions, to hold these third parties harmless against specified losses, such as those arising from a breach of representations or covenants, other third-party claims that our on-demand software when used for its intended purpose infringes the intellectual property rights of such other third parties, or other claims made against certain parties. It is not possible to determine the maximum potential amount of liability under these indemnification obligations due to our limited history of prior indemnification claims and the unique facts and circumstances that are likely to be involved in each particular claim. Historically, payments made under these obligations have not been material.
We have established a reserve for sales and use taxes. A variety of factors could affect the liability, which factors include recovery of amounts from customers and any changes in relevant statutes in the various states in which we have done business. To the extent that the actual amount of our liabilities for sales and use taxes materially differs from the amount we have reserved on our consolidated balance sheet, our future results of operations and cash flows could be negatively affected. We plan to begin invoicing our customers in certain states for sales and use taxes.
51
Table of Contents
Off-Balance Sheet Arrangements
During the periods presented, we did not have any relationships with unconsolidated entities or financial partnerships, such as entities often referred to as structured finance or special purpose entities, which would have been established for the purpose of facilitating off-balance sheet arrangements or other contractually narrow or limited purposes.
Critical Accounting Policies and Estimates
Our consolidated financial statements are prepared in accordance with accounting principles generally accepted in the United States. The preparation of these consolidated financial statements requires us to make estimates and assumptions that affect the reported amounts of assets, liabilities, revenue, costs and expenses, and related disclosures. On an ongoing basis, we evaluate our estimates and assumptions. Our actual results may differ from these estimates under different assumptions or conditions.
We believe that of our significant accounting policies, which are described in note 2 to our consolidated financial statements, the following accounting policies involve a greater degree of judgment and complexity. Accordingly, these are the policies we believe are the most critical to aid in fully understanding and evaluating our condensed consolidated financial condition and results of operations.
Revenue Recognition
We recognize revenue in accordance with ASC No. 605-25, Revenue Recognition. Our revenue is primarily derived from sales of subscriptions to our on-demand software. Subscription revenue primarily consists of revenue from contractually committed messaging and revenue from messages sent above contracted levels. Customers do not have the contractual right to take possession of our on-demand software. Accordingly, we recognize the aggregate minimum subscription fee on a straight-line basis over the subscription term, provided that an enforceable contract has been signed by both parties, access to our software has been granted to the customer, the fee for the subscription is fixed or determinable and collection is reasonably assured. We do not recognize revenue in excess of the amount we have the right to invoice. Should a customer exceed the specified contractual messaging volume, per-message fees are billed for the excess volume. We recognize revenue for messages sent above contracted levels in the period in which the messages are sent. We also derive revenue from setup fees when the services are first activated. The setup fees are recorded as deferred revenue and recognized as revenue ratably over the estimated life of the customer relationship.
We also derive revenue from professional services. Professional services revenue consists primarily of fees associated with campaign services, creative and strategic marketing services, technical services and education services. Revenue from professional services is recognized as services are rendered for time and material engagements or using a proportional performance model based on services performed for fixed fee consulting engagements. Education services revenue is recognized after the services are performed. Professional services, when sold with on-demand software subscriptions, are accounted for separately when these services have value to the customer on a standalone basis.
At the inception of a customer contract, we make an assessment as to that customer’s ability to pay for the services provided. We base our assessment on a combination of factors, including the successful completion of a credit check or financial review, our collection experience with the customer, and other forms of payment assurance. If we subsequently determine that collection from the customer is not reasonably assured, we record an allowance for doubtful accounts and bad debt expense for all of that customer’s unpaid invoices and cease recognizing revenue for continued services provided until cash is received from the customer. Changes in our estimates and judgments about whether collection is reasonably assured would change the timing of revenue or the amount of bad debt expense that we recognize.
52
Table of Contents
Deferred revenue represents amounts billed to customers for which revenue has not been recognized. Deferred revenue consists of the unearned portion of professional services fees or the unearned portion of fees from subscriptions to our on-demand software.
Retrospective adoption of new accounting principle. In October 2009, the FASB amended the accounting standards for multiple deliverable revenue arrangements to:
| • | provide updated guidance regarding how the deliverables in an arrangement should be separated, and how the consideration should be allocated; |
| • | require an entity to allocate revenue in an arrangement using its best estimate of selling price, or BESP, of deliverables if a vendor does not first have vendor-specific objective evidence, or VSOE, of selling price or does not have third-party evidence, or TPE, of selling price; and |
| • | eliminate the use of the residual method and require an entity to allocate revenue using the relative selling price method. |
We elected to adopt this accounting guidance on a retrospective basis. We believe retrospective adoption provides the most comparable and useful financial information for financial statement users, is more consistent with the information our management uses to evaluate our business, and better reflects the underlying economic performance of our company. Our consolidated financial statements and the notes to our consolidated financial statements presented herein reflect the retrospective adoption of the new accounting principle.
Revenue recognition for arrangements with multiple deliverables. A multiple-element arrangement includes the sale of a subscription to our on-demand software with one or more associated professional service offerings, each of which are individually considered separate units of accounting. In determining whether professional services represent a separate unit of accounting we consider the availability of the services from other vendors. We allocate revenue to each element in a multiple-element arrangement based upon the relative selling price of each deliverable.
We are not able to demonstrate VSOE or TPE of selling price with respect to sales of subscriptions to our on-demand software. We do not have sufficient instances of separate sales of subscriptions nor are we able to demonstrate sufficient pricing consistency with respect to such sales. We also considered that no other vendor sells similar subscriptions given the unique nature and functionality of our service offering, and therefore have determined that we are not able to establish TPE of selling price. Therefore, we have determined the BESP of subscriptions to our on-demand software based on the following:
| • | The list price, which represents a component of our current go-to market strategy, as established by senior management taking into consideration factors such as the competitive and economic environment. |
| • | An analysis of the historical pricing with respect to both our bundled and standalone arrangements to subscriptions to our on-demand software. |
We have established VSOE of selling price of professional services based on an analysis of separate sales of such professional services.
Accounting for Income Taxes
We account for income taxes using an asset and liability approach to record deferred income taxes. Deferred income taxes reflect the impact of temporary differences between assets and liabilities recognized for financial reporting purposes, and such amounts recognized for income tax purposes, net of operating loss carry forwards and other tax credits, measured by applying currently enacted tax laws. Valuation allowances are provided when necessary to reduce deferred tax assets to an amount that is more-likely-than-not to be realized.
53
Table of Contents
On January 1, 2007, we adopted the authoritative guidance in ASC 740, Income Taxes, prescribing a threshold and measurement attribute for the financial recognition and measurement of a tax position taken or expected to be taken in a tax return. The guidance also provides for de-recognition of tax benefits, classification on the balance sheet, interest and penalties, accounting in interim periods, disclosure and transition. The guidance utilizes a two-step approach for evaluating uncertain tax positions. Step one, Recognition, requires a company to determine if the weight of available evidence indicates that a tax position is more-likely-than-not to be sustained upon audit, including resolution of related appeals or litigation processes, if any. If a tax position is not considered more-likely-than-not to be sustained, then no benefits of the position are to be recognized. Step two, Measurement, is based on the largest amount of benefit, which is more-likely-than-not to be realized on ultimate settlement. We consider many factors when evaluating and estimating our tax positions and tax benefits, which may require periodic adjustments and which may not accurately anticipate actual outcomes. In 2008, we determined that it was more likely than not that the deferred tax assets would be realized and adjusted the valuation allowance, which resulted in an income tax benefit of $20.0 million.
With the adoption of the guidance, companies are required to reflect only those tax positions that are more-likely-than-not to be sustained. Any necessary adjustment would be recorded directly to retained earnings and reported as a change in accounting principle as of the date of adoption. The adoption of this guidance did not have a material impact on our consolidated financial statements.
Our policy is to recognize interest and penalties related to unrecognized tax benefits in income tax expense. See note 11 for additional information, including the effects of adoption on our consolidated financial position, results of operations and cash flows.
Goodwill
Goodwill represents the excess of the aggregate purchase price paid over the fair value of the net tangible and identifiable intangible assets acquired. In accordance with FASB ASC No. 350-10, Intangibles—Goodwill and Other, goodwill is not amortized and is tested for impairment at least annually or whenever events or changes in circumstances indicate that the carrying value may not be recoverable. We have determined that we operate in one reporting unit and have selected November 30 as the date to perform our annual impairment test. In the valuation of our goodwill, we must make assumptions regarding estimated future cash flows to be derived from our reporting unit. If these estimates or their related assumptions change in the future, we may be required to record impairment for these assets. The performance of the test involves a two-step process. The first step of the impairment test involves comparing the fair value of our company to its net book value, including goodwill. If the net book value exceeds its fair value, then we perform the second step of the goodwill impairment test to determine the amount of the impairment loss. The impairment loss would be calculated by comparing the implied fair value of our company to its net book value. In calculating the implied fair value of our goodwill, the fair value of our company is allocated to all of the other assets and liabilities based on their fair values. The excess of the fair value of a company over the amount assigned to its other assets and liabilities is the implied fair value of goodwill. An impairment loss is recognized when the carrying amount of goodwill exceeds its implied fair value. As of December 31, 2010, the goodwill balance was $1.3 million. No impairment of goodwill was recorded for the years ended December 31, 2008, 2009 or 2010.
Long-lived Assets, Purchased Intangible Assets and Equity Method Investments
Purchased intangible assets with a determinable economic life and long-lived assets are carried at cost, less accumulated amortization and depreciation. Amortization and depreciation is computed over the estimated useful life of each asset on a straight-line basis. Equity method investments are carried at cost and are adjusted for our share in the equity method investment earnings. We review our long-lived assets, purchased intangible assets and equity method investments for impairment in accordance with FASB ASC No. 360-10, Property, Plant and Equipment, whenever events or changes in circumstances indicate that the carrying amount of an asset may no longer be recoverable. When these events occur, we measure impairment by comparing the carrying value of the assets to the estimated undiscounted future cash flows expected to result from the use of the assets and their
54
Table of Contents
eventual disposition. If the sum of the expected undiscounted cash flows is less than the carrying amount of the assets, we would recognize an impairment loss based on the fair value of our assets.
Accounting for Stock-based Awards
On January 1, 2006, we adopted FASB ASC No. 718-20, Compensation—Stock Compensation, or ASC 718, which required us to measure the cost of employee services received in exchange for an award of equity instruments based on the grant date fair value of the award. We elected to use the prospective transition method such that ASC 718 applies to new awards and to awards modified, repurchased, or canceled after the effective date.
Generally, stock options granted to employees vest 25% one year from the vesting commencement date and 1/48th each month thereafter, and have a contractual term of 10 years. We recognize stock-based compensation expense over the requisite service period of the individual grant, generally, equal to the vesting period.
Prior to January 1, 2006, we accounted for an award of equity instruments using the intrinsic value method in accordance with Accounting Principles Board (APB) Opinion No. 25, Accounting for Stock Issued to Employees, and FASB Interpretation (FIN) No. 44, Accounting for Certain Transactions involving Stock Compensation—an interpretation of APB Opinion No. 25. Under this method, for grants prior to January 1, 2006, no compensation expense was recognized for employee stock options granted with exercise prices greater than or equal to the fair value of the underlying common stock at date of grant. If the exercise price is less than the market value at the date of grant, the difference is recognized as deferred compensation expense, which is amortized over the vesting period. Compensation costs for the portion of awards for which the required service period has not been rendered (such as unvested options) that were outstanding as of January 1, 2006, continue to be accounted for under the provisions of APB Opinion No. 25 and were recognized as the remaining required services are rendered.
The Black-Scholes pricing model was developed for use in estimating the fair value of traded options that have no vesting restrictions and are fully transferable; these characteristics are not present in our option grants. Existing valuation models, including the Black-Scholes model, may not provide reliable measures of the fair value of our stock-based compensation. Consequently, there is a risk that our estimates of the fair value of our stock-based compensation awards on the grant dates may bear little resemblance to the actual values realized upon exercise. Stock options may expire or result in zero intrinsic value as compared to the fair values originally estimated on the grant date and reported in our financial statements. Alternatively, value may be realized from these instruments that are significantly higher than the fair values originally estimated on the grant date and reported in our financial statements.
As of December 31, 2010, we had approximately $5.1 million of unrecognized stock-based compensation expense related to non-vested stock option awards that we expect to be recognized over a weighted-average period of 1.76 years.
We calculated the fair value of options granted using the Black-Scholes pricing model with the following assumptions:
| Year Ended December 31, | ||||||||||||
| 2008 | 2009 | 2010 | ||||||||||
| Dividend yield(1) |
— | % | — | % | — | % | ||||||
| Risk-free rate(2) |
2.94 -3.48 | % | 2.94 - 3.48 | % | 2.12-2.52 | % | ||||||
| Expected volatility(3) |
48.89 - 56.02 | % | 48.89 - 50.94 | % | 50.00-51.02 | % | ||||||
| Expected term—in years(4) |
6.06 - 8.00 | 3.77 - 6.06 | 6.06 | |||||||||
| (1) | We have not issued dividends to date and do not anticipate issuing dividends. |
55
Table of Contents
| (2) | The risk-free interest rate is based on the implied yield then currently available on U.S. Treasury zero coupon issues with an equivalent remaining term. |
| (3) | We estimated volatility for option grants by evaluating the average historical volatility of companies we believe to be in our peer group for the period immediately preceding the option grant for a term that is approximately equal to the options’ expected life. |
| (4) | The expected term of our options represents the period that the stock-based awards are expected to be outstanding. We have elected to use the simplified method described in SAB No. 107 to compute expected term. Our stock plan provides for options that have a 10-year term. |
Our board of directors has historically set the exercise price of options to purchase our common stock on a price per share not less than the fair value of the underlying common stock at the time of grant. To determine the fair value of our common stock, our board of directors considered many factors, including but not limited to:
| • | independent third-party valuations using the methodologies described below; |
| • | our current and historical operating performance; |
| • | our expected future operating performance; |
| • | our financial condition at the grant date; |
| • | the liquidation rights and other preferences of our preferred stock; |
| • | our then-current book value per share; |
| • | input from management; |
| • | the lack of marketability of our common stock; |
| • | the potential future marketability of our common stock; and |
| • | the business risks inherent in our business and in high technology companies generally. |
The following table summarizes all option grants from January 1, 2009 through the date of this prospectus:
| Grant Date |
Number of Options Granted |
Per Share Exercise Price |
Common Stock Fair Value Per Share at Grant Date |
|||||||||
| March 11, 2009 |
213,750 | $ | 2.28 | $ | 2.28 | |||||||
| July 22, 2009(1) |
2,784,874 | 2.60 | 2.60 | |||||||||
| December 8, 2009(2) |
366,250 | 3.08 | 3.08 | |||||||||
| December 30, 2009 |
49,999 | 3.08 | 3.08 | |||||||||
| June 8, 2010 |
362,375 | 4.48 | 4.48 | |||||||||
| December 15, 2010 |
587,062 | 7.40 | 7.40 | |||||||||
| March 29, 2011 |
305,125 | 9.25 | 9.25 | |||||||||
| (1) | Includes previously granted options to purchase 2,562,500 shares of our common stock that were exchanged for six members of our management team. The exchange altered and extended the vesting term of the options and modified the performance criteria required for the options to become fully vested. The new option grants vest over a 119-month service period, or earlier upon achievement of a revenue milestone or a change in control of the company. We accounted for the change in terms as a stock option modification, which requires the unrecognized stock compensation expense associated with the previous grant to be added to the incremental compensation cost of the new grants. The incremental compensation cost is equal to the difference between the fair value of the modified stock options on the date of modification and their fair values immediately prior to modification. The total amount is then recognized over the remaining service period. |
| (2) | Includes fully-vested options to purchase 25,000 shares of our common stock issued in connection with the acquisition of Smith-Harmon. |
56
Table of Contents
In order to determine the fair value of our common stock underlying all option grants accounted for under ASC 718 and ASC 505-50, we have considered contemporaneous valuations of our common stock utilizing the discounted cash flow method and the comparable company method as well as an appropriate equity allocation model. As part of the comparable company method we analyzed a population of possible comparable companies and selected those companies that we considered to be the most comparable to us in terms of industry, revenues, growth and margins. We weighted the discounted cash flow and comparable company methods equally as we determined both methods relevant in estimating the value of our common stock. After estimating the value, the equity was allocated between the preferred and common stock using the option pricing model. For our valuations dated May 31, 2010 and December 1, 2010, we utilized the probability-weighted method which took into consideration the likelihood of an initial public offering and other scenarios.
The significant assumptions used in the valuation model are based on subjective future expectations combined with management judgment, which are described as follows.
Assumptions utilized in the discounted cash flow method include:
| • | our revenue, operating margins, cash flow and EBITDA for the current and future years, determined as of the valuation date, based on our estimates; |
| • | a discount rate, which is applied to forecasted future cash flows in order to calculate the present value of those cash flows; and |
| • | a terminal value multiple, which is applied to our last projected fiscal year EBITDA to calculate the residual value of our future cash flows. |
Assumptions in the comparable company method include:
| • | our revenue, operating margins, cash flow and EBITDA for the current and future years, determined as of the valuation date based on our estimates; |
| • | multiples of market value to trailing 12 months revenue, determined as of the valuation date, based on a group of comparable companies we identified; and |
| • | multiples of market value of future revenue, determined as of the valuation date, based on third-party estimates for a group of comparable companies we identified. |
Significant factors contributing to changes in common stock fair value at the date of each grant beginning in fiscal year 2009 were as follows:
March 2009. In March 2009, our revenue and net income continued to grow despite an adverse economic environment. In estimating the value as of March 2009, key assumptions included a 16% discount rate, a 15 times earnings terminal value multiple, market multiples using current and future revenue as well as future earnings estimates based on current market conditions. In addition, this analysis used a 23% lack of marketability discount. In this analysis, the option pricing model was utilized to estimate the common stock with key assumptions including a 65% volatility and a 1.5 year time to liquidity. In the absence of a public trading market for our common stock, our board of directors, with input from management, on March 11, 2009 determined the fair value of our common stock to be $2.28 per share.
July 2009. From April 2009 to July 2009, our revenue continued to grow and operating margins were higher than previous estimates. In June 2009 we had a limited production release of Responsys Interact Suite which integrated all of our core applications into one platform. This suite also included the first release of Interact Program for visually designing, managing, and automating complex marketing programs with multiple stages and across multiple channels. In estimating the value as of July 2009, key assumptions included a 17% discount rate, a 15 times earnings terminal value multiple, market multiples using current and future revenue as well as future earnings estimates based on current market conditions. In addition, this analysis used a 23% lack of marketability discount. In this analysis, the option pricing model was utilized to estimate the common stock with
57
Table of Contents
key assumptions including a 65% volatility and a 1.5 year time to liquidity. In the absence of a public trading market for our common stock, our board of directors, with input from management, on July 22, 2009 determined the fair value of our common stock to be $2.60 per share, an increase of 14% from the prior valuation date.
December 2009. From August 2009 to December 2009, our revenue and operating income continued to improve. We released Responsys Interact Suite for general availability in October 2009. In addition, we acquired Smith-Harmon in November 2009. With this acquisition we acquired a knowledgeable work force as well as the opportunity to increase our market share through the acquisition of the Smith-Harmon customer list. In estimating the value as of December 2009, key assumptions include a 15% discount rate, a 15 times earnings terminal value multiple, market multiples using current and future revenue as well as future earnings estimates based on current market conditions. In addition, this analysis used a 23% lack of marketability discount. In this analysis, the option pricing model was utilized to estimate the common stock with key assumptions including a 65% volatility, a 1.5 year time to liquidity and a long-term growth rate of 5%. In the absence of a public trading market for our common stock, our board of directors, with input from management, on December 8, 2009 determined the fair value of our common stock to be $3.08 per share, an increase of 18% from the prior valuation date.
June 2010. Our revenue declined in the first quarter of 2010 compared to the previous quarter due to the seasonality of some of our customer activity in the fourth quarter of the year. In the June 2010 quarter, revenue continued to grow. In February 2010, we released Interact Campaign for social to create, schedule, automate and track promotions to people who engage with their brands via Facebook and Twitter. In estimating the value as of June 2010, key assumptions included a 15% discount rate, a 5% long-term growth rate, market multiples using current and future revenue as well as future earnings estimates based on current market conditions. In addition, this analysis used a 22% lack of marketability discount. In this analysis, the probability-weighted method was utilized to estimate the common stock value due to the expected timing of a liquidity event. For this analysis, we assumed a 47.5% probability of an initial public offering, a 17.5% probability of a strategic sale and a 35% probability of remaining an independent private company. In the absence of a public trading market for our common stock, our board of directors, with input from management, on June 8, 2010 determined the fair value of our common stock to be $4.48 per share, an increase of 45% from the prior valuation date.
December 2010. From June 2010 to December 2010, our revenue continued to grow and it became more likely that we would pursue an initial public offering. In estimating the value as of December 2010, key assumptions included a 14% discount rate, a 5% long-term growth rate, and market multiples using current and future revenue as well as future earnings estimates based on current market conditions. In addition, this analysis used a 15% lack of marketability discount. In this analysis, the probability-weighted method was utilized to estimate the common stock value due to the expected timing of a liquidity event. For this analysis, we assumed a 70% probability of an initial public offering, a 20% probability of a strategic sale and a 10% probability of remaining an independent private company. In the absence of a public trading market for our common stock, our board of directors, with input from management, on December 15, 2010 determined the fair value of our common stock to be $7.40 per share, an increase of 65% from the prior valuation date.
March 2011. In March 2011, we determined the fair value of our common stock to be $9.25, the mid point of the range listed on the cover page of this prospectus, an increase of 25% from the prior valuation date.
New Accounting Pronouncements
Effective January 1, 2009, we adopted three accounting standard updates which were intended to provide additional application guidance and enhanced disclosures regarding fair value measurements and impairments of securities. They also provide additional guidelines for estimating fair value in accordance with fair value accounting. The first update, as codified in ASC 820-10-65, provides additional guidelines for estimating fair value in accordance with fair value accounting. The second accounting update, as codified in ASC 320-10-65, changes accounting requirements for other-than-temporary-impairment for debt securities by replacing the current requirement that a holder have the positive intent and ability to hold an impaired security to recovery in order to conclude an impairment was temporary with a requirement that an entity conclude it does not intend to sell an impaired security and it is not more likely-than-not that it will be required to sell the security before the recovery of its amortized cost basis. The third accounting update, as codified in ASC 825-10-65, increases the frequency of fair
58
Table of Contents
value disclosures. These updates were effective for fiscal years and interim periods ended after June 15, 2009. The adoption of these accounting updates did not have a material impact on our consolidated financial statements.
In October 2009, the FASB issued ASU 2009-13, Multiple-Deliverable Revenue Arrangements, (amendments to ASC Topic 605, Revenue Recognition), or ASU 2009-13 (formerly Emerging Issues Task Force Issue 08-1), and ASU 2009-14, Certain Arrangements That Include Software Elements, (amendments to FASB ASC Topic 985, Software), or ASU 2009-14 (formerly Emerging Issues Task Force Issue 09-3). ASU 2009-13 requires entities to allocate revenue in an arrangement using estimated selling prices of the delivered goods and services based on a selling price hierarchy. The amendments eliminate the residual method of revenue allocation and require revenue to be allocated using the relative selling price method. ASU 2009-14 removes tangible products from the scope of software revenue guidance and provides guidance on determining whether software deliverables in an arrangement that includes a tangible product are covered by the scope of the software revenue guidance. ASU 2009-13 and ASU 2009-14 should be applied on a prospective basis for revenue arrangements entered into or materially modified in fiscal years beginning on or after June 15, 2010, with early adoption permitted. We have adopted the new accounting principle on a retrospective basis.
In December 2010, the FASB issued Accounting Standards Update 2010-29, “Business Combinations Topic (805): Disclosure of supplementary pro forma Information for Business Combinations”, or ASU 2010-29. ASU 2010-29 provides clarification on the presentation of pro forma information for business combinations and applies to public entities. ASU 2010-29 specifies that the pro forma disclosure should include revenue and earnings of the combined entity as though the business combination(s) during the current year had occurred as of the beginning of the comparable prior annual reporting period only if comparative financial statements are presented. It also expands the supplemental pro forma disclosures to include a description of the nature and amount of the material, nonrecurring pro forma adjustments directly attributable to the business combination included in the reported pro forma revenue and earnings. The amendments are effective on a prospective basis for business combinations for which the acquisition date is on or after the beginning of the first annual reporting period beginning on or after December 15, 2010. We adopted this update as of January 1, 2011, and its adoption resulted in additional disclosures over our business combination acquisition of Eservices that was completed in January 2011.
Qualitative and Quantitative Disclosures about Market Risk
Foreign Currency Exchange Risk
We believe that there is no material risk of exposure to our results of operations and cash flows due to changes in foreign currency exchange rates. We do not engage in any foreign currency hedging to manage our exposure to fluctuations in foreign currency exchange rates.
Interest Rate Sensitivity
Interest income and expenses are sensitive to changes in the general level of U.S. interest rates. However, based on the nature and current level of our investments, which are primarily cash and money market accounts, we believe that we have no material risk of exposure to changes in interest rates.
Controls and Procedures
In connection with the audits of our financial statements for the years ended December 31, 2008, 2009 and 2010, our independent registered public accounting firm reported to our audit committee a material weakness in the design and operating effectiveness of our internal controls over financial reporting as defined by the standards established by the Public Company Accounting Oversight Board. A material weakness is a deficiency, or combination of deficiencies, that creates a reasonable possibility that a material misstatement of the annual or interim financial statements will not be prevented or detected in a timely manner.
59
Table of Contents
The material weakness reported by our independent registered public accounting firm was that we did not have sufficient personnel within our accounting function that possessed an appropriate level of experience to effectively perform the following:
| • | identify, select and apply GAAP sufficient to provide reasonable assurance that transactions were being appropriately recorded; and |
| • | design control activities over the financial close and reporting process necessary to provide reasonable assurance regarding the reliability of financial reporting and the preparation of financial statements. |
As a result, we experienced difficulties in reporting timely and accurate financial statements in compliance with GAAP and certain accounting transactions were not identified or properly assessed. As a result of this material weakness, we recorded material post-closing adjustments to our financial statements.
We are addressing the material weakness through process improvements and the hiring of additional finance personnel. In 2010, we added seven staff members to our finance organization, including a director of technical accounting and a revenue controller. We are also implementing additional procedures and training programs for all personnel involved in the preparation of our financial statements. We are continuing to add additional headcount in 2011. Our corporate controller will be leaving in April 2011. We have appointed an interim controller and will be seeking to hire a permanent controller, as well as additional accounting personnel, to continue to address our material weakness. We will not be able to fully address this material weakness until these steps have been completed.
We will not be able to assess whether the steps we are taking will fully remedy the material weakness in our internal control over financial reporting until we have fully implemented them and sufficient time passes in order to evaluate their effectiveness.
60
Table of Contents
Overview
Responsys is a leading provider of on-demand software that enables companies to engage in relationship marketing across the interactive channels that consumers are embracing today—email, mobile, social and the web. Our on-demand software, the Responsys Interact Suite, provides marketers with a set of integrated applications to create, execute, optimize and automate marketing campaigns. Our solution consists of our on-demand software and professional services, all focused on enabling the marketing success of our customers.
The Responsys Interact Suite is an open and flexible software-as-a-service, or SaaS, platform. Our Interact Suite is comprised of several integrated applications that enable the design, management and automation of tasks and processes for executing email and cross-channel marketing campaigns. Our platform can also be used with third-party applications and data from real-time sources, allowing our customers to deliver targeted content to their customers and known prospects as part of their interactive marketing campaigns. We sell our on-demand software and professional services primarily through a direct sales force and target enterprise and larger mid-market companies that seek to implement more advanced marketing programs across interactive channels. As of December 31, 2010, we had 277 customers of varied size across a wide variety of industries, including retail and consumer, travel, financial services and technology.
For the years ended December 31, 2008, 2009 and 2010, our revenue was $50.1 million, $66.6 million and $94.1 million, representing year-over-year growth of 33% and 41% in 2009 and 2010, respectively. In addition, we generated net income of $20.4 million, $5.9 million and $8.6 million for the years ended December 31, 2008, 2009 and 2010, respectively.
Industry
Marketing is Undergoing a Significant Shift.
Marketing through traditional media, such as broadcast and print, has for many years been the primary means for large organizations to reach their consumer audiences. However, a number of interrelated trends in technology and information consumption are changing the way organizations market to their customers.
| • | Adoption of digital technology has dramatically changed consumer behavior. Today, rather than watching live television, an increasing number of consumers are watching recorded programming and fast-forwarding through commercials with the use of digital video recorders. The effectiveness of telemarketers is declining due to call-screening technologies, such as caller ID, the implementation of the National Do Not Call Registry and the decreasing role of the home telephone. The addressable audiences of traditional newspaper advertising are shrinking due to declines in newspaper circulation. Meanwhile, interactive channels, including email, mobile, social and the web, are rapidly supplanting traditional media channels as consumers’ primary entertainment and information sources for everything from news, sports and weather to the products and services they consume and the brands they choose. |
| • | The change in consumer behavior is driving marketers to shift spending from traditional media channels to interactive channels. With this shift in consumer behavior, the role of marketing organizations has moved towards a focus on leveraging interactive channels to drive transactions for direct revenue generation, as opposed to simply branding and awareness. According to Forrester, spending on interactive marketing, which includes internet search and display advertising as well as email, mobile, and social media marketing, is expected to increase to nearly $55 billion and represent 21% of all U.S. marketing spend by 2014, as marketers shift dollars away from traditional media.(1) According to a survey conducted by Forrester, nearly 60% of respondents indicated they will increase their budgets for interactive marketing by shifting money away from traditional marketing channels.(1) |
| (1) | Source: Forrester, US Interactive Marketing Forecast 2009 to 2014, July 6, 2009, as updated January 11, 2010. |
61
Table of Contents
| • | Within interactive spending, marketers are turning more to interactive channels, such as email, mobile, social and the web, to increase conversion, retention and lifetime value. As spending shifts from traditional to interactive channels, relationship marketing offers a compelling value proposition relative to acquisition marketing. |
| • | Acquisition marketing. Acquisition marketing focuses on acquiring new, unknown customers by driving them towards a potential purchase or sale. A common type of acquisition marketing is driving website traffic sourced from internet search engine links, effectively spending dollars in targeted search advertising to drive revenue from online transactions. With this type of acquisition marketing alone, which focuses on generating new business from new customers, additional search spending is required to generate additional sales. According to Forrester, in 2010, U.S. interactive marketing spend was approximately $26 billion in the primary acquisition marketing channels of search marketing and display advertising.(1) |
| • | Relationship marketing. Relationship marketing focuses on building and maintaining a longer-term relationship with customers once they have been identified through acquisition marketing. Once the customer is known and has given the marketing organization permission to communicate with the customer, the marketer is able to send relevant and timely communications that have a greater propensity to generate a response. One example of relationship marketing is to deliver a text message to a customer’s mobile phone regarding a particular travel deal based on historical data that would suggest that the customer would potentially be interested in such a deal. According to Forrester, in 2010, U.S. interactive marketing spend was approximately $2.9 billion on email, mobile and social media, the primary interactive channels currently used for relationship marketing.(1) |
With an increasing focus on delivering greater revenue from their marketing investments, marketing organizations are looking at relationship marketing channels as an important component of their broader arsenal of interactive marketing strategies. According to the Direct Marketing Association, in 2009, email had the highest return on investment of any marketing channel, returning $43.62 for every dollar spent, while the second highest return on investment was search marketing, which returned $21.85 for every dollar spent.(2) As a result of relationship marketing’s compelling value proposition, we believe organizations will be increasingly focused on obtaining permission from their customers to market to them across email, mobile and social channels. This will reduce their reliance on acquisition marketing and increase conversion, retention and lifetime value of their customers.
| • | Spending on relationship marketing channels is expected to grow significantly. According to Forrester, U.S. interactive marketing spend on email, mobile and social media, the primary interactive channels currently used for relationship marketing, is expected to grow from $2.9 billion in 2010 to nearly $6.5 billion by 2014, representing a compound annual growth rate of 22%, while spending on the primarily acquisition marketing channels is expected to grow at a compound annual growth rate of 17% during the same period.(1) |
| • | Email. Despite the growth of other interactive channels, email remains the primary channel for an interactive marketer given its compelling return on investment. According to Forrester, U.S. email marketing spend is expected to grow from $1.4 billion in 2010 to $2.1 billion in 2014, representing a compound annual growth rate of 11%.(1) |
| • | Mobile. According to Gartner, the number of mobile phones worldwide is expected to grow to over 4.9 billion in 2014.(1) The mobile channel provides marketers compelling benefits, such as location-based data as well as a channel for real time engagement with customers. Given mobile’s ability to generate immediate response, it can be an effective way to acquire new customers and capture permission for other marketing channels. According to Forrester, U.S. mobile marketing spend is expected to grow from $561 million in 2010 to $1.3 billion in 2014, representing a compound annual growth rate of 23%.(2) |
| (1) | Source: Forrester, US Interactive Marketing Forecast 2009 to 2014, July 6, 2009, as updated January 11, 2010. |
| (2) | Source: Direct Marketing Association, The Power of Direct Marketing: 2009-2010 Edition, October 2009. |
62
Table of Contents
| • | Social. Facebook has announced it has over 500 million active users and Twitter has announced it has 175 million members, all connecting with friends, colleagues, causes and companies they like. In particular, according to Facebook, users spend an average of 55 minutes on Facebook daily. According to Forrester, U.S. social media marketing spend is expected to grow from $935 million in 2010 to $3.1 billion in 2014, representing a compound annual growth rate of 35%.(1) |
| • | Web. While the majority of interactive marketing spend on the web is focused on acquisition-oriented internet search and display advertising, the web channel can also serve as an effective relationship marketing channel. Email, mobile and social media campaigns drive website visits, which are a critical component of interactive marketing campaigns as they not only enable permission capture, but also provide the means by which user conversion occurs to generate sales. Websites can build relationships using tools such as web forms to collect customer information, conversion-tracking tools to track customer web behavior, and customer data-driven targeting rules to personalize landing pages and content. |
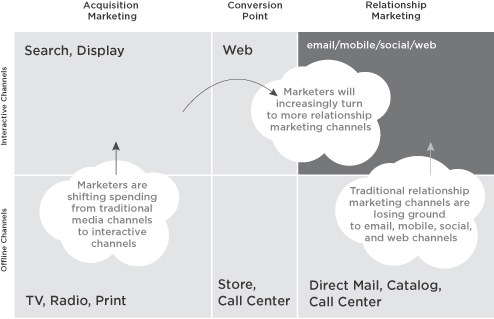
Marketing Organizations Need a Next-generation On-demand Marketing Platform.
The shift from traditional to interactive marketing has caused marketing activities to become increasingly complex and dependent on technology. We believe marketing organizations need a next-generation marketing platform to effectively execute their campaigns across email and other interactive channels to consumers who have given them permission to send marketing communications through those channels.
| • | Effective marketing requires an integrated cross-channel strategy. With the increasing consumer use of these new relationship marketing channels, companies need to interact with their customers across these channels in an integrated fashion in order to market effectively. Therefore, marketing organizations need a platform to orchestrate campaigns across email, mobile, social and the web to provide an optimized and consistent customer experience. |
| • | There are now too many channels for marketers to manage without being heavily technology-enabled. With the recent, rapid rise of the mobile and social channels and consumer demand for |
| (1) | Source: Forrester, US Interactive Marketing Forecast 2009 to 2014, July 6, 2009, as updated January 11, 2010. |
63
Table of Contents
| relevant and real-time interactions, marketers need the ability to execute and automate all of their campaigns across email and other interactive channels efficiently on a single platform. |
| • | There has been a proliferation in the amount of data on customer behavior and preferences across the interactive channels. With the growth of e-commerce and interactive channels, marketers can track digital customer interactions in increasing detail. This wealth of information, when leveraged across a single platform, empowers marketers to increase relevance, and deepen customer relationships, which can help to drive better engagement and increased sales. |
Existing Alternatives Are Inadequate.
Organizations have recognized the need for software that can manage customer relationships and be used for cross-channel marketing. The two most common alternatives are to use traditional “on-premise” software installed and customized at the customer’s location to manage marketing campaigns, or to assemble a collection of disparate software products designed to address specific marketing functions or channels. Both of these alternatives are increasingly inefficient and inadequate for the interactive marketer.
On-premise alternatives are not built to handle the demands of the interactive marketer and we believe suffer from the following key limitations:
| • | Offline channel focused. On-premise alternatives have traditionally been designed to support offline campaigns, primarily print and catalog, and not the real-time, interactive campaigns that today’s marketers increasingly need to deploy in order to reach their target customer base. |
| • | Limited campaign execution. Traditional on-premise alternatives focus primarily on analyzing consumer data and grouping, or segmenting, consumers based on their interests or characteristics. These alternatives generally do not focus on executing the personalized campaigns that today’s marketers require to effectively communicate with consumers. |
| • | Batch-oriented focus. Traditional on-premise alternatives focus on acquisition marketing with campaigns that deliver content to batches of consumers with little to no differentiation in preferences. These campaigns lack the personalized information needed to enhance messaging relevancy. Today’s marketers require the ability to deploy customized programs across interactive channels for existing customers. |
| • | Higher cost and implementation. Traditional on-premise alternatives are built to be deployed with large IT teams over a multi-week to multi-month period, and require large up front investments by marketing organizations. Such a deployment process is ineffective for today’s marketer, who needs to execute quickly with minimal upfront capital investment and without the need to maintain any IT infrastructure. |
The other common alternative is to patch together a series of disparate products that are each designed for either a single channel or only one aspect of marketing execution. For example, marketers can use one software product for email, another for mobile, another for social, and yet another to target content on their website. This approach brings with it the costs and inefficiencies of learning a variety of products and managing multiple vendor relationships. Furthermore, there can be significant limitations in coordinating data integration between disparate systems, an important step required to manage communications across different interactive channels and maintain a consistent experience for consumers. As a result, marketing strategies remain focused on specific interactive channels and marketing teams struggle to gain efficiencies marketing to their customers across an increasingly integrated and digital customer lifecycle.
Our Solution
We are a leading provider of on-demand software that enables companies to engage in relationship marketing across the interactive channels that consumers are embracing today—email, mobile, social and the
64
Table of Contents
web. Our on-demand software, the Responsys Interact Suite, provides marketers with a set of integrated applications to create, execute, optimize and automate marketing campaigns across key interactive channels.
Our on-demand software enables marketing organizations to automate, coordinate and efficiently execute interactive marketing activities, enabling timely and relevant communications with their customers throughout the customer lifecycle. Our focus on relationship marketing helps to enhance the revenue generation potential of our customers’ marketing investments. Our platform can be used with a variety of third-party applications and data sources and to help marketing organizations utilize a wide range of customer data in their marketing campaigns. Marketers can use this customer data to be more timely and relevant in their messaging, which can lead to a higher response rate and a greater return on their marketing investments.
To help maximize results, we also provide a range of professional services to assist, augment, and provide strategic guidance to our customers’ marketing organizations. Together, our on-demand software and professional services provide the technology and expertise to enable successful relationship marketing.
The key benefits of our solution include:
| • | Broad application suite. The Responsys Interact Suite provides marketers with a set of integrated applications for campaign management, automation of marketing programs, workflow management, tools for reporting and analysis, and data integration across the key interactive channels—email, mobile, social and the web. |
| • | Leading email and cross-channel campaign execution. Interact Campaign, the core application in our Interact Suite, is designed to help marketers effectively execute campaigns across email and other interactive channels to consumers who have given them permission to send marketing communications through those channels. Our applications allow marketers to design and deliver personalized content across each channel, and track and analyze the results. Forrester named Responsys as a leader in email marketing in The Forrester Wave™: Email Marketing Service Providers, Q4 2009, December 23, 2009. |
| • | Advanced campaign and program automation. To manage the increased volume of communications and growing set of interactive channels, Interact Program gives marketers the ability to design, orchestrate, and automate complex campaigns with multiple stages and across multiple channels with minimal IT resources. We believe our Interact Program application is a key differentiator for us. |
| • | Data model flexibility. Unlike most alternative solutions that often require that a company’s data be transformed into a predefined format, our open relational data model allows our customers to easily use data from their internal systems and those of third-party providers for improved targeting and automation of marketing campaigns. |
| • | Commitment to the marketing success of our customers. We complement our on-demand software with a range of professional services to help drive marketing success for our customers. Furthermore, to align our success with that of our customers, our account managers work closely with our customers to help them achieve their marketing goals. |
| • | On-demand software model. We deliver our applications and functionality on demand over the internet, with no hardware or software installation required by our customers. In using an on-demand platform, we are able to provide a reliable, cost-effective solution to our customers, and relieve them of the costs and burdens that have often prevented marketers from executing complex, cross-channel marketing campaigns. |
Our Products
The Responsys Interact Suite is provided as a software-as-a-service platform that helps companies engage in relationship marketing across the interactive channels that consumers are embracing today—email, mobile, social and the web. Unlike software that requires a company’s data to be transformed into a predefined format, our on-
65
Table of Contents
demand software is built on an open data model that allows our customers to use their existing data from their original sources and in their native formats to create more relevant and timely marketing programs.
Our Interact Suite is comprised of several integrated applications that enable the design, management and automation of tasks and processes for executing marketing campaigns across interactive channels such as email, mobile, social and the web. Customers have the option to purchase access to the entire Responsys Interact Suite or to specific applications within the suite. All of our components are delivered on-demand over the internet, with no hardware or software installation required by our customers. Our on-demand software platform can also be used with third-party applications and data from a variety of sources, allowing our customers to leverage existing data in their interactive marketing activities targeted to their existing customers.
The following diagram illustrates the key interactive channels and the various components of the Responsys Interact Suite:
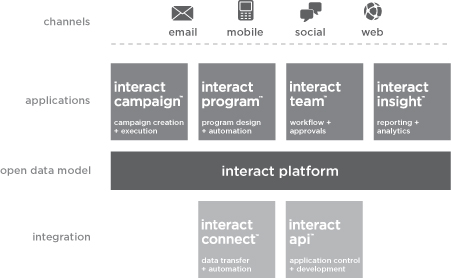
In combination, these components allow marketing teams to create, manage, and automate required tasks and processes for executing email and other marketing campaigns across interactive channels.
Applications
Each application in the Responsys Interact Suite performs a critical function for the interactive marketer.
Interact Campaign: Campaign Creation and Execution
Interact Campaign enables marketers to design campaign content, define rules for personalization, select a target audience and schedule the delivery of that campaign. Key features and capabilities include:
| • | an interface that can be used to build a target audience for each campaign by selecting from various demographic, behavioral, and customer profile attributes; |
| • | a feature that enables each message to include unique content tailored to each recipient; |
| • | an ability to automatically add content generated by third-party applications, such as product recommendation and marketing effectiveness testing products; |
| • | detailed scheduling and launching options that control when messages are delivered to recipients; |
66
Table of Contents
| • | a content quality, preview, and campaign monitoring tools; and |
| • | an interface for creating and publishing content to Facebook and Twitter. |
Interact Program: Program Design and Automation
Interact Program enables marketers to visually design, manage, and automate marketing programs that have multiple stages and are designed to produce an ongoing relationship with consumers. This application is designed for more complex and sophisticated interactions that involve multiple waves of content in a sequence, or that change dynamically in response to customer behavior. Key features and capabilities include:
| • | a library of pre-built program templates, based on industry-specific best practices, that can be used to create marketing communications designed to achieve a range of business objectives; examples include encouraging customers who abandon a shopping cart to purchase the abandoned items and producing repeat customers; |
| • | a visual design interface that presents users with a menu of elements that they can use to design a marketing campaign by placing elements onto a blank screen, or canvas, and linking them together; examples of these elements include timers that indicate when to send an email and branching elements that allow communications to be individualized to a particular audience; |
| • | an ability to orchestrate the sending of messages to a recipient across different channels; |
| • | segmentation tools that allow for audiences within a marketing program to be split for testing or optimization purposes; and |
| • | real-time monitoring reports that display how customers are responding to programs. |
Interact Team: Marketing Process Workflow and Approvals
Interact Team provides a set of management tools to help marketing teams collaborate, stay organized and stay on schedule. This application is especially useful when marketing efforts involve multiple contributors and sub-projects. Key features and capabilities include:
| • | tools for defining how a marketing process will be executed within an organization, including a tool to create visual diagrams that portray the sequence of steps to complete a marketing project, methods for assigning tasks to members of the organization, and a shared calendar for defining and tracking timelines and milestones; |
| • | a notification system that alerts individuals to tasks awaiting action; |
| • | a library that allows contributors to share materials, such as files, images, and copy; and |
| • | an approval system that allows the launching of campaigns immediately following a final approval step. |
Interact Insight: Marketing Reporting and Analytics
Interact Insight provides marketers with tools to understand, analyze, measure and optimize their marketing campaigns. Through a combination of standard reports and more advanced analysis capabilities, Interact Insight helps marketers understand their marketing performance, make informed changes and discover new opportunities to increase their revenue and achieve deeper customer engagement. Key features and capabilities include:
| • | summary reports that can be customized to provide snapshots of key business metrics; |
| • | tools to help marketers graphically view trends and patterns in their campaign results; |
| • | pre-built reports that provide a quick overview of key performance metrics, such as average revenue per campaign and customer response rates, for all campaigns across all channels; |
67
Table of Contents
| • | features that allow users to perform rapid and detailed analysis of performance metrics; and |
| • | an ability to share results across the organization through scheduled report distribution. |
Data and Application Integration
Interact Connect: Data Transfer and Automation
Interact Connect enables marketers to automate the transfer of data to and from the Responsys Interact Suite and their customer data management systems or those of third parties. This helps marketing teams benefit from the wealth of data captured across a variety of systems to improve the relevance of their marketing campaigns. Interact Connect includes the following features and capabilities:
| • | an interface to configure and schedule an exchange of data between Interact and a third-party application or a company’s internal systems; |
| • | tools that allow marketers to define which external data should be inserted into records within the customer’s data tables; and |
| • | integrations with select Responsys partners. |
Interact API: Application Control and Development
The Interact API, or application programming interface, gives developers access to a framework that they can use to create customized software programs to suit their needs and that can, for example, trigger marketing activities or automatically integrate data into our platform. This gives companies more control over the marketing interactions with their customers by synchronizing their internal systems with the capabilities of the Responsys Interact Suite. The Interact API can be used to:
| • | automatically trigger a marketing message or series of messages to a recipient when an event occurs on a company’s website, such as a purchase or registration; |
| • | continuously synchronize customer data between internal databases and our platform; |
| • | load content from internal systems into our platform for use in subsequent campaigns; and |
| • | automatically update properties or settings of upcoming campaigns. |
Our Services
We complement our on-demand software platform with a range of professional services that are designed to drive marketing success for our customers. Our experienced team brings region- and industry-specific methodologies and best practices to help our customers accelerate the implementation and execution of their marketing efforts, increase their revenue from interactive channels and improve their return on overall marketing spend. Our technical services include a variety of capabilities such as setting up our platform for use by new customers, data architecture design, program design and content management, all of which help our customers implement and use our products.
Our professional services include:
| • | Strategic services. Our team helps companies add structure to the art of marketing. For example, we help our customers design their marketing strategy, prepare marketing plans that align specific, actionable tactics with these strategies at every stage and assist with the measurement and analyses of the effectiveness of their marketing programs. |
| • | Creative services. Our team of designers, developers and copywriters works directly with marketing strategists, technical specialists, and account managers to provide creative services such as copywriting and design services for marketing programs. |
68
Table of Contents
| • | Deliverability services. We assist our customers in navigating the wide variety of factors that determine whether an email reaches an inbox, is diverted by filters or bounces back. For example, our email delivery audit service provides a comprehensive review of opt-in, opt-out, and privacy policies, deliverability metrics and the creative structure and content of emails. We also work with internet service providers on a regular basis to maintain high deliverability rates for all Responsys customers. |
| • | Campaign services. Our campaign execution and deployment services support the full campaign development lifecycle and provide services such as software programming, testing, live campaign launches and reporting. |
| • | Education services. Our education services include classroom training, live online training or private sessions to help our customers successfully launch campaigns and multi-stage programs. We also offer advanced education programs for experienced users. |
We offer several services models to provide our customers with flexibility in selecting the level of service that best meets their needs, ranging from collaborating on individual marketing program elements, such as strategy consulting or creative design, to completely outsourcing the execution of their interactive marketing programs.
How Customers Engage with Responsys
We believe that a highly collaborative relationship with our customers is an important element of enabling marketing success. The following illustrates how our customers typically interact with us:
Onboarding and consulting. At the inception of the customer relationship, our services consultants lead the customer through a thorough process to define their requirements, establish an appropriate data model, configure campaign options and train their users. Additionally, Responsys’ professional services consultants can be engaged to help customers establish their marketing objectives, define the highest impact marketing programs and recommend campaign best practices.
Data. Our customers frequently use data such as customer names, contact information, purchase history and other attributes from a variety of different sources in our platform. This data is taken from their own or third-party, data management systems. Our services consultants often assist with the integration between these systems and our platform as well as the process of importing the data. Customers can then access and manage that data using web-based tools within the Responsys Interact Suite to create target lists for outbound marketing campaigns, or to enable more relevant delivery of content.
Campaign content. Our customers can upload digital content into our platform from their own systems, or they can utilize tools provided within the Responsys Interact Suite. Some of our customers have in-house personnel that generate this content, and others use our professional services consultants to produce graphic designs, copy and campaign templates for them.
Campaign execution. Our customers can use the capabilities of the Responsys Interact Suite to design, schedule and execute marketing campaigns, or we can manage these tasks for them. Campaigns may range from simple one-time campaigns to complex campaigns with multiple stages across multiple interactive channels, spanning the customer lifecycle. By leveraging the functionality with the Responsys Interact Suite, customers can automate complex programs.
Reporting and analysis. Our platform provides standard, pre-configured reports as well as tools to create customized reports and download data for analysis in third-party systems. They may also engage our professional services consultants to create and customize reports and assist in analyzing the data and identifying opportunities to improve campaign performance.
69
Table of Contents
Our Growth Strategy
The key elements of our growth strategy are:
Expand our relationships with existing customers. As our offerings become increasingly integral to our customers’ marketing success, we believe that we gain a variety of opportunities to grow our business with them.
| • | Increasing messaging volumes. We intend to grow messaging volume and increase messaging frequency from our customer base by helping them increase the number of people they can market to, the channels across which they market and the effectiveness of their marketing communications. |
| • | Cross-selling functionality. We intend to cross-sell additional functionality to our customers as their marketing programs become more complex and extend from email into additional interactive marketing channels. For example, to date, our customers have primarily used email messages for their interactive marketing campaigns, but we plan to sell them functionality that will allow them to also use additional channels such as mobile, social and the web for their campaigns. |
| • | Expanding deployments with existing customers. We intend to expand the adoption of our solution within existing customers’ organizations, particularly with divisions that have not previously used our platform. |
Expand our customer base. We believe that many organizations are still in the early stages of adopting relationship marketing across interactive channels, which provides us with a significant opportunity to acquire new customers.
| • | Enabling new groups of customers. We believe a significant portion of the market includes companies that either have not previously had a need for technology-based marketing or are currently using less sophisticated applications that were not designed for more advanced email and cross-channel interactive marketing. |
| • | Expanding into adjacent customer segments. While we currently target enterprise and larger mid-market customers, we intend to expand our presence in the mid-market customer segment to target companies that, for example, are likely to send over one million email messages per month. We have added sales and lead generation personnel to target this additional customer segment. |
| • | Expanding international footprint. We intend to increase our presence in international markets through additional investments in sales, marketing and support capabilities, and acquisitions of companies serving additional geographies. These investments would allow us to serve more English-speaking markets in Europe and Asia and to localize our on-demand software for use in other areas. |
Develop new capabilities and channels. We believe there are many additional opportunities for growth.
| • | Adding new capabilities and functionality. We intend to develop new capabilities and functionality for the Responsys Interact Suite to enable marketing through channels such as web-based and social media display advertising and drive increased usage. |
| • | Expanding partnerships. We believe we can drive additional efficiency in our business by expanding the breadth of our partner network and driving greater revenue from new indirect sales partnerships. |
Customers
Our customers are of varied size across a wide variety of industries, including retail and consumer, travel, financial services and technology. Our customers also include advertising agencies who partner with us to use our on-demand software on behalf of their customers. We had 212, 239, 246 and 277 customers as of December 31, 2007, 2008, 2009 and 2010, respectively. We define our number of customers as of the end of a particular quarter as direct-billed subscription customers with $3,000 or more in committed subscription revenue in that quarter. Some of our customers are divisions or subsidiaries of larger organizations that have purchased
70
Table of Contents
our solution. Given the independent nature of our engagement across sales, support, billing and services, as well as their segmented usage of our product, we treat these components of an organization as separate customers. If we did not treat these independent purchasing units as separate customers, we would have had 250 customers as of December 31, 2010.
Some of our largest customers by industry, based on total revenue per customer for the year ended December 31, 2010, include:
| Retail and Consumer Lands’ End, Inc. LEGO Brand Retail, Inc. Newegg, Inc. PHE, Inc. Sears Holdings Management Corporation StubHub, Inc. Williams-Sonoma, Inc. |
Travel Carlson Continental Airlines, Inc. Deutsche Lufthansa AG Dollar Thrifty Automotive Group, Inc. Intrawest ULC Orbitz, LLC Southwest Airlines Co. | |
| Financial Services AccountNow, Inc. American Family Mutual Insurance Company Bank of the West KeyBank National Association Metropolitan Property and Casualty Insurance Company MORE TH>N, an affiliate of RSA Insurance Group plc Quicken Loans Inc. |
Technology Epson America, Inc. Lenovo salesforce.com, inc. Snapfish by HP Thomson Reuters E-Channel, an affiliate of West Services, Inc. Trend Micro Inc. YouSendIt, Inc. | |
For the years ended December 31, 2008, 2009 and 2010 no single customer accounted for more than 10% of our total revenue.
Sales and Marketing
We sell our on-demand software and services primarily through our direct sales force. As of December 31, 2010, we had 36 employees in our direct sales force, which includes field sales representatives, sales management and sales consultants. Our sales force is organized by the size of the target customer as well as by geographic region. We primarily target enterprise and larger mid-market customers that seek to implement more advanced marketing programs across interactive channels. Our typical sales cycle with a prospective customer begins with the generation of a sales lead, which is followed by an assessment of the customer’s requirements, sales presentations and product demonstrations. Our sales cycle can vary substantially from customer to customer, but typically requires four to six months depending on the size and complexity of the opportunity.
In addition to new customer sales, our account management organization actively sells additional solutions and services to our existing customers to enable them to refine and expand their interactive marketing programs.
Our marketing efforts and lead generation activities consist primarily of customer referrals, internet advertising, telemarketing, social, trade shows and industry events and press releases. Within the customer organization, our marketing programs target company executives, marketing professionals and senior business leaders. We also host frequent conferences where customers both participate in and present a variety of programs designed to help accelerate marketing success with our integrated platform.
71
Table of Contents
Account Management and Customer Support
We provide account management and customer support services focused on making our customers’ marketing programs successful.
Account management. Our account managers serve as the primary point of contact for our customers and work closely with them to perform assessments of their interactive marketing programs, benchmark their programs against industry best practices, develop action plans for achieving their objectives and execute on those plans. Our account managers are also responsible for cross-selling additional functionality to our customers.
Customer support. Our customer support services provide our customers with product support by phone or email from multiple offices worldwide. We offer a multi-tier support structure that provides varying levels of service level commitments depending on the customer’s requirements. We also provide an online customer portal called Responsys Share, that contains information, insights and interactive tools to help customers answer questions and share best practices information in order to improve the speed, effectiveness and return on investment of their interactive marketing programs.
Technology
The Responsys Interact Suite is delivered over the internet using a technology platform designed to meet the demands of email and cross-channel interactive marketers. Our technology platform has several key design elements:
Scalability. Our platform supports hundreds of millions of email, mobile, social and web site addresses, generates and sends billions of messages per month, and is designed to accommodate significant seasonal increases in transaction volumes.
Flexibility. Our open data model enables our customers to use existing consumer data from a variety of sources, including their own and third-party customer data management systems in their marketing campaigns. It also allows them to organize the data using tables, filters and field names.
High availability. Our platform supports ongoing, carefully coordinated marketing programs that require delivery of targeted messages across multiple channels at specified times or in response to specific actions; the availability of personalized web site landing pages when a consumer clicks on a message; and real-time measurement, tracking and reporting.
Security. Our platform is multi-tenant with each customer’s data partitioned to prevent comingling. The infrastructure is continually monitored by several layers of network security including a variety of intrusion detection systems. Customer communications to and from our platform are SSL-encrypted.
Ease of use. Our applications use visual design tools to simplify the creation and management of complex marketing campaigns and programs.
Low cost. Because our platform is accessed through the web, our on-demand software does not require our customers to implement or install additional IT infrastructure.
Deliverability. Our infrastructure is also designed to ensure optimal performance in the delivery of content to users. The delivery mechanisms vary by channel:
| • | for email, messages are assembled within our platform and delivered to ISPs from our own simple mail transfer protocol and mail transfer agent layer; |
72
Table of Contents
| • | for mobile messages, content is assembled within our platform and delivered to mobile handsets through a partnership with a third-party mobile aggregator who maintains direct connections with mobile carriers worldwide; |
| • | for social networks, content is assembled within our platform and delivered to Facebook and Twitter via APIs; |
| • | for website pages including forms and landing pages, content is assembled within our platform and served using our own content serving engine; and |
| • | for the millions of images displayed, this content is cached on our content delivery network partner’s thousands of data centers. |
Operations
We serve our customers primarily from a third-party data center located in San Jose, California. The current term of our services agreement for this data center expires in January 2013. We also use another third-party data center located in Sacramento, California. We use a variety of methods to provide physical, personnel, network, application, and data security. Our infrastructure is continuously monitored using a variety of tools to minimize the risk of failure. We conduct regular system tests and vulnerability assessments and provide advance notice when maintenance is performed. However, in the event of a failure, we have engineered our data centers with backup and redundancy programs designed to ensure business continuity.
Research and Development
We devote a substantial portion of our resources to developing new solutions and enhancing existing solutions, conducting software and quality assurance testing and improving our core technology. We continually enhance our existing software platform and develop new applications to meet our customers’ changing interactive marketing needs.
Our technical staff monitors and tests our software on a regular basis, and we maintain a regular release process to refine, update, and enhance our existing solutions. We typically deploy new releases of our on-demand software three to four times per year, although software patches may be released more frequently as needed.
Research and development expense totaled $5.1 million, $8.1 million and $10.6 million for the years ended December 31, 2008, 2009 and 2010, respectively.
Competition
The overall market for interactive marketing software is fragmented and highly competitive, with a wide variety of customer requirements depending on the size and profile of the customer. Barriers to entry can be low, particularly in segments focused on a single marketing channel. We provide on-demand, cross-channel interactive marketing applications and services targeting primarily enterprise and larger mid-market companies. We face significant competition from both technology providers and marketing services providers, some of which have broader software and services offerings and greater name recognition and resources than we have. To a lesser extent, we compete with internally developed and maintained solutions.
Our primary competitors include:
| • | technology providers such as Aprimo, Inc., which has been acquired by Teradata Corporation, BlueHornet, a subsidiary of Digital River, Inc., Eloqua Corporation, ExactTarget, Inc., Silverpop Systems Inc., StrongMail Systems, Inc. and Unica Corporation, which has been acquired by IBM; and |
| • | marketing services providers such as Acxiom Digital, Epsilon Data Management LLC and Experian CheetahMail and Yesmail, a division of infoGROUP Inc. |
73
Table of Contents
We believe the principal competitive factors in our markets include:
| • | product features, effectiveness, interoperability and reliability; |
| • | strength of professional services organization; |
| • | cross-channel integration; |
| • | ability to scale; |
| • | pace of innovation and product roadmap; |
| • | domain expertise in interactive marketing; |
| • | price of products and services; |
| • | customer support and training; |
| • | integration with third-party applications and data sources; |
| • | return on investment; |
| • | ease of use; and |
| • | size and financial stability of operations. |
Government Regulation
Consumer Protection Regulations
Our customers use our on-demand software to generate marketing campaigns that send messages to consumers across email, mobile, social and/or web-based channels. Commercial communications using these channels are governed by certain U.S. and foreign laws and regulations. With respect to email campaigns, for example, in the United States, the Controlling the Assault of Non-Solicited Pornography and Marketing Act of 2003, or the CAN-SPAM Act, establishes certain requirements for the distribution of “commercial” email messages and provides for penalties for transmission of commercial email messages that are intended to deceive the recipient as to source or content.
Although the CAN-SPAM Act preempts most state restrictions specific to email marketing, it does provide for certain exceptions with respect to rules against falsity or deception in commercial email, fraud and computer crime. The scope of these exceptions is not settled, and some states have adopted email regulations that, if upheld, could impose liabilities and compliance burdens in addition to those imposed by the CAN-SPAM Act. Moreover, some foreign jurisdictions, such as Australia, Canada and the European Union, have also enacted laws that regulate sending email, some of which are more restrictive than U.S. laws.
With respect to text message campaigns, for example, the CAN-SPAM Act and regulations implemented by the U.S. Federal Communications Commission pursuant to the CAN-SPAM Act, and the Telephone Consumer Protection Act, also known as the Federal Do-Not-Call law, among other requirements, prohibit companies from sending specified types of commercial text messages unless the recipient has given his or her prior express consent. Additionally, our customers collect and use personal information about consumers to conduct their marketing campaigns, which subjects them to federal, state and foreign privacy laws that regulate the use, collection and disclosure of consumers’ personal information. In European Union member states and certain other countries outside the United States, data protection is more highly regulated and rigidly enforced. Non-compliance with these laws and regulations carries significant financial penalties.
Our terms and conditions require that our customers comply with all applicable laws, including, among others, the CAN-SPAM Act and the Federal Do-Not-Call law, in the use of our on-demand software and hold them liable for any violations of such laws. If we become aware that a customer has violated a law applicable to its marketing activities while using our on-demand software and/or breached our terms and conditions, we can
74
Table of Contents
suspend or terminate its use of our on-demand software and professional services. Although we believe that our customers’ use of our on-demand software will comply with existing laws, if challenged, we may not be able to demonstrate adequate compliance with existing or future laws or regulations.
Tax Regulations
The applicability of sales taxes to our subscription services in various jurisdictions is unclear. With respect to a U.S. state’s ability to impose obligations to collect taxes, fees or surcharges with respect to sales made over the internet, the U.S. Supreme Court’s decision in Quill Corporation v. North Dakota currently requires that a taxpayer have a physical presence within the state before the state can collect such taxes. However, the U.S. Supreme Court has provided little guidance as to what levels of contacts constitute a physical presence, and no assurance can be given that we will not be found to have a physical presence in certain U.S. states based on, for example, our affiliations with other businesses that have a physical presence in the state.
Furthermore, a number of states, as well as the U.S. Congress, have been considering or have adopted initiatives regarding sales and use taxes on internet sales. If these initiatives are successful, we could be required to collect sales and use taxes in a number of states or change our business practices. The imposition by state and local governments of various taxes, fees and surcharges upon internet commerce could result in administrative burden, put us at a competitive disadvantage if similar obligations are not imposed on all or substantially all of our online competitors and negatively affect our future sales. Any of these developments could adversely affect our results of operations.
Intellectual Property
Our intellectual property rights are important to our business. We rely on a combination of copyright, trade secret, trademark and other rights in the United States and other jurisdictions, as well as confidentiality procedures and contractual provisions to protect our proprietary technology, processes and other intellectual property.
Employees
As of December 31, 2010, we had approximately 488 employees. None of our employees are represented by a labor union.
Facilities
Our corporate headquarters occupy approximately 31,000 square feet in San Bruno, California under subleases that expire in June 2012. Our corporate headquarters accommodates our principal engineering, sales, marketing, operations and finance and administrative activities. In addition to our corporate headquarters in San Bruno, as of December 31, 2010, we leased office space in Carlsbad, Chicago, Denver, New York, San Francisco, Seattle and the United Kingdom for local sales and professional services personnel. These facilities total approximately 35,000 square feet. We also recently opened and began operations at a new development center in Bangalore, India. At this time, we believe our facilities are adequate for our near term operational and business needs. We intend to add new facilities and expand our existing facilities as we add employees and expand our markets, and we believe that suitable additional or substitute space will be available as needed to accommodate any such expansion of our operations.
Litigation
From time to time we may become involved in various legal proceedings in the ordinary course of our business, and may be subject to third-party infringement claims. Even claims that lack merit could result in significant legal expenses and use of managerial resources.
75
Table of Contents
Executive Officers and Directors
The following table provides information regarding our executive officers and directors as of March 31, 2011:
| Name |
Age |
Position(s) | ||
| Daniel D. Springer |
47 | Chief Executive Officer and Chairperson | ||
| Christian A. Paul |
50 | Chief Financial Officer | ||
| Antonio Casacuberta |
50 | Chief Technology Officer and Vice President of Engineering | ||
| Edward A. Henrich |
46 | Senior Vice President of Professional Services | ||
| Scott V. Olrich |
39 | Chief Marketing and Sales Officer | ||
| Julian K. Ong |
44 | Vice President, General Counsel and Secretary | ||
| Andrew W. Priest |
48 | Chief Customer Officer | ||
| Donald E. Smith |
52 |
Chief Information Officer | ||
| Robert W. Frick(1)(3)(4) |
73 | Director | ||
| Edwin J. Gillis(1) |
62 |
Director | ||
| Bruce Golden(2) |
52 | Director | ||
| Gregory C. Gretsch(2)(3) |
44 | Director | ||
| Michael N. Schuh(1)(2) |
67 | Director | ||
| (1) | Member of the Audit Committee. |
| (2) | Member of the Compensation Committee. |
| (3) | Member of the Nominating and Corporate Governance Committee. |
| (4) | Lead Independent Director. |
Daniel D. Springer has served as our Chief Executive Officer and Chairperson since April 2004. From April 2002 to February 2004, Mr. Springer was Managing Director in the San Francisco office of Modem Media, an interactive marketing agency that was acquired by Digitas Inc. in 2004. From September 2000 to July 2001, Mr. Springer was the Chief Executive Officer of Telleo, Inc., an online communication platform linking local businesses and consumers. From December 1997 to September 2000, Mr. Springer was Chief Marketing and Sales Officer and General Manager for NextCard, Inc. Mr. Springer holds an M.B.A. from Harvard University and a B.A. in Mathematics and Economics from Occidental College. We believe that Mr. Springer should serve as a member of our board of directors based on his historic knowledge of our company and operational expertise as our Chief Executive Officer, which brings continuity to our board of directors.
Christian A. Paul has served as our Chief Financial Officer since August 2006. From April 2002 to May 2005, Mr. Paul served as Vice President of Finance and Administration and Chief Financial Officer at Determine Software Inc., a provider of enterprise contract management solutions. From 1994 to 2002, Mr. Paul held several posts as Chief Financial Officer, including at Integral Systems, Inc., ICVerify, Inc., Cloudscape, Inc. and Linuxcare, Inc. Mr. Paul began his career at Ernst & Young as a Chartered Accountant in South Africa. Mr. Paul holds a post-graduate degree in Accounting and Taxation and a Bachelor of Commerce degree from the University of Cape Town, South Africa.
76
Table of Contents
Antonio Casacuberta has served as our Chief Technology Officer and Vice President of Engineering since August 2007. From July 1999 to June 2006, Mr. Casacuberta held various positions at Infospace, Inc., a metasearch technology company, most recently as its Chief Technology Officer. From 1989 to 1999, Mr. Casacuberta held various positions at Oracle Corp., most recently as Director of Development. Mr. Casacuberta holds a B.S. degree in Computer Science from Boston University.
Edward A. Henrich has served as our Senior Vice President of Professional Services since January 1, 2010. From April 2007 to July 2007, he served as our Vice President of Strategic Services and from July 2007 until December 2009, he served as our Vice President of Professional Services. From September 2005 to January 2010, Mr. Henrich served as President of Henrich Enterprises, Inc., a provider of integrated email marketing and web analytics. From February 2007 to November 2009, Mr. Henrich was President of DragonVista, LLC, an automated website monitoring service. From 2001 to September 2005, Mr. Henrich held various positions at Yesmail.com Inc., an email marketing solutions provider acquired by InfoGROUP, Inc., most recently as President. Mr. Henrich holds a B.S. in Mechanical Engineering from Drexel University, and an M.S. in Aerospace Engineering and a Ph.D. in Mechanical Engineering, both from the University of California, Los Angeles.
Scott V. Olrich has served as our Chief Marketing and Sales Officer since August 2004. From May 1998 to July 2004, Mr. Olrich served in various positions at Topica, Inc., an email marketing application service provider, most recently as Vice President of Business Development from October 2001 to July 2004. From January 1997 to August 1998, Mr. Olrich served as Vice President of Sales and Business Development at Spark Online Inc., a provider of interactive automated marketing solutions which he co-founded. From February 1993 to February 1997, Mr. Olrich was a senior consultant at Accenture. Mr. Olrich holds a B.S. in Business and Finance from San Diego State University.
Julian K. Ong has served as our Vice President, General Counsel and Secretary since May 2010. From August 2006 to May 2010, Mr. Ong served as Vice President, General Counsel and Secretary of SuccessFactors, Inc. an on-demand business execution software solutions provider. From September 2002 to July 2006, Mr. Ong served in various capacities in the legal department of salesforce.com, inc., an on-demand customer relationship management application company, most recently as Deputy General Counsel. From January 2000 to August 2002, Mr. Ong was an associate at the law firm of Skadden, Arps, Slate, Meagher & Flom LLP. Mr. Ong holds a B.S. and an M.S. in Electrical Engineering from Stanford University and a J.D. from University of California, Berkeley School of Law.
Andrew W. Priest has served as our Chief Customer Officer since October 2005. From November 2002 to November 2004, Mr. Priest was Executive Vice President of Customer Operations at Open Harbor, an international trade logistics software company that was acquired by TradeBeam Holdings, Inc. in December 2004. From 2001 to 2002, Mr. Priest served as Senior Vice President of Professional Services at Epiphany Inc., a provider of enterprise-level CRM solutions. From 1999 to 2001, Mr. Priest served as Senior Vice President of Worldwide Field Operations at Brightware, Inc., a provider of call center CRM solutions. Mr. Priest holds a B.S. in Computer Science from the State University of New York at Albany.
Donald E. Smith has served as our Chief Information Officer since May 2006. From August 2005 to April 2006, Mr. Smith was a Venture Partner at Sigma Partners, a venture capital firm. During 2005, Mr. Smith also provided technical and business consulting services to a number of on-demand businesses. From 2000 to 2004, Mr. Smith was the Senior Vice President of Customer Advocacy at Extensity, Inc., an internet-based employee relationship management solutions company that was acquired by Geac Computer Corporation Limited in 2002. Mr. Smith holds a B.S. in Electrical Engineering from the University of Nebraska, Lincoln.
Robert W. Frick has served as a member on our board of directors since August 2002. Since 1988, Mr. Frick has served as Chairman of K.E.S. Management. From 1963 to 1974 and from 1976 to 1988, Mr. Frick served in various capacities at Bank of America, including as Vice Chairman of the board of directors, Chief Financial
77
Table of Contents
Officer, Head of the World Banking Group for Bank of America, Managing Director of BankAmerica International, and President of Bank of America’s venture capital subsidiary. Mr. Frick currently serves on the board of directors of several private companies, including Charles Schwab Bank, a subsidiary of The Charles Schwab Corporation, and Lucas Film Limited. From April 2003 to February 2009 Mr. Frick served on the board of directors of Telik, Inc. Mr. Frick is currently an Adjunct Professor of Business Strategy in the graduate business program at St. Mary’s College of California. Mr. Frick holds a B.S. degree in Civil Engineering and an M.B.A. degree from Washington University in St. Louis, Missouri. We believe that Mr. Frick should serve as a member of our board of directors based on his extensive corporate management experience at Bank of America, financial expertise, his specific knowledge of our company and his service as a director of other companies.
Edwin J. Gillis has served on our board of directors since March 2011. Mr. Gillis has worked as a business consultant and private investor since January 2006. Most recently, Mr. Gillis was an executive advisor at Skype S.a.r.l. where he was engaged by Silver Lake Partners from October 2009 to February 2010 as part of their acquisition of Skype. Previously, he was the interim Chief Financial Officer at Avaya Inc. where he was engaged by TPG Partners and Silver Lake Partners from November 2007 to July 2008 as part of their acquisition of Avaya. From 1991 to 2005, Mr. Gillis held several posts as Chief Financial Officer: at Veritas Software Corporation from 2002 to 2005, at Parametric Technology Corporation from 1995 to 2002 and at Lotus Development Corporation from 1991 to 1995. Prior to joining Lotus, Mr. Gillis was a Certified Public Accountant and partner at Coopers & Lybrand L.L.P. Mr. Gillis serves as a director of Teradyne, Inc. and LogMeIn, Inc. Mr. Gillis also served as a director of BladeLogic, Inc. from 2007 until its acquisition by BMC Software in 2008. Mr. Gillis holds a B.A. in Government from Clark University, an M.A. in International Relations from the University of Southern California and an M.B.A. from Harvard Business School. We believe that Mr. Gillis should serve as a member of our board of directors based on his extensive experience with issues confronting global technology companies and financial reporting expertise as a former Chief Financial Officer of several publicly-traded technology companies.
Bruce Golden has served as a member on our board of directors since December 1998. Mr. Golden is a partner at Accel Partners, a venture capital firm, which he joined in 1997. Mr. Golden has led a number of investments in enterprise software and internet-related companies while at Accel and currently serves as a member of the board of directors of comScore, Inc., Qlik Technologies Inc. and several private companies. Mr. Golden holds an M.B.A. from Stanford University and a B.A. in Political Science from Columbia University. We believe that Mr. Golden should serve as a member of our board of directors based on his significant experience in the venture capital industry analyzing, investing in and serving on the boards of directors of enterprise software and SaaS companies, his lengthy experience with our company and the perspective he brings as an affiliate of one of our major stockholders.
Gregory C. Gretsch has served as a member on our board of directors since March 2001. Mr. Gretsch is a managing director at Sigma Partners, a venture capital firm, which he joined in 2000. Prior to joining Sigma Partners, Mr. Gretsch founded Connectify, Inc. in May 1998, which was acquired by Kana Communications, Inc. in August 1999 and co-founded GiftONE in August 1996, which was acquired by SkyMall in October 1997. Mr. Gretsch holds a B.B.A in Management Information Systems from the University of Georgia. We believe that Mr. Gretsch should serve as a member of our board of directors based on his significant experience in the venture capital industry analyzing, investing in and serving on the boards of directors of other technology and marketing companies, his management and leadership experience as a former founder and executive of several startup technology companies and the perspective he brings as an affiliate of one of our major stockholders.
Michael N. Schuh has served as a member on our board of directors since December 1998. From August 1998 to the present, Mr. Schuh has served as a Managing Member of Foundation Capital, a venture capital firm. Prior to joining Foundation Capital, Mr. Schuh was a founder and Chief Executive Officer of Intrinsa Corporation, a supplier of productivity solutions for software development organizations from 1994 to 1998. Mr. Schuh served on the board of directors of Netflix Inc. from February 1999 to May 2010. He also serves on the board of directors of several private companies. Mr. Schuh holds a B.S.E.E. from the University of Maryland.
78
Table of Contents
We believe that Mr. Schuh should serve as a member of our board of directors based on his significant experience in the venture capital industry analyzing, investing in and serving on the boards of directors of software companies, his management and leadership experience as a co-founder and Chief Executive Officer of a software company and the perspective he brings as an affiliate of one of our major stockholders.
Election of Officers
Our executive officers are elected by, and serve at the discretion of, our board of directors. There are no family relationships among any of our directors or executive officers.
Board Composition
Our bylaws authorize seven directors and our board of directors currently consists of six members. Our directors were elected pursuant to our articles of incorporation and an investors’ rights agreement by and among us and certain holders of our preferred and common stock as follows:
| • | Messrs. Springer, Frick and Gillis were elected as the designees of stockholders who hold a majority of the outstanding shares of our common stock and preferred stock; |
| • | Messrs. Schuh and Golden were elected as the designees of stockholders who hold a majority of the outstanding shares of our Series A Preferred Stock; and |
| • | Mr. Gretsch was elected as the designee of stockholders who hold a majority of the outstanding shares of our Series C Preferred Stock. |
The voting provisions of the investors’ rights agreement by which the directors were elected will terminate in connection with this offering, and there will be no further contractual obligations regarding the election of our directors. Our current directors will continue to serve as directors until their resignations or until their successors are duly elected by the holders of our common stock.
Under our restated certificate of incorporation and bylaws that will be in effect at the closing of this offering, our board of directors will be authorized to determine the size of our board of directors.
Classified Board
Our restated certificate of incorporation and bylaws that will be in effect at the closing of this offering will provide for a classified board of directors consisting of three classes of directors, each serving staggered three-year terms. Our directors will be divided among the three classes as follows:
| • | Class I directors will be Messrs. Golden and Schuh, whose initial term will expire at the annual meeting of stockholders to be held in 2012; |
| • | Class II directors will be Messrs. Frick and Gretsch, whose initial term will expire at the annual meeting of stockholders to be held in 2013; and |
| • | Class III directors will be Messrs. Gillis and Springer, whose initial term will expire at the annual meeting of stockholders to be held in 2014. |
Directors for a particular class will be elected for three-year terms at the annual meeting of stockholders in the year in which their term expires. As a result, only one class of directors will be elected at each annual meeting of our stockholders, with the other classes continuing for the remainder of their respective three-year terms. Each director’s term continues until the election and qualification of his successor, or his earlier death, resignation or removal.
79
Table of Contents
Our restated certificate of incorporation and bylaws that will be in effect at the closing of this offering will provide that only our board of directors may fill vacancies on our board of directors until the next annual meeting of stockholders. Any additional directorships resulting from an increase in the number of directors will be distributed among the three classes so that, as nearly as possible, each class will consist of one-third of the total number of directors.
The classification of our board of directors and provisions described above may have the effect of delaying or preventing changes in our control or management. See “Description of Capital Stock—Anti-Takeover Provisions—Restated Certificate of Incorporation and Restated Bylaws Provisions.”
Director Independence
We have applied to list our common stock on the NASDAQ Global Market. The listing rules of The NASDAQ Stock Market require that a majority of the members of our board of directors be independent. In October 2010, our board of directors undertook a review of its composition and the independence of each director. Based upon information requested from and provided by each director concerning his background, employment and affiliations, our board of directors determined that none of our non-employee directors has a relationship that would interfere with the exercise of independent judgment in carrying out the responsibilities of a director and that each of these directors is “independent” as that term is defined under the rules of The NASDAQ Stock Market. In making this determination, our board of directors considered the relationships that each non-employee director has with our company and all other facts and circumstances our board of directors deemed relevant in determining their independence, including the beneficial ownership of our capital stock by each non-employee director. The independence of our board committee members is discussed below.
Board Committees
Our board of directors has established an audit committee, a compensation committee and a nominating and corporate governance committee, each of which will have the composition and responsibilities described below as of the closing of this offering. Members serve on these committees until their resignations or until otherwise determined by our board of directors.
The listing rules of The NASDAQ Stock Market require that each member of our board committees be independent. Under special phase-in rules applicable to initial public offerings, we have 12 months from our date of listing on the NASDAQ Global Market to comply with these requirements. Our board of directors has evaluated the independence of each member of our board committees under the applicable listing rules and, with respect to the members of the audit committee, Rule 10A-3 of the Exchange Act, and determined that Messrs. Frick and Gillis on our audit committee, Messrs. Golden, Gretsch and Schuh who comprise our compensation committee, and Messrs. Gretsch and Frick who comprise our nominating and corporate governance committee satisfy the independence standards for those committees established by the applicable rules of The NASDAQ Stock Market and the SEC. We intend to evaluate the composition of our audit committee during the 12 months following our date of listing and to comply with the independence requirements for our audit committee before the expiration of the phase-in period.
Audit Committee
Our audit committee is comprised of Messrs. Frick, Gillis and Schuh. All members of our audit committee meet the requirements for financial literacy under applicable listing rules and SEC rules and regulations. Mr. Frick is the chairperson of our audit committee, is our audit committee financial expert, as that term is defined under SEC rules implementing Section 407 of the Sarbanes-Oxley Act of 2002 and possesses financial sophistication, as that term is defined under the rules of The NASDAQ Stock Market. The designation does not impose on Mr. Frick any duties, obligations or liabilities that are greater than are generally imposed on members
80
Table of Contents
of our audit committee and our board of directors. Our audit committee is directly responsible for, among other things:
| • | selecting a firm to serve as the independent registered public accounting firm to audit our financial statements; |
| • | ensuring the independence of the independent registered public accounting firm; |
| • | discussing the scope and results of the audit with the independent registered public accounting firm, and reviewing, with management and that firm, our interim and year-end operating results; |
| • | recommending to the board of directors whether our annual audited financial statements should be included in our annual reports on Form 10-K; |
| • | developing procedures for employees to anonymously submit concerns about questionable accounting or audit matters; |
| • | considering the adequacy of our internal accounting controls and audit procedures; and |
| • | pre-approving all audit and non-audit services to be performed by the independent registered public accounting firm. |
Compensation Committee
Our compensation committee is comprised of Messrs. Schuh, Golden and Gretsch. Mr. Schuh is the chairperson of our compensation committee. Each member of this committee is a non-employee director, as defined pursuant to Rule 16b-3 promulgated under the Securities Exchange Act of 1934, as amended, and an outside director, as defined pursuant to Section 162(m) of the Internal Revenue Code of 1986, as amended. Our compensation committee is responsible for, among other things:
| • | reviewing and approving, or recommending that our board of directors approve, the compensation of our executive officers; |
| • | reviewing and recommending to our board of directors the compensation of our directors; |
| • | reviewing and approving the terms of any material agreements with our executive officers; |
| • | administering our stock and equity incentive plans; |
| • | reviewing and making recommendations to our board of directors with respect to incentive compensation and equity plans; and |
| • | establishing and reviewing our overall compensation philosophy. |
Nominating and Corporate Governance Committee
Our nominating and corporate governance committee is comprised of Messrs. Gretsch and Frick. Mr. Gretsch is the chairperson of our nominating and corporate governance committee. Our nominating and corporate governance committee is responsible for, among other things:
| • | identifying, evaluating and recommending nominees to our board of directors and committees of our board of directors; |
| • | conducting searches for appropriate directors; |
| • | evaluating the performance of our board of directors; |
| • | considering and making recommendations to our board of directors regarding the composition of our board of directors and its committees; |
| • | reviewing related party transactions and proposed waivers of the code of conduct; |
| • | reviewing developments in corporate governance practices; and |
| • | evaluating the adequacy of our corporate governance practices and reporting. |
81
Table of Contents
Each committee has a written charter approved by our board of directors. Following the closing of this offering, copies of each charter will be available in the investor relations section of our website.
Board Leadership Structure and Risk Oversight
Our board of directors believes that it should maintain flexibility to select a chairperson and board leadership structure from time to time. Our board of directors does not have a policy on whether the role of the chairperson and chief executive officer should be separate and believes that it is currently in the best interest of the company and its stockholders for Mr. Springer to serve in both roles, in light of his knowledge of our company and its industry. His ability to speak as chairperson and chief executive officer also provides strong unified leadership for our company.
Our board of directors has established corporate governance principles in connection with this offering which state that when the chairperson and chief executive officer positions are held by the same person, a lead independent director should also be appointed. Because Mr. Springer is our Chief Executive Officer and Chairperson, our board of directors appointed Mr. Frick to serve as our lead independent director. As lead independent director, Mr. Frick will, among other responsibilities, preside over regularly scheduled meetings at which only our independent directors are present, serve as a liaison between the chairperson and the independent directors, and perform such additional duties as our board of directors may otherwise determine and delegate.
Our board is primarily responsible for overseeing our risk management processes. Our board, as a whole, determines the appropriate level of risk for our company, assesses the specific risks that we face and reviews management’s strategies for adequately mitigating and managing the identified risks. Although our board administers this risk management oversight function, our audit committee, nominating and corporate governance committee and compensation committee support our board in discharging its oversight duties and address risks inherent in their respective areas. We believe this division of responsibilities is an effective approach for addressing the risks we face and that our board leadership structure supports this approach.
In particular, the audit committee is responsible for considering and discussing our significant accounting and financial risk exposures and the actions management has taken to control and monitor these exposures. The nominating and corporate governance committee is responsible for considering and discussing our significant corporate governance risk exposures and the actions management has taken to control and monitor these exposures. The compensation committee, with input from our management, is responsible for assisting our board in reviewing and assessing whether any of our compensation policies and programs could potentially encourage excessive risk-taking.
In connection with this offering, management conducted a risk assessment of our compensation plans and practices and concluded that our compensation programs do not create risks that are reasonably likely to have a material adverse effect on the company. The compensation committee has reviewed and agrees with management’s conclusion. The objective of the assessment was to identify any compensation plans or practices that may encourage employees to take unnecessary risk that could threaten the company. No such plans or practices were identified. The risk assessment process included, among other things, a review of our cash and equity incentive-based compensation plans to ensure that they are aligned with our company performance goals and the overall compensation mix to ensure an appropriate balance between fixed and variable pay components and between short- and long-term incentives.
Our board will receive reports from the audit, nominating and corporate governance and compensation committees regarding risk management in their areas of responsibility. Our board will consider these reports, and our company’s strategic and enterprise risks more generally, when performing its routine functions and discussing long-term goals. While our board oversees our risk management, company management is responsible for day-to-day risk management processes. Our board expects company management to consider risk and risk management in each business decision, to pro-actively develop and monitor risk management strategies and
82
Table of Contents
processes for day-to-day activities and to effectively implement risk management strategies adopted by the committees and the board.
Compensation Committee Interlocks and Insider Participation
During 2010, our compensation committee consisted of Messrs. Golden, Gretsch and Schuh. None of them has at any time in the last fiscal year been one of our officers or employees, and none has had any relationships with our company of the type that is required to be disclosed under Item 404 of Regulation S-K. None of our executive officers has served as a member of the board of directors, or as a member of the compensation or similar committee, of any entity that has one or more executive officers who served on our board of directors or compensation committee during 2010.
Code of Business Ethics and Conduct
In connection with this offering, our board of directors adopted a code of business ethics and conduct that applies to all of our employees, officers and directors. Following the closing of this offering, the full text of our code of business conduct will be posted on the investor relations section of our website. The inclusion of our website address in this prospectus does not include or incorporate by reference the information on our website into this prospectus. We intend to disclose future amendments to certain provisions of our code of business conduct, or waivers of these provisions, on our website and/or in public filings.
Director Compensation
Prior to this offering, there was no formal policy in place to provide our directors with any cash or equity compensation for their services as members of our board of directors or any committee of our board of directors. Although there was no formal policy in place relating to the granting of options to purchase shares of our common stock to our directors, the following table presents the total compensation for each person who served as an independent member of our board of directors during 2010. Other than as set forth in the table and described more fully below, in 2010 we did not pay any fees to, reimburse any expenses of, make any equity awards or non-equity awards to, or pay any other compensation to the independent members of our board of directors. Mr. Springer, who is our Chief Executive Officer, receives no compensation for his service as a director, and is not included in this table.
| Director Name |
Option Awards ($)(1) |
Total ($) |
||||||
| Robert W. Frick |
$ | 28,200 | $ | 28,200 | ||||
| Bruce Golden |
— | — | ||||||
| Gregory C. Gretsch |
— | — | ||||||
| Michael N. Schuh |
— | — | ||||||
| (1) | Amount reported represents the grant date fair value of a stock option granted to an independent member of our board of directors during 2010 under our 1999 Stock Plan, computed in accordance with ASC 718. The valuation assumptions used in calculating the fair value of the stock options are set forth in note 9 to our consolidated financial statements included elsewhere in this prospectus. The shares subject to the stock option vest in 24 monthly installments beginning on the first monthly anniversary after June 8, 2010. The stock option fully vests upon a change in control and has a ten year term. As of December 31, 2010, none of the independent members of our board of directors held outstanding stock options. In December 2010, Mr. Frick exercised both of his outstanding options to purchase common stock and was issued an aggregate of 37,500 shares of our common stock. As of December 31, 2010, 21,875 shares were unvested and subject to a repurchase right in our favor that lapses on the schedule described in this footnote. |
83
Table of Contents
Our board of directors has adopted a compensation program for our independent directors that will become effective upon the closing of this offering. Pursuant to this program, independent directors are entitled to receive the following compensation:
| • | An annual cash retainer of $25,000. In addition, the lead independent director will receive an annual cash retainer of $3,000; the chair of the audit committee will receive an annual cash retainer of $16,000 and the other members of the audit committee will receive an annual cash retainer of $8,000; the chair of the compensation committee will receive an annual cash retainer of $10,000 and the other members of the compensation committee will receive an annual cash retainer of $5,000; and the chair of the nominating and corporate governance committee will receive an annual cash retainer of $6,000 and the other members of the nominating and corporate governance committee will receive an annual cash retainer of $3,000. |
| • | Starting in 2012, on the date of each annual meeting of our stockholders, each independent director will receive an option to purchase 12,500 shares of our common stock. The option will vest and become exercisable in monthly installments over a one-year period, but will vest and become exercisable in full if we are subject to a change in control. |
Messrs. Golden, Gretsch and Schuh have each decided not to accept any cash compensation for their service as a member on our board of directors.
In addition:
| • | On March 29, 2011, Mr. Gillis was granted an option to purchase 50,000 shares of our common stock, at an exercise price equal to $9.25 per share, the midpoint of the price range set forth on the cover of this prospectus. The option will vest and become exercisable in monthly installments over a three-year period beginning on March 2, 2011, but will vest and become exercisable in full if we are subject to a change in control. |
| • | Upon the closing of this offering, each of Messrs. Golden, Gretsch and Schuh will receive an option to purchase 12,500 shares of our common stock, at an exercise price equal to the price of our common stock on the cover of this prospectus. These options will vest and become exercisable in monthly installments over a one-year period, but will vest and become exercisable in full if we are subject to a change in control. |
Compensation Discussion and Analysis
The following discussion describes and analyzes the material components of our executive compensation program for:
| • | Daniel D. Springer, our Chief Executive Officer, or CEO; |
| • | Christian A. Paul, our Chief Financial Officer; |
| • | Edward A. Henrich, our Senior Vice President, Professional Services; |
| • | Scott V. Olrich, our Chief Marketing and Sales Officer; and |
| • | Julian K. Ong, our Vice President, General Counsel and Secretary. |
We refer to these executive officers collectively in this prospectus as our “named executive officers.”
This section should be read together with the compensation tables and disclosures that follow. This discussion contains forward-looking statements that are based on current plans, considerations, expectations, and determinations regarding future compensation programs. The actual compensation programs that we adopt may differ materially from the current or planned programs summarized in this discussion.
84
Table of Contents
Compensation Philosophy and Objectives
As a provider of on-demand marketing software and professional services, we operate in a highly competitive business environment, which is characterized by frequent technological advances, rapidly changing market requirements, and the emergence of new market entrants. To succeed in this environment, we must continually develop and refine new and existing products and services and demonstrate an ability to quickly identify and capitalize on new business opportunities. We recognize that our success is in large part dependent on our ability to attract and retain talented employees. Therefore, we maintain, and intend to modify as necessary, an executive compensation and benefits program designed to attract, retain, and incentivize a highly talented, deeply qualified, and committed team of executive officers to share our vision and desire to work toward these goals.
We endeavor to create and maintain compensation programs that reward performance and serve to align the interests of our executive officers and stockholders. The principles and objectives of our compensation and benefits program for our executive officers are to provide compensation opportunities that:
| • | attract and retain talented and experienced executive officers; |
| • | motivate and reward executive officers who have the knowledge, skills, and performance to manage the growth of our company and lead us to the next stage of development; |
| • | link company performance and individual achievement to compensation; and |
| • | align the interests of our executive officers and our stockholders by providing our executive officers with long-term incentives to increase stockholder value. |
As we transition to public company status, we intend to evaluate our executive compensation philosophy and objectives and refine our focus on the following principles when formulating our compensation policies and making compensation decisions:
| • | create a direct and meaningful link between company business results, individual performance, and rewards; |
| • | provide for meaningful differentiation in compensation for performance that is below, at, and above target levels; |
| • | ensure that executive officers have the opportunity to share in the success we create; |
| • | grant equity awards that reflect actual and potential contributions to company success; |
| • | ensure that compensation plans and arrangements are simple to communicate and understand; and |
| • | ensure that compensation plans and arrangements are flexible enough to adjust to changing economic circumstances. |
As our needs evolve, we intend to continue to evaluate our philosophy and objectives and compensation programs as circumstances require, and, at a minimum, we will review executive compensation annually.
Compensation-setting Process
Our board of directors, with input from the compensation committee, has been responsible for overseeing our executive compensation program, as well as determining and approving the ongoing compensation arrangements with our CEO and other named executive officers.
Initial Compensation. The initial compensation arrangements with our executive officers, including the named executive officers, were negotiated with each individual executive officer by our CEO, except with respect to his own compensation, with the oversight and final approval of our board of directors. Our CEO’s initial compensation arrangement was determined by our board of directors. Generally, the focus of these arrangements has been to recruit skilled individuals to help us meet our on-demand software development,
85
Table of Contents
customer acquisition, and customer success objectives, while achieving our financial growth goals and obtaining the level of talent and experience needed to further the growth of our company.
Annual Compensation Review. Our board of directors reviews the compensation levels for our executive officers annually. For executive officers other than our CEO, our board of directors has historically considered input from our CEO regarding such executive officers’ responsibilities, performance and compensation. Specifically, our CEO recommends changes to base salary, target levels for cash incentive awards, and advises our board of directors regarding the executive compensation program’s ability to attract, retain and motivate talented executive officers. These recommendations reflect compensation levels that our CEO believes are qualitatively commensurate with an executive officer’s individual qualifications, experience, responsibility level, functional role, knowledge, skills, and individual performance, as well as the performance of our business. Our board of directors considers our CEO’s recommendations, but may adjust components of compensation up or down as it determines in its discretion, and approves the specific compensation for all the executive officers. In connection with its annual review and any reviews that occur during the fiscal year, our board of directors also recommends any equity compensation to be awarded to our executive officers. Authority to make equity award grants to our executive officers currently rests with our board of directors. All such compensation determinations are largely discretionary.
Our CEO makes recommendations to our board of directors, attends board meetings (except for sessions discussing his compensation) and has been and will continue to be heavily involved in the determination of compensation for our executive officers. He abstains from voting in sessions where the board of directors acts on his compensation.
Use of Competitive Data. To date, we have not identified a group of peer companies against which we would compare our compensation practices nor have we benchmarked our executive compensation against that of our competitors.
Role of Compensation Consultant. Neither we nor our board of directors engaged the services of outside consultants and advisors to review and provide advice with respect to our executive officer compensation policies and procedures for 2010, although we and they are authorized to do so. Following a review of our executive compensation program for 2010, we and our board of directors have determined that our existing program satisfies our compensation philosophy and objectives and will remain unchanged for 2011. Although we have no current plans to effect any material changes to our executive compensation program, we expect that the direction, emphasis and components of our program and the associated processes and procedures for implementing our program will continue to evolve as we gain experience operating as a public company. In the future, we or our board of directors may engage an independent compensation consultant to assist us in our evaluation and review of our executive compensation program.
Compensation Program Components
To date, the compensation of our executive officers, including our named executive officers, has typically consisted of base salary, cash incentive awards, equity compensation in the form of stock options, broad-based employee benefits and severance arrangements.
We offer cash compensation in the form of base salaries and cash incentive awards that we believe appropriately recognize and reward our executive officers for their individual contributions to our business. Typically, cash incentive awards are based on our achievement of revenue and/or bookings targets, along with individual performance objectives. For our executive officers except our CEO, these company targets and individual performance objectives are agreed upon between our CEO and each executive officer at the beginning of each half of the fiscal year. Our CEO’s revenue target and individual performance objectives are agreed upon between our CEO and the compensation committee at the beginning of each fiscal year.
86
Table of Contents
Another key component of our executive compensation program has been stock option awards to purchase shares of our common stock. As a privately-held company, we have emphasized the use of stock options to incentivize our executive officers to focus on the growth of our overall enterprise value and, correspondingly, to create value for our stockholders. We use stock options as our sole equity award vehicle. Going forward, we may use stock options, restricted stock units, and other types of equity-based awards, as we deem appropriate, to offer our employees, including our executive officers, long-term equity incentives that align their interests with the long-term interests of our stockholders.
The following describes each component of our executive compensation program, the rationale for each, and how compensation amounts are determined.
Base Salary. To obtain the skills and experience that we believe are necessary to lead our growth, most of our executive officers, including the named executive officers, have been hired from larger organizations. Generally, their initial base salaries were established through negotiation at the time the individual executive officer was hired, taking into account his or her qualifications, experience and prior salary level, while also taking into account that we are a privately-held company seeking to contain costs and cash outlays.
In line with our emphasis on controlling our expenses, our CEO’s base salary has not increased since he was hired in April 2004. Similarly, the base salary for Mr. Olrich has not changed since 2007. In January 2010, we increased Mr. Henrich’s salary by $10,000 to its current level in connection with his promotion to Senior Vice President of Professional Services and in July 2010, we increased Mr. Paul’s base salary for the first time since his hiring in 2006 by $15,000 to bring it in line with those paid to our other executive officers. We hired Mr. Ong in 2010. The base salaries for our named executive officers as of December 31, 2010 are set forth below.
| Named Executive Officer |
2010 Base Salary | |||
| Daniel D. Springer |
$ | 300,000 | ||
| Christian A. Paul |
200,000 | |||
| Edward A. Henrich |
190,000 | |||
| Scott V. Olrich |
200,000 | |||
| Julian K. Ong |
200,000 | |||
Cash Incentive Awards. We use cash bonuses to incentivize our executive officers to achieve our short-term financial and strategic objectives on a semi-annual basis (except for our CEO whose achievement is measured on an annual basis and our General Counsel whose performance is evaluated semi-annually but who does not receive cash incentive awards) while making progress towards our longer-term growth and other goals. Each executive officer that is entitled to receive a cash incentive award has a pre-determined semi-annual or annual target bonus amount, as applicable, that is intended to provide a competitive level of compensation if the executive officer achieves his performance objectives. Performance objectives consist of one or more company performance objectives and/or individual objectives established by our CEO for a particular executive officer before the beginning of each fiscal year. In general, we use performance objectives to ensure that our executive compensation program aligns the interests of each of our named executive officers with those of our stockholders and that we provide our named executive officers with incentives to maximize their efforts throughout the year. Cash incentive awards are intended to compensate our named executive officers for their contribution to achieving semi-annual, and for our CEO, annual, financial goals contained in our company financial plan and for success in meeting any individual performance objectives. The actual cash incentive award paid to each of our named executive officers is based on a subjective assessment of his overall level of achievement of the performance objectives assigned to him.
The initial on-target bonus amount for each of our executive officers was established through negotiation either at the time of hire or within a specified period following each executive officer’s start date. Target bonus levels are reviewed annually, following the end of the fiscal year by our CEO, or by the board of directors in the case of our CEO, and we pay cash incentive awards following the applicable performance period (i.e., the first
87
Table of Contents
and second halves of each fiscal year or for our CEO fiscal-year end). The annual or semi-annual on-target bonus amounts for each of our named executive officers for 2010 are set forth below:
| Named Executive Officer |
Annual On-Target Bonus Amount |
First Half Semi-Annual On-Target Bonus Amount |
Second Half Semi-Annual On-Target Bonus Amount |
|||||||||
| Daniel D. Springer |
$ | 135,000 | — | — | ||||||||
| Christian A. Paul |
— | $ | 22,500 | $ | 22,500 | |||||||
| Edward A. Henrich |
— | 42,500 | $ | 42,500 | (1) | |||||||
| Scott V. Olrich |
— | $ | 40,000 | $ | 50,000 | |||||||
| Julian K. Ong |
— | — | — | |||||||||
| (1) | In addition to his semi-annual on-target bonus amount for the second half of the year, Mr. Henrich’s cash incentive award for the second half of the year, has a variable component that is tied to our achievement of professional services revenue for the year, as described in more detail below. |
Each of our named executive officers, except for our CEO, is reviewed semi-annually on his achievement of performance objectives by our CEO. Our CEO is reviewed annually on his achievement of performance objectives by the compensation committee. Our CEO makes a qualitative assessment of each executive officer’s actual performance against his performance objectives for the period. Based on his subjective assessment, our CEO assigns an overall percentage of achievement to each executive officer for the period, taking into account the relative importance given to each objective based on its weighting. The overall percentage of achievement is then multiplied by the on-target bonus amount to determine the cash incentive award paid to each of our executive officers for the performance period. The compensation committee makes a similar recommendation to our board of directors with respect to the cash incentive award for our CEO. Our CEO has discretion to adjust the cash incentive award paid to an executive officer in each half of the fiscal year, subject to approval by the board of directors and other than with respect to his own award. The compensation committee has similar discretion with respect to the CEO’s annual cash incentive award. Such adjustments are based on a subjective assessment of the executive officer’s performance during the relevant performance period and how challenging the performance objectives assigned to that executive officer were to achieve. The cash incentive awards paid to the named executive officers during 2010 are set forth in the 2010 Summary Compensation Table.
The annual on-target bonus amount for Mr. Springer, our CEO, was $135,000 for the year ended December 31, 2010. The annual bonus objectives and the weighting associated with each objective consisted of (1) total revenue exceeding $87 million, weighted at 30%; (2) transitioning customers to our next-generation on-demand software platform, weighted at 20%; (3) preparation and readiness to become a public company, weighted at 20%; (4) expansion of our international presence, weighted at 15%; and (5) customer success and satisfaction, weighted at 15%. The board of directors determined that Mr. Springer had earned a bonus of $124,200, or an overall achievement of 92%, due to our achievement of revenues exceeding the specified goal, our ability to transition customers to our next-generation on-demand software platform, our progress toward establishing controls and delivering results like a public company, the acceleration of our acquisition of the remaining equity interests of Eservices, growth in our international headcount and revenue, and improved customer success survey results.
The semi-annual on-target bonus amount for Mr. Paul, our Chief Financial Officer for each half of 2010 was $22,500, or $45,000 annually. In the first half of 2010, the semi-annual bonus objectives and the weighting associated with each objective consisted of (1) growth of company revenues to $40 million in the first half of 2010, weighted at 30%; (2) performance related to collecting accounts receivable and providing business support analysis, weighted at 25%; (3) preparation and readiness to become a public company, weighted at 25%; and (4) improving information systems automation and international acquisition support; weighted at 20%. For the first half of 2010, Mr. Paul was awarded $20,700, or an overall achievement of 92%, due to our achievement of the revenue target, improvements in our collections process and ability to analyze financial data and results, strong management of the offering process and support of our Smith-Harmon and Eservices acquisitions. For the
88
Table of Contents
second half of 2010, Mr. Paul’s revenue objective increased to $48 million, weighted at 30%. His remaining semi-annual objectives were the same and carried the same weighting as during the first half. For the second half of 2010, Mr. Paul was awarded $21,825, or an overall achievement of 97%, due to our achievement of the revenue target, ability to complete quarterly financial processes, strong management of the offering process, progress in improving and upgrading financial systems, and strong support of the Eservices acquisition.
The semi-annual on-target bonus amount for Mr. Henrich, our Senior Vice President of Professional Services is $7,500 for each half of 2010 and was based on customer service focused objectives. Mr. Henrich was awarded $5,625 in the first half of 2010, or an overall achievement of 75%, and $6,000 in the second half of 2010, or an overall achievement of 80%, based on customer satisfaction, as reported in our customer success survey results. Mr. Henrich’s cash incentive award also includes a variable component that is tied to our professional services revenue results for each half of the fiscal year. For the first half of 2010, if professional services revenue exceeded $7.75 million, then Mr. Henrich would be awarded $17,500 and if they exceeded $8.0 million an additional $17,500. For the first half of 2010, Mr. Henrich was awarded $35,000 as a result of our professional services revenue results exceeding $8.0 million. For the second half of 2010, if professional services revenue exceeded $9.25 million, then Mr. Henrich would be awarded $17,500 and if they exceeded $10.0 million, an additional $17,500, plus an additional 3.5% of all professional services revenue in excess of $18.5 million for the full year. For the second half of 2010, Mr. Henrich was awarded $107,285 based on our professional services revenue for the second half of 2010 and for the full year.
The semi-annual on-target bonus amount for Mr. Olrich, our Chief Marketing and Sales Officer, was $40,000 for the first half of 2010 and $50,000 for the second half of 2010. Mr. Olrich’s on-target bonus amount increased for the second half of 2010 due to the increased difficulty of his performance objectives and an expansion of his responsibilities during the fiscal year. For the first half of 2010, Mr. Olrich’s semi-annual bonus objectives and the weighting associated with each objective consisted of (1) driving new customer bookings and lowering the costs associated with such bookings, weighted at 60%; (2) improving our customer and field marketing programs, weighted at 30%; and (3) general efforts to build the business, weighted at 10%. For the first half of 2010, Mr. Olrich was awarded $51,600, or an overall achievement of 129%. Our CEO adjusted and our board of directors approved the increase to Mr. Olrich’s award above the 100% achievement level due to significant overachievement in new customer bookings, well-received marketing and customer events, strong support of the professional services team and improved internal and external marketing communications. For the second half of 2010, Mr. Olrich’s first and second objectives were the same as the first half and the third objective changed to support and delivery of our next-generation on-demand software platform, weighted at 10%. For the second half of 2010, Mr. Olrich was awarded $46,000, or an overall achievement of 92%, due to near achievement of the customer bookings objective, strong support of Eservices, which was considered part of Mr. Olrich’s second objective, effective implementation of the new marketing program for existing customers and improved support in scaling of our next-generation on-demand software platform. The bookings targets for Mr. Olrich were established at a level that was aggressively higher than the bookings we achieved in the prior year and we believe the targets were challenging to achieve.
Equity Compensation. Our board of directors has responsibility for granting equity awards to our executive officers (other than to our CEO, whose equity awards have been, and will continue to be, approved by the non-employee members of our board of directors). We use equity awards to incentivize and reward our executives officers, including our named executive officers, for long-term corporate performance based on the value of our common stock and, thereby, to align the interests of our executive officers with those of our stockholders.
We typically grant stock options to executive officers upon hiring to create the incentive to build stockholder value over the long-term and to attract and retain the executive officer with a competitive compensation package. The size and terms of the stock options granted to our executive officers upon hiring historically have been established through negotiation at the time the individual executive was hired. In making these stock option grants, our board considers, among other factors, the prospective role and responsibility of the
89
Table of Contents
individual executive officer, our subjective view of the market for similarly situated executives, the cash compensation received by the executive officer, and the need to create a meaningful opportunity for reward predicated on the creation of long-term stockholder value.
We hired Mr. Ong, our Vice President, General Counsel and Secretary in April 2010. Pursuant to the terms of his offer letter, our board of directors granted Mr. Ong an option to purchase 125,000 shares of our common stock under our 1999 Stock Plan on June 8, 2010. The shares subject to the option vest as to 25% on the one-year anniversary of the vesting commencement date, May 17, 2010, and the remainder of the shares vest monthly in equal installments over the next three years. Vesting is contingent upon Mr. Ong’s continued service with us. If Mr. Ong is terminated without cause within twelve months of a change in control of us (as defined in the offer letter), the greater of 31,250 shares or 50% of the then-unvested shares will vest. The number of shares was based on negotiation with Mr. Ong. We did not perform any peer group analysis.
We also grant stock options to executive officers upon promotion, in connection with a significant change in responsibilities or to recognize extraordinary performance. In making these stock option grants, our board considers, among other factors, the executive officer’s responsibilities and anticipated future contributions, the competitiveness of the executive officer’s overall compensation package, the executive officer’s existing equity holdings and the potential reward to the executive officer if the market value of our common stock appreciates and the recommendations of our CEO.
On December 15, 2010, our board of directors granted Mr. Henrich an option to purchase 50,000 shares of our common stock, in connection with Mr. Henrich’s promotion to Senior Vice President of Professional Services. The shares subject to the option vest as to 25% on the one-year anniversary of the vesting commencement date, December 15, 2010, and the remainder of the shares vest monthly in equal installments over the next three years. Vesting is contingent upon Mr. Henrich’s continued service with us.
Other than option grants to Messrs. Ong and Henrich, none of our named executive officers were granted equity awards in 2010.
Retirement and Other Broad-based Employee Benefits. We have established a tax-qualified Section 401(k) retirement savings plan for our employees, including the named executive officers, who satisfy certain eligibility requirements. Eligible employees may elect to contribute pre-tax amounts, up to a statutorily prescribed limit, to the 401(k) plan. For 2010, the prescribed annual limit was $16,500. Under the 401(k) plan, we are permitted, but not obligated, to match a portion of the employee contributions. We currently make matching contributions of fifty cents per dollar contributed by participants, for up to $2,000 per calendar year. Contributions are allocated to each participant’s individual account and are then invested in selected investment alternatives according to the participants’ directions. All accounts are 100% vested at all times. We intend for the plan to qualify under Section 401(a) of the Code, so that contributions by participants to the 401(k) plan, and income earned on plan contributions, are not taxable to participants until withdrawn from the plan and not rolled over into an individual retirement account or another qualified employer retirement plan.
Additional benefits received by our executive officers, including the named executive officers, include medical, dental, and vision benefits, medical and dependent care flexible spending accounts, short-term and long-term disability insurance, accidental death and dismemberment insurance and basic life insurance coverage. These benefits are provided to our executive officers on the same general terms as to all of our full-time U.S. employees.
We do not view perquisites or other personal benefits as a significant component of our executive compensation program and did not provide perquisites to our executive officers during 2010.
Severance and Change in Control Arrangements. Our named executive officers are entitled to certain protections if their employment is terminated under specified circumstances, including following a change in
90
Table of Contents
control of the company, pursuant to the terms of their offer letters. These protections were negotiated at the time each individual was hired, taking into account any arrangements that such executive officer had with his prior employer. We believe that these protections were necessary to induce these individuals to forego other opportunities or leave their existing employment for the uncertainty of a demanding position in a new and unfamiliar organization and also to help from a retention standpoint.
We also recognize the possibility that we may in the future undergo a change in control, and that this possibility, and the uncertainty it may cause among our executive officers may result in their departure or distraction to the detriment of our company and our stockholders. Accordingly, in January 2008, our board of directors adopted a Management M&A Incentive Plan as an additional arrangement to help our executive officers maintain continued focus and dedication to their responsibilities to help maximize stockholder value in the event of a potential change in control transaction. The amounts payable to each executive officer under this plan reflect compensation levels that our board of directors believed were qualitatively commensurate with each executive officer’s individual qualifications, experience, responsibility level, functional role, knowledge, skills, and contribution to our performance. For a summary of the material terms and conditions of these severance and change in control arrangements, see “—Offer Letters” and “—Potential Payments Upon Termination or Change in Control” below.
Deductibility of Executive Compensation
Generally, Section 162(m) of the Code disallows a tax deduction to any publicly-held corporation for any remuneration in excess of $1 million paid in any taxable year to its chief executive officer and each of its other named executive officers. Remuneration in excess of $1 million may be deducted if, among other things, it qualifies as “performance-based compensation” within the meaning of the Code. In this regard, the compensation income realized upon the exercise of stock options granted under a stockholder-approved stock option plan generally will be deductible so long as the options are granted by a committee whose members are non-employee directors and certain other conditions are satisfied.
As we have not been a publicly-held corporation prior to this offering, our board of directors or compensation committee, as applicable, has not previously taken the deductibility limit imposed by Section 162(m) into consideration in setting compensation for our executive officers. We expect that, where reasonably practicable, we will seek to qualify future eligible variable compensation paid to our executive officers for the “performance-based compensation” exemption from the deductibility limit. As such, in approving the amount and form of compensation for our executive officers in the future, we will consider all elements of the cost to us of providing such compensation, including the potential impact of Section 162(m). Our compensation committee may, in its judgment, authorize compensation payments that do not comply with an exemption from the deductibility limit when it believes that such payments are appropriate to attract and retain executive talent.
Taxation of “Parachute” Payments
Sections 280G and 4999 of the Code provide that executive officers and directors who hold significant equity interests and certain other service providers may be subject to an excise tax if they receive payments or benefits in connection with a change in control that exceeds certain prescribed limits, and that the company, or a successor, may forfeit a deduction on the amounts subject to this additional tax. We did not provide any executive officer, including any named executive officer, with a “gross-up” or other reimbursement payment for any tax liability that he or she might owe as a result of the application of Sections 280G or 4999 during 2010 and we have not agreed and are not otherwise obligated to provide any named executive officer with such a “gross-up” or other reimbursement.
Accounting for Stock-based Compensation
We follow ASC 718 to account for our stock-based compensation awards. ASC 718 requires us to recognize the compensation cost of stock-based awards in our income statement over the period that our employees are
91
Table of Contents
required to render services in exchange for the awards. ASC 718 requires us to calculate the grant date fair value of stock-based awards using a variety of assumptions. See “Management’s Discussion and Analysis of Financial Condition and Results of Operations—Critical Accounting Policies and Estimates—Accounting for Stock-based Awards” above and note 9 to our consolidated financial statements included elsewhere in this prospectus for more about the costs associated with stock-based compensation awards and the assumptions we use when calculating grant date fair value. The calculation of grant date fair value is performed for accounting purposes and reported in the compensation tables below. The amounts reported do not reflect the actual value that may be realized by our named executive officers upon exercise and disposition (if any) of their stock-based awards.
2010 Summary Compensation Table
The following table presents summary information regarding the total compensation awarded to, earned by, or paid to each of the named executive officers for services rendered to us for the fiscal year ended December 31, 2010.
| Name and Principal Position |
Fiscal Year |
Salary ($) |
Option Awards ($)(1) |
Non-Equity Incentive Plan Compensation ($)(2) |
All
Other Compensation ($)(3) |
Total ($) |
||||||||||||||||||
| Daniel D. Springer, |
2010 | $ | 300,000 | $ | — | $ | 124,200 | $ | 2,000 | $ | 426,200 | |||||||||||||
| Chief Executive Officer |
2009 | 300,000 | 1,725,917 | 125,500 | 1,000 | 2,152,467 | ||||||||||||||||||
| Christian A. Paul, Chief Financial Officer |
2010 | 192,500 | — | 42,525 | 2,000 | 237,025 | ||||||||||||||||||
| 2009 | 185,000 | 569,540 | 42,750 | 2,000 | 799,290 | |||||||||||||||||||
| Edward A. Henrich, |
2010 | 190,000 | 185,820 | 153,910 | 2,000 | 531,730 | ||||||||||||||||||
| Senior Vice President, Professional Services |
||||||||||||||||||||||||
| Scott V. Olrich, |
2010 | 200,000 | — | 97,600 | 2,000 | 299,600 | ||||||||||||||||||
| Chief Marketing and Sales Officer |
2009 | 200,000 | 656,021 | 77,000 | 2,000 | 935,021 | ||||||||||||||||||
| Julian K. Ong, |
2010 | 125,884 | (4) | 282,000 | — | 2,000 | 409,884 | |||||||||||||||||
| Vice President, General Counsel and Secretary |
||||||||||||||||||||||||
| (1) | Amounts reported for fiscal year 2010 represent the grant date fair value of the stock options granted during 2010, computed in accordance with ASC 718. Amounts reported for fiscal year 2009 represent the fair value of the stock options exchanged during 2009, computed in accordance with ASC 718. The valuation assumptions used in calculating the fair value of the stock options are set forth in note 9 to our consolidated financial statements included elsewhere in this prospectus. For more information about the stock options exchanged in 2009, see “Related Party Transactions.” |
| (2) | Amounts reported represent the amount each named executive officer received as a cash incentive award based on the achievement of his performance objectives for 2010. For more information about the performance objectives of our named executive officers, see “—Annual Cash Incentive Awards” in the Compensation Discussion and Analysis above. |
| (3) | Represents matching 401(k) contributions made during the fiscal year. |
| (4) | Mr. Ong’s employment with us started in May 2010. The amount reflects Mr. Ong’s salary for the period from May 2010 through December 2010. |
92
Table of Contents
2010 Grants of Plan-based Awards Table
The following table presents, for each of the named executive officers, information concerning each grant of a cash or equity award made during the fiscal year ended December 31, 2010. This information supplements the information about these awards set forth in the 2010 Summary Compensation Table.
| Name |
Grant Date |
Estimated Future Payouts Under Non-Equity Incentive Plan Awards Target ($)(1) |
All Other Option Awards: Number of Securities Underlying Options (#)(2) |
Exercise or Base Price of Option Awards ($/sh) |
Grant Date Fair Value of Option Awards ($)(3) |
|||||||||||||
| Daniel D. Springer |
$ | 135,000 | ||||||||||||||||
| Christian A. Paul |
45,000 | |||||||||||||||||
| Edward A. Henrich |
85,000 | (4) | ||||||||||||||||
| December 15, 2010 | 50,000 | $ | 7.40 | $ | 185,820 | |||||||||||||
| Scott V. Olrich |
90,000 | |||||||||||||||||
| Julian K. Ong |
June 8, 2010 | 125,000 | 4.48 | 282,000 | ||||||||||||||
| (1) | Amounts represent the on-target payout amount for each named executive officer under his individual cash incentive award plan. The plans provide for payment of up to 100% of the on-target amount based on each named executive officer’s achievement of personalized performance objectives. The plans do not provide for the payment of threshold or maximum amounts. The actual payments from these awards are included in the “Non-Equity Incentive Plan Compensation” column of the 2010 Summary Compensation Table above. For more information about the cash incentive plans, see “—Annual Cash Incentive Awards” in the Compensation Discussion and Analysis above. |
| (2) | The vesting schedules for these options are described in the footnotes to the 2010 Outstanding Equity Awards at Fiscal Year-End Table below. |
| (3) | Amounts reported represent the grant date fair value of the stock options granted during 2010 computed in accordance with ASC 718. The valuation assumptions used in calculating the grant date fair value of the stock options are set forth in note 9 to our consolidated financial statements included elsewhere in this prospectus. |
| (4) | In addition to the target payout amount, Mr. Henrich’s cash incentive award has a variable component that is tied to our achievement of professional services revenue, as described in more detail in “—Annual Cash Incentive Awards” in the Compensation Discussion and Analysis above. |
93
Table of Contents
2010 Outstanding Equity Awards at Fiscal Year-end Table
The following table presents, for each of the named executive officers, information regarding outstanding stock options and other equity awards held as of December 31, 2010.
| Option Awards(1) | Stock Awards | |||||||||||||||||||||||||||
| Name |
Vesting Commencement Date |
Number of Securities Underlying Unexercised Options (#) Exercisable(2) |
Number of Securities Underlying Unexercised Options (#) Unexercisable(3) |
Option Exercise Price ($) |
Option Expiration Date |
Number of Shares or Units of Stock that Have Not Vested (#) |
Market Value of Shares or Units of Stock that Have Not Vested ($) |
|||||||||||||||||||||
| Daniel D. Springer |
4/1/2004 | 2,123,778 | — | $ | 0.04 | 6/17/2014 | — | — | ||||||||||||||||||||
| 3/12/2009 | — | 950,000 | (4) | 2.60 | 7/22/2019 | — | — | |||||||||||||||||||||
| Christian A. Paul |
8/14/2006 | 425,000 | — | 0.40 | 9/14/2016 | — | — | |||||||||||||||||||||
| 8/16/2009 | — | 312,500 | (4) | 2.60 | 7/22/2019 | — | — | |||||||||||||||||||||
| Edward A. Henrich |
4/2/2007 | 80,208 | 7,292 | 1.40 | 6/20/2017 | — | — | |||||||||||||||||||||
| 4/23/2008 | 8,333 | 4,167 | 2.92 | 4/23/2018 | — | — | ||||||||||||||||||||||
| 12/30/2009 | 12,501 | 37,498 | 3.08 | 12/30/2019 | — | — | ||||||||||||||||||||||
| 12/15/2010 | — | 50,000 | 7.40 | 12/15/2020 | — | — | ||||||||||||||||||||||
| Scott V. Olrich |
7/14/2004 | 675,000 | — | 0.04 | 7/14/2014 | — | — | |||||||||||||||||||||
| 10/20/2005 | 387,500 | — | 0.04 | 10/20/2015 | — | — | ||||||||||||||||||||||
| 3/12/2009 | — | 375,000 | (4) | 2.60 | 7/22/2019 | — | — | |||||||||||||||||||||
| Julian K. Ong |
5/17/2010 | — | — | — | — | 125,000 | (5) | $ | 1,156,250 | (6) | ||||||||||||||||||
| (1) | Unless otherwise noted in these footnotes, all stock options referenced in this table vest over a four year period, with 25% of the shares subject to the stock option vesting on the one-year anniversary of the vesting commencement date and the remainder of the shares vesting monthly for each of the thirty-six months thereafter. Vesting is contingent on the optionee’s continued service with us. |
| (2) | Because all options granted under our 1999 Stock Plan are immediately exercisable, subject to a right of repurchase in our favor which lapses as the shares vest, this column reflects the number of options held by our named executive officers that were exercisable and vested as of December 31, 2010. |
| (3) | Because all options granted under our 1999 Stock Plan are immediately exercisable, subject to a right of repurchase in our favor which lapses as the shares vest, this column reflects the number of options held by our named executive officers that were exercisable and unvested as of December 31, 2010. |
| (4) | The stock option was exchanged on July 22, 2009 and is immediately exercisable, subject to a right of repurchase in our favor until the shares vest. The shares vest upon the earlier of (i) the completion of 119 months of continuous service from the vesting commencement date, which differs for each named executive officer, depending on the officer’s start date, and (ii) our attainment of a Milestone (as defined below). Upon the completion of 119 months of continuous service, the shares vest in full. Upon the attainment of a Milestone, 25% of the total number of shares vest for each year of continuous service that the named executive officer has completed since the vesting commencement date, until fully vested. A “Milestone” is attained when either (i) our revenues for four consecutive completed calendar quarters totals more than $100 million or (ii) we undergo a change in control before the named executive officer’s service terminates and the aggregate proceeds available for distribution to our stockholders exceeds $250 million. |
| (5) | The stock issued pursuant to this award was issued upon exercise of an immediately exercisable stock option. The shares are subject to a right of repurchase in our favor that lapses as the shares vest. The shares vest over a four year period, with 25% of the shares vesting on the one-year anniversary of the vesting commencement date and the remainder of the shares vesting monthly for each of the thirty-six months thereafter. Vesting is contingent on Mr. Ong’s continued service with us. |
| (6) | Represents the fair market value of Mr. Ong’s 125,000 unvested shares as of December 31, 2010. The fair market value assumes an initial public offering price of $9.25 per share, the midpoint of the price range set forth on the cover of this prospectus. |
94
Table of Contents
2010 Option Exercises
| Option Awards | ||||||||
| Name |
Number of Shares Acquired on Exercise (#) |
Value Realized on Exercise ($)(1) |
||||||
| Daniel D. Springer |
— | — | ||||||
| Christian A. Paul |
25,000 | $ | 221,250 | (2) | ||||
| Edward A. Henrich |
— | — | ||||||
| Scott V. Olrich |
— | — | ||||||
| Julian K. Ong |
— | — | ||||||
| (1) | The aggregate dollar amount realized represents the amount by which the aggregate market price for the shares of common stock issued on the date of exercise (calculated using a per share value based on the most recent valuation completed prior to the date of exercise) exceeds the aggregate exercise price of the option. |
| (2) | Represents the aggregate dollar amount realized by Mr. Paul upon exercise of an option to purchase 25,000 shares of common stock at an exercise price of $0.40 per share on December 17, 2010. The market price for our common stock assumes an initial public offering price of $9.25 per share, the midpoint of the price range set forth on the cover of this prospectus. |
Offer Letters
We entered into offer letters with each of the named executive officers in connection with their commencement of employment with us. These letters provide for at-will employment and include the executive officer’s initial base salary, an annual incentive cash award opportunity, the terms of a recommended stock option grant subject to the approval of our board of directors, and severance arrangements. In addition, the offer letters provide that as a regular employee, the named executive officer is eligible to participate in company-sponsored benefit programs that are available generally to all salaried employees and entitled to paid vacation in accordance with our general vacation policy. These offers of employment were each subject to execution of our standard confidential information and invention assignment agreement. The potential payments and benefits due upon a termination of employment or a change in control of us are quantified below in “—Potential Payments upon Termination or Change in Control.”
Daniel D. Springer
We entered into an offer letter with Mr. Springer, our CEO, on March 23, 2004. Pursuant to the offer letter, Mr. Springer’s initial annual base salary was established at $300,000 per year. Mr. Springer was eligible to be considered for an annual on-target bonus amount based on criteria established by our board of directors with the amount of the incentive award to be a percentage of base salary to be established after Mr. Springer’s start date with us. For 2010, Mr. Springer’s annual on-target bonus amount was 45% of base salary, or $135,000. On June 17, 2004, in accordance with the terms of his offer letter, Mr. Springer was granted a stock option to purchase 3,611,407 shares of our common stock at an exercise price of $0.04 per share, which was equal to the fair market value of our common stock on the date the option was granted as determined by our board of directors. The stock option became fully vested in 2008.
Mr. Springer’s offer letter provides that if Mr. Springer’s employment is terminated for any reason other than cause (as defined in the offer letter), we will continue to pay Mr. Springer’s base salary for a period of six months from the date of his termination and pay his health insurance premiums under the Consolidated Omnibus Budget Reconciliation Act, or COBRA, for up to six months. Mr. Springer’s receipt of the above payments and benefits is conditioned upon his resignation as a member of our board of directors, execution of a general release of claims, and return of all company property.
95
Table of Contents
In the event of a change in control of us (as defined in the 1999 Stock Plan), Mr. Springer’s offer letter provides for a payment equal to the lesser of $1,000,000 and the amount of the proceeds available for distribution to our stockholders in connection with the change in control. To the extent that Mr. Springer receives consideration for holding capital stock or vested options in connection with such a change in control, such amounts shall be deducted from this change in control payment.
Christian A. Paul
We entered into an offer letter with Mr. Paul, our Chief Financial Officer, on August 16, 2006. Pursuant to the offer letter, Mr. Paul’s initial annual base salary was established at $185,000 with an annual target incentive award amount of $45,000. On September 14, 2006, in accordance with the terms of his offer letter, Mr. Paul was granted a stock option to purchase 475,000 shares of our common stock at an exercise price of $0.40 per share, which was equal to the fair market value of our common stock on the date the options were granted as determined by our board of directors. The stock option became fully vested in 2010.
Mr. Paul’s offer letter provides that if Mr. Paul’s employment is terminated as a result of a change in control or for any reason other than cause (as defined in the offer letter), we will pay Mr. Paul a lump sum equal to three months of his base salary and annual on-target bonus amount as of the date of his termination. We also will pay his health insurance premiums under COBRA for up to three months. In the event of Mr. Paul’s termination for any reason other than cause and not in connection with a change in control, we will add an additional three months to Mr. Paul’s service period to determine the vested percentage of his initial option grant.
In the event of Mr. Paul’s voluntary or involuntary termination within 12 months following a change in control, the offer letter provides for vesting acceleration for the greater of (1) 25% of all shares subject to Mr. Paul’s initial option grant or (2) 50% of the unvested portion of such shares.
Edward A. Henrich
We entered into an offer letter agreement with Edward A. Henrich, our Senior Vice President, Professional Services, on March 27, 2007. Pursuant to the offer letter, Mr. Henrich’s initial annual base salary was established at $180,000 with an annual on-target bonus amount of $50,000, in addition to a commission based on the referral of customers to us during the first 12 months of Mr. Henrich’s employment. On June 20, 2007, in accordance with the terms of his offer letter, Mr. Henrich was granted a stock option to purchase 87,500 shares of our common stock at an exercise price of $1.40 per share, which was equal to the fair market value of our common stock on the date the options were granted as determined by our board of directors. The stock option vests 25% on the first anniversary of the vesting commencement date, with the remainder vesting ratably over the next 36 months, subject to Mr. Henrich’s continued service through each applicable date. As of December 31, 2010, 7,292 shares subject to the option are unvested.
Mr. Henrich’s offer letter agreement provides for the accelerated vesting of 21,875 shares, or 25% of Mr. Henrich’s initial option grant, in the event that Mr. Henrich’s employment is subject to an involuntary termination within 12 months following a change in control of us.
Scott V. Olrich
We entered into an offer letter with Mr. Olrich, our Chief Marketing and Sales Officer on June 25, 2004. Pursuant to the offer letter, Mr. Olrich’s initial annual base salary was established at $185,000 with annual on-target bonus amount of $80,000. On July 14, 2004, in accordance with the terms of his offer letter, Mr. Olrich was granted a stock option to purchase 675,000 shares of our common stock at an exercise price of $0.04 per share, which was equal to the fair market value of our common stock on the date the options were granted as determined by our board of directors. The stock option became fully vested in 2008.
96
Table of Contents
Mr. Olrich’s offer letter provides that if Mr. Olrich’s employment is terminated for any reason other than cause (as defined in the offer letter), then we will continue to pay Mr. Olrich’s base salary for three months following the date of termination and health insurance premiums under COBRA for up to three months, conditioned upon the execution by Mr. Olrich of a general release of claims and Mr. Olrich’s return of all of our property.
Julian K. Ong
We entered into an offer letter with Mr. Ong, our Vice President, General Counsel and Secretary on April 14, 2010. Pursuant to the offer letter, Mr. Ong’s initial annual base salary was established at $200,000. On June 8, 2010, in accordance with the terms of his offer letter, Mr. Ong was granted a stock option to purchase 125,000 shares of our common stock at an exercise price of $4.48 per share, which was equal to the fair market value of our common stock on the date the options were granted as determined by our board of directors. As of December 31, 2010, all of the shares subject to the option are unvested.
Mr. Ong’s offer letter provides that if Mr. Ong’s employment is terminated as a result of a change in control or for any reason other than cause (as defined in the offer letter), we will pay Mr. Ong a lump sum equal to three months of his base salary in effect as of the date of his termination. We also will pay his health insurance premiums under COBRA for up to three months. In the event of Mr. Ong’s termination for any reason other than cause and not in connection with a change in control, we will add an additional three months to Mr. Ong’s service period to determine the vested percentage of his initial option grant.
In the event of Mr. Ong’s involuntary termination within 12 months following a change in control, the offer letter provides for vesting acceleration for the greater of (1) 25% of all shares subject to Mr. Ong’s initial option grant or (2) 50% of the unvested portion of such shares.
For the potential payments and benefits payable to the named executive officers under these offer letters, see “—Potential Payments Upon Termination or Change in Control” below.
Potential Payments upon Termination or Change in Control
Management M&A Incentive Plan
In January 2008, our board of directors adopted a Management M&A Incentive Plan, or M&A Plan, because it believed this plan would help our executive officers maintain continued focus and dedication to their responsibilities while helping to maximize stockholder value in the event of a potential transaction that could involve a change in control of.
Pursuant to the terms of the M&A Plan, if we engage in a transaction with aggregate sale proceeds of at least $250 million that results in a change in control of us, which includes (i) a disposition of all or substantially all of our assets, (ii) the consummation of a merger or consolidation of us, except a merger or consolidation in which our stockholders immediately before the transaction hold 50% or more of the voting power of the capital stock of the surviving or acquiring entity or (iii) the closing of a transfer of our securities that results in any person or group of affiliated persons holding more than 50% of our outstanding voting stock, then certain executive officers, including three of our named executive officers, shall receive a cash bonus payment from the plan’s aggregate bonus pool of $10 million. Pursuant to the terms of the plan, should such a transaction close, Messrs. Springer, Paul and Olrich would be entitled to receive $3 million, $1 million and, $1.5 million, respectively, in cash bonus payments. As of December 31, 2010, Messrs. Henrich and Ong were not participants in the M&A Plan. Our board of directors has the discretion to approve additional participants in the M&A Plan. To be eligible for a bonus payment under the M&A Plan, each of Messrs. Springer, Paul and Olrich must continue to provide services to us upon the close of the transaction and to the extent required by any successor, remain a service provider to us for up to 12 months following the change in control, unless their employment is terminated without cause (as defined in the M&A Plan) following the closing date. The M&A Plan terminates upon the earlier to occur of a change in control transaction of less than $250 million or January 15, 2013.
97
Table of Contents
Offer Letters
Under the terms and conditions of their individual offer letters, as described in detail above, each of our named executive officers is eligible to receive certain payments and benefits in connection with his termination of employment, depending on the circumstances, including following a change in control. In addition, each named executive officer is eligible to receive benefits accrued under our broad-based benefit plans, such as accrued vacation pay, in accordance with the terms of those plans and policies.
The tables below illustrate the potential payments and benefits payable to each named executive officer pursuant to the terms and conditions of his offer letter and the M&A Plan, assuming a termination of employment occurred as of December 31, 2010. For purposes of valuing the severance and vacation payments in the tables below, we used each executive officer’s base salary as in effect as of December 31, 2010 and the number of accrued but unused vacation days as of December 31, 2010.
The actual amounts that would be paid or distributed to the named executive officers as a result of a termination event occurring in the future may be different than those presented below as many factors will affect the amount of any payments and benefits upon a termination of employment. For example, some of the factors that could affect the amounts payable include the named executive officer’s base salary and the market price of our common stock. Although we have entered into written arrangements to provide severance payments and benefits to the named executive officers in connection with a termination of employment under particular circumstances, we, or an acquirer, may mutually agree with the named executive officers on severance terms that vary from those provided in these pre-existing arrangements. For more information about the named executive officers’ outstanding equity awards as of December 31, 2010, see the 2010 Outstanding Equity Awards at Fiscal Year-End Table above.
Daniel D. Springer
The table below summarizes the value of the termination payments to Mr. Springer assuming a qualifying termination as of December 31, 2010.
| Benefit |
No Change in Control | Qualifying Change in Control(1) | ||||||||||
| Termination without cause | No Termination | Termination without cause | ||||||||||
| Severance |
$ | 150,000 | $ | — | $ | 150,000 | ||||||
| COBRA Premiums |
9,349 | — | 9,349 | |||||||||
| Vacation Payout |
18,462 | — | 18,462 | |||||||||
| Change in Control Bonus |
— | — | (2) | — | (2) | |||||||
| M&A Plan Bonus |
— | 3,000,000 | 3,000,000 | |||||||||
| Total Value |
$ | 177,811 | $ | 3,000,000 | $ | 3,177,811 | ||||||
| (1) | As described above under “—Management M&A Incentive Plan”, a qualifying change in control is one in which the fair market value of the aggregate consideration payable to our stockholders is at least $250 million. |
| (2) | In the event of a qualifying change in control in which the fair market value of the aggregate consideration payable to our stockholders is at least $250 million, the value of the change in control bonus described under “—Offer Letters—Dan Springer” above would be zero. |
98
Table of Contents
Christian A. Paul
The table below summarizes the value of the termination payments to Mr. Paul assuming a qualifying termination as of December 31, 2010.
| Benefit |
No Change in Control | Qualifying Change in Control(1) | ||||||||||
| Termination without cause | No Termination | Termination without cause | ||||||||||
| Severance |
$ | 61,250 | $ | — | $ | 61,250 | ||||||
| COBRA Premiums |
4,487 | — | 4,487 | |||||||||
| Vacation Payout |
15,385 | — | 15,385 | |||||||||
| Vesting Acceleration |
— | — | — | |||||||||
| M&A Plan Bonus |
— | 1,000,000 | 1,000,000 | |||||||||
| Total Value |
$ | 81,122 | $ | 1,000,000 | $ | 1,081,122 | ||||||
| (1) | As described above under “—Management M&A Incentive Plan”, a qualifying change in control is one in which the fair market value of the aggregate consideration payable to our stockholders is at least $250 million. |
Edward A. Henrich
The table below summarizes the value of the termination payments to Mr. Henrich, assuming a qualifying termination as of December 31, 2010.
| Benefit |
No Change in Control | Qualifying Change in Control(1) | ||||||||||
| Termination without cause | No Termination | Termination without cause | ||||||||||
| Vacation Payout |
$ | 7,769 | $ | — | $ | 7,769 | ||||||
| Vesting Acceleration |
— | — | 16,863 | (2) | ||||||||
| Total Value |
$ | 7,769 | $ | — | $ | 24,632 | ||||||
| (1) | Pursuant to the terms of Mr. Henrich’s offer letter, a qualifying change in control is one in which a sale or merger of us other than a reincorporation results in more than a 50% change of control of our outstanding shares. |
| (2) | Represents the fair market value of 1,823 unvested shares subject to Mr. Henrich’s initial option grant as of December 31, 2010 that would be subject to accelerated vesting. The fair market value assumes an initial public offering price of $9.25 per share, the midpoint of the price range set forth on the cover of this prospectus. |
Scott V. Olrich
The table below summarizes the value of the termination payments to Mr. Olrich assuming a qualifying termination as of December 31, 2010.
| Benefit |
No Change in Control | Qualifying Change in Control(1) | ||||||||||
| Termination without cause | No Termination | Termination without cause | ||||||||||
| Severance |
$ | 50,000 | $ | — | $ | 50,000 | ||||||
| COBRA Premiums |
4,487 | — | 4,487 | |||||||||
| Vacation Payout |
15,385 | — | 15,385 | |||||||||
| M&A Plan Bonus |
— | 1,500,000 | 1,500,000 | |||||||||
| Total Value |
$ | 69,872 | $ | 1,500,000 | $ | 1,569,872 | ||||||
| (1) | As described above under “—Management M&A Incentive Plan,” a qualifying change in control is one in which the fair market value of the aggregate consideration payable to our stockholders is at least $250 million. |
99
Table of Contents
Julian K. Ong
The table below summarizes the value of the termination payments to Mr. Ong assuming a qualifying termination as of December 31, 2010.
| Benefit |
No Change in Control | Qualifying Change in Control(1) | ||||||||||
| Termination without cause | No Termination | Termination without cause | ||||||||||
| Severance |
$ | 50,000 | $ | — | $ | 50,000 | ||||||
| COBRA Premiums |
3,435 | — | 3,435 | |||||||||
| Vacation Payout |
4,114 | — | 4,114 | |||||||||
| Vesting Acceleration |
— | — | 578,125 | (2) | ||||||||
| Total Value |
$ | 57,549 | $ | — | $ | 635,674 | ||||||
| (1) | Pursuant to the terms of Mr. Ong’s offer letter, a qualifying change in control is one in which a sale or merger of us other than a reincorporation results in more than a 50% change of control of our outstanding shares. |
| (2) | Represents the fair market value of 62,500 unvested shares subject to Mr. Ong’s initial option grant as of December 31, 2010 that would be subject to accelerated vesting. The fair market value assumes an initial public offering price of $9.25 per share, the midpoint of the price range set forth on the cover of this prospectus. |
Employee Benefit Plans
1999 Stock Plan
Our board of directors adopted and our stockholders approved our 1999 Stock Plan on May 5, 1999. Our 1999 Stock Plan provides for the grant of incentive stock options, within the meaning of Section 422 of the Internal Revenue Code of 1986, as amended, or the Code, to our employees or any parent or subsidiary’s employees, and for the grant of nonstatutory stock options to our employees, directors and consultants and any parent and subsidiary corporations’ employees and consultants. The 1999 Stock Plan also allows for awards and sales of shares of restricted stock. We will cease issuing awards under the 1999 Stock Plan upon the implementation of the 2011 Equity Incentive Plan, which is described below. Likewise, we will not grant any additional awards under our 1999 Stock Plan following this offering. Instead we will grant equity awards under our 2011 Equity Incentive Plan.
Share Reserve. As of December 31, 2010, we had reserved 17,437,500 shares of our common stock for issuance under our 1999 Stock Plan. As of December 31, 2010, options to purchase 7,627,016 of these shares had been exercised, options to purchase 10,937,216 of these shares remained outstanding and 810,565, of these shares remained available for future grant. In addition, we had granted restricted stock awards for 384,137 shares of common stock. The options outstanding as of December 31, 2010 had a weighted-average exercise price of approximately $1.55 per share. Our 2011 Equity Incentive Plan (described below) will be effective on or prior to the closing of this offering. As a result, we will not grant any additional options under the 1999 Stock Plan following that date and the 1999 Stock Plan will terminate. However, any outstanding options granted under the 1999 Stock Plan will remain outstanding, subject to the terms of our 1999 Stock Plan and stock option agreements, until they are exercised or until they terminate or expire by their terms. Shares of common stock reserved for issuance pursuant to this plan will be rolled into our 2011 Equity Incentive Plan.
Administration. Our board of directors currently administers our 1999 Stock Plan. Our board of directors has complete discretion to make all decisions relating to the plan, including the power to determine the terms of the awards, including who will receive awards, the exercise price, the number of shares subject to each award, the term of awards, the vesting schedule and exercisability of awards and the form of consideration payable upon exercise.
100
Table of Contents
Stock Options. The exercise price of incentive stock options must be at least equal to the fair market value of our common stock on the date of grant and the term of the incentive stock options may not exceed 10 years. With respect to incentive stock options granted to any employee who owns 10% or more of the voting power of all classes of our outstanding stock as of the grant date, the term must not exceed 5 years and the exercise price must equal at least 110% of the fair market value on the grant date.
Upon termination of an employee’s employment with us, he or she may exercise his or her incentive stock option for the period of time stated in the incentive stock option agreement, to the extent his or her incentive stock option is vested on the date of termination. If termination is due to death or disability, the incentive stock option will remain exercisable for a period of not less than 6 months nor more than 12 months. Upon termination, the incentive stock option will remain exercisable for a period of up to 3 months after the date on which the employee’s employment terminates or such shorter or longer period as may be prescribed in the incentive stock option agreement, the minimum specified period being 30 days. Subject to the requirements of all applicable laws, rules or regulations, each nonstatutory stock option agreement shall contain provisions relating to early termination of the nonstatutory stock option based upon termination of the holder’s service to us as determined by our board of directors. A stock option may never be exercised later than the expiration of its term.
Effect of Certain Corporate Transactions. In the event we experience a merger or consolidation, all awards granted under the 1999 Stock Plan shall be subject to the agreement evidencing such merger or consolidation, and with respect to a stock option, such agreement shall provide for one or more of the following:
| • | the continuation or assumption of such outstanding stock options by the surviving corporation or its parent; |
| • | the substitution by the surviving corporation or its parent of new options for such outstanding stock options; |
| • | full acceleration of the vesting of such stock options; or |
| • | the cancellation of such stock options in exchange for a payment equal to the excess of the fair market value of the shares subject to such stock options (whether or not such stock options are then exercisable or such shares are then vested) over the exercise price of such stock options. |
The 1999 Stock Plan provides for adjustment of awards in the event of a stock split, stock dividend and certain other corporate events.
Payment. The exercise price for options granted under the 1999 Stock Plan may not be less than 100% of the fair market value of our common stock on the grant date. Optionees may pay the exercise price of options by using:
| • | cash or cash equivalents; |
| • | shares of common stock that the optionee already owns; |
| • | a full recourse promissory note, under certain circumstances; or |
| • | following this offering, an immediate sale of the option shares through a broker designated by us. |
The 1999 Stock Plan allowed the board of directors to award, in its discretion, shares in consideration of services rendered to us prior to the grant date of the award.
Additional Provisions. Our board of directors has the authority to amend, suspend or terminate the 1999 Stock Plan, provided our stockholders approve actions that (i) increase the number of shares of our common stock that may be issued under the 1999 Stock Plan or (ii) change the designation of employees eligible to receive incentive stock option awards under the 1999 Stock Plan.
101
Table of Contents
2011 Equity Incentive Plan
Share Reserve. Our board of directors adopted our 2011 Equity Incentive Plan in December 2010, and our stockholders approved it in March 2011, to become effective on or prior to the closing of this offering. We reserved 10,000,000 shares of our common stock for issuance under our 2011 Equity Incentive Plan plus (i) any shares reserved but not issued or subject to outstanding awards under our 1999 Stock Plan, (ii) shares that are subject to outstanding awards under the 1999 Stock Plan which cease to be subject to such awards, and (iii) shares issued under the 1999 Stock Plan which are forfeited or repurchased at their original issue price. The number of shares reserved for issuance under our 2011 Equity Incentive Plan will increase automatically on the first day of January of each of 2012 through 2015 by a number of shares equal to (i) the lesser of 5% of the total outstanding shares our common stock as of the immediately preceding December 31st or (ii) a number of shares determined by the board of directors. In addition, the following shares will again be available for grant or issuance under our 2011 Equity Incentive Plan:
| • | shares subject to options granted under our 2011 Equity Incentive Plan that cease to be subject to the option for any reason other than exercise of the option; |
| • | shares subject to awards granted under our 2011 Equity Incentive Plan that are subsequently forfeited or repurchased by us at the original issue price; and |
| • | shares subject to awards granted under our 2011 Equity Incentive Plan that otherwise terminate without shares being issued. |
Term. Our 2011 Equity Incentive Plan will terminate ten years from the date our board of directors approves the plan, unless it is terminated earlier by our board of directors.
Eligibility. Our 2011 Equity Incentive Plan will provide for the award of stock options, restricted stock awards, stock appreciation rights, restricted stock units, performance shares and stock bonuses. No person will be eligible to receive more than shares in any calendar year under our 2011 Equity Incentive Plan other than a new employee of ours, who will be eligible to receive no more than shares under the plan in the calendar year in which the employee commences employment.
Administration. Our 2011 Equity Incentive Plan will be administered by our compensation committee, all of the members of which are non-employee directors under applicable federal securities laws and outside directors as defined under applicable federal tax laws. The compensation committee will have the authority to construe and interpret our 2011 Equity Incentive Plan, grant awards and make all other determinations necessary or advisable for the administration of the plan. Awards under the 2011 Equity Incentive Plan may be made subject to “performance factors” and other terms in order to qualify as performance based compensation for the purposes of Internal Revenue Code Section 162(m).
Stock Options. Our 2011 Equity Incentive Plan will provide for the grant of incentive stock options that qualify under Section 422 of the Code only to our employees. All awards other than incentive stock options may be granted to our employees, directors, consultants, independent contractors and advisors, provided the consultants, independent contractors and advisors render services not in connection with the offer and sale of securities in a capital-raising transaction. The exercise price of each stock option must be at least equal to the fair market value of our common stock on the date of grant. The exercise price of incentive stock options granted to 10% stockholders must be at least equal to 110% of that value.
Our compensation committee may provide for options to be exercised only as they vest or to be immediately exercisable with any shares issued on exercise being subject to our right of repurchase that lapses as the shares vest. In general, options will vest over a four-year period. The maximum term of options granted under our 2011 Equity Incentive Plan is ten years.
Restricted Stock. A restricted stock award is an offer by us to sell shares of our common stock subject to restrictions. The price (if any) of a restricted stock award will be determined by the compensation committee.
102
Table of Contents
Unless otherwise determined by the compensation committee at the time of award, vesting will cease on the date the participant no longer provides services to us and unvested shares will be forfeited to or repurchased by us.
Stock Appreciation Rights. Stock appreciation rights provide for a payment, or payments, in cash or shares of our common stock, to the holder based upon the difference between the fair market value of our common stock on the date of exercise and the stated exercise price up to a maximum amount of cash or number of shares. Stock appreciation rights may vest based on time or achievement of performance conditions.
Restricted Stock Units. A restricted stock unit is an award that covers a number of shares of our common stock that may be settled upon vesting in cash, by the issuance of the underlying shares or a combination of both. These awards are subject to forfeiture prior to settlement because of termination of employment or failure to achieve certain performance conditions.
Performance Shares. A performance share is an award that covers a number of shares of our common stock that may be settled upon achievement of the pre-established performance conditions in cash or by issuance of the underlying shares. These awards are subject to forfeiture prior to settlement because of termination of employment or failure to achieve the performance conditions.
Stock Bonus Awards. Stock bonus awards may be granted as additional compensation for services and/or performance, and therefore, not be issued in exchange for cash.
Additional Provisions. Awards granted under our 2011 Equity Incentive Plan may not be transferred in any manner other than by will or by the laws of descent and distribution or as determined by our compensation committee. Unless otherwise restricted by our compensation committee, awards that are nonstatutory stock options may be exercised during the lifetime of the optionee only by the optionee, the optionee’s guardian or legal representative, or a family member of the optionee who has acquired the option by a permitted transfer. Awards that are incentive stock options may be exercised during the lifetime of the optionee only by the optionee or the optionee’s guardian or legal representative. Options granted under our 2011 Equity Incentive Plan generally may be exercised for a period of three months after the termination of the optionee’s service to us, except in the case of death or permanent disability, in which case the options may be exercised for up to 12 months following termination of the optionee’s service to us.
If we experience a change in control transaction, outstanding awards, including any vesting provisions, may be assumed or substituted by the successor company. Outstanding awards that are not assumed or substituted will expire upon the closing of a change in control transaction. In the discretion of our compensation committee, the vesting of these awards may be accelerated upon the occurrence of these types of transactions.
Limitations on Liability and Indemnification Matters
Our restated certificate of incorporation that will be in effect at the closing of this offering contains provisions that limit the liability of our directors for monetary damages to the fullest extent permitted by the Delaware General Corporation Law. Consequently, our directors will not be personally liable to us or our stockholders for monetary damages for any breach of fiduciary duties as directors, except liability for:
| • | any breach of the director’s duty of loyalty to us or our stockholders; |
| • | any act or omission not in good faith or that involves intentional misconduct or a knowing violation of law; |
| • | unlawful payments of dividends or unlawful stock repurchases or redemptions as provided in Section 174 of the Delaware General Corporation Law; or |
| • | any transaction from which the director derived an improper personal benefit. |
Our restated bylaws that will be in effect at the closing of this offering require us to indemnify our directors and executive officers to the maximum extent not prohibited by the Delaware General Corporation Law or any
103
Table of Contents
other applicable law and allow us to indemnify other officers, employees and other agents as set forth in the Delaware General Corporation Law or any other applicable law.
We intend to enter into separate indemnification agreements with our directors and executive officers, in addition to the indemnification provided for in our restated bylaws. These agreements, among other things, require us to indemnify our directors and executive officers for certain expenses and liabilities, including attorneys’ fees, judgments, penalties, fines and settlement amounts actually and reasonably incurred by a director or executive officer in any action or proceeding arising out of their services as one of our directors or executive officers, or any of our subsidiaries or any other company or enterprise to which the person provides services at our request, including liability arising out of negligence or active or passive wrongdoing by the officer or director. We believe that these charter provisions and indemnification agreements are necessary to attract and retain qualified persons as directors and officers. We also maintain directors’ and officers’ liability insurance.
The limitation of liability and indemnification provisions in our restated certificate of incorporation and bylaws may discourage stockholders from bringing a lawsuit against our directors and officers for breach of their fiduciary duty. They may also reduce the likelihood of derivative litigation against our directors and officers, even though an action, if successful, might benefit us and other stockholders. Further, a stockholder’s investment may be adversely affected to the extent that we pay the costs of settlement and damage awards against directors and officers as required by these indemnification provisions.
At present, there is no pending litigation or proceeding involving any of our directors or executive officers as to which indemnification is required or permitted, and we are not aware of any threatened litigation or proceeding that may result in a claim for indemnification.
Insofar as indemnification for liabilities arising under the Securities Act may be permitted to directors, executive officers or persons controlling us, we have been informed that in the opinion of the SEC such indemnification is against public policy as expressed in the Securities Act and is therefore unenforceable.
104
Table of Contents
Other than the executive officer and director compensation arrangements discussed above under “Director Compensation” and “Executive Compensation,” and the arrangements described below, there were no transactions since January 1, 2007 to which we have been a participant, in which the amount involved in the transaction exceeds or will exceed $120,000 and in which any of our directors, executive officers or holders of more than 5% of our capital stock, or any immediate family member of, or person sharing the household with, any of these individuals, had or will have a direct or indirect material interest.
Third Amended and Restated Investors’ Rights Agreement
We have entered into an investors’ rights agreement with certain holders of our convertible preferred stock and common stock, including entities with which certain of our directors are affiliated. As of January 1, 2007, the holders of 32,494,245 shares of our common stock, including the common stock issuable upon the conversion of our preferred stock, are entitled to rights with respect to the registration of their shares following this offering under the Securities Act. For a description of these registration rights, see “Description of Capital Stock—Registration Rights.” In addition, the election of the members of our board of directors is governed by certain provisions contained in our investors’ rights agreement. The holders of a majority of our Series A preferred stock, voting as a separate series, have designated Michael N. Schuh and Bruce Golden for election to our board of directors. The holders of a majority of our Series C preferred stock, voting as a separate series, have designated Gregory C. Gretsch for election to our board of directors. The holders of a majority of our common stock and preferred stock, voting together as a class on as-converted basis, have designated Daniel D. Springer and Robert W. Frick for election to our board of directors. These provisions will terminate upon the closing of this offering.
Indemnification Agreements
We intend to enter into indemnification agreements with each of directors and executive officers. For more information regarding these agreements, see “Limitations on Liability and Indemnification Matters.”
Stock Option Exchange
In July 2009, our board of directors determined that certain stock options that had been granted to our executive officers, including certain of our named executive officers, in January 2008 were no longer providing the incentive intended when they were originally granted. The stock options were subject to vesting upon our completion of an initial public offering, which our board of directors determined was no longer an appropriate vesting milestone due to uncertainty in the capital markets. In order to restore the intended incentive effect to these stock options, our board of directors approved an exchange that allowed the executive officers to exchange their old stock options for new stock options with different vesting terms. The number and terms of the cancelled stock options and new options granted to our named executive officers are summarized in the table below:
| Named Executive Officer |
Shares Subject to Cancelled Options(1) |
Shares Subject to New Options(2) |
||||||
| Daniel D. Springer |
962,278 | 950,000 | ||||||
| Christian A. Paul |
320,759 | 312,500 | ||||||
| Scott V. Olrich |
320,759 | 375,000 | ||||||
| (1) | The cancelled options were originally granted in January 2008. The exercise price per share of the cancelled options on the date of grant was $2.80 per share. Each of the options was scheduled to fully vest upon the named executive officer’s completion of six years of continuous service with us following the grant date. In addition, in the event of change in control of us prior to an initial public offering, or IPO, each of the options would terminate in its entirety. In the event of an IPO that closed during the named executive officer’s service with us and within three years following the date of grant, each of the options would be subject to modified vesting acceleration provisions, depending on our market capitalization following the IPO, provided that each named executive officer remained in continuous service with us until each of the accelerated vesting dates. |
105
Table of Contents
| (2) | The new options were granted on July 22, 2009. The exercise price per share of the new options on the date of grant was $2.60 per share. The new options are immediately exercisable, subject to our right of repurchase (at the exercise price) until the shares vest. The shares vest upon the earlier of (i) the completion of 119 months of continuous service from the vesting commencement date, which differs for each named executive officer, depending on the officer’s start date, and (ii) our attainment of a Milestone (as defined below). Upon the completion of 119 months of continuous service, the shares vest in full. Upon the attainment of a Milestone, 25% of the total number of shares vest for each year of continuous service that the named executive officer has completed since the vesting commencement date, until fully vested. A “Milestone” is attained when either (i) our revenues for four consecutive completed calendar quarters totals more than $100 million or (ii) we undergo a change in control before the named executive officer’s service terminates and the aggregate proceeds available for distribution to our stockholders exceeds $250 million. The vesting commencement date was March 12, 2009 for Messrs. Springer and Olrich and August 16, 2009 for Mr. Paul. |
Share Repurchases
On December 15, 2010, we repurchased 250,006 shares of common stock from Daniel Springer, our Chief Executive Officer, at a purchase price equal to $7.40 per share, which was the most recent fair value of our common stock, as determined by our board of directors. We repurchased the shares pursuant to our exercise of our right of first refusal set forth in the 1999 Stock Plan agreement under which the shares were originally issued.
On December 16, 2010, we repurchased 125,000 shares of common stock from Andrew Priest, our Chief Customer Officer, at a purchase price equal to $7.40 per share, which was the most recent fair value of our common stock, as determined by our board of directors. We repurchased the shares pursuant to our exercise of our right of first refusal set forth in the 1999 Stock Plan agreement under which the shares were originally issued.
Share Issuances and Option Grants
On March 11, 2011, we issued 15,000 shares of our common stock under our 1999 Stock Plan to Edwin Gillis, a member of our board of directors, at a purchase price equal to $8.00 per share.
On March 29, 2011, our board of directors granted Messrs. Henrich and Gillis options to purchase 87,500 shares and 50,000 shares of our common stock, respectively, at an exercise price of $9.25 per share, the midpoint of the price range set forth on the cover of this prospectus. The shares subject to the option granted to Mr. Henrich vest as to 25% on the one-year anniversary of the grant date, and the remainder of the shares vest monthly in equal installments over the next three years. The shares subject to the option granted to Mr. Gillis vest monthly over a three year period that began March 2, 2011. Vesting under both options is contingent on their continued service with us.
We intend to grant options to three members of our board of directors upon the closing of this offering. See “Director Compensation” for additional information.
Review, Approval or Ratification of Transactions with Related Parties
Our policy and the charter of our audit committee to be adopted by our board of directors and in effect upon the closing of this offering requires that any transaction with a related party that must be reported under applicable rules of the SEC must be reviewed and approved or ratified by our audit committee, unless the related party is, or is associated with, a member of that committee, in which event the transaction must be reviewed and approved by our nominating and corporate governance committee.
Prior to this offering we had no formal, written policy or procedure for the review and approval of related party transactions; however, our practice has been that all related party transactions are reviewed and approved by a majority of the disinterested members of our board of directors.
106
Table of Contents
PRINCIPAL AND SELLING STOCKHOLDERS
The following table sets forth certain information with respect to the beneficial ownership of our common stock as of March 31, 2011 and as adjusted to reflect the sale of common stock offered by us and the selling stockholders in this offering, for:
| • | each stockholder known by us to be the beneficial owner of more than 5% of our outstanding shares of common stock; |
| • | each of our directors; |
| • | each of our named executive officers; |
| • | all of our directors and executive officers as a group; and |
| • | each selling stockholder. |
We have determined beneficial ownership in accordance with the rules of the SEC. Except as indicated by the footnotes below, we believe, based on the information furnished to us, that the persons and entities named in the table below have sole voting and investment power with respect to all shares of common stock that they beneficially own, subject to applicable community property laws.
Applicable percentage ownership is based on 40,233,646 shares of common stock outstanding at March 31, 2011, assuming conversion of all outstanding shares of preferred stock into 30,158,928 shares of common stock. For purposes of the table below, we have assumed that shares of common stock will be sold in this offering. In computing the number of shares of common stock beneficially owned by a person and the percentage ownership of that person, we deemed to be outstanding all shares of common stock subject to options, warrants or other convertible securities held by that person or entity that are currently exercisable or exercisable within 60 days of March 31, 2011. We did not deem these shares outstanding, however, for the purpose of computing the percentage ownership of any other person. Unless otherwise indicated, the address of each beneficial owner listed in the table below is c/o Responsys, Inc., 900 Cherry Avenue, 5th Floor, San Bruno, California 94066.
| Shares Beneficially Owned Prior to This Offering |
Number of Shares Being Offered |
Shares Beneficially Owned After This Offering |
||||||||||||||||||
| Name of Beneficial Owner |
Number | Percentage | Number | Percentage | ||||||||||||||||
| Directors and Named Executive Officers: |
||||||||||||||||||||
| Daniel D. Springer(1) |
4,061,401 | 9.6 | % | — | 4,061,401 | 8.5 | % | |||||||||||||
| Christian A. Paul(2) |
737,500 | 1.8 | — | 737,500 | 1.6 | |||||||||||||||
| Edward A. Henrich(3) |
287,499 | * | — | 287,499 | * | |||||||||||||||
| Julian K. Ong(4) |
162,500 | * | — | 162,500 | * | |||||||||||||||
| Scott V. Olrich(5) |
1,437,500 | 3.5 | — | 1,437,500 | 3.0 | |||||||||||||||
| Robert W. Frick(6) |
716,608 | 1.8 | 75,000 | 641,608 | 1.4 | |||||||||||||||
| Edwin J. Gillis(7) |
75,000 | * | — | 75,000 | * | |||||||||||||||
| Bruce Golden(8) |
— | * | — | — | * | |||||||||||||||
| Gregory C. Gretsch(9) |
7,435,348 | 18.5 | — | 7,435,348 | 16.3 | |||||||||||||||
| Michael N. Schuh(10) |
7,925,557 | 19.7 | — | 7,925,557 | 17.3 | |||||||||||||||
| All executive officers and directors as a group |
25,195,163 | 53.4 | 75,000 | 25,120,163 | 47.7 | |||||||||||||||
| 5% Stockholders: |
||||||||||||||||||||
| Entities affiliated with Foundation Capital(12) |
7,925,557 | 19.7 | — | 7,925,557 | 17.3 | |||||||||||||||
| Entities affiliated with Sigma Partners(13) |
7,435,348 | 18.5 | — | 7,435,348 | 16.3 | |||||||||||||||
| Entities affiliated with Accel Partners(14) |
6,738,707 | 16.8 | — | 6,738,707 | 14.7 | |||||||||||||||
| Entities affiliated with Redpoint Ventures(15) |
4,266,034 | 10.6 | — | 4,266,034 | 9.3 | |||||||||||||||
| Entities affiliated with The Entrepreneurs’ Fund(16) |
3,273,359 | 8.1 | 894,654 | 2,378,705 | 5.2 | |||||||||||||||
| Other Selling Stockholders: |
||||||||||||||||||||
| Anand Jagannathan(17) |
801,086 | 2.0 | 75,000 | 726,086 | 1.6 | |||||||||||||||
| Raghunath Raghavan(18) |
787,500 | 2.0 | 75,000 | 712,500 | 1.6 | |||||||||||||||
| * | Less than 1%. |
107
Table of Contents
| (1) | Includes 2,078,565 shares of common stock issuable upon exercise of options exercisable within 60 days of March 31, 2011, of which 950,000 are unvested and early exercisable and would be subject to a right of repurchase in our favor upon exercise and Mr. Springer’s cessation of service prior to vesting. As described in “Related Party Transactions” above, we repurchased shares of common stock from Mr. Springer on December 15, 2010. |
| (2) | Includes 737,500 shares of common stock issuable upon exercise of options exercisable within 60 days of March 31, 2011, of which 312,500 are unvested and early exercisable and would be subject to a right of repurchase in our favor upon exercise and Mr. Paul’s cessation of service prior to vesting. |
| (3) | Includes 287,499 shares of common stock issuable upon exercise of options exercisable within 60 days of March 31, 2011, of which 172,656 are unvested and early exercisable and would be subject to a right of repurchase in our favor upon exercise and Mr. Henrich’s cessation of service. |
| (4) | Includes 93,749 shares of common stock which, within 60 days of March 31, 2011, are unvested and subject to a right of repurchase in our favor upon Mr. Ong’s cessation of service. |
| (5) | Includes 1,437,500 shares of common stock issuable upon exercise of options exercisable within 60 days of March 31, 2011, of which 375,000 are unvested and early exercisable and would be subject to a right of repurchase in our favor upon exercise and Mr. Olrich’s cessation of service prior to vesting. |
| (6) | Includes 14,063 shares of common stock which, within 60 days of March 31, 2011, are unvested and subject to a right of repurchase in our favor upon Mr. Frick’s cessation of service. If the underwriters’ over-allotment option is exercised in full, then Mr. Frick would sell an additional 25,000 shares and would beneficially own 616,608 shares of common stock after the offering, representing 1.4% of our outstanding common stock. |
| (7) | Includes 50,000 shares of common stock issuable upon exercise of options exercisable within 60 days of March 31, 2011, of which 47,223 are unvested and early exercisable and would be subject to a right of repurchase in our favor upon Mr. Gillis’ cessation of service prior to vesting. |
| (8) | Does not include 6,738,707 shares of common stock beneficially owned by the Accel Funds, as described in further detail in footnote 14. Mr. Golden is a partner of Accel Partners and he disclaims beneficial ownership of any of the Accel Funds’ shares. We intend to grant Mr. Golden a stock option to purchase shares of our common stock upon the closing of this offering. See “Director Compensation” for additional information. |
| (9) | Mr. Gretsch is a managing member of Sigma Partners. See footnote 13. We intend to grant Mr. Gretsch a stock option to purchase shares of our common stock upon the closing of this offering. See “Director Compensation” for additional information. |
| (10) | Mr. Schuh is a general partner of Foundation Capital. See footnote 12. We intend to grant Mr. Schuh a stock option to purchase shares of our common stock upon the closing of this offering. See “Director Compensation” for additional information. |
| (11) | Includes 6,947,314 shares issuable upon exercise of options within 60 days of March 31, 2011 that are held by our directors and officers as a group, of which 2,819,878 are unvested and early exercisable and would be subject to a right of repurchase in our favor upon the holder’s cessation of service with us prior to vesting. Also includes 107,812 shares of common stock that will be unvested within 60 days of March 31, 2011 and subject to a right of repurchase in our favor upon the holder’s cessation of service with us prior to vesting. |
| (12) | Includes the following shares of common stock beneficially owned: (i) 4,226,192 shares held by Foundation Capital II, LP, or FC2; (ii) 497,197 shares held by Foundation Capital II Entrepreneurs Fund, LLC, or FC2EF; (iii) 248,599 shares of common stock beneficially owned by Foundation Capital II Principals Fund, LLC, or FC2PF; (iv) 2,876,856 shares held by Foundation Capital Leadership Fund, LP, or FCLF; and (v) 76,713 shares held by Foundation Capital Leadership Principals Fund, LLC, or FCLPF. FC Leadership Management Co., LLC is the general partner of FC2, FC2PF and FC2EF. FC Leadership Management Co., LLC is the general partner of FCLF and FCLPF. Mr. Schuh is managing member of both FC Leadership Management Co. II, LLC, or FCLM2, and FC Leadership Management Co., LLC, or FCLM and as such, Mr. Schuh has voting and investment control over the shares beneficially owned by FC2, FC2EF, FC2PF, FCLF and FCLPF, which we refer to collectively as the “Foundation Funds.” Each of the Foundation Funds is located at 250 Middlefield Road, Menlo Park, California 94025. |
108
Table of Contents
| (13) | Includes the following shares of common stock beneficially owned: (i) 754,583 shares held by Sigma Associates 6, L.P., or Sigma Associates; (ii) 73,922 shares held by Sigma Investors 6, L.P., or Sigma Investors; and (iii) 6,606,843 shares held by Sigma Partners 6, L.P., or Sigma Partners. Sigma Management 6, L.L.C. is the general partner of Sigma Associates, Sigma Investors and Sigma Partners, which we refer to collectively as the “Sigma Funds.” Sigma Management 6, L.L.C. has sole voting and investment power. Robert Davoli, Lawrence Finch, Gregory Gretsch, Clifford L. Haas, John Mandile, Peter Solvik, Robert Spinner and Wade Woodson, as managing members of Sigma Management 6, L.L.C., share this power. Each of the Sigma Funds is located at 1600 El Camino Real, Suite 280, Menlo Park, California 94025. |
| (14) | Includes the following shares of common stock beneficially owned: (i) 129,036 shares held by Accel Internet Fund II L.P., or Accel Internet; (ii) 412,739 shares held by Accel Investors ‘98 L.P., or Accel ‘98; (iii) 683,397 shares held by Accel Investors ’98-S L.P., or Accel ‘98-S; (iv) 87,602 shares held by Accel Keiretsu VI L.P., or Accel Keiretsu; (v) 1,009,960 shares held by Accel VI L.P., or Accel VI; and (vi) 4,415,973 shares held by Accel VI-S, L.P., or Accel VI-S. We refer to Accel Internet, Accel ‘98, Accel ‘98-S, Accel Keiretsu, Accel VI and Accel VI-S collectively as the “Accel Funds.” Accel Internet Fund II Associates L.L.C. is the general partner of Accel Internet and has sole voting and investment power. James W. Breyer, Arthur C. Patterson and James R. Swartz are the managing members of Accel Internet Fund II Associates L.L.C. and share such powers. Accel VI Associates L.L.C. is the general partner of Accel ‘98-S, Accel VI and Accel VI-S and has the sole voting and investment power. James W. Breyer, Arthur C. Patterson and James R. Swartz are the managing members of Accel VI Associates L.L.C. and share such powers. Accel Keiretsu VI Associates L.L.C. is the general partner of Accel Keiretsu and has the sole voting and investment power. James W. Breyer, Arthur C. Patterson and James R. Swartz are the managing members of Accel Keiretsu VI Associates L.L.C. and share such powers. James W. Breyer, Arthur C. Patterson and James R. Swartz are general partners of Accel ‘98 and share voting and investment power. Each of the Accel Funds is located at 428 University Avenue, Palo Alto, California 94301. |
| (15) | Includes the following shares of common stock beneficially owned: (i) 119,439 share held by Redpoint Associates I, LLC, or Redpoint Associates; (ii) 18,059 shares held by Redpoint Technology Partners A-1, L.P., or Redpoint A-1; (iii) 113,018 shares held by Redpoint Technology Partners Q-1, L.P., or Redpoint Q-1; and (iv) 4,015,518 shares held by Redpoint Ventures I, L.P., or Redpoint Ventures. Redpoint Ventures I, LLC is the general partner of Redpoint Associates, Redpoint A-1, Redpoint Q-1 and Redpoint Ventures, which we refer to collectively as the “Redpoint Funds.” Redpoint Ventures I, LLC has sole voting and investment power over the Redpoint Funds. Jeffrey Brody, Thomas Dyal, Timothy Haley, G. Bradford Jones, John Walecka and Geoffrey Yang share this power. Each of the Redpoint Funds is located at 3000 Sand Hill Road, Building 2, Menlo Park, California 94025. |
| (16) | Includes the following shares of common stock beneficially owned: (i) 810,002 shares held by The Entrepreneurs’ Fund, L.P., or TEF; (ii) 810,023 shares held by The Entrepreneurs’ Fund II, L.P., or TEF2; (iii) 1,568,682 shares held by The Entrepreneurs’ Growth Fund, or TEGF; (iv) 64,931 shares held by RBW Investments, LLC, or RBW; and (v) 19,721 shares held by Jeffrey T. Webber. BW Management, LLC is the general partner of TEF. Jeffrey Webber has voting and investment power over TEF. BW Management II, LLC is the general partner of TEF2 and TEGF. Jeffrey Webber and C. Woodrow Rea, Jr. have voting and investment power over TEF2 and TEGF. Mr. Webber has voting and investment power over RBW. Each of The Entrepreneur’s Funds is located at 800 W. El Camino Real, Suite 180, Mountain View, California, 94040. |
| (17) | Our board of directors granted Mr. Jagannathan an option to purchase 535,016 shares of common stock on November 13, 2003 at an exercise price of $0.04 per share and extended the exercisability of the option through 2011. Mr. Jagannathan exercised the option on December 5, 2008, November 9, 2009, December 1, 2010 and February 4, 2011 and purchased 150,000, 35,016, 22,500 and 327,500 shares, respectively on those dates. Neither we nor our predecessors or affiliates have had a material relationship with Mr. Jagannathan during the last three years. |
| (18) | Our board of directors granted Mr. Raghavan an option to purchase 535,016 shares of common stock on November 13, 2003 at an exercise price of $0.04 per share and extended the exercisability of the option through 2010. Mr. Raghavan exercised the option on June 2, 2008 and December 18, 2010 and purchased 250,000 and 285,016 shares, respectively on those dates. Neither we nor our predecessors or affiliates have had a material relationship with Mr. Raghavan during the last three years. |
109
Table of Contents
Upon the closing of this offering, our authorized capital stock will consist of 250,000,000 shares of common stock, $0.0001 par value per share, and 5,000,000 shares of undesignated preferred stock, $0.0001 par value per share. A description of the material terms and provisions of our restated certificate of incorporation and bylaws that will be in effect at the closing this offering and affecting the rights of holders of our capital stock is set forth below. The description is intended as a summary, and is qualified in its entirety by reference to the form of our restated certificate of incorporation and the form of our restated bylaws adopted in connection with this offering that are included as exhibits to the registration statement of which this prospectus forms a part.
As of December 31, 2010, and after giving effect to the automatic conversion of all of our outstanding preferred stock into common stock in connection with this offering, there were outstanding:
| • | 38,606,658 shares of our common stock held by approximately 300 stockholders; |
| • | 10,937,216 shares issuable upon exercise of outstanding stock options; and |
| • | 28,302 shares issuable upon exercise of an outstanding warrant. |
Common Stock
Dividend Rights
Subject to preferences that may apply to shares of preferred stock outstanding at the time, the holders of outstanding shares of our common stock are entitled to receive dividends out of funds legally available if our board of directors, in its discretion, determines to issue dividends and only then at the times and in the amounts that our board of directors may determine. See “Dividend Policy” for more information.
Voting Rights
Each holder of common stock is entitled to one vote for each share of common stock held on all matters submitted to a vote of stockholders. Stockholders do not have the ability to cumulate votes for the election of directors. We have a classified board of directors, to be divided into three classes with staggered three-year terms. Only one class of directors will be elected at each annual meeting of our stockholders, with the other classes continuing for the remainder of their respective three-year terms.
No Preemptive or Similar Rights
Our common stock is not entitled to preemptive rights and is not subject to conversion, redemption or sinking fund provisions.
Right to Receive Liquidation Distributions
Upon our dissolution, liquidation or winding-up, the assets legally available for distribution to our stockholders are distributable ratably among the holders of our common stock, subject to prior satisfaction of all outstanding debt and liabilities and the preferential rights and payment of liquidation preferences, if any, on any outstanding shares of preferred stock.
Preferred Stock
Upon the closing of this offering, no shares of preferred stock will be outstanding, but we will be authorized, subject to limitations prescribed by Delaware law, to issue preferred stock in one or more series, to establish from time to time the number of shares to be included in each series and to fix the designation, powers, preferences and rights of the shares of each series and any of its qualifications, limitations or restrictions. Our board of
110
Table of Contents
directors also can increase or decrease the number of shares of any series, but not below the number of shares of that series then outstanding, without any further vote or action by our stockholders. Our board of directors may authorize the issuance of preferred stock with voting or conversion rights that could adversely affect the voting power or other rights of the holders of the common stock. The issuance of preferred stock, while providing flexibility in connection with possible acquisitions and other corporate purposes, could, among other things, have the effect of delaying, deferring or preventing a change in control of our company and may adversely affect the market price of our common stock and the voting and other rights of the holders of common stock. We have no current plan to issue any shares of preferred stock.
Options
As of December 31, 2010, we had options to purchase 10,937,216 shares of our common stock outstanding pursuant to our 1999 Stock Plan.
Warrants
As of December 31, 2010, we had an outstanding warrant to purchase 28,302 shares of our common stock with an exercise price of $6.36 per share. The exercise price of the warrant may be paid either in cash or by surrendering the right to receive shares of common stock having a value equal to the exercise price.
Registration Rights
After this offering, the holders of an aggregate of 32,494,245 shares of our common stock and 28,302 shares subject to a warrant to purchase our common stock outstanding as of December 31, 2010 will be entitled to certain rights with respect to registration of such shares under the Securities Act of 1933, as amended. These shares are referred to as registrable securities. The holders of these registrable securities possess registration rights pursuant to the terms of our Third Amended and Restated Investors’ Rights Agreement dated January 6, 2003 by and among us and such holders, or the investors’ rights agreement.
Demand Registration Rights
Under our investors’ rights agreement, upon the written request of the holders of at least 50% of the registrable securities then outstanding that we file a registration statement under the Securities Act with an anticipated aggregate price to the public of at least $15,000,000, we will be obligated to use our commercially reasonable efforts to register the sale of all registrable securities that the holders may request in writing to be registered within 30 days of mailing of notice by us. The demand registration rights may not be exercised until six months after this offering. We are required to effect no more than two registration statements which are declared or ordered effective. We may refuse to effect a registration in any jurisdiction in which we would be required to consent to service of process, unless we are already subject to service in such jurisdiction. We may postpone the filing of a registration statement for up to 90 days once in a 12-month period if in the good faith judgment of the board of directors such registration would be detrimental to us, and are not required to effect the filing of a registration statement during the period beginning 60 days prior to our good faith estimate of the date of the filing of, and ending on a date 180 days following the effective date of, a registration initiated by us. Holders of shares with these registration rights have signed agreements with the underwriters prohibiting the exercise of their registration rights for 180 days, subject to a possible extension of up to 34 additional days beyond the end of such 180-day period, following the date of this prospectus. These agreements are described below under “Underwriting.”
Piggyback Registration Rights
If we register any of our securities for public sale, we will have to use all commercially reasonable efforts to register all registrable securities that the holders of such securities request in writing be registered within 30 days
111
Table of Contents
of mailing of notice by us of the proposed registration. However, this right does not apply to a registration relating to any of our stock plans, the offer and sale of debt securities, a corporate reorganization or other transaction under Rule 145 of the Securities Act, or a registration on any registration form that does not include substantially the same information as would be required to be included in a registration statement covering the sale of the registrable securities. The managing underwriter of any underwritten offering will have the right to limit, due to marketing reasons, the number of shares registered by these holders to 40% of the total shares covered by the registration statement.
Form S-3 Registration Rights
The holders of at least 20% of the registrable securities can request that we register all or a portion of their shares on Form S-3 if we are eligible to file a registration statement on Form S-3 and the aggregate price to the public of the shares offered is at least $3.0 million. We are required to file no more than one registration statement on Form S-3 upon exercise of these rights per 12-month period. We may postpone the filing of a registration statement for up to 90 days once in a 12-month period if in the good faith judgment of the board of directors such registration would be detrimental to us.
Registration Expenses
We will pay all expenses incurred in connection with each of the registrations described above, except for underwriting discounts and commissions. However, we will not pay for any expenses of any demand or Form S-3 registration if the request is subsequently withdrawn at the request of a majority of the holders of the registrable securities to be registered, subject to limited exceptions.
Expiration of Registration Rights
The registration rights described above will survive this offering and will terminate as to any stockholder at such time as all of such stockholders’ securities (together with any affiliate of the stockholder with whom such stockholder must aggregate its sales) could be sold without compliance with the registration requirements of the Securities Act of 1933 pursuant to Rule 144 or following a deemed liquidation event under our current amended and restated articles of incorporation, but in any event no later than the five-year anniversary of this offering.
Anti-takeover Provisions
The provisions of Delaware law, our restated certificate of incorporation and our restated bylaws that will be in effect at the closing of this offering may have the effect of delaying, deferring or discouraging another person from acquiring control of our company.
Delaware Law
Upon the closing of this offering, we will be governed by the provisions of Section 203 of the Delaware General Corporation Law regulating corporate takeovers. This section prevents some Delaware corporations from engaging, under some circumstances, in a business combination, which includes a merger or sale of at least 10% of the corporation’s assets with any interested stockholder, meaning a stockholder who, together with affiliates and associates, owns or, within three years prior to the determination of interested stockholder status, did own 15% or more of the corporation’s outstanding voting stock, unless:
| • | the transaction is approved by the board of directors prior to the time that the interested stockholder became an interested stockholder; |
| • | upon consummation of the transaction which resulted in the stockholder’s becoming an interested stockholder, the interested stockholder owned at least 85% of the voting stock of the corporation outstanding at the time the transaction commenced; or |
112
Table of Contents
| • | subsequent to such time that the stockholder became an interested stockholder the business combination is approved by the board of directors and authorized at an annual or special meeting of stockholders by at least two-thirds of the outstanding voting stock which is not owned by the interested stockholder. |
A Delaware corporation may “opt out” of these provisions with an express provision in its original certificate of incorporation or an express provision in its certificate or incorporation or bylaws resulting from a stockholders’ amendment approved by at least a majority of the outstanding voting shares. We have not opted out of these provisions. As a result, mergers or other takeover or change in control attempts of us may be discouraged or prevented.
Restated Certificate of Incorporation and Bylaws Provisions
Our restated certificate of incorporation and our restated bylaws will include a number of provisions that may have the effect of deterring hostile takeovers or delaying or preventing changes in control of our management team, including the following:
| • | Board of Directors Vacancies. Our restated certificate of incorporation and bylaws authorize only our board of directors to fill vacant directorships. In addition, the number of directors constituting our board of directors is set only by resolution adopted by a majority vote of our entire board of directors. These provisions prevent a stockholder from increasing the size of our board of directors and gaining control of our board of directors by filling the resulting vacancies with its own nominees. |
| • | Classified Board. Our restated certificate of incorporation and bylaws provide that our board of directors is classified into three classes of directors. The existence of a classified board could delay a successful tender offeror from obtaining majority control of our board of directors, and the prospect of that delay might deter a potential offeror. |
| • | Stockholder Action; Special Meeting of Stockholders. Our restated certificate of incorporation provides that our stockholders may not take action by written consent, but may only take action at annual or special meetings of our stockholders. Stockholders will not be permitted to cumulate their votes for the election of directors. Our restated bylaws further provide that special meetings of our stockholders may be called only by a majority of our board of directors, the chairperson of our board of directors, our chief executive officer or our president. |
| • | Advance Notice Requirements for Stockholder Proposals and Director Nominations. Our restated bylaws provide advance notice procedures for stockholders seeking to bring business before our annual meeting of stockholders, or to nominate candidates for election as directors at any meeting of stockholders. Our restated bylaws also specify certain requirements regarding the form and content of a stockholder’s notice. These provisions may preclude our stockholders from bringing matters before our annual meeting of stockholders or from making nominations for directors at our meetings of stockholders. |
| • | Issuance of Undesignated Preferred Stock. Our board of directors has the authority, without further action by the stockholders, to issue up to 5,000,000 shares of undesignated preferred stock with rights and preferences, including voting rights, designated from time to time by the board of directors. The existence of authorized but unissued shares of preferred stock enables our board of directors to render more difficult or to discourage an attempt to obtain control of us by means of a merger, tender offer, proxy contest or otherwise. |
Listing
We have applied to list our common stock on the NASDAQ Global Market under the symbol “MKTG.”
Transfer Agent and Registrar
The transfer agent and registrar for our common stock is Computershare, Inc.
113
Table of Contents
SHARES ELIGIBLE FOR FUTURE SALE
Before this offering, there has not been a public market for shares of our common stock. Future sales of substantial amounts of shares of our common stock, including shares issued upon the exercise of outstanding options and an outstanding warrant, in the public market after this offering, or the possibility of these sales occurring, could cause the prevailing market price for our common stock to fall or impair our ability to raise equity capital in the future.
Upon the closing of this offering, a total of 44,106,658 shares of common stock will be outstanding, assuming 38,606,658 shares outstanding as of December 31, 2010 and that there are no exercises of options or warrants after December 31, 2010. Of these shares, all 6,619,654 shares of common stock sold in this offering by us and the selling stockholders will be freely tradable in the public market without restriction or further registration under the Securities Act, unless these shares are held by “affiliates,” as that term is defined in Rule 144 under the Securities Act.
The remaining 37,487,004 shares of common stock will be “restricted securities,” as that term is defined in Rule 144 under the Securities Act. These restricted securities are eligible for public sale only if they are registered under the Securities Act or if they qualify for an exemption from registration under Rule 144 or Rule 701 under the Securities Act, which are summarized below.
As a result of the lock-up and market standoff agreements described below and subject to the provisions of Rules 144 and 701 under the Securities Act, these restricted securities will be available for sale in the public market as follows:
| • | on the date of this prospectus, none of the shares will be available for sale in the public market without restriction; and |
| • | beginning 181 days after the date of this prospectus, subject to extension as described in “Underwriters,” 37,487,004 shares will become eligible for sale in the public market, of which 8,679,040 shares will be freely tradeable under Rule 144, and 28,807,958 shares will be freely tradeable, subject to the limitations under Rules 144 and 701, of which 91,147 shares will be unvested and subject to our right of repurchase. |
In addition, of the 10,937,216 shares of our common stock that were subject to stock options outstanding as of December 31, 2010, options to purchase 6,893,517 shares of common stock were vested as of December 31, 2010 and will be eligible for sale 181 days following the effective date of this prospectus, subject to extension as described in “Underwriters.”
Rule 144
In general, under Rule 144 as currently in effect, once we have been subject to public company reporting requirements for at least 90 days, a person who is not deemed to have been one of our affiliates for purposes of the Securities Act at any time during the 90 days preceding a sale and who has beneficially owned the shares proposed to be sold for at least six months, including the holding period of any prior owner other than our affiliates, is entitled to sell those shares without complying with the manner of sale, volume limitation or notice provisions of Rule 144, subject to compliance with the public information requirements of Rule 144. If such a person has beneficially owned the shares proposed to be sold for at least one year, including the holding period of any prior owner other than our affiliates, then that person is entitled to sell those shares without complying with any of the requirements of Rule 144.
In general, under Rule 144, as currently in effect, our affiliates or persons selling shares on behalf of our affiliates are entitled to sell upon the expiration of the lock-up and market standoff agreements described below, within any three-month period beginning 90 days after the date of this prospectus, a number of shares that does not exceed the greater of:
| • | 1% of the number of shares of common stock then outstanding, which will equal approximately 441,067 shares immediately after the offering, or |
114
Table of Contents
| • | the average weekly trading volume of the common stock during the four calendar weeks preceding the filing of a notice on Form 144 with respect to such sale. |
Sales under Rule 144 by our affiliates or persons selling shares on behalf of our affiliates are also subject to certain manner of sale provisions and notice requirements and to the availability of current public information about us.
Rule 701
In general, under Rule 701 as currently in effect, any of our employees, consultants or advisors who purchase shares from us in connection with a compensatory stock or option plan or other written agreement in a transaction before the effective date of this offering that was completed in reliance on Rule 701 and complied with the requirements of Rule 701 will, subject to the restrictions described below, be eligible to resell such shares 90 days after the date of this prospectus in reliance on Rule 144, but without compliance with certain restrictions, including the holding period, contained in Rule 144.
Lock-up Agreements and Market Standoff Agreements
Our officers, directors and the holders of approximately 96% of our common stock outstanding on a fully-diluted basis immediately prior to this offering have agreed with the underwriters, subject to certain exceptions, not to dispose of any of our common stock or securities convertible into or exchangeable for shares of our common stock for a period that extends through the date 180 days after the date of this prospectus, except with the prior written consent of Morgan Stanley & Co. Incorporated. In addition, substantially all holders of our common stock and options and warrants to purchase our common stock have previously entered into market standoff agreements with us not to sell or otherwise transfer any of their common stock or securities convertible into or exchangeable for shares of common stock for a period that extends through 180 days after the date of this prospectus.
The 180-day restricted period under the lock-up agreements with the underwriters described in the preceding paragraph will be automatically extended if: (1) during the last 17 days of the 180-day restricted period we issue an earnings release or material news or a material event relating to us occurs; or (2) prior to the expiration of the 180-day restricted period, we announce that we will release earnings results during the 16-day period beginning on the last day of the 180-day period, in which case the restrictions described in the preceding paragraph will continue to apply until the expiration of the 18-day period beginning on the issuance of the earnings release or the occurrence of the material news or material event.
See “Underwriters” for a more complete description of the lock-up agreements.
Registration Rights
Upon the closing of this offering, the holders of an aggregate of 32,494,245 shares of our common stock and the holder of a warrant to purchase an aggregate of 28,302 shares of our common stock, or their permitted transferees, will be entitled to rights with respect to the registration of the sale of these shares under the Securities Act. Registration of the sale of these shares under the Securities Act would result in these shares becoming fully tradable without restriction under the Securities Act immediately upon the effectiveness of the registration, except for shares purchased by affiliates. See “Description of Capital Stock—Registration Rights” for additional information.
Registration Statements
We intend to file a registration statement on Form S-8 under the Securities Act covering all of the shares of common stock subject to options outstanding and reserved for issuance under our stock plans. We expect to file this registration statement as soon as practicable after this offering. However, none of the shares registered on Form S-8 will be eligible for resale until the expiration of the lock-up and market standoff agreements to which they are subject.
115
Table of Contents
MATERIAL UNITED STATES FEDERAL TAX CONSIDERATIONS
FOR NON-U.S. HOLDERS OF COMMON STOCK
This section summarizes the material United States federal income and estate tax considerations relating to the ownership and disposition of our common stock by “non-U.S. holders.” This summary does not provide a complete analysis of all potential tax considerations. The information provided below is based upon provisions of the Internal Revenue Code of 1986, as amended, or the Code, and Treasury regulations promulgated thereunder, administrative rulings and judicial decisions currently in effect. These authorities may change at any time, possibly on a retroactive basis, or the Internal Revenue Service, or IRS, might interpret the existing authorities differently. In either case, the tax considerations of owning or disposing of our common stock could differ from those described below. For purposes of this summary, a “non-U.S. holder” is any holder of our common stock, other than a partnership, that is not:
| • | an individual who is a citizen or resident of the United States; |
| • | a corporation created or organized under the laws of the United States, any state therein or the District of Columbia; |
| • | a trust if it (1) is subject to the primary supervision of a United States court and one of more United States persons have authority to control all substantial decisions of the trust or (2) has a valid election in effect under applicable United States Treasury regulations to be treated as a United States person; or |
| • | an estate whose income is subject to United States income tax regardless of source. |
If you are an individual, you may, in many cases, be deemed to be a resident alien, as opposed to a nonresident alien, by virtue of being present in the United States for at least 31 days in the calendar year and for an aggregate of at least 183 days during a three-year period ending in the current calendar year. For these purposes, all the days present in the current year, one-third of the days present in the immediately preceding year, and one-sixth of the days present in the second preceding year are counted. Resident aliens are subject to United States federal income tax as if they were United States citizens. Such an individual is urged to consult his or her own tax advisor regarding the United States federal income tax consequences of the ownership or disposition of our common stock. If a partnership or other pass-through entity is a beneficial owner of our common stock, the tax treatment of a partner in the partnership or an owner of the entity will depend upon the status of the partner or other owner and the activities of the partnership or other entity. Any partner in a partnership or owner of a pass-through entity holding shares of our common stock should consult its own tax advisor.
This discussion assumes that a non-U.S. holder will hold our common stock as a capital asset (generally, property held for investment). The summary generally does not address tax considerations that may be relevant to particular investors because of their specific circumstances, or because they are subject to special rules, including if the investor is a United States expatriate, “controlled foreign corporation,” “passive foreign investment company,” corporation that accumulates earnings to avoid United States federal income tax, dealer in securities or currencies, financial institution, tax-exempt entity, insurance company, person holding our common stock as part of a hedging, integrated, conversion or constructive sale transaction or a straddle, trader in securities that elects to use a mark-to-market method of accounting, person liable for the alternative minimum tax, person who acquired our common stock as compensation for services, and partner in a partnership or beneficial owner of a pass-through entity that holds our common stock. Finally, the summary does not describe the effects of any applicable foreign, state or local laws, or, except to the extent discussed below, the effects of any applicable gift or estate tax laws.
INVESTORS CONSIDERING THE PURCHASE OF OUR COMMON STOCK SHOULD CONSULT THEIR OWN TAX ADVISORS REGARDING THE APPLICATION OF THE UNITED STATES FEDERAL INCOME AND ESTATE TAX LAWS TO THEIR PARTICULAR SITUATIONS AND THE CONSEQUENCES OF FOREIGN, STATE OR LOCAL LAWS, AND TAX TREATIES.
116
Table of Contents
Dividends
We do not expect to declare or pay any dividends on our common stock in the foreseeable future. If we do pay dividends on shares of our common stock, however, such distributions will constitute dividends for United States federal income tax purposes to the extent paid from our current or accumulated earnings and profits, as determined under United States federal income tax principles. Distributions in excess of our current and accumulated earnings and profits will constitute a return of capital that is applied against and reduces, but not below zero, a non-U.S. holder’s adjusted tax basis in shares of our common stock. Any remaining excess will be treated as gain realized on the sale or other disposition of our common stock. See “—Sale of Common Stock” below.
Any dividend paid to a non-U.S. holder on our common stock will generally be subject to United States withholding tax at a 30% rate. The withholding tax might not apply, however, or might apply at a reduced rate, under the terms of an applicable income tax treaty between the United States and the non-U.S. holder’s country of residence. You should consult your tax advisors regarding your entitlement to benefits under a relevant income tax treaty. Generally, in order for us or our paying agent to withhold tax at a lower treaty rate, a non-U.S. holder must certify its entitlement to treaty benefits. A non-U.S. holder generally can meet this certification requirement by providing a Form W-8BEN (or any successor form) or appropriate substitute form to us or our paying agent. If the non-U.S. holder holds the stock through a financial institution or other agent acting on the holder’s behalf, the holder will be required to provide appropriate documentation to the agent. The holder’s agent will then be required to provide certification to us or our paying agent, either directly or through other intermediaries. For payments made to a partnership or other pass-through entity, the certification requirements generally apply to the partners or other owners rather than to the partnership or other entity, and the partnership or other entity must provide the partners’ or other owners’ documentation to us or our paying agent. If you are eligible for a reduced rate of United States federal withholding tax under an income tax treaty, you may obtain a refund or credit of any excess amounts withheld by filing an appropriate claim for a refund with the IRS in a timely manner.
Dividends received by a non-U.S. holder that are effectively connected with a U.S. trade or business conducted by the non-U.S. holder, and if required by an applicable income tax treaty between the United States and the non-U.S. holder’s country of residence, are attributable to a permanent establishment maintained by the non-U.S. holder in the United States, are not subject to such withholding tax. To obtain this exemption, a non-U.S. holder must provide us with an IRS Form W-8ECI properly certifying such exemption. Such effectively connected dividends, although not subject to withholding tax, are taxed at the same graduated rates applicable to U.S. persons, net of certain deductions and credits. In addition to the graduated tax described above, dividends received by corporate non-U.S. holders that are effectively connected with a U.S. trade or business of the corporate non-U.S. holder may also be subject to a branch profits tax at a rate of 30% or such lower rate as may be specified by an applicable tax treaty.
Sale of Common Stock
Non-U.S. holders will generally not be subject to United States federal income tax on any gains realized on the sale, exchange or other disposition of our common stock unless:
| • | the gain (1) is effectively connected with the conduct by the non-U.S. holder of a United States trade or business and (2) if an applicable income tax treaty applies between the U.S. and the non-U.S. holder’s country of residence, is attributable to a permanent establishment (or, in the case of an individual, a fixed base) maintained by the non-U.S. holder in the United States (in which case the special rules described below apply); |
| • | the non-U.S. holder is an individual who is present in the United States for 183 days or more in the taxable year of the sale, exchange or other disposition of our common stock, and certain other requirements are met (in which case the gain would be subject to a flat 30% tax, or such reduced rate as may be specified by an applicable income tax treaty, which may be offset by United States source capital losses, even though the individual is not considered a resident of the United States); or |
117
Table of Contents
| • | the rules of the Foreign Investment in Real Property Tax Act, or FIRPTA, treat the gain as effectively connected with a United States trade or business. |
The FIRPTA rules may apply to a sale, exchange or other disposition of our common stock if we are, or were within the shorter of the five-year period preceding the disposition and the non-U.S. holder’s holding period, a “U.S. real property holding corporation,” or USRPHC. In general, we would be a USRPHC if interests in United States real estate comprised at least half of our business assets. We do not believe that we are a USRPHC and we do not anticipate becoming one in the future. Even if we become a USRPHC, as long as our common stock is regularly traded on an established securities market, such common stock will be treated as United States real property interests only if beneficially owned by a non-U.S. holder that actually or constructively owns more than 5% of our outstanding common stock.
If any gain from the sale, exchange or other disposition of our common stock, (1) is effectively connected with a United States trade or business conducted by a non-U.S. holder and (2) if an applicable income tax treaty applies between the U.S. and the non-U.S. holder’s country of residence, is attributable to a permanent establishment (or, in the case of an individual, a fixed base) maintained by such non-U.S. holder in the United States, then the gain generally will be subject to United States federal income tax at the same graduated rates applicable to U.S. persons, net of certain deductions and credits. If the non-U.S. holder is a corporation, under certain circumstances, that portion of its earnings and profits that is effectively connected with its United States trade or business, subject to certain adjustments, generally would be subject to a “branch profits tax.” The branch profits tax rate is generally 30%, although an applicable income tax treaty between the U.S. and the non-U.S. holder’s country of residence might provide for a lower rate.
United States Federal Estate Tax
The estates of nonresident alien individuals generally are subject to United States federal estate tax on property with a United States situs. Because we are a United States corporation, our common stock will be United States situs property and therefore will be included in the taxable estate of a nonresident alien decedent, unless an applicable estate tax treaty between the United States and the decedent’s country of residence provides otherwise.
Backup Withholding and Information Reporting
The Code and the Treasury regulations require those who make specified payments to report the payments to the IRS. Among the specified payments are dividends and proceeds paid by brokers to their customers. The required information returns enable the IRS to determine whether the recipient properly included the payments in income. This reporting regime is reinforced by “backup withholding” rules. These rules require the payors to withhold tax from payments subject to information reporting if the recipient fails to cooperate with the reporting regime by failing to provide his taxpayer identification number to the payor, furnishing an incorrect identification number, or failing to report interest or dividends on his returns. The backup withholding tax rate is currently 28% and is scheduled to increase to 31% for payments made after December 31, 2010. The backup withholding rules do not apply to payments to corporations, whether domestic or foreign.
Payments to non-U.S. holders of dividends on common stock generally will not be subject to backup withholding, so long as the non-U.S. holder certifies its nonresident status (and we or our paying agent do not have actual knowledge or reason to know the holder is a United States person or that the conditions of any other exemption are not, in fact, satisfied) or otherwise establishes an exemption. The certification procedures to claim treaty benefits described under “—Dividends” will satisfy the certification requirements necessary to avoid the backup withholding tax as well. We must report annually to the IRS any dividends paid to each non-U.S. holder and the tax withheld, if any, with respect to these dividends. Copies of these reports may be made available to tax authorities in the country where the non-U.S. holder resides.
118
Table of Contents
Under the Treasury regulations, the payment of proceeds from the disposition of shares of our common stock by a non-U.S. holder made to or through a United States office of a broker generally will be subject to information reporting and backup withholding unless the beneficial owner certifies, under penalties of perjury, among other things, its status as a non-U.S. holder (and the broker does not have actual knowledge or reason to know the holder is a United States person) or otherwise establishes an exemption. The payment of proceeds from the disposition of shares of our common stock by a non-U.S. holder made to or through a non-United States office of a broker generally will not be subject to backup withholding and information reporting, except as noted below. Information reporting, but not backup withholding, will apply to a payment of proceeds, even if that payment is made outside of the United States, if you sell our common stock through a non-United States office of a broker that is:
| • | a United States person (including a foreign branch or office of such person); |
| • | a “controlled foreign corporation” for United States federal income tax purposes; |
| • | a foreign person 50% or more of whose gross income from certain periods is effectively connected with a United States trade or business; or |
| • | a foreign partnership if at any time during its tax year (a) one or more of its partners are United States persons who, in the aggregate, hold more than 50% of the income or capital interests of the partnership or (b) the foreign partnership is engaged in a United States trade or business; |
unless the broker has documentary evidence that the beneficial owner is a non-U.S. holder and certain other conditions are satisfied, or the beneficial owner otherwise establishes an exemption (and the broker has no actual knowledge or reason to know to the contrary).
Backup withholding is not an additional tax. Any amounts withheld from a payment to a holder of common stock under the backup withholding rules can be credited against any United States federal income tax liability of the holder and may entitle the holder to a refund, provided that the required information is furnished to the IRS in a timely manner.
Recent legislation generally imposes withholding at a rate of 30% on payments to certain foreign entities, after December 31, 2012, of dividends on and the gross proceeds of dispositions of U.S. common stock, unless various U.S. information reporting and due diligence requirements (generally relating to ownership by U.S. persons of interests in or accounts with those entities) have been satisfied. Non-U.S. holders should consult their tax advisors regarding the possible implications of this legislation on their investment in our common stock.
THE PRECEDING DISCUSSION OF UNITED STATES FEDERAL TAX CONSIDERATIONS IS FOR GENERAL INFORMATION ONLY. IT IS NOT TAX ADVICE. EACH PROSPECTIVE INVESTOR SHOULD CONSULT ITS OWN TAX ADVISOR REGARDING THE PARTICULAR UNITED STATES FEDERAL, STATE, LOCAL AND FOREIGN TAX CONSEQUENCES OF PURCHASING, HOLDING AND DISPOSING OF OUR COMMON STOCK, INCLUDING THE CONSEQUENCES OF ANY PROPOSED CHANGE IN APPLICABLE LAWS.
119
Table of Contents
Under the terms and subject to the conditions contained in an underwriting agreement dated the date of this prospectus, the underwriters named below, for whom Morgan Stanley & Co. Incorporated and Credit Suisse Securities (USA) LLC are acting as representatives, have severally agreed to purchase, and we and the selling stockholders have agreed to sell to them, severally, the number of shares indicated below:
| Name |
Number of Shares |
|||
| Morgan Stanley & Co. Incorporated |
||||
| Credit Suisse Securities (USA) LLC |
||||
| William Blair & Company, L.L.C. |
||||
| JMP Securities LLC |
||||
| Pacific Crest Securities LLC |
||||
| Total: |
6,619,654 | |||
The underwriters and the representatives are collectively referred to as the “underwriters” and the “representatives,” respectively. The underwriters are offering the shares of common stock subject to their acceptance of the shares from us and subject to prior sale. The underwriting agreement provides that the obligations of the several underwriters to pay for and accept delivery of the shares of common stock offered by this prospectus are subject to the approval of certain legal matters by their counsel and to certain other conditions. The underwriters are obligated to take and pay for all of the shares of common stock offered by this prospectus if any such shares are taken. However, the underwriters are not required to take or pay for the shares covered by the underwriters’ over-allotment option described below. If an underwriter defaults, the underwriting agreement provides that the purchase commitments of the non-defaulting underwriters may be increased.
The underwriters initially propose to offer part of the shares of common stock directly to the public at the initial public offering price listed on the cover page of this prospectus and part to certain dealers at a price that represents a concession not in excess of $ a share under the public offering price. After the initial offering of the shares of common stock, the offering price and other selling terms may from time to time be varied by the representatives.
We and the selling stockholders have granted to the underwriters an option, exercisable for 30 days from the date of this prospectus, to purchase up to 992,948 additional shares of common stock (which includes 25,000 shares offered by a selling stockholder and the remaining 967,948 offered by us) at the public offering price listed on the cover page of this prospectus, less underwriting discounts and commissions. The underwriters may exercise this option solely for the purpose of covering over-allotments, if any, made in connection with the offering of the shares of common stock offered by this prospectus. To the extent the option is exercised, each underwriter will become obligated, subject to certain conditions, to purchase about the same percentage of the additional shares of common stock as the number listed next to the underwriter’s name in the preceding table bears to the total number of shares of common stock listed next to the names of all underwriters in the preceding table.
The following table shows the per share and total public offering price, underwriting discounts and commissions, and proceeds before expenses to us and the selling stockholders. These amounts are shown assuming both no exercise and full exercise of the underwriters’ option to purchase up to an additional 992,948 shares of our common stock.
| Total | ||||||||||||
| Per Share | No Exercise | Full Exercise | ||||||||||
| Public offering price |
$ | $ | $ | |||||||||
| Underwriting discounts and commissions paid by us |
||||||||||||
| Underwriting discounts and commissions paid by the selling stockholders |
||||||||||||
| Proceeds, before expenses, to us |
||||||||||||
| Proceeds, before expenses, to selling stockholders |
||||||||||||
120
Table of Contents
The estimated offering expenses payable by us, exclusive of the underwriting discounts and commissions, are approximately $1.8 million, which includes legal, accounting and printing costs and various other fees associated with the registration and listing of our common stock.
The underwriters have informed us that they do not intend sales to discretionary accounts to exceed 5% of the total number of shares of common stock offered by them.
We have applied to have our common stock quoted on the NASDAQ Global Market under the trading symbol “MKTG.”
We, all of our directors and officers and the holders of approximately 96% of our outstanding stock on a fully-diluted basis immediately prior to this offering have agreed that we and they will not, during the period ending 180 days after the date of this prospectus:
| • | offer, pledge, sell, contract to sell, sell any option or contract to purchase, purchase any option or contract to sell, grant any option, right or warrant to purchase lend or otherwise transfer or dispose of, directly or indirectly, any shares of common stock or other securities convertible into or exercisable or exchangeable for common stock; |
| • | enter into any swap or other arrangement that transfers to another, in whole or in part, any of the economic consequences of ownership of the common stock, whether any such transaction described in these first two bullets is to be settled by delivery of common stock or such other securities, in cash or otherwise; or |
| • | in our case, file any registration statement with the Securities and Exchange Commission relating to the offering of any shares of common stock or any securities convertible into or exercisable or exchangeable for common stock. |
The foregoing may be waived, in our case, by Morgan Stanley & Co. Incorporated and Credit Suisse Securities (USA) LLC, and in the case of our directors, officers and stockholders, by Morgan Stanley & Co. Incorporated.
The restrictions described in the two immediately preceding paragraphs shall not apply to:
| • | transactions by a director, officer or stockholder relating to shares of common stock or other securities acquired in open market transactions after the completion of the offering of the shares, provided that no filing under Section 16(a) of the Exchange Act is required or voluntarily made in connection with subsequent sales of common stock or other securities acquired in such open market transactions; |
| • | the sale of shares of common stock pursuant to the underwriting agreement; |
| • | the issuance by us of shares of common stock upon the exercise of an option or warrant or the conversion of a security outstanding on the date of and as described in this prospectus; |
| • | transfers of shares of common stock or any securities convertible into or exercisable or exchangeable for common stock by a director, officer or stockholder (i) as a bona fide gift, or gifts, (ii) to an immediate family member or a trust for the direct or indirect benefit of the director, officer, stockholder or immediate family member, or (iii) by will or intestacy, provided that it shall be a condition of the transfer that each transferee or donee shall sign and deliver a copy of the lock-up agreement prior to or upon such transfer and no filing under Section 16(a) of the Exchange Act reporting a reduction in beneficial ownership of shares of common stock shall be required or shall be made voluntarily during the 180-day restricted period; |
| • | transfers or distributions of shares of common stock or any securities convertible into or exercisable or exchangeable for common stock by a (i) stockholder that is a corporation, partnership or other business entity (A) to another corporation, partnership or other business entity that controls, is controlled by or managed by or is under common control with the director, officer or other stockholder or (B) as part of a |
121
Table of Contents
| distribution to an equity holder of such stockholder or to the estate of any such equity holder or (ii) in the case of a stockholder which is a trust, transfers of shares of common stock or any securities convertible into or exercisable or exchangeable for common stock to a trustor or beneficiary of the trust or to the estate of such beneficiary, provided that it shall be a condition of the transfer or distribution that each transferee, donee or distributee shall sign and deliver a copy of the lock-up agreement prior to or upon such transfer and no filing under Section 16(a) of the Exchange Act reporting a reduction in beneficial ownership of shares of common stock shall be required or shall be made voluntarily during the 180-day restricted period; |
| • | the exercise of options granted under our 1999 Stock Plan or 2011 Equity Incentive Plan or warrants outstanding on the date of this prospectus, in each case by a director, officer or stockholder, provided that no filing under Section 16(a) of the Exchange Act reporting the disposition of shares of common stock or any other reduction in the beneficial ownership of shares is required or voluntarily made in connection with these transactions during this 180-day restricted period; |
| • | the issuance or grant by us of shares, or options to purchase shares of, common stock pursuant to our stock plans described in this prospectus, provided that the recipient of such services or options shall sign and deliver a copy of the lock-up agreement to the extent such shares or options become vested within 180 days after the date of this prospectus; |
| • | the establishment of a trading plan pursuant to Rule 10b5-1 under the Exchange Act for the transfer of shares of common stock, provided that such plan does not provide for the transfer of common stock during the 180-day restricted period and that no public filing or other public announcement of such plan by us or such holders regarding the establishment of such plan is not required to be or voluntarily made during this 180-day restricted period; |
| • | the issuance by us of up to 10% of the total number of shares of common stock issued and outstanding immediately following the completion of this offering in connection with our acquisition of one or more businesses, products or technologies or in connection with joint ventures, commercial relationships or other strategic transactions, provided the recipients of such shares agree, on or prior to such issuance, to be bound by the lock-up agreement; and |
| • | the filing by us of a registration statement on Form S-8 in respect of any shares issued under or the grant of any award pursuant to an employee benefit plan described in this prospectus. |
In addition, all of our directors and officers and the holders of approximately 96% of our outstanding stock, on a fully-diluted basis immediately prior to this offering have also agreed that, without the prior written consent of Morgan Stanley & Co. Incorporated on behalf of the underwriters, they will not, during the period ending 180 days after the date of this prospectus, make any demand for, or exercise any right with respect to, the registration of any shares of common stock or any security convertible into or exercisable or exchangeable for common stock.
The 180-day restricted period described in the preceding paragraphs will be automatically extended if:
| • | during the last 17 days of the 180-day restricted period we issue an earnings release or material news or announce a material event relating to us, or |
| • | prior to the expiration of the 180-day restricted period, we announce that we will release earnings results during the 16 day period beginning on the last day of the 180-day restricted period, |
in which case the restrictions described in the preceding paragraph will continue to apply until the expiration of the 18 day period beginning on the issuance of the earnings release or the occurrence of the material news or material event.
In order to facilitate this offering of common stock, the underwriters may engage in transactions that stabilize, maintain or otherwise affect the price of the common stock. Specifically, the underwriters may sell more shares than they are obligated to purchase under the underwriting agreement, creating a short position. A
122
Table of Contents
short sale is covered if the short position is no greater than the number of shares available for purchase by the underwriters under the over-allotment option. The underwriters can close out a covered short sale by exercising the over-allotment option or purchasing shares in the open market. In determining the source of shares to close out a covered short sale, the underwriters will consider, among other things, the open market price of shares compared to the price available under the over-allotment option. The underwriters may also sell shares in excess of the over-allotment option, creating a naked short position. The underwriters must close out any naked short position by purchasing shares in the open market. A naked short position is more likely to be created if the underwriters are concerned that there may be downward pressure on the price of the common stock in the open market after pricing that could adversely affect investors who purchase in this offering. In addition, to stabilize the price of the common stock, the underwriters may bid for, and purchase, shares of common stock in the open market. The underwriting syndicate also may reclaim selling concessions allowed to an underwriter or a dealer for distributing the common stock in the offering, if the syndicate repurchases previously distributed common stock to cover syndicate short positions or to stabilize the price of the common stock. These activities may raise or maintain the market price of the common stock above independent market levels or prevent or retard a decline in the market price of the common stock. The underwriters are not required to engage in these activities and may end any of these activities at any time.
We, the selling stockholders and the underwriters have agreed to indemnify each other against certain liabilities, including liabilities under the Securities Act.
A prospectus in electronic format may be made available on websites maintained by one or more underwriters, or selling group members, if any, participating in this offering. The representatives may agree to allocate a number of shares of common stock to underwriters for sale to their online brokerage account holders. Internet distributions will be allocated by the representatives to underwriters that may make internet distributions on the same basis as other allocations.
The underwriters and their respective affiliates are full service financial institutions engaged in various activities, which may include securities trading, commercial and investment banking, financial advisory, investment management, principal investment, hedging, financing and brokerage activities. Certain of the underwriters and their respective affiliates have, from time to time, performed, and may in the future perform, various financial advisory and investment banking services for us, for which they received or will receive customary fees and expenses.
In the ordinary course of their various business activities, the underwriters and their respective affiliates may make or hold a broad array of investments and actively trade debt and equity securities (or related derivative securities) and financial instruments (including bank loans) for their own account and for the accounts of their customers and may at any time hold long and short positions in such securities and instruments. Such investment and securities activities may involve our securities and instruments.
Pricing of the Offering
Prior to this offering, there has been no public market for our common stock. The initial public offering price will be determined by negotiations among us, the selling stockholders, and the representatives of the underwriters. Among the factors to be considered in determining the initial public offering price will be our future prospects and those of our industry in general, our sales, earnings and certain other financial and operating information in recent periods, and the price-earnings ratios, price-sales ratios, market prices of securities, and certain financial and operating information of companies engaged in activities similar to ours. The estimated initial public offering price range set forth on the cover page of this preliminary prospectus is subject to change as a result of market conditions and other factors. Neither we nor the underwriters can assure investors that an active trading market for the shares will develop, or that after the offering the shares will trade in the public market at or above the initial public offering price.
123
Table of Contents
Selling Restrictions
European Economic Area
In relation to each Member State of the European Economic Area which has implemented the Prospectus Directive (each, a “Relevant Member State”) an offer to the public of any shares of our common stock may not be made in that Relevant Member State, except that an offer to the public in that Relevant Member State of any shares of our common stock may be made at any time under the following exemptions under the Prospectus Directive, if they have been implemented in that Relevant Member State:
| • | to any legal entity which is a qualified investor as defined in the Prospectus Directive; |
| • | to fewer than 100 or, if the Relevant Member State has implemented the relevant provision of the 2010 PD Amending Directive, 150, natural or legal persons (other than qualified investors as defined in the Prospectus Directive), as permitted under the Prospectus Directive, subject to obtaining the prior consent of the representatives for any such offer; or |
| • | in any other circumstances falling within Article 3(2) of the Prospectus Directive, provided that no such offer of shares of our common stock shall result in a requirement for the publication by us or any underwriter of a prospectus pursuant to Article 3 of the Prospectus Directive. |
For the purposes of this provision, the expression an “offer to the public” in relation to any shares of our common stock in any Relevant Member State means the communication in any form and by any means of sufficient information on the terms of the offer and any shares of our common stock to be offered so as to enable an investor to decide to purchase any shares of our common stock, as the same may be varied in that Member State by any measure implementing the Prospectus Directive in that Member State, the expression “Prospectus Directive” means Directive 2003/71/EC (and amendments thereto, including the 2010 PD Amending Directive, to the extent implemented in the Relevant Member State), and includes any relevant implementing measure in the Relevant Member State, and the expression “2010 PD Amending Directive” means Directive 2010/73/EU.
United Kingdom
Each underwriter has represented and agreed that:
| • | it has only communicated or caused to be communicated and will only communicate or cause to be communicated an invitation or inducement to engage in investment activity (within the meaning of Section 21 of the FSMA) received by it in connection with the issue or sale of the shares of our common stock in circumstances in which Section 21(1) of the FSMA does not apply to us; and |
| • | it has complied and will comply with all applicable provisions of the FSMA with respect to anything done by it in relation to the shares of our common stock in, from or otherwise involving the United Kingdom. |
124
Table of Contents
The validity of the shares of common stock offered hereby will be passed upon for us by Fenwick & West LLP, Mountain View, California. Davis Polk & Wardwell LLP, Menlo Park, California, is acting as counsel to the underwriters.
The consolidated financial statements of Responsys, Inc. and subsidiary as of December 31, 2009 and 2010, and for each of the three years in the period ended December 31, 2010 and the related financial statement schedule included in this prospectus and the registration statement, have been audited by Deloitte & Touche LLP, an independent registered public accounting firm, as stated in their report appearing herein (which report expresses an unqualified opinion on the consolidated financial statements and financial statement schedule and includes an explanatory paragraph regarding the adoption of a new accounting standard). Such financial statements and financial statement schedule have been so included in reliance upon the report of such firm given upon their authority as experts in accounting and auditing.
The consolidated financial statements of Responsys Pty Ltd (formerly Eservices Group Pty Ltd) as of June 30, 2010, and for the year ended June 30, 2010, appearing in this prospectus and registration statement have been audited by Ernst & Young, independent auditors, as set forth in their report thereon appearing elsewhere herein, and are included in reliance upon such report given on the authority of such firm as experts in accounting and auditing.
WHERE YOU CAN FIND ADDITIONAL INFORMATION
We have filed with the SEC a registration statement on Form S-1 under the Securities Act with respect to the shares of common stock offered hereby. This prospectus, which constitutes a part of the registration statement, does not contain all of the information set forth in the registration statement or the exhibits filed therewith. For further information about us and the common stock offered hereby, reference is made to the registration statement and the exhibits filed therewith. Statements contained in this prospectus regarding the contents of any contract or any other document that is filed as an exhibit to the registration statement are not necessarily complete, and each such statement is qualified in all respects by reference to the full text of such contract or other document filed as an exhibit to the registration statement. We currently do not file periodic reports with the SEC. Upon closing of this offering, we will be required to file periodic reports, proxy statements and other information with the SEC pursuant to the Exchange Act. A copy of the registration statement and the exhibits filed therewith may be inspected without charge at the public reference room maintained by the SEC, located at 100 F Street, NE, Washington, DC 20549, and copies of all or any part of the registration statement may be obtained from that office. Please call the SEC at 1-800-SEC-0330 for further information about the public reference room. The SEC also maintains a website that contains reports, proxy and information statements and other information regarding registrants that file electronically with the SEC. The address of the website is www.sec.gov.
125
Table of Contents
| Responsys, Inc. Consolidated Financial Statements |
||||
| F-2 | ||||
| F-3 | ||||
| F-4 | ||||
| Consolidated Statements of Stockholders’ Equity and Comprehensive Income (Loss) |
F-5 | |||
| F-6 | ||||
| F-7 | ||||
| Responsys Pty Ltd (formerly Eservices Group Pty Ltd) Consolidated Financial Statements |
||||
| F-35 | ||||
| F-36 | ||||
| F-37 | ||||
| F-38 | ||||
| F-39 | ||||
| F-40 | ||||
| Responsys Pty Ltd (formerly Eservices Group Pty Ltd) Unaudited Condensed Consolidated Financial Information |
||||
| F-63 | ||||
| Unaudited Condensed Consolidated Statements of Comprehensive Income |
F-64 | |||
| Unaudited Condensed Consolidated Statements of Changes in Equity |
F-65 | |||
| F-66 | ||||
| Notes to the Unaudited Condensed Consolidated Financial Statements |
F-67 | |||
| Unaudited Pro Forma Condensed Combined Financial Information |
||||
| F-71 | ||||
| Unaudited Pro Forma Condensed Combined Statement of Income Data |
F-72 | |||
| Notes to the Unaudited Pro Forma Condensed Combined Financial Information |
F-73 | |||
| Financial Statement Schedule: |
||||
| S-1 | ||||
F-1
Table of Contents
REPORT OF INDEPENDENT REGISTERED PUBLIC ACCOUNTING FIRM
To the Board of Directors and Stockholders of
Responsys, Inc.
San Bruno, California
We have audited the accompanying consolidated balance sheets of Responsys, Inc. and subsidiaries (the “Company”) as of December 31, 2009 and 2010, and the related consolidated statements of income, stockholders’ equity and comprehensive income (loss), and cash flows for each of the three years in the period ended December 31, 2010. Our audits also included the financial statement schedule listed in the Index to Consolidated Financial Statements on page F-1. These financial statements and financial statement schedule are the responsibility of the Company’s management. Our responsibility is to express an opinion on these financial statements and financial statement schedule based on our audits.
We conducted our audits in accordance with the standards of the Public Company Accounting Oversight Board (United States). Those standards require that we plan and perform the audit to obtain reasonable assurance about whether the financial statements are free of material misstatement. The Company is not required to have, nor were we engaged to perform, an audit of its internal control over financial reporting. Our audits included consideration of internal control over financial reporting as a basis for designing audit procedures that are appropriate in the circumstances, but not for the purpose of expressing an opinion on the effectiveness of the Company’s internal control over financial reporting. Accordingly, we express no such opinion. An audit includes examining, on a test basis, evidence supporting the amounts and disclosures in the financial statements, assessing the accounting principles used and significant estimates made by management, as well as evaluating the overall financial statement presentation. We believe that our audits provide a reasonable basis for our opinion.
In our opinion, such consolidated financial statements present fairly, in all material respects, the financial position of the Company as of December 31, 2009 and 2010, and the results of its operations and its cash flows for each of the three years in the period ended December 31, 2010, in conformity with accounting principles generally accepted in the United States of America. Also, in our opinion, such financial statement schedule, when considered in relation to the basic consolidated financial statements taken as a whole, presents fairly, in all material respects, the information set forth therein.
As discussed in Note 2 to the Consolidated Financial Statements, the Company adopted Accounting Standards Codification (“ASC”) No. 815-40, Derivatives and Hedging-Contracts in Entity’s Own Equity on January 1, 2009.
/s/ DELOITTE & TOUCHE LLP
San Jose, California
March 16, 2011
(April 4, 2011 as to the first paragraph of Note 9)
F-2
Table of Contents
Consolidated Balance Sheets
(in thousands, except per share data)
| As of December 31, | Pro Forma Stockholders’ Equity as of December 31, 2010 |
|||||||||||
| 2009 | 2010 | |||||||||||
| Assets |
||||||||||||
| Current assets: |
||||||||||||
| Cash and cash equivalents |
$ | 15,750 | $ | 13,884 | ||||||||
| Accounts receivable, net of allowances of $393 and $174 as of December 31 2009 and 2010, respectively |
13,744 | 18,101 | ||||||||||
| Deferred taxes |
7,867 | 7,288 | ||||||||||
| Prepaid expenses and other current assets |
1,581 | 5,347 | ||||||||||
| Total current assets |
38,942 | 44,620 | ||||||||||
| Property and equipment—net |
8,553 | 10,822 | ||||||||||
| Goodwill |
1,301 | 1,301 | ||||||||||
| Intangible assets—net |
776 | 529 | ||||||||||
| Deferred taxes—noncurrent |
8,176 | 5,190 | ||||||||||
| Investment in unconsolidated affiliates |
— | 8,057 | ||||||||||
| Other assets |
247 | 1,381 | ||||||||||
| Total assets |
$ | 57,995 | $ | 71,900 | ||||||||
| Liabilities and stockholders’ equity |
||||||||||||
| Current liabilities: |
||||||||||||
| Accounts payable |
$ | 1,061 | $ | 1,162 | ||||||||
| Accrued compensation |
3,203 | 3,516 | ||||||||||
| Other accrued liabilities |
2,303 | 3,866 | ||||||||||
| Current portion of capital lease obligations |
436 | 387 | ||||||||||
| Current portion of deferred revenue |
5,450 | 8,642 | ||||||||||
| Total current liabilities |
12,453 | 17,573 | ||||||||||
| Capital lease obligations—noncurrent |
327 | — | ||||||||||
| Deferred revenue—noncurrent |
134 | 382 | ||||||||||
| Other long-term liabilities |
264 | 770 | ||||||||||
| Total liabilities |
13,178 | 18,725 | ||||||||||
| Commitments and contingencies (Note 8) |
||||||||||||
| Stockholders’ equity: |
||||||||||||
| Convertible preferred stock, $.0001 par value, 38,729 shares authorized; 30,159 shares issued and outstanding at December 31, 2009 and 2010; aggregate liquidation preferences for holders of Series E preferred stock of $5,476 as of December 31, 2009 and 2010, and subsequently $20,000, distributed among the holders of Series A, B, C, and D preferred on a pro rata basis; no shares authorized, issued or outstanding pro forma |
62,028 | 62,028 | — | |||||||||
| Common stock, $.0001 par value; 62,500 shares authorized; 8,326 and 8,448 shares issued and outstanding at December 31, 2009 and 2010, respectively; 38,607 shares issued and outstanding pro forma |
1 | 1 | 4 | |||||||||
| Additional paid-in capital |
8,704 | 12,860 | 74,885 | |||||||||
| Accumulated deficit |
(25,770 | ) | (22,765 | ) | (22,765 | ) | ||||||
| Accumulated other comprehensive income (loss) |
(146 | ) | 1,051 | 1,051 | ||||||||
| Total stockholders’ equity |
44,817 | 53,175 | 53,175 | |||||||||
| Total liabilities and stockholders’ equity |
$ | 57,995 | $ | 71,900 | $ | 71,900 | ||||||
See notes to consolidated financial statements.
F-3
Table of Contents
Consolidated Statements of Income
(in thousands, except per share data)
| Year Ended December 31, | ||||||||||||
| 2008 | 2009 | 2010 | ||||||||||
| Revenue: |
||||||||||||
| Subscription |
$ | 41,047 | $ | 53,044 | $ | 69,284 | ||||||
| Professional services |
9,067 | 13,599 | 24,787 | |||||||||
| Total revenue |
50,114 | 66,643 | 94,071 | |||||||||
| Cost of revenue: |
||||||||||||
| Subscription |
12,399 | 15,109 | 20,221 | |||||||||
| Professional services |
8,926 | 12,478 | 20,697 | |||||||||
| Total cost of revenue |
21,325 | 27,587 | 40,918 | |||||||||
| Gross profit |
28,789 | 39,056 | 53,153 | |||||||||
| Operating expenses: |
||||||||||||
| Research and development |
5,068 | 8,052 | 10,597 | |||||||||
| Sales and marketing |
15,681 | 15,494 | 20,849 | |||||||||
| General and administrative |
4,639 | 5,746 | 8,225 | |||||||||
| Total operating expenses |
25,388 | 29,292 | 39,671 | |||||||||
| Operating income |
3,401 | 9,764 | 13,482 | |||||||||
| Other income (expense): |
||||||||||||
| Interest income |
121 | 16 | 4 | |||||||||
| Interest expense |
— | (45 | ) | (32 | ) | |||||||
| Other income (expense), net |
(932 | ) | 214 | 1,199 | ||||||||
| Total other income (expense) |
(811 | ) | 185 | 1,171 | ||||||||
| Income before income taxes |
2,590 | 9,949 | 14,653 | |||||||||
| Benefit (provision) for income taxes |
17,857 | (4,063 | ) | (5,821 | ) | |||||||
| Equity in net loss of unconsolidated affiliates |
— | — | (234 | ) | ||||||||
| Net income |
$ | 20,447 | $ | 5,886 | $ | 8,598 | ||||||
| Net income attributable to common stockholders: |
||||||||||||
| Basic |
$ | 2,980 | $ | 186 | $ | 802 | ||||||
| Diluted |
$ | 5,009 | $ | 299 | $ | 1,179 | ||||||
| Net income per share attributable to common stockholders: |
||||||||||||
| Basic |
$ | 0.43 | $ | 0.02 | $ | 0.09 | ||||||
| Diluted |
$ | 0.35 | $ | 0.02 | $ | 0.08 | ||||||
| Shares used in computation of net income per share attributable to common stockholders: |
||||||||||||
| Basic |
7,007 | 7,518 | 8,527 | |||||||||
| Diluted |
14,408 | 14,302 | 14,464 | |||||||||
| Pro forma net income per share attributable to common stockholders (unaudited): |
||||||||||||
| Basic |
$ | 0.22 | ||||||||||
| Diluted |
$ | 0.19 | ||||||||||
| Pro forma weighted-average shares outstanding used in calculating net income per share attributable to common stockholders (unaudited): |
||||||||||||
| Basic |
38,686 | |||||||||||
| Diluted |
44,623 | |||||||||||
See notes to consolidated financial statements.
F-4
Table of Contents
Consolidated Statements of Stockholders’ Equity and Comprehensive Income (Loss)
(in thousands)
| Convertible Preferred Stock |
Common Stock | Additional Paid-In Capital |
Deferred Stock Compensation |
Accumulated Deficit |
Accumulated Other Comprehensive Income (Loss) |
Total Stockholders’ Equity |
||||||||||||||||||||||||||||||
| Shares | Amount | Shares | Amount | |||||||||||||||||||||||||||||||||
| BALANCE—December 31, 2007 |
29,434 | $ | 60,260 | 6,698 | $ | — | $ | 3,864 | $ | (151 | ) | $ | (50,322 | ) | $ | 8 | $ | 13,659 | ||||||||||||||||||
| Exercise of common stock options |
— | — | 739 | 1 | 105 | — | — | — | 106 | |||||||||||||||||||||||||||
| Repurchase of common stock |
— | — | (7 | ) | — | — | — | — | — | — | ||||||||||||||||||||||||||
| Expiration of preferred stock warrants |
— | (182 | ) | — | — | 182 | — | — | — | — | ||||||||||||||||||||||||||
| Stock-based compensation expense |
— | — | — | — | 1,378 | 72 | — | — | 1,450 | |||||||||||||||||||||||||||
| Tax benefit from employees stock plans |
— | — | — | — | 567 | — | — | — | 567 | |||||||||||||||||||||||||||
| Net income |
— | — | — | — | — | — | 20,447 | — | 20,447 | |||||||||||||||||||||||||||
| Foreign currency translation adjustment |
— | — | — | — | — | — | — | (192 | ) | (192 | ) | |||||||||||||||||||||||||
| Comprehensive income |
— | — | — | — | — | — | — | — | 20,255 | |||||||||||||||||||||||||||
| BALANCE—December 31, 2008 |
29,434 | 60,078 | 7,430 | 1 | 6,096 | (79 | ) | (29,875 | ) | (184 | ) | 36,037 | ||||||||||||||||||||||||
| Cumulative adjustment to beginning balance upon adoption of Accounting Standards Codification No. 815-40, Derivatives and Hedging—Contracts in Entity’s Own Equity |
— | (160 | ) | — | — | — | — | (1,781 | ) | — | (1,941 | ) | ||||||||||||||||||||||||
| Exercise of common stock options |
— | — | 896 | — | 177 | — | — | — | 177 | |||||||||||||||||||||||||||
| Issuance of vested common stock options for business acquisition |
— | — | — | — | 31 | — | — | — | 31 | |||||||||||||||||||||||||||
| Exercise of preferred stock warrants |
725 | 2,110 | — | — | — | — | — | — | 2,110 | |||||||||||||||||||||||||||
| Stock-based compensation expense |
— | — | — | — | 1,557 | 79 | — | — | 1,636 | |||||||||||||||||||||||||||
| Tax benefit from employees stock plans |
— | — | — | — | 843 | — | — | — | 843 | |||||||||||||||||||||||||||
| Net income |
— | — | — | — | — | — | 5,886 | — | 5,886 | |||||||||||||||||||||||||||
| Foreign currency translation adjustment |
— | — | — | — | — | — | — | 38 | 38 | |||||||||||||||||||||||||||
| Comprehensive income |
— | — | — | — | — | — | — | — | 5,924 | |||||||||||||||||||||||||||
| BALANCE—December 31, 2009 |
30,159 | 62,028 | 8,326 | 1 | 8,704 | — | (25,770 | ) | (146 | ) | 44,817 | |||||||||||||||||||||||||
| Exercise of common stock options |
— | — | 960 | — | 322 | — | — | — | 322 | |||||||||||||||||||||||||||
| Stock-based compensation expense |
— | — | — | — | 2,506 | — | — | — | 2,506 | |||||||||||||||||||||||||||
| Repurchase of common stock |
— | — | (838 | ) | — | (107 | ) | — | (5,593 | ) | — | (5,700 | ) | |||||||||||||||||||||||
| Tax benefit from employees stock plans |
— | — | — | — | 1,435 | — | — | — | 1,435 | |||||||||||||||||||||||||||
| Net income |
— | — | — | — | — | — | 8,598 | — | 8,598 | |||||||||||||||||||||||||||
| Foreign currency translation adjustment |
— | — | — | — | — | — | — | 1,197 | 1,197 | |||||||||||||||||||||||||||
| Comprehensive income |
— | — | — | — | — | — | — | — | 9,795 | |||||||||||||||||||||||||||
| BALANCE—December 31, 2010 |
30,159 | $ | 62,028 | 8,448 | $ | 1 | $ | 12,860 | $ | — | $ | (22,765 | ) | $ | 1,051 | $ | 53,175 | |||||||||||||||||||
See notes to consolidated financial statements.
F-5
Table of Contents
Consolidated Statements of Cash Flows
(in thousands)
| Year Ended December 31, | ||||||||||||
| 2008 | 2009 | 2010 | ||||||||||
| Cash flows from operating activities: |
||||||||||||
| Net income |
$ | 20,447 | $ | 5,886 | $ | 8,598 | ||||||
| Adjustments to reconcile net income to net cash provided by operating activities: |
||||||||||||
| Provision for bad debts |
(23 | ) | 521 | 63 | ||||||||
| Depreciation and amortization |
3,236 | 4,329 | 5,779 | |||||||||
| Stock based compensation |
1,450 | 1,636 | 2,506 | |||||||||
| Loss on disposal of property and equipment |
233 | — | — | |||||||||
| Changes in preferred warrant liability |
— | 169 | — | |||||||||
| Net changes in call and put options |
— | — | (1,517 | ) | ||||||||
| Deferred tax assets |
(18,105 | ) | 2,932 | 4,605 | ||||||||
| Excess tax benefits from stock-based compensation |
— | — | (172 | ) | ||||||||
| Equity in net loss of unconsolidated affiliates |
— | — | 234 | |||||||||
| Changes in operating assets and liabilities—net of business acquired: |
||||||||||||
| Accounts receivable |
(1,959 | ) | (3,956 | ) | (4,420 | ) | ||||||
| Prepaid expenses and other current assets |
(53 | ) | (119 | ) | (1,552 | ) | ||||||
| Other assets |
(69 | ) | (41 | ) | — | |||||||
| Accounts payable |
(845 | ) | (1,292 | ) | 604 | |||||||
| Accrued compensation |
73 | 1,332 | 312 | |||||||||
| Other accrued liabilities |
639 | 949 | 438 | |||||||||
| Deferred revenue |
17 | 507 | 3,440 | |||||||||
| Other long-term liabilities |
214 | 49 | 502 | |||||||||
| Net cash provided by operating activities |
5,255 | 12,902 | 19,420 | |||||||||
| Cash flows from investing activities: |
||||||||||||
| Purchases of property and equipment |
(4,795 | ) | (2,245 | ) | (7,917 | ) | ||||||
| Addition of capitalized software development costs |
(1,316 | ) | (823 | ) | (430 | ) | ||||||
| Business acquisition, net of cash received |
(279 | ) | (892 | ) | (325 | ) | ||||||
| Investment in unconsolidated affiliates |
— | — | (7,013 | ) | ||||||||
| Restricted cash |
— | — | — | |||||||||
| Net cash used in investing activities |
(6,390 | ) | (3,960 | ) | (15,685 | ) | ||||||
| Cash flows from financing activities: |
||||||||||||
| Proceeds from issuance of common shares |
106 | 177 | 322 | |||||||||
| Proceeds from early exercise of stock options |
— | — | 643 | |||||||||
| Excess tax benefits from stock-based compensation |
— | — | 172 | |||||||||
| Repurchase of common stock |
— | — | (5,700 | ) | ||||||||
| Payments of deferred offering costs |
— | — | (735 | ) | ||||||||
| Principal payments on capital lease obligations |
— | (518 | ) | (417 | ) | |||||||
| Net cash provided by (used in) financing activities |
106 | (341 | ) | (5,715 | ) | |||||||
| Effect of foreign exchange rate changes on cash and cash equivalents |
(191 | ) | 19 | 114 | ||||||||
| Net increase (decrease) in cash and cash equivalents |
(1,220 | ) | 8,620 | (1,866 | ) | |||||||
| Cash and cash equivalents at beginning of year |
8,350 | 7,130 | 15,750 | |||||||||
| Cash and cash equivalents at end of year |
$ | 7,130 | $ | 15,750 | $ | 13,884 | ||||||
| Noncash financing and investing activities: |
||||||||||||
| Issuance of vested common stock options in connection with business acquisition |
$ | — | $ | 31 | $ | — | ||||||
| Cashless exercise of Series E preferred stock warrants |
$ | — | $ | 2,110 | $ | — | ||||||
| Fair value of put option |
— | — | $ | 523 | ||||||||
| Fair value of call option |
— | — | $ | 2,208 | ||||||||
| Unpaid consideration for investment in unconsolidated affiliates |
$ | — | $ | — | $ | 381 | ||||||
| Unpaid deferred offering costs |
— | — | $ | 399 | ||||||||
| Purchase of property and equipment under capital lease |
$ | 935 | $ | — | $ | 87 | ||||||
| Purchase of property and equipment on account |
$ | 451 | $ | 773 | $ | 128 | ||||||
| Supplemental disclosures of cash flow information: |
||||||||||||
| Cash paid during the period for interest |
$ | — | $ | 45 | $ | 32 | ||||||
| Cash paid during the period for taxes |
$ | 338 | $ | 1,010 | $ | 486 | ||||||
See notes to consolidated financial statements.
F-6
Table of Contents
Notes to Consolidated Financial Statements
| 1. | ORGANIZATION AND DESCRIPTION OF BUSINESS |
Responsys, Inc. (the “Company”) was incorporated in California on February 3, 1998 and reincorporated from California to Delaware on March 30, 2011 (see Note 9). The Company’s solution is comprised of its on-demand software and professional services. The Company has one core offering, the Responsys Interact Suite, which provides marketers with a set of integrated applications to create, execute, optimize and automate marketing campaigns across the key interactive channels—email, mobile, social and the web. The Company has offices in North America and the United Kingdom, and its principal markets are also in North America and Europe.
Certain Significant Risks and Uncertainties—The Company participates in a dynamic high-technology industry. Changes in any of the following areas could have a material adverse effect on the Company’s future financial position, results of operations, or cash flows: competition, advances and trends in new technologies and industry standards, the early stage of some of the Company’s target markets, customer retention rates, security risks, market acceptance of the Company’s offerings, litigation, or claims against the Company based on intellectual property rights, patent, product, regulatory, or other factors, general economic conditions and the Company’s ability to attract and retain employees necessary to support its growth.
2. SUMMARY OF SIGNIFICANT ACCOUNTING POLICIES
Principles of Consolidation—The accompanying consolidated financial statements include the accounts of the Company and its wholly-owned subsidiaries. All intercompany balances and transactions have been eliminated in consolidation. In addition, the Company includes its proportionate share of the operating results of its unconsolidated affiliates.
Unaudited Pro Forma Information—All of the outstanding shares of convertible preferred stock will convert into common stock on the closing of an underwritten public offering of common stock under the Securities Act of 1933, in which the Company receives at least $10 million in gross proceeds and the offering price is at least $4.20 per common share or by the election of two-thirds or more of the outstanding shares of convertible preferred stock. The December 31, 2010 unaudited pro forma balance sheet has been prepared assuming the conversion of each share of Series A, B, C, D and E convertible preferred stock outstanding into shares of common stock as is determined by dividing the applicable original issuance price ($3.068, $16.32, $6.36, $6.36, and $0.24788, respectively) by the applicable conversion price in effect on December 31, 2010. For purposes of pro forma net income per share attributable to common stockholders, all shares of convertible preferred stock have been treated as though they have been converted to common stock at the earliest of the date of issuance or the beginning of the respective periods in all periods in which such shares were outstanding.
The pro forma information does not include 148,648 shares of common stock that were issued in January 2011 in connection with the Company’s acquisition of the remaining equity interests in Eservices, and 15,000 shares of common stock that were issued in March 2011 under its 1999 Stock Plan.
Foreign Currency Translation—The functional currency of the Company’s foreign subsidiary in the United Kingdom is the local currency. The Company translates all assets and liabilities to U.S. dollars at the current exchange rates as of the applicable balance sheet date. Revenue and expenses are translated at the average exchange rate prevailing during the period. Gains and losses resulting from the translation of the foreign subsidiary’s financial statements are recorded as a component of accumulated other comprehensive income (loss). Net gains and losses resulting from foreign exchange transactions were not significant during any of the periods presented.
F-7
Table of Contents
RESPONSYS, INC.
Notes to Consolidated Financial Statements (Continued)
| 2. | SUMMARY OF SIGNIFICANT ACCOUNTING POLICIES (Continued) |
Use of Estimates—The preparation of the Company’s consolidated financial statements in conformity with accounting principles generally accepted in the United States of America requires management to make estimates and assumptions that affect the reported amounts of assets and liabilities and disclosure of contingent assets and liabilities at the date of the consolidated financial statements and the reported amounts of revenue and expenses during the reporting period. The most significant estimates and assumptions relate to management’s determination of the estimated selling price of subscription and professional services, the fair values of equity awards issued, the fair value of its call and put options related to its acquisition of Eservices Group Pty Ltd (“Eservices”) (see Note 7), the valuation of intangible assets acquired in business combinations, and the valuation allowance on deferred tax assets. The Company bases these estimates on historical and anticipated results and trends and on various other assumptions that the Company believes are reasonable under the circumstances, including assumptions as to future events. These estimates form the basis for making judgments about the carrying values of assets and liabilities and recorded revenue and expenses that are not readily apparent from other sources. Actual results could differ from those estimates.
Subsequent Events—Management has reviewed and evaluated material subsequent events from the balance sheet date of December 31, 2010 through the audited financial statements issuance date of March 16, 2011. For the reissuance of the annual financial statements presented herein, Management has evaluated subsequent events through April 4, 2011. All appropriate subsequent events have been considered and disclosed in the notes to the Company’s consolidated financial statements.
Concentration of Credit Risk—Financial instruments that potentially subject the Company to concentrations of credit risk consist principally of cash and cash equivalents and accounts receivable. The Company’s cash equivalents are invested in interest bearing money market funds that invest in short-term U.S. government obligations, which include U.S. Treasuries and other securities issued or guaranteed by the U.S. government or any of its agencies, authorities, instrumentalities or sponsored entities and related repurchase agreements. The Company does not hold or issue financial instruments for trading purposes. As part of the Company’s cash management process, the Company performs periodic evaluations of the relative credit standings of these financial institutions.
The Company does not require its customers to provide collateral to support accounts receivable. The Company performs ongoing credit evaluations of its customers’ financial condition and maintains allowances for estimated credit losses. No single customer accounted for 10% or more of the Company’s revenue for the year ended December 31, 2008, 2009 and 2010 or 10% or more of the Company’s accounts receivable as of December 31, 2009 and 2010.
Cash and Cash Equivalents—The Company considers all highly liquid securities with maturities of three months or less from the date of purchase to be cash equivalents. Cash equivalents consist of amounts held in interest-bearing money market accounts that were readily convertible to cash and for which the cost approximates fair value.
Accounts Receivable—Management reviews accounts receivable on a periodic basis to determine if any receivables will potentially be uncollectible. The Company reserves for receivables that are determined to be uncollectible, if any, in its allowance for doubtful accounts. After the Company has exhausted all collection efforts, the outstanding receivable is written off against the allowance.
Fair Value of Financial Instruments—The carrying amount of cash, cash equivalents, accounts receivable, accounts payable and accrued expenses approximates fair value due to the short-term nature of these items. Management believes that the Company’s capital lease obligations bear interest at rates which
F-8
Table of Contents
RESPONSYS, INC.
Notes to Consolidated Financial Statements (Continued)
| 2. | SUMMARY OF SIGNIFICANT ACCOUNTING POLICIES (Continued) |
approximate prevailing market rates for instruments with similar characteristics and, accordingly, the carrying values for these instruments approximate fair value. The Company’s put and call options related to its acquisition of Eservices are carried at fair value.
Fair value is defined as the price that would be received to sell an asset or paid to transfer a liability (i.e., the “exit price”) in an orderly transaction between market participants at the measurement date. As such, fair value is a market-based measurement that should be determined based on assumptions that market participants would use in pricing an asset or liability. A hierarchy has been defined which prioritizes the inputs used in measuring fair value as follows: (Level 1) observable inputs such as quoted prices in active markets; (Level 2) inputs other than the quoted prices in active markets that are observable either directly or indirectly; and (Level 3) unobservable inputs in which there is little or no market data, which requires the Company to develop its own assumptions. This hierarchy requires the Company to use observable market data, when available, and to minimize the use of unobservable inputs when determining fair value. On a recurring basis, the Company measures certain financial assets and liabilities at fair value, including the Company’s cash equivalents.
Property and Equipment—Property and equipment are stated at cost less accumulated depreciation and are depreciated using the straight-line method over the estimated useful lives of the assets, generally over the following periods:
| Depreciation Life (Years) |
||||
| Computers and equipment |
3-5 years | |||
| Software |
3-5 years | |||
| Furniture and fixtures |
3-5 years | |||
| Capitalized software |
5 years | |||
| Leasehold improvements |
Shorter of remaining lease term or useful life | |||
Goodwill—Goodwill represents the excess of the aggregate purchase price paid over the fair value of the net tangible and identifiable intangible assets acquired. In accordance with Financial Accounting Standards Board (“FASB”) Accounting Standards Codification (“ASC”) No. 350-10, Intangibles—Goodwill and Other, goodwill is not amortized and is tested for impairment at least annually or whenever events or changes in circumstances indicate that the carrying value may not be recoverable. The Company has determined that it operates as one reporting unit and has selected November 30 as the date to perform its annual impairment test. In valuation of its goodwill, the Company must make assumptions regarding estimated future cash flows to be derived from the Company. If these estimates or their related assumptions change in the future, the Company may be required to record impairment for these assets. The performance of the test involves a two-step process. The first step of the impairment test involves comparing the fair value of the Company to its net book value, including goodwill. If the net book value exceeds its fair value, then the Company performs the second step of the goodwill impairment test to determine the amount of the impairment loss. The impairment loss would be calculated by comparing the implied fair value of the Company to its net book value. In calculating the implied fair value of the Company’s goodwill, the fair value of the Company is allocated to all of the other assets and liabilities based on their fair values. The excess of the fair value of the Company over the amount assigned to its other assets and liabilities is the implied fair value of goodwill. An impairment loss is recognized when the carrying amount of goodwill exceeds its implied fair value. There was no impairment of goodwill recorded for the years ended December 31, 2008, 2009 or 2010.
F-9
Table of Contents
RESPONSYS, INC.
Notes to Consolidated Financial Statements (Continued)
| 2. | SUMMARY OF SIGNIFICANT ACCOUNTING POLICIES (Continued) |
Long-lived Assets, Purchased Intangible Assets and Equity Method Investments—Purchased intangible assets with a determinable economic life and long-lived assets are carried at cost, less accumulated amortization and depreciation. Amortization and depreciation is computed over the estimated useful life of each asset on a straight-line basis. Equity method investments are carried at cost and are adjusted for the Company’s share in the equity method investments’ earnings. The Company reviews its long-lived assets, purchased intangible assets and equity method investments for impairment in accordance with FASB ASC No. 360-10, Property, Plant and Equipment, whenever events or changes in circumstances indicate that the carrying amount of an asset may no longer be recoverable. When these events occur, the Company measures impairment by comparing the carrying value of the assets to the estimated undiscounted future cash flows expected to result from the use of the assets and their eventual disposition. If the sum of the expected undiscounted cash flows is less than the carrying amount of the assets, the Company recognizes an impairment loss based on the fair value of the assets.
Segment Reporting—The Company is organized and operates in one reportable industry segment: the delivery of on-demand marketing service and related professional services. The Company’s chief operating decision maker, the chief executive officer, reviews financial information presented on a consolidated basis for purposes of making operating decisions and assessing financial performance.
Revenue by geographic region is based on the billing address of the customer. Subscription and professional services revenue by geographic region were as follows (in thousands):
| Year Ended December 31, | ||||||||||||
| 2008 | 2009 | 2010 | ||||||||||
| Subscription |
||||||||||||
| Americas |
$ | 35,630 | $ | 47,272 | $ | 62,641 | ||||||
| Europe |
4,981 | 5,418 | 5,955 | |||||||||
| Asia pacific |
436 | 354 | 688 | |||||||||
| Professional services |
||||||||||||
| Americas |
8,078 | 12,267 | 23,152 | |||||||||
| Europe |
949 | 1,256 | 1,491 | |||||||||
| Asia pacific |
40 | 76 | 144 | |||||||||
| Total revenue |
$ | 50,114 | $ | 66,643 | $ | 94,071 | ||||||
Property and equipment by geographic region were as follows (in thousands):
| December 31, | ||||||||
| 2009 | 2010 | |||||||
| Americas |
$ | 8,366 | $ | 10,414 | ||||
| Europe |
187 | 362 | ||||||
| Asia pacific |
— | 46 | ||||||
| Total property and equipment—net |
$ | 8,553 | $ | 10,822 | ||||
F-10
Table of Contents
RESPONSYS, INC.
Notes to Consolidated Financial Statements (Continued)
| 2. | SUMMARY OF SIGNIFICANT ACCOUNTING POLICIES (Continued) |
Revenue Recognition—The Company recognizes revenue in accordance with ASC No. 605-25, Revenue Recognition. The Company’s revenue is primarily derived from sales of subscriptions to its on-demand software (“Subscriptions”). Subscription revenue primarily consists of revenue from contractually committed messaging and revenue from messages sent above contracted levels. Customers do not have the contractual right to take possession of the Company’s on-demand software. Accordingly, the Company recognizes the aggregate minimum subscription fee on a straight-line basis over the subscription term, provided that an enforceable contract has been signed by both parties, access to the Company’s software has been granted to the customer, the fee for the subscription is fixed or determinable and collection is reasonably assured. The Company does not recognize revenue in excess of the amount it has the right to invoice. Should a customer exceed the specified contractual messaging volume, per-message fees are billed for the excess volume. The Company recognizes revenue for messages sent above contracted levels in the period in which the messages are sent. The Company also derives revenue from setup fees when the services are first activated. The setup fees are recorded as deferred revenue and recognized as revenue ratably over the estimated life of the customer relationship.
The Company also derives revenue from professional services. Professional services revenue consists primarily of fees associated with campaign services, creative and strategic marketing services, technical services and education services. Revenue from professional services is recognized as services are rendered for time and material engagements or using a proportional performance model based on services performed for fixed fee consulting engagements. Education services revenue is recognized after the services are performed. Professional services, when sold with on-demand software subscriptions, are accounted for separately when these services have value to the customer on a standalone basis.
At the inception of a customer contract, the Company makes an assessment as to that customer’s ability to pay for the services provided. The Company bases its assessment on a combination of factors, including the successful completion of a credit check or financial review, its collection experience with the customer, and other forms of payment assurance. If the Company subsequently determines that collection from the customer is not reasonably assured, the Company records an allowance for doubtful accounts and bad debt expense for all of that customer’s unpaid invoices and ceases recognizing revenue for continued services provided until cash is received from the customer. Changes in the Company’s estimates and judgments about whether collection is reasonably assured would change the timing of revenue or the amount of bad debt expense that the Company recognizes.
Deferred revenue represents amounts billed to customers for which revenue has not been recognized. Deferred revenue consists of the unearned portion of professional services fees or the unearned portion of fees from subscriptions to the Company’s on-demand software.
Revenue Recognition for Arrangements With Multiple Deliverables—A multiple-element arrangement includes the sale of a Subscription with one or more associated professional service offerings, each of which are individually considered separate units of accounting. In determining whether professional services represent a separate unit of accounting the Company considers the availability of the services from other vendors. The Company allocates revenue to each element in a multiple-element arrangement based upon the relative selling price of each deliverable.
The Company is not able to demonstrate VSOE or TPE of selling price with respect to its Subscriptions. The Company does not have sufficient instances of separate sales of Subscriptions nor is it able to demonstrate sufficient pricing consistency with respect to such sales. The Company also considered that no other vendor sells
F-11
Table of Contents
RESPONSYS, INC.
Notes to Consolidated Financial Statements (Continued)
| 2. | SUMMARY OF SIGNIFICANT ACCOUNTING POLICIES (Continued) |
similar Subscriptions given the unique nature and functionality of its service offering, and therefore has determined that it is not able to establish TPE of selling price. Therefore, the Company has determined the BESP of Subscriptions based on the following:
| • | The list price, which represents a component of the Company’s current go-to market strategy, as established by senior management taking into consideration factors such as the competitive and economic environment. |
| • | An analysis of the historical pricing with respect to both the Company’s bundled and standalone subscription arrangements. |
The Company has established VSOE of selling price for its professional services based on an analysis of separate sales of such services.
Cost of Revenue—Cost of Subscription revenue primarily consists of hosting costs, data communications expenses, personnel and related costs, including salaries and employee benefits, allocated overhead, software license fees, costs associated with website development activities, amortization expenses associated with capitalized software and depreciation and amortization expenses associated with computer equipment. Cost of professional services revenue primarily consists of personnel and related costs and allocated overhead.
Stock-based Compensation—On January 1, 2006, the Company adopted FASB ASC No. 718-20, Compensation—Stock Compensation, which required companies to measure the cost of employee services received in exchange for an award of equity instruments based on the grant date fair value of the award. Prior to January 1, 2006, the Company accounted for an award of equity instruments using the intrinsic value method in accordance with Accounting Principles Board (“APB”) Opinion No. 25, Accounting for Stock Issued to Employees, and FASB Interpretation (“FIN”) No. 44, Accounting for Certain Transactions involving Stock Compensation—an interpretation of APB Opinion No. 25. Under this method, for grants prior to January 1, 2006, no compensation expense was recognized for employee stock options granted with exercise prices greater than or equal to the fair value of the underlying common stock at date of grant. If the exercise price is less than the market value at the date of grant, the difference is recognized as deferred compensation expense, which is amortized over the vesting period. Compensation costs for the portion of awards for which the required service period has not been rendered (such as unvested options) that were outstanding as of January 1, 2006, continue to be accounted for under the provisions of APB Opinion No. 25 and were recognized as the remaining required services are rendered.
The Company elected to use the prospective transition method such that ASC No. 718-20 applies to new awards and to awards modified, repurchased, or canceled after the effective date.
The Company has stock-based compensation plans. Generally, stock options granted to employees vest 25% one year from the vesting commencement date and 1/48th each month thereafter, and have a contractual term of 10 years. The Company recognizes stock-based compensation expense over the requisite service period of the individual grant, generally, equal to the vesting period.
Determining Fair Value—The Company calculates the fair value of options granted by using the Black-Scholes pricing model with the following assumptions:
Expected Volatility—The Company estimates volatility for option grants by evaluating the average historical volatility of a peer group of companies for the period immediately preceding the option grant for a term that is approximately equal to the options’ expected life.
F-12
Table of Contents
RESPONSYS, INC.
Notes to Consolidated Financial Statements (Continued)
| 2. | SUMMARY OF SIGNIFICANT ACCOUNTING POLICIES (Continued) |
Expected Term—The expected term of the Company’s options represents the period that the stock-based awards are expected to be outstanding. The Company has elected to use the simplified method described in SAB No. 107 to compute expected term. The Company’s stock plan provides for options that have a 10-year term.
Risk-Free Interest Rate—The risk-free interest rate is based on the implied yield then currently available on U.S. Treasury zero coupon issues with an equivalent remaining term.
Dividend Yield—The Company has not issued dividends to date and does not anticipate issuing dividends. As such, the dividend yield has been estimated to be zero.
Preferred Stock Warrants—In accordance with ASC Topic 480, Distinguishing Liabilities from Equity (“ASC 480”), the Company accounts for freestanding preferred stock warrants for preferred stock that is not indexed to the Company’s own equity as liabilities that are recorded at their fair value at the time of issuance and adjusted to fair value at each balance sheet date, with the change in the fair value being recorded as a component of other income (expense).
In June 2008, the FASB issued ASC 815-40, Derivatives and Hedging: Contracts in Entity’s Own Equity (“ASC 815-40”). ASC 815-40 clarified the determination of whether an instrument (or an embedded feature) is indexed to an entity’s own stock, which would qualify as a scope exception under ASC 815-10-15 (formerly referred to as SFAS No. 133, Accounting for Derivative Instruments and Hedging Activities). ASC 815-40 is effective for financial statements issued for fiscal years beginning after December 15, 2008. In connection with the issuance of a secured borrowing agreement in fiscal 2003, the Company issued warrants to purchase 800,632 shares of Series E convertible preferred stock at $0.24788 per share. These warrants were determined to be a liability instrument based on the clarification within ASC Topic 815-40. As of January 1, 2009, the fair value of these warrants was reclassified from equity to a current liability and a cumulative effect adjustment to retained earnings was recorded for the change in the fair value of the warrants. During the period in which the warrants are classified as a liability, the fair value of the warrants are remeasured with any changes in value recognized in other income (loss) in the consolidated financial statements.
Website Development Costs and Software Development Costs—Costs incurred in connection with the development of the Company’s on-demand software solution are accounted for in accordance with FASB ASC No. 350-50, Website Development Costs, and ASC No. 350-40, Internal-use Software. All costs incurred in the preliminary project and post-implementation stages are expensed as incurred, and certain costs incurred in the development stage of the project are capitalized if certain criteria are met. Once the software is available for general release, the capitalized costs are amortized over the expected useful life of the software on a straight-line basis. The Company currently estimates a useful life of five years with respect to its capitalized software.
The Company capitalized $1.3 million, $0.8 million and $0.4 million of costs in the years ended December 31, 2008, 2009 and 2010, respectively. Amortization expense totaled approximately $0, $0.2 million and $0.5 million for the years ended December 31, 2008, 2009 and 2010, respectively.
Research and Development Costs—Research and development costs are expensed to operations as incurred.
Advertising Costs—Advertising costs are expensed as incurred. Advertising expenses were $0.4 million, $0.2 million and $0.3 million for the years ended December 31, 2008, 2009 and 2010, respectively.
F-13
Table of Contents
RESPONSYS, INC.
Notes to Consolidated Financial Statements (Continued)
| 2. | SUMMARY OF SIGNIFICANT ACCOUNTING POLICIES (Continued) |
Income Taxes—The Company accounts for income taxes using an asset and liability approach to record deferred income taxes. Deferred income taxes reflect the impact of temporary differences between assets and liabilities recognized for financial reporting purposes, and such amounts recognized for income tax purposes, net of operating loss carryforwards and other tax credits, measured by applying currently enacted tax laws. Valuation allowances are provided when necessary to reduce deferred tax assets to an amount that is more-likely-than-not to be realized.
On January 1, 2007, the Company adopted the authoritative guidance in ASC 740, Income Taxes, prescribing a threshold and measurement attribute for the financial recognition and measurement of a tax position taken or expected to be taken in a tax return. The guidance also provides for de-recognition of tax benefits, classification on the balance sheet, interest and penalties, accounting in interim periods, disclosure and transition. The guidance utilizes a two-step approach for evaluating uncertain tax positions. Step one, Recognition, requires a company to determine if the weight of available evidence indicates that a tax position is more-likely-than-not to be sustained upon audit, including resolution of related appeals or litigation processes, if any. If a tax position is not considered more-likely-than-not to be sustained then no benefits of the position are to be recognized. Step two, Measurement, is based on the largest amount of benefit, which is more-likely-than-not to be realized on ultimate settlement. The Company considers many factors when evaluating and estimating its tax positions and tax benefits, which may require periodic adjustments and which may not accurately anticipate actual outcomes.
With the adoption of the guidance, companies are required to reflect only those tax positions that are more-likely-than-not to be sustained. Any necessary adjustment would be recorded directly to retained earnings and reported as a change in accounting principle as of the date of adoption. The adoption of this guidance did not have a material impact on the Company’s consolidated financial statements. The Company’s policy is to recognize interest and penalties related to unrecognized tax benefits in income tax expense. See Note 11 for additional information, including the effects of adoption on the Company’s consolidated financial position, results of operations and cash flows.
Comprehensive Income—Comprehensive income is composed of net income and other comprehensive income (loss). Other comprehensive income (loss) relates to foreign exchange translation adjustments of $38,000 and $1.2 million for the years ended December 31, 2009 and 2010, respectively. Accumulated other comprehensive loss of $(0.1) million and $1.1 million as of December 31, 2009 and 2010, respectively, is comprised entirely of cumulative foreign exchange translation adjustments.
Net Income Per Share—Basic and diluted net income per common share are presented in conformity with the two-class method required for participating securities. Holders of Series E convertible preferred stock are entitled to receive noncumulative dividends at the annual rate of $0.0196 per share, payable prior and in preference to any dividends on any other shares of the Company’s preferred and common stock. Holders of Series A, B, C and D convertible preferred stock are entitled to receive noncumulative dividends at the annual rate of $ 0.224, $1.304, $0.508, and $0.508 per share of Series A, B, C and D convertible preferred stock, respectively, payable prior and in preference to any dividends on any other shares of the Company’s common stock. In the event a dividend is paid on common stock, the convertible preferred stockholders are entitled to a proportionate share of any such dividend as if they were holders of common stock (on an as-if converted basis).
Under the two-class method, net income attributable to common stockholders is determined by allocating undistributed earnings, calculated as net income less current period Series A, Series B, Series C, Series D and
F-14
Table of Contents
RESPONSYS, INC.
Notes to Consolidated Financial Statements (Continued)
| 2. | SUMMARY OF SIGNIFICANT ACCOUNTING POLICIES (Continued) |
Series E convertible preferred stock non-cumulative dividends, between common stock and Series A, Series B, Series C, Series D and Series E convertible preferred stock. In computing diluted net income attributed to common stockholders, undistributed earnings are re-allocated to reflect the potential impact of dilutive securities. Basic net income per common share is computed by dividing the net income attributable to common stockholders by the weighted-average number of common shares outstanding during the period. The weighted-average number of shares of common stock used to calculate the Company’s basic net income per common share excludes those shares subject to repurchase related to stock options that were exercised prior to vesting as these shares are not deemed to be issued for accounting purposes until they vest. Diluted net income per common share is computed by giving effect to all potential common stock equivalents outstanding for the period determined using the treasury-stock method. For purposes of this calculation, stock options to purchase common stock, common stock subject to repurchase and warrants to purchase common stock are considered to be common stock equivalents.
Pro forma basic and diluted net income per share attributable to common stockholders (unaudited) were computed to give effect to the conversion of the Series A, Series B, Series C, Series D, and Series E convertible preferred stock using the as-if converted method into common shares as though the conversion had occurred as of the beginning of the period or the original date of issuance if later.
F-15
Table of Contents
RESPONSYS, INC.
Notes to Consolidated Financial Statements (Continued)
| 2. | SUMMARY OF SIGNIFICANT ACCOUNTING POLICIES (Continued) |
The following table presents the calculation of basic and diluted net income per common share and unaudited pro forma basic and diluted net income per common share (in thousands, except per share data):
| Year Ended December 31, | ||||||||||||
| 2008 | 2009 | 2010 | ||||||||||
| Net income attributable to common stockholders: |
||||||||||||
| Numerator: |
||||||||||||
| Basic: |
||||||||||||
| Net income |
$ | 20,447 | $ | 5,886 | $ | 8,598 | ||||||
| Non-cumulative dividends on convertible preferred stock |
(4,946 | ) | (4,960 | ) | (4,960 | ) | ||||||
| Undistributed earnings allocated to convertible preferred stock |
(12,521 | ) | (740 | ) | (2,836 | ) | ||||||
| Net income attributed to common stockholders—basic |
$ | 2,980 | $ | 186 | $ | 802 | ||||||
| Diluted |
||||||||||||
| Net income attributed to common stockholders—basic |
$ | 2,980 | $ | 186 | $ | 802 | ||||||
| Undistributed earnings re-allocated to common stockholders |
2,029 | 113 | 377 | |||||||||
| Net income attributed to common stockholders—diluted |
$ | 5,009 | $ | 299 | $ | 1,179 | ||||||
| Denominator: |
||||||||||||
| Basic shares: |
||||||||||||
| Weighted-average shares used in computing basic net income per share attributable to common stockholders |
7,007 | 7,518 | 8,527 | |||||||||
| Diluted shares: |
||||||||||||
| Weighted-average shares used in computing basic net income per share attributable to common stockholders |
7,007 | 7,518 | 8,527 | |||||||||
| Effect of potentially dilutive securities: |
||||||||||||
| Repurchaseable share options |
23 | — | — | |||||||||
| Employee share options |
7,368 | 6,775 | 5,937 | |||||||||
| Common share warrants |
10 | 9 | — | |||||||||
| Weighted-average shares used in computing diluted net income per share attributable to common stockholders |
14,408 | 14,302 | 14,464 | |||||||||
| Net income per common share: |
||||||||||||
| Basic |
$ | 0.43 | $ | 0.02 | $ | 0.09 | ||||||
| Diluted |
$ | 0.35 | $ | 0.02 | $ | 0.08 | ||||||
| Net income attributable to common stockholders used in computing pro forma net income per share attributable to common stockholders, basic and diluted |
$ | 8,598 | ||||||||||
| Shares used in computing pro forma net income per share (unaudited): |
||||||||||||
| Basic shares: |
||||||||||||
| Weighted-average common shares used in computing basic net income per common share |
8,527 | |||||||||||
| Pro forma weighted-average conversion of convertible preferred stock |
30,159 | |||||||||||
| Weighted-average shares outstanding used in calculating pro forma basic net income per share |
38,686 | |||||||||||
| Diluted shares: |
||||||||||||
| Weighted-average shares outstanding used in calculating pro forma basic net income per common share |
38,686 | |||||||||||
| Effect of potentially dilutive securities: |
||||||||||||
| Repurchaseable shares |
— | |||||||||||
| Employee share options |
5,937 | |||||||||||
| Common share warrants |
— | |||||||||||
| Weighted-average shares outstanding used in calculating pro forma diluted net income per share |
44,623 | |||||||||||
| Pro forma net income per share attributable to common stockholders (unaudited): |
||||||||||||
| Basic |
$ | 0.22 | ||||||||||
| Diluted |
$ | 0.19 | ||||||||||
F-16
Table of Contents
RESPONSYS, INC.
Notes to Consolidated Financial Statements (Continued)
| 2. | SUMMARY OF SIGNIFICANT ACCOUNTING POLICIES (Continued) |
Recently Issued Accounting Standards—Effective January 1, 2009, the Company adopted three accounting standard updates which were intended to provide additional application guidance and enhanced disclosures regarding fair value measurements and impairments of securities. They also provide additional guidelines for estimating fair value in accordance with fair value accounting. The first update, as codified in ASC 820-10-65, provides additional guidelines for estimating fair value in accordance with fair value accounting. The second accounting update, as codified in ASC 320-10-65, changes accounting requirements for other-than-temporary-impairment (“OTTI”) for debt securities by replacing the current requirement that a holder have the positive intent and ability to hold an impaired security to recovery in order to conclude an impairment was temporary with a requirement that an entity conclude it does not intend to sell an impaired security and it is not more likely-than-not that it will be required to sell the security before the recovery of its amortized cost basis. The third accounting update, as codified in ASC 825-10-65, increases the frequency of fair value disclosures. These updates were effective for fiscal years and interim periods ended after June 15, 2009. The adoption of these accounting updates did not have a material impact on the Company’s consolidated financial statements.
In December 2010, the FASB issued Accounting Standards Update 2010-29, “Business Combinations Topic (805): Disclosure of supplementary pro forma Information for Business Combinations” (“ASU 2010-29”). ASU 2010-29 provides clarification on the presentation of pro forma information for business combinations and applies to public entities. ASU 2010-29 specifies that the pro forma disclosure should include revenue and earnings of the combined entity as though the business combination(s) during the current year had occurred as of the beginning of the comparable prior annual reporting period only if comparative financial statements are presented. It also expands the supplemental pro forma disclosures to include a description of the nature and amount of the material, nonrecurring pro forma adjustments directly attributable to the business combination included in the reported pro forma revenue and earnings. The amendments are effective on a prospective basis for business combinations for which the acquisition date is on or after the beginning of the first annual reporting period beginning on or after December 15, 2010. The Company adopted this update as of January 1, 2011, and its adoption resulted in additional disclosures over its business combination acquisition of Eservices that was completed on January 3, 2011.
| 3. | BUSINESS COMBINATIONS |
Smith-Harmon, Inc.—On November 16, 2009, the Company acquired all of the equity interests of Smith-Harmon, Inc. (“Smith-Harmon”), a privately-held company based in Seattle, Washington, that provided marketing consulting services. With this acquisition, the Company acquired a knowledgeable work force as well as the opportunity to increase its market share through the acquisition of the customer list. Total cost for the acquisition was approximately $1.3 million, which includes approximately $1.2 million in cash, and options to purchase 100,000 shares of common stock valued at approximately $31,000. Of the $1.2 million cash consideration, $0.9 million was paid in 2009 and $0.3 million was paid in 2010. Goodwill recorded as a result of this acquisition is not deductible for tax purposes. As of December 31, 2010 the full cash consideration had been paid.
F-17
Table of Contents
RESPONSYS, INC.
Notes to Consolidated Financial Statements (Continued)
| 3. | BUSINESS COMBINATIONS (Continued) |
The allocation of the purchase price for this acquisition is as follows (in thousands):
| Fair value of tangible assets |
$ | 400 | ||
| Fair value of identifiable intangible assets: |
||||
| Trade name (five-year estimated life) |
149 | |||
| Customer list (three-year estimated life) |
645 | |||
| Goodwill |
631 | |||
| Deferred tax liabilities |
(224 | ) | ||
| Accrued liabilities |
(318 | ) | ||
| Total consideration |
$ | 1,283 | ||
| 4. | PROPERTY AND EQUIPMENT—NET |
Property and equipment as of December 31, 2008 and 2009 and September 30, 2010, consisted of the following (in thousands):
| December 31, | ||||||||
| 2009 | 2010 | |||||||
| Computers and equipment |
$ | 15,262 | $ | 20,670 | ||||
| Software |
3,171 | 4,558 | ||||||
| Furniture and fixtures |
351 | 598 | ||||||
| Capitalized software |
2,139 | 2,569 | ||||||
| Leasehold improvements |
396 | 713 | ||||||
| Total property and equipment—cost |
21,319 | 29,108 | ||||||
| Less: accumulated depreciation |
(12,766 | ) | (18,286 | ) | ||||
| Total property and equipment—net |
$ | 8,553 | $ | 10,822 | ||||
Depreciation expense was $2.9 million, $4.3 million and $5.5 million for the years ended December 31, 2008, 2009 and 2010, respectively.
The Company acquired equipment that was financed with capital leases in the amount of $0.9 million, $0 and $0.1 million during the years ended December 31, 2008, 2009 and 2010, respectively. As of December 31, 2009 and 2010, $0.9 million and $1.0 million, respectively, was included in the Company’s computers and equipment balance.
| 5. | INTANGIBLE ASSETS |
Purchased intangible assets with a determinable economic life are carried at cost, less accumulated amortization. Amortization is computed over the estimated useful life of each asset on a straight-line basis. Intangible assets consist of customer lists and trade name, which are being amortized over a period of two to five years.
Amortization expense was $0.3 million, $32,000 and $0.3 million for the years ended December 31, 2008, 2009 and 2010, respectively.
F-18
Table of Contents
RESPONSYS, INC.
Notes to Consolidated Financial Statements (Continued)
| 5. | INTANGIBLE ASSETS (Continued) |
Intangible assets as of December 31, 2009 and 2010, consisted of the following (in thousands):
| December 31, | ||||||||
| 2009 | 2010 | |||||||
| Customer lists |
$ | 645 | $ | 645 | ||||
| Trade name |
149 | 149 | ||||||
| Total intangible assets—gross |
794 | 794 | ||||||
| Less: accumulated amortization |
(18 | ) | (265 | ) | ||||
| Total intangible assets—net |
$ | 776 | $ | 529 | ||||
The estimated future amortization expense related to intangible assets as of December 31, 2009, is as follows (in thousands):
| Amortization | ||||
| 2011 |
$ | 245 | ||
| 2012 |
224 | |||
| 2013 |
30 | |||
| 2014 |
30 | |||
| Total amortization |
$ | 529 | ||
| 6. | GOODWILL |
The Company conducted its annual goodwill impairment test as of November 30, 2009 and 2010. Based on its analysis, the Company determined that there was no impairment to goodwill. The Company will continue to monitor conditions and changes that could indicate that the recorded goodwill may be impaired.
| 7. | INVESTMENT IN UNCONSOLIDATED AFFILIATES |
In July 2010, the Company acquired 50% of the common shares of Eservices Group Pty Ltd, a privately-held company headquartered in Melbourne, Australia for $6.7 million (AUD $7.8 million) in cash. Of this amount, $0.4 million was unpaid as of December 31, 2010.
The Company has determined that it does not have power to control the activities that would most significantly impact the economic performance of Eservices nor does it have a controlling financial interest as the Company does not own a majority of the voting interests. Accordingly, the Company is accounting for such investment using the equity method.
F-19
Table of Contents
RESPONSYS, INC.
Notes to Consolidated Financial Statements (Continued)
| 7. | INVESTMENT IN UNCONSOLIDATED AFFILIATES (Continued) |
The difference between the amount at which the investment was recorded and the amount of underlying equity in net assets was as follows (in thousands):
| Initial cost of equity investment in Eservices |
$ | 6,740 | ||
| Equity in net tangible assets/liabilities |
||||
| Tangible assets |
2,337 | |||
| Tangible liabilities |
(1,531 | ) | ||
| Net assets |
806 | |||
| Net book value difference |
$ | 5,934 | ||
| Components of net book value difference: |
||||
| Customer list (three-year estimated life) |
$ | 2,965 | ||
| Trade name (two-year estimated life) |
52 | |||
| Software (one-year estimated life) |
25 | |||
| Goodwill (indefinite-lived) |
2,892 | |||
| Total net book value difference |
$ | 5,934 | ||
There exists a difference in net book value in the underlying net assets between the Company’s basis and Eservices’ historical basis due to the fair market value of intangible assets. The determination of the Company’s proportionate share of Eservices’ net operating results includes amortization of intangible assets over their respective estimated useful life.
Condensed combined financial information of Eservices as of December 31, 2010 and for the period from July 1, 2010 to December 31, 2010 is as follows (in thousands):
| December 31, 2010 | ||||
| Assets: |
||||
| Current assets |
$ | 1,490 | ||
| Noncurrent assets |
7,889 | |||
| Total assets |
$ | 9,379 | ||
| Liabilities and owners’ equity: |
||||
| Current liabilities |
$ | 668 | ||
| Noncurrent liabilities |
954 | |||
| Owner’s equity |
7,757 | |||
| Total liabilities and owners’ equity |
$ | 9,379 | ||
| For the Six Months Ended December 31, 2010 |
||||
| Revenue |
$ | 2,234 | ||
| Operating expenses |
(2,531 | ) | ||
| Loss before tax provision |
(297 | ) | ||
| Income tax provision |
82 | |||
| Net loss |
$ | (215 | ) | |
F-20
Table of Contents
RESPONSYS, INC.
Notes to Consolidated Financial Statements (Continued)
| 7. | INVESTMENT IN UNCONSOLIDATED AFFILIATES (Continued) |
As of December 31, 2010, the Company had the option to purchase (“Call Option”) and could also be obligated to purchase (“Put Option”) an additional 16.67% and the remaining 33.33% of Eservices in July 2011 and December 2011, respectively. The share purchase agreement provides that payments to acquire the additional shares of Eservices in July 2011 and December 2011 will be an amount equal to 1.5 times Eservices’ revenue for the year ending June 30, 2011 and from January 1, 2011 through December 31, 2011, respectively, prorated by the number of shares to be purchased. In addition, the final payment calculation provides for up to an additional $1.3 million based on Eservices’ revenue growth for the year ending June 30, 2011.
With respect to the Call Option and Put Option, the Company elected to account for such financial instruments in accordance with ASC 825-10-25. The Company recorded an asset of $1.7 million, and a liability for $1.6 million, relating to the July 2011 and December 2011 Call Option and Put Option, respectively. As of December 31, 2010, the fair value of the Call Option was $2.2 million, which was recorded in prepaid expenses and other current asset and the fair value of the Put Option of $0.5 million was recorded in other accrued liabilities. Gains and losses from the changes in the fair values of the Call and Put Options were recognized in other income (expense). The Company recognized a net gain of $1.5 million for the year ended December 31, 2010 related to the Call and Put Options.
On January 3, 2011, the Company purchased the remaining equity interests of Eservices (see Note 15).
| 8. | COMMITMENTS AND CONTINGENCIES |
Lease Commitments—The Company leases its facilities under noncancelable operating lease agreements that expire in August 2014 and computer equipment under a noncancelable capital lease, which expires in December 2011. The operating lease agreements provide for escalation of the lease payments over the lease term. The capital lease payments include interest at an effective rate of 4.8% per annum. The capital lease is collateralized with the leased equipment. Total minimum future lease payments under operating and capital leases as of December 31, 2010 were as follows (in thousands):
| Operating | Capital | |||||||
| 2011 |
$ | 2,176 | $ | 417 | ||||
| 2012 |
1,875 | — | ||||||
| 2013 |
771 | — | ||||||
| 2014 |
265 | — | ||||||
| 2015 |
74 | — | ||||||
| Total minimum lease payments |
$ | 5,161 | 417 | |||||
| Less: amount representing interest |
(30 | ) | ||||||
| Present value of minimum lease payments |
387 | |||||||
| Less: current portion of capital lease obligations |
(387 | ) | ||||||
| Capital lease obligations—noncurrent |
$ | — | ||||||
The Company records a deferred rent liability within its general accruals and recognizes rent expense on its facility leases on a straight-line basis. Rental expense under the Company’s operating leases was $1.1 million, $1.5 million and $2.0 million for the years ended December 31, 2008, 2009 and 2010, respectively.
F-21
Table of Contents
RESPONSYS, INC.
Notes to Consolidated Financial Statements (Continued)
| 8. | COMMITMENTS AND CONTINGENCIES (Continued) |
Legal Proceedings—From time to time, the Company may become involved in various legal proceedings in the ordinary course of its business, and may be subject to third-party infringement claims. Even claims that lack merit could result in significant legal expenses and use of managerial resources.
During fiscal year 2005, the Company entered into a settlement agreement relating to a patent litigation that was brought against the Company. In fiscal 2007, a superseding second settlement agreement was entered into, whereby the counterparty agreed to an upfront cash payment of $0.1 million and a contingent payment of $0.4 million for which the Company recorded a liability. The Company subsequently determined that the probability of payment of the contingent settlement amount was remote and removed the liability from its consolidated balance sheet as of March 31, 2008, which is reflected as a reduction in the Company’s cost of subscription revenue in the consolidated statement of income for the year ended December 31, 2008.
From time to time, in the normal course of business, the Company may agree to indemnify third parties with whom it enters into contractual relationships, including customers, lessors, and parties to other transactions with the Company, with respect to certain matters. The Company has agreed, under certain conditions, to hold these third parties harmless against specified losses, such as those arising from a breach of representations or covenants, other third-party claims that the Company’s products when used for their intended purposes infringe the intellectual property rights of such other third parties, or other claims made against certain parties. It is not possible to determine the maximum potential amount of liability under these indemnification obligations due to the Company’s limited history of prior indemnification claims and the unique facts and circumstances that are likely to be involved in each particular claim. Historically, payments made by the Company under these obligations have not been material.
| 9. | COMMON STOCK |
Reincorporation and Reverse Stock Split—On March 30, 2011, the Company reincorporated from the state of California to the state of Delaware by means of merger with and into a wholly-owned subsidiary, Responsys, Inc., a Delaware corporation. In connection with the merger, the Company executed a 1-for-4 reverse stock split of its common stock and convertible preferred stock (collectively, “Capital Stock”). On the effective date of the reverse stock split, (i) each 4 shares of outstanding Capital Stock were reduced to one share of Capital Stock; (ii) the number of shares of Capital Stock into which each outstanding warrant or option to purchase Capital Stock is exercisable was proportionately reduced on a 4-to-1 basis; (iii) the exercise price of each outstanding warrant or option to purchase Capital Stock was proportionately increased on a 1-to-4 basis; and (iv) each 4 shares of authorized Capital Stock were reduced to one share of Capital Stock. All of the share and per share amounts have been adjusted, on a retroactive basis, to reflect this 1-for-4 reverse stock split.
Common Stock—As of December 31, 2010, under the Company’s Certificate of Incorporation, as amended, the Company was authorized to issue 62.5 million shares of common stock with par value of $0.0001 per share.
F-22
Table of Contents
RESPONSYS, INC.
Notes to Consolidated Financial Statements (Continued)
| 9. | COMMON STOCK (Continued) |
As of December 31, 2009 and 2010 the common stock reserved for issuance was as follows (in thousands):
| December 31, | ||||||||
| 2009 | 2010 | |||||||
| Outstanding options |
11,308 | 10,937 | ||||||
| Reserved for future option grants |
181 | 811 | ||||||
| Convertible preferred stock (as converted) |
30,159 | 30,159 | ||||||
| Warrants to purchase convertible preferred stock (as converted) |
28 | 28 | ||||||
| Total common stock reserved for issuance |
41,676 | 41,935 | ||||||
Stock Option Plans—In May 1999, the Company adopted the 1999 Stock Plan (the “1999 Stock Plan”). The 1999 Stock Plan provides for the granting of incentive stock options, nonqualified stock options, and shares of common stock to employees, consultants, and outside directors of the Company. Incentive stock options (“ISOs”) may be granted only to Company employees (including officers and directors who are also employees). Nonqualified stock options (“NSOs”) and direct awards or sale of shares may be granted to Company employees, consultants, and outside directors. The Company has authorized 17,437,500 shares of common stock for issuance under the Plan.
Options under the 1999 Stock Plan may be granted for periods of up to ten years, provided that: (i) the exercise price of an ISO and NSO shall not be less than 100% and 85%, respectively, of the estimated fair value of the shares on the date of grant as determined by the board of directors, and (ii) the exercise price of an ISO and NSO granted to a 10% stockholder shall not be less than 110% of the estimated fair value of the shares on the date of grant as determined by the board of directors. The purchase price of a share offered under the 1999 Stock Plan shall not be less than 85% of the fair market value of such shares on the date of grant, except for a 10% stockholder, in which case the exercise price shall not be less than 100% of the fair market value on the date of grant. Options granted are immediately exercisable and generally vest 25% one year from the vesting commencement date and 1/48th each month thereafter. The 1999 Stock Plan provides that the unvested shares that are exercised are subject to repurchase by the Company upon termination of employment at the original price paid for the shares. At December 31, 2010, there were 148,047 shares subject to repurchase and therefore not included in stockholders’ equity. These shares have been reflected as exercised in the summary of option activity as of December 31, 2010.
F-23
Table of Contents
RESPONSYS, INC.
Notes to Consolidated Financial Statements (Continued)
| 9. | COMMON STOCK (Continued) |
A summary of the Company’s stock option activity under the Plan and related information is as follows:
| Shares Available for Grant |
Options Outstanding | |||||||||||||||||||
| Number of Shares |
Weighted- Average Exercise Price |
Weighted- Average Remaining Contractual Life in Years |
Aggregate Intrinsic Value |
|||||||||||||||||
| (in thousands) | (in thousands) | (in thousands) | ||||||||||||||||||
| Balance—December 31, 2007 |
3,185 | 9,932 | 0.32 | |||||||||||||||||
| Options granted |
(3,070 | ) | 3,070 | 2.82 | ||||||||||||||||
| Options exercised |
— | (739 | ) | 0.14 | ||||||||||||||||
| Options canceled |
678 | (678 | ) | 1.15 | ||||||||||||||||
| Options repurchased |
7 | — | 0.04 | |||||||||||||||||
| Balance—December 31, 2008 |
800 | 11,585 | 0.96 | |||||||||||||||||
| Options granted |
(3,415 | ) | 3,415 | 2.64 | ||||||||||||||||
| Options exercised |
— | (896 | ) | 0.20 | ||||||||||||||||
| Options canceled |
2,796 | (2,796 | ) | 2.67 | ||||||||||||||||
| Balance—December 31, 2009 |
181 | 11,308 | 1.09 | |||||||||||||||||
| Options authorized |
528 | — | — | |||||||||||||||||
| Options granted |
(951 | ) | 951 | 6.28 | ||||||||||||||||
| Options exercised |
— | (1,108 | ) | 0.88 | ||||||||||||||||
| Options canceled |
214 | (214 | ) | 2.64 | ||||||||||||||||
| Common stock repurchases |
839 | — | 0.16 | |||||||||||||||||
| Balance—December 31, 2010 |
811 | 10,937 | 1.55 | 6.07 | $ | 64,029 | ||||||||||||||
| Vested and exercisable—December 31, 2010 |
6,893 | 0.45 | 4.52 | $ | 47,880 | |||||||||||||||
| Vested and expected to vest—December 31, 2010 |
10,563 | 1.40 | 5.95 | $ | 63,424 | |||||||||||||||
The weighted-average grant date fair value of options granted was $1.71, $1.38 and $3.15 for the years ended December 31, 2008, 2009 and 2010, respectively. The total intrinsic value of options exercised during the year ended December 31, 2008, 2009 and 2010 was $2.1 million, $2.5 million and $5.1 million, respectively.
F-24
Table of Contents
RESPONSYS, INC.
Notes to Consolidated Financial Statements (Continued)
| 9. | COMMON STOCK (Continued) |
The following table summarizes the stock options outstanding as of December 31, 2010:
| Outstanding Options | Options Vested and Exercisable | |||||||||||||||||||||||
| Exercise |
Number of Shares |
Weighted- Average Remaining Contractual Life in Years |
Weighted- Average Exercise Price |
Number of Shares |
Weighted- Average Remaining Contractual Life in Years |
Weighted- Average Exercise Price |
||||||||||||||||||
| (in thousands) | (in thousands) | |||||||||||||||||||||||
| $0.04 |
4,289 | 3.63 | $ | 0.04 | 4,288 | 3.63 | $ | 0.04 | ||||||||||||||||
| 0.40 | 1,484 | 5.33 | 0.40 | 1,484 | 5.33 | 0.40 | ||||||||||||||||||
| 0.60 | 129 | 5.88 | 0.60 | 126 | 5.87 | 0.60 | ||||||||||||||||||
| 1.40 | 130 | 5.40 | 1.40 | 121 | 5.32 | 1.40 | ||||||||||||||||||
| 1.96 |
494 | 6.72 | 1.96 | 402 | 6.72 | 1.96 | ||||||||||||||||||
| 2.28 |
153 | 8.13 | 2.28 | 71 | 8.07 | 2.28 | ||||||||||||||||||
| 2.60 | 2,747 | 8.55 | 2.60 | 59 | 8.19 | 2.60 | ||||||||||||||||||
| 2.80 |
66 | 6.95 | 2.80 | 51 | 6.95 | 2.80 | ||||||||||||||||||
| 2.92 |
285 | 6.86 | 2.92 | 195 | 6.79 | 2.92 | ||||||||||||||||||
| 3.08 |
362 | 8.82 | 3.08 | 90 | 8.80 | 3.08 | ||||||||||||||||||
| 4.48 |
211 | 9.44 | 4.48 | 4 | 9.44 | 4.48 | ||||||||||||||||||
| 7.40 | 587 | 9.86 | 7.40 | 2 | 9.96 | 7.40 | ||||||||||||||||||
| 10,937 | 6.07 | 1.55 | 6,893 | 4.52 | 0.45 | |||||||||||||||||||
Stock-based compensation expense included in the Company’s cost of revenue and operating expenses that the Company recorded within the accompanying consolidated statements of income are as follows (in thousands):
| Year Ended December 31, | ||||||||||||
| 2008 | 2009 | 2010 | ||||||||||
| Total cost of revenue |
$ | 308 | $ | 332 | $ | 523 | ||||||
| Research and development |
264 | 280 | 331 | |||||||||
| Sales and marketing |
400 | 461 | 694 | |||||||||
| General and administrative |
478 | 563 | 958 | |||||||||
| Total stock-based compensation expense |
1,450 | 1,636 | 2,506 | |||||||||
| Recognized tax benefit |
278 | 442 | 742 | |||||||||
There was approximately $5.1 million of total unrecognized compensation expense related to non-vested stock-based compensation arrangements granted under all equity compensation plans as of December 31, 2010, respectively. The Company expects to recognize that cost over a weighted-average period of approximately 1.76 years.
F-25
Table of Contents
RESPONSYS, INC.
Notes to Consolidated Financial Statements (Continued)
| 9. | COMMON STOCK (Continued) |
Determining Fair Value of Stock-based Compensation—The Company estimates the fair values of stock options using the Black-Scholes option-pricing model on the date of grant. Assumptions used in the Black-Scholes valuation model were as follows:
| Year Ended December 31, | ||||||||||||
| 2008 | 2009 | 2010 | ||||||||||
| Dividend yield(1) |
— | % | — | % | — | % | ||||||
| Risk-free rate(2) |
2.94 - 3.48 | % | 2.94 - 3.48 | % | 2.12 - 2.52 | % | ||||||
| Expected volatility(3) |
48.89 - 56.02 | % | 48.89 - 50.94 | % | 50.00 - 51.02 | % | ||||||
| Expected term—in years(4) |
6.06 - 8.00 | 3.77 - 6.06 | 6.06 | |||||||||
| (1) | The Company has not issued dividends to date and does not anticipate issuing dividends. |
| (2) | The risk-free interest rate is based on the implied yield currently available on U.S. Treasury zero coupon issues with an equivalent remaining term. |
| (3) | The Company estimated volatility for option grants by evaluating the average historical volatility of its peer group for the period immediately preceding the option grant for a term that is approximately equal to the options’ expected life. |
| (4) | The expected term of the Company’s option plans represents the period that its stock-based awards are expected to be outstanding. The Company has elected to use the simplified method described in SAB No. 107 to compute the expected term. The Company’s stock plan provides for a 10-year term to expiration. |
As required by FASB ASC No. 718-20, the Company is required to estimate potential forfeitures for stock grants and adjust stock-based compensation expense accordingly. The estimate of potential forfeitures will be adjusted over the requisite service period to the extent that actual forfeitures differ, or are expected to differ, from such estimates. Changes in estimated forfeitures will be recognized in the period of change and will also impact the amount of stock-based compensation expense to be recognized in future periods.
Performance-based Awards—In fiscal year 2008, the Company issued options to purchase 2,566,076 shares of common stock under the 1999 Stock Plan to executives. The shares were to vest over a service period but such vesting was to be accelerated in the event of an initial public offering. The Company used a Black-Scholes model to value the awards and determined that the grant-date fair value of these awards was $1.76 per share.
On July 22, 2009, the Company approved an exchange of the outstanding options granted to its executives in fiscal year 2008. The exchange altered and extended the vesting term of the options and modified the performance criteria required for the options to become fully vested. The new option grants vest over a 119-month service period, or earlier upon achievement of a revenue milestone or a change in control of the Company. The Company accounted for the change in terms as a stock option modification, which requires the unrecognized stock compensation expense associated with the previous grant to be added to the incremental compensation cost of the new grants. The incremental compensation cost is equal to the difference between the fair value of the modified stock options on the date of modification and their fair values immediately prior to modification. The total amount is then recognized over the remaining service period. The Company used a Black-Scholes model to value the awards for the purpose of calculating the incremental fair value. The total fair value of the modified stock options increased by $0.2 million due to the change in terms. The remaining incremental fair value will be recognized over the expected vesting period of the options, which is approximately 1.16 years as of December 31, 2010. Stock-based compensation expenses related to performance-based awards was $0.7 million, $0.9 million and $1.7 million for the years ended December 31, 2008, 2009 and 2010, respectively.
F-26
Table of Contents
RESPONSYS, INC.
Notes to Consolidated Financial Statements (Continued)
| 10. | PREFERRED STOCK |
As of December 31, 2009 and 2010 convertible preferred stock consisted of the following (in thousands, except per share amounts):
| Issuance Date |
Issue Price per Share |
Shares Authorized |
Shares Outstanding |
Carrying Value |
Liquidation Preference |
|||||||||||||||||
| Series A |
December 16, 1998 and March 31, 1999 |
$ | 3.07 | 2,204 | 2,071 | $ | 7,805 | $ | 2,241 | |||||||||||||
| Series B |
January 13, 2000 |
16.32 | 1,275 | 1,225 | 19,963 | 7,055 | ||||||||||||||||
| Series C |
March 29, 2001 and April 20, 2001 |
6.36 | 4,250 | 4,078 | 26,018 | 9,149 | ||||||||||||||||
| Series D |
January 11, 2002 |
6.36 | 1,000 | 693 | 1,054 | 1,555 | ||||||||||||||||
| Series E |
January 6, 2003 and February 25, 2003 |
0.25 | 30,000 | 22,091 | 7,188 | 5,476 | ||||||||||||||||
| 38,729 | 30,159 | $ | 62,028 | $ | 25,476 | |||||||||||||||||
Significant rights and preferences of the above convertible preferred stock are as follows:
Conversion—Each share of Series A, B, C, D and E convertible preferred stock is, at the option of the holder, convertible into such number of fully paid and nonassessable shares of common stock as is determined by dividing the applicable original issuance price ($3.068, $16.32, $6.36, $6.36, and $0.24788, respectively) by the applicable conversion price in effect on the date the certificate is surrendered for conversion. The initial conversion price of the Series A, B, C, D, and E convertible preferred stock is their original issuance price, subject to appropriate adjustments for common stock splits, stock dividends, and other similar transactions. The outstanding shares of preferred stock automatically convert into common stock on the closing of an underwritten public offering of common stock under the Securities Act of 1933, in which the Company receives at least $10 million in gross proceeds and the offering price is at least $4.20 per common share. In addition, under certain circumstances, convertible preferred stock will be converted to common stock if the holders of the convertible preferred stock fail to invest their pro rata share in any mandatory stock offering.
Dividends—Series E convertible preferred stockholders are entitled to noncumulative dividends of $0.0196 per share, payable prior and in preference to any dividends on any other shares of the Company’s convertible preferred and common stock. Holders of Series A, B, C and D convertible preferred stock are entitled to receive noncumulative dividends at the annual rate of $0.224, $1.304, $0.508, and $0.508 per share of Series A, B, C and D convertible preferred stock, respectively, payable prior and in preference to any dividends on any shares of the Company’s common stock. Dividends will only be paid out of legally available assets when, as, and if declared by the board of directors. No dividends have been declared as of December 31, 2010.
Liquidation Preferences—In the event of a liquidation, either voluntary or involuntary, as defined, the holders of Series E convertible preferred stock are entitled to receive, prior and in preference to any distribution of the proceeds of such liquidation event to the holders of the other series of convertible preferred stock or the common stock, an amount per share equal to $0.24788 per share, plus any declared but unpaid dividends. After the distribution to Series E convertible preferred stock, the holders of Series A, B, C and D convertible preferred stock are entitled to receive an aggregate of up to $20 million. This amount is to be distributed among the holders of Series A, B, C and D convertible preferred stockholders on a pro rata equal-priority basis up to the original issue price of each series. Thereafter, any remaining proceeds shall be distributed on a pro rata basis among the holders of the common stock and of Series E convertible preferred stock until holders of Series E convertible preferred stock received a total of $0.49576 per share, including amounts paid pursuant to the prior preference. Thereafter, any remaining assets and funds shall be distributed on a pro rata basis among holders of the common stock and Series C convertible preferred stock until holders of Series C convertible preferred stock receive a total
F-27
Table of Contents
RESPONSYS, INC.
Notes to Consolidated Financial Statements (Continued)
| 10. | PREFERRED STOCK (Continued) |
of $4.32 per share, including amounts paid pursuant to the prior preference. Thereafter, any remaining assets and funds shall be distributed on a pro rata basis among the holders of common stock.
Voting—Each holder of Series A, B, C, D and E convertible preferred stock is entitled to the number of votes equal to the number of shares of common stock into which such preferred stock can be converted on the record date and have voting rights and powers equal to the voting rights and powers of common stock voting together as a single class.
Preferred Stock Warrants—In fiscal year 2000 and 2001, the Company issued fully-vested warrants to purchase 19,841 and 13,750 shares of Series B convertible preferred stock. The warrants were immediately exercisable, but they expired unexercised in November 2007 and January 2008, respectively.
As of December 31, 2010, 28,302 shares of Series C convertible preferred stock were subject to an outstanding warrant. The warrant was immediately exercisable at $6.36 per share and expires in May 2011.
In fiscal year 2003, the Company issued fully-vested warrants to purchase 800,632 share of Series E convertible preferred stock at $0.24788 per share in connection with a secured borrowing agreement. The fair value of the warrants at the date of grant was valued at $0.2 million and was amortized to interest expense over the life of the financing agreement. The warrants were immediately exercisable and allowed for net exercise. The warrants were net exercised in April 2009 and consequently 725,457 shares of Series E convertible preferred stock were issued.
In conjunction with the adoption of ASC 815-40, the initial fair value of $0.2 million was reclassified from equity to a current liability and a cumulative effect adjustment of $1.8 million was recorded to retained earnings for the change in the fair value of the warrants. From adoption through the date of exercise, the fair value of the warrants was remeasured with the $0.2 million fair value increase recognized in other income (loss) in the consolidated financial statements.
| 11. | INCOME TAXES |
The domestic and foreign components of income before income taxes were as follows (in thousands):
| December 31, | ||||||||||||
| 2008 | 2009 | 2010 | ||||||||||
| Income before income taxes |
||||||||||||
| Domestic |
$ | 2,932 | $ | 9,754 | $ | 14,375 | ||||||
| Foreign |
(342 | ) | 195 | 278 | ||||||||
| Total income before income taxes |
$ | 2,590 | $ | 9,949 | $ | 14,653 | ||||||
The Company has not provided U.S. income tax on certain foreign earnings that are deemed to be indefinitely invested outside of the United States. As of December 31, 2010, the amount of accumulated earnings from the Company’s foreign subsidiary was approximately $1.1 million.
F-28
Table of Contents
RESPONSYS, INC.
Notes to Consolidated Financial Statements (Continued)
| 11. | INCOME TAXES (Continued) |
The components of the benefit (provision) for income taxes for the year ended December 31, 2008, 2009 and 2010 were as follows (in thousands):
| December 31, | ||||||||||||
| 2008 | 2009 | 2010 | ||||||||||
| Current provision: |
||||||||||||
| Federal |
$ | (730 | ) | $ | (1,010 | ) | $ | (1,637 | ) | |||
| State |
(174 | ) | (741 | ) | (573 | ) | ||||||
| Foreign |
112 | (81 | ) | (47 | ) | |||||||
| Total current provision |
(792 | ) | (1,832 | ) | (2,257 | ) | ||||||
| Deferred benefit (provision): |
||||||||||||
| Federal |
16,814 | (2,249 | ) | (3,453 | ) | |||||||
| State |
1,835 | 18 | (111 | ) | ||||||||
| Total deferred benefit (provision) |
18,649 | (2,231 | ) | (3,564 | ) | |||||||
| Total benefit (provision) for income taxes |
$ | 17,857 | $ | (4,063 | ) | $ | (5,821 | ) | ||||
The Company is entitled to a deduction for federal and state tax purposes with respect to employees’ stock option activity. The net reduction in taxes otherwise payable in excess of any amount credited to income tax benefit has been reflected as an adjustment to additional paid-in capital. The benefit arising from employee stock option activity that resulted in an adjustment to additional paid-in capital was approximately $0.6 million, $0.8 million and $1.4 million for the years ended December 31, 2008, 2009 and 2010, respectively.
The provision for income taxes differs from the amount which would result by applying the applicable federal and state income tax rate to income before income taxes for the years ended December 31, 2008, 2009 and 2010. The reconciliation of the provision computed at the federal statutory rate to the Company’s benefit (provision) for income taxes is as follows (in thousands):
| December 31, | ||||||||||||
| 2008 | 2009 | 2010 | ||||||||||
| Provision computed at federal statutory rate |
$ | (881 | ) | $ | (3,383 | ) | $ | (4,982 | ) | |||
| State tax provision — net of federal benefit |
(597 | ) | (477 | ) | (738 | ) | ||||||
| Research and development credits |
(357 | ) | — | 153 | ||||||||
| Stock-based compensation |
(245 | ) | (168 | ) | (182 | ) | ||||||
| Foreign income taxed at different rate |
9 | (15 | ) | 38 | ||||||||
| Valuation allowance |
20,017 | — | — | |||||||||
| Other |
(89 | ) | (20 | ) | (110 | ) | ||||||
| Benefit (provision) for income taxes |
$ | 17,857 | $ | (4,063 | ) | $ | (5,821 | ) | ||||
F-29
Table of Contents
RESPONSYS, INC.
Notes to Consolidated Financial Statements (Continued)
| 11. | INCOME TAXES (Continued) |
The components of the net deferred income tax assets as of December 31, 2009 and 2010 were as follows (in thousands):
| December 31, | ||||||||
| 2009 | 2010 | |||||||
| Deferred tax assets |
||||||||
| Tax credit carry-forwards |
$ | 721 | $ | 799 | ||||
| Other reserves and accruals |
3,046 | 2,048 | ||||||
| Net operating losses |
12,853 | 10,497 | ||||||
| Stock compensation |
720 | 1,437 | ||||||
| Total deferred tax assets |
17,340 | 14,781 | ||||||
| Deferred tax liability |
||||||||
| Depreciation and amortization |
(1,297 | ) | (2,303 | ) | ||||
| Net deferred tax asset |
$ | 16,043 | $ | 12,478 | ||||
In assessing the realizability of deferred tax assets, management considers whether it is more likely than not that some portion or all of the deferred tax assets will not be realized. In the event that the Company determines, based on available evidence and management judgment, that all or part of the net deferred tax assets will not be realized in the future, the Company would record a valuation allowance in the period the determination is made. The Company recorded a valuation allowance against all deferred tax assets through 2007. In 2008, the Company determined it was more likely than not that the deferred tax assets would be realized and the valuation allowance was adjusted. The Company applied the guidance of FAS 141 in adjusting the valuation allowance in 2008. A portion of the deferred tax assets relating to net operating losses pertain to acquired net operating loss carryforwards of approximately $2.5 million. When recognized, the tax benefit of these loss carryforwards is accounted for as a credit to reduce goodwill or acquired intangibles, if remaining, rather than a reduction of income tax expense. Benefit of the available portion of these losses was recorded as income tax benefit in 2008 as no basis remained in goodwill or intangibles from the acquisition. As of December 31, 2009 and 2010, the Company did not record a valuation allowance.
As of December 31, 2010, the Company had federal and state net operating loss carryforwards for financial reporting purpose of approximately $25.2 million and $22.9 million, respectively. The net operating loss carryforwards will expire beginning in 2021 and 2015, respectively, if not utilized. The Company has federal research tax credit carryforwards of approximately $0.8 million that will expire beginning in 2012. The Company also had federal AMT tax credit carryforwards of approximately $0.6 million that have no expiration date. Although the Company files U.S. federal, U.S. state and foreign tax returns, its major tax jurisdiction is the U.S.
If a future change in ownership of the Company exceeds specified limits, existing loss and credit carryforwards may become restricted as to their use. Such restrictions would lapse over a period of time determined by the relationship between the amount of the loss carryforwards and the valuation of the Company at the time of the ownership change. Any ownership change could significantly limit the Company’s ability to utilize its deferred tax assets.
On January 1, 2007, the Company adopted ASC Topic 740—Income Taxes (“ASC 740”) FASB ASC 740, Income Taxes—an interpretation of FASB Statement No. 109 (“FIN 48”). Due to net operating loss and research credit carryforwards, substantially all of the Company’s tax years, from 1998 through 2010, remain open to U.S.
F-30
Table of Contents
RESPONSYS, INC.
Notes to Consolidated Financial Statements (Continued)
| 11. | INCOME TAXES (Continued) |
federal and state tax examinations. The Company classifies interest and penalties recognized pursuant to FIN 48 as part of income tax expense. No interest or penalties related to unrecognized tax benefits have been accrued for the year ended December 31, 2010. The Company anticipates its unrecognized tax benefits will increase in the next 12 months.
The aggregate changes in the balance of gross unrecognized tax benefits were as follows (in thousands):
| December 31, | ||||||||||||
| 2008 | 2009 | 2010 | ||||||||||
| Balance, beginning of year |
$ | 632 | $ | 957 | $ | 1,381 | ||||||
| Additions based on tax positions related to the current year |
325 | 424 | 111 | |||||||||
| Additions for tax positions related to prior years |
— | — | — | |||||||||
| Reductions for tax positions related to prior years |
— | — | — | |||||||||
| Balance, end of year |
$ | 957 | $ | 1,381 | $ | 1,492 | ||||||
In the event that any unrecognized tax benefits are recognized, the effective tax rate will be affected. Unrecognized tax benefits in the amount of $0.8 million, $1.2 million and $1.3 million for the years ended December 31, 2008, 2009 and 2010, respectively, would impact the effective rate, if recognized.
| 12. | RETIREMENT PLANS |
The Company has a 401(k) retirement and savings plan (the “401(k) Plan”) covering all employees who satisfy certain eligibility requirements. The 401(k) Plan allows each participant to contribute up to an amount not to exceed an annual statutory maximum. The Company made matching contributions in the amount of $0.1 million, $0.3 million and $0.5 million for the years ended December 31, 2008, 2009 and 2010, respectively.
| 13. | FAIR VALUE MEASUREMENTS |
The assets measured at fair value on a recurring basis and the input categories associated with those assets as of December 31, 2009 and 2010 were as follows (in thousands):
| December 31, 2009 | ||||||||||||||||
| Fair Value |
Quoted Prices in Active Markets for Identical Assets (Level 1) |
Significant Other Observable Inputs (Level 2) |
Significant Other Unobservable Inputs (Level 3) |
|||||||||||||
| Assets: |
||||||||||||||||
| Money market funds |
$ | 13,277 | $ | 13,277 | $ | — | $ | — | ||||||||
F-31
Table of Contents
RESPONSYS, INC.
Notes to Consolidated Financial Statements (Continued)
| 13. | FAIR VALUE MEASUREMENTS (Continued) |
| December 31, 2010 | ||||||||||||||||
| Fair Value |
Quoted Prices in Active Markets for Identical Assets (Level 1) |
Significant Other Observable Inputs (Level 2) |
Significant Other Unobservable Inputs (Level 3) |
|||||||||||||
| Assets: |
||||||||||||||||
| Money market funds |
$ | 9,281 | $ | 9,281 | $ | — | $ | — | ||||||||
| Call options |
$ | 2,208 | $ | — | $ | — | $ | 2,208 | ||||||||
| Liabilities |
||||||||||||||||
| Put options |
$ | 523 | $ | — | $ | — | $ | 523 | ||||||||
The roll-forward of the fair value of the preferred stock warrant liability categorized with Level 3 inputs as of December 31, 2009 was as follows (in thousands):
| December 31, 2009 |
||||
| Preferred stock warrant liability—beginning of period |
$ | — | ||
| Adoption of Accounting Standards Codification No. 815-40 |
||||
| Derivative and Hedging—Contracts in Entity’s Own Equity |
1,941 | |||
| Increase in value |
169 | |||
| Exercise of preferred stock warrants |
(2,110 | ) | ||
| Preferred stock warrant liability—end of period |
$ | — | ||
The roll-forward of the fair value of the Call Options and Put Options categorized with Level 3 inputs as of December 31, 2010 was as follows (in thousands):
| Call Option | Put Option | |||||||
| Beginning of period |
$ | — | $ | — | ||||
| Acquisition date |
1,728 | 1,564 | ||||||
| Effect of foreign currency exchange rate |
268 | 264 | ||||||
| Decrease in value |
212 | (1,305 | ) | |||||
| End of period |
$ | 2,208 | $ | 523 | ||||
The estimated fair value of the Call Option and Put Option is based on the Monte Carlo simulation model. The model takes into consideration the (1) estimated fair value of Eservices, which was estimated using the discounted cash flow method, the guideline company method and mergers and acquisitions method and (2) the estimated strike price for the Call and Put Option based on Eservices’ revenue for the years ended June 30, 2011 and December 31, 2011, respectively. The revenues were modeled using the Monte Carlo simulation.
| 14. | RELATED PARTY TRANSACTIONS |
Equity Transactions
On December 15, 2010, the Company repurchased 250,006 shares of common stock from its Chief Executive Officer, at a purchase price equal to $7.40 per share, which was the most recent fair value of its
F-32
Table of Contents
RESPONSYS, INC.
Notes to Consolidated Financial Statements (Continued)
| 14. | RELATED PARTY TRANSACTIONS (Continued) |
common stock, as determined by its board of directors. The Company repurchased the shares pursuant to its exercise of its right of first refusal set forth in the 1999 Stock Plan agreement under which the shares were originally issued.
On December 16, 2010, the Company repurchased 125,000 shares of common stock from its Chief Customer Officer, at a purchase price equal to $7.40 per share, which was the most recent fair value of its common stock, as determined by its board of directors. The Company repurchased the shares pursuant to its exercise of its right of first refusal set forth in the 1999 Stock Plan agreement under which the shares were originally issued.
On December 15, 2010, the board of directors approved the 2011 Equity Incentive Plan, subject to stockholder approval, to become effective at the closing of the offering. The Company reserved 10,000,000 shares of its common stock for issuance under its 2011 Equity Incentive Plan plus (i) any shares reserved but not issued or subject to outstanding awards under its 1999 Stock Plan, (ii) shares subject to outstanding awards under the 1999 Stock Plan which cease to be subject to such awards, and (iii) shares issued under the 1999 Stock Plan which are forfeited or repurchased at their original issue price. The number of shares reserved for issuance under the 2011 Equity Incentive Plan will increase automatically on the first day of January of each year from 2012 through 2015 by a number of shares equal to the lesser of (i) 5% of the total outstanding shares of common stock as of the immediately preceding December 31st or (ii) a number of shares determined by the board of directors.
| 15. | SUBSEQUENT EVENTS (UNAUDITED) |
Eservices Acquisition
On January 3, 2011, the Company completed the acquisition (the “Acquisition”) of the remaining equity interests of Eservices. The Acquisition was consummated pursuant to the Share Sale and Shareholders Agreement dated as of July 1, 2010, as amended January 3rd, 2011 (the “Agreement”). The Agreement accelerated the purchase of the remaining 50% of the common shares of Eservices for $8.3 million (AUD $8.0 million), which consisted of $7.1 million payable in cash and 148,648 shares of the Company’s common stock valued at approximately $1.2 million.
Pursuant to the original Agreement the Company had the option to purchase and could also have been obligated to purchase an additional 16.67% and the remaining 33.33% of Eservices in July 2011 and December 2011, respectively. Pursuant to the Agreement the Call and Put Options were cancelled in January 2011.
F-33
Table of Contents
RESPONSYS, INC.
Notes to Consolidated Financial Statements (Continued)
| 15. | SUBSEQUENT EVENTS (UNAUDITED) (Continued) |
The preliminary allocation of the aggregate purchase price, which is based on a preliminary valuation report and therefore subject to change, is as follows (in thousands):
| Cash and cash equivalents |
$ | 900 | ||
| Trade receivables |
2,083 | |||
| Property and equipment |
515 | |||
| Other tangible assets |
326 | |||
| Deferred tax liabilities |
(1,535 | ) | ||
| Deferred revenue |
(160 | ) | ||
| Other liabilities assumed |
(1,236 | ) | ||
| Net tangible assets |
893 | |||
| Intangible assets |
||||
| Customer list (two and a half years estimated life) |
4,929 | |||
| Trade name (one and a half years estimated life) |
82 | |||
| Software (half year estimate life) |
30 | |||
| Goodwill |
13,021 | |||
| Total intangible assets |
18,062 | |||
| Consideration given |
$ | 18,955 | ||
The following unaudited pro forma condensed combined financial information gives effect to the acquisition of Eservices as of January 1, 2009. This unaudited condensed combined financial information is based upon the historical financial statements of the Company and Eservices for the respective twelve month periods, which for Eservices have been derived by taking the operating results for the fiscal year ended June 30, 2009 and 2010, adding subsequent interim period results to the fiscal year information and deducting comparable preceding year interim period results and is based on the assumptions and estimates set forth below. The unaudited pro forma information is not intended to represent or be indicative of the results of operations of the Company that would have been reported had the Acquisition occurred as of the beginning of the periods presented and should not be taken as representative of the future consolidated results of operations of the combined companies.
The unaudited pro forma condensed combined financial information for the years ended December 31, 2009 and 2010 gives effect to the acquisition as if the acquisition had occurred at the beginning of the fiscal year ended December 31, 2009 (in thousands, except per share amounts).
| Year Ended December 31, |
||||||||
| 2009 | 2010 | |||||||
| Revenue |
$ | 74,566 | $ | 103,372 | ||||
| Operating income |
10,043 | 13,237 | ||||||
| Income before income taxes |
10,131 | 14,819 | ||||||
| Net income |
$ | 5,960 | $ | 8,934 | ||||
Under ASC 805-10, acquisition-related costs are not included as a component of consideration transferred but are required to be expensed as incurred. These costs of $0.4 million are not presented in the pro forma condensed combined statement of income because they will not have a continuing impact on the combined results.
F-34
Table of Contents

Report of Independent Auditors
To the Members of Responsys Pty Ltd (formerly Eservices Group Pty Ltd)
We have audited the accompanying consolidated balance sheet of Responsys Pty Ltd (formerly Eservices Group Pty Ltd) (the “Company”) as of June 30, 2010, and the related consolidated statements of comprehensive income, changes in equity, and cash flows for the year then ended. The financial statements are the responsibility of the Company’s management. Our responsibility is to express an opinion on the financial statements based on our audit.
We conducted our audit in accordance with auditing standards generally accepted in the United States. Those standards require that we plan and perform the audit to obtain reasonable assurance about whether the financial statements are free of material misstatement. We were not engaged to perform an audit of the Company’s internal control over financial reporting. Our audit included consideration of internal control over financial reporting as a basis for designing audit procedures that are appropriate in the circumstances, but not for the purpose of expressing an opinion on the effectiveness of the Company’s internal control over financial reporting. Accordingly, we express no such opinion. An audit also includes examining, on a test basis, evidence supporting the amounts and disclosures in the financial statements, assessing the accounting principles used and significant estimates made by management, and evaluating the overall financial statement presentation. We believe that our audit provides a reasonable basis for our opinion.
IAS 1 requires that financial statements be presented with comparative financial information. These consolidated financial statements have been prepared solely for the purpose of meeting the requirements of Rule 3-05 of Regulation S-X. Accordingly no comparative financial information is presented.
In our opinion, except for the omission of the comparative financial statements as discussed in the preceding paragraph, the consolidated financial statements referred to above present fairly, in all material respects, the consolidated financial position of Responsys Pty Ltd (formerly Eservices Group Pty Ltd) at June 30, 2010 and the consolidated results of its operations and its cash flows for the year then ended in conformity with International Financial Reporting Standards as issued by the International Accounting Standards Board.
/s/ Ernst & Young
Ernst & Young
Melbourne, Australia
March 11, 2011
Liability limited by a scheme approved
under Professional Standards Legislation
F-35
Table of Contents
Responsys Pty Ltd (Formerly Eservices Group Pty Ltd)
Consolidated Balance Sheet as at 30 June 2010
| Note | 2010 A$ |
|||||||
| ASSETS |
||||||||
| Current Assets |
||||||||
| Cash and cash equivalents |
6 | 2,088,247 | ||||||
| Trade and other receivables |
7 | 2,399,536 | ||||||
| Intangibles |
10 | 103,828 | ||||||
| Held to maturity investments |
8 | 74,478 | ||||||
| Total Current Assets |
4,666,089 | |||||||
| Non-Current Assets |
||||||||
| Deferred tax assets |
5 | 185,828 | ||||||
| Property, plant and equipment |
9 | 586,141 | ||||||
| Goodwill |
10 | 488,766 | ||||||
| Total Non-Current Assets |
1,260,735 | |||||||
| TOTAL ASSETS |
5,926,824 | |||||||
| LIABILITIES |
||||||||
| Current Liabilities |
||||||||
| Trade and other payables |
11 | 1,012,805 | ||||||
| Provisions |
12 | 2,196,869 | ||||||
| Income tax payable |
272,282 | |||||||
| Total Current Liabilities |
3,481,956 | |||||||
| Non-Current Liabilities |
||||||||
| Provisions |
13 | 81,053 | ||||||
| Total Non-Current Liabilities |
81,053 | |||||||
| TOTAL LIABILITIES |
3,563,009 | |||||||
| NET ASSETS |
2,363,815 | |||||||
| EQUITY |
||||||||
| Issued capital |
14 | 100,000 | ||||||
| Retained earnings |
15 | 2,263,815 | ||||||
| Parent interests |
2,363,815 | |||||||
| Non-controlling interests |
— | |||||||
| TOTAL EQUITY |
2,363,815 | |||||||
The above consolidated balance sheet should be read in conjunction with the accompanying notes.
F-36
Table of Contents
Responsys Pty Ltd (Formerly Eservices Group Pty Ltd)
Consolidated Statement of Comprehensive Income
for the Year Ended 30 June 2010
| Note | 2010 A$ |
|||||||
| Continuing Operations |
||||||||
| Fees |
4 | 10,709,612 | ||||||
| Other revenue |
4 | 21,903 | ||||||
| Revenue |
10,731,515 | |||||||
| Staff expenses |
(5,996,437 | ) | ||||||
| Occupancy costs |
(311,262 | ) | ||||||
| Communications infrastructure |
(418,527 | ) | ||||||
| Depreciation |
4 | (371,907 | ) | |||||
| Travel & entertainment |
(382,522 | ) | ||||||
| Communications |
(163,712 | ) | ||||||
| Impairment of goodwill |
11 | (250,000 | ) | |||||
| Other |
4 | (432,028 | ) | |||||
| Profit from continuing operations before income tax |
2,405,120 | |||||||
| Income tax expense |
5 | (774,351 | ) | |||||
| Profit from continuing operations after income tax |
1,630,769 | |||||||
| Profit from discontinued operations |
||||||||
| Profit from discontinued operations after income tax |
22 | 185,482 | ||||||
| Net Profit |
1,816,251 | |||||||
| Other comprehensive income |
— | |||||||
| Total comprehensive income |
1,816,251 | |||||||
| Net profit attributable to: |
||||||||
| Non-controlling interest |
30,477 | |||||||
| Owners of the parent |
1,785,774 | |||||||
| 1,816,251 | ||||||||
| Total comprehensive income is attributable to: |
||||||||
| Non-controlling interest |
30,477 | |||||||
| Owners of the parent |
1,785,774 | |||||||
| 1,816,251 | ||||||||
The above consolidated statement of comprehensive income should be read in conjunction with the accompanying notes.
F-37
Table of Contents
Responsys Pty Ltd (Formerly Eservices Group Pty Ltd)
Consolidated Statement of Changes in Equity
for the Year Ended 30 June 2010
| Issued capital A$ |
Retained earnings A$ |
Parent interests A$ |
Non- controlling interest A$ |
Total | ||||||||||||||||
| At 1 July 2009 |
100,000 | 3,023,596 | 3,123,596 | 5,862 | 3,129,458 | |||||||||||||||
| Net profit |
— | 1,785,774 | 1,785,774 | 30,477 | 1,816,251 | |||||||||||||||
| Other comprehensive income |
— | — | — | — | — | |||||||||||||||
| Total comprehensive income |
— | 1,785,774 | 1,785,774 | 30,477 | 1,816,251 | |||||||||||||||
| Transactions with owners in their capacity as owners |
||||||||||||||||||||
| Dividends paid or declared |
— | (2,545,555 | ) | (2,545,555 | ) | — | (2,545,555 | ) | ||||||||||||
| Sale of subsidiary |
— | — | — | (36,339 | ) | (36,339 | ) | |||||||||||||
| At 30 June 2010 |
100,000 | 2,263,815 | 2,363,815 | — | 2,363,815 | |||||||||||||||
The above consolidated statement of changes in equity should be read in conjunction with the accompanying notes.
F-38
Table of Contents
Responsys Pty Ltd (Formerly Eservices Group Pty Ltd)
Consolidated Statement of Cash flows
for the Year Ended 30 June 2010
| Note | 2010 A$ |
|||||||
| Cash flows from operating activities |
||||||||
| Receipts from customers (inclusive of GST) |
14,351,754 | |||||||
| Payments to suppliers and employees (inclusive of GST) |
(11,302,371 | ) | ||||||
| Interest received |
20,785 | |||||||
| Income tax paid |
(1,064,822 | ) | ||||||
| Net cash flows from operating activities |
6 | 2,005,346 | ||||||
| Cash flows from investing activities |
||||||||
| Purchase of property, plant and equipment |
(576,996 | ) | ||||||
| Proceeds from sale of property, plant and equipment |
3,941 | |||||||
| Net proceeds from sale of subsidiary |
(107,346 | ) | ||||||
| Net cash flows used in investing activities |
(680,401 | ) | ||||||
| Cash flows from financing activities |
||||||||
| Repayment of borrowings |
(400,000 | ) | ||||||
| Dividends paid |
(700,000 | ) | ||||||
| Net cash flows used in financing activities |
(1,100,000 | ) | ||||||
| Net increase in cash and cash equivalents |
224,945 | |||||||
| Cash and cash equivalents at beginning of year |
1,863,302 | |||||||
| Cash and cash equivalents at end of year |
6 | 2,088,247 | ||||||
The above consolidated statement of cash flows should be read in conjunction with the accompanying notes
F-39
Table of Contents
Responsys Pty Ltd (Formerly Eservices Group Pty Ltd)
Notes to the Consolidated Financial Statements
for the Year Ended 30 June 2010
Note 1. Summary of significant accounting policies
(a) Corporate information
The consolidated financial statements of Responsys Pty Ltd (The “Group” or “Company”) for the year ended 30 June 2010 was authorised for issue in accordance with a resolution of the directors on 18 February 2011. The principal activities during the year of the entities within the consolidated entity were email software and services, website design and development, and advertising services.
(b) Basis of preparation
The consolidated financial report has been prepared on a historical cost basis.
The financial report is presented in Australian dollars (A$) and all values are rounded to the nearest dollar unless otherwise stated.
(c) Compliance with IFRS
The consolidated financial statements of the Group have been prepared in accordance with International Financial Reporting Standards (IFRS) as issued by the International Accounting Standards Board (IASB).
(d) New accounting standards and interpretations
(i) Changes in accounting policy disclosures
The accounting policies adopted are consistent with those of the previous financial year except as follows:
The Group has adopted the following new and amended IFRS and International Financial Reporting Interpretations Committee (IFRIC) interpretations as of 1 July 2009.
- International Accounting Standard (IAS) 1 Presentation of financial statements (revised), effective 1 July 2009
- IFRS 3 Business combinations (revised) and IAS 27 Consolidated and separate financial statements (amended), effective 1 July 2009 including consequential amendments to IFRS 7, IAS 21, IAS 28, IAS 31 and IAS 39
- IFRS 8 Operating segments effective 1 July 2009
Where the adoption of the Standard or Interpretation is deemed to have an impact on the financial statements or performance of the Group, its impact is described below:
IAS 1 Presentation of financial statements
The revised Standard separates owner and non-owner changes in equity. The statement of changes in equity includes only details of transactions with owners, with non-owner changes in equity presented in a reconciliation of each component of equity and included in the new statement of comprehensive income. The statement of comprehensive income presents all items of recognised income and expense, either in one single statement, or in two linked statements. The Group has elected to present one statement.
(d) New accounting standards and interpretations
(ii) Accounting standards and interpretations issued but not yet effective
Standards issued but not yet effective are outlined below. The Group is yet to fully determine the future impact of these standards.
F-40
Table of Contents
Responsys Pty Ltd (Formerly Eservices Group Pty Ltd)
Notes to the Consolidated Financial Statements (Continued)
for the Year Ended 30 June 2010
Note 1. Summary of significant accounting policies (continued)
IAS 24 Related Party Disclosures (Amendment)
The amended standard is effective for annual periods beginning on or after 1 January 2011. It clarified the definition of a related party to simplify the identification of such relationships and to eliminate inconsistencies in its application. The revised standard introduces a partial exemption of disclosure requirements for government related entities. The Group does not expect any impact on its financial position or performance. Early adoption is permitted for either the partial exemption for government-related entities or for the entire standard.
IFRS 9 Financial Instruments: Classification and Measurement
IFRS 9 as issued reflects the first phase of the IASBs work on the replacement of IAS 39 and applies to classification and measurement of financial assets as defined in IAS 39. The standard is effective for annual periods beginning on or after 1 January 2013. In subsequent phases, the IASB will address classification and measurement of financial liabilities, hedge accounting and derecognition. The completion of this project is expected in early 2011. The Group has not yet determined the impact of this standard.
Improvements to IFRSs (issued in May 2010)
The IASB issued Improvements to IFRSs, an omnibus of amendments to its IFRS standards. The amendments have not been adopted as they become effective for annual periods on or after either 1 July 2010 or 1 January 2011. The amendments listed below, are considered to have a reasonably possible impact on the Group, however the Group has not yet determined their impact.
- IFRS 7 Financial Instruments: Disclosures
- IAS 1 Presentation of Financial Statements
- IAS 27 Consolidated and Separate Financial Statements
(e) Basis of consolidation
The consolidated financial statements comprise the financial statements of Responsys Pty Ltd and its subsidiaries as at and for the year ended 30 June 2010.
(f) Cash and cash equivalents
Cash and cash equivalents in the balance sheet comprise cash at bank and in hand and short-term deposits with an original maturity of three months or less that are readily convertible to known amounts of cash and which are subject to an insignificant risk of changes in value.
For the purposes of the statement of cash flows, cash and cash equivalents consist of cash and cash equivalents as defined above, net of outstanding bank overdrafts. Cash flows relating to receipts from customers and payments to suppliers include those amounts paid and received whereby the Group has an agency relationship between its customers and third party service providers.
(g) Trade and other receivables
Trade receivables are recognised initially at fair value and subsequently measured at amortised cost using the effective interest method less an allowance for impairment.
An impairment provision is recognised when there is objective evidence that the group will not be able to collect the receivable. Bad debts that are known to be uncollectable are written off when identified.
F-41
Table of Contents
Responsys Pty Ltd (Formerly Eservices Group Pty Ltd)
Notes to the Consolidated Financial Statements (Continued)
for the Year Ended 30 June 2010
Note 1. Summary of significant accounting policies (continued)
(h) Held to maturity investments
Non-derivative financial assets with fixed or determinable payments and fixed maturity are classified as held-to-maturity when the Group has the positive intention and ability to hold to maturity.
(i) Property, plant and equipment
Property, plant and equipment is stated at historical cost less accumulated depreciation and any accumulated impairment losses.
Depreciation is calculated on a straight line basis over the estimated useful life of the specific assets as follows:
| Asset |
Life | |||
| Owned property, plant and equipment |
3 years | |||
| Leased property, plant and equipment |
3 years | |||
| Leasehold improvements |
3 years | |||
An item of property, plant and equipment is derecognised upon disposal or when no further future economic benefits are expected from its use or disposal.
Any gain or loss arising on derecognition of the asset (calculated as the difference between the net disposal proceeds and the carrying amount of the asset) are included in the statement of comprehensive income in the year the asset is derecognised.
(j) Leases
The determination of whether an arrangement is or contains a lease is based on the substance of the arrangement and requires an assessment of whether the fulfilment of the arrangement is dependent on the use of a specific asset or assets and the arrangement conveys a right to use the asset.
Operating Leases
Operating leases are not capitalised and, except as described below; rental payments are expensed in the period in which they are incurred. Operating lease incentives are recognised as a liability when received and subsequently reduced by allocating lease payments between rental expense and the liability. Gains or losses representing the difference between the selling price and fair value of the asset are deferred and amortised over the term of the lease. Lease incentives are recognised in the statement of comprehensive income as an integral part of the total lease expense.
(k) Goodwill and intangibles
Goodwill acquired in a business combination is initially measured at cost of the business combination being the excess of the consideration transferred over the fair value of the acquiree’s identifiable assets and liabilities assumed. Following initial recognition, goodwill is measured at cost less any accumulated impairment losses.
Impairment is determined by assessing the recoverable amount of the cash-generating unit to which the goodwill relates. When the recoverable amount of the cash-generating unit is less than the carrying amount, an impairment loss has to be recognised. Impairment losses recognised for goodwill are not subsequently reversed.
F-42
Table of Contents
Responsys Pty Ltd (Formerly Eservices Group Pty Ltd)
Notes to the Consolidated Financial Statements (Continued)
for the Year Ended 30 June 2010
Note 1. Summary of significant accounting policies (continued)
Intangible assets acquired in a business combination are initially measured at cost, which is its fair value as at the date of acquisition. Following initial recognition, intangible assets are carried at cost less any accumulated amortisation and any accumulated impairment losses. The useful lives of intangible assets are assessed to be either finite or indefinite. Intangible assets with finite lives are amortised over their useful life and tested for impairment whenever there is an indication that the intangible asset may be impaired. The amortisation period is reviewed at least annually and changes in the expected useful life are accounted for prospectively by changing the amortisation period or method, as appropriate, which is a change in accounting estimate. The amortisation expense on intangible assets with finite lives is recognised in profit or loss in the expense category consistent with the function of the intangible asset. Intangible assets with indefinite useful lives are tested for impairment annually either individually or at the cash-generating unit level consistent with the methodology outlined for goodwill above. Such intangibles are not amortised.
(l) Recoverable amounts of non-current assets
At each reporting date, the Company assesses whether there is any indication that an asset may be impaired. Where an indicator of impairment exists, the Company makes a formal estimate of recoverable amount. Where the carrying amount of an asset exceeded its recoverable amount the asset is considered impaired and is written down to its recoverable amount.
Recoverable amount is the greater of fair value less costs to sell and value in use. It is determined for an individual asset, unless the asset’s value in use cannot be estimated to be close to its fair value less costs to sell and it does not generate inflows that are largely independent of those from other assets or groups of assets, in which case, the recoverable amount is determined for the cash-generating unit to which the asset belongs.
In assessing value in use, the estimated future cash flows are discounted to their present value using a pre-tax discount rate that reflects current market conditions of the time value of money and the risks specific to the asset.
(m) Trade and other payables
Trade and other payables are carried at amortised cost due to their short term nature and are not discounted. They represent liabilities for goods and services provided to the Company prior to the end of the financial year that are unpaid and arise when the Company becomes obliged to make future payments in respect of the purchase of these goods and services. The amounts are unsecured and are usually paid within 30 days of recognition.
(n) Provisions
Provisions are recognised when the Company has a present obligation (legal or constructive) as a result of a past event, it is probable that an outflow of resources embodying economic benefits will be required to settle the obligation and a reliable estimate can be made of the amount of the obligation.
Provisions are measured at the present value of management’s best estimate of the expenditure required to settle the present obligation at the reporting date. If the effect of the time value of money is material, provisions are discounted using a current pre-tax rate that reflects the time value of money and the risks specific to the liability. The increase in the provision resulting from the passage of time is recognised in finance costs.
(o) Employee leave benefits
Provision is made for employee benefits accumulated as a result of employees rendering services up to the reporting date. These benefits include annual leave and long service leave.
F-43
Table of Contents
Responsys Pty Ltd (Formerly Eservices Group Pty Ltd)
Notes to the Consolidated Financial Statements (Continued)
for the Year Ended 30 June 2010
Note 1. Summary of significant accounting policies (continued)
i) Annual leave
Annual leave expected to be settled within 12 months of the reporting date is recognised in respect of employees’ services up to the reporting date. Annual leave balances are measured at the amount expected to be paid when the liabilities are settled.
ii) Long service leave
The liability for long service leave is recognised and measured as the present value of expected future payments to be made in respect of services provided by employees up to the reporting date. Consideration is given to expected future wage and salary levels, experience of employee departures, and periods of service. Expected future payments are discounted using market yields at the reporting date on national government bonds with terms to maturity and currencies that match, as closely as possible, the estimated future cash outflows.
No provision is made for non-vesting sick leave, as the anticipated pattern of future sick leave taken indicates that accumulated non-vesting leave will never be paid.
All on-costs, including payroll tax, workers compensation premiums and fringe benefits tax are included in the determination of provisions.
(p) Revenue recognition
Revenue is recognised and measured at the fair value of the consideration received or receivable to the extent that it is probable that the economic benefits will flow to the Company and the revenue can be reliably measured. The following specific recognition criteria must also be met before revenue is recognised.
(i) Rendering of services
Revenue is earned from email delivery including creative design of the email. Revenue is brought to account as income when billed to the client, which corresponds to the timing of the services provided. Client contracts determine the price per email that the client is required to pay based on email volume. Clients are also charged for the time in developing the creative element of the email as services are provided.
Web
Revenue is earned from creating and modifying websites and other internet related advertising mediums. Revenue is brought to account as income when billed to the client on a stage of completion basis. Head hour revenue is brought to account as income with specific reference to the stage of completion of the services to be provided.
Revenue billed in advance is deferred and recorded as unearned revenue.
(ii) Interest
Revenue is recognised as the interest accrues using the effective interest rate method. This is a method of calculating the amortised cost of a financial asset and allocating the interest income over the relevant period using the effective interest rate.
F-44
Table of Contents
Responsys Pty Ltd (Formerly Eservices Group Pty Ltd)
Notes to the Consolidated Financial Statements (Continued)
for the Year Ended 30 June 2010
Note 1. Summary of significant accounting policies (continued)
(q) Income tax
Current tax assets and liabilities for the current and prior periods are measured at the amount expected to be recovered from or paid to the taxation authorities based on the current period’s taxable income. The tax rates and tax laws used to compute the amount are those that are enacted or substantively enacted by the balance sheet date.
Deferred income tax is provided on all temporary differences at the balance sheet date between the tax bases of assets and liabilities and their carrying amounts for financial reporting purposes.
Deferred income tax liabilities are recognised for all temporary differences except:
| • | when the deferred income tax liability arises from the initial recognition of goodwill or of an asset or liability in a transaction that is not a business combination and that, at the time of the transaction, affects neither the accounting profit nor taxable profit or loss; or |
| • | when the taxable temporary difference is associated with investments in subsidiaries, associates or interests in joint ventures, and the timing of the reversal of the temporary difference can be controlled and it is probable that the temporary difference will not reverse in the foreseeable future. |
Deferred income tax assets are recognised for all deductible temporary differences, carry-forward of unused tax credits and unused tax losses, to the extent that it is probable that taxable profit will be available against which the deductible temporary differences and the carry-forward of unused tax credits and unused tax losses can be utilised, except:
| • | when the deferred income tax asset relating to the deductible temporary difference arises from the initial recognition of an asset or liability in a transaction that is not a business combination and, at the time of the transaction, affects neither the accounting profit nor taxable profit or loss; or |
| • | when the deductible temporary difference is associated with investments in subsidiaries, associates and interests in joint ventures, in which case a deferred tax asset is only recognised to the extent that it is probable that the temporary difference will reverse in the foreseeable future and taxable profit will be available against which the temporary difference can be utilised. |
The carrying amount of deferred income tax assets is reviewed at each balance sheet date and reduced to the extent that it is no longer probable that sufficient taxable profit will be available to allow all or part of the deferred income tax asset to be utilised.
Unrecognised deferred income tax assets are reassessed at each balance sheet date and are recognised to the extent that it has become probable that future taxable profit will allow the deferred tax asset to be recovered.
Deferred income tax assets and liabilities are measured at the tax rates that are expected to apply to the year when the asset is realised or the liability is settled, based on tax rates (and tax laws) that have been enacted or substantively enacted at the balance sheet date.
Deferred tax assets and deferred tax liabilities are offset only if a legally enforceable right exists to set off current tax assets against current tax liabilities and the deferred tax assets and liabilities relate to the same taxable entity and the same taxation authority.
F-45
Table of Contents
Responsys Pty Ltd (Formerly Eservices Group Pty Ltd)
Notes to the Consolidated Financial Statements (Continued)
for the Year Ended 30 June 2010
Note 1. Summary of significant accounting policies (continued)
(q) Income tax (continued)
Other taxes
Revenues, expenses and assets are recognised net of the amount of GST except:
| • | when the GST incurred on a purchase of goods and services is not recoverable from the taxation authority, in which case the GST is recognised as part of the cost of acquisition of the asset or as part of the expense item as applicable; or |
| • | receivable and payables, which are stated with the amount of GST included. |
The net amount of GST recoverable from, or payable to, the taxation authority is included as part of receivables or payables in the balance sheet.
Cash flows are included in the statement of cash flows on a gross basis and the GST component of cash flows arising from investing and financing activities, which is recoverable from, or payable to, the taxation authority is classified as part of operating cash flows.
Commitments and contingencies are disclosed net of the amount of GST recoverable from, or payable to, the taxation authority.
(r) Defined contribution superannuation plan
Contributions to the defined contribution superannuation plan maintained by the Company are expensed in the year they are paid or become payable.
Note 2. Financial risk management objectives and policies
The Group’s principal financial instruments comprise receivables, payables, cash and short-term deposits.
Risk exposures and responses
The Group manages its exposure to key financial risks, including interest rate risk, liquidity risk and credit risk. The objective is to support the delivery of the Group’s financial targets while protecting future financial security.
Interest rate risk
At balance date, the Group had the following financial assets exposed to Australian variable interest rate risk:
| 2010 | ||||
| Financial Assets |
A$ | |||
| Cash and cash equivalents |
2,088,247 | |||
| Held to maturity investments |
74,478 | |||
| Net Exposure |
2,162,725 | |||
F-46
Table of Contents
Responsys Pty Ltd (Formerly Eservices Group Pty Ltd)
Notes to the Consolidated Financial Statements (Continued)
for the Year Ended 30 June 2010
Note 2. Financial risk management objectives and policies (continued)
The following sensitivity analysis is based on the interest rate risk exposures in existence at the reporting date.
At 30 June 2010, if interest rates had moved, as illustrated in the table below, with all other variables held constant, post tax profit and other comprehensive income would have been affected as follows:
| Judgements of reasonably possible movements: |
Post tax profit
and Other comprehensive income higher/(lower) 2010 A$ |
|||
| +.5% (50 basis points) |
7,570 | |||
| -.5% (50 basis points) |
(7,570 | ) | ||
The movements in profit and other comprehensive income are due to higher/lower interest costs from variable rate cash balances.
Credit Risk
Credit risk arises from the financial assets of the Group, which comprise cash and cash equivalents, and trade and other receivables. The Group’s exposure to credit risk arises from potential default of the counterparty. Eservices has credit insurance cover where commercially practicable to limit exposure in the event of a default.
In addition, receivable balances are monitored on an ongoing basis.
There are no significant concentrations of credit risk within the Group.
Liquidity Risk
The table below reflects all receivables and contractual liabilities for settlement, repayments and interest resulting from recognised financial assets and liabilities as of 30 June 2010.
| 2010 |
0-1 year A$ |
|||
| Financial Assets |
||||
| Cash and cash equivalents |
2,088,247 | |||
| Trade and other receivables |
2,399,536 | |||
| Held to maturity investments |
74,478 | |||
| 4,562,261 | ||||
| Financial Liabilities |
||||
| Trade and other payables |
1,012,805 | |||
| 1,012,805 | ||||
| Net Liquidity |
3,549,456 | |||
F-47
Table of Contents
Responsys Pty Ltd (Formerly Eservices Group Pty Ltd)
Notes to the Consolidated Financial Statements (Continued)
for the Year Ended 30 June 2010
Note 3. Significant accounting judgements, estimates and assumptions
The preparation of the financial statements requires management to make judgements, estimates and assumptions that affect the reported amounts in the financial statements. Management continually evaluates its judgements and estimates in relation to assets, liabilities, contingent liabilities, revenue and expenses. Management bases its judgements and estimates on historical experience and on other various factors it believes to be reasonable under the circumstances, the result of which form the basis of the carrying values of assets and liabilities that are not readily apparent from other sources.
Management has identified the following critical accounting policies for which significant judgements, estimates and assumptions are made. Actual results may differ from these estimates under different assumptions and conditions and may materially affect financial results or the financial position reported in future periods.
Further details of the nature of these assumptions and conditions may be found in the relevant notes to the financial statements.
(i) Significant accounting judgements
Operating lease commitments—Group as lessee
The Group has entered into a commercial property lease with respect to the premises they operate in. The Group has determined that it does not retain all the risks and rewards of ownership of the premises and has classified the lease as an operating lease.
Recovery of deferred tax assets
Deferred tax assets are recognised for deductible temporary differences as management considers that it is probable that future taxable profits will be available to utilise those temporary differences.
(ii) Significant accounting estimates and assumptions
Impairment of goodwill
The Group determines whether goodwill is impaired at least on an annual basis. This requires an estimation of the recoverable amount of the cash generating units, using a value in use discounted cash flow methodology, to which the goodwill is allocated. An impairment loss of $250,000 was recognised in the current year in respect of goodwill relating to the Eservices Web cash generating unit.
Long service leave provision
The liability for long service leave is recognised and measured at the present of the estimated future cash flows to be made in respect of all employees at balance date. In determining the present value of the liability, attrition rates and pay increases through promotion and inflation have been taken into account.
Make good provisions
Provision is made for the anticipated costs of future restoration of leased premises. The provision includes future cost estimates associated with leaving the premises. These future cost estimates are discounted to their present value.
F-48
Table of Contents
Responsys Pty Ltd (Formerly Eservices Group Pty Ltd)
Notes to the Consolidated Financial Statements (Continued)
for the Year Ended 30 June 2010
Note 3. Significant accounting judgements, estimates and assumptions (continued)
Estimation of useful lives of assets
The estimation of the useful lives of assets has been based on historical experience. In addition, the condition of the assets is assessed at least once per year and considered against the remaining useful life. Adjustments to useful lives are made when considered necessary.
| 4. | Revenues and expenses |
(a) Revenues
| Note | 2010 A$ |
|||||||
| Fees |
10,709,612 | |||||||
| Other income |
||||||||
| Interest from: |
||||||||
| - other |
21,903 | |||||||
| Other income total |
21,903 | |||||||
| Total revenues |
10,731,515 | |||||||
| Profit is after charging the following expenses: |
||||||||
| (b) Depreciation, amortisation and impairment |
||||||||
| Depreciation of: |
||||||||
| - leasehold improvements |
9 | 4,811 | ||||||
| - property, plant and equipment |
9 | 367,096 | ||||||
| Total depreciation |
371,907 | |||||||
| Impairment of: |
||||||||
| - goodwill |
11 | 250,000 | ||||||
| Total impairment |
250,000 | |||||||
| Total depreciation, amortisation and impairment |
621,907 | |||||||
| (c) Lease payments included in statement of comprehensive income |
||||||||
| Minimum lease payments—operating lease |
306,023 | |||||||
| 306,023 | ||||||||
| (d) Employee benefits expense |
||||||||
| Salaries and wages |
5,075,847 | |||||||
| Defined contribution superannuation expense |
394,099 | |||||||
| Other employee benefits expense |
526,491 | |||||||
| Total employee benefits expense |
5,996,437 | |||||||
| (e) Other expenses |
||||||||
| Advertising expense |
58,006 | |||||||
| Accounting and legal fees |
125,014 | |||||||
| Insurance expenses |
31,503 | |||||||
| General and administrative |
217,505 | |||||||
| Total other expenses |
432,028 | |||||||
F-49
Table of Contents
Responsys Pty Ltd (Formerly Eservices Group Pty Ltd)
Notes to the Consolidated Financial Statements (Continued)
for the Year Ended 30 June 2010
5. Income tax
(a) Income tax expense
The major components of income tax expense are:
| 2010 A$ |
||||
| Statement of Comprehensive Income |
||||
| Current income tax |
||||
| Current income tax charge |
968,851 | |||
| Adjustments in respect of current income tax of previous years |
(74,349 | ) | ||
| Deferred income tax |
||||
| Relating to origination and reversal of temporary differences |
(120,151 | ) | ||
| Income tax expense reported in statement of comprehensive income |
774,351 | |||
(b) Numerical reconciliation between aggregate tax expense recognised in the statement of comprehensive income and tax expense calculated per the statutory income tax rate
| Accounting profit before income tax from continuing operations |
2,405,120 | |||
| Profit before tax from discontinued operations |
225,113 | |||
| Total accounting profit before income tax |
2,630,233 | |||
| At the statutory income tax rate of 30% |
789,070 | |||
| - Entertainment |
13,824 | |||
| - Goodwill impairment |
75,000 | |||
| - Other expenditure not allowable for income tax purposes |
10,438 | |||
| - Adjustments in respect of current income tax of previous years |
(74,350 | ) | ||
| Aggregate income tax expense |
813,982 | |||
| Aggregate income tax expense is attributable to: |
||||
| Continuing operations |
774,351 | |||
| Discontinued operations |
39,631 | |||
| Total |
813,982 | |||
(c) Recognised deferred tax assets and liabilities
| 2010 A$ Current income tax |
2010 A$ Deferred income tax |
|||||||
| Opening balance |
396,281 | 65,677 | ||||||
| Charged to income |
894,502 | 126,745 | ||||||
| Payments |
(1,018,501 | ) | — | |||||
| Acquisitions/Disposals |
— | (6,594 | ) | |||||
| Closing Balance |
272,282 | 185,828 | ||||||
F-50
Table of Contents
Responsys Pty Ltd (Formerly Eservices Group Pty Ltd)
Notes to the Consolidated Financial Statements (Continued)
for the Year Ended 30 June 2010
5. Income tax (continued)
(d) Recognised deferred tax assets
Deferred income tax at 30 June relates to the following:
| 2010 A$ |
||||
| Deferred tax assets |
||||
| Provision for annual leave |
46,095 | |||
| Provision for long service leave |
71,615 | |||
| Plant and equipment temporary differences |
27,657 | |||
| Accruals—not incurred |
21,750 | |||
| Other |
18,711 | |||
| Deferred tax assets |
185,828 | |||
6. Cash and cash equivalents
(a) Reconciliation to the statement of cash flows
For the purposes of the statement of cash flows, cash and cash equivalents includes cash on hand and in banks and deposits at call.
| 2010 A$ |
||||
| Cash at bank |
2,038,247 | |||
| Short term deposits |
50,000 | |||
| 2,088,247 | ||||
Cash at bank earns interest at floating rates based on daily bank deposit rates. The carrying value amounts of cash and cash equivalents represents fair value. The short term deposits are part of the cash management function.
F-51
Table of Contents
Responsys Pty Ltd (Formerly Eservices Group Pty Ltd)
Notes to the Consolidated Financial Statements (Continued)
for the Year Ended 30 June 2010
6. Cash and cash equivalents (continued)
(b) Reconciliation of net profit after income tax to the net cash flows from operations
| Net profit after income tax |
1,816,251 | |||
| Adjustments for non-cash income and expense items: |
||||
| Depreciation |
371,907 | |||
| Goodwill impairment |
250,000 | |||
| Profit on sale of investment |
(140,557 | ) | ||
| Transfers to provisions: |
||||
| Increase in provisions for employee entitlements |
223,192 | |||
| Decrease in provisions for doubtful debts |
(9,546 | ) | ||
| Increase in provisions for make good |
40,000 | |||
| Movement in provision for: |
||||
| Decrease in income tax payable |
(123,999 | ) | ||
| Increase in deferred tax assets |
(126,745 | ) | ||
| Changes in assets / liabilities: |
||||
| Increase in trade and other receivables |
(306,066 | ) | ||
| Increase in other current assets |
(101,031 | ) | ||
| Decrease in intangibles |
106,757 | |||
| Increase in trade and other payables |
5,203 | |||
| Net cash flows from operating activities |
2,005,346 | |||
7. Trade and other receivables (current)
| 2010 A$ |
||||
| Trade receivables(i) |
2,295,432 | |||
| less allowance for impairment loss(ii) |
— | |||
| Total trade receivables, net |
2,295,432 | |||
(i) Trade receivables are non-interest bearing on normal commercial terms
(ii) A provision for impairment loss is recognised when there is objective evidence that an individual trade debtor is impaired.
| Other unrelated persons |
104,104 | |||
| Total non-trade receivables |
104,104 | |||
| Total current trade and other receivables, net |
2,399,536 | |||
F-52
Table of Contents
Responsys Pty Ltd (Formerly Eservices Group Pty Ltd)
Notes to the Consolidated Financial Statements (Continued)
for the Year Ended 30 June 2010
7. Trade and other receivables (current) (continued)
(a) At 30 June, the ageing analysis of trade receivables is as follows:
| 0 - 30 days |
1,298,986 | |||
| 31 - 60 days (PDNI)* |
890,422 | |||
| 61 - 90 days (PDNI)* |
82,220 | |||
| > 90 days (PDNI)* |
23,804 | |||
| Total |
2,295,432 | |||
* Past due not impaired (PDNI)
(b) Allowance for impairment loss
| At 1 July |
(9,546 | ) | ||
| Change for the year |
9,546 | |||
| Amounts written off |
— | |||
| At 30 June |
— | |||
8. Held to maturity investments
| Held to maturity investment(i) |
74,478 | |||
| Total other current assets |
74,478 | |||
(i) Term deposit as security on bank guarantee on the premises at Level 10, 468 St Kilda Road Melbourne, which matures in January 2011.
F-53
Table of Contents
Responsys Pty Ltd (Formerly Eservices Group Pty Ltd)
Notes to the Consolidated Financial Statements (Continued)
for the Year Ended 30 June 2010
9. Property, plant and equipment
| 2010 A$ |
||||
| Plant and equipment |
||||
| Cost |
||||
| Opening balance |
1,093,561 | |||
| Additions |
536,996 | |||
| Disposals |
(6,231 | ) | ||
| Closing balance |
1,624,326 | |||
| Accumulated depreciation |
||||
| Opening balance |
713,379 | |||
| Depreciation for the year |
367,096 | |||
| Disposals |
(2,290 | ) | ||
| Closing balance |
1,078,185 | |||
| Net book value |
546,141 | |||
| Leasehold improvements |
||||
| Cost |
||||
| Opening balance |
35,753 | |||
| Additions |
40,000 | |||
| Closing balance |
75,753 | |||
| Accumulated depreciation |
||||
| Opening balance |
30,942 | |||
| Depreciation for the year |
4,811 | |||
| Closing balance |
35,753 | |||
| Net book value |
40,000 | |||
| Total property, plant and equipment, at cost |
1,700,079 | |||
| Total property, plant and equipment, net |
586,141 | |||
No property, plant, and equipment is pledged as security for liabilities.
10. Intangible assets and goodwill
| Intangibles (current) | Prepayments A$ |
WIP A$ |
Total A$ |
|||||||||
| Year ended 30 June 2010 |
||||||||||||
| Carrying amount at 1 July 2009 |
38,259 | 172,326 | 210,585 | |||||||||
| Additions |
43,282 | 60,546 | 103,828 | |||||||||
| Charges |
(38,259 | ) | (172,326 | ) | (210,585 | ) | ||||||
| Carrying amount at 30 June 2010 |
43,282 | 60,546 | 103,828 | |||||||||
F-54
Table of Contents
Responsys Pty Ltd (Formerly Eservices Group Pty Ltd)
Notes to the Consolidated Financial Statements (Continued)
for the Year Ended 30 June 2010
10. Intangible assets and goodwill (continued)
Payments made for goods or services to be received in the future are recorded as an asset on the balance sheet. The value of the prepayment is expensed to the statement of comprehensive income over time as the benefit is received.
Work in progress (WIP) represents work performed but not yet billed to the client. Work will be billed in the short term, and therefore all WIP amounts are classified as current assets.
| 2010 A$ |
||||
| Goodwill (non-current) |
||||
| Goodwill, at 1 July 2009 |
738,766 | |||
| Less impairment |
(250,000 | ) | ||
| Goodwill at 30 June 2010 |
488,766 | |||
(a) Description of the Group’s goodwill
After initial recognition, goodwill acquired in a business combination is measured at cost less any accumulated impairment losses. Goodwill is not amortised but is subject to impairment testing on an annual basis or whenever there is an indication of impairment.
The goodwill was acquired as part of the acquisition of Commercial Interactive Media Pty Ltd in 2007. The goodwill is fully allocated to the Web division cash generating unit (CGU) There is no separately identifiable intangible asset relating to customer relationships that remain during the current or prior period.
(b) Impairment losses recognised
An impairment loss of $250,000 on goodwill was recognised for continuing operations in the 2010 financial year. The impaired goodwill related to the Web division cash generating unit. The impairment loss has been recognised in the statement of comprehensive income as an impairment expense. The cash generating unit consists of the Group’s Web services and development activities. The recoverable amount was based on value in use.
(c) Impairment tests for goodwill
(i) Description of the cash generating unit and other relevant information
A discounted cash flow approach was used to perform the value in use calculation, and projections at 30 June are based on financial budgets approved by management for the year ended 30 June 2011 together with forecast growth assumptions for a further four year period.
The pre-tax, risk-adjusted discount rate applied to cash flow projections is 15%, and cash flows beyond 30 June 2011 are extrapolated using a 0.5% growth rate which is reflective of longer term anticipated growth.
F-55
Table of Contents
Responsys Pty Ltd (Formerly Eservices Group Pty Ltd)
Notes to the Consolidated Financial Statements (Continued)
for the Year Ended 30 June 2010
10. Intangible assets and goodwill (continued)
(ii) Key assumptions used in the value in use calculation
The key assumptions used in the value in use calculation are:
- Discount rates
- Revenue and operating expenses
- Growth rate used to extrapolate cash flows beyond the budget period
Discount rates reflect the estimate of the time value of money and the risks specific to the unit not already reflected in the cash flows. Regard has been given to the weighted average cost of capital of the entity as a whole, adjusted for risks specific to the unit.
Revenue and operating expenses are based on specific budgeted analysis of clients and client costs, together with administrative overheads.
The growth rate estimate has been based on anticipated forecasts of the CGU’s performance.
(iii) Sensitivity to changes in assumptions
Each of the key assumptions are subject to reasonably possible changes. Management have assessed that inflation between 2-4% may impact revenue and operating expenses together with client movements. Growth rates may change as a result of competitive forces and any further change upward in the discount rate would result in a greater impairment.
11. Trade and other payables (current)
| 2010 A$ |
||||
| Trade payables—unsecured |
448,749 | |||
| Unearned revenue |
52,709 | |||
| Other payables |
511,347 | |||
| Total trade and other payables |
1,012,805 | |||
(a) Trade payables are due on normal commercial terms.
(b) Due to the short term nature of these payables, their carrying value is assumed to approximate their fair value.
(c) For terms and conditions relating to related party payables refer Note 18.
(d) Information regarding liquidity risk exposure is set out in Note 2.
(e) Other payables relate to accruals for operating expenditure incurred during the year.
F-56
Table of Contents
Responsys Pty Ltd (Formerly Eservices Group Pty Ltd)
Notes to the Consolidated Financial Statements (Continued)
for the Year Ended 30 June 2010
12. Provisions (current)
| 2010 A$ |
||||
| Employee benefits—annual leave |
||||
| - Balance at beginning of year |
141,616 | |||
| - Movements during the year |
12,035 | |||
| - Balance at end of year |
153,651 | |||
| Employee benefits—long service leave |
||||
| - Balance at beginning of year |
42,189 | |||
| - Movements during the year |
155,474 | |||
| - Balance at end of year |
197,663 | |||
| Provision for dividends payable |
||||
| - Balance at beginning of year |
— | |||
| - Movements during the year |
1,845,555 | |||
| - Balance at end of year |
1,845,555 | |||
| Total current provisions |
2,196,869 | |||
13. Provisions (non-current)
| Employee benefits—long service leave(i) |
||||
| - Balance at beginning of year |
— | |||
| - Movements during the year |
41,053 | |||
| - Balance at end of year |
41,053 | |||
| Make good provision(ii) |
||||
| - Balance at beginning of year |
— | |||
| - Movements during the year |
40,000 | |||
| - Balance at end of year |
40,000 | |||
| Total non-current provisions |
81,053 | |||
(i) Refer to Note 1(o)(ii) for the relevant accounting policy and a discussion of the significant estimations and assumptions applied in the measurement of this provision.
(ii) During the year Responsys Pty Ltd entered into a new lease agreement, with an initial term of three years. A provision of A$40,000 was raised during the year ended 30 June 2010 in respect of the Group’s obligation to remove leasehold improvements from these leased premises and is included in the carrying amount of the leasehold improvements. Because of the nature of the liability, there is uncertainty in estimating the provision for the costs that will ultimately be incurred.
F-57
Table of Contents
Responsys Pty Ltd (Formerly Eservices Group Pty Ltd)
Notes to the Consolidated Financial Statements (Continued)
for the Year Ended 30 June 2010
14. Issued capital
| 2010 A$ |
||||
| Ordinary shares |
||||
| Issued and fully paid |
100,000 | |||
| Movements in ordinary shares on issue |
||||
| Issued capital at beginning of year |
100,000 | |||
| Capital issued during year |
— | |||
| Issued capital as at reporting date |
100,000 | |||
Capital Management
When managing capital, management’s objective is to ensure the entity continues as a going concern as well as to maintain optimal returns to shareholders and benefits for other stakeholders. Management also aims to maintain a capital structure that ensures the lowest cost of capital available to the entity.
15. Retained earnings
| Retained earnings |
||||
| Balance 1 July |
3,023,596 | |||
| Dividends provided for or paid |
(2,545,555 | ) | ||
| Net profit |
1,785,774 | |||
| Retained earnings at the end of the financial year |
2,263,815 | |||
16. Related party disclosure
(a) Subsidiaries
The consolidated financial statements include the financial statements of Responsys Pty Ltd (formerly Eservices Responsys Pty Ltd) and the subsidiaries listed in the following table:
| Name |
Equity Interest 2010 |
Investment 2010 A$ |
||||||
| Eservices Email Pty Ltd (formerly Eservices Communications Pty Ltd) |
100 | % | 2 | |||||
| Eservices Web Pty Ltd (formerly Eservices Interactive Pty Ltd) |
100 | % | 703,079 | |||||
| Eservices Performance Pty Ltd* |
0 | % | — | |||||
| 703,081 | ||||||||
* The disposal of Eservices Performance Pty Ltd was completed on 30 June 2010.
(b) Ultimate Parent
Clemenger Group Limited is the ultimate parent entity.
F-58
Table of Contents
Responsys Pty Ltd (Formerly Eservices Group Pty Ltd)
Notes to the Consolidated Financial Statements (Continued)
for the Year Ended 30 June 2010
16. Related party disclosure (continued)
(c) Transactions with related parties
| 2010 | ||||||||
| Billings A$ |
Purchases A$ |
|||||||
| Related party |
||||||||
| Clemenger BBDO (Melbourne) Pty Ltd |
36,107 | 43,098 | ||||||
| Clemenger BBDO (Sydney) Pty Ltd |
— | 8,071 | ||||||
| Clemenger Digital Services Pty Ltd |
216,807 | 17,066 | ||||||
| Clemenger Group Limited |
23,541 | 893,421 | ||||||
| Clemenger Harvie Edge (Brisbane) Pty Ltd |
72,347 | 2,109 | ||||||
| Clemenger Superannuation Plan |
— | 158,509 | ||||||
| Creative Activation Pty Ltd |
4,398 | — | ||||||
| Curtis Jones and Brown Pty Ltd |
16,500 | — | ||||||
| Hardie Grant Publishing Pty Ltd |
80,707 | — | ||||||
| Lonsdale Share Assistance Pty Ltd |
33,780 | 248,062 | ||||||
| Netx Proximity Pty Ltd |
133,766 | — | ||||||
| Optimum Media Director Pty Ltd |
650 | 8,556 | ||||||
| Porter Novelli Pty Ltd |
28,450 | 8,383 | ||||||
| Proximity Melbourne Pty Ltd |
— | 59,429 | ||||||
| Simon Richards Group Pty Ltd |
1,010 | — | ||||||
| Traffik Marketing Pty Ltd |
20,595 | — | ||||||
| 668,658 | 1,446,704 | |||||||
Terms and conditions of transactions with related parties
Sales to and purchases from related parties are made in arm’s length transactions both at normal market prices and on normal commercial terms.
Outstanding balances at year end are unsecured, interest free and settlement occurs in cash.
Allowance for impairment loss on trade receivables
For the year ended 30 June 2010, the Group has not made any allowance for impairment loss relating to amounts owed by related parties based on the payment history. An impairment assessment is undertaken each financial year by examining the financial position of the related party and the market in which the related party operates to determine whether there is objective evidence that a related party receivable is impaired. When such objective evidence exists, the Group recognises an allowance for the impairment loss.
17. Employee benefits
| Note | ||||||||
| The number of full-time equivalents employed as at 30 June are: |
57 | |||||||
| Employee Benefits Recognised |
||||||||
| Liabilities from employee benefits are as follows: |
||||||||
| Aggregate employee benefit liability |
12, 14 | 392,367 | ||||||
F-59
Table of Contents
Responsys Pty Ltd (Formerly Eservices Group Pty Ltd)
Notes to the Consolidated Financial Statements (Continued)
for the Year Ended 30 June 2010
18. Company details
The registered office of the Company is:
Level 10, 468 St Kilda Road
Melbourne
Vic 3182
The principal place of business is:
Level 10, 468 St Kilda Road
Melbourne
Vic 3182
The ultimate controlling entity at the date of this report is Responsys Inc.
19. Subsequent events
On 3 July 2010, the shareholders of the Group sold 50% of their shareholding to Responsys Inc.
On 3 July 2010, the businesses of Eservices Web Pty Ltd and Eservices Email Pty Ltd were transferred into the legal entity Eservices Group Pty Ltd.
On 1 July 2010, Eservices Group Pty Ltd changed its name to Eservices Responsys Pty Ltd.
On 3 January 2011, Eservices Responsys Pty Ltd shareholding changed to 100% Responsys, Inc.
On 3 January 2011, Eservices Responsys Pty Ltd changed its name to Responsys Pty Ltd.
During the six month period ended 31 December 2010, the results of the Web division cash generating unit deteriorated as a result of the loss of existing clients at 30 June 2010. The loss of these clients was unknown at that time. The business was also restructured and incorporated with the Email division. The directors determined an impairment charge of $488,766 was required to be booked in the period to 31 December 2010 on the goodwill carried in relation to the Web cash generating unit.
The Group has evaluated all events and transactions that occurred after 30 June 2010 through 11 March 2011, and noted no significant subsequent events not previously disclosed elsewhere in these notes.
20. Commitments
| 2010 A$ |
||||
| Operating lease expenditure contracted for is payable as follows: |
||||
| Within one year |
216,777 | |||
| After one year but not more than five years |
456,580 | |||
| After more than five years |
— | |||
| Total minimum lease payments |
673,357 | |||
F-60
Table of Contents
Responsys Pty Ltd (Formerly Eservices Group Pty Ltd)
Notes to the Consolidated Financial Statements (Continued)
for the Year Ended 30 June 2010
20. Commitments (continued)
Operating leases are entered into as a means of acquiring access to property and storage facilities. Rental payments are generally fixed. No renewal or purchase options exist in relation to operating leases and no operating leases contain restrictions on financing or other leasing activities.
21. Directors and key management personnel
The amount of remuneration of Directors of the Group who were paid, or were due to be paid, income (including bonuses, salaries and superannuation contributions), directly or indirectly, from the Group.
| 2010 A$ |
||||
| Short term benefits |
904,001 | |||
| Long term benefits |
53,921 | |||
| 957,922 | ||||
The amount of remuneration of other Key Management personnel of the Group who were paid, or were due to be paid, income (including bonuses, salaries and superannuation contributions), directly or indirectly, from the Group.
| 2010 A$ |
||||
| Short term benefits |
417,526 | |||
| Long term benefits |
34,942 | |||
| 452,468 | ||||
There are 3 key management personnel of the Group who are included in the above note.
22. Discontinued operations
(a) Details of operations disposed
On 30 June 2010, the Board of Directors entered into a sale agreement to dispose of Eservices Performance Pty Ltd, a company that plans and buys online media. The disposal was completed on 30 June 2010, on which date control of the company passed to the acquirer.
(b) Financial performance of operations for the year until disposal are presented below:
| 2010 A$ |
||||
| Revenue |
833,814 | |||
| Expenses |
(749,278 | ) | ||
| Profit before tax from discontinued items |
84,536 | |||
| Income tax benefit |
2,542 | |||
| Gross profit |
87,078 | |||
| Gain on disposal after tax |
98,404 | |||
| Gain for the year from discontinued operations |
185,482 | |||
F-61
Table of Contents
Responsys Pty Ltd (Formerly Eservices Group Pty Ltd)
Notes to the Consolidated Financial Statements (Continued)
for the Year Ended 30 June 2010
22. Discontinued operations (continued)
(c) Assets and liabilities and cash flow information of disposed entity
| 2010 A$ |
||||
| Assets |
||||
| Cash and cash equivalents |
315,346 | |||
| Trade and other receivables |
209,348 | |||
| Other current assets |
26,553 | |||
| Deferred tax assets |
6,594 | |||
| Property, plant and equipment |
2,390 | |||
| 560,231 | ||||
| Liabilities |
||||
| Trade and other payables |
441,874 | |||
| Provisions |
14,630 | |||
| 456,504 | ||||
| Net assets attributable to discontinued operations |
103,727 | |||
The net cash flows of Eservices Performance Pty Ltd are as follows:
| Operating activities |
(266,322 | ) | ||
| Net cash outflow |
(266,322 | ) | ||
(d) Consideration received or receivable:
| Cash |
208,000 | |||
| Total disposal consideration |
208,000 | |||
| Less net assets disposed of |
(67,423 | ) | ||
| Gain on disposal before tax |
140,577 | |||
| Income tax expense |
(42,173 | ) | ||
| Gain on disposal after income tax expense |
98,404 | |||
| Net cash inflow on disposal |
||||
| Cash and cash equivalents consideration |
208,000 | |||
| Less cash and cash equivalents disposed of |
(315,346 | ) | ||
| Net cash inflow on disposal |
(107,346 | ) | ||
F-62
Table of Contents
(Formerly Eservices Group Pty Ltd)
Condensed Consolidated Balance Sheets
| Note | 31-Dec-10 A$ |
30-Jun-10 A$ |
||||||||||
| (Unaudited) | ||||||||||||
| ASSETS |
||||||||||||
| Current Assets |
||||||||||||
| Cash and cash equivalents |
876,608 | 2,088,247 | ||||||||||
| Trade and other receivables |
2,005,727 | 2,399,536 | ||||||||||
| Intangibles |
3 | 40,862 | 103,828 | |||||||||
| Income tax receivable |
3,832 | — | ||||||||||
| Held to maturity investments |
74,478 | 74,478 | ||||||||||
| Total Current Assets |
3,001,507 | 4,666,089 | ||||||||||
| Non-Current Assets |
||||||||||||
| Deferred tax assets |
192,869 | 185,828 | ||||||||||
| Property, plant and equipment |
501,769 | 586,141 | ||||||||||
| Goodwill |
3 | — | 488,766 | |||||||||
| Total Non-Current Assets |
694,638 | 1,260,735 | ||||||||||
| TOTAL ASSETS |
3,696,145 | 5,926,824 | ||||||||||
| LIABILITIES |
||||||||||||
| Current Liabilities |
||||||||||||
| Trade and other payables |
974,474 | 1,012,805 | ||||||||||
| Provisions |
337,414 | 2,196,869 | ||||||||||
| Income tax payable |
— | 272,282 | ||||||||||
| Total Current Liabilities |
1,311,888 | 3,481,956 | ||||||||||
| Non-Current Liabilities |
||||||||||||
| Provisions |
92,116 | 81,053 | ||||||||||
| Deferred tax liabilities |
22,336 | — | ||||||||||
| Total Non-Current Liabilities |
114,452 | 81,053 | ||||||||||
| TOTAL LIABILITIES |
1,426,340 | 3,563,009 | ||||||||||
| NET ASSETS |
2,269,805 | 2,363,815 | ||||||||||
| EQUITY |
||||||||||||
| Issued capital |
100,000 | 100,000 | ||||||||||
| Retained earnings |
2,169,805 | 2,263,815 | ||||||||||
| TOTAL EQUITY |
2,269,805 | 2,363,815 | ||||||||||
The above balance sheets should be read in conjunction with the accompanying notes.
F-63
Table of Contents
(Formerly Eservices Group Pty Ltd)
Unaudited Condensed Consolidated Statements of Comprehensive Income
| Six months ended | ||||||||||||
| Note | 31-Dec-10 A$ |
31-Dec-09 A$ |
||||||||||
| Continuing operations |
||||||||||||
| Fees |
2 | 4,733,167 | 5,257,185 | |||||||||
| Other income |
2 | 11,550 | 10,120 | |||||||||
| Revenue |
4,744,717 | 5,267,305 | ||||||||||
| Staff expenses |
2 | (3,135,018 | ) | (3,078,652 | ) | |||||||
| Occupancy costs |
(172,983 | ) | (170,635 | ) | ||||||||
| Communications infrastructure |
(210,810 | ) | (205,436 | ) | ||||||||
| Depreciation |
2 | (145,954 | ) | (136,024 | ) | |||||||
| Travel & entertainment |
(229,526 | ) | (222,871 | ) | ||||||||
| Communications |
(66,722 | ) | (79,317 | ) | ||||||||
| Impairment of goodwill |
2 | (488,766 | ) | — | ||||||||
| Other |
2 | (200,209 | ) | (159,866 | ) | |||||||
| Profit from continuing operations before income tax |
94,729 | 1,214,504 | ||||||||||
| Income tax expense |
(188,739 | ) | (371,180 | ) | ||||||||
| (Loss) / profit from continuing operations after tax |
(94,010 | ) | 843,324 | |||||||||
| Loss from discontinued operations |
||||||||||||
| Loss from discontinued operations after income tax |
— | (16,785 | ) | |||||||||
| Net (loss) / profit |
(94,010 | ) | 826,539 | |||||||||
| Other comprehensive income |
— | — | ||||||||||
| Total comprehensive income / (loss) for the period |
(94,010 | ) | 826,539 | |||||||||
| Net profit / (loss) attributable to: |
||||||||||||
| Non-controlling interest |
— | (5,875 | ) | |||||||||
| Owners of the parent |
(94,010 | ) | 832,414 | |||||||||
| (94,010 | ) | 826,539 | ||||||||||
| Total comprehensive income / (loss) is attributable to: |
||||||||||||
| Non-controlling interest |
— | (5,875 | ) | |||||||||
| Owners of the parent |
(94,010 | ) | 832,414 | |||||||||
| (94,010 | ) | 826,539 | ||||||||||
The above statements of comprehensive income should be read in conjunction with the accompanying notes.
F-64
Table of Contents
(Formerly Eservices Group Pty Ltd)
Unaudited Condensed Consolidated Statements of Changes in Equity
| Issued capital A$ |
Retained earnings A$ |
Parent interests A$ |
Non- controlling interest A$ |
Total equity A$ |
||||||||||||||||
| At 1 July 2010 |
100,000 | 2,263,815 | 2,363,815 | — | 2,363,815 | |||||||||||||||
| Loss for the period |
— | (94,010 | ) | (94,010 | ) | — | (94,010 | ) | ||||||||||||
| Other comprehensive income |
— | — | — | — | — | |||||||||||||||
| Total comprehensive loss for the period |
— | (94,010 | ) | (94,010 | ) | — | (94,010 | ) | ||||||||||||
| Transactions with owners in their capacity as owners |
||||||||||||||||||||
| Issue of share capital |
— | — | — | — | — | |||||||||||||||
| Dividends provided |
— | — | — | — | — | |||||||||||||||
| At 31 December 2010 |
100,000 | 2,169,805 | 2,269,805 | — | 2,269,805 | |||||||||||||||
| Issued capital A$ |
Retained earnings A$ |
Parent interests A$ |
Non- controlling interest A$ |
Total equity A$ |
||||||||||||||||
| At 1 July 2009 |
100,000 | 3,023,596 | 3,123,596 | 5,862 | 3,129,458 | |||||||||||||||
| Profit for the period |
— | 832,414 | 832,414 | (5,875 | ) | 826,539 | ||||||||||||||
| Other comprehensive income |
— | — | — | — | — | |||||||||||||||
| Total comprehensive income for the period |
— | 832,414 | 832,414 | (5,875 | ) | 826,539 | ||||||||||||||
| Transactions with owners in their capacity as owners |
||||||||||||||||||||
| Issue of share capital |
— | — | — | — | — | |||||||||||||||
| Dividends provided |
— | (700,000 | ) | (700,000 | ) | — | (700,000 | ) | ||||||||||||
| At 31 December 2009 |
100,000 | 3,156,010 | 3,256,010 | (13 | ) | 3,255,997 | ||||||||||||||
The above statements of changes in equity should be read in conjunction with the accompanying notes.
F-65
Table of Contents
(Formerly Eservices Group Pty Ltd)
Unaudited Condensed Consolidated Statements of Cash Flows
| Six months ended | ||||||||
| 31-Dec-10 A$ |
31-Dec-09 A$ |
|||||||
| Cash flows from operating activities |
||||||||
| Receipts from customers (inclusive of GST) |
5,945,200 | 6,456,372 | ||||||
| Payments to suppliers and employees (inclusive of GST) |
(3,759,107 | ) | (4,123,508 | ) | ||||
| Interest received |
11,550 | 10,120 | ||||||
| Income tax paid |
(1,502,006 | ) | (1,909,765 | ) | ||||
| Net cash flows from operating activities |
695,637 | 433,219 | ||||||
| Cash flows from investing activities |
||||||||
| Purchase of property, plant and equipment |
(61,721 | ) | (56,496 | ) | ||||
| Net cash flows used in investing activities |
(61,721 | ) | (56,496 | ) | ||||
| Cash flows from financing activities |
||||||||
| Repayment of borrowings |
— | (200,000 | ) | |||||
| Dividends paid |
(1,845,555 | ) | (700,000 | ) | ||||
| Net cash flows used in financing activities |
(1,845,555 | ) | (900,000 | ) | ||||
| Net decrease in cash and cash equivalents |
(1,211,639 | ) | (523,277 | ) | ||||
| Cash and cash equivalents at beginning of period |
2,088,247 | 1,863,302 | ||||||
| Cash and cash equivalents at end of period |
876,608 | 1,340,025 | ||||||
The above statements of cash flows should be read in conjunction with the accompanying notes
F-66
Table of Contents
(Formerly Eservices Group Pty Ltd)
Notes to the Unaudited Condensed Consolidated Financial Statements
for the six month periods ended 31 December 2010 and 2009
Note 1. Basis of Preparation and Significant Accounting Policies
These unaudited interim condensed consolidated financial statements relate to Responsys Pty Ltd (the Company) and controlled entities as a consolidated entity (the Group). Responsys Pty Ltd is a company limited by shares incorporated and domiciled in Australia.
These general purpose unaudited condensed consolidated financial statements for the six month periods ended 31 December 2010 and 2009 have been prepared in accordance with International Accounting Standard (IAS) 34 Interim Financial Reporting as issued by the International Accounting Standards Board (IASB).
The unaudited interim condensed consolidated financial statements do not include all notes of the type normally included within the audited consolidated financial statements and therefore cannot be expected to provide as full an understanding of the financial performance, financial position, and financing and investing activities of the consolidated entity as the full year financial report. The unaudited interim condensed consolidated financial statements should be read in conjunction with the Company’s consolidated financial statements for the year ended 30 June 2010.
The financial report is presented in Australian dollars (A$).
The accounting policies adopted are consistent with those of the previous financial year, except for the following new and amended International Financial Reporting Standards (IFRS) effective as of 1 July 2010.
Improvements to IFRSs
In May 2008 and April 2009, the IASB issued omnibus amendments to its standards, primarily with a view to removing inconsistencies and clarifying wording. There are separate transitional provisions for each standard. The adoption of the following amendments resulted in changes to accounting policies but did not have any impact on the financial position or performance of the Group.
Issued in May 2008
IFRS 5 Non-current Assets Held for Sale and Discontinued Operations: clarifies that when a subsidiary is classified as held for sale, all its assets and liabilities are classified as held for sale, even when the entity remains a non-controlling interest after the sale transaction. The amendment is applied prospectively and has no impact on the financial position nor financial performance of the Group.
Issued in April 2009
IFRS 5 Non-current Assets Held for Sale and Discontinued Operations: clarifies that the disclosures required in respect of non-current assets and disposal groups classified as held for sale or discontinued operations are only those set out in IFRS 5. The disclosure requirements of other IFRSs only apply if specifically required for such non-current assets or discontinued operations.
IAS 7 Statement of Cash Flows: States that only expenditure that results in recognising an asset can be classified as a cash flow from investing activities.
F-67
Table of Contents
Responsys Pty Ltd
(Formerly Eservices Group Pty Ltd)
Notes to the Unaudited Condensed Consolidated Financial Statements (Continued)
for the six month periods ended 31 December 2010 and 2009
Note 1. Basis of Preparation and Significant Accounting Policies (continued)
IAS 36 Impairment of Assets: The amendment clarifies that the largest unit permitted for allocating goodwill, acquired in a business combination, is the operating segment as defined in IFRS 8 before aggregation for reporting purposes.
Other amendments resulting from Improvements to IFRSs to the following standards did not have any impact on the accounting policies, financial position or performance of the Group:
Issued in April 2009
IAS 1 Presentation of Financial Statements
IAS 17 Leases
IAS 34 Interim Financial Reporting
IAS 38 Intangible Assets
IAS 39 Financial Instruments: Recognition and Measurement
The Group has not elected to early adopt any other new Standards or amendments that are issued but not yet effective.
| 2. | Revenues and expenses |
(a) Revenues
| 31-Dec-10 A$ |
31-Dec-09 A$ |
|||||||
| Fees |
4,733,167 | 5,257,185 | ||||||
| Other income |
||||||||
| Interest from: |
||||||||
| - other |
11,550 | 10,120 | ||||||
| Other income total |
11,550 | 10,120 | ||||||
| Total revenues |
4,744,717 | 5,267,305 | ||||||
| Profit is after charging the following expenses: |
||||||||
| (b) Depreciation, amortisation and impairment |
||||||||
| Depreciation of: |
||||||||
| - leasehold improvements |
6,060 | 2,406 | ||||||
| - property, plant and equipment |
139,894 | 133,618 | ||||||
| Total depreciation |
145,954 | 136,024 | ||||||
| Impairment of: |
||||||||
| - goodwill |
488,766 | — | ||||||
| Total impairment |
488,766 | — | ||||||
| (c) Employee benefits expense |
||||||||
| Salaries and wages |
2,605,555 | 2,744,880 | ||||||
| Defined contribution superannuation expense |
216,265 | 206,932 | ||||||
| Other employee benefits expense |
313,198 | 126,840 | ||||||
| Total employee benefits expense |
3,135,018 | 3,078,652 | ||||||
| (d) Other expenses |
||||||||
| Advertising expense |
49,508 | 33,703 | ||||||
| Accounting and legal fees |
60,450 | 8,836 | ||||||
| Insurance expenses |
19,198 | 17,412 | ||||||
| General and administrative |
71,053 | 99,915 | ||||||
| Total other expenses |
200,209 | 159,866 | ||||||
F-68
Table of Contents
Responsys Pty Ltd
(Formerly Eservices Group Pty Ltd)
Notes to the Unaudited Condensed Consolidated Financial Statements (Continued)
for the six month periods ended 31 December 2010 and 2009
3. Intangible assets and goodwill
| 31-Dec-10 A$ |
30-Jun-10 A$ |
|||||||
| Prepayments |
40,862 | 43,282 | ||||||
| Work in progress |
— | 60,546 | ||||||
| Total intangibles - current |
40,862 | 103,828 | ||||||
Payments made for goods or services to be received in the future are recorded as an asset on the balance sheet. The value of the prepayment is expensed to the statement of comprehensive income over time as the benefit is received.
Work in progress (WIP) represents work performed but not yet billed to the client. Work will be billed in the short term, and therefore all WIP amounts are classified as current assets.
| Goodwill (non-current) |
||||||||
| Goodwill |
— | 488,766 | ||||||
The goodwill was acquired as part of the acquisition of Commercial Interactive Media Pty Ltd in 2007. The goodwill is fully allocated to the Web division cash generating unit (CGU), and there is no separately identifiable intangible asset relating to customer relationships that remain during the current or prior period.
An impairment loss of $488,766 on goodwill was recognised during the six months ended 31 December 2010 and has been recognised in the statement of comprehensive income as an impairment loss. This brings the net value of goodwill to nil. During the six month period ended 31 December 2010, the results of the Web division cash generating unit deteriorated as a result of the loss of clients since 30 June 2010, resulting in the impairment loss. There are no other assets within the Web division CGU which are stated above their recoverable amount.
4. Company details
The registered office of the Company is:
Level 10, 468 St Kilda Road
Melbourne
Vic 3182
The principal place of business is:
Level 10, 468 St Kilda Road
Melbourne
Vic 3182
5. Subsequent events
Effective 3 January 2011, the shareholders of Eservices Responsys Pty Ltd sold the remaining 50% of their shareholding to Responsys Inc. On 3 January 2011, Eservices Responsys Pty Ltd changed its name to Responsys Pty Ltd.
The Group has evaluated all events and transactions that occurred after 31 December 2010 through 11 March 2011, and noted no significant subsequent events not previously disclosed elsewhere in these notes.
F-69
Table of Contents
Unaudited Pro Forma Condensed Combined Financial Information
Introductory Note
On July 1, 2010, the Company acquired 50% of the common shares of Eservices Group Pty Ltd (“Eservices”), a privately-held company headquartered in Melbourne, Australia and on January 3, 2011 the Company completed the acquisition of the remaining equity interests of Eservices. The acquisition was consummated pursuant to the Share and Shareholders Agreement dated as of July 1, 2010, as amended January 1, 2011 (the “Agreement”). The Agreement accelerated the purchase of the remaining 50% of the common shares of Eservices for $8.3 million (AUD $8.0 million), which consisted of $7.1 million in cash and 148,648 shares of the Company’s common stock valued at approximately $1.2 million. The acquisition of Eservices should allow the Company to expand its scope of its business internationally, increase its customer base and grow its professional services and sales teams.
The unaudited pro forma condensed combined balance sheet data as of December 31, 2010 gives effect to the acquisition as if the acquisition had occurred on December 31, 2010. The unaudited pro forma condensed combined statements of income for the year ended December 31, 2010 gives effect to the acquisition as if the acquisition had occurred at the beginning of the fiscal year ended December 31, 2010.
The unaudited pro forma condensed combined financial information, including the notes thereto, does not give effect to any potential cost savings or other synergies that could result from the acquisition. The unaudited pro forma condensed combined financial information is not intended to represent or be indicative of our financial position or results of operations in future periods or the results that would have been realized if the acquisition had been consummated on the dates indicated. The unaudited pro forma condensed combined financial information should be read in conjunction with the historical financial statements of Responsys and Eservices that are included elsewhere in this prospectus.
F-70
Table of Contents
Unaudited Pro Forma Condensed Combined Balance Sheet Data
(In thousands)
December 31, 2010
| Historical | Pro Forma | |||||||||||||||||||
| Responsys | Eservices* | Adjustments** | Combined | |||||||||||||||||
| Assets |
||||||||||||||||||||
| Current assets: |
||||||||||||||||||||
| Cash and cash equivalents |
$ | 13,884 | $ | 900 | $ | (7,448 | ) | (a | ) | $ | 7,336 | |||||||||
| Accounts receivable, net of allowances |
18,101 | 2,054 | (69 | ) | (b | ) | 20,086 | |||||||||||||
| Deferred taxes |
7,288 | 4 | — | 7,292 | ||||||||||||||||
| Prepaid expenses and other current assets |
5,347 | 124 | (2,208 | ) | (a | ) | 3,263 | |||||||||||||
| Total current assets |
44,620 | 3,082 | (9,725 | ) | 37,977 | |||||||||||||||
| Property and equipment—net |
10,822 | 515 | — | 11,337 | ||||||||||||||||
| Goodwill |
1,301 | — | 13,021 | (a | ) | 14,322 | ||||||||||||||
| Intangible assets—net |
529 | — | 5,041 | (a | ) | 5,570 | ||||||||||||||
| Deferred taxes—noncurrent |
5,190 | 198 | (1,512 | ) | (a | ) | 3,876 | |||||||||||||
| Investment in unconsolidated affiliates |
8,057 | — | (7,899 | ) | (a | ) | 158 | |||||||||||||
| Other assets |
1,381 | — | — | 1,381 | ||||||||||||||||
| Total assets |
$ | 71,900 | $ | 3,795 | $ | (1,074 | ) | $ | 74,621 | |||||||||||
| Liabilities and stockholders’ equity |
||||||||||||||||||||
| Current liabilities: |
||||||||||||||||||||
| Accounts payable |
$ | 1,162 | $ | 289 | $ | (69 | ) | (b | ) | $ | 1,382 | |||||||||
| Accrued compensation |
3,516 | 346 | — | 3,862 | ||||||||||||||||
| Other accrued liabilities |
3,866 | 378 | (887 | ) | (a | ) | 3,357 | |||||||||||||
| Current portion of capital lease obligations |
387 | — | — | 387 | ||||||||||||||||
| Current portion of deferred revenue |
8,642 | 333 | (75 | ) | (a | ) | 8,900 | |||||||||||||
| Total current liabilities |
17,573 | 1,346 | (1,031 | ) | 17,888 | |||||||||||||||
| Deferred revenue—noncurrent |
382 | — | — | 382 | ||||||||||||||||
| Other long-term liabilities |
770 | 118 | — | 888 | ||||||||||||||||
| Total liabilities |
18,725 | 1,464 | (1,031 | ) | 19,158 | |||||||||||||||
| Stockholders’ equity: |
||||||||||||||||||||
| Convertible preferred stock |
62,028 | — | — | 62,028 | ||||||||||||||||
| Common stock |
3 | — | — | 3 | ||||||||||||||||
| Additional paid-in capital |
12,858 | 103 | 1,087 | (a | ) | 14,048 | ||||||||||||||
| Accumulated deficit |
(22,765 | ) | 2,228 | 100 | (a | ) | (20,437 | ) | ||||||||||||
| Accumulated other comprehensive income (loss) |
1,051 | — | (1,230 | ) | (a | ) | (179 | ) | ||||||||||||
| Total stockholders’ equity |
53,175 | 2,331 | (43 | ) | 55,463 | |||||||||||||||
| Total liabilities and stockholders’ equity |
$ | 71,900 | $ | 3,795 | $ | (1,074 | ) | $ | 74,621 | |||||||||||
| * | Refer to Note 2. |
| ** | Refer to Note 4. |
See notes to unaudited pro forma condensed combined financial statements.
F-71
Table of Contents
Unaudited Pro Forma Condensed Combined Statement of Income Data
For the Year Ended December 31, 2010
(In thousands, except per share amounts)
| Pro Forma | ||||||||||||||||||||
| Responsys | Eservices* | Adjustments** | Combined | |||||||||||||||||
| Revenue: |
||||||||||||||||||||
| Subscription |
$ | 69,284 | $ | 5,455 | $ | (89 | ) | (b | ) | $ | 74,650 | |||||||||
| Professional services |
24,787 | 3,935 | — | 28,722 | ||||||||||||||||
| Total revenue |
94,071 | 9,390 | (89 | ) | 103,372 | |||||||||||||||
| Cost of revenue: |
||||||||||||||||||||
| Subscription |
20,221 | 930 | (89 | ) | (b | ) | 21,062 | |||||||||||||
| Professional services |
20,697 | 3,376 | — | 24,073 | ||||||||||||||||
| Total cost of revenue |
40,918 | 4,306 | (89 | ) | 45,135 | |||||||||||||||
| Gross profit |
53,153 | 5,084 | — | 58,237 | ||||||||||||||||
| Operating expenses: |
||||||||||||||||||||
| Research and development |
10,597 | 85 | — | 10,682 | ||||||||||||||||
| Sales and marketing |
20,849 | 2,188 | 1,791 | (c | ) | 24,828 | ||||||||||||||
| General and administrative |
8,225 | 950 | (365 | ) | (a | ) | 8,810 | |||||||||||||
| Impairment of goodwill |
— | 680 | — | 680 | ||||||||||||||||
| Total operating expenses |
39,671 | 3,903 | 1,426 | 45,000 | ||||||||||||||||
| Operating income |
13,482 | 1,181 | (1,426 | ) | 13,237 | |||||||||||||||
| Other income (expense): |
||||||||||||||||||||
| Interest income |
4 | — | — | 4 | ||||||||||||||||
| Interest expense |
(32 | ) | — | — | (32 | ) | ||||||||||||||
| Other income (expense), net |
1,199 | — | (289 | ) | (a | ) | 910 | |||||||||||||
| Total other income (expense) |
1,171 | — | (289 | ) | 882 | |||||||||||||||
| Income before income taxes |
14,653 | 1,181 | (1,715 | ) | 14,119 | |||||||||||||||
| Provision (benefit) for income taxes |
(5,821 | ) | (544 | ) | 1,199 | (a | ),(c) | (5,166 | ) | |||||||||||
| Equity loss in unconsolidated affiliates |
(234 | ) | — | 215 | (a | ) | (19 | ) | ||||||||||||
| Net income |
$ | 8,598 | $ | 637 | $ | (301 | ) | $ | 8,934 | |||||||||||
| Net income attributable to common stockholders: |
||||||||||||||||||||
| Basic |
$ | 802 | $ | 629 | ||||||||||||||||
| Diluted |
$ | 1,179 | $ | 917 | ||||||||||||||||
| Net income per share attributable to common stockholders: |
||||||||||||||||||||
| Basic |
$ | 0.09 | $ | 0.07 | ||||||||||||||||
| Diluted |
$ | 0.08 | $ | 0.06 | ||||||||||||||||
| Shares used in computation of net income per share attributable to common stockholders: |
||||||||||||||||||||
| Basic |
8,527 | (d | ) | 8,676 | ||||||||||||||||
| Diluted |
14,464 | (d | ) | 14,613 | ||||||||||||||||
| * | Refer to Note 2. |
| ** | Refer to Note 4. |
See notes to unaudited pro forma condensed combined financial statements.
F-72
Table of Contents
Notes to the Unaudited Pro Forma Condensed Combined Financial Information
NOTE 1. BASIS OF PRESENTATION
The unaudited pro forma condensed combined financial information included herein have been prepared by the Company, without audit, pursuant to the rules and regulations of the Securities and Exchange Commission.
The acquisition of Eservices is accounted for under the acquisition method of accounting in accordance with ASC Topic 805-10, Business Combinations—Overall (“ASC 805-10”). The Company has accounted for the transaction by using its historical information and accounting policies and adding the assets and liabilities of Eservices as of the acquisition date at their respective fair values. Pursuant to ASC 805-10, under the acquisition method, the total purchase price (consideration transferred), as described in Note 3, is measured at the acquisition closing date of January 3, 2011 using the fair value of the Company’s common stock and cash paid. The assets and liabilities of Eservices have been measured based on various estimates and valuations using assumptions that the Company’s management believes are reasonable utilizing information currently available. Use of different estimates and judgments could yield different results. The process for estimating the fair values of identifiable intangible assets and certain tangible assets requires the use of significant estimates and assumptions, including estimating future cash flows and developing appropriate discount rates. For purposes of measuring the estimated fair value of the assets acquired and liabilities assumed as reflected in the unaudited pro forma condensed combined financial statements, the Company used the guidance in ASC Topic 820-10, Fair Value Measurement and Disclosure—Overall (“ASC 820-10”), which establishes a framework for measuring fair values. Use of different estimates and judgments could yield different results. Under ASC 805-10, acquisition-related transaction costs (e.g., investment banker, advisory, legal, valuation, and other professional fees) are not included as a component of consideration transferred but are required to be expensed as incurred. These costs are not presented in the unaudited pro forma condensed combined statement of income because they will not have a continuing impact on the combined results.
NOTE 2. ACCOUNTING POLICIES
Eservices’ historical financial statements were prepared in accordance with International Financial Reporting Standards (“IFRS”) as issued by the International Accounting Standards Board (“IASB”). The unaudited pro forma condensed combined financial statements reflect adjustments to conform Eservice’s results to Accounting Policies Generally Accepted in the United States of America with respect to the classification of expenses. As such, the historical condensed statement of income for Eservices has been updated to reflect the classification of revenue and expenses in accordance with U.S. GAAP (See Note 5).
Eservices’ historical balance sheet as of December 31, 2010 was translated based on the effective rate as of the balance sheet date of 1.03.
NOTE 3. DESCRIPTION OF PURCHASE PRICE ALLOCATION
In July 2010, the Company acquired the initial 50% of the common shares of Eservices for $6.7 million (AUD $7.8 million) in cash. On January 3, 2011, the Company completed the acquisition (the “Acquisition”) of the remaining equity interests of Eservices. The Acquisition was consummated pursuant to the Share Sale and Shareholders Agreement dated as of July 1, 2010, as amended January 1, 2011 (the “Agreement”). The Agreement accelerated the purchase of the remaining 50% of the common shares of Eservices for $8.3 million (AUD $8.0 million) which consisted of $7.1 million paid in cash and 148,648 shares of the Company’s common stock valued at approximately $1.2 million.
F-73
Table of Contents
Notes to the Unaudited Pro Forma Condensed Combined Financial Information (Continued)
NOTE 3. DESCRIPTION OF THE PURCHASE PRICE ALLOCATION (Continued)
The preliminary allocation of the aggregate purchase price, which is based on a preliminary valuation report and is therefore subject to change, is as follows (in thousands):
| Cash and cash equivalents |
$ | 900 | ||
| Trade receivables |
2,083 | |||
| Property, plant and equipment |
515 | |||
| Other tangible assets |
326 | |||
| Deferred tax liabilities |
(1,535 | ) | ||
| Deferred revenue |
(160 | ) | ||
| Other liabilities assumed |
(1,236 | ) | ||
| Net tangible assets |
893 | |||
| Intangible assets |
||||
| Customer list (two and a half years estimated life) |
4,929 | |||
| Trade name (one and a half years estimated life) |
82 | |||
| Software (half year estimate life) |
30 | |||
| Goodwill |
13,021 | |||
| Total intangible assets |
18,062 | |||
| Consideration given |
$ | 18,955 | ||
The valuation of the identifiable intangible assets acquired was based on currently available information and reasonable and supportable assumptions. The purchase price of the acquisition was allocated to the assets acquired and liabilities assumed based on estimates of their fair values as of January 3, 2011. The tangible long-lived assets were recorded at their estimated fair value, which approximates their carrying value. The intangible long-lived assets were valued using a combination of the income and cost methods. To value the customer relationships, the Company used the income approach, specifically, a variation of the discounted cash-flow method known as the multiperiod excess earnings method; key assumptions included the future revenue and costs attributable to existing customers and their expected attrition probability of the customers in question and the impact of competition on the business. The relief from royalty method, which considers both the market approach and the income approach, was used to value the Eservices trade name; key assumptions included the future revenue attributable to this trade name and a market-based royalty rate. Further, all future cash flows in applicable valuations have been discounted at an estimated discount rate. The Company believes these methods and assumptions were appropriate because of the lack of comparative market sales data required for the market approach when measuring the value of these assets. The excess of the aggregate estimated purchase price over the estimated fair value of the identifiable assets and liabilities in the amount of $13.0 million was classified as goodwill.
F-74
Table of Contents
Notes to the Unaudited Pro Forma Condensed Combined Financial Information (Continued)
NOTE 3. DESCRIPTION OF THE PURCHASE PRICE ALLOCATION (Continued)
The aggregate estimated purchase price of $17.7 million reflected in these unaudited pro forma condensed combined financial statements includes 148,648 shares of the Company’s common stock, which was valued at $8.00 per share as of January 3, 2011. The valuation analysis of the Company’s common stock has been conducted under a probability-weighted expected return method as prescribed by the AICPA Practice Aid. Under this methodology, the fair market value of the Company’s common stock is estimated based upon an analysis of future values assuming various outcomes. The value is based on the probability-weighted present value of expected future investment returns considering each of the possible outcomes available to the Company as well as the rights of each share class. The possible outcomes considered are based upon an analysis of future scenarios as described below:
| • | strategic sale; |
| • | continuation as a private company; |
| • | completion of an initial public offering; and |
| • | remote likelihood of dissolution |
The Company estimates useful lives for each category of intangible assets based on the period over which the asset is expected to contribute directly or indirectly to the future cash flows of the Company. The acquired intangible assets subject to amortization are amortized based upon the pattern in which the economic benefits of the intangible assets are being realized, which are on a straight-line basis for all acquired intangible assets. The Company estimated the expected customer attrition rate primarily based on historical attrition rates.
NOTE 4. PRO FORMA ADJUSTMENTS
The Company derived Eservices’ historical results of operations by taking the operating results for the year ended June 30, 2010, adding the operating results for the six months ended December 31, 2010 and deducting the operating results for the six months ended December 31, 2009.
Additionally, the following adjustments have been reflected in the unaudited pro forma condensed combined financial information:
| (a) | To eliminate account balances resulting from the Company’s accounting treatment of its initial investment using the equity method and to record cash paid, common stock issued, and record applicable purchase accounting entries including intangible assets and goodwill. In July 2010, the Company acquired 50% of the common shares of Eservices which the Company accounted for using the equity method. Accordingly, the Company’s investment was carried at cost and adjusted for the Company’s share in the investee’s earnings. Amount of cash paid assumes the payment was made as of December 31, 2010 using an effective foreign exchange rate as of that date. |
Pursuant to the Agreement the Company had the option to purchase (“Call Option”) and may have also been obligated to purchase (“Put Option”) an additional 16.67% and the remaining 33.33% of Eservices in July 2011 and December 2011, respectively.
Common stock issued is based on 148,648 shares issued in the transaction, which closed on January 3, 2011, with an estimated fair market value of $8.00 per share, total value of $1.2 million, which has been recorded as additional paid-in capital. Preexisting Eservices’ retained earnings of $2.2 million have been eliminated as part of purchase accounting.
F-75
Table of Contents
Notes to the Unaudited Pro Forma Condensed Combined Financial Information (Continued)
NOTE 4. PRO FORMA ADJUSTMENTS (Continued)
The following table summarizes the adjustments to the pro forma presentation related to the elimination of the initial 50% equity interest and the allocation of the purchase price:
| (In thousands) | Increase (decrease) |
|||||||
| Balance sheet |
||||||||
| To record payment of the second 50% equity interest |
$ | (7,084 | ) | |||||
| Elimination of unpaid consideration as pro forma statements assume consideration was transferred as of December 31, 2010 |
(364 | ) | ||||||
| Total impact on cash balance |
(7,448 | ) | ||||||
| Elimination of Call Option recorded at fair market value |
(2,208 | ) | ||||||
| Goodwill (see Note 3 for purchase price allocation) |
13,021 | |||||||
| Intangibles (see Note 3 for purchase price allocation) |
5,041 | |||||||
| Deferred tax liability (see Note 3 for purchase price allocation) |
1,512 | |||||||
| Carrying value of the Company’s equity investment |
(7,899 | ) | ||||||
| Put Option recorded at fair market value |
(523 | ) | ||||||
| Elimination of unpaid consideration as pro forma assumes consideration was transferred as of December 31, 2010 |
(364 | ) | ||||||
| Impact on other accrued liabilities |
(887 | ) | ||||||
| Fair market adjustment to deferred revenues (see Note 3 for purchase price allocation) |
(75 | ) | ||||||
| Elimination of Eservices paid in capital balance |
(102 | ) | ||||||
| Stock issued pursuant to the amended agreement |
1,189 | |||||||
| Impact on additional paid in capital |
1,087 | |||||||
| Elimination of pre existing Eservices retained earnings |
(2,228 | ) | ||||||
| Net gain resulting from business combination |
2,328 | |||||||
| Impact on retained earnings |
100 | |||||||
| Impact of foreign exchange rate on initial 50% equity interest investment |
(1,230 | ) | ||||||
| Income statement |
||||||||
| Elimination of transaction fees recorded in connection with the acquisition |
365 | |||||||
| Net gain in the Call Option and Put Option fair market value |
(1,681 | ) | ||||||
| Gain on the initial 50% equity interest |
1,080 | |||||||
| Impact of foreign exchange rate fluctuations |
312 | |||||||
| Impact on other income |
(289 | ) | ||||||
| Income tax expense associated with the gain recorded on its Call Option and Put Option |
662 | |||||||
| Equity loss in its share of Eservices operating losses |
215 | |||||||
See Note 3 for purchase price allocation.
| (b) | To eliminate account balance resulting from intercompany transactions. |
F-76
Table of Contents
Notes to the Unaudited Pro Forma Condensed Combined Financial Information (Continued)
NOTE 4. PRO FORMA ADJUSTMENTS (Continued)
| (c) | Adjustment to record $1.8 million amortization expense and associated tax benefit of $0.5 million for the year ended December 31, 2010 relating to the identifiable intangible assets resulting from the allocation of the Eservices purchase price. Amortization expense has been calculated on a straight line basis and translated using the average foreign exchange rate for the year ended December 31, 2010. The pro forma adjustment assumes that the identifiable intangibles will be amortized on a straight-line basis over their respective estimated lives (remaining intangibles including goodwill will be tested for impairment). |
| (d) | Adjustment to the weighted average number of common shares outstanding used in computing per share amounts, basic and diluted, is as follows: |
| Year Ended December 31, 2010 |
||||
| Basic |
||||
| Company’s historical weighted average common shares |
8,527 | |||
| Add the pro forma impact of common shares issued to Eservice’s shareholders |
149 | |||
| Basic – Adjusted |
8,676 | |||
| Diluted |
||||
| Company’s historical weighted average common shares |
14,464 | |||
| Add the pro forma impact of common shares issued to Eservice’s shareholders |
149 | |||
| Diluted – Adjusted |
14,613 | |||
The calculations do not reflect the potential conversion of outstanding convertible preferred stock into common stock upon the closing of an underwritten public offering of common stock under the Securities Act of 1933.
F-77
Table of Contents
Notes to the Unaudited Pro Forma Condensed Combined Financial Information (Continued)
NOTE 5. IFRS to US GAAP ADJUSTMENTS
The following tables show a reconciliation of the unaudited operating results for the twelve months ended December 31, 2010, prepared in accordance with IFRS and in Australian Dollars, to the statement of income under US GAAP and in U.S. Dollars included in the unaudited pro forma combined condensed statement of income.
Eservices
Statement of Operations Presentation and IFRS to US GAAP Adjustments
For the Year Ended December 31, 2010
| Year Ended |
Six months Ended December 31, |
Twelve Months Ended | ||||||||||||||||||
| June 30, 2010 (AUD) |
2009 (AUD) |
2010 (AUD) |
December 31, 2010 (AUD) |
December 31, 2010 (USD) |
||||||||||||||||
| (1) | (2) | |||||||||||||||||||
| (Unaudited) | ||||||||||||||||||||
| Continuing Operations |
||||||||||||||||||||
| Fees |
$ | 10,710 | $ | 5,257 | $ | 4,733 | 10,186 | 9,368 | ||||||||||||
| Other revenue |
22 | 10 | 12 | 24 | 22 | |||||||||||||||
| Revenue |
10,732 | 5,267 | 4,745 | 10,210 | 9,390 | |||||||||||||||
| Staff expenses |
(5,996 | ) | (3,079 | ) | (3,135 | ) | (6,052 | ) | (5,567 | ) | ||||||||||
| Occupancy costs |
(311 | ) | (171 | ) | (173 | ) | (313 | ) | (288 | ) | ||||||||||
| Communications infrastructure |
(419 | ) | (205 | ) | (211 | ) | (425 | ) | (391 | ) | ||||||||||
| Depreciation |
(372 | ) | (136 | ) | (146 | ) | (382 | ) | (351 | ) | ||||||||||
| Travel and entertainment |
(195 | ) | (223 | ) | (230 | ) | (202 | ) | (186 | ) | ||||||||||
| Communications |
(351 | ) | (79 | ) | (67 | ) | (339 | ) | (312 | ) | ||||||||||
| Impairment of goodwill |
(250 | ) | — | (489 | ) | (739 | ) | (680 | ) | |||||||||||
| Other |
(432 | ) | (160 | ) | (200 | ) | (472 | ) | (434 | ) | ||||||||||
| Profit from continuing operations before income tax |
2,406 | 1,214 | 94 | 1,286 | 1,181 | |||||||||||||||
| Income tax expense |
(774 | ) | (371 | ) | (189 | ) | (592 | ) | (545 | ) | ||||||||||
| Net profit |
$ | 1,632 | $ | 843 | $ | (95 | ) | $ | 694 | $ | 637 | |||||||||
F-78
Table of Contents
Notes to the Unaudited Pro Forma Condensed Combined Financial Information (Continued)
NOTE 5. IFRS to US GAAP ADJUSTMENTS (Continued)
| IFRS to GAAP Adjustments for the Year Ended December 31, 2010 (USD) |
||||
| (3) | ||||
| Revenue: |
||||
| Subscription |
$ | 5,455 | ||
| Professional services |
3,935 | |||
| Total revenue |
9,390 | |||
| Cost of revenue: |
||||
| Subscription |
930 | |||
| Professional services |
3,376 | |||
| Total cost of revenue |
4,306 | |||
| Gross profit |
5,084 | |||
| Operating expenses: |
||||
| Research and development |
85 | |||
| Sales and marketing |
2,188 | |||
| General and administrative |
950 | |||
| Impairment of goodwill |
680 | |||
| Total operating expenses |
3,903 | |||
| Operating income |
1,181 | |||
| Other income (expense): |
||||
| Interest income |
— | |||
| Interest expense |
— | |||
| Other income (expense), net |
— | |||
| Total other income (expense) |
— | |||
| Income before income taxes |
1,181 | |||
| Provision for income taxes |
(544 | ) | ||
| Equity loss in unconsolidated affiliates |
— | |||
| Net income |
$ | 637 | ||
Notes:
| (1) | Eservices’ unaudited condensed combined financial information is based upon the historical financial statements derived by taking the operating results for the fiscal year ended June 30, 2010, adding subsequent interim period results to the fiscal year information and deducting comparable preceding year interim period results. |
| (2) | The results are converted to U.S. Dollars using the average exchange rate for the period presented. The exchange rate used for the period ended December 31, 2010 was 0.92. |
| (3) | Allocation of Eservices’ historical operating results were based on an analysis of the nature of revenue and expenses. |
F-79
Table of Contents
SCHEDULE II—VALUATION AND QUALIFYING ACCOUNTS
Responsys, Inc.
| Years Ended | ||||||||||||
| December 31, 2008 | December 31, 2009 | December 31, 2010 | ||||||||||
| (in thousands) | ||||||||||||
| Allowance for Doubtful Accounts: |
||||||||||||
| Beginning balance |
$ | 436 | $ | 392 | $ | 393 | ||||||
| Bad debt expenses |
(23 | ) | 521 | 63 | ||||||||
| Write-offs |
(21 | ) | (520 | ) | (282 | ) | ||||||
| Ending balance |
$ | 392 | $ | 393 | $ | 174 | ||||||
S-1
Table of Contents

Table of Contents
PART II
INFORMATION NOT REQUIRED IN PROSPECTUS
| Item 13. | Other Expenses of Issuance and Distribution |
The following table sets forth all expenses to be paid by the Registrant, other than estimated underwriting discounts and commissions, in connection with this offering. All amounts shown are estimates except for the SEC registration fee and the FINRA filing fee:
| SEC registration fee |
$ | 6,151 | ||
| FINRA filing fee |
8,113 | |||
| Initial listing fee |
25,000 | |||
| Printing and engraving |
175,000 | |||
| Legal fees and expenses |
787,500 | |||
| Accounting fees and expenses |
810,000 | |||
| Transfer agent and registrar fees |
4,000 | |||
| Miscellaneous |
10,000 | |||
| Total |
1,825,764 | |||
| Item 14. | Indemnification of Directors and Officers |
Section 145 of the Delaware General Corporation Law authorizes a court to award, or a corporation’s board of directors to grant, indemnity to directors and officers under certain circumstances and subject to certain limitations. The terms of Section 145 of the Delaware General Corporation Law are sufficiently broad to permit indemnification under certain circumstances for liabilities, including reimbursement of expenses incurred, arising under the Securities Act of 1933, as amended, or the Securities Act.
As permitted by the Delaware General Corporation Law, the Registrant’s restated certificate of incorporation that will be in effect at the closing of the offering contains provisions that eliminate the personal liability of its directors for monetary damages for any breach of fiduciary duties as a director, except liability for the following:
| • | any breach of the director’s duty of loyalty to the Registrant or its stockholders; |
| • | acts or omissions not in good faith or that involve intentional misconduct or a knowing violation of law; |
| • | under Section 174 of the Delaware General Corporation Law (regarding unlawful dividends and stock purchases); or |
| • | any transaction from which the director derived an improper personal benefit. |
As permitted by the Delaware General Corporation Law, the Registrant’s restated bylaws that will be in effect at the closing of this offering, provide that:
| • | the Registrant is required to indemnify its directors and executive officers to the fullest extent permitted by the Delaware General Corporation Law, subject to very limited exceptions; |
| • | the Registrant may indemnify its other employees and agents as set forth in the Delaware General Corporation Law; |
| • | the Registrant is required to advance expenses, as incurred, to its directors and executive officers in connection with a legal proceeding to the fullest extent permitted by the Delaware General Corporation Law, subject to limited exceptions; and |
| • | the rights conferred in the bylaws are not exclusive. |
II-1
Table of Contents
Prior to the closing of this offering, the Registrant has entered into indemnification agreements with each of its current directors and executive officers to provide these directors and executive officers additional contractual assurances regarding the scope of the indemnification set forth in the Registrant’s restated certificate of incorporation and restated bylaws and to provide additional procedural protections. At present, there is no pending litigation or proceeding involving a director or executive officer of the Registrant regarding which indemnification is sought. Reference is also made to the underwriting agreement filed as Exhibit 1.1 to this registration statement, which provides for the indemnification of executive officers, directors and controlling persons of the Registrant against certain liabilities. The indemnification provisions in the Registrant’s restated certificate of incorporation, restated bylaws and the indemnification agreements entered into or to be entered into between the Registrant and each of its directors and executive officers may be sufficiently broad to permit indemnification of the Registrant’s directors and executive officers for liabilities arising under the Securities Act.
The Registrant currently carries liability insurance for its directors and officers.
Reference is made to the following documents filed as exhibits to this Registration Statement regarding relevant indemnification provisions described above and elsewhere herein:
| Exhibit Title |
Exhibit Number |
|||
| Form of Underwriting Agreement |
1.1 | |||
| Form of Restated Certificate of Incorporation of the Registrant, to be in effect at the closing of this offering |
3.3 | |||
| Form of Restated Bylaws of the Registrant, to be in effect at the closing of this offering |
3.4 | |||
| Form of Indemnification Agreement |
10.1 | |||
| Item 15. | Recent Sales of Unregistered Securities |
Since February 1, 2008, the Registrant has issued and sold the following securities:
| (1) | On April 23, 2008, the Registrant granted options to purchase an aggregate of 205,125 shares of common stock to certain of its employees under its 1999 Stock Plan at an exercise price of $2.92 per share. |
| (2) | On April 23, 2008, the Registrant granted an option to purchase an aggregate of 12,500 shares of common stock to an executive officer under its 1999 Stock Plan at an exercise price of $2.92 per share. |
| (3) | On July 16, 2008, the Registrant granted options to purchase an aggregate of 145,625 shares of common stock to certain of its employees under its 1999 Stock Plan at an exercise price of $2.92 per share. |
| (4) | On October 22, 2008, the Registrant granted options to purchase an aggregate of 170,625 shares of common stock to certain of its employees under its 1999 Stock Plan at an exercise price of $2.92 per share. |
| (5) | On March 11, 2009, the Registrant granted options to purchase an aggregate of 213,750 shares of common stock to certain of its employees under its 1999 Stock Plan at an exercise price of $2.23 per share. |
| (6) | In April 2009, the Registrant issued 725,457 shares of Series E Preferred Stock to Lighthouse Capital Partners IV, L.P., a venture lending partnership, upon the exercise of an outstanding warrant with an exercise price of $0.24788 per share, net of the aggregate exercise price of $179,826, which was settled using 75,174 shares of Series E Preferred Stock that otherwise would have been issued to the warrantholder pursuant to the terms of the warrant. |
| (7) | On July 22, 2009, the Registrant granted options to purchase an aggregate of 222,374 shares of common stock to certain of its employees under its 1999 Stock Plan at an exercise price of $2.60 per share. |
| (8) | On July 22, 2009, the Registrant exchanged options to purchase an aggregate of 2,566,073 shares of common stock at an exercise price of $2.80 per share granted to certain of its executive officers under its 1999 Stock Plan on January 15, 2008 for options to purchase an aggregate of 2,562,500 shares of common stock at an exercise price of $2.60 per share granted under its 1999 Stock Plan. |
II-2
Table of Contents
| (9) | On December 8, 2009, the Registrant granted options to purchase an aggregate of 341,250 shares of common stock to certain of its employees under its 1999 Stock Plan at an exercise price of $3.08 per share. |
| (10) | On December 8, 2009, the Registrant granted an option to purchase 25,000 shares of common stock to a member of its board of directors under its 1999 Stock Plan at an exercise price of $3.08 per share. |
| (11) | On December 30, 2009, the Registrant granted an option to purchase 50,000 shares of common stock to an executive officer under its 1999 Stock Plan at an exercise price of $3.08 per share. |
| (12) | On June 8, 2010, the Registrant granted options to purchase an aggregate of 224,875 shares of common stock to certain of its employees under its 1999 Stock Plan at an exercise price of $4.48 per share. |
| (13) | On June 8, 2010, the Registrant granted options to purchase an aggregate of 137,500 shares of common stock to an executive officer and member of its board of directors under its 1999 Stock Plan at an exercise price of $4.48 per share. |
| (14) | On December 15, 2010, the Registrant granted options to purchase an aggregate of 537,062 shares of common stock to certain of its employees under its 1999 Stock Plan at an exercise price of $7.40 per share. |
| (15) | On December 15, 2010, the Registrant granted an option to purchase 50,000 shares of common stock to an executive officer under its 1999 Stock Plan at an exercise price of $7.40 per share. |
| (16) | On January 3, 2011, the Registrant issued an aggregate of 148,648 shares of common stock with an aggregate value of $1,100,000 to two former shareholders of Eservices residing in Australia as consideration for the acquisition of their equity interests in Eservices. |
| (17) | On March 29, 2011, the Registrant granted options to purchase an aggregate of 167,625 shares of common stock to certain of its employees under its 1999 Stock Plan at an exercise price of $9.25 per share. |
| (18) | On March 29, 2011, the Registrant granted options to purchase an aggregate of 137,500 shares of common stock to an executive officer and a member of its board of directors under its 1999 Stock Plan at an exercise price of $9.25 per share. |
| (19) | Since February 1, 2008, the Registrant has issued an aggregate of 2,147,673 shares of common stock upon exercise of options granted to employees under its 1999 Stock Plan, with a weighted average exercise price of $0.34 per share for an aggregate purchase price of $720,388. |
| (20) | Since February 1, 2008, the Registrant has issued and sold an aggregate of 2,051,821 shares of common stock upon grant of restricted stock awards and exercise of options granted to executive officers and members of its board of directors under its 1999 Stock Plan, with a weighted average exercise price of $0.44 per share for an aggregate purchase price of $905,973. |
The issuances of the securities described in items (1), (3)-(5), (7), (9), (12), (14), (17) and (19) above were exempt from registration under the Securities Act in reliance on Rule 701 promulgated under Section 3(b) of the Securities Act pursuant to benefit plans and contracts relating to compensation. The issuance of securities described in items (2), (6), (8), (10)-(11), (13), (15), (18) and (20) above are exempt from registration under the Securities Act in reliance on Section 4(2) of the Securities Act as a transaction by an issuer not involving any public offering. The issuance of shares described in item (16) above is exempt from registration under the Securities Act in reliance on Regulation S of the Securities Act as sales that occurred outside the United States.
None of the foregoing transactions involved any underwriters, underwriting discounts or commissions, or any public offering, and the Registrant believes each transaction was exempt from the registration requirements of the Securities Act as stated above. All recipients of the foregoing transactions either received adequate information about the Registrant or had access, through their relationships with the Registrant, to such information. Furthermore, the Registrant affixed appropriate legends to the share certificates and instruments issued in each foregoing transaction setting forth that the securities had not been registered and the applicable restrictions on transfer.
II-3
Table of Contents
| Item 16. | Exhibits and Financial Statement Schedules |
(a) Exhibits. The following exhibits are included herein or incorporated herein by reference:
| Exhibit |
Description | |
| 1.1 | Form of Underwriting Agreement. | |
| 2.1#** | Share Sale & Shareholders Agreement, dated July 1, 2010, between the Registrant, Eservices Group Pty Ltd, Diversified Marketing Services Pty Ltd, Cross Brothers Nominees Pty Ltd as trustee for APSN Trust, and O’Day Nominees Pty Ltd as trustee for O’Day Trust. | |
| 2.2# | Amendment to Share Sale and Shareholders Agreement dated January 2, 2011 between the Registrant, Eservices Responsys Pty Ltd (formerly Eservices Group Pty Ltd), Diversified Marketing Services Pty Ltd, Cross Brothers Nominees Pty Ltd and O’Day Nominees Pty Ltd. | |
| 3.1 | Restated Certificate of Incorporation of the Registrant. | |
| 3.2 | Bylaws of the Registrant. | |
| 3.3 | Form of Restated Certificate of Incorporation of the Registrant, to be in effect at the closing of this offering. | |
| 3.4 | Form of Restated Bylaws of the Registrant, to be in effect at the closing of this offering. | |
| 3.5** | Amended and Restated Articles of Incorporation of Responsys, Inc., a California corporation. | |
| 3.6** | Bylaws of Responsys, Inc., a California corporation. | |
| 4.1 | Intentionally omitted. | |
| 4.2** | Third Amended and Restated Investors’ Rights Agreement, dated January 6, 2003, by and among Registrant and certain security holders of the Registrant. | |
| 4.3** | Warrant to Purchase Shares of Series C Preferred Stock dated May 24, 2001 issued by the Registrant to Pentech Financial Services, Inc. | |
| 4.4** | Second Amended and Restated Right of First Refusal and Co-Sale Agreement, dated March 29, 2001, by and among the Registrant and certain securityholders of the Registrant. | |
| 5.1 | Opinion of Fenwick & West LLP. | |
| 10.1** | Form of Indemnification Agreement. | |
| 10.2+** | 1999 Stock Plan, as amended, and forms of stock option and stock option exercise agreement. | |
| 10.3+ | 2011 Equity Incentive Plan, to be in effect upon the closing of this offering, and forms of stock option award agreement, restricted stock award agreement, stock appreciation right award agreement, restricted stock unit award agreement, performance shares award agreement and stock bonus award agreement. | |
| 10.4+** | Offer Letter, dated March 23, 2004, between the Registrant and Daniel D. Springer. | |
| 10.5+** | Offer Letter, dated August 16, 2006, between the Registrant and Christian A. Paul, as amended. | |
| 10.6+** | Offer Letter, dated June 25, 2004, between the Registrant and Scott V. Olrich. | |
| 10.7+** | Offer Letter, dated March 21, 2007, between the Registrant and Edward A. Henrich. | |
| 10.8+** | Offer Letter, dated April 13, 2010, between the Registrant and Julian K. Ong. | |
| 10.9** | Sublease Agreement, dated October 15, 2007, as amended by the First Amendment to Sublease Agreement, dated August 31, 2009, between the Registrant and The Gap, Inc. | |
| 10.10** | Sub-sublease Agreement, dated May 4, 2010, by and between the Registrant and Business Alliance Insurance Company. | |
II-4
Table of Contents
| Exhibit |
Description | |
| 10.11** | Master Agreement, dated as of February 25, 2009, between the Registrant and AT&T Corp. | |
| 10.12** | Management M&A Incentive Plan, as adopted January 15, 2008. | |
| 21.1** | List of subsidiaries of the Registrant. | |
| 23.1 | Consent of Deloitte & Touche LLP, Independent Registered Public Accounting Firm. | |
| 23.2 | Consent of Ernst & Young, Independent Auditors. | |
| 23.3 | Consent of Fenwick & West LLP (included in Exhibit 5.1). | |
| 24.1** | Power of Attorney. | |
| 24.2** | Power of Attorney of Edwin J. Gillis. | |
| ** | Previously filed. |
| + | Indicates management contract or compensatory plan. |
| # | Schedules have been omitted pursuant to Regulation S-K Item 601(b)(2). Registrant hereby undertakes to furnish copies of any of the omitted schedules upon request by the Securities and Exchange Commission. |
(b) Financial Statement Schedules. The following financial statement schedule is filed as part of this registration statement:
Schedule II – Valuation and Qualifying Accounts
All other financial statement schedules are omitted because they are not applicable or the information is included in the Registrant’s consolidated financial statements or related notes.
| Item 17. | Undertakings |
The undersigned Registrant hereby undertakes to provide to the underwriters at the closing specified in the underwriting agreement, certificates in such denominations and registered in such names as required by the underwriters to permit prompt delivery to each purchaser.
Insofar as indemnification for liabilities arising under the Securities Act may be permitted to directors, officers and controlling persons of the Registrant pursuant to the foregoing provisions, or otherwise, the Registrant has been advised that in the opinion of the Securities and Exchange Commission such indemnification is against public policy as expressed in the Securities Act and is, therefore, unenforceable. In the event that a claim for indemnification against such liabilities (other than the payment by the Registrant of expenses incurred or paid by a director, officer or controlling person of the Registrant in the successful defense of any action, suit or proceeding) is asserted by such director, officer or controlling person in connection with the securities being registered, the Registrant will, unless in the opinion of its counsel the matter has been settled by controlling precedent, submit to a court of appropriate jurisdiction the question whether such indemnification by it is against public policy as expressed in the Securities Act and will be governed by the final adjudication of such issue.
The undersigned Registrant hereby undertakes that:
(1) For purposes of determining any liability under the Securities Act, the information omitted from the form of prospectus filed as part of this registration statement in reliance upon Rule 430A and contained in a form of prospectus filed by the Registrant pursuant to Rule 424(b)(1) or (4) or 497(h) under the Securities Act shall be deemed to be part of this registration statement as of the time it was declared effective.
(2) For the purpose of determining any liability under the Securities Act, each post-effective amendment that contains a form of prospectus shall be deemed to be a new registration statement relating to the securities offered therein, and the offering of such securities at that time shall be deemed to be the initial bona fide offering thereof.
II-5
Table of Contents
SIGNATURES
Pursuant to the requirements of the Securities Act of 1933, the registrant has duly caused this amendment to the registration statement to be signed on its behalf by the undersigned, thereunto duly authorized, in the City of San Bruno, State of California, on this 4th of April, 2011.
| RESPONSYS, INC. |
| /s/ DANIEL D. SPRINGER |
| Daniel D. Springer Chief Executive Officer |
Pursuant to the requirements of the Securities Act of 1933, this amendment to the registration statement has been signed by the following persons in the capacities and on the dates indicated.
| Signature |
Title |
Date | ||
| /s/ DANIEL D. SPRINGER Daniel D. Springer |
Chief Executive Officer (Principal Executive Officer) |
April 4, 2011 | ||
| /s/ CHRISTIAN A. PAUL Christian A. Paul |
Chief Financial Officer (Principal Financial Officer and Principal Accounting Officer) |
April 4, 2011 | ||
| * Robert W. Frick |
Director |
April 4, 2011 | ||
| * Edwin J. Gillis |
Director |
April 4, 2011 | ||
| * Bruce Golden |
Director |
April 4, 2011 | ||
| * Gregory C. Gretsch |
Director |
April 4, 2011 | ||
| * Michael N. Schuh |
Director |
April 4, 2011 | ||
| *By | /S/ CHRISTIAN A. PAUL | |
| Christian A. Paul Attorney-in-fact | ||
II-6
Table of Contents
EXHIBIT INDEX
| Exhibit |
Description | |
| 1.1 | Form of Underwriting Agreement. | |
| 2.1#** | Share Sale & Shareholders Agreement, dated July 1, 2010, between the Registrant, Eservices Group Pty Ltd, Diversified Marketing Services Pty Ltd, Cross Brothers Nominees Pty Ltd as trustee for APSN Trust, and O’Day Nominees Pty Ltd as trustee for O’Day Trust. | |
| 2.2# | Amendment to Share Sale and Shareholders Agreement dated January 2, 2011 between the Registrant, Eservices Responsys Pty Ltd (formerly Eservices Group Pty Ltd), Diversified Marketing Services Pty Ltd, Cross Brothers Nominees Pty Ltd and O’Day Nominees Pty Ltd. | |
| 3.1 | Restated Certificate of Incorporation of the Registrant. | |
| 3.2 | Bylaws of the Registrant. | |
| 3.3 | Form of Restated Certificate of Incorporation of the Registrant, to be in effect at the closing of this offering. | |
| 3.4 | Form of Restated Bylaws of the Registrant, to be in effect at the closing of this offering. | |
| 3.5** | Amended and Restated Articles of Incorporation of Responsys, Inc., a California corporation. | |
| 3.6** | Bylaws of Responsys, Inc., a California corporation. | |
| 4.1 | Intentionally omitted. | |
| 4.2** | Third Amended and Restated Investors’ Rights Agreement, dated January 6, 2003, by and among Registrant and certain security holders of the Registrant. | |
| 4.3** | Warrant to Purchase Shares of Series C Preferred Stock dated May 24, 2001 issued by the Registrant to Pentech Financial Services, Inc. | |
| 4.4** | Second Amended and Restated Right of First Refusal and Co-Sale Agreement, dated March 29, 2001, by and among the Registrant and certain securityholders of the Registrant. | |
| 5.1 | Opinion of Fenwick & West LLP. | |
| 10.1** | Form of Indemnification Agreement. | |
| 10.2+** | 1999 Stock Plan, as amended, and forms of stock option and stock option exercise agreement. | |
| 10.3+ | 2011 Equity Incentive Plan, to be in effect upon the closing of this offering, and forms of stock option award agreement, restricted stock award agreement, stock appreciation right award agreement, restricted stock unit award agreement, performance shares award agreement and stock bonus award agreement. | |
| 10.4+** | Offer Letter, dated March 23, 2004, between the Registrant and Daniel D. Springer. | |
| 10.5+** | Offer Letter, dated August 16, 2006, between the Registrant and Christian A. Paul, as amended. | |
| 10.6+** | Offer Letter, dated June 25, 2004, between the Registrant and Scott V. Olrich. | |
| 10.7+** | Offer Letter, dated March 21, 2007, between the Registrant and Edward A. Henrich. | |
| 10.8+** | Offer Letter, dated April 13, 2010, between the Registrant and Julian K. Ong. | |
| 10.9** | Sublease Agreement, dated October 15, 2007, as amended by the First Amendment to Sublease Agreement, dated August 31, 2009, between the Registrant and The Gap, Inc. | |
| 10.10** | Sub-sublease Agreement, dated May 4, 2010, by and between the Registrant and Business Alliance Insurance Company. | |
Table of Contents
| Exhibit |
Description | |
| 10.11** | Master Agreement, dated as of February 25, 2009, between the Registrant and AT&T Corp. | |
| 10.12** | Management M&A Incentive Plan, as adopted January 15, 2008. | |
| 21.1** | List of subsidiaries of the Registrant. | |
| 23.1 | Consent of Deloitte & Touche LLP, Independent Registered Public Accounting Firm. | |
| 23.2 | Consent of Ernst & Young, Independent Auditors. | |
| 23.3 | Consent of Fenwick & West LLP (included in Exhibit 5.1). | |
| 24.1** | Power of Attorney. | |
| 24.2** | Power of Attorney of Edwin J. Gillis. | |
| ** | Previously filed. |
| + | Indicates management contract or compensatory plan. |
| # | Schedules have been omitted pursuant to Regulation S-K Item 601(b)(2). Registrant hereby undertakes to furnish copies of any of the omitted schedules upon request by the Securities and Exchange Commission. |