Attached files
| file | filename |
|---|---|
| 8-K - FORM 8-K - OPTICAL CABLE CORP | d8k.htm |
Exhibit 99.1

Forward Looking Information
This presentation may contain “forward looking statements” that involve risks and uncertainties. These statements reflect management’s current expectations about possible future events and performance. Actual future results may differ materially due to a number of factors, including but not limited to, those factors set forth in detail in the “forward looking information” of our most recent annual report on Form 10-K and quarterly reports on Form 10-Q and in our other SEC reports—all such factors are incorporated herein by reference. These factors may be revised or supplemented in future reports filed with the SEC.
![]()
Page 2
Agenda
| • | OCC® Demonstrates Strength in Fiscal Year 2010. |
| • | The Right Strategy: A Proven Business Model. |
| • | Driving Shareholder Value. |
| • | Looking Forward to Fiscal Year 2011. |
![]()
Page 3
OCC Demonstrates Strength
in Fiscal Year 2010
![]()
Page 4
2010 Unfolded As Expected
| • | First half of 2010 continued to be challenging |
| • | Tough economy |
| • | Growing pains from integration of acquisitions |
| • | Second half of 2010 improved financial performance |
| • | Economy improving |
| • | Strong execution and integration successes |
![]()
5
Achieved Record Net Sales.
| • | OCC increased sales 31.7% during the second half of 2010 over same 2009 period, and increased 23.1% compared to the first half of 2010. |
| • | OCC reported net sales of $67.5 million in fiscal year 2010—highest annual net sales in the Company’s 27 year history! |
![]()
Page 6
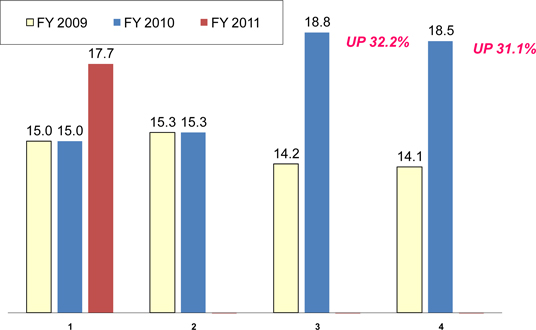
Consolidated Net Sales—by Quarter
(FY 2009, FY 2010 and Q1 2011)
(in millions $)
![]()
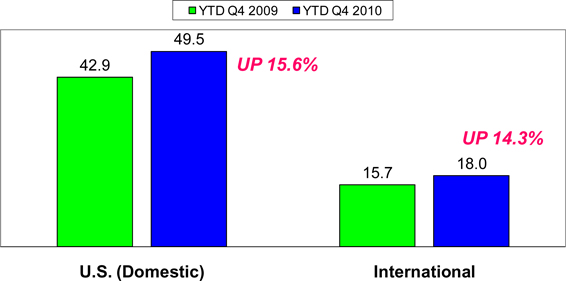
Consolidated Sales by Geography
FY 2009 v FY 2010 (in millions $)
![]()
Strong Financial Results.
| • | Increased gross profit margins: |
| • | Gross profit increased 19.8% to $23.8 million. |
| • | Gross profit margin (gross profit as a percentage of net sales) increased to 35.2% for fiscal year 2010 from 33.9% for fiscal year 2009. |
| • | Generated strong annual cash flow from operating activities. |
![]()
Page 9
Strong Financial Results (cont’d).
| • | Returned to profitability in second half of fiscal year 2010: |
| • | $0.09 net income per share in Q3 2010 attributable to OCC. |
| • | $0.23 net income per share in Q4 2010 attributable to OCC ($0.13 per share excluding accounting adjustment). |
| • | Controlled costs: |
| • | Decreased SG&A costs about $1 million (excluding acquisition of AOS). |
![]()
Page 10
Strong Financial Position.
| • | Initiated quarterly cash dividend in October 2010. |
| • | Made possible by strong balance sheet and ability to generate solid cash flow. |
| • | Reduced debt. |
| • | Paid down OCC’s revolving credit facility balance to $700,000 at year end, and paid off by January 31, 2011. |
![]()
Page 11
The Right Strategy:
A Proven Business Model.
![]()
Page 12
The Right Strategy.
| • | Our strategy is to position OCC to provide unrivaled integrated solutions™ to our customers and end-users, as well as top-tier components that seamlessly integrate with other providers’ offerings. |
| • | Acquired Applied Optical Systems, Inc. (October 2009) and SMP Data Communications (May 2008). |
![]()
Page 13
The Execution.
| • | Significant effort and resources committed to integration of SMP Data Communications and AOS acquisitions. |
| • | Organizational changes designed to improve the OCC customer experience. |
| • | Marketing initiatives and process improvements. |
| • | Unified and collaborative manufacturing and engineering strategies. |
![]()
Page 14
The Results: Proven Business Model.
| • | OCC Team has fundamentally changed OCC’s position in the industry—perfectly positioning OCC with customers and potential customers by providing needed cabling and connectivity solutions. |
| • | Realized sales synergies between product lines—generating new business. |
| • | Realized operating synergies—enabling us to be more efficient. |
| • | Solutions-based approach—resulting in new products. |
![]()
Page 15
The Results: Proven Business Model.
| • | Operating leverage in our model generates disproportionate returns as net sales increase, while fixed production costs and necessary expenses increase at a slower rate. |
| • | Model proven during the second half of fiscal year 2010—and during Q1 2011, even without full recovery. |
![]()
Page 16
Driving
Shareholder Value.
![]()
Page 17
Improved Market Valuation.
| • | OCC’s 52-week trading range: $2.16 to $7.41. |
| • | $7.41 high achieved less than 30 days ago (March 3, 2011). |
| • | OCC’s net book value attributable to OCC was $28.2 million, or $4.53 per share, at end of Q1 2011. |
![]()
Page 18
Driving Shareholder Value.
| • | OCC’s financial results have driven increase in shareholder value. |
| • | Also, OCC initiated quarterly dividend in October 2010. |
| • | OCC has purchased 151,143 shares of the 325,848 shares authorized under its October 2009 repurchase program at an average price of $3.02 per share (including legal and brokerage fees). |
![]()
Page 19
Looking Forward
to
Fiscal Year 2011.
![]()
Page 20
Q1 2011 Results.
| • | OCC increased sales 18.0% to $17.7 million, compared to same period last year. |
| • | Gross profit increased 16.8% to $6.4 million. |
| • | SG&A expenses decreased 1.1% compared to Q1 2010. |
| • | Net income of 6 cents per share. |
| • | Once again—generated positive cash flow from operating activities. |
![]()
Page 21
Q1 2011 Results. (cont’d)
| • | Paid off our revolving credit facility, resulting in $6.0 million in unused and available credit. |
| • | OCC declared its second quarterly dividend in January 2011. |
![]()
Page 22
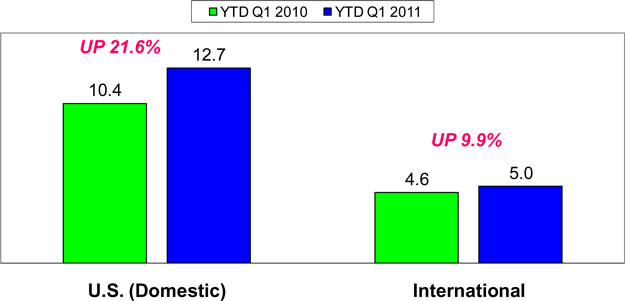
Consolidated Sales by Geography
Q1 2010 v Q1 2011 (in millions $)
![]()
Looking Forward to Fiscal Year 2011.
| • | The economic recovery is still fragile—particularly with significant world uncertainty. |
| • | Some degree of quarterly volatility—even seasonality (?). Sales affected by ebbs and flows of economic recovery ripple through various sectors of the economy during fiscal 2011. |
| • | Early—Yet on track for over $70 million in net sales for FY 2011! |
![]()
Page 24
Every Reason to be Optimistic.
| • | OCC well positioned strategically. |
| • | Proven business model with demonstrated earnings, cash flow and shareholder value creation. |
| • | Improving economy. |
![]()
Page 25

New Ticker
“OCC”
Effective March 31, 2011

Celebrating 15 years on Nasdaq.
![]()
26