Attached files
UNITED STATES
SECURITIES AND EXCHANGE COMMISSION
Washington, D.C. 20549
FORM 10-K
(Mark One)
|
x
|
ANNUAL REPORT PURSUANT TO SECTION 13 OR 15(d) OF THE SECURITIES EXCHANGE ACT OF 1934
|
For the Fiscal Year Ended December 31, 2010
|
o
|
TRANSITION REPORT PURSUANT TO SECTION 13 OR 15(d) OF THE SECURITIES EXCHANGE ACT OF 1934
|
For the Transition Period From ____________ to ____________
Commission File No. 000-22400
STRATEGIC DIAGNOSTICS INC.
(Exact name of Registrant as specified in its charter)
|
Delaware
|
56-1581761
|
|
(State or other jurisdiction of
|
(I.R.S. Employer
|
|
incorporation or organization)
|
identification no.)
|
|
111 Pencader Drive
|
|
|
Newark, Delaware
|
19702
|
|
(Address of principal executive offices)
|
(Zip Code)
|
Registrant’s telephone number, including area code: (302) 456-6789
Securities registered pursuant to Section 12(b) of the Act: None
|
Title of Each Class
|
Name of Each Exchange on Which Registered
|
||||||
|
Common Stock, $0.01 par value
|
The NASDAQ Stock Market LLC
|
||||||
Securities registered pursuant to Section 12(g) of the Act:
None
Indicate by check mark if the Registrant is a well-known seasoned issuer, as defined in Rule 405 of the Securities Act. Yes o No x
Indicate by check mark if the Registrant is not required to file reports pursuant to Section 13 or Section 15(d) of the Exchange Act. Yes o No x
Indicate by check mark whether the Registrant: (1) has filed all reports required to be filed by Section 13 or 15(d) of the Securities Exchange Act of 1934 during the preceding 12 months (or for such shorter period that the registrant was required to file such reports), and (2) has been subject to such filing requirements for the past 90 days. Yes x No o
Indicate by check mark whether the registrant has submitted electronically and posted on its corporate Web site, if any, every Interactive Data File required to be submitted and posted pursuant to Rule 405 of Regulation S-T (§ 232.405 of this chapter) during the preceding 12 months (or for such shorter period that the registrant was required to submit and post such files). Yes o No o
Indicate by check mark if disclosure of delinquent filers pursuant to Item 405 of Regulation S-K is not contained herein, and will not be contained, to the best of Registrant’s knowledge, in definitive proxy or information statements incorporated by reference in Part III of this Form 10-K or any amendment to this Form 10-K. o
Indicate by check mark whether the Registrant is a large accelerated filer, an accelerated filer, a non-accelerated filer or a smaller reporting company. See the definitions of “large accelerated filer,” “accelerated filer” and “smaller reporting company” in Rule 12b-2 of the Exchange Act. (Check one):
|
Large Accelerated Filer o
|
Accelerated Filer o
|
Non-Accelerated Filer o
|
Smaller Reporting Company x
|
|
(Do not check if a smaller
reporting company)
|
Indicate by check mark whether the Registrant is a shell company (as defined in Rule 12b-2 of the Exchange Act). Yes o No x
The aggregate market value of the common stock held by non-affiliates of the Registrant was $26,760,698, calculated by using the number of shares outstanding and the closing price of the common stock on June 30, 2010 (the last business day of the Registrant’s most recently completed second fiscal quarter).
As of March 25, 2011 there were 20,536,730 shares outstanding of the Registrant’s common stock, par value $0.01 per share.
DOCUMENTS INCORPORATED BY REFERENCE
Portions of the definitive proxy statement (the “Definitive Proxy Statement”) to be filed no later than April 30, 2011 with the Securities and Exchange Commission relative to the Company’s 2011 Annual Meeting of Stockholders are incorporated by reference into Part III of this Report.
|
PART I
|
|
|||
|
ITEM 1.
|
BUSINESS
|
1
|
||
|
Overview
|
1
|
|||
|
Life Sciences
|
1
|
|||
|
Life Sciences Products and Services
|
2
|
|||
|
Kit Products
|
3
|
|||
|
Food Safety Products
|
3
|
|||
|
Agricultural Testing
|
4
|
|||
|
Water Quality
|
5
|
|||
|
Environmental Contamination Detection Products
|
6
|
|||
|
Sales and Marketing Strategy
|
6
|
|||
|
Competition
|
6
|
|||
|
Markets and Products
|
7
|
|||
|
Geographic and Customer Information
|
7
|
|||
|
Regulatory Approvals
|
7
|
|||
|
Manufacturing
|
8
|
|||
|
Research and Development
|
9
|
|||
|
Proprietary Technology and Patents
|
9
|
|||
|
Employees
|
10
|
|||
|
Organizational History
|
10
|
|||
|
ITEM 1A.
|
RISK FACTORS
|
10
|
||
|
ITEM 1B.
|
UNRESOLVED STAFF COMMENTS
|
14
|
||
|
ITEM 2.
|
PROPERTIES
|
14
|
||
|
ITEM 3.
|
LEGAL PROCEEDINGS
|
15
|
||
|
ITEM 4.
|
[REMOVED AND RESERVED]
|
15
|
||
|
PART II
|
16
|
|||
|
ITEM 5.
|
MARKET FOR REGISTRANT’S COMMON EQUITY, RELATED STOCKHOLDER MATTERS AND ISSUER PURCHASES OF EQUITY SECURITIES
|
16
|
||
|
Stock Performance Graph
|
17
|
|||
|
ITEM 6.
|
SELECTED FINANCIAL DATA
|
18
|
||
|
ITEM 7.
|
MANAGEMENT’S DISCUSSION AND ANALYSIS OF FINANCIAL CONDITION AND RESULTS OF OPERATIONS
|
19
|
||
|
Forward Looking Statements
|
19
|
|||
|
Overview
|
19
|
|||
|
Results of Operations
|
20
|
|||
|
Year ended December 31, 2010 versus year ended December 31, 2009
|
20
|
|||
|
Year ended December 31, 2009 versus year ended December 31, 2008
|
21
|
|||
|
Liquidity and Capital Resources
|
22
|
|||
|
Off-Balance Sheet Arrangements
|
24
|
|||
|
Contractual Obligations
|
24
|
|||
|
Critical Accounting Policies
|
24
|
|||
|
New Accounting Standards and Disclosures
|
26
|
|||
|
ITEM 7A.
|
QUANTITATIVE AND QUALITATIVE DISCLOSURES ABOUT MARKET RISK
|
26
|
||
|
ITEM 8.
|
FINANCIAL STATEMENTS AND SUPPLEMENTARY DATA
|
27
|
||
|
ITEM 9.
|
CHANGES IN AND DISAGREEMENTS WITH ACCOUNTANTS ON ACCOUNTING AND FINANCIAL DISCLOSURE
|
27
|
||
|
ITEM 9A.
|
CONTROLS AND PROCEDURES
|
27
|
||
|
ITEM 9B.
|
OTHER INFORMATION
|
27
|
||
|
PART III
|
28
|
|||
|
ITEM 10.
|
DIRECTORS, EXECUTIVE OFFICERS AND CORPORATE GOVERNANCE
|
28
|
||
|
ITEM 11.
|
EXECUTIVE COMPENSATION
|
28
|
||
|
ITEM 12.
|
SECURITY OWNERSHIP OF CERTAIN BENEFICIAL OWNERS AND MANAGEMENT AND RELATED STOCKHOLDER MATTERS
|
28
|
||
|
ITEM 13.
|
CERTAIN RELATIONSHIPS AND RELATED TRANSACTIONS, AND DIRECTOR INDEPENDENCE
|
29
|
||
|
ITEM 14.
|
PRINCIPAL ACCOUNTING FEES AND SERVICES
|
29
|
||
|
PART IV
|
30
|
|||
|
ITEM 15.
|
EXHIBITS AND FINANCIAL STATEMENT SCHEDULES
|
30
|
||
Item 1. Business
Overview
SDIX (“SDIX,” the “Company,” “we,” “our” or “us”), is a biotechnology company with a core mission of developing, commercializing and marketing innovative, effective products and solutions, many of which are proprietary, that preserve and enhance the quality of human health and wellness. The Company serves the pharmaceutical, biotechnology, diagnostics, food safety and environmental markets.
SDIX is a customer-centric organization. Our goals are to consistently deliver increased value to our customers through products and services that facilitate business results, reduce costs and help manage risk. SDIX sales professionals focus among other things on delivering a quantifiable “return on investment” to their customers, demonstrating to them how to reduce time and total costs associated with applications for which the Company’s products are used. In addition, the Company believes its tests and immuno-solutions provide high levels of accuracy and reliability, delivering more actionable results to the customer compared to alternative products.
The Company is focused on achieving profitable growth by leveraging its expertise in antibodies and immuno-technologies to successfully develop proprietary products and services that enhance the competitive advantage of our customers.
The Company believes that our competitive position has been enhanced through the combination of talent, technology, and resources resulting from the business development activities we have pursued since our inception. The Company has achieved meaningful economies of scale for the products it offers through the utilization of its facilities in Newark, Delaware for the manufacture of test kits and antibodies and its facilities located in Windham, Maine for the manufacture of antibodies.
The Company’s Life Sciences product portfolio includes a full suite of integrated immuno-solution capabilities including assay design, development and production. These capabilities, combined with our proprietary Genomic Antibody Technology™ (“GAT™”), are being used today to help discover the mechanisms of disease, facilitate the development of new drugs, and provide the means for rapid diagnosis.
The Company’s Food Safety portfolio includes immunoassays that represent advanced technology for rapid, cost-effective, easy-to-use and accurate detection of food pathogens. SDIX’s RapidChek® and SELECT ™ test kits are experiencing growing adoption for the detection of pathogens such as E. coli, Salmonella and Listeria in the production, processing, and manufacturing of food and beverages.
SDIX has been developing antibodies which have advanced our customers’ immuno-based work for 20 years. By applying its core competencies of creating proprietary, high-quality antibodies and assay development solutions, the Company has produced sophisticated testing and reagent systems that are responsive to our customers’ analytical information needs.
The Company segregates its business into two areas, Life Sciences and Kit Products, which are described below.
Life Sciences
SDIX is a leading provider of a wide range of life sciences products and services, including custom antibodies, in-vitro diagnostic-grade antibodies, proprietary critical reagent products, associated bio-processing services, and custom assay design and development services. The Company’s products and services are sold to, and often embedded in other commercial products used by, a wide range of customers including pharmaceutical, biotechnology and diagnostic companies, and major biomedical research centers both domestically and internationally. The Company is fully integrated to deliver a wide range of services encompassing its customers’ immuno-solution needs from antigen design and antibody development through large scale production and post production bio-processing and immunoassay design and development. Customer service, innovation, and expertise are the foundation of the Company’s competitive advantage. The Company’s ISO9001:2008 accredited facilities employ sophisticated production processes that are reliable and deliver high quality to its customers, and its Newark, Delaware and Windham, Maine facilities are certified and accredited by the Association for the Assessment and Accreditation of Laboratory Animal Care (“AAALAC”), the highest standard in laboratory animal care. The Company is licensed by the U.S. Department of Agriculture for research and its work with laboratory animals.
GAT™ innovation is a key element of the Company’s Life Sciences strategy for establishing and maintaining sustainable differentiation in key markets. The study of gene and protein functionality has created a growing demand for antibody reagents, yet commercially available antibodies exist for only a fraction of the diversity of all proteins and protein modifications. GAT™ was developed to address this growing need for high quality reagents in the Life Science industry. GAT™ products and services utilize sophisticated bioinformatics and immunization strategies to produce high value antibody reagents and biomolecules. SDIX’s application of powerful proprietary algorithms provides GAT™ the ability to “dial in” the precise gene or protein sequence to produce a recombinant protein inside the host animal that in turn elicits an immune response to the encoded protein. This “specificity by design” approach generates antibodies that recognize the conformational epitopes on the native protein. The ability of any antibody to recognize a protein’s naturally folded state has the potential to expand a biomolecule’s utility to advance platforms like flow cytometry. A recognized advantage is the technology’s ability to produce reagents against traditionally difficult cellular targets, such as highly conserved proteins, ion channels and transmembrane proteins.
1
Immunoassay Technology. An immunoassay is an analytical test that uses antibodies to detect the presence of a target in a complex biological sample with high degrees of sensitivity, precision and accuracy. Immunoassays play a central role in the detection and quantitation of proteins associated with disease diagnosis, prognosis and progression, and therapeutic toxicity, efficacy and outcome. Antibody quality and fit for assay application are key to success. The Company’s scientists are experts in antigen design, antibody development and immunoassays. The Company’s scientific expertise with multiple immunoassay formats, coupled with a thorough understanding of the needs of markets and specific customer applications, has allowed the Company to develop a diverse array of immunoassay products.
Life Sciences Products and Services
The overall Life Sciences market is experiencing growth due to the expansion of research in the genomic era into understanding the role of proteins in biology and medicine. According to Frost & Sullivan and other market researchers, the global market for antibody-based reagents and tools in 2008 was approximately $1.8 billion with estimated annual growth in the range of 5-7%. Custom reagent development and production account for approximately $450 million with an estimated 10-12% annual growth rate and premade reagent products comprised approximately $1.4 billion with an estimated annual growth rate in the 5-7% range. We believe that customers in these markets regard the Company as a leader in the design, development and production of critical tools used to target, differentiate, quantify and profile the vast number of proteins related to human health. The Company links its historical expertise in immunotools and immunoassays with the speed and agility of its proprietary GAT™ platform. Post-genomics drug development is a rapidly emerging sector for proteomic immunotools. Within this market, investment has largely shifted from discovery activities into more information-rich integrated development activities. Within the past two years, the Company has supplied 14 of the top 20 pharmaceutical and biopharmaceutical companies with proteomic immunotools to further their drug development programs as well as initial clinical candidates for monoclonal antibody therapeutics. The Company produces antibodies to targets and biomarkers of interest allowing customers to quickly assess the feasibility, efficacy and safety of compounds in their developmental pipelines.
Protein biomarkers as predictive, prognostic, diagnostic, and reporters of activity throughout the drug discovery and development workflow have created increased needs for protein identification and quantitation tools. The Company sees advances in the use of antibodies as tools to measure biomarkers. BCC Research “Biomarkers: The Expanding Global Market”, issued in 2008, projects annual market size for the entire biomarker services industry to be at $13 billion by 2012. The biomarker assay testing market has a proven record of revenue generation. The market was $612 million in 2007 and is estimated to have an annual growth rate of 23.5%. This estimate is based solely on assays and products that are currently available. Currently, high-quality biomarker assays exist for less than 500 proteins (across all species), a fraction (1-2%) of the total number of proteins encoded by the genomes of key species (e.g., human and rodent). We believe that customers in these markets view the Company as a key provider of critical antibody reagents and immunoassay design and development.
We believe that the Company’s experience in antigen design, antibody generation and immunoassay development, together with its proprietary GAT™ platform, put it in a strong position to address these needs. In 2009, SDIX was selected for a third consecutive time through an open Request for Proposal by Science Applications International Corporation (“SAIC”) in cooperation with the National Cancer Institute to generate a library of monoclonal reagents against cancer biomarkers. These antibodies are expected to become part of a reference set of validated tools for researchers. The Company also has a portfolio of catalog antibodies made using its GAT™ platform available for sale online. Within the past year, many new customers have benefitted from these oncology-focused research reagents. In many cases, a singular product has been selected by a client to become a critical testing reagent in long term projects, precipitating the transition of a per-unit sale into a critical reagent supply agreement. These antibodies are now a resource for the Company to assess application in novel platforms, assays and multiplex applications.
The Company offers its services to the IVD market as a CMO (Contract Manufacturing Organization). SDIX’s expertise in immunoassay area and large-scale production capabilities enable it to address IVD clients’ clinical assay needs. Products and services include: analyte specific reagents, custom manufacturing of antibodies (monoclonal and polyclonal) and calibrators, and consultation for immunoassay design.
The Company’s products are suitable for use in a variety of immunoassay formats, including lateral flow devices (LFD) and agglutination assays. The Company’s experience in polyclonal production management and reagent processing ensures lot-to-lot consistency in reagent supply. SDIX facilities (monoclonal as well as polyclonal) are also equipped to meet large volume needs.
The Company maintains regulatory compliance, industrial scale and efficiencies, and necessary quality systems to assure a reliable supply of critical reagents to its partners. The Company offers long-term contracts, in-house quality control and vendor management options in order to address global IVD companies’ immunoassay reagent needs. The Company is supplying diagnostic quality reagents to major global IVD companies, and focuses on high value service areas such as antibody development for new assay targets.
2
Kit Products
The Company’s detection technologies allow industrial customers to rapidly and cost-effectively identify the presence of adulterants, such as chemical toxins, biological pathogens and other contaminants, which can compromise human or environmental safety, and/or financially impact efficiencies of production processes. Many of the Company’s products are in the form of single use test devices, sample prep materials and reagents, thus creating recurring revenue opportunities. Specific industry applications include:
|
|
●
|
Food and Beverage Manufacturing: Systems for high efficiency testing for the identification of pathogens and toxins in food, water and the manufacturing environment.
|
|
|
●
|
Water Utilities: Drinking water facilities test for chemical toxins and pathogens. Wastewater treatment facilities manage pollution control by monitoring efficiency maintenance in biological processing systems, specifically testing for influent and effluent toxic chemicals and pesticides.
|
|
|
●
|
Environmental Management: On-site testing systems to increase the speed and accuracy of environmental monitoring and remediation of soil and ground water pollutants.
|
|
|
●
|
Agriculture and Agro-science: Systems for the detection, identity preservation and quantification testing of genetically modified organisms, and test systems for feed and grain safety testing, including for the presence of mycotoxins.
|
By leveraging its expertise in immunology, proteomics, bio-luminescence and other bio-reactive technologies with innovative application and production capabilities, the Company is able to provide sophisticated diagnostic testing and reagent systems to a diverse customer base serving multiple vertical markets.
Food Safety Products
The Company’s food safety product line includes enrichment media and rapid tests to detect food pathogens, including E. coli O157 (including H7), Listeria and Salmonella.
Food Pathogen Testing
Pathogen specific testing is an increasingly important part of microbiology testing performed in the global food industry. The worldwide market for pathogen tests and media is estimated to be between $850 million and $1 billion according to independent studies and the Company’s own market research. According to several independent studies, the market for pathogen tests grew at a rate of 5 to 7% in 2009 and this growth rate is expected to continue for the next several years. Growth in pathogen testing is driven primarily by regulatory changes, customer testing trends, industry consolidation, and globalization of the world’s food supply.
Since 2001, the Company has invested in the development and market introduction of products for the detection of pathogenic microorganisms in food. In 2002, the Company introduced its first test method for the pathogen E. coli O157 (including H7). The RapidChek® E. coli O157:H7 test strips and proprietary media system have received ongoing market acceptance in the United States. In addition, the RapidChek® test for detection of E. coli O157:H7 was selected by the Food Safety Inspection Service (“FSIS”), the public health agency in the United States Department of Agriculture (“USDA”), as an approved methodology for screening of the organism in raw beef samples. The FSIS section of the USDA conducted a rigorous evaluation of rapid methods that are currently on the market for screening pathogens, including polymerase chain reaction, and automated/manual immunoassays and benchmarked kit performance against the current USDA traditional cultural method. The RapidChek® E. coli O157:H7 method was evaluated and determined to be the “best in class” against the other immunological methods tested. RapidChek® has been included in the USDA Microbiological Laboratory Guidelines as one of only two immunoassays that are recognized for use in screening raw beef for E. coli O157 (including H7). The Company believes that the acceptance of its method by the agencies regulating food safety has increased sales as producers seek to use methods that have been evaluated by the regulatory agencies. The RapidChek® E. coli O157:H7 test system has also received international recognition with regulatory approvals in Canada (Canadian Food Inspection Agency) and Australia (Australian Quarantine and Inspection Service). In 2009, the Company received AOAC Research Institute Performance Tested Method certification for improvements made to the RapidChek E. coli O157 test method including validation of the testing of composite 375g ground beef and beef trim sample.
In June 2004, the Company launched its test for detection of Listeria. This test system received AOAC Research Institute (“AOAC,” “AOAC-RI”) approval for both food and environmental samples, in contrast to several competitive methods on the market that have AOAC approval for food samples only. As a result of new regulations enacted by the USDA in 2003, environmental samples account for approximately 80% of all Listeria testing. The Listeria test incorporates the use of a proprietary enrichment procedure that provides results in 40 hours. In addition, the proprietary enrichment system does not require a transfer step, providing significant labor savings compared to other methods on the market. As with all pathogen systems, food companies require internal evaluations prior to adoption. In these evaluations, the Company’s Listeria test system demonstrated superior performance and improvements in efficiency and productivity compared to most competitive methods on the market. As a result of improvements in performance and cost-in-use, the Company has had the Listeria product adopted by a number of very large food processors.
3
In August 2006, the Company launched its new RapidChek® SELECT™ Salmonella test with AOAC-RI approval at the International Association of Food Protection Meeting in Calgary, Canada. This novel test is based on a patented phage technology combined with the Company’s next generation lateral flow technology and has revolutionized the Salmonella testing arena. The RapidChek® SELECT ™ test was developed to meet some of the challenges faced in Salmonella testing, including high false positive and negative rates, which can be particularly prevalent in high burden samples. The patent claims technology that increases both the specificity and sensitivity of rapid pathogen tests. In September 2006, the RapidChek® SELECT ™ Salmonella test was the first lateral flow test approved for the National Poultry Improvement Plan, and will provide an attractive alternative to current methods used such as labor intensive cultural methodologies. The RapidChek® SELECT ™ Salmonella test was evaluated and adopted by several of the top poultry and beef processors in 2007. The launch and acceptability of RapidChek® SELECT ™ in the market has also facilitated the increase in sales of the RapidChek® Listeria system, as most processors prefer to utilize one platform for multiple testing needs. Customers have cited the use of SELECT ™ contributing to improved laboratory efficiencies and significant savings as compared to what they were previously using to test. In 2010, the Company received AOAC-RI certification for the RapidChek SELECT salmonella system for environmental surface testing using a 24-hour protocol. Also, in 2010, the Company received AFNOR Validation of the RapidChek SELECT Salmonella test system which is critical for marketing of rapid test system in Europe, particularly in France.
In July 2010, the Company launched its new RapidChek SELECT Salmonella Enteritidis (SE) test system. It is applicable to both egg and poultry industries, and will specifically help U.S. commercial egg producers comply with the recent FDA regulation that requires them to test poultry houses and eggs for Salmonella Enteritidis (SE). The new FDA rule became effective July 9, 2010 for commercial egg producers with over 50,000 laying hens and becomes effective July 9, 2012 for egg producers with between 3,000 and 49,999 laying hens. The new rule will affect approximately 3,300 commercial egg producers in the USA. It is estimated that 47 billion eggs are consumed annually in the U.S. and according to reports from the USDA and FDA, there are 2.3 million eggs annually contaminated with Salmonella Enteritidis. In November, 2010 the RapidChek SELECT SE method received AOAC-RI Performance Tested Method certification validating the system for poultry house environmental samples, pooled egg samples and poultry carcass rinses. In January 2011, the US FDA determined that the method was equivalent in accuracy, precision and sensitivity to the traditional testing methods for detecting SE in environmental and pooled egg samples. In February 2011, the RapidChek® SELECT™ Salmonella Enteritidis (SE) test system was granted interim National Poultry Improvement Plan (NPIP) approval by the Secretary’s Advisory Committee on Poultry Health for use in detecting the presence of Salmonella Enteritidis in poultry environments. With these regulatory approvals, the Company believes that its test can help the approximately 3,300 egg producers comply with the new FDA regulations and significantly reduce SE poultry house contamination levels from those being experienced today by providing a more sensitive and accurate detection of SE.
Bacteriophage Technology
Bacteriophage, or phage, are viruses that infect bacteria. They are highly specific for the type of bacteria that they infect and do not infect any other living cell from any other organism including animal, plant, fungus or yeast. Because lytic bacteriophage specifically kill their bacterial hosts and not other living cells, purified preparations of phage have been used medicinally to treat bacterial infections of plants, animals and humans. The use of bacteriophage as a human therapeutic attests to the biological specificity and safety of these viruses. In the last two years, the U.S. Food and Drug Administration (“FDA”) has approved the use of bacteriophage products for direct application to ready-to-eat foods for reduction of Listeria bacteria based on the determination that phage are “generally recognized as safe” (“GRAS”).
The Company is applying its bacteriophage technology in its test kit products for the detection of bacterial food pathogens, including its Salmonella SELECT ™ product. The Company has been awarded a U.S. patent claiming the use of bacteriophage to control competing and cross-reacting bacteria, thereby reducing false positive and negative results and improving analytical test performance.
The Company has also filed patent applications claiming the use of specific lytic bacteriophage to control contaminating bacteria in large scale industrial fermentation processes such as ethanol and lysine production. The Company believes that the use of bacteriophage is a significant improvement over the use of antibiotics and may have a positive impact on yield and cost associated with the production of ethanol from feedstock.
Agricultural Testing
Genetically Modified Crops
Tests for GM traits are generally used to determine whether the sample tested contains the protein associated with the genetic modification. Seeds, grain or leaf tissue are typically tested. The tests may be employed by users desiring to ensure that seed or grain lots are either GM-free or, in other cases, that they contain a specified amount of the GM material in order to meet certain GM requirements. Among the commodities typically tested with the Company’s products are corn, soybeans, rice and cotton. The Company estimates that the worldwide demand for protein based testing of genetically modified crops is $15 million per year. To address this market, the Company entered into an exclusive, worldwide (except Brazil) distribution agreement with Romer Labs (Union, MO) in 2010 for all its TraitChek, SeedChek and GMOChek branded test systems for detecting genetically modified crops.
4
The Company has developed a simple “one-step” test that is used at the point of testing to determine if an individual plant contains the targeted genetic trait. Commercial seed producers use these products to ensure the quality of their products. This type of test also can be used in crops for enforcement purposes to expose unlicensed application of the genetic technology.
Acceptance of GM crops has increased and as the development of new traits has risen, some countries have adopted regulations on biotech crops. In 2004, the European Union (“EU”) adopted regulations regarding labeling and traceability of GM food and feed with enforcement beginning in April 2004. The regulatory tolerance for EU-authorized GM traits is 0.9%, and 0.5% for unauthorized GM traits that have already received a favorable risk assessment from various U.S. regulatory agencies. Traceability systems must be in place and must demonstrate that any traces of GM traits are adventitious and are technically avoidable. The Company no longer believes that the impact of regulations will result in stricter testing of grain and grain exports from countries growing GM crops, or increases in testing to meet these new regulations. Conversely, widespread acceptance of GM crops is generally reducing the practice of grain testing as GM traits are increasingly ubiquitous in the environment.
Water Quality
The Company’s water quality product line includes industrial bio-detection kits for water and soil contaminants such as pesticides, explosives, petroleum related products and polychlorinated biphenyls (PCBs); Microtox® toxicity tests used in a wide array of market segments; and products for detecting polymers and corrosion in water. In addition to use by water utilities and related government agencies, the product line is used in many industrial manufacturing segments, environmental remediation, research and ecological studies. The global market for analytical testing associated with the water and environmental industries is estimated at $1.4 billion based on a compilation of market research studies. The overall annual growth rate in developed markets is estimated at 0-2%, while the annual growth rate in developing markets, primarily Asia, is estimated at 7-9%. The biggest driver for growth is government regulations associated with water quality and environmental protection.
Bioluminescence Technology
The Company’s Microtox® and DeltaTox® tests use a specific strain of luminescent bacteria as biosensors of toxicity, especially in water samples. These bacteria, when exposed to certain chemicals, undergo a chemical reaction resulting in the emission of visible light. Light output is inversely proportional to the toxicity of the sample being tested.
SDIX’s solutions include the instrumentation, reagents and technology necessary to employ testing. The Company has developed proprietary technology to analyze the results and calculate toxicity according to industry standard and regulatory methods. These solutions are highly reliable and offer significantly greater precision than other commonly applied measures of toxicity employing small numbers of living organisms (e.g., fish). The Company’s products, reagent kits, instruments and software provide for rapid and inexpensive assessment of toxicity in multiple applications including approved regulatory methods in many countries worldwide.
Toxicity Testing
In 2001, the Company acquired AZUR Environmental Limited to add the Microtox® product line to its portfolio. Microtox® is a unique rapid acute toxicity test that detects a broad range of toxins and chemical agents. The Microtox® brand is the global reference standard for rapid acute toxicity testing. Microtox® makes toxicity analysis simple and easy to perform and results can be generated in as little as 30 minutes. The Company also markets a portable version of the Microtox® technology known as DeltaTox®. Many water utilities and emergency response teams are using DeltaTox® technology as part of their Water Fit for Use and emergency response programs. Microtox® has been widely accepted by the wastewater treatment industry where managing and controlling costs by accurately assessing the mechanical, operational and chemical performance of these facilities is critical. Microtox® delivers value by helping to improve operating efficiency and by helping facilities stay in compliance with their discharge permits.
In February 2006, the Company announced that its Microtox® bioassay technology was awarded the Designation and Certification as an “Approved Product for Homeland Security” by the Department of Homeland Security. In December 2007, the Company was awarded a Federal Supply Schedule GSA contract. The contract further expands the Company’s reach into federal, state and local agencies, in addition to making it easier for these agencies to do business with the Company.
In March 2010, the Company launched its next generation DeltaTox® instrument. This new instrument, DeltaTox® II, includes features to further enhance business results by enabling global customers implementing strong Water Fit for Use programs.
5
Environmental Contamination Detection Products
The entrance of pesticides into the water supply is a result of agricultural and residential runoff. In areas of substantial agricultural activity, drinking water is tested for pesticides to protect supplies and to comply with federal and state regulations. The Company’s pesticide test kits are used in situations where field testing, or the testing of one specific pesticide gives the test kit much greater utility than a lab-based analyzer. Users include federal agencies such as the U.S. Geological Survey and USDA, state environmental and health departments, water utilities and environmental engineering companies. The Company also sells immunoassay products in the environmental market. The Company offers three different test formats, each with performance characteristics that make them well suited for a particular customer application. All of the Company’s environmental test kits are capable of analyzing multiple samples in parallel. The Company is currently marketing kits for a variety of contaminant classes and has been able to expand its product offerings through distribution agreements to accommodate new technologies.
Sales and Marketing Strategy
The Company markets and sells products in the life sciences, food safety and water quality product categories through a U.S. direct sales force, Internet presence and a network of over 50 distributors in Canada, Mexico, Latin America, Europe and Asia and through the Company’s corporate partners. The Company markets and sells products in agricultural testing exclusively through distributors. The Company also has international sales representatives based in England. The Company evaluates various sales and service models that can contribute to the profitable growth of business. Identifying the most effective channels to market will allow the Company to better allocate resources to both new and existing growth opportunities.
In the United States, the primary sales channel is through a direct sales force comprised of geographically based field sales professionals, key segment managers, and inside sales associates. The sales force is augmented by customer service and project management organizations, and applied technical marketing specialists which assure that all elements of the customer’s buying experience meet and exceed their performance expectations.
On the basis of its strengthening market position, the Company continues to develop channels to market and accelerate predictability and sustainability of revenues. The Company is investing in its direct sales force through the addition of new sales representatives and focused sales and technical training. The Company continually measures sales performance and maintains discipline in the balance between the addition of new sales resources and ongoing efforts to continually improve sales efficiency and effectiveness of existing resources.
The Company is also focusing on its network of quality channel partners. In 2006, the Company added its first distributor for its custom antibody offering. The Company is working to add additional channel partners for both its custom and catalog offerings nationally and internationally.
Since 2007, The Company has expanded its international distribution network for food safety pathogen products, adding and training a total of 15 independent distributors to sell the RapidChek® product line in high growth markets globally, including Southeast Asia, Europe and Latin America. The Company also took a much more aggressive role in marketing these methods. It is anticipated that the additional distributors and international expansions of promotion/sales of the products will increase revenues as they gain acceptability.
Competition
Many of the Company’s potential competitors are large companies with substantially greater financial and other resources than the Company. To the extent that any such companies enter into one or more of the Company’s markets, the Company’s operations could be materially adversely affected. The Company anticipates increased competition as potential competitors perceive that the Company’s products have become commercially proven, or if the Company cannot maintain competitive differentiation.
In the Ag/GMO market, the Company competes with several small, privately held companies (Agdia, Envirologix) that market very similar, if not identical products.
In food pathogen testing, the Company is among the more recent entrants to the market and faces a broad base of competition. The worldwide market for pathogen tests is estimated to be between $850 million and $1 billion annually and as such has drawn many competitive products. The Company’s RapidChek® E. coli O157:H7, Salmonella and Listeria tests compete globally with numerous competitive rapid testing systems. Instrument-based tests are offered by bioMerieux SA and DuPont Qualicon among others. Competitive strip based tests are offered by Neogen Corp., BioControl Systems, Inc. and others. In addition, traditional lab culture methods offer indirect competition. The Company hopes to gain market share from competitive methods and with new users due to key product advantages such as speed of result, ease-of-use, accuracy and by providing overall cost savings.
In rapid toxicity testing, the Company primarily competes against Checklight, Ltd., and one other instrument-based test method produced by Hach Lange, an affiliate of The Danaher Corporation. There are other rapid toxicity competitors based in Europe and China. The Company believes its products have a number of competitive advantages including the comprehensive screening for general toxicity and competes effectively on superior features and functions.
6
With respect to the environmental contaminant test products, the Company currently receives the greatest competition from fixed site environmental laboratories and several small privately held companies. Traditional analytical methods for environmental contamination are often utilized for confirmation and closure of environmental sites. The Company believes it has detection products which are user friendly and provide greater value in use than competitive offerings.
In the antibody product category, the competitive landscape is rapidly changing as the Company continues to shift its emphasis to earlier activities in drug and biomarker discovery. The Company will increasingly compete with technology companies that offer products and services for the discovery and advancement of novel antibodies. The Company believes that its proprietary GAT™ platform coupled with its expertise in assay development provides differentiated access to the high value application markets it is targeting.
The Company also competes in its traditional antibody markets with the internal capabilities of some of the Company’s large pharmaceutical, research and diagnostics customers. These customers often have significantly greater revenues than the Company. Generally these customers produce some products internally and purchase similar products from the Company.
Competitors in the market as third party providers of custom, large scale antibody reagent production include Covance (public), Harlan (private), Lampire (private) and Scantibodies (private). Additionally, there are a number of smaller companies that offer competing products. In the custom research reagent market, the Company has identified approximately 50 companies offering some form of traditional antibody production from customer-provided antigens. The Company believes that its innovation, expertise, and fully integrated suite of immune-solutions plus the scale of its operations are significant competitive advantages against both large and small competitors. In the catalog antibody space, there are over 130 companies competing for this $1.35 billion market.
Markets and Products
The Company sells products in the life sciences, food safety and water quality market categories through its U.S. direct sales force, a network of over 50 distributors in Canada, Mexico, Latin America, Europe and Asia and the Company’s corporate partners. The Company markets and sells products in agricultural testing exclusively through distributors.
Geographic and Customer Information
The following table sets forth sales by geographic region:
|
Year
|
||||||||||||
|
Ended December 31,
|
||||||||||||
|
2010
|
2009
|
2008
|
||||||||||
|
United States
|
$ | 21,269 | $ | 19,739 | $ | 20,744 | ||||||
|
Rest of the world
|
7,080 | 7,415 | 6,915 | |||||||||
|
Total
|
$ | 28,349 | $ | 27,154 | $ | 27,659 | ||||||
The Company’s basis for identifying sales by country is the ship-to location. There were no individual countries outside of the United States that represented more than 10% of the total revenues of the Company.
No single customer accounted for 10% or more of the Company’s revenues in 2010, 2009 or 2008.
Regulatory Approvals
The Company is engaged in the development of antibody and immunoassay products for use in the medical and human healthcare fields. Its current products in this market are intended for “research use only.” The Company also manufactures tests for bacterial food pathogens, mycotoxins, genetically engineered traits in plants and water treatment polymers, which are currently unregulated. However, agencies such as the Environmental Protection Agency (“EPA”), the FDA, and the USDA are engaged in testing and, together with organizations like the AOAC, maintain compilations of official methods for use in testing in certain market segments. Some of these organizations also issue procedures and guidelines for validating new methods. Although not required, official methods adopted by these agencies sometimes have the commercial impact of regulations because the industry and the Company’s customers tend to follow the practices of regulatory agencies.
The Company maintains quality system components compliant with 21 CFR 820, Quality System Regulations, and International Organization for Standardization (“ISO”) 9001:2008 certification for all three of its facilities from an ANSI-ASQ National Accreditation Board (“ANAB”) Accredited International Registrar for ISO 9001 standards. Recognized and respected worldwide, the ISO 9001:2008 standards are put forth by the ISO organization. This certification demonstrates the Company’s commitment to excellence in product and service quality, and a continued focus on improving the customer experience.
7
The Company has maintained AAALAC (Association for the Assessment and Accreditation of Laboratory Animal Care) accreditation at its Delaware facility since 1992 and at its Maine facility since 2000. The Company volunteers to participate in the AAALAC program in addition to complying with the local, state and federal laws that regulate animal research. In order to maintain these accreditations, the Company undergoes regular inspections and reviews. The Company also holds approvals from the USDA, OLAW (Office of Laboratory Animal Welfare), and the NIH, further validating the stewardship of the Company in proper laboratory animal care.
The Company believes that the validation and acceptance of its environmental products by regulatory agencies plays a significant role in market acceptance. EPA SW-846 is the compendium of test methods published by the EPA’s Office of Solid Waste listing those analytical methods that have been validated by the EPA for a stated purpose. The vast majority of the Company’s analytical methods for environmental soil sample analysis are listed in EPA SW-846. Many federal, state and local environmental programs often refer to and rely on EPA SW-846 methods for purposes of remediation and monitoring.
The legislation and regulations that the Company believes are most applicable to its environmental business are the Research Conservation and Recovery Act (“RCRA”), Comprehensive Environmental Response, Compensation and Liability Act (“CERCLA”), Toxic Substances Control Act (“TSCA”), Federal Insecticide, Fungicide and Rodenticide Act (“FIFRA”) and the Pure Food and Drug Act. For analysis of water and wastewater, the Safe Drinking Water Act, the Clean Water Act and the National Pollution Discharge Elimination System (“NPDES”) permitting program acceptance under the Clean Water Act also will be significant to the Company’s business. As the utility of the Company’s Microtox® products continues to be widely recognized in drinking water security applications, regulations and mandates associated with Homeland Security programs may also have an impact on the Company’s business. Collectively, these programs regulate the management, disposal and clean-up of hazardous substances and protect the nation’s ground and surface water and drinking water supplies.
Manufacturing
The Company manufactures test kits for the detection of a wide array of analytes in five immunoassay formats and one bioluminescence format. The five formats are: one step lateral flow tests; coated tubes; latex particles; magnetic particles; and micro-titer plates. The Company manufactures a biological supplement that enhances the detection of certain analytes and improves overall performance of certain assay formats. In addition to test kits, the Company supplies ancillary equipment and supplies including test evaluation instruments, reagents, sample media, spectrophotometers, pipettes, balances and timers.
The key critical reagent manufacturing technologies are conjugation chemistries, antibody formulations, calibrator preparation, lateral flow strip production, microbiological and immunoassay processes. Reagent production processes include filling and dispensing liquids, subcomponent and finished goods assembly, in-process testing, quality control, packaging and shipping. The critical reagents and production assembly groups produce test kits in the Newark, Delaware laboratories. Biological materials are primarily developed and produced in-house; however, some reagents are licensed from third parties or purchased from commercial sources. A crucial step in the Company’s manufacturing process is the stabilization of the immunoreagents utilizing proprietary lyophilization techniques. In general, raw materials used by the Company in its products are obtainable from multiple sources. The Company purchases instruments and ancillary equipment from outside vendors. A number of the instruments sold by the Company were developed to be used exclusively with the Company’s products and are subject to specific supply agreements. The Company believes that the raw materials, instruments and equipment used in the manufacture of its products are sufficiently available for the Company’s current and foreseeable manufacturing needs.
The Company has implemented data-driven problem solving, measurement and statistical process controls to troubleshoot and continuously improve quality and output performance. Capital investment and equipment automation have reduced key parameter variation, improved production efficiencies and lowered manufacturing costs. The Company utilizes planning tools to control all elements of the supply chain and manufacturing processes, including raw material procurement, inventory management, capacity planning and production scheduling, work-in-process tracking, order processing and fulfillment, shipping and customer invoicing. The Company believes the existing facilities and equipment are sufficient to support a significantly larger production demand.
The Company also supplies a wide array of custom antibody products and services to the in-vitro diagnostic, academic, pharmaceutical and medical research industries. Antibodies are developed and produced using animals or cell culture methods. Laboratories are maintained to prepare immunogens, perform chemical conjugations, purify antibodies, and perform a range of quality control procedures. The cell culture laboratories support the development of hybridomas and manufacture of monoclonal antibodies. The cell culture laboratories also provide services to enhance the productivity of cell lines, establish Master Cell Banks, and store cell lines in secure fail-safe cryogenic systems. In 2010, the Company added antigen strategy and design capabilities along with assay screening capabilities to support antibody and assay development programs for biopharma. Animal facilities house specific-pathogen-free animals that are tested routinely to assure they are maintained under the highest health standards. Capacity utilization in antibody production was approximately 70% during 2010, and there is additional land and zoning clearance on the 64-acre site in Windham, Maine that could be used to potentially double polyclonal operations.
8
Research and Development
The Company engages in substantial research and development activities (R&D) involving development of products, services and technology platforms for its two primary markets, Life Sciences and Food Safety. In the years ended December 31, 2010, 2009 and 2008, the Company incurred approximately $3.1 million, $2.9 million and $3.6 million, respectively, in research and development expenditures.
The Company’s primary laboratory facilities located in Newark, Delaware were designed and built specifically for conducting research and development relating to antibody and immunoassay technology. These facilities include state-of-the art, antibody development and large-scale production facilities. The Company has assembled a scientific staff with extensive experience in the development, production and purification of monoclonal and polyclonal antibodies. The Company also has extensive expertise in the development and production of reagents from the antibodies it produces, as well as commercial immunoassays employing those reagents.
In 2010, the Company continued development of its proprietary GAT™ platform, focusing on advanced methods for development of antibodies to high value proteins that are the targets of pharmaceutical and biotechnology companies. Specificially, the Company carried out a research program to characterize the value of GAT™-produced antibodies as compared to conventionally produced antibodies using peptides for immunization. The resulting data demonstrate that using GAT™ provides higher chances of successfully raising high-quality antibodies for a variety of assay formats compared to conventional, peptide-based immunization strategies. Moreover, this advantage becomes progressively more pronounced with increasingly challenging applications that require particularly high affinity antibodies for high-sensitivity assays.
In the food safety market, the Company completed the development of and commercially launched its new “SE Select™” product to test for Salmonella Enteritidis in the egg and poultry/broiler processing industry, responding to new FDA-mandated testing requirements for the egg-industry implemented in 2010. The test received AOAC RI certification as well as NPIP (National Poultry Improvement Plan) interim certification, and was endorsed by the FDA as a method equivalent to the cultural Bacteriological Analytical Manual (“BAM”) process used by the agency. SE Select is the only thus certified immuno-assay-based low-complexity test currently on the market which significantly outperforms the BAM standard with regard to sensitivity and time-to-result for testing of eggs. Also in the food safety market, the Company received a Certificate of Validation for its RapidChek® SELECT™ Salmonella system from the Association française de Normalisation (AFNOR) thus qualifying the test for the European market.
In 2010, the Company filed one US patent application in the food safety area. The Company’s research and development personnel are experts in many advanced research disciplines in life sciences including immunology, immunochemistry, molecular biology, protein chemistry, biochemistry, microbiology and synthetic organic chemistry. In addition to the technical expertise resident within the research and development organization, the Company’s technical manufacturing organization is expert in large-scale -production, bioprocessing, purification and quality control of antibodies and reagents. The Company’s core expertise is in antibody and immunoassay development and it is a major developer and producer of monoclonal antibodies.
Research and development activities are focused on developing proprietary technology and products to expand the Company’s differentiated market position in Life Science and food safety markets. The Company is a recognized leader in the field of contract antibody and assay development services primarily for large pharmaceutical, biotech, diagnostic and chemical companies, and the development of rapid test kits in the food, water quality and agricultural sectors based on immunoassay technology. In addition, the Company has extensive expertise, facilities and equipment relating to the development and manufacture of one-step lateral flow tests.
The Company’s research and development organization consists of 13 individuals, nine of whom hold advanced academic degrees. In addition, approximately one-third of the Company’s employees are involved in technical job functions.
Proprietary Technology and Patents
The Company’s products are based on the use of proprietary reagents, technology and test systems developed by Company scientists or acquired externally. Accordingly, the Company has implemented a number of procedures to safeguard the proprietary nature of its technology. The Company requires its employees and consultants to execute confidentiality agreements upon the commencement of an employment or consulting relationship with the Company and all employees are required to assign to the Company all rights to any inventions made during their employment or relating to the Company’s activities. Additionally, the Company seeks to protect its technology and processes through the patent process. As of December 31, 2010, the Company holds 24 issued U.S. patents, as well as one U.S. patent licensed for exclusive use by the Company. These patents expire on various dates between June 2012 and September 2026. There can be no assurance that the Company’s patent applications will result in the issuance of any patent or that any patents issued to the Company would provide protection that is sufficiently broad to protect the Company’s technology and products. In addition, the Company cannot be certain that it was the first creator of inventions covered by pending patent applications or that it was the first to file patent applications for such inventions. In addition to seeking patent protection for the Company’s proprietary information, the Company also relies upon trade secrets, know-how and continuing technical innovation to maintain competitiveness for its products and services. The Company has developed a number of proprietary technologies which it has chosen not to patent, including immunization protocols, DNA and plasmid constructs, stabilization systems for reagents, chemical syntheses, and strategies relating to antibody development. While propietary technologies are important to the Company's strategic objectives, the Company derives no revenue from the licensing of any of its intellectual property.
9
|
Expiration Date
|
U.S. Patent
|
Title
|
||
|
6/20/2012
|
5,426,035
|
Method for compensating toxicity test data for the measured toxicity of a reference sample
|
||
|
7/27/2013
|
5,449,611
|
Polyaromatic hydrocarbon (PAH) immunoassay method, its components and a kit for use in performing the same
|
||
|
7/30/2013
|
5,541,079
|
Monoclonal and polyclonal antibodies and test method for determination of organophosphates (license)
|
||
|
10/25/2014
|
5,547,877
|
Methods for the rapid detection of toxic halogenated hydrocarbons and kits useful in performing the same
|
||
|
1/14/2014
|
5,593,850
|
Monitoring of industrial water quality using monoclonal antibodies to polymers
|
||
|
7/27/2013
|
5,618,681
|
Polyaromatic hydrocarbon (PAH) immunoassay method, its components and a kit for use in performing the same
|
||
|
2/23/2016
|
5,780,250
|
Immunoassay standards for polyaromatic hydrocarbon detection
|
||
|
11/10/2015
|
5,834,222
|
Polychlorinated Biphenyls (PCB) immunoassay method
|
||
|
11/10/2015
|
5,858,692
|
PCB immunoassay
|
||
|
2/23/2016
|
5,874,216
|
Indirect label assay device for detecting small molecules and method of use thereof
|
||
|
4/6/2016
|
5,891,657
|
Immunoassay standards for volatile analytes with benzene rings
|
||
|
7/6/2016
|
5,919,645
|
Method for the direct determination of the toxicity of particulate solids
|
||
|
3/29/2016
|
6,096,563
|
Dual particle immunoassay method & kit
|
||
|
11/14/2017
|
6,146,903
|
Method for determination of water treatment polymers
|
||
|
2/23/2016
|
6,376,195
|
Indirect label assay device for detecting small molecules and method of use thereof
|
||
|
9/28/2012
|
6,420,530
|
Determination method
|
||
|
6/1/2019
|
6,524,810
|
Method of making bioluminescent assay reagent based on non-viable E. coli
|
||
|
3/5/2019
|
6,663,833
|
Integrated Assay Device and Methods of Production and Use
|
||
|
8/30/11
|
6,750,328
|
Antibodies for detection of water treatment polymers
|
||
|
9/28/2012
|
6,911,534
|
Method for determination of water treatment polymers
|
||
|
12/12/2023
|
7,189,520
|
Compositions and methods for detecting animal byproduct in feed
|
||
|
5/5/2020
|
7,214,505
|
Cell-based assay for the detection of toxic analytes
|
||
|
11/12/2023
|
7,241,626
|
Isolation and confirmation of analytes from test devices
|
||
|
9/18/2026
|
7,521,201
|
Bacteriophages as Selective Agents
|
||
|
11/27/2027
|
7,532,321
|
Compositions and methods for the detection of water treatment polymers
|
Employees
As of December 31, 2010, the Company employed 150 full time and five part time employees. The workforce was supplemented by five agency-provided contractors. All of the Company’s employees have executed agreements with the Company agreeing not to disclose the Company’s proprietary information and assigning to the Company all rights to inventions made during their employment. Key personnel have signed agreements prohibiting them from competing with the Company. None of the Company’s employees are covered by collective bargaining agreements. The Company believes that its relations with its employees are good.
Organizational History
Strategic Diagnostics Inc. is a Delaware corporation formed in 1990.
Item 1A. Risk Factors
Our results of operations may fluctuate, which could cause volatility in our stock price.
Our results of operations may fluctuate significantly in the future as a result of a number of factors, many of which are outside of our control. These factors include, but are not limited to:
● unanticipated events associated with regulatory changes;
● general economic conditions;
● acceptance of our products;
● the success of products competitive with ours;
● expenses associated with development and protection of intellectual property matters;
● establishing or maintaining commercial scale manufacturing capabilities;
10
● the timing of expenses related to commercialization of new products;
● seasonality; and
● the timing and success in building our distribution channels.
The results of our operations may fluctuate significantly from quarter to quarter and may not meet expectations of securities analysts and investors. This may cause our stock price to be volatile.
If we use hazardous materials in a manner that causes injury or violates laws, we may be liable for damages.
Our research and development activities involve the controlled use of potentially harmful biological materials as well as hazardous materials, chemicals and various radioactive compounds. We use radioactivity in conducting biological assays and we use solvents that could be flammable in conducting our research and development activities. We cannot completely eliminate the risk of accidental contamination or injury from the use, storage, handling or disposal of these materials. We do not maintain a separate insurance policy for these types of risks. In the event of contamination or injury, we could be held liable for damages that result, and any liability could exceed our resources. We are subject to federal, state and local laws and regulations governing the use, storage, handling and disposal of these materials and specified waste products. The cost of compliance with these laws and regulations could be significant.
Our antibody production process utilizes various species of animals that could contract disease or die, interrupting business operations.
Our antibody production process utilizes animals to produce antibodies. We cannot completely eliminate the risks of animals contracting disease or a disaster that could cause death to valuable production animals. Disease or death on a broad scale could interrupt business operations as animals are a key part of the antibody production operation.
If we do not obtain and maintain adequate protection for our intellectual property, the value of our technology and products may be adversely affected.
Our business and competitive positions are dependent in part upon our ability to protect our proprietary technology. To protect our proprietary rights, we rely on a combination of trademark, copyright, patent, trade secret and other intellectual property strategies and laws, employment, confidentiality and invention assignment agreements with our employees and contractors, and confidentiality agreements and protective contractual provisions with other third parties. We attempt to protect our intellectual property position by filing trademark applications and U.S., foreign and international patent applications related to our proprietary technology, inventions and improvements that are important to the development of our business.
As of December 31, 2010, we had 24 issued U.S. patents, two foreign patents and three pending U.S. and international patent applications relating to various aspects of our business. We also had 21 trademark registrations in the United States for a variety of word marks and slogans. We do not believe that any single patent, trademark or other intellectual property right of ours, or combination of our intellectual property rights, is likely to prevent others from competing with us using a similar business model. There are many issued patents and patent applications held by others in our industry. Our competitors may independently develop technologies that are substantially similar or superior to our technologies, or design around our patents or other intellectual property to avoid infringement. In addition, we may not apply for a patent relating to products or processes that are patentable, we may fail to receive any patent for which we apply or have applied, and any patent owned by us or issued to us could be circumvented, challenged, invalidated, or held to be unenforceable, or rights granted thereunder may not adequately protect our technology or provide a competitive advantage to us. If a third-party challenges the validity of any patents or proprietary rights of ours, we may become involved in intellectual property disputes and litigation that would be costly and time-consuming.
Although third parties may infringe on our patents and other intellectual property rights, we may not be aware of any such infringement, or we may be aware of potential infringement but elect not to seek to prevent such infringement or pursue any claim of infringement, and the third party may continue its potentially infringing activities. Any decision whether or not to take further action in response to potential infringement of our patent or other intellectual property rights may be based on any one or more of a variety of factors, such as the potential costs and benefits of taking such action, and business and legal issues and circumstances. Litigation of claims of infringement of a patent or other intellectual property rights may be costly and time-consuming and divert the attention of key company personnel, and may not be successful or result in any significant recovery of compensation for any infringement or enjoining of any infringing activity. Litigation or licensing discussions may also involve or lead to counterclaims that could be brought by a potential infringer to challenge the validity or enforceability of our patents and other intellectual property.
To protect our trade secrets and other proprietary information, we generally require our employees, consultants, contractors and outside collaborators to enter into written nondisclosure agreements. These agreements, however, may not provide adequate protection to prevent any unauthorized use, misappropriation or disclosure of our trade secrets, know-how or other proprietary information. These agreements may be breached, and we may not become aware of, or have adequate remedies in the event of, any such breach. Also, others may independently develop the same or substantially equivalent proprietary information and techniques or otherwise gain access to our trade secrets.
11
Our ability to market our services may be impaired by the intellectual property rights of third parties.
Our success is dependent in part upon our ability to avoid infringing the patents or proprietary rights of others. Our industry is characterized by a large number of patents, patent filings and litigation based on allegations of patent infringement. Competitors may have filed applications for or have been issued patents and may obtain additional patents and proprietary rights related to products, services or processes that we compete with or are similar to ours. We may not be aware of all of the patents or patent applications potentially adverse to our interests that may have been or may later be issued to or filed by others.
U.S. patent applications may be kept confidential while pending in the Patent and Trademark Office. If other companies have or obtain patents relating to our products or services, we may be required to obtain licenses to those patents or to develop or obtain alternative technology. We may not be able to obtain any such licenses on acceptable terms, or at all. Any failure to obtain such licenses could impair or foreclose our ability to make, use, market or sell our products and services.
Based on the litigious nature of our industry and the fact that we may pose a competitive threat to some companies who own or control various patents, it is always possible that one or more third parties may assert a patent infringement claim seeking damages and to enjoin the manufacture, use, sale and marketing of our products and services. If a third- party asserts that we have infringed on its patent or proprietary rights, we may become involved in intellectual property disputes and litigation that would be costly and time-consuming and could impair or foreclose our ability to make, use, market or sell our products and services.
Lawsuits may have already been filed against us without our knowledge. Additionally, we may receive notices from other third parties suggesting or asserting that we are infringing their patents and inviting us to license such patents. We do not believe that we are infringing on any other party’s patents or that a license to any such patents is necessary. Should litigation over such patents arise, we intend to vigorously defend against any allegation of infringement.
If we are found to infringe on the patent or intellectual property rights of others, we may be required to pay damages, stop the infringing activity or obtain licenses or rights to the patents or other intellectual property in order to use, manufacture, market or sell our products and services. Any required license may not be available to us on acceptable terms or at all. If we succeed in obtaining such licenses, payments under such licenses would reduce any earnings from our products. In addition, licenses may be non-exclusive and, accordingly, our competitors may have access to the same technology as that which may be licensed to us. If we fail to obtain a required license or are unable to alter the design of our product candidates to make a license unnecessary, we may be unable to manufacture, use, market or sell our products and services, which could significantly affect our ability to achieve, sustain or grow our commercial business.
Moreover, regardless of the outcome, patent litigation against or by us could significantly disrupt our business, divert our management’s attention and consume our financial resources. We cannot predict if or when any third party will file suit for patent or other intellectual property infringement.
The difficulties of operating in international markets may harm sales of our products.
Customers outside of the United States accounted for 25% and 27% of our revenues for the years ended December 31, 2010 and 2009, respectively. The majority of our sales transactions are in U.S. dollars; however, we received payments in British pounds sterling for approximately $0.7 million in sales from our foreign subsidiary.
The international nature of our business subjects us and our representatives, agents and distributors to the laws and regulations of the jurisdictions in which they operate, and in which our products are sold. The types of risks that we face in international operations include, but are not limited to:
● the imposition of governmental controls;
● logistical difficulties in managing international operations; and
● fluctuations in foreign currency exchange rates.
Our international sales and operations may be limited or disrupted if we cannot successfully meet the challenges of operating internationally.
12
Future acquisitions and business combinations that we consummate may be difficult to integrate, disrupt our business, dilute stockholder value or divert management attention.
From time to time, we have considered and may in the future consider expanding our operations and market presence by making acquisitions and entering into business combinations, investments, joint ventures or other strategic alliances with other companies. We may have to issue debt or equity securities to pay for future acquisitions, which could be dilutive to our then current stockholders. We cannot assure you that we will consummate any transactions in the future. However, these transactions create risks, such as:
|
|
●
|
difficulty assimilating the operations, technology and personnel of the combined companies;
|
|
|
●
|
disrupting our ongoing business;
|
|
|
●
|
problems retaining key technical and managerial personnel;
|
|
|
●
|
additional operating losses and expenses of acquired businesses; and
|
|
|
●
|
impairment of relationships with existing employees, customers and business partners.
|
Any of the events described in the foregoing paragraph could have an adverse effect on our business, financial condition and results of operations and could cause our stock price to decline.
If we do not produce future taxable income, our ability to realize the benefits of our net operating loss carryforwards could be significantly reduced.
As of December 31, 2010, the Company had U.S. federal net operating loss carryforwards, including those acquired in the Company’s past acquisitions, of approximately $15.5 million, which, if not utilized, begin to expire as follows:
|
Year
|
Net
Operating Loss (in thousands) |
|||
|
2011
|
$ | 917 | ||
|
2017
|
760 | |||
|
2018
|
1,327 | |||
|
2019
|
550 | |||
|
2020
|
66 | |||
|
2021
|
56 | |||
|
2022
|
2,268 | |||
|
2024
|
2,032 | |||
|
2025
|
3 | |||
|
2026
|
1 | |||
|
2027
|
1 | |||
|
2028
|
3,492 | |||
|
2029
|
2,501 | |||
|
2030
|
1,553 | |||
|
Total
|
$ | 15,527 | ||
The Tax Reform Act of 1986 (the “Act”) limits the annual use of net operating loss and income tax credit carryforwards (after certain ownership changes, as defined by the Act). The application of these limits could significantly restrict our ability to utilize carryforwards. Certain of our total net operating loss carryforwards from 2001 and prior years are subject to limitations on their annual use since a cumulative change in ownership of more than 50% has occurred within a three-year period with respect to those net operating loss carryforwards. The Company is currently evaluating recent changes in ownership. If it is determined that an ownership change of more than 50% within a three-year period did occur, as determined pursuant to the Internal Revenue Code and Regulations, substantially all of the net operating loss carryforwards and income tax credit carryforwards could be subject to annual limitations on usage. Because U.S. tax laws limit the time period during which these carryforwards may be applied against future taxable income, we may not be able to take full advantage of these attributes for federal and state income tax purposes due to the annual limitation usage.
Based on the best information available to us today, we may not have sufficient future taxable income to utilize the net operating loss carryforwards and income tax credit carryforwards prior to their expiration, and we have established a full valuation allowance against these net operating loss and income tax credit carryforwards for financial reporting purposes.
The leases for our headquarters and a property where we conduct manufacturing and research will expire no later than December 31, 2011, unless we extend them. If we are unable to negotiate new leases for our existing space, or find replacement space, in either case on terms that are attractive to us, or if we are required to make substantial capital improvements in either the existing or new space, our results of operations could be harmed.
13
Our headquarters and 25,000 square feet of manufacturing and research space that we lease in Newark, Delaware are leased under operating leases that will expire no later than December 2011. We are currently considering our options with respect to temporary extensions of these leases, and renewal or replacement of this space. We may be unable to negotiate new leases for our existing space, or to find replacement space, in either case on terms that are attractive to us. In addition, should we elect to attempt to negotiate new leases in our current facilities, we may have to make investments in capital improvements to enhance the space. In any such case, our results of operations could be harmed.
Certain of our shareholders are able to significantly influence proposals for a change in control or other matters requiring a shareholder vote.
Directly, or through entities that they control, members of our Board of Directors as of December 31, 2010 controlled approximately 16% of our common stock. Through entities that he controls, Steven R. Becker, who joined our Board effective March 12, 2008, controlled approximately 12% of our outstanding common stock as of December 31, 2010. Due to this concentration of ownership, members of our Board, acting together or, in some cases, individually, can substantially influence all matters requiring a stockholder vote, including, without limitation:
● the election of directors;
● the amendment of our organizational documents; or
● the approval of a merger, sale of assets, or other major corporate transaction.
Provisions in our organizational documents could prevent or frustrate attempts by stockholders to replace our current management.
Our certificate of incorporation and our bylaws contain provisions that could make it more difficult for a third party to acquire us without the consent of our Board. Our certificate of incorporation provides for a staggered board and removal of directors only for cause. Accordingly, stockholders may elect only a portion of our board at any annual meeting, which may have the effect of delaying or preventing changes in management. In addition, under our certificate of incorporation, our Board of Directors may issue additional shares of preferred stock and determine the terms of those shares of stock without any further action by our stockholders. Our issuance of additional preferred stock could make it more difficult for a third party to acquire a majority of our outstanding voting stock and thereby effect a change in the composition of our Board of Directors. Our bylaws require advance notice of stockholder proposals and director nominations and permit only our President or a majority of the Board of Directors to call a special stockholder meeting. These provisions may have the effect of preventing or hindering attempts by our stockholders to replace our current management. In addition, our certificate of incorporation contains provisions that limit our ability to engage in a business combination with any holder of 15% or more of our capital stock unless, among other possibilities, the Board of Directors approves the transaction. These provisions may have the effect of preventing or hindering a change of control of our company.
Our stock has generally had low trading volume, and its public trading price has been volatile.
During the year ended December 31, 2010, the price of our common stock fluctuated between $1.31 and $2.25 per share, with an average daily trading volume for the year of approximately 19,000 shares. The market may experience significant price and volume fluctuations that are often unrelated to the operating performance of individual companies.
Our common stock may be delisted from the NASDAQ Global Market, which could negatively impact the price of our common stock and our ability to access the capital markets.
Our common stock is listed on the NASDAQ Global Market. Should we fail to satisfy the continued listing requirements of the NASDAQ Global Market, our common stock could be delisted. The delisting of our common stock would significantly affect the ability of investors to trade our securities and would significantly negatively affect the value and liquidity of our common stock. In addition, the delisting of our common stock could materially adversely affect our ability to raise capital on terms acceptable to us or at all. Delisting from the NASDAQ Global Market could also have other negative results, including the potential loss of confidence by our suppliers, customers and employees, the loss of institutional investor interest, and fewer business development opportunities.
Item 1B. Unresolved Staff Comments
None.
Item 2. Properties
The Company is headquartered in Newark, Delaware, and occupies approximately 28,000 square feet of space under an operating lease expiring in December 2011. The Company also leases approximately 25,000 square feet of manufacturing and research space in Newark, Delaware, under an operating lease expiring in December 2011. The Company is currently considering its options with respect to temporary extensions of these leases, and renewal or replacement of this space. The Company owns and occupies approximately 75,000 square feet of manufacturing, research and animal facility space and approximately 88 acres of farmland in Windham, Maine. As of the date of this report, the Company believes that its equipment and facilities are adequate for its present purposes.
14
The Company’s inactive subsidiary, AZUR Environmental Limited, is the lessee for two real property leases located in the United Kingdom. In 2001, the landlord of the two properties gave AZUR Environmental Limited its consent to allow AZUR to assign the lease and its related obligations to a third party. As inducement to the landlord to grant the assignment, AZUR was required to guarantee performance under the original lease terms if the third party fails to perform. Both lease terms expire in November 2016 and provide for annual principal rent payments of approximately $300,000 in the aggregate. The Company believes that based on its assessment of the current financial strength of the third party, no liability is required to be recorded with regard to the guarantee or lease obligation.
Item 3. Legal Proceedings
The Company is not a party to any material legal proceedings.
Item 4. [Removed and Reserved]
15
PART II
Item 5. Market for Registrant’s Common Equity, Related Stockholder Matters and Issuer Purchases of Equity Securities
The Company’s common stock is traded on The NASDAQ Global Market under the symbol “SDIX.” Set forth below are the quarterly high and low bid prices for the shares of common stock of the Company as reported by The NASDAQ Global Market without retail mark-up, mark-down or commission and may not necessarily represent actual transactions:
|
Common Stock
|
||||||||
|
Price Range
|
||||||||
|
Fiscal Year Ended
|
High
|
Low
|
||||||
|
December 31, 2010:
|
||||||||
|
Fourth Quarter
|
$ | 1.88 | $ | 1.32 | ||||
|
Third Quarter
|
1.99 | 1.00 | ||||||
|
Second Quarter
|
2.13 | 1.15 | ||||||
|
First Quarter
|
2.10 | 1.00 | ||||||
|
December 31, 2009:
|
||||||||
|
Fourth Quarter
|
$ | 2.02 | $ | 1.00 | ||||
|
Third Quarter
|
2.19 | 0.88 | ||||||
|
Second Quarter
|
1.67 | 0.79 | ||||||
|
First Quarter
|
1.36 | 0.69 | ||||||
On March 25, 2011, there were approximately 23,000 holders (345 holders of record) of the common stock of the Company. The Company has never paid any cash dividends on its common stock.
16
Stock Performance Graph
The following line graph compares for the fiscal years ended December 31, 2005 through 2010 (i) the yearly cumulative total shareholder return on the common stock with (ii) the cumulative total return of the NASDAQ Composite Index and with (iii) a Peer Group Index consisting of NASDAQ Medical Equipment Stocks.
COMPARISON OF 5 YEAR CUMULATIVE TOTAL RETURN*
Among Strategic Diagnostics Inc., the NASDAQ Composite Index
and the NASDAQ Medical Equipment Index
Among Strategic Diagnostics Inc., the NASDAQ Composite Index
and the NASDAQ Medical Equipment Index
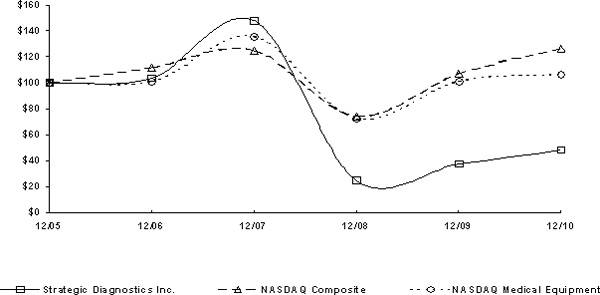
COMPARISON OF CUMULATIVE TOTAL RETURN
Strategic Diagnostics Inc., NASDAQ Composite Index and NASDAQ Medical Equipment Peer Group Index
|
12/05
|
12/06
|
12/07
|
12/08
|
12/09
|
12/10
|
||||||||||
|
Strategic Diagnostics Inc.
|
100.00
|
103.85
|
147.80
|
24.45
|
37.36
|
48.35
|
|||||||||
|
NASDAQ Composite
|
100.00
|
111.74
|
124.67
|
73.77
|
107.12
|
125.93
|
|||||||||
|
NASDAQ Medical Equipment
|
100.00
|
101.15
|
135.54
|
72.03
|
101.17
|
106.70
|
|||||||||
17
Item 6. Selected Financial Data
|
Year Ended December 31,
|
||||||||||||||||||||
|
2010
|
2009
|
2008
|
2007
|
2006
|
||||||||||||||||
|
(in thousands, except share and per share data)
|
||||||||||||||||||||
|
Revenues
|
$ | 28,349 | $ | 27,154 | $ | 27,659 | $ | 27,207 | $ | 25,522 | ||||||||||
|
Cost of sales
|
11,781 | 12,416 | 13,091 | 10,766 | 11,715 | |||||||||||||||
|
Gross profit
|
16,568 | 14,738 | 14,568 | 16,441 | 13,807 | |||||||||||||||
|
Operating expenses:
|
||||||||||||||||||||
|
Research and development
|
3,077 | 2,894 | 3,576 | 2,938 | 2,630 | |||||||||||||||
|
Selling, general and administrative
|
14,428 | 13,593 | 14,425 | 11,990 | 10,555 | |||||||||||||||
|
Goodwill impairment
|
- | - | 4,150 | - | - | |||||||||||||||
|
(Gain) loss on disposal of assets
|
(8 | ) | (1 | ) | (17 | ) | 110 | 42 | ||||||||||||
|
Total operating expenses
|
17,497 | 16,486 | 22,134 | 15,038 | 13,227 | |||||||||||||||
|
Operating income (loss)
|
(929 | ) | (1,748 | ) | (7,566 | ) | 1,403 | 580 | ||||||||||||
|
Interest income (expense), net
|
(42 | ) | (15 | ) | 157 | 433 | 386 | |||||||||||||
|
Income (loss) before taxes
|
(971 | ) | (1,763 | ) | (7,409 | ) | 1,836 | 966 | ||||||||||||
|
Income tax expense (benefit)
|
(8 | ) | (112 | ) | 8,386 | 976 | 282 | |||||||||||||
|
Net income (loss)
|
$ | (963 | ) | $ | (1,651 | ) | $ | (15,795 | ) | $ | 860 | $ | 684 | |||||||
|
Basic net income (loss) per share
|
$ | (0.05 | ) | $ | (0.08 | ) | $ | (0.78 | ) | $ | 0.04 | $ | 0.03 | |||||||
|
Shares used in computing basic net income (loss)
|
||||||||||||||||||||
|
per share
|
20,251,534 | 20,113,659 | 20,312,707 | 20,325,285 | 20,031,833 | |||||||||||||||
|
Diluted net income (loss) per share
|
$ | (0.05 | ) | $ | (0.08 | ) | $ | (0.78 | ) | $ | 0.04 | $ | 0.03 | |||||||
|
Shares used in computing diluted net income (loss)
|
||||||||||||||||||||
|
per share
|
20,251,534 | 20,113,659 | 20,312,707 | 20,562,645 | 20,108,688 | |||||||||||||||
|
December 31,
|
||||||||||||||||||||
| 2010 | 2009 | 2008 | 2007 | 2006 | ||||||||||||||||
|
BALANCE SHEET DATA:
|
||||||||||||||||||||
|
Cash and cash equivalents
|
$ | 8,056 | $ | 7,937 | $ | 9,980 | $ | 12,988 | $ | 10,892 | ||||||||||
|
Working capital
|
14,514 | 14,671 | 14,233 | 19,973 | 16,731 | |||||||||||||||
|
Total assets
|
22,516 | 23,225 | 25,521 | 41,949 | 37,953 | |||||||||||||||
|
Current portion of long-term debt
|
400 | 400 | 1,658 | 611 | 211 | |||||||||||||||
|
Long-term debt
|
300 | 700 | - | 1,640 | 351 | |||||||||||||||
|
Stockholders’ equity
|
19,704 | 20,093 | 21,248 | 37,128 | 35,262 | |||||||||||||||
18
Item 7. Management’s Discussion and Analysis of Financial Condition and Results of Operations
Forward Looking Statements
This annual report contains certain forward-looking statements reflecting the current expectations of Strategic Diagnostics Inc. and its subsidiaries (the “Company” or “SDIX”). In addition, when used in this annual report, the words “anticipate,” “enable,” “estimate,” “intend,” “expect,” “believe,” “potential,” “may,” “will,” “should,” “project” and similar expressions as they relate to the Company are intended to identify said forward-looking statements. Investors are cautioned that all forward-looking statements involve risks and uncertainties, which may cause actual results to differ from those anticipated at this time. Such risks and uncertainties include, without limitation, changes in demand for products, delays in product development, delays in market acceptance of new products, retention of customers, attraction and retention of management and key employees, adequate supply of raw materials, inability to obtain or delays in obtaining third party approvals or required government approvals, the ability to meet increased market demand, competition, protection of intellectual property, non-infringement of intellectual property, seasonality, the ability to obtain financing and other factors more fully described in the Company’s public filings with the U.S. Securities and Exchange Commission.
Overview
SDIX is a biotechnology company with a core mission of developing, commercializing and marketing innovative and proprietary products, services and solutions that preserve and enhance the quality of human health and wellness.
The Company believes that its competitive position has been enhanced through the combination of talent, technology and resources resulting from the business development activities it has pursued since its inception. The Company has achieved meaningful economies of scale for the products it offers through the utilization of its consolidated facilities in Newark, Delaware for the manufacture of test kits and antibodies, and its facilities located in Windham, Maine for the manufacture of antibodies.
The Company believes that by applying its core competency of creating custom antibodies to assay development, it produces sophisticated diagnostic testing and reagent systems that are responsive to customer diagnostic and information needs. Customers benefit from a quantifiable “return on investment” by reducing time, labor and/or material costs associated with applications for which the Company’s products are used. In addition, the Company believes its tests provide high levels of accuracy, reliability and actionability of essential test results as compared to alternative products. The Company is focused on sustaining this competitive advantage by leveraging its expertise in immunology, proteomics, bio-luminescence and other bio-reactive technologies to continue its successful customer-focused research and development efforts. The Company believes that an established product base, quality manufacturing expertise, experienced sales and marketing organization, established network of distributors, corporate partner relationships and proven research and development expertise will be critical elements of its potential future success.
In 2009, the Company continued the transition from a fragmented product offering and marketing strategy to becoming a focused organization, with proven, proprietary technologies tied directly to its customers’ needs. The transition is most evident in the Life Science immuno-solutions initiative and food pathogen detection products, where the Company believes significant progress is being made.
The Company continues to develop and introduce new methods for the detection of food pathogens that deliver a strong competitive advantage to its customers. In 2005, the Company filed a patent for new technology to be used in proprietary enrichments of its food pathogen testing methods. The patent covers technology for increasing the specificity and sensitivity of the Company’s immunoassay test methods. The patent also makes claims for the application of the technology in large scale bio-production/bio-fermentation processes, such as those used in the production of amino acids, ethanol, enzymes and other processes using microbiological production methods.
The Company continued to develop multiple channels to market worldwide through an approach that includes direct sales, inside sales, distributors and agents. The Company increased distribution for its food pathogen products in Europe and Asia where there is growing demand for the Company’s product line.
The Company believes it is making progress in most of its business efforts. As the deployment of new initiatives is accelerated, building on the Company’s leadership position in food pathogens and expanding its strong positioning in the emerging area of genomic antibodies, the Company anticipates that the revenue lost to market changes in its legacy businesses will be replaced and the Company will develop a stronger, more predictable revenue base.
The Company expects the life science and food pathogen products to be its primary growth drivers in the future, and that the Company’s competencies and competitive positions in these two areas are strong.
19
Results of Operations
Year ended December 31, 2010 versus year ended December 31, 2009
Revenues
Revenues for the year ended December 31, 2010 increased 4% to $28.3 million compared to $27.2 million for the year ended December 31, 2009. The increase in revenues was primarily the result of a 7% increase in sales of Life Sciences products. The following table sets out revenues by product category:
|
Year Ended
|
||||||||||||||||
|
December 31,
|
Increase
|
Percent
|
||||||||||||||
|
2010
|
2009
|
(Decrease)
|
Change
|
|||||||||||||
|
(in thousands, except percentages)
|
||||||||||||||||
|
Life Sciences
|
$ | 15,361 | $ | 14,321 | $ | 1,040 | 7 | % | ||||||||
|
Kit products
|
12,913 | 12,738 | 175 | 1 | % | |||||||||||
|
Contract
|
75 | 95 | (20 | ) | (21 | %) | ||||||||||
|
Revenues
|
$ | 28,349 | $ | 27,154 | $ | 1,195 | 4 | % | ||||||||
Life Sciences Products
Life Science products revenues increased 7% to $15.4 million for the year ended December 31, 2010, compared to $14.3 million for the year ended December 31, 2009. The increased revenues in 2010 were the result of increased sales to the Company’s in-vitro diagnostic, biopharma and content/reseller customers, partially offset by a decrease in sales to academic/government customers. These changes reflect a refocusing of the Company’s sales efforts on in-vitro diagnostics and biopharma customers and stress the Company’s broad range of capabilities rather than concentrating on strictly antibody production.
Kit Products
Kit products revenues increased 1% to $12.9 million for the year ended December 31, 2010 compared to $12.7 million for the year ended December 31, 2009. Sales of food pathogen products increased 7% to $5.9 million. This increase was primarily attributable to increased sales of products to detect the pathogen E. Coli in meat products. Water quality product sales decreased 1% to $4.8. The decreased demand is primarily from the Company’s municipal and government customers in the U.S. and Europe and reflects general economic conditions that are expected to continue into 2011. Ag-GMO product sales decreased 7% to $2.2 million. This decrease was attributable to decreased demand for the Company’s products in Brazil, where sales have declined over the past few years due to reduced demand for testing for GMOs. This trend is expected to continue. The Company also entered into an agreement with Romer Labs in 2010 for the exclusive distribution of its Ag-GMO products in all countries except Brazil. As a result, selling prices have decreased due to distributor pricing.
Gross profit
Gross profit increased to $16.6 million for the year ended December 31, 2010 from $14.7 million for the year ended December 31, 2009. Gross margins improved to 58% for 2010 compared to 54% in 2009. The increase in margin was primarily attributable to increased sales of the Life Science products which have a lower per unit cost of sale and increased manufacturing efficiencies within the Kit products group.
Research and development
Research and development expenses were $3.1 million for the year ended December 31, 2010, compared to $2.9 million for the year ended December 31, 2009. This increase was primarily due to increased spending and effort on development of the Company’s products to detect pathogens in beef and poultry. Research and development expenses were 11% of revenues for both periods presented.
Selling, general and administrative
Selling, general and administrative expenses were $14.4 million for the year ended December 31, 2010, compared to $13.6 million for the year ended December 31, 2009. This increase was primarily the result of increased personnel costs.
Interest expense, net
The Company recorded $42,000 in net interest expense for the year ended December 31, 2010 compared to $15,000 for the year ended December 31, 2009, due to lower interest rates received on decreased levels of invested cash and cash equivalents during 2010.
20
Income taxes
The Company recorded an income tax benefit of $8,000 for the year ended December 31, 2010 compared to an income tax benefit of $112,000 for the year ended December 31, 2009. The 2009 federal income tax benefit was primarily the result of changes in federal tax law that provided the ability to realize research and experimentation credits and alternative minimum tax credits that previously had a valuation allowance placed against them.
Net loss
Net loss for the year ended December 31, 2010 was $963,000, or $0.05 per diluted share, compared to a net loss of $1.7 million, or $0.08 per diluted share, for the year ended December 31, 2009. Diluted shares utilized in these computations were 20.3 million and 20.1 million for the 2010 and 2009 periods, respectively.
Year ended December 31, 2009 versus year ended December 31, 2008
Revenues for the year ended December 31, 2009 decreased 2% to $27.2 million compared to $27.7 million for the year ended December 31, 2008. The decrease in revenues was primarily the result of a 7% decrease in sales of kit products, partially offset by a 4% increase in sales of life science products. The following table sets out revenues by product category:
|
December 31,
|
Increase
|
Percent
|
||||||||||||||
|
2009
|
2008
|
(Decrease)
|
Change
|
|||||||||||||
|
(in thousands, except percentages)
|
||||||||||||||||
|
Life sciences
|
$ | 14,321 | $ | 13,821 | $ | 500 | 4 | % | ||||||||
|
Kit products
|
12,738 | 13,634 | (896 | ) | (7 | %) | ||||||||||
|
Contract
|
95 | 204 | (109 | ) | (53 | %) | ||||||||||
|
Revenues
|
$ | 27,154 | $ | 27,659 | $ | (505 | ) | (2 | %) | |||||||
Life Sciences Products
Life science revenues increased 4% to $14.3 million for the year ended December 31, 2009, compared to $13.8 million for the year ended December 31, 2008. Sales of bulk antibody products increased 10% to $3.4 million, sales of products utilizing the Company’s GAT ™ platform increased 8% to $1.6 million and sales of custom polyclonal products increased 2% to $5.7 million all as a result of increased sales to the Company’s IVD (In-vitro Diagnostics) customers. These increases were partially offset by a decline in sales of custom monoclonal products of 4% to $3.3 million. These changes reflect a refocusing of the Company’s sales efforts on in-vitro diagnostics and biopharma customers and stress the Company’s broad range of capabilities rather than concentrating on strictly antibody production.
Kit Products
Kit products revenues decreased 7% to $12.7 million for the year ended December 31, 2009 compared to $13.6 million for 2008. Sales of food pathogen products were $5.5 million in both 2009 and 2008. Water quality product sales decreased 7% to $4.8 million for 2009 compared to 2008, which was primarily attributable to decreased demand for the Company’s water testing equipment in China. Ag-GMO products decreased 18% to $2.4 million for 2009 compared to 2008, primarily attributable to decreased demand for the Company’s testing products in Brazil as a result of decreased demand for GMO testing as well as the elimination of required testing for the Starlink TM trait in grains in the United States.
Gross profit
Gross profit increased to $14.7 million for the year ended December 31, 2009 from $14.6 million for the year ended December 31, 2008. Gross margins improved to 54% for 2009 compared to 53% in 2008. The increase in margin was primarily attributable to increased sales of the Life Science products which have a lower per unit cost of sale.
Research and development
Research and development expenses were $2.9 million for the year ended December 31, 2009, compared to $3.6 million, or 13% of revenues, for the year ended December 31, 2008. This decrease was primarily due to decreased spending and effort on development of the Company’s proprietary SEQer™ antibodies, which are produced by the GAT ™ platform and are being sold through the Company’s antibody catalog and decreased spending and effort on development of the Company’s proprietary phage technology for use in the production of ethanol.
21
Selling, general and administrative
Selling, general and administrative expenses were $13.6 million for the year ended December 31, 2009, compared to $14.4 million for the year ended December 31, 2008. This decrease was primarily the result of decreased professional fees related to the recruitment of new management, reductions in severance costs related to the replacement of prior management and an insurance settlement related to employee fraud.
Interest income (expense), net
The Company recorded $15,000 in net interest expense for the year ended December 31, 2009 compared to net interest income of $157,000 for the year ended December 31, 2008, due to lower interest rates received on decreased levels of invested cash and cash equivalents during 2009.
Income taxes
The Company recorded an income tax benefit of $112,000 for the year ended December 31, 2009 compared to an income tax expense of $8.4 million for the year ended December 31, 2008. The 2009 federal income tax benefit was primarily the result of changes in federal tax law that provided the ability to realize research and experimentation credits and alternative minimum tax credits that previously had a valuation allowance placed against them. The tax provision for 2008 is due to valuation allowances placed against U.S. federal and state deferred tax assets in 2008, as a result of uncertainty as to the realization of the net deferred tax assets prior to their expiration.
Net loss
Net loss for the year ended December 31, 2009 was $1.7 million, or $0.08 per diluted share, compared to a net loss of $15.8 million, or $0.78 per diluted share, for the year ended December 31, 2008. Diluted shares utilized in these computations were 20.1 million and 20.3 million for the 2009 and 2008 periods, respectively.
Liquidity and Capital Resources
Liquidity is our ability to generate sufficient cash flows from operating activities to meet the Company’s obligations and commitments, or obtain appropriate financing. Currently our liquidity needs arise primarily from debt service on indebtedness, working capital requirements and capital expenditures.
The following is a summary of selected cash flow information:
|
Year Ended
|
||||||||||||
|
December 31,
|
||||||||||||
|
2010
|
2009
|
2008
|
||||||||||
|
(in thousands)
|
||||||||||||
|
Net cash provided by (used in) operating activities
|
$ | 425 | $ | 366 | $ | (749 | ) | |||||
|
Net cash used in investing activities
|
(522 | ) | (499 | ) | (895 | ) | ||||||
|
Net cash provided by (used in) financing activities
|
236 | (1,791 | ) | (1,082 | ) | |||||||
|
Effect of exchange rate changes on cash
|
(20 | ) | (119 | ) | (282 | ) | ||||||
|
Net increase (decrease) in cash and cash equivalents
|
$ | 119 | $ | (2,043 | ) | $ | (3,008 | ) | ||||
Net cash provided by operating activities in 2010 was primarily the result of depreciation, amortization and share based compensation more than offsetting the loss for the year. For 2009, net cash used in operating activities primarily related to the net loss for the year, offset by depreciation, amortization and stock based compensation charges, decreases in accounts receivable and inventories and decreases in accounts payable and accruals. For 2008, net cash used in operating activities primarily related to the net loss incurred for the year offset by depreciation, amortization and stock based compensation charges, the goodwill impairment charge and deferred income taxes.
Net cash used in investing activities for 2010 was $522,000 compared to $499,000 for 2009 and $895,000 in 2008. These cash outflows were primarily the result of capital purchases which were $532,000 in 2010, $500,000 in 2009 and $929,000 in 2008. The capital expenditures in 2010 were primarily related to the purchase of computer and lab equipment. The capital expenditures in 2009 were primarily related to the purchase of computer and electronic equipment. The capital expenditures in 2008 were primarily related to the purchase of lab and manufacturing equipment.
Net cash provided by financing activities were $236,000 in 2010, primarily related to the reduction in the restricted cash requirement of $550,000 partially offset by debt repayments of $400,000. Net cash used in financing activities was $1.8 million for 2009, primarily related to a $1.25 million restricted cash requirement from the Company’s lender, and $558,000 in debt repayments. In 2008, net cash used in financing activities was $1.1 million, primarily the result of $593,000 in debt repayments and $555,000 in purchases of treasury stock.
22
The Company’s working capital (current assets less current liabilities) decreased to $14.5 million at December 31, 2010, from $14.7 million at December 31, 2009. The reduction from 2009 was primarily due to reductions in inventory and cash, while the increase from 2008 was due to the reclassification of $700,000 of debt to long-term from current as a result of our amended credit agreement described below. Outstanding debt decreased to $700,000 at December 31, 2010 from $1.1 million at December 31, 2009, due to scheduled debt payments. Outstanding debt decreased to $1.1 million at December 31, 2009 from $1.7 million at December 31, 2008 due to scheduled debt payments.
On May 5, 2000, the Company entered into a financing agreement with a commercial bank which was amended on August 12, 2009 (as amended, the “Credit Agreement”). The Credit Agreement was amended to eliminate the revolving line of credit, remove financial covenants requiring minimum EBITDA and tangible net worth amounts, and reduce the restricted cash requirement from $2.7 million to the amount of debt outstanding.
On August 21, 2007, the Company received a term loan under the Credit Agreement to finance the construction of new facilities at its Windham, Maine location. This agreement provided for up to $2 million in financing, $700,000 of which was outstanding at December 31, 2010, and is repayable over five years, with principal payments that began on October 1, 2007. The loan bears a fixed interest rate of 5.96% with equal amortization of principal payments plus interest. This indebtedness is secured by $700,000 in restricted cash as required by the Credit Agreement.
The Company has had expenditures for property, plant and equipment of $532,000, $500,000 and $929,000 in the years ended December 2010, 2009 and 2008, respectively, primarily for production and information technology additions. The Company has no material commitments for capital expenditures at December 31, 2010. However, the leases for the Company’s two Delaware facilities expire on December 31, 2011 and the Company will have to move to a new facility or extend the leases at the existing facilities, which could require substantial renovations to these facilities. Therefore, it is expected that capital expenditures in 2011 and 2012 will exceed the levels incurred in the prior three years.
For the year ended December 31, 2010, the Company satisfied all of its cash requirements from cash and cash equivalents on-hand. At December 31, 2010, the Company had $700,000 in debt and stockholders’ equity of $19.7 million.
Based upon its cash and cash equivalents on hand, current product sales and the anticipated sales of new products, the Company believes it has, or has access to, sufficient resources to meet its operating requirements at least through the next 12 months.
The Company’s ability to meet its long-term capital needs will depend on a number of factors, including compliance with existing and new loan covenants, the success of its current and future products, the focus and direction of its research and development program, competitive and technological advances, future relationships with corporate partners, government regulation, the Company’s marketing and distribution strategy, its successful sale of additional common stock and/or the Company successfully locating and obtaining other financing, and the success of the Company’s plan to make future acquisitions. Accordingly, no assurance can be given that the Company will be able to meet the long-term liquidity requirements that may arise from these inherent and similar uncertainties.
23
Off-Balance Sheet Arrangements
As of December 31, 2010, the Company did not have any off-balance sheet arrangements as defined in Item 304(a) (4) (ii) of Regulation S-K.
Contractual Obligations
The Company is committed to making cash payments in the future on two types of contracts: its long-term indebtedness and leases. The Company has no off-balance sheet debt or other such unrecorded obligations. Below is a schedule of the future payments that the Company was obligated to make based on agreements in place as of December 31, 2010.
|
Payments Due by Year
|
||||||||||||||||||||||||||||
|
2016 and
|
||||||||||||||||||||||||||||
|
2011
|
2012
|
2013
|
2014
|
2015
|
Beyond
|
Total
|
||||||||||||||||||||||
|
(in thousands)
|
||||||||||||||||||||||||||||
|
Long-term debt (1)
|
$ | 400 | 300 | - | - | - | - | 700 | ||||||||||||||||||||
|
Operating leases (2)
|
$ | 1,074 | 330 | 300 | 300 | 300 | 300 | 2,604 | ||||||||||||||||||||
|
Total contractual
|
||||||||||||||||||||||||||||
|
cash obligations
|
$ | 1,474 | 630 | 300 | 300 | 300 | 300 | 3,304 | ||||||||||||||||||||
|
|
(1) See Note 5 to the Consolidated Financial Statements for a discussion of long-term debt
|
|
|
(2) See Note 8 to the Consolidated Financial Statements for a discussion of operating leases
|
Critical Accounting Policies
The Company’s accounting policies are described in Note 1 of the Notes to the Consolidated Financial Statements. The Consolidated Financial Statements are prepared in conformity with U.S. generally accepted accounting principles (“GAAP”), which require the Company to make estimates and assumptions that affect the reported amounts of assets and liabilities and disclosures of contingent assets and liabilities at the date of the financial statements and the reported amounts of revenues and expenses during the year. On an on-going basis, the Company evaluates its estimates, including those related to bad debts, inventories, deferred taxes, long-lived assets and stock-based compensation. The Company bases its estimates on historical experience and on various other assumptions that the Company believes are reasonable under the circumstances. The results form the basis for making judgments about the carrying values of assets and liabilities that are not readily apparent from other sources. Actual results could differ from those estimates. The Company considers the following policies to be most critical in understanding the judgments that are involved in preparing the Consolidated Financial Statements and the uncertainties that could impact the consolidated results of operations, financial condition and cash flows.
Valuation of Accounts Receivable – Accounts receivable as of December 31, 2010 and December 31, 2009, were net of an allowance for doubtful accounts of $78,000 and $38,000, respectively. The recorded allowance is continually evaluated based on current market conditions, an analysis of customer-specific facts and circumstances, and the size and composition of the overall portfolio. The current state of the economy could cause longer sales cycles resulting in increased risk that outstanding balances could become uncollectible. If receivables are in dispute with the customer or otherwise deemed uncollectible, the corresponding amounts are written off and are charged against the allowance.
Valuation of Inventories – Inventories are valued at the lower of cost or market.
For inventories that consist primarily of test kit components, bulk antibody serum and antibody products, cost is determined using the first in, first out method. Realization of inventories is dependent upon the successful marketing of our products. Judgments are made regarding the carrying value of inventory based on current market conditions. Market conditions may change depending upon competitive product introductions and customer demand. If market conditions change or if the introduction of new products by the Company impacts the market for previously released products, the Company may be required to write-down the cost of its inventory.
For inventories that consist of costs associated with the production of custom antibodies, cost is determined using the specific identification method. Realization of such inventories is dependent upon the successful completion of a project in accordance with customer specifications. Losses on projects in progress are recorded in the period such losses become probable and estimable.
24
Deferred Taxes – In assessing the realizability of deferred tax assets, management considers whether it is more likely than not that some portion or all of the deferred tax assets will not be realized. The ultimate realization of deferred tax assets is dependent upon the generation of future taxable income during the period in which those temporary differences become deductible. In making their assessment, management considers positive evidence, negative evidence, and possible tax planning strategies that could be implemented. Management also considers the future reversal of existing taxable temporary differences, recent earnings history, history of or potential for tax attributes such as net operating losses to expire and the ability to project future taxable income. The Company’s history of cumulative pre-tax losses over the most recent three-year period, including 2010, is significant negative evidence that is difficult to overcome. In light of this negative evidence, coupled with the current economic conditions, management has concluded that it is more likely than not that the Company will not realize the benefits of these tax deductible differences and has continued to provide a full valuation allowance offsetting its U.S. federal and state net deferred tax assets at December 31, 2010.
At December 31, 2010, the Company had approximately $4.6 million of net operating loss carryforwards for tax purposes, which have no expiration and which correspond to a $970,000 deferred tax asset, related to operations in the United Kingdom (“UK”). Management considered positive and negative indicators in concluding that a substantial valuation allowance of approximately $930,000 was necessary for the foreign deferred tax assets of $970,000. The positive indicators include the contribution to income before taxes by the foreign operations in the UK for 2010, 2009 and 2008, and the expected income before taxes in the UK for 2011 and 2012. The negative indicators include a history of substantial net operating losses in the UK, the lack of income before taxes until 2004 and limitations with regard to estimating income in the UK beyond 2012 resulting from a year-to-year evaluation of the future need for a UK subsidiary.
As of December 31, 2010, the Company had U.S. federal net operating loss carryforwards, of $15.5 million, including those of acquired companies, which begin to expire as follows:
|
Year
|
Net
Operating Loss (in thousands) |
|||
|
2011
|
$ | 917 | ||
|
2017
|
760 | |||
|
2018
|
1,327 | |||
|
2019
|
550 | |||
|
2020
|
66 | |||
|
2021
|
56 | |||
|
2022
|
2,268 | |||
|
2024
|
2,032 | |||
|
2025
|
3 | |||
|
2026
|
1 | |||
|
2027
|
1 | |||
|
2028
|
3,492 | |||
|
2029
|
2,501 | |||
|
2030
|
1,553 | |||
|
Total
|
$ | 15,527 | ||
Revenue Recognition — Revenues composed of sales of immunoassay-based test kits and certain antibodies and immunochemical reagents are recognized upon the shipment of the product and transfer of title or when related services are provided. Revenues associated with such products or services are recognized when persuasive evidence of an order exists, shipment of product has occurred or services have been provided, the price is fixed or determinable, and collectability is reasonably assured. Management is required to make judgments based on actual experience about whether or not collectability is reasonably assured.
The Company enters into contracts related to the production of custom antibodies, which provide for the performance of defined tasks for a fixed price, with delivery of the product upon completion of production. The standard time to complete a project is typically longer than 30 days but less than 12 months and effort is expended over the life of the project. Revenues related to sales of custom antibody projects are recognized when a project’s specifications have been met and/or the related materials have been shipped.
25
Fees associated with products and services added on to a custom antibody project subsequent to delivery of the initial project are billed monthly and recognized as revenue as the services and other deliverables are provided.
Valuation of Goodwill and Long-Lived Assets — Long-lived assets, such as property and equipment, and purchased intangibles subject to amortization, are reviewed for impairment whenever events or changes in circumstances indicate that the carrying amount of an asset may not be recoverable. Recoverability of assets to be held and used is measured by a comparison of the carrying amount of an asset to its estimated discounted future cash flows expected to be generated by the asset. If the carrying amount of an asset exceeds its estimated future cash flows, an impairment charge is recognized by the amount by which the carrying amount of the asset exceeds the fair value of the asset. Goodwill and intangible assets not subject to amortization are tested annually for impairment, and are tested for impairment more frequently if events and circumstances indicate that the asset might be impaired. An impairment loss is recognized to the extent that the carrying amount exceeds an asset’s fair value.
The Company tests goodwill annually in a two-step approach. The first step is the comparison of the carrying value of the Company, including goodwill, to the fair value of the Company at the testing date. If the carrying amount exceeds the fair value of the Company, a second test is performed to measure the amount of an impairment charge, if any. To measure the amount of any impairment charge, the Company determines the implied fair value of goodwill in the same manner as if the Company were being acquired in a business combination.
In the fourth quarter of 2008, the Company recorded an impairment charge of approximately $4.2 million to writeoff goodwill and other intangible assets. For additional information, refer to Note 3 of the Notes to the Consolidated Financial Statements.
Share–Based Compensation — The Company accounts for share-based compensation in accordance with the fair value method of accounting, which requires the Company to measure all employee share–based compensation awards at the date of grant and recognize such expense in our consolidated financial statements.
The grant date fair value of the awards is recognized as compensation expense over the vesting period of the awards and is included in selling, general and administrative expenses. Management is required to make estimates and assumptions to determine the grant date fair value of stock options, including the expected term of stock options and the volatility of our stock price in the future. In addition, assumptions related to expected future forfeitures and performance-based vesting features all impact expense recognition. These assumptions have an impact on the valuation assigned to equity awards and the associated recognition of expense.
New Accounting Standards and Disclosures
In September 2009, the Financial Accounting Standards Board, (“FASB”) issued Accounting Standard Update (“ASU”) No. 2009-13, Revenue Recognition (Topic 605) – Multi-Deliverables Revenue Arrangements, a Consensus of the FASB Emerging Issues Task Force, to address the accounting for multiple-deliverable arrangements to enable vendors to account for products or services (deliverables) separately rather than as a combined unit. It establishes the accounting and reporting guidance for arrangements under which the vendor will perform multiple revenue-generating activities, specifically, how to separate deliverables and how to measure and allocate arrangement consideration to one or more units of accounting. The update will be effective prospectively for revenue arrangements entered into or materially modified in fiscal years beginning on or after June 15, 2010. The Company does not expect the adoption of this standard to have a material impact on its financial statements.
Item 7A. Quantitative and Qualitative Disclosures About Market Risk
The Company has limited exposure to changing interest rates, and is currently not engaged in hedging activities. Interest on approximately $700,000 of debt, is at a fixed annual rate of interest of 5.961%.
The Company conducts operations in the United Kingdom. The consolidated financial statements of the Company are denominated in U.S. dollars and changes in exchange rates between foreign countries and the U.S. dollar will affect the translation of financial results of foreign subsidiaries into U.S. dollars for purposes of recording the Company’s consolidated financial results. Historically, the effects of translation have not been material to the consolidated financial results.
26
Item 8. Financial Statements and Supplementary Data
The following consolidated financial statements and supplemental quarterly financial data of the Company and its subsidiaries are included as part of this Form 10-K:
|
Page
|
||
|
Management’s Report on Internal Control over Financial Reporting
|
33
|
|
|
Report of Independent Registered Public Accounting Firm
|
34
|
|
|
Consolidated Balance Sheets as of December 31, 2010 and 2009
|
35
|
|
|
Consolidated Statements of Operations for each of the years in the three-year period ended December 31, 2010
|
36
|
|
|
Consolidated Statements of Stockholders’ Equity and Comprehensive Loss for each of the years in the three-year period ended December 31, 2010
|
37
|
|
|
Consolidated Statements of Cash Flows for each of the years in the three-year period ended December 31, 2010
|
38
|
|
|
Notes to Consolidated Financial Statements
|
39
|
Item 9. Changes in and Disagreements with Accountants on Accounting and Financial Disclosure
None.
Item 9A. Controls and Procedures
(a) Evaluation of Disclosure Controls and Procedures
Our management, with the participation of our Chief Executive Officer and Chief Financial Officer, evaluated the effectiveness of our disclosure controls and procedures, as defined in Rule 13a-15(e) under the Securities Exchange Act of 1934, as amended, as of the end of the period covered by this report. Based upon that evaluation, the Chief Executive Officer and Chief Financial Officer concluded that our disclosure controls and procedures as of December 31, 2010, were functioning effectively to provide reasonable assurance that the information required to be disclosed by us in reports filed or submitted under the Securities Exchange Act of 1934, as amended, is (i) recorded, processed, summarized and reported within the time periods specified in the SEC’s rules and forms, and (ii) accumulated and communicated to our management, including our principal executive and financial officers, or persons performing similar functions, as appropriate to allow timely decisions regarding required disclosure.
(b) Change in Internal Control over Financial Reporting
No change in our internal control over financial reporting occurred during the quarter ended December 31, 2010 that has materially affected, or is reasonably likely to materially affect, our internal control over financial reporting.
Management’s Report on Internal Control over Financial Reporting
The report of management on our internal control over financial reporting is set forth on page 33 of this report and is incorporated herein by reference.
Item 9B. Other Information
None.
27
PART III
Item 10. Directors, Executive Officers and Corporate Governance
The applicable information set forth in the Company’s Definitive Proxy Statement is incorporated herein by reference.
Identification of Executive Officers and Certain Significant Employees
The executive officers of the Company, their positions with the Company, their ages and a brief biography for each are as follows:
|
Name
|
Age
|
Position
|
|||||
|
Francis M. DiNuzzo
|
55
|
President and Chief Executive Officer
|
|||||
|
Klaus Lindpaintner
|
56
|
VP – Research and Development and Chief Science Officer
(effective February 1, 2010)
|
|||||
|
Kevin J. Bratton
|
62
|
VP – Finance, Chief Financial Officer and Corporate Secretary
|
|||||
Francis M. DiNuzzo has served as President and Chief Executive Officer since October 13, 2008. Mr. DiNuzzo joined the Company in February 2008 as Executive Vice President – Marketing and Chief Commercial Officer, and on June 6, 2008, he was appointed interim President and Chief Executive Officer. Prior to joining SDIX, Mr. DiNuzzo spent 26 years at Agilent Technologies / Hewlett Packard. He began his career in research and development in 1981 and advanced through a series of functional management roles over the next 18 years. In 1999, Mr. DiNuzzo became General Manager of Agilent’s Chemical Solutions Business Unit where he had global responsibility for analytical equipment, consumables and service products serving the chemical, environmental, food and forensics markets. In 2001, Mr. DiNuzzo became General Manager of the Consumable and Services Business Unit, with global responsibility for all consumables and services across all Life Science and Chemical Analysis markets. In 2004, Mr. DiNuzzo became Vice President and General Manager of the Integrated Biology Solutions unit, a role where he formed a biotechnology business focused on Genomics, Proteomics and BioInformatics. Mr. DiNuzzo holds B.S and M.S. degrees in Engineering with a minor in Business Administration from the University of New Hampshire.
Klaus Lindpaintner joined SDIX in February 2010 as Vice President – Research and Development and Chief Scientific Officer. Prior to joining SDIX, Dr. Lindpaintner was with F. Hoffmann-La Roche Ltd. for 13 years and most recently served as Director of the “Roche Molecular Medicine Laboratories” at the company’s headquarters in Basel, Switzerland, and as Roche’s Global Head, Molecular Medicines Policy and External Affairs, coordinating the company’s efforts and activities in implementing biomarker research based on genetics, genomics, proteomics, and associated disciplines from early discovery to late-stage clinical trials. Dr. Lindpaintner graduated from the Innsbruck University Medical School with a degree in Medicine and from Harvard University with a degree in Public Health.
Kevin J. Bratton joined SDIX in June 2009 as Vice President – Finance and Chief Financial Officer. Mr. Bratton was Senior Vice President Business Operations for EUSA Pharma (USA), Inc. in Langhorne, Pennsylvania from May 2008 until May 2009. Mr. Bratton had been Senior Vice President and Chief Financial Officer of Cytogen Corporation in Princeton, New Jersey from November 2006 until its acquisition by EUSA Pharma, Inc. in May 2008. Mr. Bratton has over 35 years of experience in all phases of multi-national financial operations across the healthcare, biotechnology and technology industries, including developing strategic plans and annual budgets as well as financing negotiations and merger & acquisition transactions. Prior to joining Cytogen, Mr. Bratton was Chief Financial Officer at Metrologic Instruments, Inc., a global technology company, from July 2002 until November 2006, where he directed the company’s finance operations during a period of significant growth in sales, net income, cash flow from operations, and working capital. Previously, Mr. Bratton began his career with the public accounting firm Touche Ross & Co. (now Deloitte & Touche LLP). He has a bachelor of science in business and accounting from Northeastern University.
Item 11. Executive Compensation
The applicable information set forth in the Company’s Definitive Proxy Statement is incorporated herein by reference.
Item 12. Security Ownership of Certain Beneficial Owners and Management and Related Stockholder Matters
The applicable information set forth in the Company’s Definitive Proxy Statement is incorporated herein by reference.
28
Equity Compensation
The table below presents certain information as of December 31, 2010 concerning securities issuable in connection with equity compensation plans that have been approved by the Company’s stockholders and that have not been approved by the Company’s stockholders.
|
Plan Category
|
Number of
securities to be issued upon exercise of outstanding options, warrants and rights (a) |
Weighted-average
exercise price of outstanding options, warrants and rights (b) |
Number of securities
remaining available for issuance under equity compensation plans (excluding securities reflected in column (a)) (c) |
|||||||||
|
Equity compensation plan
|
||||||||||||
|
approved by security
|
||||||||||||
|
holders
|
2,008,906 | $ | 2.56 | 1,327,925 | ||||||||
|
Equity compensation
|
||||||||||||
|
not approved by
|
||||||||||||
|
security holders
|
150,000 | $ | 1.50 | - | ||||||||
|
Total
|
2,158,906 | $ | 2.49 | 1,327,925 | ||||||||
The 150,000 shares underlying options granted under equity compensation not approved by security holders were granted in connection with the Company’s hiring, on June 1, 2009, of its Chief Financial Officer, Kevin Bratton; and on February 1, 2010, of its Chief Science Officer, Klaus Lindpaintner. The grants to both Mr. Bratton and Mr. Lindpaintner are ten year non-qualified stock option grants at an exercise price of $1.50 per share.
Item 13. Certain Relationships and Related Transactions, and Director Independence
The applicable information set forth in the Company’s Definitive Proxy Statement is incorporated herein by reference.
Item 14. Principal Accounting Fees and Services
The applicable information set forth in the Company’s Definitive Proxy Statement is incorporated herein by reference.
29
PART IV
Item 15. Exhibits and Financial Statement Schedules
1. Financial Statements
(a) See the Consolidated Financial Statements which begin on page 43 of this report.
2. Financial Statement Schedules
Financial statement schedules are omitted because they are either not required or not applicable or the required information is reflected in the financial statements or notes thereto.
3. Exhibits
|
Exhibit
|
||||
|
Number
|
Description
|
Reference
|
||
|
2.1
|
Agreement and Plan of Merger among the Company, AZUR Acquisition Corp. and AZUR Environmental dated May 4, 2001
|
(1)
|
||
|
3.1
|
Fourth Amended and Restated Certificate of Incorporation of the Company
|
(2)
|
||
|
3.2
|
Amended and Restated Bylaws of the Company
|
(2)
|
||
|
4.1
|
Reference is made to Exhibits 3.1 and 3.2
|
|||
|
4.2
|
Forms of Warrants to Purchase Common Stock of the Company
|
(2)
|
||
|
10.1
|
Stock Purchase Agreement among the Company and its outside directors and certain of their affiliates dated August 16, 2002
|
(12)
|
||
|
10.2
|
Demand Registration Rights Agreement among the Company and its outside directors and certain of their affiliates dated August 16, 2002
|
(12)
|
||
|
10.3
|
EnSys Environmental Products, Inc. 1993 Stock Incentive Plan*
|
(3)
|
||
|
10.4
|
Amended and Restated EnSys Environmental Products, Inc. 1995 Stock Incentive Plan*
|
(4)
|
||
|
10.5
|
EnSys Environmental Products, Inc. 401(k) Plan Adoption Agreement
|
(3)
|
||
|
10.11
|
Agreement and Plan of Merger by and between EnSys and Strategic Diagnostics Inc. dated as of October 11, 1996
|
(2)
|
||
|
10.18
|
Industrial Lease dated October 26, 1993, by and between Tober & Agnew Properties, Inc. and Strategic Diagnostics Inc.
|
|||
|
10.21
|
Lease agreement dated October 29, 1997 by and between Pencader Courtyard, L.P. and Strategic Diagnostics Inc.
|
(7)
|
||
|
10.22
|
1998 Employee Stock Purchase Plan
|
(11)
|
||
|
10.23
|
2000 Stock Incentive Plan*
|
(17)
|
||
|
10.27
|
Loan Agreement between the Company and PNC Bank, Delaware, dated May 5, 2000
|
(10)
|
30
| 10.27.1 |
First Amendment to Loan Agreement, dated December 13, 2001
|
|||
| 10.27.2 | Second Amendment to Loan Agreement, dated April 25, 2002 | |||
| 10.27.3 | Third Amendment to Loan Agreement, dated October 24, 2002 | |||
| 10.27.4 | Fourth Amendment to Loan Agreement, dated February 11, 2003 | |||
| 10.27.5 | Fifth Amendment to Loan Agreement, dated February 16, 2004 | |||
| 10.27.6 | Sixth Amendment to Loan Agreement, dated September 16, 2005 | |||
| 10.27.7 | Seventh Amendment to Loan Agreement, dated August 21, 2007 | |||
| 10.27.8 |
Eighth Amendment to Loan Agreement, dated October 1, 2008
|
|||
| 10.27.9 | Ninth Amendment to Loan Agreement, dated May 15, 2009 | |||
| 10.27.10 |
Tenth Amendment to Loan Agreement, dated August 12, 2009
|
|||
|
10.28
|
Line of Credit Note between the Company and PNC Bank, Delaware, dated May 5, 2000
|
(10)
|
||
|
|
|
|||
|
10.29
|
Term Note between the Company and PNC Bank, Delaware, dated May 5, 2000
|
(10)
|
||
|
|
|
|||
|
10.30
|
Employment Agreement dated September 2, 2003, by and between Matthew H. Knight and the Company*
|
(13)
|
||
|
10.31
|
Nonqualified Stock Option Agreement dated September 2, 2003, by and between Matthew H. Knight and the Company*
|
(13)
|
31
|
10.32
|
Restricted Stock Grant Agreement dated September 2, 2003, by and between Matthew H. Knight and the Company*
|
(13)
|
||
|
10.33
|
Employment Agreement dated January 1, 1997 by and between James W. Stave and the Company*
|
(14)
|
||
|
10.34
|
Amended and Restated Distribution Agreement, dated as of August 31, 2009, by and between the Registrant and the DuPont Qualicon division of E.I. du Pont de Nemours and Company+
|
(15)
|
||
|
10.35
|
Strategic Diagnostics Inc. Change of Control Severance Agreement*
|
(16)
|
||
|
10.36
|
Agreement, dated as of March 12, 2008, by and among the Company and Steven R. Becker, BC Advisors, LLC, SRB Management, L.P. and Richard van den Broek
|
(18)
|
||
|
10.37
|
Separation Agreement, dated as of June 6, 2008, between Strategic Diagnostics Inc. and Matthew H. Knight*
|
(19)
|
||
|
10.38
|
Employment Agreement, dated as of October 13, 2008, between Strategic Diagnostics Inc. and Francis M. DiNuzzo*
|
(20)
|
||
|
10.39
|
Separation Agreement, dated as of December 9, 2008, between Strategic Diagnostics Inc. and Stanley Fronczkowski*
|
(21)
|
||
|
10.40
|
Amendment No. 1 to Separation Agreement and General Release, dated as of April 3, 2009, between Strategic Diagnostics Inc. and Stanley Fronczkowski*
|
(22)
|
||
|
10.41
|
Form of Nonqualified Stock Option Agreement
|
(23)
|
||
|
10.42
|
Form of Restricted Stock Grant Agreement
|
(23)
|
||
|
21.1
|
Subsidiaries of the Company
|
|||
|
23.1
|
Consent of KPMG LLP, Independent Registered Public Accounting Firm
|
|||
|
31.1
|
Certifications of the Chief Executive Officer of Strategic Diagnostics Inc. required by Rule 13a-14(a) under the Securities Exchange Act of 1934
|
|||
|
31.2
|
Certifications of the Chief Financial Officer of Strategic Diagnostics Inc. required by Rule 13a-14(a) under the Securities Exchange Act of 1934
|
|||
|
32.1
|
Certification of Francis M. DiNuzzo pursuant to 18 U.S.C. Section 1350, as adopted pursuant to Section 906 of Sarbanes-Oxley Act of 2002
|
|||
|
32.2
|
Certification of Kevin J. Bratton pursuant to 18 U.S.C. Section 1350, as adopted pursuant to Section 906 of Sarbanes-Oxley Act of 2002
|
|
(1)
|
Incorporated by reference to the designated exhibit of the Company’s 10-Q for the fiscal quarter ended September 30, 2001.
|
|
(2)
|
Incorporated by reference to the designated exhibit of the EnSys Registration Statement on Form S-4 (No. 333-17505) filed on December 9, 1996.
|
|
(3)
|
Incorporated by reference to the designated exhibit of the EnSys Registration Statement on Form S-1 (No. 33-68440) filed on September 3, 1993.
|
|
(4)
|
Incorporated by reference to Appendix F to the Joint Proxy Statement/Prospectus contained in the EnSys Registration Statement on Form S-4 (No. 333-17505) filed on December 9, 1996.
|
|
(5)
|
Incorporated by reference to the designated exhibit of the EnSys Form 10-K for the fiscal year ended December 31, 1994.
|
|
(6)
|
Incorporated by reference to the designated exhibit of the EnSys Form 10-Q for the fiscal quarter ended March 31, 1996.
|
|
(7)
|
Incorporated by reference to the designated exhibit of the Company’s Form 10-K for the fiscal year ended December 31, 1996.
|
|
(8)
|
Incorporated by reference to the designated exhibit of the Company’s Form 10-K for the fiscal year ended December 31, 1997.
|
32
(9) Incorporated by reference to the identically numbered exhibit contained in the Company’s Form 8-K filed on May 26, 1999.
|
(10)
|
Incorporated by reference to the designated exhibit of the Company’s 10-Q for the fiscal quarter ended June 30, 2000.
|
|
(11)
|
Incorporated by reference to the designated exhibit of the Company’s Registration Statement on Form S-8 (No. 333- 68107) filed on November 30, 1998.
|
|
(12)
|
Incorporated by reference to the designated exhibit of the Company’s 10-Q for the fiscal quarter ended September 30, 2002.
|
|
(13)
|
Incorporated by reference to the designated exhibit of the Company’s Form 10-Q for the fiscal quarter ended September 30, 2003.
|
|
(14)
|
Incorporated by reference to the designated exhibit of the Company’s Form 10-K for the fiscal year ended December 31, 2004.
|
|
(15)
|
Incorporated by reference to the designated exhibit of the Company’s Form 10-Q for the fiscal quarter ended September 30, 2009, as amended.
|
|
(16)
|
Incorporated by reference to the designated exhibit of the Company’s Form 10-Q for the fiscal quarter ended September 30, 2005.
|
|
(17)
|
Incorporated by reference to Appendix A of the Company’s Definitive Proxy Statement filed with the Securities and Exchange Commission on March 24, 2004.
|
|
(18)
|
Incorporated by reference to Exhibit 99.1 of the Company’s Form 8-K filed March 18, 2008.
|
|
(19)
|
Incorporated by reference to Exhibit 99.1 of the Company’s Form 8-K filed June 6, 2008.
|
|
(20)
|
Incorporated by reference to Exhibit 99.1 of the Company’s Form 8-K filed October 16, 2008.
|
|
(21)
|
Incorporated by reference to Exhibit 99.1 of the Company’s Form 8-K filed December 9, 2008.
|
|
(22)
|
Incorporated by reference to Exhibit 10.1 of the Company’s Form 10-Q for the fiscal quarter ended March 31, 2009.
|
|
(23)
|
Incorporated by reference to the designated exhibit of the Company’s Form 10-k for the fiscal year ended December 31, 2009.
|
|
*
|
Management contract or compensatory plan.
|
|
+
|
Confidential treatment has been granted as to certain portions of this exhibit pursuant to Rule 24b-2 under the Securities Exchange Act of 1934, as amended.
|
33
MANAGEMENT’S REPORT ON INTERNAL CONTROL OVER FINANCIAL REPORTING
Our management is responsible for establishing and maintaining adequate internal control over financial reporting for the Company. Internal control over financial reporting is a process designed to provide reasonable assurance regarding the reliability of financial reporting and the preparation of financial statements for external purposes in accordance with generally accepted accounting principles. Our system of internal control over financial reporting includes those policies and procedures that (i) pertain to the maintenance of records that, in reasonable detail, accurately and fairly reflect the transactions and dispositions of the assets of the Company; (ii) provide reasonable assurance that transactions are recorded as necessary to permit preparation of financial statements in accordance with generally accepted accounting principles, and that receipts and expenditures of the Company are being made only in accordance with authorizations of management and directors of the Company; and (iii) provide reasonable assurance regarding prevention or timely detection of unauthorized acquisition, use or disposition of the Company’s assets that could have a material effect on the financial statements.
Management performed an assessment of the effectiveness of our internal control over financial reporting as of December 31, 2010 based upon criteria in Internal Control — Integrated Framework issued by the Committee of Sponsoring Organizations of the Treadway Commission (“COSO”). Based on this assessment, management determined that the Company’s internal control over financial reporting was effective as of December 31, 2010, based on the criteria in Internal Control-Integrated Framework issued by COSO.
This annual report does not include an attestation report of the Company’s registered public accounting firm regarding internal control over financial reporting pursuant to temporary rules of the Securities and Exchange Commission that permit the Company to provide only management’s report in this annual report.
This report shall not be deemed “filed” for purposes of Section 18 of the Securities Exchange Act of 1934, as amended, or otherwise subject to the liability of that section. Further, this report shall not be deemed to be incorporated by reference into any filing under the Securities Act of 1933, as amended, or the Securities Exchange Act of 1934, as amended.
|
/s/ Francis M. DiNuzzo
|
/s/ Kevin J. Bratton
|
|
|
Francis M. DiNuzzo
|
Kevin J. Bratton
|
|
|
President and Chief Executive Officer
|
Vice President – Finance and Chief
|
|
|
Financial Officer
|
||
Dated: April 1, 2011
34
REPORT OF INDEPENDENT REGISTERED PUBLIC ACCOUNTING FIRM
Board of Directors and Stockholders
Strategic Diagnostics Inc.:
We have audited the accompanying consolidated balance sheets of Strategic Diagnostics Inc. and subsidiaries as of December 31, 2010 and 2009, and the related consolidated statements of operations, stockholders’ equity and comprehensive loss and cash flows for each of the years in the three-year period ended December 31, 2010. These consolidated financial statements are the responsibility of the Company’s management. Our responsibility is to express an opinion on these consolidated financial statements based on our audits.
We conducted our audits in accordance with the standards of the Public Company Accounting Oversight Board (United States). Those standards require that we plan and perform the audit to obtain reasonable assurance about whether the financial statements are free of material misstatement. An audit includes examining, on a test basis, evidence supporting the amounts and disclosures in the financial statements. An audit also includes assessing the accounting principles used and significant estimates made by management, as well as evaluating the overall financial statement presentation. We believe that our audits provide a reasonable basis for our opinion.
In our opinion, the consolidated financial statements referred to above present fairly, in all material respects, the financial position of Strategic Diagnostics Inc. and subsidiaries as of December 31, 2010 and 2009, and the results of their operations and their cash flows for each of the years in the three-year period ended December 31, 2010 in conformity with U.S. generally accepted accounting principles.
/s/ KPMG LLP
Philadelphia, Pennsylvania
March 31, 2011
35
STRATEGIC DIAGNOSTICS INC. AND SUBSIDIARIES
CONSOLIDATED BALANCE SHEETS
(in thousands, except share and per share data)
|
December 31,
|
December 31,
|
|||||||
|
2010
|
2009
|
|||||||
|
ASSETS
|
||||||||
|
Current Assets :
|
||||||||
|
Cash and cash equivalents
|
$ | 8,056 | $ | 7,937 | ||||
|
Restricted cash
|
700 | 1,250 | ||||||
|
Receivables, net
|
4,376 | 3,650 | ||||||
|
Inventories
|
3,333 | 3,714 | ||||||
|
Deferred tax asset
|
- | 1 | ||||||
|
Other current assets
|
561 | 551 | ||||||
|
Total current assets
|
17,026 | 17,103 | ||||||
|
Property and equipment, net
|
4,087 | 4,626 | ||||||
|
Other assets
|
45 | 10 | ||||||
|
Deferred tax asset
|
37 | 51 | ||||||
|
Intangible assets, net
|
1,321 | 1,435 | ||||||
|
Total assets
|
$ | 22,516 | $ | 23,225 | ||||
|
LIABILITIES AND STOCKHOLDERS’ EQUITY
|
||||||||
|
Current Liabilities :
|
||||||||
|
Current portion of long-term debt
|
$ | 400 | $ | 400 | ||||
|
Accounts payable
|
491 | 571 | ||||||
|
Accrued expenses
|
1,597 | 1,386 | ||||||
|
Deferred revenue
|
24 | 75 | ||||||
|
Total current liabilities
|
2,512 | 2,432 | ||||||
|
Long-term debt
|
300 | 700 | ||||||
|
COMMITMENTS AND CONTINGENCIES (NOTE 8)
|
||||||||
|
Stockholders’ Equity:
|
||||||||
|
Preferred stock, $.01 par value, 20,920,648 shares authorized,
|
||||||||
|
no shares issued or outstanding
|
- | - | ||||||
|
Common stock, $.01 par value, 35,000,000 shares authorized,
|
||||||||
|
20,916,433 and 20,786,515 issued
|
||||||||
|
at December 31, 2010 and December 31, 2009, respectively
|
209 | 208 | ||||||
|
Additional paid-in capital
|
41,551 | 40,958 | ||||||
|
Treasury stock, 406,627 common shares at cost
|
||||||||
|
at December 31, 2010 and December 31, 2009
|
(555 | ) | (555 | ) | ||||
|
Accumulated deficit
|
(21,239 | ) | (20,276 | ) | ||||
|
Cumulative translation adjustments
|
(262 | ) | (242 | ) | ||||
|
Total stockholders’ equity
|
19,704 | 20,093 | ||||||
|
Total liabilities and stockholders’ equity
|
$ | 22,516 | $ | 23,225 | ||||
The accompanying notes are an integral part of these statements
36
STRATEGIC DIAGNOSTICS INC. AND SUBSIDIARIES
CONSOLIDATED STATEMENTS OF OPERATIONS
(in thousands, except share and per share data)
|
Year Ended December 31,
|
||||||||||||
|
2010
|
2009
|
2008
|
||||||||||
|
Revenues
|
$ | 28,349 | $ | 27,154 | $ | 27,659 | ||||||
|
Cost of sales
|
11,781 | 12,416 | 13,091 | |||||||||
|
Gross profit
|
16,568 | 14,738 | 14,568 | |||||||||
|
Operating expenses:
|
||||||||||||
|
Research and development
|
3,077 | 2,894 | 3,576 | |||||||||
|
Selling, general and administrative
|
14,428 | 13,593 | 14,425 | |||||||||
|
Goodwill impairment
|
- | - | 4,150 | |||||||||
|
Gain on disposal of assets
|
(8 | ) | (1 | ) | (17 | ) | ||||||
|
Total operating expenses
|
17,497 | 16,486 | 22,134 | |||||||||
|
Operating loss
|
(929 | ) | (1,748 | ) | (7,566 | ) | ||||||
|
Interest income (expense), net
|
(42 | ) | (15 | ) | 157 | |||||||
|
Loss before taxes
|
(971 | ) | (1,763 | ) | (7,409 | ) | ||||||
|
Income tax expense (benefit)
|
(8 | ) | (112 | ) | 8,386 | |||||||
|
Net loss
|
$ | (963 | ) | $ | (1,651 | ) | $ | (15,795 | ) | |||
|
Basic net loss per share
|
$ | (0.05 | ) | $ | (0.08 | ) | $ | (0.78 | ) | |||
|
Shares used in computing basic net loss
|
||||||||||||
|
per share
|
20,251,534 | 20,113,659 | 20,312,707 | |||||||||
|
Diluted net loss per share
|
$ | (0.05 | ) | $ | (0.08 | ) | $ | (0.78 | ) | |||
|
Shares used in computing diluted net loss
|
||||||||||||
|
per share
|
20,251,534 | 20,113,659 | 20,312,707 | |||||||||
The accompanying notes are an integral part of these statements.
37
STRATEGIC DIAGNOSTICS INC. AND SUBSIDIARIES
CONSOLIDATED STATEMENTS OF STOCKHOLDERS’ EQUITY
AND COMPREHENSIVE LOSS
(in thousands)
|
Additional
|
Cumulative
|
|||||||||||||||||||||||||||
|
Preferred
|
Common
|
Paid-In
|
Treasury
|
Accumulated
|
Translation
|
|||||||||||||||||||||||
|
Stock
|
Stock
|
Capital
|
Stock
|
Deficit
|
Adjustments
|
Total
|
||||||||||||||||||||||
|
Balance January 1, 2008
|
$ | - | $ | 205 | $ | 39,594 | $ | - | $ | (2,830 | ) | $ | 159 | $ | 37,128 | |||||||||||||
|
Comprehensive loss:
|
||||||||||||||||||||||||||||
|
Net loss
|
- | - | - | - | (15,795 | ) | - | (15,795 | ) | |||||||||||||||||||
|
Currency translation adjustment
|
- | - | - | - | - | (282 | ) | (282 | ) | |||||||||||||||||||
|
Total comprehensive loss
|
(16,077 | ) | ||||||||||||||||||||||||||
|
Company share buyback
|
- | - | - | (555 | ) | - | - | (555 | ) | |||||||||||||||||||
|
Employee stock purchase plan
|
- | 1 | 69 | - | - | - | 70 | |||||||||||||||||||||
|
Stock-based compensation
|
- | - | 682 | - | - | - | 682 | |||||||||||||||||||||
|
Balance December 31, 2008
|
- | 206 | 40,345 | (555 | ) | (18,625 | ) | (123 | ) | 21,248 | ||||||||||||||||||
|
Comprehensive loss:
|
||||||||||||||||||||||||||||
|
Net loss
|
- | - | - | - | (1,651 | ) | - | (1,651 | ) | |||||||||||||||||||
|
Currency translation adjustment
|
- | - | - | - | - | (119 | ) | (119 | ) | |||||||||||||||||||
|
Total comprehensive loss
|
(1,770 | ) | ||||||||||||||||||||||||||
|
Employee stock purchase plan
|
- | 1 | 27 | - | - | - | 28 | |||||||||||||||||||||
|
Stock-based compensation
|
- | 1 | 586 | - | - | - | 587 | |||||||||||||||||||||
|
Balance December 31, 2009
|
- | 208 | 40,958 | (555 | ) | (20,276 | ) | (242 | ) | 20,093 | ||||||||||||||||||
|
Comprehensive loss:
|
||||||||||||||||||||||||||||
|
Net loss
|
- | - | - | - | (963 | ) | - | (963 | ) | |||||||||||||||||||
|
Currency translation adjustment
|
- | - | - | - | - | (20 | ) | (20 | ) | |||||||||||||||||||
|
Total comprehensive loss
|
(983 | ) | ||||||||||||||||||||||||||
|
Employee stock purchase plan
|
- | - | 32 | - | - | - | 32 | |||||||||||||||||||||
|
Stock option exercises
|
- | 1 | 63 | - | - | - | 64 | |||||||||||||||||||||
|
Stock-based compensation
|
- | - | 498 | - | - | - | 498 | |||||||||||||||||||||
|
Balance December 31, 2010
|
$ | - | $ | 209 | $ | 41,551 | $ | (555 | ) | $ | (21,239 | ) | $ | (262 | ) | $ | 19,704 | |||||||||||
The accompanying notes are an integral part of these statements.
38
STRATEGIC DIAGNOSTICS INC. AND SUBSIDIARIES
CONSOLIDATED STATEMENTS OF CASH FLOWS
(in thousands)
|
Year Ended December 31,
|
||||||||||||
|
2010
|
2009
|
2008
|
||||||||||
|
Cash Flows from Operating Activities :
|
||||||||||||
|
Net loss
|
$ | (963 | ) | $ | (1,651 | ) | $ | (15,795 | ) | |||
|
Adjustments to reconcile net loss to net
|
||||||||||||
|
cash provided by (used in) operating activities :
|
||||||||||||
|
Goodwill impairment charge
|
- | - | 4,150 | |||||||||
|
Depreciation, amortization and other intangibles impairment
|
1,183 | 1,277 | 1,401 | |||||||||
|
Stock-based compensation expense
|
506 | 591 | 682 | |||||||||
|
Deferred income taxes
|
15 | 22 | 8,566 | |||||||||
|
Gain on disposal of fixed assets
|
(8 | ) | (1 | ) | (17 | ) | ||||||
|
(Increase) decrease in :
|
||||||||||||
|
Receivables
|
(726 | ) | 449 | 11 | ||||||||
|
Inventories
|
381 | 176 | 314 | |||||||||
|
Other current assets
|
(10 | ) | (17 | ) | (13 | ) | ||||||
|
Other assets
|
(33 | ) | 103 | (100 | ) | |||||||
|
Increase (decrease) in :
|
||||||||||||
|
Accounts payable
|
(80 | ) | (120 | ) | 122 | |||||||
|
Accrued expenses
|
211 | (474 | ) | 1 | ||||||||
|
Deferred revenue
|
(51 | ) | 11 | 59 | ||||||||
|
Other non-current liabilities
|
- | - | (130 | ) | ||||||||
|
Net cash provided by (used in) operating activities
|
425 | 366 | (749 | ) | ||||||||
|
Cash Flows from Investing Activities :
|
||||||||||||
|
Purchase of property and equipment
|
(532 | ) | (500 | ) | (929 | ) | ||||||
|
Proceeds from sale of assets
|
10 | 1 | 34 | |||||||||
|
Net cash used in investing activities
|
(522 | ) | (499 | ) | (895 | ) | ||||||
|
Cash Flows from Financing Activities :
|
||||||||||||
|
Proceeds from exercise of stock options
|
64 | - | - | |||||||||
|
Proceeds from employee stock purchase plan
|
22 | 17 | 66 | |||||||||
|
Purchase of treasury stock
|
- | - | (555 | ) | ||||||||
|
Restricted cash requirement
|
550 | (1,250 | ) | - | ||||||||
|
Repayments on financing obligations
|
(400 | ) | (558 | ) | (593 | ) | ||||||
|
Net cash provided by (used in) financing activities
|
236 | (1,791 | ) | (1,082 | ) | |||||||
|
Effect of exchange rate changes on cash
|
(20 | ) | (119 | ) | (282 | ) | ||||||
|
Net increase (decrease) in cash and cash equivalents
|
119 | (2,043 | ) | (3,008 | ) | |||||||
|
Cash and Cash Equivalents, Beginning of Year
|
7,937 | 9,980 | 12,988 | |||||||||
|
Cash and Cash Equivalents, End of Year
|
$ | 8,056 | $ | 7,937 | $ | 9,980 | ||||||
|
Supplemental Cash Flow Disclosure :
|
||||||||||||
|
Cash paid (received) for taxes and tax refunds
|
$ | (105 | ) | $ | (54 | ) | $ | 11 | ||||
|
Cash paid for interest
|
69 | 84 | 119 | |||||||||
The accompanying notes are an integral part of these statements
39
STRATEGIC DIAGNOSTICS INC. AND SUBSIDIARIES
NOTES TO CONSOLIDATED FINANCIAL STATEMENTS
AS OF AND FOR THE YEAR ENDED DECEMBER 31, 2010
(in thousands, except share and per share data)
1. SUMMARY OF SIGNIFICANT ACCOUNTING POLICIES AND CERTAIN BALANCE SHEET INFORMATION
Business
Strategic Diagnostics Inc. and its subsidiaries (“SDIX” or the “Company”) is a biotechnology company with a core mission of developing, commercializing and marketing innovative and proprietary products, services and solutions that preserve and enhance the quality of human health and wellness.
The Company’s Life Science portfolio includes products and custom services that supply critical reagents used across the life science research and development markets. The Company’s Genomic Antibody Technology™ (“GAT™”) is is being used in proteomic research, disease understanding and drug/biomarker discovery among academic, biotech, in-vitro diagnostic and large pharmaceutical customers.
The Company’s Kit products portfolio includes immunoassays, which represent advanced technology for rapid, cost-effective detection of food pathogens as well as water and soil contaminants. SDIX’s RapidChek® and SELECT ™ kits are experiencing growing adoption for the detection of pathogens such as E. coli, Salmonella and Listeria in the production, processing and manufacturing of food and beverages.
By applying its core competencies of creating proprietary antibodies and assay development, the Company has produced sophisticated testing and reagent systems that are responsive to each customer’s analytical information needs.
SDIX is a customer-centric organization. The Company’s goals are to consistently deliver increased value to its customers that facilitate their business results, reduce costs and help in the management of risk. SDI sales professionals focus on delivering a quantifiable “return on investment” to their customers by reducing time and total costs associated with applications for which the Company’s products are used. In addition, the Company believes its tests provide high levels of accuracy and reliability, which deliver more actionable test results to the customer as compared to alternative products. The Company is focused on sustaining profitable growth by leveraging its expertise in antibodies and immuno-technologies to successfully develop proprietary products and services that enhance the competitive advantage of its customers.
The Company believes that its competitive position has been enhanced through the combination of talent, technology and resources resulting from the business development activities it has pursued since its inception. The Company has achieved meaningful economies of scale for the products it offers through the utilization of its facilities in Newark, Delaware for the manufacture of test kits and antibodies, and its facility in Windham, Maine for the manufacture of antibodies.
The continued economic downturn, including disruptions in the capital and credit markets, may continue indefinitely and intensify, and could adversely affect our results of operations, cash flows and financial condition or those of our customers and suppliers. These circumstances could adversely affect our access to liquidity needed to conduct or expand our business or conduct acquisitions or make other discretionary investments. These circumstances may also adversely impact the capital needs of our customers and suppliers, which, in turn, could adversely affect their ability to purchase our products or supply us with necessary equipment and raw materials. This could adversely affect our results of operations, cash flows and financial condition. A weakening business climate could cause longer sales cycles and slower growth, and could expose us to increased business or credit risk in dealing with customers or suppliers adversely affected by economic conditions. Our ability to collect accounts receivable may be delayed or precluded if our customers are unable to pay their obligations.
Basis of Presentation
The historical financial statements presented herein include the consolidated financial statements of Strategic Diagnostics Inc. and its subsidiaries. All significant intercompany balances and transactions have been eliminated in consolidation.
Foreign Currency Translation
The functional currency for the Company’s United Kingdom branch operation is the British pound. Assets and liabilities related to this foreign operation are translated at the current exchange rates at the end of each period. The resulting translation adjustments are accumulated as a separate component of stockholders’ equity. Revenues and expenses are translated at average exchange rates in effect during the period with foreign currency transaction gains and losses, if any, included in results of operations.
40
STRATEGIC DIAGNOSTICS INC. AND SUBSIDIARIES
NOTES TO CONSOLIDATED FINANCIAL STATEMENTS
AS OF AND FOR THE YEAR ENDED DECEMBER 31, 2010
(in thousands, except share and per share data)
Use of Estimates
The preparation of the consolidated financial statements requires management of the Company to make a number of estimates and assumptions relating to the reported amount of assets and liabilities and disclosure of contingent assets and liabilities at the date of the consolidated financial statements and the reported amounts of revenues and expenses during the period. These estimates include those made in connection with assessing the valuation of accounts receivable, inventories, deferred tax assets and long-lived assets. Actual results could differ from those estimates.
Accounts Receivable
As of December 31, 2010 and 2009, the allowance for doubtful accounts was $78 and $38, respectively. If receivables are in dispute with the customer or otherwise deemed uncollectible, the Company’s policy is to charge these write-offs against the allowance. The Company continually reviews the realizability of its receivables and charges current period earnings for the amount deemed unrealizable. At December 31, 2010 and 2009, net accounts receivable were $4,376 and $3,650, respectively.
41
STRATEGIC DIAGNOSTICS INC. AND SUBSIDIARIES
NOTES TO CONSOLIDATED FINANCIAL STATEMENTS
AS OF AND FOR THE YEAR ENDED DECEMBER 31, 2010
(in thousands, except share and per share data)
A summary of the activity in the allowance for doubtful accounts for the years ended December 31, 2010, 2009 and 2008 is as follows:
|
2010
|
2009
|
2008
|
||||||||||
|
Balance, January 1
|
$ | 38 | $ | 70 | $ | 82 | ||||||
|
Additions to allowance for doubtful accounts charged to costs and expenses
|
46 | 12 | 70 | |||||||||
|
Deductions-written off as uncollectible
|
(6 | ) | (44 | ) | (82 | ) | ||||||
|
Balance, December 31
|
$ | 78 | $ | 38 | $ | 70 | ||||||
Inventories
The Company’s inventories are valued at the lower of cost or market. For inventories that consist primarily of test kit components, bulk antibody serum and antibody products, cost is determined using the first in, first out method.
For inventories that consist of costs associated with the production of custom antibodies, cost is determined using the specific identification method. Realization of such inventories is dependent upon the successful completion of a project in accordance with customer specifications. Losses on projects in progress are recorded in the period such losses become probable.
At December 31, inventories consisted of the following:
|
December 31,
2010 |
December 31,
2009 |
|||||||
|
Raw materials
|
$ | 794 | $ | 807 | ||||
|
Work in progress
|
1,214 | 1,228 | ||||||
|
Finished goods
|
1,325 | 1,679 | ||||||
|
Net inventories
|
$ | 3,333 | $ | 3,714 | ||||
Property and Equipment
Property and equipment are stated at cost. Depreciation and amortization are computed using the straight-line method over the estimated useful lives (generally three to five years) of the assets. Leasehold improvements are depreciated over the shorter of the lease term or the estimated useful life.
Impairment of Goodwill and Long-Lived Assets
Long-lived assets, such as property and equipment, and purchased intangibles subject to amortization, are reviewed for impairment whenever events or changes in circumstances indicate that the carrying amount of an asset may not be recoverable. Recoverability of assets to be held and used is measured by a comparison of the carrying amount of an asset to estimated undiscounted future cash flows expected to be generated by the asset. If the carrying amount of an asset exceeds its estimated future cash flows, an impairment charge is recognized in the amount by which the carrying amount of the asset exceeds the fair value of the asset. Goodwill and intangible assets not subject to amortization are tested annually for impairment, and are tested for impairment more frequently if events and circumstances indicate that the asset might be impaired. An impairment loss is recognized to the extent that the carrying amount exceeds the asset’s fair value.
42
STRATEGIC DIAGNOSTICS INC. AND SUBSIDIARIES
NOTES TO CONSOLIDATED FINANCIAL STATEMENTS
AS OF AND FOR THE YEAR ENDED DECEMBER 31, 2010
(in thousands, except share and per share data)
The Company tests its goodwill annually in a two-step approach. The first step is the comparison of the carrying value of the Company, including goodwill, to the fair value of the Company at the testing date. If the carrying amount exceeds the fair value of the Company, a second test is performed to measure the amount of an impairment charge, if any. To measure the amount of any impairment charge, the Company determines the implied fair value of goodwill in the same manner as if the Company were being acquired in a business combination. See Note 3 for additional information.
Revenue Recognition
Revenues composed of sales of immunoassay-based test kits and certain antibodies and immunochemical reagents are recognized upon the shipment of the product and transfer of title, or when related services are provided. Revenues associated with such products or services are recognized when persuasive evidence of an order exists, shipment of product has occurred or services have been provided, the price is fixed or determinable and, collectability is reasonably assured. Management is required to make judgments based on actual experience about whether or not collectability is reasonably assured.
The Company enters into contracts related to the production of custom antibodies, which provide for the performance of defined tasks for a fixed price, with delivery of the product upon completion of production. The standard time to complete a project is typically longer than 30 days but less than 12 months and effort is expended over the life of the project. Revenues related to sales of custom antibody projects are recognized when a project’s specifications have been met and/or the related materials have been shipped.
Fees associated with products and services added on to a custom antibody project subsequent to delivery of the initial project are billed monthly and recognized as revenue as the services and other deliverables are provided.
Stock-Based Compensation
The Company accounts for stock-based compensation using the fair value method, which requires that compensation costs related to employee share-based payment transactions are measured in the financial statements at fair value on the date of grant and are recognized over the vesting period of the award.
Research and Development
Research and development costs are charged to expense as incurred.
Accounting for Income Taxes
Deferred income tax assets and liabilities are determined based on the differences between the financial statement and tax basis of assets and liabilities and are measured using the enacted tax rates and laws that will be in effect when the differences are expected to reverse. The measurement of deferred tax assets is reduced, if necessary, by a valuation allowance for any tax benefits which are not expected to be realized. The effect on deferred income tax assets and liabilities of a change in tax rates is recognized in the period that such changes are enacted.
The Company utilizes a recognition threshold and measurement attribute for the financial statement recognition and measurement of a tax position taken or expected to be taken in a tax return. As a result of the implementation of authoritative guidance related to the accounting for uncertainty in income taxes, the Company recognizes in its financial statements the impact of a tax position if that position is more likely than not of being sustained on audit, based on the technical merits of the position. The authoritative guidance also provides guidance on derecognition, classification, interest and penalties, accounting in interim periods and disclosure. The Company includes interest and penalties related to unrecognized tax benefits as a component of income tax expense. See Note 10 for further information.
43
STRATEGIC DIAGNOSTICS INC. AND SUBSIDIARIES
NOTES TO CONSOLIDATED FINANCIAL STATEMENTS
AS OF AND FOR THE YEAR ENDED DECEMBER 31, 2010
(in thousands, except share and per share data)
Basic and Diluted Loss per Share
Basic loss per share (EPS) is computed by dividing net loss available for common stockholders by the weighted-average number of common shares outstanding during the period. Diluted EPS is similar to basic EPS, except that the dilutive effect of converting or exercising all potentially dilutive securities is also included in the denominator. The Company’s calculation of diluted EPS includes the dilutive effect of exercising stock options into common shares and the inclusion of unvested restricted stock awards. Basic loss per share excludes potentially dilutive securities. For the years 2010, 2009 and 2008, conversion of stock options and unvested restricted shares totaling 231,045, 208,679 and 339,656 into common share equivalents were excluded from this calculation because they were anti-dilutive.
Listed below are the basic and diluted share calculations for the years ended December 31, 2010, 2009 and 2008:
|
2010
|
2009
|
2008
|
||||||||||
|
Weighted average common shares outstanding
|
20,251,534 | 20,113,659 | 20,312,707 | |||||||||
|
Shares used in computing basic net
|
||||||||||||
|
loss per share
|
20,251,534 | 20,113,659 | 20,312,707 | |||||||||
|
Dilutive effect of stock options and
|
||||||||||||
|
unvested restricted stock awards
|
- | - | - | |||||||||
|
Shares used in computing diluted net
|
||||||||||||
|
loss per share
|
20,251,534 | 20,113,659 | 20,312,707 | |||||||||
44
STRATEGIC DIAGNOSTICS INC. AND SUBSIDIARIES
NOTES TO CONSOLIDATED FINANCIAL STATEMENTS
AS OF AND FOR THE YEAR ENDED DECEMBER 31, 2010
(in thousands, except share and per share data)
Treasury Stock
Shares of common stock repurchased by the Company are recorded at cost as treasury stock in the stockholders’ equity section of the consolidated balance sheet, and as a use of cash in the financing activities section of the consolidated statement of cash flows.
Comprehensive Loss
Comprehensive loss is comprised of net loss and currency translation adjustments and is presented in the consolidated statements of stockholders’ equity.
Statements of Cash Flows
The Company considers all highly liquid instruments purchased with an original maturity of three months or less to be cash equivalents.
New Accounting Pronouncements
In September 2009, the Financial Accounting Standards Board, (“FASB”) issued Accounting Standard Update (“ASU”) No. 2009-13, Revenue Recognition (Topic 605) – Multi-Deliverables Revenue Arrangements, a Consensus of the FASB Emerging Issues Task Force, to address the accounting for multiple-deliverable arrangements to enable vendors to account for products or services (deliverables) separately rather than as a combined unit. It establishes the accounting and reporting guidance for arrangements under which the vendor will perform multiple revenue-generating activities, specifically, how to separate deliverables and how to measure and allocate arrangement consideration to one or more units of accounting. The update will be effective prospectively for revenue arrangements entered into or materially modified in fiscal years beginning on or after June 15, 2010. The Company does not expect the adoption of this standard to have a material impact on its financial statements.
45
STRATEGIC DIAGNOSTICS INC. AND SUBSIDIARIES
NOTES TO CONSOLIDATED FINANCIAL STATEMENTS
AS OF AND FOR THE YEAR ENDED DECEMBER 31, 2010
(in thousands, except share and per share data)
2. PROPERTY AND EQUIPMENT
As of December 31, property and equipment consisted of the following:
|
2010
|
2009
|
|||||||
|
Equipment
|
$ | 7,081 | $ | 6,595 | ||||
|
Building improvements
|
4,105 | 4,105 | ||||||
|
Furniture and fixtures
|
189 | 188 | ||||||
|
Land
|
1,452 | 1,452 | ||||||
|
Leasehold improvements
|
1,004 | 972 | ||||||
|
Total property and equipment
|
13,831 | 13,312 | ||||||
|
Less - accumulated depreciation and amortization
|
(9,744 | ) | (8,686 | ) | ||||
|
Net property and equipment
|
$ | 4,087 | $ | 4,626 | ||||
Depreciation expense was $1,069, $1,150 and $1,114 in 2010, 2009 and 2008, respectively.
3. INTANGIBLE ASSETS
As of December 31, intangible assets consisted of the following:
|
2010
|
2009
|
Lives
|
||||||||||
|
Intangible assets
|
$ | 2,614 | $ | 2,614 | 2-20 | |||||||
|
Less - accumulated amortization
|
(1,293 | ) | (1,179 | ) | ||||||||
|
Net intangible assets
|
$ | 1,321 | $ | 1,435 | ||||||||
In the fourth quarter of 2008, as economic conditions continued to decline, the Company experienced a sustained and significant decline in its stock price. As a result of this decline, the Company’s market capitalization was significantly below the book value of the Company’s stockholders’ equity at December 31, 2008. The Company performed an impairment test and the resulting fair value of goodwill was zero. Accordingly, the Company recorded a charge of $4,150 to write off the entire balance of goodwill during the year ended December 31, 2008.
The remaining intangible assets principally relate to intellectual and property rights acquired from Molecular Circuitry Inc. (“MCI”). The technology acquired from MCI primarily relates to proprietary growth media used by the Company in conjunction with the Company’s E. coli and Salmonella test kits, and also technology used in the Company’s ruminant feed test kit. The Company launched sales of these products during the year ended December 31, 2003 and expects a continued revenue stream from the sale of these products.
A former director and current large shareholder of the Company was a majority shareholder of MCI. MCI was to receive royalties from the Company until July of 2012, however in the third quarter of 2010 the Company settled all future obligations with MCI for a one-time payment of $220. This amount is included in other current assets and is being amortized over the life of the contract. Royalties paid to MCI in 2010, 2009 and 2008 were $110, $167 and $166, respectively.
46
STRATEGIC DIAGNOSTICS INC. AND SUBSIDIARIES
NOTES TO CONSOLIDATED FINANCIAL STATEMENTS
AS OF AND FOR THE YEAR ENDED DECEMBER 31, 2010
(in thousands, except share and per share data)
Amortization of these intangible assets is on a straight line basis over their useful lives and was $114, $127 and $237 in 2010, 2009 and 2008, respectively. The following table is a schedule of the expected amortization expense in each of the next five years:
|
Year
|
Amount
|
||||
|
2011
|
$ | 114 | |||
|
2012
|
114 | ||||
|
2013
|
114 | ||||
|
2014
|
114 | ||||
|
2015
|
114 | ||||
4. ACCRUED EXPENSES
As of December 31, accrued expenses consisted of the following:
|
2010
|
2009
|
|||||||
|
Royalties
|
$ | 78 | $ | 88 | ||||
|
Compensation
|
1,112 | 798 | ||||||
|
Professional fees
|
214 | 256 | ||||||
|
Purchases
|
193 | 244 | ||||||
|
Total accrued expenses
|
$ | 1,597 | $ | 1,386 | ||||
5. LONG-TERM DEBT
On May 5, 2000, the Company entered into a financing agreement with a commercial bank which was amended on August 12, 2009 (as amended, the “Credit Agreement”).
On August 21, 2007, the Company received a term loan under the Credit Agreement to finance the construction of new facilities at its Windham, Maine location. This agreement provided for up to $2,000 in financing, $700 of which was outstanding at December 31, 2010, and is repayable over five years, with principal payments that began on October 1, 2007. The loan bears a fixed interest rate of 5.96% with equal amortization of principal payments plus interest.
This indebtedness is secured by $700 in restricted cash as required by the Credit Agreement.
The following table is a schedule of the principal payments required under the Company’s long-term indebtedness:
|
2011
|
$ | 400 | ||
|
2012
|
300 | |||
|
Total debt
|
$ | 700 |
Interest expense was $67, $82 and $117 in 2010, 2009 and 2008, respectively.
6. SHARE-BASED COMPENSATION
Under various plans, executives, key employees and outside directors receive awards of options to purchase common stock. The Company has a stock option plan (the “2000 Plan”) which authorizes the granting of incentive and nonqualified stock options and restricted stock awards. Incentive stock options are granted at not less than 100% of fair market value at the date of grant (110% for stockholders owning more than 10% of the Company’s common stock). Nonqualified stock options are granted at not less than 85% of fair market value at the date of grant. A maximum of 6,000,000 shares of common stock are issuable under the 2000 Plan. Certain additional options have been granted outside the 2000 Plan. These options generally follow the provisions of the 2000 Plan. The Company issues new shares to satisfy option exercises and the vesting of restricted stock awards.
47
STRATEGIC DIAGNOSTICS INC. AND SUBSIDIARIES
NOTES TO CONSOLIDATED FINANCIAL STATEMENTS
AS OF AND FOR THE YEAR ENDED DECEMBER 31, 2010
(in thousands, except share and per share data)
The Company also has an Employee Stock Purchase Plan (the “ESPP”). The ESPP allows eligible full-time employees to purchase shares of common stock at 90 percent of the lower of the fair market value of a share of common stock on the first or last day of the quarter. Eligible employees are provided the opportunity to acquire Company common stock during each quarter. No more than 661,157 shares of common stock may be issued under the ESPP. Such stock may be unissued shares or treasury shares of the Company or may be outstanding shares purchased in the open market or otherwise on behalf of the ESPP. For financial reporting purposes, the Company’s ESPP is compensatory. Therefore, the Company is required to recognize compensation expense related to the discount from market value of shares sold under the ESPP. During 2010, 16,100 shares of common stock were purchased through the ESPP.
48
STRATEGIC DIAGNOSTICS INC. AND SUBSIDIARIES
NOTES TO CONSOLIDATED FINANCIAL STATEMENTS
AS OF AND FOR THE YEAR ENDED DECEMBER 31, 2010
(in thousands, except share and per share data)
Share-based compensation expense recorded in 2010, 2009 and 2008 is summarized as follows:
|
2010
|
2009
|
2008
|
||||||||||
|
Stock options
|
$ | 320 | $ | 307 | $ | 384 | ||||||
|
Employee stock purchase plan
|
8 | 4 | 7 | |||||||||
|
Restricted stock awards
|
178 | 280 | 291 | |||||||||
|
Total share-based compensation expense
|
$ | 506 | $ | 591 | $ | 682 | ||||||
The deferred income tax benefit related to share-based compensation expense for the years ended December 31, 2010, 2009 and 2008 was $0 due to the full valuation allowance recorded against deferred tax assets (see Note 10). Share-based compensation expense is a component of selling, general and administrative expense, and is recorded as a non-cash expense in the operating activities section of the consolidated statement of cash flows.
Information with respect to the stock options granted under the 2000 Plan and options granted separately from the 2000 Plan is summarized as follows:
|
Weighted
|
Aggregate
|
|||||||||||||||
|
Number
|
Average Remaining
|
Instrinsic
|
||||||||||||||
|
of Shares
|
Price Range
|
Contractual term
|
Value
|
|||||||||||||
|
Balance, Jauary 1, 2008
|
1,251,620 | $ | 1.88- $ 6.94 | |||||||||||||
|
Granted
|
574,420 | $ | 1.50- $ 4.60 | |||||||||||||
|
Cancelled / forfeited
|
(106,068 | ) | $ | 3.05- $ 5.50 | ||||||||||||
|
Balance, December 31, 2008
|
1,719,972 | $ | 1.88- $ 6.94 | |||||||||||||
|
Granted
|
483,000 | $ | 1.10- $ 1.50 | |||||||||||||
|
Cancelled / forfeited
|
(501,172 | ) | $ | 2.88- $ 4.69 | ||||||||||||
|
Balance, December 31, 2009
|
1,701,800 | $ | 1.10- $ 6.94 | |||||||||||||
|
Granted
|
674,852 | $ | 1.50- $ 2.09 | |||||||||||||
|
Exercised
|
(42,500 | ) | $ | 1.50- $ 1.50 | ||||||||||||
|
Cancelled / forfeited
|
(175,246 | ) | $ | 1.10- $ 6.94 | ||||||||||||
|
Balance, December 31, 2010
|
2,158,906 | $ | 1.10- $ 5.17 |
6.9 years
|
$ | 214 | ||||||||||
|
Vested and excercisable at December 31, 2010
|
1,056,736 | $ | 1.10- $ 5.17 |
5.0 years
|
$ | 70 | ||||||||||
|
Expected to vest as of December 31, 2010
|
2,060,986 | $ | 1.10- $ 5.17 |
6.8 years
|
$ | 200 | ||||||||||
49
STRATEGIC DIAGNOSTICS INC. AND SUBSIDIARIES
NOTES TO CONSOLIDATED FINANCIAL STATEMENTS
AS OF AND FOR THE YEAR ENDED DECEMBER 31, 2010
(in thousands, except share and per share data)
As of December 31, 2010, options covering 1,056,736 shares were exercisable with a weighted average exercise price of $3.24 per share, and 1,327,925 shares were available for future grant under the 2000 Plan.
As of December 31, 2010 there was $730 of unrecognized compensation expense related to non-vested stock options that is expected to be recognized over a weighted average period of 2.8 years.
The total aggregate intrinsic value of options exercised during the years ended December 31, 2010, 2009 and 2008 was $6, $0 and $0 respectively. Cash received from the exercises during the years ended December 31, 2010, 2009 and 2008 was $64, $0 and $0 and are included within the financing activity section of the consolidated statements of cash flows.
The weighted average fair value at the date of grant for options granted during 2010, 2009 and 2008 was estimated at $0.83, $0.62 and $1.39 per share, respectively, using the Black-Scholes pricing model. The weighted-average assumptions used in the Black-Scholes model were as follows: dividend yield of 0%, expected volatility of 51% in 2010, 51% in 2009 and 49% in 2008, risk-free interest rate of 2.51% in 2010, 2.50% in 2009 and 3.20% in 2008, and an expected option life of 6 years in each of the years ended December 31, 2010, 2009 and 2008. The expected option life was computed using the sum of the average vesting period and the contractual life of the option and dividing by 2, for all periods presented.
The following table provides additional information about the Company’s stock options outstanding at December 31, 2010:
|
Options Outstanding
|
Options Exercisable
|
||||||||||||||||
|
Weighted Average
|
Wtd. Average
|
||||||||||||||||
|
Range of
|
Number of
|
Remaining
|
Exercise
|
Number of
|
Exercise
|
||||||||||||
|
Exercise Prices
|
Shares
|
Contractual Life
|
Price
|
Shares
|
Price
|
||||||||||||
| $ 1.10 - $ 2.51 | 1,386,652 | 8.4 Years | $ | 1.68 | 310,482 | $ | 1.62 | ||||||||||
| $ 3.05 - $ 3.57 | 206,400 | 2.6 Years | $ | 3.32 | 206,400 | $ | 3.32 | ||||||||||
| $ 3.69 - $ 5.17 | 565,854 | 4.5 Years | $ | 4.16 | 539,854 | $ | 4.14 | ||||||||||
| $ 1.50 - $ 5.17 | 2,158,906 | 6.9 Years | $ | 2.49 | 1,056,736 | $ | 3.24 | ||||||||||
50
STRATEGIC DIAGNOSTICS INC. AND SUBSIDIARIES
NOTES TO CONSOLIDATED FINANCIAL STATEMENTS
AS OF AND FOR THE YEAR ENDED DECEMBER 31, 2010
(in thousands, except share and per share data)
The Company grants restricted stock awards (RSA) which is the right to receive shares. The fair value of RSAs is based on the market price for the stock at the date of grant. RSAs generally vest over periods of two to five years.
The following table summarizes the changes in non-vested RSAs for the three year period ending December 31, 2010:
|
Weighted Average
|
||||||||||||
|
Grant Date
|
Aggregate
|
|||||||||||
|
Shares
|
Fair Value
|
Intrinsic Value
|
||||||||||
|
Non-vested RSAs at January 1, 2008
|
96,116 | $ | 4.36 | |||||||||
|
Granted
|
266,619 | $ | 1.99 | |||||||||
|
Vested
|
(52,117 | ) | $ | 4.02 | ||||||||
|
Cancelled / forfeited
|
(14,212 | ) | $ | 4.71 | ||||||||
|
Non-vested RSAs at December 31, 2008
|
296,406 | $ | 2.28 | |||||||||
|
Granted
|
64,500 | $ | 1.26 | |||||||||
|
Vested
|
(142,133 | ) | $ | 2.26 | ||||||||
|
Cancelled / forfeited
|
(12,747 | ) | $ | 3.78 | ||||||||
|
Non-vested RSAs at December 31, 2009
|
206,026 | $ | 1.77 | |||||||||
|
Granted
|
87,500 | $ | 1.59 | |||||||||
|
Vested
|
(139,476 | ) | $ | 1.52 | ||||||||
|
Cancelled / forfeited
|
(18,300 | ) | $ | 1.46 | ||||||||
|
Non-vested RSAs at December 31, 2010
|
135,750 | $ | 1.95 | $ | 239 | |||||||
|
Expected to vest at December 31, 2010
|
124,425 | $ | 1.94 | $ | 219 | |||||||
The Company recorded compensation expense of $178, $280 and $291 for the years ended December 31, 2010, 2009 and 2008, for RSAs. This expense is a component of selling, general and administrative expenses, and is recorded as a non-cash expense in the operating activities section of the consolidated statement of cash flows. As of December 31, 2010, 124,425 of the above non-vested RSAs are expected to vest and there is approximately $191 of unrecognized compensation expense related to non-vested RSAs that are expected to vest over a weighted average of 2 years.
51
STRATEGIC DIAGNOSTICS INC. AND SUBSIDIARIES
NOTES TO CONSOLIDATED FINANCIAL STATEMENTS
AS OF AND FOR THE YEAR ENDED DECEMBER 31, 2010
(in thousands, except share and per share data)
7. SEGMENT, GEOGRAPHIC AND CUSTOMER INFORMATION
The Company develops and manufactures antibodies in its life sciences division. Such antibodies are incorporated into test kits manufactured by the Company’s Kit products division for the detection of a wide variety of substances related to food safety and water quality. In addition, antibodies from the life sciences division are sold to medical diagnostic and pharmaceutical companies and research institutions. The Company does not provide segment disclosures, as discrete financial information is not prepared on a divisional basis for review by the Company’s Chief Operating Decision Maker.
Geographic:
The following table sets forth revenues by geographic region:
|
Year Ended December 31,
|
||||||||||||
|
2010
|
2009
|
2008
|
||||||||||
|
United States
|
$ | 21,269 | $ | 19,739 | $ | 20,744 | ||||||
|
Rest of the world
|
7,080 | 7,415 | 6,915 | |||||||||
|
Total
|
$ | 28,349 | $ | 27,154 | $ | 27,659 | ||||||
The Company’s basis for identifying sales by country is the ship-to location. There were no individual countries outside of the United States that represented more than 10% of the total revenues of the Company. There are no significant long-lived assets located outside the United States.
No single customer accounted for 10% or more of the Company’s revenues in 2010, 2009 or 2008.
Products and Services:
The following table sets out revenues by product category.
|
Year Ended December 31,
|
||||||||||||
|
2010
|
2009
|
2008
|
||||||||||
|
Life Science
|
$ | 15,361 | $ | 14,321 | $ | 13,821 | ||||||
|
Kit products
|
12,913 | 12,738 | 13,634 | |||||||||
|
Contract revenue
|
75 | 95 | 204 | |||||||||
|
Revenues
|
$ | 28,349 | $ | 27,154 | $ | 27,659 | ||||||
52
STRATEGIC DIAGNOSTICS INC. AND SUBSIDIARIES
NOTES TO CONSOLIDATED FINANCIAL STATEMENTS
AS OF AND FOR THE YEAR ENDED DECEMBER 31, 2010
(in thousands, except share and per share data)
8. COMMITMENTS AND CONTINGENCIES
The Company leases its office and manufacturing facilities and other equipment under operating leases. Rent expense for the years ended December 31, 2010, 2009 and 2008, was $968, $1,157 and $991, respectively. Future commitments under non-cancelable leases at December 31, 2010 are as follows:
|
2011
|
$ | 1,074 | ||
|
2012
|
330 | |||
|
2013
|
300 | |||
|
2014
|
300 | |||
|
2015
|
300 | |||
|
2016 and thereafter
|
300 | |||
| $ | 2,604 |
The Company’s subsidiary, AZUR Environmental Limited, is the lessee for two real property leases located in the United Kingdom. In 2001, the landlord of the two properties gave AZUR Environmental Limited its consent to allow AZUR to assign the lease and its related obligations to a third party. As inducement to the landlord to grant the assignment, AZUR was required to guarantee performance under the original lease terms if the third party fails to perform. Both lease terms expire in November 2016 and provide for annual principal rent payments of approximately $300 per year in the aggregate and these amounts have been included in the table above.
The Company is subject to various claims arising in the ordinary course of business. Although the ultimate outcome of these matters is presently not determinable, management does not believe that the outcome of these matters will have a material adverse effect on the Company’s financial position or results of operations.
9. RETIREMENT SAVINGS PLAN
The Company maintains a retirement savings plan qualified under Section 401(k) of the Internal Revenue Code. The plan allows for eligible employees to contribute a portion of their gross wages to the plan. The Company matches employees’ contributions on a 100% basis up to 1% of gross wages and on a 50% basis up to the next 5% of gross wages. In 2010, 2009 and 2008, the Company recognized expense of $254, $245 and $242, respectively, associated with this plan.
53
STRATEGIC DIAGNOSTICS INC. AND SUBSIDIARIES
NOTES TO CONSOLIDATED FINANCIAL STATEMENTS
AS OF AND FOR THE YEAR ENDED DECEMBER 31, 2010
(in thousands, except share and per share data)
10. INCOME TAXES
The components of income (loss) before taxes for the years ended December 31 are as follows:
|
2010
|
2009
|
2008
|
||||||||||
|
United States
|
$ | (1,055 | ) | $ | (1,900 | ) | $ | (7,587 | ) | |||
|
Rest of the world
|
84 | 137 | 178 | |||||||||
|
Total
|
$ | (971 | ) | $ | (1,763 | ) | $ | (7,409 | ) | |||
The income tax expense (benefit) consists of the following:
|
2010
|
2009
|
2008
|
|||||||||||
|
Federal
|
current
|
$ | (23 | ) | $ | (147 | ) | $ | (20 | ) | |||
|
deferred
|
- | 7,249 | |||||||||||
| (23 | ) | (147 | ) | 7,229 | |||||||||
|
State
|
current
|
- | 7 | (135 | ) | ||||||||
|
deferred
|
- | - | 1,242 | ||||||||||
| - | 7 | 1,107 | |||||||||||
|
Foreign
|
current
|
- | - | - | |||||||||
|
deferred
|
15 | 28 | 50 | ||||||||||
| 15 | 28 | 50 | |||||||||||
|
Total
|
$ | (8 | ) | $ | (112 | ) | $ | 8,386 | |||||
54
STRATEGIC DIAGNOSTICS INC. AND SUBSIDIARIES
NOTES TO CONSOLIDATED FINANCIAL STATEMENTS
AS OF AND FOR THE YEAR ENDED DECEMBER 31, 2010
(in thousands, except share and per share data)
The following table summarizes the significant differences between the U.S. Federal statutory rate and the Company’s effective tax rate for financial statement purposes:
|
2010
|
2009
|
2008
|
||||||||||
|
Statutory tax rate
|
34.0 | % | 34.0 | % | 34.0 | % | ||||||
|
State taxes, net of federal benefit
|
- | (0.3 | ) | (9.9 | ) | |||||||
|
Valuation allowance, federal
|
(31.0 | ) | (22.7 | ) | (135.8 | ) | ||||||
|
Goodwill impairment
|
- | - | (2.5 | ) | ||||||||
|
Other, net
|
(2.0 | ) | (4.7 | ) | 1.0 | |||||||
|
Total
|
1.0 | % | 6.3 | % | (113.2 | %) | ||||||
Significant components of the Company’s deferred tax assets as of December 31 are as follows:
|
2010
|
2009
|
|||||||
|
Net operating loss carryforwards
|
$ | 6,620 | $ | 7,856 | ||||
|
Credit carryforwards
|
1,043 | 884 | ||||||
|
Amortization and depreciation
|
3,447 | 3,647 | ||||||
|
Deferred compensation
|
245 | 240 | ||||||
|
Non-deductible reserves
|
168 | 141 | ||||||
|
Inventory costs not currently deductible
|
362 | 323 | ||||||
|
Total deferred tax assets
|
11,885 | 13,091 | ||||||
|
Valuation allowance
|
(11,848 | ) | (13,039 | ) | ||||
|
Net deferred tax assets
|
$ | 37 | $ | 52 | ||||
Overall, the valuation allowance for deferred tax assets decreased during 2010 by $1,191. The valuation allowance was decreased by $1,737 related to net operating losses that expired during 2010, which was offset by an increase in the valuation allowance of $546 related to the net operating loss generated during 2010.
55
STRATEGIC DIAGNOSTICS INC. AND SUBSIDIARIES
NOTES TO CONSOLIDATED FINANCIAL STATEMENTS
AS OF AND FOR THE YEAR ENDED DECEMBER 31, 2010
(in thousands, except share and per share data)
FASB ASC 740, Accounting for Income Taxes (“FASB ASC 740”), requires a company to evaluate its deferred tax assets on a regular basis to determine if a valuation allowance against the net deferred tax assets is required. Pursuant to FASB ASC 740, a cumulative pre-tax loss in recent years is significant negative evidence that is difficult to overcome in considering whether deferred tax assets are more likely than not realizable. The Company has evaluated the possibility of potential tax planning strategies and determined that none currently exist that the Company would conclude are prudent and feasible. The Company has concluded, based upon the evaluation of all available evidence, that it is more likely than not that the U.S. federal and state net deferred tax assets will not be realized and has recorded a full valuation allowance on its U.S. federal and state net deferred tax assets, as of December 31, 2010.
At December 31, 2010, the Company had approximately $4,600 of net operating loss carryforwards for tax purposes which have no expiration related to operations in the United Kingdom (“UK”). Management considered positive and negative indicators, as well as potential tax planning strategies, and has concluded that a substantial valuation allowance of approximately $930 was necessary for the foreign deferred tax assets of approximately $970. The positive indicators include the contribution to income before taxes by the foreign operations in the UK for 2010, 2009 and 2008, and the forecasted income before taxes in the UK for 2011 and 2012. The negative indicators include a history of substantial net operating losses in the UK, the lack of income before taxes prior to 2004, limited income before taxes in the recent years and limitations with regard to estimating income in the UK beyond 2012 resulting from a year-to-year evaluation of the future need for a UK subsidiary.
At December 31, 2010, the Company had U.S. federal net operating loss carryforwards of $15,527 including those of acquired companies, which will expire as follows:
|
Year
|
Net
Operating Loss |
|||
|
2011
|
$ | 917 | ||
|
2017
|
760 | |||
|
2018
|
1,327 | |||
|
2019
|
550 | |||
|
2020
|
66 | |||
|
2021
|
56 | |||
|
2022
|
2,268 | |||
|
2024
|
2,032 | |||
|
2025
|
3 | |||
|
2026
|
1 | |||
|
2027
|
1 | |||
|
2028
|
3,492 | |||
|
2029
|
2,501 | |||
|
2030
|
1,553 | |||
|
Total
|
$ | 15,527 | ||
The above includes net operating losses of $555 which, if realized, would be accounted for as additional paid in capital and excludes $440 related to unrecognized tax benefits.
56
STRATEGIC DIAGNOSTICS INC. AND SUBSIDIARIES
NOTES TO CONSOLIDATED FINANCIAL STATEMENTS
AS OF AND FOR THE YEAR ENDED DECEMBER 31, 2010
(in thousands, except share and per share data)
The Tax Reform Act of 1986 (the “Act”) limits the annual use of net operating loss and income tax credit carryforwards (after certain ownership changes, as defined by the Act). The application of these limits could significantly restrict the Company’s ability to utilize these carryforwards. Certain of the Company’s total net operating loss carryforwards from 2001 and prior years are subject to limitations on their annual use since a cumulative change in ownership of more than 50% has occurred within a three-year period with respect to those net operating loss carryforwards. The Company continues to evaluate recent changes in ownership. If it is determined that an ownership change of more than 50% within a three-year period did occur, as determined pursuant to the Internal Revenue Code and Regulations, substantially all the net operating loss carryforwards and income tax credit carryforwards could be subject to annual limitations on usage. Because U.S. tax laws limit the time period during which these carryforwards may be applied against future taxable income, the Company may not be able to take full advantage of these attributes for federal and state income tax purposes due to the annual limitation usage.
The Company has federal research and experimentation credit carryforwards of $818, net of $90 related to unrecognized tax benefits, as of December 31, 2010, which are set to expire in years 2021 through 2030. The Company also has federal alternative minimum tax credit carryforwards of $6 which have indefinite lives. In accordance with Internal Revenue Code §168(k)(4)) the Company intends to elect out of bonus depreciation on the filing of its 2010 federal income tax return which will result in a federal tax refund related to certain of the research and experimentation credits and the alternative minimum tax credits. Accordingly, the research and experimentation credits and alternative minimum tax credits were reduced in 2010 by $30 and $1, respectively.
57
STRATEGIC DIAGNOSTICS INC. AND SUBSIDIARIES
NOTES TO CONSOLIDATED FINANCIAL STATEMENTS
AS OF AND FOR THE YEAR ENDED DECEMBER 31, 2010
(in thousands, except share and per share data)
The following table is a reconciliation of the gross unrecognized tax benefits during the years ended December 31:
|
2010
|
2009
|
2008
|
||||||||||
|
Gross unrecognized tax benefits as of January 1
|
$ | 510 | $ | 487 | $ | 580 | ||||||
|
Increases from positions taken in prior periods
|
- | - | - | |||||||||
|
Decreases from positions taken in prior periods
|
(6 | ) | (5 | ) | (130 | ) | ||||||
|
Increases from positions taken in current period
|
36 | 28 | 37 | |||||||||
|
Decreases from unrecognized tax benefits for settlements
|
||||||||||||
|
with taxing authorities
|
- | - | - | |||||||||
|
Gross unrecognized tax benefits as of December 31
|
$ | 540 | $ | 510 | $ | 487 | ||||||
The unrecognized tax benefits at December 31, 2010 of $540, if recognized in a period where there was not a full valuation allowance, would affect the effective tax rate.
The Company is subject to U.S. federal and UK income tax, as well as income taxes of multiple state jurisdictions.
The Company recognizes accrued interest expense and penalties related to uncertain tax benefits that have resulted in a refund or reduction of income taxes paid. Unrecognized tax benefits aggregating $530 would reduce already existing net operating loss and tax credit carryforwards and therefore require no accrual for interest or penalty in any of the years 2010, 2009 or 2008. The remaining unrecognized tax benefit of $10 include diminimus interest and penalty where required.
For federal purposes, post-1992 tax years remain open to examination as a result of net operating loss carryforwards. For state purposes, the statute of limitations remains open in a similar manner for states that have generated net operating losses. The Company does not expect that the total amount of unrecognized tax benefits related to positions taken in prior periods will change significantly during the next 12 months.
58
STRATEGIC DIAGNOSTICS INC. AND SUBSIDIARIES
NOTES TO CONSOLIDATED FINANCIAL STATEMENTS
AS OF AND FOR THE YEAR ENDED DECEMBER 31, 2010
(in thousands, except share and per share data)
11. QUARTERLY FINANCIAL DATA (unaudited)
|
Three Months Ended,
|
||||||||||||||||
|
March 31
|
June 30
|
September 30
|
December 31
|
|||||||||||||
|
(In thousands except per share data)
|
||||||||||||||||
|
2010
|
||||||||||||||||
|
Revenues
|
$ | 6,691 | $ | 6,796 | $ | 7,473 | $ | 7,389 | ||||||||
|
Gross profit
|
3,936 | 4,032 | 4,458 | 4,142 | ||||||||||||
|
Net loss
|
(459 | ) | (215 | ) | (29 | ) | (260 | ) | ||||||||
|
Basic loss per share
|
(0.02 | ) | (0.01 | ) | - | (0.01 | ) | |||||||||
|
Diluted loss per share
|
(0.02 | ) | (0.01 | ) | - | (0.01 | ) | |||||||||
|
2009
|
||||||||||||||||
|
Revenues
|
$ | 6,902 | $ | 6,853 | $ | 7,196 | $ | 6,203 | ||||||||
|
Gross profit
|
3,805 | 3,630 | 4,113 | 3,190 | ||||||||||||
|
Net loss
|
(561 | ) | (734 | ) | (291 | ) | (65 | ) | ||||||||
|
Basic loss per share
|
(0.03 | ) | (0.04 | ) | (0.01 | ) | - | |||||||||
|
Diluted loss per share
|
(0.03 | ) | (0.04 | ) | (0.01 | ) | - | |||||||||
59
SIGNATURES
Pursuant to the requirements of Section 13 or 15(d) of the Securities Exchange Act of 1934, the Registrant has duly caused this report to be signed on its behalf by the undersigned, thereunto duly authorized.
|
STRATEGIC DIAGNOSTICS INC.
|
||
|
Date:
|
April 1, 2011
|
/s/ Francis M. DiNuzzo
|
|
Francis M. DiNuzzo
|
||
|
President, Chief Executive Officer and Director
|
||
Pursuant to the requirements of the Securities Exchange Act of 1934, this report has been signed below by the following persons on behalf of the Registrant and in the capacities and on the dates indicated.
|
Date:
|
April 1, 2011
|
/s/ Thomas A. Bologna
|
|
Thomas A. Bologna
|
||
|
Chairman of the Board of Directors
|
||
|
Date:
|
April 1, 2011
|
/s/ Francis M. DiNuzzo
|
|
Francis M. DiNuzzo
|
||
|
President, Chief Executive Officer and Director
(Principal Executive Officer)
|
||
|
Date:
|
April 1, 2011
|
/s/ Kevin J. Bratton
|
|
Kevin J. Bratton
|
||
|
Vice President – Finance and Chief Financial Officer
(Principal Financial and Accounting Officer)
|
||
|
Date:
|
April 1, 2011
|
/s/ Steven Becker
|
|
Steven Becker
|
||
|
Director
|
||
|
Date:
|
April 1, 2011
|
/s/ Geoffrey Davis
|
|
Geoffrey Davis
|
||
|
Director
|
||
|
Date:
|
April 1, 2011
|
/s/ Richard van den Broek
|
|
Richard van den Broek
|
||
|
Director
|
||
|
Date:
|
April 1, 2011
|
/s/ Stephen L. Waechter
|
|
Stephen L. Waechter
|
||
|
Director
|
||
|
Date:
|
April 1, 2011
|
/s/ David M. Wurzer
|
|
David M. Wurzer
|
||
|
Director
|
||
|
Date:
|
April 1, 2011
|
/s/ Wayne P. Yetter
|
|
Wayne P. Yetter
|
||
|
Director
|
60