Attached files
| file | filename |
|---|---|
| EX-31.2 - EX-31.2 - TIDEWATER FUTURES FUND LP | y04582exv31w2.htm |
| EX-31.1 - EX-31.1 - TIDEWATER FUTURES FUND LP | y04582exv31w1.htm |
| EX-32.2 - EX-32.2 - TIDEWATER FUTURES FUND LP | y04582exv32w2.htm |
| EX-32.1 - EX-32.1 - TIDEWATER FUTURES FUND LP | y04582exv32w1.htm |
| EX-10.1.A - EX-10.1.A - TIDEWATER FUTURES FUND LP | y04582exv10w1wa.htm |
UNITED STATES
SECURITIES AND EXCHANGE COMMISSION
SECURITIES AND EXCHANGE COMMISSION
WASHINGTON, D.C. 20549
FORM 10-K
| þ | ANNUAL REPORT PURSUANT TO SECTION 13 or 15(d) OF THE SECURITIES EXCHANGE ACT OF 1934 |
For the fiscal year ended December 31, 2010
OR
| o | TRANSITION REPORT PURSUANT TO SECTION 13 OR 15(d) OF THE SECURITIES EXCHANGE ACT OF 1934 |
For the transition period from to .
Commission File Number 000-52604
TIDEWATER FUTURES FUND L.P.
(Exact name of registrant as specified in its charter)
| New York | 04-3621353 | |
| (State or other jurisdiction of incorporation or organization) |
(I.R.S. Employer Identification No.) |
|
c/o Ceres Managed Futures LLC
522 Fifth Avenue — 14th Floor
New York, New York 10036
(Address and Zip Code of principal executive offices)
522 Fifth Avenue — 14th Floor
New York, New York 10036
(212) 296-1999
(Registrant’s telephone number, including area code)
Securities registered pursuant to Section 12(b) of the Act: None
Securities registered pursuant to Section 12(g) of the Act:
|
Redeemable Units of Limited Partnership Interest | |||
Indicate by check mark if the registrant is a well-known seasoned issuer, as defined in Rule 405 of
the Securities Act.
Yes o No þ
Indicate by check mark if the registrant is not required to file reports pursuant to Section 13 or
Section 15(d) of the Act.
Yes o No þ
Indicate by check mark whether the registrant (1) has filed all reports required to be filed by
Section 13 or 15(d) of the Securities Exchange Act of 1934 during the preceding 12 months (or for
such shorter period that the registrant was required to file such reports), and (2) has been
subject to such filing requirements for the past 90 days.
Yes þ No o
Indicate by check mark whether the registrant has submitted electronically and posted on its
corporate Web site, if any, every Interactive Data File required to be submitted and posted
pursuant to Rule 405 of Regulation S-T during the preceding 12 months (or for such shorter period
that the registrant was required to submit and post such files). Yes o No o
Indicate by check mark if disclosure of delinquent filers pursuant to Item 405 of Regulation S-K is
not contained herein, and will not be contained, to the best of registrant’s knowledge, in
definitive proxy or information statements incorporated by reference in Part III of this Form 10-K
or any amendment to this form 10-K þ
Indicate by check mark whether the registrant is a large accelerated filer, an accelerated filer, a
non-accelerated filer, or a smaller reporting company. See the definitions of “large accelerated
filer,” “accelerated filer” and “smaller reporting company” in Rule 12b-2 of the Exchange Act.
(Check one):
| Large accelerated filer o | Accelerated filer o | Non-accelerated filer þ | Smaller reporting company o | |||
| (Do not check if a smaller reporting company) |
Indicate by check mark whether the registrant is a shell company (as defined in Rule 12b-2 of the
Exchange Act).
Yes o No þ
Limited Partnership Redeemable Units with an aggregate value
of $38,124,904 were outstanding and
held by non-affiliates as of the last business day of the registrant’s most recently completed
second calendar month.
As of
February 28, 2011, 16,977.2188 Limited Partnership Redeemable Units
were outstanding.
DOCUMENTS INCORPORATED BY REFERENCE
[None]
[None]
TABLE OF CONTENTS
PART I
Item 1. Business.
(a) General Development of Business. Tidewater Futures Fund L.P. (the “Partnership”)
is a limited partnership organized on February 23, 1995 under the partnership laws of the State of
New York to engage in the speculative trading of a diversified portfolio of commodity interests
including futures contracts, options, swaps and forward contracts. The sectors traded include
currencies, energy, grains, indices, U.S. and non-U.S. interest rates, livestock, lumber, metals
and softs. The commodity interests that are traded by the Partnership are volatile and involve a
high degree of market risk.
During the initial offering period (April 17, 1995 to July 1, 1995), the Partnership sold
5,111 redeemable units of limited partnership interest (“Redeemable Units”) at $1,000 per
Redeemable Unit. The Partnership privately and continuously offers up to 150,000 Redeemable Units
in the Partnership to qualified investors. There is no maximum number of Redeemable Units that may
be sold by the Partnership. Subscriptions and redemptions of Redeemable Units and General Partner
contributions and redemptions for the years ended December 31, 2010, 2009 and 2008 are reported in
the Statements of Changes in Partners’ Capital on page 28 under “Item 8. Financial Statements
and Supplementary Data.”
Ceres Managed Futures LLC, a Delaware limited liability company, acts as the general partner
(the “General Partner”) and commodity pool operator of the Partnership. The General Partner is
wholly owned by Morgan Stanley Smith Barney Holdings LLC (“MSSB
Holdings”). Morgan Stanley, indirectly through various subsidiaries, owns a
majority equity interest in MSSB Holdings.
Citigroup Global Markets Inc. (“CGM”), the commodity broker and a selling agent for the
Partnership, owns a minority equity interest in MSSB Holdings. Citigroup Inc. (“Citigroup”), indirectly
through various subsidiaries, wholly owns CGM. Prior to July 31, 2009, the date as of which MSSB
Holdings became its owner, the General Partner was wholly owned by Citigroup Financial Products
Inc., a wholly owned subsidiary of Citigroup Global Markets Holdings Inc., the sole owner of which
is Citigroup. As of December 31, 2010, all trading decisions for the
Partnership are made by the Advisor (defined below).
For the period from July 12, 2010 through September 14, 2010, Chesapeake Capital Corporation
(“Chesapeake” or the “Advisor”), in consultation with the General Partner, reduced temporarily the
overall leverage of the Partnership’s assets traded pursuant to the Advisor’s Diversified 2XL
Program (the “Program”) from 75% of the customary leverage utilized by the Program, to 50% of the
customary leverage utilized by the Program. Effective September 15, 2010, the Advisor, in
consultation with the General Partner, increased the overall leverage of the Partnership’s assets
traded pursuant to the Program from 50% of the customary leverage utilized by the Program to 62.5%
of the customary leverage utilized by the Program. Effective October 12, 2010, the Advisor, in
consultation with the General Partner, increased the overall leverage of the Partnership assets
traded pursuant to the Program to 75% of the customary leverage utilized by the Program. The
Advisor, in further consultation with the General Partner, will determine if, and at what time, the
leverage may be further readjusted. Such adjustments to the leverage employed will not exceed 100%
of the customary leverage utilized by the Advisor in the Program.
The Partnership’s trading of futures, forward and options contracts, if applicable, on
commodities is done primarily on U.S. commodity exchanges and foreign commodity exchanges. It engages in such trading
through a commodity brokerage account maintained with CGM.
The Partnership will be liquidated upon the first of the following to occur: December 31,
2015; when the net asset value per Redeemable Unit decreases to less than $400 per Redeemable Unit
as of the close of business on any business day, or under certain circumstances as defined in the
Limited Partnership Agreement of the Partnership (the “Limited Partnership Agreement”).
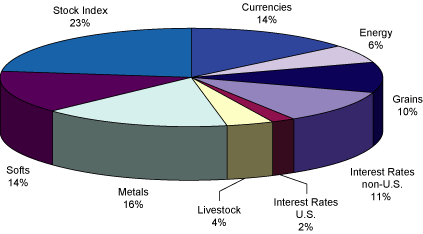
For the period January 1, 2010 through December 31, 2010, the approximate average market
sector distribution for the Partnership was as follows:
The General Partner has entered into a management agreement (the “Management Agreement”) with
the Advisor, a registered commodity trading advisor, who will make all commodity trading decisions
for the Partnership. A description of the trading activities and focus of the Advisor is included
on page 7, under “Item 7. Management’s Discussion and Analysis of Financial Condition and Results
of Operations.” The Advisor is not affiliated with the General Partner or CGM. The Advisor is not
responsible for the organization or operation of the Partnership.
2
Pursuant to the terms of the Management Agreement, the Partnership is obligated to pay the
Advisor a monthly management fee equal to 1/6 of 1% (2% per year) of month-end Net Assets managed
by the Advisor. Month-end Net Assets, for the purpose of calculating management fees, are Net
Assets, as defined in the Limited Partnership Agreement, prior to the reduction of the current
month’s incentive fee accrual, the monthly management fee and any redemptions or distributions as
of the end of such month. For the period from August 1, 2010 through September 30, 2010, the
Advisor reduced the management fee it receives from the Partnership
from an annual rate of 2% of
adjusted net assets to an annual rate of 1% of adjusted net assets. For the period from October 1,
2010 through October 31, 2010, the Advisor reduced the management fee it receives from the
Partnership from an annual rate of 2% of adjusted net assets to an annual rate of 1.5% of adjusted
net assets. The Management Agreement may be terminated upon notice by either party.
In addition, the Partnership is obligated to pay the Advisor an incentive fee, payable
quarterly, equal to 20% of the New Trading Profits, as defined in the Management Agreement, earned
by the Advisor for the Partnership during each calendar quarter. The Advisor will not be paid
incentive fees until the Advisor recovers the net loss incurred and earns additional new trading
profits for the Partnership.
The Partnership has entered into a customer agreement (the “Customer Agreement”) with CGM
which provides that the Partnership will pay CGM a monthly brokerage fee equal to 6.5% per year of
month-end Net Assets, in lieu of brokerage fees on a per trade basis.
Effective February 1, 2011, the Partnership reduced the monthly brokerage fee paid to CGM to 5.0% per year of month-end Net Assets.
Month-end Net Assets, for the
purpose of calculating brokerage fees are Net Assets, as defined in the Limited Partnership
Agreement, prior to the reduction of the current month’s brokerage fees, incentive fee accrual, the
monthly management fee and other expenses and any redemptions or distributions as of the end of
such month. CGM will pay a portion of its brokerage fees to other
properly registered selling agents and to financial advisors who have sold
Redeemable Units. Brokerage fees will be paid for the life of the
Partnership, although the rate at which such fees are paid may be
changed. This fee may be increased or decreased at any time at CGM’s
discretion upon written notice to the Partnership.
The Partnership will pay
for National Futures Association (“NFA”) fees, exchange fees, clearing fees, give-up fees, user fees and floor brokerage fees
(collectively the “clearing fees”). All of the Partnership’s assets are deposited in the
Partnership’s account at CGM. The Partnership’s cash is deposited by CGM in segregated bank
accounts to the extent required by Commodity Futures Trading
Commission regulations. CGM will pay the Partnership interest on 80%
of the average daily equity maintained in cash in the Partnership’s brokerage account during each
month at a 30-day U.S. Treasury bill rate determined weekly by CGM based on the average
non-competitive yield on 3-month U.S. Treasury bills maturing in 30 days from the date on which
such weekly rate is determined. The Customer Agreement between the Partnership and
CGM gives the Partnership the legal right to net unrealized gains and losses. The Customer
Agreement may be terminated upon notice by either party.
(b) Financial Information About Segments. The Partnership’s business consists
of only one segment, speculative trading of commodity interests. The Partnership does not engage in
sales of goods or services. The Partnership’s net income (loss) from operations for the years ended
December 31, 2010, 2009, 2008, 2007 and 2006 is set forth under “Item 6. Selected Financial
Data.” The Partnership’s Capital as of December 31, 2010 was $41,672,044.
(c) Narrative Description of Business.
See Paragraphs (a) and (b) above.
(i) through (xii) — Not applicable.
(xiii) — The Partnership has no employees.
(d) Financial Information About Geographic Areas. The Partnership does not engage in
sales of goods or services or own any long-lived assets, and therefore this item is not applicable.
3
(e) Available Information. The Partnership does not have an internet address. The
Partnership will provide paper copies of its annual report on Form 10-K, quarterly reports on Form
10-Q, current reports on Form 8-K and any amendments to these reports free of charge upon request.
(f) Reports to Security Holders. Not applicable.
(g) Enforceability of Civil Liabilities Against Foreign Persons. Not applicable.
(h) Smaller Reporting Companies. Not applicable.
Item 1A. Risk Factors.
As a result of leverage, small changes in the price of the Partnership’s positions may result
in major losses.
The trading of commodity interests is speculative, volatile and involves a high degree of
leverage. A small change in the market price of a commodity interest contract can produce major
losses for the Partnership. Market prices can be influenced by, among other things, changing supply
and demand relationships, governmental, agricultural, commercial and trade programs and policies,
national and international political and economic events, weather and climate conditions, insects
and plant disease, purchases and sales by foreign countries and changing interest rates.
An investor may lose all of their investment.
Due to the speculative nature of trading commodity interests, an investor could lose all of
their investment in the Partnership.
The Partnership will pay substantial fees and expenses regardless of profitability.
Regardless of its trading performance, the Partnership will incur fees and expenses, including
brokerage and management fees. Fees will be paid to the Advisor even if the Partnership experiences
a net loss for the full year.
An investor’s ability to redeem or transfer units is limited.
An investor’s ability to redeem units is limited and no market exists for the units.
Conflicts of interest exist.
The Partnership is subject to numerous conflicts of interest including those that arise from
the facts that:
1. The
General Partner and the Partnership’s commodity broker are affiliates;
2. The Advisor, the Partnership’s commodity broker and their principals and affiliates may trade in
commodity interests for their own accounts; and
3. An investor’s financial advisor will receive ongoing compensation for providing services
to the investor’s account.
Investing in units might not provide the desired diversification of an investor’s overall
portfolio.
The Partnership will not provide any benefit of diversification of an investor’s overall
portfolio unless it is profitable and produces returns that are independent from stock and bond
market returns.
Past performance is no assurance of future results.
The Advisor’s trading strategies may not perform as they have performed in the past. The
Advisor has from time to time incurred substantial losses in trading on behalf of clients.
4
An investor’s tax liability may exceed cash distributions.
Investors are taxed on their share of the Partnership’s income, even though the Partnership
does not intend to make any distributions.
Regulatory changes could restrict the Partnership’s operations.
Regulatory changes could adversely affect the Partnership by restricting its markets or
activities, limiting its trading and/or increasing the taxes to which investors are subject.
Pursuant to the mandate of the Dodd-Frank Wall Street Reform and Consumer Protection Act, signed
into law on July 21, 2010, the Commodity Futures Trading Commission (“CFTC”) and the Securities and
Exchange Commission (the “SEC”) may promulgate rules to regulate swaps dealers, require that swaps
be traded on an exchange or swap execution facilities, mandate additional reporting and disclosure
requirements and require that derivatives (such as those traded by the Partnership) be moved into
central clearinghouses. These rules, if promulgated, may negatively impact the manner in which
swap contracts are traded and/or settled and limit trading by speculators (such as the Partnership)
in futures and over-the-counter markets.
Speculative position and trading limits may reduce profitability.
The CFTC and U.S. exchanges have established speculative position limits on the maximum net
long or net short positions which any person may hold or control in particular futures and options
on futures. The trading instructions of an advisor may have to be modified, and positions held by
the Partnership may have to be liquidated in order to avoid exceeding these limits. Such
modification or liquidation could adversely affect the operations and profitability of the
Partnership by increasing transaction costs to liquidate positions and foregoing potential profits.
Item 2. Properties.
The Partnership does not own or lease any properties. The General Partner operates out of
facilities provided by MSSB Holdings.
Item 3. Legal Proceedings.
This section describes the major pending legal proceedings, other than ordinary routine
litigation incidental to the business, to which CGM is a party or to which any of their property is
subject. There are no material legal proceedings pending against the Partnership or the General
Partner.
CGM is a New York corporation with its principal place of business at 388 Greenwich St., New
York, New York 10013. CGM is registered as a broker-dealer and futures commission merchant
(“FCM’’), and provides futures brokerage and clearing services for institutional and retail
participants in the futures markets. CGM and its affiliates also provide investment banking and
other financial services for clients worldwide.
There have been no material administrative, civil or criminal actions within the past five
years against CGM or any of its individual principals and no such actions are currently pending,
except as follows.
Credit-Crisis-Related Litigation and Other Matters
Citigroup and CGM continue to
cooperate fully in response to subpoenas and requests for information from the SEC, FINRA, the
Federal Housing Finance Agency, state attorneys general, the Department of Justice and
subdivisions thereof, bank regulators, and other government agencies and authorities,
in connection with various formal and informal inquiries concerning Citigroup’s
subprime and other mortgage-related conduct and business activities, as well as
other business activities affected by the credit crisis. These business activities
include, but are not limited to, Citigroup’s sponsorship, packaging, issuance, marketing,
servicing and underwriting of MBS and CDOs and its origination, sale or other transfer,
servicing, and foreclosure of residential mortgages.
Subprime Mortgage-Related Litigation and Other Matters
The SEC, among other regulators, is investigating Citigroup’s subprime
and other mortgage-related conduct and business activities, as well as other business activities
affected by the credit crisis, including an ongoing inquiry into Citigroup’s
structuring and sale of CDOs. Citigroup is cooperating fully with the
SEC’s inquiries.
On July 29, 2010, the SEC announced the settlement
of an investigation into certain of Citigroup’s 2007 disclosures
concerning its subprime-related business activities. On October 19, 2010, the
United States District Court for the District of Columbia entered a Final Judgment
approving the settlement, pursuant to which Citigroup agreed to pay a $75 million civil
penalty and to maintain certain disclosure policies, practices and procedures for a three-year
period. Additional information relating to this action is publicly available in court filings under
the docket number 10 Civ. 1277 (D.D.C.) (Huvelle, J.).
The Federal Reserve Bank, the OCC and the FDIC, among other federal and state
authorities, are investigating issues related to the conduct of certain mortgage servicing
companies, including Citigroup affiliates, in connection with mortgage foreclosures. Citigroup is
cooperating fully with these inquiries.
Certain of these regulatory matters assert claims for substantial or indeterminate damages.
Some of these matters already have been resolved, either through settlements or court proceedings,
including the complete dismissal of certain complaints or the rejection of certain claims following
hearings.
In the course of its business, CGM, as a major futures commission merchant and broker-dealer,
is a party to various civil actions, claims and routine regulatory investigations and proceedings
that the General Partner believes do not have a material effect on the business of CGM.
Item 4. [Removed and Reserved]
5
PART II
Item 5. Market for Registrant’s Common Equity, Related Stockholder Matters and Issuer Purchases
of Equity Securities.
(a) Market Information. The Partnership has issued no stock. There is no public market
for the Redeemable Units.
(b) Holders. The number of holders of Redeemable Units as of December 31, 2010 was
516.
(c) Distribution.
The Partnership did not declare a distribution in 2010 or
2009. The Partnership does not intend to declare distributions in the forseeable future.
(d) Securities Authorized for Issuance under Equity Compensation Plans. None.
(e) Performance Graph. Not applicable
(f) Recent
Sales of Unregistered Securities; Use of Proceeds from Registered
Securities. For the year ended December 31, 2010,
there were additional subscriptions of 1,353.3838 Redeemable Units totaling $2,106,000. For the
year ended December 31, 2009, there were additional subscriptions of 1,526.6293 Redeemable Units
totaling $2,841,000. For the year ended December 31, 2008, there were additional subscriptions of
4,082.4408 Redeemable Units totaling $7,390,000 and 521.2428 General
Partner unit equivalents totaling $886,660.
The Redeemable Units were issued in reliance upon applicable exemptions from registration
under Section 4(2) of the Securities Act of 1933, as amended, and Section 506 of Regulation D
promulgated thereunder. The Redeemable Units were purchased by accredited investors, as described
in Regulation D.
Proceeds of net offering were used for the trading of commodity interests including futures
contracts, options, and forward and swap contracts.
(g) Purchases of Equity Securities by the Issuer and Affiliated Purchasers.
The following chart sets forth the purchases of Redeemable Units by the Partnership.
| (d) Maximum Number | ||||||||||||||||
| (or Approximate | ||||||||||||||||
| (c) Total Number | Dollar Value) of | |||||||||||||||
| of Redeemable Units | Redeemable | |||||||||||||||
| Purchased as Part | Units that | |||||||||||||||
| (a) Total Number | (b) Average | of Publicly | May Yet Be | |||||||||||||
| of Redeemable | Price Paid per | Announced | Purchased Under the | |||||||||||||
| Period | Units Purchased* | Redeemable Unit** | Plans or Programs | Plans or Programs | ||||||||||||
October 1, 2010 - October 31, 2010 |
334.7442 | $ | 1,768.04 | N/A | N/A | |||||||||||
November 1, 2010 - November 30, 2010 |
442.9268 | $ | 1,563.17 | N/A | N/A | |||||||||||
December 1, 2010 - December 31, 2010 |
398.4020 | $ | 1,982.43 | N/A | N/A | |||||||||||
| 1,176.0730 | $ | 1,763.51 | ||||||||||||||
| * | Generally, limited partners are permitted to redeem their Redeemable Units as of the end of each month on three business days’ notice to the General Partner. Under certain circumstances, the General Partner can compel redemption, although to date the General Partner has not exercised this right. Purchases of Redeemable Units by the Partnership reflected in the chart above were made in the ordinary course of the Partnership’s business in connection with effecting redemptions for limited partners. | |
| ** | Redemptions of Redeemable Units are effected as of the last day of each month at the net asset value per Redeemable Unit as of that day. |
6
Item 6. Selected Financial Data.
Net realized and unrealized trading gains (losses), interest income, net income (loss),
increase (decrease) in net asset value per unit and net asset value per unit for the years ended
December 31, 2010, 2009, 2008, 2007 and 2006, and total assets at December 31, 2010, 2009, 2008,
2007 and 2006 were as follows:
| 2010 | 2009 | 2008 | 2007 | 2006 | ||||||||||||||||
Net realized and
unrealized trading
gains (losses), net of
brokerage fees
(including clearing
fees) of $2,687,495,
$3,565,935, $4,769,347,
$5,850,002, and
$4,830,155,
respectively |
$ | (1,353,930 | ) | $ | 1,032,616 | $ | 13,935,204 | $ | (33,426,318 | ) | $ | 10,432,208 | ||||||||
Interest income |
$ | 33,924 | $ | 38,284 | $ | 758,022 | $ | 3,077,631 | $ | 2,548,664 | ||||||||||
| $ | (1,320,006 | ) | $ | 1,070,900 | $ | 14,693,226 | $ | (30,348,687 | ) | $ | 12,980,872 | |||||||||
Net income (loss) |
$ | (2,299,264 | ) | $ | (192,757 | ) | $ | 13,050,579 | $ | (35,224,227 | ) | $ | 9,007,334 | |||||||
Increase (decrease) in
net asset value per
unit |
$ | (53.40 | ) | $ | 53.37 | $ | 330.33 | $ | (817.81 | ) | $ | 319.88 | ||||||||
Net asset value per unit |
$ | 1,982.43 | $ | 2,035.83 | $ | 1,982.46 | $ | 1,652.13 | $ | 2,469.94 | ||||||||||
Total assets |
$ | 42,918,567 | $ | 51,030,910 | $ | 67,349,349 | $ | 68,715,245 | $ | 86,061,702 | ||||||||||
Item 7. Management’s Discussion and Analysis of Financial Condition and Results of
Operations.
Overview
The Partnership aims to achieve substantial capital appreciation through speculative trading
in U.S. and international markets for currencies, interest rates, stock indices, agricultural and
energy products and precious and base metals. The Partnership may employ futures, options on
futures, forwards and swap contracts in those markets.
The General Partner manages all business of the Partnership. The General Partner has delegated
its responsibility for the investment of the Partnership’s assets to Chesapeake. The General
Partner employs a team of approximately 40 professionals whose primary emphasis is on attempting to
maintain quality control among the advisors to the partnerships operated or managed by the General
Partner. A full-time staff of due diligence professionals use proprietary technology and on-site
evaluations to monitor new and existing futures money managers. The accounting and operations staff
provide processing of trading activity and reporting to limited partners and regulatory
authorities. In selecting the Advisor for the Partnership, the General Partner considered past
performance, trading style, volatility of markets traded and fee requirements. The General Partner
may modify or terminate the allocation of assets to the Advisor at any time.
Responsibilities of the General Partner include:
| • | due diligence examinations of the Advisor; | ||
| • | selection, appointment and termination of the Advisor; | ||
| • | negotiation of the management agreement; and | ||
| • | monitoring the activity of the Advisor. |
In addition, the General Partner prepares the books and records and provides the
administrative and compliance services that are required by law or
regulation, from time to time, in
connection with the operation of the Partnership. These services include the preparation of
required books and records and reports to limited partners, government agencies and regulators;
computation of net asset value; calculation of fees; effecting subscriptions, redemptions and
limited partner communications; and preparation of offering documents and sales literature.
The
General Partner seeks the best prices and services available in its commodity futures
brokerage transactions.
7
The programs offered generally by the Advisor to its clients to trade commodity interests for
their accounts are the Diversified Program and the Diversified 2XL Program, both systematic trading
programs. Chesapeake initially traded its Diversified Program on behalf of the Partnership,
however, since August 1, 1997, Chesapeake has traded the Partnership’s account pursuant to its
Diversified 2XL Program. The Diversified Program emphasizes a wide range of diversification by
utilizing a global portfolio of commodity interests, including, but not limited to, agricultural
products, precious and industrial metals, currencies, financial instruments, and stock, financial
and economic indices. These contracts are traded on a highly leveraged basis.
The Diversified 2XL Program employs the same trading system as the Diversified Program, except
that the Diversified 2XL Program is generally traded on an increased exposure basis equal to
approximately two times the exposure or trading level typically applied to a fully-funded
Diversified Program account. Ultimately, the appropriate exposure or trading level to be employed
as determined at the sole discretion of the Advisor will be determined by the performance factors
associated with the relevant account only, regardless of the intended performance relationship of
such account to other accounts trading in other programs that may utilize more or less exposure.
In general, the Advisor analyzes markets, including price action, market volatility, open
interest and volume (“technical analysis”) as a means of predicting market opportunity and
discovering any repeating patterns in past historical prices. The Advisor’s trading decisions are
based on a combination of its systems, market timing techniques, trading discretion, judgment and
experience, as well as market opportunities. The Advisor’s trading methodology is both systematic
and strategic. Trading decisions require the exercise of strategic judgment by the Advisor in
evaluating its technical trading methods, in their possible modification from time to time, and in
their implementation.
Exchanges on which transactions for the Partnership may take place include all futures
exchanges in the U.S. and certain non-U.S. futures exchanges. The Advisor continually monitors
numerous markets, both non-U.S. and U.S., and may initiate trades at any point the system
determines that the market is sufficiently liquid and suitable for trading using the methods
employed by the Advisor.
| (a) | Liquidity. |
The Partnership does not engage in sales of goods or services. The Partnership’s assets are
its equity in its trading account, consisting of cash and cash equivalents, net unrealized
appreciation on open futures contracts, net unrealized appreciation on open forward contracts, and
interest receivable. Because of the low margin deposits normally required in commodity futures
trading, relatively small price movements may result in substantial losses to the Partnership.
While substantial losses could lead to a material decrease in liquidity, no such illiquidity
occurred during the year ended December 31, 2010.
To
minimize the risk relating to low margin deposits, the Partnership follows certain trading
policies, including:
| (i) | The Partnership invests its assets only in commodity interests that the Advisor believes are traded in sufficient volume to permit ease of taking and liquidating positions. Sufficient volume, in this context, refers to a level of liquidity that the Advisor believes will permit it to enter and exit trades without noticeably moving the market. | ||
| (ii) | The Advisor will not initiate additional positions in any commodity if these positions would result in aggregate positions requiring a margin of more than 66 2/3% of the Partnership’s net assets allocated to the Advisor. | ||
| (iii) | The Partnership may occasionally accept delivery of a commodity. Unless such delivery is disposed of promptly by retendering the warehouse receipt representing the delivery to the appropriate clearinghouse, the physical commodity position is fully hedged. | ||
| (iv) | The Partnership does not employ the trading technique commonly known as “pyramiding,” in which the speculator uses unrealized profits on existing positions as margin for the purchases or sale of additional positions in the same or related commodities. | ||
| (v) | The Partnership does not utilize borrowings other than short-term borrowings if the Partnership takes delivery of any cash commodities. |
| (vi) | The Advisor may, from time to time, employ trading strategies such as spreads or straddles on behalf of the Partnership. “Spreads” and “Straddles” describe commodity futures trading strategies involving the simultaneous buying and selling of futures contracts on the same commodity but involving different delivery dates or markets. | ||
| (vii) | The Partnership will not permit the churning of its commodity trading account. The term “churning” refers to the practice of entering and exiting trades with a frequency unwarranted by legitimate efforts to profit from the trades, driven by the desire to generate commission income. |
8
From January 1, 2010 through December 31, 2010, the Partnership’s average margin to equity
ratio (i.e., the percentage of assets on deposit required for margin) was approximately 25.8%.
In the normal course of business, the Partnership is party to financial instruments with
off-balance sheet risk, including derivative financial instruments and derivative commodity
instruments. These financial instruments include forwards, futures, options and swaps, whose values
are based upon an underlying asset, index or reference rate, and generally represent future
commitments to exchange currencies or cash balances, or to purchase or sell other financial
instruments at specified terms at specified future dates, or, in the case of derivative commodity
instruments, to have a reasonable possibility to be settled in cash, through physical delivery or
with another financial instrument. These instruments may be traded on an exchange or
over-the-counter (“OTC”). Exchange-traded instruments are standardized and include futures and
certain forwards and option contracts. OTC contracts are negotiated between contracting parties and
include swaps and certain forwards and option contracts. Each of these instruments is subject to
various risks similar to those relating to the underlying financial instruments including market
and credit risk. In general, the risks associated with OTC contracts are greater than those
associated with exchange-traded instruments because of the greater risk of default by the
counterparty to an OTC contract.
The risk to the limited partners that have purchased interests
in the Partnership is limited to the amount of their capital
contributions to the Partnership and their share of the
Partnership’s assets and undistributed profits. This
limited liability is a consequence of the organization of the
Partnership as a limited partnership under applicable law.
Market risk is the potential for changes in the value of the financial instruments traded by
the Partnership due to market changes, including interest and foreign exchange rate movements and
fluctuations in commodity or security prices. Market risk is directly impacted by the volatility
and liquidity in the markets in which the related underlying assets are traded. The Partnership is
exposed to a market risk equal to the value of futures and forward contracts purchased and
unlimited liability on such contracts sold short.
Credit risk is the possibility that a loss may occur due to the failure of a counterparty to
perform according to the terms of a contract. The Partnership’s risk of loss in the event of a
counterparty default is typically limited to the amounts recognized in the Statements of Financial
Condition and not represented by the contract or notional amounts of the instruments. The
Partnership’s risk of loss is reduced through the use of legally enforceable master netting
agreements with counterparties that permit the Partnership to offset unrealized gains and losses
and other assets and liabilities with such counterparties upon the occurrence of certain events.
The Partnership has credit risk and concentration risk as the sole counterparty or broker with
respect to the Partnership’s assets is CGM or a CGM affiliate. Credit risk with respect to
exchange-traded instruments is reduced to the extent that through CGM, the Partnership’s
counterparty is an exchange or clearing organization.
The General Partner monitors and attempts to control the Partnership’s risk exposure on a
daily basis through financial, credit and risk management monitoring systems, and accordingly,
believes that it has effective procedures for evaluating and limiting the credit and market risks
to which the Partnership may be subject. These monitoring systems generally allow the General
Partner to statistically analyze actual trading results with risk adjusted performance indicators
and correlation statistics. In addition, on-line monitoring systems provide account analysis of
futures, forwards and options positions by sector, margin requirements, gain and loss transactions
and collateral positions. (See also “Item 8. Financial Statements and Supplementary Data”
for further information on financial instrument risks included in the notes to the financial
statements.)
Other than the risks inherent in commodity futures and other derivatives trading, the
Partnership knows of no trends, demands, commitments, events or uncertainties which will result in
or which are reasonably likely to result in the Partnership’s liquidity increasing or decreasing in
any material way. The Limited Partnership Agreement provides that the General Partner may, in its
discretion, cause the Partnership to cease trading operations and liquidate all open positions
under certain circumstances including a decrease in net asset value per Redeemable Unit to less
than $400 as of the close of business on any business day.
(b) Capital Resources.
(i) The Partnership has made no material commitments for capital expenditures.
(ii) The Partnership’s capital consists of the capital contributions of the partners as
increased or decreased by gains or losses on trading and by expenses, interest income, redemptions
of Redeemable Units and distributions of profits, if any. Gains or losses on trading cannot be
predicted. Market movements in commodities are dependent upon fundamental and technical factors
which the Advisors may or may not be able to identify, such as changing supply and demand
relationships, weather, government agricultural, commercial and trade programs and policies,
national and international political and economic events and changes in interest rates. Partnership
expenses consist of, among other things, brokerage fees and advisory fees. The level of
these expenses is dependent upon trading performance and the level of Net Assets maintained. In
addition, the amount of interest income payable by CGM is dependent upon interest rates over which
the Partnership has no control.
No forecast can be made as to the level of redemptions in any given period. A limited partner
may require the Partnership to redeem their Redeemable Units at the net asset value per Redeemable
Unit as of the last day of any month on three business days’ notice to the General Partner. There
is no fee charged to limited partners in connection with redemptions. Redemptions generally are
funded out of the Partnership’s cash holdings. For the year ended December 31, 2010, 4,641.7005
Redeemable Units were redeemed totaling $7,613,343 and 117.7745 General Partner unit equivalents
were redeemed totaling $250,000. For the year ended December 31, 2009, 9,474.3926 Redeemable Units
were redeemed totaling $17,224,525 and 812.0052 General Partner unit equivalents were redeemed
totaling $1,486,124. For the year ended December 31, 2008, 11,348.7824 Redeemable Units were
redeemed totaling $21,508,257.
For the year ended December 31, 2010, there were additional subscriptions of 1,353.3838
Redeemable Units totaling $2,106,000. For the year ended December 31, 2009, there were additional
subscriptions of 1,526.6293 Redeemable Units totaling $2,841,000. For the year ended December 31,
2008, there were additional subscriptions of 4,082.4408 Redeemable
Units totaling $7,390,000 and 521.2428 General Partner unit equivalents totaling $886,660.
9
(c) Results of Operations.
For the year ended December 31, 2010, the net asset value per unit decreased 2.6% from
$2,035.83 to $1,982.43. For the year ended December 31, 2009, the net asset value per unit
increased 2.7% from $1,982.46 to $2,035.83. For the year ended December 31, 2008, the net asset
value per unit increased 20.0% from $1,652.13 to $1,982.46.
The Partnership experienced a net trading gain of $1,333,565 before brokerage fees and
expenses for the year ended December 31, 2010. Gains were primarily attributable to the trading of
commodity futures in grains, U.S. and non-U.S. interest rates and metals and were partially offset
by losses in currencies, energy, indices, livestock and softs. The net trading gain (or loss) realized from the Partnership
is disclosed on page 27 under “Item 8. Financial Statements and Supplementary Data.”
Most of the financial risk assets recovered
well in 2010 due to expansionary monetary and fiscal policies adopted by most central banks. However, this recovery came amidst
global unrest due to geographically localized crises such as European sovereign debt crisis and inflationary headwinds in emerging
markets. Global weather conditions also played a significant role in 2010 in affecting commodity prices. Many agricultural products
remained at record level prices as extreme weather conditions such as drought, floods and winter storms affected production.
The Partnership was profitable in the
agricultural sector, interest rates and metals; while registering losses in currencies, the energy sector and equity indices.
In the agricultural sector, products such as corn, cotton and coffee
reached record price levels. In the case of cotton, prices reached 140-year highs. Extreme weather conditions in some of the biggest
exporters of these products significantly disrupted the global supply. Several exporting countries even imposed an export ban to meet
the internal demand. The Partnership capitalized on the strong trends in such agricultural products and remained profitable in this sector.
In metals, the Partnership was profitable in precious metals as they reached
record price levels. Precious metals such as gold and silver appealed to many investors as both inflation hedges and a flight to quality.
In interest rates, the Partnership recorded gains in both U.S.
and non-U.S.
interest rates. The Federal Reserve kept U.S. interest rates at historically low levels amid a consistently high unemployment rate
at above 9%. Also, as the European debt crisis seemed to engulf several countries, most notably Greece and Ireland, investors flocked
to U.S. and German bonds as a flight to quality. Thus the yields remained at historically low levels reaffirming the trend from
earlier year.
In currencies, the Partnership registered modest losses, mostly from European
currencies such as the euro, British pound and other emerging countries in the region. As the European debt crisis loomed, the euro
dropped to some of the lowest levels against the U.S. dollar. Concerns over economic growth in U.K. led to weakening of the British pound.
In equity indices, the Partnership recorded losses earlier in the year as
global equities sharply corrected. The European debt crisis and “Flash crash” of equities on May 6th came around the time that many
economists were actively discussing the possibility of a double dip recession. Equity indices recovered from the lowest levels following
the announcement of a European Union bailout of troubled nations
within the European Union. Also, later in the year, the U.S. Federal Reserve
announced a second round of quantitative easing which seemed to increase the appetite for risk assets.
The Partnership registered losses in the energy sector, primarily from
crude oil and other derivatives as oil remained range bound on concerns over global economic growth. The oil market remained very
volatile through most of the year and reacted sharply to global events and economic factors.
The Partnership experienced a net trading gain of $4,598,551 before brokerage fees and
expenses for the year ended December 31, 2009. Gains were primarily attributable to the trading of
commodity futures in indices, livestock, metals and softs and were partially offset by losses in
currencies, energy, grains and U.S. and non-U.S. interest rates.
2009 was a volatile year for the financial markets. The U.S. stock market entered 2009 reeling
from the financial turmoil of 2008. The results of the sub-prime fallout, bank bailouts, auto
industry bankruptcies, and capitulating economic data overwhelmed not just stock prices, but fueled
extraordinarily high levels of risk aversion. The market’s recovery was driven by stability in the
banking sector and a rapid recovery in global markets. By mid-year 2009, the market had hit bottom
in March, banks were seeking to return TARP bailout money and other leading indicators were
recovering.
In currencies, the Partnership registered losses as the U.S. dollar reversed the strong trend
earlier in the year and started weakening against the other major currencies. Trading in Japanese
yen and cross rates contributed to these losses following speculation that the Japanese government
may interfere in the markets to reverse a strong Japanese yen. In the energy sector, most of the products
did not exhibit any strong trends and mostly remained range bound after the reversals earlier in
the year. This pattern of sharp reversal followed by non-directional volatility attributed to the
losses in this sector. Losses were also seen in the fixed-income sector. With the economic backdrop
of 2008, yields started to exhibit asymmetric volatility due to extreme uncertainty prevailing in
the longer time horizon. Encouraged by the continuing fiscal and monetary efforts of the U.S.
government to stabilize the economy, the
10
markets finally began to recover. In agricultural commodities, losses were realized primarily
in wheat. The price of wheat unexpectedly rallied in October, as cold and wet weather conditions
threatened to delay harvest.
In livestock, the Partnership was profitable in hogs and cattle futures trading. The
Partnership recorded gains in the metals sector primarily from zinc, copper and gold. Investors
across the world chose to buy gold through ETFs and bullion as a hedge against inflation, driven by
the massive monetary influx of the central banks. In softs, modest gains were recorded as the
strong gains in sugar offset the losses in coffee. In stock indices, strong trends emerged in the
second quarter after the lows of March 2009. The Partnership was favorably positioned to capitalize
on these trends and recover the losses from the sharp reversals
Interest income on 80% of the average daily equity maintained in cash in the Partnership’s
brokerage account was earned at a 30-day U.S. Treasury bill rate determined weekly by CGM based on
the average non-competitive yield on 3-month U.S. Treasury bills maturing in 30 days. Interest
income for the three months ended December 31, 2010 increased by $6,351 as compared to the
corresponding period in 2009. The increase in interest income is primarily due to higher U.S.
Treasury Bill rates for the Partnership during the three months ended December 31, 2010, as
compared to the corresponding period in 2009. Interest income for the twelve months ended December
31, 2010 decreased by $4,360 as compared to the corresponding period in 2009. The decrease in
interest income is primarily due to lower average daily equity maintained in cash for the
Partnership during the twelve months ended December 31, 2010, as compared to the corresponding
period in 2009. Interest earned by the Partnership will increase the net asset value of the
Partnership. The amount of interest income earned by the Partnership depends on the average daily
equity in the Partnership’s accounts and upon interest rates over which neither the Partnership nor
CGM has control.
Brokerage fees are calculated as a percentage of the Partnership’s adjusted net asset value on
the last day of each month and are affected by trading performance,
subscriptions and redemptions.
Accordingly, they must be compared in relation to the fluctuations in the monthly net asset values.
Brokerage fees for the three and twelve months ended December 31, 2010 decreased by $128,773 and
$878,440, respectively as compared to the corresponding periods in 2009. The decrease in brokerage
fees is due to lower average adjusted net assets during the three and twelve months ended December
31, 2010, as compared to the corresponding periods in 2009.
Management fees are calculated as a percentage of the Partnership’s adjusted net asset value
as of the end of each month and are affected by trading performance,
subscriptions and redemptions.
Management fees for the three and twelve months ended December 31, 2010 decreased by $60,394 and
$366,451 respectively as compared to the corresponding periods in 2009. The decrease in management
fees is due to lower average adjusted net assets as well as a temporary reduction in the management
fee rate for the three and twelve months ended December 31, 2010, as compared to the corresponding
periods in 2009.
Incentive fees are based on the new trading profits generated by the Advisor at the end of the
quarter, as defined in the management agreement among the Partnership, the General Partner and the
Advisor. There were no incentive fees earned for the three and twelve months ended December 31,
2010 or 2009. The Advisor will not be paid incentive fees until the Advisor recovers the net loss
incurred and earns additional new trading profits for the Partnership.
The Partnership pays professional fees, which generally include legal and accounting expenses.
Professional fees for the years ended December 31, 2010 and 2009 were $252,552 and $145,186,
respectively.
The Partnership pays other expenses, which generally include filing, reporting and data
processing fees. Other expenses for the years ended December 31, 2010 and 2009 were $18,875 and
$44,189, respectively.
The Partnership experienced a net trading gain of $18,704,551 before brokerage fees and
expenses for the year ended December 31, 2008. Gains were primarily attributable to the trading of
commodity futures in currencies, energy, grains, indices, U.S. and non-U.S. interest rates,
livestock and softs and were partially offset by losses in metals.
In 2008, the liquidity crisis that began in 2007 rapidly spread to all corners of the globe,
significantly pushing down global economic growth and presenting the economies with some of the
hardest challenges since the Great Depression. During the year, the world’s credit markets virtually seized up, commodity
prices plunged and most major equity indices declined dramatically,
while some of the largest
U.S. financial institutions were under pressure. Faced with unprecedented and rapid deterioration in
economic data and outlook, and fearing a snowball adverse effect of the credit crunch, global
central banks reacted with aggressive campaigns of interest rate cuts and coordinated capital
injections. As the markets re-priced the cost of risk, several strong trends emerged. The
Partnership strongly
11
capitalized on the trends and was profitable in currencies, energy, grains, interest rates,
agricultural softs and stock indices while some losses were seen in the metals sector.
The Partnership was well positioned to capitalize on the strong trends that emerged in the
currencies and realized gains for the year. The U.S. dollar was relatively strong compared with
most of the other developed economy currencies. The euro was put to its first major test since its
inception. The UK, Germany and France continued to show weak growth earlier in the year and as the
situations worsened in the latter part of the year, these countries officially entered recession.
The Japanese yen remained an exception and showed extraordinary strength as the carry trade
reversed.
The Partnership realized most of the profits in the energy sector by capturing both the
bullish and the bearish trends. In the earlier part of the year, crude oil pushed towards a
historic high of $147 per barrel and in the latter part, the trend suddenly reversed and a strong
negative trend emerged with crude oil dropping to about $32 per barrel. Natural gas also
contributed to profits as prices plunged from $14 to about $5 per MMBtu.
In grains and agricultural softs, the Partnership was profitable as the trading strategy
successfully navigated the trend reversal period and captured the bullish and bearish legs of the
trend across several products. Corn prices continued to show a strong correlation to energy prices
and while peaking at 800 cents around mid year, closed the year at around 400 cents.
The Partnership was profitable in the interest rates sector as the yields on shorter end of
the yield curve dropped to almost unphysical levels. Short term U.S. Treasury bills were in such
high demand due to flight-to-quality that the yields dropped below
zero. While the 10-year U.S. Treasury bill
yielded on an average between 3.5%-4% for most of the year, the yield dropped to 2% in December.
Non-U.S. interest rates also showed tremendous volatility as the rates dropped precipitously due to
the actions of the central banks.
Global stock indices also contributed to the gains as the indices continued to test multi-year
lows. As banks continued to write off the assets and as bankruptcies loomed, investors lost
confidence in the equity markets. Futures markets offered greater flexibility as the SEC
temporarily banned short selling in the equity markets.
The Partnership registered losses in the metals sector. Precious metals did not demonstrate a
very strong directional trend, but the industrial metals reflected the general economic malaise.
Copper, which is usually considered essential for growth, dropped from 4 cents to 1.5 cents per
pound. Most of the Partnership losses in the metals sector were registered in the third quarter due
to sudden price reversals.
In the General Partner’s opinion, the Advisor continues to employ trading methods and produce
results consistent with its expected performance given market conditions and the objectives of the
Partnership. The General Partner continues to monitor the Advisor’s performance on a daily, weekly,
monthly and annual basis to assure these objectives are met.
Commodity markets are highly volatile. Broad price fluctuations and rapid inflation increase
the risks involved in commodity trading, but also increase the possibility of profit. The
profitability of the Partnership depends on the existence of major price trends and the ability of
the Advisor to identify those price trends correctly. Price trends are influenced by, among other
things, changing supply and demand relationships, weather, governmental, agricultural, commercial
and trade programs and policies, national and international political and economic events and
changes in interest rates. To the extent that market trends exist and the Advisor is able to
identify them, the Partnership expects to increase capital through operations.
In allocating the assets of the Partnership to the Advisor, the General Partner considered
past performance, trading style, volatility of markets traded and fee requirements. The General
Partner may modify or terminate the allocation of assets to the Advisor at any time.
(d) Off-Balance Sheet Arrangements. None.
(e) Contractual Obligations. None.
12
(f) Operational Risk
The Partnership is directly exposed to market risk and credit risk, which arise in the normal
course of its business activities. Slightly less direct, but of critical importance, are risks
pertaining to operational and back office support. This is particularly the case in a rapidly
changing and increasingly global environment with increasing transaction volumes and an expansion
in the number and complexity of products in the marketplace.
Such risks include:
Operational/Settlement Risk — the risk of financial and opportunity loss and legal liability
attributable to operational problems, such as inaccurate pricing of transactions, untimely trade
execution, clearance and/or settlement, or the inability to process large volumes of transactions.
The Partnership is subject to increased risks with respect to its trading activities in emerging
market securities, where clearance, settlement, and custodial risks are often greater than in more
established markets.
Technological Risk — the risk of loss attributable to technological limitations or hardware
failure that constrain the Partnership’s ability to gather, process, and communicate information
efficiently and securely, without interruption, to customers and in the markets where the
Partnership participates.
Legal/Documentation Risk — the risk of loss attributable to deficiencies in the documentation
of transactions (such as trade confirmations) and customer relationships (such as master netting
agreements) or errors that result in noncompliance with applicable legal and regulatory
requirements.
Financial Control Risk — the risk of loss attributable to limitations in financial systems
and controls. Strong financial systems and controls ensure that assets are safeguarded, that
transactions are executed in accordance with management’s authorization, and that financial
information utilized by management and communicated to external parties, including the
Partnership’s Redeemable Unit holders, creditors, and regulators, is free of material errors.
(g) Critical Accounting Policies.
Partnership’s Investments. All commodity interests (including derivative financial instruments
and derivative commodity instruments) are held for trading purposes. The commodity interests are
recorded on trade date and open contracts are recorded at fair value (as described below) at the
measurement date. Investments in commodity interests denominated in foreign currencies are
translated into U.S. dollars at the exchange rates prevailing at the measurement date. Gains or
losses are realized when contracts are liquidated. Unrealized gains or losses on open contracts are
included as a component of equity in trading account on the Statements of Financial Condition.
Realized gains or losses and any change in net unrealized gains or losses from the preceding period
are reported in the Statements of Income and Expenses.
Partnership’s Fair Value Measurements. Fair value is defined as the price that would be
received to sell an asset or paid to transfer a liability in an orderly transaction between market
participants at the measurement date under current market conditions. The fair value hierarchy
gives the highest priority to unadjusted quoted prices in active markets for identical assets or
liabilities (Level 1) and the lowest priority to fair values derived from unobservable inputs
(Level 3). The level in the fair value hierarchy within which the fair value measurement in its
entirety falls shall be determined based on the lowest level input that is significant to the fair
value measurement in its entirety.
Accounting principles generally accepted in the United States of
America (“GAAP”) also requires the need to use judgment in determining if a formerly active market has
become inactive and in determining fair values when the market has become inactive.
Management has concluded that based on available information in
the marketplace, the Partnership’s Level 1 assets and
liabilities are actively traded.
The Partnership will separately present purchases, sales, issuances, and settlements
in their reconciliation of Level 3 fair value measurements (i.e. to present such items on a gross basis rather than
on a net basis), and makes disclosures regarding the level of disaggregation and the inputs and valuation techniques
used to measure fair value for measurements that fall within either Level 2 or Level 3 of the fair value hierarchy as
required under GAAP.
The Partnership considers prices for exchange-traded commodity futures, forwards and options
contracts to be based on unadjusted quoted prices in active markets for identical assets (Level 1).
The values of non exchange-traded forwards, swaps and certain options contracts for which market
quotations are not readily available are priced by broker-dealers who derive fair values for those
assets from observable inputs (Level 2). As of and for the years ended December 31, 2010 and 2009,
the Partnership did not hold any derivative instruments for which market quotations are not readily
available and that are priced by broker-dealers who derive fair values for those assets from
observable inputs (Level 2) or that are priced at fair value using unobservable inputs through the
application of management’s assumptions and internal valuation pricing models (Level 3).
13
Futures Contracts. The Partnership trades futures contracts. A futures contract is a firm
commitment to buy or sell a specified quantity of investments, currency or a standardized amount of
a deliverable grade commodity, at a specified price on a specified future date, unless the contract
is closed before the delivery date or if the delivery quantity is something where physical delivery
cannot occur (such as the S&P 500 Index), whereby such contract is settled in cash. Payments
(“variation margin”) may be made or received by the Partnership each business day, depending on the
daily fluctuations in the value of the underlying instruments, and are recorded as unrealized gains
or losses by the Partnership. When the contract is closed, the Partnership records a realized gain
or loss equal to the difference between the value of the contract at the time it was opened and the
value at the time it was closed. Transactions in futures contracts require participants to make
both initial margin deposits of cash or other assets and variation margin deposits, through the
futures broker, directly with the exchange on which the contracts are traded. Realized gains
(losses) and changes in unrealized gains (losses) on futures contracts are included in the
Statements of Income and Expenses.
London Metals Exchange Forward Contracts. Metal contracts traded on the London Metals Exchange
(“LME”) represent a firm commitment to buy or sell a specified quantity of aluminum, copper, lead,
nickel, tin or zinc. LME contracts traded by the Partnership are cash settled based on prompt dates
published by the LME. Payments (“variation margin”) may be made or received by the Partnership each
business day, depending on the daily fluctuations in the value of the underlying contracts, and are
recorded as unrealized gains or losses by the Partnership. A contract is considered offset when all
long positions have been matched with a like number of short positions settling on the same prompt
date. When the contract is closed at the prompt date, the Partnership records a realized gain or
loss equal to the difference between the value of the contract at the time it was opened and the
value at the time it was closed. Transactions in LME contracts require participants to make both
initial margin deposits of cash or other assets and variation margin deposits, through the broker,
directly with the LME. Realized gains (losses) and changes in unrealized gains (losses) on metal
contracts are included in the Statements of Income and Expenses.
Item 7A. Quantitative and Qualitative Disclosures About Market Risk.
Introduction
The Partnership is a speculative commodity pool. The market sensitive instruments held by it
are acquired for speculative trading purposes, and all or substantially all of the Partnership’s
assets are subject to the risk of trading loss. Unlike an operating company, the risk of market
sensitive instruments is integral, not incidental, to the Partnership’s main line of business.
The risk to the limited partners that have purchased interests in the Partnership is limited
to the amount of their capital contributions to the Partnership and
their share of the Partnership’s
assets and undistributed profits. This limited liability is a consequence of the organization of
the Partnership as a limited partnership under applicable law.
Market movements result in frequent changes in the fair market value of the Partnership’s open
positions and, consequently, in its earnings and cash balances. The Partnership’s market risk is
influenced by a wide variety of factors, including the level and volatility of interest rates,
exchange rates, equity price levels, the market value of financial instruments and contracts, the
diversification effects among the Partnership’s open positions and the liquidity of the markets in
which it trades.
The Partnership rapidly acquires and liquidates both long and short positions in a wide range
of different markets. Consequently, it is not possible to predict how a particular future market
scenario will affect performance, and the Partnership’s past performance is not necessarily
indicative of its future results.
“Value at Risk” is a measure of the maximum amount which the Partnership could reasonably be
expected to lose in a given market sector. However, the inherent uncertainty of the Partnership’s
speculative trading and the recurrence in the markets traded by the Partnership of market movements
far exceeding expectations could result in actual trading or non-trading losses far beyond the
indicated Value at Risk or the Partnership’s experience to date (i.e., “risk of ruin”). In light of
the foregoing as well as the risks and uncertainties intrinsic to all future projections, the
inclusion of the quantification in this section should not be considered to constitute any
assurance or representation that the Partnership’s losses in any market sector will be limited to
Value at Risk or by the Partnership’s attempts to manage its market risk.
14
Materiality as used in this section, “Quantitative and Qualitative Disclosures About
Market Risk,” is based on an assessment of reasonably possible market movements and the potential
losses caused by such movements, taking into account the leverage, optionality and multiplier
features of the Partnership’ market sensitive instruments.
Quantifying the Partnership’s Trading Value at Risk
The following quantitative disclosures regarding the Partnership’s market risk exposures
contain “forward-looking statements” within the meaning of the safe harbor from civil liability
provided for such statements by the Private Securities Litigation Reform Act of 1995 (set forth in
Section 27A of the Securities Act of 1933, as amended and Section 21E of the Securities Exchange
Act of 1934, as amended). All quantitative disclosures in this section are deemed to be
forward-looking statements for purposes of the safe harbor except for statements of historical fact
(such as the terms of particular contracts and the number of market risk sensitive instruments held
during or at the end of the reporting period).
The Partnership’s risk exposure in the various market sectors traded by the Advisor is
quantified below in terms of Value at Risk. Due to the Partnership’s mark-to-market accounting, any
loss in the fair value of the Partnership’s open positions is directly reflected in the
Partnership’s earnings (realized or unrealized). Exchange maintenance margin requirements have been
used by the Partnership as the measure of its Value at Risk. Maintenance margin requirements are
set by exchanges to equal or exceed the maximum losses reasonably expected to be incurred in the
fair value of any given contract in 95%-99% of any one-day interval. The maintenance margin levels
are established by dealers and exchanges using historical price studies as well as an assessment of
current market volatility (including the implied volatility of the options on a given futures
contract) and economic fundamentals to provide a probabilistic estimate of the maximum expected
near-term one-day price fluctuation. Maintenance margin has been used rather than the more
generally available initial margin, because initial margin includes a credit risk component which
is not relevant to Value at Risk.
In the case of market sensitive instruments which are not exchange traded (almost exclusively
currencies in the case of the Partnership), the margin requirements for the equivalent futures
positions have been used as Value at Risk. In those rare cases in which a futures-equivalent margin
is not available, dealers’ margins have been used.
The fair value of the Partnership’s futures and forward positions does not have any
optionality component. However, the Advisor may trade commodity options. The Value at Risk
associated with options is reflected in the following table as the margin requirement attributable
to the instrument underlying each option. Where this instrument is a futures contract, the futures
margin, and where this instrument is a physical commodity, the futures-equivalent maintenance
margin has been used. This calculation is conservative in that it assumes that the fair value of an
option will decline by the same amount as the fair value of the underlying instrument, whereas, in
fact, the fair values of the options traded by the Partnership in almost all cases fluctuate to a
lesser extent than those of the underlying instruments.
In quantifying the Partnership’s Value at Risk, 100% positive correlation in the different
positions held in each market risk category has been assumed. Consequently, the margin requirements
applicable to the open contracts have simply been added to determine each trading category’s
aggregate Value at Risk. The diversification effects resulting from the fact that the Partnership’s
positions are rarely, if ever, 100% positively correlated have not been reflected.
The Partnership’s Trading Value at Risk in Different Market Sectors
Value at risk tables represent a probabilistic assessment of the risk of loss in market risk
sensitive instruments. The following tables indicate the trading Value at Risk associated with the
Partnership’s open positions by market category as of December 31, 2010 and December 31, 2009, and
the highest, lowest and average values during the years. All open position trading risk exposures
of the Partnership have been included in calculating the figures set forth below. As of December
31, 2010, the Partnership’s total capitalization was $41,672,044.
15
December 31, 2010
| % of Total | High | Low | Average | |||||||||||||||||
| Market Sector | Value at Risk | Capitalization | Value at Risk | Value at Risk | Value at Risk* | |||||||||||||||
Currencies |
$ | 1,249,666 | 3.00 | % | $ | 2,057,069 | $ | 867,991 | $ | 1,472,045 | ||||||||||
Energy |
661,702 | 1.59 | % | 1,012,471 | 173,691 | 554,668 | ||||||||||||||
Grains |
1,104,950 | 2.65 | % | 1,637,000 | 163,960 | 815,322 | ||||||||||||||
Indices |
2,432,046 | 5.84 | % | 14,744,438 | 1,055,959 | 3,158,056 | ||||||||||||||
Interest Rates U.S. |
108,900 | 0.26 | % | 196,300 | 58,400 | 123,815 | ||||||||||||||
Interest Rates Non-U.S. |
697,780 | 1.67 | % | 1,302,981 | 634,429 | 888,963 | ||||||||||||||
Livestock |
208,500 | 0.50 | % | 495,950 | 23,373 | 257,388 | ||||||||||||||
Metals |
1,124,452 | 2.70 | % | 2,458,619 | 601,999 | 1,466,625 | ||||||||||||||
Softs |
1,513,817 | 3.63 | % | 2,103,301 | 309,772 | 1,229,004 | ||||||||||||||
Total |
$ | 9,101,813 | 21.84 | % | ||||||||||||||||
| * | Annual average of month-end Value at Risk |
As of December 31, 2009, the Partnership’s total capitalization was $49,728,651.
December 31, 2009
| % of Total | High | Low | Average * | |||||||||||||||||
| Market Sector | Value at Risk | Capitalization | Value at Risk | Value at Risk | Value at Risk | |||||||||||||||
Currencies |
$ | 1,560,855 | 3.14 | % | $ | 2,702,662 | $ | 981,058 | $ | 1,639,412 | ||||||||||
Energy |
847,200 | 1.70 | % | 847,200 | 818,450 | 832,825 | ||||||||||||||
Grains |
661,600 | 1.33 | % | 1,773,405 | 2,700 | 465,577 | ||||||||||||||
Indices |
4,056,121 | 8.16 | % | 4,480,840 | 750 | 1,437,215 | ||||||||||||||
Interest Rates U.S. |
104,780 | 0.21 | % | 309,600 | 104,780 | 175,972 | ||||||||||||||
Interest Rates Non-U.S. |
777,428 | 1.56 | % | 1,174,913 | 368,305 | 743,464 | ||||||||||||||
Livestock |
170,500 | 0.34 | % | 287,550 | 170,500 | 215,010 | ||||||||||||||
Metals |
2,136,825 | 4.30 | % | 2,136,825 | 163,719 | 915,090 | ||||||||||||||
Softs |
1,798,631 | 3.62 | % | 1,820,696 | 364,345 | 1,037,627 | ||||||||||||||
Total |
$ | 12,113,940 | 24.36 | % | ||||||||||||||||
| * | Annual average of month-end Value at Risk |
Material Limitations on Value at Risk as an Assessment of Market Risk
The face value of the market sector instruments held by the Partnership is typically many
times the applicable maintenance margin requirement (margin requirements generally range between 2%
and 15% of contract face value) as well as many times the capitalization of the Partnership. The
magnitude of the Partnership’s open positions creates a “risk of ruin” not typically found in most
other investment vehicles. Because of the size of its positions, certain market conditions —
unusual, but historically recurring from time to time — could cause the Partnership to incur
severe losses over a short period of time. The foregoing Value at Risk table — as well as the past
performance of the Partnership — give no indication of this “risk of ruin.”
Non-Trading Risk
The Partnership has non-trading market risk on its foreign cash balances not needed for
margin. However, these balances (as well as any market risk they represent) are immaterial.
Qualitative Disclosures Regarding Primary Trading Risk Exposures
The following qualitative disclosures regarding the Partnership’s market risk exposures —
except for (i) those disclosures that are statements of historical fact and (ii) the descriptions
of how the Partnership manages its primary market risk exposures — constitute
forward-looking statements within the meaning of Section 27A of the Securities Act and Section
21E of the Securities Exchange Act. The Partnership’s primary market risk exposures as well as the
strategies used and to be used by the General Partner and the Advisor for managing such exposures
are subject to numerous uncertainties, contingencies and risks, any one of which could cause the
actual results of the Partnership’s risk controls to differ materially from the objectives of such
strategies. Government interventions, defaults and expropriations, illiquid markets, the emergence
of dominant fundamental factors, political upheavals, changes in historical price
16
relationships, an
influx of new market participants, increased regulation and many other factors could result in
material losses as well as in material changes to the risk exposures and the management strategies
of the Partnership. There can be no assurance that the Partnership’s current market exposure and/or
risk management strategies will not change materially or that any such strategies will be effective
in either the short or long term. Investors must be prepared to lose all or substantially all of
their investment in the Partnership.
The following were the primary trading risk exposures of the Partnership as of December 31,
2010, by market sector.
Interest Rates. Interest rate movements directly affect the price of the futures
positions held by the Partnership and indirectly the value of its stock index and currency
positions. Interest rate movements in one country as well as relative interest rate movements
between countries materially impact the Partnership’s profitability. The Partnership’s primary
interest rate exposure is to interest rate fluctuations in the United States and the other G-8
countries. However, the Partnership also takes futures positions on the government debt of smaller
nations — e.g., Australia.
Currencies. The Partnership’s currency exposure is to exchange rate fluctuations,
primarily fluctuations which disrupt the historical pricing relationships between different
currencies and currency pairs. These fluctuations are influenced by interest rate changes as well
as political and general economic conditions. The General Partner does not anticipate that the risk
profile of the Partnership’s currency sector will change significantly in the future. The currency
trading Value at Risk figure includes foreign margin amounts converted into U.S. dollars with an
incremental adjustment to reflect the exchange rate risk inherent to the U.S. dollar-based
Partnership in expressing Value at Risk in a functional currency other than U.S. dollars.
Stock Indices. The Partnership’s primary equity exposure is to equity price risk in
the G-8 countries. The stock index futures traded by the Partnership are limited to futures on
broadly based indices. As of December 31, 2010, the Partnership’s primary exposures were in the
EUREX and Chicago Mercantile Exchange stock indices. The General Partner anticipates little, if
any, trading in non-G-8 stock indices. The Partnership is primarily exposed to the risk of adverse
price trends or static markets in the major U.S., European and Japanese indices. (Static markets
would not cause major market changes but would make it difficult for the Partnership to avoid being
“whipsawed” into numerous small losses.)
Metals. The Partnership’s primary metal market exposure is to fluctuations in the
price of gold, silver, nickel, zinc, copper and aluminum.
Softs. The Partnership’s primary commodities exposure is to agricultural price
movements which are often directly affected by severe or unexpected
weather conditions. Cocoa,
coffee and sugar accounted for the substantial bulk of the Partnership’s commodity exposure as of
December 31, 2010.
Qualitative Disclosures Regarding Non-Trading Risk Exposure
The following were the only non-trading risk exposures of the Partnership as of December 31,
2010.
Foreign Currency Balances. The Partnership’s primary foreign currency balances are in
Japanese yen, euro and Swiss francs. The Advisor regularly converts foreign currency balances to
U.S. dollars in an attempt to control the Partnership’s non-trading risk.
Qualitative Disclosures Regarding Means of Managing Risk Exposure
The General
Partner monitors and attempts to control the Partnership’s risk exposure on a daily basis
through financial, credit and risk management monitoring systems and
accordingly, believes that it
has effective procedures for evaluating and limiting the credit and market risks to which the
Partnership may be subject.
The General Partner monitors the Partnership’s performance and the concentration of its open
positions, and consults with the Advisor concerning the Partnership’s overall risk profile. If the
General Partner felt it necessary to do so, the General Partner could
require the Advisor to close out positions as well as enter positions
traded on behalf of the Partnership. However, any such intervention would be a highly unusual
event. The General Partner primarily relies on the Advisor’s own risk control policies while
maintaining a general supervisory overview of the Partnership’s market risk exposures.
17
The Advisor applies its own risk management policies to its trading. The Advisor often follows
diversification guidelines, margin limits and stop loss points to exit a position. The Advisor’s
research of risk management often suggests ongoing modifications to its trading programs.
As part of the General Partner’s risk management, the General Partner periodically meets with
the Advisor to discuss its risk management and to look for any material changes to the Advisor’s
portfolio balance and trading techniques. The Advisor is required to notify the General Partner of
any material changes to its programs.
18
Item 8. Financial Statements and Supplementary Data.
TIDEWATER FUTURES FUND L.P.
The following financial statements and related items of the Partnership are filed under this
Item 8: Oath or Affirmation, Management’s Report on Internal Control over Financial Reporting,
Reports of Independent Registered Public Accounting Firms, for the years ended December 31, 2010,
2009, and 2008; Statements of Financial Condition at December 31, 2010 and 2009; Condensed
Schedules of Investments at December 31, 2010 and 2009; Statements of Income and Expenses for the
years ended December 31, 2010, 2009, and 2008; Statements of Changes in Partners’ Capital for the
years ended December 2010, 2009, and 2008; and Notes to Financial Statements.
19
To the Limited
Partners of
Tidewater Futures Fund L.P.
Tidewater Futures Fund L.P.
To the best of the knowledge and belief of the undersigned, the
information contained herein is accurate and complete.

| By: | Walter Davis |
President and Director
Ceres Managed Futures LLC
General Partner,
Tidewater Futures Fund L.P.
Ceres Managed Futures LLC
522 Fifth Avenue
14th Floor
New York, N.Y. 10036
212-296-1999
20
Management’s
Report on Internal Control Over
Financial Reporting
Financial Reporting
The management of Tidewater Futures Fund L.P. (the Partnership),
Ceres Managed Futures LLC, is responsible for establishing and
maintaining adequate internal control over financial reporting
as defined in Rules 13a – 15(f) and
15d – 15(f) under the Securities Exchange Act of 1934
and for our assessment of internal control over financial
reporting. The Partnership’s internal control over
financial reporting is a process designed to provide reasonable
assurance regarding the reliability of financial reporting and
the preparation of financial statements for external purposes in
accordance with accounting principles generally accepted in the
United States of America. The Partnership’s internal
control over financial reporting includes those policies and
procedures that:
(i) pertain to the maintenance of records that, in
reasonable detail, accurately and fairly reflect the
transactions and dispositions of the assets of the Partnership;
(ii) provide reasonable assurance that transactions are
recorded as necessary to permit preparation of financial
statements in accordance with accounting principles generally
accepted in the United States of America, and that receipts and
expenditures of the Partnership are being made only in
accordance with authorizations of management and directors of
the Partnership; and
(iii) provide reasonable assurance regarding prevention or
timely detection and correction of unauthorized acquisition, use
or disposition of the Partnership’s assets that could have
a material effect on the financial statements.
Because of its inherent limitations, internal control over
financial reporting may not prevent or detect misstatements.
Also, projections of any evaluation of effectiveness to future
periods are subject to the risk that controls may become
inadequate because of changes in conditions, or that the degree
of compliance with the policies or procedures may deteriorate.
The management of Tidewater Futures Fund L.P. has assessed
the effectiveness of the Partnership’s internal control
over financial reporting as of December 31, 2010. In making
this assessment, management used the criteria set forth in the
Internal Control-Integrated Framework issued by the
Committee of Sponsoring Organizations of the Treadway Commission
(COSO). Based on our assessment, management concluded that the
Partnership maintained effective internal control over financial
reporting as of December 31, 2010 based on the criteria
referred to above.
|
|

|
|
|
Walter Davis President and Director Ceres Managed Futures LLC General Partner, Tidewater Futures Fund L.P. |
Jennifer Magro Chief Financial Officer and Director Ceres Managed Futures LLC General Partner, Tidewater Futures Fund L.P. |
21
REPORT OF INDEPENDENT REGISTERED PUBLIC ACCOUNTING FIRM
To the Partners of
Tidewater Futures Fund L.P.:
Tidewater Futures Fund L.P.:
We have audited the accompanying statements of financial condition of Tidewater Futures Fund L.P.
(the “Partnership”), including the condensed schedules of investments, as of December 31, 2010 and
2009, and the related statements of income and expenses, and changes in partners’ capital for the
years then ended. These financial statements are the responsibility of the Partnership’s
management. Our responsibility is to express an opinion on these financial statements based on our
audits. The financial statements of the Partnership for the year ended December 31, 2008 were
audited by other auditors whose report, dated March 26, 2009, expressed an unqualified opinion on
those statements.
We conducted our audits in accordance with the standards of the Public Company Accounting Oversight
Board (United States). Those standards require that we plan and perform the audit to obtain
reasonable assurance about whether the financial statements are free of material misstatement. The
Partnership is not required to have, nor were we engaged to perform, an audit of its internal
control over financial reporting. Our audits included consideration of internal control over
financial reporting as a basis for designing audit procedures that are appropriate in the
circumstances, but not for the purpose of expressing an opinion on the effectiveness of the
Partnership’s internal control over financial reporting. Accordingly, we express no such opinion.
An audit also includes examining, on a test basis, evidence supporting the amounts and disclosures
in the financial statements, assessing the accounting principles used and significant estimates
made by management, as well as evaluating the overall financial statement presentation. We believe
that our audits provide a reasonable basis for our opinion.
In our opinion, such 2010 and 2009 financial statements present fairly, in all material respects,
the financial position of Tidewater Futures Fund L.P. as of December 31, 2010 and 2009, and the
results of its operations and its changes in partners’ capital for the years then ended, in
conformity with accounting principles generally accepted in the United States of America.
/s/ Deloitte & Touche LLP
New York, New York
March 23, 2011
New York, New York
March 23, 2011
22
Report of Independent Registered Public Accounting Firm
To the Partners of
Tidewater Futures Fund L.P.:
Tidewater Futures Fund L.P.:
In our opinion, the accompanying statement of income and expenses, and statement of changes in
partners’ capital present fairly, in all material respects, the financial position of Tidewater
Futures Fund L.P. (formerly known as Smith Barney Tidewater Futures Fund L.P.) at December 31, 2008
and the results of its operations for the year then ended in conformity with accounting principles
generally accepted in the United States of America. Also in our opinion, the Partnership
maintained, in all material respects, effective internal control over financial reporting as of
December 31, 2008, based on criteria established in Internal Control — Integrated Framework issued
by the Committee of Sponsoring Organizations of the Treadway Commission (COSO). The Partnership’s
management is responsible for these financial statements, for maintaining effective internal
control over financial reporting and for its assessment of the effectiveness of internal control
over financial reporting, included in the accompanying Management’s Report on Internal Control over
Financial Reporting. Our responsibility is to express opinions on these financial statements and
on the Partnership’s internal control over financial reporting based on our integrated audit. We
conducted our audit in accordance with the standards of the Public Company Accounting Oversight
Board (United States). Those standards require that we plan and perform the audit to obtain
reasonable assurance about whether the financial statements are free of material misstatement and
whether effective internal control over financial reporting was maintained in all material
respects. Our audit of the financial statements included examining, on a test basis, evidence
supporting the amounts and disclosures in the financial statements, assessing the accounting
principles used and significant estimates made by management, and evaluating the overall financial
statement presentation. Our audit of internal control over financial reporting included obtaining
an understanding of internal control over financial reporting, assessing the risk that a material
weakness exists, and testing and evaluating the design and operating effectiveness of internal
control based on the assessed risk. Our audit also included performing such other procedures as we
considered necessary in the circumstances. We believe that our audit provides a reasonable basis
for our opinion.
A company’s internal control over financial reporting is a process designed to provide reasonable
assurance regarding the reliability of financial reporting and the preparation of financial
statements for external purposes in accordance with generally accepted accounting principles. A
company’s internal control over financial reporting includes those policies and procedures that (i)
pertain to the maintenance of records that, in reasonable detail, accurately and fairly reflect the
transactions and dispositions of the assets of the company; (ii) provide reasonable assurance that
transactions are recorded as necessary to permit preparation of financial statements in accordance
with generally accepted accounting principles, and that receipts and expenditures of the company
are being made only in accordance with authorizations of management and directors of the company;
and (iii) provide reasonable assurance regarding prevention or timely detection of unauthorized
acquisition, use, or disposition of the company’s assets that could have a material effect on the
financial statements.
Because of its inherent limitations, internal control over financial reporting may not prevent or
detect misstatements. Also, projections of any evaluation of effectiveness to future periods are
subject to the risk that controls may become inadequate because of changes in conditions, or that
the degree of compliance with the policies or procedures may deteriorate.
/s/ PricewaterhouseCoopers LLP
New York, New York
March 26, 2009
March 26, 2009
23
Tidewater Futures
Fund L.P.
Statements of Financial Condition
December 31, 2010 and 2009
Statements of Financial Condition
December 31, 2010 and 2009
| 2010 | 2009 | |||||||
|
Assets:
|
||||||||
|
Equity in trading account:
|
||||||||
|
Cash (Note 3c)
|
$ | 25,519,706 | $ | 32,781,935 | ||||
|
Cash margin (Note 3c)
|
10,943,883 | 13,348,704 | ||||||
|
Net unrealized appreciation on open futures contracts
|
6,452,412 | 3,623,720 | ||||||
|
Net unrealized appreciation on open forward contracts
|
— | 1,276,029 | ||||||
| 42,916,001 | 51,030,388 | |||||||
|
Interest receivable (Note 3c)
|
2,566 | 522 | ||||||
|
Total assets
|
$ | 42,918,567 | $ | 51,030,910 | ||||
|
Liabilities and Partners’ Capital:
|
||||||||
|
Liabilities:
|
||||||||
|
Net unrealized depreciation on open forward contracts
|
$ | 56,461 | $ | — | ||||
|
Accrued expenses:
|
||||||||
|
Brokerage fees (Note 3c)
|
232,170 | 276,417 | ||||||
|
Management fees (Note 3b)
|
70,888 | 84,470 | ||||||
|
Professional fees
|
82,874 | 46,499 | ||||||
|
Other
|
14,326 | 25,928 | ||||||
|
Redemptions payable (Note 5)
|
789,804 | 868,945 | ||||||
|
Total liabilities
|
1,246,523 | 1,302,259 | ||||||
|
Partners’ Capital (Notes 1 and 5):
|
||||||||
|
General Partner, 281.2556 and 399.0301 unit equivalents
outstanding at December 31, 2010 and 2009, respectively
|
557,570 | 812,357 | ||||||
|
Limited Partners, 20,739.3934 and 24,027.7101 Redeemable Units
outstanding at December 31, 2010 and 2009, respectively
|
41,114,474 | 48,916,294 | ||||||
|
Total partners’ capital
|
41,672,044 | 49,728,651 | ||||||
|
Total liabilities and partners’ capital
|
$ | 42,918,567 | $ | 51,030,910 | ||||
|
Net asset value per unit
|
$ | 1,982.43 | $ | 2,035.83 | ||||
See accompanying notes to financial statements.
24
Tidewater Futures
Fund L.P.
Condensed Schedule of Investments
December 31, 2010
Condensed Schedule of Investments
December 31, 2010
|
Number of |
% of Partners’ |
|||||||||||
| Contracts | Fair Value | Capital | ||||||||||
|
Futures Contracts Purchased
|
||||||||||||
|
Currencies
|
251 | $ | 672,219 | 1.61 | % | |||||||
|
Energy
|
239 | 200,124 | 0.48 | |||||||||
|
Grains
|
562 | 2,286,361 | 5.49 | |||||||||
|
Indices
|
782 | 392,394 | 0.94 | |||||||||
|
Interest Rates U.S.
|
58 | (227,140 | ) | (0.54 | ) | |||||||
|
Interest Rates
Non-U.S.
|
700 | (2,789 | ) | (0.01 | ) | |||||||
|
Livestock
|
201 | 421,367 | 1.01 | |||||||||
|
Metals
|
57 | 749,650 | 1.80 | |||||||||
|
Softs
|
353 | 1,766,647 | 4.24 | |||||||||
|
Total futures contracts purchased
|
6,258,833 | 15.02 | ||||||||||
|
Futures Contracts Sold
|
||||||||||||
|
Currencies
|
238 | 718,098 | 1.72 | |||||||||
|
Indices
|
2 | 6,214 | 0.02 | |||||||||
|
Interest Rates
Non-U.S.
|
92 | (14,145 | ) | (0.03 | ) | |||||||
|
Softs
|
259 | (516,588 | ) | (1.24 | ) | |||||||
|
Total futures contracts sold
|
193,579 | 0.47 | ||||||||||
|
Unrealized Appreciation on Open Forward Contracts
|
||||||||||||
|
Metals
|
133 | 1,063,713 | 2.55 | |||||||||
|
Total unrealized appreciation on open forward contracts
|
1,063,713 | 2.55 | ||||||||||
|
Unrealized Depreciation on Open Forward Contracts
|
||||||||||||
|
Metals
|
121 | (1,120,174 | ) | (2.69 | ) | |||||||
|
Total unrealized depreciation on open forward contracts
|
(1,120,174 | ) | (2.69 | ) | ||||||||
|
Total fair value
|
$ | 6,395,951 | 15.35 | % | ||||||||
See accompanying notes to financial statements.
25
Tidewater Futures
Fund L.P.
Condensed Schedule of Investments
December 31, 2009
Condensed Schedule of Investments
December 31, 2009
|
Number of |
% of Partners’ |
|||||||||||
| Contracts | Fair Value | Capital | ||||||||||
|
Futures Contracts Purchased
|
||||||||||||
|
Currencies
|
389 | $ | (605,857 | ) | (1.22 | )% | ||||||
|
Energy
|
223 | 1,173,441 | 2.36 | |||||||||
|
Grains
|
192 | 23,307 | 0.05 | |||||||||
|
Indices
|
1,025 | 1,972,504 | 3.97 | |||||||||
|
Interest Rates U.S.
|
87 | (238,297 | ) | (0.48 | ) | |||||||
|
Interest Rates
Non-U.S.
|
294 | (389,286 | ) | (0.78 | ) | |||||||
|
Metals
|
119 | (898,300 | ) | (1.81 | ) | |||||||
|
Softs
|
776 | 2,519,407 | 5.06 | |||||||||
|
Total futures contracts purchased
|
3,556,919 | 7.15 | ||||||||||
|
Futures Contracts Sold
|
||||||||||||
|
Currencies
|
215 | (18,762 | ) | (0.04 | ) | |||||||
|
Grains
|
278 | 235,663 | 0.47 | |||||||||
|
Interest Rates U.S.
|
1 | 5,023 | 0.01 | |||||||||
|
Interest Rates
Non-U.S.
|
316 | (45,505 | ) | (0.09 | ) | |||||||
|
Livestock
|
192 | (106,358 | ) | (0.21 | ) | |||||||
|
Softs
|
240 | (3,260 | ) | (0.01 | ) | |||||||
|
Total futures contracts sold
|
66,801 | 0.13 | ||||||||||
|
Unrealized Appreciation on Open Forward Contracts
|
||||||||||||
|
Metals
|
241 | 1,510,523 | 3.04 | |||||||||
|
Total unrealized appreciation on open forward contracts
|
1,510,523 | 3.04 | ||||||||||
|
Unrealized Depreciation on Open Forward Contracts
|
||||||||||||
|
Metals
|
50 | (234,494 | ) | (0.47 | ) | |||||||
|
Total unrealized depreciation on open forward contracts
|
(234,494 | ) | (0.47 | ) | ||||||||
|
Total fair value
|
$ | 4,899,749 | 9.85 | % | ||||||||
See accompanying notes to financial statements.
26
Tidewater Futures
Fund L.P.
Statements of Income and Expenses
for the years ended
December 31, 2010, 2009 and 2008
Statements of Income and Expenses
for the years ended
December 31, 2010, 2009 and 2008
| 2010 | 2009 | 2008 | ||||||||||
|
Income:
|
||||||||||||
|
Net gains (losses) on trading of commodity interests:
|
||||||||||||
|
Net realized gains (losses) on closed contracts
|
$ | (162,637 | ) | $ | 2,601,999 | $ | 19,354,323 | |||||
|
Change in net unrealized gains (losses) on open contracts
|
1,496,202 | 1,996,552 | (649,772 | ) | ||||||||
|
Gain (loss) from trading, net
|
1,333,565 | 4,598,551 | 18,704,551 | |||||||||
|
Interest income (Note 3c)
|
33,924 | 38,284 | 758,022 | |||||||||
|
Total income (loss)
|
1,367,489 | 4,636,835 | 19,462,573 | |||||||||
|
Expenses:
|
||||||||||||
|
Brokerage fees including clearing fees (Note 3c)
|
2,687,495 | 3,565,935 | 4,769,347 | |||||||||
|
Management fees (Note 3b)
|
778,084 | 1,074,282 | 1,423,171 | |||||||||
|
Professional fees
|
252,552 | 145,186 | 168,684 | |||||||||
|
Other
|
18,875 | 44,189 | 50,792 | |||||||||
|
Total expenses
|
3,737,006 | 4,829,592 | 6,411,994 | |||||||||
|
Management fees waived (Note 3b)
|
(70,253 | ) | — | — | ||||||||
|
Net expenses
|
3,666,753 | 4,829,592 | 6,411,994 | |||||||||
|
Net income (loss)
|
$ | (2,299,264 | ) | $ | (192,757 | ) | $ | 13,050,579 | ||||
|
Net income (loss) per unit (Note 6)
|
$ | (53.40 | ) | $ | 53.37 | $ | 330.33 | |||||
|
Weighted average units outstanding
|
23,013.2035 | 28,947.5633 | 37,749.3594 | |||||||||
See accompanying notes to financial statements.
27
Tidewater Futures
Fund L.P.
Statements of Changes in Partners’ Capital
for the years ended
December 31, 2010, 2009 and 2008
Statements of Changes in Partners’ Capital
for the years ended
December 31, 2010, 2009 and 2008
|
Limited |
General |
|||||||||||
| Partners | Partner | Total | ||||||||||
|
Partners’ Capital at December 31, 2007
|
$ | 64,832,448 | $ | 1,139,627 | $ | 65,972,075 | ||||||
|
Net income (loss)
|
12,676,037 | 374,542 | 13,050,579 | |||||||||
|
Subscriptions of 4,082.4408 Redeemable Units and 521.2428
General Partner unit equivalents
|
7,390,000 | 886,660 | 8,276,660 | |||||||||
|
Redemptions of 11,348.7824 Redeemable Units
|
(21,508,257 | ) | — | (21,508,257 | ) | |||||||
|
Partners’ Capital at December 31, 2008
|
63,390,228 | 2,400,829 | 65,791,057 | |||||||||
|
Net income (loss)
|
(90,409 | ) | (102,348 | ) | (192,757 | ) | ||||||
|
Subscriptions of 1,526.6293 Redeemable Units
|
2,841,000 | — | 2,841,000 | |||||||||
|
Redemptions of 9,474.3926 Redeemable Units and 812.0052 General
Partner unit equivalents
|
(17,224,525 | ) | (1,486,124 | ) | (18,710,649 | ) | ||||||
|
Partners’ Capital at December 31, 2009
|
48,916,294 | 812,357 | 49,728,651 | |||||||||
|
Net income (loss)
|
(2,294,477 | ) | (4,787 | ) | (2,299,264 | ) | ||||||
|
Subscriptions of 1,353.3838 Redeemable Units
|
2,106,000 | — | 2,106,000 | |||||||||
|
Redemptions of 4,641.7005 Redeemable Units and 117.7745 General
Partner unit equivalents
|
(7,613,343 | ) | (250,000 | ) | (7,863,343 | ) | ||||||
|
Partners’ Capital at December 31, 2010
|
$ | 41,114,474 | $ | 557,570 | $ | 41,672,044 | ||||||
|
Net asset value per unit:
|
||||||||||||
|
2008:
|
$ | 1,982.46 | ||
|
2009:
|
$ | 2,035.83 | ||
|
2010:
|
$ | 1,982.43 | ||
See accompanying notes to financial statements.
28
Tidewater Futures
Fund L.P.
Notes to Financial Statements
December 31, 2010
Notes to Financial Statements
December 31, 2010
| 1. | Partnership Organization: |
Tidewater Futures Fund L.P. (the “Partnership”)
is a limited partnership organized on February 23, 1995
under the partnership laws of the State of New York to engage in
the speculative trading of a diversified portfolio of commodity
interests including futures contracts, options, swaps and
forward contracts. The sectors traded include currencies,
energy, grains, indices, U.S. and
non-U.S. interest
rates, livestock, lumber, metals and softs. The commodity
interests that are traded by the Partnership are volatile and
involve a high degree of market risk. The Partnership privately
and continuously offers up to 150,000 redeemable units of
limited partnership interest (“Redeemable Units”) to
qualified investors. There is no maximum number of Redeemable
Units that may be sold by the Partnership.
Ceres Managed Futures LLC, a Delaware limited liability company,
acts as the general partner (the “General Partner”)
and commodity pool operator of the Partnership. The General
Partner is wholly owned by Morgan Stanley Smith Barney Holdings
LLC (“MSSB Holdings”). Morgan Stanley, indirectly
through various subsidiaries, owns a majority equity interest in
MSSB Holdings. Citigroup Global Markets Inc. (“CGM”),
the commodity broker and a selling agent for the Partnership,
owns a minority equity interest in MSSB Holdings. Citigroup Inc.
(“Citigroup”), indirectly through various
subsidiaries, wholly owns CGM. Prior to July 31, 2009, the
date as of which MSSB Holdings became its owner, the General
Partner was wholly owned by Citigroup Financial Products Inc., a
wholly owned subsidiary of Citigroup Global Markets Holdings
Inc., the sole owner of which is Citigroup. As of
December 31, 2010, all trading decisions for the
Partnership are made by the Advisor (defined below).
For the period from July 12, 2010 through
September 14, 2010, Chesapeake Capital Corporation (the
“Advisor”), in consultation with the General Partner,
reduced temporarily the overall leverage of the
Partnership’s assets traded pursuant to the Advisor’s
Diversified 2XL Program (the “Program”) from 75% of
the customary leverage utilized by the Program, to 50% of the
customary leverage utilized by the Program. Effective
September 15, 2010, the Advisor, in consultation with the
General Partner, increased the overall leverage of the
Partnership’s assets traded pursuant to the Program from
50% of the customary leverage utilized by the Program to 62.5%
of the customary leverage utilized by the Program. Effective
October 12, 2010, the Advisor, in consultation with the
General Partner, increased the overall leverage of the
Partnership assets traded pursuant to the Program to 75% of the
customary leverage utilized by the Program. The Advisor, in
further consultation with the General Partner, will determine
if, and at what time, the leverage may be further readjusted.
Such adjustments to the leverage employed will not exceed 100%
of the customary leverage utilized by the Advisor in the Program.
The General Partner and each limited partner share in the
profits and losses of the Partnership in proportion to the
amount of Partnership interest owned by each except that no
limited partner shall be liable for obligations of the
Partnership in excess of its initial capital contribution and
profits, if any, net of distributions.
The Partnership will be liquidated upon the first to occur of
the following: December 31, 2015; when the net asset value
of a Redeemable Unit decreases to less than $400 per Redeemable
Unit as of the close of business on any business day; or under
certain circumstances as defined in the limited partnership
agreement of the Partnership (the “Limited Partnership
Agreement”).
| 2. | Accounting Policies: |
| a. | Use of Estimates. The preparation of financial statements and accompanying notes in conformity with accounting principles generally accepted in the United States of America (“GAAP”) requires management to make estimates and assumptions that affect the reported amounts of assets and liabilities, income and expenses, and related disclosures of contingent assets and liabilities in the financial statements and accompanying notes. As a result, actual results could differ from these estimates. |
29
Tidewater Futures
Fund L.P.
Notes to Financial Statements
December 31, 2010
Notes to Financial Statements
December 31, 2010
| b. | Statement of Cash Flows. The Partnership is not required to provide a Statement of Cash Flows. | |
| c. | Partnership’s Investments. All commodity interests (including derivative financial instruments and derivative commodity instruments) are held for trading purposes. The commodity interests are recorded on trade date and open contracts are recorded at fair value (as described below) at the measurement date. Investments in commodity interests denominated in foreign currencies are translated into U.S. dollars at the exchange rates prevailing at the measurement date. Gains or losses are realized when contracts are liquidated. Unrealized gains or losses on open contracts are included as a component of equity in trading account on the Statements of Financial Condition. Realized gains or losses and any change in net unrealized gains or losses from the preceding period are reported in the Statements of Income and Expenses. |
Partnership’s Fair Value
Measurements. Fair value is defined as the price
that would be received to sell an asset or paid to transfer a
liability in an orderly transaction between market participants
at the measurement date under current market conditions. The
fair value hierarchy gives the highest priority to unadjusted
quoted prices in active markets for identical assets or
liabilities (Level 1) and the lowest priority to fair
values derived from unobservable inputs (Level 3). The
level in the fair value hierarchy within which the fair value
measurement in its entirety falls shall be determined based on
the lowest level input that is significant to the fair value
measurement in its entirety. GAAP also requires the need to use
judgment in determining if a formerly active market has become
inactive and in determining fair values when the market has
become inactive. Management has concluded that based on
available information in the marketplace, the Partnership’s
Level 1 assets and liabilities are actively traded.
The Partnership will separately present purchases, sales,
issuances, and settlements in their reconciliation of
Level 3 fair value measurements (i.e. to present such items
on a gross basis rather than on a net basis), and makes
disclosures regarding the level of disaggregation and the inputs
and valuation techniques used to measure fair value for
measurements that fall within either Level 2 or
Level 3 of the fair value hierarchy as required under GAAP.
The Partnership considers prices for exchange-traded commodity
futures, forwards and options contracts to be based on
unadjusted quoted prices in active markets for identical assets
(Level 1). The values of non exchange-traded forwards,
swaps and certain options contracts for which market quotations
are not readily available are priced by broker-dealers who
derive fair values for those assets from observable inputs
(Level 2). As of and for the years ended December 31,
2010 and 2009, the Partnership did not hold any derivative
instruments for which market quotations are not readily
available and that are priced by broker-dealers who derive fair
values for those assets from observable inputs
(Level 2) or that are priced at fair value using
unobservable inputs through the application of management’s
assumptions and internal valuation pricing models
(Level 3). The
30
Tidewater Futures
Fund L.P.
Notes to Financial Statements
December 31, 2010
Notes to Financial Statements
December 31, 2010
gross presentation of the fair value of the Partnership’s
derivatives by instrument type is shown in Note 4,
“Trading Activities”.
|
Quoted Prices in |
||||||||||||||||
|
Active Markets |
Significant Other |
Significant |
||||||||||||||
|
for Identical |
Observable Inputs |
Unobservable |
||||||||||||||
|
|
12/31/2010 | Assets (Level 1) | (Level 2) | Inputs (Level 3) | ||||||||||||
|
Assets
|
||||||||||||||||
|
Futures
|
$ | 6,452,412 | $ | 6,452,412 | $ | — | $ | — | ||||||||
|
Total assets
|
6,452,412 | 6,452,412 | — | — | ||||||||||||
|
Liabilities
|
||||||||||||||||
|
Forwards
|
56,461 | 56,461 | — | — | ||||||||||||
|
Total liabilities
|
56,461 | 56,461 | — | — | ||||||||||||
|
Total fair value
|
$ | 6,395,951 | $ | 6,395,951 | $ | — | $ | — | ||||||||
|
Quoted Prices in |
||||||||||||||||
|
Active Markets |
Significant Other |
Significant |
||||||||||||||
|
for Identical |
Observable Inputs |
Unobservable |
||||||||||||||
|
|
12/31/2009 | Assets (Level 1) | (Level 2) | Inputs (Level 3) | ||||||||||||
|
Assets
|
||||||||||||||||
|
Futures
|
$ | 3,623,720 | $ | 3,623,720 | $ | — | $ | — | ||||||||
|
Forwards
|
1,276,029 | 1,276,029 | — | — | ||||||||||||
|
Total assets
|
4,899,749 | 4,899,749 | — | — | ||||||||||||
|
Total fair value
|
$ | 4,899,749 | $ | 4,899,749 | $ | — | $ | — | ||||||||
| d. | Futures Contracts. The Partnership trades futures contracts. A futures contract is a firm commitment to buy or sell a specified quantity of investments, currency or a standardized amount of a deliverable grade commodity, at a specified price on a specified future date, unless the contract is closed before the delivery date or if the delivery quantity is something where physical delivery cannot occur (such as the S&P 500 Index), whereby such contract is settled in cash. Payments (“variation margin”) may be made or received by the Partnership each business day, depending on the daily fluctuations in the value of the underlying instruments, and are recorded as unrealized gains or losses by the Partnership. When the contract is closed, the Partnership records a realized gain or loss equal to the difference between the value of the contract at the time it was opened and the value at the time it was closed. Transactions in futures contracts require participants to make both initial margin deposits of cash or other assets and variation margin deposits, through the futures broker, directly with the exchange on which the contracts are traded. Realized gains (losses) and changes in unrealized gains (losses) on futures contracts are included in the Statements of Income and Expenses. | |
| e. | London Metals Exchange Forward Contracts. Metal contracts traded on the London Metals Exchange (“LME”) represent a firm commitment to buy or sell a specified quantity of aluminum, copper, lead, nickel, tin or zinc. LME contracts traded by the Partnership are cash settled based on prompt dates published by the LME. Payments (“variation margin”) may be made or received by the Partnership each business day, depending on the daily fluctuations in the value of the underlying contracts, and are recorded as unrealized gains or losses by the Partnership. A contract is considered offset when all long positions have been matched with a like number of short positions settling on the same prompt date. When the contract is closed at the prompt date, the Partnership records a realized gain or loss equal to the difference between the value of the contract at the time it was opened and the value at the time it was closed. Transactions in LME contracts require participants to make both initial margin deposits of cash or other assets and variation margin deposits, through the broker, directly with the LME. Realized gains (losses) and |
31
Tidewater Futures
Fund L.P.
Notes to Financial Statements
December 31, 2010
Notes to Financial Statements
December 31, 2010
| changes in unrealized gains (losses) on metal contracts are included in the Statements of Income and Expenses. |
| f. | Income Taxes. Income taxes have not been provided as each partner is individually liable for the taxes, if any, on its share of the Partnership’s income and expenses. |
GAAP provides guidance for how uncertain tax positions should be
recognized, measured, presented and disclosed in the financial
statements and requires the evaluation of tax positions taken or
expected to be taken in the course of preparing the
Partnership’s financial statements to determine whether the
tax positions are “more-likely-than-not” to be
sustained by the applicable tax authority. Tax positions with
respect to tax at the Partnership level not deemed to meet the
“more-likely-than-not” threshold would be recorded as
a tax benefit or expense in the current year. The General
Partner concluded that no provision for income tax is required
in the Partnership’s financial statements.
The Partnership files U.S. federal and various state and
local tax returns. No income tax returns are currently under
examination. Generally, the 2007 through 2010 tax years remain
subject to examination by U.S. federal and most state tax
authorities. Management does not believe that there are any
uncertain tax positions that require recognition of a tax
liability.
| g. | Subsequent Events. Management of the Partnership evaluates events that occur after the balance sheet date but before financial statements are filed. Management has assessed the subsequent events through the date of filing and determined that there were no subsequent events requiring adjustment of or disclosure in the financial statements. | |
| h. | Net Income (Loss) per Unit. Net income (loss) per unit is calculated in accordance with investment company guidance. See Note 6, “Financial Highlights”. |
| 3. | Agreements: |
| a. | Limited Partnership Agreement: |
The General Partner administers the business and affairs of the
Partnership including selecting one or more advisors to make
trading decisions for the Partnership.
| b. | Management Agreement: |
The General Partner, on behalf of the Partnership, has entered
into a management agreement (the “Management
Agreement”) with the Advisor, a registered commodity
trading advisor. The Advisor is not affiliated with the General
Partner or CGM and is not responsible for the organization or
operation of the Partnership. As compensation for services, the
Partnership is obligated to pay the Advisor a monthly management
fee of
1/6
of 1% (2% per year) of month-end Net Assets managed by the
Advisor. Month-end Net Assets, for the purpose of calculating
management fees, are Net Assets, as defined in the Limited
Partnership Agreement, prior to the reduction of the current
month’s incentive fee accrual, the monthly management fee
and any redemptions or distributions as of the end of such
month. For the period from August 1, 2010 through
September 30, 2010, the Advisor reduced the management fee
it receives from the Partnership from an annual rate of 2% of
adjusted net assets to an annual rate of 1% of adjusted net
assets. For the period from October 1, 2010 through
October 31, 2010, the Advisor reduced the management fee it
receives from the Partnership from an annual rate of 2% of
adjusted net assets to an annual rate of 1.5% of adjusted net
assets. The Management Agreement may be terminated upon notice
by either party.
In addition, the Partnership is obligated to pay the Advisor an
incentive fee, payable quarterly, equal to 20% of the New
Trading Profits, as defined in the Management Agreement, earned
by the Advisor for the Partnership during each calendar quarter.
The Advisor will not be paid incentive
32
Tidewater Futures
Fund L.P.
Notes to Financial Statements
December 31, 2010
Notes to Financial Statements
December 31, 2010
fees until the Advisor recovers the net loss incurred and earns
additional new trading profits for the Partnership.
In allocating the assets of the Partnership to the trading
advisor, the General Partner considers past performance, trading
style, volatility of markets traded and fee requirements. The
General Partner may modify or terminate the allocation of assets
to the trading advisor and may allocate the assets to additional
advisors at any time.
| c. | Customer Agreement: |
The Partnership has entered into a customer agreement (the
“Customer Agreement”) with CGM whereby CGM provides
services which include, among other things, the execution of
transactions for the Partnership’s account in accordance
with orders placed by the Advisor. The Partnership is obligated
to pay a monthly brokerage fee to CGM equal to 6.5% per year of
month-end Net Assets, in lieu of brokerage fees on a per trade
basis. Effective February 1, 2011, the Partnership reduced
the monthly brokerage fee paid to CGM to 5.0% per year of
month-end Net Assets. Month-end Net Assets, for the purpose of
calculating brokerage fees are Net Assets, as defined in the
Limited Partnership Agreement, prior to the reduction of the
current month’s brokerage fees, management fee, incentive
fee accrual and other expenses and any redemptions or
distributions as of the end of such month. CGM will pay a
portion of its brokerage fees to other properly registered
selling agents and to financial advisors who have sold
Redeemable Units. Brokerage fees will be paid for the life of
the Partnership, although the rate at which such fees are paid
may be changed. This fee may be increased or decreased at any
time at CGM’s discretion upon written notice to the
Partnership. The Partnership will pay for National Futures
Association fees, exchange, clearing, user,
give-up and
floor brokerage fees (collectively the “clearing
fees”). All of the Partnership’s assets are deposited
in the Partnership’s account at CGM. The Partnership’s
cash is deposited by CGM in segregated bank accounts to the
extent required by Commodity Futures Trading Commission
regulations. At December 31, 2010 and 2009, the amount of
cash held for margin requirements was $10,943,883 and
$13,348,704, respectively. CGM will pay the Partnership interest
on 80% of the average daily equity maintained in cash in the
Partnership’s brokerage account during each month at a
30-day
U.S. Treasury bill rate determined weekly by CGM based on
the average non-competitive yield on
3-month
U.S. Treasury bills maturing in 30 days from the date
on which such weekly rate is determined. The Customer Agreement
may be terminated upon notice by either party.
| 4. | Trading Activities: |
The Partnership was formed for the purpose of trading contracts
in a variety of commodity interests, including derivative
financial instruments and derivative commodity instruments. The
results of the Partnership’s trading activities are shown
in the Statements of Income and Expenses.
The Customer Agreement between the Partnership and CGM gives the
Partnership the legal right to net unrealized gains and losses
on open futures and forward contracts. The Partnership nets, for
financial reporting purposes, the unrealized gains and losses on
open futures and forward contracts on the Statements of
Financial Condition.
All of the commodity interests owned by the Partnership are held
for trading purposes. The average number of futures contracts
traded for the years ended December 31, 2010 and 2009 based
on a monthly calculation, were 4,217 and 2,502, respectively.
The average number of metals forward contracts traded for the
years ended December 31, 2010 and 2009 based on a monthly
calculation, were 282 and 113, respectively. In prior year, the
average contracts were based on a quarterly and not a monthly
calculation. The amounts for the year ended December 31,
2009 have been revised accordingly.
33
Tidewater Futures
Fund L.P.
Notes to Financial Statements
December 31, 2010
Notes to Financial Statements
December 31, 2010
Brokerage fees are calculated as a percentage of the
Partnership’s adjusted net asset value on the last day of
each month and are affected by trading performance, additions
and redemptions.
The following tables indicate the gross fair values of
derivative instruments of futures and forward contracts as
separate assets and liabilities as of December 31, 2010 and
2009.
|
Assets
|
December 31, 2010 | |||
|
Futures Contracts
|
||||
|
Currencies
|
$ | 1,561,451 | ||
|
Energy
|
296,607 | |||
|
Grains
|
2,286,361 | |||
|
Indices
|
538,181 | |||
|
Interest Rates
Non-U.S.
|
77,000 | |||
|
Livestock
|
421,367 | |||
|
Metals
|
749,650 | |||
|
Softs
|
1,788,112 | |||
|
Total unrealized appreciation on
open futures contracts |
$ | 7,718,729 | ||
|
Liabilities
|
||||
|
Futures Contracts
|
||||
|
Currencies
|
$ | (171,134 | ) | |
|
Energy
|
(96,483 | ) | ||
|
Indices
|
(139,573 | ) | ||
|
Interest Rates U.S.
|
(227,140 | ) | ||
|
Interest Rates
Non-U.S.
|
(93,934 | ) | ||
|
Softs
|
(538,053 | ) | ||
|
Total unrealized depreciation on
open futures contracts |
$ | (1,266,317 | ) | |
|
Net unrealized appreciation on
open futures contracts |
$ | 6,452,412 | * | |
|
Assets
|
||||
|
Forward Contracts
|
||||
|
Metals
|
$ | 1,063,713 | ||
|
Total unrealized appreciation on open forward contracts
|
$ | 1,063,713 | ||
|
Liabilities
|
||||
|
Forward Contracts
|
||||
|
Metals
|
$ | (1,120,174 | ) | |
|
Total unrealized depreciation on open forward contracts
|
$ | (1,120,174 | ) | |
|
Net unrealized depreciation on open forward contracts
|
$ | (56,461 | )** | |
| * | This amount is in “Net unrealized appreciation on open futures contracts” on the Statements of Financial Condition. | |
| ** | This amount is in “Net unrealized depreciation on open forward contracts” on the Statements of Financial Condition. |
34
Tidewater Futures
Fund L.P.
Notes to Financial Statements
December 31, 2010
Notes to Financial Statements
December 31, 2010
|
Assets
|
December 31, 2009 | |||
|
Futures Contracts
|
||||
|
Currencies
|
$ | 480,338 | ||
|
Energy
|
1,173,441 | |||
|
Grains
|
328,415 | |||
|
Interest Rates U.S.
|
5,023 | |||
|
Interest Rates
Non-U.S.
|
20,069 | |||
|
Indices
|
1,983,702 | |||
|
Livestock
|
7,030 | |||
|
Softs
|
2,690,297 | |||
|
Total unrealized appreciation on
open futures contracts |
$ | 6,688,315 | ||
|
Liabilities
|
||||
|
Futures Contracts
|
||||
|
Currencies
|
$ | (1,104,957 | ) | |
|
Grains
|
(69,445 | ) | ||
|
Interest Rates U.S.
|
(238,297 | ) | ||
|
Interest Rates
Non-U.S.
|
(454,860 | ) | ||
|
Indices
|
(11,198 | ) | ||
|
Livestock
|
(113,388 | ) | ||
|
Metals
|
(898,300 | ) | ||
|
Softs
|
(174,150 | ) | ||
|
Total unrealized depreciation on
open futures contracts |
$ | (3,064,595 | ) | |
|
Net unrealized appreciation on
open futures contracts |
$ | 3,623,720 | * | |
|
Assets
|
||||
|
Forward Contracts
|
||||
|
Metals
|
$ | 1,510,523 | ||
|
Total unrealized appreciation on open forward contracts
|
$ | 1,510,523 | ||
|
Liabilities
|
||||
|
Forward Contracts
|
||||
|
Metals
|
$ | (234,494 | ) | |
|
Total unrealized depreciation on open forward contracts
|
$ | (234,494 | ) | |
|
Net unrealized appreciation on open forward contracts
|
$ | 1,276,029 | ** | |
| * | This amount is in “Net unrealized appreciation on open futures contracts” on the Statements of Financial Condition. | |
| ** | This amount is in “Net unrealized appreciation on open forward contracts” on the Statements of Financial Condition. |
35
Tidewater Futures
Fund L.P.
Notes to Financial Statements
December 31, 2010
Notes to Financial Statements
December 31, 2010
The following tables indicate the trading gains and losses, by
market sector, on derivative instruments for the years ended
December 31,2010 and 2009.
|
December 31, |
December 31, |
|||||||
|
2010 |
2009 |
|||||||
|
Gain (Loss) |
Gain (Loss) |
|||||||
|
Sector
|
from Trading | from Trading | ||||||
|
Currencies
|
$ | (296,465 | ) | $ | (3,328,709 | ) | ||
|
Energy
|
(2,214,938 | ) | (466,919 | ) | ||||
|
Grains
|
2,585,561 | (1,553,269 | ) | |||||
|
Indices
|
(540,389 | ) | 4,538,302 | |||||
|
Interest Rates U.S.
|
564,696 | (859,153 | ) | |||||
|
Interest Rates
Non-U.S.
|
1,787,049 | (1,883,874 | ) | |||||
|
Livestock
|
(1,003,769 | ) | 996,379 | |||||
|
Metals
|
1,608,449 | 2,647,029 | ||||||
|
Softs
|
(1,156,629 | ) | 4,508,765 | |||||
|
Total
|
$ | 1,333,565 | *** | $ | 4,598,551 | *** | ||
| *** | This amount is in “Gain (loss) from trading, net” on the Statements of Income and Expenses. |
| 5. | Subscriptions, Distributions and Redemptions: |
Subscriptions are accepted monthly from investors and they
become limited partners on the first day of the month after
their subscription is processed. Distributions of profits, if
any, will be made at the sole discretion of the General Partner
and at such times as the General Partner may decide. A limited
partner may require the Partnership to redeem their Redeemable
Units at their net asset value per Redeemable Unit as of the
last day of any month on three business days’ notice to the
General Partner. There is no fee charged to limited partners in
connection with redemptions.
| 6. | Financial Highlights: |
Changes in the net asset value per unit for the years ended
December 31, 2010, 2009 and 2008 were as follows:
| 2010 | 2009 | 2008 | ||||||||||
|
Net realized and unrealized gains (losses)*
|
$ | (12.29 | ) | $ | 95.04 | $ | 354.47 | |||||
|
Interest income
|
1.48 | 1.28 | 19.42 | |||||||||
|
Expenses**
|
(42.59 | ) | (42.95 | ) | (43.56 | ) | ||||||
|
Increase (decrease) for the year
|
(53.40 | ) | 53.37 | *** | 330.33 | |||||||
|
Net asset value per unit, beginning of year
|
2,035.83 | 1,982.46 | 1,652.13 | |||||||||
|
Net asset value per unit, end of year
|
$ | 1,982.43 | $ | 2,035.83 | $ | 1,982.46 | ||||||
| * | Includes brokerage fees. | |
| ** | Excludes brokerage fees. | |
| *** | The increase in the net asset value per unit while the Partnership incurred a net loss for the year ended December 31, 2009 is due to the timing of subscriptions and redemptions of units throughout the year. |
36
Tidewater Futures
Fund L.P.
Notes to Financial Statements
December 31, 2010
Notes to Financial Statements
December 31, 2010
| 2010 | 2009 | 2008 | ||||||||||
|
Ratios to average net assets:
|
||||||||||||
|
Net investment income (loss) before incentive fees****
|
(9.3 | )% | (9.1 | )% | (8.1 | )% | ||||||
|
Operating expenses
|
9.4 | %***** | 9.2 | % | 9.2 | % | ||||||
|
Incentive fees
|
— | % | — | % | — | % | ||||||
|
Total expenses
|
9.4 | % | 9.2 | % | 9.2 | % | ||||||
|
Total return:
|
||||||||||||
|
Total return before incentive fees
|
(2.6 | )% | 2.7 | % | 20.0 | % | ||||||
|
Incentive fees
|
— | % | — | % | — | % | ||||||
|
Total return after incentive fees
|
(2.6 | )% | 2.7 | % | 20.0 | % | ||||||
| **** | Interest income less total expenses. | |
| ***** | Percentages are after management fee waivers. The Advisor voluntarily waived a portion of the management fee (equal to 0.2% per year of adjusted net assets). |
The above ratios may vary for individual investors based on the
timing of capital transactions during the year. Additionally,
these ratios are calculated for the limited partner class using
limited partners’ share of income, expenses and average net
assets.
| 7. | Financial Instrument Risks: |
In the normal course of business, the Partnership is party to
financial instruments with off-balance sheet risk, including
derivative financial instruments and derivative commodity
instruments. These financial instruments may include forwards,
futures, options and swaps, whose values are based upon an
underlying asset, index, or reference rate, and generally
represent future commitments to exchange currencies or cash
balances, to purchase or sell other financial instruments at
specific terms at specified future dates, or, in the case of
derivative commodity instruments, to have a reasonable
possibility to be settled in cash, through physical delivery or
with another financial instrument. These instruments may be
traded on an exchange or
over-the-counter
(“OTC”). Exchange-traded instruments are standardized
and include futures and certain forwards and option contracts.
OTC contracts are negotiated between contracting parties and
include certain forwards and option contracts. Each of these
instruments is subject to various risks similar to those related
to the underlying financial instruments including market and
credit risk. In general, the risks associated with OTC contracts
are greater than those associated with exchange-traded
instruments because of the greater risk of default by the
counterparty to an OTC contract.
The risk to the limited partners that have purchased interests
in the Partnership is limited to the amount of their capital
contributions to the Partnership and their share of the
Partnership’s assets and undistributed profits. This
limited liability is a consequence of the organization of the
Partnership as a limited partnership under applicable law.
Market risk is the potential for changes in the value of the
financial instruments traded by the Partnership due to market
changes, including interest and foreign exchange rate movements
and fluctuations in commodity or security prices. Market risk is
directly impacted by the volatility and liquidity in the markets
in which the related underlying assets are traded. The
Partnership is exposed to a market risk equal to the value of
futures and forward contracts purchased and unlimited liability
on such contracts sold short.
37
Tidewater Futures
Fund L.P.
Notes to Financial Statements
December 31, 2010
Notes to Financial Statements
December 31, 2010
Credit risk is the possibility that a loss may occur due to the
failure of a counterparty to perform according to the terms of a
contract. The Partnership’s risk of loss in the event of a
counterparty default is typically limited to the amounts
recognized in the Statements of Financial Condition and not
represented by the contract or notional amounts of the
instruments. The Partnership’s risk of loss is reduced
through the use of legally enforceable master netting agreements
with counterparties that permit the Partnership to offset
unrealized gains and losses and other assets and liabilities
with such counterparties upon the occurrence of certain events.
The Partnership has credit risk and concentration risk as the
sole counterparty or broker with respect to the
Partnership’s assets is CGM or a CGM affiliate. Credit risk
with respect to exchange-traded instruments is reduced to the
extent that through CGM, the Partnership’s counterparty is
an exchange or clearing organization.
The General Partner monitors and attempts to control the
Partnership’s risk exposure on a daily basis through
financial, credit and risk management monitoring systems, and
accordingly, believes that it has effective procedures for
evaluating and limiting the credit and market risks to which the
Partnership may be subject. These monitoring systems generally
allow the General Partner to statistically analyze actual
trading results with
risk-adjusted
performance indicators and correlation statistics. In addition,
on-line monitoring systems provide account analysis of futures,
forwards and options positions by sector, margin requirements,
gain and loss transactions and collateral positions.
The majority of these instruments mature within one year of the
inception date. However, due to the nature of the
Partnership’s business, these instruments may not be held
to maturity.
38
Selected unaudited quarterly financial data for the years ended December 31, 2010 and 2009 are summarized below:
| For the period from | For the period from | For the period from | For the period from | |||||||||||||
| October 1, 2010 to | July 1, 2010 to | April 1, 2010 to | January 1, 2010 to | |||||||||||||
| December 31, 2010 | September 30, 2010 | June 30, 2010 | March 31, 2010 | |||||||||||||
Net realized and
unrealized trading
gains (losses) net of
brokerage fees and
clearing fees
including interest
income |
$ | 10,316,597 | $ | 1,934,499 | $ | (13,432,393 | ) | $ | (138,709 | ) | ||||||
Net income (loss) |
$ | 10,048,309 | $ | 1,725,293 | $ | (13,671,008 | ) | $ | (401,858 | ) | ||||||
Increase (decrease) in
net asset value per unit |
$ | 465.67 | $ | 80.67 | $ | (587.85 | ) | $ | (11.89 | ) | ||||||
| For the period from | For the period from | For the period from | For the period from | |||||||||||||
| October 1, 2009 to | July 1, 2009 to | April 1, 2009 to | January 1, 2009 to | |||||||||||||
| December 31, 2009 | September 30, 2009 | June 30, 2009 | March 31, 2009 | |||||||||||||
Net realized and
unrealized trading
gains (losses) net of
brokerage fees and
clearing fees
including interest
income |
$ | 2,879,321 | $ | 6,272,425 | $ | (6,298,233 | ) | $ | (1,782,613 | ) | ||||||
Net income (loss) |
$ | 2,642,139 | $ | 6,027,105 | $ | (6,646,885 | ) | $ | (2,215,116 | ) | ||||||
Increase (decrease) in
net asset value per unit |
$ | 107.25 | $ | 227.55 | $ | (213.24 | ) | $ | (68.19 | ) | ||||||
39
Item 9. Changes in and Disagreements with Accountants on Accounting and Financial
Disclosure.
PricewaterhouseCoopers LLP (“PwC”) was previously the principal accountant for the Partnership
through July 22, 2009. On July 22, 2009, PwC was dismissed as principal accountant and on July 23,
2009 Deloitte & Touche LLP (“Deloitte”) was engaged as the independent registered public accounting
firm. The decision to change accountants was approved by the General Partner of the Partnership.
In connection with the audit of the fiscal year ended December 31, 2008, and through July 22,
2009, there were no disagreements with PwC, on any matter of accounting principles or practices,
financial statement disclosure, or auditing scope or procedures, which disagreements if not
resolved to their satisfaction would have caused them to make reference thereto in their report on
the financial statements for the corresponding year.
The respective report of PwC on the financial statements of the Partnership as of and
for the year ended December 31, 2008, did not contain any adverse opinion or disclaimer of opinion,
nor was it qualified or modified as to uncertainty, audit scope, or accounting principle.
Item 9A. Controls and Procedures.
The Partnership’s disclosure controls and procedures are designed to ensure that information
required to be disclosed by the Partnership on the reports that it files or submits under the
Securities Exchange Act of 1934 (the “Exchange Act”) is recorded, processed, summarized and reported
within the time periods expected in the SEC’s rules and
forms. Disclosure controls and procedures include controls and procedures designed to ensure that
information required to be disclosed by the Partnership in the reports it files is accumulated and
communicated to management, including the Chief Executive Officer (“CEO”) and Chief Financial
Officer (“CFO”) of the General Partner, to allow for timely decisions regarding required disclosure
and appropriate SEC filings.
Management is responsible for ensuring that there is an adequate and effective process for
establishing, maintaining and evaluating disclosure controls and procedures for the Partnership’s
external disclosures.
The General Partner’s CEO and CFO have evaluated the effectiveness of the Partnership’s
disclosure controls and procedures (as defined in Rules 13a-15(e) and 15d-15(e) under the Exchange
Act) as of December 31, 2010 and, based on that evaluation, the General Partner’s CEO and CFO have
concluded that at that date the Partnership’s disclosure controls and procedures were effective.
The Partnership’s internal control over financial reporting is a process under the supervision
of the General Partner’s CEO and CFO to provide reasonable assurance regarding the reliability of
financial reporting and the preparation of financial statements in accordance with GAAP. These
controls include policies and procedures that:
| • | pertain to the maintenance of records that in reasonable detail accurately and fairly reflect the transactions and dispositions of the assets of the Partnership; | ||
| • | provide reasonable assurance that (i) transactions are recorded as necessary to permit preparation of financial statements in accordance with GAAP, and (ii) the Partnership’s receipts are handled and expenditures are made only pursuant to authorizations of the General Partner; and | ||
| • | provide reasonable assurance regarding prevention or timely detection of unauthorized acquisition, use or disposition of the Partnership’s assets that could have a material effect on the financial statements. |
The report included in “Item 8. Financial Statements and Supplementary Data.” includes
management’s report on internal control over financial reporting (“Management’s Report”).
There were no changes in the Partnership’s internal control over financial reporting during
the fiscal quarter ended December 31, 2010 that materially affected, or are reasonably likely to
materially affect, the Partnership’s internal control over financial reporting.
Item 9B. Other Information
None.
40
PART III
Item 10. Directors, Executive Officers and Corporate Governance.
The
Partnership has no officers, directors or employees and its affairs are managed by its General
Partner. Investment decisions are made by the Advisors.
The officers and directors of the General Partner are Walter Davis (President and Chairman of
the Board of Directors), Jennifer Magro (Chief Financial Officer and Director), Michael McGrath
(Director), Douglas J. Ketterer (Director), Ian Bernstein (Director), Harry Handler (Director),
Patrick T. Egan (Director) and Alper Daglioglu (Director). Each director of the General Partner holds office until the
earlier of his or her death, resignation or removal. Vacancies on the board of directors may be
filled by either (i) the majority vote of the remaining directors or (ii) Morgan Stanley Smith
Barney Holdings LLC, as the sole member of the General Partner. The officers of the General
Partner are designated by the General Partner’s board of directors. Each officer will hold office
until his or her successor is designated and qualified or until his or her death, resignation or
removal.
Walter
Davis, age 46, is President and Chairman of the Board of Directors of the General
Partner (since June 2010). Mr. Davis was registered as an associated person of the General Partner
and listed as a principal in June 2010. Mr. Davis is responsible for the oversight of the General
Partner’s funds and accounts. Prior to the combination of Demeter Management LLC (“Demeter”) and the General Partner
effective December 1, 2010, Mr. Davis served as Chairman of the Board of Directors and President of
Demeter, a registered commodity pool operator. Mr. Davis was a principal and associated person of
Demeter from May 2006 to December 2010 and July 2006 to December 2010, respectively. Mr. Davis was
an associated person of Morgan Stanley DW Inc., a financial services firm, from August 2006 to
April 2007, when, because of the merger of Morgan Stanley DW Inc. into Morgan Stanley & Co. Incorporated (“MS & Co.”), a global financial
services firm, he became an associated person of MS & Co. (due to the transfer of his original
registration as an associated person of Morgan Stanley DW Inc.). Prior to becoming an associated
person in August 2006, Mr. Davis was responsible for overseeing the sales and marketing of MS &
Co.’s managed futures funds to high net worth and institutional investors on a global basis. Mr.
Davis withdrew as an associated person of MS & Co. in June 2009. Mr. Davis has been an associated
person of Morgan Stanley Smith Barney LLC since June 2009. Morgan Stanley Smith Barney LLC is
registered as a broker-dealer with FINRA, an investment adviser with the SEC and a futures
commission merchant with the CFTC. Mr. Davis is a Managing Director of Morgan Stanley Smith Barney
LLC and the Director of Morgan Stanley Smith Barney LLC’s Managed Futures Department. Prior to
joining Morgan Stanley in September 1999, Mr. Davis worked for Chase Manhattan Bank’s Alternative
Investment Group from January 1992 until September 1999, where his principal duties included
marketing managed futures funds to high net worth investors, as well as developing and structuring
managed futures funds. Throughout his career, Mr. Davis has been involved with the development,
management and marketing of a diverse array of commodity pools, hedge funds and other alternative
investment vehicles. Mr. Davis received an MBA in Finance and International Business from the
Columbia University Graduate School of Business in 1992 and a BA in Economics from the University
of the South in 1987.
Jennifer Magro, age 39, is Chief Financial Officer and Director of the General Partner (since
October 2006 and May 2005, respectively). Ms. Magro was listed as a principal in June 2005. Ms.
Magro served as Vice President and Secretary of the General Partner from August 2001 to December
2010 and June 2010 to December 2010, respectively. She was also a Managing Director of Citi
Alternative Investments (“CAI”), a division of Citigroup that administered its hedge fund and fund
of funds business, and was Chief Operating Officer of CAI’s Hedge Fund Management Group from
October 2006 to July 2009. Ms. Magro is responsible for the financial, administrative and
operational functions of the General Partner. She is also responsible for the accounting and
financial and regulatory reporting of the General Partner’s managed futures funds. From March 1999
to July 2009, Ms. Magro was responsible for the accounting and financial and regulatory reporting
of Citigroup’s managed futures funds. She had similar responsibilities with CAI’s Hedge Fund
Management Group (from October 2006 to July 2009). Prior to joining the General Partner in January
1996, Ms. Magro was employed by Prudential Securities Inc., a securities brokerage services
company, (from July 1994) as a staff accountant whose duties included the calculation of net asset
values for commodity pools and real estate investment products. Ms. Magro received a BS in
Accounting from the State University of New York, Oswego in 1993.
Michael McGrath, age 41, has been a Director of the General Partner since June 2010. Mr.
McGrath was listed as a principal in June 2010. Mr. McGrath was a principal and Director of
Demeter from May 2006 until Demeter’s combination with the General Partner in December 2010. Mr.
McGrath is a Managing Director of Morgan Stanley Smith Barney LLC and currently serves as the Head
of Alternative Investments for the Global Wealth Management Group of Morgan Stanley Smith Barney
LLC. He also serves on
41
the Management Committee of the Global Wealth Management Group. Prior to his current role,
Mr. McGrath served as the Director of Product Management for the Consulting Services Group in
Morgan Stanley as well as the Chief Operating Officer for Private Wealth Management North America
and Private Wealth Management Latin America (the Americas) and the Director of Product Development
for Morgan Stanley’s Global Wealth Management Group. Mr. McGrath served as a Managing Director of
Morgan Stanley from May 2004 until May 2009, when Mr. McGrath became a Managing Director of Morgan
Stanley Smith Barney LLC. Mr. McGrath joined Morgan Stanley from Nuveen Investments, a publicly
traded investment management company headquartered in Chicago, Illinois, where he worked from July
2001 to May 2004. At Nuveen Investments, Mr. McGrath served as a Managing Director and oversaw the
development of alternative investment products catering to high net worth investors. Mr. McGrath
received his BA degree from Saint Peters College in 1990, and currently serves on the school’s
Board of Regents. He received his MBA in Finance from New York University in 1996.
Douglas J. Ketterer, age 45, has been a Director of the General Partner since December 2010.
Mr. Ketterer was listed as a principal in December 2010. Mr. Ketterer was a principal of Demeter
from October 2003 until Demeter’s combination with the General Partner in December 2010. Mr.
Ketterer is a Managing Director and Head of the U.S. Private Wealth Management Group within Morgan
Stanley Smith Barney LLC. Mr. Ketterer joined MS & Co. in March 1990 and has served in many roles
in the corporate finance/investment banking, asset management, and wealth management divisions of
the firm; most recently as Chief Operating Officer, Wealth Management Group and Head of the
Products Group with responsibility for a number of departments (including, among others, the
Alternative Investments Group, Consulting Services Group, Annuities & Insurance Department and
Retirement & Equity Solutions Group) which offered products and services through MS & Co.’s Global
Wealth Management Group. Mr. Ketterer received his MBA from New York University’s Leonard N. Stern
School of Business and his BS in Finance from the University at Albany’s School of Business.
Ian Bernstein, age 48, is a Director of the General Partner. Mr. Bernstein has been a
Director, and listed as a principal of the General Partner since December 2010. Mr. Bernstein held
various positions, including Managing Director, within the Capital Markets group at Morgan Stanley
DW Inc. from October 1984 to April 2007, when Morgan Stanley DW Inc. was merged into, its
institutional affiliate, MS & Co. and became the Global Wealth Management Division of MS & Co. Mr.
Bernstein first served as a Managing Director with MS & Co. in March 2004, prior to its merger with
Morgan Stanley DW Inc. Since June 1, 2009, Mr. Bernstein has served as a Managing Director of
Capital Markets at Morgan Stanley Smith Barney LLC, a new broker-dealer formed as a result of a
joint venture between Citigroup and Morgan Stanley. The respective retail business of MS & Co. and
Citigroup (formerly known as Smith Barney) was contributed to Morgan Stanley Smith Barney LLC. Mr.
Bernstein has continued as Managing Director of both Morgan Stanley Smith Barney LLC, the retail
broker-dealer, and MS & Co., the institutional broker-dealer, up to the present. Mr. Bernstein
received his MBA from New York University’s Leonard N. Stern School of Business in 1988, and his BA
from the University of Buckingham in 1980.
Harry Handler, age 51, has been a Director of the General Partner since December 2010. Mr.
Handler became registered as an associated person of the General Partner and listed as a principal
in December 2010. Mr. Handler was a principal and associated person of Demeter from May 2005 until
Demeter’s combination with the General Partner in December 2010, and from April 2006 until December
2010, respectively. He has been an associate member of the NFA since August 1985. Mr. Handler was
an associated person of Morgan Stanley DW Inc., a financial services firm, from February 1984 to
April 2007, when, because of the merger of Morgan Stanley DW Inc. into MS & Co., he became an
associated person of MS & Co. due to the transfer of his original registration as an associated
person of Morgan Stanley DW Inc. Mr. Handler withdrew as an associated person of MS & Co. in June
2009. Mr. Handler has been an associated person of Morgan Stanley Smith Barney LLC since June
2009. Mr. Handler serves as an Executive Director at Morgan Stanley Smith Barney LLC in the Global
Wealth Management Group. Mr. Handler works in the Capital Markets Division and is responsible for
Electronic Equity and Securities Lending. Additionally, Mr. Handler serves as Chairman of the
Global Wealth Management Group’s Best Execution Committee. In his prior position, Mr. Handler was
a Systems Director in Information Technology, in charge of Equity and Fixed Income Trading Systems
along with the Special Products, such as Unit Trusts, Managed Futures, and Annuities. Prior to his
transfer to the Information Technology Area, Mr. Handler managed the Foreign Currency and Precious
Metals Trading Desk of Dean Witter, a financial services firm and predecessor company to Morgan
Stanley, from July 1982 until January 1984. He also held various positions in the Futures Division
where he helped to build the Precious Metals Trading Operation at Dean Witter. Before joining Dean
Witter, Mr. Handler worked at Mocatta Metals, a precious metals trading firm and futures broker
that was sold to Standard Charted Bank in the 1980’s, as an Assistant to the Chairman from March
1980 until June 1982. His roles at Mocatta Metals included positions on the Futures Order Entry
Desk and the Commodities Exchange Trading Floor. Additional work included building a computerized
Futures Trading System and writing a history of the company. Mr. Handler
42
graduated on the Dean’s List from the University of Wisconsin-Madison with a BA degree and a
double major in History and Political Science.
Patrick T. Egan, age 41, has been a Director of the General Partner since December 2010. Mr.
Egan became registered as an associated person of the General Partner and listed as a principal in
December 2010. Mr. Egan has been an associate member of the NFA since December 1997. He has been
an associated person of Morgan Stanley Smith Barney LLC since November 2010. Mr. Egan was an
associated person of Morgan Stanley DW Inc., a financial services firm, from February 1998 to April
2007, when, because of the merger of Morgan Stanley DW Inc. into MS & Co., he became an associated
person of MS & Co. due to the transfer of his original registration as an associated person of
Morgan Stanley DW Inc. Mr. Egan withdrew as an associated person of MS & Co. in November 2010.
Mr. Egan is an Executive Director at Morgan Stanley Smith Barney LLC and currently serves as the
Co- Chief Investment Officer for Morgan Stanley Smith Barney LLC’s Managed Futures Department.
Prior to his current role, Mr. Egan served as the Head of Due Diligence & Manager Research for
Morgan Stanley’s Managed Futures Department from October 2003 until the formation of Morgan Stanley
Smith Barney LLC in June 2009. From March 1993 through September 2003, Mr. Egan was an analyst and
manager within the Managed Futures Department for Morgan Stanley DW Inc., and its predecessor firm,
Dean Witter Reynolds, Inc., a financial services firm, with his primary responsibilities being
dedicated to the product development, due diligence, investment analysis and risk management of the
firm’s commodity pools. Mr. Egan began his career in August 1991, joining Dean Witter
Intercapital, the asset management arm of Dean Witter Reynolds, Inc., until March 1993 when he
joined the firm’s Managed Futures Department. Mr. Egan received a Bachelor of Business
Administration with a concentration in Finance from the University of Notre Dame in May 1991. Mr.
Egan is a former Director to the Managed Funds Association’s Board of Directors, a position he was
elected to by industry peers for two consecutive two-year terms, from November 2004 to October 2006
and November 2006 to October 2008.
Alper Daglioglu, age 33, has been a Director, and listed as a principal of the General Partner
since December 2010. Mr. Daglioglu is an Executive Director at Morgan Stanley Smith Barney LLC and
the Co-Chief Investment Officer for Morgan Stanley Smith Barney LLC’s Managed Futures Department.
Mr. Daglioglu also serves on the Alternative Investments Product Review Committee of Morgan Stanley
Smith Barney LLC’s Alternative Investments Group. Prior to his current role, Mr. Daglioglu was a
Senior Analyst at the Product Origination Group within Morgan Stanley Managed Futures Department
from December 2003 until the formation of Morgan Stanley Smith Barney LLC in June 2009. In
addition to his responsibilities within Managed Futures Department, Mr. Daglioglu was also the lead
investment analyst for Global Macro and Managed Futures strategies within Morgan Stanley Graystone
Research Group from February 2007 to June 2009. Mr. Daglioglu served as a consultant at the
Product Origination Group within Morgan Stanley Managed Futures Department from June 2003 to
November 2003. Mr. Daglioglu received a BS degree in Industrial Engineering from Galatasaray
University in June 2000 and a MBA degree in Finance from the University of Massachusetts-Amherst’s
Isenberg School of Management in May 2003. Mr. Daglioglu was awarded a full merit scholarship and
research assistantship at the Center for International Securities and Derivatives Markets during
his graduate studies. In this capacity, he worked with various major financial institutions in
performance monitoring, asset allocation and statistical analysis projects and specialized on
alternative approaches to risk assessment for hedge funds and managed futures. Mr. Daglioglu wrote
and published numerous research papers on alternative investments. Mr. Daglioglu is a Chartered
Alternative Investment Analyst charterholder.
The Partnership has not adopted a code of ethics that applies to officers because it has no
officers. In addition, the Partnership has not adopted any procedures by which investors may
recommend nominees to the Partnership’s board of directors, and has not established an audit
committee because it has no board of directors.
Item 11. Executive Compensation.
The Partnership has no directors or officers. Its affairs are managed by Ceres Managed Futures
LLC, its General Partner. CGM, an affiliate of the General Partner, is the commodity broker for the
Partnership and receives brokerage fees for such services, as described under “Item 1.
Business.” Brokerage fees and clearing fees of $2,687,495 were earned by CGM for the year
ended December 31, 2010. Management fees of $707,831 (net of
management fees waived of $70,253) were earned by the Advisor for the year ended
December 31, 2010. There were no incentive fees earned by the Advisor for the year ended December
31, 2010. The Advisor will not be paid incentive fees until the Advisor recovers the net loss
incurred and earns additional new trading profits for the Partnership.
Item 12. Security Ownership of Certain Beneficial Owners and Management and Related Stockholder Matters.
(a) Security ownership of certain beneficial owners. As of February 28, 2011, the
Partnership knows no person who beneficially owns more than five percent (5%) of the Redeemable
Units outstanding.
43
(b) Security ownership of management. Under the terms of the Limited Partnership
Agreement, the Partnership’s affairs are managed by the General Partner.
The following table indicates securities owned by management as of December 31, 2010:
| (3) Amount and | ||||||||||||
| (2) Name of | Nature of | |||||||||||
| Beneficial | Beneficial | (4) Percent of | ||||||||||
| (1) Title of Class | Owner | Ownership | Class | |||||||||
General Partner unit equivalents |
General Partner | 281.2556 | 1.3 | % | ||||||||
(c) Changes in control. None.
Item 13. Certain Relationships and Related Transactions, and Director Independence.
(a) Transactions with related persons. None.
(b) Review, approval or ratification of transactions with related persons. Not applicable.
(c) Promoters and certain control persons.
CGM and the General Partner would be considered promoters for purposes of item 404(d) of
Regulation S-K. The nature and the amounts of compensation each promoter will receive, if any, from
the Partnership are set forth under “Item 1. Business” and “Item 11. Executive
Compensation.”
Item 14. Principal Accountant Fees and Services.
(1) Audit Fees. The
aggregate fees billed for each of the last two fiscal years for
professional services rendered by Deloitte in the year ended December 31,
2010 and the period from July 23, 2009 through December 31, 2009, PwC in the period from January 1, 2009 through July 22, 2009 for the audit of the Partnership’s
annual financial statements, review of financial statements included in the Partnership’s Forms
10-Q and 10-K and other services normally provided in connection with regulatory filings or
engagements were:
Deloitte |
PwC |
|||||||
2010 |
$ | 45,000 | N/A | |||||
2009 |
$ | 76,900 | (1) | $ | 9,400 | (2) | ||
(1) For the period July 23, 2009 to December 31, 2009.
(2) For the period January 1, 2009 to July 22, 2009.
(2) Audit-Related Fees. None
(3) Tax Fees. In the last two fiscal years, Deloitte did not provide any professional
services for tax compliance, tax advice or tax planning. The aggregate fees billed for each of the
last two fiscal years for professional services rendered by PwC for tax compliance and tax advice
given in the preparation of the Partnership’s Schedule K1s, the preparation of the Partnership’s
Form 1065 and preparation of all State Tax Returns were:
2010
|
$ | 21,000 | ||
2009
|
$ | 20,000 |
(4) All Other Fees. None.
(5) Not Applicable.
(6) Not Applicable.
44
PART IV
Item 15.
Exhibits, Financial Statement Schedules.
(a) (1) Financial Statements:
Statements of Financial Condition at December 31, 2010 and 2009.
Condensed Schedules of Investments at December 31, 2010 and 2009.
Statements of Income and Expenses for the years ended December 31, 2010, 2009 and 2008.
Statements of Changes in Partners’ Capital for the years ended December 31, 2010, 2009 and
2008.
Notes to Financial Statements.
(2) Exhibits:
3.1
|
Second Amended and Restated Limited Partnership Agreement (filed as Exhibit 3.2 to the general form for registration of securities on Form 10 filed on April 30, 2007 and incorporated herein by reference). | ||
3.2
|
Certificate of Limited Partnership of the Partnership as filed in the office of the Secretary of State of the State of the State of New York (filed as Exhibit 3.1 to the general form for registration of securities on Form 10 filed on April 30, 2007 and incorporated herein by reference). | ||
(a)
|
Certificate of Amendment of the Certificate of Limited Partnership as filed in the office of the Secretary of State of the State of New York, dated February 26, 1999 (filed as Exhibit 3.1(a) to the general form for registration of securities on Form 10 filed on April 30, 2007 and incorporated herein by reference). | ||
(b)
|
Certificate of Amendment of the Certificate of Limited Partnership as filed in the office of the Secretary of State of the State of New York, dated April 1, 2001 (filed as Exhibit 3.1(b) to the general form for registration of securities on Form 10 filed on April 30, 2007 and incorporated herein by reference). | ||
(c)
|
Certificate of Amendment of the Certificate of Limited Partnership as filed in the office of the Secretary of State of the State of New York, dated May 21, 2003 (filed as Exhibit 3.2(c) to the quarterly report on Form 10-Q filed on November 16, 2009 and incorporated herein by reference). | ||
(d)
|
Certificate of Amendment of the Certificate of Limited Partnership as filed in the office of the Secretary of State of the State of New York, dated September 21, 2005 (filed as Exhibit 3.1(c) to the general form for registration of securities on Form 10 filed on April 30, 2007 and incorporated herein by reference). | ||
(e)
|
Certificate of Amendment of the Certificate of Limited Partnership as filed in the office of the Secretary of State of the State of New York, dated September 19, 2008 (filed as Exhibit 3.2(e) to the quarterly report on Form 10-Q filed on November 16, 2009 and incorporated herein by reference). | ||
(f)
|
Certificate of Amendment of the Certificate of Limited Partnership as filed in the office of the Secretary of State of the State of New York, dated September 30, 2009 (filed as Exhibit 99.1(a) to current report on Form 8-K filed on September 30, 2009 and incorporated herein by reference). | ||
(g)
|
Certificate of Change of the Certificate of Limited Partnership as filed in the office of the Secretary of State of the State of New York, dated January 31, 2000 (filed as Exhibit 3.2(g) to the quarterly report on Form 10-Q filed on November 16, 2009 and incorporated herein by reference). | ||
(h)
|
Certificate of Amendment of the Certificate of Limited Partnership dated June 30, 2010 (filed as Exhibit 3.2(h) to the Current Report on Form 8-K filed on July 2, 2010 and incorporated herein by reference). | ||
10.1
|
Amended and Restated Management Agreement among the Partnership, the General Partner and Chesapeake Capital Corporation (filed as Exhibit 10.1 on Form 8-K filed on September 16, 2010 and incorporated herein by reference). | ||
10.1(a)
|
Letter extending the Management Agreement between the General Partner and Chesapeake Capital Corporation for 2010 (filed herein). |
45
10.2
|
Second Amended and Restated Customer Agreement between the Partnership and Salomon Smith Barney Inc. (filed as Exhibit 10.2 to the general form for registration of securities on Form 10 filed on April 30, 2007 and incorporated herein by reference). | ||
10.3
|
Amended and Restated Agency Agreement between the Partnership, Smith Barney Futures Management LLC and Salomon Smith Barney Inc. (filed as Exhibit 10.3 to the general form for registration of securities on Form 10 filed on April 30, 2007 and incorporated herein by reference). | ||
10.4
|
Form of Subscription Agreement (filed as Exhibit 10.4 to the quarterly report on Form 10-Q filed on November 16, 2009 and incorporated herein by reference). | ||
10.5
|
Joinder Agreement among Citigroup Managed Futures LLC (the former name of the General Partner), Citigroup Global Markets Inc. and Morgan Stanley Smith Barney LLC (filed as Exhibit 10 to the quarterly report on Form 10-Q filed on August 14, 2009). | ||
16.1(a)
|
Letter Regarding Change of Certifying Accountant (filed as Exhibit 16.1 on Form 8-K filed on July 24, 2009 and incorporated herein by reference). | ||
16.1(b)
|
Letter Regarding Change of Certifying Accountant (filed as Exhibit 16.1 on Form 8-K filed on July 1, 2008 and incorporated herein by reference). |
The exhibits required to
be filed by Item 601 of regulation S-K are incorporated herein by
reference.
Exhibit 31.1 —
Rule 13a-14(a)/15d-14(a) Certification (Certification of
President and Director).
Exhibit 31.2
— Rule 13a-14(a)/15d-14(a) Certification (Certification of Chief
Financial Officer and Director).
Exhibit 32.1 —
Section 1350 Certification (Certification of President and
Director).
Exhibit 32.2 —
Section 1350 Certification (Certification of Chief Financial Officer and
Director).
46
SIGNATURES
Pursuant to the requirements of Section 13 or 15(d) of the Securities Exchange Act of 1934,
the registrant has duly caused this report to be signed on its behalf by the undersigned, thereunto
duly authorized.
|
Tidewater Futures Fund L.P. |
||||
| By: | Ceres Managed Futures LLC | |||
| (General Partner) | ||||
| By: | /s/ Walter Davis | |||
| Walter Davis, President & Director |
||||
| Date: March 31, 2011 | ||||
Pursuant to the requirements of the Securities Exchange Act of 1934, this report has been
signed below by the following persons on behalf of the Registrant and in the capacities and on the
date indicated.
/s/ Walter Davis
|
/s/ Michael McGrath
|
/s/ Patrick T. Egan
|
|||
President
and Director Ceres Managed Futures LLC Date: March 31, 2011 |
Director Ceres Managed Futures LLC Date: March 31, 2011 |
Director Ceres Managed Futures LLC Date: March 31, 2011 |
|||
/s/ Jennifer Magro
|
/s/ Douglas J. Ketterer | /s/ Alper Daglioglu | |||
Jennifer Magro
|
Douglas J. Ketterer | Alper Daglioglu | |||
Chief
Financial Officer and Director (Principal Accounting Officer) Ceres Managed Futures LLC Date: March 31, 2011 |
Director Ceres Managed Futures LLC Date: March 31, 2011 |
Director Ceres Managed Futures LLC Date: March 31, 2011 |
|||
/s/ Ian Bernstein
|
/s/ Harry Handler | ||||
Ian Bernstein
|
Harry Handler | ||||
Director Ceres Managed Futures LLC Date: March 31, 2011 |
Director Ceres Managed Futures LLC Date: March 31, 2011 |
||||
Supplemental Information to be Furnished With Reports Filed Pursuant to Section 15(d) of the
Act by Registrants Which Have Not Registered Securities Pursuant to Section 12 Of the Act.
Annual Report to Limited Partners
No proxy material has been sent to Limited Partners.
47