Attached files
The Savannah Bancorp, Inc. and Subsidiaries
Financial Statement Section
Index
Page
Number
|
Index to Financial Statement Section
|
F-1
|
|
Report of Independent Registered Public Accounting Firm
|
F-2
|
|
Consolidated Balance Sheets
|
|
|
December 31, 2010 and 2009
|
F-3
|
|
Consolidated Statements of Operations for the Years
|
|
|
Ended December 31, 2010, 2009 and 2008
|
F-4
|
|
Consolidated Statements of Changes in Shareholders'
|
|
|
Equity for the Years Ended December 31, 2010, 2009 and 2008
|
F-5
|
|
Consolidated Statements of Cash Flows for the Years
|
|
|
Ended December 31, 2010, 2009 and 2008
|
F-6
|
|
Notes to Consolidated Financial Statements
|
F-7
|
|
Management’s Discussion and Analysis of Financial
|
|
|
Condition and Results of Operations
|
F-33
|
|
Selected Five-Year Financial Data – 2006-2010
|
|
|
Selected Financial Condition Highlights
|
F-33
|
|
Selected Operating Highlights
|
F-34
|
|
Selected Quarterly Data
|
F-35
|
|
Market for Registrant's Common Equity and
|
|
|
Related Shareholder Matters
|
F-35
|
|
Stock Performance Graph
|
F-36
|
|
Introduction
|
F-37
|
|
Critical Accounting Estimates
|
F-38
|
|
Results of Operations
|
|
|
2010 Compared with 2009
|
F-42
|
|
2009 Compared with 2008
|
F-43
|
|
Financial Condition and Capital Resources
|
F-44
|
| Loan Concentrations | F-44 |
| Liquidity and Interest Rate Sensitivity Management | F-46 |
| Off-Balance Sheet Arrangements | F-46 |
| Forward Looking Statements | F-47 |
| Cash Flow/Maturity Gap and Repricing Data | F-48 |
| Average Balance Sheet and Rate/Volume Analysis – 2010 and 2009 | F-49 |
| Average Balance Sheet and Rate/Volume Analysis – 2009 and 2008 | F-50 |
F-1
The Savannah Bancorp, Inc. – 2010 Annual Report
Report of Independent Registered Public Accounting Firm
To the Board of Directors and Shareholders
of The Savannah Bancorp, Inc.:
We have audited the accompanying consolidated balance sheets of The Savannah Bancorp, Inc. and subsidiaries as of December 31, 2010 and 2009 and the related consolidated statements of operations, changes in shareholders’ equity and cash flows for each of the three years in the period ended December 31, 2010. These financial statements are the responsibility of the Company’s management. Our responsibility is to express an opinion on these consolidated financial statements based on our audits.
We conducted our audits in accordance with the standards of the Public Company Accounting Oversight Board (United States). Those standards require that we plan and perform the audit to obtain reasonable assurance about whether the financial statements are free of material misstatement. The Company is not required to have, nor were we engaged to perform, an audit of its internal control over financial reporting. Our audit included consideration of internal control over financial reporting as a basis for designing audit procedures that are appropriate in the circumstances, but not for the purpose of expressing an opinion on the effectiveness of the Company’s internal control over financial reporting. Accordingly, we express no such opinion. An audit also includes examining, on a test basis, evidence supporting the amounts and disclosures in the financial statements, assessing the accounting principles used and significant estimates made by management, as well as evaluating the overall financial statement presentation. We believe that our audits provide a reasonable basis for our opinion.
In our opinion, the consolidated financial statements referred to above present fairly, in all material respects, the consolidated financial position of The Savannah Bancorp, Inc. and its subsidiaries as of December 31, 2010 and 2009 and the results of its operations and its cash flows for each of the three years in the period ended December 31, 2010, in conformity with accounting principles generally accepted in the United States of America.
/s/ Mauldin & Jenkins, LLC
Albany, Georgia
March 25, 2011
F-2
The Savannah Bancorp, Inc. – 2010 Annual Report
The Savannah Bancorp, Inc. and Subsidiaries
Consolidated Balance Sheets
($ in thousands, except share data)
|
December 31,
|
|||
|
2010
|
2009
|
||
|
Assets
|
|||
|
Cash and due from banks
|
$ 17,990
|
$ 19,253
|
|
|
Federal funds sold
|
110
|
8,575
|
|
|
Interest-bearing deposits in banks
|
40,836
|
12,707
|
|
|
Cash and cash equivalents
|
58,936
|
40,535
|
|
|
Securities available for sale, at fair value (amortized
|
|||
|
cost of $136,980 and $86,596)
|
138,099
|
87,919
|
|
|
Loans, net of allowance for loan losses of $20,350
and $17,678
|
806,212
|
866,208
|
|
|
Premises and equipment, net
|
15,056
|
15,574
|
|
|
Other real estate owned
|
13,199
|
8,329
|
|
|
Bank-owned life insurance
|
6,309
|
6,434
|
|
|
Goodwill and other intangible assets, net
|
3,786
|
2,498
|
|
|
Other assets
|
25,333
|
23,011
|
|
|
Total assets
|
$ 1,066,930
|
$ 1,050,508
|
|
|
Liabilities
|
|||
|
Deposits:
|
|||
|
Noninterest-bearing
|
$ 95,725
|
$ 82,557
|
|
|
Interest-bearing demand
|
140,531
|
143,559
|
|
|
Savings
|
20,117
|
16,893
|
|
|
Money market
|
265,840
|
228,124
|
|
|
Time deposits
|
401,532
|
413,436
|
|
|
Total deposits
|
923,745
|
884,569
|
|
|
Short-term borrowings
|
15,075
|
23,553
|
|
|
Other borrowings
|
10,536
|
15,988
|
|
|
Federal Home Loan Bank advances
|
17,658
|
31,664
|
|
|
Subordinated debt to nonconsolidated subsidiaries
|
10,310
|
10,310
|
|
|
Other liabilities
|
3,803
|
5,398
|
|
|
Total liabilities
|
981,127
|
971,482
|
|
|
Commitments and contingencies (Notes 17 and 20)
|
|||
|
Shareholders' equity
|
|||
|
Preferred stock, par value $1 per share:
|
|||
|
authorized 10,000,000 shares, none issued
|
-
|
-
|
|
|
Common stock, par value $1 per share: shares authorized
|
|||
|
20,000,000, issued 7,201,346 and 5,933,789
|
7,201
|
5,934
|
|
|
Additional paid-in capital
|
48,634
|
38,605
|
|
|
Retained earnings
|
29,275
|
33,383
|
|
|
Treasury stock, at cost, 2,483 and 1,443 shares
|
(1)
|
(4)
|
|
|
Accumulated other comprehensive income, net
|
694
|
1,108
|
|
|
Total shareholders' equity
|
85,803
|
79,026
|
|
|
Total liabilities and shareholders' equity
|
$ 1,066,930
|
$ 1,050,508
|
|
The accompanying notes are an integral part of these consolidated financial statements.
F-3
The Savannah Bancorp, Inc. – 2010 Annual Report
The Savannah Bancorp, Inc. and Subsidiaries
Consolidated Statements of Operations
($ in thousands, except per share data)
|
For the Years Ended December 31,
|
|||||
|
2010
|
2009
|
2008
|
|||
|
Interest and dividend income
|
|||||
|
Loans, including fees
|
$ 45,001
|
$ 47,081
|
$ 53,259
|
||
|
Loans held for sale
|
-
|
-
|
60
|
||
|
Investment securities:
|
|||||
|
Taxable
|
2,401
|
3,220
|
2,803
|
||
|
Tax-exempt
|
313
|
154
|
87
|
||
|
Dividends
|
47
|
45
|
191
|
||
|
Deposits with banks
|
147
|
45
|
149
|
||
|
Federal funds sold
|
20
|
18
|
133
|
||
|
Total interest and dividend income
|
47,929
|
50,563
|
56,682
|
||
|
Interest expense
|
|||||
|
Deposits
|
12,460
|
16,454
|
21,842
|
||
|
Short-term and other borrowings
|
1,138
|
1,045
|
596
|
||
|
Federal Home Loan Bank advances
|
458
|
397
|
1,359
|
||
|
Subordinated debt
|
306
|
362
|
642
|
||
|
Total interest expense
|
14,362
|
18,258
|
24,439
|
||
|
Net interest income
|
33,567
|
32,305
|
32,243
|
||
|
Provision for loan losses
|
21,020
|
13,065
|
6,000
|
||
|
Net interest income after provision for loan losses
|
12,547
|
19,240
|
26,243
|
||
|
Noninterest income
|
|||||
|
Trust and asset management fees
|
2,599
|
2,351
|
2,832
|
||
|
Service charges on deposit accounts
|
1,788
|
1,809
|
1,881
|
||
|
Mortgage related income, net
|
398
|
432
|
295
|
||
|
Gain on sale of securities
|
608
|
2,119
|
163
|
||
|
Gain on hedges
|
2
|
873
|
1,288
|
||
|
Other operating income
|
1,916
|
1,238
|
1,216
|
||
|
Total noninterest income
|
7,311
|
8,822
|
7,675
|
||
|
Noninterest expense
|
|||||
|
Salaries and employee benefits
|
11,948
|
12,146
|
13,584
|
||
|
Occupancy and equipment
|
3,945
|
3,716
|
3,884
|
||
|
Information technology
|
2,101
|
1,810
|
1,633
|
||
|
FDIC deposit insurance
|
1,688
|
1,886
|
653
|
||
|
Amortization of intangibles
|
171
|
144
|
144
|
||
|
Loss on sale and write-downs of foreclosed assets
|
2,472
|
2,566
|
228
|
||
|
Other operating expense
|
4,652
|
4,710
|
4,616
|
||
|
Total noninterest expense
|
26,977
|
26,978
|
24,742
|
||
|
Income (loss) before income taxes
|
(7,119)
|
1,084
|
9,176
|
||
|
Income tax expense (benefit)
|
(3,130)
|
155
|
3,170
|
||
|
Net income (loss)
|
$ (3,989)
|
$ 929
|
$ 6,006
|
||
|
Net income (loss) per share:
|
|||||
|
Basic
|
$ (0.60)
|
$ 0.16
|
$ 1.01
|
||
|
Diluted
|
$ (0.60)
|
$ 0.16
|
$ 1.01
|
||
|
Dividends per share
|
$ 0.02
|
$ 0.185
|
$ 0.50
|
||
|
Average basic shares (000s)
|
6,625
|
5,933
|
5,930
|
||
|
Average diluted shares (000s)
|
6,625
|
5,936
|
5,947
|
||
|
The accompanying notes are an integral part of these consolidated financial statements.
|
F-4
The Savannah Bancorp, Inc. – 2010 Annual Report
The Savannah Bancorp, Inc. and Subsidiaries
Consolidated Statements of Changes in Shareholders' Equity
($ in thousands, except share data)
|
For the Years Ended December 31,
|
|||
|
2010
|
2009
|
2008
|
|
|
Common shares issued
|
|||
|
Shares, beginning of year
|
5,933,789
|
5,933,789
|
5,923,797
|
|
Common stock issued
|
1,267,557
|
-
|
6,211
|
|
Exercise of options
|
-
|
-
|
3,781
|
|
Shares, end of year
|
7,201,346
|
5,933,789
|
5,933,789
|
|
Treasury shares owned
|
|||
|
Shares, beginning of year
|
1,443
|
318
|
318
|
|
Treasury stock issued
|
(943)
|
-
|
-
|
|
Unredeemed common stock
|
36
|
-
|
-
|
|
Unvested restricted stock
|
1,947
|
1,125
|
-
|
|
Shares, end of year
|
2,483
|
1,443
|
318
|
|
Common stock
|
|||
|
Balance, beginning of year
|
$ 5,934
|
$ 5,934
|
$ 5,924
|
|
Common stock issued
|
1,267
|
-
|
6
|
|
Exercise of options
|
-
|
-
|
4
|
|
Balance, end of year
|
7,201
|
5,934
|
5,934
|
|
Additional paid-in capital
|
|||
|
Balance, beginning of year
|
38,605
|
38,516
|
38,279
|
|
Common stock issued, net of issuance costs
|
9,980
|
-
|
68
|
|
Stock-based compensation expense, net
|
49
|
89
|
137
|
|
Exercise of options
|
-
|
-
|
32
|
|
Balance, end of year
|
48,634
|
38,605
|
38,516
|
|
Retained earnings
|
|||
|
Balance, beginning of year
|
33,383
|
33,552
|
30,512
|
|
Net income (loss)
|
(3,989)
|
929
|
6,006
|
|
Dividends paid
|
(119)
|
(1,098)
|
(2,966)
|
|
Balance, end of year
|
29,275
|
33,383
|
33,552
|
|
Treasury stock
|
|||
|
Balance, beginning of year
|
(4)
|
(4)
|
(4)
|
|
Treasury stock issued
|
3
|
-
|
-
|
|
Balance, end of year
|
(1)
|
(4)
|
(4)
|
|
Accumulated other comprehensive income, net
|
|||
|
Balance, beginning of year
|
1,108
|
2,934
|
1,561
|
|
Change in unrealized gains/losses on securities
|
|||
|
available for sale, net of reclassification adjustment
|
(127)
|
(531)
|
842
|
|
Change in fair value and gains on termination of
|
|||
|
derivative instruments, net of tax
|
(287)
|
(1,295)
|
531
|
|
Balance, end of year
|
694
|
1,108
|
2,934
|
|
Total shareholders' equity
|
$ 85,803
|
$ 79,026
|
$ 80,932
|
The accompanying notes are an integral part of these consolidated financial statements.
See Note 1 for other comprehensive income disclosures.
F-5
The Savannah Bancorp, Inc. – 2010 Annual Report
The Savannah Bancorp, Inc. and Subsidiaries
Consolidated Statements of Cash Flows
|
For the Years Ended December 31,
|
|||
|
($ in thousands)
|
2010
|
2009
|
2008
|
|
Operating activities
|
|||
|
Net income (loss)
|
$ (3,989)
|
$ 929
|
$ 6,006
|
|
Adjustments to reconcile net income (loss) to cash
|
|||
|
provided by operating activities:
|
|||
|
Provision for loan losses
|
21,020
|
13,065
|
6,000
|
|
Loans originated for sale
|
-
|
-
|
(10,255)
|
|
Proceeds from sale of loans originated for sale
|
-
|
291
|
10,202
|
|
Net amortization (accretion) of securities
|
1,922
|
432
|
(95)
|
|
Depreciation and amortization
|
1,454
|
1,513
|
1,383
|
|
Accretion of gain on termination of derivatives
|
(453)
|
(1,962)
|
(2,670)
|
|
Proceeds from termination of derivatives
|
-
|
1,299
|
3,225
|
|
Non cash stock-based compensation expense
|
79
|
144
|
221
|
|
(Increase) decrease in deferred income taxes, net
|
(1,759)
|
(1,748)
|
621
|
|
Gain on sale of loans and securities, net
|
(608)
|
(2,119)
|
(221)
|
|
Loss on sale and write-downs of foreclosed assets
|
2,472
|
2,566
|
228
|
|
Equity in net loss (income) of nonconsolidated subsidiary
|
50
|
(43)
|
(94)
|
|
Gain on sale of partnership interest
|
(255)
|
-
|
-
|
|
Increase in CSV of bank-owned life insurance policies
|
(183)
|
(218)
|
(231)
|
|
Decrease (increase) in prepaid FDIC deposit insurance assessment
|
1,545
|
(5,037)
|
-
|
|
(Increase) decrease in income taxes receivable/payable
|
(3,758)
|
1,068
|
59
|
|
Change in other assets and other liabilities, net
|
(1,965)
|
(673)
|
1,150
|
|
Net cash provided by operating activities
|
15,572
|
9,507
|
15,529
|
|
Investing activities
|
|||
|
Activity in available for sale securities
|
|||
|
Purchases
|
(100,897)
|
(88,741)
|
(44,616)
|
|
Sales
|
52,483
|
62,076
|
5,248
|
|
Maturities, calls and paydowns
|
22,547
|
21,203
|
20,420
|
|
Loan originations and principal collections, net
|
22,644
|
(35,442)
|
(71,955)
|
|
Proceeds from sale of foreclosed assets
|
9,120
|
5,048
|
3,852
|
|
Disposition of premises and equipment
|
-
|
305
|
-
|
|
Proceeds from life insurance and sale of partnership interest
|
1,002
|
-
|
-
|
|
Distribution from nonconsolidated subsidiary
|
-
|
-
|
350
|
|
Additions to premises and equipment
|
(765)
|
(6,141)
|
(5,516)
|
|
Net cash received from FDIC-assisted transaction
|
190,253
|
-
|
-
|
|
Net cash provided by (used in) investing activities
|
196,387
|
(41,692)
|
(92,217)
|
|
Financing activities
|
|||
|
Net increase (decrease) in noninterest-bearing deposits
|
4,837
|
(166)
|
(5,780)
|
|
Net (decrease) increase in interest-bearing deposits
|
(166,516)
|
52,720
|
73,577
|
|
Net (decrease) increase in short-term borrowings
|
(8,478)
|
(10,083)
|
13,037
|
|
Net (decrease) increase in other borrowings
|
(5,452)
|
3,837
|
12,151
|
|
Net decrease in FHLB advances
|
(29,006)
|
(505)
|
(20,804)
|
|
Payment on note payable
|
(74)
|
(86)
|
(1,840)
|
|
Dividends paid
|
(119)
|
(1,098)
|
(2,966)
|
|
Issuance of common stock, treasury stock and exercise of options
|
11,250
|
-
|
110
|
|
Net cash (used in) provided by financing activities
|
(193,558)
|
44,619
|
67,485
|
|
Increase (decrease) in cash and cash equivalents
|
18,401
|
12,434
|
(9,203)
|
|
Cash and cash equivalents, beginning of year
|
40,535
|
28,101
|
37,304
|
|
Cash and cash equivalents, end of year
|
$ 58,936
|
$ 40,535
|
$ 28,101
|
|
Supplemental disclosures of cash flow information
|
|||
|
Cash paid during the year for:
|
|||
|
Interest on deposits and other borrowings
|
$ 14,881
|
$ 18,826
|
$ 25,920
|
|
Income taxes
|
-
|
550
|
2,595
|
|
Non cash investing activity:
|
|||
|
Transfer to other real estate owned from loans
|
(16,462)
|
(7,843)
|
(10,068)
|
The accompanying notes are an integral part of these consolidated financial statements.
F - 6
The Savannah Bancorp, Inc. – 2010 Annual Report
Notes to Consolidated Financial Statements
________________________________________________________________________________________________________________
Note 1 - Organization and Summary of Significant Accounting Policies
Principles of Consolidation - The consolidated financial statements include the accounts of The Savannah Bancorp, Inc. (“the Company”) and its wholly-owned subsidiaries, The Savannah Bank, N.A. (“Savannah”), Bryan Bank & Trust (“Bryan”), and Minis & Co., Inc. (“Minis”), a registered investment advisory firm. The Company formed a new subsidiary, SAVB Holdings, LLC (“SAVB Holdings”), in the third quarter 2008 for the purpose of holding problems loans and other real estate. The two bank subsidiaries, together, are referred to as the “Subsidiary Banks”. All significant intercompany balances and transactions have been eliminated in consolidation. Certain prior year balances have been reclassified to conform to the current year presentation.
Nature of Operations - The Company is a bank holding company headquartered in Savannah, Georgia that owns two banks and a registered investment advisory firm. The Company has eleven banking offices and thirteen ATMs in Savannah, Garden City, Skidaway Island, Whitemarsh Island, Tybee Island, Pooler, and Richmond Hill, Georgia and Hilton Head Island and Bluffton, South Carolina. The Company also has mortgage lending offices in Savannah, Richmond Hill and Hilton Head Island and an investment management office in Savannah. Through the subsidiaries, the Company offers a full range of lending, deposit, residential mortgage origination, fiduciary, trust and investment advisory products. The primary service areas of the Company are Chatham County and Bryan County, Georgia and southern Beaufort County in South Carolina. In 2005, the Company formed a nonconsolidated subsidiary, SAVB Properties, LLC, which purchased a 50 percent interest in two real estate partnerships that own the Company’s headquarters building and the adjacent parking lot. This investment is accounted for using the equity method of accounting. The Company’s sold its interest in the parking lot in 2010.
Use of Estimates - In preparing consolidated financial statements in conformity with generally accepted accounting principles (“GAAP”) in the United States, management is required to make estimates and assumptions that affect the reported amounts of assets and liabilities as of the date of the balance sheet and reported amounts of revenues and expenses during the reporting period. Actual results could differ from those estimates. Material estimates that are particularly susceptible to significant change in the near term relate to the determination of the allowance for loan losses, the valuation of other real estate owned, fair value of financial instruments, other-than-temporary impairment analysis and the evaluation of the realization of deferred tax assets.
Cash and Cash Equivalents - For purposes of the consolidated statements of cash flows, cash and cash equivalents include cash and balances due from banks, federal funds sold and interest-bearing deposits in banks, all of which mature within ninety days.
Securities Available for Sale - Management has classified the entire investment securities portfolio as available for sale. Securities available for sale are carried at estimated fair value with unrealized gains and losses, net of deferred income taxes, recorded as a separate component of shareholders' equity. Purchase premiums and discounts are recognized in interest income using the interest method over the life of the securities. Gains and losses on the sale of securities are recorded on the trade date and are determined using the specific identification method.
A decline in the fair value of any available for sale security below cost, that is deemed other-than-temporary, results in a charge to earnings for the excess of cost over fair value which is attributed to credit quality. A new cost basis for the security is established upon recognition of other-than-temporary impairment.
Loans and Loan Fees - The Subsidiary Banks underwrite mortgage, commercial and consumer loans to customers. A substantial portion of the loan portfolio consists of real estate secured loans throughout the coastal Georgia and South Carolina areas. Loans that management has the intent and ability to hold for the foreseeable future or until maturity or pay-off are generally reported at their outstanding unpaid principal balances adjusted for charge-offs, the allowance for loan losses, and any deferred fees or origination costs. Interest income is accrued on the unpaid principal balance. Loan origination fees, net of certain direct origination costs, are deferred and recognized as an adjustment of the related loan yield on a straight-line basis, which approximates the interest method.
The accrual of interest on mortgage and commercial loans is discontinued at the time the loan is 90 days past due unless the credit is well-secured and in process of collection. Revolving credit loans and other personal loans are typically charged-off when payments are 120 days past due. Past due status is based on the contractual terms of the
F-7
The Savannah Bancorp, Inc. – 2010 Annual Report
Notes to Consolidated Financial Statements
________________________________________________________________________________________________________________
Note 1 - Organization and Summary of Significant Accounting Policies (continued)
loan. Loans are placed on nonaccrual status or charged-off at an earlier date if collection of principal or interest in full becomes doubtful. All interest accrued in the current year but not collected for loans that are placed on nonaccrual status or charged-off is reversed against interest income. The interest on these loans is accounted for on the cash-basis or cost-recovery method until qualifying for return to accrual. Loans are returned to accrual status when all the principal and interest amounts contractually due are brought current and future payments are reasonably assured.
A loan is considered impaired when, based on current information and events, it is probable that the Company will be unable to collect the scheduled payments of principal or interest when due according to the contractual terms of the loan agreement. Factors considered by management in determining impairment include payment status, collateral value, and the probability of collecting scheduled principal and interest payments when due. Loans that experience insignificant payment delays and payment shortfalls generally are not classified as impaired. Management determines the significance of payment delays and payment shortfalls on a case-by-case basis, taking into consideration all of the circumstances surrounding the loan and the borrower, including the length of the delay, the reasons for the delay, the borrower’s prior payment record, and the amount of the shortfall in relation to the principal and interest owed. Impairment is measured on a loan by loan basis by either the present value of expected future cash flows discounted at the loan’s effective interest rate, the loan’s obtainable market price, or the fair value of the collateral if the loan is collateral dependent. Management charges down the loan or establishes a valuation allowance when management determines the value is less than the carrying amount.
Allowance for Loan Losses - The allowance for loan losses is established through a provision for loan losses charged to earnings resulting from measurements of inherent credit risk in the loan portfolio and estimates of probable losses or impairments of individual loans. The adequacy of the allowance is based on management's continuing evaluation of the loan portfolio considering current economic conditions, underlying collateral value securing loans and other relevant qualitative and quantitative factors that deserve recognition in estimating loan losses. Actual future losses may be different from estimates due to unforeseen events. Loans that are determined to be uncollectible are charged-off against the allowance and subsequent recoveries, if any, are credited to the allowance.
The adequacy of the allowance for loan losses is evaluated on a regular basis by management and reported to and approved by the Audit Committee of the Board of Directors (“Board”) quarterly. The evaluation is based upon management’s periodic review of the collectability of specific loans, adverse situations that may affect specific borrowers’ ability to repay, the estimated value of any underlying collateral, the composition and size of the loan portfolio, emerging credit trends, regulatory guidance and prevailing economic conditions. In addition, on a regular basis, management and the Board review loan ratios. These ratios include the allowance for loan losses as a percentage of total loans, net charge-offs as a percentage of average loans, nonperforming loans as a percentage of total loans and the allowance coverage on nonperforming loans. Also, management reviews past due ratios by officer, Subsidiary Bank and the Company as a whole. This evaluation is inherently subjective as it requires estimates that are susceptible to significant revision as more information becomes available.
The Company has a number of documented loan policies and procedures that set forth the approval and monitoring process of the lending function. Adherence to these policies and procedures is monitored by management and the Board. A number of committees and an underwriting staff oversee the lending operations of the Company. These include the Board Loan Committee and Problem Asset Committee. Credit administration personnel monitor and, if necessary, adjust the grades assigned to loans through periodic examination. In addition, the Company contracts with an independent third party for loan review which reports to the Audit Committee of the Board.
In compliance with loan policy, the lending staff is given lending limits based on their knowledge and experience. Loan quality or “risk-rating” grades are assigned to each loan based upon certain factors. This information is used to assist management in monitoring the credit quality of the portfolio. Loan requests of amounts greater than an officer’s lending limits are reviewed by senior credit officers, in-house loan committees or the Board.
F - 8
The Savannah Bancorp, Inc. – 2010 Annual Report
Notes to Consolidated Financial Statements
________________________________________________________________________________________________________________
Note 1 - Organization and Summary of Significant Accounting Policies (continued)
Credit quality, adherence to policies and loss mitigation are major concerns of credit administration. Credit administration reviews and approves third-party appraisals obtained by the Company on real estate collateral and monitors loan maturities to ensure updated appraisals are obtained.
Our allowance for loan losses consists of two components, a general reserve and a specific reserve. For the general component, risk-rating grades are assigned by lending or credit administration, based on an analysis of the financial and collateral strength and other credit attributes underlying each loan. Loan grades range from 1 to 8, with 1 being loans with the least credit risk. Allowance factors established by management are applied to the total balance of loans in each grade to determine the amount needed in the allowance for loan losses. The allowance factors are established based on historical loss ratios experienced by the Company for these loan types, as well as the credit quality criteria underlying each grade, adjusted for trends and expectations about losses inherent in our existing portfolios. In making these adjustments to the allowance factors, management takes into consideration factors which it believes are causing, or are likely in the future to cause, losses within our loan portfolio but which may not be fully reflected in our historical loss ratios. Allowance factors established by management are then multiplied by loan balances for each grade or homogeneous portfolio of loans to determine the amount needed in the allowance for loan losses. The specific component relates to loans that are deemed to be impaired. Impairment is measured on a loan-by-loan basis for loans above a minimum dollar amount. For such loans that are classified as impaired, an allowance is established or the loan is charged-down when the discounted cash flows (or value of related collateral or observable market price) of the impaired loan is lower than the carrying value of that loan. Large groups of smaller balance homogeneous loans are evaluated collectively for impairment.
Premises and Equipment - Buildings, furniture, banking equipment and leasehold improvements are stated at cost less accumulated depreciation and amortization. Depreciation and amortization of these assets are computed using the straight-line method over the estimated useful lives or estimated lease terms including expected lease renewals, ranging from three to fifty years, of the respective assets for financial reporting purposes and accelerated methods for income tax purposes. Additions and major improvements are capitalized, while routine maintenance and repairs and gain or loss on dispositions are recognized currently.
Other Real Estate Owned - Assets acquired through loan foreclosure are held for sale and are initially recorded at fair value less estimated disposal costs at the date of foreclosure, establishing a new cost basis. Subsequent to foreclosure, valuations are periodically performed by management and the assets are carried at the lower of carrying amount or fair value less estimated disposal costs. Valuation allowances are established or the asset is written-down when subsequent valuations are less than current carrying amounts. Expenses from operations, changes in the valuation allowance, write-downs and net expenses from holding these assets are included in noninterest expense.
Bank-Owned Life Insurance - Bank-owned life insurance policies are recorded at the net realizable value of the underlying insurance contracts. The change in contract value during the year represents the contract earnings during the period less the mortality costs and administrative costs of the underlying life insurance contracts. The increase in cash surrender value from bank-owned life insurance contracts is included as a component of other operating income and the mortality costs and administrative fees are recorded as noninterest expense.
Intangible Assets - Intangible assets include goodwill and other identifiable assets, such as customer lists and deposits. Customer list and deposit premium intangibles are amortized on a straight-line basis over estimated useful lives of ten and five years, respectively, and evaluated for impairment whenever events or changes in circumstances indicate the carrying amount of the assets may not be recoverable. Goodwill is not amortized but tested annually for impairment or at any time an event occurs or circumstances change that may trigger a decline in the value of the reporting unit. Examples of such events or circumstances include an adverse change in operations, legal factors, business climate, unanticipated competition, change in regulatory environment, or loss of key personnel. The goodwill and customer list intangible assets were evaluated for impairment as of August 31, 2010 and based on that evaluation it was determined that there was no impairment.
F-9
The Savannah Bancorp, Inc. – 2010 Annual Report
Notes to Consolidated Financial Statements
________________________________________________________________________________________________________________
Note 1 - Organization and Summary of Significant Accounting Policies (continued)
Income Taxes - The income tax accounting guidance results in two components of income tax expense: current and deferred. Current income tax expense reflects taxes to be paid or refunded for the current period by applying the provisions of the enacted tax law to the taxable income or excess of deductions over revenues. The Company determines deferred income taxes using the liability (or balance sheet) method. Under this method, the net deferred tax asset or liability is based on the tax effects of the differences between the book and tax bases of assets and liabilities, and enacted changes in tax rates and laws are recognized in the period in which they occur.
Deferred income tax expense results from changes in deferred tax assets and liabilities between periods. Deferred tax assets are recognized if it is more likely than not, based on the technical merits, that the tax position will be realized or sustained upon examination. The term more likely than not means a likelihood of more than 50 percent; the terms examined and upon examination also include resolution of the related appeals or litigation processes, if any. A tax position that meets the more-likely-than-not recognition threshold is initially and subsequently measured as the largest amount of tax benefit that has a greater than 50 percent likelihood of being realized upon settlement with a taxing authority that has full knowledge of all relevant information. The determination of whether or not a tax position has met the more-likely-than-not recognition threshold considers the facts, circumstances, and information available at the reporting date and is subject to management’s judgment. Deferred tax assets may be reduced by deferred tax liabilities and a valuation allowance if, based on the weight of evidence available, it is more likely than not that some portion or all of a deferred tax asset will not be realized.
Earnings (Loss) Per Share - Basic earnings (loss) per share represent net income (loss) divided by the weighted average number of common shares outstanding during the period. Diluted earnings (loss) per share reflect additional common shares that would have been outstanding if dilutive potential common shares had been issued, as well as any adjustment to income that would result from the assumed issuance. Potential common shares that may be issued by the Company relate solely to outstanding stock options, and are determined using the treasury stock method. Earnings (loss) per common share have been computed based on the following:
|
(amounts in thousands)
|
|||
|
Years Ended December 31,
|
2010
|
2009
|
2008
|
|
Average number of common shares outstanding - basic
|
6,625
|
5,933
|
5,930
|
|
Effect of dilutive options
|
-
|
3
|
17
|
|
Average number of common shares outstanding - diluted
|
6,625
|
5,936
|
5,947
|
Stock option shares in the amount of 174,328, 194,814 and 192,022 for the years ended 2010, 2009 and 2008, respectively, were excluded from the diluted earnings per share calculation due to their anti-dilutive effect.
Derivative Instruments and Hedging Activities - Accounting principles provide the disclosure requirements for derivatives and hedging activities with the intent to provide users of financial statements with an enhanced understanding of: (a) how and why an entity uses derivative instruments, (b) how derivative instruments and related hedged items are accounted for, and (c) how derivative instruments and related hedged items affect an entity’s financial position, financial performance, and cash flows. Accounting principles require qualitative disclosures about objectives and strategies for using derivatives, quantitative disclosures about the fair value of and gains and losses on derivative instruments, and disclosures about credit-risk-related contingent features in derivative instruments.
As required by accounting principles, the Company records all derivatives on the balance sheet at fair value. The accounting for changes in the fair value of derivatives depends on the intended use of the derivative, whether the Company has elected to designate a derivative in a hedging relationship and apply hedge accounting and whether the hedging relationship has satisfied the criteria necessary to apply hedge accounting. Derivatives designated and qualifying as a hedge of the exposure to changes in the fair value of an asset, liability, or firm commitment attributable to a particular risk, such as interest rate risk, are considered fair value hedges. Derivatives designated and qualifying as a hedge of the exposure to variability in expected future cash flows, or other types of forecasted transactions, are considered cash flow hedges. Hedge accounting generally provides for the matching of the timing
F-10
The Savannah Bancorp, Inc. - 2010 Annual Report
Notes to Consolidated Financial Statements
________________________________________________________________________________________________________________
Note 1 - Organization and Summary of Significant Accounting Policies (continued)
of gain or loss recognition on the hedging instrument with the recognition of the changes in the fair value of the hedged asset or liability that are attributable to the hedged risk in a fair value hedge or the earnings effect of the hedged forecasted transactions in a cash flow hedge. The Company may enter into derivative contracts that are intended to economically hedge certain of its risk, even though hedge accounting does not apply or the Company elects not to apply hedge accounting.
Other Comprehensive Income (Loss) - Comprehensive income (loss) is the change in the Company’s equity during the period from transactions and other events and circumstances from non-owner sources.
|
($ in thousands)
|
2010
|
2009
|
2008
|
|
Net income (loss)
|
$ (3,989)
|
$ 929
|
$ 6,006
|
|
Change in unrealized gains/losses on securities
|
|||
|
available for sale, net of reclassification adjustment
|
(127)
|
(531)
|
842
|
|
Change in fair value and gains on termination of
|
|||
|
derivative instruments, net of tax
|
(287)
|
(1,295)
|
531
|
|
Other comprehensive income (loss)
|
$ (4,403)
|
$ (897)
|
$ 7,379
|
Accounting for Stock-Based Compensation - Accounting principles require that the compensation cost relating to share-based payment transactions be recognized in financial statements. That cost will be measured based on the grant date fair value of the equity or liability instruments issued. The stock compensation accounting guidance covers a wide range of share-based compensation arrangements including stock options, restricted share plans, performance-based awards, share appreciation rights, and employee share purchase plans.
The stock compensation accounting guidance requires that compensation cost for all stock awards be calculated and recognized over the employees’ service period, generally defined as the vesting period. For awards with graded-vesting, compensation cost is recognized on a straight-line basis over the requisite service period for the entire award. A Black-Scholes model is used to estimate the fair value of stock options, while the market price of the Company’s common stock at the date of grant is used for restricted stock awards and stock grants.
The 1995 Incentive Stock Option Plan (“1995 Plan”) authorized the Company to issue both incentive and non-qualified stock options to certain key officers for the purchase of shares at the fair market value of the stock at the date of grant. In 2000, the shareholders authorized additional option shares under the 1995 Plan. All authorized shares have been awarded from the 1995 Plan.
In 2005, shareholders approved the 2005 Omnibus Stock Ownership and Long-Term Incentive Plan (“2005 Omnibus Plan”) and authorized 250,000 option or restricted shares to be available for issuance. The total number of remaining options or awards available for issuance at December 31, 2010 under the 2005 Omnibus Plan was 147,249 shares of common stock. Options granted under both plans have a term of ten years and generally become fully vested over periods ranging from three to ten years. Performance based options granted to directors vest over three quarters from the date of grant.
The following table summarizes compensation costs related to the Company’s stock-based compensation plans for the years ended December 31:
|
($ in thousands)
|
2010
|
2009
|
2008
|
|
Salaries and employee benefits
|
$ 52
|
$ 94
|
$ 189
|
|
Directors' stock-based compensation
|
27
|
50
|
32
|
|
Pre-tax stock-based compensation expense
|
79
|
144
|
221
|
|
Income tax benefit
|
(30)
|
(55)
|
(84)
|
|
Total stock-based compensation expense, net of tax
|
$ 49
|
$ 89
|
$ 137
|
F - 11
The Savannah Bancorp, Inc. – 2010 Annual Report
Notes to Consolidated Financial Statements
________________________________________________________________________________________________________________
Note 1 - Organization and Summary of Significant Accounting Policies (continued)
During 2010, 2009 and 2008 no income tax benefits were realized on stock option exercises.
The Company recognizes stock-based compensation expense using the graded vesting attribution method. The remaining unrecognized compensation cost related to unvested incentive stock option and restricted share awards at December 31, 2010 is approximately $122,000. The weighted-average period of time over which this cost will be recognized is approximately 5.3 years. This amount does not include the cost of any additional options that may be granted in future periods nor any reduction in cost for potential forfeitures.
The fair value of each option grant is estimated on the date of grant using the Black-Scholes option pricing model with the following assumptions.
|
2010
|
2009
|
2008
|
|
|
Weighted average fair value of options granted
|
$ 3.41
|
$ 1.87
|
$ 4.29
|
|
Expected volatility
|
45%
|
39.1%
|
31.4%
|
|
Dividend yield
|
1.47%
|
2.67%
|
2.87%
|
|
Risk-free interest rate
|
2.43%
|
1.82%
|
2.48%
|
|
Expected life
|
6.0 years
|
6.0 years
|
6.0 years
|
Risks and Uncertainties - In the normal course of its business, the Company encounters two significant types of risk: economic and regulatory. There are three main components of economic risk: interest rate risk, credit risk and market risk. The Company is subject to interest rate risk to the degree that our interest-bearing liabilities mature or reprice at different speeds, or on different indexes, than our interest-earning assets. Credit risk is the risk of default on the loan portfolio that results from borrowers’ inability or unwillingness to make contractually required payments. Market risk reflects changes in the value of collateral underlying loans receivable and the valuation of other real estate owned, investment securities available for sale and mortgage servicing rights.
The Company is subject to the regulations of various government agencies. These regulations can and do change significantly from period to period. The Company also undergoes periodic examinations by the regulatory agencies, which may subject the Company to further changes with respect to asset valuations, amounts of required loss allowances and operating restrictions resulting from the regulators’ judgments on information available to them at the time of their examination.
Recent Accounting Pronouncements
In June 2009, the Financial Accounting Standards Board (“FASB”) amended its guidance on accounting for transfers of financial assets. The amended guidance eliminates the concept of qualifying special-purpose entities and requires that these entities be evaluated for consolidation under applicable accounting guidance, and it also removes the exception that permitted sale accounting for certain mortgage securitizations when control over the transferred assets had not been surrendered. Based on this new standard, many types of transferred financial assets that would previously have been derecognized will now remain on the transferor’s financial statements. The guidance also requires enhanced disclosures about transfers of financial assets and the transferor’s continuing involvement with those assets and related risk exposure. The new guidance was effective for the Company beginning in 2010. Adoption of this new guidance did not have a significant impact on the Company’s financial condition or results of operations.
Also in June 2009, the FASB issued amended guidance on accounting for variable interest entities (“VIE”). This guidance replaces the quantitative-based risks and rewards calculation for determining which enterprise might have a controlling financial interest in a VIE. The new, more qualitative evaluation focuses on who has the power to direct the significant economic activities of the VIE and also has the obligation to absorb losses or rights to receive benefits from the VIE. It also requires an ongoing reassessment of whether an enterprise is the primary beneficiary of a VIE and calls for certain expanded disclosures about an enterprise’s involvement with VIEs. The new guidance was effective for the Company’s 2010 fiscal year and did not have a significant impact on its financial condition or results of operations.
F - 12
The Savannah Bancorp, Inc. – 2010 Annual Report
Notes to Consolidated Financial Statements
________________________________________________________________________________________________________________
Note 1 - Organization and Summary of Significant Accounting Policies (continued)
In January 2010, the FASB issued amended guidance on the disclosure of fair value measurements that added new disclosures and clarified certain existing disclosure requirements. The amended guidance requires disclosure of the amount of and the reason for any significant transfers between Level 1 and Level 2 of the fair value hierarchy as well as the policy for determining when transfers between levels are recognized. The guidance also requires a more detailed breakdown of the information presented in the reconciliation of the beginning and ending balance of Level 3 fair value measurements, including separate information on purchases, sales, issuances, settlements and transfers in or out. The FASB clarified the requirement to disclose valuation techniques and inputs for recurring and nonrecurring fair value measurements as well the guidance on how assets and liabilities should be disaggregated for the fair value measurement disclosures. Most of this amended guidance is effective for the Company beginning in 2010, except the more detailed reconciliation of Level 3 measurements which is effective for 2011. The adoption of this new guidance is not expected to have a material effect on the Company’s consolidated financial position or results of operations.
In February 2010, the FASB amended its guidance to certain recognition and disclosure requirements. The amended guidance requires Securities and Exchange Commission (“SEC”) filers to evaluate subsequent events through the date the financial statements are issued and removes the requirement for SEC filers to disclose the date through which subsequent events have been evaluated. The FASB believes these amendments alleviate potential conflicts with the SEC’s requirements. The amended guidance was effective upon issuance for the Company. The adoption of this amended guidance did not have a material effect on the Company’s consolidated financial position or results of operations.
In July 2010, the FASB issued guidance on the disclosures about the credit quality of financing receivables and the allowance for loan losses. The guidance requires additional disclosure to facilitate financial statement users’ evaluation of the following: (1) the nature of credit risk inherent in the entity’s loan portfolio, (2) how that risk is analyzed and assessed in arriving at the allowance for loan losses, and (3) the changes and reasons for those changes in the allowance for loan losses. For public companies, increased disclosures as of the end of a reporting period are effective for periods ending on or after December 15, 2010. Increased disclosures about activity that occurs during a reporting period are effective for interim and annual reporting periods beginning on or after December 15, 2010. The adoption of this guidance resulted in the inclusion of additional disclosures in the Company’s consolidated financial statements.
In January 2011, the FASB issued guidance deferring the effective date of disclosures about troubled debt restructurings for public entities. The delay is intended to allow the FASB time to complete its deliberations on what constitutes a troubled debt restructuring. The effective date of the new disclosures about troubled debt restructurings for public entities and the guidance for determining what constitutes a troubled debt restructuring will then be coordinated. Currently, that guidance is anticipated to be effective for interim and annual periods ending after June 15, 2011. The adoption of this guidance is not expected to have a material impact on the Company’s consolidated financial position or results of operations.
The FASB issued guidance on when to perform step 2 of the goodwill impairment test for reporting units with zero or negative carrying amounts. The guidance modifies Step 1 of the goodwill impairment test for reporting units with zero or negative carrying amounts. For those reporting units, an entity is required to perform Step 2 of the goodwill impairment test if it is more likely than not that a goodwill impairment exists. In determining whether it is more likely than not that a goodwill impairment exists, an entity should consider whether there are any adverse qualitative factors indicating that an impairment may exist such as if an event occurs or circumstances change that would more likely than not reduce the fair value of a reporting unit below its carrying amount. The guidance will be effective for the Company on January 1, 2011 and is not expected have a material impact on the Company’s financial statements.
F - 13
The Savannah Bancorp, Inc. – 2010 Annual Report
Notes to Consolidated Financial Statements
________________________________________________________________________________________________________________
Note 2 - Acquisitions
On June 25, 2010, Savannah entered into an agreement with the FDIC to purchase substantially all deposits and certain liabilities and assets of First National Bank, Savannah (“First National”). Savannah acquired approximately $42 million in assets and assumed $216 million in liabilities, including $201 million in customer deposits. The assets primarily include cash and due from accounts and investment securities. Savannah acquired the local, non-brokered deposits of approximately $105 million at a premium of 0.11 percent, or approximately $116,000. In connection with the closing, Savannah received a cash payment from the FDIC totaling $174 million, based on the differential between liabilities assumed and assets acquired, taking into account the deposit premium.
The following table summarizes the estimated fair values of the assets acquired and liabilities assumed at the date of the acquisition.
|
($ in thousands)
|
June 25, 2010
|
|
Assets acquired
|
|
|
Cash and due from banks
|
$ 7,330
|
|
Interest-bearing deposits in banks
|
8,851
|
|
Securities available for sale
|
25,937
|
|
Loans
|
131
|
|
Premises and equipment
|
11
|
|
Deposit premium intangible
|
387
|
|
Other assets
|
128
|
|
Total assets acquired
|
42,775
|
|
Liabilities assumed
|
|
|
Deposits
|
200,843
|
|
Federal Home Loan Bank advances
|
15,271
|
|
Due to the FDIC
|
266
|
|
Accrued interest and other liabilities
|
432
|
|
Total liabilities assumed
|
216,812
|
|
Net liabilities assumed
|
$ (174,037)
|
The only loans assumed by Savannah were deposit-secured loans which are not subject to FDIC loss-share. In its assumption of the deposit liabilities, the Company believes that the customer relationships associated with the local deposits have intangible value. In addition, the Company determined that the recorded amount of the deposits approximates fair value primarily due to the fact that the Company can re-price all customer deposits to current market rates.
Note 3 - Restrictions on Cash and Demand Balances Due from Banks and Interest-Bearing Bank Balances
The Subsidiary Banks are required by the Federal Reserve Bank (“FRB”) to maintain minimum cash reserves based upon reserve requirements calculated on their deposit balances. Cash reserves of $581,000 and $339,000 are required as of December 31, 2010 and 2009, respectively. At times, the Company pledges interest-bearing cash balances at the Federal Home Loan Bank of Atlanta (“FHLB”) in addition to investment securities to secure public fund deposits and securities sold under repurchase agreements. The Company did not have any cash pledged at the FHLB at December 31, 2010. Pledged cash balances were $11,500,000 at December 31, 2009.
F - 14
The Savannah Bancorp, Inc. – 2010 Annual Report
Notes to Consolidated Financial Statements
________________________________________________________________________________________________________________
Note 4 - Securities Available for Sale
The aggregate amortized cost and fair value of securities available for sale as of December 31, 2010 and 2009 are as follows:
| 2010 | ||||
|
($ in thousands)
|
Amortized
|
Unrealized
|
Unrealized
|
Fair
|
|
Cost
|
Gains
|
Losses
|
Value
|
|
|
Investment securities:
|
||||
|
U.S. government-sponsored enterprises (“GSE”)
|
$ 1,821
|
$ 4
|
$ -
|
$ 1,825
|
|
Mortgage-backed securities - GSE
|
120,998
|
1,628
|
(435)
|
122,191
|
|
State and municipal securities
|
10,285
|
76
|
(154)
|
10,207
|
|
Restricted equity securities
|
3,876
|
-
|
-
|
3,876
|
|
Total investment securities
|
$ 136,980
|
$ 1,708
|
$ (589)
|
$ 138,099
|
| 2009 | ||||
|
($ in thousands)
|
Amortized
|
Unrealized
|
Unrealized
|
Fair
|
|
Cost
|
Gains
|
Losses
|
Value
|
|
|
Investment securities:
|
||||
|
U.S. government-sponsored enterprises
|
$ 1,727
|
$ 136
|
$ -
|
$ 1,863
|
|
Mortgage-backed securities - GSE
|
73,203
|
1,205
|
(120)
|
74,288
|
|
State and municipal securities
|
7,906
|
108
|
(6)
|
8,008
|
|
Restricted equity securities
|
3,760
|
-
|
-
|
3,760
|
|
Total investment securities
|
$ 86,596
|
$ 1,449
|
$ (126)
|
$ 87,919
|
The distribution of securities by contractual maturity at December 31, 2010 is shown below. Actual maturities may differ from contractual maturities because issuers may have the right to call or prepay obligations with or without call or prepayment penalties.
|
($ in thousands)
|
Amortized
Cost
|
Fair Value
|
|
Securities available for sale:
|
||
|
Due in one year or less
|
$ 100
|
$ 102
|
|
Due after one year through five years
|
2,331
|
2,357
|
|
Due after five years through ten years
|
3,625
|
3,548
|
|
Due after ten years
|
6,050
|
6,025
|
|
Mortgage-backed securities - GSE
|
120,998
|
122,191
|
|
Restricted equity securities
|
3,876
|
3,876
|
|
Total investment securities
|
$ 136,980
|
$ 138,099
|
At December 31, 2010 and 2009, investment securities with a carrying value of $61,728,000 and $60,260,000, respectively, are pledged as collateral to secure public funds, securities sold under repurchase agreements and FHLB borrowings.
Gains and losses on sales of securities available for sale consist of the following for the years ended December 31:
|
($ in thousands)
|
2010
|
2009
|
2008
|
|
Gross gains
|
$ 684
|
$ 2,170
|
$ 163
|
|
Gross losses
|
(76)
|
(51)
|
-
|
|
Net realized gains
|
$ 608
|
$ 2,119
|
$ 163
|
F - 15
The Savannah Bancorp, Inc. – 2010 Annual Report
Notes to Consolidated Financial Statements
________________________________________________________________________________________________________________
Note 4 - Securities Available for Sale (continued)
The restricted equity securities consist of the following at December 31:
|
($ in thousands)
|
2010
|
2009
|
|
FHLB stock
|
$ 3,054
|
$ 3,205
|
|
FRB stock
|
822
|
555
|
|
Total
|
$ 3,876
|
$ 3,760
|
The following table shows the gross unrealized losses and fair value of the Company’s investments with unrealized losses that are not deemed to be other-than-temporarily impaired, aggregated by investment category and length of time that individual securities have been in a continuous unrealized loss position at December 31, 2010. At December 31, 2009, the unrealized loss was not material to the financial statements. Available for sale securities that have been in a continuous unrealized loss position are as follows:
|
Less Than 12 Months
|
12 Months or More
|
Total
|
||||
|
Fair
|
Unrealized
|
Fair
|
Unrealized
|
Fair
|
Unrealized
|
|
|
($ in thousands)
|
Value
|
Losses
|
Value
|
Losses
|
Value
|
Losses
|
|
Mortgage-backed securities - GSE
|
$ 37,606
|
$ (435)
|
$ -
|
$ -
|
$ 37,606
|
$ (435)
|
|
State and municipal securities
|
3,853
|
(154)
|
-
|
-
|
3,853
|
(154)
|
|
Total temporarily impaired securities
|
$ 41,459
|
$ (589)
|
$ -
|
$ -
|
$ 41,459
|
$ (589)
|
The unrealized losses on the Company’s investment in GSE mortgage-backed securities were caused by interest rate increases. The Company purchased those investments at a premium relative to their face amount, and the contractual cash flows of those investments are guaranteed by an agency of the U.S. Government. Accordingly, it is expected that the securities would not be settled at a price less than the amortized cost bases of the Company’s investments. The Company also has municipal securities with unrealized losses caused by interest rate increases. Management has reviewed these bonds and all are rated AAA or Aa1. Because the decline in market value is attributable to changes in interest rates and not credit quality, and because the Company does not intend to sell the investments and it is not more likely than not that the Company will be required to sell the investments before recovery of their amortized cost bases, which may be maturity, the Company does not consider those investments to be other-than-temporarily impaired at December 31, 2010.
Note 5 - Loans
The composition of the loan portfolio at December 31, 2010 and 2009 is presented below:
|
($ in thousands)
|
Percent
|
Percent
|
||
|
2010
|
of Total
|
2009
|
of Total
|
|
|
Commercial real estate
|
||||
|
Construction and development
|
$ 20,819
|
2.5%
|
$ 61,476
|
7.0%
|
|
Owner-occupied
|
120,797
|
14.6
|
102,942
|
11.6
|
|
Non owner-occupied
|
231,641
|
28.0
|
233,767
|
26.5
|
|
Residential real estate - mortgage
|
363,390
|
44.0
|
381,350
|
43.1
|
|
Commercial
|
74,889
|
9.1
|
89,380
|
10.1
|
|
Installment and other consumer
|
15,026
|
1.8
|
14,971
|
1.7
|
|
Gross loans
|
826,562
|
100.0%
|
883,886
|
100.0%
|
|
Allowance for loan losses
|
(20,350)
|
(17,678)
|
||
|
Net loans
|
$ 806,212
|
$ 866,208
|
F - 16
The Savannah Bancorp, Inc. – 2010 Annual Report
Notes to Consolidated Financial Statements
________________________________________________________________________________________________________________
Note 5 - Loans (continued)
For purposes of the disclosures required pursuant to accounting standards, the loan portfolio was disaggregated into segments and then further disaggregated into classes for certain disclosures. A portfolio segment is defined as the level at which an entity develops and documents a systematic method for determining its allowance for loan losses. There are four loan portfolio segments that include commercial real estate, residential real estate-mortgage, commercial and installment and other consumer. Commercial real estate has three classes including construction and development, owner-occupied and non owner-occupied. The construction and development class includes residential and commercial construction and development loans. Land and lot development loans are included in the non owner-occupied commercial real estate class or residential real estate segment depending on the property type.
Changes in the allowance for loan losses are summarized as follows:
|
($ in thousands)
|
2010
|
2009
|
2008
|
|
Balance, beginning of year
|
$ 17,678
|
$ 13,300
|
$ 12,864
|
|
Provision for loan losses
|
21,020
|
13,065
|
6,000
|
|
Charge-offs
|
(18,765)
|
(8,893)
|
(5,714)
|
|
Recoveries
|
417
|
206
|
150
|
|
Balance, end of year
|
$ 20,350
|
$ 17,678
|
$ 13,300
|
The following table details the change in the allowance for loan losses from December 31, 2009 to December 31, 2010 by loan segment:
|
($ in thousands)
|
Commercial Real Estate
|
Residential Real Estate
|
Commercial
|
Consumer
|
Unallocated
|
Total
|
|
Allowance for loan losses
|
||||||
|
Beginning balance
|
$ 5,740
|
$ 10,690
|
$ 977
|
$ 227
|
$ 44
|
$ 17,678
|
|
Charge-offs
|
(5,840)
|
(11,729)
|
(1,080)
|
(116)
|
-
|
(18,765)
|
|
Recoveries
|
20
|
352
|
17
|
28
|
-
|
417
|
|
Provision
|
4,802
|
14,269
|
1,614
|
379
|
(44)
|
21,020
|
|
Ending balance
|
$ 4,722
|
$ 13,582
|
$ 1,528
|
$ 518
|
$ -
|
$ 20,350
|
|
Ending balance: individually
evaluated for impairment
|
$ 285
|
$ 4,055
|
$ 540
|
$ 257
|
$ -
|
$ 5,137
|
|
Loans
|
||||||
|
Ending balance
|
$ 373,257
|
$ 363,390
|
$ 74,889
|
$ 15,026
|
$ -
|
$ 826,562
|
|
Ending balance: individually
evaluated for impairment
|
$ 3,865
|
$ 25,669
|
$ 596
|
$ 257
|
$ -
|
$ 30,387
|
A loan is considered impaired, in accordance with the impairment accounting guidance, when based on current information and events, it is probable that the Company will be unable to collect all amounts due from the borrower in accordance with the contractual term of the loan. Impaired loans include loans modified in troubled debt restructurings where concessions have been granted to borrowers experiencing financial difficulties. These concessions could include a reduction in the interest rate on the loan, payment extensions, forgiveness of principal, forbearance or other actions intended to maximize collection.
F - 17
The Savannah Bancorp, Inc. – 2010 Annual Report
Notes to Consolidated Financial Statements
________________________________________________________________________________________________________________
Note 5 - Loans (continued)
The following is a summary of information pertaining to impaired loans as of and for the year ended December 31, 2010:
|
($ in thousands)
|
Recorded
Investment
|
Unpaid Principal Balance
|
Related
Allowance
|
|
Impaired loans without a valuation allowance
|
|||
|
Commercial real estate
|
|||
|
Construction and development
|
$ 152
|
$ 177
|
$ -
|
|
Owner-occupied
|
1,075
|
1,374
|
-
|
|
Non owner-occupied
|
301
|
3,979
|
-
|
|
Residential real estate - mortgage
|
12,906
|
18,476
|
-
|
|
Commercial
|
-
|
-
|
-
|
|
Installment and other consumer
|
-
|
-
|
-
|
|
Total impaired loans without a valuation allowance
|
14,434
|
24,006
|
-
|
|
Impaired loans with a valuation allowance
|
|||
|
Commercial real estate
|
|||
|
Construction and development
|
2,218
|
3,218
|
265
|
|
Owner-occupied
|
1,647
|
1,667
|
186
|
|
Non owner-occupied
|
2,926
|
3,353
|
372
|
|
Residential real estate - mortgage
|
30,634
|
33,471
|
6,316
|
|
Commercial
|
1,196
|
1,425
|
619
|
|
Installment and other consumer
|
814
|
818
|
349
|
|
Total impaired loans with a valuation allowance
|
39,435
|
43,952
|
8,107
|
|
Total impaired loans
|
$ 53,869
|
$ 67,958
|
$ 8,107
|
|
Average investment in impaired loans
|
$ 53,962
|
||
|
Interest income recognized on impaired loans
|
$ 821
|
At December 31, 2009, impaired loans were $54,054,000 and included $15,887,000 of loans without a valuation allowance and $38,167,000 with a valuation allowance. For 2009, the Company had a valuation allowance of $6,129,000 on impaired loans, an average investment of $45,892,000 and recognized interest income of $957,000. Impaired loans with a valuation allowance include pools of impaired loans.
The following table presents the aging of the recorded investment in past due loans as of December 31, 2010 by class of loans:
|
($ in thousands)
|
30-59 days
past due
|
60-89 days
past due
|
Accruing
greater
than 90
days past
due
|
Nonaccrual
|
Total past
due and nonaccrual
|
|
Commercial real estate
|
|||||
|
Construction and development
|
$ -
|
$ -
|
$ -
|
$ 2,370
|
$ 2,370
|
|
Owner-occupied
|
1,471
|
-
|
251
|
1,194
|
2,916
|
|
Non owner-occupied
|
309
|
12
|
803
|
1,595
|
2,719
|
|
Residential real estate - mortgage
|
4,114
|
4,894
|
1,855
|
26,446
|
37,309
|
|
Commercial
|
120
|
85
|
151
|
760
|
1,116
|
|
Installment and other consumer
|
147
|
12
|
4
|
471
|
634
|
|
Total
|
$ 6,161
|
$ 5,003
|
$ 3,064
|
$ 32,836
|
$ 47,064
|
F - 18
The Savannah Bancorp, Inc. – 2010 Annual Report
Notes to Consolidated Financial Statements
________________________________________________________________________________________________________________
Note 5 - Loans (continued)
At December 31, 2009, loans on nonaccrual status amounted to approximately $32,545,000 and loans past due 90 days or more and still accruing interest were $1,570,000.
Internal risk-rating grades are assigned to each loan by lending or credit administration, based on an analysis of the financial and collateral strength and other credit attributes underlying each loan. Management analyzes the resulting ratings, as well as other external statistics and factors, such as delinquency, to track the migration performance of the portfolio balances. Loan grades range between 1 and 8, with 1 being loans with the least credit risk. Loans that migrate toward the “Pass” grade (those with a risk rating between 1 and 4) or within the “Pass” grade generally have a lower risk of loss and therefore a lower risk factor. The “Special Mention” grade (those with a risk rating of 5) is utilized on a temporary basis for “Pass” grade loans where a significant risk-modifying action is anticipated in the near term. Substantially all of the “Special Mention” loans are performing. Loans that migrate toward the “Substandard” or higher grade (those with a risk rating between 6 and 8) generally have a higher risk of loss and therefore a higher risk factor applied to those related loan balances. The following table presents the Company’s loan portfolio by risk-rating grades at December 31, 2010:
|
($ in thousands)
|
Pass
(1-4)
|
Special Mention
(5)
|
Sub-
standard
(6)
|
Doubtful
(7)
|
Loss
(8)
|
Total
|
|
Commercial real estate
|
||||||
|
Construction and development
|
$ 17,792
|
$ 577
|
$ 2,450
|
$ -
|
$ -
|
$ 20,819
|
|
Owner-occupied
|
114,603
|
1,851
|
4,343
|
-
|
-
|
120,797
|
|
Non owner-occupied
|
216,744
|
9,017
|
5,880
|
-
|
-
|
231,641
|
|
Residential real estate - mortgage
|
290,894
|
19,936
|
51,317
|
1,243
|
-
|
363,390
|
|
Commercial
|
71,361
|
666
|
2,562
|
300
|
-
|
74,889
|
|
Installment and other consumer
|
14,011
|
78
|
762
|
175
|
-
|
15,026
|
|
Total
|
$ 725,405
|
$ 32,125
|
$ 67,314
|
$ 1,718
|
$ -
|
$ 826,562
|
The Company has granted loans to certain directors and executive officers of the Company and to their related interests. The aggregate amount of loans was $42,590,000 and $37,933,000 at December 31, 2010 and 2009, respectively. During 2010, new loans of $30,617,000 were made and repayments of $25,960,000 were received. Unfunded commitments of credit available to related parties aggregated $7,917,000 and $2,515,000 at December 31, 2010 and 2009, respectively. Related party loans are made on substantially the same terms, including interest rates and collateral, as those prevailing at the time for comparable transactions with unrelated persons and do not involve more than normal risk of collection.
Note 6 - Premises and Equipment
Premises and equipment at December 31, 2010 and 2009 are summarized as follows:
|
($ in thousands)
|
Depreciable
Lives
|
2010
|
2009
|
|
Land
|
-
|
$ 2,635
|
$ 2,635
|
|
Buildings and improvements
|
5 - 50
|
11,419
|
11,334
|
|
Furniture and banking equipment
|
3 - 15
|
8,039
|
7,637
|
|
Leasehold improvements
|
5 - 32
|
1,972
|
1,710
|
|
Total cost
|
24,065
|
23,316
|
|
|
Less accumulated depreciation and
amortization
|
9,009
|
7,742
|
|
|
Premises and equipment, net
|
$ 15,056
|
$ 15,574
|
Depreciation expense was $1,283,000, $1,369,000, and $1,239,000 for the years ended December 31, 2010, 2009 and 2008, respectively.
F - 19
The Savannah Bancorp, Inc. – 2010 Annual Report
Notes to Consolidated Financial Statements
________________________________________________________________________________________________________________
Note 7 - Other Real Estate Owned
Other real estate owned at December 31, 2010 and 2009 is summarized as follows:
|
($ in thousands)
|
2010
|
2009
|
|
Balance, beginning of year
|
$ 8,329
|
$ 8,100
|
|
Additions
|
16,462
|
7,843
|
|
Disposals
|
(10,167)
|
(6,772)
|
|
Additional write-downs
|
(1,425)
|
(842)
|
|
Balance, end of year
|
$ 13,199
|
$ 8,329
|
Note 8 - Goodwill and Other Intangible Assets
The Company recorded a core deposit intangible asset of $387,000 associated with the acquisition of First National in the second quarter of 2010. Following is a summary of information related to acquired intangible assets:
|
As of December 31, 2010
|
As of December 31, 2009
|
||||
|
Gross
|
Accumulated
|
Gross
|
Accumulated
|
||
|
($ in thousands)
|
Amount
|
Amortization
|
Amount
|
Amortization
|
|
|
Amortized intangible assets
|
|||||
|
Client list
|
$ 1,400
|
$ 480
|
$ 1,400
|
$ 336
|
|
|
Core deposit premium
|
387
|
27
|
-
|
-
|
|
|
Total carrying value
|
$ 1,787
|
$ 507
|
$ 1,400
|
$ 336
|
|
The aggregate amortization expense for intangible assets was approximately $171,000, $144,000 and $144,000 for the years ended December 31, 2010, 2009 and 2008, respectively.
The estimated amortization expense for each of the next five years is as follows: 2011 - $224,000, 2012 - $224,000, 2013 - $224,000, 2014 - $224,000 and 2015 - $184,000.
Changes in the carrying amounts of goodwill at December 31, 2010 and 2009 are as follows:
|
($ in thousands)
|
2010
|
2009
|
|
Balance, beginning of year
|
$ 1,434
|
$ 1,434
|
|
Goodwill acquired
|
1,072
|
-
|
|
Balance, end of year
|
$ 2,506
|
$ 1,434
|
All of the goodwill is related to the 2007 acquisition of Minis. The goodwill acquired in 2010 was a final contingent earn-out payment.
Note 9 - Deposits
The aggregate amount of time deposits in denominations of $100,000 or more at December 31, 2010 and 2009 is $235,406,000 and $261,795,000, respectively. At December 31, 2010, brokered time deposits mature as follows: 2011 - $54,623,000; 2012 - $387,000; and 2013 - $435,000. Additionally, $42,504,000 of non-maturity institutional money market accounts are considered brokered deposits because the deposits are from customers of brokerage firms up to a maximum of $250,000 per depositor.
F - 20
The Savannah Bancorp, Inc. – 2010 Annual Report
Notes to Consolidated Financial Statements
________________________________________________________________________________________________________________
Note 9 - Deposits (continued)
The scheduled maturities of time deposits at December 31, 2010 are as follows:
|
($ in thousands)
|
Total
|
|
2011
|
$ 331,876
|
|
2012
|
33,853
|
|
2013
|
7,712
|
|
2014
|
11,874
|
|
2015 and thereafter
|
16,217
|
|
Total
|
$ 401,532
|
Note 10 - Short-Term Borrowings
Short-term borrowings at December 31, 2010 and 2009 consist of federal funds purchased, securities sold under agreements to repurchase, and FRB short-term advances:
|
($ in thousands)
|
Federal Funds Purchased
|
Securities
Sold Under
Repurchase
Agreements
|
FRB
Short-Term Advances
|
|
2010
|
|||
|
Balance at December 31
|
$ 295
|
$ 14,780
|
$ -
|
|
Maximum indebtedness at any month end
|
1,320
|
17,225
|
6,000
|
|
Daily average indebtedness outstanding
|
805
|
14,847
|
1,099
|
|
Average rate paid for the year
|
0.26%
|
0.50%
|
0.55%
|
|
Average rate paid on period-end borrowings
|
0.20%
|
0.50%
|
0.00%
|
|
2009
|
|||
|
Balance at December 31
|
$ 1,320
|
$ 12,233
|
$ 10,000
|
|
Maximum indebtedness at any month end
|
3,247
|
18,459
|
17,000
|
|
Daily average indebtedness outstanding
|
1,045
|
14,835
|
8,564
|
|
Average rate paid for the year
|
0.34%
|
0.53%
|
0.52%
|
|
Average rate paid on period-end borrowings
|
0.20%
|
0.50%
|
0.50%
|
The maximum amount of short-term borrowings outstanding at the end of any month was $20,414,000 and $52,819,000 during 2010 and 2009, respectively. At December 31, 2010, federal funds borrowing arrangements aggregating $41,500,000 were available to the Subsidiary Banks from correspondent banking institutions. There are no commitment fees and no requirements for compensating balances. These unused lines principally serve as temporary liquidity back-up lines and are subject to availability of funds and other specific limitations of the correspondent banks.
Savannah is a member and shareholder of the FRB of Atlanta. The Subsidiary Banks have been approved to access the FRB discount window to borrow on a secured basis at 25 basis points over the Federal Funds Target Rate. The amount of credit available is subject to the amounts and types of collateral available when borrowings are requested. The Subsidiary Banks were approved by the FRB under the borrower-in-custody of collateral (“BIC”) arrangement. This temporary liquidity arrangement allows collateral to be maintained at the Subsidiary Banks rather than being delivered to the FRB or a third party custodian. At December 31, 2010, the Company had secured borrowing capacity of $78.4 million with the FRB and no balance outstanding.
F - 21
The Savannah Bancorp, Inc. – 2010 Annual Report
Notes to Consolidated Financial Statements
________________________________________________________________________________________________________________
Note 11 - Other Borrowings
Other borrowings consist of a note payable due to related parties (directors) of $10,536,000. The proceeds were used to fund SAVB Holdings. Principal payments are due monthly based on repayments, sales, charge-offs or other activity in the assets held by SAVB Holdings. At December 31, 2010, interest is at prime plus two percent with a floor of 7.5 percent and is due monthly. The Company has already met the cumulative principal pay down required by September 30, 2011. The remaining indebtedness is due and payable by September 30, 2012. The agreement includes customary performance covenants and a guarantee of the Company. One of the covenants is that the Company’s dividend payout ratio will not exceed 50 percent of income on a quarterly basis.
Note 12 - Federal Home Loan Advances
Short-term Advances - Short-term advances from the FHLB totaled $4,000,000 and $16,000,000 at December 31, 2010 and 2009, respectively. The weighted-average interest rates on the short-term advances were 1.08 and 0.36 percent at December 31, 2010 and 2009, respectively. Of the $4,000,000 in short-term advances at December 31, 2010, $2,000,000 is a daily rate credit and was repaid in January, 2011 and $2,000,000 is a fixed rate advance that matures on May 16, 2011 with interest due monthly.
Convertible Advances - The Company had convertible fixed rate advances of $10,000,000 at December 31, 2010 and 2009. The weighted-average interest rates on convertible advances were 2.26 percent at December 31, 2010 and 2009. The advances mature in 2018 and are now convertible each quarter at the option of the FHLB to an advance with an interest rate equal to the current three-month LIBOR.
Long-term Advances - Long-term advances from the FHLB totaled $3,658,000 and $5,664,000 at December 31, 2010 and 2009, respectively. The weighted-average interest rates on the long-term advances were 2.09 and 1.95 percent at December 31, 2010 and 2009, respectively. Aggregate maturities for the loan-term advances at December 31, 2010 are $3,500,000 in 2012 and $158,000 in 2015 and thereafter. Interest is generally payable monthly and scheduled principal reductions are made quarterly, semi-annually or at maturity. The long-term advances include prepayment penalties for each advance.
FHLB Advance Borrowing Capacity - The Subsidiary Banks are shareholders of the FHLB and have access to secured borrowings from the FHLB under Blanket Floating Lien Agreements. Under these agreements, the Subsidiary Banks have pledged certain 1-4 family first mortgage loans, commercial real estate loans, home equity lines of credit and second mortgage residential loans. The Subsidiary Banks’ individual borrowing limits range from 20 to 25 percent of assets. In aggregate, the Subsidiary Banks had secured borrowing capacity of approximately $136 million of which $17.7 million was advanced at December 31, 2010. These credit arrangements serve as a core funding source as well as liquidity backup for the Subsidiary Banks. Additional advances are subject to review and approval by the FHLB.
Note 13 - Subordinated Debt to Nonconsolidated Subsidiaries
During the third quarters 2003 and 2004, the Company formed SAVB Capital Trust I and SAVB Capital Trust II (the “Trusts”), nonconsolidated subsidiaries whose sole purpose was to issue $6,000,000 and $4,000,000, respectively, in Trust Preferred Securities through investment pools sponsored by two national brokerage firms. The Trust Preferred Securities have maturities of 30 years and are redeemable at the Company’s option on any quarterly interest payment date after five years. There are certain events (as defined in the Trust agreements) in which the securities may be redeemed within the first five years at the Company’s option. At December 31, 2010, the interest rates on the securities were 3.14 and 2.50 percent, respectively, with quarterly resets at the three-month LIBOR plus 2.85 and 2.20 percent, respectively. The Company’s liabilities to the nonconsolidated Trusts are recorded as liabilities of $6.186 million and $4.124 million and investments (included in other assets) of $186,000 and $124,000, respectively, in the consolidated balance sheet. Subject to certain limitations, the securities qualify as Tier 1 capital for regulatory capital purposes under FRB regulations.
F - 22
The Savannah Bancorp, Inc. – 2010 Annual Report
Notes to Consolidated Financial Statements
________________________________________________________________________________________________________________
Note 14 - Income Taxes
Income tax expense (benefit) is composed of the following for each of the years ended December 31:
|
($ in thousands)
|
2010
|
2009
|
2008
|
|
Current federal
|
$ (1,092)
|
$ 1,861
|
$ 2,757
|
|
Current state
|
(279)
|
42
|
310
|
|
Total current
|
(1,371)
|
1,903
|
3,067
|
|
Deferred federal
|
(1,528)
|
(1,417)
|
88
|
|
Deferred state
|
(231)
|
(331)
|
15
|
|
Total deferred
|
(1,759)
|
(1,748)
|
103
|
|
Income tax expense (benefit)
|
$ (3,130)
|
$ 155
|
$ 3,170
|
Investments in federal and state low-income housing tax credit partnerships reduced federal and state income tax expense approximately $143,000, $113,000 and $145,000 in 2010, 2009 and 2008, respectively.
A reconciliation between income tax expense (benefit) and the amounts computed by applying the U.S. federal tax rate of 34 percent to income (loss) before income taxes is as follows:
|
($ in thousands)
|
2010
|
2009
|
2008
|
|
Tax provision at 34%
|
$ (2,421)
|
$ 369
|
$ 3,120
|
|
State tax, net of federal tax benefit
|
(300)
|
46
|
196
|
|
Benefit of tax-exempt income, net
|
(197)
|
(141)
|
(127)
|
|
Other
|
(212)
|
(119)
|
(19)
|
|
Income tax expense (benefit)
|
$ (3,130)
|
$ 155
|
$ 3,170
|
Deferred income tax assets and liabilities are comprised of the following at December 31, 2010 and 2009:
|
($ in thousands)
|
2010
|
2009
|
|
Deferred tax assets:
|
||
|
Allowance for loan losses
|
$ 7,676
|
$ 6,455
|
|
Tax-deductible goodwill
|
1,317
|
741
|
|
Write-down of foreclosed assets
|
306
|
319
|
|
Unamortized loan fees
|
49
|
179
|
|
Unamortized non-compete costs
|
17
|
23
|
|
Deferred compensation expense
|
469
|
452
|
|
Stock-based compensation expense
|
140
|
114
|
|
Other
|
112
|
84
|
|
Total deferred tax assets
|
10,086
|
8,367
|
|
Deferred tax liabilities:
|
||
|
Depreciation
|
624
|
616
|
|
Unrealized gains on securities
|
425
|
502
|
|
Deferred costs on loans and deposits
|
72
|
129
|
|
Unrealized gains on derivatives
|
-
|
177
|
|
Other
|
25
|
16
|
|
Total deferred tax liabilities
|
1,146
|
1,440
|
|
Net deferred tax assets
|
$ 8,940
|
$ 6,927
|
The net deferred tax assets are included in the consolidated balance sheets in other assets. The Company files a consolidated Federal tax return and a consolidated Georgia return for the Georgia-based parent and subsidiaries.
F - 23
The Savannah Bancorp, Inc. – 2010 Annual Report
Notes to Consolidated Financial Statements
________________________________________________________________________________________________________________
Note 15 - Stock Option and Employee Benefit Plans
As discussed in Note 1, the Company has two stock option plans. All authorized shares have been awarded from the 1995 Plan. There are 147,249 authorized option shares remaining under the 2005 Omnibus Plan at December 31, 2010. The options granted in the chart below generally vest 20 percent each year over five years and are exercisable over ten years except for 57,601 option shares granted to directors which vest within one year and 18,310 restricted share awards which vest from three to ten years. Some of the executive officer option shares also include minimum performance triggers as a condition of vesting.
Changes in stock options outstanding for the years ended December 31, 2010, 2009 and 2008 are as follows.
|
2010
|
2009
|
2008
|
||||
|
Shares
|
Weighted
Average
Exercise
Price
|
Shares
|
Weighted
Average
Exercise
Price
|
Shares
|
Weighted
Average
Exercise
Price
|
|
|
Outstanding at beginning
|
||||||
|
of year
|
194,814
|
$ 17.09
|
192,022
|
$ 18.28
|
210,484
|
$ 17.76
|
|
Granted
|
7,915
|
11.25
|
19,291
|
8.74
|
9,850
|
17.44
|
|
Exercised
|
-
|
-
|
-
|
-
|
(3,781)
|
10.23
|
|
Forfeited
|
(28,401)
|
14.55
|
(16,499)
|
21.12
|
(24,531)
|
14.72
|
|
Outstanding at end of year
|
174,328
|
$ 17.24
|
194,814
|
$ 17.09
|
192,022
|
$ 18.28
|
|
Exercisable at end of year
|
163,355
|
$ 16.87
|
175,625
|
$ 16.75
|
150,307
|
$ 17.30
|
At December 31, 2010, there is no aggregate intrinsic value for the outstanding or exercisable stock options.
Options outstanding at December 31, 2010 are as follows:
|
Outstanding
|
Exercisable
|
||||
|
Outstanding Common Options
|
Remaining Contractual Number
|
Weighted
Average
Life
|
Weighted
Average
Price
|
Number
|
Weighted
Average
Price
|
|
Range of exercise prices
|
|||||
|
$6.85 - $12.00
|
36,660
|
6.46
|
$ 9.67
|
34,687
|
$ 9.58
|
|
$12.01 - $15.00
|
15,466
|
1.54
|
13.02
|
15,466
|
13.02
|
|
$15.01 - $20.00
|
70,195
|
3.64
|
16.91
|
70,195
|
16.91
|
|
$20.01 - $25.00
|
28,707
|
4.15
|
22.33
|
28,707
|
22.33
|
|
$25.00 - $28.56
|
23,300
|
6.00
|
26.71
|
14,300
|
27.59
|
|
Total outstanding
|
174,328
|
4.44
|
$ 17.24
|
163,355
|
$ 16.87
|
Restricted Stock - In 2007 and 2006, the Board granted 18,310 shares of restricted stock under the 2005 Omnibus Plan which awards certain officers common shares of the Company. The cost of these shares is being amortized against earnings using the vesting schedule over the three and ten year vesting periods. In 2010, 2009 and 2008, 3,500 shares did not vest or were forfeited. Unrecognized compensation cost for restricted stock awards was $49,000 at December 31, 2010.
The Company sponsors a 401(k) employee savings and profit sharing plan in which substantially all full-time employees are eligible to participate. The plan allows eligible employees to save a portion of their salary on a pre-tax basis. Contributions by the Company to the plan are discretionary. Contributions and administrative expenses related to the plan aggregated $10,000, $290,000 and $339,000 for the years ended December 31, 2010, 2009 and 2008, respectively. The Company did not make a contribution to the plan in 2010 and the only costs were for administrative expenses.
F-24
The Savannah Bancorp, Inc. – 2010 Annual Report
Notes to Consolidated Financial Statements
________________________________________________________________________________________________________________
Note 16 - Capital Ratios and Dividend Restrictions
The Subsidiary Banks’ primary regulators have adopted capital requirements that specify the minimum capital level for which no prompt corrective action is required. In addition, the Federal Deposit Insurance Corporation (“FDIC”) has adopted FDIC insurance assessment rates based on certain “well-capitalized” risk-based and equity capital ratios. Failure to meet minimum capital requirements can result in the initiation of certain actions by the regulators that, if undertaken, could have a material effect on the Company’s and the Subsidiary Banks’ financial statements.
As of December 31, 2010, the Subsidiary Banks were categorized as well-capitalized under the regulatory framework for prompt corrective action in the most recent notification from the FDIC. There are no conditions or events since the notification that management believes have changed the institutions’ categories. Bryan has agreed with its primary regulator to maintain a Tier 1 Leverage Ratio of not less than 8.00 percent.
Banking regulations restrict the amount of cash dividends that banks may pay without obtaining regulatory approval. At December 31, 2010, approximately $2.8 million in retained earnings of the Subsidiary Banks was available for the payment of dividends, subject to maintaining adequate capital ratios in the Subsidiary Banks. The Company has agreed with its primary regulator to obtain approval prior to paying or declaring any dividends.
Management believes that the Company and the Subsidiary Banks meet all capital adequacy requirements to which they are subject as of December 31, 2010. The following tables show the capital amounts and ratios for the Company and the Subsidiary Banks at December 31, 2010 and 2009:
|
($ in thousands)
|
Company
|
Savannah
|
Bryan
|
||||||||
|
2010
|
2009
|
2010
|
2009
|
2010
|
2009
|
||||||
|
Qualifying Capital
|
|||||||||||
|
Tier 1 capital
|
$ 87,623
|
$ 85,420
|
$ 64,193
|
$ 60,461
|
$ 21,294
|
$ 21,672
|
|||||
|
Total capital
|
97,589
|
95,880
|
71,450
|
68,061
|
23,826
|
24,255
|
|||||
|
Leverage Ratios
|
|||||||||||
|
Tier 1 capital to average assets
|
8.12%
|
8.25%
|
7.97%
|
7.93%
|
8.20%
|
8.57%
|
|||||
|
Risk-based Ratios
|
|||||||||||
|
Tier 1 capital to risk-weighted assets
|
11.13%
|
10.30%
|
11.18%
|
10.02%
|
10.67%
|
10.57%
|
|||||
|
Total capital to risk-weighted assets
|
12.40%
|
11.56%
|
12.44%
|
11.28%
|
11.93%
|
11.83%
|
|||||
|
Well-
|
||
|
Required Regulatory Capital Ratios:
|
Minimum
|
Capitalized
|
|
Tier 1 capital to average assets
|
4.00%
|
5.00%
|
|
Tier 1 capital to risk-weighted assets
|
4.00%
|
6.00%
|
|
Total capital to risk-weighted assets
|
8.00%
|
10.00%
|
Note 17 - Leases and Commitments
Future minimum payments under non-cancelable land and office space operating leases with remaining terms in excess of one year are presented as follows: 2011 - $937,000; 2012 - $788,000; 2013 - $679,000; 2014 - $606,000; 2015 and thereafter is $3,291,000. The land and office space leases contain customary escalation clauses. The Company or the Subsidiary Banks are responsible for taxes, insurance and maintenance during the lease term under certain leases. Future minimum payments due under the Company’s long-term data processing contract are as follows: 2011 - $1,200,000; 2012 - $1,224,000; 2013 - $1,248,000; 2014 - $1,273,000; and 2015 - $1,191,000. The contract contains customary escalation and buyout clauses.
F - 25
The Savannah Bancorp, Inc. – 2010 Annual Report
Notes to Consolidated Financial Statements
________________________________________________________________________________________________________________
Note 17 - Leases and Commitments (continued)
The net rental expense for all office space operating leases amounted to $1,272,000 in 2010, $636,000 in 2009 and $1,452,000 in 2008. The leases on the office space have five to twenty-year renewal options and typically require increased rental payments under consumer price index escalation clauses.
Note 18 - Other Operating Expense
The components of other operating expense for the years ended December 31, 2010, 2009 and 2008 are as follows:
|
($ in thousands)
|
2010
|
2009
|
2008
|
|
Loan and collection costs
|
$ 1,046
|
$ 1,107
|
$ 605
|
|
Professional and directors fees
|
873
|
1,114
|
957
|
|
Regulatory assessments and audit fees
|
545
|
592
|
536
|
|
Advertising and sales promotion
|
377
|
233
|
425
|
|
Postage and courier
|
297
|
310
|
321
|
|
Taxes and licenses
|
273
|
244
|
237
|
|
Stationery and supplies
|
198
|
253
|
332
|
|
Telephone
|
172
|
175
|
209
|
|
Insurance
|
147
|
95
|
65
|
|
Dues and subscriptions
|
111
|
115
|
135
|
|
Correspondent bank charges
|
39
|
50
|
101
|
|
Other expense
|
574
|
422
|
693
|
|
Total other operating expense
|
$ 4,652
|
$ 4,710
|
$ 4,616
|
Note 19 - On-Balance Sheet Derivative Instruments and Hedging Activities
Risk Management Objective of Using Derivatives
The Company is exposed to certain risks arising from both its business operations and economic conditions. The Company principally manages its exposures to a wide variety of business and operational risks through management of its core business activities. The Company manages economic risks, including interest rate, liquidity, and credit risk, primarily by managing the amount, sources, and duration of its assets and liabilities and through the use of derivative financial instruments. Specifically, the Company enters into derivative financial instruments to manage exposures that arise from business activities that result in the receipt or payment of future known and uncertain cash amounts, the value of which are determined by interest rates. The Company’s derivative financial instruments are used to manage differences in the amount, timing, and duration of the Company’s known or expected cash receipts principally related to certain variable rate loan assets.
Fair Values of Derivative Instruments on the Balance Sheet
The table below presents the fair value of the Company’s derivative financial instruments at December 31:
|
2010
|
2009
|
|||||
|
Fair Value
|
Fair Value
|
|||||
|
($ in thousands)
|
Asset
|
Liability
|
Asset
|
Liability
|
||
|
Derivatives designated as hedging instruments:
|
||||||
|
Interest rate products
|
$ -
|
$ -
|
$ -
|
$ -
|
||
|
Derivatives not designated as hedging instruments:
|
||||||
|
Interest rate products
|
136
|
135
|
32
|
20
|
||
|
Total
|
$ 136
|
$ 135
|
$ 32
|
$ 20
|
||
F - 26
The Savannah Bancorp, Inc. – 2010 Annual Report
Notes to Consolidated Financial Statements
________________________________________________________________________________________________________________
Note 19 - On-Balance Sheet Derivative Instruments and Hedging Activities (continued)
Cash Flow Hedges of Interest Rate Risk
The Company’s objectives in using interest rate derivatives are to add stability to interest income and expense and to manage its exposure to interest rate movements. To accomplish this objective, the Company has historically used interest rate swaps, collars, and floors as part of its interest rate risk management strategy. Interest rate swaps designated as cash flow hedges involve the receipt of variable amounts from a counterparty in exchange for the Company making fixed payments over the life of the agreements without exchange of the underlying notional amount. Interest rate collars designated as cash flow hedges involve the receipt of variable-rate amounts from a counterparty if interest rates fall below the strike rate on the purchased floor and the payment of variable-rate amounts if interest rates rise above the cap rate on the sold floor. Interest rate floors designated as cash flow hedges involve the receipt of variable-rate amounts from a counterparty if interest rates fall below the strike rate on the contract in exchange for an up front premium. As of December 31, 2010 the Company had no outstanding derivatives that were designated as cash flow hedging relationships.
During the year ended December 31, 2009, the Company had a $40 million interest rate collar which was used to hedge the cash inflows associated with then-existing pools of Prime-based loan assets. This interest rate collar hedging the Company’s variable cash inflows associated with Prime-based loan pools failed to qualify for hedge accounting due to the mismatch in the collar notional and designated loan principal; accordingly, all changes in fair value of the collars from the date of failure through the date of termination were recorded directly in earnings. Refer to amounts disclosed under the sections entitled “Derivatives Not Designated as Hedging Instruments” throughout this footnote. No hedge ineffectiveness was recognized during the years ended December 31, 2010 and 2009.
Amounts reported in accumulated other comprehensive income related to derivatives will be reclassified to interest income as interest payments are received on the Company’s variable rate assets. During the year ended December 31, 2010, the Company accelerated the reclassification of amounts in other comprehensive income to earnings as a result of a portion of the hedged forecasted transactions related to the Company’s interest rate swaps, collars and interest rate floor becoming probable not to occur. The accelerated amount for the year ended December 31, 2010 was a gain of $14,000.
Effect of Derivative Instruments on the Income Statement
The table below presents the effect of the Company’s derivative financial instruments on the income statement for the years ended December 31, 2010 and 2009 ($ in thousands):
|
2010
|
2009
|
2010
|
2009
|
|||
|
Cash Flow Hedging Relationships
|
Gain Recognized in
OCI on Derivative
(Effective Portion)
|
Location of Gain Reclassified
from Accumulated OCI into
Income (Effective Portion)
|
Gain Reclassified
from Accumulated
OCI into Income
(Effective Portion)
|
|||
|
Interest Rate Products
|
$ -
|
$ -
|
Interest income
|
$ 450
|
$ 1,205
|
|
|
Noninterest income
|
14
|
794
|
||||
|
Total
|
$ -
|
$ -
|
$ 464
|
$ 1,999
|
||
Non-designated Hedges
The Company does not use derivatives for trading or speculative purposes. Derivatives not designated as hedges are used to manage the Company’s exposure to interest rate movements and other identified risks but do not meet the strict hedge accounting requirements. Changes in the fair value of derivatives not designated in hedging relationships are recorded directly in earnings. As noted under “Cash Flow Hedges of Interest Rate Risk,” collars hedging the Company’s variable cash inflows associated with Prime-based loans disqualified for hedge accounting
F - 27
The Savannah Bancorp, Inc. – 2010 Annual Report
Notes to Consolidated Financial Statements
________________________________________________________________________________________________________________
Note 19 - On-Balance Sheet Derivative Instruments and Hedging Activities (continued)
as of December 31, 2008 and March 31, 2009; accordingly, the changes in fair value of the collars were subsequently recognized directly in earnings through the date of termination. The Company recognized a loss of $10,000 relating to the changes in fair value of these interest rate collars during the year ended December 31, 2009.
As of December 31, 2010 none of the Company’s outstanding derivatives are designated in qualifying hedging relationships. Derivatives not designated as hedges are not speculative and result from a service the Company provides to certain customers. The Company executes interest rate swaps with commercial banking customers to facilitate their respective risk management strategies. Those interest rate swaps are simultaneously hedged by executing offsetting interest rate swaps that the Company executes with a third party, such that the Company minimizes its net risk exposure resulting from such transactions. As the interest rate swaps associated with this program do not meet the strict hedge accounting requirements, changes in the fair value of both the customer swaps and the offsetting swaps are recognized directly in earnings. As of December 31, 2010, the Company had two interest rate swaps with an aggregate notional amount of $5,079,125 related to this program. During the years ended December 31, 2010 and 2009, respectively, the Company recognized a net loss of $12,000 and a net gain of $12,000 related to changes in fair value of these swaps.
Credit-risk-related Contingent Features
The Company has an agreement with one of its derivative counterparties that contains a provision where if the Company defaults on any of its indebtedness, including default where repayment of the indebtedness has not been accelerated by the lender, then the Company could also be declared in default on its derivative obligations.
As of December 31, 2010 the fair value of derivatives in a net liability position, which includes accrued interest but excludes any adjustment for nonperformance risk, related to these agreements was $134,000. As of December 31, 2010, the Company has minimum collateral posting thresholds with certain of its derivative counterparties and has posted collateral of $54,000 against its obligations under these agreements. If the Company had breached any of these provisions at December 31, 2010, it would have been required to settle its obligations under the agreements at the termination value.
Note 20 - Financial Instruments with Off-Balance Sheet Risk
The Company is a party to financial instruments with off-balance sheet risk in the normal course of business in order to meet the financing needs of its customers. These financial instruments include commitments to extend credit and standby letters of credit. These instruments involve, to varying degrees, elements of credit and interest rate risk in excess of the amount recognized in the balance sheets. The majority of all commitments to extend credit and standby letters of credit are variable rate instruments. The Company's exposure to credit losses is represented by the contractual amounts of those instruments. The Company uses the same credit policies in making commitments and conditional obligations as it does for on-balance sheet instruments.
Commitments to extend credit are agreements to lend to a customer as long as there is no violation of any condition established in the contract. Commitments generally have fixed expiration dates or other termination clauses and may require payment of a fee. At December 31, 2010 and 2009 unfunded commitments to extend credit and unfunded lines of credit were $81,183,000 and $87,480,000, respectively, of which some were subject to interest rate lock commitments. Since many of the commitments are expected to expire without being drawn upon, the total commitment amounts do not necessarily represent future cash requirements. The amount of collateral obtained by the Company upon extension of credit, if deemed necessary, is based on management's credit evaluation of the customer. Collateral may include cash, securities, accounts receivable, inventory, equipment, and real estate.
Letters of credit are conditional commitments issued by the Company to guarantee the performance of a customer to a third party. The letters of credit are primarily issued to support public and private borrowing arrangements. At December 31, 2010 and 2009, commitments under letters of credit aggregated approximately $2,667,000 and $2,175,000, respectively.
F - 28
The Savannah Bancorp, Inc. – 2010 Annual Report
Notes to Consolidated Financial Statements
________________________________________________________________________________________________________________
Note 21 - Fair Value of Financial Instruments
Determination of Fair Value
The Company uses fair value measurements to record fair value adjustments to certain assets and liabilities and to determine fair value disclosures. In accordance with the accounting standards for fair value measurements and disclosure, the fair value of a financial instrument is the price that would be received to sell an asset or paid to transfer a liability in an orderly transaction between market participants at the measurement date. Fair value is best determined based upon quoted market prices. However, in many instances, there are no quoted market prices for the Company’s various financial instruments. In cases where quoted market prices are not available, fair values are based on estimates using present value or other valuation techniques. Those techniques are significantly affected by the assumptions used, including the discount rate and estimates of future cash flows. Accordingly, the fair value estimates may not be realized in an immediate settlement of the instrument.
The fair value guidance provides a consistent definition of fair value, which focuses on exit price in an orderly transaction (that is, not a forced liquidation or distressed sale) between market participants at the measurement date under current market conditions. If there has been a significant decrease in the volume and level of activity for the asset or liability, a change in valuation technique or the use of multiple valuation techniques may be appropriate. In
such instances, determining the price at which willing market participants would transact at the measurement date under current market conditions depends on the facts and circumstances and requires the use of significant judgment.
The fair value is a reasonable point within the range that is most representative of fair value under current market conditions.
In accordance with this guidance, the Company groups its financial assets and financial liabilities generally measured at fair value in three levels, based on the markets in which the assets and liabilities are traded and the reliability of the assumptions used to determine fair value:
Level 1: Quoted prices (unadjusted) for identical assets or liabilities in active markets that the entity has the ability to access as of the measurement date.
Level 2: Significant other observable inputs other than Level 1 prices, such as quoted prices for similar assets or liabilities, quoted prices in markets that are not active, and other inputs that are observable or can be corroborated by observable market data.
Level 3: Significant unobservable inputs that are supported by little or no market activity for the asset or liability. Level 3 assets and liabilities include financial instruments whose value is determined using pricing models, discounted cash flow methodologies, or similar techniques, as well as instruments for which determination of fair value requires significant management judgment or estimation.
Recurring Fair Value Changes
Following is a description of the valuation methodologies used for instruments measured at fair value on a recurring basis and recognized in the accompanying balance sheet, as well as the general classification of such instruments pursuant to the valuation hierarchy.
Investment securities: The fair values of securities available for sale are determined by obtaining quoted prices on nationally recognized securities exchanges or matrix pricing, which is a mathematical technique used widely in the industry to value debt securities without relying exclusively on quoted prices for the specific securities but rather by relying on the securities’ relationship to other benchmark quoted securities.
Derivative instruments: Our derivative instruments consist of loan level swaps. As such, significant fair value inputs can generally be verified and do not typically involve significant judgments by management.
F - 29
The Savannah Bancorp, Inc. – 2010 Annual Report
Notes to Consolidated Financial Statements
________________________________________________________________________________________________________________
Note 21 - Fair Value of Financial Instruments (continued)
Assets and liabilities measured at fair value on a recurring basis are summarized below as of December 31:
|
Fair Value Measurements at December 31, 2010 Using
|
||||
|
Quoted Prices in
|
Significant Other
|
Significant
|
||
|
Active Markets for
|
Observable
|
Unobservable
|
||
|
Carrying
|
Identical Assets
|
Inputs
|
Inputs
|
|
|
($ in thousands)
|
Value
|
(Level 1)
|
(Level 2)
|
(Level 3)
|
|
Investment securities
|
$ 138,099
|
$ -
|
$ 134,223
|
$ 3,876
|
|
Derivative asset positions
|
136
|
-
|
136
|
-
|
|
Derivative liability positions
|
135
|
-
|
135
|
-
|
|
Carrying
|
Fair Value Measurements at December 31, 2009 Using
|
|||
|
($ in thousands)
|
Value
|
Level 1
|
Level 2
|
Level 3
|
|
Investment securities
|
$ 87,919
|
$ -
|
$ 84,159
|
$ 3,760
|
|
Derivative asset positions
|
32
|
-
|
32
|
-
|
|
Derivative liability positions
|
20
|
-
|
20
|
-
|
Nonrecurring Fair Value Changes
Certain assets and liabilities are measured at fair value on a nonrecurring basis. These instruments are not measured at fair value on an ongoing basis, but subject to fair value in certain circumstances, such as when there is evidence of impairment that may require write-downs. The write-downs for the Company’s more significant assets or liabilities measured on a nonrecurring basis are based on the lower of amortized or estimated fair value.
Impaired loans and other real estate owned (“OREO”): Impaired loans and OREO are evaluated and valued at the time the loan or OREO is identified as impaired, at the lower of cost or market value. Market value is measured based on the value of the collateral securing these loans and is classified at a Level 3 in the fair value hierarchy. Collateral for impaired loans may be real estate and/or business assets, including equipment, inventory and/or accounts receivable. Its fair value is generally determined based on real estate appraisals or other independent evaluations by qualified professionals. Impaired loans and OREO are reviewed and evaluated on at least a quarterly basis for additional impairment and adjusted accordingly, based on the same factors identified above. Impaired loans measured on a nonrecurring basis do not include pools of impaired loans.
Assets and liabilities with an impairment charge during the current year and measured at fair value on a nonrecurring basis are summarized below as of December 31:
|
Carrying Values at December 31, 2010
|
||||||
|
($ in thousands)
|
Total
|
Level 1
|
Level 2
|
Level 3
|
Total
gain (loss)
|
|
|
Impaired loans
|
$ 7,236
|
$ -
|
$ -
|
$ 7,236
|
$ (5,073)
|
|
|
OREO
|
5,423
|
-
|
-
|
5,423
|
(1,424)
|
|
|
Carrying Values at December 31, 2009
|
||||||
|
($ in thousands)
|
Total
|
Level 1
|
Level 2
|
Level 3
|
Total
gain (loss)
|
|
|
Impaired loans
|
$ 14,021
|
$ -
|
$ -
|
$ 14,021
|
$ (5,613)
|
|
|
OREO
|
3,390
|
-
|
-
|
3,390
|
(841)
|
|
F - 30
The Savannah Bancorp, Inc. – 2010 Annual Report
Notes to Consolidated Financial Statements
________________________________________________________________________________________________________________
Note 21 - Fair Value of Financial Instruments (continued)
Fair Value Disclosures
Accounting standards require the disclosure of the estimated fair value of financial instruments including those financial instruments for which the Company did not elect the fair value option. The fair value represents management’s best estimates based on a range of methodologies and assumptions.
Cash and federal funds sold, interest-bearing deposits in banks, accrued interest receivable, all non-maturity deposits, short-term borrowings, other borrowings, subordinated debt and accrued interest payable have carrying amounts which approximate fair value primarily because of the short repricing opportunities of these instruments.
Following is a description of the methods and assumptions used by the Company to estimate the fair value of its financial instruments:
Investment securities: Fair value is based upon quoted market prices, if available. If a quoted market price is not available, fair value is estimated using quoted market prices for similar securities. Restricted equity securities are carried at cost because no market value is available.
Loans: The fair value is estimated for portfolios of loans with similar financial characteristics. Loans are segregated by type, such as commercial, mortgage, and consumer loans. The fair value of the loan portfolio is calculated by discounting contractual cash flows using estimated market discount rates which reflect the credit and interest rate risk inherent in the loan. The estimated fair value of the Subsidiary Banks' off-balance sheet commitments is nominal since the committed rates approximate current rates offered for commitments with similar rate and maturity characteristics and since the estimated credit risk associated with such commitments is not significant.
Derivative instruments: The fair value of derivative instruments, consisting of interest rate contracts, is equal to the estimated amount that the Company would receive or pay to terminate the derivative instruments at the reporting date, taking into account current interest rates and the credit-worthiness of the counterparties.
Deposit liabilities: The fair value of time deposits is estimated using the discounted value of contractual cash flows based on current rates offered for deposits of similar remaining maturities.
FHLB advances: The fair value is estimated using the discounted value of contractual cash flows based on current rates offered for debt of similar remaining maturities and/or termination values provided by the FHLB.
The carrying amounts and estimated fair values of the Company’s financial instruments are as follows as of December 31:
|
|
2010
|
2009
|
|||
|
($ in thousands)
|
Estimated
|
Estimated
|
|||
|
Carrying
|
Fair
|
Carrying
|
Fair
|
||
|
Value
|
Value
|
Value
|
Value
|
||
|
Financial assets:
|
|||||
|
Cash and federal funds sold
|
$ 18,100
|
$ 18,100
|
$ 27,828
|
$ 27,828
|
|
|
Interest-bearing deposits
|
40,836
|
40,836
|
12,707
|
12,707
|
|
|
Securities available for sale
|
138,099
|
138,099
|
87,919
|
87,919
|
|
|
Loans, net of allowance for loan losses
|
806,212
|
800,785
|
866,208
|
873,705
|
|
|
Accrued interest receivable
|
3,789
|
3,789
|
3,923
|
3,923
|
|
|
Derivative asset positions
|
136
|
136
|
32
|
32
|
|
|
Financial liabilities:
|
|||||
|
Deposits
|
923,745
|
929,271
|
884,569
|
887,969
|
|
|
Short-term borrowings
|
15,075
|
15,075
|
23,553
|
23,553
|
|
|
Other borrowings
|
10,536
|
10,536
|
15,988
|
15,988
|
|
|
FHLB advances
|
17,658
|
18,214
|
31,664
|
32,094
|
|
|
Subordinated debt to nonconsolidated subsidiaries
|
10,310
|
10,310
|
10,310
|
10,310
|
|
|
Accrued interest payable
|
1,108
|
1,108
|
1,628
|
1,628
|
|
|
Derivative liability positions
|
135
|
135
|
20
|
20
|
|
F - 31
The Savannah Bancorp, Inc. – 2010 Annual Report
Notes to Consolidated Financial Statements
________________________________________________________________________________________________________________
Note 22 - The Savannah Bancorp, Inc. (Parent Company Only) Financial Information ($ in thousands)
The following are condensed balance sheets of the Parent Company at December 31, 2010 and 2009:
|
2010
|
2009
|
|
|
Assets
|
||
|
Cash on deposit
|
$ 60
|
$ 65
|
|
Interest-bearing deposits
|
1,542
|
197
|
|
Investment in subsidiaries
|
92,031
|
86,399
|
|
Premises and equipment
|
554
|
831
|
|
Investment in nonconsolidated
|
||
|
subsidiary
|
905
|
1,394
|
|
Other assets
|
2,625
|
1,953
|
|
Total assets
|
$ 97,717
|
$ 90,839
|
|
Liabilities
|
||
|
Subordinated debt
|
$ 10,310
|
$ 10,310
|
|
Other liabilities
|
1,604
|
1,503
|
|
Total liabilities
|
11,914
|
11,813
|
|
Shareholders' equity
|
||
|
Common stock
|
7,201
|
5,934
|
|
Additional paid-in capital
|
48,634
|
38,605
|
|
Retained earnings
|
29,275
|
33,383
|
|
Treasury stock
|
(1)
|
(4)
|
|
Accumulated other
|
||
|
comprehensive income, net
|
694
|
1,108
|
|
Total shareholders’ equity
|
85,803
|
79,026
|
|
Total liabilities and equity
|
$ 97,717
|
$ 90,839
|
F - 32
The Savannah Bancorp, Inc. – 2010 Annual Report
Notes to Consolidated Financial Statements
________________________________________________________________________________________________________________
Note 22 - The Savannah Bancorp, Inc. (Parent Company Only) Financial Information ($ in thousands)
The operating results of the Parent Company are shown below for the three years ended December 31:
|
2010
|
2009
|
2008
|
|
|
Dividends from subsidiaries
|
$ 950
|
$ 4,200
|
$ 3,450
|
|
Interest income
|
31
|
4
|
15
|
|
Interest expense
|
306
|
362
|
642
|
|
Net interest and dividend income
|
675
|
3,842
|
2,823
|
|
Other income
|
289
|
29
|
35
|
|
Processing / management fees
|
4,996
|
5,267
|
5,468
|
|
Total income
|
5,960
|
9,138
|
8,326
|
|
Corporate expenses
|
535
|
733
|
669
|
|
Processing / management costs
|
5,111
|
5,342
|
5,543
|
|
Other expenses
|
5,646
|
6,075
|
6,212
|
|
Income before income taxes and
|
|||
|
(distributions in excess of
|
|||
|
earnings) equity in undistributed
|
|||
|
net income of subsidiaries
|
314
|
3,063
|
2,114
|
|
Income tax benefit
|
175
|
395
|
415
|
|
Income before (distributions in
|
|||
|
excess of earnings) equity in
|
|||
|
undistributed net income
|
|||
|
of subsidiaries
|
489
|
3,458
|
2,529
|
|
(Distributions in excess of
|
|||
|
earnings) equity in undistributed
|
|||
|
net income of subsidiaries
|
(4,478)
|
(2,529)
|
3,477
|
|
Net income (loss)
|
$(3,989)
|
$ 929
|
$ 6,006
|
F - 32a
The Savannah Bancorp, Inc. – 2010 Annual Report
Notes to Consolidated Financial Statements
________________________________________________________________________________________________________________
Note 22 - The Savannah Bancorp, Inc. (Parent Company Only) Financial Information ($ in thousands)
The cash flows of the Parent Company are shown below for the three years ended December 31:
|
2010
|
2009
|
2008
|
|
|
Operating activities
|
|||
|
Net income (loss)
|
$ (3,989)
|
$ 929
|
$ 6,006
|
|
Adjustments to reconcile net
|
|||
|
income (loss) to cash provided
|
|||
|
by operating activities:
|
|||
|
Distributions in excess of
|
|||
|
earnings (equity in
|
|||
|
undistributed net income)
|
|||
|
of subsidiaries
|
4,478
|
2,529
|
(3,477)
|
|
Depreciation of equipment
|
343
|
449
|
445
|
|
Gain on sale of partnership
|
|||
|
interest
|
(255)
|
-
|
-
|
|
Non cash stock-based
|
|||
|
compensation expense
|
79
|
144
|
221
|
|
Change in other assets and
|
|||
|
liabilities, net
|
(601)
|
(477)
|
60
|
|
Net cash provided by
|
|||
|
operating activities
|
55
|
3,574
|
3,255
|
|
Investing activities
|
|||
|
Distribution from
|
|||
|
nonconsolidated subsidiary
|
-
|
-
|
350
|
|
Proceeds from sale of
|
|||
|
partnership interest
|
694
|
-
|
-
|
|
Purchase of equipment and
|
|||
|
software
|
(65)
|
(108)
|
(545)
|
|
Capital contribution to
|
|||
|
consolidated subsidiaries
|
(10,475)
|
(3,390)
|
-
|
|
Net cash used in
|
|||
|
investing activities
|
(9,846)
|
(3,498)
|
(195)
|
|
Financing activities
|
|||
|
Dividends paid
|
(119)
|
(1,098)
|
(2,966)
|
|
Issuance of common stock
|
|||
|
and exercise of options
|
11,247
|
-
|
110
|
|
Issuance of treasury stock
|
3
|
-
|
-
|
|
Net cash provided by (used in)
|
|||
|
financing activities
|
11,131
|
(1,098)
|
(2,856)
|
|
Increase (decrease) in cash
|
|||
|
and cash equivalents
|
1,340
|
(1,022)
|
204
|
|
Cash, beginning of year
|
262
|
1,284
|
1,080
|
|
Cash, end of year
|
$ 1,602
|
$ 262
|
$ 1,284
|
The Parent Company financial statements include the following intercompany items: interest-bearing deposits on the balance sheets; dividend income, interest income and processing / management fees on the statements of income. The investment in the nonconsolidated subsidiary on the balance sheet represents a 50 percent interest in a limited partnership which owns the headquarters building at 25 Bull Street, Savannah, GA.
F - 32b
The Savannah Bancorp, Inc. – 2010 Annual Report
Managements's Discussion and Analysis of Financial Condition and Results of Operations
___________________________________________________________________________________________________________________
For a comprehensive presentation of the Company’s financial condition and results of operations, the following selected financial data and analysis should be reviewed along with the consolidated financial statements and the accompanying notes to the consolidated financial statements.
Table 1 - Selected Financial Condition Highlights – Five-Year Comparison
|
($ in thousands, except share data)
|
2010
|
2009
|
2008
|
2007
|
2006
|
|
Selected Average Balances
|
|||||
|
Assets
|
$ 1,078,464
|
$ 1,018,470
|
$ 960,260
|
$ 869,026
|
$ 769,917
|
|
Total interest-earning assets
|
979,436
|
935,617
|
898,295
|
830,900
|
734,470
|
|
Loans held for sale
|
-
|
-
|
765
|
1,299
|
7,842
|
|
Loans, net of unearned fees
|
810,484
|
841,033
|
821,673
|
754,490
|
658,750
|
|
Securities
|
111,753
|
81,282
|
62,019
|
58,910
|
50,600
|
|
Other interest-earning assets
|
57,199
|
13,302
|
13,838
|
16,201
|
17,278
|
|
Interest-bearing deposits
|
840,077
|
777,763
|
701,045
|
628,310
|
542,375
|
|
Borrowed funds
|
62,140
|
71,967
|
88,553
|
70,939
|
62,255
|
|
Total interest-bearing liabilities
|
902,217
|
849,730
|
789,598
|
699,249
|
604,630
|
|
Noninterest-bearing deposits
|
86,458
|
82,406
|
83,678
|
91,367
|
96,113
|
|
Total deposits
|
926,535
|
860,169
|
784,723
|
719,677
|
638,488
|
|
Shareholders' equity
|
84,319
|
79,804
|
78,998
|
71,516
|
61,766
|
|
Loan to deposit ratio – average
|
87%
|
98%
|
105%
|
105%
|
103%
|
|
Selected Financial Data at Year-End
|
|||||
|
Assets
|
$ 1,066,930
|
$ 1,050,508
|
$ 1,007,284
|
$ 932,459
|
$ 843,514
|
|
Interest-earning assets
|
971,653
|
959,219
|
931,448
|
878,992
|
803,927
|
|
Loans held for sale
|
-
|
-
|
291
|
180
|
914
|
|
Loans, net of unearned fees
|
826,562
|
883,886
|
864,974
|
808,651
|
720,918
|
|
Deposits
|
923,745
|
884,569
|
832,015
|
764,218
|
706,824
|
|
Interest-bearing liabilities
|
881,599
|
883,527
|
837,558
|
759,597
|
669,974
|
|
Shareholders' equity
|
85,803
|
79,026
|
80,932
|
76,272
|
66,574
|
|
Loan to deposit ratio
|
89%
|
100%
|
104%
|
106%
|
102%
|
|
Shareholders' equity to total assets
|
8.04%
|
7.52%
|
8.03%
|
8.18%
|
7.89%
|
|
Dividend payout ratio
|
NM
|
118.19%
|
49.38%
|
36.73%
|
25.92%
|
|
Risk-based capital ratios:
|
|||||
|
Tier 1 capital to risk-weighted assets
|
11.13%
|
10.30%
|
10.28%
|
10.49%
|
11.09%
|
|
Total capital to risk-weighted assets
|
12.40%
|
11.56%
|
11.54%
|
11.74%
|
12.34%
|
|
Loan Quality Data
|
|||||
|
Nonperforming assets
|
$ 49,099
|
$ 42,444
|
$ 35,703
|
$ 19,535
|
$ 2,776
|
|
Nonperforming loans
|
35,900
|
34,115
|
27,603
|
17,424
|
2,231
|
|
Nonaccruing loans
|
32,836
|
32,545
|
26,277
|
14,663
|
825
|
|
Loans past due 90 days - accruing
|
3,064
|
1,570
|
1,326
|
2,761
|
1,406
|
|
Net charge-offs
|
18,348
|
8,687
|
5,564
|
765
|
444
|
|
Allowance for loan losses
|
20,350
|
17,678
|
13,300
|
12,864
|
8,954
|
|
Allowance for loan losses to total loans
|
2.46%
|
2.00%
|
1.54%
|
1.59%
|
1.24%
|
|
Nonperforming loans to loans
|
4.34%
|
3.86%
|
3.19%
|
2.15%
|
0.31%
|
|
Nonperforming assets to assets
|
4.60%
|
4.04%
|
3.54%
|
2.09%
|
0.33%
|
|
Net charge-offs to average loans
|
2.26%
|
1.03%
|
0.68%
|
0.10%
|
0.07%
|
|
Per Share Data at Year-End
|
|||||
|
Book value
|
$ 11.92
|
$ 13.32
|
$ 13.64
|
$ 12.88
|
$ 11.52
|
|
Tangible book value
|
$ 11.39
|
$ 12.90
|
$ 13.19
|
$ 12.40
|
$ 11.52
|
|
Common stock closing price (NASDAQ)
|
$ 7.00
|
$ 8.00
|
$ 8.85
|
$ 17.14
|
$ 27.25
|
|
Common shares outstanding (000s)
|
7,200
|
5,932
|
5,934
|
5,924
|
5,781
|
F - 33
The Savannah Bancorp, Inc. – 2010 Annual Report
Managements's Discussion and Analysis of Financial Condition and Results of Operations
___________________________________________________________________________________________________________________
Table 2 - Selected Operating Highlights – Five-Year Comparison
|
($ in thousands, except share data)
|
2010
|
2009
|
2008
|
2007
|
2006
|
|
Summary of operations
|
|||||
|
Interest income - taxable equivalent
|
$ 47,961
|
$ 50,595
|
$ 56,714
|
$ 63,414
|
$ 55,347
|
|
Interest expense
|
14,362
|
18,258
|
24,439
|
30,282
|
22,737
|
|
Net interest income - taxable equivalent
|
33,599
|
32,337
|
32,275
|
33,132
|
32,610
|
|
Taxable equivalent adjustment
|
(32)
|
(32)
|
(32)
|
(156)
|
(158)
|
|
Net interest income
|
33,567
|
32,305
|
32,243
|
32,976
|
32,452
|
|
Provision for loan losses
|
21,020
|
13,065
|
6,000
|
4,675
|
1,585
|
|
Net interest income after
provision for loan losses
|
12,547
|
19,240
|
26,243
|
28,301
|
30,867
|
|
Noninterest income
|
|||||
|
Trust and asset management fees
|
2,599
|
2,351
|
2,832
|
1,513
|
658
|
|
Service charges on deposits accounts
|
1,788
|
1,809
|
1,881
|
1,383
|
1,526
|
|
Mortgage related income, net
|
398
|
432
|
295
|
615
|
886
|
|
Gain on sale of securities
|
608
|
2,119
|
163
|
-
|
-
|
|
Gain on hedges
|
2
|
873
|
1,288
|
-
|
-
|
|
Other operating income
|
1,916
|
1,238
|
1,216
|
1,242
|
1,233
|
|
Total noninterest income
|
7,311
|
8,822
|
7,675
|
4,753
|
4,303
|
|
Noninterest expense
|
|||||
|
Salaries and employee benefits
|
11,948
|
12,146
|
13,584
|
11,846
|
10,852
|
|
Occupancy and equipment
|
3,945
|
3,716
|
3,884
|
3,294
|
2,920
|
|
Information technology
|
2,101
|
1,810
|
1,633
|
1,616
|
1,525
|
|
FDIC deposit insurance
|
1,688
|
1,886
|
653
|
251
|
78
|
|
Amortization of intangibles
|
171
|
144
|
144
|
48
|
-
|
|
Loss on sale and write-downs of
|
|||||
|
foreclosed assets
|
2,472
|
2,566
|
228
|
44
|
-
|
|
Other operating expense
|
4,652
|
4,710
|
4,616
|
4,084
|
4,578
|
|
Total noninterest expense
|
26,977
|
26,978
|
24,742
|
21,183
|
19,953
|
|
Income (loss) before income taxes
|
(7,119)
|
1,084
|
9,176
|
11,871
|
15,217
|
|
Income tax expense (benefit)
|
(3,130)
|
155
|
3,170
|
4,235
|
5,215
|
|
Net income (loss)
|
$ (3,989)
|
$ 929
|
$ 6,006
|
$ 7,636
|
$ 10,002
|
|
Net income per share:
|
|||||
|
Basic
|
$ (0.60)
|
$ 0.16
|
$ 1.01
|
$ 1.31
|
$ 1.73
|
|
Diluted
|
$ (0.60)
|
$ 0.16
|
$ 1.01
|
$ 1.29
|
$ 1.70
|
|
Cash dividends paid per share
|
$ 0.02
|
$ 0.185
|
$ 0.50
|
$ 0.48
|
$ 0.45
|
|
Average basic shares outstanding (000s)
|
6,625
|
5,933
|
5,930
|
5,850
|
5,765
|
|
Average diluted shares outstanding (000s)
|
6,625
|
5,936
|
5,947
|
5,922
|
5,876
|
|
Performance ratios (averages)
|
|||||
|
Net interest margin
|
3.43%
|
3.46%
|
3.58%
|
3.99%
|
4.44%
|
|
Return on average assets
|
(0.37)%
|
0.09%
|
0.63%
|
0.88%
|
1.30%
|
|
Return on average equity
|
(4.73)%
|
1.16%
|
7.60%
|
10.68%
|
16.19%
|
|
Efficiency ratio
|
66.00%
|
65.60%
|
61.98%
|
56.15%
|
54.29%
|
F - 34
The Savannah Bancorp, Inc. – 2010 Annual Report
Managements's Discussion and Analysis of Financial Condition and Results of Operations
___________________________________________________________________________________________________________________
|
|
Table 3 - Selcted Quarterly Data
The following is a summary of unaudited quarterly results for 2010 and 2009:
|
2010
|
2009
|
||||||||
|
Fourth
|
Third
|
Second
|
First
|
Fourth
|
Third
|
Second
|
First
|
||
|
Net interest income
|
$8,833
|
$8,029
|
$8,276
|
$8,429
|
$8,315
|
$8,240
|
$8,084
|
$7,666
|
|
|
Provision for loan losses
|
6,725
|
5,230
|
3,745
|
5,320
|
2,560
|
3,560
|
3,225
|
3,720
|
|
|
Net interest income after
|
|||||||||
|
provision for loan losses
|
2,108
|
2,799
|
4,531
|
3,109
|
5,755
|
4,680
|
4,859
|
3,946
|
|
|
Noninterest income
|
1,767
|
1,538
|
1,726
|
2,280
|
2,680
|
2,227
|
1,906
|
2,009
|
|
|
Noninterest expense
|
6,701
|
7,310
|
6,539
|
6,427
|
7,288
|
6,476
|
6,739
|
6,475
|
|
|
Income (loss) before
income taxes
|
(2,826)
|
(2,973)
|
(282)
|
(1,038)
|
1,147
|
431
|
26
|
(520)
|
|
|
Income tax expense
(benefit)
|
(950)
|
(1,410)
|
(220)
|
(550)
|
385
|
85
|
(80)
|
(235)
|
|
|
Net income (loss)
|
$(1,876)
|
$(1,563)
|
$ (62)
|
$ (488)
|
$ 762
|
$ 346
|
$ 106
|
$ (285)
|
|
|
Per share: (a)
|
|||||||||
|
Net income (loss) – basic
|
$ (0.26)
|
$ (0.22)
|
$(0.01)
|
$ (0.08)
|
$ 0.13
|
$ 0.06
|
$ 0.02
|
$ (0.05)
|
|
|
Net income (loss) – diluted
|
$ (0.26)
|
$ (0.22)
|
$(0.01)
|
$ (0.08)
|
$ 0.13
|
$ 0.06
|
$ 0.02
|
$ (0.05)
|
|
|
Dividends
|
$ -
|
$ -
|
$ -
|
$ 0.02
|
$ 0.02
|
$ 0.02
|
$ 0.02
|
$ 0.125
|
|
|
Average shares (000s)
|
|||||||||
|
Basic
|
7,200
|
7,200
|
6,146
|
5,938
|
5,932
|
5,932
|
5,932
|
5,933
|
|
|
Diluted
|
7,200
|
7,200
|
6,146
|
5,938
|
5,937
|
5,936
|
5,936
|
5,933
|
|
|
|
(a) The summation of quarterly earnings per share may not agree with annual earnings per share.
|
Table 4 - Market for Registrant's Common Equity and Related Shareholder Matters
The Company's common stock is traded on NASDAQ under the symbol SAVB. The quarterly high, low and closing stock trading prices for 2010 and 2009 are listed below. There were approximately 640 holders of record of Company common stock and, according to information provided to the Company, approximately 1,320 additional shareholders in street name through brokerage accounts at December 31, 2010.
|
|
2010
|
2009
|
|||||||
|
Closing Market Prices
|
Fourth
|
Third
|
Second
|
First
|
Fourth
|
Third
|
Second
|
First
|
|
|
High
|
$ 9.11
|
$ 10.05
|
$ 12.20
|
$ 11.09
|
$ 9.25
|
$ 8.50
|
$ 10.93
|
$ 10.00
|
|
|
Low
|
6.85
|
8.86
|
9.03
|
7.50
|
7.00
|
6.65
|
6.65
|
6.00
|
|
|
Close
|
7.00
|
9.30
|
9.76
|
10.61
|
8.00
|
8.10
|
6.65
|
7.01
|
|
F - 35
The Savannah Bancorp, Inc. – 2010 Annual Report
Managements's Discussion and Analysis of Financial Condition and Results of Operations
___________________________________________________________________________________________________________________
Table 5 - Stock Performance Graph
The following table provides a graphic comparison of the cumulative total shareholder return on the common stock of the Company for the five year period from December 31, 2005 through December 31, 2010. It includes the cumulative total return on the NASDAQ Market Index, the SNL $500M-$1B Bank Index and assumes the re-investment of all dividends over the same period. All cumulative returns assume an initial investment of $100.
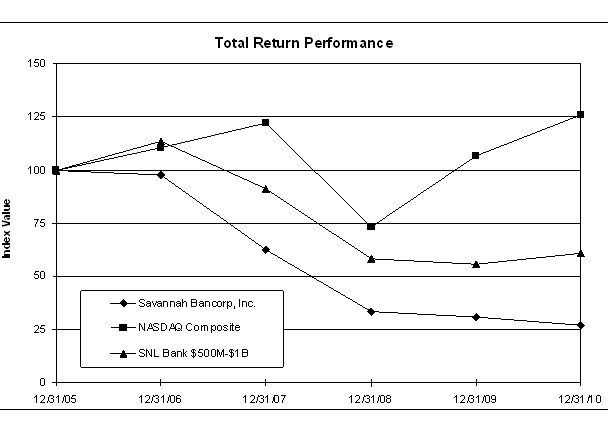
|
For the Years Ended December 31,
|
||||||||
|
Index
|
2005
|
2006
|
2007
|
2008
|
2009
|
2010
|
||
|
The Savannah Bancorp, Inc.
|
100.00
|
97.52
|
62.54
|
33.42
|
30.86
|
27.07
|
||
|
NASDAQ Composite
|
100.00
|
110.39
|
122.15
|
73.32
|
106.57
|
125.91
|
||
|
SNL Bank $500M-$1B
|
100.00
|
113.73
|
91.14
|
58.40
|
55.62
|
60.72
|
||
|
Source : SNL Financial LC, Charlottesville, VA © 2010
|
||||||||
F - 36
The Savannah Bancorp, Inc. – 2010 Annual Report
Managements's Discussion and Analysis of Financial Condition and Results of Operations
___________________________________________________________________________________________________________________
Introduction
Management's Discussion and Analysis of Financial Condition and Results of Operations (“MD & A”) provides supplemental information which sets forth the major factors that have affected the Company's financial condition and results of operations. These discussions should be read in conjunction with the Consolidated Financial Statements and related notes. The MD & A is divided into subsections entitled:
Selected Financial Data Tables 1 - 5 (preceding pages)
Introduction
Critical Accounting Estimates
Results of Operations
Financial Condition and Capital Resources
Liquidity and Interest Rate Sensitivity Management
Off-Balance Sheet Arrangements
Forward Looking Statements
These discussions should facilitate a better understanding of the major factors and trends that affect the Company's earnings performance and financial condition and how the Company's performance during 2010 compared with prior years. Throughout this section, The Savannah Bancorp, Inc. and its subsidiaries, collectively, are referred to as "SAVB" or the "Company." The Savannah Bank, N.A. is referred to as "Savannah," Bryan Bank & Trust is referred to as “Bryan” and Minis & Co., Inc. is referred to as “Minis.” The operations of Minis, a registered investment advisor and wholly-owned subsidiary, are included beginning September 1, 2007. The Company formed a new subsidiary, SAVB Holdings, LLC in the third quarter 2008 for the purpose of holding problems loans and other real estate. SAVB Holdings, LLC is referred to as “SAVB Holdings.” Collectively, Savannah and Bryan are referred to as the “Subsidiary Banks.”
The averages used in this report are the averages of daily balances for each respective period. See Tables 9 and 10 for average balances and interest rates presented on an annual basis. Certain prior year balances have been reclassified to conform to the current year presentation.
The Company is headquartered in Savannah, Georgia and, as of December 31, 2010, had eleven banking offices and thirteen ATMs in Savannah, Garden City, Skidaway Island, Whitemarsh Island, Pooler, Tybee Island and Richmond Hill, Georgia and Hilton Head Island and Bluffton, South Carolina. The Company also has mortgage lending offices in Savannah, Richmond Hill and Hilton Head Island and an investment management office in Savannah.
Savannah and Bryan are located in the relatively diverse and growing Savannah Metropolitan Statistical Area (“Savannah MSA”). The diversity of major employers includes manufacturing, port related transportation, construction, military, healthcare, tourism, education, warehousing and the supporting services and products for each of these major employers. The real estate market is experiencing moderate government growth and very minimal commercial and residential growth. Coastal Georgia and South Carolina continue to be desired retiree residential destinations as well as travel destinations. The Savannah MSA and Coastal South Carolina markets have both experienced significant devaluation in real estate prices.
The primary risks to the Company include trends or events that would cause or result in a significant decline in local employment, real estate values, loans or core deposits. The events in the national economy have filtered down to the Company’s local markets and the slow down in real estate activity has negatively impacted the Company. The Company operates in competitive markets with the related challenges of competitive pricing on loans, deposits and other banking services. Competition for the best talent is also a strategic challenge faced in competitive markets.
The primary strategic objectives of the Company are growth in loans, deposits, assets under management, product lines and service quality in existing markets, and quality expansion into new markets, within acceptable risk parameters, which results in enhanced shareholder value. The Company believes that the management team and the operational and internal control infrastructure are largely in place to execute the Board of Directors’ (“Board”) objectives over the long term.
F-37
The Savannah Bancorp, Inc. – 2010 Annual Report
Managements's Discussion and Analysis of Financial Condition and Results of Operations
___________________________________________________________________________________________________________________
Critical Accounting Estimates
Allowance for Loan Losses
The Company considers its policies regarding the allowance for loan losses to be its most critical accounting estimate due to the significant degree of management judgment involved. The allowance for loan losses is established through charges to earnings in the form of a provision for loan losses based on management's continuous evaluation of the loan portfolio. Loan losses and recoveries are charged or credited directly to the allowance. The amount of the allowance reflects management's opinion of an adequate level to absorb probable losses inherent in the loan portfolio at December 31, 2010. The amount charged to the provision and the level of the allowance is based on management's judgment and is dependent upon growth in the loan portfolio, the total amount of past due and nonperforming loans, recent charge-off levels, known loan deteriorations and concentrations of credit. Other factors affecting the allowance include market interest rates, loan sizes, portfolio maturity and composition, collateral values and general economic conditions. Finally, management's assessment of probable losses, based upon internal credit grading of the loans and periodic reviews and assessments of credit risk associated with particular loans, is considered in establishing the amount of the allowance.
No assurance can be given that the Company will not sustain loan losses which would be sizable in relationship to the amount reserved or that subsequent evaluation of the loan portfolio, in light of conditions and factors then prevailing, will not require significant changes in the allowance for loan losses by future charges or credits to earnings. The allowance for loan losses is also subject to review by various regulatory agencies through their periodic examinations of the Subsidiary Banks. Such examinations could result in required changes to the allowance for loan losses. No adjustment in the allowance or significant adjustments to the Subsidiary Banks’ internally classified loans were made as a result of their most recent regulatory examinations.
The allowance for loan losses totaled $20,350,000 or 2.46 percent of total loans at December 31, 2010. This is compared to an allowance of $17,678,000 or 2.00 percent of total loans at December 31, 2009. For 2010, the Company reported net charge-offs of $18,348,000 or 2.26 percent of average loans. This is compared to net charge-offs of $8,687,000 or 1.03 percent of average loans for 2009. The significantly higher level of charge-offs resulted primarily from continued weakness in the Company’s local residential real estate markets. During 2010 and 2009, a provision for loan losses of $21,020,000 and $13,065,000, respectively, was added to the allowance for loan losses. Real estate-related charge-offs, continued weakness in the Company’s local real estate markets, and level or declining real estate values provide the basis for the higher provision for loan losses.
The Company's nonperforming assets consist of loans on nonaccrual status, loans which are contractually past due 90 days or more on which interest is still being accrued, and other real estate owned. Nonaccrual loans of $32,836,000 and loans past due 90 days or more and still accruing interest of $3,064,000 totaled $35,900,000, or 4.34 percent of gross loans, at December 31, 2010. Nonaccrual loans of $32,545,000 and loans past due 90 days or more and still accruing interest of $1,570,000 totaled $34,115,000, or 3.86 percent of gross loans, at December 31, 2009. Generally, loans are placed on nonaccrual status when the collection of the principal or interest in full becomes doubtful. Management typically writes down loans through a charge to the allowance when it determines they are impaired. Nonperforming assets also included $13,199,000 and $8,329,000 of other real estate owned at December 31, 2010 and 2009, respectively. Management is aggressively pricing and marketing the other real estate owned.
Impaired loans, which include loans modified in troubled debt restructurings, totaled $53,869,000 and $54,054,000 at December 31, 2010 and 2009, respectively.
At December 31, 2010 nonperforming loans consisted primarily of $16.4 million of land, lot and construction and development related loans and $14.5 million of improved residential real estate-secured loans. Less than one percent of the nonperforming loans were unsecured. The largest nonperforming relationship consists of four loans for $7.7 million to a residential developer in the Bluffton/Hilton Head Island, South Carolina (“Bluffton/HHI”) market. The loans are secured by residential land and lots. Approximately $2,050,000 of the allowance was allocated to this relationship as a specific reserve. The next largest nonperforming relationship consists of four loans for $3.0 million to a residential developer in the Effingham County, Georgia market. The loans are secured by residential land and lots and completed 1-4 family properties.
F-38
The Savannah Bancorp, Inc. – 2010 Annual Report
Managements's Discussion and Analysis of Financial Condition and Results of Operations
___________________________________________________________________________________________________________________
The Company charged-off $1,500,000 on this relationship in 2010 and still has approximately $265,000 of the allowance allocated as a specific reserve and $63,000 allocated as a general reserve. The Company has another nonperforming relationship consisting of four loans for $3.0 million secured by 1-4 family residential rental properties on Tybee Island, Georgia. The Company is in process of foreclosing on the properties and does not have any amount reserved in the allowance based on appraisals of the properties and the Company’s testing for impairment.
The Company continues to devote significant internal and external resources to managing the past due and classified loans. The Company has performed extensive internal and external loan review procedures and analyses on the loan portfolio. The Company charges-down loans as appropriate before the foreclosure process is complete and often before they are past due.
If the allowance for loan losses had changed by five percent, the effect on net income would have been approximately $660,000. If the allowance had to be increased by this amount, it would not have changed the Subsidiary Banks’ status as well-capitalized financial institutions.
Changes in the allowance for loan losses from 2006 through 2010 are summarized as follows:
|
($ in thousands)
|
2010
|
2009
|
2008
|
2007
|
2006
|
|
Balance at the beginning of the year
|
$ 17,678
|
$ 13,300
|
$ 12,864
|
$ 8,954
|
$ 7,813
|
|
Charge-offs – commercial
|
(1,080)
|
(459)
|
(387)
|
(150)
|
-
|
|
Charge-offs – consumer
|
(116)
|
(210)
|
(85)
|
(103)
|
(125)
|
|
Charge-offs – real estate
|
(17,569)
|
(8,224)
|
(5,242)
|
(621)
|
(381)
|
|
Charge-offs – total
|
(18,765)
|
(8,893)
|
(5,714)
|
(874)
|
(506)
|
|
Recoveries – commercial
|
17
|
22
|
13
|
6
|
6
|
|
Recoveries – consumer
|
28
|
29
|
28
|
43
|
54
|
|
Recoveries – real estate
|
372
|
155
|
109
|
60
|
2
|
|
Recoveries – total
|
417
|
206
|
150
|
109
|
62
|
|
Net charge-offs
|
(18,348)
|
(8,687)
|
(5,564)
|
(765)
|
(444)
|
|
Provision for loan losses
|
21,020
|
13,065
|
6,000
|
4,675
|
1,585
|
|
Balance at the end of the year
|
$ 20,350
|
$ 17,678
|
$ 13,300
|
$ 12,864
|
$ 8,954
|
|
Ratio of net charge-offs to average loans
|
2.26%
|
1.03%
|
0.68%
|
0.10%
|
0.07%
|
The allowance for loan losses is allocated by loan category based on management's assessment of risk within the various categories of loans. Loans are segregated by category and by credit risk rating within each category. The allowance for loan losses is allocated to each category by applying reserve percentages to each category. These percentages are based upon management's assessment of risk inherent within each category and the historical and anticipated loss rates within each category.
The Company’s allocation of the allowance for loan losses is presented in the following table:
|
($ in thousands)
|
2010
|
2009
|
2008
|
2007
|
2006
|
|
Commercial
|
$ 1,528
|
$ 977
|
$ 760
|
$ 750
|
$ 900
|
|
Real estate-construction
|
|||||
|
and development
|
671
|
2,556
|
5,291
|
4,150
|
4,350
|
|
Real estate-mortgage
|
17,633
|
13,874
|
7,061
|
6,750
|
2,350
|
|
Consumer
|
518
|
227
|
188
|
200
|
400
|
|
Unallocated
|
-
|
44
|
-
|
1,014
|
954
|
|
Total allowance for
|
|||||
|
loan losses
|
$ 20,350
|
$ 17,678
|
$ 13,300
|
$ 12,864
|
$ 8,954
|
F - 39
The Savannah Bancorp, Inc. – 2010 Annual Report
Managements's Discussion and Analysis of Financial Condition and Results of Operations
___________________________________________________________________________________________________________________
The composition of the loan portfolio as a percentage of total loans is presented below:
|
($ in thousands)
|
2010
|
2009
|
2008
|
2007
|
2006
|
|
Commercial
|
9.1%
|
10.1%
|
9.5%
|
8.8%
|
8.0%
|
|
Real estate-construction
|
|||||
|
and development
|
2.5
|
7.0
|
11.5
|
16.6
|
23.1
|
|
Real estate-mortgage
|
86.6
|
81.2
|
77.0
|
72.3
|
66.6
|
|
Consumer
|
1.8
|
1.7
|
2.0
|
2.3
|
2.3
|
|
Total loans
|
100.0%
|
100.0%
|
100.0%
|
100.0%
|
100.0%
|
Impairment of Loans
The Company measures impaired loans based on the present value of expected future cash flows discounted at the loan’s effective interest rate, the loan’s obtainable market price, or the fair value of the collateral if the loan is collateral dependent. A loan is considered impaired when it is probable that the Company will be unable to collect the scheduled payments of principal or interest when due according to the contractual terms of the loan agreement. A loan is not considered impaired during a period of delay in payment if the ultimate collection of all amounts due is expected. The Company maintains a valuation allowance or charges-down the loan balance to the extent that the measure of value of an impaired loan is less than the recorded investment.
Other Real Estate Owned
Assets acquired through, or in lieu of, loan foreclosure are held for sale and are initially recorded at fair value less costs to sell at the date of foreclosure, establishing a new cost basis. Subsequent to foreclosure, management periodically performs valuations of the foreclosed assets based on updated appraisals, general market conditions, length of time the properties have been held, and our ability and intention with regard to continued ownership of the properties. The Company may incur additional write-downs of foreclosed assets to fair value less costs to sell if valuations indicate a further other than temporary deterioration in market conditions.
F - 40
The Savannah Bancorp, Inc. – 2010 Annual Report
Managements's Discussion and Analysis of Financial Condition and Results of Operations
___________________________________________________________________________________________________________________
Table 6 – Allowance for Loan Losses and Nonperforming Assets
|
December 31,
|
||
|
($ in thousands)
|
2010
|
2009
|
|
Allowance for loan losses
|
||
|
Balance at beginning of period
|
$ 17,678
|
$ 13,300
|
|
Provision for loan losses
|
21,020
|
13,065
|
|
Net charge-offs
|
(18,348)
|
(8,687)
|
|
Balance at end of period
|
$ 20,350
|
$ 17,678
|
|
As a % of loans
|
2.46%
|
2.00%
|
|
As a % of nonperforming loans
|
56.69%
|
51.77%
|
|
As a % of nonperforming assets
|
41.45%
|
41.62%
|
|
Risk element assets
|
||
|
Nonaccruing loans
|
$ 32,836
|
$ 32,545
|
|
Loans past due 90 days – accruing
|
3,064
|
1,570
|
|
Total nonperforming loans
|
35,900
|
34,115
|
|
Other real estate owned
|
13,199
|
8,329
|
|
Total nonperforming assets
|
$ 49,099
|
$ 42,444
|
|
Loans past due 30-89 days
|
$ 11,164
|
$ 5,182
|
|
Nonperforming loans as a % of loans
|
4.34%
|
3.86%
|
|
Nonperforming assets as a % of loans
|
||
|
and other real estate owned
|
5.85%
|
4.76%
|
|
Nonperforming assets as a % of assets
|
4.60%
|
4.04%
|
F - 41
The Savannah Bancorp, Inc. – 2010 Annual Report
Managements's Discussion and Analysis of Financial Condition and Results of Operations
___________________________________________________________________________________________________________________
Results of Operations
2010 Compared with 2009
Net loss for 2010 was $3,989,000 compared to net income of $929,000 in 2009. Net loss per diluted share was $0.60 in 2010 versus net income per diluted share of $0.16 in 2009. The decline in earnings results primarily from a higher provision for loan losses and lower gain on sale of securities and hedges, partially offset by higher net interest income. Return on average equity was (4.73) percent, return on average assets was (0.37) percent and the efficiency ratio was 66.00 percent in 2010. Pretax earnings before the provision for loan losses and gain/loss on sale of securities and foreclosed assets were $15,765,000 in 2010 versus $14,596,000 in 2009.
Average interest-earning assets increased 4.6 percent to $979 million in 2010 from $936 million in 2009. Net interest income was $33.6 million in 2010 compared to $32.3 million in 2009, an increase of 4.0 percent. Average loans were $810 million for 2010, 3.7 percent lower when compared to $841 million in 2009. Shareholders’ equity increased to $86 million at December 31, 2010 from $79 million at December 31, 2009. In June 2010, the Company raised $11.2 million, net of issuance costs, in a public common stock offering. The Company’s total capital to risk-weighted assets ratio was 12.40 percent at December 31, 2010, which exceeds the 10 percent required by the regulatory agencies to maintain well-capitalized status. The net interest margin decreased to 3.43 percent in 2010 from 3.46 percent in 2009. As shown in Table 9, the decline in net interest margin was primarily due to higher levels of noninterest-earning assets. The interest rate spread increased five basis points in 2010. As shown in Table 8, the Company’s balance sheet continues to be asset-sensitive since the interest-earning assets reprice faster than interest-bearing liabilities. Rising interest rates favorably impact the net interest margin of an asset-sensitive balance sheet and falling rates adversely impact the net interest margin. However, when the prime rate stops decreasing, the interest rates on time deposits, certain non-maturity deposits and other funding sources will continue to decline due to the re-pricing lag associated with those liabilities. In addition the Company has instituted interest rate floors on many variable rate loans such that the loans will not reprice in a rising rate environment until the floating rate exceeds the floor.
The provision for loan losses was $21,020,000 for 2010, compared to $13,065,000 in 2009. Loans declined $57 million in 2010 versus growth of $19 million in 2009. The higher provision for loan losses in 2010 as compared to 2009 is primarily due to real estate-related charge-offs and continued weakness in the Company’s local real estate markets. Net charge-offs were $18,348,000 in 2010 as compared to $8,687,000 in 2009. The significant increase in charge-offs resulted primarily from weakness in the Company’s local residential real estate markets.
Noninterest income was $7,311,000 in 2010 compared to $8,822,000 in 2009, a decrease of $1,511,000 or 17 percent. The decrease was primarily due to $1,511,000 lower gain on sale of securities and $871,000 lower gain on hedges, partially offset by $248,000 higher trust and asset management fees and $678,000 higher other operating income. The increase in other operating income in 2010 mainly consisted of the Company selling its 50 percent interest in a parking lot that resulted in a $255,000 gain and the Company realizing a $308,000 gain on life insurance proceeds.
Noninterest expense was $26,977,000 in 2010 compared to $26,978,000 in 2009. In 2010, noninterest expense included approximately $600,000 of expenses related to the purchase of First National.
Income tax benefit was $3,130,000 in 2010 versus income tax expense of $155,000 in 2009. The combined effective federal and state tax rates were 44.0 percent and 14.3 percent, respectively. The difference in tax rates is due primarily to the impact of tax credits on lower taxable income. The Company has never recorded a valuation allowance against deferred tax assets. All significant deferred tax assets are considered to be realizable due to expected future taxable income.
F - 42
The Savannah Bancorp, Inc. – 2010 Annual Report
Managements's Discussion and Analysis of Financial Condition and Results of Operations
___________________________________________________________________________________________________________________
2009 Compared with 2008
Net income for 2009 was $929,000, a decrease of 85 percent from $6,006,000 in 2008. Net income per diluted share was $0.16 and $1.01 in 2009 and 2008, respectively, a decrease of 84 percent. The earnings decrease was primarily attributable to a higher provision for loan losses, higher FDIC insurance premiums and a higher loss on sale of foreclosed assets partially offset by a higher gain on sale of securities. Return on average equity was 1.16 percent, return on average assets was 0.09 percent and the efficiency ratio was 65.60 percent in 2009.
Average interest-earning assets increased 4.2 percent to $936 million in 2009 from $898 million in 2008. Net interest income was $32.3 million in 2009 compared to $32.2 million in 2008. Average loans were $841 million for 2009, 2.3 percent higher when compared to $822 million in 2008. Shareholders’ equity decreased to $79 million at December 31, 2009 from $81 million at December 31, 2008 due solely to a decrease in accumulated other comprehensive income. The Company’s total capital to risk-weighted assets ratio was 11.56 percent at December 31, 2009, which exceeds the 10 percent required by the regulatory agencies to maintain well-capitalized status. The net interest margin decreased to 3.46 percent in 2009 from 3.58 percent in 2008. As shown in Table 10, the decline in net interest margin was primarily due to higher levels of noninterest-earning assets. The interest rate spread increased five basis points in 2009.
The provision for loan losses was $13,065,000 for 2009, compared to $6,000,000 in 2008. Loan growth was $19 million in 2009 compared to $56 million in 2008. The higher provision for loan losses in 2009 as compared to 2008 is mainly attributable to real estate-related charge-offs and continued weakness in the Company’s local real estate markets. Net charge-offs were $8,687,000 in 2009 as compared to $5,564,000 in 2008. The significant increase in charge-offs resulted primarily from continued weakness in the Company’s local residential real estate markets particularly in the Bluffton/HHI area.
Noninterest income was $8,822,000 in 2009 compared to $7,675,000 in 2008, an increase of $1,147,000 or 15 percent. The increase was the result of a $2,119,000 gain on sale of securities, partially offset by $481,000 lower trust and asset management fees and $415,000 lower gain on hedges.
Noninterest expense was $26,978,000 in 2009 compared to $24,742,000 in 2008, an increase of $2,236,000, or 9.0 percent. Noninterest expense included a $2,338,000 higher loss on the sale and write-down of foreclosed assets, $1,233,000 of higher FDIC insurance premiums, a 188 percent increase, partially offset by $1,438,000 in lower salaries and employee benefits, or 11 percent decrease.
Income tax expense was $155,000 in 2009 and $3,170,000 in 2008. The combined effective federal and state tax rates were 14.3 percent and 34.5 percent, respectively. The lower income tax rate in 2009 was due to the impact of tax credits on lower taxable income. The Company has never recorded a valuation allowance against deferred tax assets. All significant deferred tax assets are considered to be realizable due to expected future taxable income.
F - 43
The Savannah Bancorp, Inc. – 2010 Annual Report
Managements's Discussion and Analysis of Financial Condition and Results of Operations
___________________________________________________________________________________________________________________
Balance Sheet Activity
The major changes in the Company’s assets and liabilities for the current and prior period are shown in the consolidated statements of cash flows. Average total assets increased 5.9 percent to $1.08 billion in 2010 from $1.02 billion in 2009. Total assets were $1.07 billion and $1.05 billion at December 31, 2010 and 2009, respectively, an increase of 1.9 percent. The deposits and related cash from the First National acquisition were used primarily to purchase investment securities and reduce the Company’s reliance on higher-priced local deposits, brokered deposits and wholesale funding. The increase in securities of $50 million and interest-bearing deposits of $28 million during 2010 was funded in part by $39 million in deposit growth. In addition loans decreased $57 million and short-term borrowings and FHLB advances decreased $22 million.
The Company has classified all investment securities as available for sale. Lower short-term interest rates resulted in an overall net unrealized gain in the investment portfolio. The unrealized gain or loss amounts are recorded in shareholders’ equity as accumulated other comprehensive income (loss), net of tax.
The Subsidiary Banks continue to utilize non-local deposits and other wholesale funding sources. However, in 2010, the Company significantly reduced its use of brokered deposits and wholesale funding. Total deposits included brokered time deposits and institutional money market accounts of $98 million at December 31, 2010 and $172 million at December 31, 2009. At December 31, 2010 and 2009, brokered time deposits include $36 million and $38 million, respectively, of reciprocal deposits from the Company’s local customers that are classified as brokered because they are placed in the CDARS network for deposit insurance purposes.
Loans
The following table shows the composition of the loan portfolio at December 31, 2010 and 2009, including a more detailed breakdown of real estate secured loans by collateral type and purpose.
Table 7 - Loan Concentrations
|
2010
|
% of
Total
|
2009
|
% of
Total
|
% Change
($)
|
|
|
Non-residential real estate
|
|||||
|
Owner-occupied
|
$ 122,753
|
15
|
$ 108,069
|
12
|
14
|
|
Non owner-occupied
|
191,255
|
23
|
188,460
|
22
|
1.5
|
|
Construction
|
3,157
|
-
|
5,352
|
1
|
(41)
|
|
Commercial land and lot development
|
39,882
|
5
|
47,080
|
5
|
(15)
|
|
Total non-residential real estate
|
357,047
|
43
|
348,961
|
40
|
2.3
|
|
Residential real estate
|
|||||
|
Owner-occupied – 1-4 family
|
81,293
|
10
|
95,741
|
11
|
(15)
|
|
Non owner-occupied – 1-4 family
|
160,426
|
19
|
158,172
|
18
|
1.4
|
|
Construction
|
13,502
|
2
|
27,061
|
3
|
(50)
|
|
Residential land and lot development
|
68,681
|
8
|
92,346
|
10
|
(26)
|
|
Home equity lines
|
55,917
|
7
|
57,527
|
6
|
(2.8)
|
|
Total residential real estate
|
379,819
|
46
|
430,847
|
48
|
(12)
|
|
Total real estate loans
|
736,866
|
89
|
779,808
|
88
|
(5.5)
|
|
Commercial
|
74,889
|
9
|
89,380
|
10
|
(16)
|
|
Consumer
|
15,026
|
2
|
14,971
|
2
|
-
|
|
Unearned fees, net
|
(219)
|
-
|
(273)
|
-
|
20
|
|
Total loans, net of unearned fees
|
$ 826,562
|
100
|
$ 883,886
|
100
|
(6.5)
|
F - 44
The Savannah Bancorp, Inc. – 2010 Annual Report
Managements's Discussion and Analysis of Financial Condition and Results of Operations
___________________________________________________________________________________________________________________
Capital Resources
The Office of the Comptroller of the Currency has adopted capital requirements that specify the minimum capital level for which no prompt corrective action is required. In addition, the FDIC assesses FDIC insurance premiums based on certain “well-capitalized” risk-based and equity capital ratios. As of December 31, 2010, the Subsidiary Banks and the Company exceeded the minimum requirements necessary to be classified as “well-capitalized.”
Total equity capital for the Company was $85.8 million, or 8.04 percent of total assets, at December 31, 2010. Tier 1 capital was 11.13 percent of risk-weighted assets at the same date. In the second quarter 2010, the Company raised $11.2 million, net of issuance costs, in a common stock offering. Tier 1 capital at December 31, 2010 includes $10.0 million of trust preferred debt issued by the Company’s nonconsolidated subsidiaries.
Under Federal Reserve Bank holding company capital regulations, trust preferred debt qualifies for Tier 1 capital treatment up to a limit of 25 percent of tangible equity capital plus trust preferred debt. All of the Company’s trust preferred debt qualifies as Tier 1 capital.
Liquidity and Interest Rate Sensitivity Management
The objectives of balance sheet management include maintaining adequate liquidity and preserving reasonable balance between the repricing of interest sensitive assets and liabilities at favorable interest rate spreads. The objective of liquidity management is to ensure the availability of adequate funds to meet the loan demands and the deposit withdrawal needs of customers. This is achieved through maintaining a combination of sufficient liquid assets, core deposit growth and unused capacity to purchase and borrow funds in the money markets.
During 2010, portfolio loans decreased $57 million to $827 million and deposits increased $39 million to $924 million. The loan to deposit ratio was 89 and 100 percent at December 31, 2010 and 2009, respectively.
In addition to local deposit growth, primary funding and liquidity sources include borrowing capacity with the FHLB, temporary federal funds purchased lines with correspondent banks and non-local institutional and brokered deposits. Contingency funding and liquidity sources include the ability to sell loans, or participations in certain loans, to investors and borrowings from the Federal Reserve Bank (“FRB”) discount window.
The Subsidiary Banks have Blanket Floating Lien Agreements with the FHLB. Under these agreements, the Subsidiary Banks have pledged certain 1-4 family first mortgage loans, commercial real estate loans, home equity lines of credit and second mortgage residential loans. The Subsidiary Banks’ individual borrowing limits range from 20 to 25 percent of assets. In aggregate, the Subsidiary Banks had secured borrowing capacity of approximately $136 million of which $17.7 million was advanced at December 31, 2010. These credit arrangements serve as a core funding source as well as liquidity backup for the Subsidiary Banks. The Subsidiary Banks also have conditional federal funds borrowing lines available from correspondent banks that management believes can provide up to $15 million of funding needs for 30-60 days. The Subsidiary Banks have been approved to access the FRB discount window to borrow on a secured basis at 50 basis points over the Federal Funds Target Rate. The amount of credit available is subject to the amounts and types of collateral available when borrowings are requested. The Subsidiary Banks were approved by the FRB under the borrower-in-custody of collateral (“BIC”) arrangement. This temporary liquidity arrangement allows collateral to be maintained at the Subsidiary Banks rather than being delivered to the FRB or a third-party custodian. At December 31, 2010, the Company had secured borrowing capacity of $78.4 million with the FRB and no amounts outstanding.
A continuing objective of interest rate sensitivity management is to maintain appropriate levels of variable rate assets, including variable rate loans and shorter maturity investments, relative to interest rate sensitive liabilities, in order to control potential negative impacts upon earnings due to changes in interest rates. Interest rate sensitivity management requires analyses and actions that take into consideration volumes of assets and liabilities repricing and the timing and magnitude of their price changes to determine the effect upon net interest income. The Company utilizes hedging strategies to reduce interest rate risk as noted below.
F-45
The Savannah Bancorp, Inc. – 2010 Annual Report
Managements's Discussion and Analysis of Financial Condition and Results of Operations
___________________________________________________________________________________________________________________
The Company’s cash flow, maturity and repricing gap at December 31, 2010 was $95 million at one year, or 9.8 percent of total interest-earning assets. At December 31, 2009 the gap at one year was $53 million, or 5.5 percent of total interest-earning assets. Interest-earning assets with maturities over five years totaled approximately $55 million, or 5.7 percent of total interest-earning assets. See Table 8 for cash flow, maturity and repricing gap. The gap position between one and five years is of less concern because management has time to respond to changing financial conditions and interest rates with actions that reduce the impact of the longer-term gap positions on net interest income. However, interest-earning assets with maturities and/or repricing dates over five years may include significant rate risk and market value of equity concerns in the event of significant interest rate increases.
The Company is asset-sensitive within one year. While net interest income increased in 2010 compared to 2009, the net interest margin was down slightly. The interest rate spread increased in 2010; however, the Company had higher levels of nonaccrual loans and other noninterest-earning assets. The Company also had a higher level of interest-bearing deposits and investments. Our investment securities and time deposits continue to re-price lower.
The Company continues to implement various strategies to reduce its asset-sensitive position, primarily through the increased use of fixed rate loans, interest rate floors on variable rate loans, short maturity funding sources and hedging strategies such as interest rate floors, collars and swaps. These actions have reduced the Company’s exposure to falling interest rates. In the first quarter of 2009, the Company terminated a $15 million interest rate collar position for net proceeds of $512,000. In April 2009, the Company terminated a $25 million interest rate collar position for net proceeds of $787,000. The amounts in other comprehensive income related to the terminated transactions were reclassified into earnings over the remaining lives of the original hedged transactions, all of which expired in 2010.
Management monitors interest rate risk quarterly using rate-sensitivity forecasting models and other balance sheet analytical reports. If and when projected interest rate risk exposures are outside of policy tolerances or desired positions, specific strategies to return interest rate risk exposures to desired levels are developed by management, approved by the Asset-Liability Committee and reported to the Board.
Off-Balance Sheet Arrangements
In order to meet the financing needs of its customers, the Company is a party to financial instruments with off-balance sheet risks in the normal course of business. At December 31, 2010, the Company had unfunded commitments to extend credit of $81.1 million and outstanding standby letters of credit of $2.7 million. Since many of the commitments are expected to expire without being drawn upon, the total commitment amounts do not necessarily represent future cash requirements. The Company uses the same credit policies in making commitments and conditional obligations as it does for on-balance sheet instruments. Management does not anticipate that funding obligations arising from these financial instruments will adversely impact its ability to fund future loan growth or deposit withdrawals.
F - 46
The Savannah Bancorp, Inc. – 2010 Annual Report
Managements's Discussion and Analysis of Financial Condition and Results of Operations
___________________________________________________________________________________________________________________
Forward Looking Statements
This MD & A and other Company communications and statements may contain "forward-looking statements." These forward-looking statements may include, among others, statements about our beliefs, plans, objectives, goals, expectations, estimates and intentions that are subject to significant risks and uncertainties and which may change based on various factors, many of which are beyond our control. The words "forecast," "believe," "anticipate," "estimate," "expect," "intend," "plan" and similar expressions are intended to identify forward-looking statements. The following factors, among others, could cause our financial performance to differ materially from what is contemplated in those forward-looking statements:
|
*
|
The strength of the United States economy in general and the strength of the local economies in which we conduct operations may be different than expected resulting in, among other things, a deterioration in credit quality or a reduced demand for credit, including the resultant effect on our loan portfolio and allowance for loan losses;
|
|
*
|
The effects of and changes in trade, monetary and fiscal policies and laws, including interest rate policies of the Board of Governors of the Federal Reserve System;
|
|
*
|
Inflation, interest rate, market and monetary fluctuations;
|
|
*
|
Increases in regulatory capital requirements for banking organizations generally, which may adversely affect the Company’s ability to expand its business or could cause it to shrink its business;
|
|
*
|
The risks of changes in interest rates and the yield curve on the levels, composition and costs of deposits, loan demand, and the values of loan collateral, securities, and interest rate sensitive assets and liabilities;
|
|
*
|
Risks related to loans secured by real estate, including further adverse developments in the real estate markets that would decrease the value and marketability of collateral;
|
|
*
|
Adverse conditions in the stock market and other capital markets and the impact of those conditions on our capital markets and capital management activities, including our investment and wealth management advisory businesses;
|
|
*
|
Changes in the cost and availability of funding due to changes in the deposit market and credit market, or the way in which the Company is perceived in such markets;
|
|
*
|
The effects of harsh weather conditions, including hurricanes;
|
|
*
|
Changes in U.S. foreign or military policy;
|
|
*
|
The failure to attract or retain key personnel;
|
|
*
|
The timely development of competitive new products and services by us and the acceptance of those products and services by new and existing customers;
|
|
*
|
The willingness of customers to accept third-party products marketed by us;
|
|
*
|
The willingness of customers to substitute competitors' products and services for our products and services and vice versa;
|
|
*
|
The impact of changes in financial services laws and regulations (including laws concerning taxes, banking, securities and insurance);
|
|
*
|
Technological changes;
|
|
*
|
Changes in consumer spending and saving habits;
|
|
*
|
The effect of corporate restructuring, acquisitions or dispositions, including the actual restructuring and other related charges and the failure to achieve the expected gains, revenue growth or expense savings from such corporate restructuring, acquisitions or dispositions;
|
|
*
|
The growth and profitability of our noninterest or fee income being less than expected;
|
|
*
|
Unanticipated regulatory or judicial proceedings;
|
|
*
|
The impact of changes in accounting policies by the SEC or the Financial Accounting Standards Board;
|
|
*
|
The limited trading activity or our common stock;
|
|
*
|
The effects of our lack of a diversified loan portfolio, including the risks of geographic concentrations;
|
|
*
|
Adverse changes in the financial performance and/or condition of our borrowers, which could impact the repayment of those borrowers' outstanding loans; and
|
The Savannah Bancorp, Inc. – 2010 Annual Report
Managements's Discussion and Analysis of Financial Condition and Results of Operations
___________________________________________________________________________________________________________________
|
*
|
Our success at managing the risks involved in the foregoing.
|
We caution that the foregoing list of important factors is not exhaustive. Also, we do not undertake to update any forward-looking statements, whether written or oral, that may be made from time to time by us or on our behalf except as may be required by our disclosure obligations in filings we make with the SEC under federal securities laws.
Table 8 - Cash Flow/Maturity Gap and Repricing Data
The following is the cash flow/maturity and repricing data for the Company as of December 31, 2010:
|
($ in thousands)
|
0 - 3
|
3 - 12
|
1 - 3
|
3 - 5
|
Over 5
|
||
|
Immediate
|
Months
|
Months
|
Years
|
Years
|
Years
|
Total
|
|
|
Interest-earning assets
|
|||||||
|
Investment securities
|
$ -
|
$ 11,019
|
$ 22,832
|
$ 44,718
|
$ 27,537
|
$ 31,993
|
$ 138,099
|
|
Federal funds sold
|
110
|
-
|
-
|
-
|
-
|
-
|
110
|
|
Interest-bearing deposits
|
39,391
|
246
|
655
|
544
|
-
|
-
|
40,836
|
|
Loans - fixed rates
|
-
|
117,357
|
160,807
|
163,677
|
33,624
|
22,167
|
497,632
|
|
Loans - variable rates
|
-
|
283,015
|
7,798
|
4,408
|
356
|
1,242
|
296,819
|
|
Total interest-earning assets
|
39,501
|
411,637
|
192,092
|
213,347
|
61,517
|
55,402
|
973,496
|
|
Interest-bearing liabilities
|
|||||||
|
NOW and savings **
|
-
|
8,033
|
16,065
|
40,162
|
48,194
|
48,194
|
160,648
|
|
Money market accounts **
|
-
|
76,004
|
78,168
|
44,667
|
67,001
|
-
|
265,840
|
|
Time deposits
|
-
|
105,297
|
229,322
|
37,116
|
23,290
|
6,507
|
401,532
|
|
Short-term borrowings
|
15,075
|
-
|
-
|
-
|
-
|
-
|
15,075
|
|
Other borrowings
|
-
|
1,505
|
4,517
|
4,514
|
-
|
-
|
10,536
|
|
FHLB advances
|
2,000
|
-
|
2,001
|
3,511
|
11
|
10,135
|
17,658
|
|
Subordinated debt
|
-
|
10,310
|
-
|
-
|
-
|
-
|
10,310
|
|
Total interest-bearing liabilities
|
17,075
|
201,149
|
330,073
|
129,970
|
138,496
|
64,836
|
881,599
|
|
GAP-Excess assets (liabilities)
|
22,426
|
210,488
|
(137,981)
|
83,377
|
(76,979)
|
(9,434)
|
91,897
|
|
GAP-Cumulative
|
$ 22,426
|
$ 232,914
|
$ 94,933
|
$ 178,310
|
$ 101,331
|
$ 91,897
|
$ 91,897
|
|
Cumulative sensitivity ratio *
|
2.31
|
2.07
|
1.17
|
1.26
|
1.12
|
1.10
|
1.10
|
* Cumulative interest-earning assets/cumulative interest-bearing liabilities
** Repricing of Now, savings and local money market accounts based on estimated percentages of market interest rate changes.
Note – At December 31, 2010 the Company had unfunded loan commitments and unfunded lines of credit totaling $81.1 million. The Company believes the likelihood of these commitments either being totally funded or funded at the same time is low. However, should a significant funding requirement occur, the Company has available borrowing capacity from the FHLB of $118 million. Additionally, further sources of funding include FRB advances, brokered time deposits and certain other non-local deposits.
F - 48
The Savannah Bancorp, Inc. – 2010 Annual Report
Managements's Discussion and Analysis of Financial Condition and Results of Operations
___________________________________________________________________________________________________________________
Table 9 - Average Balance Sheet and Rate/Volume Analysis - 2010 and 2009
The following table presents average balances of the Company and the Subsidiary Banks on a consolidated basis, the taxable-equivalent interest earned and the rate paid thereon during 2010 and 2009.
|
Taxable-Equivalent
|
(a) Variance
|
|||||||||
|
Average Balance
|
Average Rate
|
Interest (b)
|
Vari-
|
Attributable to
|
||||||
|
2010
|
2009
|
2010
|
2009
|
2010
|
2009
|
ance
|
Rate
|
Volume
|
||
|
($ in thousands)
|
(%)
|
($ in thousands)
|
($ in thousands)
|
|||||||
|
Assets
|
||||||||||
|
$ 50,461
|
$ 5,963
|
0.29
|
0.75
|
Interest-bearing deposits
|
$ 147
|
$ 45
|
$ 102
|
$ (27)
|
$ 129
|
|
|
104,367
|
77,844
|
2.35
|
4.20
|
Investments - taxable
|
2,456
|
3,273
|
(817)
|
(1,440)
|
623
|
|
|
7,386
|
3,438
|
4.45
|
4.94
|
Investments - non-taxable
|
329
|
170
|
159
|
(17)
|
176
|
|
|
6,738
|
7,339
|
0.30
|
0.25
|
Federal funds sold
|
20
|
18
|
2
|
4
|
(2)
|
|
|
810,484
|
841,033
|
5.55
|
5.60
|
Loans (c)
|
45,009
|
47,089
|
(2,080)
|
(421)
|
(1,659)
|
|
|
979,436
|
935,617
|
4.90
|
5.41
|
Total interest-earning assets
|
47,961
|
50,595
|
(2,634)
|
(1,901)
|
(733)
|
|
|
99,028
|
82,853
|
Noninterest-earning assets
|
||||||||
|
$ 1,078,464
|
$ 1,018,470
|
Total assets
|
||||||||
|
Liabilities and equity
|
||||||||||
|
Deposits
|
||||||||||
|
$ 125,994
|
$123,715
|
0.36
|
0.46
|
NOW accounts
|
450
|
572
|
(122)
|
(124)
|
2
|
|
|
18,402
|
16,071
|
0.39
|
0.65
|
Savings accounts
|
71
|
104
|
(33)
|
(42)
|
9
|
|
|
199,331
|
131,402
|
1.49
|
1.74
|
Money market accounts
|
2,974
|
2,281
|
693
|
(329)
|
1,022
|
|
|
54,927
|
86,044
|
0.83
|
1.48
|
MMA - institutional
|
456
|
1,272
|
(816)
|
(559)
|
(257)
|
|
|
185,505
|
157,923
|
2.20
|
3.32
|
CDs, $100M or more
|
4,081
|
5,239
|
(1,158)
|
(1,769)
|
611
|
|
|
86,523
|
117,120
|
1.01
|
2.01
|
CDs, broker
|
877
|
2,356
|
(1,479)
|
(1,171)
|
(308)
|
|
|
169,395
|
145,488
|
2.10
|
3.18
|
Other time deposits
|
3,551
|
4,630
|
(1,079)
|
(1,571)
|
492
|
|
|
840,077
|
777,763
|
1.48
|
2.12
|
Total interest-bearing deposits
|
12,460
|
16,454
|
(3,994)
|
(5,564)
|
1,570
|
|
|
30,609
|
37,744
|
3.72
|
2.77
|
Short-term/other borrowings
|
1,138
|
1,045
|
93
|
359
|
(266)
|
|
|
21,221
|
23,913
|
2.16
|
1.66
|
FHLB advances
|
458
|
397
|
61
|
120
|
(59)
|
|
|
10,310
|
10,310
|
2.97
|
3.51
|
Subordinated debt
|
306
|
362
|
(56)
|
(56)
|
-
|
|
|
Total interest-bearing
|
||||||||||
|
902,217
|
849,730
|
1.59
|
2.15
|
liabilities
|
14,362
|
18,258
|
(3,896)
|
(5,142)
|
1,246
|
|
|
86,458
|
82,406
|
Noninterest-bearing deposits
|
||||||||
|
5,470
|
6,530
|
Other liabilities
|
||||||||
|
84,319
|
79,804
|
Shareholders' equity
|
||||||||
|
$ 1,078,464
|
$1,018,470
|
Liabilities and equity
|
||||||||
|
3.31
|
3.26
|
Interest rate spread
|
||||||||
|
3.43
|
3.46
|
Net interest margin
|
||||||||
|
Net interest income
|
$33,599
|
$32,337
|
$1,262
|
$ 3,241
|
$(1,979)
|
|||||
|
$ 77,219
|
$ 85,887
|
Net earning assets
|
||||||||
|
$ 926,535
|
$860,169
|
Average deposits
|
||||||||
|
1.34
|
1.91
|
Average cost of deposits
|
||||||||
|
87%
|
98%
|
Average loan to deposit ratio
|
||||||||
|
(a)
|
This table shows the changes in interest income and interest expense for the comparative periods based on either changes in average volume or changes in average rates for interest-earning assets and interest-bearing liabilities. Changes which are not solely due to rate changes or solely due to volume changes are attributed to volume.
|
|
(b)
|
The taxable equivalent adjustment of $32 in 2010 and in 2009 results from tax exempt income less non-deductible TEFRA interest expense.
|
| (c) |
Average nonaccruing loans have been excluded from total average loans and included in noninterest-earning assets.
|
The Savannah Bancorp, Inc. – 2010 Annual Report
Managements's Discussion and Analysis of Financial Condition and Results of Operations
___________________________________________________________________________________________________________________
Table 10 - Average Balance Sheet and Rate/Volume Analysis - 2009 and 2008
The following table presents average balances of the Company and the Subsidiary Banks on a consolidated basis, the taxable-equivalent interest earned and the rate paid thereon during 2009 and 2008.
|
Taxable-Equivalent
|
(a) Variance
|
|||||||||
|
Average Balance
|
Average Rate
|
Interest (b)
|
Vari-
|
Attributable to
|
||||||
|
2009
|
2008
|
2009
|
2008
|
2009
|
2008
|
ance
|
Rate
|
Volume
|
||
|
($ in thousands)
|
(%)
|
($ in thousands)
|
($ in thousands)
|
|||||||
|
Assets
|
||||||||||
|
$ 5,963
|
$ 7,033
|
0.75
|
2.11
|
Interest-bearing deposits
|
$ 45
|
$ 149
|
$ (104)
|
$ (96)
|
$ (8)
|
|
|
77,844
|
60,136
|
4.20
|
4.98
|
Investments - taxable
|
3,273
|
3,002
|
271
|
(469)
|
740
|
|
|
3,438
|
1,883
|
4.94
|
5.46
|
Investments - non-taxable
|
170
|
103
|
67
|
(10)
|
77
|
|
|
7,339
|
6,805
|
0.25
|
1.95
|
Federal funds sold
|
18
|
133
|
(115)
|
(116)
|
1
|
|
|
-
|
765
|
-
|
7.82
|
Loans held for sale
|
-
|
60
|
(60)
|
-
|
(60)
|
|
|
841,033
|
821,673
|
5.60
|
6.47
|
Loans (c)
|
47,089
|
53,267
|
(6,178)
|
(7,149)
|
971
|
|
|
935,617
|
898,295
|
5.41
|
6.30
|
Total interest-earning assets
|
50,595
|
56,714
|
(6,119)
|
(7,995)
|
1,876
|
|
|
82,853
|
61,965
|
Noninterest-earning assets
|
||||||||
|
$1,018,470
|
$960,260
|
Total assets
|
||||||||
|
Liabilities and equity
|
||||||||||
|
Deposits
|
||||||||||
|
$123,715
|
$120,661
|
0.46
|
1.15
|
NOW accounts
|
572
|
1,396
|
(824)
|
(833)
|
9
|
|
|
16,071
|
15,488
|
0.65
|
0.88
|
Savings accounts
|
104
|
137
|
(33)
|
(36)
|
3
|
|
|
131,402
|
128,826
|
1.74
|
2.38
|
Money market accounts
|
2,281
|
3,079
|
(798)
|
(824)
|
26
|
|
|
86,044
|
68,464
|
1.48
|
2.66
|
MMA - institutional
|
1,272
|
1,827
|
(555)
|
(808)
|
253
|
|
|
157,923
|
147,576
|
3.32
|
4.52
|
CDs, $100M or more
|
5,239
|
6,685
|
(1,446)
|
(1,771)
|
325
|
|
|
117,120
|
85,790
|
2.01
|
3.49
|
CDs, broker
|
2,356
|
2,998
|
(642)
|
(1,270)
|
628
|
|
|
145,488
|
134,240
|
3.18
|
4.25
|
Other time deposits
|
4,630
|
5,720
|
(1,090)
|
(1,436)
|
346
|
|
|
777,763
|
701,045
|
2.12
|
3.11
|
Total interest-bearing deposits
|
16,454
|
21,842
|
(5,388)
|
(6,940)
|
1,152
|
|
|
37,744
|
27,153
|
2.77
|
2.19
|
Short-term/other borrowings
|
1,045
|
597
|
448
|
157
|
291
|
|
|
23,913
|
51,090
|
1.66
|
2.65
|
FHLB advances
|
397
|
1,358
|
(961)
|
(506)
|
(455)
|
|
|
10,310
|
10,310
|
3.51
|
6.21
|
Subordinated debt
|
362
|
642
|
(280)
|
(278)
|
(2)
|
|
|
Total interest-bearing
|
||||||||||
|
849,730
|
789,598
|
2.15
|
3.09
|
liabilities
|
18,258
|
24,439
|
(6,181)
|
(7,422)
|
1,241
|
|
|
82,406
|
83,678
|
Noninterest-bearing deposits
|
||||||||
|
6,530
|
7,986
|
Other liabilities
|
||||||||
|
79,804
|
78,998
|
Shareholders' equity
|
||||||||
|
$1,018,470
|
$960,260
|
Liabilities and equity
|
||||||||
|
3.26
|
3.21
|
Interest rate spread
|
||||||||
|
3.46
|
3.58
|
Net interest margin
|
||||||||
|
Net interest income
|
$32,337
|
$ 32,275
|
$ 62
|
$ (573) )
|
$ 6355
|
|||||
|
$ 85,887
|
$108,697
|
Net earning assets
|
||||||||
|
$860,169
|
$784,723
|
Average deposits
|
||||||||
|
1.91
|
2.78
|
Average cost of deposits
|
||||||||
|
98%
|
105%
|
Average loan to deposit ratio
|
||||||||
|
(a)
|
This table shows the changes in interest income and interest expense for the comparative periods based on either changes in average volume or changes in average rates for interest-earning assets and interest-bearing liabilities. Changes which are not solely due to rate changes or solely due to volume changes are attributed to volume.
|
|
(b)
|
The taxable equivalent adjustment of $32 in 2009 and in 2008 results from tax exempt income less non-deductible TEFRA interest expense.
|
|
(c)
|
Average nonaccruing loans have been excluded from total average loans and included in noninterest-earning assets.
|
F - 50
The Savannah Bancorp, Inc. – 2010 Annual Report