Attached files
| file | filename |
|---|---|
| 10-K - NEDAK ETHANOL, LLC | form10k_032911.htm |
| EX-31.1 - 302 CERTIFICATION/FAGERLAND - NEDAK ETHANOL, LLC | form10kexh311_032911.htm |
| EX-31.2 - 302 CERTIFICATION/BORER - NEDAK ETHANOL, LLC | form10kexh312_032911.htm |
| EX-32.1 - 1350 CERTIFICATION/FAGERLAND - NEDAK ETHANOL, LLC | form10kexh321_032911.htm |
| EX-10.(I).36 - SUPPLEMENT FOREBEARANCE AGREEMENT - NEDAK ETHANOL, LLC | form10kex10i36_032911.htm |
| EX-32.2 - 1350 CERTIFICATION/BORER - NEDAK ETHANOL, LLC | form10kex322_032911.htm |
Exhibit 13.1

Fiscal Year 2010 Annual Report
March 31, 2011
A letter from the President and General Manager
Dear NEDAK Investor: This is my second annual report to you as President of an operating company, and as I write to you, I’m looking back at the most remarkable of a remarkable six years. This second year of operations has brought us to a steady level of production that we only hoped to achieve a year ago. Our expectations include continued improvements that should bring production levels up to the maximum amount allowed under our environmental permits.
Last year, I told you that “the challenges and possibilities of the days to come are different from the past”, and this statement is even more true today. Ahead, the word “improvement” dominates our thinking—process improvement, equipment improvement and upgrade, training and skill improvement, improvement of feedstock, improvement of steady throughput, and in all of these, improvement of quality. We like to say that we have set our foot on the road of “Continuous Quality Improvement.”
One of the most challenging aspects of business at NEDAK this year has been the weakened financial condition that remained after the volatile experiences of the 5 year development and start-up phases. This, combined with volatile commodities markets, corn and natural gas procurement under negative working capital conditions, and a very slow start to recovery in the larger economy across the world were the main challenges in 2010. We continue to explore options to remedy our negative working capital and improve our lending arrangements. Those options may include obtaining additional equity capital, as well as changing our marketing and procurement arrangements in a way that reduces the levels of risk and reward in our business.
Our goals are to protect as much of the value of this successfully operating production facility for the benefit of the existing membership and to keep control of the company. Although the market values for ethanol plants sold during the last 12-24 months spanned a wide range, non-operating ethanol plants have generally sold at a significant discount. Therefore, considering our existing debt load and the value others have received in the sale of ethanol plants in recent months, we believe the best way to add member value is to maintain a continually operated facility into what we hope is a more prosperous future in the industry.
On a brighter note, we have experienced improvement in the local wet distillers grains market, which fueled a profitable fourth quarter in 2010 and we have continued to see a stable demand for this product in our area.
This Annual Report containing our fiscal 2010 financial statements includes discussion of many challenges in the past two years. My message to you in this letter continues to look forward with our plans and expectations for the future grounded in our prior experience. Overall, I have three main goals:
|
·
|
Protect Unit holder value in our efforts to recapitalize the company, seeking additional resources and strategic changes in marketing and operation partners.
|
|
·
|
Continue to stabilize Unit holder value by continuous improvement of efficiencies while controlling expenses and maximizing revenues.
|
|
·
|
Continue to review opportunities to increase revenues through product research and development.
|
Another significant initiative we’ve started in recent months and plan to pursue into the future is targeted capital investments in equipment to improve even more our production efficiencies. Investments in new, upgraded or modified equipment is critical to establish us as a low-cost producer. As additional working capital becomes available, the Directors and Management will actively pursue any capital project that can bring immediate process or productivity improvements with cash flow and payback in the short term.
Looking forward, we are ready to capture the upside potential of our commodity markets when the opportunities arise and our capital resources allow. As we all know, today’s environment is much different than when we were organized. However, we intend to continue in our efforts to develop our business into a valuable and productive enterprise that will provide returns to you in the future.

Jerome Fagerland,
President and General Manager
2010 Annual Report
|
Content
|
Page
|
|
Forward-Looking and Cautionary Statements
|
1
|
|
Company Overview
|
2
|
|
Management’s Discussion & Analysis of Financial Condition and Results of Operation
|
5
|
|
Overview
|
5
|
|
2010 and 2009 Production Levels
|
7
|
|
2010 and 2009 Net Income
|
8
|
|
Revenues, Cost of Goods Sold, General & Administrative Expenses
|
9
|
|
Liquidity and Capital Resources
|
10
|
|
Market Risk
|
12
|
|
Application of Critical Accounting Estimates
|
13
|
|
Off-Balance Sheet Arrangements
|
14
|
|
Our Directors and Officers
|
14
|
|
Changes in and Disagreements with Accountants
|
14
|
|
Market Price and Dividends
|
14
|
|
Management’s Responsibility for Financial Information
|
15
|
|
Management’s Report on Internal Control over Financial Reporting
|
15
|
|
Annual Report on Form 10-K
|
16
|
|
Audited Financial Statements for the Years ended December 31, 2010 and 2009
|
|
|
Report of Independent Registered Public Accounting Firm
|
F-1
|
|
Balance Sheets
|
F-2
|
|
Statements of Operations
|
F-3
|
|
Statements of Changes in Members’ Equity
|
F-4
|
|
Statements of Cash Flows
|
F-5
|
|
Notes to Financial Statements
|
F-6
|
Forward-Looking and Cautionary Statements
Certain statements contained in this 2010 Annual Report may constitute forward-looking statements within the meaning of the Private Securities Litigation Reform Act of 1995. These statements involve a number of risks, uncertainties and other factors that could cause actual results to be materially different, as discussed more fully elsewhere in this Annual Report and in the company’s filings with the Securities and Exchange Commission (“SEC”), including the company’s 2010 Form 10-K filed on March 31, 2011.
1
Company Overview
General
NEDAK Ethanol, LLC, a Nebraska limited liability company (the “Company,” “we” or “us”) was formed in 2003 to construct and operate our ethanol plant near Atkinson, Nebraska. We began producing ethanol and distiller’s grains at the plant in December 2008, but did not commence full production until June of 2009. Our ethanol plant consumes approximately 17 million bushels of locally grown corn annually, and produces approximately 44 million gallons of denatured fuel-grade ethanol and approximately 340,000 tons of wet distiller’s grains for feed cattle annually.
Strategy
In the past few years, U. S. ethanol production capacity has grown to over 13 billion gallons annually, and significant portions of that capacity are owned by the largest players in the U. S. fossil fuel markets. In that marketplace, we produce barely 1/3 of 1% of that domestic capacity, which leaves us with strategic challenges. Furthermore, the economic realities leave us with unique financial challenges as compared to most other producers. With approximately half of our assets leveraged with debt and as a newer plant in an industry in which approximately a third of all plants are nearly fully depreciated and a significant number of plants recently out of bankruptcy, we have a high interest burden requiring cash as well as a large non-cash depreciation burden to cover. The marketplace is also experiencing dramatic swings in profitability. In 2010, the “Crush Margin” (the difference between the market prices of ethanol and corn per gallon of ethanol produced) swung from a low of $0.02 to a high of $0.53. This compared to lows and highs in 2009 of $0.18 and $0.61 per gallon, respectively. Our combined interest and depreciation alone will be more than $0.18 per gallon in 2011.
Accordingly, our near-term strategy is to minimize losses and to team up with a strategic commodities marketer that can assist with risk management. We are also currently working to reorganize our financial structure with the objectives of providing working capital and restructuring our debt. After risk-management, our strategic initiatives include improving production efficiencies, maximizing throughput, controlling expenses, and increasing revenues in an innovative way.
Snapshot of our Business
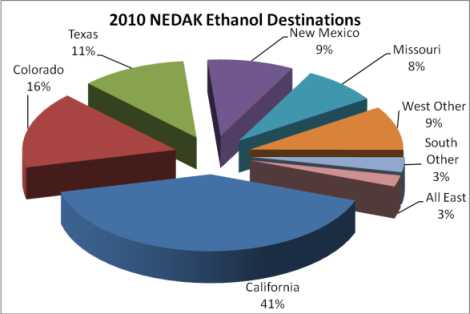
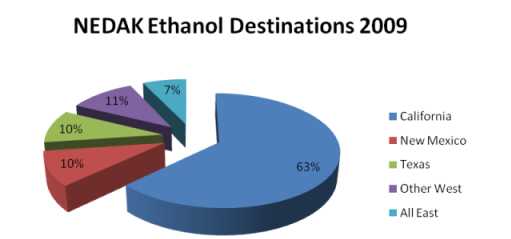
Below are three presentations of key economic drivers of our business: where we sell our product, Chicago Board of Trade (“CBOT”) crush margins, and a trend of reformulated blendstock for oxygenate blending (“RBOB”) pricing compared to ethanol pricing.
Where we sell our product
We believe that we have an advantage due to our location and the geography of other plant locations across the country. Our westernmost location provides us with a transportation cost advantage when shipping to our western customers. The large population in California is evident in the proportion of our sales delivered into that market, with New Mexico and Texas drawing effectively equal portions of our product as all the rest of the western states. Only 3% of our product was shipped into the eastern U. S. in 2010.
2
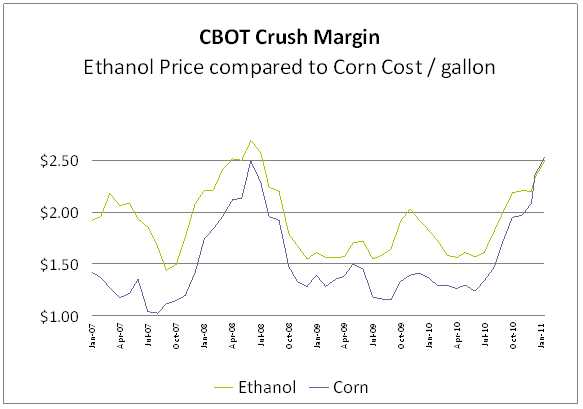
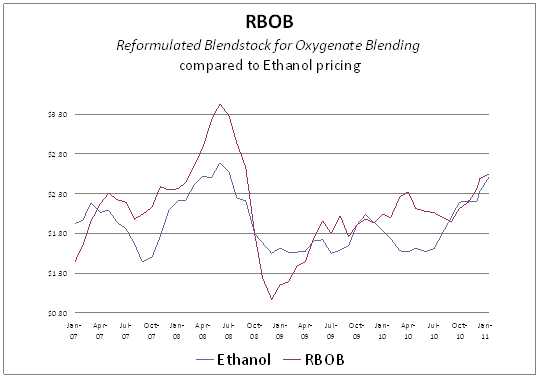
Crush margin & RBOB
The relationship between the cost of corn and the price of ethanol is shown in the following graph. This correlation is clearly primary in our marketplace. The relationship between the cost of gasoline and ethanol is less direct, as shown in the RBOB graph. Several times in the last three years, ethanol has actually been priced above the market price of RBOB, which is the unleaded gasoline base for the E10 product that is the dominant product in which ethanol is consumed.
3
4
Management’s Discussion & Analysis of Financial Condition
and Results of Operation
Overview
We completed full startup of our ethanol plant in June 2009, and have the capacity to annually process approximately 17 million bushels of corn, through a dry milling process, into approximately 44 million gallons of ethanol per year. We also produce approximately 340,000 tons of wet distiller’s grains (“WDG”) annually. We are currently operating at approximately 112% capacity.
Our plant needs approximately 47,000 bushels per day as the feedstock for its dry milling process. The grain supply for our plant is obtained primarily from local markets. The price and availability of corn are subject to significant fluctuations depending upon a number of factors that affect commodity prices in general, including crop conditions, weather, governmental programs and foreign purchases.
As a commodity processor, our profitability is primarily driven by the relationship between the cost of corn and the price at which we can sell our end-products, ethanol and WDG. Since we have been operational, the price of ethanol has usually tracked closely with the cost of corn. Although the corn-ethanol Crush Margin—the difference between the cost of corn in each gallon and the price of ethanol—has varied from time to time, revenues from sales of ethanol have usually covered our variable costs of operations, leaving our fixed costs to be covered by our WDG revenues. As of March 4, 2011, corn for May 2011 delivery was $7.28 per bushel and the corresponding ethanol sales prices is $2.61 per gallon on the CBOT, resulting in a negative gross Crush Margin of $0.04 per gallon.
Because of the way our costs have been covered during our first year and a half of operations, our profitability has tended to improve with higher corn costs. Cattle feeders compare our WDG prices to the price they would otherwise pay for feed corn, which means that generally speaking throughout our operations, higher corn prices have tended to increase our WDG revenues. So long as the price of ethanol covers our variable costs with a sufficient Crush Margin and our fixed costs are covered by WDG prices, higher corn costs support higher WDG prices and increase our profitability. Since these commodity price relationships are complex and not necessarily correlated, these trends could change at any time, and our profitability could be hindered by higher corn prices. At some point, increased corn costs will decrease the Crush Margin to the point where WDG prices cannot compensate and our profitability would correspondingly decrease.
As described below under “Liquidity and Capital Resources—Credit Facility,” we have been actively working with our lenders to resolve defaults under our credit agreements, change the way we manage our commodity risk and identify sources of additional capital to meet our working capital needs. In connection with that process, we have modified or terminated several of our pre-existing contracts for the sale of ethanol and WDG and the purchase of corn and natural gas. Currently, we are considering entering into a substitute marketing agreement or toll processing agreement, which we believe will allow us to more effectively manage risk and will reduce our working capital needs. While those discussions are on-going, we have established a relationship with Tenaska Biofuels, LLC (“Tenaska”). Although we have not entered into any long-term agreement with Tenaska, we are working closely with Tenaska for the purchase of corn and have been selling all of our ethanol through Tenaska. We have also entered into a master netting agreement to facilitate payments with Tenaska and more efficiently use our working capital. The agreement is terminable by either party at will.
WDG Revenues
As noted above, WDG sales are a key revenue stream driving our profitability. Generally, because distiller’s grains compete with other protein-based animal feed products, the price of distiller’s grains may decrease when the prices of competing feed products decrease. Downward pressure on commodity prices, such as soybeans and corn, will generally cause the price of competing animal feed products to decline, resulting in downward pressure on the price of WDG, which will decrease our revenues.
Our WDG-derived profits improved in 2010 over 2009, in part due to improvements in supply and demand throughout 2010. During the startup of our plant in 2009, our WDG was favored in the marketplace because of its better quality when compared to the
5
modified and dry product that had been available in the local market previously. However, late in 2009 and through the summer of 2010, a large local ethanol facility increased the amount of WDG available in the marketplace. Additionally, a local feedlot closed, which decreased local demand for distiller’s grains. Then, in the fall of 2010, the local feedlot resumed operations and our competitor’s WDG production was converted to dried distiller’s grain production for the export market. This resulted in increased WDG sales and a decrease in our losses in the fourth quarter of 2010.
In addition to an improvement of local WDG supply and demand factors in 2010, we undertook a WDG pricing strategy that improved our results for 2010. During the winter of 2009 – 2010, because we expected a reduction in WDG demand during the summer of 2010, we offered our large volume consumers a deeper discount in return for their commitment to continue to take the same volume of WDG throughout the summer at the same price. These marketing agreements allowed us to earn higher WDG prices over the summer of 2010 than we received in 2009.
We currently anticipate a continued increase in revenues from the sale of WDG in 2011 over 2010 because of increasing corn prices, which topped $7.00 per bushel on February 25, 2011 on the Chicago Mercantile Exchange ending the day at $7.12 per bushel. Our first quarter 2011 WDG pricing has been based on the December 2010 cost of corn under our verbal agreements with local cattle feeders, and we expect it to fluctuate throughout 2011. Furthermore, we believe our WDG revenues will increase in 2011 as plant productivity continues to increase through improved operating processes, systems and formulation.
Ethanol Market Factors
The price of ethanol is largely driven by supply and demand on the national markets, as well as regulatory requirements born by fuel blenders. Annual U.S. ethanol production capacity grew continually from 1980 through the middle of 2009. According to the Renewable Fuels Association (“RFA”), in 2002, annual U.S. ethanol production surpassed two billion gallons, by 2007, production further increased to 6.5 billion gallons, and in 2009 it topped ten billion gallons. Due to general economic difficulties and commodity prices in the last half of 2008, approximately two billion gallons of additional capacity that was planned or already under construction was put on hold, but the RFA indicates that total U.S. ethanol production capacity is now approximately 13 billion gallons.
The Renewable Fuels Standard (“RFS”), which was created by the Energy Policy Act of 2005 (the “2005 Act”), established the RFS2 standard for blending renewable fuels into automobile fuel in 2011 at 13.95 billion gallons, of which 2.56 billion gallons must come from non-corn based ethanol, leaving a maximum requirement of 11.4 billion gallons of corn based ethanol to be blended in 2011. As of December 2010, the RFA reported that nation-wide there were 191 operating ethanol refineries with a nameplate capacity of 13.1 billion gallons, another 21 non-operating facilities with 654 million gallons of capacity and 11 more plants under construction with additional capacity of 840 million gallons. Total capacity from these 223 facilities would be 14.6 billion gallons at nameplate, and at 110% of nameplate could produce over 16 billion gallons of ethanol per year. This means that compared to the RFS2 standard for 2011, there is nearly five billion gallons of potential corn based ethanol oversupply in the U.S. Therefore, the ethanol industry must continue to generate demand for ethanol beyond the minimum floor set by the RFS in order to support current ethanol prices.
In response to a request by Growth Energy, an ethanol industry trade association, under section 211(f)(4) of the Clean Air Act, the Environmental Protection Agency (“EPA”) has granted a partial waiver to allow fuel and fuel additive manufacturers to introduce gasoline that contains more than 10 volume percent (vol%) ethanol and up to 15 vol% ethanol (“E15”) for use in model year (“MY”) 2001 and newer light-duty motor vehicles, subject to several conditions. On October 13, 2010, the EPA granted a partial waiver for E15 for use in MY2007 and newer “light-duty vehicles.” “Light-duty vehicles” include cars, light-duty trucks and medium-duty passenger vehicles. On January 21, 2011, the EPA granted a partial waiver for E15 for use in MY2001-2006 “light-duty vehicles.” These decisions were based on test results provided by the U.S. Department of Energy (“DOE”) and other information regarding the potential effect of E15 on vehicle emissions. Taken together, the two actions allow, but do not require, E15 to be introduced into commerce for use in MY2001 and newer light-duty vehicles if conditions for mitigating, misfueling and ensuring fuel quality are met. The EPA is in the process of completing work on regulations that would provide a more practical means of meeting the conditions.
As shown in the graph above under “Company Overview—Shapshot of our Business—Crush Margin & RBOB,” throughout the last four years, with a very high correlation, ethanol and corn prices rose and fell together with a high level of correlation. We have no reason to expect this to change in the foreseeable future. On a macro basis, we also believe that both product delivery infrastructure and demand for ethanol must increase in order to increase ethanol profit margins over both the near and long term.
We believe that since the beginning of the global recession in mid 2009, the fluctuating U.S. demand for ethanol has been primarily driven by two variables: (1) the level of on-hand inventory of ethanol in the domestic blender pipeline and storage, and to a lesser extent, (2) the sale of ethanol to South America as the weather and economies affect the sugar crop and the production of sugar-based ethanol there. The Crush Margin tends to increase in the short term (week to week) when shortages in blender inventories cause
6
immediate demand pressure. Less dramatically, we believe that the net export of U.S. ethanol to Brazil as a result of the Brazilian sugar crop shortages caused longer term (month to month) increases in the 2010 average Crush Margins.
We believe these short and medium term fluctuations in the Crush Margin will continue to cover our variable ethanol production costs, and until the domestic ethanol distribution infrastructure grows and domestic demand for ethanol increases, the Crush Margin will have a muted impact on our profitability.
Risk Management
Because our financial performance is primarily based on commodity prices, one of the most important facets of our industry is risk management, focused on maintaining balance in the sale of ethanol and the purchase of corn. Historically, and to the extent we had available working capital, we have used commodity forward-contract marketing. The preferred position is to purchase corn and sell a matching amount of ethanol for future delivery when the margins are profitable. When corn is forward-contracted and ethanol cannot be sold to balance, we face the risk that corn prices will fall, followed by ethanol, leaving the plant with excessive expenses in corn purchases, pushing the cost of ethanol above the market price. Even if the decision is made to shut down the plant, rather than operate at a loss, the purchase and resale of that corn will also result in a loss. Alternatively, we sometimes purchase corn for future delivery and buy corn futures contracts as a hedge against adverse price changes, but this requires us to pay margin calls on the futures contracts. However, our ability to hedge has been limited because of our working capital and liquidity. As a result we have been limited to using nearby spot purchases of corn and sales of ethanol for prompt delivery. We are continuing to explore other marketing arrangements and possibly a toll processing agreement to reduce our exposure to commodity price risk and more efficiently manage our working capital.
Production Matters
In the beginning of 2010, we were forced to run the plant at reduced rates due to poor quality corn and increased foreign material in the corn fines. The plant production staff closely monitored the beer column (part of the ethanol manufacturing process) and made adjustments to the process, which minimized the impact on production rates. We reduced the solids content in the mash going to the beer column, adjusted the beer column temperature, and retuned process controllers for temperature and level control. Throughout 2010, we gradually increased the steady-state rates up to and past 100% of our plant’s name-plate capacity. By year end, the plant was frequently topping daily production rates above 110% of nameplate, and since have often increased to 113% of nameplate. Our goals for 2011 include stabilizing production rates and continuing to improve equipment and processes until we achieve daily production rates that require an application to the Nebraska Department of Environmental Quality to increase our Air Quality Permit production limit beyond our current 117% of nameplate.
We expect to spend at least the next 12 months focused on plant operations, including three primary functions: (i) managing cost-effective purchases of inputs for our production process, (ii) optimizing the production process to reduce manufacturing costs, and (iii) monitoring and evaluating the performance of our marketing agents to ensure effective marketing of our ethanol and distiller’s grains.
2010 and 2009 Production Levels
We began ethanol and distiller’s grains production in January 2009, and full production commenced in June 2009 as our plant constructor, Delta-T Corporation (“Delta-T”) turned the plant over to us. 2009 began with limited production, no production in May, and gradual improvements into winter when severe weather and startup equipment, along with infrastructure problems, resulted in down time. 2010 was a year of proving our plant capabilities and operational competence. Our operational team performed well in 2010, with excellent performance at the end of the year.
Monthly summary of 2010 and 2009 operations:
|
Ethanol Gallons
|
Corn Bushels
|
Denatured Yield
|
Tons of Wet DGs
|
Tons of Dry DGs
|
||||||||||||
| Produced (000’s) |
Nameplate
|
Ground (000’s) | (000’s) |
Sold (000’s)
|
Sold (000’s)
|
|||||||||||
| 2010 | 2009 | % 2010 | 2010 | 2009 | 2010 | 2009 | 2010 | 2009 | 2010 | 2009 | ||||||
| January | 3,446 | 2,817 | 88% | 1,240 | 1,051 | 2.78 | 2.68 | 25 | 22 | 0.4 | 0.0 | |||||
| February | 3,563 | 2,347 | 101% | 1,278 | 839 | 2.79 | 2.80 | 26 | 22 | 0.1 |
0.0
|
|||||
|
March
|
4,125 | 2,428 |
106%
|
1,490
|
943 | 2.77 | 2.57 |
26
|
20
|
2.1 | 0.0 | |||||
| April | 3,475 | 2,961 | 90% | 1,240 |
1,141
|
2.80
|
2.60
|
26 |
20
|
2.5
|
0.0
|
|||||
| May | 4,254 | - | 109% | 1,542 | - | 2.76 | - | 25 |
-
|
1.6
|
0.1 | |||||
| June | 4,174 |
3,099
|
111%
|
1,484
|
1,238 | 2.81 | 2.50 | 19 |
10
|
2.5 | 3.2 | |||||
|
July
|
3,900
|
3,340
|
100%
|
1,412
|
1,177
|
2.76
|
2.84
|
22
|
19 |
3.8
|
2.5 | |||||
| August | 4,167 | 3,753 | 107% | 1,490 | 1,416 | 2.80 | 2.65 | 21 |
21
|
4.6
|
4.8
|
|||||
| September | 4,070 |
3,643
|
108%
|
1,462
|
1,274
|
2.78
|
2.86
|
29
|
22
|
1.7
|
4.0
|
|||||
| October |
3,659
|
3,222
|
94%
|
1,338
|
1,181
|
2.73
|
2.73
|
31
|
25
|
0.0 |
1.0
|
|||||
| November |
3,893
|
3,733 |
103%
|
1,418
|
1,376
|
2.75 |
2.71
|
34
|
23
|
0.5
|
1.0
|
|||||
| December | 4,356 |
3,011
|
112% |
1,542
|
1,114
|
2.82
|
2.70 |
35
|
24
|
0.1
|
2.0
|
|||||
|
Total
|
47,082 | 34,354 | 107% |
16,936
|
12,750 |
2.78
|
2.69
|
319
|
228
|
19.9
|
18.6
|
7
Quarterly summary of 2010 and 2009 operations:
|
Ethanol Gallons
|
Corn Bushels
|
Denatured Yield
|
Tons of Wet DGs
|
Tons of Dry DGs
|
Net Income (Loss)
|
||||||||||||||||||
|
Produced (000’s)
|
Ground (000’s)
|
(000’s)
|
Sold (000’s)
|
Sold (000’s)
|
(000’s)
|
||||||||||||||||||
|
2010 2009
|
2010 2009
|
2010 2009
|
2010 2009
|
2010 2009
|
2010 2009
|
||||||||||||||||||
|
Quarter 1
|
11,134
|
7,592
|
4,008
|
2,833
|
2.78
|
2.68
|
77
|
64
|
2.6
|
0.0
|
$1,727
|
($3,843)
|
|||||||||||
|
Quarter 2
|
11,903
|
6,060
|
4,266
|
2,379
|
2.79
|
2.55
|
70
|
30
|
6.6
|
3.3
|
(3,218)
|
(4,423)
|
|||||||||||
|
Quarter 3
|
12,137
|
10,736
|
4,364
|
3,867
|
2.78
|
2.78
|
72
|
62
|
10.1
|
11.3
|
(2,125)
|
(3,019)
|
|||||||||||
|
Quarter 4
|
11,908
|
9,966
|
4,298
|
3,671
|
2.77
|
2.71
|
100
|
72
|
0.6
|
4.0
|
1,529
|
2,050
|
|||||||||||
|
Total
|
47,082
|
34,354
|
16,936
|
12,750
|
2.78
|
2.69
|
319
|
228
|
19.9
|
18.6
|
($2,087)
|
($9,235)
|
|||||||||||
Our production dramatically improved in 2010. First, our production in the first half of 2009 was restricted by the failure and reconstruction of one of the three fermenters. Second, our operational improvements due to post-startup expertise in 2010 allowed improved throughput and steady-state production in the second half of 2010 as compared to 2009. As the table above illustrates, our third quarter production volumes in 2010 were the best of both years. The third quarter volumes resulted from bringing the third fermenter on line in our new plant in June of 2009, and from continuing the efforts to further maximize throughput and improve steady-state production in 2010. Fourth quarter 2009 production volumes were hampered by the establishment of maintenance and cleaning processes as well as severe winter weather causing breakdowns and power failures. While winter weather caused reduced throughput in the fourth over the third quarter in both years, we still increased production in the fourth quarter of 2010 because of our throughput and steady-state production.
2010 and 2009 Net Income
Comparison of our fourth quarter 2010 and 2009 Statement of Operations Items:
|
Fourth Quarter
2010
|
Fourth Quarter 2010
Percentage
|
Fourth Quarter 2009
|
Fourth Quarter 2009
Percentage
|
|||||||
|
Revenues
|
$
|
27,955,531
|
100%
|
$
|
21,924,243
|
100%
|
||||
|
Cost of Goods Sold
|
25,225,020
|
90%
|
22,341,201
|
102%
|
||||||
|
Gross Profit (Loss)
|
2,730,511
|
10%
|
(416,958)
|
2%
|
||||||
|
General & Admin. Expenses
|
624,176
|
2%
|
387,089
|
2%
|
||||||
|
Operating Income (Loss)
|
2,106,335
|
8%
|
(804,047)
|
(4%)
|
||||||
|
Other Income (Expense) net
|
(576,726)
|
(2%)
|
2,855,001
|
13%
|
||||||
|
Net Income
|
$
|
1,529,609
|
6%
|
$
|
2,050,954
|
9%
|
||||
Summary of 2010 and 2009 Income Statement Items:
|
2010
|
2010 Percentage
|
2009
|
2009
Percentage
|
|||||||
|
Revenues
|
$
|
94,777,441
|
100%
|
$
|
67,536,108
|
100%
|
||||
|
Cost of Goods Sold
|
94,338,221
|
99%
|
74,528,307
|
110%
|
||||||
|
Gross Profit (Loss)
|
439,220
|
0%
|
(6,992,199)
|
(10%)
|
||||||
|
General & Admin. Expenses
|
2,424,432
|
2%
|
2,596,682
|
4%
|
||||||
|
Operating Income (Loss)
|
(1,985,213)
|
(2%)
|
(9,588,881)
|
(14%)
|
||||||
|
Other Income (Expense) net
|
(101,374)
|
0%
|
353,633
|
1%
|
||||||
|
Net Loss
|
$
|
(2,086,586)
|
(2%)
|
$
|
(9,235,248)
|
(14%)
|
||||
In both the fourth quarter and the year as a whole, our financial results improved in 2010 over 2009. We received a benefit of approximately $3,000,000 from our settlement with Delta-T in both years. In 2009, we received that payment in the fourth quarter and in 2010 we received it in the first quarter. Thus, while fourth quarter 2010 net income was approximately $521,000 lower than the same quarter of 2009, our operating income improved approximately $2,910,000 in 2010 over 2009 before accounting for Other Income (Expense) items.
8
Operating Income (Loss) improvement in 2010 over 2009 was approximately $7,600,000. This is a result of three primary factors. First, our total throughput increased in every month of 2010 as compared to 2009, but most dramatically in the first half because 2009 production was restricted with only two operational fermenters through April and no production in May. Second, although not apparent in the raw numbers, yield was improved in 2010 over 2009 as a result of our improved processes and methods—despite the fact that the quality of the corn we used in 2010 was worse than used in 2009. Third, our improvements in operational methods and infrastructure resulted in a significant reduction in down time and stop/start incidents in 2010 as compared to 2009.
Revenues, Cost of Goods Sold, General & Administrative Expenses
Revenues
Our revenues from operations come from two primary sources: sales of ethanol and distiller’s grains. For the year ended December 31, 2010 and 2009, without freight reimbursements, we received $79,085,330 (about 83%) and $53,785,224 (about 80%) of our revenue from the sale of ethanol, respectively, and $12,004,033 (about 13%) and $8,006,646 (about 12%) of our revenue from the sale of distiller’s grains, respectively. The average selling price for ethanol was $1.73 and $1.56 per gallon in 2010 and 2009, respectively; the average selling price for WDG was $30.34 and $27.05 per ton in 2010 and 2009, respectively; and the average selling price for dry distiller’s grains was $98.75 and $84.47 per ton in 2010 and 2009, respectively. We sold approximately 46.0 and 34.3 million gallons of ethanol in 2010 and 2009, respectively; we sold approximately 319,000 and 228,000 tons of WDG in 2010 and 2009, respectively; and we sold approximately 19,900 and 18,600 tons of dried distiller’s grains in 2010 and 2009, respectively.
As we have previously reported, there are two price/cost relationships that must improve for us to be profitable: the Crush Margin, and the price of distiller’s grains compared to the costs that remain uncovered by the Crush Margin. These two relationships are inherent in the largest numbers in our statement of operations, which in descending order are ethanol sales, corn purchases, and distiller’s grains revenue.
We expect the Crush Margin to increase above its year end 2010 level. As of December 31, 2010, the CBOT price of corn was $6.29 per bushel while CBOT ethanol was $2.38 per gallon, resulting in a $0.16 Crush Margin (assuming a 2.83 bushel to gallon conversion rate); while the average Crush Margin for all of 2010 was $0.37. The Crush Margin continued to deteriorate in January 2011 until it was actually negative in mid month. The negative Gross Crush Margin continued throughout February and remained so until the middle of March, 2011, when it became positive. For all of 2010, our ethanol revenue was 122% of the cost of corn, but in the fourth quarter that ratio was the lowest of the year at 115%, while first, second and third quarters it was 125%, 123% and 130% respectively. We believe this ratio will be driven higher with improvement in the U.S. economy, which should increase demand for ethanol, and those higher prices will be supported by continued political support for ethanol and the RFS.
Sales of distiller’s grains only accounted for 13% and 12% of our revenues in 2010 and 2009, respectively, when both ethanol and distiller’s grains revenues were depressed. As discussed above, we increased our 2010 summer WDG volume over 2009 in return for reduced prices, resulting in an overall increase in WDG revenue in 2010 over 2009. Finally, we expect the price of distiller’s grains to improve as feedlot operators recognize the benefits of WDG over corn.
Cost of Goods Sold
Our cost of goods sold as a percentage of revenues was 99% and 110% in 2010 and 2009, respectively, which includes a fourth quarter improvement of 90% in 2010 from 102% in 2009. The improvement in the fourth quarter resulted from both a better Crush Margin and better distiller’s grains prices. Our two primary costs of producing ethanol and distiller’s grains are corn and natural gas. As of December 31, 2010, we had forward purchase contracts for delivery of 2,100,000 bushels of corn through July 2011, for a total commitment of approximately $11,487,000. We expect continued volatility in the price of corn, which could significantly impact our cost of goods sold. The following chart provides more detail on our cost of goods sold, and a comparison between the periods.
|
Cost of Goods Sold Items
|
2010
|
2010 Percentage
|
2009
|
2009
Percentage
|
|||||||
|
Revenues
|
$
|
94,777,441
|
100%
|
$
|
67,536,108
|
100%
|
|||||
|
Costs:
|
|||||||||||
|
Corn
|
62,590,549
|
67%
|
43,874,327
|
65%
|
|||||||
|
Denaturant & Chemicals
|
5,888,114
|
6%
|
4,255,093
|
6%
|
|||||||
|
Ethanol Freight Costs
|
6,800,521
|
7%
|
8,013,611
|
12%
|
|||||||
|
Natural Gas and Electricity
|
8,217,478
|
9%
|
8,259,391
|
12%
|
|||||||
|
Production Labor
|
2,551,832
|
3%
|
2,298,954
|
3%
|
|||||||
|
Supplies and Maintenance
|
1,221,811
|
1%
|
631,858
|
1%
|
|||||||
|
Property Tax
|
971,496
|
1%
|
1,108,134
|
2%
|
|||||||
|
Depreciation
|
6,096,420
|
6%
|
6,086,939
|
9%
|
|||||||
|
Total Cost of Goods Sold
|
$
|
94,338,221
|
99%
|
$
|
74,528,307
|
110%
|
9
Corn is the largest component of our cost structure. Our cost of corn was higher in 2010 than in 2009. Our average cost of corn per gallon of ethanol produced was $1.36 and $1.26 in 2010 and 2009, respectively, with the monthly minimum average of $1.18 and $1.11 per gallon in 2010 and 2009, respectively, and a monthly maximum of $1.88 and $1.48 in 2010 and 2009, respectively. Our average cost per bushel of corn was $3.85 and $3.46 in 2010 and 2009, respectively, with a monthly minimum average of $3.30 and $3.13 in 2010 and 2009, respectively, and a monthly maximum average of $5.15 and $3.94 in 2010 and 2009, respectively.
General and Administrative Expenses
Our general and administrative expense as a percentage of revenues for 2010 and 2009 was 2% and 4%, respectively. The improvement was primarily due to increasing revenues and productivity. General and administrative expenses include salaries and benefits of administrative employees, insurance, professional fees and other general administrative costs. The following chart provides more detail on our general and administrative expenses, and a comparison between the periods.
|
General and Administrative
Expense Items
|
2010
|
2010 Percentage
|
2009
|
2009
Percentage
|
|||||||
|
Revenues
|
$
|
94,777,441
|
100%
|
$
|
67,536,108
|
100%
|
|||||
|
Costs:
|
|||||||||||
|
Administrative People Costs
|
997,364
|
1%
|
961,856
|
1%
|
|||||||
|
Professional Fees
|
861,759
|
1%
|
1,089,277
|
2%
|
|||||||
|
Insurance
|
337,097
|
0%
|
361,880
|
1%
|
|||||||
|
Other
|
228,212
|
0%
|
183,669
|
0%
|
|||||||
|
Total General and Administrative Expenses
|
$
|
2,424,432
|
2%
|
$
|
2,596,682
|
4%
|
|||||
Environmental Compliance
Our operations are subject to environmental laws and regulations adopted by various governmental entities in the jurisdiction in which we operate. These laws require us to investigate and remediate the effects of the release or disposal of materials. We are in compliance with all environmental regulations and respond promptly to all requests and suggestions from the state and federal regulating bodies when they are received.
Construction Contract
The Company entered into an Engineering, Procurement and Construction Services Fixed Price Contract dated August 9, 2006 (the “Delta-T Contract”) with Delta-T. Following a dispute, the parties amended the Delta-T Contract on September 1, 2009, which provided that, among other things: (i) Delta-T relinquished letter of credit proceeds of $3,995,000 held by Lender, and (ii) a $5,000,000 promissory note in Delta-T’s favor was extinguished. The extinguishment of the $5,000,000 promissory note and other contract liabilities were recorded as reductions to property and equipment. The relinquishment of the $3,995,000 letter of credit proceeds, less $228,431 for costs expected to be incurred, was recognized as gain in other income during the fourth quarter of 2009.
On March 19, 2010, we entered into a Settlement Agreement and Mutual Release (the “Settlement Agreement”) with Delta-T, Delta-T’s parent, Bateman Litwin NV (“Bateman”) and Bateman Engineering Inc. (“Bateman Engineering”) under which, among other things, (i) Delta-T and Bateman authorized us to draw $3,000,000 from a letter of credit, and (ii) we released Delta-T and Bateman from all warranties and other claims under the Delta-T Contract. The Settlement Agreement resolved all outstanding disputes among us, Bateman and Delta-T relating to the Delta-T Contract and construction of our ethanol plant. The receipt of the $3,000,000 was recognized as a gain in other income in the first quarter of 2010.
Liquidity and Capital Resources
Net cash provided by operating activities was $4,766,368 for the year ended December 31, 2010 compared to net cash used in operating activities of $4,941,283 for the year ended December 31, 2009. In addition to the ordinary and generally anticipated draws and additions to working capital in increasing accounts payable, inventory and receivables that come with the commencement of operations of a business, we received significant benefits from the Settlement Agreement. In 2010, we received $3,000,000 related to the settlement. In 2009, the settlement increased our working capital, with a reduction of retainage and sales tax payable of
10
$1,700,000 and $400,000, respectively, as well as relinquishment of letter of credit proceeds of $3,995,000. Other non-working capital benefits derived from this settlement were used to reduce our long term asset value through forgoing warranty repairs worth approximately $230,000 and the (non-cash) extinguishment of a $5,000,000 note payable to Delta-T.
We had expected that our original equity offerings and debt financing would have been sufficient to cover all costs associated with the initial stage of production. However, as of December 31, 2010, we had negative working capital of ($4,644,148), prior to classification of $38.6 million of our debt to current liabilities. We may continue operating at negative margins, depending on commodity prices. If we are unable to generate sufficient cash flows from operations or obtain additional debt or equity financing, our ability to continue operations may be materially hindered, including our ability to enter into derivative positions, and we may be forced to continue to purchase our corn and market our ethanol at spot prices, which would further expose us to market volatility and associated risks. The financial statements included within this Annual Report have been prepared assuming that we will continue as a going concern. Until we are able to obtain additional working capital from operations or outside sources and modify our Credit Agreement covenants or refinance our construction loan, there is substantial doubt as to whether we can continue to operate as a going concern.
As we have reported in the past, we continue to work with our lenders and others to identify the means by which we can improve our capital position. Improved capitalization would better enable us to hedge and better manage our market risk in the commodity markets, among other things. Improving our capitalization will likely involve restructuring our debt so that both our debt level and the associated covenants are more compatible with current market conditions, and may also involve our issuing equity in one or more private placements on terms which we cannot predict at this time.
Credit Facility
We entered into the following agreements with AgCountry Farm Credit Services, FLCA (“Lender”) regarding our senior secured credit facility (“Facility”) for the provision of construction and permanent debt financing for our ethanol plant: a Master Credit Agreement dated February 14, 2007 (the “Master Agreement”), and several supplements including the Seventh Supplement and Forbearance agreement to the Master Credit Agreement effective February 1, 2011 (the “Seventh Supplement” and together with the Master Agreement, the “Loan Agreements”). As of December 31, 2010, we had $38,026,321 outstanding under the Facility.
Under the Loan Agreements, we made certain customary representations and are subject to customary affirmative and negative covenants, including restrictions on our ability to incur debt, create liens, dispose of assets, pay distributions and to make capital expenditures, and customary events of default (including payment defaults, covenant defaults, cross defaults, construction-related defaults and bankruptcy defaults).
Affirmative financial covenants under the Loan Agreements require us to maintain minimum working capital of $6,000,000, a minimum current ratio of 1.20:1.00, minimum tangible net worth of $41,000,000, minimum owners’ equity ratio of 50%, and a minimum fixed charge coverage ratio of 1.25:1.00. As of December 31, 2010, we did not meet those covenants, as follows: our working capital was negative ($4,644,148) (not including current liabilities for term debt previously classified as long term), our current ratio was 0:72 to 1.00 (not including current liabilities for term debt previously classified as long term), our tangible net worth was $40,399,378, our owners' equity ratio was 71%, and our fixed charge coverage ratio was 0.79: 1.00. This resulted in all debt under the Loan Agreement being classified as current liabilities.
In addition, we have also agreed to the following with the Lender under the Loan Agreements, among other things:
|
|
·
|
We must obtain Lender’s consent to make any capital expenditures in excess of $500,000.
|
|
|
·
|
We must make annual payments to Lender of 40% of our Net Available Cash (as defined in the Loan Agreements).
|
|
|
·
|
We must make monthly payments of principal and interest.
|
We are actively negotiating with the Lender to convert the construction financing to operating lines and to modify the loan covenants to reflect current industry economics. We cannot predict whether the Lender will agree to modify any of those covenants. To the extent we are unable to modify those covenants, it may not be possible to meet them unless the commodities markets we operate in move in favorable directions. Until we are able to comply with the covenants under the Loan Agreements, the Lender may take a variety of actions, including immediately accelerating the repayment of all outstanding debt under the Loan Agreements. Such acceleration could entitle the Lender to liquidate all of our assets, and would likely lead to our bankruptcy, reorganization or winding up of our affairs.
11
TIF Note
In June 2007, the City of Atkinson, Nebraska (“City”) issued a tax increment financing Note (the “TIF Note”), the net proceeds of which in the amount of $4,939,925 were paid to us to reimburse us for certain infrastructure improvements relating to our plant. Repayment of the TIF Note is guaranteed by us, but was originally expected to be retired from incremental property tax revenue we pay the City, which are based on the added value of our land and buildings. The TIF Note serves as collateral for a loan with an outstanding balance of $6,579,000 (the “Loan”) as of December 31, 2010. We received the net proceeds of the Loan under a Loan Agreement with the lead lending agent, Arbor Bank (“TIF Lender”), under which we loaned the proceeds to the City in exchange for the TIF Note. This liability has been classified as a current liability, and will remain so until the resolution of the TIF Lawsuit described below.
On August 12, 2010, the TIF Lender filed a lawsuit (the “TIF Lawsuit”) against us in the District Court of Douglas County, Nebraska alleging that we failed to make certain payments due under the TIF Note and failed to maintain the required debt service reserve fund. In addition, the lawsuit states that the TIF Lender has accelerated the maturity of the TIF Note. The TIF Lawsuit provides that as of August 9, 2010, the amount due and owing under the TIF Note was $7,039,126, and the TIF Lender seeks payment of that amount, plus such additional amounts as become due and owing under the TIF Note, with interest accruing after August 9, 2010 at the rate of 9.5% until the judgment is paid. It is uncertain when or how the court will rule on the several pending motions. Discovery is ongoing and no trial date has been set.
Market Risk
We are exposed to the impact of market fluctuations associated with commodity prices. We may use derivative financial instruments as part of an overall strategy to manage market risk, assuming we have sufficient working capital and liquidity to manage such a strategy, or we may transfer risk management to Tenaska under a long term arrangement. If we do not transfer risk management to Tenaska, then subject to available working capital, we may, when able, use cash, futures and option contracts to hedge changes to the commodity prices of corn, natural gas and gasoline. We will not enter into these derivative financial instruments for trading or speculative purposes, nor will we designate these contracts as cash flow or fair value hedges for accounting. However, our ability to undertake any hedging activities has been limited due to our limited working capital. We cannot presently predict if or when we may modify our risk management profile through an arrangement with Tenaska or any other party.
Commodity Price Risk
We are exposed to market risk with respect to the price of ethanol, our principal product, and the price and availability of corn, the principal commodity we use to produce ethanol. Our other primary product is distiller’s grains, and we are also subject to market risk with respect to its price. In general, rising ethanol and distiller’s grains prices should result in higher profit margins, and therefore represent favorable market conditions. Ethanol and distiller’s grains prices are, however, influenced by various factors beyond the control of our management, including the supply and demand for gasoline, the availability of substitutes and the effects of laws and regulations.
Ethanol revenues are based on its market price, which is largely driven by the supply and demand in the national marketplace. Our risk management team meets weekly and assesses the balance of forward purchases of corn with forward sales of ethanol and the risks associated with the trends in the marketplace. Throughout the majority of the last year and a half, the price of ethanol has closely followed the market price of corn. The price of unleaded gasoline is also a primary concern in that if the price of ethanol rises above the RBOB price, then the economies do not allow favorable margins for the discretionary blenders and demand for ethanol falls.
Distiller’s grains are primarily sold into the local cattle feed market. Historically, the summer months bring the lowest seasonal demand for this product. As previously reported, we endured an extraordinarily long period of startup irregularities and our ability to market distiller’s grains in 2009 was affected by these complications, as well as a deeper seasonal reduction in 2009 than was expected. Consistent production volumes and quality are required to maximize the pricing potential of our favorable geography near a large number of cattle feeders. We continue to work to establish a reputation and relationships with those cattle feeders that will help mitigate the seasonal variability in future years, though ultimately demand for distiller’s grains is not in our control.
Ethanol, corn and energy markets have demonstrated a complex relationship in the past 24 months. Generally speaking, we believe that the price of energy provides a ceiling value for ethanol, particularly in the price of crude oil as driven into the price of unleaded gasoline, otherwise known in the markets as RBOB. However, except when affected by that upward limit, we believe that the price of ethanol follows the price of corn with a high degree of correlation, with the Crush Margin dictated by the market relationships of supply and demand. As discussed above, that Crush Margin has been squeezed in recent months by the oversupply of ethanol capacity, but can be significantly affected by any of several factors, including the relationship of distribution infrastructure and
12
its limits to handle the volume of ethanol that could be produced by the existing capacity while limited by the EPA to 10% blends for regular unleaded gasoline. The price of oil also affects the Crush Margin. In mid 2008, when oil was above $140 a barrel, the cost of RBOB allowed profitable blending of ethanol with a favorable Crush Margin, even when corn costs were above $6 and $7 a bushel.
The availability and price of corn is subject to wide fluctuations due to various unpredictable factors which are beyond our control, including weather conditions, farmer planting decisions, governmental policies with respect to agriculture and local, regional, national and international trade, demand and supply. In 2010, our corn cost as a percentage of ethanol sales was 75%, and was 66% of gross sales.
We expect the annual impact on our results of operations due to a $0.30 per bushel fluctuation in market prices for corn to be approximately $4,890,000, or $0.11 per gallon, assuming our plant continues to operate at 100% name plate capacity (production of 44,000,000 gallons of ethanol annually). We also expect a $0.20 per gallon fluctuation in ethanol market prices to impact annual net income by approximately $8,800,000, a $0.20 per gallon fluctuation in denaturant market prices to impact annual net income by approximately $180,000, and a $0.50 per BTU fluctuation in natural gas market prices to impact annual net income by approximately $630,000.
We seek to minimize the risks from fluctuations in the prices of corn and ethanol through the use of derivative instruments, provided we have sufficient working capital to enter into such instruments and cover any margin requirements necessary to maintain such positions. In practice, as markets move, we will seek to actively manage our risk and adjust hedging strategies as appropriate, provided we have sufficient working capital for such strategies. Although we believe our hedge positions accomplish an economic hedge against our future purchases, they are not designated as such for hedge accounting purposes, which would match the gain or loss on our hedge positions to the specific commodity purchase being hedged. We mark to market our hedge positions, which means as the current market price of our hedge positions changes, the gains and losses are immediately recognized in our cost of goods sold. The immediate recognition of hedging gains and losses can cause net income to be volatile from quarter to quarter due to the timing of the change in the value of the derivative instruments relative to the cost and use of the commodity being hedged. We have recorded gains (losses) on derivative instruments of approximately ($335,600) and $4,700 for 2010 and 2009, respectively.
In the event we do not have sufficient working capital to enter into hedging strategies to manage our risks, we may be forced to purchase our corn and market our ethanol at spot prices and as a result, we could be further exposed to market volatility and risk. However, as discussed above, we may also determine to transfer much of our risk management to Tenaska.
Application of Critical Accounting Estimates
Management uses estimates and assumptions in preparing these financial statements in accordance with Generally Accepted Accounting Principles (“GAAP”). Those estimates and assumptions affect the reported amounts of assets and liabilities, the disclosure of contingent assets and liabilities, and the reported revenues and expenses. We use estimates and assumptions in accounting for the following significant matters, among others: the allowance for doubtful accounts, useful lives of property and equipment, the valuation of inventory, and inventory purchase commitments, and long-lived asset impairments including the assumptions used to estimate future cash flows, the ability to raise capital, and the ability to comply with certain provisions within the Loan Agreements. Actual results may differ from previously estimated amounts, and such differences may be material to our financial statements. We periodically review estimates and assumptions, and the effects of revisions are reflected in the period in which the revision is made.
Long-lived assets, such as property and equipment, are reviewed for impairment whenever events or changes in circumstances indicate that the carrying amount of an asset may not be recoverable. In accordance with the our policy for evaluating impairment of long-lived assets, we have estimated that the projected future undiscounted cash flows from operations of these facilities exceed their carrying value at December 31, 2010; therefore no impairment loss was recognized. In determining the projected future undiscounted cash flows, we made significant assumptions concerning the future viability of the ethanol industry, the future price of corn in relation to the future price of ethanol and the overall demand for ethanol in relation to production and supply capacity. Changes in the estimated future prices of corn and ethanol used within the analysis can have a significant effect on the determination of impairment given the sensitivity of the analysis. In addition to the impairment analysis performed, we believe that the following factors also indicate that no impairment of long-lived assets has occurred. First, our short time in operation under distress from construction delays, equipment failures and startup complications provides inadequate cost history to assess with reasonable levels of certainty what the cost structure will be going forward. Second, the economic structure of the distiller’s grain markets has been excessively volatile throughout initial plant operations. The cash flow to be generated from sales of distiller’s grains is a critical requirement for us to generate future profitability. Third, the economic recession in the U.S. during the entire startup and operation of the plant further complicated the measurement of our ability to generate future cash flows that are required to document material impairment to the carrying value of our plant assets. In the impairment analysis, we assumed (i) future distiller’s grain revenue will be 17% of gross
13
revenue, (ii) future corn costs will be 87% of ethanol revenue, and (iii) these relationships drive EBITDA estimates for 2011 of 8% of gross revenues. If we fail to realize these economic improvements, it is likely in the future, that asset values will need to be adjusted to reflect impaired value because we would be unable to forecast future cash flows sufficient to carry those values.
Off-Balance Sheet Arrangements
We do not have any off-balance sheet arrangements that have or are reasonable likely to have a current or future material effect on our financial condition, results of operations or liquidity.
Our Directors and Officers
Below is certain information about our Directors and officers. Additional information about our Directors and officers will be provided in our proxy statement for our 2011 Annual Members’ Meeting.
|
|
●
|
Jeff Lieswald, a Director, is a principal of Agland Electric Motor (a retail electric motor reseller) and has worked as an electrician for 23 years.
|
|
|
●
|
Todd Shane, a Director, is a farmer and rancher with HBK Land & Cattle Co.
|
|
|
●
|
Kirk Shane, a Director, is a farmer and rancher.
|
|
|
●
|
Gerald Winings, a Director, is the manager of Atkinson Fertilizer, Inc., a blender and distributor of agricultural fertilizers.
|
|
|
●
|
Everett Vogel, Vice President, a Director and Chairman of the Board, is President and a Director of Stuart Fertilizer and Grain, Inc., a blender and distributor of agricultural fertilizers.
|
|
|
●
|
Paul Seger, a Director, is the owner of Seger Farms.
|
|
|
●
|
Kenneth Osborne, a Director, is the President and a Director of Osborne Construction, Inc.
|
|
|
●
|
Robin Olson, a Director, is a Director of Olson Industries, Inc., a manufacturer of airport light bases, irrigation systems, commercial trash containers, electric utility poles and other galvanized products, and is a Principal of Alpha Galvanizing.
|
|
|
●
|
Clayton Goeke, a Director, is a farmer and rancher.
|
|
|
●
|
Jerome Fagerland is the Company’s President, General Manager and a Director.
|
|
|
●
|
Steve Dennis, a Director, is the owner and manager of O’Neill Grain Co., a grain elevator.
|
|
|
●
|
Paul Corkle, a Director, is a farmer and rancher and owner of Corkle Insurance Agency.
|
|
|
●
|
Timothy Borer, the Secretary, Treasurer and a Director, is a farmer.
|
|
|
●
|
Richard Bilstein, a Director and Vice President of the Board, is a Farm Manager for Don Oppliger Farms.
|
Changes in and Disagreements with Accountants.
We have not had any disagreements with our accountants in our two most recent fiscal years or any subsequent interim period.
On June 24, 2009, we changed independent registered public accountants from Boulay, Heutmaker, Zibell & Co., PLLP to McGladrey & Pullen, LLP. McGladrey & Pullen, LLP performed the audits as of and for the years ended December 31, 2010 and 2009.
Market Price and Dividends
There is no public trading market for our Membership Units, and our Third Amended and Restated Operating Agreement dated March 4, 2009 (the “Operating Agreement”) contains significant restrictions on the transfer of our Units to ensure that we are not
14
deemed a “publicly traded partnership” and thus taxed as a corporation. Additionally, pursuant to the Operating Agreement, the Board has developed a Unit Transfer Policy which imposes conditions on the transfer of Membership Units.
Subject to the provisions of the Nebraska Limited Liability Company Act (the “Act”), distributions are payable at the discretion of our Board of Directors as provided in our Operating Agreement. The Board has no obligation to distribute profits, if any, to Members. We have not declared or paid any distributions on our Membership Units to date, and distributions on our Common Units are first subject to preferential distributions on our Class A Preferred Units. We anticipate distributing a portion of our net cash flow to our Members in proportion to the Membership Units held and in accordance with our Operating Agreement and any loan covenants to which we may then be subject. By net cash flow, we mean our gross cash proceeds received less any portion, as determined by our Directors in their sole discretion, used to pay or establish reserves for our expenses, debt payments, capital improvements, replacements and contingencies. If our financial performance and loan covenants permit, our Board of Directors will consider cash distributions at times and in amounts that will permit Unit holders to make income tax payments. However, the Board may elect to retain future profits to provide operational financing for the plant, debt retirement and possible plant expansion.
Management’s Responsibility for Financial Information
It is the responsibility of management to prepare and present the financial statements in this Annual Report with integrity and objectivity. These financial statements have been prepared in accordance with GAAP. As required, management applies certain estimates and judgments in the preparation of these financial statements.
Wagner and Associates, an independent accounting and management consulting firm, was retained to assist management in their assessment of the effectiveness of our internal controls over financial reporting. That firm is responsible to management to document our internal control structure and to test the structure’s effectiveness, reporting to management any recommendations for improvement as well as providing assurances through testing of the system’s effectiveness. McGladrey & Pullen, LLP, an independent registered public accounting firm, is retained to audit our financial statements.
The Audit Committee of the Board of Directors and is responsible for selection and supervision of accounting management and the independent registered public accounting firm. The Audit Committee meets periodically and privately with the independent registered public accounting firm as well as management to review accounting, auditing, internal control structure and financial reporting matters.
Management’s Report on Internal Control over Financial Reporting
Management is also responsible for establishing and maintaining adequate internal control over financial reporting. Our internal control over financial reporting is a process designed by, or under the supervision of, our CEO and CFO, and effected by our Board of Directors, management and other personnel to provide reasonable assurance regarding the reliability of financial reporting and the preparation of financial statements in accordance with GAAP and includes policies and procedures that:
|
(i)
|
Pertain to the maintenance of records that in reasonable detail accurately and fairly reflect our financial transactions, | |
|
(ii)
|
Provide reasonable assurance that transactions are recorded as necessary to permit preparation of financial statements in accordance with GAAP, and that our revenues and expenditures are being made only in accordance with authorizations of our management and directors, and
|
|
|
(iii)
|
Provide reasonable assurance regarding the prevention or timely detection of unauthorized acquisition, use or disposition of our assets that could have a material effect on our financial statements.
|
Because of its inherent limitations, internal control over financial reporting may not prevent or detect misstatements. Also, projections of any evaluation of effectiveness to future periods are subject to the risk that controls may become inadequate because of changes in conditions, or that the degree of compliance with policies or procedures may deteriorate.
Management assessed our internal control over financial reporting as of December 31, 2010. Management based its assessment on criteria established in Internal Control-Integrated Framework issued by the Committee of Sponsoring Organizations of the Treadway Commission (“COSO”). Management’s assessment included an evaluation of such elements as the design and operating effectiveness of key financial reporting controls, process documentation, accounting policies and our overall control environment.
Based on this assessment, management concluded that our internal control over financial reporting was effective as of December 31, 2010. This annual report is not required to include an attestation report of our independent registered public accounting firm regarding our internal control over financial reporting.
15
Annual Report on Form 10-K
You may request, orally or in writing, a copy of our annual report on Form 10-K, which will be provided to you at no cost, by contacting Lisa Fix, P. O. Box 391, Atkinson, NE 68713, Office Phone 402 925-5570.
16
Report of Independent Registered Public Accounting Firm
To the Board of Directors and Members
NEDAK Ethanol, LLC
We have audited the accompanying balance sheets of NEDAK Ethanol, LLC as of December 31, 2010 and 2009, and the related statements of operations, changes in members’ equity, and cash flows for the years then ended. These financial statements are the responsibility of the Company’s management. Our responsibility is to express an opinion on these financial statements based on our audits.
We conducted our audits in accordance with the standards of the Public Company Accounting Oversight Board (United States). Those standards require that we plan and perform the audit to obtain reasonable assurance about whether the financial statements are free of material misstatement. The Company is not required to have, nor were we engaged to perform, an audit of its internal control over financial reporting. Our audit included consideration of internal control over financial reporting as a basis for designing audit procedures that are appropriate in the circumstances, but not for the purpose of expressing an opinion on the effectiveness of the Company’s internal control over financial reporting. Accordingly, we express no such opinion. An audit also includes examining, on a test basis, evidence supporting the amounts and disclosures in the financial statements, assessing the accounting principles used and significant estimates made by management, as well as evaluating the overall financial statement presentation. We believe that our audits provide a reasonable basis for our opinion.
In our opinion, the financial statements referred to above present fairly, in all material respects, the financial position of NEDAK Ethanol, LLC as of December 31, 2010 and 2009, and the results of its operations and its cash flows for the years then ended in conformity with U.S. generally accepted accounting principles.
The financial statements have been prepared assuming that the Company will continue as a going concern. As discussed in Note 2 to the financial statements, there is uncertainty as to the Company’s ability to cure credit agreement defaults and, therefore, to secure additional funds needed to fund ongoing operations. This raises substantial doubt about the Company's ability to continue as a going concern. Management's plans in regard to these matters are also described in Note 2 to the financial statements. The financial statements do not include any adjustments that might result from the outcome of this uncertainty.
/s/ McGladrey & Pullen, LLP
Sioux Falls, South Dakota
March 31, 2011
F-1
|
NEDAK ETHANOL, LLC
|
|||
|
Balance Sheets
|
|||
|
December 31,
|
|||
|
2010
|
2009
|
||
|
ASSETS (Note 8)
|
|||
|
Current Assets
|
|||
|
Cash and cash equivalents
|
$ 1,618,244
|
$ 1,853,959
|
|
|
Restricted short term investment (Note 7)
|
1,163,581
|
1,153,708
|
|
|
Restricted cash (Notes 8, 9 and 11)
|
1,043,173
|
997,656
|
|
|
Accounts receivable
|
2,813,133
|
1,149,804
|
|
|
Commodity broker receivable
|
-
|
94,391
|
|
|
Inventory (Note 3)
|
5,267,330
|
2,971,319
|
|
|
Derivative financial instruments (Notes 4 and 10)
|
-
|
5,325
|
|
|
Prepaid expenses and other
|
208,190
|
622,443
|
|
|
Total current assets
|
12,113,651
|
8,848,605
|
|
|
Property and equipment, net (Note 5)
|
75,160,322
|
81,150,620
|
|
|
Deposits
|
550,000
|
300,000
|
|
|
Debt issuance costs, net of accumulated amortization of $696,175
|
|||
|
and $419,256 as of December 31, 2010 and 2009, respectively
|
1,065,060
|
1,341,979
|
|
|
Total other assets
|
1,615,060
|
1,641,979
|
|
|
Total Assets
|
$ 88,889,033
|
$ 91,641,204
|
|
|
LIABILITIES AND MEMBERS' EQUITY
|
|||
|
Current Liabilities
|
|||
|
Current maturities of long-term debt (Note 2, 8 and 9)
|
$ 6,025,417
|
$ 3,205,471
|
|
|
Accounts payable
|
|||
|
Trade
|
1,244,868
|
1,834,787
|
|
|
Corn
|
5,322,868
|
2,688,561
|
|
|
Accrued liabilities (Note 2)
|
4,164,646
|
2,401,015
|
|
|
Reclassification of long-term debt to current (Notes 2, 8 and 9)
|
38,579,904
|
45,873,529
|
|
|
Total current liabilities
|
55,337,703
|
56,003,363
|
|
|
Long-Term Debt, net of Current Maturities (Notes 2, 8 and 9)
|
18,750
|
18,750
|
|
|
Commitments and Contingencies (Notes 2, 6, 7, 11 and 12)
|
|||
|
Members’ Equity (Note 6)
|
|||
|
Preferred Units, 185.45 and 185.44 units issued and outstanding as of December 31, 2010 and 2009, respectively
|
1,854,503
|
1,854,428
|
|
|
Common Units, net of offering costs, 5,233 units issued and outstanding
|
49,839,281
|
49,839,281
|
|
|
Accumulated deficit
|
(18,161,204)
|
(16,074,618)
|
|
|
Total members' equity
|
33,532,580
|
35,619,091
|
|
|
Total Liabilities and Members’ Equity
|
$ 88,889,033
|
$ 91,641,204
|
|
|
See Notes to Financial Statements.
|
|||
F-2
|
NEDAK ETHANOL, LLC
|
||||
|
Statements of Operations
|
||||
|
Years Ended December 31,
|
||||
|
2010
|
2009
|
|||
|
Revenues
|
$ 94,777,441
|
$ 67,536,108
|
||
|
Cost of Goods Sold
|
94,338,221
|
74,528,307
|
||
|
Gross Income (Loss)
|
439,220
|
(6,992,199)
|
||
|
General and Administrative Expenses
|
2,424,432
|
2,596,682
|
||
|
Operating Loss
|
(1,985,212)
|
(9,588,881)
|
||
|
Other Income (Expense)
|
||||
|
Gain from litigation settlement (Note 11)
|
3,000,000
|
3,766,567
|
||
|
Interest income
|
31,317
|
44,452
|
||
|
Interest expense
|
(3,443,160)
|
(3,457,386)
|
||
|
Other income
|
310,469
|
-
|
||
|
Total other income (expense), net
|
(101,374)
|
353,633
|
||
|
Net Loss
|
$ (2,086,586)
|
$ (9,235,248)
|
||
|
Net Loss Per Common Unit - Basic and Diluted (Note 6)
|
$ (434.18)
|
$ (1,790.31)
|
||
|
See Notes to Financial Statements.
|
||||
F-3
|
NEDAK ETHANOL, LLC
|
||||||||
|
Statements of Changes in Members' Equity
|
||||||||
|
Accumulated
|
||||||||
|
Preferred Units
|
Common Units
|
Deficit
|
Total
|
|||||
|
Balance - December 31, 2008
|
$
|
-
|
$
|
49,891,449
|
$
|
(6,839,370)
|
$
|
43,052,079
|
|
Sale of 185.44 units
|
1,854,428
|
-
|
-
|
1,854,428
|
||||
|
Cost of raising capital
|
-
|
(52,168)
|
-
|
(52,168)
|
||||
|
Net loss
|
-
|
-
|
(9,235,248)
|
(9,235,248)
|
||||
|
Balance - December 31, 2009
|
1,854,428
|
49,839,281
|
(16,074,618)
|
35,619,091
|
||||
|
Sale of 0.0075 units
|
75
|
-
|
-
|
75
|
||||
|
Net loss
|
-
|
-
|
(2,086,586)
|
(2,086,586)
|
||||
|
Balance - December 31, 2010
|
$
|
1,854,503
|
$
|
49,839,281
|
$
|
(18,161,204)
|
$
|
33,532,580
|
|
See Notes to Financial Statements.
|
||||||||
F-4
|
Statements of Cash Flows
|
||||
|
Years Ended December 31,
|
||||
|
2010
|
2009
|
|||
|
Cash Flows from Operating Activities
|
||||
|
Net loss
|
$ (2,086,586)
|
$ (9,235,248)
|
||
|
Adjustments to reconcile net loss to net cash provided by (used in) operations:
|
||||
|
Depreciation and amortization
|
6,390,306
|
6,341,815
|
||
|
Change in fair value of derivative financial instruments
|
5,325
|
(5,325)
|
||
|
Gain from litigation settlement due to debt extinguishment
|
-
|
(3,766,567)
|
||
|
Change in operating assets and liabilities
|
||||
|
Receivables
|
(1,568,938)
|
(1,062,043)
|
||
|
Inventory
|
(2,296,011)
|
(1,327,041)
|
||
|
Prepaid expenses and other
|
414,253
|
(321,891)
|
||
|
Deposits
|
(250,000)
|
(300,000)
|
||
|
Accounts payable
|
2,394,388
|
3,338,896
|
||
|
Accrued liabilities
|
1,763,631
|
1,396,121
|
||
|
Net cash provided by (used in) operating activities
|
4,766,368
|
(4,941,283)
|
||
|
Cash Flows from Investing Activities
|
||||
|
Purchases of property and equipment
|
(123,089)
|
(181,922)
|
||
|
Net change in restricted cash and investments
|
(55,390)
|
(371,386)
|
||
|
Net cash used in investing activities
|
(178,479)
|
(553,308)
|
||
|
Cash Flows from Financing Activities
|
||||
|
Proceeds from construction loan
|
-
|
1,700,000
|
||
|
Payments on construction loan
|
(4,473,679)
|
-
|
||
|
Sale of preferred units
|
75
|
1,854,428
|
||
|
Proceeds from Delta-T letter of credit
|
-
|
3,995,000
|
||
|
Payment on tax increment financing
|
-
|
(285,000)
|
||
|
Payments for deferred offering costs
|
-
|
(10,569)
|
||
|
Payment for debt issuance costs
|
(350,000)
|
-
|
||
|
Net cash provided by (used in) financing activities
|
(4,823,604)
|
7,253,859
|
||
|
Increase (Decrease) in Cash and Cash Equivalents
|
(235,715)
|
1,759,268
|
||
|
Cash and Cash Equivalents – Beginning of Period
|
1,853,959
|
94,691
|
||
|
Cash and Cash Equivalents – End of Period
|
$ 1,618,244
|
$ 1,853,959
|
||
|
Supplemental Disclosures of Cash Flow Information and
|
||||
|
Noncash Investing and Financing Activities
|
||||
|
Cash payments for interest
|
$ 2,516,320
|
$ 3,655,215
|
||
|
Debt issuance costs in accounts payable
|
-
|
350,000
|
||
|
Settlement advance from Delta-T used to reduce property and
|
||||
|
equipment
|
-
|
228,433
|
||
|
Deferred offering costs offset against equity
|
-
|
52,168
|
||
|
Settlement concession from Delta-T from forgiveness of note payable which
|
||||
|
reduced property and equipment
|
-
|
3,246,785
|
||
|
Deferred offering costs included in accounts payable
|
-
|
8,566
|
||
|
Capitalization of accrued interest on member notes
|
-
|
3,750
|
||
|
See Notes to Financial Statements.
|
||||
F-5
NEDAK ETHANOL, LLC
Notes to Financial Statements
December 31, 2010 and 2009
1. SUMMARY OF SIGNIFICANT ACCOUNTING POLICIES
Nature of Business
NEDAK Ethanol, LLC, a Nebraska limited liability company (the “Company”) operates a 44 million gallon per year ethanol plant in Atkinson, Nebraska. The Company produces and sells fuel ethanol and distiller’s grains, a co-product of the fuel ethanol production process. Sales of ethanol and distiller’s grains began in January 2009.
Accounting Estimates
Management uses estimates and assumptions in preparing these financial statements in accordance with generally accepted accounting principles (GAAP). Those estimates and assumptions affect the reported amounts of assets and liabilities, the disclosure of contingent assets and liabilities, and the reported revenues and expenses. The Company uses estimates and assumptions in accounting for the following significant matters, among others: the allowance for doubtful accounts, useful lives of property and equipment, the valuation of inventory and inventory purchase commitments and long-lived asset impairments including the assumptions used to estimate future cash flows, the ability to raise capital, and the ability to comply with certain provisions within the Company’s credit agreements. Actual results may differ from estimated amounts, and such differences may be material to the Company’s financial statements. The Company periodically reviews estimates and assumptions, and the effects of revisions are reflected in the period in which the revisions are made.
Cash and Cash Equivalents
The Company considers all unrestricted, highly liquid debt instruments with maturity of three months or less at the time of purchase to be cash equivalents. The Company maintains its accounts primarily at one financial institution. At times throughout the year, the Company’s cash and cash equivalents balances exceed amounts insured by the Federal Deposit Insurance Corporation. The Company does not believe it is exposed to any significant credit risk on its cash and cash equivalent balances.
Investments
Restricted short term investments consist of certificates of deposit recorded at the lower of cost or market. These deposits are with the same bank as cash balances are held with. As noted in Note 7, these instruments are restricted as part of letter of credit agreements the Company has entered into.
Restricted Cash
The Company is required to maintain cash balances for two purposes:
· as part of the construction loan / operating line financing as described in Note 8,
· as part of the tax increment financing agreement as described in Note 9.
Accounts Receivable
Credit terms are extended to customers in the normal course of business. The Company performs ongoing credit evaluations of its customers’ financial condition and, generally, requires no collateral.
Accounts receivable are recorded at their estimated net realizable value. Accounts are considered past due if payment is not made on a timely basis in accordance with the Company’s credit terms. Accounts considered uncollectible are written off. The Company’s estimate of the allowance for doubtful accounts is based on historical experience, its evaluation of the current status of receivables, and unusual circumstances, if any. As of December 31, 2010 and 2009, the Company was of the belief that an allowance was not considered necessary. It is possible this estimate could change in the future.
F-6
NEDAK ETHANOL, LLC
Notes to Financial Statements
December 31, 2010 and 2009
Inventory
Inventory is stated at the lower of cost or market on a weighted average cost basis. Market is based on current replacement values not to exceed net realizable values and it is not less than net realizable values reduced by allowances for normal profit margin. Inventory consists of raw materials, work in process, and finished goods. Corn is the primary raw material. Finished goods consist of ethanol and distiller’s grains produced.
Derivative Financial Instruments
The Company is exposed to the impact of market fluctuations associated with commodity prices. It uses derivative financial instruments as part of the overall strategy to manage market risk, as allowed by sufficient working capital and liquidity. The Company, when able, uses cash, futures and option contracts to hedge changes to the commodity prices of corn, ethanol, natural gas and gasoline. The Company will not enter into these derivative financial instruments for trading or speculative purposes, nor does it plan to designate these contracts as cash flow or fair value hedges for accounting.
Derivatives are recognized in the balance sheet at their fair value. The fair value of futures and options is determined by exchange traded market prices. Gains and losses from derivatives that do not qualify as accounting hedges, or are undesignated, must be recognized immediately in earnings and are recorded in cost of goods sold.
Contracts are evaluated to determine whether the contracts are derivatives. Certain contracts that literally meet the definition of a derivative may be exempted as “normal purchases or normal sales”. Normal purchases and normal sales are contracts that provide for the purchase or sale of commodities that will be delivered in quantities expected to be used or sold over a reasonable period in the normal course of business. Contracts that meet the requirements of normal purchases or sales are documented as normal and exempted from accounting as derivatives and, therefore, are not marked to market in the Company’s financial statements. Losses are recognized on such contracts when the contract price is not expected to be realized.
Property and Equipment
Property and equipment is stated at cost. Maintenance and repairs are expensed as incurred; major improvements are capitalized. Depreciation is computed using the straight-line method over the following estimated useful lives:
|
Land improvements
|
20 years
|
|||
|
Buildings
|
15-39 years
|
|||
|
Plant equipment
|
10-20 years
|
|||
|
Office equipment
|
5-7 years
|
|||
|
Vehicles
|
5-7 years
|
Long-Lived Assets
Long-lived assets, such as property and equipment, are reviewed for impairment whenever events or changes in circumstances indicate that the carrying amount of an asset may not be recoverable. If circumstances require a long-lived asset be tested for possible impairment, the Company first compares future undiscounted cash flows expected to be generated by an asset to the carrying value of the asset. If the carrying value of the long-lived asset is not recoverable on an undiscounted cash flow basis, impairment would be recognized to the extent that the carrying value exceeds its fair value. Fair value would be determined through various valuation techniques including discounted cash flow models, quoted market values and third-party independent appraisals, as considered necessary.
Due to continued net losses and violations of its credit agreements, the Company performed an impairment analysis over long-lived assets as of December 31, 2010. In accordance with the Company’s policy for evaluating impairment of long-lived assets described above, management has estimated that the projected future undiscounted cash flows from operations of these facilities exceed their carrying value as of December 31, 2010; therefore, no impairment loss was recognized. In determining the projected future undiscounted cash flows, the Company has made significant assumptions concerning the future viability of the ethanol industry, the future price of corn in relation to the future price of ethanol and the overall demand for ethanol in relation to production and supply capacity.
F-7
NEDAK ETHANOL, LLC
Notes to Financial Statements
December 31, 2010 and 2009
Debt Issuance Costs
Debt issuance costs are amortized over the term of the related debt by use of the effective interest method. Amortization expense related to debt issuance costs of $276,919 and $242,535 for the years ended December 31, 2010 and 2009, respectively, is included in interest expense. Future amortization of debt issuance costs is expected to be as follows: 2011 $239,330, 2012 $213,018, 2013 $189,731, 2014 $155,215, 2015 $123,491, and thereafter $144,275.
Revenue Recognition
The Company generally sells ethanol and distiller’s grains pursuant to marketing agreements. Revenues from these products are recorded when the customer has taken title and assumed the risks and rewards of ownership, prices are fixed or determinable and collectability is reasonably assured. Title is generally assumed by the buyer at the Company’s shipping point.
In accordance with the Company’s agreements for the marketing and sale of ethanol and distiller’s grains, marketing fees and commissions due to the marketers are deducted from the gross sales price as earned. Marketing fees and commissions were approximately $1,219,000 and $700,000 for the years ended December 31, 2010 and 2009, respectively. Revenue is recorded net of these fees and commissions. In certain situations, shipping costs were incurred by the Company and in other situations they were paid by the marketers. Shipping costs incurred in the sale of ethanol and paid by the Company are recorded gross and are included in Costs of Goods Sold in the Statement of Operations. Shipping costs paid for by the Company’s marketers are netted in revenues.
Net Income (Loss) per Common Unit
Basic net income (loss) per common unit is computed by dividing net income (loss) applicable to common units by the weighted average number of members’ common units outstanding during the period. Diluted net income per common unit is computed by dividing net income (loss) applicable to common units by the weighted average number of members’ common units and, if dilutive, members’ common unit equivalents outstanding during the period. There were no member common unit equivalents outstanding during the periods presented and the entire amount of loss was allocated to common units. Accordingly, for all periods presented the Company’s basic and diluted net income per common unit are the same.
Income Taxes
The Company is treated as a partnership for federal and state income tax purposes and generally does not incur income taxes. Instead, income or losses are included in the income tax returns of the Company’s members. Accordingly, no provision or liability for federal or state income taxes has been included in these financial statements. As of December 31, 2010 the Company’s reported basis in its net assets exceeds their tax basis by $20,603,932. Accordingly, a net deferred tax liability of $7,417,416 would be recognized by a debit to income tax expense, if the partnership were a taxable entity.
The Company files income tax returns in the U.S. federal jurisdiction and the state of Nebraska. Management continually evaluates the Company’s tax positions and has concluded that the Company has taken no uncertain tax positions that require adjustment to the financial statements. Generally, the Company is no longer subject to U.S. federal, state and local income tax examinations by tax authorities for years before 2007.
Segment Reporting
Operating segments are defined as components of an enterprise for which separate financial information is available that is evaluated regularly by the chief operating decision maker or decision making group in deciding how to allocate resources and in assessing performance. The Company has determined that it has one reportable business segment, the manufacture and marketing of fuel-grade ethanol and the co-products of the ethanol production process. The Company’s chief operating decision maker reviews financial information of the Company as a whole for purposes of assessing financial performance and making operating decisions. Accordingly, the Company considers itself to be operating in a single industry segment.
F-8
NEDAK ETHANOL, LLC
Notes to Financial Statements
December 31, 2010 and 2009
2. MARKET UNCERTAINTIES, LIQUIDITY AND MANAGEMENT’S PLANS
The Company has certain risks and uncertainties that it experiences during volatile market conditions such as what the ethanol industry experienced during 2008 and which continued through 2009 and into 2010. These volatilities can have a severe impact on operations.
The Company’s operating and financial performance is largely driven by the prices at which it sells ethanol and the net cost of corn. The price of ethanol is influenced by factors such as supply and demand, the weather, government policies and programs, unleaded gasoline prices and the petroleum markets as a whole. Excess ethanol supply in the market, in particular, puts downward pressure on the price of ethanol. The Company’s largest cost of production is corn. The Company’s cost of corn is generally impacted by factors such as supply and demand, the weather, government policies and programs, and risk management techniques used to protect against the price volatility. The Company is subject to significant risk that its operating margins may be reduced or eliminated due to the relative movements in the market prices of its products and major manufacturing inputs. As a result, market fluctuations in the price of or demand for these commodities can have a significant adverse effect on the Company’s operations and profitability. Due to the current conditions of these commodity markets, the Company may continue to produce negative margins.
As of December 31, 2010, the Company was in default of its Credit Agreement and its Tax Increment Financing, as further discussed in Notes 8 and 9. For this reason, the Company has reclassified amounts owing under these loans as current liabilities. Such treatment of the Company’s long term debt will continue, as required by GAAP, until such defaults are cured. The Company also performed an impairment analysis for its long-lived assets as of December 31, 2010, see Note 1.
Because of these events and market conditions, there is an increased level of uncertainty with respect to the Company’s ability to obtain sufficient cash flows from operations or debt or equity financing sufficient to cover the liquidity needed for ongoing operations. The Company has continued discussions with its lenders to resolve defaults under the Credit Agreement and Tax Increment Financing, which may include entering into a tolling agreement and obtaining additional capital. A final resolution to the defaults and amortization of the loans will require approval of the lenders and may include requirements for additional capital. The Company has also engaged a firm to undertake a more systematic approach to potential capital sources.
The Company continues to work with its lenders and others to identify the means by which it can improve its capital position. Improved capitalization would better enable the Company to hedge and better manage its market risk in the commodity markets, among other things. Improving its capitalization will likely involve restructuring its debt so that both the debt level and the associated covenants are more compatible with current market conditions, and may also involve the Company issuing equity in one or more private placements on terms which the Company cannot predict at this time.
Exclusive of the reclassification of the majority of the Company’s long term debt to current liabilities, the Company would have had negative working capital of $4,644,148 including only Current Maturities of Long Term Debt that represent normal amortization of principal, as of December 31, 2010. As reported in the Balance Sheet, including the reclassification of long term debt to current liabilities, working capital was a negative $43,224,052 as of December 31, 2010.
Accrued liabilities include accrued board compensation of $929,750 and $742,500 as of December 31, 2010 and 2009, respectively, and accounts payable include amounts due to the Company’s grain procurement agent totaling approximately $869,000 and $808,000 as of December 31, 2010 and 2009, respectively, which have had favorable payment terms. If these favorable payment terms cease, more cash may be required.
These financial statements have been prepared assuming the Company will continue as a going concern. Until the Company is able to obtain additional working capital from the above options, for which no assurance can be given, or from operations, and in addition, modify the Credit Agreement covenants or refinance the construction loan, there is substantial doubt as to whether the Company can continue to operate as a going concern.
3. INVENTORY
Inventory consisted of the following as of December 31, 2010 and 2009:
F-9
NEDAK ETHANOL, LLC
Notes to Financial Statements
December 31, 2010 and 2009
|
2010
|
2009
|
|||
|
Finished Goods
|
$
|
3,478,089
|
$
|
842,143
|
|
Work in Process
|
912,104
|
567,410
|
|
Raw Materials
|
877,137
|
1,561,766
|
||
|
Total
|
$
|
5,267,330
|
$
|
2,971,319
|
4. DERIVATIVE FINANCIAL INSTRUMENTS
The Company seeks to hedge a portion of its future corn and natural gas purchases to the extent considered necessary for minimizing risk from market price fluctuations. However, as of December 31, 2010, the Company had no open derivative positions for corn to hedge its forward corn commitments and no open derivative positions for natural gas. Derivative financial instruments are recorded at fair value.
The following table provides details regarding the approximate losses from the Company’s derivative financial instruments in the statement of operations for the year ended December 31, 2010, none of which are designated as hedging instruments:
|
Derivatives not
|
Location of Loss
|
Amount of Loss
|
||
|
Designated as Hedging
|
Recognized in
|
Recognized in
|
||
|
Instruments
|
Income
|
Income
|
||
|
Commodity contracts
|
Cost of goods sold
|
$
|
(335,630)
|
The following table provides details regarding the Company’s derivative financial instruments as of December 31, 2009, none of which are designated as hedging instruments:
|
Instrument
|
Balance Sheet Location
|
Assets
|
Liabilities
|
|||
|
Commodity contracts
|
Derivative financial instruments
|
$
|
5,325
|
$
|
-
|
The following table provides details regarding the approximate gains from the Company’s derivative financial instruments in the statement of operations for the year ended December 31, 2009, none of which are designated as hedging instruments:
|
Derivatives not
|
Location of Gain
|
Amount of Gain
|
||
|
Designated as Hedging
|
Recognized in
|
Recognized in
|
||
|
Instruments
|
Income
|
Income
|
||
|
Commodity contracts
|
Cost of goods sold
|
$
|
4,703
|
5. PROPERTY AND EQUIPMENT
Property and equipment consisted of the following as of December 31, 2010 and 2009:
|
2010
|
2009
|
||
|
Land and improvements
|
$ 4,408,272
|
$ 4,408,272
|
|
|
Buildings
|
9,121,024
|
9,102,173
|
|
|
Plant equipment
|
73,216,667
|
73,204,195
|
|
|
Office equipment
|
200,575
|
200,575
|
|
|
Vehicles
|
560,383
|
468,617
|
|
|
87,506,623
|
87,383,832
|
||
|
Less accumulated depreciation
|
(12,346,599)
|
(6,233,212)
|
|
|
Net property and equipment
|
$ 75,160,322
|
$ 81,150,620
|
Depreciation expense for the years ended December 31, 2010 and 2009 was $6,113,387 and $6,099,280, respectively.
F-10
NEDAK ETHANOL, LLC
Notes to Financial Statements
December 31, 2010 and 2009
6. MEMBERS’ EQUITY
In 2009, the Company issued preferred membership units (“Preferred Units”) at $10,000 per Preferred Unit. The Preferred Units entitle the holders thereof to (i) receive a preferred cumulative distribution of 10% (“Preferred Return”) before holders of common membership units receive distributions upon declaration by the Board of Directors, subject to (a) any existing debt-related restrictions the Company may have, and (b) after estimated tax distributions; (ii) then share in their proportionate share any remaining amounts available for distribution; (iii) first receive a distribution of the purchase price of the Preferred Units, plus any Preferred Return, upon a liquidation event; and (iv) the right to vote as a class for purposes of determining whether a liquidation event has occurred. Following the third anniversary of the issuance of the Preferred Units, the Company may redeem Preferred Units for the original purchase price plus any accrued but unpaid distributions.
As of December 31, 2010, there were 185.5 Preferred Units, of which 101.5 units were issued to Directors of the Company. The accumulated undeclared Preferred Return as of December 31, 2010 was $318,899, and the total liquidation preference of the Preferred Units as of December 31, 2010 was $2,173,402. Losses are generally allocated to all units based upon their respective percentage of units held, except that losses are not allocated to Preferred Units if the Preferred Return has not been achieved.
A reconciliation of net loss applicable to common units used in the calculation of net loss per common unit for the years ended December 31, 2010 and 2009 is as follows:
|
2010
|
2009
|
||||||
|
Net loss
|
$ (2,086,586)
|
$ (9,235,248)
|
|||||
|
Preferred Return on Preferred Units
|
(185,459)
|
(133,440)
|
|||||
|
Net loss applicable to Common Units
|
$ (2,272,045)
|
$ (9,368,688)
|
|||||
|
Weighted average Common Units Outstanding - Basic and Diluted
|
5,233
|
5,233
|
|||||
|
Net loss per Common Unit - Basic and Diluted
|
$ (434.18)
|
$ (1,790.31)
|
|||||
|
Quarterly earnings per Common Units (unaudited) are as follows:
|
|||||||
|
First
Quarter
|
Second
Quarter
|
Third
Quarter
|
Fourth
Quarter
|
||||
|
Year ended December 31, 2010
|
|||||||
|
Net income (loss)
|
$ 1,726,967
|
$ (3,218,505)
|
$ (2,124,657)
|
$ 1,529,609
|
|||
|
Preferred Return on Preferred Units
|
(45,737)
|
(46,235)
|
(46,744)
|
(46,743)
|
|||
|
Net income (loss) applicable to Common Units
|
$ 1,681,230
|
$ (3,264,740)
|
$(2,171,401)
|
$ 1,482,866
|
|||
|
Weighted average Common Units Outstanding -Basic and Diluted
|
5,233
|
5,233
|
5,233
|
5,233
|
|||
|
Net loss per Common Unit - Basic and Diluted
|
$ 321.27
|
$ (623.88)
|
$ (414.94)
|
$ 283.37
|
|||
|
Year ended December 31, 2009
|
|||||||
|
Net income (loss)
|
$ (3,843,772)
|
$ (4,422,892)
|
$ (3,019,538)
|
2,050,954
|
|||
|
Preferred Return on Preferred Units
|
(6,929)
|
(33,055)
|
(46,725)
|
(46,731)
|
|||
|
Net income (loss) applicable to Common Units
|
$ (3,850,701)
|
$ (4,455,947)
|
$ (3,066,263)
|
$ 2,004,223
|
|||
|
Weighted average Common Units Outstanding -Basic and Diluted
|
5,233
|
5,233
|
5,233
|
5,233
|
|||
|
Net loss per Common Unit - Basic and Diluted
|
$ (735.85)
|
$ (851.51)
|
$ (585.95)
|
$ 383.00
|
|||
F-11
NEDAK ETHANOL, LLC
Notes to Financial Statements
December 31, 2010 and 2009
7. LINE OF CREDIT
In March 2006, the Company entered into a line of credit agreement, in favor of its natural gas transporter (see Note 11) to reserve pipeline space. The natural gas transporter may draw up to $150,000 until maturity in May 2011. Interest is payable upon the lender’s demand or in May 2011 at a rate of 3.35%. In August 2007, the Company entered into a line of credit agreement, in favor of its natural gas transporter for the service of transporting gas. The natural gas transporter may draw up to $923,828. Interest is payable upon the lender’s demand at a rate of 3.75%. These agreements are secured by restricted short term investments totaling $1,163,581 and $1,153,708 as of December 31, 2010 and 2009, respectively. As of December 31, 2010 and 2009, there were no borrowings outstanding on the lines of credit.
8. LONG-TERM DEBT
|
December 31, 2010
|
December 31, 2009
|
|||
|
Construction loan under Credit Agreement
|
$
|
38,026,321
|
$
|
42,500,000
|
|
Members’ notes payable
|
18,750
|
18,750
|
||
|
Tax increment financing note (Note 9)
|
6,579,000
|
6,579,000
|
||
|
44,624,071
|
49,097,750
|
|||
|
Less current maturities
|
(6,025,417)
|
(3,205,471)
|
||
|
Less debt previously classified as long term
|
(38,579,904)
|
(45,873,529)
|
||
|
$
|
18,750
|
$
|
18,750
|
The maturities of long term debt as of December 31, 2010, are as follows:
| 2011 |
$ 44,605,321
|
|||
| 2012 |
18,750
|
|||
|
Total long-term debt
|
$ 44,624,071
|
Construction Loan under Credit Agreement
In February 2007, the Company entered into a senior credit facility (“Credit Agreement”) with AgCountry Farm Credit Services, FLCA (“Lender”) for a multiple advance construction loan totaling $42,500,000. The Company was required to make interest payments during the construction phase at the thirty-day LIBOR plus 3.4%, but not less than 6.0%. The interest rate was 6.0% as of December 31, 2010. The performance test of the plant was completed in June 2009, but three significant equipment deficiencies prevented final acceptance at that time. The Credit Agreement provides that the construction loan is to be converted at final acceptance to a permanent ten year term loan of $32,500,000 and a $10,000,000 revolving term loan, which has not yet occurred as of December 31, 2010. As of December 31, 2010 and 2009, the Company had $38,026,321 and $42,500,000 outstanding on the construction loan, respectively.
Under the current terms of the Credit Agreement, the Company is required to make level monthly principal and interest payments of approximately $447,368 through February 1, 2018.
The Credit Agreement requires the Company to maintain certain financial covenants, including minimum working capital of $6,000,000, minimum current ratio of 1.20:1.00, minimum tangible net worth of $41,000,000, minimum owners’ equity ratio of 50%, and a minimum fixed charge coverage ratio of 1.25:1.00, and also includes restrictions on distributions and capital expenditures. As of December 31, 2010, the Company was in violation of the working capital and current ratio covenants (working capital was $(4,644,148) and the ratio was 1.20:0.71, both, exclusive of the debt reclassification), tangible net worth ($40,399,328) and the fixed charge coverage ratio (0.79:1.00). The Credit Agreement contains certain prepayment fees in the first four years of the scheduled payments, and the loan is secured by substantially all the Company’s assets.
On August 6¸ 2010, the Company executed a Sixth Supplement and Forbearance Agreement to the Master Credit Agreement (the “Sixth Supplement”), under which the Company agreed that Lender could apply the $3,945,087 it held as collateral under the Credit Agreement to the Company’s current obligations under the Credit Agreement, including monthly payments, penalties and interest. In exchange for the foregoing among other terms, Lender agreed to refrain from exercising its rights under the Credit Agreement until the earlier of October 1, 2010 or the date of any default under the Sixth Supplement. The TIF Lender (defined in Note 9) filed a suit
F-12
NEDAK ETHANOL, LLC
Notes to Financial Statements
December 31, 2010 and 2009
alleging a breach of the TIF Loan, which suit constituted a breach under the Sixth Amendment, but the Lender has not taken any actions directly related to the suit.
The Company and the Lender remain in discussions to revise the Credit Agreement covenants and resolve outstanding defaults under the Credit Agreement. In light of continuing poor margins in the ethanol industry, the Lender has indicated the Company should focus on mitigation of risk and obtaining additional capital.
Effective February 1, 2011, the Company entered into a Seventh Supplement and Forbearance Agreement with the Lender (the “Seventh Supplement”), under which the Lender agreed to forbearance from exercising its enforcement rights under the Loan Agreements until the earliest to occur of June 30, 2011 and the occurrence of an “event of default” under the Seventh Supplement. In addition, the Company agreed that the Lender may apply the proceeds of a letter of credit issued in connection with the Fifth Supplement and Forbearance Agreement dated September 30, 2009 against any amounts due under the Loan Agreement, at the Lender’s sole discretion. In addition, the Company has agreed to deliver a comprehensive strategic financial plan, or update any plan previously delivered, to the Lender by March 31, 2011. Furthermore, the Company has also committed to raise additional capital prior to expiration of the forbearance period provided in the Seventh Supplement, and the Company is obligated to provide certain financial statements, books, records and budgets to lender on a periodic basis as set forth in the Seventh Supplement.
Note Payable to Members
In May 2004, each of the initial 15 members loaned the Company $1,000. The unsecured loans bore interest at 5% per annum with principal and interest due on April 8, 2009. On April 8, 2009, the notes were amended and restated to add accrued interest in the amount of $3,750 to the principal. The unsecured notes, which are classified as long-term debt as of December 31, 2010, continue to bear interest at 5% per annum with principal and interest due on April 8, 2012.
9. TAX INCREMENT FINANCING
In September 2007, the City of Atkinson, Nebraska, (“Issuer”) issued a tax increment financing Note (the “TIF Note”), the net proceeds of which in the amount of $4,939,925 were paid to the Company through a loan (the “TIF Loan”) to reimburse the Company for certain infrastructure improvements relating to the plant. Repayment of the Loan is secured by the Company’s pledge to the lender of the TIF Note (“TIF Lender”) and other obligations relating to the TIF Note. The original amount of the TIF Note was $6,864,000 and bears interest of 9.5%.
In connection with the issuance of the Note, the Issuer and the Company entered into a Redevelopment Contract (“Contract”). Under the Contract, the Note proceeds were used for project costs, for the establishment of special funds held by the Note trustee for interest and principal payments and reserves (the “Capitalized Interest Fund” and the “Debt Service Reserve Fund”), and for debt issuance costs. As of December 31, 2010 and 2009, the Capitalized Interest Fund was approximately $6,500 and $52,500, respectively, and is included in restricted cash on the balance sheet.
Payments on the Note are due in semi-annual increments which commenced at $139,000 on June 1, 2009 and increase to $444,000, with a final maturity in December 2021. Interest on the Note is payable semi-annually on September 1 and December 1. The interest rate resets on September 1, 2012 and September 1, 2017 to a rate equal to the 5-year U.S. Treasury Constant Maturity index plus 4.75% for the applicable five-year period and the remainder of the term of the TIF Loan, respectively. The Company has the option to redeem or purchase the Note in whole or in part. As of December 31, 2010 and 2009, the Company had $6,579,000 outstanding on the TIF Loan.
On July 6, 2009, the TIF Lender notified the Company that the Debt Service Reserve Fund was deficient, constituting a default under the TIF Loan. The Company and the TIF Lender entered into a Forbearance Agreement dated December 31, 2009 (the “TIF Forbearance”). The Company and the TIF Lender failed to extend the TIF Forbearance or reach other arrangements containing similar forbearance obligations by May 15, 2010, and the Company received a Notice of Default dated June 30, 2010 from the TIF Lender indicating that the Company was in default under the TIF Note due to nonpayment of $464,768 owing on June 1, 2010, and that the Debt Service Reserve Fund remained deficient by an amount of $588,553. Because of these defaults, the TIF Lender reserved the right to (i) charge the Company an interest rate of 4% over the interest rate the Lender would otherwise be able to charge the Company, (ii) charge the Company a late charge of 5% for payments which are more than 10 days overdue, (iii) accelerate the entire
F-13
NEDAK ETHANOL, LLC
Notes to Financial Statements
December 31, 2010 and 2009
amount of principal outstanding under the TIF Loan (which was $6,579,000 as of June 30, 2010) and (iv) exercise any other rights available to it under TIF Forbearance or at law. Due to these defaults, the TIF Loan is classified as a current liability.
On August 12, 2010, the TIF Lender filed a lawsuit against the Company in the District Court of Douglas County, Nebraska alleging that the Company failed to make certain payments due under the TIF Note and failed to maintain the required debt service reserve fund. In addition, the lawsuit stated that the TIF Lender accelerated the maturity of the TIF Note. The TIF Lender sought in the lawsuit repayment of $7,039,126 due as of August 9, 2010, plus such additional amounts as become due and owing under the TIF Note, with interest accruing after August 9, 2010 at the rate of 9.5% until the judgment is paid. It is uncertain when or how the court will rule on the several pending motions. Discovery is ongoing and no trial date has been set.
Under the terms of the Contract, a portion of the real estate taxes paid by the Company would be used to make principal and interest payments on the TIF Note. However, the Company is not in compliance with the Contract due to nonpayment of real estate taxes. The Company has accrued the full amounts of 2009 and 2010 real estate taxes due as of December 31, 2010 in accrued expenses on the balance sheet.
10. FAIR VALUE MEASUREMENTS
Accounting standards establish a framework for measuring fair value. That framework provides a fair value hierarchy that prioritizes the inputs to valuation techniques used to measure fair value. The hierarchy gives the highest priority to unadjusted quoted prices in active markets for identical assets or liabilities (level 1 measurements) and the lowest priority to unobservable inputs (level 3 measurements). The three levels of the fair value hierarchy are described below:
|
|
·
|
Level 1: Inputs to the valuation methodology are unadjusted quoted prices for identical assets or liabilities in active markets that the Company has the ability to access.
|
|
|
·
|
Level 2: Significant other observable inputs other than Level 1 prices such as quoted prices for similar assets or liabilities; quoted prices in markets that are not active; or other inputs that are observable or can be corroborated by observable market data.
|
|
|
·
|
Level 3: Inputs to the valuation methodology are unobservable and significant to the fair value measurement.
|
The asset’s or liability’s fair value measurement level within the fair value hierarchy is based on the lowest level of any input that is significant to the fair value measurement. Valuation techniques used need to maximize the use of observable inputs and minimize the use of unobservable inputs.
The following table summarizes by level, within the fair value hierarchy, the Company’s assets (liabilities) that are measured at fair value on a recurring basis as of December 31, 2009:
|
Level 1
|
Level 2
|
Level 3
|
Total
|
|
|
Derivative financial instruments
|
$ 5,325
|
$ -
|
$ -
|
$ 5,325
|
There were no assets or liabilities measured at fair value on a recurring or nonrecurring basis as of December 31, 2010.
The carrying values of cash and cash equivalents, restricted cash, restricted short-term investments, accounts receivable, the commodity broker receivable, derivative financial instruments and accounts payable are recorded at or approximate fair value. Management determined it is not practicable to estimate the fair value of the notes payable and long-term debt since these agreements contain unique terms, conditions, and restrictions, which were negotiated at arm’s length, and there was no readily determinable similar instrument on which to base an estimate of fair value.
F-14
NEDAK ETHANOL, LLC
Notes to Financial Statements
December 31, 2010 and 2009
11. COMMITMENTS AND CONTINGENCIES
Construction Contract
The Company entered into an Engineering, Procurement and Construction Services Fixed Price Contract dated August 9, 2006 (the “Delta-T Contract”) with Delta-T Corporation (“Delta-T”). Following a dispute, the parties amended the Delta-T Contract on September 1, 2009, which provided that, among other things: (i) Delta-T relinquished letter of credit proceeds of $3,995,000 held by Lender, and (ii) a $5,000,000 promissory note in Delta-T’s favor was extinguished. The extinguishment of the $5,000,000 promissory note and other contract liabilities were recorded as reductions to property and equipment. The relinquishment of the $3,995,000 letter of credit proceeds, less $228,431 for costs expected to be incurred, was recognized as gain in other income during the fourth quarter of 2009.
On March 19, 2010, the Company, Delta-T, Delta-T’s parent, Bateman Litwin NV (“Bateman”) and Bateman Engineering Inc. (“Bateman Engineering”) entered into a Settlement Agreement and Mutual Release (the “Settlement Agreement”), under which, among other things, Delta-T and Bateman authorized the Company to draw $3,000,000 from a letter of credit. The receipt of the $3,000,000 was recognized as a gain in other income in the first quarter of 2010, and held as restricted cash by the Company. Under the Sixth Supplement, withdrawals of $2,220,818, $660,454, $6,694 and $20,500 were made from the restricted cash on July 29, 2010, September 1, 2010, October 31, 2010 and December 8, 2010, respectively, to satisfy amounts due the Lender under the Credit Agreement, leaving $1,036,673 including interest in restricted cash as of December 31, 2010.
Plant Management Agreement
In July 2007, the Company entered into an agreement with an unrelated party for the operation and management of the Company’s plant. The Company pays a fixed monthly payment of approximately $120,434 for such services, which will be adjusted annually. The unrelated party also supplies process chemicals, which the Company is currently paying for at a fixed rate per denatured gallon of ethanol produced. The existing contract allows for potential future payments in an incentive program intended to be based on operational improvements and company profitability. The agreement will terminate on December 31, 2014 unless terminated by either party giving 180 days prior written notice. The Company incurred approximately $1,477,000 and $1,188,000 for these services for the years ended December 31, 2010 and 2009, respectively.
Utility Contracts
The Company has entered into a consulting service contract for management of the various facets of the demand for natural gas for use in plant operations. The three services of natural gas procurement required to operate the plant are transport, distribution and supply. The physical supply of natural gas to operate the plant is purchased from various companies based on bids established by the Company’s Risk Management Committee with the advice of the management services company. The gas is transported by Kinder Morgan pursuant to various contracts with the Company, and delivered to the local gas company, Source Gas, which distributes the gas to the plant.
Transportation Agreement
In July 2007, the Company entered into an agreement with a fuel carrier for the transportation of ethanol from the plant to the load out facility. The Company pays a base fee per gallon unloaded plus a surcharge if above the diesel fuel base. The agreement has a three year term which commenced July 2007 and will automatically renew for additional one-year terms unless terminated by either party by written notice no less than 180 days prior to the ending date of the initial three-year term or of any renewal term. No notice was issued by either party and the term of the agreement was automatically extended for one year through July 2011.
Marketing Agreements
Ethanol
In November 2006, the Company entered into a marketing agreement with an unrelated party for the sale of its ethanol. The Company pays the marketer a fixed rate fee of $0.01 per net gallon of denatured ethanol for the services provided. In August 2010, the Company gave notice of non-renewal to the marketer, and the Company sold the last ethanol to this marketer in December, 2010.
The marketer leases rail cars to the Company with varying terms under this agreement, which leases may survive the actual marketing agreement by many years. The Company has lease agreements for 137 rail cars under this agreement. There are 29 cars under leases
F-15
NEDAK ETHANOL, LLC
Notes to Financial Statements
December 31, 2010 and 2009
that expire before the end of 2011 and carry an average monthly rental cost of $433. The remaining 108 cars have expiration dates between May 31, 2017 and August 31, 2020, with average monthly rental cost of $653.
Revenues from sales to this marketer were approximately $72,438,000 and $59,906,000 for the years ended December 31, 2010 and 2009, respectively. Accounts receivable from this marketer were $567,066 and $674,671 as of December 31, 2010 and 2009, respectively.
As of December 31, 2010 the Company has forward contracted sales of ethanol with a separate party for 1,160,000 gallons of ethanol to be priced later with a basis of minus $0.09, for delivery in January 2011. The Company has since sold ethanol on the spot market through an arrangement with Tenaska BioFuels, LLC (“Tenaska”), which arrangement is terminable by either party at will. Under this arrangement, the Company pays Tenaska $0.02 per gallon of ethanol sold.
Distiller’s Grains
In January 2007, the Company entered into a marketing agreement with an unrelated party to purchase all of the Company’s wet distiller’s grains with soluble (“WDGS”). The marketer paid the Company the selling price, less a marketing fee equal to $1.50 per ton of WDGS sold at $50 a ton or less or 3.0% of the price of WDGS sold over $50 a ton. The agreement was terminated on February 29, 2011. Revenue from this marketer was approximately $11,644,000 and $7,500,000 for the years ended December 31, 2010 and 2009, respectively. Accounts receivable from this marketer were $712,614 and $332,092 as of December 31, 2010 and 2009, respectively. The Company has since sold its distiller’s grains directly to its purchasers without third party assistance.
Grain Procurement
In the years 2009 and 2010, the Company utilized the services of an unrelated party on an at-will basis to supply its corn. The agent was paid a service fee of $0.04 per bushel of grain delivered, and the Company also executes some contracts directly with producers (which include directors) for some of its corn. The Company has engaged Tenaska on an at-will basis to assist it with grain procurement, under which the Company’s corn cost is netted against its receivable for ethanol sold through Tenaska.
In the ordinary course of business, the Company will enter into forward purchase contracts for its corn purchases. Management considers these forward contracts to be normal purchases since the corn will be delivered in quantities expected to be used by the Company over a reasonable period in the normal course of business. Purchases directly from the agent totaled approximately $13,499,000 and $8,261,000 for the years ended December 31, 2010 and 2009, respectively. As of December 31, 2010, the Company had commitments on forward purchase contracts to purchase 2,100,000 bushels of corn at an average price of $5.47 per bushel totaling $11,487,000 for delivery between January 2011 and July 2011.
Environmental Liabilities
The Company’s operations are subject to environmental laws and regulations adopted by various governmental entities in the jurisdiction in which it operates. These laws require the Company to investigate and remediate the effects of the release or disposal of materials at its location. Accordingly, the Company has adopted policies, practices, and procedures in the areas of pollution control, occupational health, and the production, handling, storage, and use of hazardous materials to prevent material environmental or other damage, and to limit the financial liability which could result from such events. Environmental liabilities are recorded when the liability is probable and the costs can be reasonably estimated.
12. EMPLOYEE BENEFIT PLAN
The Company has a 401(k) plan (“Plan”) for all eligible employees, as defined by the Plan. The Company provides a matching contribution equal to 100% of the first 5% of each participant’s eligible compensation deferred. The Company recorded $33,928 and $37,062 in operating expenses for the cost of providing benefits under the Plan for the years ended December 31, 2010 and 2009, respectively.
F-16
NEDAK ETHANOL, LLC
Notes to Financial Statements
December 31, 2010 and 2009
13. SUBSEQUENT EVENTS
During February 2011, a fire occurred in the Company’s dryer within the plant. The fire resulted in extensive damage to the dryer. There is no reason to believe that the Company will incur material liability or that insurers will not cover all material losses, in each case connected with such fire. The fire has not resulted in any disruption to the daily operations of the plant.
Effective February 1, 2011, the Company entered into a Seventh Supplement, under which the Lender agreed to forbearance from exercising its enforcement rights under the Loan Agreements until the earliest to occur of June 30, 2011 or the occurrence of an “event of default” under the Seventh Supplement. In addition, the Company agreed that the Lender may apply the proceeds of a letter of credit issued in connection with the Fifth Supplement and Forbearance Agreement dated September 30, 2009 against any amounts due under the Loan Agreement, at the Lender’s sole discretion. In addition, the Company has agreed to deliver a comprehensive strategic financial plan, or update any plan previously delivered, to the Lender by March 31, 2011. Furthermore, the Company has also committed to raise additional capital prior to expiration of the forbearance period provided in the Seventh Supplement, and the Company is obligated to provide certain financial statements, books, records and budgets to lender on a periodic basis as set forth in the Seventh Supplement.
Effective March 31, 2011, the Company entered into a Master Netting and Setoff Agreement with Tenaska (the “Master Netting Agreement”) to facilitate payments between the Company and Tenaska and more efficiently use the Company’s working capital. Pursuant to the Master Netting Agreement, the parties net out the payments due from one to the other on a weekly basis. The Master Netting Agreement is terminable by either party at will.
F-17