Attached files
UNITED STATES
SECURITIES AND EXCHANGE COMMISSION
Washington, D.C. 20549
FORM 10-K
| x ANNUAL REPORT PURSUANT TO SECTION 13 OR 15(d) OF THE SECURITIES EXCHANGE ACT OF 1934 |
For the fiscal year ended December 31, 2010.
or
o TRANSITION REPORT PURSUANT TO SECTION 13 OR 15(d) OF THE SECURITIES EXCHANGE ACT OF 1934
For the transition period from ______________ to ______________.
Commission file number: 000-52748

FIRST GUARANTY BANCSHARES, INC.
(Exact name of registrant as specified in its charter)
|
Louisiana
|
26-0513559
|
|
(State or other jurisdiction incorporation or organization)
|
(I.R.S. Employer Identification Number)
|
|
|
|
|
400 East Thomas Street
|
|
|
Hammond, Louisiana
|
70401
|
|
(Address of principal executive offices)
|
(Zip Code)
|
|
(985) 345-7685
|
|
|
(Registrant’s telephone number, including area code)
|
|
|
Not Applicable
|
|
|
(Former name or former address, if changed since last report)
|
|
|
Securities registered pursuant to Section 12(b) of the Act: None
|
|
|
Securities registered pursuant to Section 12(g) of the Act:
|
|
|
Title of each class
|
Name of each exchange on which registered
|
|
Common Stock, $1 par value per share
|
None
|
- 1 -
Indicate by check mark if the registrant is a well-known seasoned issuer, as defined in Rule 405 of the Securities Act.
YESo NO x
Indicate by check mark if the registrant is not required to file reports pursuant to Section 13 or Section 15(d) of the Act.
YES o NO x
Indicate by check mark whether the Registrant (1) has filed all reports required to be filed by Section 13 or 15(d) of the Securities Exchange Act of 1934 during the preceding 12 months (or for such shorter period that the registrant
was required to file such reports), and (2) has been subject to such filing requirements for the past 90 days.
YES x NO o
Indicate by check mark whether the registrant has submitted electronically and posted on its corporate website, if any, every Interactive Data File required to be submitted and posted pursuant to Rule 405 of Regulation S-T during the preceding 12 months.
YESo NO o
Indicate by check mark if disclosure of delinquent filers pursuant to Item 405 of Regulation S-K (§229.405 of this chapter) is not contained herein, and will not be contained, to the best of registrant’s knowledge, in definitive proxy or information statements incorporated by reference in Part III of this Form 10-K or any amendment to this Form 10-K.T
YESo NOx
Indicate by check mark whether the registrant is a large accelerated filer, an accelerated filer, a non-accelerated filer, or a smaller reporting company. See definitions of “large accelerated filer,” “accelerated filer” and “smaller reporting company” in Rule 12b-2 of the Exchange Act. (Check one):
Large accelerated filer o Accelerated filer o Non-accelerated filer o Smaller reporting company x
Indicate by check mark whether the registrant is a shell company (as defined in Rule 12b-2 of the Act).
YESo NO x
The aggregate market value of the voting stock held by non-affiliates of the registrant as of June 30, 2010 was $53,658,241 based upon the price from the last trade of $18.62. The common stock is not quoted or traded on an exchange and there is no established or liquid market for the common stock.
As of March 10, 2011, there were issued and outstanding 5,559,644 shares of the Registrant’s Common Stock.
DOCUMENTS INCORPORATED BY REFERENCE:
(1) Proxy Statement for the 2010 Annual Meeting of Stockholders of the Registrant (Part III).
- 2 -
|
Page
|
||
|
Part I.
|
||
|
Item 1
|
Business
|
4
|
|
Item 1A
|
Risk Factors
|
15
|
|
Item 1B
|
Unresolved Staff Comments
|
21
|
|
Item 2
|
Properties
|
22
|
|
Item 3
|
Legal Proceedings
|
23
|
|
Item 4
|
Reserved
|
23
|
|
Part II.
|
||
|
Item 5
|
Market for Registrant's Common Equity, Related Stockholder Matters and Issuer
|
|
|
Purchases of Equity Securities
|
23
|
|
|
Item 6
|
Selected Financial Data
|
25
|
|
Item 7
|
Management's Discussion and Analysis of Financial Condition and Results
|
|
|
of Operations
|
27
|
|
|
Item 7A
|
Quantitative and Qualitative Disclosures about Market Risk
|
50
|
|
Item 8
|
Financial Statements and Supplementary Data
|
52
|
|
Item 9
|
Changes in and Disagreements with Accountants on Accounting and Financial
|
|
|
Disclosures
|
85
|
|
|
Item 9a(T)
|
Controls and Procedures
|
85
|
|
Item 9b
|
Other Information
|
85
|
|
Part III.
|
||
|
Item 10
|
Directors, Executive Officers and Corporate Governance
|
86
|
|
Item 11
|
Executive Compensation
|
86
|
|
Item 12
|
Security Ownership of Certain Beneficial Owners, Management and Related Stockholder
|
86
|
|
Matters
|
||
|
Item 13
|
Certain Relationships and Related Transactions and Director Independence
|
86
|
|
Item 14
|
Principal Accountant Fees and Services
|
86
|
|
Part IV.
|
||
|
Item 15
|
Exhibits and Financial Statement Schedules
|
87
|
- 3 -
PART 1
Background
First Guaranty Bancshares, Inc. (the “Company”) is a bank holding company headquartered in Hammond, Louisiana with one wholly owned subsidiary, First Guaranty Bank (the “Bank”). At December 31, 2010, the Company had consolidated assets of $1.133 billion with $97.9 million in consolidated stockholders’ equity. The Company’s executive office is located at 400 East Thomas Street, Hammond, Louisiana 70401. The telephone number is (985) 345-7685. The Company is subject to extensive regulation by the Board of Governors of the Federal Reserve System (“FRB”).
First Guaranty Bank is a Louisiana state chartered commercial bank with 16 full-service banking facilities and one drive-up only facility located in southeast, southwest and north Louisiana. The Bank was organized under Louisiana law in 1934 and changed its name to First Guaranty Bank in 1971. Deposits are insured up to the maximum legal limits by the FDIC. The Bank is not a member of the Federal Reserve System. As of December 31, 2010, the Bank was the sixth largest Louisiana-based bank and the fourth largest Louisiana bank not headquartered in New Orleans, as measured by total assets. On October 22, 2010, the Company entered into an Agreement and Plan of Merger (the “Merger Agreement”) with Greensburg Bancshares, Inc. (“Greensburg Bancshares”) and its wholly-owned subsidiary, Bank of Greensburg (“Greensburg”). For further information see "Entry into Material Definitive Agreement."
Business Objective
The Company’s business objective is to provide value to customers by delivering products and services matched to customer needs. We emphasize personal relationships and localized decision making. The Board of Directors and senior Management have extensive experience and contacts in our marketplace and are an important source of new business opportunities.
The Company’s business plan emphasizes both growth and profitability. From December 31, 2006 to December 31, 2010, assets have grown from $715.2 million to $1.133 billion.
Market Areas
Our focus is on the bedroom communities of metropolitan markets, small cities and rural areas in southeast, southwest and north Louisiana. In southeast Louisiana, seven branches are located in Tangipahoa Parish in the towns of Amite, Hammond (2), Independence, Kentwood and Ponchatoula (2). Two branches are located in Livingston Parish, one branch in Denham Springs and the other in Walker. In southwest Louisiana, we have branches in Abbeville and Jennings which are located in Vermillion Parish and Jefferson Davis Parish, respectively. The remaining six branches are located in north Louisiana, in Haynesville and Homer, which are both in Claiborne Parish; in Oil City and Vivian, both in Caddo Parish; in Dubach in Lincoln Parish and Benton, in Bossier Parish. Our core market remains in the home parish of Tangipahoa where approximately 33.0% of deposits and 39.8% of net loans were based in 2010.
Our southeast Louisiana market is strategically located near the intersection of Interstates 12 and 55, which places it at a crossroads of commercial activity for the southeastern United States. In addition, this market area is largely populated by the work force of several nearby petrochemical refineries and other industrial plants and is a bedroom community for the urban centers of New Orleans and Baton Rouge, which are approximately 45 miles and 60 miles, respectively, from Hammond, where the main office is located. Hammond is home to one of the largest medical centers in the state of Louisiana and the third largest state university in Louisiana.
Our southwest Louisiana market benefits from a profitable casino gaming industry and substantial tourism revenue derived from the Louisiana Acadian culture. It also has a concentration of oilfield and oilfield services activity and is a thriving agricultural center for rice, sugarcane and crawfish.
Timber cultivation and its related industries, including milling and logging, are key commercial activities in the north Louisiana market. It is also an agrarian center in which corn, cotton and soybeans are the primary crops. The poultry industry, including independent poultry grower farms that contract with national poultry processing companies, are also very important to the local economy.
Banking Products and Services
The Company offers personalized commercial banking services to businesses, professionals and individuals. We offer a variety of deposit products including personal and business checking and savings accounts, time deposits, money market accounts and NOW accounts. Other services provided include personal and commercial credit cards, remote deposit capture, safe deposit boxes, official checks, traveler's checks, internet banking, online bill pay, mobile banking and lockbox services. Also offered is 24-hour banking through internet banking, voice response and 26 automated teller machines. Although full trust powers have been granted, we do not actively operate or have any present intention to activate a trust department.
Loans
The Bank is engaged in a diversity of lending activities to serve the credit needs of its customer base including commercial loans, commercial real estate loans, real estate construction loans, residential mortgage loans, agricultural loans, home equity lines of credit, equipment loans, inventory financing and student loans. In addition, the Bank provides consumer loans for a variety of reasons such as the purchase of automobiles, recreational vehicles or boats, investments or other consumer needs. The Bank issues MasterCard and Visa credit cards and provides merchant processing services to commercial customers. The loan portfolio is divided, for regulatory purposes, into four broad classifications: (i) real estate loans, which include all loans secured in whole or part by real estate; (ii) agricultural loans, comprised of all farm loans; (iii) commercial and industrial loans, which include all commercial and industrial loans that are not secured by real estate; and (iv) consumer loans.
- 4 -
Competition
The banking business in Louisiana is extremely competitive. We compete for deposits and loans with existing Louisiana and out-of-state financial institutions that have longer operating histories, larger capital reserves and more established customer bases. The competition includes large financial services companies and other entities in addition to traditional banking institutions such as savings and loan associations, savings banks, commercial banks and credit unions.
Many of our larger competitors have a greater ability to finance wide-ranging advertising campaigns through their greater capital resources. Marketing efforts depend heavily upon referrals from officers, directors and shareholders, selective advertising in local media and direct mail solicitations. We compete for business principally on the basis of personal service to customers, customer access to officers and directors and competitive interest rates and fees.
In the financial services industry, intense market demands, technological and regulatory changes and economic pressures have eroded industry classifications in recent years that were once clearly defined. Financial institutions have been forced to diversify their services, increase rates paid on deposits and become more cost effective, as a result of competition with one another and with new types of financial services companies, including non-banking competitors. Some of the results of these market dynamics in the financial services industry have been a number of new bank and non-bank competitors, increased merger activity, and increased customer awareness of product and service differences among competitors. These factors could affect business prospects.
Employees
At December 31, 2010, the Company employeed 246 full-time equivalent employees. None of our employees are represented by a collective bargaining group. The Company has a good relationship with its employees.
Data Processing
Since November 2001, customer information has been housed on equipment owned by Financial Institution Service Corporation (FISC). FISC is a cooperative jointly owned by a number of Louisiana and Mississippi state banks that are currently serviced by FISC. The 2010 annual cost of this service was $0.8 million. The current arrangements are adequate and are expected to be able to accommodate our needs for the foreseeable future.
Information Technology Infrastructure
Our wide area network links more than 25 remote sites. All of the Company's network devices communicate via secure network. We have a redundant back-up site located in Homer, Louisiana.
Subsidiaries
The Company is a one-bank holding company with First Guaranty Bank as its subsidiary.
Bank Regulatory Compliance
First Guaranty Bank is a Federal Deposit Insurance Corporation (“FDIC”) insured, non-member Louisiana state bank. Regulation of financial institutions is intended primarily to protect depositors, the deposit insurance funds of the FDIC and the banking system as a whole, and generally is not intended to protect stockholders or other investors.
The Bank is subject to regulation and supervision by both the Louisiana Office of Financial Institutions and the FDIC. In addition, the Bank is subject to various requirements and restrictions under federal and state law, including requirements to maintain reserves against deposits, restrictions on the types and amounts of loans that are made and the interest that is charged on those loans, and limitations on the types of investments that are made and the types of services that are offered. Various consumer laws and regulations also affect operations. See “Bank Regulation and Supervision.”
Bank Regulation and Supervision
Banking is a complex, highly regulated industry. Consequently, the growth and earnings performance of First Guaranty Bancshares, Inc. and its subsidiary bank can be affected not only by Management decisions and general and local economic conditions, but also by the statutes administered by, and the regulations and policies of, various governmental regulatory authorities. These authorities include, but are not limited to, the FRB, the FDIC, the Louisiana Office of Financial Institutions (“OFI”), the U.S. Internal Revenue Service and state taxing authorities. The effect of these statutes, regulations and policies and any changes to any of them can be significant and cannot be predicted.
The primary goals of the regulatory scheme are to maintain a safe and sound banking system and to facilitate the conduct of sound monetary policy. In furtherance of these goals, Congress has created several largely autonomous regulatory agencies and enacted numerous laws that govern banks, bank holding companies and the banking industry. The system of supervision and regulation applicable to First Guaranty Bancshares, Inc. establishes a comprehensive framework for their respective operations and is intended primarily for the protection of the FDIC’s deposit insurance funds, depositors and the public, rather than the shareholders and creditors. The following is an attempt to summarize some of the relevant laws, rules and regulations governing banks and bank holding companies, but does not purport to be a complete summary of all such applicable laws, rules and regulations. The descriptions are qualified in their entirety by reference to the specific statutes and regulations discussed.
- 5 -
The Dodd-Frank Wall Street Reform and Consumer Protection Act of 2010 (“Dodd-Frank Act”).
The Dodd-Frank Act made extensive changes in the regulation of depository institutions. For example, the Dodd-Frank Act creates a new Consumer Financial Protection Bureau as an independent bureau of the Federal Reserve Board. The Consumer Financial Protection Bureau will assume responsibility for the implementation of the federal financial consumer protection and fair lending laws and regulations, a function currently assigned to prudential regulators, and will have authority to impose new requirements. Institutions of less than $10 billion in assets, such as First Guaranty Bank, will continue to be examined for compliance with consumer protection and fair lending laws and regulations by, and be subject to the primary enforcement authority of, their federal prudential regulator rather than the Consumer Financial Protection Bureau.
In addition to creating the Consumer Financial Protection Bureau, the Dodd-Frank Act, among other things, directs changes in the way that institutions are assessed for deposit insurance, requires more stringent consolidated capital requirements for bank holding companies, requires originators of securitized loans to retain a percentage of the risk for the transferred loans, establishes regulatory rate-setting for certain debit card interchange fees, repeals restrictions on the payment of interest on commercial demand deposits, contains a number of reforms related to mortgage originations and requires public companies to give stockholders a non-binding vote on executive compensation and golden parachutes. Many of the provisions of the Dodd-Frank Act are subject to delayed effective dates and/or require the issuance of implementing regulations. Their impact on operations can not yet be fully assessed. However, there is significant possibility that the Dodd-Frank Act will, at a minimum, result in increased regulatory burden, compliance costs and interest expense for First Guaranty Bank.
First Guaranty Bancshares, Inc.
General. First Guaranty Bancshares, Inc. is a bank holding company registered with, and subject to regulation by, the FRB under the Bank Holding Company Act of 1956, as amended (the “Bank Holding Company Act”). The Bank Holding Company Act and other federal laws subject bank holding companies to particular restrictions on the types of activities in which they may engage, and to a range of supervisory requirements and activities, including regulatory enforcement actions for violations of laws and regulations.
In accordance with FRB policy, a bank holding company, such as First Guaranty Bancshares, Inc., is expected to act as a source of financial strength to its subsidiary banks and commit resources to support its banks. This support may be required under circumstances when we might not be inclined to do so absent this FRB policy.
Dividends. The Federal Reserve Bank has stated that generally, a bank holding company, should not maintain a rate of distributions to shareholders unless its available net income has been sufficient to fully fund the distributions, and the prospective rate of earnings retention appears consistent with the bank holding company’s capital needs, asset quality and overall financial condition. As a Louisiana corporation, the Company is restricted under the Louisiana corporate law from paying dividends under certain conditions. The Company is currently required to obtain prior written approval from the FRB before declaring or paying any corporate dividend.
The Company is also restricted under the terms of the agreement related to the issuance of the Treasury Capital Purchase Program preferred stock from raising its dividend level or engaging in other capital transactions. See "Troubled Assets Relief Program."
First Guaranty Bank may not pay dividends or distribute capital assets if it is in default on any assessment due to the FDIC. First Guaranty Bank is also subject to regulations that impose minimum regulatory capital and minimum state law earnings requirements that affect the amount of cash available for distribution. In addition, under the Louisiana Banking Law, dividends may not be paid if it would reduce the unimpaired surplus below 50% of outstanding capital stock in any year.
The Bank is restricted under applicable laws in the payment of dividends to an amount equal to current year earnings plus undistributed earnings for the immediately preceding year, unless prior permission is received from the Commissioner of Financial Institutions for the State of Louisiana.
Certain Acquisitions. Federal law requires every bank holding company to obtain the prior approval of the FRB before (i) acquiring more than five percent of the voting stock of any bank or other bank holding company, (ii) acquiring all or substantially all of the assets of any bank or bank holding company or (iii) merging or consolidating with any other bank holding company.
Additionally, federal law provides that the FRB may not approve any of these transactions if it would result in or tend to create a monopoly or substantially lessen competition or otherwise function as a restraint of trade, unless the anti-competitive effects of the proposed transaction are clearly outweighed by the public interest in meeting the convenience and needs of the community to be served. The FRB is also required to consider the financial and managerial resources and future prospects of the bank holding companies and banks concerned and the convenience and needs of the community to be served. Further, the FRB is required to consider the record of a bank holding company and its subsidiary bank(s) in combating money laundering activities in its evaluation of bank holding company merger or acquisition transactions.
Under the Bank Holding Company Act, if adequately capitalized and adequately managed, any bank holding company located in Louisiana may purchase a bank located outside of Louisiana. However, as discussed below, restrictions currently exist on the acquisition of a bank that has only been in existence for a limited amount of time or will result in specified concentrations of deposits.
Change in Bank Control. The Bank Holding Company Act and the Change in Bank Control Act of 1978, as amended, generally require FRB approval prior to any person or company acquiring control of a bank holding company. Control is conclusively presumed to exist if an individual or company acquires 25% or more of any class of voting securities of the bank holding company. Control is rebuttably presumed to exist if a person or company acquires 10% or more, but less than 25%, of any class of voting securities.
- 6 -
Permitted Activities. Generally, bank holding companies are prohibited by federal law from engaging in or acquiring direct or indirect control of more than 5% of the voting shares of any company engaged in any activity other than (i) banking or managing or controlling banks or (ii) an activity that the FRB determines to be so closely related to banking as to be a proper incident to the business of banking.
Activities that the FRB has found to be so closely related to banking as to be a proper incident to the business of banking include, but are not limited to:
- factoring accounts receivable;
- making, acquiring, brokering or servicing loans and usual related activities;
- leasing personal or real property;
- operating a non-bank depository institution, such as a savings association;
- trust company functions;
- financial and investment advisory activities;
- conducting discount securities brokerage activities;
- underwriting and dealing in government obligations and money market instruments;
- providing specified Management consulting and counseling activities;
- performing selected data processing services and support services;
- acting as agent or broker in selling credit life insurance and other types of insurance in connection with credit transactions; and
- performing selected insurance underwriting activities.
Despite prior approval, the FRB has the authority to require a bank holding company to terminate an activity or terminate control of or liquidate or divest certain subsidiaries or affiliates when the FRB believes the activity or the control of the subsidiary or affiliate constitutes a significant risk to the financial safety, soundness or stability of any of its banking subsidiaries. A bank holding company that qualifies and elects to become a financial holding company is permitted to engage in additional activities that are financial in nature or incidental or complementary to financial activity. The Bank Holding Company Act expressly lists the following activities as financial in nature:
- lending, exchanging, transferring, investing for others, or safeguarding money or securities;
- insuring, guaranteeing or indemnifying against loss or harm, or providing and issuing annuities, and acting as principal, agent or broker for these purposes, in any state;
- providing financial, investment or advisory services;
- issuing or selling instruments representing interests in pools of assets permissible for a bank to hold directly;
- underwriting, dealing in or making a market in securities;
- other activities that the FRB may determine to be so closely related to banking or managing or controlling banks as to be a proper incident to managing or controlling banks;
- foreign activities permitted outside of the United States if the FRB has determined them to be usual in connection with banking operations abroad;
- merchant banking through securities or insurance affiliates; and
- insurance company portfolio investments.
To qualify to become a financial holding company, First Guaranty Bancshares, Inc. and its subsidiary bank must be well-capitalized and well managed and must have a Community Reinvestment Act rating of at least satisfactory. Additionally, First Guaranty Bancshares, Inc. would be required to file an election with the FRB to become a financial holding company and to provide the FRB with 30 days’ written notice prior to engaging in a permitted financial activity. A bank holding company that falls out of compliance with these requirements may be required to cease engaging in some of its activities. First Guaranty Bancshares, Inc. currently has no plans to make a financial holding company election.
Anti-tying Restrictions. Bank holding companies and affiliates are prohibited from tying the provision of services, such as extensions of credit, to other services offered by a holding company or its affiliates.
- 7 -
Insurance of Deposit Accounts.
First Guaranty Bank is a member of the Deposit Insurance Fund, which is administered by the FDIC. Deposit accounts in First Guaranty Bank are insured by the FDIC, previously up to a maximum of $100,000 for each separately insured depositor and $250,000 for self-directed retirement accounts. However, in view of the recent economic crisis, the FDIC temporarily increased the deposit insurance available on all deposit accounts to $250,000. The Dodd-Frank Act made that level of coverage permanent. In addition, the Dodd-Frank Act requires that certain non-interest-bearing transaction accounts maintained with depository institutions be fully insured, regardless of the dollar amount, until December 31, 2012.
The FDIC imposes an assessment for deposit insurance against all depository institutions. That assessment is based on the risk category of each institution, which is derived from examination and supervisory information. The FDIC first establishes an institution's initial base assessment rate based upon the risk category, with less risky institution paying lower rates. That initial base assessment rate ranges, from 12 to 45 basis points, depending upon the risk category of the institution. The initial base assessment is then adjusted (higher or lower) to obtain the total base assessment rate. The adjustments to the initial base assessment rate are generally based upon an institution's levels of unsecured debt, secured liabilities and brokered deposits. The total base assessment rate, as adjusted, ranges from 7 to 77.5 basis points of the institution's assessable deposits. The FDIC may adjust the scale uniformly, except when no adjustment may deviate more than three basis points from the base scale without notice and comment.
On May 22, 2009, the FDIC issued a final rule that imposed a special five basis point assessment on each FDIC-insured depository institution's assets minus its Tier 1 capital, on June 30, 2009, which was collected on September 30, 2009. The special assessment was capped at 10 basis points of an institution's domestic deposits.
Subsequently the FDIC adopted a rule pursuant to which all insured depository institutions were required to prepay their estimated assessments for the fourth quarter of 2009, and for all of 2010, 2011 and 2012. That pre-payment, which was due on December 30, 2009, amounted to approximately $4.5 million for the Bank. The amount of prepayment was determined based on certain assumptions, including an annual 5% growth rate in the assessment base through the end of 2012. The pre-payment was been recorded as a prepaid expense asset at December 31. 2009 and will be amortized to expense over three years.
Most recently, the Dodd-Frank Act required the FDIC to revise its risk-based assessment schedule and procedures to base the assessment on each institution’s average total assets less tangible capital, rather than deposits. The FDIC has issued a final rule that will implement that directive effective April 1, 2011.
The Federal Deposit Insurance Corporation has authority to increase insurance assessments. A significant increase in insurance premiums would likely have an adverse effect on the operating expenses and results of operations of First Guaranty Bank. Management cannot predict what insurance assessment rates will be in the future.
- 8 -
Insurance of deposits may be terminated by the Federal Deposit Insurance Corporation upon a finding that an institution has engaged in unsafe or unsound practices, is in an unsafe or unsound condition to continue operations or has violated any applicable law, regulation, rule, order or condition imposed by the Federal Deposit Insurance Corporation. We do not currently know of any practice, condition or violation that may lead to termination of our deposit insurance.
In addition to the Federal Deposit Insurance Corporation assessments, the Financing Corporation (“FICO”) is authorized to impose and collect, with the approval of the Federal Deposit Insurance Corporation, assessments for anticipated payments, issuance costs and custodial fees on bonds issued by the FICO in the 1980s to recapitalize the former Federal Savings and Loan Insurance Corporation. The bonds issued by the FICO are due to mature in 2017 through 2019. For the quarter ended December 31, 2010, the annualized FICO assessment was 1.04 basis points of assessable deposits maintained at an institution.
Other Regulations. Interest and other charges collected or contracted is subject to state usury laws and federal laws concerning interest rates. Loan operations are also subject to federal laws applicable to credit transactions, such as:
- the federal "Truth -In-Lending Act," governing disclosures of credit terms to consumer borrowers;
- the "Home Mortgage Disclosure Act of 1975," requiring financial institutions to provide information to enable the public and public officials to determine whether a financial institution is fulfilling its obigation to help meet the housing needs of the community it serves;
- the "Equal Credit Opportunity Act," prohibiting discrimination on the basis of race, creed or other prohibited factors in extending credit;
- the "Fair Credit Reporting Act of 1978," governing the use and provision of information to credit reporting agencies;
- the "Real Estate Settlement Procedures Act";
- the "Fair Debt Collection Act," governing the manner in which consumer debts may be collected by collection agencies; and
- The rules and regulations of the various federal agencies charged with the responsibility of implementing these federal laws.
The deposit operations are subject to:
- the "Right to Financial Privacy Act," which imposes a duty to maintain confidentiality of consumer financial records and prescribes procedures for complying with administrative subpoenas of financial records;
- the "Electronic Funds Transfer Act," and Regulation E issued by the FRB to implement that act, which govern automatic deposits to and withdrawals from deposit accounts and customers' rights and liabilities arising from the use of automated teller machines and other electronic banking services;
- the "Truth in Savings Act"; and
- the "Expedited Funds Availability Act".
Dividends. The Company is a legal entity separate and distinct from its subsidiary, First Guaranty Bank. The majority of the Company’s revenue is from dividends paid to the Company by the Bank. First Guaranty Bank may not pay dividends or distribute capital assets if it is in default on any assessment due to the FDIC. The FRB has indicated generally that it may be an unsafe or unsound practice for a bank holding company to pay dividends unless the bank holding company’s net income over the preceding year is sufficient to fund the dividends and the expected rate of earnings retention is consistent with the organization’s capital needs, asset quality and overall financial condition.
First Guaranty Bank is also subject to regulations that impose minimum regulatory capital and minimum state law earnings requirements that affect the amount of cash available for distribution. In addition, under the Louisiana Banking Law, dividends may not be paid if it would reduce the unimpaired surplus below 50% of outstanding capital stock in any year. If the Company does not comply with these laws, regulations or policies it may materially affect the ability of the Bank to pay dividends.
Capital Adequacy. The FRB monitors the capital adequacy of bank holding companies, such as First Guaranty Bancshares, Inc., and the OFI and FDIC monitor the capital adequacy of First Guaranty Bank. The federal bank regulators use a combination of risk-based guidelines and leverage ratios to evaluate capital adequacy and consider these capital levels when taking action on various types of applications and when conducting supervisory activities related to safety and soundness. The risk-based guidelines apply on a consolidated basis to bank holding companies with consolidated assets of $500 million or more and, generally, on a bank-only basis for bank holding companies with less than $500 million in consolidated assets. Each insured depository subsidiary of a bank holding company with less than $500 million in consolidated assets is expected to be “well-capitalized.”
- 9 -
The risk-based capital standards are designed to make regulatory capital requirements more sensitive to differences in risk profiles among banks and their holding companies, to account for off-balance sheet exposure, and to minimize disincentives for holding liquid assets. Assets and off-balance sheet items, such as letters of credit and unfunded loan commitments, are assigned to broad risk categories, each with appropriate risk weights. The resulting capital ratios represent capital as a percentage of total risk-weighted assets and off-balance sheet items.
The minimum guideline for the ratio of total capital to risk-weighted assets is 8%. Total capital consists of two components, Tier 1 Capital and Tier 2 Capital. Tier 1 Capital generally consists of common stock, minority interests in the equity accounts of consolidated subsidiaries, noncumulative perpetual preferred stock and a limited amount of qualifying cumulative perpetual preferred stock, less goodwill and other specified intangible assets. Tier 1 Capital must equal at least 4% of risk-weighted assets. Tier 2 Capital generally consists of subordinated debt, preferred stock (other than that which is included in Tier I Capital), and a limited amount of loan loss reserves. The total amount of Tier 2 Capital is limited to 100% of Tier 1 Capital.
In addition, the FRB has established minimum leverage ratio guidelines for bank holding companies with assets of $500 million or more. These guidelines provide for a minimum ratio of Tier 1 Capital to average assets, less goodwill and other specified intangible assets, of 3% for bank holding companies that meet specified criteria, including having the highest regulatory rating and implementing the FRB’s risk-based capital measure for market risk. All other bank holding companies with assets of $500 million or more generally are required to maintain a leverage ratio of at least 4%. The guidelines also provide that bank holding companies of such size experiencing internal growth or making acquisitions will be expected to maintain strong capital positions substantially above the minimum supervisory levels without reliance on intangible assets. The FRB considers the leverage ratio and other indicators of capital strength in evaluating proposals for expansion or new activities. The FRB and the FDIC have adopted amendments to their risk-based capital regulations to provide for the consideration of interest rate risk in the agencies’ determination of a banking institution’s capital adequacy.
The Dodd-Frank Act requires the Federal Reserve Board to issue consolidated regulatory capital requirements for bank holding companies that are at least as stringent as those applicable to insured depository institutions. Such regulations, when issued, will eliminate the use of certain instruments, such as cumulative preferred stock and trust preferred securities, from Tier 1 holding company capital. Instruments issued by May 19, 2010 by bank holding companies with consolidated assets of less than $15 billion (as of December 31, 2009) are grandfathered.
Failure to meet capital guidelines could subject a bank or bank holding company to a variety of enforcement remedies, including issuance of a capital directive, the termination of federal deposit insurance, a prohibition on accepting brokered deposits and other restrictions on its business.
Concentrated Commercial Real Estate Lending Regulations. The FRB and FDIC have recently promulgated guidance governing financial institutions with concentrations in commercial real estate lending. The guidance provides that a company has a concentration in commercial real estate lending if (i) total reported loans for construction, land development, and other land represent 100% or more of total capital or (ii) total reported loans secured by multifamily and non-farm residential properties and loans for construction, land development, and other land represent 300% or more of total capital and the outstanding balance of such loans has increased 50% or more during the prior 36 months. If a concentration is present, Management must employ heightened risk Management practices including board and Management oversight and strategic planning, development of underwriting standards, risk assessment and monitoring through market analysis and stress testing, and increasing capital requirements. The Company is subject to these regulations.
Prompt Corrective Action Regulations. Under the prompt corrective action regulations, bank regulators are required and authorized to take supervisory actions against undercapitalized banks. For this purpose, a bank is placed in one of the following five categories based on its capital:
- well-capitalized (at least 5% leverage capital, 6% Tier 1 risk-based capital and 10% total risk-based capital);
- adequately capitalized (at least 4% leverage capital, 4% Tier 1 risk-based capital and 8% total risk-based capital);
- undercapitalized (less than 8% total risk-based capital, 4% Tier 1 risk-based capital or 3% leverage capital);
- significantly undercapitalized (less than 6% total risk-based capital, 3% Tier 1 risk-based capital or 3% leverage capital); and
- critically undercapitalized (less than 2% tangible capital).
Federal banking regulators are required to take various mandatory supervisory actions and are authorized to take other discretionary actions with respect to institutions in the three undercapitalized categories. The severity of the action depends upon the capital category in which the institution is placed. Generally, subject to a narrow exception, banking regulators must appoint a receiver or conservator for an institution that is “critically undercapitalized.” The federal banking agencies have specified by regulation the relevant capital level for each category. An institution that is categorized as “undercapitalized”, “significantly undercapitalized” or “critically undercapitalized” is required to submit an acceptable capital restoration plan to its appropriate federal banking agency. A bank holding company must guarantee that a subsidiary depository institution meets its capital restoration plan, subject to various limitations. The controlling holding company’s obligation to fund a capital restoration plan is limited to the lesser of 5% of an “undercapitalized” subsidiary’s assets at the time it became “undercapitalized” or the amount required to meet regulatory capital requirements. An “undercapitalized” institution is also generally prohibited from increasing its average total assets, making acquisitions, establishing any branches or engaging in any new line of business, except under an accepted capital restoration plan or with regulatory approval. The regulations also establish procedures for downgrading an institution to a lower capital category based on supervisory factors other than capital.
- 10 -
Restrictions on Transactions with Affiliates and Loans to Insiders. First Guaranty Bank is subject to the provisions of Section 23A of the FRB Act and its implementing regulations. These provisions place limits on the amount of:
- First Guaranty Bank’s loans or extensions of credit to affiliates;
- First Guaranty Bank’s investment in affiliates;
- assets that First Guaranty Bank may purchase from affiliates, except for real and personal property exempted by the FRB;
- the amount of loans or extensions of credit to third parties collateralized by the securities or obligations of affiliates; and
- First Guaranty Bank’s guarantee, acceptance or letter of credit issued on behalf of an affiliate.
The total amount of the above transactions is limited in amount, as to any one affiliate, to 10% of First Guaranty Bank’s capital and surplus and, as to all affiliates combined, to 20% of its capital and surplus. In addition to the limitation on the amount of these transactions, each of the above transactions must also meet specified collateral requirements.
First Guaranty Bank is also subject to the provisions of Section 23B of the FRB Act and its implementing regulations, which, among other things, prohibit First Guaranty Bank from engaging in any transaction with an affiliate, such as First Guaranty Bancshares, Inc., unless the transaction is on terms substantially the same, or at least as favorable to First Guaranty Bank as those prevailing at the time for comparable transactions with nonaffiliated companies.
First Guaranty Bank is also subject to restrictions on extensions of credit to its executive officers, directors, principal shareholders and their related interests. These types of extensions of credit must be made on substantially the same terms, including interest rates and collateral, as those prevailing at the time for comparable transactions with third parties and must not involve more than the normal risk of repayment or present other unfavorable features.
Anti-terrorism Legislation. Financial institutions are required to establish anti-money laundering programs. In 2001, the USA PATRIOT Act was enacted. The USA PATRIOT Act significantly enhanced the powers of the federal government and law enforcement organizations to combat terrorism, organized crime and money laundering. While the USA PATRIOT Act imposed additional anti-money laundering requirements, these additional requirements are not material to our operations.
Aside from the above, the USA PATRIOT Act also requires the federal banking regulators to assess the effectiveness of an institution’s anti-money laundering program in connection with merger and acquisition transactions. Failure to maintain an effective anti-money laundering program is grounds for the denial of merger or acquisition transactions.
Federal Securities Laws
First Guaranty Bancshares, Inc. common stock is registered with the Securities and Exchange Commission under the Securities Exchange Act of 1934. First Guaranty Bancshares, Inc. will continue to be subject to the information, proxy solicitation, insider trading restrictions and other requirements under the Securities Exchange Act of 1934.
Brokered Deposits and Pass-Through Insurance
An FDIC-insured depository institution cannot accept, rollover or renew brokered deposits unless it is well capitalized or adequately capitalized and receives a waiver from the FDIC. A depository institution that cannot receive brokered deposits also cannot offer “pass-through” insurance on certain employee benefit accounts. Whether or not it has obtained such a waiver, an adequately capitalized depository institution may not pay an interest rate on any deposits in excess of 0.75% over certain prevailing market rates specified by regulation. As of December 31, 2010, the Bank had $12.9 million in brokered deposits through the Certificate of Deposit Account Registry Service (CDARS).
Interstate Branching
Effective June 1, 1997, the Riegle-Neal Interstate Banking and Branching Efficiency Act of 1994 permits state and national banks with different home states to operate branches across state lines with approval of the appropriate federal banking agency, unless the home state of a participating bank passed legislation “opting out” of interstate banking. The Dodd-Frank Act amended federal law to allow banks to branch de novo into another state if that state allows banks chartered by it to establish branches within its borders. First Guaranty Bank currently has no branches outside of Louisiana.
- 11 -
Community Reinvestment Act
Under the Community Reinvestment Act, or CRA, a financial institution has a continuing and affirmative obligation, consistent with its safe and sound operation, to help meet the credit needs of its entire community, including low and moderate income neighborhoods. The FDIC assigns banks a CRA rating of “outstanding,” “satisfactory,” “needs to improve” or “substantial noncompliance,” and the bank must publicly disclose its rating. The FDIC rated the Bank as “satisfactory” in meeting community credit needs under the CRA at its most recent CRA performance examination.
Privacy Provisions
Under the Gramm-Leach-Bliley Act, federal banking regulators have adopted new rules requiring disclosure of privacy policies and information sharing practices to consumers. These rules prohibit depository institutions from sharing customer information with nonaffiliated parties without the customer’s consent, except in limited situations, and require disclosure of privacy policies to consumers and, in some circumstances, enable consumers to prevent disclosure of personal information to nonaffiliated third parties. In addition, the Fair and Accurate Credit Transactions Act of 2003 requires banks to notify their customers if they report negative information about them to a credit bureau or if they grant credit to them on terms less favorable than those generally available.
The Company has instituted risk Management systems to comply with all required privacy provisions and believes that the new disclosure requirements and implementation of the privacy laws will not materially increase operating expenses.
Check 21
The Check 21 Act facilitates check truncation and electronic check exchange by authorizing a new negotiable instrument called a “substitute check”. The Act provides that a properly prepared substitute check is the legal equivalent of the original check for all purposes. This law supercedes contradictory state laws (i.e., state laws that allow customers to demand the return of original checks).
Although the Check 21 Act does not require any bank to create substitute checks or to accept checks electronically, it does require banks to accept a legally equivalent substitute check in place of an original check after the Check 21 Act’s effective date of October 28, 2004.
Sarbanes-Oxley Act
The Company is also subject to the Sarbanes-Oxley Act of 2002, which has imposed corporate governance and accounting oversight restrictions and responsibilities on the board of directors, executive officers and independent auditors. The law has increased the time spent discharging responsibilities and costs for audit services. Beginning in 2007, Management was required to report on the effectiveness of internal controls and procedures. The Company is a smaller reporting company and is not required to get an attestation report from our external auditor on the effectiveness of our internal controls over financial reporting until our public float exceeds $75 million.
Effect of Governmental Policies
The difference between the interest rate paid on deposits and other borrowings and the interest rate received on loans and securities comprise most of a bank’s earnings. In order to mitigate the interest rate risk inherent in the industry, the banking business is becoming increasingly dependent on the generation of fee and service charge revenue.
The earnings and growth of a bank will be affected by both general economic conditions and the monetary and fiscal policy of the United States Government and its agencies, particularly the Federal Reserve. The Federal Reserve sets national monetary policy such as seeking to curb inflation and combat recession. This is accomplished by its open-market operations in United States government securities, adjustments to the discount rates on borrowings and target rates for federal funds transactions. The actions of the Federal Reserve in these areas influence the growth of bank loans, investments and deposits and also affect interest rates on loans and deposits. The nature and timing of any future changes in monetary policies and their potential impact on the Company cannot be predicted.
Our noninterest income and expenses can be affected by increasing rates of inflation; however, unlike most industrial companies, the assets and liabilities of financial institutions such as the Banks are primarily monetary in nature. Interest rates, therefore, have a more significant impact on the Bank’s performance than the effect of general levels of inflation on the price of goods and services.
- 12 -
Entry into Material Definitive Agreement
On October 22, 2010, the Company entered into an Agreement and Plan of Merger (the “Merger Agreement”) with Greensburg Bancshares, Inc. (“Greensburg Bancshares”) and its wholly-owned subsidiary, Bank of Greensburg (“Greensburg”).
The Merger Agreement provides for the acquisition of Greensburg Bancshares in a merger (the “Merger”). At the effective time of the Merger, each share of common stock of Greensburg Bancshares (other than shares owned by Greensburg Bancshares and First Guaranty Bancshares), at the election of the holder thereof, will be converted into the right to receive either 13.26 shares of common stock of First Guaranty Bancshares, $247 in cash, or a combination of cash and common stock of First Guaranty Bancshares (the “Merger Consideration”). The final structure of the Merger will depend upon the election by Greensburg Bancshares of the form of the Merger Consideration. The total consideration is valued at approximately $5.3 million.
At December 31, 2010, Greensburg Bancshares had total assets of approximately $89.3 million, including loans of $67.5 million. Total deposits were $79.8 million.
The Merger is subject to the approval by the stockholders of Greensburg Bancshares by such vote as is required under its articles of incorporation and Louisiana Business Corporation Law, and other customary closing conditions. The Merger Agreement contains customary representations, warranties and covenants of First Guaranty Bancshares, First Guaranty Bank, Merger Subsidiary, Greensburg Bancshares and Greensburg.
It is expected that the Merger will be completed during the second quarter of 2011 following receipt of all regulatory and shareholder approvals.
Troubled Assets Relief Program. Under the TARP, the United States Department of the Treasury authorized a voluntary capital purchase program (the “CPP”) to purchase up to $250 billion of senior preferred shares of qualifying financial institutions that elected to participate. Participating companies must adopt certain standards for executive compensation, including (a) prohibiting “golden parachute” payments as defined in the EESA to senior Executive Officers; (b) requiring recovery of any compensation paid to senior Executive Officers based on criteria that is later proven to be materially inaccurate; and (c) prohibiting incentive compensation that encourages unnecessary and excessive risks that threaten the value of the financial institution. The terms of the CPP also limit certain uses of capital by the issuer, including repurchases of company stock and increases in dividends.
On August 28, 2009, the Company entered into a Letter Agreement, which includes a Securities Purchase Agreement and a Side Letter Agreement (together, the “Purchase Agreement”), with the United States Department of the Treasury (“Treasury Department”) pursuant to which the Company has issued and sold to the Treasury Department 2,069.9 shares of the Company’s Fixed Rate Cumulative Perpetual Preferred Stock, Series A, par value $1,000 per share for a total purchase price of $20.7 million. In addition to the issuance of the Series A Stock, as a part of the transaction, the Company issued to the Treasury Department a warrant to purchase 114.44444 shares of the Company’s Fixed Rate Cumulative Preferred Stock, Series B, and immediately following the issuance of the Series A stock, the Treasury Department exercised its rights and acquired 103 of the Series B shares through a cashless exercise. The newly issued Series A Stock, generally non-voting stock, pays cumulative dividends of 5% for five years, and a rate of 9% dividends, per annum, thereafter. The newly issued Series B Stock, generally non-voting, pays cumulative dividends at a rate of 9% per annum. Both the Series A Stock and the Series B Stock were issued in a private placement.
- 13 -
FDIC Temporary Liquidity Guarantee Program. First Guaranty Bancshares, Inc. and First Guaranty Bank have chosen to participate in the FDIC’s Temporary Liquidity Guarantee Program (the “TLGP”), which applies to, among other, all U.S. depository institutions insured by the FDIC and all United States bank holding companies, unless they have opted out. Under the TLPG, the FDIC guarantees certain senior unsecured debt of the holding company and bank, as well as non-interest bearing transaction account deposits at First Guaranty Bank. Under the debt guarantee component of the TLGP, the FDIC will pay the unpaid principal and interest on an FDIC-guaranteed debt instrument upon the uncured failure of the participating entity to make a timely payment of principal or interest. Neither First Guaranty Bancshares, Inc. nor First Guaranty Bank issued debt under the TLGP.
Under the transaction account guarantee component of the TLGP, all non-interest bearing transaction accounts maintained at First Guaranty Bank are insured in full by the FDIC until June 30, 2010, later extended to December 31, 2010, regardless of the standard maximum deposit insurance amounts. An annualized 10 basis point assessment on balances in noninterest-bearing transaction accounts that exceed the existing deposit insurance limit of $250,000 was assessed on a quarterly basis to insured depository institutions participating in this component of the TLGP. The Company chose to participate in this component of the TLGP. The Dodd-Frank Act extended unlimited coverage for certain non-interest bearing transaction accounts through December 31, 2012. The cost associated with that coverage will be part of the usual FDIC assessment.
American Recovery and Reinvestment Act of 2009. On February 17, 2009, the American Recovery and Reinvestment Act of 2009 (the “ARRA”) was enacted. The ARRA is intended to provide a stimulus to the U.S. economy in the wake of the economic downturn brought about by the subprime mortgage crisis and the resulting credit crunch. The bill includes federal tax cuts, expansion of unemployment benefits and other social welfare provisions, and domestic spending in education, healthcare, and infrastructure, including the energy structure. The new law also includes numerous non-economic recovery related items, including a limitation on executive compensation in federally aided banks.
Under the ARRA, an institution will be subject to the following restrictions and standards through out the period in which any obligation arising from financial assistance provided under the TARP remains outstanding:
- Limits on compensation incentives for risk taking for senior executive officers.
- Requirement of recovery of any compensation paid based on inaccurate financial information.
- Prohibition on "Golden Parachute Payments".
- Prohibition on compensation plans that would encourage manipulation of reported earnings to enhance the compensation of employees.
- Publicly registered TARP recipients must establish a board compensation committee comprised entirely of independent directors, for the purpose of reviewing employee compensation plans.
- Prohibition on bonus, retention award, or incentive compensation, except for payments of long term restricted stock.
- Limitation on luxury expenditures.
- TARP recipients are required to permit a separate shareholder vote to approve the compensation of executives, as disclosed pursuant to the SEC's compensation disclosure rules.
The foregoing is a summary of requirements to be included in standards to be established by the Secretary of the Treasury.
The chief executive officer and chief financial officer of each TARP recipient will be required to provide a written certification of compliance with these standards to the SEC. The foregoing is a summary of requirements to be included in standards to be established by the Secretary of the Treasury.
- 14 -
Item 1A. – Risk Factors
(references to “our,” “we” or similar terms under this subheading refer to First Guaranty Bancshares, Inc.)
Various factors, such as general economic conditions in the U.S. and Louisiana, regulatory and legislative initiatives and increasing competition could impact our business. The risks and uncertainties described below are not the only risks that may have a material adverse effect on us. Additional risks and uncertainties also could adversely affect our business and results of operations. If any of the following risks actually occur, our business, financial condition or results of operations could be negatively affected, the market price for your securities could decline, and you could lose all or part of your investment. Further, to the extent that any of the information contained in this Annual Report on Form 10-K constitutes forward-looking statements, the risk factors set forth below also are cautionary statements identifying important factors that could cause our actual results to differ materially from those expressed in any forward-looking statements made by or on behalf of us.
Risks Associated with our Business
We may be vulnerable to certain sectors of the economy.
A portion of our loan portfolio is secured by real estate. If the economy deteriorated and depressed real estate values beyond a certain point, that collateral value of the portfolio and the revenue stream from those loans could come under stress and possibly require additional provision to the allowance for loan losses. Our ability to dispose of foreclosed real estate at prices above the respective carrying values could also be impinged, causing additional losses.
Difficult market conditions have adversely affected the industry in which we operate.
The capital and credit markets have been experiencing volatility and disruption for more than twenty-four months. The volatility and disruption has reached unprecedented levels. Dramatic declines in the housing market over the past two years, with falling home prices and increasing foreclosures, unemployment and under-employment, have negatively impacted the credit performance of mortgage loans and resulted in significant write-downs of asset values by financial institutions, including government-sponsored entities as well as major commercial and investment banks. These write-downs have caused many financial institutions to seek additional capital, to merge with larger and stronger institutions and, in some cases, to fail. Reflecting concern about the stability of the financial markets generally and the strength of counterparties, many lenders and institutional investors have reduced or ceased providing funding to borrowers, including to other financial institutions. This market turmoil and tightening of credit have led to an increased level of commercial and consumer delinquencies, lack of consumer confidence, increased market volatility and widespread reduction of business activity generally. We do not expect that the difficult conditions in the financial markets are likely to improve in the near future. A worsening of these conditions would likely exacerbate the adverse effects of these difficult market conditions on us and others in the financial institution industry. In particular, we may face the following risks in connection with these events:
-
We expect to face increased regulation of our industry, including as a result of the Emergency Economic Stabilization Act of 2008 (EESA).
-
Compliance with such regulation may increase our costs and limit our ability to pursue business oppotunities.
-
Market developments and the resulting economic pressure on consumers may affect consumer confidence levels and may cause increases in delinquencies and default rates, which, among other effects, could affect our charge-offs and provision for laon losses. Competition in the industry could intensify as a result of the increasing consolidation of financial services companies in connection with the current market conditions.
-
The current market disruptions make valuation even more difficult and subjective, and our ability to measure the fair value of our assets could be adversely affected. If we determine that a significant portion of our assets have values significantly below their recorded carrying value, we could recognize a material charge to earnings in the quarter in which such determination was made, our capital ratios would be adversely affected and a rating agency might downgrade our credit rating or put us on credit watch.
- 15 -
Certain changes in interest rates, inflation, deflation, or the financial markets could affect demand for our products and our ability to deliver products efficiently.
Loan originations, and potentially loan revenues, could be adversely impacted by sharply rising interest rates. Conversely, sharply falling rates could increase prepayments within our securities portfolio lowering interest earnings from those investments. An underperforming stock market could reduce brokerage transactions, therefore reducing investment brokerage revenues; in addition, wealth management fees associated with managed securities portfolios could also be adversely affected. An unanticipated increase in inflation could cause our operating costs related to salaries and benefits, technology, and supplies to increase at a faster pace than revenues.
The fair market value of our securities portfolio and the investment income from these securities also fluctuate depending on general economic and market conditions. In addition, actual net investment income and/or cash flows from investments that carry prepayment risk, such as mortgage-backed and other asset-backed securities, may differ from those anticipated at the time of investment as a result of interest rate fluctuations.
Changes in the policies of monetary authorities and other government action could adversely affect our profitability.
The results of operations are affected by credit policies of monetary authorities, particularly the Federal Reserve Board. The instruments of monetary policy employed by the Federal Reserve Board include open market operations in U.S. government securities, changes in the discount rate or the federal funds rate on bank borrowings and changes in reserve requirements against bank deposits. In view of changing conditions in the national economy and in the money markets, particularly in light of the continuing threat of terrorist attacks and the current military operations in the Middle East, we cannot predict possible future changes in interest rates, deposit levels, loan demand or our business and earnings. Furthermore, the actions of the United States government and other governments in responding to such terrorist attacks or the military operations in the Middle East may result in currency fluctuations, exchange controls, market disruption and other adverse effects.
We engage in acquisitions of other businesses from time to time.
On occasion, we will engage in acquisitions of other businesses. Inability to successfully integrate acquired businesses can pose varied risks to us, including customer and employee turnover, thus increasing the cost of operating the new businesses. The acquired companies may also have legal contingencies, beyond those that we are aware of, that could result in unexpected costs. Moreover, there can be no assurance that acquired businesses will achieve prior or planned results of operations.
We may not be able to successfully maintain and manage our growth.
Since December 31, 2006, assets have grown 58.4%, loan balances have grown 11.9% and deposits have grown 60.8%. Continued growth depends, in part, upon the ability to expand market presence, to successfully attract core deposits, and to identify attractive commercial lending opportunities.
Management cannot be certain as to its ability to manage increased levels of assets and liabilities. We may be required to make additional investments in equipment and personnel to manage higher asset levels and loans balances, which may adversely impact our efficiency ratio, earnings and shareholder returns.
In addition, franchise growth may increase through acquisitions and de novo branching. The ability to successfully integrate such acquisitions into our consolidated operations will have a direct impact on our financial condition and results of operations.
Our loan portfolio consists of a high percentage of loans secured by non-farm non-residential real estate. These loans are riskier than loans secured by one- to four-family properties.
At December 31, 2010, $292.8 million, or 50.9% of the loan portfolio consisted of non-farm non-residential real estate loans (primarily loans secured by commercial real estate such as office buildings, hotels and gaming facilities). These loans generally expose a lender to greater risk of nonpayment and loss than one- to four-family residential mortgage loans because repayment of the loans often depends on the successful operation and income stream of the borrowers. Such loans typically involve larger loan balances to single borrowers or groups of related borrowers compared to one- to four-family residential loans. Consequently, an adverse development with respect to one loan or one credit relationship can expose us to a significantly greater risk of loss compared to an adverse development with respect to a one- to four-family residential mortgage loan.
- 16 -
Emphasis on the origination of short-term loans could expose us to increased lending risks.
At December 31, 2010, $495.1 million, or 86.0% of our loan portfolio consisted of loans that mature within five years. These loans typically provide for payments based on a ten to twenty-year amortization schedule. This results in our borrowers having significantly higher final payments due at maturity, known as a “balloon payment”. In the event our borrowers are unable to make their balloon payments when they are due, we may incur significant losses in our loan portfolio. Moreover, while the shorter maturities of our loan portfolio help us to manage our interest rate risk, they also increase the reinvestment risk associated with new loan originations. To mitigate this risk, we generally will originate loans to existing customers. There can be no assurance that during an economic slow-down we might not incur significant losses as our loan portfolio matures.
Hurricane Activity in Louisiana can have an adverse impact on our market area.
Our market area in Southeast Louisiana is close to New Orleans and the Gulf of Mexico, an area which is susceptible to hurricanes and tropical storms.
Hurricane Katrina hit the greater New Orleans area in August 2005. The hurricane caused widespread property damage, required the relocation of an unprecedented number of residents and business operations, and severely disrupted normal economic activity in the impacted areas. The hurricane affected our loan originations and impacted our deposit base. While Hurricane Katrina did not affect our operations as adversely as other areas of Southeast Louisiana, future hurricane activity may have a severe and adverse affect on our operations. More generally, our ability to compete effectively with financial institutions whose operations are not concentrated in areas affected by hurricanes or whose resources are greater than ours, will depend primarily on our ability to continue normal business operations following a hurricane. The severity and duration of the effects of hurricanes will depend on a variety of factors that are beyond our control, including the amount and timing of government, private and philanthropic investments including deposits in the region, the pace of rebuilding and economic recovery in the region and the extent to which a hurricane’s property damage is covered by insurance.
None of the effects described above can be accurately predicted or quantified at this time. As a result, significant uncertainty remains regarding the impact a hurricane may have on our business, financial condition and results of operations.
The oil leak in the Gulf of Mexico and legislative and regulatory responses thereto could have a negative impact on the Company’s customers and, indirectly, result in a negative impact on our earnings.
In late April 2010, the explosion and collapse of a drilling rig in the Gulf of Mexico off the Louisiana coast caused a major oil spill that has now been contained. In response to the oil spill, the U.S. Government imposed a moratorium on deepwater drilling operations and issued new regulations intended to improve the safety of these operations. A moratorium on new wells was ultimately rescinded in October 2010, and the industry is in the process of working to comply with these new requirements. The U.S. Congress currently is considering legislation that could impact offshore drillers’ operations. The Company has identified and communicated with customers that may be affected by the oil spill and its effects. The Company currently believes that its exposure to this event remains extremely limited. As of December 31, 2010, no credit relationship had been adversely classified as a result of the oil spill. However, new legislation or regulations that affect offshore exploration and production activities or substantially increase the cost of these activities could negatively impact customers in this industry and the general economy in our market area.
If the allowance for loan losses is not sufficient to cover actual loan losses, earnings could decrease.
Loan customers may not repay their loans according to the terms of their loans, and the collateral securing the payment of their loans may be insufficient to assure repayment. We may experience significant credit losses, which could have a material adverse effect on our operating results. Various assumptions and judgments about the collectability of the loan portfolio are made, including the creditworthiness of borrowers and the value of the real estate and other assets serving as collateral for the repayment of many loans. In determining the amount of the allowance for loan losses, Management reviews the loans and the loss and delinquency experience and evaluates economic conditions. If assumptions prove to be incorrect, the allowance for loan losses may not cover inherent losses in the loan portfolio at the date of the financial statements. Material additions to the allowance would materially decrease net income. At December 31, 2010, our allowance for loan losses totaled $8.3 million, representing 1.44% of loans, net of unearned income.
Management believes it has underwriting standards to manage normal lending risks, and at December 31, 2010, nonperforming loans consisted of $30.4 million, or 5.28% of loans, net of unearned income. We can give no assurance that the nonperforming loans will not increase or that nonperforming or delinquent loans will not adversely affect future performance.
In addition, federal and state regulators periodically review the allowance for loan losses and may require an increase in the allowance for loan losses or recognize further loan charge-offs. Any increase in our allowance for loan losses or loan charge-offs as required by these regulatory agencies could have a material adverse effect on the results of operations and financial condition.
- 17 -
Adverse events in Louisiana, where our business is concentrated, could adversely affect our results and future growth.
Our business, the location of our branches and the real estate used as collateral on our real estate loans are primarily concentrated in Louisiana. As a result, we are exposed to geographic risks. The occurrence of an economic downturn in Louisiana, or adverse changes in laws or regulations in Louisiana could impact the credit quality of our assets, the business of our customers and our ability to expand our business.
Our success significantly depends upon the growth in population, income levels, deposits and housing in our market area. If the communities in which we operate do not grow or if prevailing economic conditions locally or nationally are unfavorable, our business may be negatively affected. In addition, the economies of the communities in which we operate are substantially dependent on the growth of the economy in the state of Louisiana. To the extent that economic conditions in Louisiana are unfavorable or do not continue to grow as projected, the economy in our market area would be adversely affected. Moreover, we cannot give any assurance that we will benefit from any market growth or favorable economic conditions in our market area if they do occur.
In addition, the market value of the real estate securing loans as collateral could be adversely affected by unfavorable changes in market and economic conditions. As of December 31, 2010, approximately 79.8% of our total loans were secured by real estate. Adverse developments affecting commerce or real estate values in the local economies in our primary market areas could increase the credit risk associated with our loan portfolio. In addition, substantially all of our loans are to individuals and businesses in Louisiana. Our business customers may not have customer bases that are as diverse as businesses serving regional or national markets. Consequently, any decline in the economy of our market area could have an adverse impact on our revenues and financial condition. In particular, we may experience increased loan delinquencies, which could result in a higher provision for loan losses and increased charge-offs. Any sustained period of increased non-payment, delinquencies, foreclosures or losses caused by adverse market or economic conditions in our market area could adversely affect the value of our assets, revenues, results of operations and financial condition.
Our continued pace of growth may require us to raise additional capital in the future, but that capital may not be available when it is needed and could result in dilution of shareholders’ ownership.
We are required by federal and state regulatory authorities to maintain adequate levels of capital to support our operations. We anticipate that our existing capital resources will satisfy our capital requirements for the foreseeable future. We may, at some point, need to raise additional capital to support continued growth, both internally and for potential acquisitions. Such issuance of our securities will dilute the ownership interest of our shareholders.
Our ability to raise additional capital, if needed, will depend on conditions in the capital markets at that time, which are outside of our control. Accordingly, we cannot assure you of our ability to raise additional capital if needed or that the terms acceptable to us will be available. If we cannot raise additional capital when needed, our ability to further expand our operations through internal growth and potential acquisitions could be materially impaired.
We rely on our Management team for the successful implementation of our business strategy.
Our success of First Guaranty Bancshares, Inc. and First Guaranty Bank has been largely due to the efforts of our Executive Management team consisting of Alton B. Lewis, Chief Executive Officer, Michael R. Sharp, President, Larry A. Stark, Executive Vice President and Eric J. Dosch, Chief Financial Officer. In addition, we substantially rely upon Marshall T. Reynolds, our Chairman of the Board of Directors. The loss of services of one or more of these individuals may have a material adverse effect on our ability to implement our business plan.
There is no assurance that we will be able to successfully compete with others for business.
The area in which we operate is considered attractive from an economic and demographic viewpoint, and is a highly competitive banking market. We compete for loans and deposits with numerous regional and national banks and other community banking institutions, as well as other kinds of financial institutions and enterprises, such as securities firms, insurance companies, savings associations, credit unions, mortgage brokers and private lenders. Many competitors have substantially greater resources than we do and operate under less stringent regulatory environments. The differences in resources and regulations may make it harder for us to compete profitably, reduce the rates that we can earn on loans and investments, increase the rates we must offer on deposits and other funds, and adversely affect our overall financial condition and earnings.
- 18 -
We depend primarily on net interest income for our earnings rather than noninterest income.
Net interest income is the most significant component of our operating income. We do not rely on nontraditional sources of fee income utilized by some community banks, such as fees from sales of insurance, securities or investment advisory products or services. For the years ended December 31, 2010, 2009, and 2008 our net interest income was $38.2 million, $32.3 million, and $31.8 million respectively. The amount of our net interest income is influenced by the overall interest rate environment, competition, and the amount of interest-earning assets relative to the amount of interest-bearing liabilities. In the event that one or more of these factors were to result in a decrease in our net interest income, we do not have significant sources of fee income to make up for decreases in net interest income.
Fluctuations in interest rates could reduce our profitability.
We realize income primarily from the difference between the interest we earn on loans and investments and the interest we pay on deposits and borrowings. Unexpected movement in interest rates markedly changing the slope of the current yield curve could cause our net interest margins to decrease, subsequently decreasing net interest income. In addition, such changes could adversely affect the valuation of our assets and liabilities. The interest rates on our assets and liabilities respond differently to changes in market interest rates, which means our interest-bearing liabilities may be more sensitive to changes in market interest rates than our interest-earning assets, or vice versa. In either event, if market interest rates change, this “gap” between the amount of interest-earning assets and interest-bearing liabilities that reprice in response to these interest rate changes may work against us, and our earnings may be negatively affected.
We are unable to predict fluctuations in market interest rates, which are affected by, among other factors, changes in the following:
-
inflation rates;
-
business activity levels;
-
money supply; and
-
domestic and foreign financial markets.
The value of our investment portfolio and the composition of our deposit base are influenced by prevailing market conditions and interest rates. Our asset-liability Management strategy, which is designed to mitigate the risk to us from changes in market interest rates, may not prevent changes in interest rates or securities market downturns from reducing deposit outflow or from having a material adverse effect on our results of operations, our financial condition or the value of our investments.
We expect to incur additional expenses in connection with our compliance with Sarbanes-Oxley.
Under Section 404 of the Sarbanes-Oxley Act of 2002, we were required to conduct a comprehensive review and assessment of the adequacy of our existing financial systems and controls beginning with the year ended December 31, 2007. Future reviews of our financial systems and controls may uncover deficiencies in existing systems and controls. If that is the case, we would have to take the necessary steps to correct any deficiencies, which may be costly and may strain our Management resources and negatively impact earnings. We also would be required to disclose any such deficiencies, which could adversely affect the market price of our common stock.
- 19 -
Future legislative or regulatory actions responding to perceived financial and market problems could impair the Company’s rights against borrowers.
There have been proposals made by members of Congress and others that would reduce the amount distressed borrowers are otherwise contractually obligated to pay under their mortgage loans and limit an institution’s ability to foreclose on mortgage collateral. Were proposals such as these, or other proposals limiting the Company’s rights as a creditor, to be implemented, the Company could experience increased credit losses or increased expense in pursuing its remedies as a creditor.
Continued or further declines in the value of certain investment securities could require write-downs, which would reduce the Company’s earnings.
At December 31, 2010, gross unrealized losses in the Company’s investment portfolio equaled approximately $10.0 million relating to securities with an aggregate fair value of $310.1 million. The gross unrealized losses were partially offset by gross unrealized gains of $5.1 million on other securities. There can be no assurance that future factors or combinations of factors will not cause the Company to conclude in one or more future reporting periods that an unrealized loss that exists with respect to any of its securities constitutes an impairment that is other than temporary.
We operate in a highly regulated environment and may be adversely affected by changes in federal, state and local laws and regulations.
We are subject to extensive regulation, supervision and examination by federal and state banking authorities. Any change in applicable regulations or federal, state or local legislation could have a substantial impact on us and our operations. Additional legislation and regulations that could significantly affect our powers, authority and operations may be enacted or adopted in the future, which could have a material adverse effect on our financial condition and results of operations. Further, regulators have significant discretion and authority to prevent or remedy unsafe or unsound practices or violations of laws by banks and bank holding companies in the performance of their supervisory and enforcement duties. The exercise of regulatory authority may have a negative impact on our results of operations and financial condition.
Like other bank holding companies and financial institutions, we must comply with significant anti-money laundering and anti-terrorism laws. Under these laws, we are required, among other things, to enforce a customer identification program and file currency transaction and suspicious activity reports with the federal government. Government agencies have substantial discretion to impose significant monetary penalties on institutions which fail to comply with these laws or make required reports.
We hold certain intangible assets that could be classified as impaired in the future. If these assets are considered to be either partially or fully impaired in the future, our earnings and the book values of these assets would decrease.
The Company is required to test goodwill and core deposit intangible assets for impairment on a periodic basis. The impairment testing process considers a variety of factors, including the current market price of our common shares, the estimated net present value of our assets and liabilities and information concerning the terminal valuation of similarly situated insured depository institutions. The Company conducted its goodwill impairment testing as of October 1, 2010. The results of the testing indicated that no goodwill impairment existing. If an impairment determination is made in a future reporting period, our earnings and the book value of these intangible assets will be reduced by the amount of the impairment. If an impairment loss is recorded, it will have little or no impact on the tangible book value of our common shares or our regulatory capital levels.
If we were unable to borrow funds through access to capital markets, we may not be able to meet the cash flow requirements of our depositors and borrowers or the operating cash needs to fund corporate expansion and other corporate activities.
Liquidity is the ability to meet cash flow needs on a timely basis at a reasonable cost. The liquidity of our Company is used to make loans and leases to repay deposit liabilities as they become due or are demanded by customers. Liquidity policies and limits are established by the board of directors. Management and the Investment Committee regularly monitor the overall liquidity position of the Company to ensure that various alternative strategies exist to cover unanticipated events that could affect liquidity. Management and the Investment Committee also establish policies and monitor guidelines to diversify the bank's funding sources. Funding sources include Federal funds purchased, securities sold under repurchase agreements, non-core deposits, and short- and long-term debt. We are also members of the Federal Home Loan Bank (“FHLB”) System, which provides funding through advances to members that are collateralized with certain loans.
- 20 -
We maintain a portfolio of securities that can be used as a secondary source of liquidity. There are other sources of liquidity available to us should they be needed. These sources include sales of loans, additional collateralized borrowings such as FHLB advances, unsecured borrowing lines with other financial institutions, the issuance and sale of debt securities, and the issuance and sale of preferred or common securities. We can also borrow from the Federal Reserve’s discount window.
Amounts available under our existing credit facilities as of December 31, 2010, consist of $52.2 million available at the Federal Home Loan Bank and $48.4 million in the form of federal funds and/or other lines of credit.
If we were unable to access any of these funding sources when needed, we might be unable to meet customers’ needs, which could adversely impact our financial condition, results of operations, cash flows, and level of regulatory-qualifying capital.
Risk Associated with an Investment in our Common Stock
The market price of our common stock is established between a buyer and seller.
First Guaranty Bank acts as the transfer agent for First Guaranty Bancshares, Inc. All shares traded are agreed upon by mutual buyers and sellers. First Guaranty Bancshares, Inc. is not traded on an exchange, therefore liquidation and/or purchases of stock may not be readily available.
Our Management controls a substantial percentage of our common stock and therefore has the ability to exercise substantial control over our affairs.
As of March 14, 2011, our directors and executive officers (and their affiliates) beneficially owned 2,948,152 shares or approximately 53.0% of our common stock. Because of the large percentage of common stock held by our directors and executive officers, such persons could significantly influence the outcome of any matter submitted to a vote of our shareholders even if other shareholders were in favor of a different result.
Our participation in the U.S. Treasury’s Capital Purchase Program imposes restrictions on us that limit our ability to perform certain equity transactions, including the payment of dividends and common stock purchases.
On August 28, 2009, we issued and sold $20.7 million in Fixed Rate Cumulative Perpetual Preferred Stock, Series A and a warrant to purchase shares of the Company’s Fixed Rate Cumulative Preferred Stock, Series B to the Treasury Department as part of the Capital Purchase Program. The Series A preferred shares will pay a cumulative dividend rate of five percent (5.0%) per annum for the first five years and will reset to a rate of nine percent (9.0%) per annum after year five. Immediately following the issuance of the Series A Preferred Stock and the Warrant, the Treasury Department exercised its rights under the Warrant to acquire shares of the Series B Preferred Stock through a cashless exercise. The Series B Preferred Stock pays cumulative dividends at a rate of nine percent (9.0%) per annum. The Series B Preferred Stock generally has the same rights and privileges as the Series A Preferred Stock. The dividends and potential increase in dividends if we do not redeem the preferred stock may significantly impact our operating results, liquidity, and capital position.
Pursuant to the Purchase Agreement, prior to August 28, 2012, unless the Company has redeemed the Series A Preferred Stock and the Series B Preferred Stock or the Treasury Department has transferred the Series A Preferred Stock and the Series B Preferred Stock to a third party, the ability of the Company to declare or pay any dividend or make any distribution on its capital stock or other equity securities of any kind of the Company will be subject to restriction, including a restriction against (1) increasing the quarterly cash dividend per share to an amount larger than the last quarterly cash dividend paid on the common stock prior to November 17, 2008, $0.16 per share, or (2) redeeming, purchasing or acquiring any shares of its common stock or other equity or capital securities, other than in connection with benefit plans consistent with past practice and certain circumstances specified in the Purchase Agreement. In addition, prior to August 28, 2012, the Company may not redeem any of the Series A Preferred Stock or Series B Preferred Stock except with the proceeds of a qualified equity offering.
Following August 28, 2012 and until August 28, 2019 (unless the Series A Preferred Stock and Series B Preferred Stock has been redeemed or transferred to a third party), the Company may not, without the consent of the Treasury Department, pay any dividends on its capital stock that are in the aggregate greater than 103% of any dividends in the prior fiscal quarter. In addition, prior to August 28, 2019 (unless the Series A Preferred Stock and Series B Preferred Stock has been redeemed or transferred to a third party) the Company may not repurchase or acquire any equity security of the Company without the consent of the Treasury Department other than in certain circumstances specified in the Purchase Agreement. Following August 28, 2019, the Company may not pay any dividend or repurchase any equity securities without the consent of the Treasury Department unless the Series A Preferred Stock and the Series B Preferred Stock have been redeemed or the United States Treasury has transferred the securities. In addition, no shares of the Series B Preferred Stock may be redeemed unless all the shares of Series A Preferred Stock have been redeemed.
In addition, under the Articles of Amendment for the Series A Preferred Stock and the Series B Preferred Stock, the Company’s ability to declare or pay dividends or repurchase its common stock or other equity or capital securities will be subject to restrictions in the event that it fails to declare and pay or set aside for payment full dividends on the Series A Preferred Stock and the Series B Preferred Stock, respectively.
None.
- 21 -
The Company does not directly own any real estate, but it does own real estate indirectly through its subsidiary. The Bank operates 17 retail-banking centers and one drive-up facility. The following table sets forth certain information relating to each office. The net book value of our properties at December 31, 2010 was $9.0 million.
|
Location
|
Use of Facilities
|
Year Facility Opened or Acquired
|
Owned/
Leased
|
|||
|
First Guaranty Square
400 East Thomas Street
Hammond, LA 70401
|
Bank’s Main Office
|
1975
|
Owned
|
|||
|
2111 West Thomas Street
Hammond, LA 70401
|
Guaranty West Banking Center
|
1974
|
Owned
|
|||
|
100 East Oak Street
Amite, LA 70422
|
Amite Banking Center
|
1970
|
Owned
|
|||
|
455 Railroad Avenue
Independence, LA 70443
|
Independence Banking Center
|
1979
|
Owned
|
|||
|
301 Avenue F
Kentwood, LA 70444
|
Kentwood Banking Center
|
1975
|
Owned
|
|||
|
170 West Hickory
Ponchatoula, LA 70454
|
Ponchatoula Banking Center
|
1960
|
Owned
|
|||
|
189 Burt Blvd
Benton, LA 71006
|
Benton Banking Center
|
2010
|
Owned
|
|||
|
126 South Hwy. 1
Oil City, LA 71061
|
Oil City Banking Center
|
1999
|
Owned
|
|||
|
401 North 2nd Street
Homer, LA 71040
|
Homer Main Banking Center
|
1999
|
Owned
|
|||
|
10065 Hwy 79
Haynesville, LA 71038
|
Haynesville Banking Center
|
1999
|
Owned
|
|||
|
117 East Hico Street
Dubach, LA 71235
|
Dubach Banking Center
|
1999
|
Owned
|
|||
|
102 East Louisiana Avenue
Vivian, LA 71082
|
Vivian Banking Center
|
1999
|
Owned
|
|||
|
500 North Cary
Jennings, LA 70546
|
Jennings Banking Center
|
1999
|
Owned
|
|||
|
799 West Summers Drive
Abbeville, LA 70510
|
Abbeville Banking Center
|
1999
|
Owned
|
|||
|
105 Berryland
Ponchatoula, LA 70454
|
Berryland Banking Center
|
2004
|
Leased
|
|||
|
2231 S. Range Avenue
Denham Springs, LA 70726
|
Denham Springs Banking Center
|
2005
|
Owned
|
|||
|
North 6th Street
Ponchatoula, LA 70454
|
Ponchatoula Banking Center 1
|
2007
|
Owned
|
|||
|
29815 Walker Rd S
Walker, LA 70785
|
Walker Banking Center
|
2007
|
Owned
|
1 This banking facility was closed on March 14, 2008 and consolidated with the Ponchatoula Banking Center.
The Bank also owns four additional properties which are currently not being used as banking facilities. One of the properties is a banking center location previously owned and operated by Homestead Bank in Amite, Louisiana but was closed at the time of the merger. This facility is currently being used for storage. The Bank also acquired, in the Homestead Bank merger, a banking facility located in Ponchatoula, Louisiana. This facility was closed in March 2008 and currently is leased. Management’s intentions are to sell these two properties.
- 22 -
The Company is subject to various legal proceedings in the normal course of its business. It is Management’s belief that the ultimate resolution of such claims will not have a material adverse effect on the financial position or results of operations. At December 31, 2010, we were not involved in any material legal proceedings.
PART II
Item 5 - Market for Registrant’s Common Equity, Related Stockholder Matters and Issuer Purchases of Equity Securities
There is no liquid or active market for our common stock. The Company’s shares of common stock are not traded on a stock exchange or in any established over-the-counter market. Trades occur primarily between individuals at a price mutually agreed upon by the buyer and seller. Trading in the Company’s common stock has been infrequent and such trades cannot be characterized as constituting an active trading market.
The following table sets forth the high and low bid quotations for First Guaranty Bancshares, Inc.’s common stock for the periods indicated. These quotations represent trades of which we are aware and do not include retail markups, markdowns, or commissions and do not necessarily reflect actual transactions. As of December 31, 2010, there were 5,559,644 shares of First Guaranty Bancshares, Inc. common stock issued and outstanding with a total of 1,361 shareholders of record.
|
2010
|
2009
|
|||||||||||||||||||||||
|
Quarter Ended:
|
High
|
Low
|
Dividend
|
High
|
Low
|
Dividend
|
||||||||||||||||||
|
March
|
$
|
17.00
|
$
|
17.00
|
$
|
0.16
|
$
|
25.00
|
$
|
17.00
|
$
|
0.16
|
||||||||||||
|
June
|
18.62
|
17.00
|
0.16
|
17.00
|
17.00
|
0.16
|
||||||||||||||||||
|
September
|
18.62
|
17.50
|
0.16
|
17.00
|
15.00
|
0.16
|
||||||||||||||||||
|
December
|
18.62
|
18.62
|
0.16
|
17.00
|
12.00
|
0.16
|
||||||||||||||||||
Our stockholders are entitled to receive dividends when, and if declared by the Board of Directors, out of funds legally available for dividends. We have paid consecutive quarterly cash dividends on our common stock for each of the last ten years and the Board of Directors intends to continue to pay regular quarterly cash dividends. The ability to pay dividends in the future will depend on earnings and financial condition, liquidity and capital requirements, regulatory restrictions, the general economic and regulatory climate and ability to service any equity or debt obligations senior to common stock.
There are legal restrictions on the ability of First Guaranty Bank to pay cash dividends to First Guaranty Bancshares, Inc. Under federal and state law, we are required to maintain certain surplus and capital levels and may not distribute dividends in cash or in kind, if after such distribution we would fall below such levels. Specifically, an insured depository institution is prohibited from making any capital distribution to its shareholders, including by way of dividend, if after making such distribution, the depository institution fails to meet the required minimum level for any relevant capital measure including the risk-based capital adequacy and leverage standards.
Additionally, under the Louisiana Business Corporation Act, First Guaranty Bancshares, Inc. is prohibited from paying any cash dividends to shareholders if, after the payment of such dividend, its total assets would be less than its total liabilities or where net assets are less than the liquidation value of shares that have a preferential right to participate in First Guaranty Bancshares, Inc.’s assets in the event First Guaranty Bancshares, Inc. were to be liquidated.
First Guaranty Bancshares, Inc. must seek prior approval from the Federal Reserve Bank before paying dividends to its shareholders.
We have not repurchased any shares of our outstanding common stock during the past year.
- 23 -
Stock Performance Graph
The line graph below compares the cumulative total return for the Company’s common stock with the cumulative total return of both the NASDAQ Stock Market Index for U.S. companies and the NASDAQ Index for bank stocks for the period December 31, 2006 through December 31, 2010. The total return assumes the reinvestment of all dividends and is based on a $100 investment on December 31, 1998. It also reflects the stock price on December 31st of each year shown, although this price reflects only a small number of transactions involving a small number of directors of the Company or affiliates or associates and cannot be taken as an accurate indicator of the market value of the Company’s common stock.
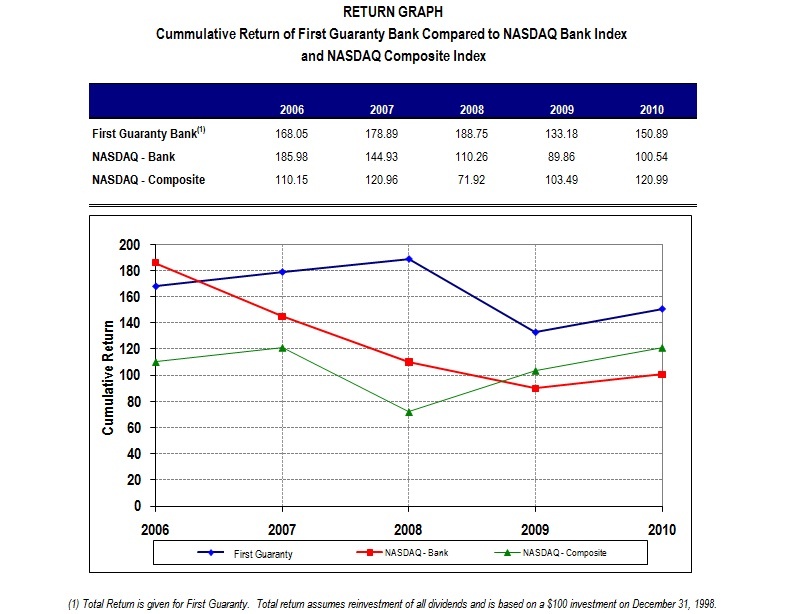
We have no equity based benefit plans.
- 24 -
The following selected financial data should be read in conjunction with the financial statements, including the related notes, and “Management’s Discussion and Analysis of Financial Condition and Results of Operations,” which are included elsewhere in this Form 10-K. Except for the data under “Performance Ratios,” “Capital Ratios” and “Asset Quality Ratios,” the income statement data and share and per share data for the years ended December 31, 2010, 2009 and 2008 and the balance sheet data as of December 31, 2010 and 2009 are derived from the audited financial statements and related notes which are included elsewhere in this Form 10-K, and the income statement data and share and per share data for the years ended December 31, 2007 and 2006 and the balance sheet data as of December 31, 2008, 2007and 2006 are derived from the audited financial statements and related notes that are not included in this Form 10-K.
|
At or For the Years Ended December 31,
|
||||||||||||||||||||
|
2010
|
2009
|
2008
|
2007
|
2006
|
||||||||||||||||
|
Year End Balance Sheet Data:
|
||||||||||||||||||||
|
(in thousands)
|
||||||||||||||||||||
|
Securities
|
$
|
481,961
|
$
|
261,829
|
$
|
139,162
|
$
|
142,068
|
$
|
158,352
|
||||||||||
|
Federal funds sold
|
9,129
|
13,279
|
838
|
35,869
|
6,793
|
|||||||||||||||
|
Loans, net of unearned income
|
575,640
|
589,902
|
606,369
|
575,256
|
507,195
|
|||||||||||||||
|
Allowance for loan losses
|
8,317
|
7,919
|
6,482
|
6,193
|
6,675
|
|||||||||||||||
|
Total assets(1)
|
1,132,792
|
930,847
|
871,233
|
807,994
|
715,216
|
|||||||||||||||
|
Total deposits
|
1,007,383
|
799,746
|
780,372
|
723,094
|
626,293
|
|||||||||||||||
|
Borrowings
|
12,589
|
31,929
|
18,122
|
13,494
|
24,568
|
|||||||||||||||
|
Stockholders' equity(1)
|
97,938
|
94,935
|
65,487
|
66,355
|
59,471
|
|||||||||||||||
|
Common Stockholders' equity(1)
|
76,963
|
74,165
|
65,487
|
66,355
|
59,471
|
|||||||||||||||
|
Average Balance Sheet Data:
|
||||||||||||||||||||
|
(dollars in thousands)
|
||||||||||||||||||||
|
Securities
|
$
|
342,589
|
$
|
245,952
|
$
|
127,586
|
$
|
152,990
|
$
|
178,419
|
||||||||||
|
Federal funds sold
|
11,007
|
24,662
|
17,247
|
8,083
|
3,115
|
|||||||||||||||
|
Loans, net of unearned income
|
593,429
|
599,609
|
600,854
|
543,946
|
505,623
|
|||||||||||||||
|
Total earning assets
|
964,039
|
906,158
|
752,093
|
712,212
|
690,057
|
|||||||||||||||
|
Total assets
|
1,015,681
|
948,556
|
797,024
|
751,237
|
726,593
|
|||||||||||||||
|
Total deposits
|
883,440
|
842,274
|
707,114
|
658,456
|
622,869
|
|||||||||||||||
|
Borrowings
|
27,324
|
22,907
|
16,287
|
23,450
|
42,435
|
|||||||||||||||
|
Stockholders' equity
|
99,575
|
77,135
|
67,769
|
63,564
|
56,640
|
|||||||||||||||
|
Stockholders' common equity
|
79,245
|
70,055
|
67,769
|
63,564
|
56,640
|
|||||||||||||||
|
Performance Ratios:
|
||||||||||||||||||||
|
Return on average assets
|
0.99
|
%
|
0.80
|
%
|
0.69
|
%
|
1.30
|
%
|
1.16
|
%
|
||||||||||
|
Return on average common equity
|
12.65
|
%
|
10.84
|
%
|
8.13
|
%
|
15.37
|
%
|
14.88
|
%
|
||||||||||
|
Return on average tangible assets(2)
|
0.99
|
%
|
0.80
|
%
|
0.69
|
%
|
1.30
|
%
|
1.16
|
%
|
||||||||||
|
Return on average tangible common equity(3)
|
12.95
|
%
|
11.14
|
%
|
8.77
|
%
|
16.47
|
%
|
15.73
|
%
|
||||||||||
|
Net interest margin
|
3.96
|
%
|
3.57
|
%
|
4.25
|
%
|
4.79
|
%
|
4.60
|
%
|
||||||||||
|
Average loans to average deposits
|
67.17
|
%
|
71.19
|
%
|
84.97
|
%
|
82.61
|
%
|
81.18
|
%
|
||||||||||
|
Efficiency ratio (1)
|
56.20
|
%
|
60.80
|
%
|
70.73
|
%
|
55.80
|
%
|
51.80
|
%
|
||||||||||
|
Efficiency ratio (excluding amortization of
|
||||||||||||||||||||
|
intangibles and securities transactions) (1)
|
59.25
|
%
|
61.99
|
%
|
61.20
|
%
|
54.59
|
%
|
49.90
|
%
|
||||||||||
|
Full time equivalent employees (year end)
|
246
|
230
|
225
|
222
|
196
|
|||||||||||||||
|
(1) For the years ended 2006, 2007 and 2008 amounts were restated in 2009 to reflect prior period adjustments.
|
|
(2) Average tangible assets represent average assets less average core deposit intangibles.
|
|
(3) Average tangible equity represents average equity less average core deposit intangibles.
|
|
|
- 25 -
|
At or For the Years Ended December 31,
|
||||||||||||||||||||
|
2010
|
2009
|
2008
|
2007
|
2006
|
||||||||||||||||
|
Capital Ratios:
|
||||||||||||||||||||
|
Average stockholders' equity to average assets
|
9.80
|
%
|
8.13
|
%
|
8.50
|
%
|
8.46
|
%
|
7.80
|
%
|
||||||||||
|
Average tangible equity to average tangible assets(1),(2)
|
9.64
|
%
|
7.95
|
%
|
8.25
|
%
|
8.31
|
%
|
7.71
|
%
|
||||||||||
|
Common stockholders' equity to total assets(3)
|
6.79
|
%
|
7.97
|
%
|
7.52
|
%
|
8.21
|
%
|
8.32
|
%
|
||||||||||
|
Tier 1 leverage capital(3)
|
8.69
|
%
|
9.58
|
%
|
7.88
|
%
|
7.38
|
%
|
8.11
|
%
|
||||||||||
|
Tier 1 capital(3)
|
11.98
|
%
|
11.90
|
%
|
9.19
|
%
|
10.13
|
%
|
9.85
|
%
|
||||||||||
|
Total risk-based capital(3)
|
13.03
|
%
|
12.97
|
%
|
10.11
|
%
|
11.09
|
%
|
10.96
|
%
|
||||||||||
|
Income Data:
|
||||||||||||||||||||
|
(dollars in thousands)
|
||||||||||||||||||||
|
Interest income
|
$
|
51,390
|
$
|
47,191
|
$
|
47,661
|
$
|
55,480
|
$
|
50,937
|
||||||||||
|
Interest expense(3)
|
13,223
|
14,844
|
15,881
|
21,934
|
19,769
|
|||||||||||||||
|
Net interest income(3)
|
38,167
|
32,347
|
31,780
|
33,546
|
31,168
|
|||||||||||||||
|
Provision for loan losses
|
5,654
|
4,155
|
1,634
|
1,918
|
4,419
|
|||||||||||||||
|
Noninterest income (excluding securities transactions)
|
6,741
|
5,909
|
5,689
|
5,176
|
4,601
|
|||||||||||||||
|
Securities (losses) gains
|
2,824
|
2,056
|
|
(1
|
)
|
(478
|
)
|
(234
|
) | |||||||||||
|
Loss on securities impairment
|
-
|
|
(829
|
)
|
(4,611
|
) |
-
|
-
|
||||||||||||
|
Noninterest expense(3)
|
26,827
|
24,007
|
23,241
|
21,341
|
18,373
|
|||||||||||||||
|
Earnings before income taxes(3)
|
15,251
|
11,321
|
7,982
|
14,985
|
12,744
|
|||||||||||||||
|
Net income(3)
|
10,025
|
7,595
|
5,512
|
9,772
|
8,431
|
|||||||||||||||
|
Net income available to common shareholders(3)
|
8,692
|
7,001
|
5,512
|
9,772
|
8,431
|
|||||||||||||||
|
Per Common Share Data:
|
||||||||||||||||||||
|
Net earnings(3)
|
$
|
1.56
|
$
|
1.26
|
$
|
0.99
|
$
|
1.76
|
$
|
1.52
|
||||||||||
|
Cash dividends paid
|
0.64
|
0.64
|
0.64
|
0.63
|
0.60
|
|||||||||||||||
|
Book value(3)
|
13.84
|
13.34
|
11.78
|
11.94
|
10.70
|
|||||||||||||||
|
Dividend payout ratio(3)
|
40.94
|
%
|
50.82
|
%
|
64.53
|
%
|
35.85
|
%
|
39.56
|
%
|
||||||||||
|
Weighted average number of shares outstanding
|
5,559,644
|
5,559,644
|
5,559,644
|
5,559,644
|
5,559,644
|
|||||||||||||||
|
Number of shares outstanding (year end)
|
5,559,644
|
5,559,644
|
5,559,644
|
5,559,644
|
5,559,644
|
|||||||||||||||
|
Market data:
|
||||||||||||||||||||
|
High
|
$
|
18.62
|
$
|
25.00
|
$
|
25.00
|
$
|
24.30
|
$
|
23.42
|
||||||||||
|
Low
|
$
|
17.00
|
$
|
12.00
|
$
|
24.30
|
$
|
23.42
|
$
|
18.57
|
||||||||||
|
Trading Volume
|
181,353
|
165,386
|
368,454
|
924,692
|
535,264
|
|||||||||||||||
|
Stockholders of record
|
1,361
|
1,356
|
1,343
|
1,293
|
1,181
|
|||||||||||||||
|
Asset Quality Ratios:
|
||||||||||||||||||||
|
Nonperforming assets to total assets
|
2.73
|
%
|
1.68
|
%
|
1.14
|
%
|
1.39
|
%
|
1.85
|
%
|
||||||||||
|
Nonperforming assets to loans
|
5.38
|
%
|
2.65
|
%
|
1.63
|
%
|
1.95
|
%
|
2.61
|
%
|
||||||||||
|
Loan loss reserve to nonperforming assets
|
26.9
|
%
|
50.68
|
%
|
65.46
|
%
|
55.26
|
%
|
50.43
|
%
|
||||||||||
|
Net charge-offs to average loans
|
0.89
|
%
|
0.45
|
%
|
0.22
|
%
|
0.50
|
%
|
1.06
|
%
|
||||||||||
|
Provision for loan loss to average loans
|
0.95
|
%
|
0.69
|
%
|
0.27
|
%
|
0.35
|
%
|
0.87
|
%
|
||||||||||
|
Allowance for loan loss to total loans
|
1.44
|
%
|
1.34
|
%
|
1.07
|
%
|
1.08
|
%
|
1.32
|
%
|
||||||||||
|
(1) Average tangible assets represents average assets less average core deposit intangibles.
|
|
(2) Average tangible equity represents average equity less average core deposit intangibles.
|
|
(3) For the years ended 2006, 2007 and 2008 amounts were restated in 2009 to reflect prior period adjustments.
|
- 26 -
First Guaranty Bancshares, Inc. became the holding company for First Guaranty Bank on July 27, 2007 in a corporate reorganization. Prior to becoming the holding company of First Guaranty Bank, First Guaranty Bancshares, Inc. had no assets, liabilities or operations.
This discussion and analysis reflects our financial statements and other relevant statistical data, and is intended to enhance your understanding of our financial condition and results of operations. Reference should be made to those financial statements of this Form 10-K and the selected financial data (above) presented in this report in order to obtain a better understanding of the commentary which follows.
Special Note Regarding Forward-Looking Statements
Congress passed the Private Securities Litigation Act of 1995 in an effort to encourage corporations to provide information about a company’s anticipated future financial performance. This act provides a safe harbor for such disclosure, which protects us from unwarranted litigation, if actual results are different from Management’s expectations. This discussion and analysis contains forward-looking statements and reflects Management’s current views and estimates of future economic circumstances, industry conditions, company performance and financial results. The words “may,” “should,” “expect,” “anticipate,” “intend,” “plan,” “continue,” “believe,” “seek,” “estimate” and similar expressions are intended to identify forward-looking statements. These forward-looking statements are subject to a number of factors and uncertainties, which could cause our actual results and experience to differ from the anticipated results and expectations, expressed in such forward-looking statements.
Application of Critical Accounting Policies
The accounting and reporting policies of the Company conform to generally accepted accounting principles in the United States of America and to predominant accounting practices within the banking industry. Certain critical accounting policies require judgment and estimates which are used in the preparation of the financial statements.
Other-Than-Temporary Impairment of Investment Securities. Securities are evaluated periodically to determine whether a decline in their value is other-than-temporary. The term “other-than-temporary” is not intended to indicate a permanent decline in value. Rather, it means that the prospects for near term recovery of value are not necessarily favorable, or that there is a lack of evidence to support fair values equal to, or greater than, the carrying value of the investment. Management reviews criteria such as the magnitude and duration of the decline, the reasons for the decline, and the performance and valuation of the underlying collateral, when applicable, to predict whether the loss in value is other-than-temporary. Once a decline in value is determined to be other-than-temporary, the carrying value of the security is reduced to its fair value and a corresponding charge to earnings is recognized.
Allowance for Loan Losses. The Company’s most critical accounting policy relates to its allowance for loan losses. The allowance for loan losses is established through a provision for loan losses charged to expense. Loans are charged against the allowance for loan losses when Management believes that the collectability of the principal is unlikely. The allowance, which is based on the evaluation of the collectability of loans and prior loan loss experience, is an amount Management believes will be adequate to reflect the risks inherent in the existing loan portfolio and that exist at the reporting date. The evaluations take into consideration a number of subjective factors including changes in the nature and volume of the loan portfolio, overall portfolio quality, review of specific problem loans, current economic conditions that may affect a borrower’s ability to pay, adequacy of loan collateral and other relevant factors.
Changes in such estimates may have a significant impact on the financial statements. For further discussion of the allowance for loan losses, see the “Allowance for Loan Losses” section of this analysis and Note 1 and Note 5 to the Consolidated Financial Statements.
Valuation of Goodwill, Intangible Assets and Other Purchase Accounting Adjustments. The Company's goodwill and intangible assets deemed to have indefinite lives are no longer amortized, but are subject to annual impairment tests. The Company’s goodwill is tested for impairment on an annual basis, or more often if events or circumstances indicate that there may be impairment. A goodwill impairment test includes two steps. Step one, used to identify potential impairment, compares the estimated fair value of a reporting unit with its carrying amount, including goodwill. If the estimated fair value of a reporting unit exceeds its carrying amount, goodwill of the reporting unit is considered not impaired. If the carrying amount of a reporting unit exceeds its estimated fair value, the second step of the goodwill impairment test is performed to measure the amount of impairment loss, if any. Step two of the goodwill impairment test compares the implied estimated fair value of reporting unit goodwill with the carrying amount of that goodwill. If the carrying amount of goodwill for that reporting unit exceeds the implied fair value of that unit’s goodwill, an impairment loss is recognized in an amount equal to that excess. Based on Management’s goodwill impairment tests, there was no impairment of goodwill at December 31, 2010. For additional information on goodwill and intangible assets, see Note 7 to the Consolidated Financial Statements.
- 27 -
2010 Financial Overview
Financial highlights for 2010 and 2009 are as follows:
|
·
|
Net income for 2010 and 2009 was $10.0 million and $7.6 million respectively. Net income to common shareholders after preferred stock dividends was $8.7 million and $7.0 million for 2010 and 2009, with earnings per common share of $1.56 and $1.26 respectively. The increase in net income was primarily the result of an increase in net interest income due to a larger investment portfolio and higher loan pricing. The Company also recognized gains from sales of securities of $2.8 million compared to $2.1 million for 2009.
|
|
·
|
Net interest income for 2010 and 2009 was $38.2 million and $32.3 million, respectively. The net interest margin for the Company was 4.0% at December 31, 2010 and 3.6% at December 31, 2009.
|
|
·
|
The provision for loan losses for 2010 was $5.7 million compared to $4.2 million for 2009.
|
|
·
|
Total assets at December 31, 2010 were $1.133 billion, an increase of $201.9 million or 21.7% when compared to $930.8 million at December 31, 2009. The increase in assets primarily resulted from excess cash received from deposit growth which was primarily invested in the securities portfolio.
|
|
·
|
Investment securities totaled $482.0 million at December 31, 2010, an increase of $220.1 million when compared to $261.8 million at December 31, 2009. At December 31, 2010, available for sale securities, at fair value, totaled $322.1 million, an increase of $72.6 million when compared to December 31, 2009. The Company had $159.8 million in the held to maturity category as of December 31, 2010. Our securities in the held to maturity category totaled $12.3 million at December 31, 2009.
|
|
·
|
The net loan portfolio at December 31, 2010 totaled $567.3 million, a decrease of $14.7 million from the December 31, 2009 level of $582.0 million. Net loans are reduced by the allowance for loan losses which totaled $8.3 million for December 31, 2010 and $7.9 million for December 31, 2009.
|
|
·
|
Non-performing assets at December 31, 2010 were $31.0 million, an increase of $15.3 million compared to December 31, 2009.
|
|
·
|
Total deposits increased $207.6 million or 26.0% in 2010 compared to the year ended December 31, 2009.
|
|
·
|
Return on average assets for the twelve months ending December 31, 2010 and December 31, 2009 was 1.0% and 0.8% respectively. Return on average common shareholders’ equity for 2010 and 2009 were 12.7% and 10.8% respectively. Return on average assets is calculated by dividing net income before preferred dividends by average assets. Return on common shareholders’ equity is calculated by dividing net earnings applicable to common shareholders by average common shareholders’ equity.
|
|
·
|
The Company’s Board of Directors declared cash dividends of $0.64 per common share in 2010 and 2009.
|
Financial Condition
Assets. Total assets at December 31, 2010 were $1.133 billion, an increase of $201.9 million, or 21.7%, from $930.8 million at December 31, 2009. Federal funds sold decreased $4.2 million from December 31, 2009 to December 31, 2010 and total loans for the same period decreased $14.3 million. Cash and due from banks increased $2.3 million from 2009 to 2010. Additionally, total investment securities increased $220.1 million to $482.0 million from December 31, 2009 to December 31, 2010. Total deposits increased by $207.6 million or 26.0% from 2009 to 2010. At December 31, 2010, the Company had no long-term borrowings compared to long-term borrowings of $20.0 million at December 31, 2009.
Investment Securities. The securities portfolio consisted principally of U.S. Government agency securities, corporate debt securities and mutual funds or other equity securities. The securities portfolio provides us with a relatively stable source of income and provides a balance to interest rate and credit risks as compared to other categories of assets.
The securities portfolio totaled $482.0 million at December 31, 2010, representing an increase of $220.1 million from December 31, 2009. The primary changes in the portfolio consisted of $1.0 billion in purchases, sales totaling $44.3 million, and calls and maturities of $768.1 million.
At December 31, 2010, approximately 2.4% of the securities portfolio (excluding Federal Home Loan Bank stock) matures in less than one year while securities with maturity dates over 10 years totaled 26.9% of the portfolio. At December 31, 2010, the average maturity of the securities portfolio was 6.5 years, compared to the average maturity at December 31, 2009 of 6.3 years.
During the fourth quarter of 2009, three agency securities with a par value of $10.0 million were transferred from available for sale to held to maturity. These three securities had a fair market value totaling $9.8 million and an average maturity of aproximately 14 years. The unrealized loss of $0.2 million was recorded as a component of other comprehensive loss and will be amortized over the life of the securities or until the security is called.
At December 31, 2010, securities totaling $322.1 million were classified as available for sale and $159.8 million were classified as held to maturity as compared to $249.5 million and $12.3 million, respectively at December 31, 2009.
Securities classified as available for sale are measured at fair market value. For these securities, the Company obtains fair value measurements from an independent pricing service. The fair value measurements consider observable data that may include dealer quotes, market spreads, cash flows, market yield curves, prepayment speeds, credit information and the instrument’s contractual terms and conditions, among other things. Securities classified as held to maturity are measured at book value. See Note 3 to the Consolidated Financial Statements for additional information.
The book yields on securities available for sale ranged from 0.8% to 10.9% at December 31, 2010, exclusive of the effect of changes in fair value reflected as a component of stockholders’ equity. The book yields on held to maturity securities ranged from 2.1% to 4.0%.
- 28 -
Securities classified as available for sale had gross unrealized losses totaling $5.5 million at December 31, 2010. These losses include $4.0 million in unrealized losses on U.S. Government agency securities, which have been in a loss position for less than 12 months. The Company believes that it will collect all amounts contractually due and has the intent and the ability to hold these securities until the fair value is at least equal to the carrying value. At December 31, 2009, securities classified as available for sale had gross unrealized losses totaling $2.8 million. See Note 3 to the Consolidated Financial Statements for additional information.
Average securities as a percentage of average interest-earning assets were 35.5% and 27.1% at December 31, 2010 and 2009, respectively. This increase reflected, in part, Management’s decision to deploy a certain amount of funds into investment securities, rather than loans, to manage our interest rate risk, in a low interest rate environment in 2010. At December 31, 2010 and 2009, $271.5 million and $154.5 million in securities were pledged, respectively.
In the second quarter of 2010, the Company sold the $12.1 million that remained in the held to maturity category. This represented approximately 4.0% of the total investment portfolio and 1.0% of assets. Several of the securities sold included mortgage backed securities and agency bullet securities which were no longer part of Management's investment portfolio strategy. During the third quarter of 2010, the Company experienced significant deposit growth but decreased loan demand. Deposits grew approximately $123.0 million or 14.0% from June 30, 2010 to December 31, 2010. Net loans declined $38.0 million or 6.0% during the same period. Investment securities increased $142.0 million or 42% from June 30, 2010 to December 31, 2010. Market conditions continued to be historically volatile and interest rates declined to levels not seen in decades.
Given the changes in the Company’s balance sheet observed during the third quarter and following the completion of a five year strategic plan, securities purchased pursuant to this plan were classified as held to maturity. The Company determined the unprecedented market conditions and volatility coupled with a revised five year strategic plan that a waiting period of one quarter was appropriate based on the materiality conditions and the type of securities in the held to maturity portfolio sold during the second quarter of 2010.
The held to maturity portfolio is comprised of government sponsored enterprise securities such as FHLB, FNMA, FHLMC, and FFCB. The securities have maturities of 15 years or less and the securities are used to collateralize public funds. The Company has maintained public funds in excess of $175.0 million since December 2007. Management believes that public funds will continue to be a significant part of the Company's deposit base and will need to be collateralized by securities in the investment portfolio.
Loans. The origination of loans is the primary use of our financial resources and represents the largest component of earning assets. At December 31, 2010, the loan portfolio (loans, net of unearned income) totaled $575.6 million, a decrease of approximately $14.3 million, or 2.4%, from the December 31, 2009 level of $589.9 million. The decrease in net loans primarily includes a reduction of $13.1 million in real estate construction and land development loans, a reduction of $5.8 million in commercial and industrial loans, a reduction of $7.9 million in non-farm non-residential loans secured by real estate, partially offset by an increase of $5.6 million in multifamily loans.
Loans represented 57.1% of deposits at December 31, 2010, compared to 73.8% of deposits at December 31, 2009. Loans secured by real estate decreased $17.7 million to $459.4 million at December 31, 2010. Commercial and industrial loans decreased $5.8 million to $76.6 million at December 31, 2010. Real estate and related loans comprised 79.8% of the portfolio in 2010 as compared to 80.9% in 2009. Commercial and industrial loans comprised 13.3% of the portfolio in 2010 as compared to 14.0% in 2009.
Loan charge-offs taken during 2010 totaled $5.6 million, compared to charge-offs of $2.9 million in 2009. Of the loan charge-offs in 2010, approximately $1.8 million were loans secured by real estate, $3.4 million were commercial and industrial loans and $0.4 million were consumer and other loans. In 2010, recoveries of $0.4 million were recognized on loans previously charged off as compared to $0.2 million in 2009.
Nonperforming Assets. Nonperforming assets were $31.0 million, or 2.7% of total assets at December 31, 2010, compared to $15.6 million, or 1.7% of total assets at December 31, 2009. The increase resulted from a $14.5 million increase in non-accrual loans, and an increase of $0.9 million in 90 days past due loans. The increase in nonaccrual loans was primarily in construction and land development, multifamily, and non-farm non-residential loans. The increase in nonperforming assets was concentrated in less than ten customer relationships.
Deposits. Total deposits increased by $207.6 million or 26.0%, to $1.01 billion at December 31, 2010 from $799.7 million at December 31, 2009. In 2010, noninterest-bearing demand deposits decreased $0.9 million, interest-bearing demand deposits increased $3.9 million and savings deposits increased $6.4 million. Time deposits increased $198.3 million, or 45.1%. The increase in deposits was principally due to an increase of $88.7 million in public funds deposits and a deposit promotion program that increased deposits by over $100.0 million. The increase in public fund deposits was the primary result of three municipalities maintaining higher deposit balances.
Public fund deposits totaled $356.2 million or 35.4% of total deposits at December 31, 2010. Six public entities comprised $277.6 million or 77.9% of the total public funds as of December 31, 2010. At December 31, 2009, public fund deposits represented 33.6% of total deposits with a balance of $268.5 million.
Borrowings. Short-term borrowings increased $0.7 million in 2010 to $12.6 million at December 31, 2010 from $11.9 million at December 31, 2009. Short-term borrowings are used to manage liquidity on a daily or otherwise short-term basis. The short-term borrowings at December 31, 2010 and 2009, respectively was solely comprised of repurchase agreements. Overnight repurchase agreement balances are monitored daily for sufficient collateralization.
There were no long-term borrowings at December 31, 2010, compared to $20.0 million at December 31, 2009.
Stockholders’ Equity. Total stockholders’ equity increased $3.0 million or 3.2% to $97.9 million at December 31, 2010 from $94.9 million at December 31, 2009. The increase in stockholders’ equity is attributable to the $10.0 million in consolidated earnings for 2010 which was partially offset by $3.6 million in dividends on common stock, $1.1 million in dividends on preferred stock, and a $2.3 million decrease in the unrealized gain on available for sale securities. Included in stockholders' equity are two classes of preferred stock Series A at $19.9 million and Series B at $1.1 million. Series A and Series B were issued in August 2009 to the Treasury Department. See Note 11 to the Consolidated Financial Statements for additional information.
- 29 -
Loan Portfolio Composition. The following table sets forth the composition of our loan portfolio, excluding loans held for sale, by type of loan at the dates indicated.
|
December 31,
|
||||||||||||||||||||||||
|
2010
|
2009
|
2008
|
||||||||||||||||||||||
|
As % of
|
As % of
|
As % of
|
||||||||||||||||||||||
|
Balance
|
Category
|
Balance
|
Category
|
Balance
|
Category
|
|||||||||||||||||||
|
(in thousands)
|
||||||||||||||||||||||||
|
Real estate
|
||||||||||||||||||||||||
|
Construction & land development
|
$
|
65,570
|
11.4
|
%
|
$
|
78,686
|
13.3
|
%
|
$
|
92,029
|
15.2
|
%
|
||||||||||||
|
Farmland
|
13,337 |
2.3
|
%
|
11,352
|
1.9
|
%
|
16,403
|
2.7
|
%
|
|||||||||||||||
|
1-4 Family
|
73,158
|
12.7
|
%
|
77,470
|
13.1
|
%
|
79,285
|
13.1
|
%
|
|||||||||||||||
|
Multifamily
|
14,544
|
2.5
|
%
|
8,927
|
1.5
|
%
|
15,707
|
2.6
|
%
|
|||||||||||||||
|
Non-farm non-residential
|
292,809
|
50.8
|
%
|
300,673
|
51.0
|
%
|
261,744
|
43.0
|
%
|
|||||||||||||||
|
Total real estate
|
459,418
|
79.7
|
%
|
477,108
|
80.8
|
%
|
465,168
|
76.6
|
%
|
|||||||||||||||
|
Agricultural
|
17,361
|
3.0
|
%
|
14,017
|
2.4
|
%
|
18,536
|
3.0
|
%
|
|||||||||||||||
|
Commercial and industrial
|
76,590
|
13.3
|
%
|
82,348
|
13.9
|
%
|
105,555
|
17.4
|
%
|
|||||||||||||||
|
Consumer and other
|
22,970
|
4.0
|
%
|
17,226
|
2.9
|
%
|
17,926
|
3.0
|
%
|
|||||||||||||||
|
Total loans before unearned income
|
576,339
|
100.0
|
%
|
590,699
|
100.0
|
%
|
607,185
|
100.0
|
%
|
|||||||||||||||
|
Less: unearned income
|
(699
|
)
|
(797
|
)
|
(816
|
)
|
||||||||||||||||||
|
Total loans net of unearned income
|
$
|
575,640
|
$
|
589,902
|
$
|
606,369
|
||||||||||||||||||
|
December 31,
|
||||||||||||||||||||||||
|
2007
|
2006
|
|||||||||||||||||||||||
|
As % of
|
As % of
|
|||||||||||||||||||||||
|
Balance
|
Category
|
Balance
|
Category
|
|||||||||||||||||||||
|
(in thousands)
|
||||||||||||||||||||||||
|
Real estate
|
||||||||||||||||||||||||
|
Construction & land development
|
$
|
98,127
|
17.0
|
%
|
$
|
49,837
|
9.9
|
%
|
||||||||||||||||
|
Farmland
|
23,065
|
4.0
|
%
|
25,582
|
5.0
|
%
|
||||||||||||||||||
|
1-4 Family
|
84,640
|
14.7
|
%
|
67,022
|
13.2
|
%
|
||||||||||||||||||
|
Multifamily
|
13,061
|
2.3
|
%
|
14,702
|
2.9
|
%
|
||||||||||||||||||
|
Non-farm non-residential
|
236,474
|
41.1
|
%
|
256,176
|
50.5
|
%
|
||||||||||||||||||
|
Total real estate
|
455,367
|
79.1
|
%
|
413,319
|
81.5
|
%
|
||||||||||||||||||
|
Agricultural
|
16,816
|
2.9
|
%
|
16,359
|
3.2
|
%
|
||||||||||||||||||
|
Commercial and industrial
|
81,073
|
14.1
|
%
|
59,072
|
11.6
|
%
|
||||||||||||||||||
|
Consumer and other
|
22,517
|
3.9
|
%
|
18,880
|
3.7
|
%
|
||||||||||||||||||
|
Total loans before unearned income
|
575,773
|
100.0
|
%
|
507,630
|
100.0
|
%
|
||||||||||||||||||
|
Less: unearned income
|
(517
|
)
|
(435
|
)
|
||||||||||||||||||||
|
Total loans net of unearned income
|
$
|
575,256
|
$
|
507,195
|
||||||||||||||||||||
- 30 -
The four most significant categories of our loan portfolio are construction and land development real estate loans, 1-4 family residential loans, non-farm non-residential real estate loans and commercial and industrial loans.
The Company’s credit policy dictates specific loan-to-value and debt service coverage requirements. The Company generally requires a maximum loan-to-value of 85.0% and a debt service coverage ratio of 1.25x to 1.0x for non-farm non-residential real estate loans. In addition, personal guarantees of borrowers are required as well as applicable hazard, title and flood insurance. Loans may have a maximum maturity of five years and a maximum amortization of 25 years. The Company may require additional real estate or non-real estate collateral when deemed appropriate to secure the loan.
The Company generally requires all one- to four- family residential loans to be underwritten based on the Fannie Mae guidelines provided through Desktop Underwriter. These guidelines include the evaluation of risk and eligibility, verification and approval of conditions, credit and liabilities, employment and income, assets, property and appraisal information. It is required that all borrowers have proper hazard, flood and title insurance prior to a loan closing. Appraisals and Desktop Underwriter approvals are good for six months. The Company has an in-house underwriter review the final package for compliance to these guidelines.
The Company generally requires a maximum loan-to value of 75.0% and a debt service coverage ratio of 1.25x to 1.0x for construction land development loans. In addition, detailed construction cost breakdowns, personal guarantees of borrowers and applicable hazard, title and flood insurance are required. Loans may have a maximum maturity of 12 months for the construction phase and a maximum maturity of 24 months for the sell-out phase. The Company may require additional real estate or non-real estate collateral when deemed appropriate to secure the loan.
The Company has specific guidelines for the underwriting of commercial and industrial loans that is specific for the collateral type and the business type. Commercial and industrial loans are secured by non-real estate collateral such as equipment, inventory or accounts receivable. Each of these collateral types has maximum loan to value ratios. Commercial and industrial loans have the same debt service coverage ratio requirements as other loans, which is 1.25x to 1.0x.
The Company will allow exceptions to each of the above policies with appropriate mitigating circumstances and approvals. The Company has a defined credit underwriting process for all loan requests. The Company actively monitors loan concentrations by industry type and will make adjustments to underwriting standards as deemed necessary. The Company has a loan review department that monitors the performance and credit quality of loans. The Company has a special assets department that manages loans that have become delinquent or have serious credit issues associated with them.
For new loan originations, appraisals and evaluations on all properties shall be valid for a period not to exceed two calendar years from the effective appraisal date for non-residential properties and one calendar year from the effective appraisal date for residential properties. However, an appraisal may be valid longer if there has been no material decline in the property condition or market condition that would negatively affect the bank’s collateral position. This must be supported with a “Validity Check Memorandum”.
For renewals with or without new money, any commercial appraisal greater than two years or greater than one year for residential appraisals must be updated with a Validity Check Memorandum. Any renewal loan request, in which new money will be disbursed, whether commercial or residential, and the appraisal is older than five years a new appraisal must be obtained.
The Company does not require new appraisals between renewals unless the loan becomes impaired and is considered collateral dependent. At this time, an appraisal may be ordered in accordance with the Company’s Allowance for Loan Losses policy.
The Company does not mitigate risk using products such as credit default agreements and/or credit derivatives. These, accordingly, have no impact on our financial statements.
The Company does not offer loan products with established loan-funded interest reserves.
Loan Maturities by Type. The following table summarizes the scheduled repayments of our loan portfolio including non-accruals at December 31, 2010. Loans having no stated repayment schedule or maturity and overdraft loans are reported as being due in one year or less. Maturities are based on the final contractual payment date and do not reflect the effect of prepayments and scheduled principal amortization.
| December 31, 2010 | ||||||||||||||||
|
One Year
|
One Through
|
After
|
||||||||||||||
|
or Less
|
Five Years
|
Five Years
|
Total
|
|||||||||||||
|
(in thousands)
|
||||||||||||||||
|
Real estate:
|
||||||||||||||||
|
Construction and land development
|
$
|
50,377 |
$
|
11,979 |
$
|
3,214 |
$
|
65,570 | ||||||||
|
Farmland
|
6,647
|
3,863 | 2,827 | 13,337 | ||||||||||||
|
1-4 Family
|
19,745 |
24,098
|
29,315 | 73,158 | ||||||||||||
|
Multifamily
|
7,815 | 5,426 | 1,303 | 14,544 | ||||||||||||
|
Non-farm non-residential
|
114,034 | 172,283 | 6,492 | 292,809 | ||||||||||||
|
Total real estate
|
198,618 | 217,649 | 43,151 | 459,418 | ||||||||||||
|
Agricultural
|
7,080 | 3,414 | 6,867 | 17,361 | ||||||||||||
|
Commercial and industrial
|
46,185 | 23,869 | 6,536 | 76,590 | ||||||||||||
|
Consumer and other
|
7,767 | 15,054 | 149 | 22,970 | ||||||||||||
|
Total loans before unearned income
|
$
|
259,650 |
$
|
259,986 |
$
|
56,703 |
$
|
576,339 | ||||||||
|
Less: unearned income
|
(699 |
)
|
||||||||||||||
|
Total loans net of unearned income
|
$
|
575,640 | ||||||||||||||
- 31 -
The following table sets forth the scheduled contractual maturities at December 31, 2010 of fixed- and floating-rate loans excluding non-accrual loans.
|
December 31, 2010
|
||||||||||||
|
Fixed
|
Floating
|
Total
|
||||||||||
|
(in thousands)
|
||||||||||||
|
One year or less
|
$
|
67,944
|
$
|
167,399
|
$
|
235,343
|
||||||
|
One to five years
|
127,401
|
132,345
|
259,746
|
|||||||||
|
Five to 15 years
|
2,456
|
30,953
|
33,409
|
|||||||||
|
Over 15 years
|
9,735
|
9,388
|
19,123
|
|||||||||
|
Subtotal
|
207,536
|
340,085
|
547,621
|
|||||||||
|
Nonaccrual loans
|
28,718
|
|||||||||||
|
Total loans
|
$
|
576,339
|
||||||||||
| Unearned Income | (699 | ) | ||||||||||
|
Total loans net of unearned income
|
|
|
$
|
575,640
|
At December 31, 2010, fixed rate loans totaled $207.5 million or 37.9% of total loans excluding non-accrual loans and variable rate loans totaled $340.1 or 62.1% of total loans excluding non-accrual loans. Throughout 2010, Management added floors to floating rate loans, primarily tied to the prime rate. As of December 31, 2010, the portfolio consisted of $340.1 million in variable rate loans with $292.0 million or 85.8% at the floor rate.
- 32 -
Non-Performing Assets. The table below sets forth the amounts and categories of our non-performing assets at the dates indicated.
|
At December 31,
|
||||||||||||||||||||
|
2010
|
2009 |
2008
|
2007
|
2006
|
||||||||||||||||
|
(in thousands)
|
||||||||||||||||||||
|
Non-accrual loans:
|
||||||||||||||||||||
|
Real estate loans:
|
||||||||||||||||||||
|
Construction and land development
|
$
|
3,383
|
$ | 2,841 |
$
|
1,644
|
$
|
1,841
|
$
|
2,676
|
||||||||||
|
Farmland
|
-
|
54 |
182
|
419
|
33
|
|||||||||||||||
|
1 - 4 family residential
|
1,480
|
2,814 |
1,445
|
1,819
|
3,202
|
|||||||||||||||
|
Multifamily
|
1,357
|
- |
-
|
2
|
-
|
|||||||||||||||
|
Non-farm non-residential
|
21,944
|
7,439 |
5,263
|
4,950
|
3,882
|
|||||||||||||||
|
Non-real estate loans:
|
||||||||||||||||||||
|
Agricultural
|
446
|
- |
-
|
-
|
-
|
|||||||||||||||
|
Commercial and industrial
|
76
|
830 |
275
|
978
|
267
|
|||||||||||||||
|
Consumer and other
|
32
|
205 |
320
|
279
|
302
|
|||||||||||||||
|
Total non-accrual loans
|
28,718
|
14,183 |
9,129
|
10,288
|
10,362
|
|||||||||||||||
|
Loans 90 days and greater delinquent
|
||||||||||||||||||||
|
and still accruing:
|
||||||||||||||||||||
|
Real estate loans:
|
||||||||||||||||||||
|
Construction and land development
|
-
|
- |
-
|
-
|
-
|
|||||||||||||||
|
Farmland
|
-
|
- |
-
|
-
|
-
|
|||||||||||||||
|
1 - 4 family residential
|
1,663
|
757 |
185
|
544
|
334
|
|||||||||||||||
|
Multifamily
|
-
|
- |
-
|
-
|
-
|
|||||||||||||||
|
Non-farm non-residential
|
-
|
- |
-
|
-
|
-
|
|||||||||||||||
|
Non-real estate loans:
|
||||||||||||||||||||
|
Agricultural
|
-
|
- |
-
|
-
|
-
|
|||||||||||||||
|
Commercial and industrial
|
-
|
- |
17
|
-
|
-
|
|||||||||||||||
|
Consumer and other
|
10
|
28 |
3
|
3
|
-
|
|||||||||||||||
|
Total loans 90 days greater
|
||||||||||||||||||||
|
delinquent and still accruing
|
1,673
|
785 |
205
|
547
|
334
|
|||||||||||||||
|
Total non-performing loans
|
30,391
|
14,968 |
9,334
|
10,835
|
10,696
|
|||||||||||||||
|
Real estate owned:
|
||||||||||||||||||||
|
Construction and land development
|
231
|
- |
89
|
84
|
2,217
|
|||||||||||||||
|
Farmland
|
-
|
- |
-
|
-
|
-
|
|||||||||||||||
|
1 - 4 family residential
|
232
|
292 |
223
|
170
|
78
|
|||||||||||||||
|
Multifamily
|
-
|
- |
-
|
-
|
-
|
|||||||||||||||
|
Non-farm non-residential
|
114
|
366 |
256
|
119
|
245
|
|||||||||||||||
|
Non-real estate loans:
|
||||||||||||||||||||
|
Agricultural
|
-
|
- |
-
|
-
|
-
|
|||||||||||||||
|
Commercial and industrial
|
-
|
- |
-
|
-
|
-
|
|||||||||||||||
|
Consumer and other
|
-
|
- |
-
|
-
|
-
|
|||||||||||||||
|
Total real estate owned
|
577
|
658 |
568
|
373
|
2,540
|
|||||||||||||||
|
Total non-performing assets
|
$
|
30,968
|
$ | 15,626 |
$
|
9,902
|
$
|
11,208
|
$
|
13,236
|
||||||||||
| Restructured Loans | 9,535 | 51 | ||||||||||||||||||
|
Ratios:
|
||||||||||||||||||||
|
Non-performing assets to total loans
|
5.38
|
%
|
2.65 | % |
1.63
|
%
|
1.95
|
%
|
2.61
|
%
|
||||||||||
|
Non-performing assets to total assets
|
2.73
|
%
|
1.68 | % |
1.14
|
%
|
1.39
|
%
|
1.85
|
%
|
||||||||||
- 33 -
For the years ended December 31, 2010 and 2009, gross interest income that would have been recorded had our non-accruing loans been current in accordance with their original terms was $1.7 million and $0.4 million, respectively. Interest income recognized on such loans for 2010 was $3.7 million.
Nonperforming assets totaled $31.0 million or 2.73% of total assets at December 31, 2010, an increase of $15.3 million from December 31, 2009. Management has not identified additional information on any loans not already included in impaired loans or the nonperforming asset total that indicates possible credit problems that could cause doubt as to the ability of borrowers to comply with the loan repayment terms in the future.
Nonaccrual loans increased $14.5 million from December 31, 2009 to December 31, 2010. There were increases in construction and land development nonaccrual loans, nonfarm nonresidential nonaccrual loans and multi-family non-accrual loans.
During 2010, there was a $0.5 million increase in construction and land development nonaccrual loans. This increase in nonaccrual construction and land development was due mainly to three loans. Two of these loans were made to the same borrower to purchase land for future development for a total outstanding balance of $0.6 million. The third loan was a vacant land purchase for future development in the amount of $1.3 million. There was also a total of $1.4 million in nonaccrual loans were moved to OREO property and subsequently sold.
Non-farm non-residential nonaccrual loans increased $14.5 million from December 31, 2009 to December 31, 2010. This increase is reflective of five loans, two of which were for the construction of a climate controlled storage facility. These two loans totaled $8.0 million to the same borrower. A third loan, in the amount of $3.8 million, is to a hotel which has seen a drop in revenue due to the recession's impact on the hotel industry. The remaining loans consist of a church loan in the amount of $2.6 million and $1.1 million loan to a non-owner occupied real estate loan. The $1.1 million loan is secured by a warehouse and has been added to nonaccrual due to lack of occupancy of the building.
Multi-family non-accrual loans increased $1.4 million during 2010. This was due to one loan in the amount of $1.3 million secured by an apartment complex. This project has experienced slow sales of units, due to the recession, and has implemented a change in management to help correct the problem. The borrower has since decided to lease the remaining units.
At December 31, 2010, there were decreases of $54,000 in farmland, $1.3 million in 1-4 family residential, $0.8 million in commercial and industrial and $0.2 million in consumer and other non-accrual loans. See preceding table for further information.
Allowance for Loan Losses. The allowance for loan losses is maintained at a level considered sufficient to absorb potential losses embedded in the loan portfolio. The allowance is increased by the provision for anticipated loan losses as well as recoveries of previously charged off loans and is decreased by loan charge-offs. The provision is the necessary charge to current expense to provide for current loan losses and to maintain the allowance at an adequate level commensurate with Management’s evaluation of the risks inherent in the loan portfolio. Various factors are taken into consideration when determining the amount of the provision and the adequacy of the allowance. These factors include but are not limited to:
-
past due and nonperforming assets;
-
specific internal analysis of loans requiring special attention;
-
the current level of regulatory classified and criticized assets and the associated risk factors with each;
-
changes in underwriting standards or lending procedures and policies;
-
charge-off and recovery practices;
-
national and local economic and business conditions;
-
nature and volume of loans;
-
overall portfolio quality;
-
adequacy of loan collateral;
-
quality of loan review system and degree of oversight by its Board of Directors;
-
competition and legal and regulatory requirements on borrowers;
-
examinations of the loan portfolio by federal and state regulatory agencies and examinations;
-
and review by our internal loan review department and independent accountants.
- 34 -
The data collected from all sources in determining the adequacy of the allowance is evaluated on a regular basis by Management with regard to current national and local economic trends, prior loss history, underlying collateral values, credit concentrations and industry risks. An estimate of potential loss on specific loans is developed in conjunction with an overall risk evaluation of the total loan portfolio. This evaluation is inherently subjective as it requires estimates that are susceptible to significant revision as new information becomes available.
The allowance consists of specific, general and unallocated components. The specific component relates to loans that are classified as doubtful, substandard or special mention. For such loans that are also classified as impaired, an allowance is established when the discounted cash flows (or collateral value or observable market price) of the impaired loan is lower than the carrying value of that loan. The general component covers non-classified loans and is based on historical loss experience adjusted for qualitative factors.
Allocation of Allowance for Loan Losses. In prior years, the Company used an internal method to calculate the allowance for loan losses which categorized loans by risk rather than by type. We do not have the ability to accurately and efficiently provide the allocation of the allowance for loan losses by loan type for a five-year historical period.
Beginning in 2008, the Company modified the allowance calculation to segregate loans by category and allocate the allowance for loan losses accordingly.
The allowance for loan losses calculation considers both qualitative and quantitative risk factors. The quantitative risk factors include, but are not limited to, past due and nonperforming assets, adequacy of collateral, changes in underwriting standings or lending procedures and policies, specific internal analysis of loans requiring special attention and the nature and volume of loans. Qualitative risk factors include, but are not limited to, local and regional business conditions and other economic factors.
The following table shows the allocation of the allowance for loan losses by loan type as of December 31, 2010, 2009, and 2008.
|
At December 31,
|
|||||||||||||||||||||||||||||||||
|
2010
|
2009
|
2008 | |||||||||||||||||||||||||||||||
| Percent of |
Percent of
|
Percent of |
Percent of
|
Percent of | Percent of | ||||||||||||||||||||||||||||
|
Allowance
|
Allowance to |
loans in each
|
Allowance
|
Allowance to |
Loans in Each
|
Allowance | Allowance to | Loans in Each | |||||||||||||||||||||||||
|
for Loan
|
Total Allowance |
category to
|
for Loan
|
Total Allowance |
Category to
|
for Loan | Total Allowance | Category to | |||||||||||||||||||||||||
|
Losses
|
for Loan Losses |
Total loans
|
Losses
|
for Loan Losses |
Total Loans
|
Losses | for Loan Losses | Total Loans | |||||||||||||||||||||||||
|
(in thousands)
|
|||||||||||||||||||||||||||||||||
|
Real estate loans:
|
|||||||||||||||||||||||||||||||||
|
Construction and land development
|
$
|
977
|
11.7 | % | 11.4 |
%
|
$
|
1,176
|
14.9 | % |
13.3
|
%
|
$ | 315 | 4.9 | % | 15.2 | % | |||||||||||||||
|
Farmland
|
46 | 0.5 | % | 2.3 |
%
|
56
|
0.7 | % |
1.9
|
%
|
39 | 0.6 | % | 2.7 | % | ||||||||||||||||||
|
1 - 4 family residential
|
1,891 | 22.7 | % | 12.7 |
%
|
2,466
|
31.2 | % |
13.1
|
%
|
1,712 | 26.4 | % | 13.1 | % | ||||||||||||||||||
|
Multifamily
|
487 | 5.9 | % | 2.5 |
%
|
128
|
1.6 | % |
1.5
|
%
|
227 | 3.5 | % | 2.6 | % | ||||||||||||||||||
|
Non-farm non-residential
|
3,423 | 41.2 | % | 50.8 |
%
|
2,727
|
34.4 | % |
51.0
|
%
|
2,572 | 39.6 | % | 43.0 | % | ||||||||||||||||||
|
Non-real estate loans:
|
|||||||||||||||||||||||||||||||||
|
Agricultural
|
80 | 1.0 | % | 3.0 |
%
|
82
|
1.0 | % |
2.4
|
%
|
92 | 1.4 | % | 3.0 | % | ||||||||||||||||||
|
Commercial and industrial
|
510 | 6.1 | % | 13.3 |
%
|
1,031
|
13.0 | % |
13.9
|
%
|
1,119 | 17.3 | % | 17.4 | % | ||||||||||||||||||
|
Consumer and other
|
390 | 4.7 | % | 4.0 |
%
|
246
|
3.1 | % |
2.9
|
%
|
355 | 5.5 | % | 3.0 | % | ||||||||||||||||||
|
Unallocated
|
513 | 6.2 | % |
N/A
|
% |
7
|
0.1 | % |
N/A
|
51 | 0.8 | % | N/A | ||||||||||||||||||||
|
Total
|
$
|
8,317 | 100.0 | % |
100.0
|
%
|
$
|
7,919
|
100.0 | % |
100.0
|
%
|
$ | 6,482 | 100.0 | % | 100 | % | |||||||||||||||
- 35 -
The following table sets forth activity in our allowance for loan losses for the periods indicated.
| At or For the Years Ended December 31, | |||||||||||||||||||
| 2010 |
2009
|
2008
|
2007
|
2006
|
|||||||||||||||
| (in thousands) | |||||||||||||||||||
|
Balance at beginning of period
|
$ | 7,919 |
$
|
6,482
|
$
|
6,193
|
$
|
6,675
|
$
|
7,597
|
|||||||||
|
Charge-offs:
|
|||||||||||||||||||
|
Real estate loans:
|
|||||||||||||||||||
|
Construction and land development
|
(5 | ) |
(448
|
)
|
(166
|
)
|
(386
|
)
|
(5,008
|
)
|
|||||||||
|
Farmland
|
- |
-
|
(10
|
)
|
(123
|
)
|
-
|
||||||||||||
|
1 - 4 family residential
|
(1,534 | ) |
(564
|
)
|
(260
|
)
|
(639
|
)
|
(59
|
)
|
|||||||||
|
Multifamily
|
- |
-
|
-
|
-
|
-
|
||||||||||||||
|
Non-farm non-residential
|
(235 | ) |
(586
|
)
|
(256
|
)
|
(1,901
|
)
|
(208
|
)
|
|||||||||
|
Commercial and industrial loans
|
(3,395 | ) |
(678
|
)
|
(561
|
)
|
(273
|
)
|
(301
|
)
|
|||||||||
|
Consumer and other
|
(444 | ) |
(603
|
)
|
(360
|
)
|
(563
|
)
|
(312
|
)
|
|||||||||
|
Total charge-offs
|
(5,613 | ) |
(2,879
|
)
|
(1,613
|
)
|
(3,885
|
)
|
(5,888
|
)
|
|||||||||
|
Recoveries:
|
|||||||||||||||||||
|
Real estate loans:
|
|||||||||||||||||||
|
Construction and land development
|
1 |
1
|
2
|
779
|
39
|
||||||||||||||
|
Farmland
|
- |
1
|
-
|
14
|
-
|
||||||||||||||
|
1 - 4 family residential
|
11 |
15
|
10
|
14
|
25
|
||||||||||||||
|
Multifamily
|
- |
-
|
-
|
-
|
-
|
||||||||||||||
|
Non-farm non-residential
|
30 |
-
|
57
|
4
|
40
|
||||||||||||||
|
Commercial and industrial loans
|
164 |
28
|
10
|
148
|
304
|
||||||||||||||
|
Consumer and other
|
151 |
116
|
189
|
201
|
139
|
||||||||||||||
|
Total recoveries
|
357 |
161
|
268
|
1,160
|
547
|
||||||||||||||
|
Net charge-offs
|
(5,256 | ) |
(2,718
|
)
|
(1,345
|
)
|
(2,725
|
)
|
(5,341
|
)
|
|||||||||
|
Provision for loan losses
|
5,654 |
4,155
|
1,634
|
1,918
|
4,419
|
||||||||||||||
|
Additional provision from acquisition
|
- |
-
|
-
|
325
|
-
|
||||||||||||||
|
Balance at end of period
|
$ | 8,317 |
$
|
7,919
|
$
|
6,482
|
$
|
6,193
|
$
|
6,675
|
|||||||||
|
Ratios:
|
|||||||||||||||||||
|
Net loan charge-offs to average loans
|
0.89 | % |
0.45
|
%
|
0.22
|
%
|
0.50
|
%
|
1.06
|
%
|
|||||||||
|
Net loan charge-offs to loans at end of period
|
0.91 | % |
0.46
|
%
|
0.22
|
%
|
0.47
|
%
|
1.05
|
%
|
|||||||||
|
Allowance for loan losses to loans at end of period
|
1.44 | % |
1.34
|
%
|
1.07
|
%
|
1.08
|
%
|
1.32
|
%
|
|||||||||
|
Net loan charge-offs to allowance for loan losses
|
63.20 | % |
34.32
|
%
|
20.75
|
%
|
44.00
|
%
|
80.01
|
%
|
|||||||||
|
Net loan charge-offs to provision charged to expense
|
92.96 | % |
65.42
|
%
|
82.32
|
%
|
142.04
|
%
|
120.86
|
%
|
|||||||||
- 36 -
Investment Securities Portfolio. The securities portfolio totaled $482.0 million at December 31, 2010 and consisted principally of U.S. Government agency securities, corporate debt securities, mutual funds or other equity securities and municipal bonds. The portfolio provides us with a relatively stable source of income and provides a balance to interest rate and credit risks as compared to other categories of the balance sheet.
U.S. Government Agency, also known as Government Sponsored Enterprises (GSEs), are privately owned but federally chartered companies. While they enjoy certain competitive advantages as a result of their government charters, their debt obligations are unsecured and are not direct obligations of the U.S. Government. However, debt securities issued by GSEs are considered to be of high credit quality and the senior debt of GSEs is AAA rated. GSEs raise funds through a variety of debt issuance programs, including:
-
Federal Home Loan Mortgage Corporation (Freddie Mac)
-
Federal National Mortgage Association (Fannie Mae)
-
Federal Home Loan Bank (FHLB)
-
Federal Farm Credit Bank System (FFCB)
With the variety of GSE-issued debt securities and programs available, investors may benefit from a unique combination of high credit quality, liquidity, pricing transparency and cash flows that can be customized to closely match their objectives.
Corporate bonds are fully taxable debt obligations issued by corporations. These bonds fund capital improvements, expansions, debt refinancing or acquisitions that require more capital than would ordinarily be available from a single lender. Corporate bond rates are set according to prevailing interest rates at the time of the issue, the credit rating of the issuer, the length of the maturity and the other terms of the bond, such as a call feature. Corporate bonds have historically been one of the highest yielding of all taxable debt securities. Interest can be paid monthly, quarterly or semi-annually. There are five main sectors of corporate bonds: industrials, banks/finance, public utilities, transportation, and Yankee and Canadian bonds.
- 37 -
The secondary market for corporate bonds is fairly liquid. Therefore, an investor who wishes to sell a corporate bond will often be able to find a buyer for the security at market prices. However, the market price of a bond might be significantly higher or lower than its face value due to fluctuations in interest rates and other price determining factors.
Other factors include credit risk, market risk, even risk, call risk, make-whole call risk and inflation risk.
Mutual funds are a professionally managed type of collective investment scheme that pools money from many investors and invests it in stocks, bonds, short-term money market instruments, and/or other securities. The mutual fund will have a fund manager that trades the pooled money on a regular basis. Mutual funds allow investors spread their investment around widely. That makes it much less risky than investing in one or two stocks.
An equity security is a share in the capital stock of a company (typically common stock, although preferred equity is also a form of capital stock). The holder of an equity security is a shareholder, owning a share, or fractional part of the issuer. Unlike debt securities, which typically require regular payments (interest) to the holder, equity securities are not entitled to any payment. In bankruptcy, they share only in the residual interest of the issuer after all obligations have been paid out to creditors. However, equity generally entitles the holder to a pro rata portion of control of the company, meaning that a holder of a majority of the equity is usually entitled to control the issuer. Equity also enjoys the right to profits and capital gain, whereas holders of debt securities receive only interest and repayment of principal regardless of how well the issuer performs financially. Furthermore, debt securities do not have voting rights outside of bankruptcy. In other words, equity holders are entitled to the "upside" of the business and to control the business.
Equity securities may include, but not be limited to: bank stock, bank holding company stock, listed stock, savings and loan association stock, savings and loan association holding company stock, subsidiary structured as limited liability company, subsidiary structured as limited partnership, limited liability company and unlisted stock.
Equity securities are generally traded on either one of the listed stock exchanges, including NASDAQ or an over-the-counter market. The market value of equity shares is influenced by prevailing economic conditions such as the company’s performance (ie. earnings) supply and demand and interest rates.
A municipal bond is a bond issued by a city or other local government, or their agencies. Potential issuers of municipal bonds include cities, counties, redevelopment agencies, special-purpose districts, school districts, public utility districts, publicly owned airports and seaports, and any other governmental entity (or group of governments) below the state level. Municipal bonds may be general obligations of the issuer or secured by specified revenues. Interest income received by holders of municipal bonds is often exempt from the federal income tax and from the income tax of the state in which they are issued, although municipal bonds issued for certain purposes may not be tax exempt.
At December 31, 2010, $11.7 million or 2.4% of our securities (excluding Federal Home Loan Bank of Dallas stock) were scheduled to mature in less than one year and securities with maturity dates 10 years and over totaled 26.9% of the total portfolio. The average maturity of the securities portfolio was 6.5 years.
At December 31, 2010, securities totaling $322.1 million were classified as available for sale and $159.8 million were classified as held to maturity, compared to $249.5 million classified as available for sale and $12.3 million classified as held to maturity at December 31, 2009.
In the second quarter of 2010, the Company sold the $12.1 million that remained in the held to maturity category. This represented approximately 4.0% of the total investment portfolio and 1.0% of assets. Several of the securities sold included mortgage backed securities and agency bullet securities which were no longer part of Management's investment portfolio strategy. During the third quarter of 2010, the Company experienced significant deposit growth but decreased loan demand. Deposits grew approximately $123.0 million or 14.0% from June 30, 2010 to December 31, 2010. Net loans declined $38.0 million or 6.0% during the same period. Investment securities increased $142.0 million or 42% from June 30, 2010 to December 31, 2010. Market conditions continued to be historically volatile and interest rates declined to levels not seen in decades.
Given the changes in the Company’s balance sheet observed during the third quarter and following the completion of a five year strategic plan, certain agency securities purchased pursuant to this plan were classified as held to maturity. The Company determined the unprecedented market conditions and volatility coupled with a revised five year strategic plan that a waiting period of one quarter was appropriate based on the materiality conditions and the type of securities in the held to maturity portfolio sold during the second quarter of 2010.
The held to maturity portfolio is comprised of government sponsored enterprise securities such as FHLB, FNMA, FHLMC, and FFCB. The securities have maturities of 15 years or less and the securities are used to collateralize public funds. The Company has maintained public funds in excess of $175.0 million since December 2007. Management believes that public funds will continue to be a significant part of the Company's deposit base and will need to be collateralized by securities in the investment portfolio.
- 38 -
Management believes that the Company has both the intent and ability to hold to maturity the $159.8 million in securities placed in this category. Management has modeled the investment portfolio for liquidity risks and believes that the Company has the ability under multiple interest rate scenarios to hold the portfolio to maturity.
Securities classified as available for sale are measured at fair market value and securities classified as held to maturity are measured at book value. The Company obtains fair value measurements from an independent pricing service to value securities classified as available for sale. The fair value measurements consider observable data that may include dealer quotes, market spreads, cash flows, market yield curves, prepayment speeds, credit information and the instrument’s contractual terms and conditions, among other things. For more information on securities and fair market value see Notes 3 and 21 to the Consolidated Financial Statements.
Total net securities gains were $2.8 million of which net AFS gains totaled $2.4 million and net HTM gains totaled $0.4 million at December 31, 2010. Securities classified as available for sale had gross unrealized gains totaling $5.1 million at December 31, 2010, which includes $0.2 million in unrealized gains on agency securities, $4.8 million in unrealized gains on corporate bonds and $20,000 in unrealized gains on mutual funds or other equity securities. Securities classified as available for sale had gross unrealized losses totaling $5.5 million at December 31, 2010, which includes $4.0 million in unrealized losses on agency securities, $1.3 million in unrealized losses on corporate bonds and $0.1 million in unrealized losses on mutual funds or other equity securities. Securities classified as held to maturity had gross unrealized losses totaling $4.5 million at December 31, 2010. There were no held to maturity securities with unrealized gains as of December 31, 2010. At December 31, 2009, securities classified as available for sale had gross unrealized losses totaling $2.8 million.
All agency securities have been in a loss position for less than 12 months. The Company had fifty-seven U.S. Government agency securities, one-hundred fifty-six corporate debt securities and one municipal that had gross unrealized losses for less than 12 months. The Company had thirteen corporate debt securities and two equity securities which have been in a continuous unrealized loss position for 12 months or longer. The Company believes that it will collect all amounts contractually due and has the intent and the ability to hold these securities until the fair value is at least equal to the carrying value. Management periodically assesses the quality of our investment holdings using procedures similar to those used in assessing the credit risks inherent in the loan portfolio.
At December 31, 2010, it is Management’s opinion that we held no investment securities which bear a greater than the normal amount of credit risk as compared to similar investments and that no securities had an amortized cost greater than their recoverable value. See Notes 3 and 21 to the Consolidated Financial Statements for additional information.
Average securities as a percentage of average interest-earning assets were 35.5% for the year December 31, 2010 and 27.1% for the year ended December 31, 2009. All securities held at December 31, 2010 qualified as pledgeable securities, except $138.5 million of debt securities and $6.0 million of equity securities. Securities pledged at December 31, 2010 totaled $271.5 million.
The following tables set forth the composition of our investment securities portfolio (excluding Federal Home Loan Bank of Dallas stock) at the dates indicated.
|
December 31, 2010
|
December 31, 2009
|
||||||||||||||||||||||||||||||
|
Gross
|
Gross
|
Gross
|
Gross
|
||||||||||||||||||||||||||||
|
Amortized
|
Unrealized
|
Unrealized
|
Fair
|
Amortized
|
Unrealized
|
Unrealized
|
Fair
|
||||||||||||||||||||||||
|
Cost
|
Gains
|
Losses
|
Value
|
Cost
|
Gains
|
Losses
|
Value
|
||||||||||||||||||||||||
|
(in thousands)
|
|||||||||||||||||||||||||||||||
|
Available for sale:
|
|||||||||||||||||||||||||||||||
|
U.S. Government Agencies
|
$
|
172,958
|
$
|
242
|
$
|
(3,982
|
)
|
$
|
169,218
|
$
|
140,843
|
$
|
382
|
$
|
(1,562)
|
$
|
139,663
|
||||||||||||||
|
Mortgage-backed obligations
|
-
|
-
|
-
|
-
|
1,472
|
104
|
-
|
|
1,576
|
||||||||||||||||||||||
|
Asset-backed securities
|
-
|
-
|
-
|
-
|
-
|
8
|
-
|
|
8
|
||||||||||||||||||||||
|
Corporate debt securities
|
138,925
|
4,804
|
(1,331
|
)
|
142,398
|
92,414
|
5,648
|
(1,086
|
)
|
96,976
|
|||||||||||||||||||||
|
Mutual funds or other equity securities
|
1,250
|
20
|
(132
|
)
|
1,138
|
1,380
|
62
|
(185
|
)
|
1,257
|
|||||||||||||||||||||
|
Municipal bonds
|
9,388
|
-
|
(14
|
) |
9,374
|
10,000
|
-
|
-
|
10,000
|
||||||||||||||||||||||
|
Total available for sale securities
|
$
|
322,521
|
$
|
5,066
|
$
|
(5,459
|
)
|
$
|
322,128
|
$
|
246,109
|
$
|
6,204
|
$
|
(2,833
|
)
|
$
|
249,480
|
|||||||||||||
|
Held to maturity:
|
|||||||||||||||||||||||||||||||
|
U.S. Government Agencies
|
$
|
159,833
|
$
|
-
|
$
|
(4,507
|
) |
$
|
155,326
|
$
|
10,721
|
$
|
52
|
$
|
-
|
$
|
10,773
|
||||||||||||||
|
Mortgage-backed obligations
|
-
|
-
|
-
|
-
|
1,628
|
61
|
-
|
|
1,689
|
||||||||||||||||||||||
|
Total held to maturity securities
|
$
|
159,833
|
$
|
-
|
$
|
(4,507
|
) |
$
|
155,326
|
$
|
12,349
|
$
|
113
|
$
|
-
|
|
$
|
12,462
|
|||||||||||||
- 39 -
During 2010, the Company did not recognize any other than temporary impairment on securities.
During 2009, the evaluation of securities with continuous unrealized losses indicated that there was a credit loss evident on one corporate bond and it was determined that this investment was other-than-temporarily impaired. In addition, three asset-backed securities were deemed to be other-than-temporarily impaired. The Company recorded other than-temporary impairment charges on these securities totaling $829,000 before tax, $547,000 after tax, for the year ended December 31, 2009. An other-than-temporary impairment charge was taken on 12 securities totaling $4.6 million in 2008.
The Company did not recognize any other impairment charges in 2009 or 2008 other than those stated above
Investment Portfolio Maturities and Yields. The composition and maturities of the investment securities portfolio at December 31, 2010 are summarized in the following table. Maturities are based on the final contractual payment dates, and do not reflect the impact of prepayments or early redemptions that may occur.
|
More than One Year
|
More than Five Years
|
|||||||||||||||||||||||||||||||
|
One Year or Less
|
through Five Years
|
through Ten Years
|
More than Ten Years
|
|||||||||||||||||||||||||||||
|
Weighted
|
Weighted
|
Weighted
|
Weighted
|
|||||||||||||||||||||||||||||
|
Amortized
|
Average
|
Amortized
|
Average
|
Amortized
|
Average
|
Amortized
|
Average
|
|||||||||||||||||||||||||
|
Cost
|
Yield
|
Cost
|
Yield
|
Cost
|
Yield
|
Cost
|
Yield
|
|||||||||||||||||||||||||
|
(in thousands)
|
||||||||||||||||||||||||||||||||
|
Available for sale:
|
||||||||||||||||||||||||||||||||
|
U.S. Government agencies
|
$
|
-
|
-
|
$
|
13,999
|
2.19
|
%
|
$
|
78,975
|
3.29
|
%
|
$
|
79,984
|
3.79
|
%
|
|||||||||||||||||
|
Corporate debt securities
|
10,562
|
6.72
|
%
|
48,385
|
6.17
|
%
|
75,578
|
4.71
|
%
|
4,400
|
7.78
|
%
|
||||||||||||||||||||
|
Mutual funds or other equity securities
|
-
|
-
|
-
|
-
|
-
|
-
|
1,250
|
2.82
|
%
|
|||||||||||||||||||||||
|
Municipal bonds
|
872
|
0.78
|
% |
3,496
|
0.79
|
% |
3,628
|
0.86
|
% |
1,392
|
5.77
|
%
|
||||||||||||||||||||
|
Total available for sale securities
|
$
|
11,434
|
6.21
|
%
|
$
|
65,880
|
5.00
|
%
|
$
|
158,181
|
3.89
|
%
|
$
|
87,026
|
4.01
|
%
|
||||||||||||||||
| Held to maturity: | ||||||||||||||||||||||||||||||||
|
U.S. Government agencies
|
$ | - | - | $ | 7,968 | 2.37 | % | $ | 106,876 | 2.75 | % | $ | 44,989 | 3.54 | % | |||||||||||||||||
| Total held to maturity securities | $ | - | - | $ | 7,968 | 2.37 | % | $ | 106,876 | 2.75 | % | $ | 44,989 | 3.54 | % | |||||||||||||||||
|
Total Securities
|
||||||||||||
|
Weighted
|
||||||||||||
|
Amortized
|
Average
|
|||||||||||
|
Cost
|
Fair Value
|
Yield
|
||||||||||
|
(in thousands)
|
||||||||||||
|
Available for sale:
|
||||||||||||
|
U.S. Government agencies
|
$
|
172,958
|
$
|
169,218
|
3.43
|
%
|
||||||
|
Corporate debt securities
|
138,925
|
142,398
|
5.47
|
%
|
||||||||
|
Mutual funds or other equity securities
|
1,250
|
1,138
|
2.82
|
%
|
||||||||
|
Municipal bonds
|
9,388
|
9,374
|
1.55
|
%
|
||||||||
|
Total available for sale securities
|
$
|
322,521
|
$
|
322,128
|
4.23
|
%
|
||||||
|
|
||||||||||||
| Held to maturity: | ||||||||||||
| U.S. Government agencies | $ | 159,833 | $ | 155,326 | 2.95 | % | ||||||
| Total held to maturity securities | $ | 159,833 | $ | 155,326 | 2.95 | % | ||||||
- 40 -
Deposits. The following table sets forth the distribution of our total deposit accounts, by account type, for the periods indicated.
|
December 31,
|
||||||||||||||||||||||||||||||||||||
|
2010
|
2009
|
2008
|
||||||||||||||||||||||||||||||||||
|
(in thousands)
|
||||||||||||||||||||||||||||||||||||
|
Balance
|
As % of Total
|
Wtd Avg Rate
|
Balance
|
As % of Total
|
Wtd Avg Rate
|
Balance
|
As % of Total
|
Wtd Avg Rate
|
||||||||||||||||||||||||||||
|
Noninterest-bearing demand
|
$
|
130,897
|
13.0
|
%
|
0.0
|
%
|
$
|
131,818
|
16.5
|
%
|
0.0
|
%
|
$
|
118,255
|
15.2
|
%
|
0.0
|
%
|
||||||||||||||||||
|
Interest-bearing demand
|
192,139
|
19.1
|
%
|
0.5
|
%
|
188,252
|
23.5
|
%
|
0.6
|
%
|
180,230
|
23.1
|
%
|
1.4
|
%
|
|||||||||||||||||||||
|
Savings
|
46,663
|
4.6
|
%
|
0.1
|
%
|
40,272
|
5.0
|
%
|
0.2
|
%
|
41,357
|
5.3
|
%
|
0.4
|
%
|
|||||||||||||||||||||
|
Time
|
637,684
|
63.3
|
%
|
2.3
|
%
|
439,404
|
55.0
|
%
|
2.8
|
%
|
440,530
|
56.4
|
%
|
3.6
|
%
|
|||||||||||||||||||||
|
Total deposits
|
$
|
1,007,383
|
100.0
|
%
|
$
|
799,746
|
100.0
|
%
|
$
|
780,372
|
100.0
|
%
|
||||||||||||||||||||||||
As of December 31, 2010, the aggregate amount of outstanding certificates of deposit in amounts greater than or equal to $100,000 was approximately $420.1 million. The following table sets forth the maturity of those certificates as of December 31, 2010, 2009 and 2008.
|
December 31,
|
||||||||||||||||||||||||
|
2010
|
2009
|
2008
|
||||||||||||||||||||||
|
Weighted
|
Weighted
|
Weighted
|
||||||||||||||||||||||
|
Average
|
Average
|
Average
|
||||||||||||||||||||||
|
Balance
|
Rate
|
Balance
|
Rate
|
Balance
|
Rate
|
|||||||||||||||||||
|
(in thousands)
|
||||||||||||||||||||||||
|
Due in one year or less
|
$
|
209,979
|
1.32
|
%
|
$
|
234,685
|
1.71
|
%
|
$
|
163,375
|
2.10
|
%
|
||||||||||||
|
Due after one year through three years
|
189,833
|
2.56
|
%
|
19,930
|
3.89
|
%
|
57,431
|
4.04
|
%
|
|||||||||||||||
|
Due after three years
|
20,331
|
3.51
|
%
|
16,577
|
4.91
|
%
|
26,944
|
4.19
|
%
|
|||||||||||||||
|
Total
|
$
|
420,143
|
1.99
|
%
|
$
|
271,192
|
2.06
|
%
|
$
|
247,750
|
2.78
|
%
|
||||||||||||
Borrowings. The following table sets forth information concerning balances and interest rates on all of our short-term borrowings at the dates and for the periods indicated.
|
December 31,
|
||||||||||||
|
2010
|
2009
|
2008
|
||||||||||
|
(in thousands)
|
||||||||||||
|
Outstanding at year end
|
$
|
12,589
|
$
|
11,929
|
$
|
9,767
|
||||||
|
Maximum month-end outstanding
|
30,465
|
26,372
|
41,321
|
|||||||||
|
Average daily outstanding
|
13,086
|
18,233
|
11,379
|
|||||||||
|
Weighted average rate during the year
|
0.21
|
%
|
0.81
|
%
|
2.16
|
%
|
||||||
|
Average rate at year end
|
0.21
|
%
|
0.23
|
%
|
0.19
|
%
|
||||||
At December 31, 2010, all long-term debt from FHLB advances had been repaid.
- 41 -
Stockholders’ Equity and Return on Equity and Assets. Stockholders’ equity provides a source of permanent funding, allows for future growth and the ability to absorb unforeseen adverse developments. At December 31, 2010, stockholders’ equity totaled $97.9 million compared to $94.9 million at December 31, 2009.
Information regarding performance and equity ratios is as follows:
|
December 31,
|
|||
|
2010
|
2009
|
2008
|
|
|
Return on average assets
|
0.99%
|
0.80%
|
0.69%
|
|
Return on average common equity
|
12.65%
|
10.84%
|
8.13%
|
|
Dividend payout ratio
|
40.94%
|
50.82%
|
64.53%
|
On August 28, 2009, the Company entered into a Letter Agreement, which includes a Securities Purchase Agreement and a Side Letter Agreement (together, the “Purchase Agreement”), with the United States Department of the Treasury (“Treasury Department”) pursuant to which the Company has issued and sold to the Treasury Department 2,069.9 shares of the Company’s Fixed Rate Cumulative Perpetual Preferred Stock, Series A, par value $1,000 per share for a total purchase price of $20.7 million. In addition to the issuance of the Series A Stock, as a part of the transaction, the Company issued to the Treasury Department a warrant to purchase 114.44444 shares of the Company’s Fixed Rate Cumulative Preferred Stock, Series B, and immediately following the issuance of the Series A stock, the Treasury Department exercised its rights and acquired 103 of the Series B shares through a cashless exercise. See Note 11 to the Consolidated Financial Statements for additional information.
Results of Operations for the Years Ended December 31, 2010 and 2009
Net Income. Net income for the year ended December 31, 2010 was $10.0 million, an increase of $2.4 million or 32.0%, from $7.6 million for the year ended December 31, 2009. Net income available to common shareholders for the year ended December 31, 2010 was $8.7 million, an increase of $1.7 million from the $7.0 million for the year ended December 31, 2009. The increase in income can be largely attributed to an increase of $4.0 million in securities interest income as well as a year over year reduction of $1.6 million in interest expense. Net interest income increased by $5.8 million and the provision for loan losses increased $1.5 million. In addition, net gains on sales of securities increased $0.8 million from $2.1 million in 2009 to $2.8 million in 2010 as well as no loss from impaired securities in 2010 compared to a $0.8 million loss in 2009. Noninterest expense increased $2.8 million primarily from increased salaries expense as well as an increase in other expenses which include: professional fees, data processing, advertising, insurance, travel, depreciation, sales and franchise tax as well as tax on capital. Income tax expense increased by $1.5 million due to the increase in net income. Earnings per common share for the year ended December 31, 2010 was $1.56 per common share, an increase of 23.8% or $0.30 per common share from $1.26 per common share for the year ended December 31, 2009.
Net Interest Income. Net interest income is the largest component of our earnings. It is calculated by subtracting the cost of interest-bearing liabilities from the income earned on interest-earning assets and represents the earnings from our primary business of gathering deposits and making loans and investments. Our long-term objective is to manage this income to provide the largest possible amount of income while balancing interest rate, credit and liquidity risks.
A financial institution’s asset and liability structure is substantially different from that of an industrial company, in that virtually all assets and liabilities are monetary in nature. Accordingly, changes in interest rates, which are generally impacted by inflation rates, may have a significant impact on a financial institution’s performance. The impact of interest rate changes depends on the sensitivity to change of our interest-earning assets and interest-bearing liabilities. The effects of the changing interest rate environment in recent years and our interest sensitivity position are discussed below.
Net interest income in 2010 was $38.2 million, an increase of $5.8 million or 18.0%, when compared to $32.3 million in 2009. Loans are our largest interest-earning asset, and 62.3% of our total loans are floating rate loans which are primarily tied to the prime lending rate. After the prime rate dropped 400 basis points in 2008, Management began adding floors to floating rate loans. Loans which have floors greater than the rate due under the variable rate provision are considered fixed rate loans until such time that the floors equals the rate due under the variable rate provision. The loan floors were the first step to managing the net interest income and have continued into 2010 as well as continuing to build the investment portfolio. The cost of our interest-bearing liabilities was positively impacted by the reduction all cost of funds paid on interest-bearing liabilities. As of December 31, 2010, time deposits represented 63.3% of our total deposits, which is an increase from 54.9% of total deposits at December 31, 2009.
Comparing 2010 to 2009, the average yield on interest-earning assets increased by 0.12% and the average rate paid on interest-bearing liabilities decreased by 0.30%. The net yield on interest-earning assets was 4.0% for the year ended December 31, 2010, compared to 3.6% for 2009.
The net interest income yield shown below in the average balance sheet is calculated by dividing net interest income by average interest-earning assets and is a measure of the efficiency of the earnings from balance sheet activities. It is affected by changes in the difference between interest on interest-earning assets and interest-bearing liabilities and the percentage of interest-earning assets funded by interest-bearing liabilities.
- 42 -
The following tables set forth average balance sheets, average yields and costs, and certain other information for the periods indicated. No tax-equivalent yield adjustments were made, as the effect thereof was not material. All average balances are daily average balances. Non-accrual loans were included in the computation of average balances, but have been reflected in the table as loans carrying a zero yield. The yields set forth below include the effect of deferred fees, discounts and premiums that are amortized or accreted to interest income or expense.
|
Years Ended December 31,
|
|||||||||||
|
2010
|
2009
|
2008
|
|||||||||
|
Average
|
Yield/
|
Average
|
Yield/
|
Average
|
Yield/
|
||||||
|
Balance
|
Interest
|
Rate
|
Balance
|
Interest
|
Rate
|
Balance
|
Interest
|
Rate
|
|||
|
(in thousands)
|
|||||||||||
|
Assets
|
|||||||||||
|
Interest-earning assets:
|
|||||||||||
|
Interest-earning deposits with banks (1)
|
$ 16,923
|
$ 41
|
0.2%
|
$ 35,800
|
$ 388
|
1.1%
|
$ 5,725
|
$ 224
|
3.9%
|
||
|
Securities (including FHLB stock)
|
342,589
|
15,043
|
4.4%
|
245,952
|
11,085
|
4.5%
|
127,586
|
6,594
|
5.2%
|
||
|
Federal funds sold
|
11,007
|
13
|
0.1%
|
24,662
|
34
|
0.1%
|
17,247
|
392
|
2.3%
|
||
|
Loans held for sale
|
91
|
5
|
5.5%
|
135
|
7
|
5.1%
|
681
|
45
|
6.6%
|
||
|
Loans, net of unearned income
|
593,429
|
36,288
|
6.1%
|
599,609
|
35,677
|
6.0%
|
600,854
|
40,406
|
6.7%
|
||
|
Total interest-earning assets
|
964,039
|
51,390
|
5.3%
|
906,158
|
47,191
|
5.2%
|
752,093
|
47,661
|
6.3%
|
||
|
Noninterest-earning assets:
|
|||||||||||
|
Cash and due from banks
|
17,961
|
17,775
|
22,468
|
||||||||
|
Premises and equipment, net
|
16,662
|
16,175
|
15,960
|
||||||||
|
Other assets
|
17,019
|
8,448
|
6,503
|
||||||||
|
Total
|
$ 1,015,681
|
$ 51,390
|
$ 948,556
|
$ 47,191
|
$ 797,024
|
$ 47,661
|
|||||
|
Liabilities and Stockholders' Equity
|
|||||||||||
|
Interest-bearing liabilities:
|
|||||||||||
|
Demand deposits
|
$ 185,195
|
$ 846
|
0.5%
|
$ 203,467
|
$ 1,179
|
0.6%
|
$ 197,822
|
$ 2,798
|
1.4%
|
||
|
Savings deposits
|
43,544
|
42
|
0.1%
|
41,747
|
98
|
0.2%
|
43,631
|
193
|
0.4%
|
||
|
Time deposits
|
529,181
|
12,218
|
2.3%
|
479,255
|
13,310
|
2.8%
|
346,282
|
12,432
|
3.6%
|
||
|
Borrowings
|
27,324
|
117
|
0.4%
|
22,907
|
257
|
1.1%
|
16,287
|
458
|
2.8%
|
||
|
Total interest-bearing liabilities
|
785,244
|
13,223
|
1.7%
|
747,376
|
14,844
|
2.0%
|
604,022
|
15,881
|
2.6%
|
||
|
Noninterest-bearing liabilities:
|
|||||||||||
|
Demand deposits
|
125,520
|
117,805
|
119,379
|
||||||||
|
Other
|
5,343
|
6,240
|
5,854
|
||||||||
|
Total liabilities
|
916,107
|
13,223
|
871,421
|
14,844
|
729,255
|
15,881
|
|||||
|
Stockholders' equity
|
99,574
|
77,135
|
67,769
|
||||||||
|
Total
|
$ 1,015,681
|
13,223
|
$ 948,556
|
14,844
|
$ 797,024
|
15,881
|
|||||
|
Net interest income
|
$ 38,167
|
$ 32,347
|
$ 31,780
|
||||||||
|
Net interest rate spread (2)
|
3.6%
|
3.2%
|
3.7%
|
||||||||
|
Net interest-earning assets (3)
|
$ 178,795
|
$ 158,782
|
$ 148,071
|
||||||||
|
Net interest margin (4)
|
4.0%
|
3.6%
|
4.2%
|
||||||||
|
Average interest-earning assets to
|
|||||||||||
|
interest-bearing liabilities
|
122.8%
|
121.2%
|
124.5%
|
||||||||
(1) Interest-earning deposits with banks include reserves kept with the Federal Reserve Bank that are classified on
the balance sheet as "cash and due from banks". The reserves are not classified as interest-earning demand deposits
on the balance sheet because interest is only paid on amounts in excess of minimum reserve requirements.
(2) Net interest rate spread represents the difference between the yield on average interest-earning assets and the cost
of average interest-bearing liabilities.
(3) Net interest-earning assets represents total interest-earning assets less total interest-bearing liabilities.
(4) Net interest margin represents net interest income divided by average total interest-earning assets.
- 43 -
Rate/Volume Analysis. The following table presents the dollar amount of changes in interest income and interest expense for major components of interest-earning assets and interest-bearing liabilities for the periods indicated. The table distinguishes between (i) changes attributable to rate (change in rate multiplied by the prior period’s volume), (ii) changes attributable to volume (changes in volume multiplied by the prior period’s rate), (iii) mixed changes (changes that are not attributable to either rate of volume) and (iv) total increase (decrease) (the sum of the previous columns).
|
Years Ended December 31,
|
|||||||||||||||||
|
2010 Compared to 2009
|
2009 Compared to 2008
|
||||||||||||||||
|
Increase (Decrease) Due To
|
Increase (Decrease) Due To
|
||||||||||||||||
|
Rate/
|
Increase/ |
Rate/
|
Increase/
|
||||||||||||||
|
Volume
|
Rate
|
Volume
|
Decrease |
Volume
|
Rate
|
Volume
|
Decrease
|
||||||||||
|
(in thousands)
|
|||||||||||||||||
|
Interest earned on:
|
|||||||||||||||||
|
Interest-earning deposits with banks
|
$ (204
|
) |
$ (301
|
) |
$ 158
|
$ (347
|
) |
$ 1,177
|
$ (162
|
) |
$ (851
|
) |
$ 164
|
||||
|
Securities (including FHLB stock)
|
4,355
|
(285
|
) |
(112
|
) |
3,958
|
6,118
|
(844
|
) |
(783
|
) |
4,491
|
|||||
|
Federal funds sold
|
(19
|
) |
(5
|
) |
3
|
(21
|
) |
169
|
(368
|
) |
(159
|
) |
(358
|
) | |||
|
Loans held for sale
|
(2
|
) |
-
|
-
|
(2
|
) |
(36
|
) |
(10
|
) |
8
|
(38
|
) | ||||
|
Loans, net of unearned income
|
(368
|
) |
989
|
(10
|
) |
611
|
(84
|
) |
(4,655
|
) |
10
|
(4,729
|
) | ||||
|
Total interest income
|
3,762
|
398
|
39
|
4,199
|
7,344
|
(6,039
|
) |
(1,775
|
) |
(470
|
) | ||||||
|
Interest paid on:
|
|||||||||||||||||
|
Demand deposits
|
(106
|
) |
(249
|
) |
22
|
(333
|
) |
80
|
(1,652
|
) |
(47
|
) |
(1,619
|
) | |||
|
Savings deposits
|
4
|
(58
|
) |
(2
|
) |
(56
|
) |
(8
|
) |
(91
|
) |
4
|
(95
|
) | |||
|
Time deposits
|
1,387
|
(2,245
|
) |
(234
|
) |
(1,092
|
) |
4,774
|
(2,816
|
) |
(1,080
|
) |
878
|
||||
|
Borrowings
|
50
|
(159
|
) |
(31
|
) |
(140
|
) |
186
|
(275
|
) |
(112
|
) |
(201
|
) | |||
|
Total interest expense
|
1,335
|
(2,711
|
) |
(245
|
) |
(1,621
|
) |
5,032
|
(4,834
|
) |
(1,235
|
) |
(1,037
|
) | |||
|
Change in net interest income
|
$ 2,427
|
$ 3,109
|
$ 284
|
$ 5,820
|
$ 2,312
|
$ (1,205
|
) |
$ (540
|
) |
$ 567
|
|||||||
Provision for Loan Losses. The provision for loan losses was $5.7 million and $4.2 million in 2010 and 2009, respectively. The increased 2010 provisions were attributable to $5.3 million in net loan charge-offs during 2010 compared to $2.7 million in 2009. Of the loan charge-offs in 2010, approximately $1.7 million were loans secured by real estate of which $0.2 million were commercial real estate and approximately $1.5 million were residential properties. The majority of the loan charge-offs in 2010 consisted of commercial and industrial loans which totaled $3.4 million. Recoveries for 2010 of $0.4 million were recognized on loans previously charged off as compared to $0.2 million in 2009.
Of the loan charge-offs during 2009, approximately $1.6 million were loans secured by real estate of which $0.6 million were commercial real estate and approximately $0.6 million were residential properties. The allowance for loan losses at December 31, 2010 was $8.3 million, compared to $7.9 million at December 31, 2009, and was 1.44% and 1.34% of total loans, respectively. Management believes that the current level of the allowance is adequate to cover losses in the loan portfolio given the current economic conditions, expected net charge-offs and nonperforming asset levels.
Noninterest Income. Noninterest income totaled $9.6 million in 2010, an increase of $2.4 million when compared to $7.1 million in 2009. Service charges, commissions and fees totaled $4.1 million for 2010 and were relatively unchanged when compared to 2009. Net securities gains were $2.8 million in 2010 compared to $2.1 million in 2009. There were no other-than-temporary impairment charges in 2010 compared to a charge of $0.8 million in 2009. Net gains on sale of loans were $0.3 million in 2010 and $0.4 million in 2009. Other noninterest income increased $1.0 million to $2.3 million in 2010 from $1.3 million in 2009. The increase in other noninterest income can be attributed to a $1.0 million gain on the sale of a facility that previously housed our Benton, LA branch prior to opening our new Benton facility in January 2010. This gain is partially offset by a donation of $0.7 million of the purchase price to the governmental entity that purchased the building. That donation is included in other non-interest expenses.
- 44 -
Noninterest Expense. Noninterest expense totaled $26.8 million in 2010 and $24.0 million in 2009. Salaries and benefits increased $1.0 million in 2010 to $11.8 million compared to $10.8 million in 2009. This can be partly explained by the total number of employees increasing from 230 full-time equivalent at December 31, 2009 to 246 at December 31, 2010; and partly due to the efforts of the Bank and its management team to attract and retain quality employees. Occupancy and equipment expense totaled $3.2 million and $2.9 million in 2010 and 2009, respectively. Regulatory assessment expense totaled $1.5 million in 2010 compared to $2.0 million in 2009. During the second quarter of 2009, a special assessment was imposed on all financial institutions. The 2009 special assessment for the Company totaled $0.4 million. For 2010 the net cost of other real estate and repossessions increased $0.5 million in 2010 to $0.9 million, when compared to $0.4 million in 2009. Other noninterest expense totaled $9.5 million in 2010, a increase of $1.6 million or 20.2% when compared to $7.9 million in 2009. This increase is largely due to an increase of $0.7 million in marketing and public relations, which is the result of a donation of $0.7 million of the purchase price to a government entity that purchased a building from the Bank, $0.5 million increase in professional fees relating to the acquisition of the Bank of Greensburg in Greensburg, LA, and an increase of $0.2 million in data processing expenses.
The following is a summary of the significant components of other noninterest expense:
|
Years Ended December 31,
|
||||||||||||
|
2010
|
2009
|
2008
|
||||||||||
|
(in thousands)
|
||||||||||||
|
Other noninterest expense:
|
||||||||||||
|
Legal and professional fees
|
$
|
1,791
|
$
|
1,254
|
$
|
1,496
|
||||||
|
Operating supplies
|
594
|
537
|
572
|
|||||||||
|
Marketing and public relations
|
1,426
|
809
|
1,131
|
|||||||||
|
Data processing
|
1,143
|
1,067
|
1,063
|
|||||||||
|
Travel and lodging
|
435
|
398
|
416
|
|||||||||
|
Taxes - sales and capital
|
620
|
529
|
571
|
|||||||||
|
Telephone
|
177
|
192
|
185
|
|||||||||
|
Amortization of core deposit intangibles
|
218
|
291
|
311
|
|||||||||
| Donations | 778 | 221 | 258 | |||||||||
| Regulatory assessment expense | 1,496 | 2,049 | 827 | |||||||||
| Net cost of other real estate and repossessions | 858 | 399 | 249 | |||||||||
|
Other
|
2,331
|
2,618
|
2,606
|
|||||||||
|
Total other expense
|
$
|
11,867
|
$
|
10,364
|
$
|
9,685
|
||||||
Total noninterest expense includes expenses paid to related parties. Related parties include the Company’s executive officers, directors and certain business organizations and individuals with which such persons are associated. During the years ended 2010 and 2009, the Company paid approximately $2.3 million and $2.2 million, respectively, for goods and services from related parties. See Note 14 to the Consolidated Financial Statements for additional information.
Income Taxes. The provision for income taxes for the years ended December 31, 2010, 2009, and 2008 was $5.2 million, $3.7 million, and $2.5 million respectively. The increase in the providion for income taxes is a result of higher income for 2010 when compared to 2009 and 2008. The Company's statutory tax rate was 34.2% which was relatively unchanged from 34.0% and 34.3% in 2009 and 2008 respectively.
Results of Operations for the Years Ended December 31, 2009 and 2008
Net Income. Net income for the year ended December 31, 2009 was $7.6 million, an increase of $2.1 million or 37.8%, from $5.5 million for the year ended December 31, 2008. Net income available to common shareholders for the year ended December 31, 2009 was $7.0 million, an increase of $1.5 million from the $5.5 million for the year ended December 31, 2008. The largest increase in net income resulted from an increase in securities interest income due to an increase in volume of securities owned. The second largest increase resulted from a $3.8 million decline in the amount of other-than-temporary impairment charges recorded on the securities portfolio. The 2009 other-than-temporary impairment charge was $0.8 million compared to a $4.6 million other-than-temporary impairment charge in 2008. In addition, net gains on sales of securities totaled $2.1 million for the period ended December 31, 2009 compared to net losses of $1,000 realized during the same period in 2008. Net interest income increased by $0.6 million and the provision for loan losses increased $2.5 million. Noninterest expense increased $0.8 million primarily from increased regulatory assessments but was offset by reduced legal and marketing expenses.
Earnings per common share for the year ended December 31, 2009 was $1.26 per common share, an increase of 27.0% or $0.27 per common share from $0.99 per common share for the year ended December 31, 2008.
- 45 -
Net Interest Income. Net interest income in 2009 was $32.3 million, an increase of $0.6 million or 1.8%, when compared to $31.8 million in 2008. Although the net interest margin declined from 2008 to 2009, increased volumes in interest-earning assets offset the decline in margins therefore increasing net interest income. Loans are our largest interest-earning asset, and 53.7% of our total loans are floating rate loans which are primarily tied to the prime lending rate. After the prime rate dropped 400 basis points in 2008, Management began adding floors to floating rate loans. Loans which have floors greater than the rate due under the variable rate provision are considered fixed rate loans until such time that the floors equals the rate due under the variable rate provision. The loan floors were the first step to managing the net interest income. Although the yield on securities also declined from 2008 to 2009, interest income was enhanced by increased volumes of securities. Management’s next focus was on the cost of funds. The cost of our interest-bearing liabilities was positively impacted by the reduction all cost of funds paid on interest-bearing liabilities. As of December 31, 2009, time deposits represented 54.9% of our total deposits, which is a decrease from 56.5% of total deposits at December 31, 2008.
Comparing 2009 to 2008, the average yield on interest-earning assets decreased by 110 basis points and the average rate paid on interest-bearing liabilities decreased by 60 basis points. The net yield on interest-earning assets was 3.6% for the year ended December 31, 2009, compared to 4.2% for 2008.
The leverage for the year ending December 31, 2009 and 2008 was 82.5% and 80.3%, respectively.
Provision for Loan Losses. The provision for loan losses was $4.2 million and $1.6 million in 2009 and 2008, respectively. The increased 2009 provisions were attributable to $2.7 million in net loan charge-offs during 2009 compared to $1.3 million in net loan charge-offs during 2008. Of the loan charge-offs in 2009, approximately $1.6 million were loans secured by real estate of which $0.4 million were construction and land development, $0.6 million were commercial real estate and approximately $0.6 million were residential properties. In 2009, recoveries of $0.2 million were recognized on loans previously charged off as compared to $0.3 million in 2008. Of the loan charge-offs during 2008, approximately $0.7 million were loans secured by real estate of which $0.3 million were commercial real estate and approximately $0.4 million were residential properties. The allowance for loan losses at December 31, 2009 was $7.9 million, compared to $6.5 million at December 31, 2008, and was 1.34% and 1.07% of total loans, respectively. Management believes that the current level of the allowance is adequate to cover losses in the loan portfolio given the current economic conditions, expected net charge-offs and nonperforming asset levels
Noninterest Income. Noninterest income totaled $7.1 million in 2009, an increase of $6.1 million when compared to $1.1 million in 2008. Service charges, commissions and fees totaled $4.1 million and $4.0 million for the years ended December 31, 2009 and 2008, respectively. Net securities gain were $2.1 million in 2009 compared to $1,000 in net securities losses in 2008. Other-than-temporary impairment charges totaling $0.8 million were taken on securities in 2009 compared to a charge of $4.6 million in 2008. Net gains on sale of loans were $422,000 in 2009 and $210,000 in 2008. Other noninterest income decreased $148,000 to $1.3 million in 2009 from $1.5 million in 2008.
.
- 46 -
Noninterest Expense. Noninterest expense totaled $24.0 million in 2009 and $23.2 million in 2008. Salaries and benefits remained relatively flat at $10.8 million in 2009 compared to $10.7 million in 2008. At December 31, 2009, 253 employees represented 230 full-time equivalent staff members as compared to 225 full-time equivalent staff members in 2008. Occupancy and equipment expense totaled $2.9 million in 2009 and 2008, respectively. Regulatory assessment expense totaled $2.0 million in 2009 compared to $0.8 million in 2008. During the second quarter of 2009, a special assessment was imposed on all financial institutions. The 2009 special assessment for the Company totaled $444,000. The net cost of other real estate and repossessions increased $150,000 in 2009 to $399,000, when compared to $249,000 in 2008. Other noninterest expense totaled $7.9 million in 2009, a decrease of $0.7 million or 8.1% when compared to $8.6 million in 2008.
Income Taxes. The provision for income taxes for the years ended December 31, 2009 and 2008 was $3.7 million and $2.5 million, respectively. The increased provision for income taxes in 2009 resulted from higher income recognized during 2009 when compared to 2008. The Company’s effective tax rate amounted to 32.9% and 30.9% during 2009 and 2008, respectively. The difference between the effective tax rate and the statutory tax rate primarily relates to variances in items that are non-taxable or non-deductible and various tax credits.
Asset/Liability Management and Market Risk
Asset/LiabilityManagement. Our asset/liability management (ALM) process consists of quantifying, analyzing and controlling interest rate risk (IRR) to maintain reasonably stable net interest income levels under various interest rate environments. The principal objective of ALM is to maximize net interest income while operating within acceptable limits established for interest rate risk and maintain adequate levels of liquidity.
The majority of our assets and liabilities are monetary in nature. Consequently, one of our most significant forms of market risk is interest rate risk. Our assets, consisting primarily of loans secured by real estate, have longer maturities than our liabilities, consisting primarily of deposits. As a result, a principal part of our business strategy is to manage interest rate risk and reduce the exposure of our net interest income to changes in market interest rates. Accordingly, our Board of Directors has established an Asset/Liability Committee which is responsible for evaluating the interest rate risk inherent in our assets and liabilities, for determining the level of risk that is appropriate given our business strategy, operating environment, capital, liquidity and performance objectives, and for managing this risk consistent with the guidelines approved by the Board of Directors. Senior Management monitors the level of interest rate risk on a regular basis and the Asset/Liability Committee, which consists of executive Management and other bank personnel operating under a policy adopted by the Board of Directors, meets as needed to review our asset/liability policies and interest rate risk position.
The interest spread and liability funding discussed below are directly related to changes in asset and liability mixes, volumes, maturities and repricing opportunities for interest-earning assets and interest-bearing liabilities. Interest-sensitive assets and liabilities are those which are subject to being repriced in the near term, including both floating or adjustable rate instruments and instruments approaching maturity. The interest sensitivity gap is the difference between total interest-sensitive assets and total interest-sensitive liabilities. Interest rates on our various asset and liability categories do not respond uniformly to changing market conditions. Interest rate risk is the degree to which interest rate fluctuations in the marketplace can affect net interest income.
To maximize our margin, we attempt to be somewhat more asset sensitive during periods of rising rates and more liability sensitive during periods of falling rates. The need for interest sensitivity gap Management is most critical in times of rapid changes in overall interest rates. We generally seek to limit our exposure to interest rate fluctuations by maintaining a relatively balanced mix of rate sensitive assets and liabilities on a one-year time horizon. The mix is relatively difficult to manage. Because of the significant impact on net interest margin from mismatches in repricing opportunities, the asset-liability mix is monitored periodically depending upon Management’s assessment of current business conditions and the interest rate outlook. Exposure to interest rate fluctuations is maintained within prudent levels by the use of varying investment strategies.
We monitor interest rate risk using an interest sensitivity analysis set forth on the following table. This analysis, which we prepare monthly, reflects the maturity and repricing characteristics of assets and liabilities over various time periods. The gap indicates whether more assets or liabilities are subject to repricing over a given time period. The interest sensitivity analysis at December 31, 2010 shown below reflects a liability-sensitive position with a negative cumulative gap on a one-year basis.
- 47 -
|
Interest Sensitivity Within
|
||||||||||||||||||||
|
3 Months
|
Over 3 Months
|
Total
|
Over
|
|||||||||||||||||
|
Or Less
|
thru 12 Months
|
One Year
|
One Year
|
Total
|
||||||||||||||||
|
(in thousands)
|
||||||||||||||||||||
|
Earning Assets:
|
||||||||||||||||||||
|
Loans (including loans held for sale)
|
$
|
122,909
|
$
|
136,741
|
$
|
259,650
|
$
|
315,990
|
$
|
575,640
|
||||||||||
|
Securities (including FHLB stock)
|
5,446
|
6,210
|
11,656
|
471,920
|
483,576
|
|||||||||||||||
|
Federal Funds Sold
|
9,129
|
-
|
9,129
|
-
|
9,129
|
|||||||||||||||
|
Other earning assets
|
13
|
-
|
13
|
-
|
13
|
|||||||||||||||
|
Total earning assets
|
137,497
|
142,951
|
280,448
|
787,910
|
$
|
1,068,358
|
||||||||||||||
|
Source of Funds:
|
||||||||||||||||||||
|
Interest-bearing accounts:
|
||||||||||||||||||||
|
Demand deposits
|
146,142
|
-
|
146,142
|
45,997
|
192,139
|
|||||||||||||||
|
Savings deposits
|
11,664
|
-
|
11,664
|
34,999
|
46,663
|
|||||||||||||||
|
Time deposits
|
112,652
|
177,125
|
289,777
|
347,907
|
637,684
|
|||||||||||||||
|
Short-term borrowings
|
12,589
|
-
|
12,589
|
-
|
12,589
|
|||||||||||||||
|
Long-term borrowings
|
-
|
-
|
-
|
-
|
-
|
|||||||||||||||
|
Noninterest-bearing, net
|
-
|
- |
-
|
179,283
|
179,283
|
|||||||||||||||
|
Total source of funds
|
283,048
|
177,125
|
460,173
|
608,185
|
$
|
1,068,358
|
||||||||||||||
|
Period gap
|
(145,551
|
)
|
(34,174
|
)
|
(179,725
|
)
|
179,725
|
|||||||||||||
|
Cumulative gap
|
$
|
(145,551
|
)
|
$
|
(179,725
|
)
|
$
|
(179,725
|
)
|
$
|
-
|
|||||||||
|
Cumulative gap as a
|
||||||||||||||||||||
|
percent of earning assets
|
-13.62
|
%
|
-16.82
|
%
|
-16.82
|
%
|
||||||||||||||
Net Interest Income at Risk. Net interest income (NII) at risk measures the risk of a decline in earnings due to changes in interest rates. The table below presents an analysis of our interest rate risk as measured by the estimated changes in net interest income resulting from an instantaneous and sustained parallel shift in the yield curve at December 31, 2010. Shifts are measured in 100 basis point increments (+ 200 through - 200 basis points,) from base case. Base case encompasses key assumptions for asset/liability mix, loan and deposit growth, pricing, prepayment speeds, deposit decay rates, securities portfolio cash flows and reinvestment strategy and the market value of certain assets under the various interest rate scenarios. The base case scenario assumes that the current interest rate environment is held constant throughout the forecast period; the instantaneous shocks are performed against that yield curve.
|
Change in
Interest
Rates
|
Estimated Increase
(Decrease) in NII
December 31, 2010
|
||||
|
(basis points)
|
|||||
|
-200
|
-1.72%
|
||||
|
-100
|
-1.83%
|
||||
|
Stable
|
0.0%
|
||||
|
+100
|
-0.48%
|
||||
|
+200
|
2.86%
|
||||
The increasing rate scenarios shows higher levels of net interest income while the decreasing scenarios show higher levels of volatility and subsequently lower levels of NII. These scenarios are instantaneous shocks that assume balance sheet Management will mirror base case. Should the yield curve begin to rise or fall, Management has several strategies available to maximize earnings opportunities or offset the negative impact to earnings. For example, in a falling rate environment, deposit pricing strategies could be adjusted to further sway customer behavior to non-contractual or short-term (less than 12 months) contractual deposit products which would reset downward with the changes in the yield curve and prevailing market rates. Another opportunity at the start of such a cycle would be reinvesting the securities portfolio cash flows into longer term, non-callable bonds that would lock in higher yields.
- 48 -
Even if interest rates change in the designated amounts, there can be no assurance that our assets and liabilities would perform as anticipated. Additionally, a change in the U.S. Treasury rates in the designated amounts accompanied by a change in the shape of the U.S. Treasury yield curve would cause significantly different changes to NII than indicated above. Strategic management of our balance sheet and earnings would be adjusted to accommodate these movements. As with any method of measuring IRR, certain shortcomings are inherent in the methods of analysis presented above. For example, although certain assets and liabilities may have similar maturities or periods to repricing, they may react in different degrees to changes in market interest rates. Also, the interest rates on certain types of assets and liabilities may fluctuate in advance of changes in market interest rates, while interest rates on other types may lag behind changes in market rates. Also, the ability of many borrowers to service their debt may decrease in the event of an interest rate increase. We consider all of these factors in monitoring its exposure to interest rate risk.
Liquidity and Capital Resources
Liquidity and Capital Resources. Liquidity refers to the ability or flexibility to manage future cash flows to meet the needs of depositors and borrowers and fund operations. Maintaining appropriate levels of liquidity allows us to have sufficient funds available to meet customer demand for loans, withdrawal of deposit balances and maturities of deposits and other liabilities. Liquid assets include cash and due from banks, interest-earning demand deposits with banks, federal funds sold and available for sale investment securities. Including securities pledged to collateralize public fund deposits, these assets represent 32.4% and 31.8% of the total liquidity base at December 31, 2010, and 2009, respectively. In addition, we maintained borrowing availability with the Federal Home Loan Bank of Dallas approximating $52.2 million and $92.2 million at December 31, 2010 and December 31, 2009, respectively. We also maintain federal funds lines of credit totaling $48.4 million at three other correspondent banks, of which $48.4 was available at December 31, 2010. Management believes there is sufficient liquidity to satisfy current operating needs.
Regulatory Capital. Risk-based capital regulations adopted by the FDIC require banks to achieve and maintain specified ratios of capital to risk-weighted assets. Similar capital regulations apply to bank holding companies. The risk-based capital rules are designed to measure “Tier 1” capital (consisting of common equity, retained earnings and a limited amount of qualifying perpetual preferred stock and trust preferred securities, net of goodwill and other intangible assets and accumulated other comprehensive income) and total capital in relation to the credit risk of both on- and off- balance sheet items. Under the guidelines, one of its risk weights is applied to the different on balance sheet items. Off-balance sheet items, such as loan commitments, are also subject to risk weighting. All bank holding companies and banks must maintain a minimum total capital to total risk weighted assets ratio of 8.00%, at least half of which must be in the form of core or Tier 1 capital. These guidelines also specify that bank holding companies that are experiencing internal growth or making acquisitions will be expected to maintain capital positions substantially above the minimum supervisory levels.
At December 31, 2010, we satisfied the minimum regulatory capital requirements and were well capitalized within the meaning of federal regulatory requirements.
Off-Balance Sheet Arrangements
We had $145.0 million, $140.0 million and $105.0 million in letters of credit issued by the FHLB of Dallas at December 31, 2010, 2009, and 2008, respectively, which was used as collateral for public fund deposits.
The Company is a party to financial instruments with off-balance sheet risk in the normal course of business to meet the financing needs of its customers and to reduce its own exposure to fluctuations in interest rates. These financial instruments include commitments to extend credit and standby and commercial letters of credit. Those instruments involve, to varying degrees, elements of credit and interest rate risk in excess of the amount recognized in the Consolidated Balance Sheets. The contract or notional amounts of those instruments reflect the extent of the involvement in particular classes of financial instruments.
The exposure to credit loss in the event of nonperformance by the other party to the financial instrument for commitments to extend credit and standby and commercial letters of credit is represented by the contractual notional amount of those instruments. The same credit policies are used in making commitments and conditional obligations as it does for on-balance sheet instruments.
Unless otherwise noted, collateral or other security is not required to support financial instruments with credit risk.
Commitments to extend credit are agreements to lend to a customer as long as there is no violation of any condition established in the contract. Commitments generally have fixed expiration dates or other termination clauses and may require payment of a fee. Since commitments may expire without being drawn upon, the total commitment amounts do not necessarily represent future cash requirements. Each customer's creditworthiness is evaluated on a case-by-case basis. The amount of collateral obtained, if deemed necessary upon extension of credit, is based on Management's credit evaluation of the counterpart. Collateral requirements vary but may include accounts receivable, inventory, property, plant and equipment, residential real estate and commercial properties.
Standby and commercial letters of credit are conditional commitments to guarantee the performance of a customer to a third party. These guarantees are primarily issued to support public and private borrowing arrangements, including commercial paper, bond financing and similar transactions. The majority of these guarantees are short-term, one year or less; however, some guarantees extend for up to three years. The credit risk involved in issuing letters of credit is essentially the same as that involved in extending loan facilities to customers. Collateral requirements are the same as on-balance sheet instruments and commitments to extend credit.
There were no losses incurred on any commitments in 2010 or 2009.
The Company had unfunded loan committments of $95.2 million and standby letters of credit of $5.7 million as of December 31, 2010.
- 49 -
Contractual Obligations
The following table summarizes our significant fixed and determinable contractual obligations and other funding needs by payment date at December 31, 2010. The payment amounts represent those amounts due to the recipient and do not include any unamortized premiums or discounts or other similar carrying amount adjustments.
At of December 31, 2010, our contractual obligations were as follows:
|
Payments Due by Period
|
||||||||||||||||
|
One Year
|
One Through
|
Over Three
|
||||||||||||||
|
or Less
|
Three Years
|
Years
|
Total
|
|||||||||||||
|
(in thousands)
|
||||||||||||||||
|
Operating leases
|
$
|
28
|
$
|
31
|
$
|
5
|
$
|
64
|
||||||||
| Software contracts | 1,037 | 678 | 112 | 1,827 | ||||||||||||
|
Time deposits
|
289,777
|
303,772
|
44,135
|
637,684
|
||||||||||||
|
Short-term borrowings
|
12,589
|
-
|
-
|
12,589
|
||||||||||||
|
Long-term borrowings
|
-
|
-
|
-
|
-
|
||||||||||||
|
Total
|
$
|
302,394
|
$
|
303,803
|
$
|
44,140
|
$
|
650,337
|
||||||||
Impact of Inflation and Changing Prices
The consolidated financial statements and related financial data presented herein have been prepared in accordance with generally accepted accounting principles, which generally require the measurement of financial position and operating results in terms of historical dollars, without considering changes in relative purchasing power over time due to inflation. Unlike most industrial companies, the majority of the Company’s assets and liabilities are monetary in nature. As a result, interest rates generally have a more significant impact on the Company’s performance than does the effect of inflation. Although fluctuations in interest rates are neither completely predictable or controllable, the Company regularly monitors its interest rate position and oversees its financial risk Management by establishing policies and operating limits (see “Asset/Liability Management and Market Risk” section). Interest rates do not necessarily move in the same direction or in the same magnitude as the prices of goods and services, since such prices are affected by inflation to a larger extent than interest rates. Although not as critical to the banking industry as to other industries, inflationary factors may have some impact on the Company’s growth, earnings, total assets and capital levels. Management does not expect inflation to be a significant factor in 2011.
For discussion on this matter, see the “Asset/Liability Management and Market Risk” section of this analysis.
- 50 -
Item 8 - Financial Statements and Supplementary Data
Report of Castaing, Hussey & Lolan, LLC
Independent Registered Accounting Firm
To the Stockholders and Board of Directors
First Guaranty Bancshares, Inc.
We have audited the accompanying consolidated balance sheets of First Guaranty Bancshares, Inc. as of December 31, 2010 and 2009, and the related consolidated statements of income, changes in stockholders’ equity and cash flows for each of the years in the three-year period ended December 31, 2010. These financial statements are the responsibility of the Company's management. Our responsibility is to express an opinion on these financial statements based on our audits.
We conducted our audits in accordance with the standards of the Public Company Accounting Oversight Board (United States). Those standards require that we plan and perform the audit to obtain reasonable assurance about whether the financial statements are free of material misstatement. The Company is not required to have, nor were we engaged to perform, an audit of its internal control over financial reporting. Our audit included consideration of internal control over financial reporting as a basis for designing audit procedures that are appropriate in the circumstances, but not for the purpose of expressing an opinion on the effectiveness of the Company’s internal control over financial reporting. Accordingly, we express no such opinion. An audit includes examining, on a test basis, evidence supporting the amounts and disclosures in the financial statements. An audit also includes assessing the accounting principles used and significant estimates made by management, as well as evaluating the overall financial statement presentation. We believe that our audits provide a reasonable basis for our opinion.
In our opinion, the financial statements referred to above present fairly, in all material respects, the consolidated financial position of First Guaranty Bancshares, Inc. as of December 31, 2010 and 2009, and the consolidated results of its operations and its cash flows for each of the years in the three-year period ended December 31, 2010 in conformity with accounting principles generally accepted in the United States of America.
/s/ Castaing, Hussey & Lolan, LLC
Castaing, Hussey & Lolan, LLC
New Iberia, Louisiana
March 31, 2011
- 51 -
|
FIRST GUARANTY BANCSHARES, INC. AND SUBSIDIARY
|
||||||||
|
CONSOLIDATED BALANCE SHEETS
|
||||||||
|
(in thousands, except share data)
|
||||||||
|
December 31,
|
||||||||
|
2010
|
2009
|
|||||||
|
Assets
|
||||||||
|
Cash and cash equivalents:
|
||||||||
|
Cash and due from banks
|
$
|
35,695 |
$
|
33,425 | ||||
|
Interest-earning demand deposits with banks
|
13
|
14 | ||||||
|
Federal funds sold
|
9,129 | 13,279 | ||||||
|
Cash and cash equivalents
|
44,837 | 46,718 | ||||||
|
Investment securities:
|
||||||||
|
Available for sale, at fair value
|
322,128 | 249,480 | ||||||
|
Held to maturity, at cost (estimated fair value of
|
||||||||
|
$155,326 and $12,462, respectively)
|
159,833 | 12,349 | ||||||
|
Investment securities
|
481,961 | 261,829 | ||||||
|
Federal Home Loan Bank stock, at cost
|
1,615 | 2,547 | ||||||
|
Loans, net of unearned income
|
575,640 | 589,902 | ||||||
|
Less: allowance for loan losses
|
8,317 | 7,919 | ||||||
|
Net loans
|
567,323 |
581,983
|
||||||
|
Premises and equipment, net
|
16,023 |
16,704
|
||||||
|
Goodwill
|
1,999 | 1,999 | ||||||
|
Intangible assets, net
|
1,729 | 1,893 | ||||||
|
Other real estate, net
|
577 | 658 | ||||||
|
Accrued interest receivable
|
7,664 | 5,807 | ||||||
|
Other assets
|
9,064 | 10,709 | ||||||
|
Total Assets
|
$
|
1,132,792 |
$
|
930,847 | ||||
|
Liabilities and Stockholders' Equity
|
||||||||
|
Deposits:
|
||||||||
|
Noninterest-bearing demand
|
$
|
130,897 |
$
|
131,818 | ||||
|
Interest-bearing demand
|
192,139 | 188,252 | ||||||
|
Savings
|
46,663 | 40,272 | ||||||
|
Time
|
637,684 | 439,404 | ||||||
|
Total deposits
|
1,007,383 | 799,746 | ||||||
|
Short-term borrowings
|
12,589 | 11,929 | ||||||
|
Accrued interest payable
|
3,539 | 2,519 | ||||||
|
Long-term borrowings
|
- | 20,000 | ||||||
|
Other liabilities
|
11,343 | 1,718 | ||||||
|
Total Liabilities
|
1,034,854 | 835,912 | ||||||
|
Stockholders' Equity
|
||||||||
|
Preferred stock:
|
||||||||
|
Series A - $1,000 par value - authorized 5,000 shares; issued
|
||||||||
|
and outstanding 2,069.9 shares
|
19,859 | 19,630 | ||||||
|
Series B - $1,000 par value - authorized 5,000 shares; issued
|
||||||||
|
and outstanding 103 shares
|
1,116 | 1,140 | ||||||
|
Common stock:
|
||||||||
|
$1 par value - authorized 100,600,000 shares; issued and
|
||||||||
|
outstanding 5,559,644 shares
|
5,560 | 5,560 | ||||||
|
Surplus
|
26,459 | 26,459 | ||||||
|
Retained earnings
|
45,203 | 40,069 | ||||||
|
Accumulated other comprehensive income (loss)
|
(259 | ) | 2,077 |
|
||||
|
Total Stockholders' Equity
|
97,938 | 94,935 | ||||||
|
Total Liabilities and Stockholders' Equity
|
$
|
1,132,792 |
$
|
930,847 | ||||
See Notes to Consolidated Financial Statements.
- 52 -
|
FIRST GUARANTY BANCSHARES, INC. AND SUBSIDIARY
|
||||||||||||
|
CONSOLIDATED STATEMENTS OF INCOME
|
||||||||||||
|
(in thousands, except share data)
|
||||||||||||
|
Years Ended December 31,
|
||||||||||||
|
2010
|
2009
|
2008
|
||||||||||
|
Interest Income:
|
||||||||||||
|
Loans (including fees)
|
$
|
36,288
|
$
|
35,677
|
$
|
40,406 | ||||||
|
Loans held for sale
|
5
|
7
|
45
|
|||||||||
|
Deposits with other banks
|
41
|
388
|
224
|
|||||||||
|
Securities (including FHLB stock)
|
15,043
|
11,085
|
6,594 | |||||||||
|
Federal funds sold
|
13
|
34
|
392 | |||||||||
|
Total Interest Income
|
51,390
|
47,191
|
47,661 | |||||||||
|
Interest Expense:
|
||||||||||||
|
Demand deposits
|
846
|
1,179
|
2,798 | |||||||||
|
Savings deposits
|
42
|
98
|
193 | |||||||||
|
Time deposits
|
12,218
|
13,310
|
12,432 | |||||||||
|
Borrowings
|
117
|
257
|
458 | |||||||||
|
Total Interest Expense
|
13,223
|
14,844
|
15,881 | |||||||||
|
Net Interest Income
|
38,167
|
32,347
|
31,780 | |||||||||
|
Provision for loan losses
|
5,654
|
4,155
|
1,634 | |||||||||
|
Net Interest Income after Provision for Loan Losses
|
32,513
|
28,192
|
30,146 | |||||||||
|
Noninterest Income:
|
||||||||||||
|
Service charges, commissions and fees
|
4,133
|
4,146
|
3,990 | |||||||||
|
Net gains (losses) on sale of securities
|
2,824
|
2,056
|
|
(1 |
)
|
|||||||
|
Loss on securities impairment
|
-
|
|
(829
|
)
|
(4,611
|
) | ||||||
|
Net gains on sale of loans
|
283
|
422
|
210 | |||||||||
| Gain on sale of fixed assets | 962 | (10 | ) | - | ||||||||
|
Other
|
1,363
|
1,351
|
1,489 | |||||||||
|
Total Noninterest Income
|
9,565
|
7,136
|
1,077 | |||||||||
|
Noninterest Expense:
|
||||||||||||
|
Salaries and employee benefits
|
11,769
|
10,752
|
10,653 | |||||||||
|
Occupancy and equipment expense
|
3,191
|
2,891
|
2,903 | |||||||||
|
Other
|
11,867
|
10,364
|
9,685 | |||||||||
|
Total Noninterest Expense
|
26,827
|
24,007
|
23,241 | |||||||||
|
Income Before Income Taxes
|
15,251
|
11,321
|
7,982 | |||||||||
|
Provision for income taxes
|
5,226
|
3,726
|
2,470 | |||||||||
|
Net Income
|
10,025
|
7,595
|
5,512 | |||||||||
|
Preferred Stock Dividends
|
(1,333
|
)
|
(594
|
) |
-
|
|||||||
|
Income Available to Common Shareholders
|
$
|
8,692
|
$
|
7,001
|
$
|
5,512 | ||||||
|
Per Common Share:
|
||||||||||||
|
Earnings
|
$
|
1.56
|
$
|
1.26
|
$
|
0.99 | ||||||
|
Cash dividends paid
|
$
|
0.64
|
$
|
0.64
|
$
|
0.64 | ||||||
|
Average Common Shares Outstanding
|
5,559,644
|
5,559,644
|
5,559,644
|
|||||||||
See Notes to Consolidated Financial Statements.
- 53 -
|
FIRST GUARANTY BANCSHARES, INC. AND SUBSIDIARY
|
||||||||||||||||||||||||||||
|
CONSOLIDATED STATEMENTS OF CHANGES IN STOCKHOLDERS' EQUITY
|
||||||||||||||||||||||||||||
|
(in thousands)
|
||||||||||||||||||||||||||||
| Series A | Series B | |||||||||||||||||||||||||||
|
Preferred
|
Preferred
|
Accumulated | ||||||||||||||||||||||||||
|
Stock
|
Stock
|
Common |
Other
|
|||||||||||||||||||||||||
| $1,000 | $1,000 | Stock | Retained | Comprehensive | ||||||||||||||||||||||||
|
Par
|
Par
|
$1 Par
|
Surplus
|
Earnings
|
Income/(Loss)
|
Total
|
||||||||||||||||||||||
|
Balance December 31, 2007
|
-
|
-
|
5,560
|
26,459
|
34,671
|
(335 |
)
|
66,355
|
||||||||||||||||||||
|
Net income
|
-
|
-
|
-
|
-
|
5,512
|
-
|
5,512
|
|||||||||||||||||||||
|
Other comprehensive income, net of tax
|
- |
-
|
-
|
-
|
-
|
(2,823
|
) |
(2,823
|
) | |||||||||||||||||||
|
Total comprehensive income
|
- | - | - | - | - |
2,689
|
||||||||||||||||||||||
|
Cash dividends on common stock ($0.64 per share)
|
- | - | - | - |
(3,557
|
)
|
(3,557
|
)
|
||||||||||||||||||||
|
Balance December 31, 2008
|
-
|
-
|
5,560
|
26,459
|
36,626
|
(3,158 |
)
|
65,487
|
||||||||||||||||||||
| Preferred stock issued |
19,551
|
1,148
|
- | - | - | - | 20,699 | |||||||||||||||||||||
|
Net income
|
-
|
-
|
-
|
-
|
7,595
|
-
|
7,595
|
|||||||||||||||||||||
|
Other comprehensive income, net of tax
|
- |
-
|
-
|
-
|
-
|
5,235
|
|
5,235 |
|
|||||||||||||||||||
| Total comprehensive income | - | - | - | - | - | - | 12,830 | |||||||||||||||||||||
|
Cash dividends on common stock ($0.64 per share)
|
- | - | - | - | (3,558 | ) | - |
(3,558
|
) | |||||||||||||||||||
|
Preferred stock dividend, amortization and accretion
|
79
|
(8
|
) |
-
|
-
|
(594 |
)
|
-
|
(523 |
)
|
||||||||||||||||||
|
Balance December 31, 2009
|
19,630
|
1,140
|
5,560
|
26,459
|
40,069
|
2,077
|
|
94,935
|
||||||||||||||||||||
|
Net income
|
-
|
-
|
-
|
-
|
10,025
|
-
|
10,025
|
|||||||||||||||||||||
|
Other comprehensive income, net of tax
|
-
|
-
|
-
|
-
|
-
|
(2,336
|
) |
(2,336
|
) | |||||||||||||||||||
|
Total comprehensive income
|
- | - | - | - | - | - |
7,689
|
|||||||||||||||||||||
|
Cash dividends on common stock ($0.64 per share)
|
-
|
-
|
-
|
-
|
(3,558
|
)
|
-
|
(3,558
|
)
|
|||||||||||||||||||
|
Preferred stock dividend, amortization and accretion
|
229
|
(24 |
)
|
-
|
-
|
(1,333
|
)
|
-
|
(1,128
|
)
|
||||||||||||||||||
|
Balance December 31, 2010
|
$
|
19,859
|
$
|
1,116
|
$
|
5,560
|
$
|
26,459
|
$
|
45,203
|
$
|
(259
|
) |
$
|
97,938
|
|||||||||||||
See Notes to Consolidated Financial Statements
.
- 54 -
|
FIRST GUARANTY BANCSHARES, INC. AND SUBSIDIARY
|
||||||||||||
|
CONSOLIDATED STATEMENTS OF CASH FLOWS
|
||||||||||||
|
(in thousands)
|
||||||||||||
| Years Ended December 31, | ||||||||||||
| 2010 |
2009
|
2008
|
||||||||||
|
Cash Flows From Operating Activities
|
||||||||||||
|
Net income
|
$ | 10,025 |
$
|
7,595
|
$
|
5,512
|
||||||
|
Adjustments to reconcile net income to net cash
|
||||||||||||
|
provided by operating activities:
|
||||||||||||
|
Provision for loan losses
|
5,654 |
4,155
|
1,634
|
|||||||||
|
Depreciation and amortization
|
1,465 |
1,413
|
1,451
|
|||||||||
|
Amortization of premium/discount on investments
|
71 |
(768
|
)
|
(807
|
)
|
|||||||
|
(Gain) Loss on call / sale of securities
|
(3,162 | ) |
(2,066
|
)
|
1
|
|||||||
|
Gain on sale of assets
|
(1,244 | ) |
(385
|
)
|
(211
|
)
|
||||||
|
Other than temporary impairment charge on securities
|
- |
829
|
4,611
|
|||||||||
|
ORE writedowns and loss on disposition
|
693 |
270
|
113
|
|||||||||
|
FHLB stock dividends
|
(8 | ) |
(3
|
)
|
(32
|
)
|
||||||
|
Net decrease in loans held for sale
|
- |
-
|
3,959
|
|||||||||
| Non-cash donation | 705 | - | - | |||||||||
|
Change in other assets and liabilities, net
|
2,043 |
(8,514
|
)
|
3,326
|
||||||||
|
Net Cash Provided By Operating Activities
|
16,242 |
2,526
|
19,557
|
|||||||||
|
Cash Flows From Investing Activities
|
||||||||||||
|
Proceeds from maturities, calls and sales of HTM securities
|
12,724 |
22,187
|
11,740
|
|||||||||
|
Proceeds from maturities, calls and sales of AFS securities
|
800,684 |
1,281,594
|
756,642
|
|||||||||
|
Funds invested in AFS securities
|
(864,419 | ) |
(1,419,358
|
)
|
(773,772
|
)
|
||||||
| Funds Invested in HTM securities | (159,831 | ) | - | - | ||||||||
|
Proceeds from sale of Federal Home Loan Bank stock
|
2,972 |
-
|
1,900
|
|||||||||
|
Funds invested in Federal Home Loan Bank stock
|
(2,032 | ) |
(1,599
|
)
|
(1,857
|
)
|
||||||
|
Proceeds from maturities of time deposits with banks
|
- |
35,094
|
2,923
|
|||||||||
|
Funds invested in time deposits with banks
|
- |
(13,613
|
)
|
(22,216
|
)
|
|||||||
|
Net decrease (increase) in loans
|
5,718 |
12,620
|
(33,196
|
)
|
||||||||
|
Purchase of premises and equipment
|
(1,327 | ) |
(1,631
|
)
|
(1,017
|
)
|
||||||
|
Proceeds from sales of premises and equipment
|
1,100 |
24
|
-
|
|||||||||
|
Proceeds from sales of other real estate owned
|
2,677 |
768
|
443
|
|||||||||
|
Cash paid in excess of cash received in acquisition
|
- |
-
|
(72
|
)
|
||||||||
|
Net Cash Used In Investing Activities
|
(201,734 | ) |
(83,914
|
)
|
(58,482
|
)
|
||||||
|
Cash Flows From Financing Activities
|
||||||||||||
|
Net increase in deposits
|
207,637 |
19,382
|
57,194
|
|||||||||
|
Net increase (decrease) in federal funds purchased and short-term borrowings
|
660 |
2,162
|
(634
|
)
|
||||||||
|
Proceeds from long-term borrowings
|
- |
20,000
|
10,000
|
|||||||||
|
Repayment of long-term borrowings
|
(20,000 | ) |
(8,355
|
)
|
(4,738
|
)
|
||||||
|
Proceeds from issuance of preferred stock
|
- |
20,699
|
-
|
|||||||||
|
Dividends paid
|
(4,686 | ) |
(3,799
|
)
|
(3,557
|
)
|
||||||
|
Net Cash Provided By Financing Activities
|
183,611 |
50,089
|
58,265
|
|||||||||
|
Net (Decrease) Increase In Cash and Cash Equivalents
|
(1,881 | ) |
(31,299
|
)
|
19,340
|
|||||||
|
Cash and Cash Equivalents at the Beginning of the Period
|
46,718 |
78,017
|
58,677
|
|||||||||
|
Cash and Cash Equivalents at the End of the Period
|
$ | 44,837 |
$
|
46,718
|
$
|
78,017
|
||||||
|
Noncash Activities:
|
||||||||||||
| Non-cash donation | $ | 705 | $ | - | $ | - | ||||||
|
Loans transferred to foreclosed assets
|
$ | 3,288 |
$
|
1,129
|
$
|
751
|
||||||
|
Cash Paid During The Period:
|
||||||||||||
|
Interest on deposits and borrowed funds
|
$ | 12,203 |
$
|
15,357
|
$
|
15,804
|
||||||
|
Income taxes
|
$ | 5,600 |
$
|
4,300
|
$
|
1,200
|
||||||
See Notes to Consolidated Financial Statements.
- 55 -
NOTES TO CONSOLIDATED FINANCIAL STATEMENTS
Note 1. Business and Summary of Significant Accounting Policies
Business
First Guaranty Bancshares, Inc. (the “Company”) is a Louisiana corporation. On July 27, 2007 the Company became the parent of First Guaranty Bank. The Company owns all of the outstanding shares of common stock of First Guaranty Bank. First Guaranty Bank (the “Bank”) is a Louisiana state-chartered commercial bank that provides a diversified range of financial services to consumers and businesses in the communities in which it operates. These services include consumer and commercial lending, mortgage loan origination, the issuance of credit cards and retail banking services. The Bank has 16 banking offices, one drive-up banking facility, and 26 automated teller machines (ATMs) in northern and southern Louisiana.
Summary of significant accounting policies
The accounting and reporting policies of the Company conform to generally accepted accounting principles and to predominant accounting practices within the banking industry. The more significant accounting and reporting policies are as follows:
Consolidation
The consolidated financial statements include the accounts of First Guaranty Bancshares, Inc. (the “Company”), and its wholly owned subsidiary, First Guaranty Bank (the “Bank”). All significant intercompany balances and transactions have been eliminated in consolidation.
Use of estimates
The preparation of financial statements in conformity with generally accepted accounting principles requires Management to make estimates and assumptions that affect the reported amounts of assets and liabilities and disclosure of contingent assets and liabilities at the dates of the financial statements and the reported amounts of revenue and expense during the reporting periods. Actual results could differ from those estimates.
Material estimates that are particularly susceptible to significant change in the near-term economic environment and market conditions relate to the determination of the allowance for loan losses and the valuation of real estate acquired in connection with foreclosures or in satisfaction of loans. In connection with the determination of the allowance for loan losses and real estate owned, the Company obtains independent appraisals for significant properties.
Available for sale investment securities are stated at estimated fair value, with the unrealized gains and losses determined on a specific identification basis. Such unrealized gains and losses, net of tax, are reported as a separate component of stockholders’ equity and included in other comprehensive income (loss). The Company utilizes an independent third party as its principal pricing source for determining fair value. For investment securities traded in an active market, fair values are measured on a recurring basis obtained from an independent pricing service and based on quoted market prices if available. If quoted market prices are not available, fair values are based on quoted market prices of comparable securities, broker quotes or comprehensive interest rate tables and pricing matrices. For investment securities traded in a market that is not active, fair value is determined using unobservable inputs or value drivers and is generally determined using expected cash flows and appropriate risk-adjusted discount rates. Expected cash flows are based primarily on the contractual cash flows of the instrument.
Any security that has experienced a decline in value, which Management believes is deemed other than temporary, is reduced to its estimated fair value by a charge to operations. In estimating other-than-temporary impairment losses, Management considers (1) the length of time and the extent to which the fair value has been less than cost, (2) the financial condition and near-term prospects of the issuer, and (3) the intent and ability of the Company to retain its investment in the issuer for a period of time sufficient to allow for any anticipated recovery in fair value. Realized gains and losses on security transactions are computed using the specific identification method. Amortization of premiums and discounts is included in interest and dividend income. Discounts and premiums related to debt securities are amortized using the effective interest rate method. The Company did not have any derivative financial instruments as of December 31, 2010 or 2009.
Cash and cash equivalents
For purposes of reporting cash flows, cash and cash equivalents are defined as cash, due from banks, interest-bearing demand deposits with banks and federal funds sold with maturities of three months or less.
Securities
The Company reviews its financial position, liquidity and future plans in evaluating the criteria for classifying investment securities. At December 31, 2010, the securities portfolio contained two classifications of securities - held to maturity and available for sale. At December 31, 2010, $322.1 million were classified as available for sale and $159.8 million were classified as held to maturity.
Debt securities that Management has the ability and intent to hold to maturity are classified as held to maturity and carried at cost, adjusted for amortization of premiums and accretion of discounts using methods approximating the interest method. Securities available for sale are stated at fair value. The unrealized difference, if any, between amortized cost and fair value of these securities is excluded from income and is reported, net of deferred taxes, as a component of stockholders' equity. Realized gains and losses on securities are computed based on the specific identification method and are reported as a separate component of other income.
- 56 -
Management evaluates securities for other-than-temporary impairment at least quarterly and more frequently when economic or market conditions warrant such evaluation. Consideration is given to (1) the length of time and the extent to which the fair value has been less than cost, (2) the financial condition and near-term prospects of the issuer (3) the recovery of contractual principal and interest and (4) the intent and ability of the Company to retain its investment in the issuer for a period of time sufficient to allow for any anticipated recovery in fair value.
The Company has a required investment in Federal Home Loan Bank stock that is carried at cost that approximates fair value. This stock must be maintained by the Company.
Loans held for sale
Mortgage loans originated and intended for sale in the secondary market are carried at the lower of cost or estimated fair value in the aggregate. Net unrealized losses, if any, are recognized through a valuation allowance by charges to income. Loans held for sale have primarily been fixed rate single-family residential mortgage loans under contract to be sold in the secondary market. In most cases, loans in this category are sold within thirty days. Buyers generally have recourse to return a purchased loan under limited circumstances. Recourse conditions may include early payment default, breach of representations or warranties and documentation deficiencies.
Mortgage loans held for sale are generally sold with the mortgage servicing rights released. Gains or losses on sales of mortgage loans are recognized based on the differences between the selling price and the carrying value of the related mortgage loans sold.
Loans
Loans are stated at the principal amounts outstanding, net of unearned income and deferred loan fees. In addition to loans issued in the normal course of business, overdrafts on customer deposit accounts are considered to be loans and reclassified as such. At December 31, 2010 and 2009, $0.2 million and $0.1 million, respectively, in overdrafts have been reclassified to loans. Interest income on all classifications of loans is calculated using the simple interest method on daily balances of the principal amount outstanding.
Accrual of interest is discontinued on a loan when Management believes, after considering economic and business conditions and collection efforts, the borrower’s financial condition is such that reasonable doubt exists as to the full and timely collection of principal and interest. This evaluation is made for all loans that are 90 days or more contractually past due. When a loan is placed in non-accrual status, all interest previously accrued but not collected is reversed against current period interest income. Income on such loans is then recognized only to the extent that cash is received and where the future collection of interest and principal is probable. Loans are returned to accrual status when, in the judgment of Management, all principal and interest amounts contractually due are reasonably assured of repayment within a reasonable time frame and when the borrower has demonstrated payment performance of cash or cash equivalents for a minimum of six months.
All loans, except mortgage loans, are considered past due if they are past due 30 days. Mortgage loans are considered past due when two consecutive payments have been missed. Loans that are past due 90-120 days and deemed uncollectible are charged off. The loan charge off is a reduction of the allowance for loan losses.
Loan fees and costs
Nonrefundable loan origination and commitment fees and direct costs associated with originating loans are deferred and recognized over the lives of the related loans as an adjustment to the loans' yield using the level yield method.
Allowance for loan losses
The allowance for loan losses is established through a provision for loan losses charged to expense. Loans are charged against the allowance for loan losses when Management believes that the collectability of the principal is unlikely. The allowance, which is based on evaluation of the collectability of loans and prior loan loss experience, is an amount that Management believes will be adequate to reflect the risks inherent in the existing loan portfolio and exist at the reporting date. The evaluations take into consideration a number of subjective factors including changes in the nature and volume of the loan portfolio, overall portfolio quality, review of specific problem loans, current economic conditions that may affect a borrower’s ability to pay, adequacy of loan collateral and other relevant factors. In addition, regulatory agencies, as an integral part of their examination process, periodically review the estimated losses on loans. Such agencies may require additional recognition of losses based on their judgments about information available to them at the time of their examination.
Although Management uses available information to recognize losses on loans, because of uncertainties associated with local economic conditions, collateral values and future cash flows on impaired loans, it is reasonably possible that a material change could occur in the allowance for loan losses in the near term. However, the amount of the change that is reasonably possible cannot be estimated.
The evaluation of the adequacy of loan collateral is often based upon estimates and appraisals. Because of changing economic conditions, the valuations determined from such estimates and appraisals may also change. Accordingly, the Company may ultimately incur losses that vary from Management's current estimates. Adjustments to the allowance for loan losses will be reported in the period such adjustments become known or can be reasonably estimated. All loan losses are charged to the allowance for loan losses when the loss actually occurs or when Management believes that the collectability of the principal is unlikely. Recoveries are credited to the allowance at the time of recovery.
- 57 -
The allowance consists of specific, general and unallocated components. The specific component relates to loans that are classified as doubtful, substandard or special mention. For such loans that are also classified as impaired, an allowance is established when the discounted cash flows (or collateral value or observable market price) of the impaired loan is lower than the carrying value of that loan. The general component covers non-classified loans and is based on historical loss experience adjusted for qualitative factors. An unallocated component is maintained to cover uncertainties that could affect Management’s estimate of probable losses. The unallocated component of the allowance reflects the margin of imprecision inherent in the underlying assumptions used in the methodologies for estimating specific and general losses in the portfolio.
A loan is considered impaired when, based on current information and events, it is probable that the Company will be unable to collect the scheduled payments of principal or interest when due according to the contractual terms of the loan agreement. Factors considered by Management in determining impairment include payment status, collateral value and the probability of collecting scheduled principal and interest payments when due. Loans that experience insignificant payment delays and payment shortfalls generally are not classified as impaired. Management determines the significance of payment delays and payment shortfalls on a case-by-case basis, taking into consideration all of the circumstances surrounding the loan and the borrower, including the length of the delay, the reasons for the delay, the borrower’s prior payment record and the amount of the shortfall in relation to the principal and interest owed. Impairment is measured on a loan-by-loan basis for commercial and construction loans by either the present value of expected future cash flows discounted at the loan’s effective interest rate, the loan’s obtainable market price or the fair value of the collateral if the loan is collateral dependent. As an administrative matter, this process is only applied to impaired loans or relationships in excess of $250,000.
Large groups of smaller balance homogeneous loans are collectively evaluated for impairment. Accordingly, individual consumer and residential loans are not separately identified for impairment disclosures, unless such loans are the subject of a restructuring agreement.
Goodwill and Intangible assets
Intangible assets are comprised of goodwill and core deposit intangibles. Goodwill and intangible assets deemed to have indefinite lives are no longer amortized, but are subject to annual impairment tests. The Company’s goodwill is tested for impairment on an annual basis, or more often if events or circumstances indicate that there may be impairment. Adverse changes in the economic environment, declining operations, or other factors could result in a decline in the implied fair value of goodwill. If the implied fair value is less than the carrying amount, a loss would be recognized in other non-interest expense to reduce the carrying amount to implied fair value of goodwill. A goodwill impairment test includes two steps. Step one, used to identify potential impairment, compares the estimated fair value of a reporting unit with its carrying amount, including goodwill. If the estimated fair value of a reporting unit exceeds its carrying amount, goodwill of the reporting unit is considered not impaired. If the carrying amount of a reporting unit exceeds its estimated fair value, the second step of the goodwill impairment test is performed to measure the amount of impairment loss, if any. Step two of the goodwill impairment test compares the implied estimated fair value of reporting unit goodwill with the carrying amount of that goodwill. If the carrying amount of goodwill for that reporting unit exceeds the implied fair value of that unit’s goodwill, an impairment loss is recognized in an amount equal to that excess. The Company did not record goodwill impairment charges in 2010, 2009, or 2008.
Identifiable intangible assets are acquired assets that lack physical substance but can be distinguished from goodwill because of contractual or legal rights or because the assets are capable of being sold or exchanged either on their own on in combination with related contract, asset or liability. The Company’s intangible assets primarily relate to core deposits. These core deposit intangibles are amortized on a straight-line basis over terms ranging from seven to 15 years. Management periodically evaluates whether events or circumstances have occurred that would result in impairment of value.
Premises and equipment
Premises and equipment are stated at cost, less accumulated depreciation. Depreciation is computed for financial reporting purposes using the straight-line method over the estimated useful lives of the respective assets as follows:
Buildings and improvements 10-40 years
Equipment, fixtures and automobiles 3-10 years
Expenditures for renewals and betterments are capitalized and depreciated over their estimated useful lives. Repairs, maintenance and minor improvements are charged to operating expense as incurred. Gains or losses on disposition, if any, are recorded in the Statements of Income.
- 58 -
Other real estate
Other real estate includes properties acquired through foreclosure or acceptance of deeds in lieu of foreclosure. These properties are recorded at the lower of the recorded investment in the property or its fair value less the estimated cost of disposition. Any valuation adjustments required prior to foreclosure are charged to the allowance for loan losses. Subsequent to foreclosure, losses on the periodic revaluation of the property are charged to current period earnings as other real estate expense. Costs of operating and maintaining the properties are charged to other real estate expense as incurred. Any subsequent gains or losses on dispositions are credited or charged to income in the period of disposition.
Off-balance sheet financial instruments
In the ordinary course of business, the Company has entered into commitments to extend credit, including commitments under credit card arrangements, commitments to fund commercial real estate, construction and land development loans secured by real estate, and performance standby letters of credit. Such financial instruments are recorded when they are funded.
Income taxes
The Company and all subsidiaries file a consolidated federal income tax return on a calendar year basis. In lieu of Louisiana state income tax, the Bank is subject to the Louisiana bank shares tax, which is included in noninterest expense in the Company’s consolidated financial statements. With few exceptions, the Company is no longer subject to U.S. federal, state or local income tax examinations for years before 2006.
Deferred tax assets and liabilities are recognized for the future tax consequences attributable to differences between the financial statement carrying amounts of existing assets and liabilities and their respective tax basis. Deferred tax assets and liabilities are measured using enacted tax rates expected to apply to taxable income in the years in which the deferred tax assets or liabilities are expected to be settled or realized. Valuation allowances are established when necessary to reduce deferred tax assets to the amount expected to be utilized.
Comprehensive income
Accounting principles generally require that recognized revenue, expenses, gains and losses be included in net income. Although certain changes in assets and liabilities, such as unrealized gains and losses on available for sale securities, are reported as a separate component of the equity section of the balance sheet, such items along with net income, are components of comprehensive income. The components of other comprehensive income and related tax effects are presented in the Statements of Changes in Stockholders’ Equity and Note 16 of the Consolidated Notes to the Financial Statements.
Earnings per common share
Earnings per share represents income available to common shareholders divided by the weighted average number of common shares outstanding during the period. No convertible shares or other agreements to issue common stock are outstanding.
Transfers of Financial Assets
Transfers of financial assets are accounted for as sales, when control over the assets has been surrendered. Control over transferred assets is deemed to be surrendered when (i) the assets have been isolated from the Company, (ii) the transferee obtains the right (free of conditions that constrain it from taking advantage of that right) to pledge or exchange the transferred assets, and (iii) the Company does not maintain effective control over the transferred assets through an agreement to repurchase them before their maturity.
Recent Accounting Pronouncements
International Financial Reporting Standards (“IFRS”)
In November 2009, the SEC issued a proposed roadmap regarding the potential use by U.S. issuers of financial statements prepared in accordance with IFRS. IFRS is a comprehensive series of accounting standards published by the International Accounting Standards Board (“IASB”). Under the proposed roadmap, the Company may be required to prepare financial statements in accordance with IFRS as early as 2014. The SEC will make a determination in 2011 regarding the mandatory adoption of IFRS. The Company is currently assessing the impact that this potential change would have on its operating results and financial condition, and will continue to monitor the development of the potential implementation of IFRS.
- 59 -
In January 2010, the Financial Accounting Standards Board (“FASB”) issued Accounting Standards Update (“ASU”) 2010-06, “Fair Value Measurements and Disclosures (Topic 820): Improving Disclosures about Fair Value Measurements.” ASU 2010-06 amends Topic 820 by requiring more robust disclosures about (i) the different classes of assets and liabilities measured at fair value, (ii) the valuation techniques and inputs used, (iii) the activity in Level 3 fair value measurements, and (iv) the transfers between Levels 1, 2, and 3. Among other things, ASU 2010-06 requires separate disclosures about purchases, sales, issuances and settlements in the roll forward of activity in Level 3 fair value measurements as opposed to presenting such activity on a net basis. The new disclosures required by ASU 2010-06 are effective for interim and annual reporting periods beginning after December 15, 2009, except for the disclosures about the roll forward of activity in Level 3 fair value measurements which are effective for interim and annual periods beginning after December 15, 2010. The provisions of ASU 2010-06 did not have a material impact on the Company’s financial position, results of operations or liquidity, but required expansion of the Company’s disclosures about fair value measurements.
ASU - Accounting Standards Update No. 2010-18, Receivables (Topic 310): Effect of a Loan Modification When the Loan Is Part of a Pool That Is Accounted for as a Single Asset. This ASU codifies the consensus reached in EITF Issue No. 09-I, “Effect of a Loan Modification When the Loan Is Part of a Pool That Is Accounted for as a Single Asset.” The amendments to the FASB Accounting Standards Codification™ (Codification) provide that modifications of loans that are accounted for within a pool under Subtopic 310-30 do not result in the removal of those loans from the pool even if the modification of those loans would otherwise be considered a troubled debt restructuring. An entity will continue to be required to consider whether the pool of assets in which the loan is included is impaired if expected cash flows for the pool change. ASU 2010-18 does not affect the accounting for loans under the scope of Subtopic 310-30 that are not accounted for within pools. Loans accounted for individually under Subtopic 310-30 continue to be subject to the troubled debt restructuring accounting provisions within Subtopic 310-40.
ASU 2010-18 is effective prospectively for modifications of loans accounted for within pools under Subtopic 310-30 occurring in the first interim or annual period ending on or after July 15, 2010. Early application is permitted. Upon initial adoption of ASU 2010-18, an entity may make a one-time election to terminate accounting for loans as a pool under Subtopic 310-30. This election may be applied on a pool-by-pool basis and does not preclude an entity from applying pool accounting to subsequent acquisitions of loans with credit deterioration. The adoption of this update did not have an impact on the consolidated financial statements.
ASU - Accounting Standards Update (ASU) No. 2010-11, Derivatives and Hedging (Topic 815): Scope Exception Related to Embedded Credit Derivatives. The FASB believes this ASU clarifies the type of embedded credit derivative that is exempt from embedded derivative bifurcation requirements. Specifically, only one form of embedded credit derivative qualifies for the exemption - one that is related only to the subordination of one financial instrument to another. As a result, entities that have contracts containing an embedded credit derivative feature in a form other than such subordination may need to separately account for the embedded credit derivative feature. The amendments in the ASU are effective for each reporting entity at the beginning of its first fiscal quarter beginning after June 15, 2010. Early adoption is permitted at the beginning of each entity’s first fiscal quarter beginning after March 5, 2010. The adoption of this update did not have an impact on the consolidated financial statements.
ASU No. 2010-20 and ASU No. 2011-01 - In 2010, the Company adopted the provisions of Accounting Standards Update (“ASU”) No. 2010-20, Receivables (Topic 310): Disclosures about the Credit Quality of Financing Receivables and the Allowance for Credit Losses” , which require the Company to provide new disclosures in its financial statements to improve the transparency of financial reporting by requiring enhanced disclosures about the Company’s allowance for credit losses as well as the credit quality of the Company’s loan portfolio.
The additional disclosures required are incorporated in Notes 4 and 5 in these consolidated financial statements.
In January 2011, the Financial Accounting Standards Board (“FASB”) issued ASU No 2011-01, Receivables (Topic 310): Deferral of the
Effective Date of Disclosures about Troubled Debt Restructurings in Update No. 2010-20, that temporarily delays the effective date of the disclosures about troubled debt restructurings (“TDRs”) that are included in ASU No 2010-20. The TDR disclosure guidance will be coordinated with the FASB’s proposed guidance for determining what constitutes a TDR and is currently anticipated to be effective for interim and annual periods ending after July 15, 2011
Reclassifications
Certain reclassifications have been made to prior year end financial statements in order to conform to the classification adopted for reporting in 2010.
Note 2. Cash and Due from Banks
Certain reserves are required to be maintained at the Federal Reserve Bank. The requirement as of December 31, 2010 and 2009 was $14.1 million and $13.7 million, respectively.
At December 31, 2010, the Company had accounts at correspondent banks, excluding the Federal Reserve Bank, but none of which exceeded the FDIC insured limits. At December 31, 2009 the Company had accounts that exceeded the FDIC insured limits of $250,000 by $9.0 million. This balance was held at JPMorgan Chase, the correspondent bank which is used to clear cash letters.
- 60 -
Note 3. Securities
A summary comparison of securities by type at December 31, 2010 and 2009 is shown below.
|
December 31, 2010
|
December 31, 2009
|
||||||||||||||||||||||||||||||
|
Gross
|
Gross
|
Gross
|
Gross
|
||||||||||||||||||||||||||||
|
Amortized
|
Unrealized
|
Unrealized
|
Fair
|
Amortized
|
Unrealized
|
Unrealized
|
Fair
|
||||||||||||||||||||||||
|
Cost
|
Gains
|
Losses
|
Value
|
Cost
|
Gains
|
Losses
|
Value
|
||||||||||||||||||||||||
|
(in thousands)
|
|||||||||||||||||||||||||||||||
|
Available for sale:
|
|||||||||||||||||||||||||||||||
|
U.S. Government Agencies
|
$
|
172,958
|
$
|
242
|
$
|
(3,982
|
)
|
$
|
169,218
|
$
|
140,843
|
$
|
382
|
$
|
(1,562
|
) |
$
|
139,663
|
|||||||||||||
|
Mortgage-backed obligations
|
-
|
-
|
-
|
-
|
1,472
|
104
|
-
|
|
1,576
|
||||||||||||||||||||||
|
Asset-backed securities
|
-
|
-
|
-
|
-
|
-
|
8
|
-
|
|
8
|
||||||||||||||||||||||
|
Corporate debt securities
|
138,925
|
4,804
|
(1,331
|
)
|
142,398
|
92,414
|
5,648
|
(1,086
|
)
|
96,976
|
|||||||||||||||||||||
|
Mutual funds or other equity securities
|
1,250
|
20
|
(132
|
)
|
1,138
|
1,380
|
62
|
(185
|
)
|
1,257
|
|||||||||||||||||||||
|
Municipal bonds
|
9,388
|
-
|
(14
|
) |
9,374
|
10,000
|
-
|
-
|
10,000
|
||||||||||||||||||||||
|
Total available for sale securities
|
$
|
322,521
|
$
|
5,066
|
$
|
(5,459
|
)
|
$
|
322,128
|
$
|
246,109
|
$
|
6,204
|
$
|
(2,833
|
)
|
$
|
249,480
|
|||||||||||||
|
Held to maturity:
|
|||||||||||||||||||||||||||||||
|
U.S. Government Agencies
|
$
|
159,833
|
$
|
-
|
$
|
(4,507
|
) |
$
|
155,326
|
$
|
10,721
|
$
|
52
|
$
|
-
|
$
|
10,773
|
||||||||||||||
|
Mortgage-backed obligations
|
-
|
-
|
-
|
-
|
1,628
|
61
|
-
|
|
1,689
|
||||||||||||||||||||||
|
Total held to maturity securities
|
$
|
159,833
|
$
|
-
|
$
|
(4,507
|
) |
$
|
155,326
|
$
|
12,349
|
$
|
113
|
$
|
-
|
|
$
|
12,462
|
|||||||||||||
The scheduled maturities of securities at December 31, 2010, by contractual maturity, are shown below. Expected maturities may differ from contractual maturities because borrowers may have the right to call or prepay obligations with or without call or prepayment penalties.
|
December 31, 2010
|
||||||||
|
Amortized
|
Fair
|
|||||||
|
Cost
|
Value
|
|||||||
|
(in thousands)
|
||||||||
|
Available For Sale:
|
||||||||
|
Due in one year or less
|
$
|
11,434
|
$
|
11,656
|
||||
|
Due after one year through five years
|
65,880
|
69,424
|
||||||
|
Due after five years through 10 years
|
158,181
|
156,417
|
||||||
|
Over 10 years
|
87,026
|
84,631
|
||||||
|
Total available for sale securities
|
$
|
322,521
|
$
|
322,128
|
||||
|
Held to Maturity:
|
||||||||
|
Due in one year or less
|
$
|
-
|
$
|
-
|
||||
|
Due after one year through five years
|
7,968
|
7,968
|
||||||
|
Due after five years through 10 years
|
106,876
|
104,065
|
||||||
|
Over 10 years
|
44,989
|
43,293
|
||||||
|
Total held to maturity securities
|
$
|
159,833
|
$
|
155,326
|
||||
At December 31, 2010 and 2009, approximately $271.5 million and $154.5 million, respectively, in securities were pledged to secure public fund deposits, and for other purposes required or permitted by law. Gross realized gains were $3.0 million, $2.1 million and $4,000 for the years ended December 31, 2010, 2009 and 2008, respectively. Gross realized losses were $9,000, $61,000 and $5,000 for the years ended December 31, 2010, 2009 and 2008. The tax (benefit) provision applicable to these realized net (losses)/gains amounted to $1.0 million, $0.7 million for 2010 and 2009, respectively. There was no tax related provision/(benefit) for 2008. Proceeds from sales of securities classified as available for sale amounted to $31.8 million, $22.1 million and $0.2 million for the years ended December 31, 2010, 2009 and 2008, respectively.
- 61 -
The following is a summary of the fair value of securities with gross unrealized losses and an aging of those gross unrealized losses at December 31, 2010.
|
Less Than 12 Months
|
12 Months or More
|
Total
|
||||||||||||||||||||||
|
Gross
|
Gross
|
Gross
|
||||||||||||||||||||||
|
Unrealized
|
Unrealized
|
Unrealized
|
||||||||||||||||||||||
|
Fair Value
|
Losses
|
Fair Value
|
Losses
|
Fair Value
|
Losses
|
|||||||||||||||||||
|
(in thousands)
|
||||||||||||||||||||||||
|
Available for sale:
|
||||||||||||||||||||||||
|
U.S. Treasury and U.S.
|
||||||||||||||||||||||||
|
Government agencies
|
$
|
133,974
|
$
|
3,982
|
$
|
-
|
$
|
-
|
$
|
133,974
|
$
|
3,982
|
||||||||||||
|
Corporate debt securities
|
41,544
|
1,019
|
2,862
|
312
|
44,406
|
1,331
|
||||||||||||||||||
| Municipal securities | 985 | 14 | - | - | 985 | 14 | ||||||||||||||||||
|
Mutual funds or other equity securites
|
-
|
-
|
369
|
132
|
369
|
132
|
||||||||||||||||||
|
Total available for sale securities
|
$
|
176,503
|
$
|
5,015
|
$
|
3,231
|
$
|
444
|
$
|
179,734
|
$
|
5,459
|
||||||||||||
|
Held to maturity:
|
||||||||||||||||||||||||
|
U.S. Treasury and U.S.
|
||||||||||||||||||||||||
|
Government agencies
|
$
|
130,373
|
$
|
4,507
|
$
|
-
|
$
|
-
|
$
|
130,373
|
$
|
4,507
|
||||||||||||
|
Total held to maturity securities
|
$
|
130,373
|
$
|
4,507
|
$
|
-
|
$
|
-
|
$
|
130,373
|
$
|
4,507
|
||||||||||||
At December 31, 2010, 227 debt securities and 2 equity securities have gross unrealized losses of $10.0 million or 3.1% of amortized cost. The gross unrealized losses in the portfolio resulted from increases in market interest rates, illiquidity, and declines in net income and other financial indicators caused by the national economy in the market and not from deterioration in the creditworthiness of the issuer. The Company believes that it will collect all amounts contractually due and has the intent and the ability to hold these securities until the fair value is at least equal to the carrying value. The Company had fifty-seven U.S. Government agency securities, one-hundred fifty-six corporate debt securities and one municipal that had gross unrealized losses for less than 12 months. The Company had thirteen corporate debt securities and two equity securities which have been in a continuous unrealized loss position for 12 months or longer. All securities with unrealized losses greater than 12 months were classified as available for sale. Securities with unrealized losses less than 12 months included $176.5 million classified as available for sale and $159.8 million in held to maturity agency securities.
During the fourth quarter of 2009, three agency securities with a par value of $10.0 million were transferred from available for sale to held to maturity. These three securities had a fair market value totaling $9.8 million and an average maturity of aproximately 14 years. The unrealized loss of $0.2 million was recorded as a component of other comprehensive loss and will be amortized over the life of the securities or until the security is called.
Irrespective of the classification, accounting and reporting treatment as AFS or HTM securities, if any decline in the market value of a security is deemed to be other than temporary, then the security’s carrying value shall be written down to fair value and the amount of the write down reflected in earnings. Management evaluates securities for other-than-temporary impairment at least quarterly and more frequently when economic or market conditions warrant such evaluation. Consideration is given to (i) the length of time and the extent to which the fair value has been less than cost, (ii) the financial condition and near-term prospects of the issuer, (iii) the recovery of contractual principal and interest and (iv) the intent and ability of the Company to retain its investment in the issuer for a period of time sufficient to allow for any anticipated recovery in fair value. In analyzing an issuer’s financial condition, Management considers whether the securities are issued by the federal government or its agencies, whether downgrades by bond rating agencies have occurred and industry reports.
The amount of investment securities issued by government agencies, mortgage-backed and asset-backed securities with unrealized losses and the amount of unrealized losses on those investment securities are primarily the result of market interest rates and illiquidity in the market. The company has the ability and intent to hold these securities until recovery, which may be until maturity.
The corporate debt securities consist primarily of corporate bonds issued by financial institutions, insurance and real estate companies. Also included in corporate debt securities are trust preferred capital securities, many issued by national and global financial services firms. The market values of corporate bonds have declined over the last several months due to larger credit spreads on financial sector debt as well as the real estate markets. The Company believes that the each of the issuers will be able to fulfill the obligations of these securities. The Company has the ability and intent to hold these securities until they recover, which could be at their maturity dates.
In the second quarter of 2010, the Company sold the $12.1 million that remained in the held to maturity category. This represented approximately 4.0% of the total investment portfolio and 1.0% of assets. Several of the securities sold included mortgage backed securities and agency bullet securities which were no longer part of Management's investment portfolio strategy. During the third quarter of 2010, the Company experienced significant deposit growth but decreased loan demand. Deposits grew approximately $123.0 million or 14.0% from June 30, 2010 to December 31, 2010. Net loans declined $38.0 million or 6.0% during the same period. Investment securities increased $142.0 million or 42% from June 30, 2010 to December 31, 2010. Market conditions continued to be historically volatile and interest rates declined to levels not seen in decades.
Given the changes in the Company’s balance sheet observed during the third quarter and following the completion of a five year strategic plan, certain securities purchased pursuant to this plan were classified as held to maturity. The Company determined the unprecedented market conditions and volatility coupled with a revised five year strategic plan that a waiting period of one quarter was appropriate based on the materiality conditions and the type of securities in the held to maturity portfolio sold during the second quarter of 2010.
The held to maturity portfolio is comprised of government sponsored enterprise securities such as FHLB, FNMA, FHLMC, and FFCB. The securities have maturities of 15 years or less and the securities are used to collateralize public funds. The Company has maintained public funds in excess of $175.0 million since December 2007. Management believes that public funds will continue to be a significant part of the Company's deposit base and will need to be collateralized by securities in the investment portfolio.
- 62 -
Other than the corporate debt securities, the Company attributes the unrealized losses mainly to increases in market interest rates over the yield available at the time the underlying securities were purchased and does not expect to incur a loss unless the securities are sold prior to maturity.
Overall market declines, particularly in the banking and financial institutions, as well as the real estate market, are a result of significant stress throughout the regional and national economy. Securities with unrealized losses, in which the Company has not already taken an OTTI charge, are currently performing according to their contractual terms. Management has the intent and ability to hold these securities for the foreseeable future. The fair value is expected to recover as the securities approach their maturity or repricing date or if market yields for such investments decline. As a result of uncertainties in the market place affecting companies in the financial services industry, it is at least reasonably possible that a change in the estimate will occur in the near term.
Securities that are other-than-temporarily impaired are evaluated at least quarterly. The evaluation includes performance indications of the underlying assets in the security, loan to collateral value, third-party guarantees, current levels of subordination, geographic concentrations, industry analysts reports, sector credit ratings, volatility of the securities fair value, liquidity, leverage and capital ratios, the company’s ability to continue as a going concern. If the company is in bankruptcy, the status and potential out come is also considered.
The Company believes that the securities with unrealized losses reflect impairment that is temporary and that there are currently no securities with other-than-temporary impairment.
During 2010, the Company did not record an impairment write-down on its securities.
During 2009, the Company recorded an impairment writedown totaling $0.8 million. The impairment writedown consisted of one corporate debt security totaling $0.2 million issued by Colonial Bank which had an unrealized loss of $0.2 million, three asset backed securities totaling $0.4 million issued by ALESCO which had unrealized losses of $0.4 million and two asset backed securities totaling $0.2 million issued by TRAPEZA which had unrealized losses of $0.2 million.
During 2008, the Company recorded an impairment writedown totaling $4.6 million. The impairment writedown consisted of three preferred stocks of Fannie Mae and Freddie Mac totaling $3.0 million, on a cost basis, which had unrealized losses of $2.0 million and $1.0 million, respectively, debt securities totaling $0.7 million and $0.2 million issued by Lehman Brothers and Washington Mutual which had unrealized losses of $0.6 million and $0.2 million, respectively. The Company also recorded an impairment writwdown on $0.5 million and $0.7 million in asset backed securities issued by TRAPEZA and ALESCO (CDOs) which had unrealized losses of $0.3 million and $0.4 million, respectively.
At December 31, 2010, the Company’s exposure to four investment security issuers exceeded 10% of stockholders’ equity as follows:
|
Amortized
|
Fair
|
|||||||
|
Cost
|
Value
|
|||||||
|
(in thousands)
|
||||||||
|
Federal Home Loan Bank (FHLB)
|
$
|
158,881
|
$
|
154,621
|
||||
|
Federal Home Loan Mortgage Corporation (Freddie Mac)
|
30,991
|
30,472
|
||||||
|
Federal National Mortgage Association (Fannie Mae)
|
24,999
|
24,428
|
||||||
|
Federal Farm Credit Bank (FFCB)
|
115,921
|
113,024
|
||||||
|
Total
|
$
|
330,792
|
$
|
322,545
|
||||
- 63 -
Note 4. Loans
The following table summarizes the components of the Company's loan portfolio as of December 31, 2010 and 2009:
|
December 31,
|
||||||||||||||||
|
2010
|
2009
|
|||||||||||||||
|
As % of
|
As % of
|
|||||||||||||||
|
Balance
|
Category
|
Balance
|
Category
|
|||||||||||||
|
(in thousands)
|
||||||||||||||||
|
Real estate
|
||||||||||||||||
|
Construction & land development
|
$
|
65,570 | 11.4 |
%
|
$
|
78,686
|
13.3
|
%
|
||||||||
|
Farmland
|
13,337 | 2.3 |
%
|
11,352
|
1.9
|
%
|
||||||||||
|
1-4 Family
|
73,158 | 12.7 |
%
|
77,470
|
13.1
|
%
|
||||||||||
|
Multifamily
|
14,544 | 2.5 |
%
|
8,927
|
1.5
|
%
|
||||||||||
|
Non-farm non-residential
|
292,809 | 50.8 |
%
|
300,673
|
51.0
|
%
|
||||||||||
|
Total real estate
|
459,418 | 79.7 |
%
|
477,108
|
80.8
|
%
|
||||||||||
|
Agricultural
|
17,361 | 3.0 |
%
|
14,017
|
2.4
|
%
|
||||||||||
|
Commercial and industrial
|
76,590 | 13.3 |
%
|
82,348
|
13.9
|
%
|
||||||||||
|
Consumer and other
|
22,970 | 4.0 |
%
|
17,226
|
2.9
|
%
|
||||||||||
|
Total loans before unearned income
|
576,339 | 100.0 |
%
|
590,699
|
100.0
|
%
|
||||||||||
|
Less: unearned income
|
(699 |
)
|
(797
|
)
|
||||||||||||
|
Total loans net of unearned income
|
$
|
575,640 |
$
|
589,902
|
||||||||||||
The following table summarizes fixed and floating rate loans by maturity and repricing frequencies as of December 31, 2010:
|
December 31, 2010
|
||||||||||||
|
Fixed
|
Floating
|
Total
|
||||||||||
|
(in thousands)
|
||||||||||||
|
One year or less
|
$
|
67,944
|
$
|
167,399
|
$
|
235,343
|
||||||
|
One to five years
|
127,401
|
132,345
|
259,746
|
|||||||||
|
Five to 15 years
|
2,456
|
30,953
|
33,409
|
|||||||||
|
Over 15 years
|
9,735
|
9,388
|
19,123
|
|||||||||
|
Subtotal
|
207,536
|
340,085
|
547,621
|
|||||||||
|
Nonaccrual loans
|
28,718
|
|||||||||||
|
Total loans before unearned income
|
$
|
576,339
|
||||||||||
| Unearned income | (699 | ) | ||||||||||
|
Total loans net of unearned income
|
|
$
|
575,640
|
- 64 -
The following table presents the age analysis of past due loans at December 31, 2010:
| As of December 31, 2010 | |||||||||||||||||||
| (in thousands) | |||||||||||||||||||
| Recorded Investment > | |||||||||||||||||||
| 30-89 Days Past Due | Greater Than 90 Days | Total Past Due | Current | Total Loans | 90 Days Accruing | ||||||||||||||
| Real estate | |||||||||||||||||||
| Construction & land development | $ | 1,574 | $ | 3,383 | $ | 4,957 | $ | 60,613 | $ | 65,570 | $ | - | |||||||
|
Farmland
|
41 | - | 41 | 13,296 | 13,337 | - | |||||||||||||
| 1 - 4 family | 4,742 | 3,189 | 7,931 | 65,227 | 73,158 | 1,663 | |||||||||||||
| Multifamily | 5,781 | 1,357 | 7,138 | 7,406 | 14,544 | - | |||||||||||||
| Non-farm non-residential | 7,960 | 21,944 | 29,904 | 262,905 | 292,809 | - | |||||||||||||
| Total real estate | 20,098 | 29,873 | 49,971 | 409,447 | 459,418 | 1,663 | |||||||||||||
| Agricultural | 333 | 446 | 779 | 16,582 | 17,361 | - | |||||||||||||
| Commercial and industrial | 1,203 | 76 | 1,279 | 75,311 | 76,590 | - | |||||||||||||
| Consumer and other | 287 | 42 | 329 | 22,641 | 22,970 | 10 | |||||||||||||
| Total loans before unearned income | $ | 21,921 | $ | 30,437 | $ | 52,358 | 523,981 | $ | 576,339 | $ | 1,673 | ||||||||
| Less: unearned income | (699 | ) | |||||||||||||||||
| Total loans net of unearned income | $ | 575,640 | |||||||||||||||||
Management monitors the credit quality of its loans on an ongoing basis. Measurement of delinquency and past due status are based on the contractual terms of each loan.
For all loan classes, past due loans are reviewed on a monthly basis to identify loans for nonaccrual status. Generally, when collection in full of the principal and interest is jeopardized, the loan is placed on nonaccrual. The accrual of interest income on commercial and most consumer loans generally is discontinued when a loan becomes 90 to 120 days past due as to principal or interest. When interest accruals are discontinued, unpaid interest recognized in income is reversed. The Company's method of income recognition for loans that are classified as nonaccrual is to recognize interest income on a cash basis or apply the cash receipt to principal when the ultimate collectibility of principal is in doubt. Nonaccrual loans will not normally be returned to accrual status unless all past due principal and interest has been paid.
The following is a summary of Non-accrual loans by class:
| As of December 31, 2010 | |||||
| (in thousands) | |||||
| Real estate: | |||||
| Construction & land development | $ | 3,383 | |||
| Farmland | - | ||||
| 1 - 4 family | 1,480 | ||||
| Multifamily | 1,357 | ||||
| Non-farm non-real estate | 21,944 | ||||
| Total real estate | 28,164 | ||||
| Agricultural | 446 | ||||
| Commercial and industrial | 76 | ||||
| Consumer and other | 32 | ||||
| Total | $ | 28,718 | |||
- 65 -
The Company assigns credit quality indicators of pass, special mention, and substandard to its loans. For the Company’s loans with a corporate credit exposure, the Company internally assigns a grade based on the creditworthiness of the borrower. For loans with a consumer credit exposure, the Bank internally assigns a grade based upon an individual loan’s delinquency status.
Loans included in the Pass category are performing loans with satisfactory debt coverage ratios, collateral, payment history, and documentation.
Special mention loans have potential weaknesses that deserve management’s close attention. If left uncorrected, these potential weaknesses may result in deterioration of the repayment prospects for the loans or in the Company’s credit position at some future date. Borrowers may be experiencing adverse operating trends (declining revenues or margins) or an ill proportioned balance sheet (e.g., increasing inventory without an increase in sales, high leverage, tight liquidity). Adverse economic or market conditions, such as interest rate increases or the entry of a new competitor, may also support a special mention rating. Nonfinancial reasons for rating a credit exposure special mention include management problems, pending litigation, an ineffective loan agreement or other material structural weakness, and any other significant deviation from prudent lending practices.
A substandard loan with a corporate credit exposure is inadequately protected by the current sound worth and paying capacity of the obligor or of the collateral pledged, if any. Loans so classified have a well-defined weakness, or weaknesses, that jeopardize the liquidation of the debt by the borrower. They are characterized by the distinct possibility that the Company will sustain some loss if the deficiencies are not corrected. They require more intensive supervision by management. Substandard loans are generally characterized by current or expected unprofitable operations, inadequate debt service coverage, inadequate liquidity, or marginal capitalization. Repayment may depend on collateral or other credit risk mitigants. For some substandard loans, the likelihood of full collection of interest and principal may be in doubt and thus, placed on nonaccrual. For loans with a consumer credit exposure, loans that are 90 days or more past due or that have been placed on nonaccrual are considered substandard.
The following table identifies the Credit Exposure of the Loan Portfolio by specific credit ratings:
| As of December 31, 2010 | |||||||||||||
| (in thousands) | |||||||||||||
| Corporate Credit Exposure -- by Credit Rating | Pass | Special Mention | Substandard | Total | |||||||||
|
Real Estate
|
|||||||||||||
| Construction & land development | $ | 55,228 | $ | 249 | $ | 10,093 | $ | 65,570 | |||||
| Farmland | 13,296 | - | 41 | 13,337 | |||||||||
| 1 - 4 family | 60,870 | 4,172 | 8,116 | 73,158 | |||||||||
| Multifamily | 8,763 | - | 5,781 | 14,544 | |||||||||
| Non-farm non-residential | 258,740 | 141 | 33,928 | 292,809 | |||||||||
| Total real estate | 396,897 | 4,562 | 57,959 | 459,418 | |||||||||
| Agricultural | 17,361 | - | - | 17,361 | |||||||||
| Consumer and industrial | 73,686 | 13 | 2,891 | 76,590 | |||||||||
| Consumer and other | 22,845 | 32 | 93 | 22,970 | |||||||||
| Total loans before unearned income | $ | 510,789 | $ | 4,607 | $ | 60,943 | $ | 576,339 | |||||
| Less: unearned income | (699 | ) | |||||||||||
| Total loans net of unearned income | $ |
575,640
|
|||||||||||
- 66 -
Note 5. Allowance for Loan Losses
A summary of changes in the allowance for loan losses, by portolio type, for the year ended December 31, 2010 is as follows:
| As of December 31, 2010 | ||||||||||||||||||||||||||||||
| (in thousands) | ||||||||||||||||||||||||||||||
| Real Estate Loans: | Non-Real Estate Loans: | |||||||||||||||||||||||||||||
| Construction and Land Development | Farmland | 1-4 Family | Multi-family | Non-farm non-residential | Agricultural | Commercial and industrial | Consumer and other | Unallocated | Total | |||||||||||||||||||||
| Allowance for credit Losses: | ||||||||||||||||||||||||||||||
| Beginning balance | $ | 1,176 | 56 | 2,466 | $ | 128 | $ | 2,727 | $ | 82 | $ | 1,031 | $ | 246 | 7 | $ | 7,919 | |||||||||||||
| Charge-offs | (5 | ) | - | (1,534 | ) | - | (235 | ) | - | (3,395 | ) | (444 | ) | - | (5,613 | ) | ||||||||||||||
| Recoveries | 1 | - | 11 | - | 30 | - | 164 | 151 | - | 357 | ||||||||||||||||||||
| Provision | (195 | ) | (10 | ) | 948 | 359 | 901 | (2 | ) | 2,710 | 437 | 506 | 5,654 | |||||||||||||||||
| Ending Balance | $ | 977 | $ | 46 | $ | 1,891 | $ | 487 | $ | 3,423 | $ | 80 | $ | 510 | $ | 390 | $ | 513 | $ | 8,317 | ||||||||||
| Allowance at the end of year: | ||||||||||||||||||||||||||||||
| Individually evaluated for impairment | $ | 323 | $ | - | $ | 726 | $ | 179 | $ | 1,901 | $ | - | $ | 408 | $ | - | - | $ | 3,537 | |||||||||||
| Collectively evaluated for impairment | 654 | 46 | 1,165 | 308 | 1,522 | 80 | 102 | 390 | 513 | 4,780 | ||||||||||||||||||||
| Loans at end of year (before unearned income) | $ | 65,570 | $ | 13,337 | $ | 73,158 | $ | 14,544 | $ | 292,809 | $ | 17,361 | $ | 76,590 | $ | 22,970 | - | $ | 576,339 | |||||||||||
| Loans individually evaluated for impairment | 6,222 | - | 4,450 | 7,138 | 35,931 | - | 2,735 | - | - | 56,476 | ||||||||||||||||||||
| Loans collectively evaluated for impairment | 59,348 | 13,337 | 68,708 | 7,406 | 256,878 | 17,361 | 73,855 | 22,970 | - | 519,863 | ||||||||||||||||||||
Negative provisions are caused by changes in the composition and credit quality of the loan portfolio. The result is a re-allocation of the loan loss reserve from one category to another.
- 67 -
Changes in the allowance for loan losses are as follows:
|
Years Ended December 31,
|
||||||||||||
|
2010
|
2009
|
2008
|
||||||||||
|
(in thousands)
|
||||||||||||
|
Balance, beginning of year
|
$
|
7,919
|
$
|
6,482
|
$
|
6,193
|
||||||
|
Provision charged to expense
|
5,654
|
4,155
|
1,634
|
|||||||||
|
Loans charged off
|
(5,613
|
)
|
(2,879
|
)
|
(1,613
|
)
|
||||||
|
Recoveries
|
357
|
161
|
268
|
|||||||||
|
Balance, end of year
|
$
|
8,317
|
$
|
7,919
|
$
|
6,482
|
||||||
The allowance for loan losses is reviewed by Management on a monthly basis and additions thereto are recorded in order to maintain the allowance at an adequate level. In assessing the adequacy of the allowance, Management considers a variety of internal and external factors that might impact the performance of individual loans. These factors include, but are not limited to, economic conditions and their impact upon borrowers' ability to repay loans, respective industry trends, borrower estimates and independent appraisals. Periodic changes in these factors impact Management's assessment of each loan and its overall impact on the adequacy of the allowance for loan losses.
The monitoring of credit risk also extends to unfunded credit commitments, such as unused commercial credit lines and letters of credit, and management establishes reserves as needed for its estimate of probable losses on such commitments.
As of December 31, 2010, 2009 and 2008, the Company had loans totaling $28.7 million, $14.2 million and $9.1 million, respectively, on which the accrual of interest had been discontinued. As of December 31, 2010, 2009 and 2008, the Company had loans past due 90 days or more and still accruing interest totaling $1.7 million, $0.8 million, and $0.2 million, respectively.
The average amount of non-accrual loans in 2010 was $21.45 million compared to $10.6 million in 2009. Had these loans performed in accordance with their original terms, the Company's interest income would have been increased by approximately $1.65 million and $0.4 million for the years ended December 31, 2010 and 2009, respectively. Impaired loans at December 31, 2010 and 2009, including non-accrual loans, amounted to $56.5 million and $33.9 million, respectively. The portion of the allowance for loan losses allocated to all impaired loans amounted to $3.5 million and $2.7 million at December 31, 2010 and 2009, respectively. As of December 31, 2010, the Company has no outstanding commitments to advance additional funds in connection with impaired loans.
- 68 -
The following is a summary of information pertaining to impaired loans as of December 31:
|
2010
|
2009
|
||||||||||
|
(in thousands)
|
|||||||||||
|
Impaired loans without a valuation allowance
|
$
|
8,713 |
$
|
5,853
|
|||||||
|
Impaired loans with a valuation allowance
|
47,763 |
28,080
|
|||||||||
|
Total impaired loans
|
$
|
56,476 |
$
|
33,933
|
|||||||
|
Valuation allowance related to impaired loans
|
$
|
3,537 |
$
|
2,967
|
|||||||
|
Total nonaccrual loans
|
$
|
28,718 |
$
|
14,183
|
|||||||
|
Total loans past due ninety days and still accruing
|
$
|
1,673 |
$
|
785
|
|||||||
| 2010 | 2009 | 2008 | |||||||||
|
Average investment in impaired loans
|
$
|
37,094 |
$
|
8,979
|
$ | 9,027 | |||||
|
Interest income recognized on impaired loans
|
$
|
2,402 |
$
|
184
|
$ | 1,049 | |||||
|
Interest income recognized on a cash basis on impaired loans
|
$
|
1,304 |
$
|
565
|
$ | 283 | |||||
The following is a summary of impaired loans by class:
| As of December 31, 2010 | ||||||||||||||||
| (in thousands) | ||||||||||||||||
| Recorded Investment | Unpaid Principal Balance | Related Allowance | Average Recorded Investment | Interest Income Recognized | ||||||||||||
| With no related allowance: | ||||||||||||||||
| Real estate | ||||||||||||||||
| Construction & land development | $ | 4,105 | $ | 5,380 | $ | - | $ | 5,532 | $ | 389 | ||||||
| Farmland | - | - | - | - | - | |||||||||||
| 1 - 4 family | 53 | 684 | - | 2,576 | 204 | |||||||||||
| Multifamily | - | - | - | - | - | |||||||||||
| Non-farm non-residential | 4,555 | 4,555 | - | 3,331 | 203 | |||||||||||
| Total real estate | 8,713 | 10,619 | - | 11,439 | 796 | |||||||||||
| Agricultural | - | - | - | - | - | |||||||||||
| Commercial and industrial | - | - | - | 425 | 37 | |||||||||||
| Consumer and other | - | - | - | - | - | |||||||||||
| With an allowance recorded: | ||||||||||||||||
| Real estate | ||||||||||||||||
| Construction & land development | 2,117 | 2,117 | 323 | 2,557 | 182 | |||||||||||
| Farmland | - | - | - | - | - | |||||||||||
| 1 - 4 familty | 4,397 | 4,397 | 726 | 1,490 | 103 | |||||||||||
| Multifamily | 7,138 | 7,138 | 179 | 5,896 | 318 | |||||||||||
| Non-farm non-residential | 31,376 | 31,376 | 1,901 | 13,655 | 852 | |||||||||||
| Total real estate | 45,028 | 45,028 | 3,129 | 23,598 | 1,455 | |||||||||||
| Agricultural | - | - | - | - | - | |||||||||||
| Commercial and industrial | 2,735 | 2,735 | 408 | 1,632 | 114 | |||||||||||
| Consumer and other | - | - | - | - | - | |||||||||||
| Total | $ | 56,476 | $ | 58,382 | $ | 3,537 | $ | 37,094 | $ | 2,402 | ||||||
- 69 -
Note 6. Premises and Equipment
The major categories comprising premises and equipment at December 31, 2010 and 2009 are as follows:
|
December 31,
|
||||||||
|
2010
|
2009
|
|||||||
|
(in thousands)
|
||||||||
|
Land
|
$
|
4,539
|
$
|
4,514
|
||||
|
Bank premises
|
15,804
|
16,608
|
||||||
|
Furniture and equipment
|
15,074
|
14,264
|
||||||
| Construction in progress | 52 | - | ||||||
|
Acquired value
|
35,469
|
35,386
|
||||||
|
Less: accumulated depreciation
|
19,446
|
18,682
|
||||||
|
Net book value
|
$
|
16,023
|
$
|
16,704
|
||||
Depreciation expense amounted to approximately $1.2 million, $1.0 million, and $1.0 million for 2010, 2009, and 2008 , respectively.
Note 7. Goodwill and Other Intangible Assets
Goodwill and intangible assets deemed to have indefinite lives are no longer amortized, but are subject to annual impairment tests. Other intangible assets continue to be amortized over their useful lives. Goodwill for the year ended December 31, 2010 was $2.0 million and was acquired in the Homestead Bank acquisition in 2007. No impairment charges have been recognized since the acquisition. Mortgage servicing rights totaled $0.2 million at December 31, 2010 and $0.1 million at December 31, 2009. Other intangible assets recorded include core deposit intangibles, which are subject to amortization. The core deposits reflect the value of deposit relationships, including the beneficial rates, which arose from the purchase of other financial institutions and the purchase of various banking center locations from one single financial institution.
The following table summarizes the Company’s purchased accounting intangible assets subject to amortization.
|
December 31,
|
||||||||||||||||||||||||
|
2010
|
2009
|
|||||||||||||||||||||||
|
Gross Carrying
|
Accumulated
|
Net Carrying
|
Gross Carrying
|
Accumulated
|
Net Carrying
|
|||||||||||||||||||
|
Amount
|
Amortization
|
Amount
|
Amount
|
Amortization
|
Amount
|
|||||||||||||||||||
|
(in thousands)
|
||||||||||||||||||||||||
|
Core deposit intangibles
|
$
|
7,997
|
$
|
6,457
|
$
|
1,540
|
$
|
7,997
|
$
|
6,240
|
$
|
1,757
|
||||||||||||
|
Mortgage Servicing Rights
|
235
|
46
|
189
|
157
|
21
|
136
|
||||||||||||||||||
|
Total
|
$
|
8,232
|
$
|
6,503
|
$
|
1,729
|
$
|
8,154
|
$
|
6,261
|
$
|
1,893
|
||||||||||||
- 70 -
Amortization expense relating to purchase accounting intangibles totaled $0.2 million, $0.3 million, and $0.3 million for the year ended December 31, 2010, 2009, and 2008, respectively. Estimated future amortization expense is as follows:
| For the Years Ended | Estimated | ||||
|
December 31,
|
Amortization Expense
|
||||
|
(in thousands)
|
|||||
|
2011
|
$
|
218
|
|||
|
2012
|
216
|
||||
|
2013
|
185
|
||||
|
2014
|
185
|
||||
|
2015
|
185
|
||||
These estimates do not assume the addition of any new intangible assets that may be acquired in the future nor any writedowns resulting from impairment.
Note 8. Other Real Estate
As of December 31, 2010 and 2009 other real estate, net, (ORE) totaled $0.6 million and $0.7 million. ORE consisted of $0.2 million of 1-4 family residential properties, $0.3 million of construction, land development and other loans, and $0.1 million non-farm non-residential properties at December 31, 2010. At December 31, 2009, ORE consisted of $0.3 million of 1-4 family residential properties and $0.4 million of nan-farm non-residential properties.
Note 9. Deposits
The aggregate amount of jumbo time deposits, each with a minimum denomination of $100,000, was approximately $420.1 million and $271.2 million at December 31, 2010 and 2009, respectively.
At December 31, 2010, the scheduled maturities of time deposits are as follows:
|
December 31, 2010
|
||||
|
(in thousands)
|
||||
|
Due in one year or less
|
$
|
289,777
|
||
|
Due after one year through three years
|
303,772
|
|||
|
Due after three years
|
44,135
|
|||
|
Total
|
$
|
637,684
|
||
The table above includes brokered deposits totaling $12.9 million in reciprocal time deposits acquired from the Certificate of Deposit Account Registry Service (CDARS). At December 31, 2009, the Company had $10.1 million in brokered deposits under the CDARS program.
- 71 -
Note 10. Borrowings
Short-term borrowings are summarized as follows:
|
December 31,
|
||||||||
|
2010
|
2009
|
|||||||
|
(in thousands)
|
||||||||
|
Securities sold under agreements to repurchase
|
$
|
12,589
|
$
|
11,929
|
||||
|
Total short-term borrowings
|
$
|
12,589
|
$
|
11,929
|
||||
Securities sold under agreements to repurchase, which are classified as secured borrowings, generally mature daily. Interest rates on repurchase agreements are set by Management and are generally based on the 91-day Treasury bill rate. Repurchase agreement deposits are fully collateralized and monitored daily.
The Company’s available lines of credit with correspondent banks, including the Federal Home Loan Bank, totaled $100.6 million at December 31, 2010 and $139.5 million at December 31, 2009.
At December 31, 2010, the Company had $98.7 million in blanket lien availability (primarily secured by commercial real estate loans) and $98.4 million in custody status availability (primarily secured by commercial real estate loans and 1-4 family mortgage loans). Total gross availability at the FHLB was $197.2 million at December 31, 2010 but was reduced by its letters of credit totaling $145.0 million. Net availability with the FHLB at December 31, 2010 was $52.2 million. The Company also had lines available with other correspondent banks totaling $48.4 million at December 31, 2010.
With the exception of the FHLB, no other lines were outstanding with any other correspondent bank at December 31, 2010.
The following schedule provides certain information about the Company’s short-term borrowings during the periods indicated:
|
December 31,
|
||||||||||||
|
2010
|
2009
|
2008
|
||||||||||
|
(in thousands)
|
||||||||||||
|
Outstanding at year end
|
$
|
12,589
|
$
|
11,929
|
$
|
9,767
|
||||||
|
Maximum month-end outstanding
|
30,465
|
26,372
|
41,321
|
|||||||||
|
Average daily outstanding
|
13,086
|
18,233
|
11,379
|
|||||||||
|
Weighted average rate during the year
|
0.21
|
%
|
0.81
|
%
|
2.16
|
%
|
||||||
|
Average rate at year end
|
0.21
|
%
|
0.23
|
%
|
0.19
|
%
|
||||||
In November 2009, the Company originated a $10.0 million amortizing one year advance at a rate of 0.861%. In December 2009, the Company originated a $10.0 million interest only bullet advance with a one year maturity at a rate of 0.480%. The Company's long-term debt totaled $20.0 million at December 31, 2009. The Company had no long-term debt at December 31, 2010.
At December 31, 2010, letters of credit issued by the FHLB totaling $145.0 million were outstanding and carried as off-balance sheet items, all of which expire in 2011. At December 31, 2009, letters of credit issued by the FHLB totaling $140.0 million were outstanding and carried as off-balance sheet items, all of which expire in 2010. The letters of credit are solely used for pledging towards public fund deposits. See Note 19 to the Consolidated Financial Statements for additional information.
The FHLB has a blanket lien on substantially all of the Bank's loan portfolio that is used to secure borrowings from the FHLB.
- 72 -
Note 11. Issuance of Preferred Stock
On August 28, 2009, the Company entered into a Letter Agreement, which includes a Securities Purchase Agreement and a Side Letter Agreement (together, the “Purchase Agreement”), with the United States Department of the Treasury (“Treasury Department”) pursuant to which the Company has issued and sold to the Treasury Department 2,069.9 shares of the Company’s Fixed Rate Cumulative Perpetual Preferred Stock, Series A, par value $1,000 per share for a total purchase price of $20.7 million. In addition to the issuance of the Series A Stock, as a part of the transaction, the Company issued to the Treasury Department a warrant to purchase 114.44444 shares of the Company’s Fixed Rate Cumulative Preferred Stock, Series B, and immediately following the issuance of the Series A stock, the Treasury Department exercised its rights and acquired 103 of the Series B shares through a cashless exercise. The newly issued Series A Stock, generally non-voting stock, pays cumulative dividends of 5% for five years, and a rate of 9% dividends, per annum, thereafter. The newly issued Series B Stock, generally non-voting, pays cumulative dividends at a rate of 9% per annum. Both the Series A Stock and the Series B Stock were issued in a private placement.
Under the Treasury Department terms related to this issuance of the preferred stock Capital Purchase Program ("CPP") participating companies must adopt certain standards for executive compensation, including (a) prohibiting “golden parachute” payments as defined in the EESA to senior Executive Officers; (b) requiring recovery of any compensation paid to senior Executive Officers based on criteria that is later proven to be materially inaccurate; and (c) prohibiting incentive compensation that encourages unnecessary and excessive risks that threaten the value of the financial institution. The terms of the CPP also limit certain uses of capital by the issuer, including repurchases of company stock and increases in dividends.
Note 12. Minimum Capital Requirements
The Company and the Bank are subject to various regulatory capital requirements administered by the federal and state banking agencies. Failure to meet minimum capital requirements can initiate certain mandatory and possibly additional discretionary actions by regulators that, if undertaken, could have a direct material effect on the Company’s financial statements. Under capital adequacy guidelines and the regulatory framework for prompt corrective action, the Company and the Bank must meet specific capital guidelines that involve quantitative measures of their assets, liabilities and certain off-balance sheet items as calculated under regulatory accounting practices. The capital amounts and classification are also subject to qualitative judgments by the regulators about components, risk weightings and other factors. Prompt corrective action provisions are not applicable to bank holding companies.
Quantitative measures established by regulation to ensure capital adequacy require the Company and the Bank to maintain minimum amounts and ratios of total and Tier 1 capital to risk-weighted assets and of Tier 1 capital to average assets. Management believes, as of December 31, 2010 and 2009, that the Company and the Bank met all capital adequacy requirements to which they were subject.
As of December 31, 2010, the most recent notification from the Federal Deposit Insurance Corporation categorized the Bank as well capitalized under the regulatory framework for prompt corrective action. To be categorized as well capitalized, an institution must maintain minimum total risk-based, Tier 1 risk-based and Tier 1 leverage ratios as set forth in the following table. There are no conditions or events since the notification that Management believes have changed the Bank’s category. The Company’s and the Bank’s actual capital amounts and ratios as of December 31, 2010 and 2009 are presented in the following table.
|
Minimum
|
||||||||
|
To Be Well
|
||||||||
|
Capitalized Under
|
||||||||
|
Minimum Capital
|
Prompt Corrective
|
|||||||
|
Actual
|
Requirements
|
Action Provisions
|
||||||
|
Amount
|
Ratio
|
Amount
|
Ratio
|
Amount
|
Ratio
|
|||
|
(in thousands)
|
||||||||
|
December 31, 2010
|
||||||||
|
Total risk-based capital:
|
||||||||
|
First Guaranty Bancshares, Inc.
|
$102,828
|
13.03%
|
$63,117
|
8.00%
|
N/A
|
N/A
|
||
|
First Guaranty Bank
|
95,644
|
12.13%
|
63,096
|
8.00%
|
78,870
|
10.00%
|
||
|
Tier 1 capital:
|
||||||||
|
First Guaranty Bancshares, Inc.
|
94,511
|
11.98%
|
31,588
|
4.00%
|
N/A
|
N/A
|
||
|
First Guaranty Bank
|
87,347
|
11.07%
|
31,548
|
4.00%
|
47,322
|
6.00%
|
||
|
Tier 1 leverage capital:
|
||||||||
|
First Guaranty Bancshares, Inc.
|
94,511
|
8.69%
|
43,528
|
4.00%
|
N/A
|
N/A
|
||
|
First Guaranty Bank
|
87,347
|
8.06%
|
43,356
|
4.00%
|
54,195
|
5.00%
|
||
|
December 31, 2009
|
||||||||
|
Total risk-based capital:
|
||||||||
|
First Guaranty Bancshares, Inc.
|
$96,514
|
12.97%
|
$59,536
|
8.00%
|
N/A
|
N/A
|
||
|
First Guaranty Bank
|
91,388
|
12.22%
|
59,834
|
8.00%
|
74,793
|
10.00%
|
||
|
Tier 1 capital:
|
||||||||
|
First Guaranty Bancshares, Inc.
|
88,595
|
11.90%
|
29,768
|
4.00%
|
N/A
|
N/A
|
||
|
First Guaranty Bank
|
83,469
|
11.16%
|
29,917
|
4.00%
|
44,876
|
6.00%
|
||
|
Tier 1 leverage capital:
|
||||||||
|
First Guaranty Bancshares, Inc.
|
88,595
|
9.58%
|
36,979
|
4.00%
|
N/A
|
N/A
|
||
|
First Guaranty Bank
|
83,469
|
9.03%
|
36,985
|
4.00%
|
46,231
|
5.00%
|
||
- 73 -
Note 13. Dividend Restrictions
The Federal Reserve Bank ("FRB") has stated that generally, a bank holding company, should not maintain a rate of distributions to shareholders unless its available net income has been sufficient to fully fund the distributions, and the prospective rate of earnings retention appears consistent with the bank holding company’s capital needs, asset quality and overall financial condition. As a Louisiana corporation, the Company is restricted under the Louisiana corporate law from paying dividends under certain conditions. The Company is currently required to obtain prior written approval from the FRB before declaring or paying any corporate dividend.
First Guaranty Bank may not pay dividends or distribute capital assets if it is in default on any assessment due to the FDIC. First Guaranty Bank is also subject to regulations that impose minimum regulatory capital and minimum state law earnings requirements that affect the amount of cash available for distribution. In addition, under the Louisiana Banking Law, dividends may not be paid if it would reduce the unimpaired surplus below 50% of outstanding capital stock in any year.
The Bank is restricted under applicable laws in the payment of dividends to an amount equal to current year earnings plus undistributed earnings for the immediately preceding year, unless prior permission is received from the Commissioner of Financial Institutions for the State of Louisiana. Dividends payable by the Bank in 2011 without permission will be limited to 2011 earnings plus the undistributed earnings of $5.1 million from 2010.
Accordingly, at January 1, 2011, $85.6 million of the Company’s equity in the net assets of the Bank was restricted. Funds available for loans or advances by the Bank to the Company amounted to $9.6 million. In addition, dividends paid by the Bank to the Company would be prohibited if the effect thereof would cause the Bank’s capital to be reduced below applicable minimum capital requirements.
The Company is prohibited under the terms of the Treasury CPP program from certain capital uses, including repurchases of Company stock and increases in dividends until August 28, 2012. After that date and until redemption of the preferred stock, such capital uses must have prior permission from the Treasury Department.
Note 14. Related Party Transactions
In the normal course of business, the Company has loans, deposits and other transactions with its executive officers, directors and certain business organizations and individuals with which such persons are associated. An analysis of the activity of loans made to such borrowers during the year ended December 31, 2010 follows:
|
December 31,
|
||||||||
|
2010
|
2009
|
|||||||
|
(in thousands)
|
||||||||
|
Balance, beginning of year
|
$
|
23, 340
|
$
|
22,457
|
||||
|
New loans
|
8,636
|
16,098
|
||||||
|
Repayments
|
(12,490
|
)
|
(15,215
|
)
|
||||
|
Balance, end of year
|
$
|
19,486
|
$
|
23,340
|
||||
Unfunded commitments to the Company’s directors and executive officers totaled $13.4 million and $7.7 million at December 31, 2010 and 2009, respectively. At December 31, 2010 the Company had deposits from director's and executives totaling $12.6 million. There were no participations in loans purchased from affiliated financial institutions included in the Company’s loan portfolio in 2010. During 2009, there were no participations in loans purchased from affiliated financial institutions. There were no participations sold to affiliated financial institutions in 2010 and $2.4 million in participation sold to affilated financial institutions at December 31, 2009.
During the years ended 2010, 2009 and 2008, the Company paid approximately $0.6 million, $0.6 million and $0.5 million, respectively, for printing services and supplies and office furniture and equipment to Champion Graphic Communications (or subsidiary companies of Champion Industries, Inc.), of which Mr. Marshall T. Reynolds, the Chairman of the Company’s Board of Directors, is President, Chief Executive Officer, Chairman of the Board of Directors and holder of 35.2% of the capital stock as of January 28, 2011; approximately $1.4 million, $1.4 million and $1.3 million, respectively, to participate in the Champion Industries, Inc. employee medical benefit plan; and approximately $0.2 million, $0.2 million and $0.2 million, respectively, to Sabre Transportation, Inc. for travel expenses of the Chairman and other directors. These expenses include, but are not limited to, the utilization of an aircraft, fuel, air crew, ramp fees and other expenses attendant to the Company’s use. The Harrah and Reynolds Corporation, of which Mr. Reynolds is President and Chief Executive Officer and sole shareholder, has controlling interest in Sabre Transportation, Inc.
During the years ended 2010, 2009, and 2008 the Company paid approximately $73,000, $66,000 and $30,000, respectively, to subsidiaries of Hood Automotive Group, of which Mr. Hood is the President. Expenses include the purchases of new Company vehicles and services on Company owned vehicles.
During the year ended 2009 and 2008 the Company engaged the services of Cashe, Lewis, Coudrain and Sandage, attorneys-at-law, of which Mr. Alton Lewis, a director of the Company, was a partner, to represent the Company with certain legal matters. Mr. Lewis had a 25% ownership interest in the law firm. In October 2009, Mr. Lewis joined the Company as the Chief Executive Officer. As of that date, Mr. Lewis was no longer a partner in the law firm Cashe, Lewis, Coudrain and Sandage. The fees paid to Cashe, Lewis, Coudrain and Sandage for legal services totaled $0.1 million for the calendar period ended September 30, 2009. The fees paid for these legal services totaled $0.2 million for the year ended 2008. The Company has continued to be represented by Cashe, Coudrain, and Sandage in certain legal matters and for the remainder of 2009 the Company paid $23,000. In 2010 the Company paid $0.2 million for the services of Cashe, Coudrain, and Sandage.
- 74 -
Note 15. Employee Benefit Plans
The Company has an employee savings plan to which employees, who meet certain service requirements, may defer one to 20 percent of their base salaries, six percent of which may be matched up to 100%, at its sole discretion. Contributions to the savings plan were $129,000, $64,000, and $64,000 in 2010, 2009 and 2008, respectively.
An Employee Stock Ownership Plan (“ESOP”) benefits all eligible employees. Full-time employees who have been credited with at least 1,000 hours of service during a 12 consecutive month period and who have attained age 21 are eligible to participate in the ESOP. The plan document has been approved by the Internal Revenue Service. Contributions to the ESOP are at the sole discretion of the Company.
No contributions were made to the ESOP for the year 2010. Voluntary contributions of $100,000 to the ESOP were made in 2009 and 2008 for the purchase of shares from third parties at market value. As of December 31, 2010, the ESOP held 23,562 shares. In October of 2010, the ESOP plan was frozen and the Company does not plan to make future contributions to this plan.
Note 16. Other Expenses
The following is a summary of the significant components of other noninterest expense:
|
Years Ended December 31,
|
||||||||||||
|
2010
|
2009
|
2008
|
||||||||||
|
(in thousands)
|
||||||||||||
|
Other noninterest expense:
|
||||||||||||
|
Legal and professional fees
|
$
|
1,791
|
$
|
1,254
|
$
|
1,496
|
||||||
|
Operating supplies
|
594
|
537
|
572
|
|||||||||
|
Marketing and public relations
|
1,426
|
809
|
1,131
|
|||||||||
|
Data processing
|
1,143
|
1,067
|
1,063
|
|||||||||
|
Travel and lodging
|
435
|
398
|
416
|
|||||||||
|
Taxes - sales and capital
|
620
|
529
|
571
|
|||||||||
|
Telephone
|
177
|
192
|
185
|
|||||||||
|
Amortization of core deposit intangibles
|
218
|
291
|
311
|
|||||||||
| Donations | 778 | 221 | 258 | |||||||||
| Regulatory assessment expense | 1,496 | 2,049 | 827 | |||||||||
| Net cost of other real estate and repossessions | 858 | 399 | 249 | |||||||||
|
Other
|
2,331
|
2,618
|
2,606
|
|||||||||
|
Total other expense
|
$
|
11,867
|
$
|
10,364
|
$
|
9,685
|
||||||
Note 17. Advertising Expenses
The Company does not capitalize advertising costs. They are expensed as incurred and are included in Other Noninterest Expense on the Consolidated Statements of Income. Advertising expense was $0.4 million, $0.4 million, and $0.6 million for 2010, 2009, and 2008, respectively.
Note 18. Income Taxes
The following is a summary of the provision for income taxes included in the Statements of Income:
|
Years Ended December 31,
|
||||||||||||
|
2010
|
2009
|
2008
|
||||||||||
|
(in thousands)
|
||||||||||||
|
Current
|
$
|
4,604
|
$
|
3,705
|
$
|
5,423
|
||||||
|
Deferred
|
622
|
67
|
|
(2,848
|
)
|
|||||||
|
Tax credits
|
-
|
|
(46
|
)
|
(105
|
)
|
||||||
|
Total
|
$
|
5,226
|
$
|
3,726
|
$
|
2,470
|
||||||
The difference between income taxes computed by applying the statutory federal income tax rate and the provision for income taxes in the financial statements is reconciled as follows:
|
Years Ended December 31,
|
||||||||||||
|
2010
|
2009
|
2008
|
||||||||||
|
(in thousands)
|
||||||||||||
|
Statutory tax rate
|
34.2 |
%
|
34.0
|
%
|
34.3
|
%
|
||||||
|
Federal income taxes at statutory rate
|
$
|
5,224 |
$
|
3,854
|
$
|
2,739
|
||||||
|
Tax credits
|
- |
|
(46
|
)
|
(105
|
)
|
||||||
|
Other
|
2 |
|
(82
|
)
|
(164
|
) | ||||||
|
Total
|
$
|
5,226
|
$
|
3,726
|
$
|
2,470
|
||||||
- 75 -
Deferred taxes are recorded based upon differences between the financial statement and tax basis of assets and liabilities, and available tax credit carryforwards. Temporary differences between the financial statement and tax values of assets and liabilities give rise to deferred tax assets (liabilities). The significant components of deferred tax assets and liabilities at December 31, 2010 and 2009 are as follows:
|
Years Ended December 31,
|
||||||||
|
2010
|
2009
|
|||||||
|
(in thousands)
|
||||||||
|
Deferred tax assets:
|
||||||||
|
Allowance for loan losses
|
$
|
2,828
|
$
|
2,692
|
||||
|
Other real estate owned
|
135
|
36
|
||||||
|
Impairment writedown on securities
|
168
|
1,236
|
||||||
|
Unrealized loss on available for sale securities
|
133
|
-
|
||||||
|
Other
|
249
|
145
|
||||||
|
Gross deferred tax assets
|
|
3,513
|
|
4,109
|
||||
|
Deferred tax liabilities:
|
||||||||
|
Depreciation and amortization
|
(1,139
|
)
|
(1,238
|
)
|
||||
|
Unrealized gains on avalable for sale securities
|
- |
|
(1,070
|
) | ||||
|
Other
|
(218
|
)
|
(226
|
)
|
||||
|
Gross deferred tax liabilities
|
(1,357
|
)
|
(2,534
|
)
|
||||
|
Net deferred tax assets
|
$
|
2,156
|
$
|
1,575
|
||||
As of December 31, 2010 and 2009, there were no net operating loss carry forwards for income tax purposes.
ASC 740-10, Income Taxes, clarifies the accounting for uncertainty in income taxes and prescribes a recognition threshold and measurement attribute for the consolidated financial statements recognition and measurement of a tax position taken or expected to be taken in a tax return. The company does not believe it has any unrecognized tax benefits included in its consolidated financial statements. The Company has not had any settlements in the current period with taxing authorities, nor has it recognized tax benefits as a result of a lapse of the applicable statue of limitations.
The Company recognizes interest and penalties accrued related to unrecognized tax benefits, if applicable, in noninterest expense. During the years ended December 31, 2010, 2009, and 2008, the Company did not recognize any interest or penalties in its consolidated financial statements, nor has it recorded an accrued liability for interest or penalty payments.
- 76 -
Note 19. Comprehensive Income
The following is a summary of the components of other comprehensive income as presented in the Statements of Changes in Stockholders’ Equity:
|
December 31,
|
||||||||||||
|
2010
|
2009
|
2008
|
||||||||||
|
(in thousands)
|
||||||||||||
|
Unrealized gain (loss) on available for sale securities, net
|
$
|
(1,085
|
) |
$
|
9,382
|
|
$
|
(8,889
|
) | |||
|
Unrealized loss on held to maturity securities, net
|
- |
|
(224
|
) |
-
|
|||||||
|
Reclassification for OTTI losses
|
-
|
829
|
4,611
|
|||||||||
|
Reclassification adjustments for net (gains) losses, realized net income
|
(2,453
|
)
|
(2,056
|
) |
1
|
|||||||
|
Other comprehensive income (loss)
|
(3,538
|
) |
7,931
|
|
(4,277
|
) | ||||||
|
Income tax (provision) benefit related to other comprehensive income
|
1,202
|
|
(2,696
|
) |
1,454
|
|
||||||
|
Other comprehensive income (loss), net of income taxes
|
$
|
(2,336
|
) |
$
|
5,235
|
|
$
|
(2,823
|
) | |||
Note 20. Off-Balance Sheet Items
The Company is a party to financial instruments with off-balance sheet risk in the normal course of business to meet the financing needs of its customers and to reduce its own exposure to fluctuations in interest rates. These financial instruments include commitments to extend credit and standby and commercial letters of credit. Those instruments involve, to varying degrees, elements of credit and interest rate risk in excess of the amount recognized in the Consolidated Balance Sheets. The contract or notional amounts of those instruments reflect the extent of the involvement in particular classes of financial instruments.
The exposure to credit loss in the event of nonperformance by the other party to the financial instrument for commitments to extend credit and standby and commercial letters of credit is represented by the contractual notional amount of those instruments. The same credit policies are used in making commitments and conditional obligations as it does for on-balance sheet instruments.
Unless otherwise noted, collateral or other security is not required to support financial instruments with credit risk.
Commitments to extend credit are agreements to lend to a customer as long as there is no violation of any condition established in the contract. Commitments generally have fixed expiration dates or other termination clauses and may require payment of a fee. Since commitments may expire without being drawn upon, the total commitment amounts do not necessarily represent future cash requirements. Each customer's creditworthiness is evaluated on a case-by-case basis. The amount of collateral obtained, if deemed necessary upon extension of credit, is based on Management's credit evaluation of the counterpart. Collateral requirements vary but may include accounts receivable, inventory, property, plant and equipment, residential real estate and commercial properties.
Standby and commercial letters of credit are conditional commitments to guarantee the performance of a customer to a third party. These guarantees are primarily issued to support public and private borrowing arrangements, including commercial paper, bond financing and similar transactions. The majority of these guarantees are short-term, one year or less; however, some guarantees extend for up to three years. The credit risk involved in issuing letters of credit is essentially the same as that involved in extending loan facilities to customers. Collateral requirements are the same as on-balance sheet instruments and commitments to extend credit.
There were no losses incurred on any commitments in 2010 or 2009.
A summary of the notional amounts of the financial instruments with off-balance sheet risk at December 31, 2010 and 2009 follows:
|
December 31,
|
||||||||
|
2010
|
2009
|
|||||||
|
(in thousands)
|
||||||||
|
Financial instruments whose contract
|
||||||||
|
amounts represent credit risk:
|
||||||||
|
Commitments to extend credit
|
$
|
95,204
|
$
|
51,132
|
||||
|
Standby and commercial letters of credit
|
5,681
|
7,091
|
||||||
- 77 -
Note 21. Fair Value Measurements
The fair value of a financial instrument is the current amount that would be received to sell an asset or paid to transfer a liability in an orderly transaction between market participants. A fair value measurement assumes that the transaction to sell the asset or transfer the liability occurs in the principal market for the asset or liability or, in the absence of a principal market, the most advantageous market for the asset or liability. Valuation techniques use certain inputs to arrive at fair value. Inputs to valuation techniques are the assumptions that market participants would use in pricing the asset or liability. They may be observable or unobservable. The Company uses a fair value hierarchy for valuation inputs that gives the highest priority to quoted prices in active markets for identical assets or liabilities and the lowest priority to unobservable inputs. The fair value hierarchy is as follows:
Level 1 Inputs – Unadjusted quoted market prices in active markets for identical assets or liabilities that the reporting entity has the ability to access at the measurement date.
Level 2 Inputs – Inputs other than quoted prices included in Level 1 that are observable for the asset or liability, either directly or indirectly. These might include quoted prices for similar assets or liabilities in active markets, quoted prices for identical or similar assets or liabilities in markets that are not active, inputs other than quoted prices that are observable for the asset or liability (such as interest rates, volatilities, prepayment speeds or credit risks) or inputs that are derived principally from or corroborated by market data by correlation or other means.
Level 3 Inputs – Unobservable inputs for determining the fair values of assets or liabilities that reflect an entity’s own assumptions about the assumptions that market participants would use in pricing the assets or liabilities.
A description of the valuation methodologies used for instruments measured at fair value follows, as well as the classification of such instruments within the valuation hierarchy.
Securities available for sale
Securities are classified within (Level 1) where quoted market prices are available in an active market. Inputs include securities that have quoted prices in active markets for identical assets. If quoted market prices are unavailable, fair value is estimated using quoted prices of securities with similar characteristics, at which point the securities would be classified within (Level 2) of the hierarchy. Securities classified (Level 3) in the Company's portfolio as of December 31, 2010 include municiapl bonds from two local municipalities.
Impaired loans
Loans are measured for impairment using the methods permitted by ASC Topic 310. Fair value of impaired loans is measured by either the loans obtainable market price, if available (Level 1), the fair value of the collateral if the loan is collateral dependent (Level 2), or the present value of expected future cash flows, discounted at the loans effective interest rate (Level 3). Fair value of the collateral is determined by appraisals or independent valuation.
Other real estate owned
Properties are recorded at the balance of the loan or at estimated fair value less estimated selling costs, whichever is less, at the date acquired. Fair values of OREO at December 31, 2010 are determined by sales agreement or appraisal, and costs to sell are based on estimation per the terms and conditions of the sales agreement or amounts commonly used in real estate transactions. Inputs include appraisal values on the properties or recent sales activity for similar assets in the property’s market, and thus OREO measured at fair value would be classified within Level 2 of the hierarchy.
- 78 -
The following table summarizes financial assets measured at fair value on a recurring basis as of December 31, 2010, segregated by the level of the valuation inputs within the fair value hierarchy utilized to measure fair value:
| At December 31, | |||||
| (in thousands) | |||||
|
2010
|
2009
|
||||
| Securities available for sale measured at fair value | $ | 322,128 | $ | 249,480 | |
| Fair Value Measurements Using: | |||||
| Quoted Prices in Active Markets For Identical Assets (Level 1) | 14,374 | 16,943 | |||
| Significant Other Observable Inputs (Level 2) | 299,366 | 223,537 | |||
| Significant Unoberservable Inputs (Level 3) | 8,388 | 9,000 | |||
The following table reconciles assets measured at fair value on a recurring basis using unobservable inputs (Level 3):
| Municipal Bonds | ||||
|
(in thousands)
|
||||
|
Balance, beginning of year
|
$
|
9,000
|
||
|
Total gains or losses (realized/unrealized)
|
|
|||
| Included in earnings | - | |||
| Included in other comprehensive income | - | |||
|
Purchases, sales, issuances and settlements, net
|
(612 | ) | ||
| Transfers in and/or out of Level 3 | - | |||
|
Balance as of end of year
|
8,388 | |||
|
The amount of total gains or losses for the period included in earnings attributable to the
|
||||
| change in unrealized gains or losses relating to assets still held as of December 31, 2010 | $ | - | ||
- 79 -
Gains and losses (realized and unrealized) included in earnings (or changes in net assets) for 2010 on a recurring basis are reported in noninterest or other comprehensive income as follows:
| Noninterest Income | Other Comprehensive Income | ||||
|
Total gains included in earnings
|
$ | 3,162 | |||
| (or changes in net assets) | |||||
| Changes in unrealized gains (losses) relating to assets | $ | (2,336 | ) | ||
| still held at December 31, 2010 | |||||
|
|
|||||
The following table measures financial assets and financial liabilities measured at fair value on a non-recurring basis as of December 31, 2010, segregated by the level of valuation inputs within the fair value hierarchy utilized to measure fair value:
| At December 31, | |||||
| (in thousands) | |||||
|
2010
|
2009
|
||||
| Impaired loans measured at fair value | $ | 47,763 | $ | 28,080 | |
| Fair Value Measurements Using: | |||||
| Quoted Prices in Active Markets For Identical Assets (Level 1) | - | - | |||
| Significant Other Observable Inputs (Level 2) | 30,364 | 11,166 | |||
| Significant Unoberservable Inputs (Level 3) | 17,399 | 16,914 | |||
| Other real estate owned measured at fair value | $ | 577 | $ | 658 | |
| Quoted Prices in Active Markets For Identical Assets (Level 1) | - | - | |||
| Significant Other Observable Inputs (Level 2) | 577 | 658 | |||
| Significant Unoberservable Inputs (Level 3) | - | - | |||
- 80 -
Note 22. Financial Instruments
Fair value estimates are generally subjective in nature and are dependent upon a number of significant assumptions associated with each instrument or group of similar instruments, including estimates of discount rates, risks associated with specific financial instruments, estimates of future cash flows and relevant available market information. Fair value information is intended to represent an estimate of an amount at which a financial instrument could be exchanged in a current transaction between a willing buyer and seller engaging in an exchange transaction. However, since there are no established trading markets for a significant portion of the Company’s financial instruments, the Company may not be able to immediately settle financial instruments; as such, the fair values are not necessarily indicative of the amounts that could be realized through immediate settlement. In addition, the majority of the financial instruments, such as loans and deposits, are held to maturity and are realized or paid according to the contractual agreement with the customer.
Quoted market prices are used to estimate fair values when available. However, due to the nature of the financial instruments, in many instances quoted market prices are not available. Accordingly, estimated fair values have been estimated based on other valuation techniques, such as discounting estimated future cash flows using a rate commensurate with the risks involved or other acceptable methods. Fair values are estimated without regard to any premium or discount that may result from concentrations of ownership of financial instruments, possible income tax ramifications or estimated transaction costs. The fair value estimates are subjective in nature and involve matters of significant judgment and, therefore, cannot be determined with precision. Fair values are also estimated at a specific point in time and are based on interest rates and other assumptions at that date. As events change the assumptions underlying these estimates, the fair values of financial instruments will change.
Disclosure of fair values is not required for certain items such as lease financing, investments accounted for under the equity method of accounting, obligations of pension and other postretirement benefits, premises and equipment, other real estate, prepaid expenses, the value of long-term relationships with depositors (core deposit intangibles) and other customer relationships, other intangible assets and income tax assets and liabilities. Fair value estimates are presented for existing on- and off-balance sheet financial instruments without attempting to estimate the value of anticipated future business and the value of assets and liabilities that are not considered financial instruments. In addition, the tax ramifications related to the realization of the unrealized gains and losses have not been considered in the estimates. Accordingly, the aggregate fair value amounts presented do not purport to represent and should not be considered representative of the underlying market or franchise value of the Company.
Because the standard permits many alternative calculation techniques and because numerous assumptions have been used to estimate the fair values, reasonable comparison of the fair value information with other financial institutions' fair value information cannot necessarily be made.
The methods and assumptions used to estimate the fair values of each class of financial instruments, that are not disclosed above, are as follows:
Cash and due from banks, interest-bearing deposits with banks, federal funds sold and federal funds purchased. These items are generally short-term in nature and, accordingly, the carrying amounts reported in the Statements of Condition are reasonable approximations of their fair values.
Investment Securities. Fair values are principally based on quoted market prices. If quoted market prices are not available, fair values are based on quoted market prices of comparable instruments or the use of discounted cash flow analyses.
Loans Held for Sale. Fair values of mortgage loans held for sale are based on commitments on hand from investors or prevailing market prices.
Loans, net. Market values are computed present values using net present value formulas. The present value is the sum of the present value of all projected cash flows on an item at a specified discount rate. The discount rate is set as an appropriate rate index, plus or minus an appropriate spread.
Accrued interest receivable. The carrying amount of accrued interest receivable approximates its fair value.
Deposits. Market values are actually computed present values using net present value formulas. The present value is the sum of the present value of all projected cash flows on an item at a specified discount rate. The discount rate is set as an appropriate rate index, plus or minus an appropriate spread.
Accrued interest payable. The carrying amount of accrued interest payable approximates its fair value.
Borrowings. The carrying amount of federal funds purchased and other short-term borrowings approximate their fair values. The fair value of the Company’s long-term borrowings is computed using net present value formulas. The present value is the sum of the present value of all projected cash flows on a item at a specified discount rate. The discount rate is set as an appropriate rate index, plus or minus an appropriate spread.
Other unrecognized financial instruments. The fair value of commitments to extend credit is estimated using the fees charged to enter into similar legally binding agreements, taking into account the remaining terms of the agreements and customers' credit ratings. For fixed-rate loan commitments, fair value also considers the difference between current levels of interest rates and the committed rates. The fair values of letters of credit are based on fees charged for similar agreements or on estimated cost to terminate them or otherwise settle the obligations with the counterparties at the reporting date. At December 31, 2010 and 2009 the fair value of guarantees under commercial and standby letters of credit was immaterial.
- 81 -
The estimated fair values and carrying values of the financial instruments at December 31, 2010 and 2009 are presented in the following table:
|
December 31,
|
||||||||||||||||
|
2010
|
2009
|
|||||||||||||||
|
Estimated
|
Estimated
|
|||||||||||||||
|
Carrying
|
Fair
|
Carrying
|
Fair
|
|||||||||||||
|
Value
|
Value
|
Value
|
Value
|
|||||||||||||
|
(in thousands)
|
||||||||||||||||
|
Assets
|
||||||||||||||||
|
Cash and cash equivalents
|
$
|
44,837
|
$
|
44,837
|
$
|
46,718
|
$
|
46,718
|
||||||||
|
Securities, available for sale
|
322,128
|
322,128
|
249,480
|
249,480
|
||||||||||||
|
Securities, held to maturity
|
159,833
|
155,326
|
12,349
|
12,462
|
||||||||||||
|
Federal Home Loan Bank stock
|
1,615
|
1,615
|
2,547
|
2,547
|
||||||||||||
|
Loans, net
|
567,323
|
570,566
|
581,983
|
584,248
|
||||||||||||
|
Accrued interest receivable
|
7,664
|
7,664
|
5,807
|
5,807
|
||||||||||||
|
Liabilities
|
||||||||||||||||
|
Deposits
|
$
|
1,007,383
|
$
|
1,016,679
|
$
|
799,746
|
$
|
802,183
|
||||||||
|
Borrowings
|
12,589
|
12,591
|
31,929
|
31,918
|
||||||||||||
|
Accrued interest payable
|
3,539
|
3,539
|
2,519
|
2,519
|
||||||||||||
There is no material difference between the contract amount and the estimated fair value of off-balance sheet items that are primarily comprised of short-term unfunded loan commitments that are generally priced at market.
Note 23. Concentrations of Credit and Other Risks
Personal, commercial and residential loans are granted to customers, most of who reside in northern and southern areas of Louisiana. Although the Company has a diversified loan portfolio, significant portions of the loans are collateralized by real estate located in Tangipahoa Parish and surrounding parishes in southeast Louisiana. Declines in the Louisiana economy could result in lower real estate values which could, under certain circumstances, result in losses to the Company.
The distribution of commitments to extend credit approximates the distribution of loans outstanding. Commercial and standby letters of credit were granted primarily to commercial borrowers. Generally, credit is not extended in excess of $8.0 million to any single borrower or group of related borrowers.
Approximately 35.4% of the Company’s deposits are derived from local governmental agencies. These governmental depositing authorities are generally long-term customers. A number of the depositing authorities are under contractual obligation to maintain their operating funds exclusively with the Company. In most cases, the Company is required to pledge securities or letters of credit issued by the Federal Home Loan Bank to the depositing authorities to collateralize their deposits. Under certain circumstances, the withdrawal of all of, or a significant portion of, the deposits of one or more of the depositing authorities may result in a temporary reduction in liquidity, depending primarily on the maturities and/or classifications of the securities pledged against such deposits and the ability to replace such deposits with either new deposits or other borrowings.
Public fund deposits totaled $356.2 million or 35.4% of total deposits at December 31, 2010. Six public entities comprised $277.6 million or 77.9% of the total public funds as of December 31, 2010.
Note 24. Litigation
The Company is subject to various legal proceedings in the normal course of its business. It is Management’s belief that the ultimate resolution of such claims will not have a material adverse effect on the Company’s financial position or results of operations.
Note 25. Commitments and Contingencies
In the ordinary course of business, various outstanding commitments and contingent liabilities arise that are not reflected in the accompanying financial statements. Included among these contingent liabilities are certain provisions in agreements, entered into with outside third parties, to sell loans that may require the Company to repurchase if it becomes delinquent within a specified period of time.
Note 26. Subsequent Events
On October 22, 2010, the Company entered into an Agreement and Plan of Merger (the “Merger Agreement”) with Greensburg Bancshares, Inc. (“Greensburg Bancshares”) and its wholly-owned subsidiary, Bank of Greensburg (“Greensburg”).
The Merger Agreement provides for the acquisition of Greensburg Bancshares in a merger (the “Merger”). At the effective time of the Merger, each share of common stock of Greensburg Bancshares, at the election of the holder thereof, will be converted into the right to receive either 13.26 shares of common stock of First Guaranty Bancshares, $247 in cash, or a combination of cash and common stock of First Guaranty Bancshares (the “Merger Consideration”). The final structure of the Merger will depend upon the election by Greensburg Bancshares of the form of the Merger Consideration. The total consideration is valued at approximately $5.3 million.
At December 31, 2010, Greensburg Bancshares had total assets of approximately $89.3 million, including loans of $67.5 million. Total deposits were $79.8 million.
The Merger is subject to the approval by the stockholders of Greensburg Bancshares by such vote as is required under its articles of incorporation and Louisiana Business Corporation Law, and other customary closing conditions. The Merger Agreement contains customary representations, warranties and covenants of First Guaranty Bancshares, First Guaranty Bank, Merger Subsidiary, Greensburg Bancshares and Greensburg.
It is expected that the Merger will be completed during the second quarter of 2011 following receipt of all regulatory and shareholder approvals.
- 82 -
Note 27. Condensed Parent Company Information
The following condensed financial information reflects the accounts and transactions of First Guaranty Bancshares, Inc. (parent company only) for the dates indicated:
|
First Guaranty Bancshares, Inc.
|
||||||||
|
Condensed Balance Sheets
|
||||||||
|
(in thousands)
|
||||||||
|
December 31,
|
||||||||
|
Assets
|
2010
|
2009
|
||||||
|
Cash
|
$
|
7,523
|
$
|
5,547
|
||||
|
Investment in bank subsidiary
|
90,701
|
89,363
|
||||||
|
Other assets
|
257
|
409
|
||||||
|
Total Assets
|
$
|
98,481
|
$
|
95,319
|
||||
|
Liabilities and Stockholders' Equity
|
||||||||
|
Other liabilities
|
$ |
543
|
$ |
384
|
||||
|
Stockholders' Equity
|
97,938
|
94,935
|
||||||
|
Total Liabilities and Stockholders' Equity
|
$
|
98,481
|
$
|
95,319
|
||||
|
First Guaranty Bancshares, Inc.
|
||||||||||||
|
Condensed Statements of Income
|
||||||||||||
|
(in thousands)
|
||||||||||||
|
Years ended December 31,
|
||||||||||||
|
Operating Income
|
2010
|
2009
|
2008
|
|||||||||
|
Dividends received from bank subsidiary
|
$
|
6,893 |
$
|
5,109
|
$
|
7,200
|
||||||
|
Other income
|
4 |
4
|
143
|
|||||||||
|
Total operating income
|
6,897 |
5,113
|
7,343
|
|||||||||
|
Operating Expenses
|
||||||||||||
|
Interest expense
|
-
|
114
|
152
|
|||||||||
| Salaries & Benefits | 88 | 78 | 106 | |||||||||
|
Other expenses
|
766
|
423
|
597
|
|||||||||
|
Total operating expenses
|
854
|
615
|
855
|
|||||||||
|
Income before income tax benefit and increase in equity in undistributed
|
||||||||||||
|
earnings of subsidiary
|
6,043
|
4,498
|
6,488
|
|||||||||
|
Income tax benefit
|
296
|
214
|
289
|
|||||||||
|
Income before increase in equity in undistributed earnings of subdisiary
|
6,339
|
4,712
|
6,777
|
|||||||||
|
Increase (Decrease) in equity in undistributed earnings of subsidiary
|
3,686
|
2,883
|
|
(1,265
|
)
|
|||||||
|
Net Income
|
|
10,025
|
|
7,595
|
|
5,512
|
||||||
|
Less preferred stock dividends
|
(1,333
|
)
|
(594
|
) |
-
|
|||||||
|
Net income available to common shareholders
|
$
|
8,692
|
$
|
7,001
|
$
|
5,512
|
||||||
- 83 -
|
First Guaranty Bancshares, Inc.
|
||||||||||||
|
Condensed Statements of Cash Flow
|
||||||||||||
| (in thousands) | ||||||||||||
|
Years ended December 31,
|
||||||||||||
|
2010
|
2009
|
2008
|
||||||||||
|
(in thousands)
|
||||||||||||
|
Cash Flows From Operating Activities
|
||||||||||||
|
Net income
|
$
|
10,025
|
$
|
7,595
|
$
|
5,512
|
||||||
|
Adjustments to reconcile net income to net cash
|
||||||||||||
|
provided by operating activities:
|
||||||||||||
|
Provision for deferred income taxes
|
-
|
-
|
(16
|
) | ||||||||
|
(Increase) Decrease in equity in undistributed earnings of subsidiary
|
(3,686
|
)
|
(2,883
|
) |
1,265
|
|||||||
|
Net change in other liabilities
|
159
|
|
(83
|
) |
65
|
|
||||||
|
Net change in other assets
|
164
|
275
|
|
(132
|
)
|
|||||||
|
Net Cash Provided By Operating Activities
|
6,662
|
4,904
|
6,694
|
|||||||||
|
Cash Flows From Investing Activities
|
||||||||||||
|
Payments for investments in and advances to subsidiary
|
-
|
|
(16,350
|
) |
-
|
|
||||||
|
Net Cash Used in Investing Activities
|
-
|
|
(16,350
|
) |
-
|
|
||||||
|
Cash Flows From Financing Activities
|
||||||||||||
|
Repayment of long-term debt
|
-
|
-
|
|
(3,093
|
) | |||||||
|
Proceeds from issuance of preferred stock
|
-
|
20,699
|
-
|
|||||||||
|
Dividends paid
|
(4,686
|
)
|
(3,799
|
)
|
(3,557
|
)
|
||||||
|
Net Cash Provided by (Used In) Financing Activities
|
(4,686
|
) |
16,900
|
|
(6,650
|
)
|
||||||
|
Net Increase In Cash and Cash Equivalents
|
1,976
|
5,454
|
44
|
|||||||||
|
Cash and Cash Equivalents at the Beginning of the Period
|
5,547
|
93
|
49
|
|||||||||
|
Cash and Cash Equivalents at the End of the Period
|
$
|
7,523
|
$
|
5,547
|
$
|
93
|
||||||
- 84 -
Item 9 - Changes in and Disagreements with Accountants on Accounting and Financial Disclosure
There were no changes in or disagreements with accountants on accounting and financial disclosures for the year ended December 31, 2010.
Evaluation of Disclosure Controls and Procedures
As defined by the Securities and Exchange Commission in Exchange Act Rules 13a-14(c) and 15d-14(c), a company’s “disclosure controls and procedures” means controls and other procedures of an issuer that are designed to ensure that information required to be disclosed by the issuer in the reports that it files or submits under the Exchange Act is recorded, processed, summarized and reported, within time periods specified in the Commission’s rules and forms. The Company maintains such controls designed to ensure this material information is communicated to Management, including the Chief Executive officer (“CEO”) and Chief Financial Officer (“CFO”), as appropriate, to allow timely decision regarding required disclosure.
Management, with the participation of the CEO and CFO, have evaluated the effectiveness of our disclosure controls and procedures as of the end of the period covered by this annual report on Form 10-K. Based on that evaluation, the CEO and CFO have concluded that the disclosure controls and procedures as of the end of the period covered by this annual report are effective. There were no changes in the Company’s internal control over financial reporting during the last fiscal quarter in the period covered by this annual report that have materially affected, or are reasonably likely to materially affect, the Company’s internal control over financial reporting.
This annual report does not include an attestation report of the Company’s registered public accounting firm regarding internal controls over financial reporting. Management’s report was not subject to attestation by the Company’s registered public accounting firm pursuant to temporary rules of the Securities and Exchange Commission that permit the Company to provide only Management’s report in this annual report.
Management’s Annual Report on Internal Control over Financial Reporting
The Management of First Guaranty Bancshares, Inc. has prepared the consolidated financial statements and other information in our Annual Report in accordance with accounting principles generally accepted in the United States of America and is responsible for its accuracy. The financial statements necessarily include amounts that are based on Management’s best estimates and judgments. In meeting its responsibility, Management relies on internal accounting and related control systems. The internal control systems are designed to ensure that transactions are properly authorized and recorded in our financial records and to safeguard our assets from material loss or misuse. Such assurance cannot be absolute because of inherent limitations in any internal control system.
Management is responsible for establishing and maintaining the adequate internal control over financial reporting, as such term is defined in the Exchange Act Rules 13 – 15(f). Under the supervision and with the participation of Management, including our principal executive officers and principal financial officer, we conducted an evaluation of the effectiveness of internal control over financial reporting based on the framework in Internal Control – Integrated Framework issued by the Committee of Sponsoring Organizations of the Treadway Commission. This section relates to Management’s evaluation of internal control over financial reporting including controls over the preparation of the schedules equivalent to the basic financial statements and compliance with laws and regulations. Our evaluation included a review of the documentation of controls, evaluations of the design of the internal control system and tests of the effectiveness of internal controls.
Based on our evaluation under the framework in Internal Control – Integrated Framework, Management concluded that internal control over financial reporting was effective as of December 31, 2010.
None
- 85 -
Item 10 – Directors, Executive Officers and Corporate Governance
Pursuant to General Instruction G (3), information on directors and executive officers of the Registrant will be incorporated by reference from the Company’s 2010 Definitive Proxy Statement.
Item 11 - Executive Compensation
Pursuant to General Instruction G (3), information on directors and executive officers of the Registrant will be incorporated by reference from the Company’s 2010 Definitive Proxy Statement.
Item 12 - Security Ownership of Certain Beneficial Owners, Management and Related Stockholder Matters
Pursuant to General Instruction G (3), information on directors and executive officers of the Registrant will be incorporated by reference from the Company’s 2010 Definitive Proxy Statement.
Item 13 - Certain Relationships and Related Transactions and Director Independence
Pursuant to General Instruction G (3), information on directors and executive officers of the Registrant will be incorporated by reference from the Company’s 2010 Definitive Proxy Statement.
Item 14 - Principal Accountant Fees and Services
Pursuant to General Instruction G (3), information on directors and executive officers of the Registrant will be incorporated by reference from the Company’s 2010 Definitive Proxy Statement.
- 86 -
Part IV
|
(a)
|
1
|
Consolidated Financial Statements
|
|
|
Item
|
Page
|
||
|
First Guaranty Bancshares, Inc. and Subsidiary
|
|||
|
Report of Independent Registered Accounting Firm
|
51
|
||
|
Consolidated Balance Sheets - December 31, 2010 and 2009
|
52
|
||
|
Consolidated Statements of Income – Years Ended December 31, 2010, 2009 and 2008
|
53
|
||
|
Consolidated Statements of Changes in Stockholders’ Equity - December 31, 2010, 2009 and 2008
|
54
|
||
|
Consolidated Statements of Cash Flows - Years Ended December 31, 2010, 2009 and 2008
|
55
|
||
|
Notes to Consolidated Financial Statements
|
56
|
||
|
2
|
Consolidated Financial Statement Schedules
|
||
|
All schedules to the consolidated financial statements of First Guaranty Bancshares, Inc. and its subsidiary have been omitted because they are not required under the related instructions or are inapplicable, or because the required information has been provided in the consolidated financial statements or the notes thereto.
|
|||
|
3
|
Exhibits
|
||
|
The exhibits required by Regulation S-K are set forth in the following list and are filed either by incorporation by reference from previous filings with the Securities and Exchange Commission or by attachment to this Annual Report on Form 10-K as indicated below.
|
|||
|
Exhibit Number
|
Exhibit
|
||
|
3.1
|
Restatement of Articles of Incorporation of First Guaranty Banchshares, Inc. dated July 27, 2007 (filed as Exhibit 3.1 on Form 8-K12G3 dated August 2, 2007 and incorporated herein by reference).
|
||
|
3.2
|
Bylaws of First Guaranty Bancshares, Inc. dated January 4, 2007 (filed as Exhibit 3.2 on Form 8-K12G3 dated August 2, 2007 and incorporated herein by reference).
|
||
|
3.3
|
Amendment to Bylaws of First Guaranty Bancshares, Inc., dated May 17, 2007 (filed as exhibit 3.3 on Form 8-K12G3 dated August 2, 2007 and incorporated herein by reference).
|
||
|
11
|
Statement Regarding Computation of Earnings Per Share
|
||
|
12
|
Statement Regarding Computation of Ratios
|
||
|
14.1
|
First Guaranty Bancshares, Inc. and Subsidiary Code of Conduct and Ethics for Employees, Officers and Directors adopted March 18, 2010 (filed at Exhibit 14.3 on the Company’s Form 10-K dated March 31, 2010 and incorporated herein by reference)
|
||
|
14.2
|
First Guaranty Bancshares, Inc. Code of Ethics for Senior Financial Officers adopted March 18, 2010 (filed at Exhibit 14.4 on the Company’s Form 10-K dated March 31, 2010 and incorporated herein by reference).
|
||
|
14.3
|
First Guaranty Bancshares, Inc. and Subsidiary Code of Conduct and Ethics for Employees, Officers and Directors adopted March 17, 2011.
|
||
|
14.4
|
First Guaranty Bancshares, Inc. Code of Ethics for Senior Financial Officers adopted March 17, 2011.
|
||
|
21
|
Subsidiaries of the First Guaranty Bancshares, Inc. (filed as Exhibit 21 on the Company’s Form 8-K dated November 8, 2007 and incorporated herein by reference).
|
||
|
24
|
Power of attorney
|
||
|
31.1
|
Certification of principal executive officer pursuant to Exchange Act Rule 13a-14(a) or 15d-14(a), pursuant to Section 302 of the Sarbanes-Oxley Act of 2002.
|
||
|
31.2
|
Certification of principal financial officer pursuant to Exchange Act Rule 13a-14(a) or 15d-14(a), pursuant to Section 302 of the Sarbanes-Oxley Act of 2002.
|
||
|
32.1
|
Certification of principal executive officer pursuant to 18 U.S.C. Section 1350, as adopted pursuant to Section 906 of the Sarbanes-Oxley Act of 2002.
|
||
|
32.2
|
Certification of principal financial officer pursuant to 18 U.S.C. Section 1350, as adopted pursuant to Section 906 of the Sarbanes-Oxley Act of 2002.
|
||
|
99.1
|
Chief Executive Officer TARP Certification
|
||
|
99.2
|
Chief Financial Officer TARP Certification
|
- 87 -
SIGNATURES
Pursuant to the requirements of Section 13 or 15(d) of the Securities Exchange Act of 1934, the Bank has duly caused this report to be signed on its behalf by the undersigned, thereunto duly authorized.
FIRST GUARANTY BANCSHARES, INC.
Dated: March 31, 2011
Pursuant to the requirements of the Securities and Exchange Act of 1934, this report has been signed below by the following persons on behalf of the Company and in the capacities and on the dates indicated.
|
/s/ Alton B. Lewis
Alton B. Lewis
|
Chief Executive Officer and
Director
|
March 31, 2011
|
|
|
/s/ Eric J. Dosch
Eric J. Dosch
|
Chief Financial Officer,
Secretary and Treasurer
(Principal Financial and Accounting Officer)
|
March 31, 2011
|
|
|
*___________________________
Marshall T. Reynolds
|
Chairman of the Board
|
March 31, 2011
|
|
|
*___________________________
William K. Hood
|
Director
|
March 31, 2011
|
|
| *___________________________
Sandra C. Ramsey
|
Director | March 31, 2011 | |
*By: /s/ Alton B. Lewis
Alton B. Lewis
Under Power of Attorney
- 88 -