Attached files
| file | filename |
|---|---|
| EX-31.1 - EX-31.1 - Reliance Bancshares, Inc. | c63752exv31w1.htm |
| EX-21.1 - EX-21.1 - Reliance Bancshares, Inc. | c63752exv21w1.htm |
| EX-99.2 - EX-99.2 - Reliance Bancshares, Inc. | c63752exv99w2.htm |
| EX-31.2 - EX-31.2 - Reliance Bancshares, Inc. | c63752exv31w2.htm |
| EX-32.1 - EX-32.1 - Reliance Bancshares, Inc. | c63752exv32w1.htm |
| EX-99.1 - EX-99.1 - Reliance Bancshares, Inc. | c63752exv99w1.htm |
| EX-32.2 - EX-32.2 - Reliance Bancshares, Inc. | c63752exv32w2.htm |
Table of Contents
UNITED STATES
SECURITIES AND EXCHANGE COMMISSION
SECURITIES AND EXCHANGE COMMISSION
Washington, D.C. 20549
Form 10-K
(Mark One)
| þ | ANNUAL REPORT PURSUANT TO SECTION 13 OR 15(d) OF THE SECURITIES EXCHANGE ACT OF 1934 |
For the fiscal year ended December 31, 2010
OR
| o | TRANSITION REPORT PURSUANT TO SECTION 13 OR 15(d) OF THE SECURITIES EXCHANGE ACT OF 1934 |
Commission file number 00-52588
Reliance Bancshares, Inc.
(Exact name of Registrant as Specified in its Charter)
| Missouri | 43-1823071 | |
| (State or Other Jurisdiction of Incorporation or Organization) |
(I.R.S. Employer Identification No.) |
|
| 10401 Clayton Road | ||
| Frontenac, Missouri | 63131 | |
| (Address of Principal Executive Offices) | (ZIP Code) |
Registrant’s telephone number, including area code:
(314) 569-7200
(314) 569-7200
Securities registered pursuant to Section 12(b) of the Act: None
Securities registered pursuant to Section 12(g) of the Act:
Securities registered pursuant to Section 12(g) of the Act:
Title of Class
Class A Common Stock, par value $0.25
Class A Common Stock, par value $0.25
Indicate by check mark if the registrant is a well-known seasoned issuer, as defined in Rule
405 of the Securities Act. Yes o No þ
Indicate by check mark if the registrant is not required to file reports pursuant to Section
13 or Section 15(d) of the Act. Yes o No þ
Indicate by check mark whether the registrant (1) has filed all reports required to be filed
by Section 13 or 15(d) of the Securities Exchange Act of 1934 during the preceding 12 months (or
for such shorter period that the registrant was required to file such reports) and (2) has been
subject to such filing requirements for the past 90 days. Yes þ No o
Indicate by check mark if disclosure of delinquent filers pursuant to Item 405 of Regulation
S-K is not contained herein, and will not be contained, to the best of registrant’s knowledge, in
definitive proxy or information statements incorporated by reference in Part III of this Form 10-K
or any amendment to this Form 10-K. o
Indicate by check mark whether the registrant has submitted electronically and posted on its
corporate Web site, if any, every Interactive Data File required to be submitted and posted
pursuant to Rule 405 of Regulation S-T (§ 232.405 of this chapter) during the preceding 12 months
(or for such shorter period that the registrant was required to submit and post such files).
Yes o No o
Indicate by check mark whether the registrant is a large accelerated filer, an accelerated
filer, a non-accelerated filer, or a smaller reporting company. See the definitions of “large
accelerated filer,” “accelerated filer” and “smaller reporting company” in Rule 12b-2 of the
Exchange Act. (Check one):
| Large accelerated filer o | Accelerated filer o | Non-accelerated filer o | Smaller Reporting Company þ | |||
| (Do not check if a smaller reporting company) |
Indicate by check mark whether the registrant is a shell company (as defined in Rule 12b-2 of
the Exchange Act). Yes o No þ
The aggregate market value of the voting and non-voting common equity held by non-affiliates
computed by reference to the price at which the common equity was last sold, or the average bid and
asked price of such common equity, as of June 30, 2010 (the last business day of the registrant’s
most recently completed second fiscal quarter) was approximately $28,989,797.
Indicate the number of shares outstanding of each of the registrant’s classes of common stock,
as of the latest practicable date: 22,481,804 shares of common stock outstanding as of March 18,
2011.
DOCUMENTS INCORPORATED BY REFERENCE
PORTIONS OF THE DEFINITIVE PROXY STATEMENT FOR THE 2011 ANNUAL MEETING OF SHAREHOLDERS TO BE
FILED WITH THE SECURITIES AND EXCHANGE COMMISSION PURSUANT TO SEC REGULATION 14A ARE INCORPORATED BY REFERENCE IN PART III, ITEMS 10 -14.
FILED WITH THE SECURITIES AND EXCHANGE COMMISSION PURSUANT TO SEC REGULATION 14A ARE INCORPORATED BY REFERENCE IN PART III, ITEMS 10 -14.
TABLE OF CONTENTS
| Page No. | ||||||||
| 2 | ||||||||
| 10 | ||||||||
| 16 | ||||||||
| 16 | ||||||||
| 16 | ||||||||
| 16 | ||||||||
| 16 | ||||||||
| 20 | ||||||||
| 21 | ||||||||
| 49 | ||||||||
| 49 | ||||||||
| 49 | ||||||||
| 49 | ||||||||
| 50 | ||||||||
| 50 | ||||||||
| 50 | ||||||||
| 50 | ||||||||
| 50 | ||||||||
| 51 | ||||||||
| 51 | ||||||||
| EX-21.1 | ||||||||
| EX-31.1 | ||||||||
| EX-31.2 | ||||||||
| EX-32.1 | ||||||||
| EX-32.2 | ||||||||
| EX-99.1 | ||||||||
| EX-99.2 | ||||||||
STATEMENT REGARDING FORWARD-LOOKING INFORMATION
Except for the historical information contained in this Annual Report, certain matters
discussed herein contain forward-looking statements within the meaning of Section 21E of the
Securities Exchange Act of 1934, as amended. Although we believe that, in making any such
statements, our expectations are based on reasonable assumptions, any such statements may be
influenced by factors that could cause actual outcomes and results to be materially different from
those projected. When used in this document, the words “anticipates,” “believes,” “expects,”
“intends” and similar expressions as they relate to Reliance Bancshares, Inc. or its management are
intended to identify such forward-looking statements. These forward-looking statements are subject
to numerous risks and uncertainties. There are important factors that could cause actual
1
Table of Contents
results to differ materially from those in forward-looking statements, certain of which are
beyond our control. These factors, risks and uncertainties are discussed under Item 1A, “Risk
Factors.”
Our actual results, performance or achievement could differ materially from those expressed
in, or implied by, these forward-looking statements. Accordingly, we can give no assurances that
any of the events anticipated by the forward-looking statements will transpire or occur or, if any
of them do so, what impact they will have on our results of operations or financial condition. We
expressly decline any obligation to publicly revise any forward-looking statements that have been
made to reflect the occurrence of events after the date hereof.
Item 1. Business
General
Reliance Bancshares, Inc. (the “Company” or “Reliance”) is a multi-bank holding company that
was incorporated in Missouri on July 24, 1998. The Company organized its first subsidiary
commercial bank, Reliance Bank, in Missouri, which secured insurance from the Federal Deposit
Insurance Corporation (“FDIC”) and began conducting business on April 16, 1999 in Des Peres,
Missouri with full depository and loan capabilities. The Company organized an additional
subsidiary, Reliance Bank, FSB in Fort Myers, Florida as a federal savings bank after operating as
a loan production office of Reliance Bank since 2004. The Company applied for and received a
federal charter from the Office of Thrift Supervision (the “OTS”), secured insurance from the FDIC
and began conducting business on January 17, 2006. The Company’s two subsidiaries, Reliance Bank
and Reliance Bank, FSB, are sometimes referred to as the “Banks.” Unless otherwise indicated,
references to the “Company” shall be intended to be references to Reliance Bancshares, Inc. and its
subsidiaries.
On April 27, 2007, the Company filed its Form 10 registration statement with the Securities
and Exchange Commission (the “SEC”) pursuant to Section 12(g) of the Securities Exchange Act of
1934, as amended. The effective date of the registration statement was June 26, 2007.
The Company’s headquarters and executive offices are located at 10401 Clayton Road, Frontenac,
Missouri, 63131, (314) 569-7200.
Available Information
All of the Company’s reports required to be filed by Sections 13(a) or 15(d) of the Securities
Exchange Act of 1934, as amended, will be available or accessible free of charge, including copies
of our future Annual Reports on Form 10-K, future Quarterly Reports on Form 10-Q, future Current
Reports on Form 8-K, future Proxy Statements, and any amendments to those reports at our website
with the address “www.reliancebancshares.com”. All reports will be made available as soon as
reasonably practicable after they are filed with or furnished to the SEC. You may also request any
materials we file with the SEC from the SEC’s Public Reference Room at 100 F. Street, NE,
Washington, D.C., 20549, or by calling (800) SEC-0330. In addition, our filings with the SEC are
electronically available via the SEC’s website at http://www.sec.gov.
For general information about Reliance Bank and Reliance Bank, FSB, please visit our current
websites at www.reliancebankstl.com and www.reliancebankfsb.com, respectively.
Recent Developments
The Emergency Economic Stabilization Act of 2008 (“EESA”) was enacted on October 3, 2008.
Pursuant to EESA, the United States Treasury Department (the “Treasury”) has the authority to among
other things, purchase up to $700 billion of mortgages, mortgage-backed securities and certain
other financial instruments from financial institutions for the purpose of stabilizing and
providing liquidity to the U.S. financial markets. Pursuant to its authority under EESA, the
Treasury created the Troubled Asset Relief Program (“TARP”) Capital Purchase Program (“CPP”) under
which the Treasury was authorized to invest in non-voting, senior preferred stock of U.S. banks and
savings associations or their holding companies.
2
Table of Contents
The Treasury has invested in the Company through the EESA and CPP. On February 13, 2009, the
Company issued 40,000 shares of Fixed Rate Cumulative Perpetual Preferred Stock, no par value,
Series A for a total of $40,000,000, and 2,000 shares of Fixed Rate Cumulative Perpetual Preferred
Stock, no par value, Series B for no additional funds, to the Treasury in connection with the
Company’s participation in the CPP. The funds received by the Company are included in the
financial data or calculations for this filing.
The Series A preferred stock accrues a dividend at the rate of 5% per annum for the first five
years and 9% thereafter. Dividends are payable quarterly and each share has a liquidation amount
of $1,000 and has liquidation rights in pari passu with other preferred stock, which is paid in
liquidation prior to Company’s common stock. The Series B preferred stock accrues a dividend at
the rate of 9% per annum, payable quarterly, and includes other provisions similar to the Series A
preferred stock with liquidation at $1,000 per share. On February 11, 2011, the Company announced
that it was suspending dividends on its Series A and Series B preferred stock effective immediately
in order to positively manage capital.
The American Recovery and Reinvestment Act of 2009 (“ARRA”) was enacted on February 17, 2009.
Among other things, ARRA sets forth additional limits on executive compensation at all financial
institutions receiving federal funds under any program, including the CPP, both retroactively and
prospectively. The executive compensation restrictions in ARRA, which will be further described in
rules and regulations to be established, include among others: limits on compensation incentives,
prohibitions on “golden parachute payments”, the establishment by publicly registered CPP
recipients of a board compensation committee comprised entirely of independent directors for the
purpose of reviewing employee compensation plans, and the requirement of a non-binding vote on
executive pay packages at each annual shareholder meeting until the government funds are repaid.
The full impact of the ARRA is not yet certain because additional regulatory action is required.
On November 10, 2009, the Company authorized 25,000 shares of Fixed Rate Cumulative Perpetual
Preferred Stock, no par value, Series C for sale with an offering price of $1,000 per share. The
offering was extended to existing shareholders who are accredited investors (as such term is
defined in Regulation D of the Securities Act of 1933, as amended) and to other accredited
investors to subscribe for and purchase shares of this series. At December 31, 2010, the Company
had subscriptions and payments totaling $555,000 for the purchase of 555 shares. The Series C
preferred stock accrues a dividend at the rate of 7% per annum, payable quarterly and includes a
liquidation preference of $1,000 per share. On February 11, 2011, the Company announced that it
was suspending dividends on its Series C preferred stock effective immediately in order to
positively manage capital.
Regulatory Agreements
The Company and the Banks have entered into a certain Agreement and memoranda of understanding
(“MOU”) with regulatory authorities as listed below. The Agreement and MOUs are informal
administrative agreements pursuant to which the Company and the Banks have agreed to take various
actions and comply with certain requirements to facilitate improvement in financial condition.
On November 30, 2009, Reliance Bank’s Board of Directors entered into an Agreement with the
Missouri Division of Finance and the Federal Deposit Insurance Corporation (“FDIC”) to, among other
things, (a) develop a plan to reduce the level of risk in each criticized asset aggregating
$2,000,000 or more included in the September 21, 2009 Missouri Division of Finance examination
report; (b) maintain the reserve for possible loan losses at a level which is reasonable in
relation to the degree of risk inherent in the Bank’s loan portfolio; (c) develop and adopt
policies and procedures designed to identify and monitor concentrations of credit, including
out-of-territory loans and loan participations purchased; (d) formulate plans to reduce the Bank’s
concentrations of credit, particularly in commercial real estate and land acquisition and
development lending; (e) review and revise the Bank’s formal loan policy to address weaknesses
noted in the September 21, 2009 Missouri Division of Finance examination report; (f) cease making
or extending any loans which might violate the Bank’s written loan policy, except in those
instances in which the Board of Directors has made a prior determination that a variance from loan
policy is in the best interests of the Bank, with such Board decisions appropriately documented in
the minutes of the Board of Director meetings; (g) develop a formal written profit plan, which will
provide a three-year budget projection for asset growth and dividend payouts to ensure Tier 1
leverage capital is maintained at least a 7% level; and (h) maintain a Tier 1 leverage capital
ratio of at least 7%, and other capital ratios such that the Bank will remain well-capitalized, and
not
3
Table of Contents
pay any dividends, management fees or bonuses, or increase any executive salary or other
compensation that would reduce the Bank to a level below a well-capitalized status.
On February 10, 2010, Reliance Bank, FSB’s Board of Directors entered into a MOU with the OTS
to, among other things, (a) develop a business plan for the years ending December 31, 2010, 2011,
and 2012 which shall include (1) strategies to preserve and enhance the Bank’s capital sufficient
to meet its needs and support its risk profile; (2) achieve core profitability by the end of 2010;
and (3) establish and maintain Board-approved loan concentration limits expressed as a percentage
of risk-based capital that takes into account the Bank’s current capital position, local and
regional market conditions, and the credit risks posed by higher risk loans; (b) continue to take
steps to identify, classify, and properly account for problem assets, including but not limited to
(1) conducting periodic asset quality reviews to identify and assign appropriate classifications to
all problem assets; (2) performing analyses on all impaired assets identified by the review
required by subparagraph (b)(1) above; and (3) estimating potential losses in identified problem
assets, while establishing an appropriate reserve for loan losses for all classified assets; (c)
develop a detailed, written plan with specific strategies, targets, and timeframes to reduce the
Bank’s level of criticized assets; (d) review the adequacy of the Bank’s reserve for loan losses
policies, procedures and methodologies on at least an annual basis to ensure the timely
establishment and maintenance of an adequate reserve for loan losses account balance; (e) identify
and monitor all loan modifications and troubled debt restructurings, with delinquent loans that are
modified being classified as substandard and placed on nonaccrual status for at least six months;
(f) prohibit the increase in the dollar amount of brokered deposits; (g) analyze the major
differences in and bases for significant differences in the value of assets, liabilities, and
off-balance-sheet positions calculated by the OTS Net Portfolio Value and the Bank’s internal
economic value of equity model; and (h) correct all deficiencies and weaknesses identified in the
October 5, 2009 OTS report of examination.
On March 16, 2010, the Company entered into a MOU with the Federal Reserve Bank of St. Louis
(“Federal Reserve”) requiring the Company to, among other things, (a) utilize its financial and
managerial resources to assist the Banks in addressing weaknesses identified during their most
recent regulatory examinations, and achieving/maintaining compliance with any supervisory action
between the Banks and their primary regulators; (b) declare no corporate dividends without the
prior written approval of the Federal Reserve; (c) incur no additional debt without the prior
written approval of the Federal Reserve; and (d) make no distributions of interest or other sums on
its preferred stock without the prior written approval of the Federal Reserve.
On February 14, 2011, Reliance Bank’s Board of Directors entered into a Consent Order (the
Consent Order) with the FDIC to (a) develop a written management plan to have and retain qualified
management; (b) charge off adversely classified assets identified during the FDIC’s September 20,
2010 examination of Reliance Bank; (c) develop a written plan to reduce Reliance Bank’s risk
exposure in each asset in excess of $2,000,000 classified as substandard or doubtful in the FDIC’s
Report of Examination for its September 20, 2010 examination; (d) not extend, directly or
indirectly, any additional credit to, or for the benefit of, any borrower who has a loan or other
extension of credit or obligation with Reliance Bank that has been, in whole or in part, charged
off or adversely classified as substandard or doubtful in the FDIC’s Report of Examination, unless
the denial of additional credit would be detrimental to Reliance Bank, as determined by the Bank’s
Board of Directors; (e) develop a written plan for systematically reducing and monitoring the
Bank’s concentrations of credit as listed in the FDIC’s Report of Examination, to an amount that is
commensurate with Reliance Bank’s business strategy, management expertise, size, and location; (f)
review and maintain an adequate reserve for loan losses on a quarterly basis; (g) maintain minimum
capital ratios of an 8% Tier 1 leverage capital ratio and 12% Total risk-based capital ratio; (h)
not increase salaries or pay bonuses for any executive officer, pay management fees, or declare or
pay any dividends; (i) review the liquidity, contingent funding, and interest rate risk policies
and plans and develop or amend such policies and plans to address how the Bank will increase its
liquid assets and reduce its reliance on volatile liabilities for liquidity purposes; (j) not
accept, increase, renew, or rollover any brokered deposits; (k) develop a written three-year
business/strategic plan and one-year profit and budget plan; (l) eliminate and/or correct any
violations of laws, rules, and regulations identified in the FDIC’s Report of Examination; and (m)
provide periodic progress reports on the above matters to the FDIC.
The Agreement, MOUs and Consent Order will remain in effect until modified or terminated by
the applicable regulatory authority. We do not expect the actions called for by the Agreement and
MOUs to change our business strategy in any material respect, although they may have the effect of
limiting or
4
Table of Contents
delaying our ability or plans to expand. Management has taken various actions to comply with
the Agreement, MOUs and Consent Order and will diligently endeavor to take all actions necessary
for compliance.
Market Area and Approach to Geographic Expansion
Reliance Bank
In the greater St. Louis Metropolitan Statistical Area, (“MSA”), which includes St. Louis
bordering counties in Illinois, Reliance Bank has facilities in twenty locations. Reliance Bank
strategically chose to locate these branches within six to seven miles of each other so as not to
over-saturate any one municipality or area. Still, in any given area, customers are within a few
miles of local branches. When choosing branch locations, we have also focused on areas that we
believe have high growth potential, a high concentration of closely-held businesses and a large
number of professionals and executives. Typically, a high growth potential location consists of
both commercial and residential development, which provides us with potential commercial and
individual customers.
Reliance Bank, FSB
The current primary market area of Reliance Bank, FSB is Lee County on the southwest coast of
Florida. Reliance Bank, FSB has a total of three locations, and is headquartered in Fort Myers,
Florida.
Reliance Bank, FSB’s original strategy was to expand in Lee County and Collier County, in
southwest Florida, as these areas have experienced high growth rates in recent years. However,
with the unprecedented downturn in the economy, specifically in the Southwest Florida real estate
market, Reliance Bank, FSB has amended its strategy and did not establish any new branches while
the economy is recovering. Reliance Bank, FSB plans to work within the community to build stronger
customer relationships, deposit growth and loan production.
Competition
The Company and its subsidiaries operate in highly competitive markets. We face substantial
competition in all phases of operations from a variety of different competitors in the St. Louis
and Fort Myers markets, including: (i) large national and super-regional financial institutions
that have well-established branches and significant market share in the communities we serve; (ii)
finance companies, investment banking and brokerage firms, and insurance companies that offer
bank-like products; (iii) credit unions, which can offer highly competitive rates on loans and
deposits as they receive tax advantages not available to commercial or community banks; (iv) other
commercial or community banks, including start-up banks, that can compete with us for customers who
desire a high degree of personal service; (v) national and super-regional banks offering mortgage
loan application services; (vi) both local and out-of-state trust companies and trust service
offices; and (vii) multi-bank holding companies with substantial capital resources and lending
capacity.
Many of the larger banks have established specialized units, which target private businesses
and high net worth individuals. Also, the St. Louis market has recently experienced an increase in
de novo (i.e., new start-up) banks that have opened within the past five years.
Reliance Bank and Reliance Bank, FSB have both grown rapidly with aggressive branching in both
markets. Because of the Company’s continued use of earnings for this expansion, we have not
historically issued dividends on common stock and do not anticipate doing so in the foreseeable
future. We have also recently suspended the dividends on our outstanding classes of preferred
stock. The Company has incurred significant expenses due to its aggressive organic growth plan.
This increased expense has negatively impacted our short term earnings per share. Both Reliance
Bank and Reliance Bank, FSB are comfortable with the amount of branches they have established in
both areas and therefore, did not expand in 2010.
5
Table of Contents
Supervision and Regulation
We are subject to various state, federal and self-regulatory organization banking laws,
regulations and policies in place to protect customers and, to some extent, shareholders, which
impose specific requirements and restrictions on our operations. Any change in applicable laws or
regulations may have a material effect on the business and prospects of the Company and its
subsidiaries.
The following is a summary of significant regulations:
The Holding Company
Bank Holding Company Act of 1956: The Company is a multi-bank holding company registered under
the Bank Holding Company Act of 1956, as amended (“BHCA”). As such, we are subject to regulation
and examination by the Federal Reserve Board and are required to file periodic reports of our
operations and such additional information as the Federal Reserve may require. Financial holding
companies must be well managed and well capitalized pursuant to the standards set by the Federal
Reserve and have at least a “satisfactory” rating under the Community Reinvestment Act.
Under the BHCA, bank holding companies are generally required to obtain the prior approval of
the Federal Reserve before (i) acquiring substantially all the assets of any bank, (ii) acquiring
direct or indirect ownership or control of any voting shares of any bank if, after such
acquisition, it would own or control more than 5% of the voting shares of such bank (unless it
already owns or controls the majority of such shares), or (iii) merging or consolidating with
another bank holding company.
Gramm-Leach Bliley Act of 1999: The Gramm-Leach-Bliley Act of 1999 (“GLBA”) eliminates many of
the restrictions placed on the activities of certain qualified financial or bank holding companies.
The GLBA also restricts the Company and the Banks from sharing certain customer personal
information with non-affiliated third parties and requires disclosure of the policies and
practices regarding such data sharing.
Source of Strength; Cross-Guarantee: Federal Reserve policy requires that we commit resources
to support our subsidiaries and in implementing this policy, the Federal Reserve takes the position
that it may require us to provide financial support when we otherwise would not consider it
necessary to do so.
Sarbanes-Oxley Act of 2002: The Sarbanes-Oxley Act of 2002 (“SOX”) generally applies to all
publicly-held companies and was enacted to increase corporate responsibility, provide for enhanced
penalties for accounting and auditing improprieties at publicly traded companies and protect
investors by improving the accuracy and reliability of corporate disclosures made pursuant to the
securities laws promulgated by the SEC. SOX requires, among other things, (i) certification of
financial statements by the Chief Executive Officer and the Chief Financial Officer and (ii)
adoption of procedures designed to ensure the adequacy of the internal controls and financial
reporting processes of public companies. Companies with securities listed on national securities
exchanges must also comply with strict corporate governance requirements.
Reliance Bank
Because Reliance Bank is not a member of the Federal Reserve System, the Missouri Division of
Finance and the FDIC are its primary regulators. Between these two regulatory authorities, all
areas of the Bank’s operations are monitored or regulated, including security devices and
procedures, adequacy of capitalization and loss reserves, loans, investments, borrowings, deposits,
mergers, issuance of securities, payment of dividends, interest rates payable on deposits, interest
rates or fees chargeable on loans, establishment of branches, corporate reorganizations,
maintenance of books and records, and adequacy of staff training to carry on safe lending and
deposit gathering practices. In addition, Reliance Bank must maintain certain capital ratios and is
subject to limitations on total investments in real estate, bank premises, and furniture and
fixtures.
Transactions with Affiliates and Insiders: Regulation W, promulgated by the Federal Reserve,
imposes regulations on certain transactions with affiliates, including the amount of loans and
extensions of credit to affiliates, investments in affiliates and the amount of advances to third
parties collateralized by the securities
6
Table of Contents
or obligations of affiliates. Regulation W also requires, among other things, that Reliance
Bank transact business with affiliates on terms substantially the same, or at least as favorable to
Reliance Bank, as those prevailing at the time for comparable transactions with non-affiliates.
Community Reinvestment Act: The Community Reinvestment Act (the “CRA”) requires that the
Company and its subsidiaries take certain steps to meet the credit needs of varying income level
households in their local communities. The Company’s record of meeting such needs is considered by
the FDIC when evaluating mergers and acquisitions and applications to open a branch or facility.
Both Reliance Bank and Reliance Bank, FSB have satisfactory ratings under the CRA.
Check 21: The Check Clearing for the 21st Century Act (“Check 21”) is designed to foster
innovation in the payments system and to enhance its efficiency by reducing some of the legal
impediments to check clearing. The law facilitates check clearing by creating a new negotiable
instrument called a substitute check, which permits banks to clear original checks, to process
check information electronically, and to deliver substitute checks to banks that want to continue
receiving paper checks. A substitute check is the legal equivalent of the original check and
includes all the information contained on the original check. The law does not require banks to
accept checks in electronic form nor does it require banks to use the new authority granted by
Check 21 to create substitute checks.
USA Patriot Act: The Uniting and Strengthening America by Providing Appropriate Tools Required
to Intercept and Obstruct Terrorism Act of 2001 (the “USA Patriot Act”) requires financial
institutions to take certain steps to protect against money laundering, such as establishing
anti-money laundering programs and maintaining controls with respect to private and foreign banking
matters.
Limitations on Loans and Transactions: The Federal Reserve Act generally imposes certain
limitations on extensions of credit and other transactions by and between banks that are members of
the Federal Reserve and other affiliates (which includes any holding company of which a bank is a
subsidiary and any other non-bank subsidiary of such holding company). Banks that are not members
of the Federal Reserve are also subject to these limitations. Further, federal law prohibits a bank
holding company and its subsidiaries from engaging in certain tie-in arrangements in connection
with any extension of credit, lease or sale of property or the furnishing of services.
Other Regulations: Interest and certain other charges collected or contracted for by the Bank
are subject to state usury laws and certain federal laws concerning interest rates. The Bank’s loan
operations are also subject to certain federal laws applicable to credit transactions, such as the
federal Truth-In-Lending Act governing disclosures of credit terms to consumer borrowers; the Home
Mortgage Disclosure Act of 1975 requiring financial institutions to provide information to enable
the public and public officials to determine whether a financial institution is fulfilling its
obligation to help meet the housing needs of the community it serves; the Equal Credit Opportunity
Act prohibiting discrimination on the basis of race, creed or other prohibited factors in extending
credit; the Fair Credit Reporting Act of 1978 governing information given to credit reporting
agencies; the Fair Debt Collection Act governing the manner in which consumer debts may be
collected by collection agencies; the Soldiers’ and Sailors Civil Relief Act of 1940, governing the
repayment terms of, and property rights underlying obligations of, persons in military service; and
the rules and regulations of the various federal agencies charged with the responsibility of
implementing such federal laws. The deposit operations of the Banks are also subject to the Right
to Financial Privacy Act, which imposes a duty to maintain confidentiality of consumer financial
records and prescribes procedures for complying with administrative subpoenas of financial records,
and the Electronic Funds Transfer Act and Regulation E issued by the Federal Reserve Board to
implement that Act, which governs automatic deposits to and withdrawals from deposit accounts and
customers’ rights and liabilities arising from the use of automated teller machines and other
electronic banking services.
Deposit Insurance: The Bank is FDIC-insured, and is therefore required to pay deposit
insurance premium assessments to the FDIC.
Pursuant to the Federal Deposit Insurance Reform Act of 2005 (the “FDIRA”) in 2006, the
previously separate deposit insurance funds for banks and savings associations were merged into a
single deposit insurance fund administered by the FDIC. The Bank’s deposits are insured up to
applicable limitations by that deposit insurance fund.
7
Table of Contents
Following the adoption of the FDIRA, the FDIC has the opportunity, through its rulemaking
authority, to better price deposit insurance for risk than was previously authorized. The FDIC
adopted regulations that create a system of risk-based assessments. Under the regulations, there
are four risk categories, and each insured institution is assigned to a risk category based on
capital levels and supervisory ratings. Well-capitalized institutions with the highest regulatory
composite ratings are placed in Risk Category I, while other institutions are placed in Risk
Categories II, III or IV depending on their capital levels and composite ratings. Currently,
Reliance Bank, FSB is ranked as Risk Category I and Reliance Bank is ranked as Risk Category II.
The assessment rates may be changed by the FDIC as necessary to maintain the insurance fund at the
reserve ratio designated by the FDIC, which currently is 1.25% of insured deposits. The FDIC may
set the reserve ratio annually at between 1.15% and 1.50% of insured deposits. Deposit insurance
assessments will be collected for a quarter, at the end of the next quarter. Assessments are based
on deposit balances at the end of the quarter, except for institutions with $1 billion or more in
assets, such as the Bank, and any institution that becomes insured on or after January 1, 2007
which will have their assessment base determined using average daily balances of insured deposits.
As of September 30, 2008, the reserve ratio of the deposit insurance fund fell to 0.76%. On
October 7, 2008, the FDIC established a restoration plan to restore the reserve ratio to at least
1.15% within five years (effective February 27, 2009 the FDIC extended this time to seven years)
and proposed rules increasing the assessment rate for deposit insurance and making adjustments to
the assessment system. On December 16, 2008, the FDIC adopted and issued a final rule increasing
the rates banks pay for deposit insurance uniformly by 7 basis points (annualized) effective
January 1, 2009. Under the final rule, risk-based rates for the first quarter 2009 assessment will
range between 12 and 50 basis points (annualized). The 2009 first quarter assessment rates
established by the FDIC provide that the highest rated institutions, those in Risk Category I, will
pay premiums of between 12 and 14 basis points and the lowest rated institutions, those in Risk
Category IV, will pay premiums of 50 basis points. On February 27, 2009, the FDIC adopted a final
rule amending the way that the assessment system differentiates for risk and setting new assessment
rates beginning with the second quarter of 2009. Beginning April 1, 2009, for the highest rated
institutions, those in Risk Category I, the initial base assessment rate will be between 12 and 16
basis points and for the lowest rated institutions, those in Risk Category IV, the initial base
assessment rate will be 45 basis points. The final rule modifies the means to determine a Risk
Category I institution’s initial base assessment rate. It also provides for the following
adjustments to an institution’s assessment rate: (1) a decrease for long-term unsecured debt,
including most senior and subordinated debt and, for small institutions, a portion of Tier 1
capital; (2) an increase for secured liabilities above a threshold amount; and (3) for institutions
in risk categories other than Risk Category I, an increase for brokered deposits above a threshold
amount. After applying these adjustments, for the highest rated institutions, those in Risk
Category I, the total base assessment rate was between 7 and 24 basis points and for the lowest
rated institutions, those in Risk Category IV, the total base assessment rate was between 40 and
77.5 basis points.
On May 22, 2009, the FDIC adopted a final rule imposing a 5 basis point special assessment on
each institution’s assets minus Tier 1 capital as of June 30, 2009, which was collected on
September 30, 2009. The amount of the special assessment for any institution was not to exceed 10
basis points times the institution’s assessment base for the second quarter.
On November 12, 2009, the FDIC adopted a final rule amending the assessment regulations to
require institutions to prepay their quarterly risk-based assessments for the fourth quarter of
2009 and for all of 2010, 2011, and 2012, on December 30, 2009. The prepayment for the fourth
quarter of 2009 and all of 2010 was determined by multiplying the total base assessment rate that
the institution paid for the third quarter of 2009 by the corresponding prepaid assessment base for
each quarter. The prepayment for 2011 and 2012 was determined by multiplying the prepaid
assessment rate plus 75 basis points times the corresponding prepaid assessment base for each
quarter. For each quarter of the prepayment period, an institution’s prepaid assessment base was
calculated by increasing its third quarter 2009 assessment base at an annual rate of 5 percent.
On November 21, 2008, the FDIC adopted final regulations implementing the Temporary Liquidity
Guarantee Program (“TLGP”) pursuant to which depository institutions could elect to participate.
Pursuant to the TLGP, the FDIC will (i) guarantee, through the earlier of maturity or June 30,
2012, certain newly issued senior unsecured debt issued by participating institutions on or after
October 14, 2008 and before June 30,
8
Table of Contents
2009 (the “Debt Guarantee”), and (ii) provide full FDIC deposit insurance coverage for
non-interest bearing deposit transaction accounts regardless of dollar amount for an additional fee
assessment by the FDIC (the “Transaction Account Guarantee”). These accounts are mainly
payment-processing accounts, such as business payroll accounts. The Transaction Account Guarantee
expired on June 30, 2010. Participating institutions were assessed a 10 basis point surcharge on
the portion of eligible accounts that exceeds the general limit on deposit insurance coverage.
Reliance Bank and Reliance Bank, FSB elected to participate in this Program.
The FDIC may terminate the deposit insurance of any insured depository institution if the FDIC
determines, after a hearing, that the institution (i) has engaged or is engaging in unsafe or
unsound practices, (ii) is in an unsafe or unsound condition to continue operations or (iii) has
violated any applicable law, regulation, order, or any condition imposed in writing by, or written
agreement with, the FDIC. The FDIC may also suspend deposit insurance temporarily during the
hearing process for a permanent termination of insurance, if the institution has no tangible
capital. Management of the Company is not aware of any activity or condition that could result in
termination of the deposit insurance of Reliance Bank.
Beginning with the second quarter of 2011, as mandated by the recently enacted Dodd-Frank Wall
Street Reform and Consumer Protection Act (the “Dodd-Frank Act”), the assessment base that the FDIC
will use to calculate assessment premiums will be a bank’s average assets minus average tangible
equity. As the asset base of the banking industry is larger thatn the deposit base, the range of
assessment rates will change to a low of 2.5 basis points through a high of 45 basis points, per
$100 of assets; however, the dollar amount of total actual premiums is expected to be roughly the
same.
The FDIC is required under the Dodd-Frank Act to establish assessment rates that will allow
the Deposit Insurance Fund to achieve a reserve ratio of 1.35% of Insurance Fund insured deposits
by September 2020. In addition, the FDIC has established a “designated reserve ratio” of 2.0%, a
target ratio that, until it is achieved, will not likely result in the FDIC reducing assessment
rates. In attempting to achieve the mandated 1.35% ratio, the FDIC is required to implement
assessment formulas that charge banks over $10 billion in asset size more than banks under that
size. Those new formulas begin in the second quarter of 2011, but do not affect the Bank. Under
the Dodd-Frank Act, the FDIC is authorized to make reimbursements from the insurance fund to banks
if the reserve ratio exceeds 1.50%, but the FDIC has adopted the “designated reserve ratio” of 2.0%
and has announced that any reimbursements from the fund are indefinitely suspended.
Reliance Bank, FSB
Reliance Bank, FSB is a federally chartered thrift, and as such, is regulated by the same
agencies as its affiliate, Reliance Bank. The principal difference is that the FSB’s primary
regulator is the OTS in lieu of the Missouri Division of Finance. As such, all of the above
mentioned federal regulations apply to Reliance Bank, FSB. Additionally, under OTS regulations,
Reliance Bank, FSB must maintain its standing as a “qualified thrift lender.” To maintain this
status, it is required to comply with restrictions and limitations imposed by OTS regulations on
the percentage of its loan portfolio that may be invested in different types of loans;
specifically, Reliance Bank, FSB must maintain at least 65% of its loan portfolio in “qualified
thrift investments,” which are essentially residential real estate loans. There are a wide variety
of loans that qualify for this purpose.
Recent Legislation Affecting the Financial Services Industry
The Dodd-Frank Act, which became law in July 2010, significantly changes regulation of financial
institutions and the financial services industry, including: creating a Financial Services
Oversight Council to identify emerging systemic risks and improve interagency cooperation;
centralizing responsibility for consumer financial protection by creating a new agency, the
Consumer Financial Protection Bureau, which will be responsible for implementing, examining and
enforcing compliance with federal consumer financial laws; permanently raising the current standard
maximum deposit insurance amount to $250,000; establishing strengthened capital standards for
banks, and disallowing certain trust preferred securities from qualifying as Tier 1 capital
(subject to certain grandfather provisions for trust preferred securities); establishing new
minimum mortgage underwriting standards; granting the Federal Reserve Board the power to regulate
debit card interchange fees; and implementing corporate governance changes. Many aspects of the
Dodd-Frank
9
Table of Contents
Act are subject to rulemaking that will take effect over several years, thus making it difficult to
assess the impact of the statute on the financial industry, including the Company, at this time.
It is difficult to predict at this time the specific impact the Dodd-Frank Act and the yet to be
written implementing rules and regulations will have on community banks. Given the uncertainty
associated with the manner in which the provisions of the Dodd-Frank Act will be implemented by the
various regulatory agencies and through regulations, the full extent of the impact such
requirements will have on financial institutions’ operations is presently unclear. The changes
resulting from the Dodd-Frank Act may impact the profitability of our business activities, require
changes to certain of our business practices, impose upon us more stringent capital, liquidity and
leverage ratio requirements or otherwise adversely affect our business. These changes may also
require us to invest significant management attention and resources to evaluate and make necessary
changes in order to comply with new statutory and regulatory requirements.
Employees
As of December 31, 2010, we had approximately 212 full-time equivalent employees. None of the
Company’s employees are covered by a collective bargaining agreement. Management believes that its
relationship with its employees is good.
Item 1A. Risk Factors
An investment in shares of our Common Stock involves various risks. Before deciding to invest
in our Common Stock, you should carefully consider the risks described below in conjunction with
the other information in this Annual Report. Our business, financial condition and results of
operations could be harmed by any of the following risks or by other risks identified throughout
this Annual Report, or by other risks that have not been identified or that we may believe are
immaterial or unlikely. The value or market price of our Common Stock could decline due to any of
these risks, and you may lose all or part of your investment. The risks discussed below also
include forward-looking statements, and our actual results may differ substantially from those
discussed in these forward-looking statements.
The current economic environment poses challenges for us and could adversely affect our financial
condition and results of operations.
We are operating in a challenging and uncertain economic environment, including generally
uncertain national conditions and local conditions in our markets. The capital and credit markets
have been experiencing volatility and disruption for more than 36 months. The volatility and
disruption we have experienced are ongoing. The risks associated with our business become more
acute in periods of a slowing economy or slow growth. Financial institutions continue to be
affected by sharp declines in the real estate market and constrained financial markets. We retain
direct exposure to the residential and commercial real estate markets, and we are affected by these
events.
Our loan portfolio includes commercial real estate loans, residential mortgage loans, and
construction and land development loans. Continued declines in real estate values, home sales
volumes and financial stress on borrowers as a result of the uncertain economic environment,
including job losses, could have an adverse effect on our borrowers or their customers, which could
adversely affect our financial condition and results of operations. In addition, a deepening of the
national economic recession or further deterioration in local economic conditions in our markets
could drive losses beyond that which is provided for in our reserve for loan losses and result in
the following other consequences: increases in loan delinquencies, problem assets and foreclosures
may increase; demand for our products and services may decline; deposits may decrease, which would
adversely impact our liquidity position; and collateral for our loans, especially real estate, may
decline in value, in turn reducing customers’ borrowing power, and reducing the value of assets and
collateral associated with our existing loans.
10
Table of Contents
The impact of recent and future legislation may affect our business.
Congress and the Treasury Department have recently adopted legislation and taken actions to
address the disruptions in the financial system and declines in the housing market. It is not clear
at this time what impact EESA, TARP, ARRA, other liquidity and funding initiatives of the Treasury
and other bank regulatory agencies that have been previously announced, and any additional programs
that may be initiated in the future, will have on the financial markets and the financial services
industry. The actual impact that EESA and such related measures undertaken to alleviate the credit
crisis will have generally on the financial markets, including the extreme levels of volatility and
limited credit availability currently being experienced, is unknown. The failure of such measures
to help stabilize the financial markets and a continuation or worsening of current financial market
conditions could materially and adversely affect our business, financial condition, results of
operations, access to credit or the trading price of our common stock. Finally, there can be no
assurance regarding the specific impact that such measures may have on us.
In addition to the legislation mentioned above, federal and state governments could pass
additional legislation responsive to current credit conditions. As an example, the Bank could
experience higher credit losses because of federal or state legislation or regulatory action that
reduces the amount the Bank’s borrowers are otherwise contractually required to pay under existing
loan contracts. Also, the Bank could experience higher credit losses because of federal or state
legislation or regulatory action that limits its ability to foreclose on property or other
collateral or makes foreclosure less economically feasible.
Current levels of market volatility are unprecedented.
The capital and credit markets have been experiencing volatility and disruption for several
years. In recent months, the volatility and disruption have reached unprecedented levels. In some
cases, the markets have produced downward pressure on stock prices and credit availability for
certain issuers without regard to those issuers’ underlying financial strength. If current levels
of market disruption and volatility continue or worsen, our ability to access capital may be
adversely affected which, in turn, could adversely affect our business, financial condition and
results of operations.
Additional increases in insurance premiums could affect our earnings.
The FDIC insures the Bank’s deposits up to certain limits. The FDIC charges us premiums to
maintain the Deposit Insurance Fund. Current economic conditions have increased the deposit
premiums as a result of bank failures. The FDIC takes control of failed banks and ensures payment
of deposits up to insured limits using the resources of the Deposit Insurance Fund. The FDIC has
designated the Deposit Insurance Fund long -term target reserve ratio at 1.25 percent of insured
deposits. Due to recent bank failures, the FDIC insurance fund reserve ratio has fallen below 1.15
percent, the statutory minimum.
The FDIC expects a higher ratio of insured institution failures in the next few years, which
may result in a continued decline in the reserve ratio. As discussed above, the FDIC has developed
a restoration plan that uniformly increases assessments by 7 basis points
(annualized) effective January 1, 2009. Effective April 1, 2009, the plan also has made changes to
the deposit insurance assessment system requiring riskier institutions to pay a larger share. Even
though we fully paid FDIC deposit insurance for the year 2009, as well as prepaying for the years
2010, 2011, and 2012, there is no guarantee the FDIC will not implement further increases during
these three years, even though prepaid. If these assessments increase significantly it could
adversely affect our earnings.
A future reduction in liquidity in the banking system could increase our costs.
The Federal Reserve Bank has been providing vast amounts of liquidity into the banking system
to compensate for weaknesses in short-term borrowing markets and other capital markets. A reduction
in the Federal Reserve’s activities or capacity could reduce liquidity in the markets, thereby
increasing funding costs to the Company or reducing the availability of funds to the Company to
finance its existing operations.
11
Table of Contents
Difficult market conditions have adversely affected our industry.
We are particularly exposed to downturns in the U.S. housing market. Dramatic declines in the
housing market over the past two years, with falling home prices and increasing foreclosures,
unemployment and under-employment, have negatively impacted the credit performance of mortgage
loans and securities and resulted in significant write-downs of asset values by financial
institutions, including government-sponsored entities, major commercial and investment banks, and
regional financial institutions. Reflecting concern about the stability of the financial markets
generally and the strength of counterparties, many lenders and institutional investors have reduced
or ceased providing funding to borrowers, including to other financial institutions. This market
turmoil and tightening of credit have led to an increased level of commercial and consumer
delinquencies, lack of consumer confidence, increased market volatility and widespread reduction of
business activity generally. The resulting economic pressure on consumers and lack of confidence in
the financial markets have adversely affected our business, financial condition and results of
operations. We do not expect that the difficult conditions in the financial markets are likely to
improve in the near future. A worsening of these conditions would likely exacerbate the adverse
effects of these difficult market conditions on us and others in the financial institutions
industry.
Our business is impacted by the local economies in which we operate.
Because the majority of our borrowers and depositors are individuals and businesses located
and doing business in the St. Louis and Fort Myers metropolitan areas, our success depends to a
significant extent upon economic conditions in the St. Louis and Fort Myers metropolitan areas.
Adverse economic conditions in our market areas could reduce our growth rate, affect the ability of
our customers to repay their loans and generally affect our financial condition and results of
operations. Conditions such as inflation, recession, unemployment, high interest rates, short money
supply, scarce natural resources, international disorder, terrorism, weather-related conditions and
other factors beyond our control may adversely affect our profitability. We are less able than a
larger institution to spread the risks of unfavorable local economic conditions across a large
number of diversified economies. Any sustained period of increased payment delinquencies,
foreclosures or losses caused by adverse market or economic conditions in the St. Louis or Fort
Myers metropolitan areas could adversely affect the value of our assets, revenues, results of
operations and financial condition. Our loan production offices (“LPOs”) in Phoenix and Houston
could also be impacted by local economies in regards to loan production and growth. Moreover, we
cannot give any assurance we will benefit from any market growth or favorable economic conditions
in our primary market areas if they do occur.
If the value of real estate in the St. Louis and Fort Myers metropolitan areas were to
continue to decline materially, a significant portion of our loan portfolio would become
under-collateralized, which could have a material adverse effect on us.
With most of our loans concentrated in the St. Louis and Fort Myers metropolitan areas at this
time, a continued decline in local economic conditions could adversely affect the value of the real
estate collateral securing our loans. A continued decline in property values would diminish our
ability to recover on defaulted loans by selling the real estate collateral, making it more likely
that we would suffer losses on defaulted loans. Additionally, the subsequent decrease in asset
quality could require additions to our reserve for possible loan losses through increased
provisions for loan losses, which would hurt our profits. Also, a further decline in local economic
conditions may have a greater effect on our earnings and capital than on the earnings and capital
of larger financial institutions whose real estate loan portfolios are more geographically diverse.
Real estate values are affected by various factors in addition to local economic conditions,
including, among other things, changes in general or regional economic conditions, governmental
rules or policies and natural disasters. A negative development in any of these factors could
adversely affect our results of operations and financial condition.
Our reserve for possible loan losses may be insufficient to absorb losses in our loan
portfolio.
Like most financial institutions, we maintain a reserve for possible loan losses to provide
for loans in our portfolio that may not be repaid in their entirety. We believe that our reserve
for possible loan losses is maintained at a level adequate to absorb probable losses inherent in
our loan portfolio as of the corresponding
12
Table of Contents
balance sheet date. However, our reserve for possible loan losses may not be sufficient to
cover actual loan losses, and future provisions for loan losses could materially adversely affect
our operating results.
In evaluating the adequacy of our reserve for possible loan losses, we consider numerous
quantitative factors, including our historical charge-off experience, growth of our loan portfolio,
changes in the composition of our loan portfolio and the volume of delinquent and criticized loans.
In addition, we use information about specific borrower situations, including their financial
position and estimated collateral values, to estimate the risk and amount of loss for those
borrowers. Finally, we also consider many qualitative factors, including general and economic
business conditions, duration of the current business cycle, current general market collateral
valuations, trends apparent in any of the factors we take into account and other matters, which are
by nature more subjective and fluid. Our estimates of the risk of loss and amount of loss on any
loan are complicated by the significant uncertainties surrounding our borrowers’ abilities to
successfully execute their business models through changing economic environments, competitive
challenges and other factors. Because of the degree of uncertainty and susceptibility of these
factors to change, our actual losses may vary from our current estimates.
At December 31, 2010, our reserve for possible loan losses as a percentage of total loans was
3.84%. Federal and state regulators, as an integral part of their examination process, periodically
review our reserve for possible loan losses and may require us to increase our reserve for possible
loan losses by recognizing additional provisions for loan losses charged to expense, or to decrease
our reserve for possible loan losses by recognizing loan charge-offs, net of recoveries. Any such
additional provisions for loan losses or charge-offs, as required by these regulatory agencies,
could have a material adverse effect on our financial condition and results of operations.
Fluctuations in interest rates could reduce our profitability and affect the value of our
assets.
Like other financial institutions, we are subject to interest rate risk. Our primary source of
income is net interest income, which is the difference between interest earned on loans and
investments and the interest paid on deposits and borrowings. We expect that we will periodically
experience imbalances in the interest rate sensitivities of our assets and liabilities and the
relationships of various interest rates to each other. Over any defined period of time, our
interest-earning assets may be more sensitive to changes in market interest rates than our
interest-bearing liabilities, or vice versa. In addition, the individual market interest rates
underlying our loan and deposit products (e.g., the prime commercial rate) may not change to the
same degree over a given time period. In any event, if market interest rates should move contrary
to our position, our earnings may be negatively affected. In addition, loan volume and quality and
deposit volume and mix can be affected by market interest rates. Changes in levels of market
interest rates could materially and adversely affect our net interest spread, asset quality,
origination volume and overall profitability.
We principally manage interest rate risk by managing our volume and mix of our earning assets
and funding liabilities. In a changing interest rate environment, we may not be able to manage this
risk effectively. If we are unable to manage interest rate risk effectively, our business,
financial condition and results of operations could be adversely affected. Changes in the level of
interest rates also may negatively affect our ability to originate real estate loans, the value of
our assets and our ability to realize gains from the sale of our assets, all of which ultimately
affect our earnings.
We are dependent upon the services of our management team.
Our future success and profitability is substantially dependent upon the management and
banking abilities of our executive management team. We believe that our future results will also
depend in part upon our attracting and retaining highly skilled and qualified senior and middle
management. We are especially dependent on a limited number of key management personnel, none of
whom has an employment agreement with us, except for our Chairman, our Chief Executive Officer and
our Executive Vice President. The loss of the Chairman, the Chief Executive Officer, Executive Vice
President or other senior executive officers could have a material adverse impact on our operations
because other officers may not have the experience and expertise to readily replace these
individuals. Competition for such personnel is intense, and we cannot assure you that we will be
successful in attracting or retaining such personnel. Changes in key personnel and their
responsibilities may be disruptive to our business and could have a material adverse effect on our
business, financial condition and results of operations.
13
Table of Contents
Our failure to recruit and retain qualified lenders could adversely affect our ability to
compete successfully and affect our profitability.
Our success and future growth depend heavily on our ability to attract and retain highly
skilled and motivated lenders and other banking professionals. We compete against many institutions
with greater financial resources both within our industry and in other industries to attract these
qualified individuals. Our failure to recruit and retain adequate talent could reduce our ability
to compete successfully and could adversely affect our business and profitability.
Competition from financial institutions and other financial service providers may adversely
affect our growth and profitability.
The banking business is highly competitive and we experience competition in each of our
markets from many other financial institutions. We compete with commercial banks, credit unions,
savings and loan associations, mortgage banking firms, consumer finance companies, securities
brokerage firms, insurance companies, money market funds, and other mutual funds, as well as other
super-regional, national and international financial institutions that operate offices in our
primary market areas and elsewhere.
We compete with these institutions both in attracting deposits and in making loans. This
competition has made it more difficult for us to make new loans and has occasionally forced us to
offer higher deposit rates. Price competition for loans and deposits might result in us earning
less on our loans and paying more on our deposits, which reduces net interest income. Many of our
competitors are larger financial institutions. While we believe we successfully compete with these
other financial institutions in our primary markets, we may face a competitive disadvantage as a
result of our smaller size, smaller resources and smaller lending limits, lack of geographic
diversification and inability to spread our marketing costs across a broader market. In recent
years, several new financial institutions have been established in the St. Louis and Fort Myers
metropolitan areas. These new financial institutions have and are expected to continue to price
their loans and deposits aggressively in order to attract customers. Although we compete by
concentrating our marketing efforts in our primary markets with local advertisements, personal
contacts, and greater flexibility and responsiveness in working with local customers, we can give
no assurance this strategy will be successful.
We may have fewer resources than many of our competitors to invest in technological
improvements.
The financial services industry is undergoing rapid technological changes, with frequent
introductions of new technology-driven products and services. The effective use of technology
increases efficiency and enables financial institutions to better serve customers and reduce costs.
Our future success will depend, in part, upon our ability to address the needs of our customers by
using technology to provide products and services that will satisfy customer demands for
convenience, as well as to create additional efficiencies in our operations. Many of our
competitors have substantially greater resources to invest in technological improvements. We may
not be able to effectively implement new technology-driven products and services or be successful
in marketing these products and services to our customers.
We are subject to security and operational risks relating to our use of technology that could
damage our reputation and our business.
Security breaches in our internet banking activities could expose us to possible liability and
damage our reputation. Any compromise of our security also could deter customers from using our
internet banking services that involve the transmission of confidential information. We rely on
standard internet security systems to provide the security and authentication necessary to effect
secure transmission of data. These precautions may not protect our systems from compromises or
breaches of our security measures that could result in damage to our reputation and our business.
Additionally, we outsource our data processing to a third party. If our third party provider
encounters difficulties or if we have difficulty in communicating with such third party, it will
significantly affect our ability to adequately process and account for customer transactions, which
would significantly affect our business operations.
14
Table of Contents
We operate in a highly regulated environment and we may be adversely affected by changes in
laws and regulations.
We are subject to extensive regulation, supervision and examination by the Federal Reserve,
OTS, the Missouri Division of Finance, its chartering authorities, and by the FDIC, as insurer of
our deposits. Such regulation and supervision govern the activities in which we may engage, and are
intended primarily for the protection of the insurance fund and for the depositors and borrowers of
the Banks. The regulation and supervision by the Federal Reserve, OTS, the Missouri Division of
Finance and the FDIC are not intended to protect the interests of investors in our Common Stock.
Regulatory authorities have extensive discretion in their supervisory and enforcement activities,
including the imposition of restrictions on our operations, the classification of our assets and
determination of the level of our reserve for possible loan losses. Any change in such regulation
and oversight, whether in the form of regulatory policy, regulations, legislation or supervisory
action, may have a material impact on our operations. As an example, the GLBA eliminates many of
the restrictions placed on the activities of certain qualified financial or bank holding companies.
We will incur additional expenses as a publicly reporting company as a result of compliance costs
associated with the SEC’s public reporting requirements. In addition, SOX and the related rules and
regulations promulgated by the SEC that are now applicable to us, have increased the scope,
complexity and cost of corporate governance, reporting and disclosure practices, including the
costs of completing our audits and maintaining our internal controls.
Our controls and procedures may fail or be circumvented.
Management regularly reviews and updates our internal controls, disclosure controls and
procedures, and corporate governance policies and procedures. Any system of controls, however well
designed and operated, is based in part on certain assumptions and can provide only reasonable, not
absolute, assurances that the objectives of the system are met. Any failure or circumvention of
our controls and procedures or failure to comply with regulations related to controls and
procedures could have a material adverse effect on our business, results of operations and
financial condition.
We continually encounter technological change.
The financial services industry is continually undergoing rapid technological change with
frequent introductions of new technology-driven products and services. The effective use of
technology increases efficiency and enables financial institutions to better serve customers and to
reduce costs. Our future success depends, in part, upon our ability to address the needs of our
customers by using technology to provide products and services that will satisfy customer demands,
as well as to create additional efficiencies in our operations. Many of our competitors have
substantially greater resources than we do to invest in technological improvements. We may not be
able to effectively implement new technology-driven products and services or be successful in
marketing these products and services to our customers. Failure to successfully keep pace with
technological change affecting the financial services industry could have a material adverse effect
on our business and, in turn, our financial condition and results of operations.
We are subject to credit risk.
When we loan money, commit to loan money or enter into a letter of credit or other contract
with a counterparty, we incur credit risk, or the risk of losses if our borrowers do not repay
their loans or our counterparties fail to perform according to the terms of their contracts. A
number of our products expose us to credit risk, including loans and lending commitments, and
assets held for sale. The credit quality of our portfolio can have a significant impact on our
earnings. We estimate and establish reserves for credit risks and credit losses inherent in our
credit exposure (including unfunded credit commitments). This process, which is critical to our
financial results and condition, requires difficult, subjective and complex judgments, including
forecasts of economic conditions and how these economic predictions might impair the ability of our
borrowers to repay their loans. As is the case with any such assessments, there is always the
chance that we will fail to identify the proper factors or that we will fail to accurately estimate
the impacts of factors that we identify.
15
Table of Contents
Changes in interest rates could adversely affect profitability.
The Company may be unable to manage interest rate risk that could reduce its net interest
income. Like other financial institutions, the Company’s results of operations are affected
principally by net interest income, which is the difference between interest earned on loans and
investments and interest expense paid on deposits and other borrowings. The Company cannot predict
or control changes in interest rates. Regional and local economic conditions and the policies of
regulatory authorities, including monetary policies of the Federal Reserve, affect interest income
and interest expense. While the Company continually takes measures intended to manage the risks
from changes in market interest rates, changes in interest rates can still have a material adverse
effect on the Company’s profitability. For example, upward fluctuations in interest rates in the
credit market may force the Company to either pay higher rates on its deposits or risk losing such
deposits to other investments. At the same time, the Company may have loaned funds to customers at
long-term fixed rates and thus would not be able to correspondingly increase its interest income.
Conversely, during periods of decreasing interest rates, customers with higher rate long term fixed
rate loans may seek to refinance their loans, thereby decreasing the Company’s interest income.
ITEM 1b. Unresolved Staff Comments
None.
Item 2. Properties
Our executive offices are located at 10401 Clayton Road, Frontenac, Missouri, 63131. As of
December 31, 2010, the Company’s subsidiary, Reliance Bank, had a total of twenty banking locations
in Missouri and Illinois. Reliance Bank owns nineteen of the bank branch buildings, as well as the
underlying real property on fourteen of them. One branch operates in a leased building, and the
remaining five branch buildings, although owned, are subject to ground leases that expire between
2015 and 2026 and include one or more renewal options.
As of December 31, 2010, the Company’s subsidiary, Reliance Bank, FSB, had three locations in
Florida. Reliance Bank, FSB leases one of these locations, and owns the other two.
As of December 31, 2010, the Company’s subsidiary, Reliance Loan Center in Phoenix, Arizona
had one leased location.
As of December 31, 2010, the Company’s subsidiary, Reliance Loan Center in Houston, Texas had
one leased location.
Item 3. Legal Proceedings
The Company and its subsidiaries are, from time to time, parties to various legal proceedings
arising out of their businesses. Management believes that there are no such proceedings pending or
threatened against the Company or its subsidiaries which, if determined adversely, would have a
material adverse effect on the business, financial condition, results of operations or cash flows
of the Company or any of its subsidiaries.
Item 4. (Removed and Reserved)
PART II
Item 5. Market for Registrant’s common equity, related stockholder matters and
issuer purchases of equity securities
The Class A Common Stock of the Company, par value $0.25 (the “Common Stock”), is not
registered under the Securities Act of 1933, as amended, however is registered under Section 12(g)
of the Securities Exchange Act of 1934, as amended. The Common Stock is quoted on the
Over-the-Counter Bulletin Board under the symbol “RLBS,” but the Company is unaware as to any
transactions involving its Common Stock other than occasional trades and private transactions
between shareholders and third parties.
16
Table of Contents
The high and low price per share paid for the Common Stock as determined by reference to
offering prices of the Common Stock during the previous two fiscal years are reflected in the
following table:
| High | Low | |||||||
2010 |
||||||||
First Quarter |
$ | 3.40 | $ | 2.25 | ||||
Second Quarter |
$ | 2.75 | $ | 2.10 | ||||
Third Quarter |
$ | 2.75 | $ | 2.10 | ||||
Fourth Quarter |
$ | 2.74 | $ | 1.43 | ||||
2009 |
||||||||
First Quarter |
$ | 4.90 | $ | 3.00 | ||||
Second Quarter |
$ | 4.50 | $ | 3.25 | ||||
Third Quarter |
$ | 3.65 | $ | 2.65 | ||||
Fourth Quarter |
$ | 3.50 | $ | 2.00 | ||||
As of March 18, 2011 there were approximately 747 holders of our Common Stock.
Dividends
The Company has never paid any cash dividends and has no current intention to pay dividends on
common in the immediate future.
The following Stock Performance Graph and related information should not be deemed “soliciting
material” or to be “filed” with the SEC nor shall such performance be incorporated by reference
into any future filings under the Securities Act of 1933 or Securities Exchange Act of 1934, each
as amended, except to the extent that the Company specifically incorporates it by reference into
such filing.
The following graph compares the Company’s cumulative stockholder return on its common stock
from June 26, 2007 through December 31, 2010, the measurement period. The graph compares the
Company’s common stock with the NASDAQ Composite and the SNL $1B-$5B Bank Index. The graph assumes
an investment of $100.00 in the Company’s common stock and each index on June 26, 2007 and
reinvestment of all quarterly dividends. The investment is measured as of the fiscal year end.
While there are no assurances, the Company believes that this trend will reverse as the economy
improves.
17
Table of Contents
Stock Performance Graph
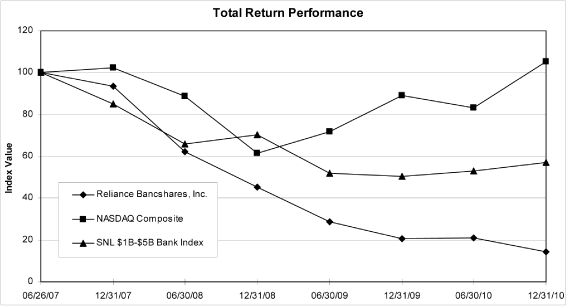
| Period | ||||||||||||||||||||||||||||||||
| Ending | ||||||||||||||||||||||||||||||||
| Index | 06/26/07 | 12/31/07 | 06/30/08 | 12/31/08 | 06/30/09 | 12/31/09 | 06/30/10 | 12/31/10 | ||||||||||||||||||||||||
Reliance Bancshares, Inc. |
100.00 | 93.33 | 62.22 | 45.24 | 28.89 | 20.44 | 20.89 | 14.31 | ||||||||||||||||||||||||
NASDAQ Composite |
100.00 | 102.21 | 88.74 | 61.35 | 71.76 | 89.17 | 83.27 | 105.35 | ||||||||||||||||||||||||
SNL $1B-$5B Bank Index |
100.00 | 84.90 | 66.04 | 70.42 | 51.72 | 50.48 | 53.04 | 57.22 | ||||||||||||||||||||||||
Securities Authorized for Issuance Under Equity Compensation Plans
The following table provides information as of December 31, 2010, regarding securities issued
and to be issued under our equity compensation plans that were in effect during the year ended
December 31, 2010:
| Number of securities | ||||||||||||
| remaining available for | ||||||||||||
| future issuance under | ||||||||||||
| Number of securities to | Weighted-average | equity compensation | ||||||||||
| be issued upon exercise | exercise price of | plans (excluding | ||||||||||
| of outstanding options, | outstanding options, | securities reflected in | ||||||||||
| warrants and rights | warrants and rights | column (a)) | ||||||||||
| Plan category | (a) | (b) | (c) | |||||||||
Equity
compensation plans
approved by security
holders |
1,424,450 | $ | 8.05 | 408,300 | ||||||||
Equity compensation
plans not approved
by security holders |
666,816 | $ | 8.41 | 116,500 | ||||||||
Total |
2,091,266 | $ | 8.17 | 524,800 | ||||||||
18
Table of Contents
Recent Sales of Unregistered Equity Securities
The Company sold 1,400,517 shares of the Company’s common stock at the offering price of $3.00 per
share at various times during the year ended 2010. This represented an aggregate offering price of
$4,201,551. This offering was extended to accredited investors (as such term is defined in
Regulation D under the Securities Act of 1933, as amended), and was intended to qualify for
exemption from registration pursuant to Rule 506 of Regulation D.
In addition, at various times during 2010 the Company sold 250 shares of our Series C Preferred
Stock for an aggregate consideration of $250,000.00. These shares were not registered and were
sold in reliance upon the exemption from registration contained in Section 4(2) of the Securities
Act of 1933, as amended.
19
Table of Contents
Item 6. selected financial data
The following consolidated selected financial data is derived from the Company’s audited
financial statements as of and for the five years ended December 31, 2010. This information should
be read in connection with our audited consolidated financial statements, related notes and
“Management’s Discussion and Analysis of Financial Condition and Results of Operations” appearing
elsewhere in this report.
| As of and for the | ||||||||||||||||||||
| Years ended December 31, | ||||||||||||||||||||
| 2010 | 2009 | 2008 | 2007 | 2006 | ||||||||||||||||
| (in thousands, except per share data) | ||||||||||||||||||||
Statements of income: |
||||||||||||||||||||
Total interest income |
$ | 64,146 | $ | 76,589 | $ | 78,209 | $ | 63,687 | $ | 47,961 | ||||||||||
Total interest expense |
23,637 | 39,005 | 41,715 | 37,609 | 26,227 | |||||||||||||||
Net interest income |
40,509 | 37,584 | 36,494 | 26,078 | 21,734 | |||||||||||||||
Provision for possible loan losses |
41,492 | 53,450 | 11,148 | 3,187 | 2,200 | |||||||||||||||
Net interest income after provision
for possible loan losses |
(983 | ) | (15,866 | ) | 25,346 | 22,891 | 19,534 | |||||||||||||
Total noninterest income |
3,507 | 3,925 | 2,683 | 1,976 | 1,310 | |||||||||||||||
Total noninterest expense |
39,741 | 34,046 | 29,428 | 22,290 | 16,605 | |||||||||||||||
Income (loss) before income taxes |
(37,217 | ) | (45,987 | ) | (1,399 | ) | 2,577 | 4,239 | ||||||||||||
Income tax expense (benefit) |
11,312 | (16,630 | ) | (1,080 | ) | 462 | 1,223 | |||||||||||||
Net income (loss) |
$ | (48,529 | ) | $ | (29,357 | ) | $ | (319 | ) | $ | 2,115 | $ | 3,016 | |||||||
Common share data: |
||||||||||||||||||||
Basic net income (loss) per share |
$ | (2.32 | ) | $ | (1.49 | ) | $ | (0.02 | ) | $ | 0.10 | $ | 0.16 | |||||||
Diluted net income (loss) per share |
(2.32 | ) | (1.49 | ) | (0.02 | ) | 0.10 | 0.15 | ||||||||||||
Dividends declared per share |
— | — | — | — | — | |||||||||||||||
Book value per common share |
2.74 | 5.12 | 6.73 | 6.76 | 6.31 | |||||||||||||||
Tangible book value per common share |
2.69 | 5.06 | 6.67 | 6.70 | 6.24 | |||||||||||||||
Weighted average shares-basic |
21,868 | 20,864 | 20,670 | 20,343 | 18,685 | |||||||||||||||
Weighted average shares-diluted |
21,868 | 20,881 | 21,063 | 21,337 | 19,548 | |||||||||||||||
Shares outstanding-end of period |
22,482 | 20,972 | 20,771 | 20,682 | 19,571 | |||||||||||||||
Period-end balances: |
||||||||||||||||||||
Loans, net |
$ | 932,988 | $ | 1,107,998 | $ | 1,238,707 | $ | 901,842 | $ | 660,318 | ||||||||||
Investment securities |
241,599 | 284,120 | 193,888 | 158,042 | 188,369 | |||||||||||||||
Total assets |
1,296,025 | 1,536,708 | 1,573,989 | 1,136,152 | 900,799 | |||||||||||||||
Deposits |
1,080,159 | 1,266,060 | 1,228,047 | 834,576 | 678,597 | |||||||||||||||
Short-term borrowings |
15,178 | 12,697 | 63,919 | 88,325 | 70,463 | |||||||||||||||
Long-term borrowings |
93,000 | 104,000 | 136,000 | 68,000 | 24,300 | |||||||||||||||
Stockholders’ equity |
104,247 | 149,669 | 139,609 | 139,891 | 123,497 | |||||||||||||||
Average balances: |
||||||||||||||||||||
Loans |
$ | 1,066,142 | $ | 1,213,937 | $ | 1,115,216 | $ | 770,523 | $ | 546,122 | ||||||||||
Investment securities |
239,910 | 254,116 | 168,289 | 174,052 | 200,286 | |||||||||||||||
Total assets |
1,422,470 | 1,569,548 | 1,366,110 | 1,006,628 | 786,014 | |||||||||||||||
Deposits |
1,153,078 | 1,238,968 | 1,006,763 | 777,450 | 629,588 | |||||||||||||||
Short-term borrowings |
19,701 | 22,477 | 88,749 | 49,179 | 26,475 | |||||||||||||||
Long-term borrowings |
98,297 | 131,039 | 125,118 | 39,646 | 15,881 | |||||||||||||||
Stockholders’ equity |
145,683 | 169,792 | 138,394 | 134,548 | 109,940 | |||||||||||||||
Selected ratios: |
||||||||||||||||||||
Net yield on earning assets |
3.08 | % | 2.55 | % | 2.88 | % | 2.79 | % | 2.94 | % | ||||||||||
Return on average total assets |
(3.41 | )% | (1.87 | )% | (0.02 | )% | 0.21 | % | 0.38 | % | ||||||||||
Return on average stockholders’ equity |
(33.31 | )% | (17.29 | )% | (0.23 | )% | 1.57 | % | 2.74 | % | ||||||||||
Average stockholders’ equity as a
percent of average total assets |
10.24 | % | 10.82 | % | 10.13 | % | 13.37 | % | 13.99 | % | ||||||||||
Nonperforming loans as a percent of loans at
year-end |
17.63 | % | 6.32 | % | 2.78 | % | 1.95 | % | 0.77 | % | ||||||||||
Reserve for possible loan losses as a
percent of loans at year-end |
3.84 | % | 2.83 | % | 1.14 | % | 1.06 | % | 1.06 | % | ||||||||||
20
Table of Contents
| Note: | All share and per share information has been retroactively restated for a two-for-one stock split and concurrent reduction in par value of $0.50 to $0.25, effective December 29, 2006. |
| Item 7. | Management’s discussion and analysis of financial condition and results of operations |
The following presents management’s discussion and analysis of the consolidated financial
condition and results of operations of Reliance Bancshares, Inc. (the “Company”) for each of the
years in the three-year period ended December 31, 2010. This discussion and analysis is intended
to review the significant factors affecting the financial condition and results of operations of
the Company, and provides a more comprehensive review which is not otherwise apparent from the
consolidated financial statements alone. This discussion should be read in conjunction with
“Selected Financial Data,” the Company’s consolidated financial statements and the notes thereto
and other financial data appearing elsewhere herein.
The Company has prepared all of the consolidated financial information in this report in
accordance with U.S. generally accepted accounting principles (“U.S. GAAP”). In preparing the
consolidated financial statements in accordance with U.S. GAAP, the Company makes estimates and
assumptions that affect the reported amount of assets and liabilities, disclosure of contingent
assets and liabilities at the date of the consolidated financial statements, and the reported
amounts of revenue and expenses during the reporting periods. No assurances can be given that
actual results will not differ from those estimates.
Overview
The Company provides a full range of banking services to individual and corporate customers
throughout the St. Louis metropolitan area in Missouri and Illinois and southwestern Florida
through the 23 locations of its wholly owned subsidiaries, Reliance Bank and Reliance Bank, FSB
(hereinafter referred to as the “Banks”). Since its opening in 1999 through December 31, 2010,
Reliance Bank has established a total of 20 branch locations in the St. Louis metropolitan area of
Missouri and Illinois and Loan Production Offices (“LPOs”) in Houston, Texas and Phoenix, Arizona,
and has total assets, loans and deposits of $1.2 billion, $920 million, and $1 billion,
respectively, at December 31, 2010.
On January 17, 2006, the Company opened a new Federal Savings Bank, Reliance Bank, FSB, in Ft.
Myers, Florida. Since its opening in 2006 through December 31, 2010, Reliance Bank, FSB has
established three branch locations in southwestern Florida and has total assets, loans, and
deposits of $85.3 million, $50.1 million, and $76.5 million, respectively, at December 31, 2010.
The St. Louis metropolitan, southwestern Florida, Houston and Phoenix markets in which the
Company’s banking subsidiaries operate are highly competitive in the financial services area. The
Banks are subject to competition from other financial and nonfinancial institutions providing
financial products throughout these markets.
Executive Summary of Results of Operations and Financial Condition
The Company’s consolidated net loss for the years ended December 31, 2010, 2009, and 2008
totaled $48,528,489, $29,357,361, and $319,230, respectively. The December 31, 2010 loss includes
a $26.1 million charge to establish a valuation allowance for deferred tax assets (see Results of
Operations for detail discussion). The Company’s financial results were driven largely by stresses
related to the commercial real estate sector in the Florida and St. Louis metropolitan markets.
Provision and Asset Quality
Credit costs continued to weigh heavily on 2010 earnings, as the Company recorded $41.5
million in provision for loan losses, largely related to asset quality deterioration in the
Company’s land development, construction and commercial real estate portfolios. Provision for loan
losses for 2009 was $53.5 million. The Company experienced an increase in non-performing loans due
to the current economic environment. Non-performing loans as of December 31, 2010 totaled $171.1
million, compared with $72.1 million as of December 31, 2009. Net charge-offs during 2010 and 2009
were $36.4 million and $35.5, respectively.
21
Table of Contents
Management remains focused on improving credit quality and as a result of continued economic
strains has implemented rigorous problem credit action plans. During 2010, the Company has added
personnel to address asset quality issues and dispose of non-performing assets.
Improved Net Interest Margin
2010 net interest margin grew by 7.8% over the same period in 2009, driven by a 39.4% drop in
2010 interest expense compared to 2009. The composition of the Company’s funding sources has
shifted to lower cost transaction and savings accounts and away from higher cost time deposits. For
the year ended December 31, 2010, average balances of transaction and savings accounts increased to
48.4% of total funding sources in 2010 as compared to 35.5% during 2009. Also, for the year ended
December 31, 2010, average balances of time deposits decreased to 42.3% of total funding sources in
2010 as compared to 53.5% during the same period in 2009.
These increases in lower cost deposits helped reduce the Company’s cost of funds to 1.96% from
2.93% for the year ended December 31, 2010 and 2009, respectively. Management has placed increased
focus on growing low cost core transaction deposits, by concentrating on overall customer deposit
relationships, allowing for a reduction in total deposit pricing and increased customer retention.
Following are certain percentages generally followed in the banking industry:
| As of and for the | ||||||||||||
| Years Ended December 31, | ||||||||||||
| 2010 | 2009 | 2008 | ||||||||||
Percentage of net income (loss) to: |
||||||||||||
Average total assets |
(3.41 | )% | (1.87 | )% | (0.02 | )% | ||||||
Average stockholders’ equity |
(33.31 | )% | (17.29 | )% | (0.23 | )% | ||||||
Percentage of common dividends
declared to net income per common
share |
— | — | — | |||||||||
Percentage of average stockholders’
equity to average total assets |
10.24 | % | 10.82 | % | 10.13 | % | ||||||
Critical Accounting Policies
The following accounting policies are considered most critical to the understanding of the
Company’s financial condition and results of operations. These critical accounting policies require
management’s most difficult subjective and complex judgments about matters that are inherently
uncertain. Because these estimates and judgments are based on current circumstances, they are
likely to change over time or prove to be different than actual experiences. In the event that
different assumptions or conditions were to prevail, and depending upon the severity of such
changes, the possibility of a materially different financial condition and/or results of operations
could reasonably be expected. The impact and any associated risks related to our critical
accounting policies on our business operations are discussed throughout this “Management’s
Discussion and Analysis of Financial Condition and Results of Operations,” where such policies
affect our reported and expected financial results. For a detailed discussion on the application of
these and other accounting policies, see Note 1 to our Consolidated Financial Statements for the
years ended December 31, 2010, 2009, and 2008 included elsewhere herein.
Reserve for Possible Loan Losses
Subject to the use of estimates, assumptions, and judgments, management’s evaluation process
used to determine the adequacy of the reserve for possible loan losses combines several factors:
management’s ongoing review of the loan portfolio; consideration of past loan loss experience;
trends in past due and nonperforming loans; risk characteristics of the various classifications of
loans, existing economic conditions; the fair value of underlying collateral; input from
regulators; and other qualitative and quantitative factors which could affect probable credit
losses. Because current economic conditions can change and future events are inherently difficult
to predict, the anticipated amount of estimated loan losses, and therefore the adequacy of the
reserve, could change significantly. In addition, as an integral part of their examination process,
various
22
Table of Contents
regulatory agencies also review the reserve for possible loan losses. Such agencies may
require that certain loan balances be charged off when their credit evaluations differ from those
of management, based on their judgments about information available to them at the time of their
examinations, or may have particular views of the level of loan loss reserve. The Company believes
the reserve for possible loan losses is adequate and properly recorded in the consolidated
financial statements.
Deferred Tax Assets
The Company recognizes deferred tax assets and liabilities for the estimated future tax
effects of temporary differences, net operating loss carryforwards and tax credits. Deferred tax
assets are recognized subject to management’s judgment based upon available evidence that
realization is more likely than not. In the event that management determines the Company would not
be able to realize all or part of net deferred tax assets in the future, deferred tax assets are
reduced by a deferred tax asset valuation allowance, which results from a direct charge to income
tax expense in the period that such determination is made. Likewise, the Company would reverse the
valuation allowance when realization of the deferred tax asset is expected and decrease income tax
expense, accordingly.
Results of Operations for the Three-Year Period Ended December 31, 2010
Net Interest Income
The Company’s net interest income increased by $2,924,853 (7.78%) to $40,509,237 for the year
ended December 31, 2010 from the $37,584,384 earned for the year ended December 31, 2009, which was
an increase of $1,090,445 (2.99%) from the $36,493,939 earned in 2008. The Company’s net interest
margin for the years ended December 31, 2010, 2009, and 2008 was 3.08%, 2.55%, and 2.88%,
respectively. The increase in margin percentage from 2009 is primarily attributed to lower cost of
funds on the Company’s retail deposit products with a shift in funding composition toward lower
cost deposit products. The Company’s average rate on interest-bearing liabilities for the years
ended December 31, 2010 and 2009 were 1.96% and 2.93%, respectively. These gains were partially
offset by a decrease in yield on loans due to an increase in non-performing loans. The Company’s
average yield on loans for the years ended December 31, 2010 and 2009 were 5.33% and 5.57%,
respectively.
Average earning assets for 2010 decreased $163,703,339 (10.95%) to $1,330,650,715 from the
level of $1,494,354,054 for 2009. Average earning assets for 2009 increased $203,514,070 (15.77%)
from the level of $1,290,839,984 for 2008. A significant portion of the decline from 2009 can be
attributed to the decrease in outstanding loan balances. Total average loans declined $147,794,178
(12.17%) in 2010 to $1,066,142,431 from the level of $1,213,936,609 for 2009, which was an increase
of $98,720,183 (8.85%) from the level of $1,115,216,426 for 2008. The depressed economy has reduced
the Company’s opportunities for loan growth in its current markets and a redirection away from
commercial real estate, which, in the near term, will reduce loan balances.
Total average investment securities for 2010 decreased $14,205,751 (5.59%) to $239,910,442
from the level of $254,116,193 for 2009, which was a decrease of $85,827,133 (51.00%) from the
level of $168,289,060 for 2008. The Company uses its investment portfolio to (a) provide support
for borrowing arrangements for securities sold under repurchase agreements, (b) provide support for
pledging purposes for deposits of governmental and municipal deposits over FDIC insurance limits,
(c) provide a secondary source of liquidity through “laddered” maturities of such securities, and
(d) provide increased interest income over that which would be earned on overnight/daily fund
investments. The total carrying value of securities pledged to secure public funds and repurchase
agreements was approximately $150,544,000, $160,923,000, and $180,767,000 at December 31, 2010,
2009, and 2008, respectively. The Banks have also pledged letters of credit from the Federal Home
Loan Banks totaling $9,118,574 as additional collateral to secure public funds at December 31,
2010.
Average short-term investments can fluctuate significantly from day to day based on a number
of factors, including, but not limited to, the collected balances of customer deposits, loan demand
and investment security maturities. Excess funds not invested in loans or investment securities are
invested in overnight funds with various unaffiliated financial institutions. The average balances
of such short-term investments for the years ended December 31, 2010, 2009, and 2008 were
$24,597,842, $26,301,252, and $7,334,498 respectively.
23
Table of Contents
A key factor in increasing the Company’s net interest margin is to maintain a higher
percentage of earning assets in the loan category, which is the Company’s highest earning asset
category. However, average loans as a percentage of average earning assets were 80.12% for 2010,
which was a 111 basis point decrease under the 81.23% percentage achieved in 2009, which was a 516
basis point decrease under the 86.39% percentage achieved in 2008. This decline resulted from the
depressed economic environment in the Banks’ market areas, resulting in fewer lending opportunities
for the Banks. The average loan balances include nonperforming loans, which do not add any
interest and reduce the overall loan yields disclosed. Total nonperforming loans at December 31,
2010, 2009, and 2008 were $171,089,003, $72,077,434, and $34,896,410, respectively.
Total average interest-bearing deposits for 2010 decreased $87,644,019 (7.45%) to
$1,089,127,193 from the level of $1,176,771,212 for 2009, which was an increase of $226,232,142
(23.80%) from the level of $950,539,070 for 2008. As discussed in the following paragraphs, while
the overall balance has declined, the mix of deposit balances has moved away from the higher cost
time deposits to savings and transaction accounts. With the decline in loan demand and low rates
available on investments, the Banks have not needed as much in deposits.
The Company’s short-term borrowings consist of overnight funds borrowed from unaffiliated
financial institutions and securities sold under sweep repurchase agreements with larger deposit
customers and a short term note payable obtained in 2008 by the Company in the amount of
$7,000,000, and repaid in 2009. The average balances of such borrowings for the years ended
December 31, 2010, 2009, and 2008 totaled $19,701,175, $22,476,551, and $88,748,506, respectively.
Short-term borrowings can fluctuate significantly based on short-term liquidity needs and changes
in deposit volumes.
The Company has used longer-term advances from the Federal Home Loan Banks to match with
longer-term fixed rate assets. During the three-year period ended December 31, 2010, average
longer-term borrowings were $98,296,595, $131,038,979, and $125,117,708, for 2010, 2009, and 2008,
respectively.
The overall mix of the Company’s funding sources has a significant impact on the Company’s net
interest margin. Following is a summary of the percentage of the various components of average
interest-bearing liabilities and noninterest-bearing deposits to the total of all average
interest-bearing liabilities and noninterest-bearing deposits (hereinafter described as total
funding sources):
| 2010 | 2009 | 2008 | ||||||||||
Average deposits: |
||||||||||||
Noninterest-bearing |
5.03 | % | 4.47 | % | 4.61 | % | ||||||
Interest-bearing: |
||||||||||||
Transaction accounts |
18.01 | 12.11 | 13.29 | |||||||||
Savings |
25.40 | 18.88 | 4.30 | |||||||||
Time deposits of $100,000 or more |
17.25 | 22.58 | 27.85 | |||||||||
Other time deposits |
25.03 | 30.94 | 32.43 | |||||||||
Total average interest-bearing deposits |
85.69 | 84.51 | 77.87 | |||||||||
Total average deposits |
90.72 | 88.98 | 82.48 | |||||||||
Short-term borrowings |
1.55 | 1.61 | 7.27 | |||||||||
Longer-term advances from Federal Home Loan Banks |
7.73 | 9.41 | 10.25 | |||||||||
| 100.00 | % | 100.00 | % | 100.00 | % | |||||||
The overall level of interest rates will also cause fluctuations between categories. The
Company has sought to increase the percentage of its noninterest-bearing deposits to total funding
sources and increase its percentage of lower cost savings and interest-bearing transaction
accounts. Through deposit campaigns, the Company increased its percentage of average savings
accounts to 25.40% of total average funding sources for the year ended December 31, 2010, compared
to 18.88% and 4.30% for the years ended December 31, 2009 and 2008, respectively. Also, average
interest-bearing transaction accounts increased to 18.01% of total average funding sources for the
year ended December 31, 2010, from 12.11% and 13.29% for the years ended December 31, 2009 and
2008, respectively. This shift in deposits was also helped by an extremely low interest rate
environment, in which customers are less willing to roll over maturing certificates of deposit to
longer term instruments at the present low rates.
24
Table of Contents
The increases in lower cost deposits, coupled with maturities of higher rate certificates of
deposit, helped reduce the rates paid on total interest-bearing liabilities. Average rates on
interest bearing liabilities were 1.96%, 2.93%, and 3.58% for the years ended December 31, 2010,
2009 and 2008, respectively. Given the low rate of interest rates for all deposits, customers are
more willing to maintain their accounts in lower-yielding savings accounts, with the expectation
that rates will eventually increase, rather than locking up their funds in lower-yielding time
deposits for any length of time.
The Company was also able to reduce the percentage of longer-term advances and higher cost
certificates of deposit. Average balances for time deposits were 42.28%, 53.52%, and 60.28% for the
years ended December 31, 2010, 2009 and 2008, respectively. Certificates of deposit have a lagging
effect with interest rate changes, as most certificates of deposit have longer maturities at fixed
rates. Depositors are also less likely to lock into the current low interest rates for an extended
period of time with certificates of deposit.
Management has placed increased focus on growing lower-cost core transaction deposits by
concentrating on overall customer deposit relationships, allowing for a reduction in total deposit
pricing and increased customer retention.
25
Table of Contents
The following tables show the condensed average balance sheets for the periods reported
and the percentage of each principal category of assets, liabilities and stockholders’ equity to
total assets. Also shown is the average yield on each category of interest-earning assets and the
average rate paid on each category of interest-bearing liabilities for each of the periods
reported.
| Year Ended December 31, 2010 | ||||||||||||||||
| Average | Percent of | Interest Income/ | Average Yield/ | |||||||||||||
| Balance | Total Assets | Expense | Rate | |||||||||||||
ASSETS |
||||||||||||||||
Loans (1) (2) (3) |
$ | 1,066,142,431 | 74.95 | % | $ | 56,775,455 | 5.33 | % | ||||||||
Investment securities: |
||||||||||||||||
Taxable |
213,684,481 | 15.02 | 6,265,165 | 2.93 | ||||||||||||
Exempt from Federal income taxes (3) |
26,225,961 | 1.84 | 1,546,174 | 5.90 | ||||||||||||
Short-term investments |
24,597,842 | 1.73 | 45,532 | 0.19 | ||||||||||||
Total earning assets |
1,330,650,715 | 93.54 | 64,632,326 | 4.86 | ||||||||||||
Nonearning assets: |
||||||||||||||||
Cash and due from banks |
5,343,320 | 0.38 | ||||||||||||||
Reserve for possible loan losses |
(36,756,476 | ) | (2.58 | ) | ||||||||||||
Premises and equipment |
41,269,332 | 2.90 | ||||||||||||||
Other assets |
79,456,080 | 5.58 | ||||||||||||||
Available-for-sale investment market
valuation |
2,507,029 | 0.18 | ||||||||||||||
Total nonearning assets |
91,819,285 | 6.46 | ||||||||||||||
Total assets |
$ | 1,422,470,000 | 100.00 | % | ||||||||||||
LIABILITIES |
||||||||||||||||
Interest-bearing liabilities: |
||||||||||||||||
Interest-bearing transaction accounts |
$ | 228,869,803 | 16.09 | % | 1,971,283 | 0.86 | % | |||||||||
Savings |
322,853,791 | 22.70 | 3,647,678 | 1.13 | ||||||||||||
Time deposits of $100,000 or more |
219,314,957 | 15.42 | 5,387,309 | 2.46 | ||||||||||||
Other time deposits |
318,088,642 | 22.36 | 8,739,062 | 2.75 | ||||||||||||
Total interest-bearing deposits |
1,089,127,193 | 76.57 | 19,745,332 | 1.81 | ||||||||||||
Long-term borrowings |
98,296,595 | 6.91 | 3,770,894 | 3.84 | ||||||||||||
Short-term borrowings |
19,701,175 | 1.38 | 120,260 | 0.61 | ||||||||||||
Total interest-bearing liabilities |
1,207,124,963 | 84.86 | 23,636,486 | 1.96 | ||||||||||||
Noninterest-bearing deposits |
63,951,012 | 4.50 | ||||||||||||||
Other liabilities |
5,711,362 | 0.40 | ||||||||||||||
Total liabilities |
1,276,787,337 | 89.76 | ||||||||||||||
STOCKHOLDERS’ EQUITY |
145,682,663 | 10.24 | ||||||||||||||
Total liabilities and stockholders’
equity |
$ | 1,422,470,000 | 100.00 | % | ||||||||||||
Net interest income |
$ | 40,995,840 | ||||||||||||||
Net yield on earning assets |
3.08 | % | ||||||||||||||
26
Table of Contents
| Year Ended December 31, 2009 | ||||||||||||||||
| Average | Percent of | Interest Income/ | Average Yield/ | |||||||||||||
| Balance | Total Assets | Expense | Rate | |||||||||||||
ASSETS |
||||||||||||||||
Loans (1) (2) (3) |
$ | 1,213,936,609 | 77.34 | % | $ | 67,651,598 | 5.57 | % | ||||||||
Investment securities: |
||||||||||||||||
Taxable |
223,321,399 | 14.23 | 7,638,510 | 3.42 | ||||||||||||
Exempt from Federal income taxes (3) |
30,794,794 | 1.96 | 1,769,507 | 5.75 | ||||||||||||
Short-term investments |
26,301,252 | 1.68 | 49,305 | 0.19 | ||||||||||||
Total earning assets |
1,494,354,054 | 95.21 | 77,108,920 | 5.16 | ||||||||||||
Nonearning assets: |
||||||||||||||||
Cash and due from banks |
5,235,533 | 0.33 | ||||||||||||||
Reserve for possible loan losses |
(18,699,687 | ) | (1.19 | ) | ||||||||||||
Premises and equipment |
43,287,455 | 2.76 | ||||||||||||||
Other assets |
44,151,042 | 2.81 | ||||||||||||||
Available-for-sale investment market
valuation |
1,219,514 | 0.08 | ||||||||||||||
Total nonearning assets |
75,193,857 | 4.79 | ||||||||||||||
Total assets |
$ | 1,569,547,911 | 100.00 | % | ||||||||||||
LIABILITIES |
||||||||||||||||
Interest-bearing liabilities: |
||||||||||||||||
Interest-bearing transaction accounts |
$ | 168,582,912 | 10.74 | % | 2,084,080 | 1.24 | % | |||||||||
Savings |
262,920,235 | 16.75 | 7,369,936 | 2.80 | ||||||||||||
Time deposits of $100,000 or more |
314,461,095 | 20.04 | 9,707,845 | 3.09 | ||||||||||||
Other time deposits |
430,806,970 | 27.45 | 14,439,151 | 3.35 | ||||||||||||
Total interest-bearing deposits |
1,176,771,212 | 74.98 | 33,601,012 | 2.86 | ||||||||||||
Long-term borrowings |
131,038,979 | 8.35 | 5,047,542 | 3.85 | ||||||||||||
Short-term borrowings |
22,476,551 | 1.43 | 356,258 | 1.59 | ||||||||||||
Total interest-bearing liabilities |
1,330,286,742 | 84.76 | 39,004,812 | 2.93 | ||||||||||||
Noninterest-bearing deposits |
62,196,559 | 3.96 | ||||||||||||||
Other liabilities |
7,272,672 | 0.46 | ||||||||||||||
Total liabilities |
1,399,755,973 | 89.18 | ||||||||||||||
STOCKHOLDERS’ EQUITY |
169,791,938 | 10.82 | ||||||||||||||
Total liabilities and stockholders’
equity |
$ | 1,569,547,911 | 100.00 | % | ||||||||||||
Net interest income |
$ | 38,104,108 | ||||||||||||||
Net yield on earning assets |
2.55 | % | ||||||||||||||
27
Table of Contents
| Year Ended December 31, 2008 | ||||||||||||||||
| Average | Percent of | Interest Income/ | Average Yield/ | |||||||||||||
| Balance | Total Assets | Expense | Rate | |||||||||||||
ASSETS |
||||||||||||||||
Loans (1) (2) (3) |
$ | 1,115,216,426 | 81.63 | % | $ | 70,359,648 | 6.31 | % | ||||||||
Investment securities: |
||||||||||||||||
Taxable |
131,062,979 | 9.59 | 6,159,384 | 4.70 | ||||||||||||
Exempt from Federal income taxes (3) |
37,226,081 | 2.72 | 2,149,879 | 5.78 | ||||||||||||
Short-term investments |
7,334,498 | 0.55 | 188,793 | 2.57 | ||||||||||||
Total earning assets |
1,290,839,984 | 94.49 | 78,857,704 | 6.11 | ||||||||||||
Nonearning assets: |
||||||||||||||||
Cash and due from banks |
14,090,695 | 1.03 | ||||||||||||||
Reserve for possible loan losses |
(11,776,516 | ) | (0.86 | ) | ||||||||||||
Premises and equipment |
44,063,019 | 3.23 | ||||||||||||||
Other assets |
29,508,579 | 2.16 | ||||||||||||||
Available-for-sale investment market
valuation |
(615,955 | ) | (0.05 | ) | ||||||||||||
Total nonearning assets |
75,269,822 | 5.51 | ||||||||||||||
Total assets |
$ | 1,366,109,806 | 100.00 | % | ||||||||||||
LIABILITIES |
||||||||||||||||
Interest-bearing liabilities: |
||||||||||||||||
Interest-bearing transaction accounts |
$ | 162,299,967 | 11.88 | % | 3,787,690 | 2.33 | % | |||||||||
Savings |
52,455,044 | 3.84 | 942,446 | 1.80 | ||||||||||||
Time deposits of $100,000 or more |
339,942,549 | 24.88 | 13,668,035 | 4.02 | ||||||||||||
Other time deposits |
395,841,510 | 28.98 | 16,252,548 | 4.11 | ||||||||||||
Total interest-bearing deposits |
950,539,070 | 69.58 | 34,650,719 | 3.65 | ||||||||||||
Long-term borrowings |
125,117,708 | 9.16 | 4,774,541 | 3.82 | ||||||||||||
Short-term borrowings |
88,748,506 | 6.49 | 2,290,008 | 2.58 | ||||||||||||
Total interest-bearing liabilities |
1,164,405,284 | 85.23 | 41,715,268 | 3.58 | ||||||||||||
Noninterest-bearing deposits |
56,223,479 | 4.12 | ||||||||||||||
Other liabilities |
7,087,530 | 0.52 | ||||||||||||||
Total liabilities |
1,227,716,293 | 89.87 | ||||||||||||||
STOCKHOLDERS’ EQUITY |
138,393,513 | 10.13 | ||||||||||||||
Total liabilities and stockholders’
equity |
$ | 1,366,109,806 | 100.00 | % | ||||||||||||
Net interest income |
$ | 37,142,436 | ||||||||||||||
Net yield on earning assets |
2.88 | % | ||||||||||||||
| (1) | Interest includes loan fees, recorded as discussed in Note 1 to the Company’s consolidated financial statements. | |
| (2) | Average balances include nonaccrual loans. The income on such loans is included in interest, but is recognized only upon receipt. | |
| (3) | Interest yields are presented on a tax-equivalent basis. Nontaxable income has been adjusted upward by the amount of Federal income tax that would have been paid if the income had been taxed at a rate of 34%, adjusted downward by the disallowance of the interest cost to carry nontaxable loans and securities. |
28
Table of Contents
The following table sets forth, on a tax-equivalent basis for the periods indicated, a summary
of the changes in interest income and interest expense resulting from changes in volume and changes
in yield/rates:
| Amount of Increase (Decrease) | ||||||||||||||||||||||||
| Change From 2009 to 2010 Due to | Change From 2008 to 2009 Due to | |||||||||||||||||||||||
| Yield/ | Yield/ | |||||||||||||||||||||||
| Volume (1) | Rate (2) | Total | Volume (1) | Rate (2) | Total | |||||||||||||||||||
Interest income: |
||||||||||||||||||||||||
Loans |
$ | (8,033,127 | ) | $ | (2,843,016 | ) | $ | (10,876,143 | ) | $ | 5,934,729 | $ | (8,642,779 | ) | $ | (2,708,050 | ) | |||||||
Investment securities: |
||||||||||||||||||||||||
Taxable |
(317,890 | ) | (1,055,455 | ) | (1,373,345 | ) | 3,485,743 | (2,006,617 | ) | 1,479,126 | ||||||||||||||
Exempt from Federal
income taxes |
(268,506 | ) | 45,173 | (223,333 | ) | (369,278 | ) | (11,094 | ) | (380,372 | ) | |||||||||||||
Short-term investments |
(3,773 | ) | — | (3,773 | ) | 154,357 | (293,845 | ) | (139,488 | ) | ||||||||||||||
Total interest income |
(8,623,296 | ) | (3,853,298 | ) | (12,476,594 | ) | 9,205,551 | (10,954,335 | ) | (1,748,784 | ) | |||||||||||||
Interest expense: |
||||||||||||||||||||||||
Interest bearing transaction
accounts |
629,224 | (742,021 | ) | (112,797 | ) | 140,207 | (1,843,817 | ) | (1,703,610 | ) | ||||||||||||||
Savings accounts |
1,398,963 | (5,121,221 | ) | (3,722,258 | ) | 5,645,760 | 781,730 | 6,427,490 | ||||||||||||||||
Time deposits of $100,000 or
more |
(2,581,210 | ) | (1,739,326 | ) | (4,320,536 | ) | (969,138 | ) | (2,991,052 | ) | (3,960,190 | ) | ||||||||||||
Other time deposits |
(3,383,779 | ) | (2,316,310 | ) | (5,700,089 | ) | 1,358,823 | (3,172,220 | ) | (1,813,397 | ) | |||||||||||||
Total deposits |
(3,936,802 | ) | (9,918,878 | ) | (13,855,680 | ) | 6,175,652 | (7,225,359 | ) | (1,049,707 | ) | |||||||||||||
Short-term borrowings |
(39,388 | ) | (196,610 | ) | (235,998 | ) | (1,277,362 | ) | (656,388 | ) | (1,933,750 | ) | ||||||||||||
Long -term borrowings |
(1,263,514 | ) | (13,134 | ) | (1,276,648 | ) | 234,146 | 38,855 | 273,001 | |||||||||||||||
Total interest expense |
(5,239,704 | ) | (10,128,622 | ) | (15,368,326 | ) | 5,132,436 | (7,842,892 | ) | (2,710,456 | ) | |||||||||||||
Net interest income |
$ | (3,383,592 | ) | $ | 6,275,324 | $ | 2,891,732 | $ | 4,073,115 | $ | (3,111,443 | ) | $ | 961,672 | ||||||||||
| (1) | Change in volume multiplied by yield/rate of prior year. | |
| (2) | Change in yield/rate multiplied by volume of prior year. |
| NOTE: | The change in interest due to both rate and volume has been allocated to volume and rate changes in proportion to the relationship of the absolute dollar amounts of the change in each. |
Provision for Possible Loan Losses
The provision for possible loan losses charged to earnings for the years ended December 31,
2010, 2009, and 2008 totaled $41,491,947, $53,450,000, and $11,148,000, respectively. During this
same time period, the Company incurred net charge-offs of $36,412,441 in 2010, $35,534,253 in 2009,
and $6,527,189 in 2008. At December 31, 2010, 2009, and 2008, the reserve for possible loan losses
as a percentage of net outstanding loans was 3.84, 2.83%, and 1.14%, respectively. The reserve for
possible loan losses as a percentage of nonperforming loans (comprised of loans for which the
accrual of interest has been discontinued and loans still accruing interest that were 90 days
delinquent) was 21.80%, 44.70%, and 41.00% at December 31, 2010, 2009, and 2008, respectively. The
continued significant decline of the real estate market has resulted in an increase in the level of
non-performing loans and a required higher provision for loan losses during 2010. Even though problem loans have increased in 2010, the majority of the increase has been loans originated outside the Florida market and loss exposure outside of Florida has been much less severe for Reliance. See further
discussion regarding the Company’s credit risk management in the section below entitled “Risk
Management.”
Noninterest Income
Total noninterest income for the year ended December 31, 2010 excluding security sale gains
and losses, increased $640,602 (24.84%) to $3,219,119 from the $2,578,517 earned for the year ended
December 31, 2009, which had increased $217,095 (9.19%) over the $2,361,422 earned for the year
ended December 31, 2008. The Company recognized a gain during 2010 of $244,369 on the sale of
approximately $4.0 million of loans guaranteed by the Small Business Administration. Other real
estate income increased $368,964 (172.44%) to $582,934 from the $213,970 earned for the year ended
December 31, 2009, as the increased level of properties owned provided more rental income
opportunities.
29
Table of Contents
The Company recorded net security sale gains of $287,509 in 2010, compared with net
security sale gains of $1,346,565 and $321,113 in 2009 and 2008, respectively. From time to time,
the Company will sell certain of its available-for-sale investment securities for short-term
liquidity purposes or longer-term asset/liability management reasons. See further discussion below
in the section entitled “Liquidity and Rate Sensitivity Management.”
Noninterest Expense
Noninterest expense increased $5,694,345 (16.73%) for the year ended December 31, 2010 to
$39,740,734 from the $34,046,389 incurred for the year ended December 31, 2009, which was a
$4,618,799 (15.70%) increase over the $29,427,590 of noninterest expenses incurred for the year
ended December 31, 2008. Savings achieved by the Company’s cost reduction efforts were more than
offset by the increase in costs of other real estate owned and insurance assessments from the FDIC.
Total personnel costs decreased $265,808 (1.92%) in 2010 to $13,601,820 from the $13,867,628
of personnel costs incurred in 2009, which was a decrease of $2,047,462 (12.86%) from the
$15,915,090 of personnel costs incurred in 2008. During 2009, the Company implemented a plan to
reduce operating costs, which included a reduction in staffing levels, and a reduction in certain
benefits.
Other real estate expense increased significantly in 2010 to $13,147,525, which was an
increase of $6,984,212 (113.32%) over the $6,163,313 of other real estate expenses incurred in
2009, which had increased by $4,580,715 (289.44%) from the $1,582,598 incurred in 2008.
Approximately $3.4 million of the 2010 expense amount relates to the transfer of four parcels of
land from land and construction in process to other real estate owned, with the balance written
down to their appraised values. The parcels were originally purchased for future expansion;
however, the Company determined that it would not be constructing branches on those sites in the
foreseeable future. Total other real estate owned net losses and write-downs for 2010 were
$10,902,221, as the continued decline in the real estate markets has necessitated such write-downs.
Total occupancy and equipment expenses decreased $41,531 (0.98%) to $4,215,238 in 2010 from
the $4,256,769 incurred in 2009, which had decreased $246,356 (5.47%) from the $4,503,125 incurred
in 2008. Certain assets became fully depreciated and a temporary facility was closed in 2009, which
reduced the Company’s depreciation expense charged to this category.
The Company’s FDIC assessment has increased significantly during the three year period ended
December 31, 2010. This assessment increased $114,217 (4.16%) in 2010 to $2,859,649, from the
$2,745,432 paid in 2009, which was an increase of $1,833,339 (201.00%) from the $912,093 paid in
2008. During 2009, the FDIC imposed a special assessment, which was levied on all banks, varying
based on size, to replenish the FDIC’s insurance fund.
Total data processing expenses for 2010 decreased $287,802 (14.76%) to $1,662,425, from the
$1,950,227 incurred in 2009, which had increased $69,259 (3.68%) from the $1,880,968 incurred in
2008. The decrease from 2009 to 2010 was due to cost reduction efforts.
Income Taxes
Applicable income tax expenses (benefits) totaled $11,311,673 for the year ended December 31,
2010, compared with $(16,629,562) and $(1,079,886) for the years ended December 31, 2009 and 2008,
respectively. The Company is required to provide a valuation reserve on deferred tax assets when it
is more likely than not that some portion of the assets will not be realized. The Company had not
established a valuation reserve at December 31, 2009 or 2008 due to management’s belief and
analysis that future income levels would be sufficient to realize the net deferred tax assets
recorded. In 2010, the Company received a total of $1,951,677 for the carryback of net operating
losses for tax reporting purposes of prior years. At December 31, 2010, the Company has
established deferred tax assets of $13,609,596 for net operating loss carryforwards for tax
reporting purposes totaling $38,561,563 which will expire beginning in 2029, if unused. The
Company has also established deferred tax assets for operating loss carry forwards for Florida
state income tax reporting purposes totaling $1,084,856 for losses incurred by Reliance Bank,
F.S.B. Such operating losses totaled $19,724,646 at December 31, 2010, and will begin to expire,
if unused by 2023.
30
Table of Contents
Given the Company’s losses that have occurred through 2010, the Company has established a
valuation reserve of $26,076,828 for its deferred tax assets.
Financial Condition
Total assets of the Company declined $240,682,320 (15.66%) to $1,296,025,264 at December 31,
2010, from $1,536,707,584 at December 31, 2009, which had decreased $37,281,634 (2.37%) in 2007
from $1,573,989,218 at December 31, 2008. The depressed economy has reduced the Company’s
opportunities for loan growth in its current markets.
Total deposits of the Company declined $185,900,981 (14.68%) to $1,080,159,216 at December 31,
2010, from $1,266,060,197 at December 31, 2009, which had increased $38,012,898 (3.10%) from
$1,228,047,299 at December 31, 2008. The overall decline is consistent with the decline in total
assets as less funding is required. However, the Company has achieved increased average growth in
interest-bearing transaction and savings accounts with a corresponding reduction in certificates of
deposit. See the “Results of Operations” section of the report for additional discussion of
changes in deposit composition.
Total short-term borrowings of the Company grew $2,480,923 (19.54%) to $15,177,855 at December
31, 2010, from $12,696,932 at December 31, 2009, which had decreased $51,221,912 (80.14%) from
$63,918,844 at December 31, 2008. Short-term borrowings will fluctuate significantly based on
short-term liquidity needs and certain seasonal deposit trends. Total long-term advances from the
Federal Home Loan Bank declined $11,000,000 (10.58%) to $93,000,000 at December 31, 2010, from
$104,000,000 at December 31, 2009, which had decreased $32,000,000 (23.53%) from $136,000,000 at
December 31, 2008. These longer-term fixed rate advances are used as an alternative funding source
and are matched up with longer-term fixed rate assets.
Total loans declined $170,042,509 (14.91%) to $970,261,366 at December 31, 2010, from
$1,140,303,875 at December 31, 2009, which had decreased $113,411,565 (9.05%) from the
$1,253,715,440 of total loans at December 31, 2008. The depressed economy and a reduced focus on
commercial real estate has reduced the Company’s opportunities for loan growth in its current
markets.
Investment securities, all of which are maintained as available-for-sale, decreased
$42,520,095 (14.97%) to $241,599,461 at December 31, 2010, from the $284,119,556 at December 31,
2009, which had increased $90,231,064 (46.54%) from the $193,888,492 of investment securities
maintained at December 31, 2008. The Company’s investment portfolio growth is dependent upon the
level of deposit growth and the funding requirements of the Company’s loan portfolio, as described
above.
Total stockholders equity at December 31, 2010, 2009, and 2008 was $104,246,650, $149,669,424,
and $139,608,880, respectively, with capital-to-asset percentages of 8.04%, 9.74%, and 8.87%,
respectively.
Risk Management
Management’s objective in structuring the balance sheet is to maximize the return on average
assets while minimizing the associated risks. The major risks concerning the Company are credit,
liquidity and interest rate risks. The following is a discussion concerning the Company’s
management of these risks.
Credit Risk Management
Managing risks that the Company’s banking subsidiaries assume in providing credit products to
customers is extremely important. Credit risk management includes defining an acceptable level of
risk and return, establishing appropriate policies and procedures to govern the credit process and
maintaining a thorough portfolio review process.
31
Table of Contents
Of equal importance in the credit risk management process are the ongoing monitoring
procedures performed as part of the Company’s loan review process. Credit policies are examined and
procedures reviewed for compliance each year. Loan personnel also continually monitor loans after
disbursement in an attempt to recognize any deterioration which may occur so that appropriate
corrective action can be initiated on a timely basis.
Net charge-offs for 2010 were $36,412,441 compared to $35,534,253 in 2009, and $6,527,189 in
2008. The increased charge-off levels result from the increased levels of nonperforming loans and
the decline in the overall valuation of real estate securing such loans. The Company’s banking
subsidiaries had no loans to any foreign countries at December 31, 2010 and 2009, nor did they have
any concentration of loans to any industry on these dates, although a significant portion of the
Company’s loan portfolio is secured by real estate in the St. Louis metropolitan and southwestern
Florida areas, particularly commercial and construction and land development real estate loans.
The Company has refrained from financing speculative transactions such as highly leveraged
corporate buyouts, or thinly-capitalized speculative start-up companies.
A summary of loans by type at December 31, 2010, 2009, 2008, 2007 and 2006 is as follows:
| December 31, | ||||||||||||||||||||
| 2010 | 2009 | 2008 | 2007 | 2006 | ||||||||||||||||
Commercial: |
||||||||||||||||||||
Real estate |
$ | 716,773,796 | $ | 797,054,385 | $ | 843,312,225 | $ | 514,752,151 | $ | 394,469,137 | ||||||||||
Other |
80,973,537 | 82,732,850 | 94,606,918 | 61,519,983 | 53,152,775 | |||||||||||||||
Real estate: |
||||||||||||||||||||
Construction |
100,456,596 | 172,731,598 | 190,381,178 | 184,167,532 | 108,408,270 | |||||||||||||||
Residential |
69,143,298 | 84,080,509 | 120,903,014 | 146,488,402 | 105,094,409 | |||||||||||||||
Consumer |
2,914,139 | 3,704,533 | 4,512,105 | 4,820,918 | 6,577,048 | |||||||||||||||
| $ | 970,261,366 | $ | 1,140,303,875 | $ | 1,253,715,440 | $ | 911,748,986 | $ | 667,701,639 | |||||||||||
Commercial loans are made based on the borrower’s character, experience, general credit
strength, and ability to generate cash flows for repayment from income sources, even though such
loans may also be secured by real estate or other assets. The credit risk related to commercial
loans is largely influenced by general economic conditions and the resulting impact on a borrower’s
operations.
Real estate loans, including commercial real estate, residential real estate, and construction
loans, are also based on the borrower’s character, but more emphasis is placed on the estimated
collateral values. Commercial real estate loans are mainly for owner-occupied business and
industrial properties, multifamily properties, and other commercial properties for which income
from the property is the primary source of repayment. Credit risk of these loan types is managed in
a similar manner to commercial loans and real estate construction loans by employing sound
underwriting guidelines. These loans are underwritten based on the cash flow coverage of the
property, typically meet the Company’s loan-to-value guidelines, and generally require either the
limited or full guarantee of principal sponsors of the credit.
Real estate construction loans, relating to residential and commercial properties, represent
financing secured by real estate under construction for eventual sale. The Company requires third
party disbursement on the majority of loans in its builder portfolio and the Company reviews
projects regularly for progress status.
Residential real estate loans are predominantly made to finance single-family, owner-occupied
properties in the St. Louis metropolitan area and southwestern Florida. Loan-to-value percentage
requirements for collateral are based on the lower of the purchase price or appraisal and are
normally limited to 80% at loan origination, unless credit enhancements are added. Appraisals are
required on all owner-occupied residential real estate loans and private mortgage insurance is
required if the loan to value percentage exceeds 85% at loan origination. These loans generally
have a short duration of three years or less, with some loans repricing more frequently. Long-term,
fixed rate mortgages are generally not retained in the Banks’ loan portfolios, but rather are sold
into the secondary market. The Banks have not financed, and do not currently finance, sub-prime
mortgage credits.
Consumer and other loans represent loans to individuals on both a secured and unsecured
nature. Credit risk is controlled by thoroughly reviewing the credit worthiness of the borrowers
on a case-by-case basis.
32
Table of Contents
The continued significant decline of the real estate market in the St. Louis metropolitan and
southwestern Florida areas has caused an increase in the Company’s non-performing assets.
Following is a summary of information regarding the Bank’s nonperforming loans as of and for each
of the years in the five-year period ended December 31, 2010:
| 2010 | 2009 | 2008 | 2007 | 2006 | ||||||||||||||||
Nonperforming loans: |
||||||||||||||||||||
Nonaccrual loans |
$ | 151,390,860 | $ | 57,227,968 | $ | 33,716,050 | $ | 15,810,222 | $ | 5,082,784 | ||||||||||
Loans 90 days delinquent and still accruing
interest |
— | 3,560,644 | 1,180,360 | 1,937,388 | 65,000 | |||||||||||||||
Restructured loans |
19,698,143 | 11,288,822 | — | — | — | |||||||||||||||
Total nonperforming loans |
$ | 171,089,003 | $ | 72,077,434 | $ | 34,896,410 | $ | 17,747,610 | $ | 5,147,784 | ||||||||||
Additional interest that would have been earned on
nonaccrual loans |
$ | 10,159,025 | $ | 4,425,441 | $ | 1,716,845 | $ | 928,759 | $ | 77,687 | ||||||||||
Non-performing loans are defined as loans on non-accrual status, loans 90 days or more
past due but still accruing, and restructured loans. Loans are placed on non-accrual status when
contractually past due 90 days or more as to interest or principal payments, unless the loans are
well secured and in process of collection. Additionally, whenever management becomes aware of facts
or circumstances that may adversely impact the collectability of principal or interest on loans, it
is management’s practice to place such loans on non-accrual status immediately, rather than
delaying such action until the loans become 90 days past due. Previously accrued and uncollected
interest on such loans is reversed and income is recorded only to the extent that interest payments
are subsequently received in cash and a determination has been made that the principal balance of
the loan is collectible. If collectability of the principal is in doubt, payments received are
applied to loan principal for financial reporting purposes.
Loans past due 90 days or more but still accruing interest are also included in non-performing
loans. Loans past due 90 days or more but still accruing interest are classified as such when the
underlying loans are both well secured (the collateral value is sufficient to cover principal and
accrued interest) and are in the process of collection. Also included in non-performing loans are
“restructured” loans. Restructured loans involve the granting of some concession to the borrower
involving the modification of terms of the loan, such as changes in payment schedule or interest
rate, because of the borrower’s stressed financial condition.
The increase in nonperforming loans is due to the continued weakness in the economy,
particularly regarding commercial and construction real estate in the Banks’ markets. The
Company has taken a more thorough and thoughtful approach toward collection and resolution of such problem
credits. Such loans are continually reviewed for impairment as the underlying real estate values
have declined, resulting in additional loan charge-offs. Once foreclosure occurs, additional
declines in the value of the properties results in other real estate owned write-downs. The Company
believes the reserve for loan losses calculation at December 31, 2010 adequately considers the fair
value of the underlying collateral on its problem loan portfolio; however, the values of these
properties have continued to deteriorate, requiring the additional provision for loan losses.
Additional provisions and other real estate write-downs may be required in subsequent periods if
the values of such properties continue to decline.
33
Table of Contents
Of the Company’s $970 million loans outstanding at December 31, 2010, 5% were originated in
Florida and 95% outside of Florida. The following table breaks down net charge-offs,
non-performing loans and non-performing assets between loans originated in Florida and all other
loans:
| Originated In | ||||||||||||
| Florida | All other | Total | ||||||||||
Net charge-offs (year to date 12/31/2010) |
15.8 million | 20.6 million | 36.4 million | |||||||||
Net charge-offs (year to date 12/31/2009) |
23.0 million | 12.5 million | 35.5 million | |||||||||
Non-performing loans (12/31/2010) |
26.3 million | 144.8 million | 171.1 million | |||||||||
Non-performing loans (12/31/2009) |
25.4 million | 46.7 million | 72.1 million | |||||||||
Non-performing assets* (12/31/2010) |
41.6 million | 160.5 million | 202.1 million | |||||||||
Non-performing assets* (12/31/2009) |
44.5 million | 56.7 million | 101.2 million | |||||||||
Outstanding loans originated in
respective markets (12/31/2010) |
51.1 million | 919.2 million | 970.3 million | |||||||||
| * | Non-performing assets are comprised of non-performing loans, other real estate owned, and investment securities on nonaccrual. |
The continued significant decline of the real estate markets in the St. Louis metropolitan and
southwestern Florida areas has caused a significant increase in the Company’s non-performing loans
in 2008, 2009 and 2010. At December 31, 2010, non-performing loans had increased $99,011,569 to
$171,089,003, from $72,077,434 at December 31, 2009, which had increased $37,181,024 from
$34,896,410 at December 31, 2008. The largest components of non-performing loans at December 31,
2010 were primarily comprised of the following loan relationships (which comprises approximately 90% of total non-performing loans):
| • | A loan for approximately $10.9 million, secured by an individual warehouse in St. Louis, Missouri. The loan is currently in forbearance as the borrower restructures its business operations. The warehouse is experiencing high vacancy. |
| • | A $16.3 million loan to a commercial real estate developer in Houston, Texas. The loan is secured by three office buildings and developed commercial land. The borrower and the Company agreed to loan renewal terms in December 2010 that brought the loan current, past due real estate taxes current, and established a reserve account. The borrower continues to negotiate the sale of a tract of ground that is collateral to a national home builder. |
| • | A loan for approximately $3.4 million to a non-profit organization for the purchase of 482 acres and a 7,000 square foot residence in St. Louis, Missouri. The property is well located in a natural setting that abuts a river. The nonprofit organization has experienced financial setbacks, most notably a decline in contributions. |
| • | A loan for approximately $4.5 million to a commercial real estate developer for the development of a shopping center. The center has a long-term lease in place with a grocery store. The owner is actively marketing the center to lease the vacant space. |
| • | Loans totaling approximately $3.2 million to build out a day spa in Missouri. The borrower is in default. The Company is seeking repayment in full through foreclosure and pursuit of guarantors. |
| • | A loan for approximately $2.8 million to finance the purchase of a retail center in O’Fallon, Missouri. The center is currently experiencing high vacancy in an overdeveloped area. The borrower continues to make monthly interest payments. Additional capital calls from investors have been slow to complete. The loan is in default and the Company has engaged counsel to collect the loan. | |
| • | A loan for approximately $5.7 million to a commercial real estate developer for the construction of medical office buildings in Arizona. The loan is secured by 10 acres. The borrower has agreed to a settlement agreement that has allowed the Company to complete foreclosure of the collateral in late January 2011. |
34
Table of Contents
| • | A loan for approximately $2.2 million for a 64,000 sq. ft. industrial warehouse used as a sports complex. The owner operates indoor soccer and inline hockey throughout the year. The borrower continues to perform and the Company is encouraging the borrower to seek alternate financing. | |
| • | A loan of approximately $11.7 million on a 61,000 sq. ft. medical office building that is located in St. Louis County, Missouri. A new professional management company has been put in place to take over day-to-day operations. The Company is seeking collection through foreclosure. The process to complete foreclosure has been stalled by a lawsuit. The Company’s counsel is seeking to have the lawsuit dismissed. | |
| • | A loan for approximately $7.8 million to refinance and provide additional capital to complete phase II of a land development in St. Charles, Missouri. The development has slowed significantly and experienced difficult times due to the continuing slow economy. | |
| • | A loan for approximately $1.9 million for the development of eight condominium buildings in St. Louis County, Missouri. Since originated, one building is under construction. The development of the land is fully completed. The borrower has experienced difficulties. The Company is seeking repayment in full through foreclosure and pursuit of guarantors. | |
| • | A loan for approximately $1.2 million for the purchase of two single tenant warehouse properties in Minnesota. The tenant previously occupied both buildings and has now consolidated operations in one building. The second building has been sold and net proceeds paid down the debt. The Company and the borrower are moving forward to restructure the debt with a goal to have this completed in early 2011. | |
| • | A loan for approximately $2.6 million to refinance a commercial building in St. Louis County, Missouri. The building was formerly occupied by a national chain which has since vacated. The borrower and the Company have entered into a forbearance agreement that allows the borrower a short time frame to liquidate the collateral. | |
| • | A loan for approximately $7.0 million to refinance a commercial office property located in Phoenix, Arizona. The building has experienced vacancies. The borrower is developing a plan to increase occupancy and bring the loan current. | |
| • | A loan totaling approximately $1.8 million to entities controlled by a group of Missouri real estate investors for the purchase and development of a parcel of land in St. Charles, Missouri. The majority of the proposed entitlements and development have been completed. The Company reached an agreement with the borrower to move the project forward with a new home builder. | |
| • | A loan for approximately $7.5 million for the purchase of four commercial buildings located in St. Louis County and Jefferson County, MO. The buildings have experienced high vacancy. The loan continues to perform on an interest only basis. The Company is seeking the borrower’s cooperation to restructure the debt. | |
| • | A loan for approximately $1.1 million to refinance a commercial office building in St. Louis County, MO. The borrower has experienced high vacancy that has affected the cash flow of the building. The Company is seeking collection through foreclosure and pursuit of guarantors. | |
| • | A loan for approximately $3.5 million to refinance a commercial retail building located in St. Louis County, MO. The largest tenant has recently vacated and the building also has other vacancies. The Company is seeking repayment in full through foreclosure and pursuit of guarantors. | |
| • | A loan for approximately $5.8 million to purchase a commercial office/warehouse building in St. Louis County, MO. The Company has identified a potential purchaser of the building. Due to outstanding judgments against the borrower, the Company will initiate foreclosure of the collateral. |
35
Table of Contents
| • | A loan for approximately $13.0 million to refinance a commercial retail center in St. Louis County, MO. The building has experienced increased vacancies and therefore insufficient cash flow to service debt. The Company is seeking repayment in full through foreclosure and pursuit of the guarantors. | |
| • | Loans totaling approximately $14.5 million to finance the equipment, operations and real estate for a joint venture industrial and manufacturing company with its main operations in Texas. The operations have suffered from the economy and the parent company’s bankruptcy. The Company is seeking repayment in full through foreclosure and pursuit of the guarantor. | |
| • | Loans totaling approximately $3.2 million for the construction and operation of a full service car wash in Napa County, California. The plan suffered delays, cost overruns and lower than expected revenues. The borrower is working to increase revenues and bring the loan current. | |
| • | A loan for approximately $4.0 million to finance the purchase a private airplane. The lease between the borrower and a third party has been terminated. Additionally, airplane values have experienced significant declines. The borrower is developing a plan to submit to the Company to repay the loan in full. | |
| • | A loan for approximately $2.0 million to finance the purchase of a retail strip center. The center has suffered from vacancy issues and their largest tenant has vacated the premises. The Company has moved towards foreclosure of the asset. | |
| • | A loan for approximately $1.3 million to an individual, secured by the individual’s primary residence in Florida that is in default. The borrower entered into a forbearance agreement, but has now defaulted under that negotiated plan. Foreclosure proceedings have again been initiated. | |
| • | A loan for approximately $2.3 million to a group of Florida investors secured by unimproved property in Florida. After multiple quarters of performance by some of the guarantors, payments have stopped and the parties have engaged legal counsel. The Company has initiated foreclosure. The borrower is in contract with a local government agency to purchase collateral. | |
| • | A loan for approximately $1.0 million to a group of investors secured by an improved commercial lot. The borrower and the Company were unable to reach agreement on further development of the site. Negotiations continue with a possible deed-in-lieu of foreclosure with new notes from the borrower for any deficiencies. | |
| • | A loan for approximately $7.9 million to a group of investors secured by a retail strip center. The borrower and the Company continue to negotiate terms to maintain the property in name of the borrower | |
| • | A loan for approximately $2.0 million to a group of investors secured by a piece of unimproved commercial real estate. The primary guarantor strength has been compromised, resulting in severe cash flow deficiencies. Legal action has been initiated against the borrower and all of the guarantors. | |
| • | A loan for approximately $2.0 million for ground development of a proposed commercial retail strip center and self-storage facility in southwestern Florida. The entity was established by an experienced real estate developer; however, with the deterioration of the real estate market, the project did not begin construction, and the real estate downturn has affected the cash flow of the guarantor. The Company is working with the borrower on a strategy for repayment, resolution of the project, or obtaining a signed deed for the property in lieu of foreclosure. |
36
Table of Contents
The Company also has non-performing assets in the form of other real estate owned. The Banks
maintained other real estate owned totaling $30,850,543 and $29,085,943 at December 31, 2010 and
2009, respectively. Other real estate owned represents property acquired through foreclosure, or
deeded to the Banks in lieu of foreclosure for loans on which borrowers have defaulted as to
payment of principal and interest. The following table details the activity within other real
estate owned for the year ended December 31, 2010:
Balance at December 31, 2009 |
$ | 29,085,943 | ||
Foreclosures |
15,855,798 | |||
Transfers from premises and equipment |
4,447,859 | |||
Loans made to facilitate sales of other real estate |
(1,703,249 | ) | ||
Cash proceeds from sales |
(5,933,587 | ) | ||
Losses and write-downs |
(10,902,221 | ) | ||
Balance at December 31, 2010 |
$ | 30,850,543 | ||
During this period of a declining real estate market, the Company has sought to add loans
to its portfolio with increased collateral margins or excess payment capacity from proven borrowers
to enhance the quality of the loan portfolio, and has often had to offer a competitively lower
interest rate on such loans. Given the collateral values maintained on its loan portfolio,
including the non-performing loans discussed above, the Company believes the reserve for possible
loan losses is adequate to absorb losses in the portfolio existing at December 31, 2010; however,
should the real estate market continue to decline, the Company may require additional provisions to
the reserve for possible loan losses to address the declining collateral.
Potential Problem Loans
As of December 31, 2010, the Company had 38 loans with a total principal balance of
$32,296,693 that were identified by management as having possible credit problems that raise doubts
as to the ability of the borrower to comply with the current repayment terms, which are not
included in nonperforming loans. These loans were continuing to accrue interest and were less than
90 days past due on any scheduled payments. However, various concerns, including, but not limited
to, payment history, loan agreement compliance, adequacy of collateral coverage, and borrowers’
overall financial condition caused management to believe that these loans may result in
reclassification at some future time as nonaccrual, past due or restructured. Such loans are not
necessarily indicative of future nonperforming loans, as the Company continues to work on resolving
issues with both nonperforming and potential problem credits on its watch list.
Policies and Procedures
The Company’s credit management policies and procedures focus on identifying, measuring, and
controlling credit exposure. These procedures employ a lender-initiated system of rating credits,
which is ratified in the loan approval process and subsequently tested in internal loan review and
regulatory bank examinations. The system requires rating all loans at the time they are made, at
each renewal date and as conditions warrant.
Adversely rated credits, including loans requiring close monitoring, are included on a monthly
loan watch list. Other loans are added whenever any adverse circumstances are detected, which might
affect the borrower’s ability to meet the terms of the loan. This could be initiated by any of the
following:
| • | Delinquency of a scheduled loan payment; | |
| • | Deterioration in the borrower’s financial condition identified in a review of periodic financial statements; | |
| • | Decrease in the value of collateral securing the loan; or | |
| • | Change in the economic environment in which the borrower operates. |
Loans on the watch list require periodic detailed loan status reports, including recommended
corrective actions, prepared by the responsible loan officer, which are discussed at each monthly
loan committee meeting.
37
Table of Contents
Downgrades of loan risk ratings may be initiated by the responsible loan officer, internal
loan review, the watch list committee, the loan committee, or senior lending personnel at any time.
Upgrades of certain risk ratings may only be made with the concurrence of a majority of the members
of the loan committee.
The Company’s loan underwriting policies limit individual loan officers to specific amounts of
lending authority, over which various committees must get involved and approve a credit. The
Company’s underwriting policies require an analysis of a borrower’s ability to pay the loan and
interest on a timely basis in accordance with the loan agreement. Collateral is then considered as
a secondary source of payment, should the borrower not be able to pay.
The Company conducts weekly loan committee meetings of all of its loan officers, including the
Chief Executive Officer, Chief Risk Officer, Chief Lending Officer, Chief Credit Officer, and the
Chief Executive Officer of Reliance Bank FSB. This committee may approve individual credit
relationships up to $2,500,000. Larger credits must go to the loan committee of the Board of
Directors, which is comprised of three directors on a rotating basis. The Company’s legal lending
limit was $31,597,816 at December 31, 2010.
Reserve for Loan Losses
At December 31, 2010, 2009, 2008, 2007, and 2006, the reserve for possible loan losses was
$37,301,075, $32,221,569, $14,305,822, $9,685,011, and $7,101,031, respectively, or 3.84%, 2.83%,
1.14%, 1.06%, and 1.06% of net outstanding loans, respectively. The following table summarizes the
Company’s loan loss experience for each of the years in the five-year period ended December 31,
2010.
| December 31, | ||||||||||||||||||||
| (in thousands of dollars) | 2010 | 2009 | 2008 | 2007 | 2006 | |||||||||||||||
Average loans outstanding |
$ | 1,066,142 | $ | 1,213,937 | $ | 1,115,216 | $ | 770,523 | $ | 546,122 | ||||||||||
Reserve at beginning
of year |
$ | 32,222 | $ | 14,306 | $ | 9,685 | $ | 7,101 | $ | 5,213 | ||||||||||
Provision for possible
loan losses |
41,492 | 53,450 | 11,148 | 3,187 | 2,200 | |||||||||||||||
| 73,714 | 67,756 | 20,833 | 10,288 | 7,413 | ||||||||||||||||
Charge-offs: |
||||||||||||||||||||
Commercial loans: |
||||||||||||||||||||
Real estate |
(14,962 | ) | (18,532 | ) | (2,828 | ) | (317 | ) | — | |||||||||||
Other |
(221 | ) | (656 | ) | (77 | ) | (25 | ) | (62 | ) | ||||||||||
Real estate: |
||||||||||||||||||||
Construction |
(19,878 | ) | (16,042 | ) | (2,262 | ) | — | (3 | ) | |||||||||||
Residential |
(1,910 | ) | (1,832 | ) | (1,313 | ) | (279 | ) | (220 | ) | ||||||||||
Consumer |
(40 | ) | (52 | ) | (73 | ) | (30 | ) | (48 | ) | ||||||||||
Total charge-offs |
(37,011 | ) | (37,114 | ) | (6,553 | ) | (651 | ) | (333 | ) | ||||||||||
Recoveries: |
||||||||||||||||||||
Commercial loans: |
||||||||||||||||||||
Real estate |
462 | 1,033 | 1 | 10 | — | |||||||||||||||
Other |
63 | 4 | 9 | 20 | 2 | |||||||||||||||
Real estate: |
||||||||||||||||||||
Construction |
22 | 371 | 1 | — | — | |||||||||||||||
Residential |
30 | 150 | — | 13 | 8 | |||||||||||||||
Consumer |
21 | 22 | 15 | 5 | 11 | |||||||||||||||
Total recoveries |
598 | 1,580 | 26 | 48 | 21 | |||||||||||||||
Reserve at end of year |
$ | 37,301 | $ | 32,222 | $ | 14,306 | $ | 9,685 | $ | 7,101 | ||||||||||
Net charge-offs to
average loans |
3.42 | % | 2.93 | % | 0.59 | % | 0.08 | % | 0.06 | % | ||||||||||
Ending reserve to net
loans at end of year |
3.84 | % | 2.83 | % | 1.14 | % | 1.06 | % | 1.06 | % | ||||||||||
38
Table of Contents
Loans charged off are subject to continuous review, and specific efforts are taken to achieve
maximum recovery of principal, accrued interest, and related expenses.
Since its inception in 1999, the Company has experienced significant loan growth in the St.
Louis metropolitan area, and in southwestern Florida, with expansion to that area by the Company in
2005. The southwestern Florida area began experiencing economic distress ahead of most of the
country, with the long-booming real estate market in Florida beginning its decline in 2007. As a
result, the Company began experiencing an increase in troubled asset situations in 2007 and began
increasing its reserve for loan losses accordingly, as the Florida real estate market weakened. In
2010, after two and one-half years of a free-fall decline in Florida real estate values, Company
management believes that the Florida real estate market has begun to stabilize at the low valuation
levels to which it has dropped during this economic recession. While the Florida real estate market
has begun to stabilize, the real estate markets in the St. Louis metropolitan area (as well as the
Houston, Texas and Phoenix, Arizona markets in which the Company has established loan production
offices) continue to experience increased stress. Throughout this time period, the Company has
attempted to address this dichotomy of markets with the tables presented in its filings that
portray the degree to which these geographic areas have been the source of problems.
While considering the level of nonperforming assets when assessing the appropriate level of
the reserve for loan losses at a particular point in time, the Company does not use a pre-assigned
coverage ratio of nonperforming assets. Since a significant percentage of the Company’s loan
portfolio is concentrated in commercial and construction real estate, the most significant factor
when determining an appropriate level for the reserve for loan losses is a detailed analysis of the
individual credit relationships and their potential for loss after considering the value of the
underlying real estate collateral. During the past three years (first in Florida and then migrating
to the Company’s other markets in St. Louis, Houston and Phoenix), the Company has experienced
continued declines in collateral values (e.g., one credit relationship had collateral with a
current appraised value of $2,000,000 at the end of 2008 and a current appraised value of
$1,000,000 at the end of 2009 for the same property). Company management has assessed that this
additional uncertainty has warranted caution in assessing an appropriate level for the reserve for
loan losses, and that somewhat greater conservatism is warranted at this time to ensure that the
provisions reflect the level of losses inherent within the portfolio at a particular point in time.
The Company risk rates all of the loans in its loan portfolio, using a 1-7 risk rating system,
with a “1” — rated credit being a high quality loan and a “7” — rated credit having some level of
loss in the credit. Loan officers are responsible for risk-rating their own credits, including
maintaining the risk rating on a current basis. Downgrades are discussed at various management and
loan committee meetings. The risk ratings are also subject to an on-going review by an extensive
loan review process performed independent of the loan officers. An adequately controlled risk
rating process allows Company management to conclude that the Banks’ watch lists (which include all
credits risk-rated “4” or greater) are, for all practical purposes, a complete profile of
situations with current loss exposure.
All loans included in the watch lists require separate action plans to be developed to reduce
the level of risk inherent in the credit relationship. Based on the information included on the
watch list and a review of each individual credit relationship thereon, the Company determines
whether a credit is impaired. The Company considers a loan to be impaired when all amounts due —
both principal and interest — will not be collected in accordance with the contractual terms of
the loan agreement. Factors considered by management in determining impairment include payment
status, collateral value (and marketability), and the probability of collecting scheduled principal
and interest payments when due. Loans that experience insignificant payment delays and payment
shortfalls generally are not classified as impaired. Management determines the significance of
payment delays and payment shortfalls on a case-by-case basis, taking into consideration all of the
circumstances surrounding the loan and the borrower, including the length of the delay, the reasons
for the delay, the borrower’s prior payment record, and the amount of shortfall in relation to the
principal and interest owed.
When measuring impairment for loans, the expected further cash flows of impaired loans are
discounted at the loan’s effective interest rate. Alternatively, impairment is measured by
reference to an observable market price, if one exists, or the fair value of collateral for a
collateral dependent loan; however, substantially all of the Company’s presently impaired credit
relationships are collateralized by (and derive their ultimate cash flows from) commercial,
construction, or residential real estate and, accordingly, virtually
39
Table of Contents
all of the Company’s impairment calculations for the present portfolio have been based on the
underlying values of the real estate collateral.
The Banks’ watch lists include complete listings of credit relationships that are considered
to be impaired, along with an assessment of the estimated impairment loss to be included as
specific exposure for impaired loans. Such impairment calculations are based on current (less than
six months old) appraisals of the underlying real estate collateral. The Company regularly obtains
updated appraisals for all of its impaired credit relationships. As noted above, the continued
decline in real estate values experienced by the Company during the past three years has resulted
in an increased level of the reserve for loan losses for these specifically identifiable impairment
losses.
The sum of all exposure amounts calculated for impaired loans is included in the reserve for
loan losses as the specifically-identifiable losses portion of the account balance. This is one
portion of the reserve for loan losses. The second portion of the reserve for loan losses is a
general reserve for all credit relationships not considered to be specifically impaired. This
amount is calculated by first calculating the historical charge-off ratio for each of the
particular loan categories and then subjectively adjusting these historical ratios for several
economic and environmental factors. The adjusted ratio for each loan category is then applied
against the non-impaired loans in that loan category, resulting in a general reserve for that
particular loan category. The sum of these general reserve categories, when added to the amount of
specifically identified losses on impaired credits, results in the final reserve for loan losses
balance for a particular date. The Company follows this process for calculating the reserve for
loan losses on a quarterly basis.
In calculating the general portion of the reserve for possible loan losses, the loan
categories used are real estate construction, residential real estate, commercial real estate,
commercial and industrial, and consumer loans. Through 2009, historical charge-off ratios were
calculated on a rolling three-year basis, which resulted in higher reserve levels with the
increased levels of charge-offs experienced during the past three years. This was reduced to a
rolling two-year historical charge-off ratio in the fourth quarter of 2010. The economic and
environmental factors for which adjustments are made to the historical charge-off ratios include
the following:
| • | Changes in lending policies and procedures, including changes in underwriting standards and collection, charge-off, and recovery practices not considered elsewhere in estimating credit losses. | ||
| • | Changes in international, national, regional, and local economic and business conditions and developments that affect the collectibility of the portfolio, including the condition of various market segments. | ||
| • | Changes in the nature and volume of the portfolio and in the terms of loans. | ||
| • | Changes in the experience, ability, and depth of lending management and other relevant staff. | ||
| • | Changes in the volume and severity of past due loans, the volume of nonaccrual loans, and the volume and severity of adversely classified or graded loans. | ||
| • | Changes in the quality of the Banks’ loan review systems. | ||
| • | Changes in the value of underlying collateral for collateral-dependent loans. | ||
| • | The existence and effect of any concentrations of credit, and changes in the level of such concentrations. | ||
| • | The effect of other external factors such as competition and legal and regulatory requirements on the level of estimated credit losses in the Banks’ existing portfolios. |
The total reserve for possible loan losses is available to absorb losses from any segment of
the portfolio. Management continues to target and maintain the reserve for possible loan losses
equal to the allocation methodology outlined above.
40
Table of Contents
In determining an adequate balance in the reserve for possible loan losses, management places
its emphasis as follows: evaluation of the loan portfolio with regard to potential future exposure
on loans to specific customers and industries; reevaluation of each watch list loan or loan
classified by supervisory authorities; and an overall review of the remaining portfolio in light of
loan loss experience normally experienced in our banking market. Any problems or loss exposure
estimated in these categories is provided for in the total current period reserve.
The perception of risk with respect to particular loans within the portfolio will change over
time as a result of the characteristics and performance of those loans, overall economic and market
trends, and the actual and expected trends in non-performing loans.
Based on its review for adequacy, management has estimated those portions of the reserve that
could be attributable to major categories of loans as detailed in the following table at year-end
for each of the years in the five-year period ended December 31, 2010:
| December 31, | ||||||||||||||||||||||||||||||||||||||||
| (in thousands of dollars) | ||||||||||||||||||||||||||||||||||||||||
| 2010 | 2009 | 2008 | 2007 | 2006 | ||||||||||||||||||||||||||||||||||||
| Percent by | Percent by | Percent by | Percent by | Percent by | ||||||||||||||||||||||||||||||||||||
| Category | Category | Category To | Category | Category | ||||||||||||||||||||||||||||||||||||
| To Total | To Total | Total | To Total | To Total | ||||||||||||||||||||||||||||||||||||
| Reserve | Loans | Reserve | Loans | Reserve | Loans | Reserve | Loans | Reserve | Loans | |||||||||||||||||||||||||||||||
Commercial: |
||||||||||||||||||||||||||||||||||||||||
Real estate |
$ | 21,406 | 73.87 | % | $ | 14,256 | 69.90 | % | $ | 9,623 | 67.27 | % | $ | 5,137 | 56.46 | % | $ | 3,465 | 59.08 | % | ||||||||||||||||||||
Other |
2,029 | 8.35 | 965 | 7.26 | 1,080 | 7.55 | 783 | 6.75 | 804 | 7.96 | ||||||||||||||||||||||||||||||
Real estate: |
||||||||||||||||||||||||||||||||||||||||
Construction |
11,966 | 10.35 | 14,897 | 15.15 | 2,172 | 15.19 | 2,002 | 20.20 | 1,391 | 16.24 | ||||||||||||||||||||||||||||||
Residential |
1,871 | 7.13 | 1,997 | 7.37 | 1,380 | 9.64 | 1,608 | 16.07 | 1,045 | 15.74 | ||||||||||||||||||||||||||||||
Consumer |
29 | 0.30 | 107 | 0.32 | 51 | 0.35 | 56 | 0.52 | 51 | 0.98 | ||||||||||||||||||||||||||||||
Not allocated |
— | — | — | — | — | — | 99 | — | 345 | — | ||||||||||||||||||||||||||||||
Total allowance |
$ | 37,301 | 100.00 | % | $ | 32,222 | 100.00 | % | $ | 14,306 | 100.00 | % | $ | 9,685 | 100.00 | % | $ | 7,101 | 100.00 | % | ||||||||||||||||||||
While the Company has no significant specific industry concentration risk, analysis
showed that over 91% of the loan portfolio was dependent on real estate collateral at December 31,
2010, including commercial real estate, residential real estate, and construction and land
development loans. The following table details the significant categories of real estate loans as a
percentage of total regulatory capital:
| Real Estate Loan | ||||||||
| Balances as a Percentage | ||||||||
| of Total Regulatory Capital | ||||||||
| 12/31/2010 | 12/31/2009 | |||||||
Construction, land development and other
other land loans |
93 | % | 112 | % | ||||
Nonfarm nonresidential: |
||||||||
Owner occupied |
148 | % | 112 | % | ||||
Non-owner occupied |
403 | % | 340 | % | ||||
1-4 family closed end loans |
49 | % | 40 | % | ||||
Multi-family |
105 | % | 86 | % | ||||
Other |
23 | % | 22 | % | ||||
Outstanding balances in all real estate loan categories have declined between December
31, 2009 and December 31, 2010. However, total regulatory capital declined at a faster pace than
most of the loan category declines, thus resulting in the increased percentages noted above.
Liquidity and Rate Sensitivity Management
Management of rate sensitive earning assets and interest-bearing liabilities remains a key to
the Company’s profitability. The Company’s operations are subject to risk resulting from interest
rate fluctuations to the extent that there is a difference between the amount of the Company’s
interest-earning assets and the amount of interest-bearing liabilities that are prepaid or
withdrawn, mature or are repriced in specified periods. The principal objective of the Company’s
asset/liability management activities is to provide maximum levels of net interest income while
maintaining acceptable levels of interest rate and liquidity risk and facilitating the funding
needs of the Company. The Banks utilize gap analyses as the primary quantitative tool in measuring
the amount of interest rate risk that is present at the end of each quarter. Bank management
41
Table of Contents
also monitors, on a quarterly basis, the variability of earnings and fair value of equity in
various interest rate environments. Bank management evaluates the Banks’ risk position to determine
whether the level of exposure is significant enough to hedge a potential decline in earnings and
value or whether the Bank can safely increase risk to enhance returns.
Liquidity is a measurement of the Banks’ ability to meet the borrowing needs and the deposit
withdrawal requirements of their customers. The composition of assets and liabilities is actively
managed to maintain the appropriate level of liquidity in the balance sheet. Management is guided
by regularly reviewed policies when determining the appropriate portion of total assets which
should be comprised of readily marketable assets available to meet conditions that are reasonably
expected to occur.
Liquidity is primarily provided to the Banks through earning assets, including Federal funds
sold and maturities and principal payments in the investment portfolio, all funded through
continued deposit growth and short-term borrowings. Secondary sources of liquidity available to the
Banks include the sale of securities included in the available-for-sale category (with a carrying
value of $241,599,461 at December 31, 2010, of which $150,544,222 is pledged to secure deposits,
repurchase agreements certain borrowings and for other purposes) and borrowing capabilities through
correspondent banks, the Federal Reserve Bank, and the Federal Home Loan Banks. Maturing loans also
provide liquidity on an ongoing basis. Accordingly, Bank management believes it has the liquidity
necessary to meet unexpected deposit withdrawal requirements or increases in loan demand.
The Banks have borrowing capabilities through correspondent banks, the Federal Reserve Bank,
and the Federal Home Loan Banks of Des Moines and Atlanta. The Banks have Federal funds lines of
credit totaling $23,000,000, through correspondent banks, of which $23,000,000 was available at
December 31, 2010. Also, Reliance Bank has a credit line with the Federal Home Loan Bank of Des
Moines in the amount of $165,779,654 and availability under that line was $66,761,080 as of
December 31, 2010. Reliance Bank, FSB maintained a credit line with the Federal Home Loan Bank of
Atlanta in the amount of $8,960,000, of which $5,860,000 was available at December 31, 2010. In
addition, Reliance Bank maintained a line of credit with the Federal Reserve Bank in the amount of
$22,450,433, of which $22,450,433 was available, subject to a collateral and credit review, at
December 31, 2010. As of December 31 2010, the combined availability under these arrangements
totaled $118,071,513. Company management believes it has the liquidity necessary to meet
unexpected deposit withdrawal requirements or increases in loan demand. However, availability of
the funds noted above is subject to the Banks’ maintaining a favorable rating by their regulators.
If the Banks were to become distressed to the point that their regulatory ratings were lowered, it
could negatively impact the ability of the Banks to borrow the funds.
42
Table of Contents
The asset/liability management process, which involves structuring the balance sheet to
allow approximately equal amounts of assets and liabilities to reprice at the same time, is a
dynamic process essential to minimize the effect of fluctuating interest rates on net interest
income. The following table reflects the Company’s interest rate gap (rate-sensitive assets minus
rate-sensitive liabilities) analysis as of December 31, 2010, individually and cumulatively,
through various time horizons:
Remaining Maturity if Fixed Rate;
Earliest Possible Repricing Interval if Floating Rate
Earliest Possible Repricing Interval if Floating Rate
| 3 | Over 3 | Over 1 | ||||||||||||||||||
| months | months | year | ||||||||||||||||||
| or | through | through | Over | |||||||||||||||||
| less | 12 months | 5 years | 5 years | Total | ||||||||||||||||
Interest-earning assets: |
||||||||||||||||||||
Loans |
$ | 432,411,460 | $ | 161,937,236 | $ | 350,133,827 | $ | 25,778,843 | $ | 970,261,366 | ||||||||||
Loans held for sale |
18,698 | 84,238 | 493,371 | 1,242,493 | 1,838,800 | |||||||||||||||
Investment securities, at amortized cost |
27,530,325 | 37,079,045 | 136,481,716 | 40,463,306 | 241,554,392 | |||||||||||||||
Other interest-earning assets |
18,800,037 | — | — | — | 18,800,037 | |||||||||||||||
Total interest-earning assets |
$ | 478,760,520 | $ | 199,100,519 | $ | 487,108,914 | $ | 67,484,642 | $ | 1,232,454,595 | ||||||||||
Interest bearing-liabilities: |
||||||||||||||||||||
Savings and interest bearing transaction
accounts |
$ | 570,096,454 | $ | 12,047 | — | — | $ | 570,108,501 | ||||||||||||
Time certificates of deposit of $100,000
Or more |
23,719,074 | 86,448,941 | 56,682,067 | 3,570,292 | 170,420,374 | |||||||||||||||
All other time deposits |
36,623,816 | 139,801,371 | 96,777,940 | 5,139,194 | 278,342,321 | |||||||||||||||
Nondeposit interest-bearing liabilities |
13,038,396 | 1,132,452 | 27,007,007 | 67,000,000 | 108,177,855 | |||||||||||||||
Total interest-bearing liabilities |
$ | 643,477,740 | $ | 227,394,811 | $ | 180,467,014 | $ | 75,709,486 | $ | 1,127,049,051 | ||||||||||
Gap by period |
$ | (164,717,220 | ) | $ | (28,294,292 | ) | $ | 306,641,900 | $ | (8,224,844 | ) | $ | 105,405,544 | |||||||
Cumulative gap |
$ | (164,717,220 | ) | $ | (193,011,512 | ) | $ | 113,630,388 | $ | 105,405,544 | $ | 105,405,544 | ||||||||
Ratio of interest-sensitive assets to
interest-sensitive liabilities |
0.74 | x | 0.88 | x | 2.70 | x | 0.89 | x | 1.09 | x | ||||||||||
Cumulative ratio of
interest-sensitive assets to
interest-sensitive liabilities |
0.74 | x | 0.78 | x | 1.11 | x | 1.09 | x | 1.09 | x | ||||||||||
A gap report is used by Bank management to review any significant mismatch between the
repricing points of the Banks’ rate sensitive assets and liabilities in certain time horizons. A
negative gap indicates that more liabilities reprice in that particular time frame and, if rates
rise, these liabilities will reprice faster than the assets. A positive gap would indicate the
opposite. Management has set policy limits specifying acceptable levels of interest rate risk as
measured by the gap report. Gap reports can be misleading in that they capture only the repricing
timing within the balance sheet, and fail to capture other significant risks such as basis risk and
embedded options risk. Basis risk involves the potential for the spread relationship between rates
to change under different rate environments and embedded options risk relates to the potential for
the divergence from expectations in the level and/or timing of cash flows given changes in rates.
As indicated in the above table, the Company operates on a short-term basis similar to most other
financial institutions, as its liabilities, with savings and interest-bearing transaction accounts
included, could reprice more quickly than its assets. However, the process of asset/liability
management in a financial institution is dynamic. Bank management believes its current
asset/liability management program will allow adequate reaction time for trends in the marketplace
as they occur, allowing maintenance of adequate net interest margins.
Bank management also uses fair market value of equity analyses to help identify longer-term
risk that may reside on the current balance sheet. The fair market value of equity is represented
by the present value of all future income streams generated by the current balance sheet. The
Company measures the fair market value of equity as the net present value of all asset and
liability cash flows discounted at forward rates suggested by the current Treasury curve plus
appropriate credit spreads. This representation of the change in the fair market value of equity
under different rate scenarios gives insight into the magnitude of risk to future earnings due to
rate changes. Management has set policy limits relating to declines in the market value of equity.
The results of these analyses at December 31, 2010 indicate that the Company’s fair market value of
equity would decrease 7.00% and 14.57% from an immediate and sustained parallel decrease in
interest rates of 100 and 200 basis points, respectively, and increase 6.54% and 10.16%, from a
corresponding increase in interest rates of 100 and 200 basis points, respectively.
43
Table of Contents
Following is a more detailed analysis of the maturity and interest rate sensitivity of the
Banks’ loan portfolios at December 31, 2010:
| Over 1 | ||||||||||||||||
| through | Over | |||||||||||||||
| 1 year | 5 | 5 | ||||||||||||||
| or less | years | years | Total | |||||||||||||
Commercial: |
||||||||||||||||
Real estate |
394,331,563 | $ | 307,183,199 | $ | 15,259,034 | $ | 716,773,796 | |||||||||
Other |
73,418,071 | 7,071,027 | 484,439 | 80,973,537 | ||||||||||||
Real estate: |
||||||||||||||||
Construction |
85,343,606 | 15,112,990 | — | 100,456,596 | ||||||||||||
Residential |
38,638,230 | 20,483,752 | 10,021,316 | 69,143,298 | ||||||||||||
Consumer |
2,497,796 | 282,859 | 14,054 | 2,794,709 | ||||||||||||
Overdrafts |
119,430 | — | — | 119,430 | ||||||||||||
| $ | 594,348,696 | $ | 350,133,827 | $ | 25,778,843 | $ | 970,261,366 | |||||||||
For all loans maturing or repricing beyond the one year time horizon at December 31, 2010,
following is a breakdown of such loans into fixed and floating rates.
| Fixed | Floating | |||||||||||
| Rate | Rate | Total | ||||||||||
Due after one but within five years |
$ | 285,091,082 | $ | 65,042,745 | $ | 350,133,827 | ||||||
Due after five years |
24,265,671 | 1,513,172 | 25,778,843 | |||||||||
| $ | 309,356,753 | $ | 66,555,917 | $ | 375,912,670 | |||||||
The investment portfolio is closely monitored to assure that the Banks have no unreasonable
concentration of securities in the obligations of any single debtor. Other than U.S. Government
agency securities, the Banks maintain no concentration of investments in any one political
subdivision greater than 10% of its total portfolio.
The book value and estimated market value of the Company’s debt securities at December 31,
2010, 2009 and 2008, all of which are classified as available-for-sale, are summarized in the
following table:
| 2010 | 2009 | 2008 | ||||||||||||||||||||||
| Amortized | Market | Amortized | Market | Amortized | Market | |||||||||||||||||||
| Cost | Value | Cost | Value | Cost | Value | |||||||||||||||||||
U.S. Government agencies
And corporations |
$ | 73,664,373 | $ | 73,531,650 | $ | 116,150,389 | $ | 115,445,243 | $ | 65,973,705 | $ | 67,487,820 | ||||||||||||
State and political subdivisions |
19,637,799 | 20,111,832 | 30,012,602 | 30,651,585 | 34,063,983 | 33,680,096 | ||||||||||||||||||
Trust preferred securities |
3,104,269 | 511,289 | 3,697,211 | 1,237,737 | 6,298,345 | 3,574,962 | ||||||||||||||||||
U.S. agency residential
mortgage-backed securities |
145,147,951 | 147,444,690 | 134,883,536 | 136,784,991 | 87,711,440 | 89,145,614 | ||||||||||||||||||
| $ | 241,554,392 | $ | 241,599,461 | $ | 284,743,738 | $ | 284,119,556 | $ | 194,047,473 | $ | 193,888,492 | |||||||||||||
44
Table of Contents
The following tables summarize maturity and yield information on the Company’s investment
portfolio at December 31, 2010:
| Weighted | ||||||||
| Average Tax | ||||||||
| — | ||||||||
| Amortized | Equivalent | |||||||
| Cost | Yield | |||||||
Available-for-sale |
||||||||
U.S. Government agencies and corporations: |
||||||||
0 to 1 year |
$ | 3,000,124 | 1.45 | % | ||||
1 to 5 years |
8,668,822 | 2.39 | ||||||
5 to 10 years |
43,674,530 | 2.30 | ||||||
Over 10 years |
18,320,897 | 1.86 | ||||||
Total |
$ | 73,664,373 | 2.17 | % | ||||
State and political subdivisions: |
||||||||
0 to 1 year |
$ | 189,970 | 5.36 | % | ||||
1 to 5 years |
4,896,801 | 5.56 | ||||||
5 to 10 years |
10,851,418 | 6.15 | ||||||
Over 10 years |
3,699,610 | 6.72 | ||||||
Total |
$ | 19,637,799 | 6.10 | |||||
Trust preferred securities: |
||||||||
0 to 1 year |
$ | — | — | % | ||||
1 to 5 years |
— | — | ||||||
5 to 10 years |
— | — | ||||||
Over 10 years |
3,104,269 | 2.12 | ||||||
Total |
$ | 3,104,269 | 2.12 | |||||
U.S. agency resident mortgage-backed
securities |
$ | 145,147,951 | 3.47 | % | ||||
Combined: |
||||||||
0 to 1 year |
$ | 3,190,094 | 1.68 | % | ||||
1 to 5 years |
13,565,623 | 3.53 | ||||||
5 to 10 years |
54,525,948 | 3.07 | ||||||
Over 10 years |
25,124,776 | 2.61 | ||||||
Mortgage-backed securities |
145,147,951 | 3.47 | ||||||
Total |
$ | 241,554,392 | 3.27 | % | ||||
Note: While yields by range of maturity are routinely provided by the Company’s accounting system
on a tax equivalent basis, the individual amounts of adjustments are not so provided. In total, at
an assumed Federal income tax rate of 34%, the adjustment amounted to $463,405.
45
Table of Contents
The Banks’ primary source of liquidity to fund growth is ultimately the generation of new
deposits. The following table shows the average daily amount of deposits and the average rate paid
on each type of deposit for the years ended December 31, 2010, 2009, and 2008:
| Years Ended December 31, | ||||||||||||||||||||||||
| 2010 | 2009 | 2008 | ||||||||||||||||||||||
| Average | Average | Average | Average | Average | Average | |||||||||||||||||||
| Balance | Rate | Balance | Rate | Balance | Rate | |||||||||||||||||||
Noninterest-bearing
demand deposits |
$ | 63,951,012 | — | % | $ | 62,196,559 | — | % | $ | 56,223,479 | — | % | ||||||||||||
Interest-bearing
transaction accounts |
228,869,803 | 0.86 | 168,582,912 | 1.24 | 162,299,967 | 2.33 | ||||||||||||||||||
Savings deposits |
322,853,791 | 1.13 | 262,920,235 | 2.80 | 52,455,044 | 1.80 | ||||||||||||||||||
Time deposits of
$100,000 or more |
219,314,957 | 2.46 | 314,461,095 | 3.09 | 339,942,549 | 4.02 | ||||||||||||||||||
All other time deposits |
318,088,642 | 2.75 | 430,806,970 | 3.35 | 395,841,510 | 4.11 | ||||||||||||||||||
| $ | 1,153,078,205 | 1.71 | % | $ | 1,238,967,771 | 2.71 | % | $ | 1,006,762,549 | 3.44 | % | |||||||||||||
As noted in the gap analyses above, at December 31, 2010, a substantial portion of the
Company’s time deposits mature within one year, which is common in the present banking market. The
following table shows the maturity of time deposits of $100,000 or more and other time deposits at
December 31, 2010:
| Time | Other | |||||||||||
| Deposit of | Time | |||||||||||
| Maturity | $100,000 or more | Deposits | Total | |||||||||
Three months or less |
$ | 23,719,074 | $ | 36,623,816 | $ | 60,342,890 | ||||||
Three to six months |
25,779,471 | 46,527,526 | 72,306,997 | |||||||||
Six to twelve months |
60,669,470 | 93,273,845 | 153,943,315 | |||||||||
Over twelve months |
60,252,359 | 101,917,134 | 162,169,493 | |||||||||
| $ | 170,420,374 | $ | 278,342,321 | $ | 448,762,695 | |||||||
Capital Adequacy
The Federal Reserve Board established risk-based capital guidelines for bank holding
companies, which require bank holding companies to maintain minimum levels of “Tier 1 Capital” and
“Total Capital.” Tier 1 Capital consists of common and qualifying preferred stockholders’ equity
and minority interests in equity accounts of consolidated subsidiaries, less goodwill and 50% of
investments in unconsolidated subsidiaries. Total capital consists of, in addition to Tier 1
Capital, mandatory convertible debt, preferred stock not qualifying as Tier 1 Capital, subordinated
and other qualifying term debt and a portion of the reserve for possible loan losses, less the
remaining 50% of qualifying total capital. Risk-based capital ratios are calculated with reference
to risk-weighted assets, which include both on-and off-balance sheet exposures. The minimum
required ratio for qualifying Total Capital is 8%, of which at least 4% must consist of Tier 1
Capital.
In addition, Federal Reserve guidelines require bank holding companies to maintain a minimum
ratio of Tier 1 Capital to average total assets (net of goodwill) of 3%. The Federal Reserve
guidelines state that all of these capital ratios constitute the minimum requirements for the most
highly-rated banking organizations, and other banking organizations are expected to maintain
capital at higher levels.
The
Banks are also required to maintain additional capital, as described in Item 1 above, under agreements
with the banking regulators. Company management believes that, as of December 31, 2010, the
Company and Banks meet all capital adequacy requirements to which they are subject, except for
Reliance Bank, FSB, which was less than adequately capitalized at December 31, 2010 after recording
the write-down of land held for future expansion effective December 31, 2010. The Company
subsequently injected $500,000 of additional capital into Reliance Bank, F.S.B. on February 16,
2011, which brought the Bank to an adequately capitalized level, but below the threshold required
by the regulatory agreement. Also, Reliance Bank, effective with the February 14, 2011 Consent Order, was deemed to be less than well capitalized due to the new, increased capital requirements within the Order.
46
Table of Contents
As of December 31, 2010, the most recent notification from the applicable regulatory
authorities categorized Reliance Bank as a well-capitalized bank under the regulatory framework for
prompt corrective action. To be categorized as a well-capitalized bank, Reliance Bank must
maintain minimum Total risk-based, Tier 1 risk-based, and Tier 1 leverage ratios as set forth in
the table below. There are no conditions or events since that notification that Company management
believes have changed Reliance Bank’s risk categories.
The actual capital amounts and ratios for the Company, Reliance Bank, and Reliance Bank, FSB
at December 31, 2010, 2009, and 2008 are presented in the following table:
| To Be a Well | ||||||||||||||||||||||||
| Capitalized Bank Under | ||||||||||||||||||||||||
| For Capital | Prompt Corrective | |||||||||||||||||||||||
| Actual | Adequacy Purposes | Action Provision | ||||||||||||||||||||||
| (in thousands of dollars) | Amount | Ratio | Amount | Ratio | Amount | Ratio | ||||||||||||||||||
December 31, 2010: |
||||||||||||||||||||||||
Total Capital (to risk weighted
assets) |
||||||||||||||||||||||||
Consolidated |
$ | 108,209 | 10.05 | % | $ | 86,168 | >8.0 | % | $ | N/A | N/A | |||||||||||||
Reliance Bank |
102,606 | 10.03 | % | 81,824 | >8.0 | % | 102,280 | >10.0 | % | |||||||||||||||
Reliance Bank, FSB |
4,033 | 7.53 | % | 4,287 | >8.0 | % | 5,359 | >10.0 | % | |||||||||||||||
Tier 1 capital (to risk weighted
assets) |
||||||||||||||||||||||||
Consolidated |
$ | 93,896 | 8.72 | % | $ | 43,084 | >4.0 | % | $ | N/A | N/A | |||||||||||||
Reliance Bank |
89,574 | 8.76 | % | 40,912 | >4.0 | % | 61,368 | >6.0 | % | |||||||||||||||
Reliance Bank, FSB |
3,330 | 6.21 | % | 2,144 | >4.0 | % | 3,215 | >6.0 | % | |||||||||||||||
Tier 1 capital (to average assets) |
||||||||||||||||||||||||
Consolidated |
$ | 93,896 | 7.14 | % | $ | 52,589 | >4.0 | % | $ | N/A | N/A | |||||||||||||
Reliance Bank |
89,574 | 7.29 | % | 49,161 | >4.0 | % | 61,451 | >5.0 | % | |||||||||||||||
Reliance Bank, FSB |
3,330 | 4.01 | % | 3,324 | >4.0 | % | 4,155 | >5.0 | % | |||||||||||||||
December 31, 2009: |
||||||||||||||||||||||||
Total Capital (to risk weighted
assets) |
||||||||||||||||||||||||
Consolidated |
$ | 146,809 | 11.38 | % | $ | 103,198 | >8.0 | % | $ | N/A | N/A | |||||||||||||
Reliance Bank |
124,248 | 10.17 | % | 97,691 | >8.0 | % | 122,113 | >10.0 | % | |||||||||||||||
Reliance Bank, FSB |
14,390 | 18.52 | % | 6,215 | >8.0 | % | 7,769 | >10.0 | % | |||||||||||||||
Tier 1 capital (to risk weighted
assets) |
||||||||||||||||||||||||
Consolidated |
$ | 130,486 | 10.12 | % | $ | 51,599 | >4.0 | % | $ | N/A | N/A | |||||||||||||
Reliance Bank |
108,965 | 8.92 | % | 48,845 | >4.0 | % | 73,268 | >6.0 | % | |||||||||||||||
Reliance Bank, FSB |
13,401 | 17.25 | % | 3,108 | >4.0 | % | 4,661 | >6.0 | % | |||||||||||||||
Tier 1 capital (to average assets) |
||||||||||||||||||||||||
Consolidated |
$ | 130,486 | 8.52 | % | $ | 61,244 | >4.0 | % | $ | N/A | N/A | |||||||||||||
Reliance Bank |
108,965 | 7.62 | % | 57,211 | >4.0 | % | 71,514 | >5.0 | % | |||||||||||||||
Reliance Bank, FSB |
13,401 | 13.57 | % | 3,952 | >4.0 | % | 4,940 | >5.0 | % | |||||||||||||||
December 31, 2008: |
||||||||||||||||||||||||
Total capital (to risk-weighted
assets) |
||||||||||||||||||||||||
Consolidated |
$ | 152,517 | 10.87 | % | $ | 112,253 | >8.0 | % | $ | N/A | N/A | |||||||||||||
Reliance Bank |
133,151 | 10.23 | % | 104,160 | >8.0 | % | 130,200 | 10.0 | % | |||||||||||||||
Reliance Bank, FSB |
22,117 | 22.00 | % | 8,044 | >8.0 | % | 10,055 | 10.0 | % | |||||||||||||||
Tier 1 capital (to risk-weighted
assets) |
||||||||||||||||||||||||
Consolidated |
$ | 138,411 | 9.87 | % | $ | 56,102 | >4.0 | % | $ | N/A | N/A | |||||||||||||
Reliance Bank |
121,099 | 9.30 | % | 52,080 | >4.0 | % | 78,120 | 6.0 | % | |||||||||||||||
Reliance Bank, FSB |
21,355 | 21.24 | % | 4,022 | >4.0 | % | 6,033 | 6.0 | % | |||||||||||||||
Tier 1 capital (to average assets) |
||||||||||||||||||||||||
Consolidated |
$ | 138,411 | 9.07 | % | $ | 61,028 | >4.0 | % | $ | N/A | N/A | |||||||||||||
Reliance Bank |
121,099 | 8.57 | % | 56,503 | >4.0 | % | 70,629 | 5.0 | % | |||||||||||||||
Reliance Bank, FSB |
21,355 | 17.30 | % | 4,937 | >4.0 | % | 6,171 | 5.0 | % | |||||||||||||||
Federal law provides the federal banking regulators with broad power to take prompt corrective
action to resolve the problems of undercapitalized banking institutions. The extent of the
regulators’ powers depend on
47
Table of Contents
whether the banking institution in question is “well capitalized,” “adequately capitalized,”
“undercapitalized,” “significantly undercapitalized” or “critically undercapitalized,” which are
defined by the regulators as follows:
| Total | Tier 1 | Tier 2 | ||||||||||
| Risk-Based | Risk-Based | Leverage | ||||||||||
| Ratio | Ratio | Ratio | ||||||||||
Well capitalized |
10 | % | 6 | % | 5 | % | ||||||
Adequately capitalized |
8 | 4 | 4 | |||||||||
Undercapitalized |
<8 | <4 | <4 | |||||||||
Significantly undercapitalized |
<6 | <3 | <3 | |||||||||
Critically undercapitalized |
* | * | * | |||||||||
| A critically undercapitalized institution is defined as having a tangible equity to total assets ratio of 2% or less. |
Contractual Obligations, Off-Balance Sheet Risk, and Contingent Liabilities
Through the normal course of operations, the Banks have entered into certain contractual
obligations and other commitments. Such obligations relate to funding of operations through
deposits or debt issuances, as well as leases for premises and equipment. As financial services
providers, the Banks routinely enter into commitments to extend credit. While contractual
obligations represent future cash requirements of the Banks, a significant portion of commitments
to extend credit may expire without being drawn upon. Such commitments are subject to the same
credit policies and approval processes accorded to loans made by the Banks.
The required contractual obligations and other commitments at December 31, 2010 were as
follows:
| Over 1 Year | ||||||||||||||||
| Total Cash | Less Than 1 | Less Than 5 | Over 5 | |||||||||||||
| Commitment | Year | Years | Years | |||||||||||||
Operating leases |
$ | 7,227,676 | $ | 722,413 | $ | 2,462,691 | $ | 4,042,572 | ||||||||
Time deposits |
448,762,695 | 286,593,202 | 153,460,007 | 8,709,486 | ||||||||||||
Federal Home Loan Bank
borrowings |
93,000,000 | 1,000,000 | 25,000,000 | 67,000,000 | ||||||||||||
Commitments to extend credit |
95,543,403 | 53,500,936 | 16,097,361 | 25,945,106 | ||||||||||||
Standby letters of credit |
12,938,236 | 5,045,325 | 7,892,911 | — | ||||||||||||
Quantitative and Qualitative Disclosures About Market Risk
For information regarding the market risk of the financial instruments of the Company, see the
section entitled “Liquidity and Rate Sensitivity Management” within this “Management’s Discussion
and Analysis of Financial Condition and Results of Operation” section.
Effects of Inflation
Persistent high rates of inflation can have a significant effect on the reported financial
condition and results of operations of all industries. However, the asset and liability structure
of a financial institution is substantially different from that of an industrial company, in that
virtually all assets and liabilities of a financial institution are monetary in nature.
Accordingly, changes in interest rates may have a significant impact on a financial institution’s
performance. Interest rates do not necessarily move in the same direction, or in the same
magnitude, as the prices of other goods and services.
Inflation, however, does have an important impact on the growth of total assets in the banking
industry, often resulting in a need to increase equity capital at higher than normal rates to
maintain an appropriate equity-to-assets ratio. One of the most important effects that inflation
has had on the banking industry has been to reduce the proportion of earnings paid out in the form
of dividends.
Although it is obvious that inflation affects the growth of total assets, it is difficult to
measure the impact precisely. Only new assets acquired each year are directly affected, so a simple
adjustment of asset totals by
48
Table of Contents
use of an inflation index is not meaningful. The results of operations also have been affected
by inflation, but again there is no simple way to measure the effect on the various categories of
income and expense.
Interest rates in particular are significantly affected by inflation, but neither the timing
nor the magnitude of the changes coincide with changes in the consumer price index. Additionally,
changes in interest rates on some types of consumer deposits may be delayed. These factors, in
turn, affect the composition of sources of funds by reducing the growth of deposits that are less
interest sensitive and increasing the need for funds that are more interest sensitive.
Item 7A. Quantitative and Qualitative Disclosures about Market Risk
Information regarding the market risk of the financial instruments of the Company is included
in this report under “Fluctuations in interest rates could reduce our profitability and affect the
value of our assets” in Item 1A “Risk Factors” and under “Liquidity and Rate Sensitivity
Management” in item 7 “Management’s Discussion and Analysis of Financial Condition and Results of
Operations.” Such information is incorporated in this Item 7A by reference.
Item 8. Financial Statements and Supplementary Data
The financial statements that are filed as part of this report are set forth in Item 15 of
this report.
Item 9. Changes in and Disagreements With Accountants on Accounting and Financial
Disclosure
None.
Item 9A. Controls and procedures
Evaluation of Controls and Procedures
Under the supervision and with the participation of the Company’s Chief Executive Officer
(“CEO”) and the Chief Financial Officer (“CFO”), management has evaluated the effectiveness of the
Company’s disclosure controls and procedures (as defined in Rules 13a-15(e) and 15d-15(e) of the
Securities and Exchange act of 1934, as amended) and concluded that the Company’s disclosure
controls and procedures were adequate and effective as of December 31, 2010.
Changes in Internal Controls over Financial Reporting
There were no changes during the period covered by this Annual Report on Form 10-K in the
Company’s internal control over financial reporting that have materially affected, or are
reasonably likely to materially affect, our internal control over financial reporting.
Management’s Report on Internal Control Over Financial Reporting
Management is responsible for establishing and maintaining adequate internal control over
financial reporting for the Company, as such term is defined in Rule 13a-15(f) under the Exchange
Act. Under the supervision and with the participation of the Company’s management, including the
Chief Executive Officer and Chief Financial Officer, we conducted an evaluation of the
effectiveness of our internal control over financial reporting as of December 31, 2010. The
framework on which such evaluation was based is contained in the report entitled “Internal
Control—Integrated Framework” issued by the Committee of Sponsoring Organizations of the Treadway
Commission. Based on this evaluation, the Chief Executive Officer and Chief Financial Officer
concluded that our internal control over financial reporting was effective as of December 31, 2010.
This Annual Report on Form 10-K does not include an attestation report of the Company’s
registered public accounting firm regarding internal control over financial reporting.
Management’s report was not
49
Table of Contents
subject to attestation by the Company’s registered public accounting firm pursuant to
temporary rules of the SEC that permit the Company to provide only management’s report in this
Annual Report.
| /s/ Allan D. Ivie, IV | ||||
| Allan D. Ivie, IV | ||||
| President and Chief Executive Officer (Principal Executive Officer) |
||||
| /s/ Dale E. Oberkfell | ||||
| Dale E. Oberkfell | ||||
| Chief Financial Officer (Principal Financial and Principal Accounting Officer) | ||||
Item 9b. Other information
None.
PART III
Item 10. Directors, Executive Officers and Corporate Governance
The information required by this Item 10 is set forth under the captions “Proposal 1 Requiring
Your Vote: Election of Directors,” “Executive Officers,” “Section 16(a) Beneficial Ownership
Reporting Compliance,” “Code of Business Conduct and Ethics” and “Board of Directors and
Committees: The Audit Committee” in the Company’s Proxy Statement for the 2011 annual meeting of
shareholders (the “2011 Proxy Statement”) and is incorporated herein by reference.
There have been no material changes to the procedures by which shareholders may recommend
Director nominees to our Board of Directors since the filing of our Quarterly Report on Form 10-Q
for the quarter ended September 30, 2010.
Item 11. Executive Compensation
The information required by this Item 11 is set forth under the captions “Compensation
Discussion and Analysis,” “Compensation Committee Report,” “Executive Compensation” and
“Compensation Committee Interlocks and Insider Participation” in the 2011 Proxy Statement and is
incorporated herein by reference.
| Item 12. Security Ownership of Certain Beneficial Owners and Management and Related Stockholder Matters |
Certain information required by this Item 12 is set forth under the caption “Stock Ownership
of Executive Officers and Certain Beneficial Owners” in the Company’s 2011 Proxy Statement and is
incorporated herein by reference.
Item 13. Certain Relationships and Related Transactions, and Director
Independence
The information required by this Item 13 is set forth under the captions “Interest of
Management in Certain Transactions” and “Independent Directors” in the Company’s 2011 Proxy
Statement and is incorporated herein by reference.
50
Table of Contents
Item 14. Principal Accountant Fees and Services
The information required by this Item 14 is set forth under the caption “Audit Committee
Report and Payment of Fees to Auditors” in the Company’s 2011 Proxy Statement and is incorporated
herein by reference.
Item 15. Exhibits and Financial Statement Schedules
| (a) | The following documents are filed as part of this Annual Report: | |
| (1) Financial Statements | ||
| The financial statements filed with this Annual Report are listed in the Index to Consolidated Financial Statements on page F-1. | ||
| (2) Schedules | ||
| None. | ||
| (3) Exhibits | ||
| The Exhibits required to be filed as a part of this Annual Report are listed in the attached Index to Exhibits. | ||
| (b) | The Exhibits required to be filed as a part of this Annual Report are listed in the attached Index to Exhibits. | |
| (c) | None. |
51
Table of Contents
Index to Consolidated Financial Statements
| AUDITED CONSOLIDATED FINANCIAL STATEMENTS — December 31, 2010, 2009 and 2008 | Page No. | |
| F-2 | ||
| F-3 | ||
| F-4 | ||
| F-5 | ||
| F-6 | ||
| F-7 | ||
| F-8 |
Table of Contents

Report of Independent Registered Public Accounting Firm
The Board of Directors and Stockholders
Reliance Bancshares, Inc.:
Reliance Bancshares, Inc.:
We have audited the accompanying consolidated balance sheets of Reliance Bancshares, Inc. and
subsidiaries as of December 31, 2010 and 2009, and the related consolidated statements of
operations, comprehensive loss, stockholders’ equity, and cash flows for each of the years in the
three-year period ended December 31, 2010. These consolidated financial statements are the
responsibility of the Company’s management. Our responsibility is to express an opinion on these
consolidated financial statements based on our audits.
We conducted our audits in accordance with standards of the Public Company Accounting Oversight
Board (United States). Those standards require that we plan and perform the audits to obtain
reasonable assurance about whether the financial statements are free of material misstatement. An
audit includes examining, on a test basis, evidence supporting the amounts and disclosures in the
financial statements. An audit also includes assessing the accounting principles used and
significant estimates made by management, as well as evaluating the overall financial statement
presentation. We believe that our audits provide a reasonable basis for our opinion.
In our opinion, the consolidated financial statements referred to above present fairly, in all
material respects, the financial position of Reliance Bancshares, Inc. and subsidiaries as of
December 31, 2010 and 2009, and the results of their operations and their cash flows for each of
the years in the three-year period ended December 31, 2010, in conformity with accounting
principles generally accepted in the United States of America.

March 28, 2011
St. Louis, Missouri
F-2
Table of Contents
RELIANCE BANCSHARES, INC. AND SUBSIDIARIES
Consolidated Balance Sheets
December 31, 2010 and 2009
| 2010 | 2009 | |||||||
ASSETS |
||||||||
Cash and due from banks (note 2) |
$ | 8,363,767 | 11,928,668 | |||||
Interest-earning deposits in other financial institutions |
18,800,037 | 15,767,862 | ||||||
Investments in available-for-sale debt securities,
at fair value (note 3) |
241,599,461 | 284,119,556 | ||||||
Loans (notes 4 and 9) |
970,261,366 | 1,140,303,875 | ||||||
Less — Deferred loan costs (fees) |
27,608 | (84,741 | ) | |||||
Reserve for possible loan losses |
(37,301,075 | ) | (32,221,569 | ) | ||||
Net loans |
932,987,899 | 1,107,997,565 | ||||||
Residential mortgage loans held for sale |
1,838,800 | 577,400 | ||||||
Premises and equipment, net (note 5) |
35,777,675 | 42,210,536 | ||||||
Accrued interest receivable |
3,448,850 | 5,647,887 | ||||||
Other real estate owned |
30,850,543 | 29,085,943 | ||||||
Identifiable intangible assets, net of accumulated amortization of $123,517
and $107,229 at December 31, 2010 and 2009, respectively |
120,802 | 137,090 | ||||||
Goodwill |
1,149,192 | 1,149,192 | ||||||
Other assets (note 7) |
21,088,238 | 38,085,885 | ||||||
| $ | 1,296,025,264 | 1,536,707,584 | ||||||
LIABILITIES AND STOCKHOLDERS’ EQUITY |
||||||||
Deposits (note 6): |
||||||||
Noninterest-bearing |
$ | 61,288,020 | 71,829,581 | |||||
Interest-bearing |
1,018,871,196 | 1,194,230,616 | ||||||
Total deposits |
1,080,159,216 | 1,266,060,197 | ||||||
Short-term borrowings (note 8) |
15,177,855 | 12,696,932 | ||||||
Long-term Federal Home Loan Bank borrowings (note 9) |
93,000,000 | 104,000,000 | ||||||
Accrued interest payable |
1,320,358 | 2,194,952 | ||||||
Other liabilities |
2,121,185 | 2,086,079 | ||||||
Total liabilities |
1,191,778,614 | 1,387,038,160 | ||||||
Commitments and contingencies (notes 13 and 14) |
||||||||
Stockholders’ equity (notes 11, 12, and 15): |
||||||||
Preferred stock, no par value; 2,000,000 shares authorized |
||||||||
Series A, 40,000 shares issued and outstanding |
40,000,000 | 40,000,000 | ||||||
Series B, 2,000 shares issued and outstanding |
2,000,000 | 2,000,000 | ||||||
Series C, 555 and 300 shares issued and outstanding at
December 31, 2010 and 2009, respectively |
555,000 | 300,000 | ||||||
Common stock, $0.25 par value; 40,000,000 shares authorized,
22,481,804 and 20,972,091 shares issued and outstanding at
December 31, 2010 and 2009, respectively |
5,620,451 | 5,243,023 | ||||||
Surplus |
124,366,338 | 122,334,757 | ||||||
Accumulated deficit |
(68,324,885 | ) | (19,796,396 | ) | ||||
Accumulated other comprehensive income — net unrealized holding
gains (losses) on available-for-sale debt securities |
29,746 | (411,960 | ) | |||||
Total stockholders’ equity |
104,246,650 | 149,669,424 | ||||||
| $ | 1,296,025,264 | 1,536,707,584 | ||||||
See accompanying notes to consolidated financial statements.
F-3
Table of Contents
RELIANCE BANCSHARES, INC. AND SUBSIDIARIES
Consolidated Statements of Operations
Years ended December 31, 2010, 2009, and 2008
| 2010 | 2009 | 2008 | ||||||||||
Interest income: |
||||||||||||
Interest and fees on loans (note 4) |
$ | 56,688,769 | 67,573,570 | 70,293,695 | ||||||||
Interest on residential mortgage loans held for sale |
63,488 | 55,174 | 42,773 | |||||||||
Interest on debt securities: |
||||||||||||
Taxable |
6,265,165 | 7,638,510 | 6,159,384 | |||||||||
Exempt from federal income taxes |
1,082,769 | 1,272,637 | 1,524,562 | |||||||||
Interest on interest-earning deposits in other financial
institutions |
45,532 | 49,305 | 188,793 | |||||||||
Total interest income |
64,145,723 | 76,589,196 | 78,209,207 | |||||||||
Interest expense: |
||||||||||||
Interest on deposits (note 6) |
19,745,332 | 33,601,012 | 34,650,719 | |||||||||
Interest on short-term borrowings (note 8) |
120,260 | 356,258 | 2,290,008 | |||||||||
Interest on long-term Federal Home Loan Bank
borrowings (note 9) |
3,770,894 | 5,047,542 | 4,774,541 | |||||||||
Total interest expense |
23,636,486 | 39,004,812 | 41,715,268 | |||||||||
Net interest income |
40,509,237 | 37,584,384 | 36,493,939 | |||||||||
Provision for possible loan losses (note 4) |
41,491,947 | 53,450,000 | 11,148,000 | |||||||||
Net interest income after provision for
possible loan losses |
(982,710 | ) | (15,865,616 | ) | 25,345,939 | |||||||
Noninterest income: |
||||||||||||
Service charges on deposit accounts |
910,297 | 975,664 | 796,653 | |||||||||
Net gains on sales of debt securities (note 3) |
287,509 | 1,346,565 | 321,113 | |||||||||
Other noninterest income (note 5) |
2,308,822 | 1,602,853 | 1,564,769 | |||||||||
Total noninterest income |
3,506,628 | 3,925,082 | 2,682,535 | |||||||||
Noninterest expense: |
||||||||||||
Other-than-temporary impairment losses on available-for-sale
debt securities: |
||||||||||||
Total other-than-temporary impairment losses |
1,628,201 | 1,078,763 | — | |||||||||
Less portion of other-than-temporary impairment losses
recognized in other comprehensive income |
(1,050,280 | ) | (737,806 | ) | — | |||||||
Net impairment loss realized |
577,921 | 340,957 | — | |||||||||
Salaries and employee benefits (notes 10 and 11) |
13,601,820 | 13,867,628 | 15,915,090 | |||||||||
Other real estate expense |
13,147,525 | 6,163,313 | 1,582,598 | |||||||||
Occupancy and equipment expense (note 5) |
4,215,238 | 4,256,769 | 4,503,125 | |||||||||
FDIC assessment |
2,859,649 | 2,745,432 | 912,093 | |||||||||
Data processing |
1,662,425 | 1,950,227 | 1,880,968 | |||||||||
Professional fees |
930,202 | 478,702 | 565,900 | |||||||||
Amortization of intangible assets |
16,288 | 16,288 | 16,288 | |||||||||
Other noninterest expenses |
2,729,666 | 4,227,073 | 4,051,528 | |||||||||
Total noninterest expense |
39,740,734 | 34,046,389 | 29,427,590 | |||||||||
Loss before applicable income taxes |
(37,216,816 | ) | (45,986,923 | ) | (1,399,116 | ) | ||||||
Applicable income tax expense (benefit) (note 7) |
11,311,673 | (16,629,562 | ) | (1,079,886 | ) | |||||||
Net loss |
$ | (48,528,489 | ) | (29,357,361 | ) | (319,230 | ) | |||||
Net loss |
$ | (48,528,489 | ) | (29,357,361 | ) | (319,230 | ) | |||||
Preferred stock dividends |
(2,208,458 | ) | (1,647,111 | ) | — | |||||||
Net loss attributable to common shareholders |
$ | (50,736,947 | ) | (31,004,472 | ) | (319,230 | ) | |||||
Per share amounts: |
||||||||||||
Basic loss per share |
$ | (2.32 | ) | (1.49 | ) | (0.02 | ) | |||||
Basic weighted average shares outstanding |
21,867,606 | 20,864,483 | 20,669,512 | |||||||||
Diluted loss per share |
$ | (2.32 | ) | (1.49 | ) | (0.02 | ) | |||||
Diluted weighted average shares outstanding |
21,867,606 | 20,881,108 | 21,063,065 | |||||||||
See accompanying notes to consolidated financial statements.
F-4
Table of Contents
RELIANCE BANCSHARES, INC. AND SUBSIDIARIES
Consolidated Statements of Comprehensive Loss
Years ended December 31, 2010, 2009, and 2008
| 2010 | 2009 | 2008 | ||||||||||
Net loss |
$ | (48,528,489 | ) | (29,357,361 | ) | (319,230 | ) | |||||
Other comprehensive income (loss) before tax: |
||||||||||||
Change in unrealized gains (losses) on available-for-sale
securities for which a portion of an other-than-temporary
impairment loss has been recognized in earnings, net of
reclassification |
(281,772 | ) | (68,176 | ) | — | |||||||
Change in unrealized gains (losses) on other available-for-sale
securities, net of reclassification |
660,611 | 608,583 | (457,010 | ) | ||||||||
Reclassification adjustment for: |
||||||||||||
Available-for-sale security gains included in net loss |
(287,509 | ) | (1,346,565 | ) | (321,113 | ) | ||||||
Write-down of investment securities included in net loss |
577,921 | 340,957 | — | |||||||||
Other comprehensive income (loss) before tax |
669,251 | (465,201 | ) | (778,123 | ) | |||||||
Income tax related to items of other comprehensive income (loss) |
227,545 | (158,171 | ) | (264,562 | ) | |||||||
Other comprehensive income (loss), net of tax |
441,706 | (307,030 | ) | (513,561 | ) | |||||||
Total comprehensive loss |
$ | (48,086,783 | ) | (29,664,391 | ) | (832,791 | ) | |||||
See accompanying notes to consolidated financial statements.
F-5
Table of Contents
RELIANCE BANCSHARES, INC. AND SUBSIDIARIES
Consolidated Statements of Stockholders’ Equity
Years ended December 31, 2010, 2009, and 2008
| Accumulated | ||||||||||||||||||||||||||||
| other | Total | |||||||||||||||||||||||||||
| Preferred | Common | Accumulated | Treasury | comprehensive | stockholders’ | |||||||||||||||||||||||
| stock | stock | Surplus | deficit | stock | income | equity | ||||||||||||||||||||||
Balance at December 31, 2007 |
$ | — | 5,170,519 | 123,329,517 | 10,982,306 | — | 408,631 | 139,890,973 | ||||||||||||||||||||
Net loss |
— | — | — | (319,230 | ) | — | — | (319,230 | ) | |||||||||||||||||||
Other activity (note 11) |
— | 22,177 | 863,801 | — | (335,280 | ) | — | 550,698 | ||||||||||||||||||||
Change in valuation of
available-for-sale securities,
net of related tax effect |
— | — | — | — | — | (513,561 | ) | (513,561 | ) | |||||||||||||||||||
Balance at December 31, 2008 |
— | 5,192,696 | 124,193,318 | 10,663,076 | (335,280 | ) | (104,930 | ) | 139,608,880 | |||||||||||||||||||
Net loss |
— | — | — | (29,357,361 | ) | — | — | (29,357,361 | ) | |||||||||||||||||||
Other activity (note 11) |
42,300,000 | 50,327 | (1,858,561 | ) | (1,102,111 | ) | 335,280 | — | 39,724,935 | |||||||||||||||||||
Change in valuation of
available-for-sale securities,
net of related tax effect |
— | — | — | — | — | (307,030 | ) | (307,030 | ) | |||||||||||||||||||
Balance at December 31, 2009 |
42,300,000 | 5,243,023 | 122,334,757 | (19,796,396 | ) | — | (411,960 | ) | 149,669,424 | |||||||||||||||||||
Net loss |
— | — | — | (48,528,489 | ) | — | — | (48,528,489 | ) | |||||||||||||||||||
Other activity (note 11) |
255,000 | 377,428 | 2,031,581 | — | — | — | 2,664,009 | |||||||||||||||||||||
Change in valuation of
available-for-sale securities,
net of related tax effect |
— | — | — | — | — | 441,706 | 441,706 | |||||||||||||||||||||
Balance at December 31, 2010 |
$ | 42,555,000 | 5,620,451 | 124,366,338 | (68,324,885 | ) | — | 29,746 | 104,246,650 | |||||||||||||||||||
See accompanying notes to consolidated financial statements.
F-6
Table of Contents
RELIANCE BANCSHARES, INC. AND SUBSIDIARIES
Consolidated Statements of Cash Flows
Years ended December 31, 2010, 2009, and 2008
| 2010 | 2009 | 2008 | ||||||||||
Cash flows from operating activities: |
||||||||||||
Net loss |
$ | (48,528,489 | ) | (29,357,361 | ) | (319,230 | ) | |||||
Adjustments to reconcile net loss to net cash provided by
operating activities: |
||||||||||||
Depreciation and amortization |
3,656,355 | 4,536,948 | 2,255,316 | |||||||||
Provision for possible loan losses |
41,491,947 | 53,450,000 | 11,148,000 | |||||||||
Capitalized interest expense on construction |
— | — | (85,984 | ) | ||||||||
Deferred income tax expense (benefit) |
11,311,673 | (14,835,657 | ) | (2,478,369 | ) | |||||||
Gain on sales of Small Business Administration loans |
(244,369 | ) | — | — | ||||||||
Net (gains) losses on sales and write-downs of debt securities |
290,412 | (1,005,608 | ) | (321,113 | ) | |||||||
Net gains on sales of premises and equipment |
— | (6,877 | ) | — | ||||||||
Net losses on sales and write-down of other real estate owned |
10,902,221 | 4,818,900 | 611,916 | |||||||||
Stock option compensation cost |
215,465 | 504,553 | 560,895 | |||||||||
Common stock awarded to directors |
— | — | 13,352 | |||||||||
Amortization of restricted stock expense |
91,489 | 50,959 | 191,786 | |||||||||
Mortgage loans originated for sale in the secondary market |
(34,952,072 | ) | (41,504,633 | ) | (22,985,716 | ) | ||||||
Mortgage loans sold in secondary market |
33,690,672 | 42,410,733 | 21,713,466 | |||||||||
Decrease (increase) in accrued interest receivable |
2,199,037 | (223,779 | ) | (464,479 | ) | |||||||
Increase (decrease) in accrued interest payable |
(874,594 | ) | (1,709,989 | ) | 248,828 | |||||||
Other operating activities, net |
5,493,536 | (7,504,840 | ) | 1,813,057 | ||||||||
Net cash provided by operating activities |
24,743,283 | 9,623,349 | 11,901,725 | |||||||||
Cash flows from investing activities: |
||||||||||||
Purchase of available-for-sale debt securities |
(172,940,988 | ) | (312,966,915 | ) | (129,466,958 | ) | ||||||
Proceeds from principal payments, maturities and calls
of available-for-sale debt securities |
193,429,504 | 164,919,620 | 54,582,323 | |||||||||
Proceeds from sales of available-for-sale debt securities |
20,848,467 | 56,075,085 | 35,428,956 | |||||||||
Net decrease (increase) in loans |
115,597,941 | 54,030,361 | (359,600,366 | ) | ||||||||
Proceeds from sales of other real estate owned |
5,933,587 | 4,627,290 | 691,040 | |||||||||
Construction expenditures to finish other real estate owned |
— | (13,786 | ) | (67,828 | ) | |||||||
Proceeds from sales of Small Business Administration loans |
4,011,598 | — | — | |||||||||
Proceeds from sales of premises and equipment |
5,973 | 44,357 | 107,134 | |||||||||
Purchases of premises and equipment |
(99,088 | ) | (343,805 | ) | (5,813,127 | ) | ||||||
Net cash provided by (used in) investing activities |
166,786,994 | (33,627,793 | ) | (404,138,826 | ) | |||||||
Cash flows from financing activities: |
||||||||||||
Net increase (decrease) in deposits |
(185,900,981 | ) | 38,012,898 | 393,470,850 | ||||||||
Net increase (decrease) in short-term borrowings |
2,480,923 | (51,221,912 | ) | (24,406,071 | ) | |||||||
Proceeds from long-term Federal Home Loan Bank borrowings |
— | — | 93,000,000 | |||||||||
Payments of long-term Federal Home Loan Bank borrowings |
(11,000,000 | ) | (32,000,000 | ) | (25,000,000 | ) | ||||||
Issuance of common stock |
4,338,167 | 121,571 | — | |||||||||
Issuance of preferred stock |
255,000 | 40,300,000 | — | |||||||||
Dividends on preferred stock |
(2,208,458 | ) | (1,647,111 | ) | — | |||||||
Purchases of treasury stock |
— | (40,000 | ) | (1,305,000 | ) | |||||||
Proceeds from sale of treasury stock |
— | 53,825 | 143,462 | |||||||||
Stock options exercised |
— | 403,000 | 789,385 | |||||||||
Payment of stock issuance costs |
(27,654 | ) | (27,262 | ) | — | |||||||
Net cash provided by (used in) financing activities |
(192,063,003 | ) | (6,044,991 | ) | 436,692,626 | |||||||
Net increase (decrease) in cash and cash equivalents |
(532,726 | ) | (30,049,435 | ) | 44,455,525 | |||||||
Cash and cash equivalents at beginning of year |
27,696,530 | 57,745,965 | 13,290,440 | |||||||||
Cash and cash equivalents at end of year |
$ | 27,163,804 | 27,696,530 | 57,745,965 | ||||||||
See accompanying notes to consolidated financial statements.
F-7
Table of Contents
RELIANCE BANCSHARES, INC. AND SUBSIDIARIES
Notes to Consolidated Financial Statements
December 31, 2010, 2009, and 2008
NOTE 1 — SUMMARY OF SIGNIFICANT ACCOUNTING POLICIES
Reliance Bancshares, Inc. (the Company) provides a full range of banking services to individual and
corporate customers throughout the St. Louis metropolitan area in Missouri and Illinois and
southwestern Florida through its wholly owned subsidiaries, Reliance Bank and Reliance Bank, FSB
(hereinafter referred to as “the Banks”). The Company also has loan production offices in Houston,
Texas and Phoenix, Arizona.
The Company and Banks are subject to competition from other financial and nonfinancial institutions
providing financial products throughout the St. Louis metropolitan area and southwestern Florida.
Additionally, the Company and Banks are subject to the regulations of certain federal and state
agencies and undergo periodic examinations by those regulatory agencies.
The accounting and reporting policies of the Company and Banks conform to generally accepted
accounting principles within the banking industry. In compiling the consolidated financial
statements, management is required to make estimates and assumptions that affect the reported
amounts of assets and liabilities and disclosure of contingent assets and liabilities at the date
of the financial statements, and the reported amounts of revenues and expenses during the reporting
period. Estimates that are particularly susceptible to change in a short period of time include
the determination of the reserve for possible loan losses, valuations of other real estate owned,
stock options and deferred tax assets, determination of possible impairment of intangible assets
and long-lived fixed assets, and other-than-temporary impairment of investments in debt securities.
Actual results could differ from those estimates.
Following is a description of the more significant accounting policies of the Company and Banks.
Principles of Consolidation
The consolidated financial statements include the accounts of the Company and Banks. All
significant intercompany accounts and transactions have been eliminated in consolidation.
Basis of Accounting
The Company and Banks utilize the accrual basis of accounting, which includes in the total of net
income all revenues earned and expenses incurred, regardless of when actual cash payments are
received or paid. The Company is also required to report comprehensive income, of which net income
is a component. Comprehensive income is defined as the change in equity (net assets) of a business
enterprise during a period from transactions and other events and circumstances from nonowner
sources, including all changes in equity during a period, except those resulting from investments
by, and distributions to, owners and cumulative effects of accounting changes and tax benefits
recorded directly to retained earnings.
Cash Flow Information
For purposes of the consolidated statements of cash flows, cash equivalents include amounts due
from banks and interest-earning deposits in other financial institutions (all of which are payable
on demand). Certain balances maintained in other financial institutions are fully insured by the
Federal Deposit Insurance Corporation (“FDIC”) under the Federal Deposit Insurance Act through
F-8
Table of Contents
RELIANCE BANCSHARES, INC. AND SUBSIDIARIES
Notes to Consolidated Financial Statements
December 31, 2012. After this period, these balances would generally exceed the level of deposits
insured by the FDIC.
Following is certain supplemental information relating to the Company’s consolidated statements of
cash flows for the years ended December 31, 2010, 2009, and 2008:
| 2010 | 2009 | 2008 | ||||||||||
Cash paid for: |
||||||||||||
Interest |
$ | 24,511,080 | 40,714,801 | 41,552,424 | ||||||||
Income taxes (refund) |
(1,951,677 | ) | 963,278 | 399,312 | ||||||||
Noncash transactions: |
||||||||||||
Transfers to other real estate owned in settlement of loans |
15,855,798 | 25,013,222 | 12,192,805 | |||||||||
Transfer of bank premises to other real estate owned |
4,447,859 | — | — | |||||||||
Loans made to facilitate the sale of other real estate owned |
1,703,249 | 1,784,045 | 605,794 | |||||||||
Tax benefit from sale of stock options exercised |
— | 5,400 | 131,809 | |||||||||
Warrants exercised and issuance of Series B preferred stock |
— | 2,000,000 | — | |||||||||
Stock issued for operating lease payments |
— | — | 25,009 | |||||||||
Investments in Debt Securities
The Banks classify their debt securities into one of three categories at the time of purchase:
trading, available-for-sale, or held-to-maturity. Trading securities are bought and held
principally for the purpose of selling them in the near-term. Held-to-maturity securities are
those debt securities which the Banks have the ability and intent to hold until maturity. All
other debt securities not included in trading or held-to-maturity, and any equity securities, are
classified as available-for-sale.
Trading and available-for-sale securities are recorded at fair value. Held-to-maturity securities
(for which no securities were so designated at December 31, 2010 and 2009) would be recorded at
amortized cost, adjusted for the amortization of premiums or accretion of discounts. Holding gains
and losses on trading securities (for which no securities were so designated at December 31, 2010
and 2009) would be included in earnings. Unrealized holding gains and losses, net of the related
tax effect, on available-for-sale securities are excluded from earnings and reported as a component
of other comprehensive income in stockholders’ equity until realized. Transfers of securities
between categories would be recorded at fair value at the date of transfer. Unrealized holding
gains and losses would be recognized in earnings for transfers into the trading category.
Mortgage-backed securities represent participating interests in pools of long-term first mortgage
loans originated and serviced by the issuers of the securities. Amortization of premiums and
accretion of discounts for mortgage-backed securities are recognized as interest income using the
interest method, which considers the timing and amount of prepayments of the underlying mortgages
in estimating future cash flows for individual mortgage-backed securities. For other debt
securities in the available-for-sale and held-to-maturity categories, premiums and discounts are
amortized or accreted over the lives of the respective securities, with consideration of historical
and estimated prepayment rates, as an adjustment to yield using the interest method. Interest
income is recognized when earned. Realized gains and losses from the sale of any securities
classified as available-for-sale are included in earnings and are derived using the specific
identification method for determining the cost of securities sold.
Declines in the fair value of securities below their cost that are deemed to be
other-than-temporary are reflected in operations as realized losses. In estimating
other-than-temporary impairment
F-9
Table of Contents
RELIANCE BANCSHARES, INC. AND SUBSIDIARIES
Notes to Consolidated Financial Statements
losses, management systematically evaluates investment securities for other-than-temporary declines
in fair value on a quarterly basis. The analysis requires management to consider various factors,
which include (1) the present value of the cash flows expected to be collected compared to the
amortized cost of the security; (2) duration and magnitude of the decline in value; (3) the
financial condition of the issuer or issuers; (4) structure of the security; and (5) the intent to
sell the security or whether it is more likely than not that the Company would be required to sell
the security before its anticipated recovery in market value.
If the fair value of a debt security is less than its amortized cost basis at the balance sheet
date, the Company assesses whether the impairment is other-than-temporary. If the Company intends
to sell the debt security, an other-than-temporary impairment shall be considered to have occurred.
If the Company does not intend to sell the debt security, the Company considers available evidence
to assess whether it more likely than not it will be required to sell the security before the
recovery of its amortized cost basis. If the Company more likely than not will be required to sell
the security before recovery of its amortized cost basis, an other-than-temporary impairment shall
be considered to have occurred.
If the Company does not expect to recover the entire amortized cost basis of the security, an
other-than-temporary impairment shall be considered to have occurred. Similarly, if the present
value of cash flows expected to be collected is less than the amortized cost basis of the security,
the entire amortized cost basis of the security will not be recovered (i.e., a credit loss exists),
and an other-than-temporary impairment shall be considered to have occurred. In such situations,
the credit loss is recorded through earnings as an other-than-temporary impairment.
Loans
Interest on loans is credited to income based on the principal amount outstanding. Loans are
considered delinquent whenever interest and/or principal payments have not been received when due.
The recognition of interest income is discontinued when, in management’s judgment, the interest
will not be collectible in the normal course of business. Subsequent payments received on such
loans are applied to principal if any doubt exists as to the collectability of such principal;
otherwise, such receipts are recorded as interest income. Loans are returned to accrual status
when management believes full collectability of principal and interest is expected. The Banks
consider a loan impaired when all amounts due — both principal and interest — will not be
collected in accordance with the contractual terms of the loan agreement. Factors considered by
management in determining impairment include payment status, collateral value, and the probability
of collecting scheduled principal and interest payments when due. Loans that experience
insignificant payment delays and payment shortfalls generally are not classified as impaired.
Management determines the significance of payment delays and payment shortfalls on a case-by-case
basis, taking into consideration all of the circumstances surrounding the loan and the borrower,
including the length of the delay, the reasons for the delay, the borrower’s prior payment
record, and the amount of the shortfall in relation to the principal and interest owed. When
measuring impairment for loans, the expected future cash flows of an impaired loan are discounted
at the loan’s effective interest rate. Alternatively, impairment is measured by reference to an
observable market price, if one exists, or the fair value of the collateral for a
collateral-dependent loan; however, the Banks would measure impairment based on the fair value of
the collateral, using observable market prices, if foreclosure was probable.
F-10
Table of Contents
RELIANCE BANCSHARES, INC. AND SUBSIDIARIES
Notes to Consolidated Financial Statements
Loan origination fees and certain direct loan origination costs are deferred and recognized as an
adjustment to interest income over the lives of the related loans using the interest method.
The reserve for loan losses is available to absorb loan charge-offs. The reserve is increased by
provisions charged to operations and is reduced by loan charge-offs less recoveries. Loans are
partially or fully charged off when Bank management believes such amounts are uncollectible, either
through collateral liquidation or cash payment. The provision charged to operations each year is
that amount which management believes is sufficient to bring the balance of the reserve to a level
adequate to absorb estimated losses inherent in the loan portfolio, based on their knowledge and
evaluation of past losses, the current loan portfolio, and the current economic environment in
which the borrowers of the Banks operate.
Management believes the reserve for loan losses is adequate to absorb losses in the loan portfolio
based upon information available. While management uses available information to recognize losses
on loans, future additions to the reserve may be necessary based on changes in economic conditions.
Additionally, various regulatory agencies, as an integral part of the examination process,
periodically review the Banks’ reserves for loan losses. Such agencies may require the Banks to
add to their reserves for loan losses based on their judgments and interpretations about
information available to them at the time of their examinations.
Premises and Equipment
Premises and equipment are stated at cost, less accumulated depreciation. Depreciation of premises
and equipment is computed over the expected lives of the assets, using the straight-line method.
Estimated useful lives are 40 years for bank buildings and three to ten years for furniture,
fixtures, and equipment. Expenditures for major renewals and improvements of bank premises and
equipment (including related interest expense, which was $85,984, for the year ended December 31,
2008) are capitalized, and those for maintenance and repairs are expensed as incurred.
Certain long-lived assets, such as premises and equipment, and certain identifiable intangible
assets must be reviewed for impairment whenever events or changes in circumstances indicate that
the carrying amounts of the assets may not be recoverable. In such situations, recoverability of
assets to be held and used is measured by a comparison of the carrying amount of the asset to
future net cash flows expected to be generated by the asset. If such assets are considered to be
impaired, the impairment to be recognized is measured by the amount by which the carrying amount of
the assets exceeds the fair value of the assets, using observable market prices. Assets to be
disposed of would be reported at the lower of the carrying amount or estimated fair value, less
estimated selling costs.
Other Real Estate Owned
Other real estate owned represents property acquired through foreclosure, or deeded to the Banks in
lieu of foreclosure, for loans on which borrowers have defaulted as to payment of principal and
interest. Properties acquired are initially recorded at the lower of the Banks’ carrying amount of
the related loan or fair value, using observable market prices, less estimated selling costs.
Valuations are performed periodically by management, and an allowance for losses is established by
means of a charge to noninterest expense if the carrying value of a property exceeds its fair
value, using observable market prices, less estimated selling costs. Subsequent increases in the
F-11
Table of Contents
RELIANCE BANCSHARES, INC. AND SUBSIDIARIES
Notes to Consolidated Financial Statements
fair value (less estimated selling costs) are recorded through a reversal of the allowance, but not
below zero. Costs related to development and improvement of property are capitalized, while costs
relating to holding the property are expensed.
Intangible Assets
Identifiable intangible assets include the core deposit premium relating to the Company’s
acquisition of The Bank of Godfrey in 2003, which is being amortized into noninterest expense on a
straight-line basis over 15 years. Amortization of the core deposit intangible assets existing at
December 31, 2010 will be $16,288 for each of the next five years, and $39,362 thereafter.
The excess of the Company’s consideration given in its acquisition of The Bank of Godfrey over the
fair value of the net assets acquired is recorded as goodwill, an intangible asset on the
consolidated balance sheets. Goodwill is the Company’s only intangible asset with an indefinite
useful life, and the Company is required to test the intangible asset for impairment on an annual
basis. Impairment is measured as the excess of carrying value over the fair value of an intangible
asset with an indefinite life. No impairment writedown was required in 2010, 2009, or 2008.
Federal Home Loan Bank Stock
Included in other assets at December 31, 2010 and 2009 are equity securities totaling $6,256,000
and $7,221,300, respectively, representing common stock of the Federal Home Loan Bank of Des Moines
and the Federal Home Loan Bank of Atlanta, which are administered by the Federal Housing Finance
Agency. As members of the Federal Home Loan Bank system, the Banks must maintain minimum
investments in the capital stock of their respective district Federal Home Loan Banks. The stock
is recorded at cost, which represents redemption value.
Securities Sold Under Agreements to Repurchase
The Banks enter into sales of securities under agreements to repurchase at specified future dates.
Such repurchase agreements are considered financing arrangements and, accordingly, the obligation
to repurchase assets sold is reflected as a short-term borrowing liability in the consolidated
balance sheets. Repurchase agreements are collateralized by debt securities which are under the
control of the Banks.
Reserve for Unfunded Commitments
A reserve for unfunded commitments is maintained at a level believed by management to be sufficient
to absorb estimated probable losses related to unfunded credit facilities (including unfunded loan
commitments and letters of credit) and is included in other liabilities in the consolidated balance
sheets. The determination of the appropriate level of the reserve is based upon an evaluation of
the unfunded credit facilities, including an assessment of historical
commitment utilization experience and credit risk grading. Net adjustments to the reserve for
unfunded commitments are included in other noninterest expense in the consolidated statements of
operations.
F-12
Table of Contents
RELIANCE BANCSHARES, INC. AND SUBSIDIARIES
Notes to Consolidated Financial Statements
Income Taxes
The Company and Banks file consolidated federal and state income tax returns. Applicable income
tax expense is computed based on reported income and expenses, adjusted for permanent differences
between reported and taxable income. Penalties and interest assessed by income taxing authorities
are included in income tax expense in the year assessed, unless such amounts relate to an uncertain
tax position. The Company had no uncertain tax positions at December 31, 2010 or 2009.
The Company and Banks use the asset and liability method of accounting for income taxes, in which
deferred tax assets and liabilities are recognized for the estimated future tax consequences
attributable to differences between the financial statement carrying amounts of existing assets and
liabilities and their respective tax bases. Deferred tax assets and liabilities are measured using
enacted tax rates in effect for the year in which those temporary differences are expected to be
recovered or settled. The effect on deferred tax assets and liabilities of a change in tax rates
is recognized in the period which includes the enactment date.
The Company’s consolidated federal income tax returns for the years ended December 31, 2009 and
2008 are presently being audited by the Internal Revenue Service. The Company’s consolidated
Illinois state income tax returns for the years ended December 31, 2009 and 2008 were audited by
the state of Illinois, with no material differences noted. The Company’s other state income tax
returns have never been examined by the applicable state taxing authorities. The Company’s federal
and state income tax returns are subject to examination generally for three years after such
returns are filed.
Mortgage Banking Operations
The Banks’ mortgage banking operations include the origination of long-term, fixed rate residential
mortgage loans for sale in the secondary market. Upon receipt of an application for a residential
real estate loan, the Banks generally lock in an interest rate with the applicable investor and, at
the same time, lock into an interest rate with the customer. This practice minimizes the Banks’
exposure to risk resulting from interest rate fluctuations. Upon disbursement of the loan proceeds
to the customer, the loan is delivered to the applicable investor. Sales proceeds are generally
received within two to seven days later. Therefore, no loans held for sale are included in the
Banks’ loan portfolios at any point in time, except those loans for which the sale proceeds have
not yet been received. Such loans are maintained at the lower of cost or market value, based on
the outstanding commitment from the applicable investors for such loans.
Loan origination fees are recognized upon the sale of the related loans and included in the
consolidated statements of operations as other noninterest income. The Banks do not retain the
servicing rights for any such loans sold in the secondary market.
Stock Issuance Costs
The Company incurs certain costs associated with the issuance of its common and preferred stock.
Such costs are recorded as a reduction of equity capital.
F-13
Table of Contents
RELIANCE BANCSHARES, INC. AND SUBSIDIARIES
Notes to Consolidated Financial Statements
Earnings per Share
Basic earnings (loss) per share data is calculated by dividing net earnings (loss) attributable to
common shareholders by the weighted average number of common shares outstanding during the period.
Diluted earnings (loss) per share reflects the potential dilution of earnings (loss) per share
which could occur under the treasury stock method if contracts to issue common stock, such as stock
options, were exercised. The following table presents a summary of per share data and amounts for
the periods indicated.
| Years ended December 31, | ||||||||||||
| 2010 | 2009 | 2008 | ||||||||||
Basic |
||||||||||||
Net loss attributable to common shareholders |
$ | (50,736,947 | ) | (31,004,472 | ) | (319,230 | ) | |||||
Weighted average common shares outstanding |
21,867,606 | 20,864,483 | 20,669,512 | |||||||||
Basic loss per share |
$ | (2.32 | ) | (1.49 | ) | (0.02 | ) | |||||
Diluted |
||||||||||||
Net loss attributable to common shareholders |
$ | (50,736,947 | ) | (31,004,472 | ) | (319,230 | ) | |||||
Weighted average common shares outstanding |
21,867,606 | 20,864,483 | 20,669,512 | |||||||||
Effect of average dilutive stock options |
— | 16,625 | 393,553 | |||||||||
Diluted weighted average common shares outstanding |
21,867,606 | 20,881,108 | 21,063,065 | |||||||||
Diluted loss per share |
$ | (2.32 | ) | (1.49 | ) | (0.02 | ) | |||||
As of December 31, 2010, 2009 and 2008, options to purchase 1,969,916, 2,091,266, and
1,593,450 shares, respectively, were excluded from the earnings per share calculation because their
effect was anti-dilutive.
Stock Options
Compensation costs relating to share-based payment transactions are recognized in the Company’s
consolidated financial statements over the period of service to which such compensation relates
(generally the vesting period), and are measured based on the fair value of the equity instruments
issued. The grant date values of share options are estimated using option-pricing models adjusted
for the unique characteristics of those instruments (unless observable market prices for the same
or similar instruments are available). If an equity award is modified after the grant date,
incremental compensation cost would be recognized in an amount equal to the excess of the fair
value of the modified award over the fair value of the original award immediately before the
modification.
No stock options were granted in 2010. The weighted average fair value of options granted in 2008
was $1.89 for an option to purchase one share of Company common stock; however, the Company’s
common stock is not actively traded on any exchange. Accordingly, the availability of fair value
information for the Company’s common stock is limited. In using the Black-Scholes option pricing
model to value the options, several assumptions have been made in arriving at the
estimated fair value of the options granted, including minimal or no volatility in the Company’s
common stock price, expected forfeitures of 10%, no dividends paid on the common stock, an expected
weighted average option life of six years, and a risk-free interest rate approximating the U.S.
treasury rates for the applicable duration period. Any change in these assumptions could have a
significant impact on the effects of determining compensation costs. No value was ascribed
F-14
Table of Contents
RELIANCE BANCSHARES, INC. AND SUBSIDIARIES
Notes to Consolidated Financial Statements
to the options granted in 2009, as the option price exceeded the market value of the stock on the
grant date.
Financial Instruments
For purposes of information included in note 14 regarding disclosures about financial instruments,
financial instruments are defined as cash, evidence of an ownership interest in an entity, or a
contract that both (a) imposes on one entity a contractual obligation to deliver cash or another
financial instrument to a second entity or to exchange other financial instruments on potentially
unfavorable terms with the second entity, and (b) conveys to that second entity a contractual right
to receive cash or another financial instrument from the first entity or to exchange other
financial instruments on potentially favorable terms with the first entity.
Fair Value Measurements
The Company uses fair value measurements to determine fair value disclosures. Fair value is the
price that would be received to sell an asset or paid to transfer a liability in an orderly
transaction between market participants at the measurement date. In determining fair value, the
Company uses various methods including market, income, and cost approaches. Based on these
approaches, the Company often utilizes certain assumptions that market participants would use in
pricing the asset or liability, including assumptions about risk and/or the risks inherent in the
inputs to the valuation technique. These inputs can be readily observable, market corroborated, or
generally unobservable inputs. The Company utilizes valuation techniques that maximize the use of
observable inputs and minimize the use of unobservable inputs. Financial assets and liabilities
carried at fair value are classified and disclosed in one of the following three categories:
| • | Level 1 — Valuations for assets and liabilities traded in active exchange markets, such as the New York Stock Exchange. Level 1 also includes U.S. treasury and federal agency securities and federal agency mortgage-backed securities, which are traded by dealers or brokers in active markets. Valuations are obtained from readily available pricing sources for market transactions involving identical assets or liabilities. | ||
| • | Level 2 — Valuations for assets and liabilities traded in less active dealer or broker markets. Valuations are obtained from third party pricing services for identical or similar assets or liabilities. | ||
| • | Level 3 — Valuations for assets and liabilities that are derived from other valuation methodologies, including option pricing models, discounted cash flow models and similar techniques, and not based on market exchange, dealer, or value assigned to such assets or liabilities. |
While certain assets are recorded at the lower of cost or fair value (e.g., other real estate
owned, loans held for sale, impaired loans, etc.), the only assets recorded at fair value on a
recurring basis by the Company are investments in available-for-sale debt securities, which are
measured at fair value using Levels 2 and 3 valuation inputs. For all debt securities other than
the trust preferred debt securities described below, the market valuation utilizes several sources,
primarily pricing sources, which include observable inputs rather than “significant unobservable
inputs” and, therefore, fall into the Level 2 category.
F-15
Table of Contents
RELIANCE BANCSHARES, INC. AND SUBSIDIARIES
Notes to Consolidated Financial Statements
The following table summarizes financial instruments measured at fair value on a recurring basis as
of December 31, 2010, segregated by the level of the valuation inputs within the fair value
hierarchy utilized to measure fair value.
| Quoted | ||||||||||||||||
| prices in | ||||||||||||||||
| active | Significant | |||||||||||||||
| markets for | other | Significant | ||||||||||||||
| identical | observable | unobservable | Total | |||||||||||||
| assets | inputs | inputs | fair | |||||||||||||
| (Level 1) | (Level 2) | (Level 3) | value | |||||||||||||
Investments in available-for sale
debt securities: |
||||||||||||||||
Obligations of U.S. government
agencies and corporations |
$ | — | 73,531,650 | — | 73,531,650 | |||||||||||
Obligations of state and
political subdivisions |
— | 20,111,832 | — | 20,111,832 | ||||||||||||
Trust preferred securities |
— | — | 511,289 | 511,289 | ||||||||||||
U.S. agency residential
mortgage-backed securities |
— | 147,444,690 | — | 147,444,690 | ||||||||||||
| $ | — | 241,088,172 | 511,289 | 241,599,461 | ||||||||||||
Included in investments in available-for-sale debt securities are collateralized debt
obligation securities that are backed by trust preferred securities issued by banks, thrifts, and
insurance companies (TRUP CDOs). Given conditions in the debt markets and the absence of
observable transactions in the secondary and new issue markets for TRUP CDOs, the few observable
transactions and market quotations that are available are not reliable for the purpose of
determining fair value, and an income valuation approach technique (present value technique) that
maximizes the use of relevant observable inputs and minimizes the use of unobservable inputs is
more representative of fair value than the market approach valuation techniques. Accordingly, the
TRUP CDOs have been classified within Level 3 of the fair value hierarchy because significant
adjustments are required to determine fair value at the measurement date, particularly regarding
estimated default probabilities based on the credit quality of the specific issuer institutions for
the TRUP CDOs. The TRUP CDOs are the only assets for which fair value is measured on a recurring
basis using Level 3 inputs. Following is further information regarding such assets for the years
ending December 31, 2010, 2009, and 2008:
| 2010 | 2009 | 2008 | ||||||||||
Balance, at fair value, at beginning of year |
$ | 1,237,737 | 1,416,729 | 3,970,077 | ||||||||
Net unrealized gain (loss) arising in period |
(133,506 | ) | 197,129 | (2,282,354 | ) | |||||||
Impairment write-downs recognized |
(577,921 | ) | (340,957 | ) | — | |||||||
Accreted discount |
1,383 | 895 | 678 | |||||||||
Payments in kind |
19,694 | — | — | |||||||||
Principal payments received |
(36,098 | ) | (36,059 | ) | (271,672 | ) | ||||||
Balance, at fair value, at end of year |
$ | 511,289 | 1,237,737 | 1,416,729 | ||||||||
F-16
Table of Contents
RELIANCE BANCSHARES, INC. AND SUBSIDIARIES
Notes to Consolidated Financial Statements
Reclassifications
Certain reclassifications have been made to the 2009 and 2008 consolidated financial statement
amounts to conform to the 2010 presentation. Such reclassifications have no effect on the
previously reported net loss or stockholders’ equity.
Subsequent Events
The Company has considered all events occurring subsequent to December 31, 2010 for possible
disclosures through the filing date of this Annual Report on Form 10-K.
NOTE 2 — CASH AND DUE FROM BANKS
The Banks are required to maintain certain daily reserve balances of cash and due from banks in
accordance with regulatory requirements. The reserve balances maintained in accordance with such
requirements at December 31, 2010 and 2009 were $333,000 and $737,000, respectively.
NOTE 3 — INVESTMENTS IN DEBT SECURITIES
The amortized cost, gross unrealized gains and losses, and estimated fair values of the Banks’
available-for-sale debt securities at December 31, 2010 and 2009 were as follows:
| Gross | Gross | |||||||||||||||
| unreal- | unreal- | Estimated | ||||||||||||||
| Amortized | ized | ized | fair | |||||||||||||
| 2010 | cost | gains | losses | value | ||||||||||||
Obligations of U.S. government
agencies and corporations |
$ | 73,664,373 | 380,259 | (512,982 | ) | 73,531,650 | ||||||||||
Obligations of state and
political subdivisions |
19,637,799 | 474,033 | — | 20,111,832 | ||||||||||||
Trust preferred securities |
3,104,269 | — | (2,592,980 | ) | 511,289 | |||||||||||
U.S. agency residential
mortgage-backed securities |
145,147,951 | 3,406,881 | (1,110,142 | ) | 147,444,690 | |||||||||||
| $ | 241,554,392 | 4,261,173 | (4,216,104 | ) | 241,599,461 | |||||||||||
| Gross | Gross | |||||||||||||||
| unreal- | unreal- | Estimated | ||||||||||||||
| Amortized | ized | ized | fair | |||||||||||||
| 2009 | cost | gains | losses | value | ||||||||||||
Obligations of U.S. government
agencies and corporations |
$ | 116,150,389 | 273,013 | (978,159 | ) | 115,445,243 | ||||||||||
Obligations of state and
political subdivisions |
30,012,602 | 651,846 | (12,863 | ) | 30,651,585 | |||||||||||
Trust preferred securities |
3,697,211 | — | (2,459,474 | ) | 1,237,737 | |||||||||||
U.S. agency residential
mortgage-backed securities |
134,883,536 | 2,430,220 | (528,765 | ) | 136,784,991 | |||||||||||
| $ | 284,743,738 | 3,355,079 | (3,979,261 | ) | 284,119,556 | |||||||||||
The amortized cost and estimated fair values of debt securities classified as
available-for-sale at December 31, 2010, by contractual maturity, are shown below. Expected
maturities may differ
F-17
Table of Contents
RELIANCE BANCSHARES, INC. AND SUBSIDIARIES
Notes to Consolidated Financial Statements
from contractual maturities because certain issuers have the right to call or prepay obligations
with or without prepayment penalties.
| Estimated | ||||||||
| Amortized | fair | |||||||
| cost | value | |||||||
Due one year or less |
$ | 3,190,094 | 3,192,370 | |||||
Due one year through five years |
13,565,623 | 13,803,967 | ||||||
Due five years through ten years |
54,525,948 | 54,847,966 | ||||||
Due after ten years |
25,124,776 | 22,310,468 | ||||||
U.S. agency residential mortgage-backed securities |
145,147,951 | 147,444,690 | ||||||
| $ | 241,554,392 | 241,599,461 | ||||||
Provided below is a summary of available-for sale debt securities which were in an unrealized
loss position at December 31, 2010 and 2009:
| Less than 12 months | 12 months or more | Total | ||||||||||||||||||||||
| Estimated | Unrealized | Estimated | Unrealized | Estimated | Unrealized | |||||||||||||||||||
| 2010 | fair value | losses | fair value | losses | fair value | losses | ||||||||||||||||||
Obligations of U.S.
government agencies
and corporations |
$ | 29,292,591 | (512,982 | ) | — | — | 29,292,591 | (512,982 | ) | |||||||||||||||
Trust preferred securities |
— | — | 511,289 | (2,592,980 | ) | 511,289 | (2,592,980 | ) | ||||||||||||||||
U.S. agency residential
mortgage-backed securities |
41,881,844 | (1,110,142 | ) | — | — | 41,881,844 | (1,110,142 | ) | ||||||||||||||||
| $ | 71,174,435 | (1,623,124 | ) | 511,289 | (2,592,980 | ) | 71,685,724 | (4,216,104 | ) | |||||||||||||||
| Less than 12 months | 12 months or more | Total | ||||||||||||||||||||||
| Estimated | Unrealized | Estimated | Unrealized | Estimated | Unrealized | |||||||||||||||||||
| 2009 | fair value | losses | fair value | losses | fair value | losses | ||||||||||||||||||
Obligations of U.S.
government agencies
and corporations |
$ | 76,621,565 | (978,159 | ) | — | — | 76,621,565 | (978,159 | ) | |||||||||||||||
Obligations of states and
political subdivisions |
3,663,692 | (12,863 | ) | — | — | 3,663,692 | (12,863 | ) | ||||||||||||||||
Trust preferred securities |
— | — | 1,237,737 | (2,459,474 | ) | 1,237,737 | (2,459,474 | ) | ||||||||||||||||
U.S. agency residential
mortgage-backed securities |
53,124,575 | (528,399 | ) | 54,376 | (366 | ) | 53,178,951 | (528,765 | ) | |||||||||||||||
| $ | 133,409,832 | (1,519,421 | ) | 1,292,113 | (2,459,840 | ) | 134,701,945 | (3,979,261 | ) | |||||||||||||||
The obligations of U.S. government agencies and corporations and U.S. agency residential
mortgage-backed securities with unrealized losses are primarily issued from and guaranteed by the
Federal Home Loan Bank, Federal National Mortgage Association, or Federal Home Loan Mortgage
Corporation. The obligations of states and political subdivisions with unrealized losses
are primarily comprised of municipal bonds with adequate credit ratings, underlying collateral,
and/or cash flow projections. The unrealized losses associated with these securities are not
believed to be attributed to credit quality, but rather to changes in interest rates and temporary
market movements. In addition, the Banks do not intend to sell the securities with unrealized
losses, and it is not more likely than not that the Banks will be required to sell them before
recovery of their amortized cost bases, which may be at maturity.
Trust preferred securities are comprised of trust preferred collateralized debt obligations
issued by banks, thrifts and insurance companies. The market for trust preferred securities at
December 31,
F-18
Table of Contents
RELIANCE BANCSHARES, INC. AND SUBSIDIARIES
Notes to Consolidated Financial Statements
2010 and 2009 was not active and markets for similar securities were also not active. The
inactivity was evidenced first by a significant widening of the bid-ask spreads in the brokered
markets in which trust preferred securities trade and then by a significant decrease in the volume
of trades relative to historical levels. The new issue market is also inactive as a minimal number
of trust preferred securities have been issued since 2007. Very few market participants are
willing and/or able to transact for these securities. The market values for the securities are
very depressed relative to historical levels. The Banks do not intend to sell the trust preferred
securities, and it is more likely than not that the Banks will not be required to sell them.
The Banks’ trust preferred securities consist of the following issues at December 31, 2010:
| Pools | ||||||||||||||||||||
| I PreTsl III | PreTsl XXVIII | PreTsl XIV | T Pref 1 | Total | ||||||||||||||||
Class |
C | B | B-1 | B | ||||||||||||||||
Original par |
$ | 1,000,000 | $ | 1,000,000 | $ | 1,000,000 | $ | 2,000,000 | ||||||||||||
Amortized cost |
1,000,000 | 933,589 | 586,256 | 584,424 | $ | 3,104,269 | ||||||||||||||
Fair value |
266,100 | 124,789 | 97,970 | 22,430 | 511,289 | |||||||||||||||
Discounted cash flow |
1,002,478 | 934,024 | 586,256 | 587,758 | ||||||||||||||||
Year to date impairment |
— | — | 431,397 | 146,524 | 577,921 | |||||||||||||||
Lowest credit rating assigned to the security: |
||||||||||||||||||||
Moody’s |
NR | Ca | Ca | Ca | ||||||||||||||||
Fitch |
CCC | CC | C | D | ||||||||||||||||
Number of banks/insurers |
25 | 56 | 64 | 59 | ||||||||||||||||
Banks/insurers currently performing |
24 | 42 | 36 | 14 | ||||||||||||||||
Actual deferrals and defaults as a percentage
of the original collateral |
7.60 | % | 20.50 | % | 30.00 | % | 11.70 | % | ||||||||||||
Excess subordination as a percentage of
the remaining performing collateral |
3.20 | % | (19.30 | )% | (32.40 | )% | (56.30 | )% | ||||||||||||
The Company has reviewed its trust preferred security pools and determined that the collateral
should be divided between two specific industries for credit analysis — banks and insurance
companies. The Company then determined the industry specific default rates for the two industries.
The bank rate was determined by reviewing each individual institution and its performance using
publicly available information. The insurance company rate was determined by examining a study by
a well-known rating agency that displayed the average one-year impairment rate.
To determine a pool-specific loss rate, the Company determined that a common indicator was needed
for each issuer. For banks, the Company obtained an estimated regulatory rating from a well-known
financial institution rating service to use as an indicator of default probability. The Company
then adjusted the default rate from 0.20% to 1.00% based on the regulatory rating obtained. For
insurance companies, the Company obtained the rating for the primary insurance company to use as an
indicator of default probability and modified the default rate from 0.25% to 1.25% based on the
ratings.
To obtain the expected annual default rate for the pool, the Company computed the weighted average
rating for each issuer based on the remaining issuance amount as a percentage of the total
remaining collateral. Any issuer with a specific default rate was only weighted by the portion of
the issuance remaining after the application of the specific default rate. The Company reviews the
assumptions quarterly for reasonableness and will update those assumptions that management believes
have changed given market conditions, changes in deferrals and defaults, as well as other
factors that can impact these assumptions. Based on the results of this analysis, the Company
F-19
Table of Contents
RELIANCE BANCSHARES, INC. AND SUBSIDIARIES
Notes to Consolidated Financial Statements
ensures that actual deferrals/defaults as well as forecasted deferrals/defaults of specific
institutions are appropriately factored into the cash flow projections for each security.
In the tables above, “Excess subordination as percentage of the remaining performing collateral”
(Excess Subordination Ratio) was calculated as follows: (total face value of performing collateral
less face value of all outstanding note balances not subordinate to the Company’s investment) ÷
total face value of performing collateral. The Excess Subordination Ratio measures the extent to
which there may be tranches within each pooled trust preferred structure available to absorb credit
losses before the Company’s securities would be impacted. A positive Excess Subordination Ratio
signifies there is some support from subordinate tranches available to absorb losses before the
Company’s investment would be impacted, while a negative Excess Subordination Ratio for each of the
mezzanine tranche securities indicates there is no support. A negative Excess Subordination Ratio
is not definitive, in isolation, for determining whether or not an other-than-temporary credit loss
should be recorded for a pooled trust preferred security. Other factors affect the timing and
amount of cash flows available for payments to the note holders (investors), including the excess
interest paid by the issuers (the issuers typically pay higher rates of interest than are paid out
to the note holders).
As noted in the above table, some of the Company’s investments in trust preferred securities have
experienced fair value deterioration due to credit losses but are not otherwise considered to be
other-than-temporarily impaired (OTTI). The following table provides information about those trust
preferred securities for which only a credit loss was recognized in income and other losses are
recorded in other comprehensive income (loss) for the years ended December 31, 2010 and 2009:
| 2010 | 2009 | |||||||
Accumulated credit losses on trust preferred securities: |
||||||||
Beginning of year |
$ | 340,957 | — | |||||
Additions related to other-than-temporary impairment losses
not previously recognized |
431,397 | 340,957 | ||||||
Reductions due to sales |
— | — | ||||||
Reductions due to change in intent or likelihood of sale |
— | — | ||||||
Additions related to increases in previously recognized
other-than-temporary impairment losses |
146,524 | — | ||||||
Reductions due to increases in expected cash flows |
— | — | ||||||
End of year |
$ | 918,878 | 340,957 | |||||
The carrying value of debt securities pledged to secure public funds, securities sold under
repurchase agreements, certain borrowings, and for other purposes amounted to approximately
$150,544,000 and $160,923,000 at December 31, 2010 and 2009, respectively. The Banks have also
pledged letters of credit from the Federal Home Loan Banks totaling $9,118,574 and $17,791,974 as
additional collateral to secure public funds at December 31, 2010 and 2009, respectively.
During 2010, 2009, and 2008, certain available-for-sale securities were sold for proceeds totaling
$20,848,467, $56,075,085, and $35,428,956, respectively, resulting in gross gains of $295,024,
$1,346,806, and $342,864, respectively, and gross losses of $7,515, $241, and $21,751,
respectively.
F-20
Table of Contents
RELIANCE BANCSHARES, INC. AND SUBSIDIARIES
Notes to Consolidated Financial Statements
NOTE 4 — LOANS
The composition of the loan portfolio at December 31, 2010 and 2009 is as follows:
| 2010 | 2009 | |||||||
Commercial: |
||||||||
Real estate |
$ | 716,773,796 | 797,054,385 | |||||
Other |
80,973,537 | 82,732,850 | ||||||
Real estate: |
||||||||
Construction |
100,456,596 | 172,731,598 | ||||||
Residential |
69,143,298 | 84,080,509 | ||||||
Consumer |
2,914,139 | 3,704,533 | ||||||
| $ | 970,261,366 | 1,140,303,875 | ||||||
The Banks grant commercial, industrial, residential, and consumer loans (including overdrafts
totaling $119,430 and $50,070 at December 31, 2010 and 2009, respectively) throughout the St.
Louis, Missouri, Phoenix, Arizona, and Houston, Texas metropolitan areas and southwestern Florida.
The Banks do not have any particular concentration of credit in any one economic sector, except
that a substantial portion of the portfolio is concentrated in and secured by real estate in the
St. Louis, Missouri metropolitan area and southwestern Florida, particularly commercial real estate
and construction of commercial and residential real estate. The ability of the Banks’ borrowers to
honor their contractual obligations is dependent upon the local economies and their effect on the
real estate market.
The aggregate amount of loans to executive officers and directors and loans made for the benefit of
executive officers and directors was $36,585,775 and $62,282,603 at December 31, 2010 and 2009,
respectively. Such loans were made in the normal course of business on substantially the same
terms, including interest rates and collateral, as those prevailing at the same time for comparable
transactions with other persons, and did not involve more than the normal risk of collectibility.
A summary of activity for loans to executive officers and directors for the year ended December 31,
2010 is as follows:
Balance, December 31, 2009 |
$ | 62,282,603 | ||
New loans made |
21,041,439 | |||
Payments received |
(27,716,652 | ) | ||
Other |
(19,021,615 | ) | ||
Balance, December 31, 2010 |
$ | 36,585,775 | ||
Other changes represent changes in the composition of executive officers, directors, and their
related entities which occurred in 2010.
F-21
Table of Contents
RELIANCE BANCSHARES, INC. AND SUBSIDIARIES
Notes to Consolidated Financial Statements
Transactions in the reserve for possible loan losses for the years ended December 31, 2010, 2009,
and 2008 are summarized as follows:
| 2010 | 2009 | 2008 | ||||||||||
Balance, January 1 |
$ | 32,221,569 | 14,305,822 | 9,685,011 | ||||||||
Provision charged to operations |
41,491,947 | 53,450,000 | 11,148,000 | |||||||||
Charge-offs |
(37,010,872 | ) | (37,114,551 | ) | (6,553,417 | ) | ||||||
Recoveries of loans previously
charged off |
598,431 | 1,580,298 | 26,228 | |||||||||
Balance, December 31 |
$ | 37,301,075 | 32,221,569 | 14,305,822 | ||||||||
The Company risk rates all of the loans in its loan portfolio, using a 1-7 risk rating system,
with a “1” rated credit being a high quality loan and a “7” rated credit having some level of loss
in the credit. Loan officers are responsible for risk-rating their own credits, including
maintaining the risk rating on a current basis. Downgrades are discussed at various management and
loan committee meetings. The risk ratings are also subject to an on-going review by an extensive
loan review process performed independent of the loan officers. An adequately controlled risk
rating process allows Company management to conclude that the Banks’ watch lists (which include all
credits risk-rated “4” or greater) are, for all practical purposes, a complete profile of
situations with current loss exposure.
All loans included in the watch lists require separate action plans to be developed to reduce the
level of risk inherent in the credit relationship. Based on the information included on the watch
lists and a review of each individual credit relationship thereon, the Company determines whether a
credit is impaired.
When measuring impairment for loans, the expected future cash flows of impaired loans are
discounted at the loan’s effective interest rate. Alternatively, impairment is measured by
reference to an observable market price, if one exists, or the fair value of collateral for a
collateral dependent loan; however, substantially all of the Company’s presently impaired credit
relationships are collateralized by (and derive their ultimate cash flows therefrom) commercial,
construction, or residential real estate and, accordingly, virtually all of the Company’s
impairment calculations for the present portfolio have been based on the underlying values of the
real estate collateral.
The Banks’ watch lists include complete listings of credit relationships that are considered to be
impaired, along with an assessment of the estimated impairment loss to be included as specific
exposure for impaired loans. Such impairment calculations are based on current appraisals of the
underlying real estate collateral. The Company regularly obtains updated appraisals for all of its
impaired credit relationships. The continued decline in real estate values experienced by the
Company during the three years ended December 31, 2010 has resulted in an increased level of the
reserve for loan losses for these specifically identifiable impairment losses.
The sum of all exposure amounts calculated for impaired loans are included in the reserve for loan
losses as the specifically-identifiable losses portion of the account balance. This is one portion
of the reserve for loan losses. The second portion of the reserve for loan losses is a general
reserve for all credit relationships not considered to be specifically impaired. This amount is
calculated by first calculating the historical charge-off ratio for each of the particular loan
categories and then subjectively adjusting these historical ratios for several economic and
environmental factors. The adjusted ratio for each loan category is then applied against the
nonimpaired loans in that loan
F-22
Table of Contents
RELIANCE BANCSHARES, INC. AND SUBSIDIARIES
Notes to Consolidated Financial Statements
category, resulting in a general reserve for that particular loan category. The sum of these
general reserve categories, when added to the amount of specifically identified losses on impaired
credits, results in the final reserve for loan losses balance for a particular date. The Banks
follow this process for calculating the reserve for loan losses on a quarterly basis.
In calculating the general portion of the reserve for possible loan losses, the loan categories
used are real estate construction, residential real estate, commercial real estate, commercial and
industrial, and consumer loans. In 2009 and 2008, historical charge-off ratios were calculated on
a rolling 36-month basis, which resulted in higher reserve levels with the increased levels of
charge-offs experienced during the past three years. Beginning in the fourth quarter of 2010, the
Company has reduced this historical “look-back” period to a rolling 24-month period on a
consolidated basis to more closely relate current periods with the most recent historical data, and
thus require less adjustment for the other environmental factors. This change resulted in an
increase to the general portion of the reserve for possible loan losses of approximately $5,696,000
at December 31, 2010 from the amount that would have been required using the rolling 36-month
historical charge-off ratios.
The economic and environmental factors for which adjustments are made to the historical charge-off
ratios include the following:
| • | changes in lending policies and procedures, including changes in underwriting standards and collection, charge-off, and recovery practices not considered elsewhere in estimating credit losses. | ||
| • | changes in international, national, regional, and local economic and business conditions and developments that affect the collectability of the portfolio, including the condition of various market segments. | ||
| • | changes in the nature and volume of the portfolio and in the terms of loans. | ||
| • | changes in the experience, ability, and depth of lending management and other relevant staff. | ||
| • | changes in the volume and severity of past due loans, the volume of nonaccrual loans, and the volume and severity of adversely classified or graded loans. | ||
| • | changes in the quality of the Banks’ loan review systems. | ||
| • | changes in the value of underlying collateral for collateral-dependent loans. | ||
| • | the existence and effect of any concentrations of credit, and changes in the level of such concentrations. | ||
| • | the effect of other external factors such as competition and legal and regulatory requirements on the level of estimated credit losses in the Banks’ existing portfolios. |
F-23
Table of Contents
RELIANCE BANCSHARES, INC. AND SUBSIDIARIES
Notes to Consolidated Financial Statements
At December 31, 2010, the Company’s consolidated reserve for loan losses calculation had the
following components (in thousands of dollars):
Specifically identifiable exposure on impaired loans:
| Loan type | # of credits | Loan balance | Exposure | |||||||||
Real estate construction |
30 | $ | 38,347 | $ | 4,633 | |||||||
Residential real estate |
18 | 3,156 | 357 | |||||||||
Commercial real estate |
55 | 130,065 | 9,109 | |||||||||
Commercial and industrial |
14 | 14,580 | 1,628 | |||||||||
Consumer |
1 | 4 | 1 | |||||||||
| $ | 186,152 | $ | 15,728 | |||||||||
General reserve for nonimpaired credits:
| Historical | Adjusted | |||||||||||||||
| charge-off | charge-off | Non-impaired | Calculated | |||||||||||||
| Loan type | percentage | percentage | loan balance | reserve | ||||||||||||
Real estate construction |
11.37 | % | 11.81 | % | $ | 62,110 | $ | 7,333 | ||||||||
Residential real estate |
1.97 | % | 2.29 | % | 65,987 | 1,514 | ||||||||||
Commercial real estate |
2.01 | % | 2.10 | % | 586,709 | 12,297 | ||||||||||
Commercial and industrial |
0.45 | % | 0.60 | % | 66,393 | 401 | ||||||||||
Consumer |
0.88 | % | 0.97 | % | 2,910 | 28 | ||||||||||
| 784,109 | 21,573 | |||||||||||||||
Total |
$ | 970,261 | $ | 37,301 | ||||||||||||
At December 31, 2009, the Company’s consolidated reserve for loan losses calculation had the
following components (in thousands of dollars):
| Specifically identifiable exposure on impaired loans: |
| Loan type | # of credits | Loan balance | Exposure | |||||||||
Real estate construction |
26 | $ | 41,737 | $ | 9,772 | |||||||
Residential real estate |
14 | 4,459 | 830 | |||||||||
Commercial real estate |
21 | 50,798 | 5,737 | |||||||||
Commercial and industrial |
2 | 1,148 | 384 | |||||||||
Consumer |
1 | 2 | 1 | |||||||||
| $ | 98,144 | $ | 16,724 | |||||||||
General reserve for non-impaired credits:
| Historical | Adjusted | |||||||||||||||
| charge-off | charge-off | Non-impaired | Calculated | |||||||||||||
| Loan type | percentage | percentage | loan balance | reserve | ||||||||||||
Real estate construction |
3.35 | % | 3.91 | % | $ | 130,995 | $ | 5,125 | ||||||||
Residential real estate |
1.00 | % | 1.47 | % | 79,621 | 1,167 | ||||||||||
Commercial real estate |
1.04 | % | 1.14 | % | 746,256 | 8,519 | ||||||||||
Commercial and industrial |
0.31 | % | 0.71 | % | 81,585 | 581 | ||||||||||
Consumer |
1.24 | % | 2.86 | % | 3,703 | 106 | ||||||||||
| 1,042,160 | 15,498 | |||||||||||||||
Total |
$ | 1,140,304 | $ | 32,222 | ||||||||||||
F-24
Table of Contents
RELIANCE BANCSHARES, INC. AND SUBSIDIARIES
Notes to Consolidated Financial Statements
Following is an analysis of the reserve for possible loan losses by loan type and those that have
been specifically evaluated or evaluated in aggregate at December 31, 2010 and 2009 (in thousands
of dollars):
| Commercial real | Real estate | Residential real | ||||||||||||||||||||||
| estate | Commercial other | construction | estate | Consumer | Total | |||||||||||||||||||
2010 |
||||||||||||||||||||||||
Reserve for possible
loan losses: |
||||||||||||||||||||||||
Beginning balance |
$ | 14,256 | 965 | 14,897 | 1,997 | 107 | 32,222 | |||||||||||||||||
Charge-offs |
(14,962 | ) | (221 | ) | (19,878 | ) | (1,910 | ) | (40 | ) | (37,011 | ) | ||||||||||||
Recoveries |
462 | 63 | 22 | 30 | 21 | 598 | ||||||||||||||||||
Provision |
21,650 | 1,222 | 16,925 | 1,754 | (59 | ) | 41,492 | |||||||||||||||||
Ending balance |
$ | 21,406 | 2,029 | 11,966 | 1,871 | 29 | 37,301 | |||||||||||||||||
Individually evaluated
for impairment |
$ | 9,109 | 1,628 | 4,633 | 357 | 1 | 15,728 | |||||||||||||||||
Collectively evaluated for impairment |
12,297 | 401 | 7,333 | 1,514 | 28 | 21,573 | ||||||||||||||||||
Financial receivables: |
||||||||||||||||||||||||
Individually evaluated
for impairment |
$ | 130,065 | 14,580 | 38,347 | 3,156 | 4 | 186,152 | |||||||||||||||||
Collectively evaluated
for impairment |
586,709 | 66,393 | 62,110 | 65,987 | 2,910 | 784,109 | ||||||||||||||||||
Ending balance |
$ | 716,774 | 80,973 | 100,457 | 69,143 | 2,914 | 970,261 | |||||||||||||||||
2009 |
||||||||||||||||||||||||
Reserve for possible
loan losses: |
||||||||||||||||||||||||
Beginning balance |
$ | 9,623 | 1,080 | 2,172 | 1,380 | 51 | 14,306 | |||||||||||||||||
Charge-offs |
(18,532 | ) | (656 | ) | (16,042 | ) | (1,832 | ) | (52 | ) | (37,114 | ) | ||||||||||||
Recoveries |
1,033 | 4 | 371 | 150 | 22 | 1,580 | ||||||||||||||||||
Provision |
22,132 | 537 | 28,396 | 2,299 | 86 | 53,450 | ||||||||||||||||||
Ending balance |
$ | 14,256 | 965 | 14,897 | 1,997 | 107 | 32,222 | |||||||||||||||||
Individually evaluated
for impairment |
$ | 5,737 | 384 | 9,772 | 830 | 1 | 16,724 | |||||||||||||||||
Collectively evaluated
for impairment |
8,519 | 581 | 5,125 | 1,167 | 106 | 15,498 | ||||||||||||||||||
Financial receivables: |
||||||||||||||||||||||||
Individually evaluated
for impairment |
$ | 50,798 | 1,148 | 41,737 | 4,459 | 2 | 98,144 | |||||||||||||||||
Collectively evaluated
for impairment |
746,256 | 81,585 | 130,995 | 79,621 | 3,703 | 1,042,160 | ||||||||||||||||||
Ending balance |
$ | 797,054 | 82,733 | 172,732 | 84,080 | 3,705 | 1,140,304 | |||||||||||||||||
F-25
Table of Contents
RELIANCE BANCSHARES, INC. AND SUBSIDIARIES
Notes to Consolidated Financial Statements
Following is a summary of past due loans by type and by number of days delinquent at December
31, 2010 and 2009 (in thousands of dollars):
| Recorded | ||||||||||||||||||||||||||||
| Total | investment > | |||||||||||||||||||||||||||
| 30-59 days | 60-89 days | Greater than | Total | financing | 90 days and | |||||||||||||||||||||||
| past due | past due | 90 days | past due | Current | receivables | accruing | ||||||||||||||||||||||
2010 |
||||||||||||||||||||||||||||
Commercial: |
||||||||||||||||||||||||||||
Real estate |
$ | 5,022 | 6,491 | 64,032 | 75,545 | 641,229 | 716,774 | — | ||||||||||||||||||||
Other |
271 | 9,283 | 235 | 9,789 | 71,184 | 80,973 | — | |||||||||||||||||||||
Real estate: |
||||||||||||||||||||||||||||
Construction |
7,199 | — | 28,296 | 35,495 | 64,962 | 100,457 | — | |||||||||||||||||||||
Residential |
3,195 | 567 | 2,403 | 6,165 | 62,978 | 69,143 | — | |||||||||||||||||||||
Consumer |
— | — | — | — | 2,914 | 2,914 | — | |||||||||||||||||||||
Total |
$ | 15,687 | 16,341 | 94,966 | 126,994 | 843,267 | 970,261 | — | ||||||||||||||||||||
2009 |
||||||||||||||||||||||||||||
Commercial: |
||||||||||||||||||||||||||||
Real estate |
$ | 3,916 | 8,959 | 35,914 | 48,789 | 748,265 | 797,054 | 3,318 | ||||||||||||||||||||
Other |
— | 580 | 214 | 794 | 81,939 | 82,733 | 100 | |||||||||||||||||||||
Real estate: |
||||||||||||||||||||||||||||
Construction |
4,581 | 4,426 | 15,473 | 24,480 | 148,252 | 172,732 | — | |||||||||||||||||||||
Residential |
340 | 288 | 4,145 | 4,773 | 79,307 | 84,080 | 143 | |||||||||||||||||||||
Consumer |
— | — | 25 | 25 | 3,680 | 3,705 | — | |||||||||||||||||||||
Total |
$ | 8,837 | 14,253 | 55,771 | 78,861 | 1,061,443 | 1,140,304 | 3,561 | ||||||||||||||||||||
Following is a summary of impaired loans by type at December 31, 2010 and 2009 (in thousands
of dollars):
| Recorded | Unpaid principal | Related | Average recorded | Interest income | ||||||||||||||||
| investment | balance | allowance | investment | recognized | ||||||||||||||||
2010 |
||||||||||||||||||||
Commercial: |
||||||||||||||||||||
Real estate |
$ | 130,065 | 141,938 | 9,109 | 137,401 | 623 | ||||||||||||||
Other |
14,580 | 14,888 | 1,628 | 14,713 | 80 | |||||||||||||||
Real estate: |
||||||||||||||||||||
Construction |
38,347 | 56,750 | 4,633 | 46,875 | 104 | |||||||||||||||
Residential |
3,156 | 4,552 | 357 | 3,997 | 1 | |||||||||||||||
Consumer |
4 | 4 | 1 | 4 | — | |||||||||||||||
Total |
$ | 186,152 | 218,132 | 15,728 | 202,990 | 808 | ||||||||||||||
2009 |
||||||||||||||||||||
Commercial: |
||||||||||||||||||||
Real estate |
$ | 50,798 | 55,422 | 5,737 | 54,079 | 454 | ||||||||||||||
Other |
1,148 | 1,154 | 384 | 1,150 | 7 | |||||||||||||||
Real estate: |
||||||||||||||||||||
Construction |
41,737 | 53,860 | 9,772 | 46,233 | 176 | |||||||||||||||
Residential |
4,459 | 5,779 | 830 | 4,645 | — | |||||||||||||||
Consumer |
2 | 2 | 1 | 2 | — | |||||||||||||||
Total |
$ | 98,144 | 116,217 | 16,724 | 106,109 | 637 | ||||||||||||||
Following is a summary of loans on nonaccrual status by type at December 31, 2010 and 2009 (in
thousands of dollars):
| 2010 | 2009 | |||||||
Commercial: |
||||||||
Real estate
|
$ | 104,714 | 34,746 | |||||
Other
|
13,660 | 114 | ||||||
Real estate: |
||||||||
Construction
|
29,894 | 17,207 | ||||||
Residential
|
3,119 | 4,593 | ||||||
Consumer
|
4 | 568 | ||||||
Total
|
$ | 151,391 | 57,228 | |||||
F-26
Table of Contents
RELIANCE BANCSHARES, INC. AND SUBSIDIARIES
Notes to Consolidated Financial Statements
Had the Banks’ nonaccrual loans continued to accrue interest, the Banks would have earned
additional income of $10,159,025, $4,425,441, and $1,716,845 during the years ended December 31,
2010, 2009, and 2008, respectively.
Following is a summary of loans segregated based on credit quality indicators at December 31, 2010
and 2009 (in thousands of dollars):
| 2010 | Commercial | Commercial | Real estate | Residential | ||||||||||||||||||||
| Grade | real estate | other | construction | real estate | Consumer | Total | ||||||||||||||||||
Pass |
$ | 561,135 | 60,406 | 56,533 | 63,412 | 2,910 | 744,396 | |||||||||||||||||
Special Mention |
14,821 | 5,524 | 4,714 | 2,217 | — | 27,276 | ||||||||||||||||||
Substandard |
140,818 | 12,258 | 38,060 | 3,514 | 4 | 194,654 | ||||||||||||||||||
Doubtful |
— | 2,785 | 1,150 | — | — | 3,935 | ||||||||||||||||||
Total |
$ | 716,774 | 80,973 | 100,457 | 69,143 | 2,914 | 970,261 | |||||||||||||||||
| 2009 | Commercial | Commercial | Real estate | Residential | ||||||||||||||||||||
| Grade | real estate | other | construction | real estate | Consumer | Total | ||||||||||||||||||
Pass |
$ | 732,619 | 80,022 | 119,858 | 77,683 | 3,681 | 1,013,863 | |||||||||||||||||
Special Mention |
16,289 | 1,472 | 2,871 | 1,593 | — | 22,225 | ||||||||||||||||||
Substandard |
47,655 | 1,126 | 50,003 | 4,769 | 24 | 103,577 | ||||||||||||||||||
Doubtful |
491 | 113 | — | 35 | — | 639 | ||||||||||||||||||
Total |
$ | 797,054 | 82,733 | 172,732 | 84,080 | 3,705 | 1,140,304 | |||||||||||||||||
NOTE 5 — PREMISES AND EQUIPMENT
A summary of premises and equipment at December 31, 2010 and 2009 is as follows:
| 2010 | 2009 | |||||||
Land |
$ | 7,978,415 | 8,721,656 | |||||
Buildings and improvements |
29,948,836 | 29,948,836 | ||||||
Furniture, fixtures, and equipment |
9,328,841 | 9,217,411 | ||||||
Construction in progress |
— | 3,732,590 | ||||||
| 47,256,092 | 51,620,493 | |||||||
Less accumulated depreciation |
11,478,417 | 9,409,957 | ||||||
| $ | 35,777,675 | 42,210,536 | ||||||
Amounts charged to noninterest expense for depreciation aggregated $2,078,116, $2,239,106 and
$2,319,204, for the years ended December 31, 2010, 2009, and 2008, respectively.
Certain branch construction contracts have involved contracts for construction with a general
contracting company that is majority-owned by one of the Company’s directors. All construction
contracts entered into by the Company have been made under formal sealed bid processes. During the
years ended December 31, 2010, 2009, and 2008, the Company paid $8,931, $4,122, and $715,470,
respectively, to the construction company owned by the Company director for construction costs
incurred.
Reliance Bank leases certain premises under noncancelable operating lease agreements that expire at
various dates through 2026, with various options to extend the leases. Minimum rental
F-27
Table of Contents
RELIANCE BANCSHARES, INC. AND SUBSIDIARIES
Notes to Consolidated Financial Statements
commitments for payments under all noncancelable operating lease agreements at December 31, 2010
for each of the next five years, and in the aggregate, are as follows:
| Minimum | ||||
| lease payments | ||||
Year ending December 31: |
||||
2011 |
$ | 722,413 | ||
2012 |
693,892 | |||
2013 |
429,698 | |||
2014 |
432,613 | |||
2015 |
442,444 | |||
Thereafter |
4,506,616 | |||
Total minimum payments required |
$ | 7,227,676 | ||
Total rent paid by the Company in 2010, 2009, and 2008 was $710,691, $761,852, and $750,113,
respectively.
Reliance Bank leases out a portion of certain of its banking facilities to unaffiliated companies
under noncancelable leases that expire at various dates through 2016. Minimum rental income under
these noncancelable leases at December 31, 2010, for each of the next five years and in the
aggregate, is as follows:
Year ending December 31: |
||||
2011 |
$ | 247,851 | ||
2012 |
95,110 | |||
2013 |
60,539 | |||
2014 |
42,484 | |||
2015 |
42,484 | |||
Thereafter |
3,540 | |||
Total minimum payments required |
$ | 492,008 | ||
Total rental income recorded by the Reliance Bank in 2010, 2009, and 2008 totaled $261,742,
$288,100, and $260,970, respectively.
Included in land and construction in progress at December 31, 2009 were four parcels of
property located in southwestern Florida which were purchased for future branch expansion. The
Company determined that it would not be constructing branches on those sites in the foreseeable
future and, accordingly, has transferred the properties to other real estate owned and recognized
an impairment charge of $3,402,512 in other real estate expense, to write down the land to the
properties’ fair values based on current appraisals.
F-28
Table of Contents
RELIANCE BANCSHARES, INC. AND SUBSIDIARIES
Notes to Consolidated Financial Statements
NOTE 6 — DEPOSITS
A summary of interest-bearing deposits at December 31, 2010 and 2009 is as follows:
| 2010 | 2009 | |||||||
Interest-bearing transaction accounts |
$ | 252,447,257 | 202,348,691 | |||||
Savings |
317,661,244 | 341,177,173 | ||||||
Other time deposits: |
||||||||
Less than $100,000 |
278,342,321 | 353,498,850 | ||||||
$100,000 and over |
170,420,374 | 297,205,902 | ||||||
| $ | 1,018,871,196 | 1,194,230,616 | ||||||
Deposits of executive officers, directors and their related interests at December 31, 2010 and
2009 totaled $23,929,128 and $14,687,238, respectively.
Interest expense on deposits for the years ended December 31, 2010, 2009, and 2008 is summarized as
follows:
| 2010 | 2009 | 2008 | ||||||||||
Interest-bearing transaction accounts |
$ | 1,971,283 | 2,084,080 | 3,787,690 | ||||||||
Savings |
3,647,678 | 7,369,936 | 942,446 | |||||||||
Other time deposits: |
||||||||||||
Less than $100,000 |
8,739,062 | 14,439,151 | 16,252,548 | |||||||||
$100,000 and over |
5,387,309 | 9,707,845 | 13,668,035 | |||||||||
| $ | 19,745,332 | 33,601,012 | 34,650,719 | |||||||||
Following are the maturities of time deposits for each of the next five years and in the
aggregate at December 31, 2010:
Year ending December 31: |
||||
2011 |
$ | 287,345,353 | ||
2012 |
92,459,859 | |||
2013 |
35,517,412 | |||
2014 |
11,691,557 | |||
2015 |
13,033,224 | |||
Thereafter |
8,715,290 | |||
| $ | 448,762,695 | |||
NOTE 7 — INCOME TAXES
The components of income tax expense (benefit) for the years ended December 31, 2010, 2009, and
2008 are as follows:
| 2010 | 2009 | 2008 | ||||||||||
Current: |
||||||||||||
Federal income taxes |
$ | — | (1,793,905 | ) | 1,545,625 | |||||||
State income taxes |
— | — | (147,142 | ) | ||||||||
Deferred income taxes |
(14,765,155 | ) | (14,835,657 | ) | (2,478,369 | ) | ||||||
Valuation reserve |
26,076,828 | — | — | |||||||||
| $ | 11,311,673 | (16,629,562 | ) | (1,079,886 | ) | |||||||
F-29
Table of Contents
RELIANCE BANCSHARES, INC. AND SUBSIDIARIES
Notes to Consolidated Financial Statements
A reconciliation of expected income tax expense (benefit) computed by applying the Federal
statutory rate of 34% to loss before applicable income tax benefit for the years ended December 31,
2010, 2009, and 2008 is as follows:
| 2010 | 2009 | 2008 | ||||||||||
Expected statutory federal income
tax benefit |
$ | (12,653,717 | ) | (15,635,554 | ) | (475,699 | ) | |||||
State income taxes, net of federal benefit |
— | — | (97,114 | ) | ||||||||
Tax exempt interest and dividend income |
(353,753 | ) | (397,340 | ) | (459,002 | ) | ||||||
Incentive stock options |
49,026 | 115,244 | 115,759 | |||||||||
Other, net |
(1,806,711 | ) | (711,912 | ) | (163,830 | ) | ||||||
Valuation reserve |
26,076,828 | — | — | |||||||||
| $ | 11,311,673 | (16,629,562 | ) | (1,079,886 | ) | |||||||
The tax effects of temporary differences that give rise to significant portions of deferred
tax assets and liabilities at December 31, 2010, 2009, and 2008 are presented below:
| 2010 | 2009 | |||||||
Deferred tax assets: |
||||||||
Amortization of start-up costs
for tax reporting purposes |
$ | 35,582 | 39,326 | |||||
Reserve for possible loan losses |
13,850,218 | 11,973,337 | ||||||
Operating loss and tax credit
carryforwards |
14,735,993 | 5,583,001 | ||||||
Stock option expense |
298,236 | 203,610 | ||||||
Other real estate owned |
4,606,309 | 1,152,721 | ||||||
Nonaccrual loan interest |
1,950,783 | 1,841,692 | ||||||
Investment write-down |
340,536 | 126,358 | ||||||
Unrealized net holding losses on
available-for-sale securities |
— | 212,222 | ||||||
Other, net |
49,052 | 336,357 | ||||||
Total deferred tax assets |
35,866,709 | 21,468,624 | ||||||
Deferred tax liabilities: |
||||||||
Bank premises and equipment |
(1,544,877 | ) | (1,693,402 | ) | ||||
Purchase adjustments |
(46,896 | ) | (53,219 | ) | ||||
Unrealized net holding gains on
available-for-sale securities |
(15,323 | ) | — | |||||
Total deferred tax liabilities |
(1,607,096 | ) | (1,746,621 | ) | ||||
Net deferred tax assets |
34,259,613 | 19,722,003 | ||||||
Valuation reserve |
(26,076,828 | ) | — | |||||
Net deferred tax assets after
valuation reserve |
$ | 8,182,785 | 19,722,003 | |||||
The Company is required to provide a valuation reserve on deferred tax assets when it is more
likely than not that some portion of the assets will not be realized. The Company had not
established a valuation reserve at December 31, 2009 or 2008 due to management’s belief and
analysis that future income levels would be sufficient to realize the net deferred tax assets
recorded. In 2010, the Company received a total of $1,951,677 for the carryback of net operating
losses for tax reporting purposes of prior years. At December 31, 2010, the Company has deferred
tax assets of $13,609,596 for net operating loss carryforwards for federal tax reporting purposes
totaling $38,561,563 which will expire beginning in 2029, if unused. The Company also has
F-30
Table of Contents
RELIANCE BANCSHARES, INC. AND SUBSIDIARIES
Notes to Consolidated Financial Statements
deferred tax assets for operating loss carryforwards for Florida state income tax reporting
purposes totaling $1,084,856 for losses incurred by Reliance Bank, F.S.B. Such operating losses
totaled $19,724,646 at December 31, 2010, and will begin to expire, if unused, by 2023. Given the
Company’s cumulative losses that have occurred through 2010, the Company has established a
valuation reserve of $26,076,828 for its deferred tax assets. This valuation reserve will be
reversed when the Company demonstrates a consistent earnings trend and begins using the net
operating loss for tax reporting purposes.
NOTE 8 — SHORT-TERM BORROWINGS
At December 31, 2010 and 2009, short-term borrowings consisted entirely of securities sold under
repurchase agreements of $15,177,855 and $12,696,932, respectively. The Banks also purchase funds
from the Federal Home Loan Banks of Des Moines and Atlanta and other financial institutions on a
daily basis, when needed for liquidity. At December 31, 2010, Reliance Bank also maintained a line
of credit with availability, subject to a collateral and credit review, in the amount of
$22,450,433 with the Federal Reserve Bank of St. Louis. Funds purchased, securities sold under
repurchase agreements, and the line of credit with the Federal Reserve Bank of St. Louis are
collateralized by debt securities with a net carrying value of approximately $85,973,000 and
$48,728,000 at December 31, 2010 and 2009, respectively.
During 2008, the Company executed a short-term note payable for $7,000,000 with an unaffiliated
financial institution which bore interest at 8.50%. The note was repaid at its maturity on March
31, 2009.
The average balances, maximum month-end amounts outstanding, average rates paid during the year,
and average rates at year end for funds purchased and securities sold under repurchase agreements
and total short-term borrowings as of and for the years ended December 31, 2010, 2009, and 2008
were as follows:
| 2010 | 2009 | 2008 | ||||||||||
Funds purchased and securities
sold under repurchase agreements: |
||||||||||||
Average balance |
$ | 19,673,778 | 20,769,702 | 86,893,315 | ||||||||
Maximum amount outstanding at
any month-end |
37,549,914 | 28,194,919 | 129,677,160 | |||||||||
Average rate paid during the year |
0.61 | % | 1.01 | % | 2.45 | % | ||||||
Average rate at end of year |
0.62 | % | 0.63 | % | 1.42 | % | ||||||
Total short-term borrowings: |
||||||||||||
Average balance |
$ | 19,701,175 | 22,476,551 | 88,748,506 | ||||||||
Maximum amount outstanding at
any month-end |
37,549,914 | 35,194,919 | 136,677,160 | |||||||||
Average rate paid during the year |
0.61 | % | 1.59 | % | 2.58 | % | ||||||
Average rate at end of year |
0.62 | % | 0.63 | % | 2.19 | % | ||||||
F-31
Table of Contents
RELIANCE BANCSHARES, INC. AND SUBSIDIARIES
Notes to Consolidated Financial Statements
NOTE 9 — LONG-TERM FEDERAL HOME LOAN BANK BORROWINGS
At December 31, 2010, the Banks had fixed rate advances outstanding with the Federal Home Loan Bank
of Des Moines and the Federal Home Loan Bank of Atlanta, maturing as follows:
| Weighted | ||||||||
| average | ||||||||
| Amount | rate | |||||||
Due in 2011 |
$ | 1,000,000 | 2.82 | % | ||||
Due in 2012 |
20,000,000 | 4.92 | % | |||||
Due in 2013 |
5,000,000 | 2.50 | % | |||||
Due in 2014 |
— | — | ||||||
Due in 2015 |
— | — | ||||||
Thereafter |
67,000,000 | 3.53 | % | |||||
| $ | 93,000,000 | |||||||
At December 31, 2010, Reliance Bank maintained a line of credit in the amount of $165,779,654
with the Federal Home Loan Bank of Des Moines and had availability under that line of $66,761,080.
Federal Home Loan Bank of Des Moines advances are secured under a blanket agreement which assigns
all Federal Home Loan Bank of Des Moines stock and one- to four-family and multi-family mortgage
and commercial real estate loans. Additionally, at December 31, 2010, Reliance Bank, FSB
maintained a line of credit in the amount of $8,960,000 (of which $5,860,000 was available) with
the Federal Home Loan Bank of Atlanta, secured by one- to four-family residential loans.
NOTE 10 — EMPLOYEE BENEFITS
The Company sponsors a contributory 401(k) savings plan to provide retirement benefits to eligible
employees. Contributions made by the Company in 2010, 2009, and 2008 totaled $86,144, $145,305,
and $292,353, respectively.
NOTE 11 — CAPITAL STOCK
The Company has authorized 40,000,000 shares of common stock with a par value of $0.25 per share.
At December 31, 2010, 22,481,804 shares were issued and outstanding, with 2,595,250 shares reserved
for issuance under the Company’s stock option programs. Holders of the Company’s common stock are
entitled to one vote per share on all matters submitted to a shareholder vote. Holders of the
Company’s common stock are entitled to receive dividends when, as and if declared by the Company’s
Board of Directors. In the event of liquidation of the Company, the holders of the Company’s
common stock are entitled to share ratably in the remaining assets after payment of all liabilities
and preferred shareholders as described below.
The Company has authorized 2,000,000 shares of no par preferred stock, with 42,555 shares issued
and outstanding at December 31, 2010. Preferred stock may be issued by the Company’s Board of
Directors from time to time, in series, at which time the terms of such series (par value per
share, dividend rates and dates, cumulative or noncumulative, liquidation preferences, etc.) shall
be fixed by the Board of Directors. On February 13, 2009, the Company issued 40,000 shares of
Fixed Rate Cumulative Perpetual Preferred Stock, no par value, Series A for a total of $40,000,000,
and 2,000 shares of Fixed Rate Cumulative Perpetual Preferred Stock, no par value, Series B for no
F-32
Table of Contents
RELIANCE BANCSHARES, INC. AND SUBSIDIARIES
Notes to Consolidated Financial Statements
additional funds, to the United States Department of the Treasury under its Troubled Assets Relief
Program Capital Purchase Program authorized by the Emergency Economic Stabilization Act of 2008.
On November 10, 2009, the Company authorized 25,000 shares of Fixed Rate Cumulative Perpetual
Preferred Stock, no par value, Series C for sale with an offering price of $1,000 per share. The
offering was extended to existing shareholders who are accredited investors (as such term is
defined in Regulation D of the Securities Act of 1933, as amended) and to other accredited
investors to subscribe for and purchase shares of this series. During 2009 and 2010, the Company
sold 555 shares for proceeds totaling $555,000.
The Series A preferred stock pays a dividend at the rate of 5% per annum for the first five years
and 9% thereafter. Dividends are payable quarterly and each share has a liquidation amount of
$1,000 and has liquidation rights in pari passu with other preferred stock and is paid in
liquidation prior to the Company’s common stock. The Series B preferred stock pays a dividend at
the rate of 9% per annum, payable quarterly and includes other provisions similar to the Series A
preferred stock with liquidation at $1,000 per share. The Series C preferred stock pays a dividend
at the rate of 7% per annum, payable quarterly and includes other provisions similar to the Series
A preferred stock with liquidation at $1,000 per share.
On January 18, 2011, the Company’s Board of Directors authorized the deferral of the Company’s
February 15, 2011 dividend payment on its preferred stock totaling $554,713.
Stock-Based Compensation
Various stock option plans have been adopted (both incentive stock option plans and nonqualified
stock option plans) under which options to purchase shares of Company common stock may be granted
to officers, employees and directors of the Company and its subsidiary banks. All options were
authorized and granted at prices approximating or exceeding the fair value of the Company’s common
stock at the date of grant. Various vesting schedules have been authorized for the options granted
to date by the Company’s Board of Directors, including certain performance measures used to
determine vesting of certain options granted. Options expire up to ten years from the date of
grant if not exercised. For certain of the options granted, the Company’s Board of Directors has
the ability, at its sole discretion, to grant to key officers of the Company and Banks, the right
to surrender their options held to the Company, in whole or in part, and to receive in exchange
therefore, payment by the Company of an amount equal to the excess of the fair value of the shares
subject to such options over the exercise price to acquire such options. Such payments may be made
in cash, shares of Company common stock, or a combination thereof.
The Company may issue common stock with restrictions to certain key employees. The shares are
restricted as to transfer, but are not restricted as to dividend payment or voting rights. The
transfer restrictions lapse over time depending upon whether the awards are service-based or
performance-based. Service-based awards are contingent upon continued employment, and
performance-based awards are based on the Company meeting specified net income goals and continued
employment.
F-33
Table of Contents
RELIANCE BANCSHARES, INC. AND SUBSIDIARIES
Notes to Consolidated Financial Statements
Following is a summary of stock option activity for the years ended December 31, 2010 and
2009:
| Weighted | ||||||||||||||||
| average | Remaining | Aggregate | ||||||||||||||
| option price | Number | contractual | intrinsic | |||||||||||||
| per share | of shares | term (years) | value | |||||||||||||
Outstanding at December 31, 2008 |
$ | 7.86 | 2,226,450 | |||||||||||||
Granted |
7.50 | 102,750 | ||||||||||||||
Forfeited |
9.67 | (81,934 | ) | |||||||||||||
Exercised |
2.58 | (156,000 | ) | |||||||||||||
Outstanding at December 31, 2009 |
$ | 8.17 | 2,091,266 | 4.07 | — | |||||||||||
Exercisable, end of year |
$ | 7.83 | 1,820,068 | 3.50 | — | |||||||||||
Outstanding at December 31, 2009 |
$ | 8.17 | 2,091,266 | |||||||||||||
Granted |
— | — | ||||||||||||||
Forfeited |
11.16 | (121,350 | ) | |||||||||||||
Exercised |
— | — | ||||||||||||||
Outstanding at December 31, 2010 |
$ | 7.98 | 1,969,916 | 2.90 | — | |||||||||||
Exercisable, end of year |
$ | 7.95 | 1,892,777 | 2.70 | — | |||||||||||
The total intrinsic value of options exercised during 2009 was $228,300.
A summary of the activity of nonvested options for the years ended December 31, 2010 and 2009 is as
follows:
| Weighted | ||||||||
| average | ||||||||
| Number | grant date | |||||||
| of shares | fair value | |||||||
Nonvested at December 31, 2008 |
300,650 | $ | 3.40 | |||||
Granted |
102,750 | — | ||||||
Vested |
(106,185 | ) | 3.63 | |||||
Forfeited |
(26,017 | ) | 2.69 | |||||
Nonvested at December 31, 2009 |
271,198 | 2.09 | ||||||
Granted |
— | — | ||||||
Vested |
(178,448 | ) | 2.86 | |||||
Forfeited |
(15,611 | ) | 0.63 | |||||
Nonvested at December 31, 2010 |
77,139 | 0.61 | ||||||
The total fair value of shares (based on the fair value of the options at their respective
grant dates) subject to options that vested during the years ended December 31, 2010 and 2009 was
$510,000 and $385,000, respectively.
As of December 31, 2010, the total unrecognized compensation expense related to nonvested stock
options granted was $15,271, and the related weighted average period over which it was expected to
be recognized was approximately seven months. During 2010 and 2009, the Company recognized stock
option expense of $215,465 and $504,553, respectively.
During 2010, 2009, and 2008 the Company awarded 40,000, 20,000, and 2,500 shares, respectively, of
the Company’s common stock on a restricted basis to certain officers which will vest over varying
periods up to three years. The awarded shares are being amortized over the estimated vesting
periods. The Company also awarded 106,300 shares of the Company’s common
F-34
Table of Contents
RELIANCE BANCSHARES, INC. AND SUBSIDIARIES
Notes to Consolidated Financial Statements
stock that are contingent on the Company meeting specified net income goals during 2010, 2011,
2012, and 2013 or the combined four-year period ended December 31, 2013 and continued employment.
A summary of the activity of the Company’s restricted stock awards for the years ended December 31,
2010 and 2009 is as follows:
| Weighted | ||||||||
| average | ||||||||
| Number | grant date | |||||||
| of shares | fair value | |||||||
Outstanding at December 31, 2008 |
7,500 | $ | 13.50 | |||||
Granted |
20,000 | 2.30 | ||||||
Vested |
(2,750 | ) | 12.95 | |||||
Forfeited |
— | — | ||||||
Outstanding at December 31, 2009 |
24,750 | 4.51 | ||||||
Granted |
196,300 | 1.02 | ||||||
Vested |
(2,750 | ) | 12.95 | |||||
Forfeited |
(17,600 | ) | — | |||||
Outstanding at December 31, 2010 |
200,700 | 1.37 | ||||||
The Company amortizes the expense related to restricted stock awards as compensation expense
over the requisite vesting period specified in the grant. Restricted stock awards granted to
senior executive officers will vest in three years after the grant date when all funds received
under the Troubled Assets Relief Program Capital Purchase Program have been paid in full. Expense
for restricted stock awards of $91,489 and $50,959 was recorded for the years ended December 31,
2010 and 2009, respectively. As of December 31, 2010, the total unrecognized compensation expense
related to restricted stock awards was $671,802, and the related weighted average period over which
it was expected to be recognized was approximately 33 months.
Other Activity in Stockholders’ Equity
Following is a summary of other activity in the consolidated statements of stockholders’ equity for
the years ended December 31, 2010, 2009, and 2008:
| Total | ||||||||||||||||
| Preferred | Common | stockholders’ | ||||||||||||||
| stock | stock | Surplus | equity | |||||||||||||
2010 |
||||||||||||||||
Issuance of 255 shares of
Series C preferred stock |
$ | 255,000 | — | — | 255,000 | |||||||||||
Issuance of 1,400,517 shares
of common stock |
— | 350,129 | 3,851,422 | 4,201,551 | ||||||||||||
Sale of 69,196 common shares of
stock in connection with employee
stock purchase plan |
— | 17,299 | 119,317 | 136,616 | ||||||||||||
Issuance of 40,000 common shares
of restricted stock to officers |
— | 10,000 | (10,000 | ) | — | |||||||||||
Dividends on preferred stock |
— | — | (2,208,458 | ) | (2,208,458 | ) | ||||||||||
Stock issuance costs |
— | — | (27,654 | ) | (27,654 | ) | ||||||||||
Compensation cost recognized
for stock options granted |
— | — | 215,465 | 215,465 | ||||||||||||
Amortization of restricted stock |
— | — | 91,489 | 91,489 | ||||||||||||
| $ | 255,000 | 377,428 | 2,031,581 | 2,664,009 | ||||||||||||
F-35
Table of Contents
RELIANCE BANCSHARES, INC. AND SUBSIDIARIES
Notes to Consolidated Financial Statements
| Total | ||||||||||||||||||||||||
| Preferred | Common | Accumulated | Treasury | stockholders’ | ||||||||||||||||||||
| stock | stock | Surplus | deficit | stock | equity | |||||||||||||||||||
2009 |
||||||||||||||||||||||||
Issuance of 40,000 shares of
Series A preferred stock |
$ | 40,000,000 | — | — | — | — | 40,000,000 | |||||||||||||||||
Issuance of 2,000 shares of
Series B preferred stock |
2,000,000 | — | (2,000,000 | ) | — | — | — | |||||||||||||||||
Issuance of 300 shares of
Series C preferred stock |
300,000 | — | — | — | — | 300,000 | ||||||||||||||||||
Sale of 59,824 common shares of
stock in connection with employee
stock purchase plan (14,910 shares
from treasury) |
— | 11,228 | (52,696 | ) | — | 216,864 | 175,396 | |||||||||||||||||
Stock options exercised — 156,000
common shares (19,604 shares
from treasury) |
— | 34,099 | 210,485 | — | 158,416 | 403,000 | ||||||||||||||||||
Issuance of 20,000 common shares of
restricted stock to officers |
— | 5,000 | (5,000 | ) | — | — | — | |||||||||||||||||
Purchase of 10,000 common shares
for treasury |
— | — | — | — | (40,000 | ) | (40,000 | ) | ||||||||||||||||
Dividends on preferred stock |
— | — | (545,000 | ) | (1,102,111 | ) | — | (1,647,111 | ) | |||||||||||||||
Stock issuance costs |
— | — | (27,262 | ) | — | — | (27,262 | ) | ||||||||||||||||
Tax benefit from sale of stock
options exercised |
— | — | 5,400 | — | — | 5,400 | ||||||||||||||||||
Compensation cost recognized
for stock options granted |
— | — | 504,553 | — | — | 504,553 | ||||||||||||||||||
Amortization of restricted stock |
— | — | 50,959 | — | — | 50,959 | ||||||||||||||||||
| $ | 42,300,000 | 50,327 | (1,858,561 | ) | (1,102,111 | ) | 335,280 | 39,724,935 | ||||||||||||||||
F-36
Table of Contents
RELIANCE BANCSHARES, INC. AND SUBSIDIARIES
Notes to Consolidated Financial Statements
| Total | ||||||||||||||||
| Common | Treasury | stockholders’ | ||||||||||||||
| stock | Surplus | stock | equity | |||||||||||||
2008 |
||||||||||||||||
Stock options exercised — 141,000
shares (52,296 shares from treasury) |
$ | 22,177 | 139,656 | 627,552 | 789,385 | |||||||||||
Tax benefit from sale of stock options
exercised |
— | 131,809 | — | 131,809 | ||||||||||||
Purchase of 105,324 common shares
for treasury |
— | — | (1,305,000 | ) | (1,305,000 | ) | ||||||||||
Sale of 22,049 common shares of stock
from treasury in connection with
employee stock purchase plan |
— | (121,126 | ) | 264,588 | 143,462 | |||||||||||
1,400 common shares of stock
awarded to directors from treasury |
— | (3,448 | ) | 16,800 | 13,352 | |||||||||||
Issuance of 2,500 common shares of
restricted stock to officer from treasury |
— | (30,000 | ) | 30,000 | — | |||||||||||
Issuance of shares as partial payment
for certain operating leases
(2,565 shares from treasury) |
— | (5,771 | ) | 30,780 | 25,009 | |||||||||||
Compensation cost recognized for
stock options granted |
— | 560,895 | — | 560,895 | ||||||||||||
Amortization of restricted stock |
— | 191,786 | — | 191,786 | ||||||||||||
| $ | 22,177 | 863,801 | (335,280 | ) | 550,698 | |||||||||||
NOTE 12 — PARENT COMPANY FINANCIAL INFORMATION
Subsidiary bank dividends are the principal source of funds for the payment of dividends by the
Company to its stockholders and for debt servicing. The Banks are subject to regulation by
regulatory authorities that require the maintenance of minimum capital requirements. The Banks are
also operating under regulatory agreements which restrict the payment of dividends without prior
written consent from their regulators. As of December 31, 2010, there are no regulatory
restrictions other than the maintenance of minimum capital standards (as discussed in note 15), as
to the amount of dividends the Banks may pay.
Following are condensed balance sheets as of December 31, 2010 and 2009 and the related condensed
schedules of operations and cash flows for each of the years in the three-year period ended
December 31, 2010 of the Company (parent company only):
| 2010 | 2009 | |||||||
Condensed Balance Sheets |
||||||||
Assets: |
||||||||
Cash |
$ | 1,365,860 | 7,305,628 | |||||
Investment in subsidiary banks |
102,413,471 | 140,167,588 | ||||||
Premises and equipment |
44,471 | 792,360 | ||||||
Other assets |
472,345 | 1,431,717 | ||||||
Total assets |
$ | 104,296,147 | 149,697,293 | |||||
Liabilities — accrued expenses payable |
$ | 49,497 | 27,869 | |||||
Total stockholders’ equity |
104,246,650 | 149,669,424 | ||||||
Total liabilities and stockholders’ equity |
$ | 104,296,147 | 149,697,293 | |||||
F-37
Table of Contents
RELIANCE BANCSHARES, INC. AND SUBSIDIARIES
Notes to Consolidated Financial Statements
| 2010 | 2009 | 2008 | ||||||||||
Condensed Schedules of Operations |
||||||||||||
Revenue: |
||||||||||||
Interest on interest-earning deposits
in subsidiary banks |
$ | 62,814 | 134,348 | 146,090 | ||||||||
Other income |
— | 2,700 | 274 | |||||||||
Total revenues |
62,814 | 137,048 | 146,364 | |||||||||
Expenses: |
||||||||||||
Interest expense |
— | 147,097 | 160,319 | |||||||||
Salaries and employee benefits |
854,381 | 498,463 | 302,163 | |||||||||
Other real estate expense |
606,266 | — | — | |||||||||
Professional fees |
208,691 | 167,557 | 171,503 | |||||||||
Other expenses |
285,231 | 358,155 | 396,894 | |||||||||
Total expenses |
1,954,569 | 1,171,272 | 1,030,879 | |||||||||
Loss before income tax and
equity in undistributed income
(loss) of subsidiary banks |
(1,891,755 | ) | (1,034,224 | ) | (884,515 | ) | ||||||
Income tax expense (benefit) |
205,228 | (302,934 | ) | (300,735 | ) | |||||||
| (2,096,983 | ) | (731,290 | ) | (583,780 | ) | |||||||
Equity in undistributed income (loss)
of subsidiary banks |
(46,431,506 | ) | (28,626,071 | ) | 264,550 | |||||||
Net loss |
$ | (48,528,489 | ) | (29,357,361 | ) | (319,230 | ) | |||||
F-38
Table of Contents
RELIANCE BANCSHARES, INC. AND SUBSIDIARIES
Notes to Consolidated Financial Statements
| 2010 | 2009 | 2008 | ||||||||||
Condensed Schedules of Cash Flows |
||||||||||||
Cash flows from operating activities: |
||||||||||||
Net loss |
$ | (48,528,489 | ) | (29,357,361 | ) | (319,230 | ) | |||||
Adjustments to reconcile net loss to net
cash used in operating activities: |
||||||||||||
Undistributed loss (income) of
subsidiary banks |
46,431,506 | 28,626,071 | (264,550 | ) | ||||||||
Write-down of other real estate owned |
606,266 | — | — | |||||||||
Depreciation |
4,648 | 4,648 | 10,944 | |||||||||
Capitalized interest expense |
— | — | (4,265 | ) | ||||||||
Stock option compensation cost |
71,271 | 184,061 | 228,399 | |||||||||
Common stock awarded to directors |
— | — | 13,352 | |||||||||
Other, net |
1,117,975 | (473,935 | ) | 30,821 | ||||||||
Net cash used in operating activities |
(296,823 | ) | (1,016,516 | ) | (304,529 | ) | ||||||
Cash flows used in investing activities —
capital injections into subsidiary banks |
(8,000,000 | ) | (25,000,000 | ) | (17,000,000 | ) | ||||||
Cash flows from financing activities: |
||||||||||||
Proceeds from note payable |
— | — | 7,000,000 | |||||||||
Repayment of note payable |
— | (7,000,000 | ) | — | ||||||||
Proceeds from sale of treasury stock |
— | 53,825 | — | |||||||||
Purchase of treasury stock |
— | (40,000 | ) | (1,305,000 | ) | |||||||
Sale of common stock |
4,338,167 | 121,571 | 143,462 | |||||||||
Sale of preferred stock |
255,000 | 40,300,000 | — | |||||||||
Preferred stock dividends |
(2,208,458 | ) | (1,647,111 | ) | — | |||||||
Stock options exercised |
— | 403,000 | 789,385 | |||||||||
Payment of stock issuance costs |
(27,654 | ) | (27,262 | ) | — | |||||||
Net cash provided by financing
activities |
2,357,055 | 32,164,023 | 6,627,847 | |||||||||
Net increase (decrease) in cash |
(5,939,768 | ) | 6,147,507 | (10,676,682 | ) | |||||||
Cash at beginning of year |
7,305,628 | 1,158,121 | 11,834,803 | |||||||||
Cash at end of year |
$ | 1,365,860 | 7,305,628 | 1,158,121 | ||||||||
NOTE 13 — LITIGATION
During the normal course of business, various legal claims have arisen which, in the opinion of
management, will not result in any material liability to the Company.
NOTE 14 — DISCLOSURES ABOUT FINANCIAL INSTRUMENTS
The Banks issue financial instruments with off-balance sheet risk in the normal course of the
business of meeting the financing needs of their customers. These financial instruments include
commitments to extend credit and standby letters of credit and may involve, to varying degrees,
elements of credit risk in excess of the amounts recognized in the balance sheets. The contractual
amounts of those instruments reflect the extent of involvement the Banks have in particular classes
of these financial instruments.
The Banks’ exposure to credit loss in the event of nonperformance by the other party to the
financial instrument for commitments to extend credit and standby letters of credit is represented
by the contractual amount of those instruments. The Banks use the same credit policies in making
commitments and conditional obligations as they do for financial instruments included on the
F-39
Table of Contents
RELIANCE BANCSHARES, INC. AND SUBSIDIARIES
Notes to Consolidated Financial Statements
balance sheets. Following is a summary of the Banks’ off-balance sheet financial instruments at
December 31, 2010 and 2009:
| 2010 | 2009 | |||||||
Financial instruments for which
contractual amounts represent: |
||||||||
Commitments to extend credit |
$ | 95,543,403 | 126,088,501 | |||||
Standby letters of credit |
12,938,236 | 13,238,950 | ||||||
| $ | 108,481,639 | 139,327,451 | ||||||
Commitments to extend credit are agreements to lend to a customer as long as there is no
violation of any condition established in the contract. Of the total commitments to extend credit
at December 31, 2010, $17,930,898 was made at fixed rates of interest. Commitments generally have
fixed expiration dates or other termination clauses and may require payment of a fee. Since
certain of the commitments may expire without being drawn upon, the total commitment amounts do not
necessarily represent future cash requirements. The Banks evaluate each customer’s
creditworthiness on a case-by-case basis. The amount of collateral obtained, if deemed necessary
by the Banks upon extension of credit, is based on management’s credit evaluation of the borrower.
Collateral held varies, but is generally residential or income-producing commercial property or
equipment on which the Banks generally have a superior lien.
Standby letters of credit are conditional commitments issued by the Banks to guarantee the
performance of a customer to a third party, for which draw requests have historically not been made
thereon. Such guarantees are primarily issued to support public and private borrowing
arrangements. The credit risk involved in issuing letters of credit is essentially the same as
that involved in extending loan facilities to customers.
Following is a summary of the carrying amounts and estimated fair values of the Company’s financial
instruments at December 31, 2010 and 2009:
| 2010 | 2009 | |||||||||||||||||
| Carrying | Estimated | Carrying | Estimated | Fair value | ||||||||||||||
| amount | fair value | amount | fair value | measurements | ||||||||||||||
Balance sheet assets: |
||||||||||||||||||
Cash and due from banks |
$ | 27,163,804 | 27,163,804 | 27,696,530 | 27,696,530 | Carrying value | ||||||||||||
Investments in debt securities |
241,599,461 | 241,599,461 | 284,119,556 | 284,119,556 | Levels 2 and 3 inputs | |||||||||||||
Loans, net |
932,987,899 | 942,809,020 | 1,107,997,565 | 1,092,995,625 | Level 3 inputs | |||||||||||||
Loans held for sale |
1,838,800 | 1,838,800 | 577,400 | 577,400 | Carrying value | |||||||||||||
Accrued interest receivable |
3,448,850 | 3,448,850 | 5,647,887 | 5,647,887 | Carrying value | |||||||||||||
| $ | 1,207,038,814 | 1,216,859,935 | 1,426,038,938 | 1,411,036,998 | ||||||||||||||
Balance sheet liabilities: |
||||||||||||||||||
Deposits |
$ | 1,080,159,216 | 1,086,042,553 | 1,266,060,197 | 1,279,372,223 | Level 3 inputs | ||||||||||||
Short-term borrowings |
15,177,855 | 15,177,855 | 12,696,932 | 12,696,932 | Carrying value | |||||||||||||
Long-term Federal Home |
||||||||||||||||||
Loan Bank borrowings |
93,000,000 | 100,422,593 | 104,000,000 | 112,908,373 | Level 3 inputs | |||||||||||||
Accrued interest payable |
1,320,358 | 1,320,358 | 2,194,952 | 2,194,952 | Carrying value | |||||||||||||
| $ | 1,189,657,429 | 1,202,963,359 | 1,384,952,081 | 1,407,172,480 | ||||||||||||||
Fair values are calculated using one or more input types, as described in note 1. The
following methods and assumptions were used to estimate the fair value for each class of financial
instruments for which it is practicable to estimate such value:
F-40
Table of Contents
RELIANCE BANCSHARES, INC. AND SUBSIDIARIES
Notes to Consolidated Financial Statements
Cash and Other Short-Term Instruments — For cash and due from banks (including interest-earning
deposits in other financial institutions), accrued interest receivable (payable), loans held for
sale, and short-term borrowings, the carrying amount is a reasonable estimate of fair value, as
such instruments are due on demand and/or reprice in a short time period.
Investments in Available-for-Sale Debt Securities — Investments in available-for-sale debt
securities are recorded at fair value on a recurring basis. The Company’s available-for sale debt
securities are measured at fair value using Levels 2 and 3 valuation inputs. For all debt
securities other than the trust preferred securities, the market valuation utilizes several
sources, primarily pricing services, which include observable inputs rather than “significant
unobservable inputs” and therefore, fall into the Level 2 category. Trust preferred securities are
valued as described in note 3.
Loans — For certain homogeneous categories of loans, such as residential mortgages and other
consumer loans, fair value is estimated using the quoted market prices for securities backed by
similar loans, adjusted for differences in loan characteristics. The fair value of other types of
loans is estimated by discounting the future cash flows using the current rates at which similar
loans would be made to borrowers with similar credit ratings and with the same remaining
maturities. The fair values of impaired loans are measured as the fair value of the underlying
collateral, using observable market prices.
Deposits — The fair value of demand deposits, savings accounts, and interest-bearing transaction
account deposits is the amount payable on demand at the reporting date. The fair value of
fixed-maturity certificates of deposit is estimated using the rates currently offered for deposits
of similar remaining maturities.
Long-Term Borrowings — Rates currently available to the Company with similar terms and remaining
maturities are used to estimate the fair value of existing long-term debt.
Commitments to Extend Credit and Standby Letters of Credit — The fair value of commitments to
extend credit and standby letters of credit are estimated using the fees currently charged to enter
into similar agreements, taking into account the remaining terms of the agreements, the likelihood
of the counterparties drawing on such financial instruments, and the present creditworthiness of
such counterparties. The Company believes such commitments have been made on terms that are
competitive in the markets in which it operates.
NOTE 15 — REGULATORY MATTERS
The Company and Banks are subject to various regulatory capital requirements administered by the
Federal banking agencies. Failure to meet minimum capital requirements can initiate certain
mandatory — and possibly additional discretionary — actions by regulators that, if undertaken,
could have a direct material effect on the Company’s consolidated financial statements. Under
capital adequacy guidelines and the regulatory framework for prompt corrective action, the Company
and Banks must meet specific capital guidelines that involve quantitative measures of the Company
and Banks’ assets, liabilities, and certain off-balance sheet items as calculated under regulatory
accounting practices. The capital amounts and classifications are also subject to qualitative
judgments by the regulators about components, risk weightings, and other factors.
F-41
Table of Contents
RELIANCE BANCSHARES, INC. AND SUBSIDIARIES
Notes to Consolidated Financial Statements
Quantitative measures established by regulation to ensure capital adequacy require the Company and
Banks to maintain minimum amounts and ratios (set forth in the table below) of Total and Tier 1
capital (as defined in the regulations) to risk-weighted assets (as defined), and of Tier 1 capital
(as defined) to average assets (as defined). The Banks are also required to maintain additional
capital as described below under agreements with the banking regulators. Company management
believes that, as of December 31, 2010, the Company and Banks meet all capital adequacy
requirements to which they are subject, except for Reliance Bank, FSB, which was less than
adequately capitalized at December 31, 2010 after recording the write-down of land held for future
expansion effective December 31, 2010. The Company subsequently injected $500,000 of additional
capital into Reliance Bank, FSB on February 16, 2011, which brought the Bank to an adequately
capitalized level, but below the threshold required by the regulatory agreement.
As of December 31, 2010, the most recent notification from the applicable regulatory authorities
categorized Reliance Bank as a well capitalized bank under the regulatory framework for prompt
corrective action. To be categorized as a well capitalized bank, Reliance Bank must maintain
minimum Total risk-based, Tier 1 risk-based, and Tier 1 leverage ratios as set forth in the table
below. There are no conditions or events since that notification that Company management believes
have changed Reliance Bank’s risk categories.
The actual capital amounts and ratios for the Company, Reliance Bank, and Reliance Bank, FSB at
December 31, 2010, 2009, and 2008 are presented in the following table:
| To be a well | ||||||||||||||||||||||||
| capitalized bank under | ||||||||||||||||||||||||
| For capital | prompt corrective | |||||||||||||||||||||||
| Actual | adequacy purposes | action provision | ||||||||||||||||||||||
| Amount | Ratio | Amount | Ratio | Amount | Ratio | |||||||||||||||||||
| (in thousands of dollars) | ||||||||||||||||||||||||
2010: |
||||||||||||||||||||||||
Total capital (to
risk-weighted assets) |
||||||||||||||||||||||||
Consolidated |
$ | 108,209 | 10.05 | % | $ | 86,168 | ³8.0 | % | N/A | N/A | ||||||||||||||
Reliance Bank |
102,606 | 10.03 | % | 81,824 | ³8.0 | % | $ | 102,280 | ³10.0 | % | ||||||||||||||
Reliance Bank, FSB |
4,033 | 7.53 | % | 4,287 | ³8.0 | % | 5,359 | ³10.0 | % | |||||||||||||||
Tier 1 capital
(to risk-weighted assets) |
||||||||||||||||||||||||
Consolidated |
$ | 93,896 | 8.72 | % | $ | 43,084 | ³4.0 | % | N/A | N/A | ||||||||||||||
Reliance Bank |
89,574 | 8.76 | % | 40,912 | ³4.0 | % | $ | 61,368 | ³6.0 | % | ||||||||||||||
Reliance Bank, FSB |
3,330 | 6.21 | % | 2,144 | ³4.0 | % | 3,215 | ³6.0 | % | |||||||||||||||
Tier 1 capital
(to average assets) |
||||||||||||||||||||||||
Consolidated |
$ | 93,896 | 7.14 | % | $ | 52,589 | ³4.0 | % | N/A | N/A | ||||||||||||||
Reliance Bank |
89,574 | 7.29 | % | 49,161 | ³4.0 | % | $ | 61,451 | ³6.0 | % | ||||||||||||||
Reliance Bank, FSB |
3,330 | 4.01 | % | 3,324 | ³4.0 | % | 4,155 | ³6.0 | % | |||||||||||||||
F-42
Table of Contents
RELIANCE BANCSHARES, INC. AND SUBSIDIARIES
Notes to Consolidated Financial Statements
| To be a well- | ||||||||||||||||||||||||
| capitalized bank under | ||||||||||||||||||||||||
| For capital | prompt corrective | |||||||||||||||||||||||
| Actual | adequacy purposes | action provision | ||||||||||||||||||||||
| Amount | Ratio | Amount | Ratio | Amount | Ratio | |||||||||||||||||||
| (in thousands of dollars) | ||||||||||||||||||||||||
2009: |
||||||||||||||||||||||||
Total capital (to
risk-weighted assets) |
||||||||||||||||||||||||
Consolidated |
$ | 146,809 | 11.38 | % | $ | 103,198 | ³8.0 | % | N/A | N/A | ||||||||||||||
Reliance Bank |
124,248 | 10.17 | % | 97,691 | ³8.0 | % | $ | 122,113 | ³10.0 | % | ||||||||||||||
Reliance Bank, FSB |
14,390 | 18.52 | % | 6,215 | ³8.0 | % | 7,769 | ³10.0 | % | |||||||||||||||
Tier 1 capital (to
risk-weighted assets) |
||||||||||||||||||||||||
Consolidated |
$ | 130,486 | 10.12 | % | $ | 51,599 | ³4.0 | % | N/A | N/A | ||||||||||||||
Reliance Bank |
108,965 | 8.92 | % | 48,845 | ³4.0 | % | $ | 73,268 | ³6.0 | % | ||||||||||||||
Reliance Bank, FSB |
13,401 | 17.25 | % | 3,108 | ³4.0 | % | 4,661 | ³6.0 | % | |||||||||||||||
Tier 1 capital (to
average assets) |
||||||||||||||||||||||||
Consolidated |
$ | 130,486 | 8.52 | % | $ | 61,244 | ³4.0 | % | N/A | N/A | ||||||||||||||
Reliance Bank |
108,965 | 7.62 | % | 57,211 | ³4.0 | % | $ | 71,514 | ³5.0 | % | ||||||||||||||
Reliance Bank, FSB |
13,401 | 13.57 | % | 3,952 | ³4.0 | % | 4,940 | ³5.0 | % | |||||||||||||||
| To be a well- | ||||||||||||||||||||||||
| capitalized bank under | ||||||||||||||||||||||||
| For capital | prompt corrective | |||||||||||||||||||||||
| Actual | adequacy purposes | action provision | ||||||||||||||||||||||
| Amount | Ratio | Amount | Ratio | Amount | Ratio | |||||||||||||||||||
| (in thousands of dollars) | ||||||||||||||||||||||||
2008: |
||||||||||||||||||||||||
Total capital
(to risk-weighted assets) |
||||||||||||||||||||||||
Consolidated |
$ | 152,517 | 10.87 | % | $ | 112,253 | ³8.0 | % | N/A | N/A | ||||||||||||||
Reliance Bank |
133,151 | 10.23 | % | 104,160 | ³8.0 | % | $ | 130,200 | ³10.0 | % | ||||||||||||||
Reliance Bank, FSB |
22,117 | 22.00 | % | 8,044 | ³8.0 | % | 10,055 | ³10.0 | % | |||||||||||||||
Tier 1 capital
(to risk-weighted assets) |
||||||||||||||||||||||||
Consolidated |
$ | 138,411 | 9.87 | % | $ | 56,102 | ³4.0 | % | N/A | N/A | ||||||||||||||
Reliance Bank |
121,099 | 9.30 | % | 52,080 | ³4.0 | % | $ | 78,120 | ³6.0 | % | ||||||||||||||
Reliance Bank, FSB |
21,355 | 21.24 | % | 4,022 | ³4.0 | % | 6,033 | ³6.0 | % | |||||||||||||||
Tier 1 capital
(to average assets) |
||||||||||||||||||||||||
Consolidated |
$ | 138,411 | 9.07 | % | $ | 61,028 | ³4.0 | % | N/A | N/A | ||||||||||||||
Reliance Bank |
121,099 | 8.57 | % | 56,503 | ³4.0 | % | $ | 70,629 | ³5.0 | % | ||||||||||||||
Reliance Bank, FSB |
21,355 | 17.30 | % | 4,937 | ³4.0 | % | 6,171 | ³5.0 | % | |||||||||||||||
On November 30, 2009, Reliance Bank’s Board of Directors entered into an Agreement (the
Agreement) with the Missouri Division of Finance and the Federal Deposit Insurance Corporation
(FDIC) to: (a) develop a plan to reduce the level of risk in each criticized asset aggregating
$2,000,000 or more included in the September 21, 2009 Missouri Division of Finance examination
report; (b) maintain the reserve for possible loan losses at a level which is reasonable in
relation to the degree of risk inherent in the Bank’s loan portfolio; (c) develop and adopt
policies and procedures designed to identify and monitor concentrations of credit, including
out-of-territory loans and loan participations purchased; (d) formulate plans to reduce the Bank’s
concentrations of credit, particularly in commercial real estate and land acquisition and
development lending; (e) review and revise the Bank’s formal loan policy to address weaknesses
noted in the September 21, 2009 Missouri Division of Finance examination report; (f) cease making
or extending loans which
F-43
Table of Contents
RELIANCE BANCSHARES, INC. AND SUBSIDIARIES
Notes to Consolidated Financial Statements
violate the Bank’s written loan policy, except in those instances in which the Board of Directors
has made a prior determination that a variance from loan policy is in the best interests of the
Bank, with such Board decisions appropriately documented in the minutes of the Board of Director
meetings; (g) develop a formal written profit plan, which will provide a three-year budget
projection for asset growth and dividend payouts to ensure Tier 1 leverage capital is maintained at
least a 7% level; and (h) maintain a Tier 1 leverage capital ratio of at least 7%, and other
capital ratios such that the Bank will remain well-capitalized, and not pay any dividends,
management fees or bonuses, or increase any executive salary or other compensation that would
reduce the Bank to a level below a well-capitalized status.
On February 10, 2010, Reliance Bank, FSB’s Board of Directors entered into a Memorandum of
Understanding (the OTS MOU) with the Office of Thrift Supervision (OTS) to: (a) develop a business
plan for the years ended December 31, 2010, 2011, and 2012 which shall include (1) strategies to
preserve and enhance the Bank’s capital sufficient to meet its needs and support its risk profile;
(2) achieve core profitability by the end of 2010; and (3) establish and maintain Board-approved
loan concentration limits expressed as a percentage of risk-based capital that takes into account
the Bank’s current capital position, local and regional market conditions, and the credit risks
posed by higher risk loans; (b) continue to take steps to identify, classify, and properly account
for problem assets, including but not limited to (1) conducting period asset quality reviews to
identify and assign appropriate classifications to all problem assets; (2) performing internal
impairment analyses for all problem assets identified; and (3) estimating potential losses in
identified problem assets, while establishing an appropriate reserve for loan losses for all
classified assets; (c) develop a detailed, written plan with specific strategies, targets, and
timeframes to reduce the Bank’s level of criticized assets; (d) review the adequacy of the Bank’s
reserve for loan losses policies, procedures and methodologies on at least an annual basis to
ensure the timely establishment and maintenance of an adequate reserve for loan losses account
balance; (e) identify and monitor all loan modifications and troubled debt restructurings, with
delinquent loans that are modified being classified as substandard and placed on nonaccrual status
for at least six months; (f) prohibit the increase in the dollar amount of brokered deposits; (g)
analyze the major differences in and bases for significant differences in the value of assets,
liabilities, and off-balance-sheet positions calculated by the OTS Net Portfolio Value and the
Bank’s internal economic value of equity model; and (h) correct all deficiencies and weaknesses
identified in the October 5, 2009 OTS report of examination.
On March 6, 2010, the Company entered into a Memorandum of Understanding (the Fed MOU) with the
Federal Reserve Bank of St. Louis (the Federal Reserve) requiring the Company to, among other
things, (a) utilize its financial and managerial resources to assist the Banks in addressing
weaknesses identified during their most recent regulatory examinations, and achieving/maintaining
compliance with any supervisory action between the Banks and their primary regulators; (b) declare
no corporate dividends without the prior written approval of the Federal Reserve; (c) incur no
additional debt without the prior written approval of the Federal Reserve; and (d) make no
distributions of interest or other sums on its preferred stock without the prior written approval
of the Federal Reserve.
On February 14, 2011, Reliance Bank’s Board of Directors entered into a Consent Order (the Consent
Order) with the FDIC to (a) develop a written management plan to have and retain qualified
management; (b) charge off adversely classified assets identified during the FDIC’s September 20,
2010 examination of Reliance Bank; (c) develop a written plan to reduce Reliance Bank’s risk
exposure in each asset in excess of $2,000,000 classified as substandard or doubtful in
F-44
Table of Contents
RELIANCE BANCSHARES, INC. AND SUBSIDIARIES
Notes to Consolidated Financial Statements
the FDIC’s Report of Examination for its September 20, 2010 examination; (d) not extend, directly
or indirectly, any additional credit to, or for the benefit of, any borrower who has a loan or
other extension of credit or obligation with Reliance Bank that has been, in whole or in part,
charged off or adversely classified as substandard or doubtful in the FDIC’s Report of Examination,
unless the denial of additional credit would be detrimental to Reliance Bank, as determined by the
Bank’s Board of Directors; (e) develop a written plan for systematically reducing and monitoring
the Bank’s concentrations of credit as listed in the FDIC’s Report of Examination, to an amount
that is commensurate with Reliance Bank’s business strategy, management expertise, size, and
location; (f) review and maintain an adequate reserve for loan losses on a quarterly basis; (g)
maintain minimum capital ratios of an 8% Tier 1 leverage capital ratio and 12% Total risk-based
capital ratio; (h) not increase salaries or pay bonuses for any executive officer, pay management
fees, or declare or pay any dividends; (i) review the liquidity, contingent funding, and interest
rate risk policies and plans and develop or amend such policies and plans to address how the Bank
will increase its liquid assets and reduce its reliance on volatile liabilities for liquidity
purposes; (j) not accept, increase, renew, or rollover any brokered deposits; (k) develop a written
three-year business/strategic plan and one-year profit and budget plan; (l) eliminate and/or
correct any violations of laws, rules, and regulations identified in the FDIC’s Report of
Examination; and (m) provide periodic progress reports on the above matters to the FDIC.
While no absolute assurance can be given, management of the Company and Banks believe the necessary
actions have been or are being taken toward complying with the provisions of the Agreement and OTS
and Fed MOUs. It is not presently determinable what actions, if any, the banking regulators might
take if the provisions of the Agreement and OTS and Fed MOUs are not complied within the specific
time periods required.
F-45
Table of Contents
RELIANCE BANCSHARES, INC. AND SUBSIDIARIES
Notes to Consolidated Financial Statements
NOTE 16 — QUARTERLY FINANCIAL INFORMATION (unaudited)
Following is a summary of quarterly financial information for the years ended December 31, 2010,
2009, and 2008:
| First | Second | Third | Fourth | For the | ||||||||||||||||
| quarter | quarter | quarter | quarter | year | ||||||||||||||||
2010: |
||||||||||||||||||||
Total interest income |
$ | 17,608,194 | 16,656,490 | 15,688,072 | 14,192,967 | 64,145,723 | ||||||||||||||
Total interest expense |
6,789,927 | 6,445,945 | 5,500,437 | 4,900,177 | 23,636,486 | |||||||||||||||
Net interest income |
10,818,267 | 10,210,545 | 10,187,635 | 9,292,790 | 40,509,237 | |||||||||||||||
Provision for possible
loan losses |
7,692,000 | 9,628,000 | 17,203,000 | 6,968,947 | 41,491,947 | |||||||||||||||
Noninterest income |
654,582 | 785,594 | 1,121,498 | 944,954 | 3,506,628 | |||||||||||||||
Noninterest expense |
7,754,512 | 7,563,930 | 8,919,948 | 15,502,344 | 39,740,734 | |||||||||||||||
Income before applicable
income taxes |
(3,973,663 | ) | (6,195,791 | ) | (14,813,815 | ) | (12,233,547 | ) | (37,216,816 | ) | ||||||||||
Applicable income taxes |
(1,474,958 | ) | (2,692,536 | ) | (5,960,479 | ) | 21,439,646 | 11,311,673 | ||||||||||||
Net loss |
(2,498,705 | ) | (3,503,255 | ) | (8,853,336 | ) | (33,673,193 | ) | (48,528,489 | ) | ||||||||||
Preferred stock dividends |
(548,891 | ) | (551,251 | ) | (553,879 | ) | (554,437 | ) | (2,208,458 | ) | ||||||||||
Net loss attributable to
common shareholders |
$ | (3,047,596 | ) | (4,054,506 | ) | (9,407,215 | ) | (34,227,630 | ) | (50,736,947 | ) | |||||||||
Weighted average shares
outstanding: |
||||||||||||||||||||
Basic |
20,972,091 | 21,221,753 | 22,569,372 | 22,680,721 | 21,867,606 | |||||||||||||||
Diluted |
20,972,091 | 21,221,753 | 22,569,372 | 22,680,721 | 21,867,606 | |||||||||||||||
Earnings per share: |
||||||||||||||||||||
Basic |
$ | (0.15 | ) | (0.19 | ) | (0.42 | ) | (1.51 | ) | (2.32 | ) | |||||||||
Diluted |
(0.15 | ) | (0.19 | ) | (0.42 | ) | (1.51 | ) | (2.32 | ) | ||||||||||
F-46
Table of Contents
RELIANCE BANCSHARES, INC. AND SUBSIDIARIES
Notes to Consolidated Financial Statements
| First | Second | Third | Fourth | For the | ||||||||||||||||
| quarter | quarter | quarter | quarter | year | ||||||||||||||||
2009: |
||||||||||||||||||||
Total interest income |
$ | 19,984,244 | 19,275,666 | 18,892,020 | 18,437,266 | 76,589,196 | ||||||||||||||
Total interest expense |
10,975,234 | 9,992,569 | 9,095,271 | 8,941,738 | 39,004,812 | |||||||||||||||
Net interest income |
9,009,010 | 9,283,097 | 9,796,749 | 9,495,528 | 37,584,384 | |||||||||||||||
Provision for possible
loan losses |
2,250,000 | 14,000,000 | 11,450,000 | 25,750,000 | 53,450,000 | |||||||||||||||
Noninterest income |
534,770 | 663,518 | 1,513,598 | 1,213,196 | 3,925,082 | |||||||||||||||
Noninterest expense |
7,241,132 | 8,698,061 | 8,726,761 | 9,380,435 | 34,046,389 | |||||||||||||||
Income before applicable
income taxes |
52,648 | (12,751,446 | ) | (8,866,414 | ) | (24,421,711 | ) | (45,986,923 | ) | |||||||||||
Applicable income taxes |
(38,226 | ) | (4,378,551 | ) | (3,091,023 | ) | (9,121,762 | ) | (16,629,562 | ) | ||||||||||
Net income (loss) |
90,874 | (8,372,895 | ) | (5,775,391 | ) | (15,299,949 | ) | (29,357,361 | ) | |||||||||||
Preferred stock dividends |
— | (557,111 | ) | (545,000 | ) | (545,000 | ) | (1,647,111 | ) | |||||||||||
Net income (loss) attributable to
common shareholders |
$ | 90,874 | (8,930,006 | ) | (6,320,391 | ) | (15,844,949 | ) | (31,004,472 | ) | ||||||||||
Weighted average shares
outstanding: |
||||||||||||||||||||
Basic |
20,746,267 | 20,855,898 | 20,918,020 | 20,935,083 | 20,864,483 | |||||||||||||||
Diluted |
20,818,840 | 20,859,102 | 20,918,020 | 20,935,083 | 20,881,108 | |||||||||||||||
Earnings per share: |
||||||||||||||||||||
Basic |
$ | <0.01 | (0.43 | ) | (0.30 | ) | (0.76 | ) | (1.49 | ) | ||||||||||
Diluted |
<0.01 | (0.43 | ) | (0.30 | ) | (0.76 | ) | (1.49 | ) | |||||||||||
| First | Second | Third | Fourth | For the | ||||||||||||||||
| quarter | quarter | quarter | quarter | year | ||||||||||||||||
2008: |
||||||||||||||||||||
Total interest income |
$ | 18,037,013 | 18,696,397 | 20,643,965 | 20,831,832 | 78,209,207 | ||||||||||||||
Total interest expense |
10,196,305 | 10,036,168 | 10,610,768 | 10,872,027 | 41,715,268 | |||||||||||||||
Net interest income |
7,840,708 | 8,660,229 | 10,033,197 | 9,959,805 | 36,493,939 | |||||||||||||||
Provision for possible
loan losses |
1,132,000 | 5,607,000 | 1,800,000 | 2,609,000 | 11,148,000 | |||||||||||||||
Noninterest income |
730,079 | 832,034 | 685,387 | 435,035 | 2,682,535 | |||||||||||||||
Noninterest expense |
7,079,589 | 7,770,425 | 7,800,871 | 6,776,705 | 29,427,590 | |||||||||||||||
Income before applicable
income taxes |
359,198 | (3,885,162 | ) | 1,117,713 | 1,009,135 | (1,399,116 | ) | |||||||||||||
Applicable income taxes |
49,100 | (1,514,610 | ) | 266,621 | 119,003 | (1,079,886 | ) | |||||||||||||
Net income (loss) |
$ | 310,098 | (2,370,552 | ) | 851,092 | 890,132 | (319,230 | ) | ||||||||||||
Weighted average shares
outstanding: |
||||||||||||||||||||
Basic |
20,668,304 | 20,673,419 | 20,687,321 | 20,728,599 | 20,669,512 | |||||||||||||||
Diluted |
21,227,572 | 21,119,050 | 20,920,384 | 20,865,356 | 21,063,065 | |||||||||||||||
Earnings per share: |
||||||||||||||||||||
Basic |
$ | 0.02 | (0.11 | ) | 0.04 | 0.04 | (0.02 | ) | ||||||||||||
Diluted |
0.01 | (0.11 | ) | 0.04 | 0.04 | (0.02 | ) | |||||||||||||
F-47
Table of Contents
SIGNATURES
Pursuant to the requirements of Section 13 or 15(d) of the Securities Exchange Act of 1934, the
registrant has duly caused this report to be signed on its behalf by the undersigned, thereunto
duly authorized.
RELIANCE BANCSHARES, INC. |
||||
| By: | /s/ Allan D. Ivie, IV | |||
| Allan D. Ivie, IV | ||||
| President and Chief Executive
Officer (Principal Executive Officer) |
||||
| By: | /s/ Dale E. Oberkfell | |||
| Dale E. Oberkfell | ||||
| Date: March 30, 2011 | Chief Financial Officer (Principal Financial and Principal Accounting Officer) | |||
52
Table of Contents
Pursuant to the requirements of the Securities Exchange Act of 1934, this report has been
signed below by the following persons on behalf of the registrant and in the capacities and on the
dates indicated.
| Name | Title | Date | ||
/s/ Allan D. Ivie, IV
|
President and Chief Executive Officer (Principal Executive Officer) |
March 30, 2011 | ||
/s/ Dale E. Oberkfell
|
Principal Financial and Principal Accounting Officer |
March 30, 2011 | ||
/s/ Robert M. Cox, Jr.
|
Director | March 30, 2011 | ||
/s/ Richard M. Demko
|
Director | March 30, 2011 | ||
/s/ Patrick R. Gideon
|
Director | March 30, 2011 | ||
/s/ Barry D. Koenemann
|
Director | March 30, 2011 | ||
/s/ Gary R. Parker
|
Director | March 30, 2011 | ||
/s/ James E. SanFilippo
|
Director | March 30, 2011 | ||
/s/ Lawrence P. Keeley, Jr.
|
Director | March 30, 2011 |
53
Table of Contents
| Name | Title | Date | ||
/s/ Jerry S. Von Rohr
|
Vice Chairman, Director | March 30, 2011 | ||
/s/ Scott A. Sachtleben
|
Director | March 30, 2011 |
54
Table of Contents
Index to Exhibits
3.1
|
Restated Articles of Incorporation of Reliance Bancshares, Inc. (filed as Exhibit 3.1 to the registrant’s Form 10 (File No. 000-52588) filed on April 27, 2007 and incorporated herein by reference). | |
3.2
|
Bylaws of Reliance Bancshares, Inc. (filed as Exhibit 3.2 to the registrant’s Form 10 (File No. 000-52588) filed on April 27, 2007 and incorporated herein by reference). | |
3.3
|
Certificate of Designation establishing Fixed Rate Cumulative Perpetual Preferred Stock, No Par Value, Series A, of Reliance Bancshares, Inc. (filed as Exhibit 4.1 to the registrant’s Form 8-K (File No. 000-52588) filed on February 23, 2009 and incorporated herein by reference). | |
3.4
|
Certificate of Designation establishing Fixed Rate Cumulative Perpetual Preferred Stock, No Par Value, Series B, of Reliance Bancshares, Inc. (filed as Exhibit 4.2 to the registrant’s Form 8-K (File No. 000-52588) filed on February 23, 2009 and incorporated herein by reference). | |
3.5
|
Corrected Certificate of Designation establishing Fixed Rate Cumulative Perpetual Preferred Stock, No Par Value, Series B, of Reliance Bancshares, Inc. (filed as Exhibit 4.3 to the registrant’s Form 8-K (File No. 000-52588) filed on February 23, 2009 and incorporated herein by reference). | |
3.6
|
Notice of Exempt Offerings of Securities for the issuance of Perpetual Convertible Preferred Stock, no par value, Series C. (Filed as Form D with the SEC on December 18, 2009 (File No. 021-137031) and incorporated herein by reference). | |
10.1
|
Employment Agreement between Reliance Bancshares, Inc. and Jerry S. Von Rohr, dated July 29, 1998 (filed as Exhibit 10.1 to the registrant’s Form 10 (File No. 000-52588) filed on April 27, 2007 and incorporated herein by reference). | |
10.2
|
Assignment of Employment Agreement between Reliance Bancshares, Inc., Reliance Bank and Jerry S. Von Rohr, dated June 16, 1999 (filed as Exhibit 10.2 to the registrant’s Form 10 (File No. 000-52588) filed on April 27, 2007 and incorporated herein by reference). | |
10.3
|
First Amendment to Employment Agreement between Reliance Bank and Jerry S. Von Rohr, dated September 1, 2001 (filed as Exhibit 10.3 to the registrant’s Form 10 (File No. 000-52588) filed on April 27, 2007 and incorporated herein by reference). | |
10.4
|
Employment Agreement between Reliance Bancshares, Inc., Reliance Bank and Dale E. Oberkfell, dated March 21, 2005 (filed as Exhibit 10.4 to the registrant’s Form 10 (File No. 000-52588) filed on April 27, 2007 and incorporated herein by reference). | |
10.5
|
2001 Incentive Stock Option Plan (filed as Exhibit 10.8 to the registrant’s Form 10 (File No. 000-52588) filed on April 27, 2007 and incorporated herein by reference). | |
10.6
|
2001 Non-Qualified Stock Option Plan (filed as Exhibit 10.9 to the registrant’s Form 10 (File No. 000-52588) filed on April 27, 2007 and incorporated herein by reference). | |
10.7
|
First Amendment of the 2001 Non-Qualified Stock Option Plan (filed as Exhibit 10.10 to the registrant’s Form 10 (File No. 000-52588) filed on April 27, 2007 and incorporated herein by reference). | |
10.8
|
Second Amendment of the 2001 Non-Qualified Stock Option Plan (filed as Exhibit 10.11 to the registrant’s Form 10 (File No. 000-52588) filed on April 27, 2007 and incorporated herein by reference). | |
10.9
|
2003 Incentive Stock Option Plan (filed as Exhibit 10.12 to the registrant’s Form 10 (File No. 000-52588) filed on April 27, 2007 and incorporated herein by reference). | |
10.10
|
2003 Non-Qualified Stock Option Plan (filed as Exhibit 10.13 to the registrant’s Form 10 (File No. 000-52588) filed on April 27, 2007 and incorporated herein by reference). |
55
Table of Contents
10.11
|
First Amendment of the 2003 Non-Qualified Stock Option Plan (filed as Exhibit 10.14 to the registrant’s Form 10 (File No. 000-52588) filed on April 27, 2007 and incorporated herein by reference). | |
10.12
|
Second Amendment of the 2003 Non-Qualified Stock Option Plan (filed as Exhibit 10.15 to the registrant’s Form 10 (File No. 000-52588) filed on April 27, 2007 and incorporated herein by reference). | |
10.13
|
2004 Non-Qualified Stock Option Plan (filed as Exhibit 10.16 to the registrant’s Form 10 (File No. 000-52588) filed on April 27, 2007 and incorporated herein by reference). | |
10.14
|
2005 Incentive Stock Option Plan (filed as Exhibit 10.17 to the registrant’s Form 10 (File No. 000-52588) filed on April 27, 2007 and incorporated herein by reference). | |
10.15
|
2005 Non-Qualified Stock Option Plan (filed as Exhibit 10.18 to the registrant’s Form 10 (File No. 000-52588) filed on April 27, 2007 and incorporated herein by reference). | |
10.16
|
First Amendment of the 2005 Non-Qualified Stock Option Plan (filed as Exhibit 10.19 to the registrant’s Form 10 (File No. 000-52588) filed on April 27, 2007 and incorporated herein by reference). | |
10.17
|
Agreement of Compensation Package between Jerry S. Von Rohr and the Compensation Committee of Reliance Bancshares, Inc., dated December 14, 2005 (filed as Exhibit 10.20 to the registrant’s Form 10 (File No. 000-52588) filed on April 27, 2007 and incorporated herein by reference). | |
10.18
|
Reliance Bancshares, Inc. 2005 Employee Stock Purchase Plan (filed as Exhibit 10.21 to the registrant’s Form 10 (File No. 000-52588) filed on April 27, 2007 and incorporated herein by reference). | |
10.19
|
2007 Non-Qualified Stock Option Plan (filed as Exhibit 10.26 to the registrant’s Amendment No. 2 to its Form 10 (File No. 000-52588) filed on July 19, 2007 and incorporated herein by reference). | |
10.20
|
Letter Agreement dated February 13, 2009 including the Securities Purchase Agreement — Standard Terms incorporated by reference therein between the Company and the Treasury (filed as Exhibit 4.3 to the registrant’s Form 8-K (File No. 000-52588) filed on February 23, 2009 and incorporated herein by reference). | |
10.21
|
Form of Omnibus Agreement between Reliance Bancshares, Inc. and each of Jerry S. Von Rohr, Dale E. Oberkfell, David S. Matthews, Daniel W. Jasper and Daniel S. Brown (filed as Exhibit 10.2 to the registrant’s Form 8-K (File No. 000-52588) filed on February 23, 2009 and incorporated herein by reference). | |
10.22
|
Waivers executed by each of Jerry S. Von Rohr, Dale E. Oberkfell, David S. Matthews, Daniel W. Jasper and Daniel S. Brown (filed as Exhibit 10.3 to the registrant’s Form 8-K (File No. 000-52588) filed on February 23, 2009 and incorporated herein by reference). | |
10.23
|
Employment Agreement between Reliance Bancshares, Inc. and Allan D. Ivie, IV dated June 4, 2010 (filed as Exhibit 10.1 to the Registrar’s Form 8-K filed on June 24, 2010 and incorporated herein by reference). | |
14.1
|
Reliance Bancshares, Inc. Code of Conduct and Ethics (filed as Exhibit 14.1 to the registrant’s Form 10 (File No. 000-52588) filed on April 27, 2007 and incorporated herein by reference). | |
21.1*
|
Subsidiaries of Reliance Bancshares, Inc. | |
31.1*
|
Chief Executive Officer’s Certification pursuant to Rules 13a-14(a) and 15d-14(a) under the Securities Exchange Act of 1934, as adopted pursuant to Section 302 of the Sarbanes-Oxley Act of 2002. | |
31.2*
|
Chief Financial Officer’s Certification pursuant to Rules 13a-14(a) and 15d-14(a) under the Securities Exchange Act of 1934, as adopted pursuant to Section 302 of the Sarbanes-Oxley Act of 2002. |
56
Table of Contents
32.1*
|
Chief Executive Officer Certification pursuant to 18 U.S.C. Section 1350, as adopted pursuant to Section 906 of the Sarbanes-Oxley Act of 2002. | |
32.2*
|
Chief Financial Officer Certification pursuant to 18 U.S.C. Section 1350, as adopted pursuant to Section 906 of the Sarbanes-Oxley Act of 2002. | |
99.1*
|
31 C.F.R. Section 30.15 Certification of Principal Executive Officer. | |
99.2*
|
31 C.F.R. Section 30.15 Certification of Principal Financial Officer. |
| __________________ |
| * | Filed herewith. |
57