Attached files
| file | filename |
|---|---|
| 8-K - FORM 8-K - DARLING INGREDIENTS INC. | d8k.htm |
 America’s leading provider of rendering, recycling
and recovery solutions to the nation’s food industry
…converting waste streams into sustainable feed and
fuel ingredients.”
Exhibit 99.1 |
 Forward-Looking Statements
This presentation contains forward-looking statements regarding the business
operations of Darling and the industry in which it operates.
These
statements
are
identified
by
words
such
as
“may,”
“will,”
“expect,”
“believe,”
“intend,”
“anticipate,”
“should,”
“estimate,”
“continue,”
and other words referring to events to occur in the future. These statements
reflect Darling's current view of future events and are based on its
assessment of, and are subject to, a variety of risks and uncertainties beyond its control,
including business and economic conditions in its existing markets that could cause
actual results to differ materially from those projected in the
forward-looking statements. Other risks and uncertainties regarding Darling, its business and the industry in
which it operates are referenced from time to time in the Company's filings with
the Securities and Exchange Commission. Darling is under no obligation to
(and expressly disclaims any such obligation to) update or alter its forward-looking statements
whether as a result of new information, future events or otherwise.
This presentation also contains information about Darling’s adjusted EBITDA,
adjusted net income and adjusted earnings per share, which are not measures
derived in accordance with GAAP and which exclude components that are important to
understanding Darling’s financial performance. Investors should recognize that
these non-GAAP measures might not be comparable to similarly titled
measures of other companies. These measures should be considered in addition to, and not as a
substitute for or superior to, any measure of performance, cash flows or liquidity
prepared in accordance with accounting principles generally accepted in the
United States. 2 |
 Founded in 1882 and
headquartered in Dallas, TX Approximately 3,300 employees
Listed on the NYSE (DAR)
LARGEST
renderer with over 130 locations nationwide in 42 states
LARGEST
bakery
waste
recycler
in
the
United
States
LARGEST
waste cooking oil recovery business in the country
LARGEST
grease
trap
maintenance
business
in
the
U.S.
One
of
LARGEST
private
fleets
of
tractors,
trucks
and
trailers
in
U.S.
–
over
5,000
units
Seeking
DOE
approval
to
begin
construction
of
LARGEST
animal fat to hydrocarbon facility in the
world with Valero Energy Corporation as our partner.
Converting
Waste
Inputs
into
“Value-Added”
Ingredients
to
Feed
and
Fuel
3
WE are America’s
Leading Provider of Rendering, Recycling
and Recovery Solutions to the Nation’s Food Industry |
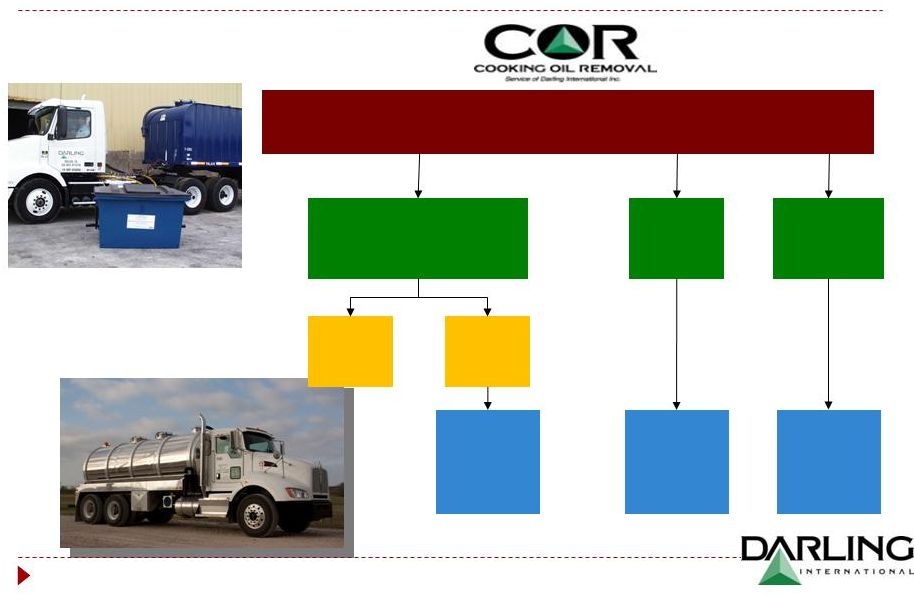
 Our
Platform Rendering
Cooking of non-edible meat products (beef, pork,
poultry) into usable ingredients
Collection and processing of spent cooking oil to
produce ingredients for animal feed or bio-fuel
Cooking Oil Removal
Grease trap cleaning and wastewater disposal
Industrial line-jetting
Sell indoor & outdoor grease collection equipment
Environmental Services/Equipment Sales
Collection of dough, ingredients and
sub-standard finished products to produce
high-calorie
ingredients
for
animal feed
Bakery Feed
Key Suppliers
End Products
o
Slaughter houses
o
Grocery stores
o
Food service preparation
o
Animal mortalities
o
Animal fats
o
Meat and bone meal
o
Poultry meals
Key Suppliers
End Products
o
Restaurant chains
o
Grocery stores
o
Food processing facilities
o
Yellow grease
Key Suppliers
End Products
o
Commercial bakeries
o
Snack food companies
o
High-calorie animal
feed
ingredients
Key Customers
o
Restaurants
o
Grocery stores
o
Commercial and industrial
(malls, hospitals)
4 |
 Rendering…. Our Core Business
Source: NRA/Harvard Risk Assessment, Supplier Relations U.S.
Raw material volumes expected to
increase
o
Meat production to feed the world
o
Strong exports to China and India
o
Integrated meat processers selectively moving to
outsource rendering activities
o
Consumer expectations of leaner meat products
Finished product prices increasing
o
Global bio-fuel mandates
o
A growing global population
o
Chinese consumption of soybeans and corn
Animal and food by-product recycling industry is
“mission critical”
in the food supply chain
Most efficient and environmentally sound disposal
alternative...reduces greenhouse gas (GHG)
~70 billion pounds of inedible by-products generated
annually
Rendering Industry
Rendering Industry Growth Drivers
5
Rendering –
turing this...
….into this |
 What
Does Rendering Do? Average Jacobsen Index Prices (at the
specified delivery point) Kills pathogenic organisms
o
Pathogens that may threaten human and animal health thrive on perishable organic
materials Protects the environment
Recycles nutrients:
o
For use in animal feed and in fertilizer
o
Prevents loading of soil with nitrogen and phosphorus
Recycles carbon:
o
Rendering captures carbon and nitrogen to avoid greenhouse gas emissions
o
Rendering
captures
many
times
more
carbon
than
it
emits
from
its
processes
Recycles energy:
o
Captures the energy in the raw materials and packages it into stable products that
can be stored, transported and used easily
o
All rendered products contain significant amounts of energy
o
Fats, greases and oils are nature’s way of concentrating and storing
energy o
Whether energy is measured in calories or as BTU, it is still energy
Provides control, verification and traceability to regulatory agencies and the
public that condemned or expired meat products are not re-used as human
food The industry does all of this within hours of receiving raw materials,
versus the weeks or months it takes some popular alternative methods
6 |
 Average Jacobsen Index Prices (at the specified delivery
point) What’s Available to the Rendering Industry to Recycle?
Wastes generated by the meat and food processing industries
Source
Amount
(million pounds)
On-farm and pre-slaughter
3,702.4
Inedible byproducts removed at slaughter
39,047.6
Downstream
Fat, bone and trim from processing
23,850.7
Expired meat from retail stores
3,960.4
Total
70,561.1
7
Source: USDA 2009 data |
 Source and Potential Volumes of Animal
Byproducts Available for Rendering
Specie
Weights in million pounds
Farm & pre-slaughter
losses
1
Slaughter
losses
2
Meat processing
losses
3,4
Grocery store
losses
4
Total
Beef
1,932.2
17,115.0
7,083.8
1,350.8
27,481.8
Pork
981.6
7,878.8
4,891.5
1,013.1
14,765.0
Lamb
64.1
214.2
119.2
30.7
428.2
Chickens
598.5
12,398.0
10,649.5
1,289.4
24,935.4
Turkey
126.0
1,441.6
1,106.8
276.3
2,950.7
Totals
3,702.4
39,047.6
23,850.7
3,960.4
70,561.1
Source: USDA 2009, data
1
USDA on-farm mortality and pre-slaughter data.
2
Calculated from USDA data for total live weight at slaughter minus carcass
weights. 3
Calculated from USDA data for meat available at retail subtracted from carcass
weights, adjusted for import and export data. 4
USDA Supermarket losses studies.
8
We estimate 40-50% of tonnage is available to non-integrated rendering
companies |
 Rendering: Producing Sustainable Green
Ingredients for Feed and Fuel
Rendering
Animal Fats
Pet
Food
Poultry
Feed
Hog
Feed
Animal
Feed
Pet
Food
Renewable
Fuels
Soap
Fertilizer
Lubricants
Textiles
Plastics
Shampoo
Emulsifiers
Cleaners
Creams
Esters
Paints
Plastics
Lubricants
Inks
Glues
Solvents
Antifreeze
Explosives
Rubber
Plastics
Tires
Lubricants
Finished
Products
Component
By-Products
Component
By-Products
Applications
Linoleic
Acid
Oleic
Acid
Glycerine
Stearic
Acid
Leather
9
Shoes
Garment
Auto Industry
Animal Proteins
Hides |
 Restaurant Services: Producing Sustainable
Green Ingredients for Feed and Fuel
Animal
Feed
Rubber
Plastics
Tires
Lubricants
Lubricants
Textiles
Plastics
Cleaners
Chemical
uses
Industrial
uses
Boiler fuel
Biodiesel
Green diesel
Energy
Finished
Products
Renewable
Fuels
Recovery of Used Cooking Oil
10 |
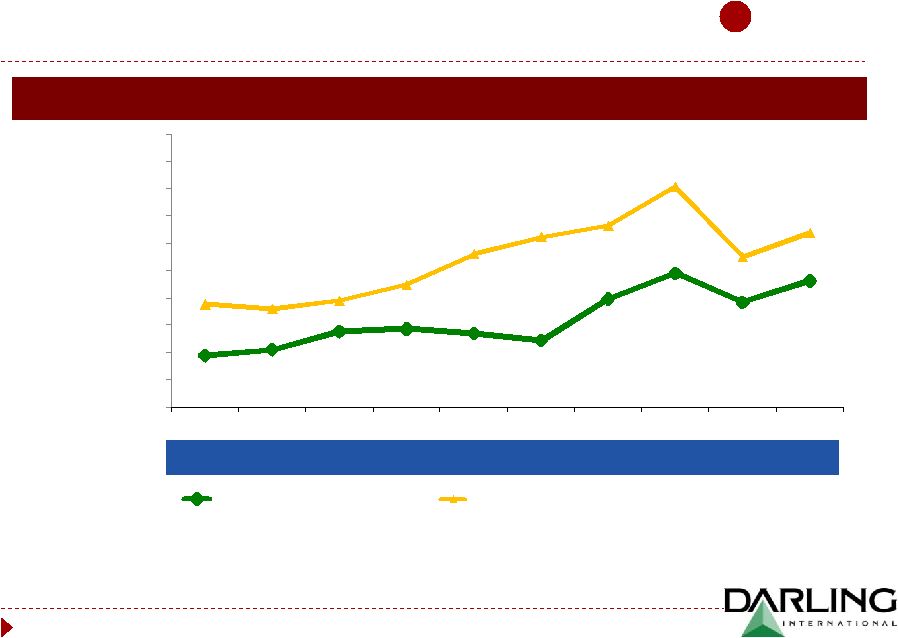
 Bakery Waste Recycling
Global Bakery Industry Revenue ($ millions)
Bakery Industry
5-10% of “scrape”
rate and growing
Additional food safety regulations and traceability
should help “scrape”
rates grow
Top tier food processors committed to stringent
sustainability initiatives require reliable company to
pick up and ensure product does not go to landfill or
get into food chain
DAR real estate allows for new growth opportunities
Finished product prices increasing
o
100% tied to corn
o
Priced as ingredient to poultry feed
o
Ethanol and Chinese demand will drive continued corn
price firmness
$351 billion U.S. bakery industry provides billions of
pounds of inedible bakery waste each year
Service wholesale baking, snacks, cookies and
crackers
Distribution centers are growing in importance
Commercial Baking Growth Drivers
Source: IBIS World
11 |
 Bakery: Producing Sustainable
Green Ingredients for Feed
Packaging is
burned for fuel
Raw Dough, Baked Goods, Snack Items
Dried and Standardized
Cookie Meal
12 |
 Environmental Services
#1 Grease Trap Maintenance and
Cleaning Service
Operates in 35 major markets
Significant synergies with our rendering and grease plants
Approximately 33,000 customers with ample customer bundling opportunities
Municipalities are driving increased regulation and enforcement
Positioned as a “Branded”
player
Used Cooking Oil Storage Tank Systems
Premium service offered in conjunction with COR
Leading equipment provider for used cooking oil collection
Installed inside or outside, this self-contained storage system
offers a clean, efficient and safe storage and collection option
13
(low cost wastewater disposal) |
 Grease Trap Maintenance
Wastewater is collected from Food Service Establishments
Solids are filtered
Solid waste is
Land filled
Fuel
Animal
Feed
14
Brown grease is
recovered |
 A
Platform of Value and Opportunity Green Diesel
Joint Venture
Positive Industry
Fundamentals
Growth and Margin
Expansion Opportunities
Strong Financial
Performance & Cash
Flow Generation
Attractive Business
Model with Solid
Risk Management
#1 Platform Across
the Food Recycling Spectrum
15
1
6
5
2
3
4 |
 Inputs Key Driver –
Animal Production
33 million cattle
(49% of live weight not used for human food)
110 million hogs
(44% not used for human food)
8-9 billion chickens
(37% not used for human food)
245 million turkeys
(36% not used for human food)
o
World population growth
o
U.S. is most efficient animal producer
o
Highest quality product in the world
U.S. Protein Production (million pounds)
U.S. Animal Agriculture Annual
Processing Volume
Producing approximately 68 Billion pounds of raw material
0
10,000
20,000
30,000
40,000
50,000
1970
1977
1984
1991
1998
2005
2012
2019
Poultry
Beef
Pork
1970
–
2009
CAGR:
3.8%
1970–2009 CAGR: 0.5%
1970–2009 CAGR: 1.2%
Source: Equity Research, USDA
16
1
Positive Industry
Fundamentals |
 2010
2011
2012
2013
2014
2015
2016
2017
2018
2019
2020
2021
2022
OTHER ADVANCED BIOFUEL
0.2
0.3
0.5
0.75
1.0
1.5
2.0
2.5
3.0
3.5
3.5
3.5
4.0
BIOMASS BASED DIESEL
1.15
0.8
1.0
1.0
1.0
1.0
1.0
1.0
1.0
1.0
1.0
1.0
1.0
CELLULOSIC BIOFUEL
0.1
0.25
0.5
1.0
1.75
3.0
4.25
5.5
7.0
8.5
10.5
13.5
16.0
CORN BASED ETHANOL
12.0
12.6
13.2
13.8
14.4
15.0
15.0
15.0
15.0
15.0
15.0
15.0
15.0
0.0
5.0
10.0
15.0
20.0
25.0
30.0
35.0
40.0
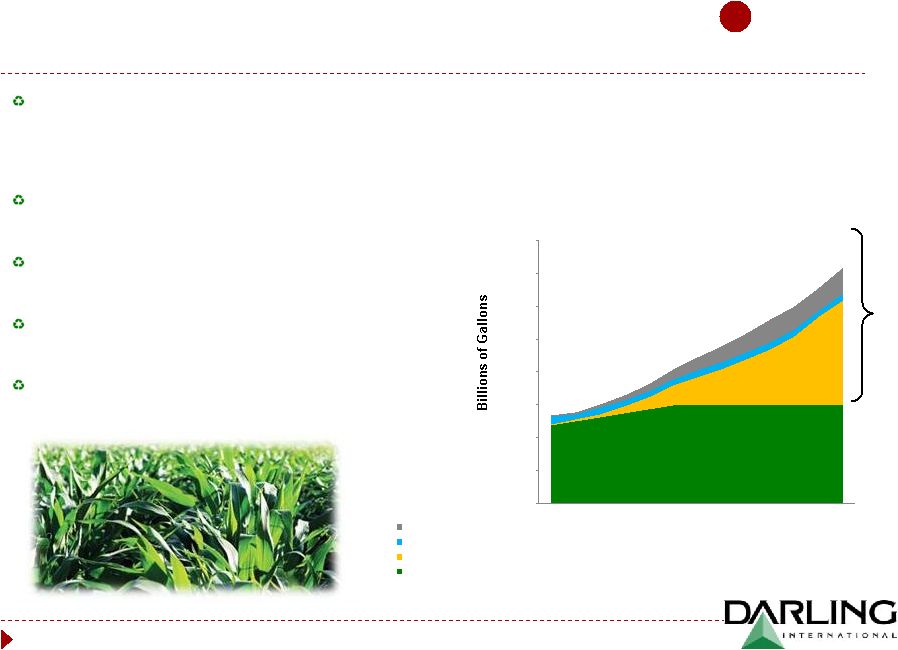
Inputs Key Driver –
Commodity Momentum
o
Biomass-based Diesel (BMD) cannot be less than 1
billion gallon/year beginning 2012
o
Only Renewable Diesel and Biodiesel can fulfill BMD
requirement
o
BMD can fulfill Other Advanced Biofuel requirement
While the agriculture complex is near historical
highs, it is not supply-constrained but is demand-
driven by global BIOFUEL mandates and strong
Chinese demand
Fuel mandates for ethanol and bio-mass fuels
continue to be implemented here and abroad
Renewable Fuel Standard 2 is our driver in the
United States
Tightening
“Fossil”
crude oil supplies are
constructive
No room in S&D for supply interruption globally for
any crop
Advanced
Biofuels
Source: EPA RFS2
17
1
Positive Industry
Fundamentals |
 Corn
Prices: “Firm for the Future” 1
Positive Industry
Fundamentals
World
Bio Fuel
Demand
South America
becomes Primary
World Supplier
U.S. Drought 1995/1996
Prod: 7.374 Billion bushels
Carryout: 426 Million bushels
2008 Commodity
Speculation Run
---------Billions of annual
bushels---------
CORN NON-ETHANOL SURPLUS
SUPPLY
DEMAND NO ETHANOL
99/00
9.4 9.0 0.4
00/01
9.9 9.2 0.7
01/02
9.5 9.1 0.4
02/03
9.0 8.5 0.5
03/04
10.1 9.0 1.1
04/05
11.8 9.3 2.5
05/06
11.1 9.6 1.5
06/07
10.5 9.1 1.4
07/08
12.5 9.0 3.5
08/09
12.0 8.5 3.5
09/10
13.1 8.5 4.6
10/11
12.5 7.7 4.8
Source: DTN Commodity Service
CBOT
Corn
Chart
-
1980 thru Present
18 |
 Darling’s National Platform –
A superior Platform to Assist Customers Nationwide
Network of over 130 facilities from coast to coast
Breadth to service national accounts
Footprint that allows Darling to grow organically and acquisitively
Darling International
Griffin Industries
Griffin locations only
Darling and Griffin locations
Darling locations only
2
#1 Platform Across
the Food Recycling
Spectrum
19 |
 Diverse Raw Material Suppliers
Diverse mix of beef, pork and poultry raw materials and the largest recycler of
bakery waste and cooking oil
Darling collects raw materials from:
o
Protein processors
o
Grocery stores
o
Butcher shops
o
Food service establishments
o
Bakeries
Processing plants generally within 150 miles of supplier facilities
Spoke and hub transfer station concept supports plant network
Darling’s relationship with its top suppliers averages over 20 years
The collection, processing and pricing of raw materials is key to Darling’s
success 20
2
#1 Platform Across
the Food Recycling
Spectrum |
 Strong Rationale for
Griffin Acquisition
Balances Raw Material Sources
Strategic Rationale
Completed missing link in national footprint
Diversification of raw materials supply
Acquired leading bakery recycling business
Collectively formed leading used cooking oil
recovery system
Provides us with additional feedstock for Valero
“Green Diesel”
joint venture
Synergy opportunities and growth platform
Well run, highly profitable and strong
management team
Evaluating 338(H)10 election
Darling 2009
Griffin 2009
Pro Forma 2009
Cooking Oil
12%
Beef/Pork
77%
Poultry
47%
Bakery
31%
Poultry
11%
Beef/Pork
10%
Cooking Oil
12%
Poultry
29%
Beef/Pork
40%
Bakery
21%
Cooking Oil
11%
Source: Company Management
Highly Diversified Business Platform
21
2
#1 Platform Across
the Food Recycling
Spectrum |
 Attractive Business Model
“Formula”
basis: fixed margin processing relationship with suppliers
“Non-formula”
basis: suppliers either paid a fixed price, not paid, or charged for the expense
of collection Finished product—
Value Addition
Raw material
procurement
Raw material
volume
Product yield
Natural gas and
diesel
prices
Processing & collecting
expenditures
We create value added ingredients from our inputs
Products are substitutes for corn, soybean oil and soybean meal
Quantity of raw material collected from Rendering, Bakery and Restaurant Services
suppliers Feed stock available to convert into finished goods
Yield on production (production volume / raw material volume) impacted by:
o
Quality of raw material
o
Type of raw material
Exposure to natural gas used for cooking and drying of material
o
Mitigated by ability to burn fats
Exposure to fuel prices through use of diesel fuel for trucks and
tractor-trailers Pricing formulas generally protect against natural gas
and fuel price fluctuations Labor cost
Replacement capex and equipment maintenance
Fuel and utilities
Other operating expenses
Key Metrics
3
Attractive Business
Model with Solid
Risk Management
22 |
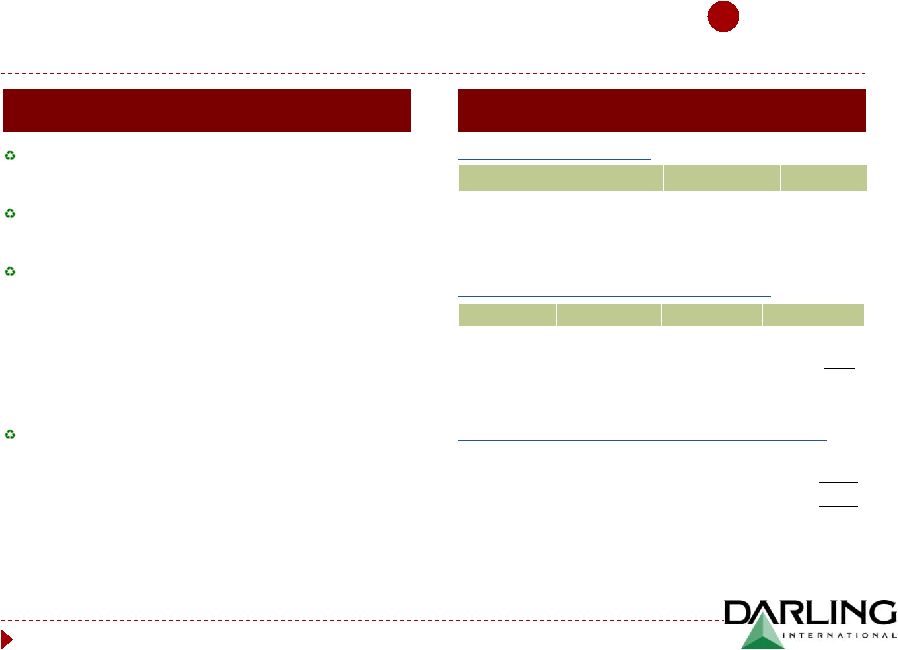 Built-In Margin and
Risk Management Tools
Darling Procurement
Darling Formula Pricing Example
Industry has evolved to a shared risk
procurement model
Pricing protocols reduce exposure to commodity
price fluctuation and provide minimum margins
Raw materials procured under two main pricing
arrangements:
o
Formula based Rendering (~70% of total
raw material volume)
o
Used cooking oil (~45% of total raw material volume)
o
Bakery waste is 100% formula tied to corn
Non-formula business generally has a service fee
o
Require supplier to pay Darling for waste removal
service
o
Adjusted to ensure collection costs are covered
Product
Finished price
Total yield
Animal Fats
$30.00cwt
26%
Protein Meals
$15.00cwt
22%
Note: Yield is based on individual supplier’s historical yields and is
adjusted as needed Product
Finished price
Total yield
Value
Animal Fats
$30.00cwt
26%
$7.80
Protein Meals
$15.00cwt
22%
$3.30
Finished product sales value
$11.10
Darling conversion cost with Energy adjuster
($6.00)
Darling fixed margin
($1.50)
Total processing cost
($7.50)
(Charge) / Rebate to supplier per cwt
$3.60
Source: Company Management
Note: When finished product sales value covers Darling’s cost and fixed
spread, a rebate to the supplier is generated. Conversely, when the
finished product sales value is less than Darling’s cost and fixed
spread, the supplier is charged for the difference. Indicative Formula
Terms Theoretical Finished Product Sales Value
Theoretical Darling (Charges)/Rebate to Supplier
23
3
Attractive Business
Model with Solid
Risk Management |
 Growth and EBITDA Expansion
Growth and Margin
Expansion
Opportunities
4
Growth and EBITDA Expansion Opportunities
National footprint will provide customer growth opportunities and potential
margin expansion
Value-adding of product streams and new waste inputs
Meaningful synergy opportunity
Bakery business will continue to expand and provide new geographic
opportunities for growth
Continue historical trend of bolt-on acquisitions
Solid history of successful integrations
24 |
 Focus on Premium and Value
Added Products
Strategic Focus on Premium and Value-Added Products
Premium Products Pricing Relative to Commodity Meals
Griffin’s Focus on Value-Add and Branding of Ingredients
Opportunity to move more of Darling’s
products into Griffin’s premium/value-added
products
Differentiated and value-added products drive
premium pricing
Value-added products sell for a significant
premium to commodity products
Provides margin expansion for Darling
Commodity Feed
Grade Poultry Meal
Griffin Pet –
Grade
Poultry Meal
Griffin Poultry Meal
(Flash Dried)
Griffin Low Ash
Poultry Meal
Source: Company Management
25
Growth and Margin
Expansion
Opportunities
4
25%
57%
+65%
+75%
+70%
2005
2009 |
 Synergy….delivery of value
Routing
improvements
(Florida,
Georgia,
Indiana,
Ohio
and
Texas
in
2011)
o
Closure of transfer stations & some small processing plants
o
Completed Florida integration in February, Georgia and Texas
underway
Scale
and
arbitrage
of
finished
products
to
proper
markets
Realignment
of
our
“Procurement
and
Services”
organizations
National
footprint
will
assist
in
servicing
national
chain
restaurants
Back
office
efficiencies
While limited overlap exists geographically, there is still significant
opportunity to capture synergies over time
26
Growth and Margin
Expansion
Opportunities
4 |
 A
proven track record of growth… Dec 2004
Burrows Industries,
Inc. dba Minuteman
Pumping
So CA
July 2007
Ace Grease Service
KC metro
Oct 2005
Southeastern
Maintenance &
Construction Inc.
FL, GA
Dec 2009
Sanimax USA
Great Lakes
May 2006
National By-
Products, LLC
Midwest US
2004
2005
2006
2007
2008
2009
2010
Dec 2008
J&R Rendering, Inc.
NYC metro
Aug 2008
API Recycling, div
of American
Proteins Inc.
GA
Feb 2009
Boca Transport,
Inc.
GA
June 2010
Nebraska By-
Products
NE, KS
27
On December 17, 2010 we acquired Griffin Industries for $840 million.
Growth and Margin
Expansion
Opportunities
4
Since 2003, Darling has acquired and integrated 10 companies investing over $1.1
Billion |
 Focus on Growing the Business…
Leader in the bakery waste business
o
Geographic opportunity to build or buy
o
Traceability and no landfill requirement
will drive growth
o
We sell 100% of output to our current
rendering raw material suppliers creating
long-term sustainable linkages
o
Current relationships with large commercial
bakeries, food companies and snack food
processors should create geographic
opportunity for expansion
Take advantage of the existing
Darling footprint
Growing the Bakery Business
Growing Rendering & Grease Collection
Darling is the leader in both rendering
and grease collection
o
Geographic opportunity to build or buy
o
Probably 10-20 meaningful geographic
candidates
Various large-scale acquisition
candidates
o
Succession driven
o
Timing unknown
28
Growth and Margin
Expansion
Opportunities
4 |
 A
Potential Game Changer…… Low quality animal fats to
hydrocarbon Green Diesel
Joint Venture
5
Proposed 50/50 JV with Valero subject to DOE Loan
Located adjacent to Valero’s St. Charles Refinery
Creates a new market for Darling’s feed stocks
Represents significant margin opportunity
Creates a natural hedge for Darling’s animal fat
products and improves pricing dynamics
Darling to commit $93 million of equity over the next
three years and the JV received conditional
commitment for a $241 million DOE loan on January
20, 2011
JV 10-year look back of ~$108 million of estimated
average annual EBITDA
Implementing next-generation renewable diesel technology
to open a new market for fats and oils
29 |
 What is Diamond Green Diesel?
9,300 Barrel Per Day
US$ million
Total Project Cost
~ $427
Partners Capital
$186
DOE Investment
$241
Animal Fat
1.1 billion lbs
Renewable
Diesel
LPG’s &
Naphtha
136.7 million
gallons
21.7 million
gallons
Annual
Annual
Source: Company Management
Note: Total Project Cost include cost to construct of approximately $360 million,
working capital, and other deal related costs (a portion of which may be
returned at a later date). Joint Venture between Darling International &
Valero Energy Corporation Ownership: 50/50
Management: Valero employees reporting to/directed by Joint Venture
Board Renewable Diesel Plant
Located next to Valero St. Charles
Refinery; Norco, Louisiana
30
Green Diesel
Joint Venture
5 |
 Diamond Green Diesel –
What are the Drivers of Profitability?
31
Renewable Fuel
Standard
Fuel Quality
Ability To Process
Low Cost Feedstock
RFS2 requires a MINIMUM of 1 billion gallons of Biomass-based Diesel
be blended annually in U.S. diesel pool
Only
two
products
can
fulfill
Biomass-based
Diesel
mandate
–
they
are
Renewable Diesel (or its co-products) and Biodiesel
Requirement could be more than 1.0 billion gallons annually as
Renewable Diesel also can fulfill the Other Advanced Biofuel Mandate
Renewable Diesel is a true Hydrocarbon (just like diesel fuel) while
Biodiesel is a methyl ester and is not a true hydrocarbon (containing an
oxygen molecule)
As a result Renewable Diesel can be distributed using the current
petroleum
distribution
system,
while
Biodiesel
requires
truck
or
rail
transport (as opposed to pipeline) and additional infrastructure
investment
Renewable
Diesel
has
no
cold
flow
issues
like
Biodiesel
Diamond Green Diesel process allows for use of low quality fats and oils
which traditionally price at substantial discount to feedstock which most
Biodiesel processors must use
Result is feedstock cost advantage of approximately $1.00/gallon
Green Diesel
Joint Venture
5 |
 Annual Average Price / Gallon
Why Darling is Investing
$0.95
$1.06
$1.39
$1.44
$1.36
$1.23
$1.99
$2.46
$1.93
$2.32
$1.89
$1.81
$1.96
$2.25
$2.81
$3.12
$3.33
$4.04
$2.76
$3.20
$0.00
$0.50
$1.00
$1.50
$2.00
$2.50
$3.00
$3.50
$4.00
$4.50
$5.00
2001
2002
2003
2004
2005
2006
2007
2008
2009
2010
Diamond Feedstock Cost
Average Diesel Price Plus $1.10 Green Premium
Source: Company Management
Green Premium is a combination of Renewable Identification Numbers, Federal Tax
Credit & wholesale price differential between #2 diesel fuel and Renewable
Diesel 32
Implied
Historical
EBITDA
(US$ million)
$105
$83
$47
$74
$148
$213
$130
$150
$80
$67
Green Diesel
Joint Venture
5 |
 The ultimate
built-in hedge!
As corn gets cheaper,
traditionally fat is cheaper and
our earnings are impacted.
Assuming petroleum pricing
remains stable to higher…
Cheaper Corn = Greater Earnings in
the “green diesel”
plant.
33 |
 Overview of St. Charles Refinery
Green Diesel Location
34
Green Diesel
Joint Venture
5 |
 Historical Financials
Strong Financial
Performance &
Cash Flow
Generation
6
Revenue (US$
millions)
Capex
(US$
millions)
1
EBITDA -
Capex (US$ millions)
EBITDA (US$ millions)
Source: Company Management
1
Griffin capex includes capex and investments, including acquisitions.
35
$1143
$1489 $1123 $1340
$213
$308 $190 $237
$178
$237 $121 $176
$35
$71 $69 $61 |
 36
Pro Forma: Balance Sheet
Strong Financial
Performance &
Cash Flow
Generation
6
Balance
Sheet
as
of
January
2011
(US
$
in
millions)
1/01/2011
Equity Adjustments
Pro Forma
Cash and cash equivalents
$19.2
$19.2
Restricted cash
0.4
0.4
Accounts receivables, net
103.7
103.7
Inventories
45.6
45.6
Other current assets
16.7
16.7
Total current assets
$185.6
$185.6
Property, plant and equipment, net
393.4
393.4
Collection route and contracts, net
391.0
391.0
Goodwill
376.3
376.3
Other assets
36.0
36.0
Total assets
$1,382.3
$1,382.3
Current portion of long-term debt
$3.0
$3.0
Accounts payable
70.1
70.1
Accrued expenses
81.7
81.7
Total current liabilities
$154.8
$154.8
Long-term debt
707.0
(292.7)
414.3
Deferred income taxes
5.4
5.4
Other non-current liabilities
50.8
50.8
Total liabilities
$918.0
$625.3
Stockholder's equity
464.3
292.7
757.0
Total liabilities and equity
$1,382.3
$0.0
$1,382.3
Darling
Combined Pro Forma |
 The
Original RECYCLING COMPANY….
Sustaining
Innovating
Renewing
Q&A
Q&A |