Attached files
| file | filename |
|---|---|
| EX-31.2 - CERTIFICATION - LENCO MOBILE INC. | lenco_10k-ex3102.htm |
| EX-14.1 - CODE OF CONDUCT - LENCO MOBILE INC. | lenco_10k-ex1401.htm |
| EX-99.1 - PRESS RELEASE - LENCO MOBILE INC. | lenco_10k-ex9901.htm |
| EX-21.1 - SUBSIDIARIES OF THE REGISTRANT - LENCO MOBILE INC. | lenco_10k-ex2101.htm |
| EX-32.1 - CERTIFICATION - LENCO MOBILE INC. | lenco_10k-ex3201.htm |
| EX-31.1 - CERTIFICATION - LENCO MOBILE INC. | lenco_10k-ex3101.htm |
UNITED STATES
SECURITIES AND EXCHANGE COMMISSION
Washington, D.C. 20549
FORM 10-K
|
þ
|
ANNUAL REPORT PURSUANT TO SECTION 13 OR 15(d) OF THE SECURITIES EXCHANGE ACT OF 1934
|
For the fiscal year ended: December 31, 2010
OR
|
¨
|
TRANSITION REPORT PURSUANT TO SECTION 13 or 15(d) OF THE SECURITIES EXCHANGE ACT OF 1934
|
Commission File Number: 000-53830
LENCO MOBILE INC.
(Exact name of registrant as specified in its charter)
|
Delaware
|
75-3111137
|
|
(State or other jurisdiction of
incorporation or organization
|
(IRS Employer Identification No.)
|
|
345 Chapala Street, Santa Barbara, California
|
93101
|
|
(Address of principal executive offices)
|
(Zip Code)
|
(805) 308-9199
(Registrant’s telephone number, including area code)
Securities registered pursuant to Section 12(b) of the Act:
|
Title of Each Class
|
Name of Each Exchange on Which Registered
|
|
|
None
|
None
|
Securities registered pursuant to Section 12(g) of the Exchange Act:
Common Stock, Par Value $0.001
Indicate by check mark if the registrant is a well-known seasoned issuer, as defined in Rule 405 of the Securities Act. o Yes x No
Indicate by check mark if the registrant is not required to file reports pursuant to Section 13 or Section 15(d) of the Exchange Act. o Yes x No
Indicate by check mark whether the registrant (1) has filed all reports required to be filed by Section 13 or 15(d) of the Securities Exchange Act of 1934 during the preceding 12 months (or for such shorter period that the registrant was required to file such reports), and (2) has been subject to such filing requirements for the past 90 days. x Yes o No
Indicate by checkmark whether the registrant has submitted electronically and posted on its corporate Website, if any, every Interactive Data File required to be submitted and posted pursuant for Rule 405 of Regulation S-T during the preceding 12 months (or for such shorter period that the registrant was required to submit and post such files). o Yes o No
Indicate by check mark if disclosure of delinquent filers pursuant to Item 405 of Regulation S-K is not contained herein, and will not be contained, to the best of the registrant’s knowledge, in definitive proxy or information statements incorporated by reference in Part III of this Form 10-K or any amendment to this Form 10-K. o
Indicate by check mark whether the registrant is a large accelerated filer, an accelerated filer, a non-accelerated filer, or a smaller reporting company.
|
Large accelerated filer o
|
Accelerated filer o
|
Non-accelerated filer o
|
Smaller reporting company x
|
Indicate by check mark whether the registrant is a shell company (as defined in Rule 12b-2 of the Exchange Act). o Yes x No
The aggregate market value of voting and non-voting common stock held by non-affiliates computed as of the last business day of Lenco Mobile Inc.’s most recently completed second quarter (June 30, 2010) was approximately $244,107,000 (based on the closing sale price of $6.00 on June 30, 2010). Shares of common stock held by executive officers, directors and by persons who own 10% or more of the outstanding common stock of the registrant have been excluded for purposes of the foregoing calculation in that such persons may be deemed to be affiliates. This does not reflect a determination that such persons are affiliates for any other purpose.
As of March 11, 2011, 71,145,659 shares of Lenco Mobile Inc.’s common stock were outstanding.
Documents Incorporated by Reference
Portions of the registrant’s Proxy Statement for the 2011 Annual Meeting of Stockholders are incorporated herein by reference in Part III of this Annual Report on Form 10-K to the extent stated herein. Such proxy statement will be filed with the Securities and Exchange Commission within 120 days of the registrant’s fiscal year ended December 31, 2010.
Lenco Mobile Inc.
Annual Report on Form 10-K
For the Fiscal Year Ended December 31, 2010
Table of Contents
|
Page
|
|||
|
EXPLANATORY NOTES
|
3
|
||
|
SPECIAL NOTE ABOUT FORWARD-LOOKING STATEMENTS
|
3
|
||
|
PART I
|
|||
|
Item 1.
|
Business.
|
4
|
|
|
Item 1A.
|
Risk Factors.
|
20
|
|
|
Item 1B.
|
Unresolved Staff Comments
|
33
|
|
|
Item 2.
|
Properties.
|
33
|
|
|
Item 3.
|
Legal Proceedings.
|
33
|
|
|
Item 4.
|
(Removed and reserved)
|
33
|
|
|
PART II
|
|||
|
Item 5.
|
Market for Our Common Equity, Related Stockholder Matters and Issuer Purchases of Equity Securities.
|
34
|
|
|
Item 6.
|
Selected Financial Data.
|
35
|
|
|
Item 7.
|
Management’s Discussion and Analysis of Financial Condition and Results of Operation.
|
36
|
|
|
Item 7A.
|
Quantitative and Qualitative Disclosure About Market Risk.
|
43
|
|
|
Item 8.
|
Financial Statements and Supplementary Data.
|
44
|
|
|
Item 9.
|
Changes in and Disagreements with Accountants on Accounting and Financial Disclosure.
|
74
|
|
|
Item 9A.
|
Controls and Procedures.
|
74
|
|
|
Item 9B.
|
Other Information.
|
76
|
|
|
PART III
|
|||
|
Item 10.
|
Directors, Executive Officers and Corporate Governance.
|
77
|
|
|
Item 11.
|
Executive Compensation.
|
77
|
|
|
Item 12.
|
Security Ownership of Certain Beneficial Owners and Management and Related Stockholder Matters.
|
77
|
|
|
Item 13.
|
Certain Relationships and Related Transactions and Director Independence.
|
77
|
|
|
Item 14.
|
Principal Accounting Fees and Services.
|
77
|
|
|
PART IV
|
|||
|
Item 15.
|
Exhibits and Financial Statement Schedules.
|
78
|
|
|
SIGNATURES
|
81
|
||
2
EXPLANATORY NOTES
In this annual report on Form 10-K, unless the context indicates otherwise, the terms “Lenco Mobile,” “Company,” “we,” “us” and “our” refer to Lenco Mobile Inc., a Delaware corporation, and its subsidiaries.
Special Note about Forward-Looking Statements
Certain statements in this report are “forward-looking statements.” Forward-looking statements reflect current views about future events and financial performance based on certain assumptions. They include opinions, forecasts, intentions, plans, goals, projections, guidance, expectations, beliefs or other statements that are not statements of historical fact. Words such as “may,” “will,” “should,” “could,” “would,” “expects,” “plans,” “believes,” “anticipates,” “intends,” “estimates,” “approximates,” “predicts,” or “projects,” or the negative or other variation of such words, and similar expressions may identify a statement as a forward-looking statement. Any statements that refer to projections of our future financial performance, our anticipated growth and trends in our business, our goals, strategies, focus and plans, and other characterizations of future events or circumstances, including statements expressing general optimism about future operating results and the development of our products, are forward-looking statements. Forward-looking statements in this report may include statements about:
|
·
|
Our ability to control operating costs and fully implement our current business plan;
|
|
·
|
Our ability to obtain future financing or funds when needed;
|
|
·
|
Our ability to successfully launch our mobile phone and internet services with new mobile telephone network operators (“Wireless Carriers”);
|
|
·
|
Our ability to obtain future financing or funds when needed and the timing and ability of Wireless Carriers to invest in and roll out their next generation mobile networks;
|
|
·
|
Our ability to respond to new developments in technology and new applications of existing technology before our competitors; and
|
|
·
|
Risks associated with acquisitions, business combinations, strategic partnerships, divestures, and other significant transactions which may involve additional uncertainties; and financial risk due to fluctuations in foreign currencies against the U.S. Dollar.
|
The forward-looking statements in this report speak only as of the date of this report and, except to the extent required by law, we do not undertake any obligation to update any forward looking statements. Forward-looking statements are subject to certain events, risks, and uncertainties that may be outside of our control. When considering forward-looking statements, you should carefully review the risks, uncertainties and other cautionary statements in this report as they identify certain important factors that could cause actual results to differ materially from those expressed in or implied by the forward-looking statements. These factors include, among others, the risks described under Item 1A and elsewhere in this report, as well as in other reports and documents we file with the SEC. Caution should be taken not to place undue reliance on any such forward-looking statements.
MARKET DATA AND INDUSTRY INFORMATION
Information regarding market and industry statistics contained in this report is included based on information available to us which we believe is accurate. We have not reviewed or included data from all available sources, and cannot assure stockholders of the accuracy or completeness of the data included in this report.
3
PART I
Item 1. Business.
Overview of Our business
We develop, own and operate mobile phone, internet and internet broadcasting advertising platforms that are used by mobile telephone network operators (“Wireless Carriers”), manufacturers, retailers and commercial enterprises (“Brand Owners”) to attract, monetize and retain relationships with consumers. During 2010, we have broadened our market reach to include mobile and internet monetization of advertising for terrestrial radio and “pure-play” internet broadcasters.
We offer Brand Owners the ability to design, manage and execute mobile and internet-based marketing campaigns, as well as terrestrial radio and “pure-play” advertising, using our proprietary advertising platforms. By using our platforms and proprietary technology, Brand Owners are able to access our state-of-the-art technology to:
|
·
|
Simplify the development and distribution of mobile phone, internet and internet broadcasting advertising;
|
|
·
|
Enhance the quality, appearance and delivery of their advertisements;
|
|
·
|
Reduce the cost of their advertising campaigns;
|
|
·
|
Improve the return on their advertising expenditure; and
|
|
·
|
Measure the level of response on each advertising campaign.
|
During 2010, we also continued to invest time and resources in order to expand our international mobile phone business. Connectivity with international Wireless Carriers forms a key component of our business plan. We have made significant progress in testing connectivity and initiating relationships with international Wireless Carriers in Mexico, Colombia, Singapore, the United Kingdom and the United States. We are currently connected to all the major U.S. Wireless Carriers through an aggregator and have specifically obtained approval from Verizon, AT&T and Sprint for selected mobile messaging campaigns. We have connected with Vodafone in the U.K. In South Africa, we are fully connected and operating with Vodafone SA (through their South African subsidiary “Vodacom”), are connected with MTN, and are currently testing with Telkom, and Cell C. We have signed an agreement to provide one of the leading banks in South Africa with a range of MMS-based marketing solutions and we are currently providing all of the major banks in South Africa with various mobile marketing solutions. Our mobile phone-based financial statement product has been accepted for use by Vodacom and a number of major Brand Owners including several of South Africa’s largest banks. We have received regulatory approval from the local tax authorities regarding compliance with the appropriate tax and communications regulations and have begun to prepare the roll-out the financial statement product to customers. In Mexico, we have successfully connected with Telcel and Iusacell and are currently testing via an aggregator in South Korea. In Singapore, we have successfully tested connectivity with M1 and StarHub, and are testing with SingTel. In Australia we have successfully executed a number of campaigns for Optus, using our server based bulk MMS messaging solution.
We have provided mobile marketing campaigns for Brand Owners such as Mr. Price, Electronic Arts, Alfa Romeo, BMW, First National Bank, Clinique, Vodacom, Vodafone, Makro, LG, Samsung, Nedbank, Ellerines, JD Group, VW, SONY, Nokia, Mitsubishi, Peugeot, Woolworths, Volvo, Virgin Mobile, Toyota, Toshiba, Sun International, Nissan, Land Rover, Ford, Fiat, Estee Lauder, Doritos, SABMiller, BlackBerry, Imperial, Hang Ten, MTN and Nike.
We have also designed, built, integrated and hosted mobi sites, which are internet sites that are accessed via a mobile phone, for many leading, blue chip Brand Owners including Mr. Price, Sasko Flour, Nike, Samsung, Morkels, Joshua Door, Dodos Shoes, Vodafone, MTN, VodaShop, Toyota South Africa, Volkswagen South Africa, Nokia, Makro, Super Sport Television Channel, First National Bank, Ellerine’s and Wetherlys.
Mobile Phone Advertising Platforms and Products
Our mobile phone advertising platform is based on our proprietary technology developed by us. We continually invest in our technical platforms to ensure that we remain market leaders in the mobile messaging sector. These software platforms facilitate the development of advertising content, compression of the advertisement to reduce file size, formatting the message to accommodate the configuration of various mobile phone handset models, and transmission of the advertisement through the Wireless Carrier’s network. During 2010, we have strengthened this platform with our acquisition of a fully integrated technical solution known as the Signaling Gateway (or “SGW”) from Angelos Gateway Limited. We now have the capability to provide MMSC, SMSC, Location-Based Services and USSD solutions using MM7 and SS7 protocols and to deliver high volumes of messages to mobile phones. Our mobile messaging platform is now one of the most advanced, if not the most advanced, in the SMS and MMS sector, with significant throughput capability. Our platform is attractive for both large wireless carriers looking to increase data throughput and smaller wireless carriers seeking to increase or initiate data revenues programs.
4
We provide Wireless Carriers with software and services which they use to manage and track the distribution of Short Message Services (“SMS”) messages and Multimedia Message Services (“MMS”) messages through their MMS Messaging Switch Center (“MMSC”). An SMS message is commonly referred to as a “text message”; it is a text based protocol which enables a mobile phone subscriber to send a text message from one mobile handset to another via a Wireless Carrier. An MMS message is similar, but the message contains multimedia content, such as pictures, audio or video content which is sent via a Wireless Carrier to a subscriber’s mobile handset. By making use of our MMS messaging platforms, a Wireless Carrier is able to enhance the revenue generated from its existing MMS network infrastructure, increase the efficiency of their MMSC, and improve the overall quality of the MMS messages which they deliver to their subscribers.
Wireless Carriers around the world are all looking to increase revenue and profits by growing the volume of data that they sell to their subscribers. Revenue from traditional voice usage is declining when measured by revenue per minute of voice usage and there is now a major drive to identify additional revenue streams from inter alia MMS messaging and solutions delivered via smart mobile phones. Our solutions are well-positioned in the mobile value chain to enhance Average Revenue Per User for the Wireless Carriers. We also believe that our business model offers Wireless Carriers a compelling value proposition which significantly reduces total cost of ownership.
Our MMS messaging platform is unique in that an MMS message compiled and delivered using our platform appears in video format on a mobile subscriber’s handset. In order to view the MMS messages, a mobile phone subscriber simply clicks to open the MMS message as if it was an SMS message, and the MMS runs automatically. Our MMS messages are not streamed, but are compressed and delivered directly into the mobile handset where they are permanently available to be viewed over again. The MMS message can be stored and retrieved at a later date, or forwarded to another mobile subscriber. Our MMS messaging platform is comprised of the following products and services:
|
·
|
FlightDeck: Our proprietary bulk MMS messaging server that is installed at the Wireless Carrier’s network infrastructure. FlightDeck delivers MMS messages in a fully automated, managed environment. FlightDeck can also prioritize an MMS campaign that is time sensitive so that the campaign is delivered at the right time and to the right mobile phone subscribers.
|
|
·
|
FlightPlan: Our mobile marketing campaign design and management system. FlightPlan takes the guesswork out of planning and designing MMS message campaigns, allowing qualified designers to efficiently construct a quality MMS message. FlightPlan offers Brand Owners and advertisers a simple to use graphical user interface that creates MMS messages.
|
|
·
|
Signaling Gateway: Our Signaling Gateway (“SGW”) platform manages the compilation and distribution of MMS and SMS messages for wireless carriers and brands. We are able to compress rich data files by up to 80% and deliver them through the MMSC and SMSC to mobile subscribers. Our MMS messages are fully-automated and delivered to mobile subscribers in full color. The compression technology used to deliver our messaging solutions allows our bulk MMS messaging server to deliver up to 1,000 MMS messages per second, per installation and has the capacity to send over 1 million MMS messages per hour. The SGW platform offers Location-Based Services as well as MM7 and SS7 protocol technology which is instrumental in Wireless Carrier communications processing.
|
|
·
|
The EPS server application: Enables a Wireless Carrier to deliver bulk MMS messaging outside of their core MMSC by uniquely encoding an MMS message. The EPS solution is designed to offer bulk A2P (Application to Person) MMS messaging capability. EPS has been successfully tested and installed at two of our current Wireless Carrier clients.
|
|
·
|
Build.mobi™: We design, build and manage a number of high-traffic mobi sites for our own use and for our clients. Mobi sites are internet sites that are designed for and accessed via a mobile phone. Mobi sites provide a full range of services, which can be used by consumers to access everything from bank accounts to mobile content sites.
|
|
·
|
MMS Greeting Card: MMS cards are digital cards that can be downloaded, customized and delivered by MMS message for special events. We have successfully deployed this solution in partnership with Vodacom, leading toVodacom increasing MMS messaging through put volumes.
|
|
·
|
Mobile Financial Statements: We have developed a unique mobile financial statement application, which delivers consumer statements directly into a mobile phone. The application includes a delivery report option, which proves receipt of the statement by the consumer. Once a mobile phone statement has been delivered into the physical handset, the consumer is able to securely access a mobi site that securely stores all of their relevant account information. We believe this application will have strong appeal to Wireless Carriers in developing countries where mobile subscribers have limited access to postal services or computers. According to the International Telecommunications Union, a specialized agency of the United Nations Organization, responsible for information and communications technology, 73% of mobile subscriptions are in the developing world. This represents a potential market of 3.8 billion mobile subscribers who have access to digitally delivered products on their mobile phones. A further benefit of the mobile phone statement application is the ability to significantly reduce the volume of paper and postage needed to communicate with consumers providing cost-savings and an improved carbon-footprint opportunity to our clients.
|
5
|
·
|
Mobile and internet advertising for terrestrial radio and “pure-play” internet broadcasters: We have broadened our market reach to include monetization of advertising for terrestrial radio and “pure-play” internet broadcasters. Through our Jetcast, Inc. acquisition (now called “Lenco Media Inc.”) and development of our UniveralPlayer™, we have an ad-serving platform which can monetize a listener base that as of January 2011 was ranked the number one in comScore’s Entertainment-Radio category in terms of unique audience, total minutes and total page views in the U.S. Display, pre-roll video and audio in-stream advertising monetized though delivery on our UniveralPlayer™, reaches an audience of approximately 40 million unique visitors per month, which we believe we will be able to monetize at attractive CPM (“cost per thousand”) prices for our customers.
|
|
·
|
Mobile Marketing Campaign and Promotion Management: Wireless Carriers and Brand Owners use our technologies to attract, monetize and retain relationships with consumers. We have significant expertise in managing mobile marketing campaigns to successfully reach consumers in a unique and effective way via mobile phones. Our blend of marketing expertise and a powerful platform provide us with significant advantages over the vast majority of other marketing companies trying to compete in the mobile space.
|
Our MMS messaging platforms are currently being used by Vodacom, one of the leading Wireless Carriers in Africa. Vodacom has approximately 30 million subscribers in Southern Africa and is part of the Vodafone Group which has 341 million proportionate subscribers worldwide. Vodacom accounted for approximately 33% of our total revenues during 2010 and approximately 23% of our revenues for the year ended December 31, 2009. We are currently in discussions to offer our MMS platforms and solutions to other carriers throughout the world. Our business goal is to create relationships with both Brand Owners and Wireless Carriers in as many countries as possible, and increase our appeal and ability to service global Brand Owners with their mobile phone advertising campaigns.
Internet and Internet Broadcasting Advertising Platforms and Products
Our internet advertising platform operates under the Lenco Multimedia Inc. (formerly “AdMax Media Inc.”). We provide Brand Owners with advertising products and services to reach out to consumers online in a highly-focused manner leading to better response rates on advertisements, higher quality leads and the ability to measure the success of each advertising campaign.
|
|
·
|
AdMaximizer Ad Placement. AdMaximizer provides cutting edge technology which is used by Brand Owners to generate consumer leads for their businesses. Our platform is designed to provide the Brand Owner with broad consumer access, better response rates on advertisements, higher quality leads and the ability to measure the success of each advertising campaign.
|
|
|
·
|
Lead Generation. We help our customers secure consumer leads through a number of methods, including opt-in programs (where consumers have elected to receive advertisements), on-line co-registration, display advertisements on third party websites and via our own websites. We have extensive relationships with internet publishers, who publish our advertisements and content on third-party websites. We also publish our own websites. We own approximately 1,157 websites and 2,867 URLs (Uniform Resource Locators or internet domains) that have been developed over many years and have an established history with the major search engines. We have worked over a period of years to drive traffic to our websites, link our sites with key partners, and take other steps designed to improve the ranking of our sites on major search engines and improve their appeal to consumers who view them. We also constantly monitor and perform search engine optimization on our sites to increase the profile of our sites on major search engines such as Google, Yahoo and Bing.
|
|
|
·
|
Consumer Database. We also own and manage a database with approximately 120 million unique names of individual consumers based in the United States. The database contains 50 million unique names where the customer has opted-in to accept offers from Brand Owners in one or more vertical industries owned or managed by us, together with 70 million unique names of consumers who have opted-in to accept offers from our ad-network publishing clients. This database is used to create a pool of prospective customers that we can approach on behalf of Brand Owners. We also track information concerning the consumers in the database to discern information concerning demographics, buying propensities, return rates and purchase defaults.
|
6
|
|
·
|
Internet broadcasting. Mobile and internet advertising for terrestrial radio and “pure-play” internet broadcasters: We have broadened our market reach to include monetization of advertising for terrestrial radio and “pure-play” internet broadcasters. Through our Jetcast, Inc. acquisition (now called “Lenco Media Inc.”) Lenco Media Inc. provides products designed to make internet broadcasting profitable for broadcasters and advertisers. Lenco Media Inc.’s UniversalPlayer™, RadioLoyalty™, ReplaceAds™ and Jetcast® streaming products eliminate costs and increase revenue for broadcasters and increase advertisers’ return on their advertising investment. As recently as January 2011, the Company’s internet radio advertising network was ranked number one by comScore in the “Entertainment-Radio” category with potential reach of 37.9 million unique visitors per month in the United States. Pandora, CBS Radio, AOL Radio, Yahoo Radio, Westwood One and Clear Channel are also included in the category. We view the acquisition as strategic in our efforts to develop an advertising company that provides Brand Owners with global access to new media channels and compelling technology. It also provides a mechanism to create and manage lists of consumers by interest groups. As we continue to expand the use of our UniversalPlayer™ to a large broadcaster base, we expect to see significant increases in revenue with this addition.
|
Our Strategy and Mission
There are approximately 5.3 billion mobile phone subscribers and 1.6 billion internet connections in the world today. We believe that there is a natural convergence between the mobile phone and the internet and that this convergence will take place at a faster and faster rate as the functionality resident in mobile phones increases. More and more mobile phones are being sold with internet browsing capability and a variety of smart applications. While data transfer rates for mobile phones have historically been the fastest in Southeast Asia, Wireless Carriers in the United States are investing in Long Term Evolution technology which will see downlink data rates of up to 100 megabits per second. This is sufficient speed to watch a television broadcast on a mobile phone while traveling in a car. The additional speed and functionality enhances the range of products and services which we are able to offer to our clients.
Brand Owners continuously compete for consumers on the basis of product features, quality and price. As a result, Brand Owners will continue to invest significant resources in developing ways to create, keep and leverage customers. In order to do this they will continue to use technology to improve service levels, delivery channels and the management of data. Our management has an intimate understanding of the mobile phone and internet markets and has developed a framework around which to continue growing our revenue through monetizing our products and services.
We believe that there are four primary reasons why consumers use their mobile phones or access the internet. These are information, communications, entertainment and to transact commerce. Many Brand Owners have failed to recognize the importance of engaging with clients at appropriate times and through appropriate channels. Our mission is to continue to assist our clients to create, keep and leverage their customers in a sustainable and competitive manner using our technology platforms.
Our strategy, based on current market conditions and opportunities, is as follows:
|
·
|
Expand the Wireless Carrier customer base for our mobile platforms: We plan to continue our focus on expanding our mobile phone technology platforms into new markets, using our success in South Africa as a reference for expansion into other territories. Our ultimate goal is to be able to afford Brand Owners global distribution for their online and mobile advertising campaigns.
|
|
·
|
Cross sell our mobile marketing and internet platforms: We believe that the ability to offer Brand Owners services for both internet and mobile advertising will expand the market that we can reach, and provide “single source” convenience that will assist us in retaining Brand Owners as clients.
|
|
·
|
Build and leverage a comprehensive database of consumer information: Starting with our existing database, we intend to build an opted-in database of customers who elect to receive targeted offers from our Brand Owner partners. We intend to expand and leverage our existing database of consumer information to improve the relevance, effectiveness and value of the advertising services we offer to Brand Owners. Because input costs have largely become commoditized, we believe that Brand Owners will increasingly view a well-managed customer relationship management and loyalty program focused on customer retention and driving incremental revenue as the best way to retain market share and ensure ongoing profitability.
|
Customers and Prospective Customers
In our mobile marketing business, we have two primary customers—the Wireless Carrier and the Brand Owner. Historically our mobile operations have been conducted in South Africa and Austraila. We are aggressively working to establish additional relationships with additional Wireless Carriers worldwide. These negotiations are at various stages and on the whole have been positive. We are continuing to expand our reach of mobile messaging products and services. Our business goal is to create relationships with both Brand Owners and Wireless Carriers in as many countries as possible, and increase our appeal and ability to service global Brand Owners in their mobile phone advertising campaigns.
7
|
·
|
South Africa: Our current primary Wireless Carrier customer is Vodacom; one of the leading Wireless Carriers in Africa. Vodacom has approximately 30 million subscribers in Southern Africa and is part of the Vodafone Group which has 341 million proportionate subscribers worldwide. Vodacom accounted for approximately 33% of our total revenues during 2010 and approximately 23% of our revenues for the year ended December 31, 2009. We are connected with MTN, and are currently testing with Telkom, and Cell C. We have signed an agreement to provide one of the leading banks in South Africa with a range of MMS-based marketing solutions and we are currently providing all of the major banks in South Africa with various mobile marketing solutions.
|
|
·
|
Australia: In Australia through our master license agreement in Australia for the mobile sector, which ran successful MMS messaging campaigns with the Wireless Carrier Optus during 2010, we earned our first revenues in Australia and expect to continue to generate revenues from that region. Also during 2011, we obtained another licensee of our mobile messaging platform with the addition of New Zealand.
|
|
·
|
Colombia: We have established offices in Bogota and are in the process of testing connectivity in Colombia.
|
|
·
|
Korea: We are currently testing with SK Telecom via an aggregator in South Korea
|
|
·
|
Mexico: In Mexico, we have successfully connected with Telcel and Iusacell.
|
|
·
|
Singapore: In Singapore, we have successfully connected with M1 and StarHub and are initiating testing with SingTel.
|
|
·
|
United Kingdom: We currently have connectivity with Vodafone in the U.K.
|
|
·
|
United States: In the United States, we entered into a commercial service agreement with OpenMarket, Inc. on September 17, 2009. OpenMarket is one of the largest aggregators of telecom services in the United States. Through OpenMarket we have access to carriers such as Sprint, Verizon and AT&T. We have successfully deployed our MMS messaging platform in initial tests with OpenMarket. We are in the process of setting up a sales and marketing infrastructure to approach Brand Owners in the United States through our Lenco Mobile USA Inc. subsidiary.
|
We have managed mobile marketing campaigns in Africa for Brand Owners of a number of global brands such as Mr. Price, Vodafone, MTN, Nedbank, Ellerines, JD Group, VW, Sony, Nokia, Mitsubishi, Peugeot, Woolworths, Volvo, Virgin Mobile, Toyota, Toshiba, Sun International, Nissan, Landrover, Ford, Fiat, Estee Lauder, Doritos, SABMiller, BlackBerry, Imperial, Hang Ten, Nike, Electronic Arts, Alfa Romeo, Clinique, Makro, LG, First National Bank, BMW and Samsung. Wireless Carriers themselves are Brand Owners and they currently use their own SMS and MMS network infrastructure to promote their products and services. Wireless Carriers are not only faced with declining average revenue per user but also high levels of churn. In order to promote customer retention, Wireless Carriers use MMS messaging to extend retention based offers to their mobile subscribers.
We have signed an agreement to provide one of the leading banks in South Africa with a range of MMS-based marketing solutions and we are currently providing all of the major banks in South Africa with various mobile marketing solutions. Our mobile phone-based financial statement product has been accepted for use by a number of major Brand Owners including several of South Africa’s largest banks. We have received regulatory approval from the local tax authorities regarding compliance with the appropriate tax and communications regulations. We currently experience a high level of repeat business from our clients, which we believe reflects the quality of our products and services.
Our internet and mobile and internet radio businesses sell to Brand Owner and advertising networks using our UniversalPlayer™ and through efforts in various vertical markets such as auto, mixed martial arts, and investing. Some of our customers include Citrix, Google and AOL.
Awards We Have Received
We have been invited to participate in various international mobile marketing competitions by regulatory bodies which oversee the marketing activities of the mobile sector.
In 2008, our campaign for Vodacom’s My Ad Me campaign won double gold and the Inkosi first place award at the 2008 Direct Marketing Association Awards. The awards were open to all Brand Owners who have used mobile marketing in the South African marketplace. More than seventy brands competed for the award.
In 2008, we won I Love Mobile Web awards in the Commerce and Retail Sector (1st place) for the Sasko Flour mobi site and in the Corporate category (3rd place) for the Vodacom Upgrade campaign. The I Love Mobile Web Awards are run under the auspices of the Mobile Marketing Association, based in New York City, New York. The awards are open to organizations that have demonstrated leading edge mobile capability and are judged by independent industry experts. More than one hundred companies and brands competed in the awards for 2008.
8
In 2009, we won the Mobile Marketing Association global award in the display category for the Europe, Middle East & Africa region for the Live Mobile Football soccer portal. The awards are open to all mobile advertising agencies and the more than 700 members of the Mobile Marketing Association.
In 2010, Multimedia Solutions, our wholly-owned South African subsidiary partnered with Mr. Price to win multiple awards at the 6th Annual Mobile Marketing Association Awards Ceremony. The Multimedia Solutions campaign designed and executed for Mr. Price was overall winner in the category for Global Relationship Building and regional winner for Europe, Middle East and Africa in the Products and Services Launch category. The Mobile Marketing Association is the world wide body that represents the interests of the wireless carriers and marketers in promoting use of mobile phones as a technology and marketing platform.
In addition, in 2010 the Multimedia Solutions campaign designed and executed for Mr. Price was also the overall winner in the South African Direct Marketing Association’s 2010 Annual Awards, wining the coveted Inkosi Assegai award. This award recognizes the top direct marketer in South Africa and is testimony to the rise of mobile phones as a marketing channel.
Trends in the Mobile Phone and Online Advertising Sectors
Wireless Carriers worldwide generally use one of two wireless transmission platforms: the Global System for Mobile (“GSM”) technology or the Code Divisible Multiple Access (“CDMA”) technology. There are currently some 800 GSM networks in 219 countries reaching 3 billion subscribers. According to the CDMA Development Group, there are 564 million CDMA subscribers, representing 321 Wireless Carriers in 121 countries using various CDMA technology platforms. Our MMS messaging platform can be integrated into either a GSM or CDMA network.
We believe that the market for our mobile and online advertising products and services will continue to grow dramatically for the foreseeable future. There are various factors driving this growth, including:
|
·
|
Wireless Carrier’s voice revenue, calculated in Average Revenue Per User or “ARPU,” is declining worldwide as a result of intense competition and commoditization of services.
|
|
·
|
Wireless Carriers are investing in data platforms which can be used to deliver services that will be charged for on a per use or per application basis.
|
|
·
|
Data transmission rates over wireless and wired networks are rapidly increasing which will provide the opportunity to deliver more sophisticated products and services to mobile handsets and computers.
|
|
·
|
Mobile phones provide one of the best direct marketing channels available today. Advertisements delivered via a mobile phone can be personalized, which traditional media cannot offer. Mobile phones offer the ability to communicate with consumers anywhere, anytime and at any place.
|
|
·
|
Advertising on mobile phones and online is less expensive to implement and can be rolled out much faster than traditional media. Moreover, Brand Owners are able to measure the response rates and uptake of offers delivered by mobile phones or accepted online.
|
|
·
|
The rapid evolution in the uses, functions and performance of technology-based products has impacted the way in which consumers shop, and, as a result, traditional marketing channels are becoming less effective. Paper coupons, an advertising mainstay for years, have seen declines in use and redemptions since 2006. However, online advertising and shopping has grown during this same period.
|
|
·
|
Both terrestrial and “pure play” internet radio broadcasters continue to seek to additional revenues and expanding audience reach through the use of mobile devices and the internet. Consumers have embraced mobile and internet as a means of transmitting radio programming, thus opening a new means of monetizing advertising spending and reaching consumers on mobile devices.
|
A further factor affecting Brand Owners is the recognition of the disproportionate cost of acquiring new customers as opposed to the cost of retaining existing customers. Mobile and online advertising campaigns can be personalized to meet individual consumer needs and behavior. As a result, strategic focus has moved towards retaining customers and profiling data in a predictive way with the ultimate goal of making better informed marketing decisions.
We believe that both our mobile phone and internet products and services provide Brand Owners of all sizes with the ability to create, keep and leverage customers. In the current economic downturn, businesses are all being forced to find more efficient and more innovative ways of managing and retaining their customers. In particular, almost every business is highly reliant on repeat customers and referrals in order to maintain market share and grow. We believe mobile phones and the internet offer the most cost effective way to reach these audiences.
9
For the year ended December 31, 2010, we generated approximately 75% of our revenues from the sale of mobile phone-related services in South Africa and 25% of our revenues from sales of internet products and services in the United States. For the year ended December 31, 2009, we generated approximately 63% of our revenues from the sale of mobile phone related services in South Africa and 37% of our revenues from sales of internet products and services in the United States. We plan to expand the geographic reach for our mobile and internet broadcast radio advertising products to other parts of the world to take advantage of the trends in the mobile phone and online advertising sectors.
Technology and Operations
Our operations and related infrastructure are located at our facilities in Santa Barbara, California, Johannesburg, South Africa, Mexico City, Mexico, Bogota, Colombia, and Singapore. We operate a data center located at our offices in Santa Barbara, California. This center houses the entire computer and communications infrastructure necessary to operate our business in North America, including our mobile phone as well as our internet and internet broadcasting advertising platforms. We employ onsite technical staff who are able to support our technology and services. We also have equipment for back-up facilities at a co-location facility monitored by a third-party data center operator in Los Angeles, California. We maintain a dedicated OC-48, 2.5 GBPS fiber optic connection between Santa Barbara and the co-location facility in Los Angeles. Both facilities provide video surveillance and access controls, and are serviced by onsite electrical generators, fire detection and suppression systems. Both facilities also have multiple Tier 1 interconnects to the internet.
Our staff manages and maintains our proprietary MMS messaging platform. We operate a number of our own high-speed servers which form the backbone of the FlightDeck, FlightPlan and SGW messaging platforms. We also provide managed servers which are installed at Wireless Carrier’s core network switching centers. These servers are highly secure and cannot be accessed from outside the Wireless Carrier network. We also make use of third-party server facilities to provide connectivity between our MMS messaging platforms and Wireless Carriers. We continually monitor these systems and enter into service level agreements with technology vendors, where necessary.
We build high-performance, availability and reliability into our product offerings. Our infrastructure is designed using load-balanced web server tools, redundant interconnected network switches and firewalls, replicated databases, and fault-tolerant storage devices. We safeguard against the potential for service interruptions at our third-party technology vendors by engineering fail-safe controls into our critical components. Scalability is achieved through use of advanced application partitioning to allow for horizontal scaling across multiple sets of applications. This enables individual applications and operating systems to scale independently as required by volume and usage. Production data is backed up on a daily basis and stored in multiple locations to ensure transactional integrity and restoration capability. Our applications are monitored 24 hours a day, 365 days a year by specialized monitoring systems that aggregate alarms to a human-staffed network operations center. If a problem occurs, appropriate engineers are notified and corrective action is taken. We are presently experimenting with the installation of a cloud computing network through which our products and services can be accessed securely and remotely. We believe that we will be able to deploy our services internationally, far more efficiently, using virtual servers. All client sensitive data will still remain securely stored on our own servers.
We own all of the hardware deployed in our MMS messaging and internet platform production environments. Changes to our production environment are tracked and managed through a formal maintenance request process. Production baseline changes are handled much the same as software product releases and are first tested on a quality control system, then verified in a staging environment, and finally deployed to the production system.
Research and Development
Historically, we have not experienced significant research and development expenses. Since February 2008, we have expanded our business through the selective acquisition of products and services which enhance our overall product offering. Our Multimedia Solutions subsidiary in South Africa has been in operation since 2004 and had completed development of its initial products at the time of our acquisition. We employ software engineers who provide a variety of services, including: customer support, content development, software maintenance and bug fixes, and the development of new features and functions for our products.
We have begun to incur research and development expense and we expect this amount to increase as we continue to develop and acquire unique technologies. Research and development expense for the years ended December 31, 2010 and 2009 were $533,000 and $262,000, respectively.
10
Intellectual Property
We have filed patent applications covering elements of our product and services offering, but no patents have been issued to date. We cannot be certain that current patent applications, or applications that we may file in the future, will result in the issuance of a patent or, even if a patent is issued, that it will provide a meaningful competitive advantage. We have not historically aggressively sought patent or copyright protection for software because of the requirement to publish the specific method or implementation of the technology as part of the application process. In those instances we rely on trade secret protection, including confidentiality agreements and invention contribution agreements with our employees and contractors to protect our rights in that technology.
Much of our technology, and the uniqueness of our solutions, is based upon software we have acquired or developed. This applies to our SGW MMS message technology which encodes, compresses and manages the way in which a MMS message is delivered over a Wireless Carrier’s network, as well as the EPS server technology, our AdMaximizer.com technology, Lenco Media Inc.’s UniversalPlayer™, RadioLoyalty™ and ReplaceAds™.
In some cases we rely on licensed software tools or engines which we use under open source or commercial licenses from third-parties. Some of the basic components that our products come from leading software and hardware providers including Oracle, Sybase, Sun, Dell, EMC, NetApp, Microsoft and Cisco while some components are constructed from leading Open Source software projects such as Apache Web Server, MySQL, Java, Perl and Linux. By striking the proper balance between using commercially available software and Open Source software, our technology expenditures are directed toward maintaining our technology platforms while minimizing third-party technology supplier costs. These licenses have various conditions to their use including payment of royalties, and authorship credit.
From time to time we may receive notices from third parties that we have violated their license, or that our products or services infringe upon their intellectual property rights. If we do not prevail in these disputes, we may lose some or all of our intellectual property protection, be enjoined from further sales of applications determined to infringe the rights of others and/or be forced to pay substantial royalties.
Sales and Marketing
Our mobile phone business is currently focused on developing relationships with both Brand Owners and Wireless Carriers, which will ultimately lead to them using our MMS messaging platform and other products. The relationship with the Wireless Carrier is the initial step to creating an advertising distribution channel that we can use to sell our services to Brand Owners. In many instances the Wireless Carriers also refer Brand Owners to us as potential customers, based on their satisfactory experience in using our products and services.
We sell to Wireless Carriers through both direct and indirect channels. Our Multimedia Solutions operation in South Africa has a dedicated sales team of 12 people which solicits additional business from Brand Owners. Our management team is experienced at selling products and services to both Wireless Carriers and Brand Owners and they are presently as varying stages in development of the markets for our mobile products and services in Singapore, the U.K., Vietnam, Thailand, South Korea, Indonesia, Malaysia, Mexico and China.
Where we can identify a qualified partner, we have entered into channel relationships for certain territories. We have master licensees in Australia, New Zealand and the United Kingdom to sell our products and services into those markets. Under the terms of the master license agreement we provide technology and sales support to these licensees via dedicated business development and technical personnel. These licensees have successfully established connectivity in these markets and are in the process of presenting our MMS products and services to Brand Owners in their respective regions. We have already begun to earn revenue from the Australian and New Zealand master license agreement in 2010. Master licensees will pay us a pre-agreed percentage of revenue for the support and access to our MMS messaging platform and an initial fee. We are exploring discontinuance of our U.K. master license arrangement and instead operate in the U.K. as a majority-controlled subsidiary in 2011. We have opened a subsidiary in the U.K., Lenco Mobile UK Ltd., to effect such a change; however, we cannot guarantee that we will complete such a change until we are further along in negotiations and legal efforts.
Once we have established a relationship with a Wireless Carrier for a particular region, we work with that Wireless Carrier to offer our mobile marketing products and solutions to the Wireless Carrier’s Brand Owner customers. In addition, where appropriate, we might contract with local advertising agencies that have relationships with Brand Owners. Our products and services afford the agency the opportunity to provide unique, effective and measurable campaigns for their Brand Owner clients. We supplement this reach to the Brand Owners with direct advertising that is targeted to the geographic region. In territories where there is high internet penetration we use the internet as a business development channel because the cost of identifying and securing customers is lower than other traditional media channels. In territories where there is less developed infrastructure we use the mobile phone as a business development channel. We believe that there is and will continue to be a logical convergence of the internet and the mobile phone and that as a result Brand Owners will continue to look for organizations who can service both marketing channels for them.
11
Our internet and mobile and internet radio businesses provide products designed to make internet broadcasting profitable for broadcasters and advertisers as well as other lead generation, data sales and list management services. Lenco Media Inc.’s UniversalPlayer™, RadioLoyalty™, ReplaceAds™ and Jetcast® brand streaming products eliminate costs and increase revenue for broadcasters and increase advertisers’ return on their advertising investment. We have five personnel at our Lenco Media Inc. subsidiary that handle direct sales to Brand Owners and sales of lead generation, data and list management services. We also use third-party advertising networks to generate sales for our mobile and internet radio business.
Our U.S. mobile sales team, under our Lenco Mobile USA Inc. subsidiary, consists of three staff members focused on sales of the Build.mobi™ product and deploying our mobile platforms in the United States in order to support our clients’ requests and new Brand Owner relationships.
Competition and Business Strengths
We face intense competition from a variety of organizations in both our mobile as well as our internet business. There are currently numerous organizations which provide various components of the mobile marketing value chain, but very few who provide the integrated range of mobile and online services which we have to offer. We believe that in the future we might compete directly with the Wireless Carriers if they decide to focus on developing platforms similar to our MMS messaging platform and possibly face competition from major online advertisers who wish to expand into the mobile arena.
The market for mobile applications and solutions is dependent on connectivity with a mobile handset through either the internet or via the Wireless Carrier. Browser based connections such as the Apple iPhone’s application are accessed by subscribers on a “pull” basis, as opposed to MMS services which are typically transmitted via the Wireless Carriers on a “push” to the subscriber when an outbound message is sent. We are able to deliver our products and services via both “push” or “pull” channels and as a result we believe that we are well positioned to address the market for both browser based and MMS delivered services. We recently presented a leading carrier in Asia a proposal to provide a mobile “app” solution and we will continue to explore avenues to develop these solutions.
Both Brand Owners and Wireless Carriers evaluate our services on a variety of levels including breadth of product offerings, price, product quality, porting abilities, ease of use, speed of execution, customer support and breadth of distribution relationships. We currently view our competitive position as follows:
|
|
·
|
We compete on the basis that our product offerings are fully-integrated and comprehensive. In this regard, we believe that we offer one of the most compelling end to end solutions available today for both our Wireless Carriers and Brand Owner clients. Our “one-stop” solution for online and mobile advertising allows us to monitor and coordinate the launch of campaigns across these two key digital media, which we believe is a competitive advantage.
|
|
|
·
|
We supply our products and services as a managed solution. This significantly reduces upfront costs for the Wireless Carriers and also allows us to price our products and services to meet new demand. We believe that our total cost of ownership model offers a compelling point of differentiation between us and our competitors, primarily because of our ability to provide reduced upfront capital costs for our Wireless Carrier clients.
|
|
|
·
|
We also compete on the basis of the quality of services that we provide. Our mobile phone platforms, including the FlightDeck, FlightPlan, SGW platform and the EPS server enable Brand Owners and Wireless Carriers to produce better quality mobile content and to efficiently reach the vast majority of handsets currently available.
|
|
|
·
|
Our FlightDeck, FlightPlan and SGW platforms contain porting capability to convert content to reach more than five thousand different operating system and handset model configurations needed to deliver an MMS message. Each handset manufactured by the leading suppliers such as Apple, BlackBerry, Nokia, Sony Ericsson, Motorola, LG and Samsung, and each operating system such as Symbian, Android and Windows Mobile, operate on different technical specifications. We are currently able to send an MMS message to both smart phones and any older handsets that have a color screen. We estimate that we are able to reach up to ninety percent of the handsets that are currently in use today
|
|
|
·
|
Our products and services have been designed to be user friendly. Our FlightPlan platform allows Brand Owners or content developers to assemble MMS messages in standard file formats and port them for distribution to thousands of unique handsets. FlightDeck allows us to connect to a Wireless Carrier’s network via a secure IP connection and manage MMS messaging campaigns remotely. We also provide unique solutions to minimize network bandwidth utilization and improve the speed of delivery of messages through the network. Our mobile phone platforms are tried and tested and can be sold or licensed to almost any of the more than 800 Wireless Carriers in the world today. By making use of our products and services, a Wireless Carrier is able to rapidly begin generating additional revenue. Because we use IP based connectivity interfaces we are able to deploy our services and solutions in far shorter time frames than competitors.
|
12
|
|
·
|
We have made a substantial commitment to providing high levels of customer services and we have been recognized by many of our customers for providing service excellence. We provide free customer support to all our customers. Our online marketing staff maintains contact with our advertisers and publishers to quickly resolve any client queries. Our mobile business staff has a proactive approach to dealing with our customers, and they are constantly in contact during the development phase of a campaign or when the campaign is being executed. Our senior management is on standby 24 hours to deal with major client queries.
|
|
|
·
|
Each of our Brand Owner customers as well as Wireless Carriers look to us as a source of incremental revenue generation. Brand Owners are looking for us to attract consumers for their products and services. Wireless Carriers earn a substantial part of their revenue from data and value-added services such as MMS messaging. Many of the MMS messages that we send out to subscribers are forwarded to other subscribers, thereby creating continuing revenue streams for the Wireless Carrier. By securing Brand Owners as new clients, we generate additional revenue for the Wireless Carriers. The higher the volume of MMS messages we distribute through the Wireless Carrier’s network, the more profit is generated for the Wireless Carrier. Our business goals are firmly aligned with that of our Brand Owner and Wireless Carrier clients.
|
While we compete and expect to continue to compete on the basis set out above, our competitors may have product offerings or other business advantages that Brand Owners or Wireless Carriers may find compelling. We believe that the most effective barrier to entry against competition is to build efficient, stable, secure and user friendly products and solutions that assist our clients to significantly enhance their businesses. Through this proactive approach, we believe that we will be able to achieve economies of scale which in turn will provide barriers to entry against competition and lead to first-mover advantages.
History of our Current Business and Corporate Structure
We were incorporated in 1999 in Delaware under the name of Shochet Holdings Corporation and we have been engaged in our current line of business, mobile and internet marketing, since early 2008. Prior to 2008, Shochet Holdings Corporation completed an initial public offering, underwent several changes of control and were engaged in several different businesses, which included discount brokerage, financial services, mortgage banking and apparel. Ultimately, we were operating as a shell company seeking a combination with another operating company. The following represents a history of our business and significant transactions:
|
|
·
|
In February 2008, we entered into an Exchange Agreement, pursuant to which our subsidiary Lenco International Ltd. acquired 100% of the outstanding shares of Digital Vouchers (Pty) Ltd., from Target Equity Limited, a British Virgin Islands company. Mr. Michael Levinsohn, our Chief Executive Officer, was the founder and principal executive officer of Digital Vouchers. Promptly upon completion of the acquisition, we appointed Mr. Levinsohn as our Chief Executive Officer with the objective of developing our mobile phone and internet marketing businesses internationally.
|
|
|
·
|
In July 2008, Lenco International Ltd. established Omara Investments Limited as a subsidiary corporation in the British Virgin Islands. On August 24, 2009, we changed the name of our subsidiary Omara Investments Limited to Omara Technology Services Ltd. On November 3, 2009 we changed the name of Omara Technology Services Limited to Lenco Technology Group Limited. Lenco Technology Group Limited (“Lenco Technology”) acts as our international licensing and managed services operation.
|
|
|
·
|
In August 2008, we acquired Capital Supreme (Pty) Ltd, a company based in Johannesburg, South Africa, doing business as Multimedia Solutions. Multimedia Solutions has been in operation as a mobile marketing company focused on MMS messaging solutions since 2005, and had ongoing business operations, customer relationships and revenue. Multimedia Solutions had developed several key software platforms and technologies including our FlightDeck and FlightPlan platforms as well as technologies for compressing MMS files and efficiently transmitting them through a Wireless Carrier’s MMSC and network.
|
|
|
·
|
In February 2009, we changed our name to Lenco Mobile Inc.
|
|
|
·
|
In February 2009, we entered into an asset purchase agreement with Superfly Advertising, Inc. (“Superfly”). In connection with the acquisition, Superfly transferred certain online advertising assets and liabilities from its Consumer Loyalty Group and Legacy Media business units to our newly formed subsidiary AdMax Media Inc., a Nevada corporation (“AdMax”). The assets we acquired from Superfly included principally our AdMaximizer™ software platform, advertising contracts with Brand Owners, relationships with a network of web publishers, 1,235 URLS, several hundred websites and content, consumer databases including over 120 million unique consumer records.
|
13
|
|
·
|
In October 2009, our AdMax Media Inc. subsidiary acquired certain assets of Simply Ideas, LLC. The assets acquired included websites, URLs, contracts and software platforms related to online advertising, primarily in the education industry.
|
|
|
·
|
In August 2010, our AdMax Media Inc. subsidiary entered into an asset purchase agreement with G2AA, LLC pursuant to which we acquired assets related to an online and mobile automotive marketing business.
|
|
|
·
|
In September 2010, we completed the acquisition of Jetcast, Inc. as a wholly-owned subsidiary. Pursuant to the merger agreement, we paid $500,000 in cash and issued 4,008,453 unregistered shares of our common stock to the former Jetcast stockholders. In addition, we agreed to pay up to approximately $4.3 million in cash and up to $20.7 million in the form of unregistered shares of our common stock issuable to the former Jetcast stockholders in connection with the achievement of future revenue targets.
|
|
|
·
|
In December 2010, Lenco Technology Group Ltd., (“LTG”) our wholly-owned subsidiary, entered into an asset purchase agreement with Angelos Gateway Limited (“Angelos”). In connection with the purchase and sale agreement, Angelos sold and transferred certain software and IP relating to the deployment of the Signaling Gateway (“SGW”) system.
|
|
|
·
|
In December 2010, AdMax sold the assets used in its educational lead generation service business (“EDU Vertical”) and the name, AdMax Media Inc.
|
|
|
·
|
In February 2011, we formally changed the name of our wholly-owned subsidiary Jetcast, Inc to Lenco Media Inc. In addition, we changed the name of our wholly-owned subsidiary AdMax Media Inc. to Lenco Multimedia Inc.
|
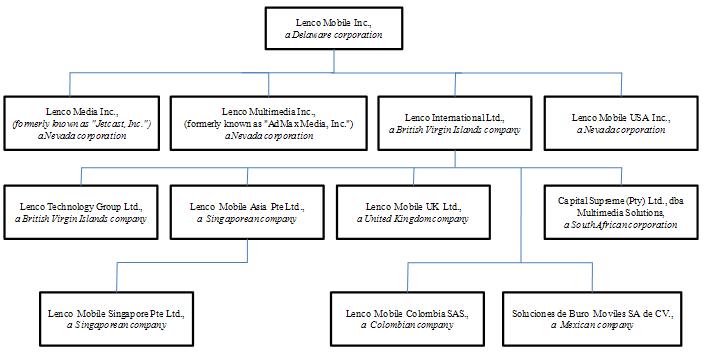
As a result of these transactions and other subsidiary formations, our current corporate structure is as follows:
Seasonality and Cyclical Fluctuations
Our advertising services business is subject to seasonal fluctuations related to the advertising spend by Brand Owners. The calendar third quarter is generally our weakest and the fourth quarter is generally our strongest, but this might vary from year to year. Other factors such as the general economic climate, the addition or loss of large customers will also to affect our business. In many cases Brand Owners plan their advertising campaigns up to one year in advance and we are dependent on their budgets for a significant percentage of our revenue. We are developing product solutions, such as our mobile phone statements, which will be less susceptible to seasonal fluctuations in revenue.
14
On December 30, 2010, we sold a significant portion of our internet business with the sale of the education lead generation business. This business had reached its pinnacle in revenue and profit performance for us in mid-2010 and began to significantly underperform from that point in time. Also, the online education sector garners ever-increasing legislative attention in the context of governmental budget cuts which we believe will hamper the ability of online schools to continue funding significant advertising dollars. We believe that we took the correct decision to sell the education lead generation business, given market circumstances. As such, we enter 2011 without the continuance of revenue in the education lead generation vertical.
Government Regulation
Laws and regulations that apply to internet communications, commerce and advertising are becoming more prevalent. These regulations could affect the costs of communicating on the Web and could adversely affect the demand for our advertising solutions or otherwise harm our business, results of operations and financial condition. The United States Congress has enacted internet legislation regarding children’s privacy, copyrights, sending of commercial email, and taxation. The United States Congress has passed legislation regarding spyware and the New York Attorney General’s office has sued a major internet marketer for alleged violations of legal restrictions against false advertising and deceptive business practices related to spyware.
The Controlling the Assault of Non-Solicited Pornography and Marketing Act of 2003, or CAN-SPAM Act, was adopted by the United States Congress as federal law and establishes requirements for commercial advertisements and specifies penalties for commercial mobile advertisements that violate the Act. In addition, the CAN-SPAM Act gives consumers the right to require advertisers to stop sending them commercial advertisements. The CAN-SPAM Act covers messages sent for the primary purpose of advertising or promoting a commercial product, service, or internet web site. The Federal Trade Commission, a federal consumer protection agency, is primarily responsible for enforcing the CAN-SPAM Act, and the Department of Justice, other federal agencies, State Attorneys General, and Internet Service Providers also have authority to enforce certain of its provisions.
The CAN-SPAM Act’s main provisions include:
|
|
·
|
Prohibiting false or misleading ad header information;
|
|
|
·
|
Prohibiting the use of deceptive subject lines;
|
|
|
·
|
Ensuring that recipients may, for at least 30 days after an ad is sent, opt out of receiving future commercial messages from the sender, with the opt-out effective within 10 days of the request;
|
|
|
·
|
Requiring that commercial ad be identified as a solicitation or advertisement unless the recipient affirmatively permitted the message; and
|
|
|
·
|
Requiring that the sender include a valid postal address in the ad message.
|
The CAN-SPAM Act also prohibits unlawful acquisition of recipients’ addresses, such as through directory harvesting, and transmission of commercial mobiles by unauthorized means, such as through relaying messages with the intent to deceive recipients as to the origin of such messages.
Violations of the CAN-SPAM Act’s provisions can result in criminal and civil penalties, including statutory penalties that can be based in part upon the number of advertisements sent, with enhanced penalties for commercial advertisers who harvest recipients’ addresses, use dictionary attack patterns to generate mobile addresses, and/or relay advertisements through a network without permission.
The CAN-SPAM Act acknowledges that the internet offers unique opportunities for the development and growth of frictionless commerce, and the CAN-SPAM Act was passed, in part, to enhance the likelihood that wanted commercial ad messages would be received. We believe we are a leader in developing policies and practices affecting our industry and that our permission-based mobile marketing model and our anti-spam policy are compatible with current CAN-SPAM Act regulatory requirements. We are a founding member of the Email Sender and Provider Coalition, or ESPC, a cooperative industry organization founded to develop and implement industry-wide improvements in spam protection and solutions to prevent inadvertent blocking of legitimate commercial advertisements. We maintain high standards that apply to all of our customers, including non-profits and political organizations, whether or not they are covered by the CAN-SPAM Act.
The CAN-SPAM Act preempts, or blocks, most state restrictions specific to email, except for rules against falsity or deception in commercial advertisements, fraud and computer crime. The scope of these exceptions, however, is not settled, and some states have adopted email regulations that, if upheld, could impose liabilities and compliance burdens on us and on our customers in addition to those imposed by the CAN-SPAM Act. Moreover, some foreign countries, including the countries of the European Union and Israel, have regulated the distribution of commercial advertisements and the internet collection and disclosure of personal information. Foreign governments may attempt to apply their laws extraterritorially or through treaties or other arrangements with U.S. governmental entities.
15
Our Wireless Carrier and Brand Owner customers may be subject to the requirements of the CAN-SPAM Act, and/or other applicable state or foreign laws and regulations affecting electronic marketing. If our customers’ mobile campaigns are alleged to violate applicable laws or regulations and we are deemed to be responsible for such violations, or if we were deemed to be directly subject to and in violation of these requirements, we could be exposed to liability.
Our standard terms and conditions of sale require our customers to comply with laws and regulations applicable to their mobile marketing campaigns and to implement any required regulatory safeguards. We take additional steps to facilitate our customers’ compliance with the CAN-SPAM Act, including the following:
|
|
·
|
New customers signing up for our services must agree that they will send advertisements through our service only to persons who have given their permission;
|
|
|
·
|
When a contact list or database is uploaded, the customer must certify that it has permission to contact each of the addressees;
|
|
|
·
|
When an individual indicates that they want to be added to a mailing list, they may receive a confirmation email and may be required to confirm their intent to be added to the contact list, through a process called double opt-in; and
|
|
|
·
|
We electronically inspect all of our customers’ contact lists to check for spam traps, dictionary attack patterns and lists that fail to meet our permission standards.
|
Our operations are also subject to general laws related to advertising. The Federal Trade Commission (“FTC”) conducted an investigation into certain segments of the internet advertising industry, which included Commerce Planet, Inc., an entity which sold certain assets to Superfly Advertising Inc. The FTC brought an action against Commerce Planet, Inc., Michael Hill (currently the President of Lenco Multimedia Inc.) and certain officers of Commerce Planet, Inc. The FTC alleged that during the period from 2005 to 2008, Commerce Planet, Inc. used certain billing practices in connection with its online supplier business that were misleading, including (i) the use of “negative option features” where a consumer’s failure to take affirmative action to reject products or services were interpreted as acceptance of an offer, and (ii) the failure to clearly and conspicuously disclose all material terms of an offer and any refund or termination policy. Mr. Hill, without admitting any of the allegations and denying any wrongdoing, entered into a stipulated judgment and order with the FTC to settle this action in November 2009. The monetary judgment against Mr. Hill was suspended based on his transfer to the FTC of cash, promissory notes and other claims with a value of approximately $700,000. The stipulated judgment also imposed certain permanent injunctions against Mr. Hill, and any person or entity in active concert or participation with him, including: (i) prohibitions against misrepresenting any material fact in connection with the advertising, promotion, offering or sale of a product or service, (ii) requirements to clearly and conspicuously disclose all costs and terms of an offer, including any refund policy, and (iii) a requirement to obtain express informed consent from a consumer prior to using any billing information to obtain payment for a product or service. The permanent injunctions proscribed in the stipulated judgment are consistent with recently adopted FTC guidelines for the internet advertising industry as a whole. Compliance with these new FTC guidelines may adversely affect our ability to operate in the lead generation sector.
In addition, the FTC has recently issued its report on Self-Regulatory Principles for Internet Behavioral Advertising that promotes principles designed to encourage meaningful self-regulation with regard to internet behavioral advertising within the industry. As evidenced by such report, the FTC maintains its support of self-regulation within the industry, however its message strongly encourages that industry participants come up with more meaningful and rigorous self-regulation or invite legislation by states, Congress or a more regulatory approach by the FTC. Such legislation or increased regulatory approach by the FTC may adversely affect our ability to grow the Company’s media division and effectively grow its behavioral targeting platform. Other laws and regulations have been adopted and may be adopted in the future, and may address issues such as user privacy, spyware, “do not email” lists, pricing, intellectual property ownership and infringement, copyright, trademark, trade secret, export of encryption technology, click-fraud, acceptable content, search terms, lead generation, behavioral targeting, taxation, and quality of products and services. This legislation could hinder growth in the use of the Web generally and adversely affect our business. Moreover, it could decrease the acceptance of the Web as a communications, commercial and advertising medium. The Company does not use any form of spam or spyware and has policies to prohibit abusive internet behavior, including prohibiting the use of spam and spyware by our Web publisher partners.
Consumer Protection and Privacy Rights
We do not facilitate the delivery of spam messages to mobile phone subscribers. Prior to the delivery of an MMS message we ensure that there is an existing relationship between us, the Wireless Carrier or the Brand Owner and the subscriber to whom the message is being delivered, in which the subscriber has agreed to receive advertising messages. We believe that a mobile phone is a personal communications device and that it should not be abused.
16
We collect personally identifiable information from consumers with the consumer’s permission. The consumer provides this permission by opting into one of our programs. We store personally identifiable information securely and do not use the data without the explicit, knowing permission of the consumer which is gained at the time we collect the data.
Our Wireless Carriers or Brand Owner customers retain the right to use data they have obtained through explicit permission from a consumer; for example, if a consumer provides an email address to receive information and updates. We rely on our customers’ consumer privacy policies and practices, as well as the consumer privacy policies and practices of the publisher websites included in each advertising campaign. If our Wireless Carriers or Brand Owner customers provide databases of their consumers, we can use this data on behalf of those customers, again pursuant to their consumer privacy policies. We rely on our Wireless Carriers and Brand Owner customers to collect and maintain such data with the appropriate precaution and responsibility as stated in their privacy policies. The premise is that both the website providing the ad space and the advertiser (1) have an opt-in relationship with the customer, (2) have an opportunity to share their consumer privacy policies with their customer, and (3) provide an opportunity to opt-out.
We collect certain technical data (such as type of browser, operating system, domain type, date and time of viewer’s response) when serving internet advertisements. This type of information is defined by the Network Advertising Initiative as non-personally identifiable information. In addition, we use non-personally identifiable information that we receive from websites, pursuant to their consumer privacy policies, about their visitors’ general demographics and interests in order to target appropriate advertising to the websites.
We use “cookies,” among other techniques, to measure and report non-personally identifiable information to advertisers, such as the number of people who see their advertisements or emails and the number of times people see the advertisement. A cookie is a small file that is stored in a web user’s hard drive. Cookies cannot read information from the web user’s hard drive; rather they allow websites and advertisers to track advertising effectiveness and to ensure that viewers do not receive the same advertisements repeatedly. Cookies, by themselves, cannot be used to identify any user if the user does not provide any personally identifiable information. They can be used, however, to record user preferences in order to allow personalization features such as stock portfolio tracking and targeted news stories.
We are compliant with the Platform for Privacy Protection Project, or P3P, compliance criteria. P3P is the most current privacy standard effort in our industry, providing simple and automated privacy controls for internet users.
Code of Ethics and Business Conduct
We have adopted a Code of Ethics and Business Conduct (“Code of Ethics”) for our officers, directors, employees, agents, and consultants. The Code of Ethics addresses inter alia such issues as conflicts of interest, corporate opportunities, confidentiality, fair dealing, protection and proper use of Company assets, compliance with applicable laws (including insider trading laws), and reporting of illegal or unethical behavior. We are committed to ensuring transparent and good corporate governance in our dealings with all stakeholders.
Corporate Culture and Employees
We are proud of our achievements and of the contribution that our employees have made to build our business to date. We support a culture of debate and dialogue pertaining to all material aspects of our business and we strive to go above and beyond to look after the people who work in our business. We believe that our future is inextricably linked to the quality and well being of our people. We operate in an environment that is dependent on talent to create and deliver new and innovative technologies. Besides creating a safe, secure and stimulating work environment, we believe that we should create an opportunity for our employees to receive compensation at the upper end of comparative market related scales.
As we expand internationally, we will be exposed to new languages, cultures and people. We will always endeavor to be sensitive to the new environments into which we expand and recognize that our success is dependent on our ability to manage diverse people in these different geographical regions.
We believe that we have a role to play in setting an example as an organization. We believe that collectively we can make a difference to millions of lives by introducing products and services which positively impact on the way people live, how they communicate and how they go about their day to day business. There are few other industries beside telecommunications that can impact on people’s lives so quickly and in such a meaningful way. The ability to send an MMS picture from one part of a country to another has and will continue to change the lives of many people. By developing products and services that are sensitive to the environment we can also make our small contribution to the improvement of the planet on which we live. Products such as our mobile phone statements have the ability to create carbon-neutral applications which will over time make a difference to our environment.
17
We are an organization that is committed to the highest levels of ethical behavior, as well as competition. We will continue to employ people who strive to deliver the most compelling business offerings at the most appropriate price in the most efficient manner.
As of December 31, 2010, we had a total of 102 employees, including 40 in the United States, 2 in the United Kingdom, 1 in South Korea, 2 in Singapore, 5 in Mexico and 52 in South Africa. None of our employees are covered by a collective bargaining agreement. We believe that we have good relations with our employees.
Our principal executive offices are located at 345 Chapala Street, Santa Barbara, California, 93101. Our telephone number is (805) 308-9199. Our website address is www.lencomobile.com. We are not including the information contained on our website, or any information that may be accessed by links on our website, as part of this registration statement.
Executive Officers and Directors
|
Name
|
Position
|
Age
|
Held Position Since
|
|||
|
Michael Levinsohn
|
Chairman of the Board, Chief Executive Officer and President
|
49
|
February 2008
|
|||
|
Jonathon Fox
|
Chief Executive Officer, Multimedia Solutions
|
46
|
June 2008
|
|||
|
Thomas Banks
|
Director and Chief Financial Officer
|
43
|
September 2009
|
|||
|
Michael Hill
|
President, Lenco Multimedia Inc.
|
34
|
March 2009
|
|||
| Ronald Wagner | Director | 46 | October 2009 | |||
| James L. Liang | Director | 53 | March 2011 | |||
| Phillip B. Harris | Director | 42 | March 2011 |
Michael Levinsohn. Mr. Levinsohn is the Chief Executive Officer, President and Chairman of the Board of Directors of Lenco Mobile Inc. He was a co-founder of Digital Vouchers (Pty) Ltd., the internet and internet loyalty program platform that we acquired in February 2008, and has served as a director and Chief Executive Officer since that time. From 2003-2007, he was the Managing Director of 121 Marketing, a leading CRM and loyalty program consultancy based in Johannesburg, South Africa. From 1998-2003, he was a co-founder and Sales and Marketing Director of Webworks, the company that developed and operated the Infinity CRM and loyalty program in South Africa. Clients of Infinity included many of the top retail and leisure brands in South Africa. Infinity was the number one ranked CRM and loyalty program in South Africa in 2003. Between 1988 and 1997 Mr. Levinsohn was at various times the CEO of Lanchem Limited, Ventel Limited and Integrated Consumer Products Limited. All three companies were listed on the Johannesburg Stock Exchange. Mr. Levinsohn has been the Managing Director of Sterling Trust (Pty) Ltd., a privately owned investment banking company since March 1988.
Jonathan Fox. Mr. Fox is responsible for the day-to-day operations of the African businesses owned by Lenco Mobile Inc., a position that he has held since June 2008. In September 2010, Mr. Fox was appointed as the Chief Executive Officer of Multimedia Solutions. He was also the Managing Director of New Seasons Entertainment, a film distribution and exhibition company in South Africa. From 1995 to 2000, he was the Chief Executive Officer of Ster-Kinekor Pictures, the largest distributor of filmed entertainment in the Southern hemisphere. He has a B.Comm and LLB degree from the University of the Witwatersrand in Johannesburg, South Africa.
Thomas Banks. Mr. Banks is the Chief Financial Officer and a director of Lenco Mobile Inc. He has served as our Chief Financial Officer since 2009. Mr. Banks most recently served as Senior Director of Finance for Local Insight Media, in charge of Latin American financial operations. Prior to that time, from 2000 to 2004, he was with Advance Group, Inc. which was the largest importer of watches by volume in the U.S. with over $300 million in revenue, ultimately serving as Vice President of Finance, Corporate Controller. He worked in the media and advertising industry in lead financial and operational roles during the period 1997 to 2000. From 1993 to 1997, Mr. Banks also served as Corporate Controller for the biopharmaceutical company Serologicals Corp. where he managed the financial operations during a period of significant growth, including playing a key role in the successful entry onto the NASDAQ in 1996. Mr. Banks began his career at Arthur Andersen & Co. and qualified as a CPA in 1993.
18
Michael Hill. Mr. Hill is a founder of the businesses that comprise Lenco Multimedia Inc., formerly AdMax Media Inc., and is currently that subsidiary’s chief executive officer. Mr. Hill served as Chief Executive Officer of Commerce Planet, Inc. from January 15, 2004 until September 2008. From 1999 until 2003, Mr. Hill was a founder of and served Chief Executive Officer of Intravantage Marketing, a privately held marketing firm. From January 1998 until starting Intravantage Marketing, Mr. Hill was the Vice President of International Specialties, Inc. In 2009, the FTC brought an action against Commerce Planet, Inc., Michael Hill (currently the President of AdMax Media, Inc.) and certain officers of Commerce Planet, Inc. in the United States District Court for the Central District of California. Mr. Hill, without admitting any of the allegations and denying any wrongdoing, entered into a stipulated judgment and order with the FTC to settle this action in November 2009. See “Government Regulation” above.
Ronald Wagner. Mr. Wagner was appointed to our Board of Directors in October 2009. He is presently the President and Chief Operating Officer of e-Storm International, Inc., an online marketing strategy and services agency based in San Francisco. He was previously the President of Partner Weekly, an online performance marketing company and subsidiary of Selling Source Inc. Between 2003 and 2006, he was the Chief Executive Officer of Clear Ink, a digital strategy and services company. Mr. Wagner has at various times held positions on the boards of Publisafe Software, Ironlight Digital (now Arc Worldwide), and WMC. Mr. Wagner has an MBA degree from the University of Chicago, IL and a BA degree from Lewis & Clark College, Portland, Oregon.
James L. Liang. Mr. Liang was appointed to our Board of Directors in March 2011. Mr. Liang brings to Lenco Mobile strategy, finance and corporate development expertise gained from working with large, global companies. From 2008 to 2011, Mr. Liang served as SVP of Strategy and Corporate Development at Amdocs, Ltd (NYSE: DOX) a global provider of software and services for billing, customer relationship management and operations support systems. From January 2005 to July 2008, Mr. Liang served as the Chief Strategy Officer for IBM Corporation’s $30+ billion Global Technology Services (GTS) Division. Prior to joining IBM, Mr. Liang spent 21 years as an investment banker working exclusively with technology companies on a broad range of financing and strategic assignments including twelve years at Morgan Stanley, where he was the Head of the Global Technology Banking Group. Mr. Liang is a graduate of Phillips Exeter Academy, Brown University (Sc.B. in Applied Mathematics/Economics) and The University of Chicago Graduate School of Business (MBA in Finance/Marketing).
Phillip B. Harris. Mr. Harris was appointed to our Board of Directors in March 2011. Mr. Harris is an experienced entrepreneur with a strong track record of operating, advising and investing in technology and healthcare companies. From 2007 to 2010, Mr. Harris was a Managing Director and Founding Principal of Maren Group, LLC which focused on select advisory projects and managing its corporate investments. Prior to founding Maren Group, Mr. Harris started a financial advisory firm, Alterity Partners, which specialized in mergers and acquisitions advisory in the technology and healthcare industries. The firm grew rapidly and was sold to First Horizon National (formerly First Tennessee Bank) where Mr. Harris continued to serve business until 2007. Previous to Alterity Partners, he held a variety of operating roles at priceline.com (SVP of Corporate Development), Cendant Corporation (GM of Interactive Services) and Nordson Corporation (Director of Marketing). Mr. Harris received a B.S. in Finance from Ohio State University and an M.B.A. from Harvard Business School.
19
Item 1A. Risk Factors.
Investors should carefully consider the risks described below before deciding whether to invest in our common stock. The risks described below are not the only ones we face. Additional risks not presently known to us or that we currently believe are immaterial may also impair our business operations and financial results. If any of the following risks actually occur, our business, financial condition or results of operations could be adversely affected. In such case, the trading price of our common stock could decline and you could lose all or part of your investment. This report as well as our other filings with the Securities and Exchange Commission also contains forward-looking statements that involve risks and uncertainties. Our actual results could differ materially from those anticipated in these forward-looking statements as a result of certain factors, including the risks described below. See “Special Note Regarding Forward-Looking Statements.”
Risks Related to Our Business and Industry
Our business is subject to many risks and uncertainties, which may affect our future financial performance. Because of the risks and uncertainties discussed below, as well as other variables affecting our operating results, past financial performance should not be considered as a reliable indicator of future performance and investors should not use historical trends to anticipate results or trends in future periods.
Our mobile advertising business is dependent upon relationships with Wireless Carriers who control access to their networks and a significant portion of our costs of sales. If we cannot secure access to the Wireless Carriers’ networks at reasonable rates, our ability to generate revenues and profits will be significantly impaired.
In our mobile phone business, we charge Brand Owners a price for sending out SMS or MMS messages to their customers. We contract with Wireless Carriers to send the SMS or MMS messages over their networks at bulk rates. We generate gross profit on the difference between the price we charge the Brand Owner and the price we pay to the Wireless Carrier. We are in varying stages of business development and testing with Wireless Carriers in several countries. Those relationships do not grant us exclusive access to those networks and third parties are allowed similar access to the network. We currently have access to the majority of Wireless Carriers in the United States through a third-party connectivity aggregation agreement, but have not generated revenues from that relationship to date. Our business plan contemplates that we will increase our revenues through establishing additional relationships with Wireless Carriers worldwide. If, for any reason, we are unable to secure or maintain relationships with Wireless Carriers we will not be able to generate additional revenues and our business will not develop.
The Wireless Carriers set the rates for the messages we send over their network, as well as the cost to their subscribers for data access. Network access is the largest component of cost of sales for our mobile phone business. If the Wireless Carriers increase the rates that they charge us for sending messages, we may be forced to increase our prices to Brand Owners. Higher prices may cause Brand Owners to look for alternative forms of advertising or otherwise decrease the amount of business that they do with us. If we incur increased rates from Wireless Carriers and cannot pass the increase on to the Brand Owners we may experience declines in our gross margins and profitability.
Wireless Carriers also have control over billings and collections for our messages and services. If a Wireless Carrier, or their third-party service provider, provides billing and collection services to us which are defective or inaccurate, our revenues may be less than anticipated or may be subject to refund at the discretion of the Wireless Carrier or our Brand Owner customers.
The mobile phone industry is going through rapid technological change. The introduction of smart phones, such as the Apple iPhone, BlackBerry and several Nokia models is resulting in the rapid development of mobile applications. Our existing and future applications will take advantage of these enhanced phones. Many of the Wireless Carriers throughout the world do not yet have fully operational new generation MMS messaging platforms installed. A major capital investment is required in order to deliver the infrastructure for high speed MMS messaging and data services. A Wireless Carrier’s decision to build in a territory, and the timing of these build outs, will impact our ability to offer more advanced services.
Deteriorating macroeconomic conditions have negatively impacted certain parts of our business and a further weakening of macroeconomic conditions may have additional negative impacts on our business.
In 2010, our mobile advertising business began experiencing weakness as a result of the deteriorating macroeconomic conditions in South Africa. We are not able to predict whether general macroeconomic conditions in the United States or abroad, or conditions in mobile or internet advertising industries specifically, will worsen or improve, or the timing of such developments. If macroeconomic conditions worsen, such worsening conditions may cause declines in the marketing industry in general, and our results of operations specifically. Further, when macroeconomic conditions do improve, there can be no assurances that we will be able to regain the levels of revenue and profitability that we achieved prior to the macroeconomic downturn.
20
As an advertising company, our business is dependent upon the level of advertising by Brand Owners. We are subject to macroeconomic fluctuations in the U.S. and global economies, including those that impact discretionary consumer spending, which may remain depressed for the foreseeable future. Some of the factors that could influence the level of consumer spending include continuing conditions in the residential real estate and mortgage markets, labor and healthcare costs, access to credit, consumer confidence and other macroeconomic factors affecting consumer spending. If the economy enters a prolonged period of decelerating growth or recession, advertisers may reduce the amount of their advertising expenses and the results of our operations may be harmed. As a result of these and other factors, our operating results may not meet the expectations of investors or public market analysts who choose to follow our company. Any failure to meet market expectations would likely result in decreases in the trading price of our common stock.
Our industry is subject to risks generally associated with the advertising industry, any of which could significantly harm our operating results.
Our business is subject to risks that are generally associated with the advertising industry, many of which are beyond our control. These risks could negatively impact our operating results. Potential advertising related risks include the following:
|
·
|
the commercial success of our Brand Owner’s brands;
|
|
·
|
economic conditions that adversely affect discretionary consumer spending;
|
|
·
|
changes in consumer demographics;
|
|
·
|
the availability and popularity of other forms of media and entertainment; and
|
|
·
|
critical reviews and public tastes and preferences, which may change rapidly and cannot necessarily be predicted.
|
Our limited operating history may not serve as an adequate basis to judge future prospects and results of operations.
As a result of our short operating history, we have limited financial data that can be used to evaluate our business. In addition we have completed a number of acquisitions and dispositions of assets over the past three years. As a result, our historical financial statements and results of operations may not provide meaningful guidance to form an assessment of the prospects or potential success of our future business operations.
We are an early stage company and face increased risks and uncertainties inherent to companies that are still developing their business.
Any evaluation of our business and our prospects must be considered in the light of our limited operating history and the risks and uncertainties encountered by companies in our stage of development. As an early-stage company in the emerging mobile and internet marketing industry, we face increased risks, uncertainties, expenses and difficulties. To address these risks and uncertainties, we must do the following:
|
|
·
|
expand our digital advertising distribution channels, including Wireless Carrier networks, and internet-based networks;
|
|
|
·
|
successfully establish direct and indirect sales channels, and develop effective value propositions to attract Brand Owners to our advertising platforms;
|
|
|
·
|
develop and deliver high-quality content for advertisements and promotions that achieve significant market acceptance;
|
|
|
·
|
respond to market developments, including next-generation software and mobile phone and radio broadcasting platforms, emerging technologies and pricing and distribution models;
|
|
|
·
|
establish and implement integrated financial and accounting policies, procedures, systems and controls;
|
|
|
·
|
enhance our information technology and processing systems;
|
|
|
·
|
successfully integrate products or companies that we may acquire;
|
|
|
·
|
execute our business and marketing strategies successfully; and
|
|
|
·
|
attract, integrate, retain and motivate qualified personnel.
|
21
We may be unable to accomplish one or more of these objectives, which could cause our business to suffer. In addition, accomplishing many of these efforts might be very expensive, which could adversely impact our operating results and financial condition.
We became engaged in our current business in early 2008 yet the Company was incorporated in 1999. There may be risks and liabilities that are unknown to our management resulting from operations prior to our implementation of our current business plan.
The Company was incorporated in 1999. However, we became engaged in our current business of mobile and internet marketing in early 2008. Between 1999 and 2008, the Company was engaged in different lines of business including discount brokerage and financial services and mortgage banking. The Company also existed as a shell company for a period of time with the intent of entering into business combinations with companies in the apparel industry. Our current management was not involved with the Company prior to early 2008. There may be risks and liabilities resulting from the conduct of the Company’s business prior to February 2008 that are unknown to our current management and therefore are not disclosed in this registration statement.
We may require additional capital in order to execute our business plan, and we have no current arrangements in place for any such financing.
The operation of our business, and our efforts to grow our business, might require significant cash outlays and commitments. As part of our plan to secure relationships with new Wireless Carrier customers, we have opened and we will continue to open local offices and staff in foreign regions, which will result in additional capital requirements and operating expenses. In addition, we expect to continue to evaluate acquisition opportunities which may require additional capital commitments. If our cash, cash equivalents and short-term investment balances and any cash generated from operations and borrowings are insufficient to meet our cash requirements, we will need to seek additional capital, potentially through debt or equity financings, to fund our operations and debt repayment obligations.
We do not have any arrangements in place for significant additional capital at this time and may not be able to raise needed cash. Financings, if available, may be on terms that are dilutive or potentially dilutive to our stockholders, depending on the time, terms and pricing of the financing. The holders of new securities may also receive rights, preferences or privileges that are senior to those of existing holders of our common stock. If new sources of financing are required but are insufficient or unavailable, we would be required to modify our growth and operating plans to the extent of available funding, which would harm our ability to grow our business.
Our financial results could vary significantly from quarter to quarter and are difficult to predict, particularly in light of the current economic environment, which in turn could cause volatility in our stock price.
Our revenues and operating results could vary significantly from quarter to quarter because of a variety of factors, many of which are outside of our control. Factors that may contribute to the variability of our quarterly results include:
|
·
|
our current reliance on large-volume orders from only a few customers;
|
|
·
|
fluctuations in the number of new mobile advertisements or levels of advertising expenditure by major Brand Owners;
|
|
·
|
fluctuations in revenues and expenses related to our addition or loss of Wireless Carrier contracts or content licenses;
|
|
·
|
our competitors may take more significant market share for similar products offered by us to our major clients;
|
|
·
|
the timing of release of new products and services by us and our competitors, particularly those that may represent a significant portion of revenues in a period;
|
|
·
|
the popularity of new campaigns and promotions released in prior periods;
|
|
·
|
the expiration of existing content licenses for particular promotions;
|
|
·
|
changes in pricing policies by us, our competitors or Wireless Carriers and other distributors;
|
|
·
|
changes in the mix of products and services we are able to sell which may have varying gross margins;
|
22
|
·
|
fluctuations in the overall consumer demand for mobile handsets, mobile campaigns and related content;
|
|
·
|
strategic actions by us or our competitors, such as acquisitions, divestitures, spin-offs, joint ventures, strategic investments or changes in business strategy;
|
|
·
|
general economic conditions in developing countries which are in our target markets;
|
|
·
|
our success in entering new geographic markets;
|
|
·
|
the timeliness and accuracy of reporting from Wireless Carriers;
|
|
·
|
the seasonality of our industry;
|
|
·
|
changes in accounting rules, such as those governing recognition of revenue;
|
|
·
|
the timing of compensation expenses associated with equity compensation grants;
|
|
·
|
the timing of charges related to impairments of goodwill and intangible assets; and
|
|
·
|
decisions by us to incur additional expenses, such as increases in marketing or research and development.
|
As a result, our operating results may experience significant fluctuations from quarter to quarter. Therefore, period-to-period comparisons may not provide meaningful guidance for investors to evaluate our prospective future operating results.
In addition, we may not be able to predict our future revenues or results of operations. We base our current and future expense levels on our internal operating plans and sales forecasts, and our operating costs are, to a large extent, fixed. As a result, we may not be able to reduce our costs sufficiently to compensate for an unexpected shortfall in revenues, and even a small shortfall in revenues could disproportionately and adversely affect financial results for that quarter.
Our contracts with Wireless Carriers and Brand Owners are generally on a purchase order basis, and we do not have long term agreements with either Brand Owners or Wireless Carriers to assure future revenues or expenses.
The Brand Owners upon whom we rely for a substantial portion of our revenues order services from us on a purchase order basis. We are generally required to secure new purchase orders for each new advertising campaign. As a result, we carry little backlog and have limited visibility into the long term purchasing plans of our customers.
We purchase bulk message services from Wireless Carriers on a purchase order basis. We do not have long term contracts with Wireless Carriers to protect our access to the network or the prices we pay for network access. Any inability to access Wireless Carrier networks at reasonable rates would have a substantial negative impact on our business.
Acquisitions could result in operating difficulties, dilution and other harmful consequences.
We have undertaken strategic acquisitions in the past. Our acquisitions of Multimedia Solutions, AdMax, and Jetcast, Inc. businesses form the core of our current business. However, acquisitions involve risks and uncertainties. Certain acquisitions of the Company have not been fully integrated into the offerings of the Company due primarily to order of priority constraints and the costs and time necessary to effect such integrations. We are unable to predict with certainty the costs required to complete the integration of those products or what the market acceptance will be for these products and services.
We expect to continue to evaluate and consider a wide array of potential strategic transactions, including business combinations and acquisitions of technologies, services, products and other assets. At any given time, we may be engaged in discussions or negotiations with respect to one or more of these types of transactions. Any of these transactions could be material to our financial condition and results of these operations. The process of integrating any acquired business may create unforeseen operating difficulties and expenditures and is itself risky. The areas where we may face difficulties include:
|
|
·
|
diversion of management time and a shift of focus from operating the businesses to issues related to integration and administration;
|
|
|
·
|
declining employee morale and retention issues resulting from changes in compensation, management, reporting relationships, future prospects or the direction of the business;
|
23
|
|
·
|
the need to integrate each acquired company’s accounting, management, information, human resource and other administrative systems to permit effective management, and the lack of control if such integration is delayed or not implemented;
|
|
|
·
|
the need to implement controls, procedures and policies appropriate for a larger public company that the acquired companies lacked prior to acquisition;
|
|
|
·
|
in the case of foreign acquisitions, the need to integrate operations across different cultures and languages and to address the particular economic, currency, political and regulatory risks associated with specific countries; and
|
|
|
·
|
liability for activities of the acquired companies before the acquisition, including violations of laws, rules and regulations, commercial disputes, tax liabilities and other known and unknown liabilities.
|
If the anticipated benefits of any future acquisitions do not materialize, or we experience difficulties integrating businesses acquired in the future, or other unanticipated problems arise, our business, operating results and financial condition may be harmed.
In addition, a significant portion of the purchase price of companies we acquire may be allocated to acquired goodwill and other intangible assets, which must be assessed for impairment at least annually. In the future, if our acquisitions do not yield expected returns, we may be required to take charges to our earnings based on this impairment assessment process, which could harm our operating results.
The terms of acquisitions may require that we make future cash or stock payments to stockholders of the acquired company, which may strain our cash resources or cause substantial dilution to our existing stockholders at the time the payments are required to be made.
We face exchange rate and currency control risks as a result of our international operations.
We currently have staff and offices in the United States, South Africa, Mexico, Singapore, the United Kingdom, Colombia, South Korea. As such, we have revenues and expenses in multiple currencies. Consequently, we are exposed to currency fluctuations without a hedging structure in place for significant changes in currency values relative to the U.S. dollar. As we continue to expand internationally we anticipate currency risk management becoming a more important aspect of our business. Conducting business in currencies other than U.S. Dollars subjects us to fluctuations in currency exchange rates that could have a negative impact on our reported operating results. Fluctuations in the value of the U.S. Dollar relative to other currencies impact our revenues, cost of revenues and operating margins and result in foreign currency exchange gains and losses. To date, we have not engaged in exchange rate hedging activities, and we do not expect to do so in the foreseeable future. Even if we were to implement hedging strategies to mitigate this risk, these strategies might not eliminate our exposure to foreign exchange rate fluctuations and would involve costs and risks of their own, such as cash expenditures, ongoing management time and expertise, external costs to implement the strategies and potential accounting implications.
We anticipate earning a significant portion of our future revenue and profits in foreign jurisdictions. Countries, including South Africa, have various restrictions and controls on bring currency into, or distributing currency out of, their county. If we are unable to effectively move and allocate capital among our operating entities it would have a material impact on our financial condition and cash position.
We face added business, political, regulatory, operational, financial and economic risks as a result of our international operations, any of which could increase our costs and hinder our growth.
International sales represented 75% of our revenues in 2010. In 2010, our international sales were generated primarily in South Africa, Australia and New Zealand.
We plan to continue to expand internationally and establish offices in other foreign jurisdictions. There are inherent risks in operating offices in developing countries and we might from time to time be exposed to risks outside of our core business. Risks affecting our international operations include:
|
·
|
political, economic and social instability including military and terrorist attacks;
|
|
·
|
compliance with multiple and conflicting laws and regulations;
|
|
·
|
unexpected changes in regulatory requirements, tariffs, customs, duties and other trade barriers;
|
|
·
|
potentially adverse tax consequences resulting from changes in tax laws;
|
24
|
·
|
challenges caused by distance, language and cultural differences;
|
|
·
|
difficulties in staffing and managing international operations;
|
|
·
|
potential violations of the Foreign Corrupt Practices Act, particularly in certain emerging countries in East Asia, Eastern Europe and Latin America;
|
|
·
|
longer payment cycles and greater difficulty collecting accounts receivable;
|
|
·
|
Protectionist laws and business practices that favor local businesses in some countries;
|
|
·
|
price increases due to fluctuations in currency exchange rates;
|
|
·
|
price controls;
|
|
·
|
the servicing of regions by many different Wireless Carriers;
|
|
·
|
imposition of public sector controls;
|
|
·
|
restrictions on the export or import of technology;
|
|
·
|
trade and tariff restrictions and variations in tariffs, quotas, taxes and other market barriers; and
|
|
·
|
difficulties in enforcing intellectual property rights in certain countries.
|
In addition, developing user interfaces that are compatible with other languages or cultures can be expensive. Our ongoing international expansion efforts may be more costly than we expect. These risks could harm our international operations, which, in turn, could materially and adversely affect our business, operating results and financial condition.
If we are unable to successfully compete in our core market, our ability to retain our customers and attract new customers could decline, as would our revenues.
We believe competition will increase as current competitors increase the sophistication of their offerings, as new participants enter the market and as the market continues to grow and, becomes increasingly attractive. The wireless communications and internet markets are continuing to evolve, and technology enhancements may enable the introduction of new and different services. If current or potential customers prefer the products and services offered by competitors over those offered by us, we will not be able to generate or sustain sufficient revenues to develop our business. Certain competitors have longer operating histories, larger customer bases, better brand recognition and significantly greater financial, marketing and other resources than we do and may enter into strategic or commercial relationships with larger, more established and better financed companies, including Wireless Carriers. Any delay by us in the development or introduction of products or services or updates, would also allow additional time for our competitors to improve their service or product offerings, and for new competitors to develop products and services for our customers and target markets. Increased competition could result in pricing pressures, reduced operating margins and loss of market share, any of which could cause our business to suffer.
We face competition from a number of sources including major media companies, traditional publishers, content aggregators, mobile software providers and independent mobile advertising publishers. Wireless Carriers may also decide to develop and distribute their own mobile campaigns. If Wireless Carriers enter the mobile advertising market as publishers, they might refuse to distribute some or all of our MMS messages or might deny us access to all or part of their networks.
Some of our competitors’ and our potential competitors’ advantages over us, either globally or in particular geographic markets, include the following:
|
|
·
|
significantly greater revenues and financial resources;
|
|
|
·
|
stronger brand and consumer recognition regionally or worldwide;
|
|
|
·
|
the capacity to leverage their marketing expenditures across a broader portfolio of mobile and non-mobile products;
|
|
|
·
|
superior intellectual property from which they can develop better technical solutions which might be attractive to Wireless Carriers, internet publishers and Brand Owners;
|
25
|
|
·
|
relationships with Wireless Carriers or Brand Owners that afford them access to intellectual property while blocking the access of competitors to that same intellectual property;
|
|
|
·
|
greater resources to make acquisitions;
|
|
|
·
|
the ability or willingness to offer competing products at no charge or reduced rates to establish market share;
|
|
|
·
|
lower labor and development costs; and
|
|
|
·
|
broader global presence and distribution channels.
|
Certain of our large competitors have considerably greater resources than we do, enabling them to develop a broader range of products and services than we can and to do so more quickly, which causes further challenges, especially on the next-generation mobile phone platforms.
In addition, given the open nature of the development and distribution for certain next-generation platforms, we also compete with a vast number of small companies and individuals who are able to create and launch mobile campaigns and other content for mobile devices utilizing limited resources and with limited start-up time or expertise. Many of these smaller developers are able to offer their products at low cost or substantially reduce prices to levels at which we are unable to respond competitively and still achieve profitability given their low overheads.
If we are unable to compete effectively or we are not as successful as our competitors in our target markets, our sales could decline, our margins could decline and we could lose market share, any of which would materially harm our business, operating results and financial condition.
We currently rely on one Wireless Carrier for substantially all of our MMS business, and expect to be dependent on a limited number of Wireless Carriers for the near future. The loss of or a change in any significant Wireless Carrier relationship, including their credit worthiness, could materially reduce our revenues and adversely impact our cash position.
A significant portion of our revenues is derived from one Wireless Carrier. In 2010, we derived approximately 33% of our revenues from Vodafone (Pty) Ltd. While we are attempting to establish relationships with a number of Wireless Carriers, we expect that we will continue to generate a substantial majority of our revenues through distribution relationships with fewer than twenty Wireless Carriers for the foreseeable future. If we are unable to establish relationships with other wireless carriers, or if any of the Wireless Carriers with which we have a relationship decide not to allow us access to their MMS network infrastructure, or decides to terminate or modify the terms of its agreement with us, or if there is consolidation among Wireless Carriers, our operating results and financial position may be adversely affected. In addition, having our revenues concentrated among a limited number of Wireless Carriers also creates a concentration of financial risk for us, and in the event that any significant Wireless Carrier were unable to fulfill its payment obligations to us, our operating results and cash position would suffer.
System or network failures or deficiencies could reduce our sales, increase costs or result in a loss of revenues or customers who use our services.
We rely on Wireless Carriers and other third-party data carriers to deliver MMS messages and advertising content to end users and to track and account for the downloading of our messages and advertising content. Some of our technologies for enhancing the performance of our MMS platform are dependent on specific types of access to the Wireless Carrier’s network. If the Wireless Carrier is unable to provide us with the level of connectivity we require, the standard and functionality of our services will be negatively impacted, which will in turn negatively affect our ability to provide services and generate profitability. In certain circumstances, we also rely on our own servers to deliver MMS messages to the Wireless Carriers and to deliver on demand content to end users through the Wireless Carrier’s networks. Any technical problem with Wireless Carriers, third party service providers or our billing, delivery or information systems or communications networks could result in the inability of the Wireless Carriers, or a mobile subscribers to download our content.
From time to time, Wireless Carriers may experience failures with their billing and delivery systems and communication networks, including gateway failures that reduce their ability to distribute MMS messages and advertising content. Any such technical problems could cause us to lose revenues or incur substantial repair costs and distract management from operating our business.
In our internet business, our success depends on the continuing and uninterrupted performance of our systems. Sustained or repeated system failures that interrupt our ability to provide services to customers, including failures affecting our ability to deliver advertisements quickly and accurately and to process responses to advertisements, would reduce significantly the attractiveness of our solutions to Brand Owners and internet publishers. Our business, results of operations and financial condition could also be materially and adversely affected by any systems damage or failure that impacts data integrity or interrupts or delays our operations.
26
Our own computer systems are vulnerable to damage from a variety of sources, including telecommunications failures, power outages, malicious or accidental human acts and natural disasters. We lease data center space in Santa Barbara, California, Johannesburg, South Africa, outside London in the United Kingdom and maintain monitored server equipment at a co-location facility in Los Angeles, California. Despite network security measures, our servers are potentially vulnerable to physical or electronic break-ins, computer viruses and similar disruptive problems in part because we cannot control the maintenance and operation of our third-party data centers. Despite the precautions taken, unanticipated problems affecting our systems could cause interruptions in the delivery of our solutions in the future and our ability to provide a record of past transactions. Our data centers and systems incorporate varying degrees of redundancy. In the event of failure, the various data centers and communications systems may not automatically switch over to their redundant counterpart. Our insurance policies may not adequately compensate us for any losses that may occur due to any failures in our systems.
Technology changes in mobile handsets may significantly reduce or eliminate Wireless Carriers’ control over delivery of our MMS messaging products and services and force us to rely on alternative sales channels, which, if not successful, could require us to increase our sales and marketing expenses significantly.
Substantially all our MMS messages are currently delivered through Wireless Carriers’ Multimedia Messaging Service Centers or MMSC’s. We have invested significant resources developing software platforms with an established value proposition for Wireless Carriers in order to offer them our products and services. Because of the revenues that they receive from our services, Wireless Carriers have assisted us with introductions to Brand Owners and provided sales support.
A growing number of mobile phone handset models currently available allow wireless subscribers to browse the internet and, in some cases, download applications from sources other than a Wireless Carrier’s messaging service. Increased use by subscribers of open operating system handsets or mobile websites will enable them to bypass Wireless Carriers’ services and could reduce the market power of Wireless Carriers as a distribution channel for Brand Owners. This could force us to develop capabilities and solutions for alternative sales channels where we may not be successful selling our MMS messaging services and could require us to increase our sales and marketing expenses significantly.
Changes in how we generate internet consumer traffic for our websites and landing pages could negatively impact our ability to maintain or grow our revenue and profitability levels.
We generate internet consumer traffic for destination websites using various methods, including: organic traffic, offline marketing campaigns, distribution agreements, search engine marketing and search engine optimization. Our search engine marketing activities include purchasing advertising on third party search engines such as Google, Yahoo or Bing. Search engine optimization is the process of modifying the content and programming of a website in an effort to improve its visibility or ranking on a search engine, thereby driving more traffic to the website. The major search engines use algorithms that try to match website content to a specific search inquiry. The algorithms rank websites against a search based on multiple factors computed in the algorithm. The current revenue and profitability levels of our advertising and lead generation segments are dependent upon our continued ability to use a combination of these methods to generate internet consumer traffic to our websites in a cost-efficient manner.
Our search engine marketing or search engine optimization techniques have been developed to work with the existing search algorithms utilized by the major search engines. The major search engines frequently modify their search algorithms. Future changes in these search algorithms could change the mix of the methods we use to generate internet consumer traffic for destination websites and could negatively impact our ability to generate such traffic in a cost-efficient manner, which could result in a significant reduction to the revenue and profitability of these business segments. There can be no assurances that we will be able to modify our search engine marketing or search engine optimization techniques to address any future search algorithm changes made by the major search engines.
If the security of our customers’ confidential information stored in our systems is breached or otherwise subjected to unauthorized access, our reputation may be severely harmed, we may be exposed to liability and we may lose the ability to offer our customers a credit card payment option.
Our network system stores data about consumers who have previously interacted with us, customers’ proprietary mobile distribution lists, credit card information and other critical data. Any accidental or willful security breaches or other unauthorized access to consumer information stored on our systems could expose us to liability for the loss of such information, adverse regulatory action by federal and state governments, time-consuming and expensive litigation and other possible liabilities as well as negative publicity, which could severely damage our reputation. If security measures are breached because of third-party action, employee error, malfeasance or otherwise, or if design flaws in our software are exposed and exploited, and, as a result, a third party obtains unauthorized access to any of our customers’ data, our relationships with our customers will be severely damaged, and we could incur significant liability. Because techniques used to obtain unauthorized access or to sabotage systems change frequently and generally are not recognized until they are launched against a target, we and our third-party hosting facilities may be unable to anticipate these techniques or to implement adequate preventative measures.
27
Many states have enacted laws requiring companies to notify individuals of data security breaches involving their personal data. These mandatory disclosures regarding a security breach often lead to widespread negative publicity, which may cause our customers to lose confidence in the effectiveness of our data security measures. Any security breach, whether actual or perceived, would harm our reputation, and we could lose customers and fail to acquire new customers.
If we fail to maintain our compliance with the data protection policy documentation standards adopted by the major credit card issuers, we could lose our ability to offer our customers a credit card payment option. Any loss of our ability to offer our customers a credit card payment option would make our products less attractive to many small organizations by negatively impacting our customer experience and significantly increasing our administrative costs related to current or planned customer payment processing.
Our existing general liability insurance may not cover any, or only a portion of any, potential claims to which we are exposed or may not be adequate to indemnify us for all or any portion of liabilities that may be imposed. Any imposition of liability that is not covered by insurance or is in excess of insurance coverage would result in significant expense and reduce our working capital.
If the technology that we currently use to target the delivery of internet and mobile advertisements and to prevent fraud on our networks is restricted or becomes subject to regulation, our expenses could increase and we could lose customers or advertising inventory.
Websites typically place small files of non-personalized or anonymous information, commonly known as “cookies,” on an internet user’s hard drive. Cookies generally collect information about users on a non-personalized basis to enable websites to provide users with a more customized experience. Cookie information is passed to the website through an internet user’s browser software. We currently use cookies to track an internet user’s movement through our customer’s websites and to monitor and prevent fraudulent activity on our networks. Most currently available internet browsers allow internet users to modify their browser settings to prevent cookies from being stored on their hard drive, and some users currently do so. internet users can also delete cookies from their hard drives at any time.
Some internet commentators and privacy advocates have suggested limiting or eliminating the use of cookies, and legislation has been introduced in some jurisdictions to regulate the use of cookie technology. The effectiveness of our technology could be limited by any reduction or limitation in the use of cookies. If the use or effectiveness of cookies were limited, we expect that we would need to switch to other technologies to gather demographic and behavioral information. While such technologies currently exist, they are substantially less effective than cookies. We also expect that we would need to develop or acquire other technology to monitor and prevent fraudulent activity on our networks. Replacement of cookies could require significant reengineering time and resources, might not be completed in time to avoid losing customers or advertising inventory, and might not be commercially viable. Our use of cookie technology or any other technologies designed to collect internet usage information may subject us to litigation or investigations in the future. Any litigation or government action against us could be costly and time consuming, could require us to change our business practices and could divert management’s attention.
Various private spam blacklists have in the past interfered with, and may in the future interfere with, the effectiveness of our products and our ability to conduct business.
We depend on the internet to market to and communicate with our advertisers, publishers and customers, and our customers rely on our internet platforms and mobile campaigns to communicate with their consumers. Various private entities attempt to regulate the use of mobile devices for commercial solicitation. These entities often advocate standards of conduct or practice that significantly exceed current legal requirements and classify certain mobile solicitations that comply with current legal requirements as spam. Some of these entities maintain “blacklists” of companies and individuals, and the websites, internet Service Providers and internet protocol addresses associated with those entities or individuals that do not adhere to those standards of conduct or practices for commercial mobile solicitations that the blacklisting entity believes are appropriate. If a company’s internet protocol addresses are listed by a blacklisting entity, messages sent from those addresses may be blocked if they are sent to any internet domain or internet address that subscribes to the blacklisting entity’s service or purchases its blacklist.
Some of our internet protocol addresses currently are listed with one or more blacklisting entities and, in the future, our other internet protocol addresses may also be listed with these and other blacklisting entities. There can be no guarantee that we will not continue to be blacklisted or that we will be able to successfully remove ourselves from those lists. Blacklisting of this type could interfere with our ability to market our products and services and communicate with our customers and could undermine the effectiveness of the marketing campaigns we conduct for our Brand Owner customers, all of which could have a material negative impact on our business and results of operations.
28
Our relationships with our channel partners may be terminated or may not continue to be beneficial in generating new customers, which could adversely affect our ability to increase our customer base.
Our Lenco Multimedia Inc. and Lenco Media Inc. subsidiaries maintain a network of active website publishers, channel partners and direct sales relationships that refer customers to us. If we are unable to maintain our contractual relationships with existing channel partners or establish new contractual relationships with potential channel partners, we may experience delays and increased costs in adding customers, which could have a material adverse effect on us. The number of customers we are able to add through these marketing relationships is dependent on the marketing efforts of our partners over which we exercise very little control, and a significant decrease in the number of gross customer additions generated through these relationships could adversely affect the size of our customer base and revenue.
We may experience difficulty in attracting and retaining key personnel, which may negatively affect our ability to develop new products or services or retain and attract customers.
At this stage of our operations, we do not have an extensive management or employee base. Accordingly we rely heavily on the actions of relatively few key personnel. The loss of the services of key personnel may adversely affect our ability to achieve our business goals.
Our ability to expand our businesses also depends on our ability to recruit, retain and motivate highly skilled sales and marketing, operational, technical and managerial personnel. Competition for these people is intense and we may not be able to successfully recruit, train or retain qualified personnel. If we fail to do so, we may be unable to develop new products or services or continue to provide a high level of customer service, which could result in the loss of customers and revenues. We do not maintain key person life insurance on our employees and have no plans to do so.
We rely on trade secrets to protect our proprietary rights, and if these rights are not sufficiently protected, our ability to compete could be harmed.
We require our employees and third-party developers to sign agreements not to disclose or improperly use our trade secrets. Those agreements also required them to acknowledge that all inventions, trade secrets, works of authorship, developments and other processes generated by them on our behalf are our property, and to assign to us any ownership they may have in those works. Nonetheless, our employees or independent contractors may breach their agreements, and it may still be possible for third parties to obtain and improperly use our intellectual properties without our consent. This could harm our business, operating results and financial condition.
Third parties may sue us for intellectual property infringement, which, if successful, may disrupt our business and could require us to pay significant damage awards.
Third parties may sue us for intellectual property infringement or initiate proceedings to invalidate our intellectual property, either of which, if successful, could disrupt the conduct of our business, cause us to pay significant damage awards or require us to pay licensing fees. In the event of a successful claim against us, we might be enjoined from using our intellectual property, we might incur significant licensing fees and we might be forced to develop alternative technologies. Our failure or inability to develop non-infringing technology or to license the infringed or similar technology on a timely basis could force us to suspend campaigns, withdraw advertisements from the market or prevent us from introducing new advertisements. In addition, even if we are able to license the infringed or similar technology or advertisements, license fees could be substantial and the terms of these licenses could be burdensome, which might adversely affect our operating results. Successful infringement or licensing claims against us might result in substantial monetary liabilities and might materially disrupt the conduct of our business. We might also incur substantial expenses in defending against third-party infringement claims, regardless of their merit.
Because a significant portion of our assets are located outside of the United States, it may be difficult for investors to use the United States federal securities laws to enforce their rights against us and some of our officers and directors in the United States.
Our Multimedia Solutions subsidiary is located in South Africa and a significant and increasing portion of our operating assets are located outside of the United States. It may therefore be difficult for investors in the United States to enforce their legal rights based on the civil liability provisions of the United States federal securities laws against us in the courts of either the United States, South Africa or another country outside of the U.S. and, even if civil judgments are obtained in courts of the United States, to enforce such judgments in South African or other international courts. Further, it is unclear if extradition treaties now in effect between the United States, South Africa and/or other countries of operation would permit effective enforcement against us or our officers and directors of criminal penalties, under the United States federal securities laws or otherwise.
29
Risks Related to our Common Stock
The trading price of our common stock has experienced, and may continue to experience, periods of high volatility.
The trading price of our common stock has fluctuated in the past and is expected to continue to fluctuate in the future, as a result of a number of factors, many of which are outside our control, such as:
|
|
·
|
price and volume fluctuations in the overall stock market, including as a result of trends in the economy as a whole, such as the recent and continuing unprecedented volatility in the financial markets;
|
|
|
·
|
changes in operating performance and stock market valuations of other technology companies generally, or those in our industry in particular, and actual or anticipated fluctuations in our operating results;
|
|
|
·
|
any changes in or our failure to meet any financial projections we may provide to the public;
|
|
|
·
|
failure of securities analysts to initiate or maintain coverage of us, changes in financial estimates by any securities analysts who follow our company or our industry and our failure to meet these estimates or failure of those analysts to initiate or maintain coverage of our stock;
|
|
|
·
|
ratings or other changes by any securities analysts who follow our company or our industry;
|
|
|
·
|
announcements by us or our competitors of significant technical innovations, acquisitions, strategic partnerships, joint ventures, capital raising activities or capital commitments;
|
|
|
·
|
the public’s response to our press releases or other public announcements, including our filings with the SEC;
|
|
|
·
|
lawsuits threatened or filed against us; and
|
|
|
·
|
market conditions or trends in our industry.
|
In addition, the stock markets, including the Pink OTC Markets on which our common stock is quoted, have recently and in the past, experienced extreme price and volume fluctuations that have affected the market prices of many companies, some of which appear to be unrelated or disproportionate to the operating performance of companies traded on such markets. These broad market fluctuations could adversely affect the market price of our common stock. In the past, following periods of volatility in the market price of a particular company’s securities, securities class action litigation has often been brought against that company. Securities class action litigation against us could result in substantial costs and divert our management’s attention and resources.
Michael Levinsohn, our Chief Executive Officer, and BasTrust Corporation Limited, a trustee of several trusts that own significant equity in the Company control us through their positions and stock ownership and their interests may differ from other stockholders.
Our Chief Executive Officer Michael Levinsohn is one of a class of beneficiaries of a trust which owns 50% of an entity that currently owns approximately 16.9% of our common stock. Beneficiaries under those trusts include members of Mr. Levinsohn’s family. In addition Mr. Levinsohn owns 3.4% of our common stock directly. BasTrust Corporation Limited is the sole trustee of certain trusts and acts as nominee for other entities that own approximately 30.4% of our outstanding common stock inclusive of the 16.9% holder described above. As a result, BasTrust Corporation Limited is able to exert significant influence over the outcome of stockholder votes on various matters, including the election of directors and extraordinary corporate transactions, including business combinations.
The interests of Mr. Levinsohn and BasTrust Corporation Limited and the beneficiaries of the various trusts it serves may differ from other stockholders. Furthermore, the concentration of ownership in our common stock reduces the public float and liquidity of our common stock, which can in turn affect the market price.
We may issue additional shares of our common stock, including through currently outstanding convertible debt securities and conversion of preferred shares, or future issuances of these instruments, to finance future operations or complete a business combination, which would reduce the equity interest of our stockholders and likely cause a change in control of our ownership.
30
We may issue a substantial number of additional shares of our common stock or preferred stock, or a combination of both, including through convertible debt securities and conversion of preferred shares to common, to finance future operations or complete a business combination. Presently, the Company has 107,500 shares of outstanding Series A Preferred which converts to common stock at a conversion price which will be determined in the future based on the Company’s performance. The issuance of additional shares of our common stock or any number of shares of preferred stock, including upon conversion of any debt securities:
|
|
·
|
may significantly reduce the equity interest of our current stockholders;
|
|
|
·
|
will likely cause a change in control if a substantial number of our shares of common stock or voting preferred stock are issued, which may affect, among other things, our ability to use our net operating loss carry forwards, if any, and could also result in a change in management; and
|
|
|
·
|
may adversely affect prevailing market prices for our common stock.
|
We are unlikely to pay cash dividends in the foreseeable future.
We currently intend to retain any future earnings for use in our operations and expansion of our business. We do not expect to pay any cash dividends in the foreseeable future, but will review this policy as circumstances dictate. Should we decide in the future to do so, our ability to pay dividends and meet other obligations depends upon the receipt of dividends or other payments from our operating subsidiaries. In addition, our operating subsidiaries, from time to time, may be subject to restrictions on their ability to make distributions to us, including as a result of restrictions on the conversion of local currency into U.S. Dollars or other hard currency and other regulatory restrictions.
Our common stock is traded on the Pink OTC Markets, is illiquid and subject to price volatility unrelated to our operations.
Our shares of common stock are currently quoted on the Pink OTC Markets. Many institutional investors have investment policies which prohibit them from trading in stocks on the Pink OTC Markets. As a result, stock quoted on this electronic quotation system generally have limited trading volume and exhibit a wide spread between the bid/ask quotations than stock traded on national exchanges. This thinner trading volume may result in increased price fluctuations.
The market price of our common stock could fluctuate substantially due to a variety of factors, including market perception of our ability to achieve our planned growth, our quarterly operating results, operating results of our competitors, trading volume in our common stock, changes in general conditions in the economy and the financial markets or other developments affecting our competitors or us. Certain of these factors can have a significant effect on the market price for our stock for reasons that are unrelated to our operating performance.
Our common stock is subject to penny stock rules.
Our common stock is subject to Rule 15g-1 through 15g-9 under the Exchange Act, which imposes certain sales practice requirements on broker-dealers which sell our common stock to persons other than established customers and “accredited investors” (generally, individuals with net worth’s in excess of $1,000,000 or annual incomes exceeding $200,000 (or $300,000 together with their spouses)). For transactions covered by this rule, a broker-dealer must make a special suitability determination for the purchaser and have received the purchaser’s written consent to the transaction prior to the sale. This rule adversely affects the ability of broker-dealers to sell our common stock and the ability of our stockholders to sell their shares of common stock.
Additionally, our common stock is subject to the SEC regulations for “penny stock.” Penny stock includes any equity security that is not listed on a national exchange and has a market price of less than $5.00 per share, subject to certain exceptions. The regulations require that prior to any non-exempt buy/sell transaction in a penny stock, a disclosure schedule set forth by the SEC relating to the penny stock market must be delivered to the purchaser of such penny stock. This disclosure must include the amount of commissions payable to both the broker-dealer and the registered representative and current price quotations for the common stock. The regulations also require that monthly statements be sent to holders of penny stock that disclose recent price information for the penny stock and information of the limited market for penny stocks. These requirements adversely affect the market liquidity of our common stock.
Some provisions in our certificate of incorporation and bylaws may deter third parties from seeking to acquire us.
Our certificate of incorporation and bylaws contain provisions that may make the acquisition of our company more difficult without the approval of our board of directors, including the following:
|
|
·
|
only the chairman of our board, our lead independent director, our chief executive officer, our president or a majority of our board of directors is authorized to call a special meeting of stockholders;
|
|
|
·
|
our certificate of incorporation authorizes undesignated preferred stock, the terms of which may be established and shares of which may be issued without stockholder approval; and
|
|
|
·
|
advance notice procedures apply for stockholders to nominate candidates for election as directors or to bring matters before a meeting of stockholders.
|
31
Delaware law and potential stockholder rights plans contain or may contain anti-takeover provisions that could deter takeover attempts that could be beneficial to our stockholders.
Provisions of Delaware law could make it more difficult for a third-party to acquire us, even if doing so would be beneficial to our stockholders. Section 203 of the Delaware General Corporation Law may make the acquisition of the Company and the removal of incumbent officers and directors more difficult by prohibiting stockholders holding 15% or more of our outstanding voting stock from acquiring the Company, without our board of directors’ consent, for at least three years from the date they first hold 15% or more of the voting stock. In addition, our Stockholder Rights Plan has significant anti-takeover effects by causing substantial dilution to a person or group that attempts to acquire us on terms not approved by our board of directors.
Risks related to Government Regulation
Our operations are subject to a number of regulations. Our operating activities in South Africa are governed under the state, commercial and labor regulations of that Country. Our products and services are subject to regulation by regulatory agencies in the countries where we operate
We are subject to federal and state laws and government regulations concerning employee safety and health and environmental matters. The Department of Labor, Occupational Safety and Health Administration, the Environmental Protection Agency, and other federal and state agencies have the authority to establish regulations that may have an impact on our operations.
Our business is subject to increasing regulation of content, consumer privacy, distribution and internet hosting and delivery in the key territories in which we conduct business. If we do not successfully respond to these regulations, our business may suffer.
Legislation is continually being introduced that may affect both the content of our products and their distribution. For example, data and consumer protection laws in the United States and Europe impose various restrictions on our websites, which will be increasingly important to our business as we continue to market our products directly to end users. Those rules vary by territory although the internet recognizes no geographical boundaries. In the United States, for example, numerous federal and state laws have been introduced which attempt to restrict the content or distribution of advertising. Legislation has been adopted in several states, and proposed at the federal level, that prohibits the sale of certain advertisements to minors. If such legislation is adopted and enforced, it could harm our business by limiting the campaigns we are able to offer to our customers or by limiting the size of the potential market for our campaigns. We may also be required to modify certain promotions or alter our marketing strategies to comply with new and possibly inconsistent regulations, which could be costly or delay the release of our campaigns. Any one or more of these factors could harm our business by limiting the products we are able to offer to our customers, by limiting the size of the potential market for our products, or by requiring costly additional differentiation between products for different territories to address varying regulations.
Due to the global nature of the Web, it is possible that, although our transmissions originate in California, the governments of other states or foreign countries might attempt to regulate our transmissions or levy sales or other taxes relating to our activities. In addition, the growth and development of the market for internet commerce may prompt calls for more stringent consumer protection laws, both in the United States and abroad, that may impose additional burdens on companies conducting business over the internet. The laws governing the internet remain largely unsettled, even in areas where there has been some legislative action. It may take years to determine how existing laws, including those governing intellectual property, privacy, libel and taxation, apply to the internet and internet advertising. Our business, results of operations and financial condition could be materially and adversely affected by the adoption or modification of industry standards, laws or regulations relating to the internet, or the application of existing laws to the internet or internet-based advertising.
We could be subject to legal claims, government enforcement actions and damage to our reputation and held liable for our or our customers’ failure to comply with federal, state and foreign laws, regulations or policies governing consumer privacy, which could materially harm our business.
Recent growing public concern regarding privacy and the collection, distribution and use of information about internet users has led to increased federal, state and foreign scrutiny and legislative and regulatory activity concerning data collection and use practices. The United States Congress currently has pending legislation regarding privacy and data security measures (e.g., S. 495, the “Personal Data Privacy and Security Act of 2007”). Any failure by us to comply with applicable federal, state and foreign laws and the requirements of regulatory authorities may result in, among other things, indemnification liability to our customers and the advertising agencies we work with, administrative enforcement actions and fines, class action lawsuits, cease and desist orders, and civil and criminal liability. Recently, class action lawsuits have been filed alleging violations of privacy laws by ISPs. The European Union’s directive addressing data privacy limits our ability to collect and use information regarding internet users. These restrictions may limit our ability to target advertising in most European countries. Our failure to comply with these or other federal, state or foreign laws could result in liability and materially harm our business.
In addition to government activity, privacy advocacy groups and the technology and direct marketing industries are considering various new, additional or different self-regulatory standards. This focus, and any legislation, regulations or standards promulgated, may impact us adversely. Governments, trade associations and industry self-regulatory groups may enact more burdensome laws, regulations and guidelines, including consumer privacy laws, affecting our customers and us. Since many of the proposed laws or regulations are just being developed, and a consensus on privacy and data usage has not been reached, we cannot yet determine the impact these proposed laws or regulations might have on our business. However, if the gathering of profiling information were to be curtailed, internet advertising would be less effective, which would reduce demand for internet advertising and harm our business.
32
Third parties may bring class action lawsuits against us relating to internet privacy and data collection. We disclose our information collection and dissemination policies, and we may be subject to claims if we act or are perceived to act inconsistently with these published policies. Any claims or inquiries could be costly and divert management’s attention, and the outcome of such claims could harm our reputation and our business.
Our Wireless Carrier and Brand Owner customers, as well as members of our publishing network are also subject to various federal and state laws concerning the collection and use of information regarding individuals. These laws include the Children’s Internet Privacy Protection Act, the Federal Drivers Privacy Protection Act of 1994, the privacy provisions of the Gramm-Leach-Bliley Act, the Federal CAN-SPAM Act of 2003, as well as other laws that govern the collection and use of consumer credit information. We cannot ensure that our customers are currently in compliance, or will remain in compliance, with these laws and their own privacy policies. We may be held liable if our customers use our technologies in a manner that is not in compliance with these laws or their own stated privacy policies.
Item 1B. Unresolved Staff Comments.
As a smaller reporting company we are not required to provide this information.
Item 2. Properties.
We lease approximately 7,700 square feet of office space in Santa Barbara, California. This office space houses our corporate headquarters, which includes our principal administrative, marketing, sales and support, and research and development organizations. We lease these properties pursuant to nine lease agreements. Each of the leased properties is located in the same office building in Santa Barbara. The terms of the lease agreements are summarized as follows:
|
Address
|
Approximate Square Footage
|
Current Monthly Rent (1)
|
Expiration of Lease (2)
|
|||
|
345 Chapala Street
|
832
|
$2,160
|
March 31, 2014
|
|||
|
347 Chapala Street
|
1,848
|
$5,756
|
March 14, 2014
|
|||
|
105 West Gutierrez Street
|
1,474
|
$3,974
|
November 14, 2012
|
|||
|
105C West Gutierrez Street
|
545
|
$1,270
|
May 31, 2011
|
|||
|
107 West Gutierrez Street
|
1,213
|
$3,125
|
March 15, 2012
|
|||
|
109 West Gutierrez Street
|
451
|
$1,170
|
November 14, 2012
|
|||
|
111 West Gutierrez Street
|
451
|
$1,170
|
November 14, 2012
|
|||
|
113 West Gutierrez Street
|
456
|
$1,170
|
November 14, 2012
|
|||
|
115 West Gutierrez Street
|
451
|
$1,265
|
June 30, 2011
|
|||
|
(1)
|
The monthly rent payments increase each year based on the Consumer Price Index.
|
|
(2)
|
Each of the lease agreements have options to extend the respective lease for additional periods of time.
|
In addition to our office space in Santa Barbara, we lease a corporate accommodation located at 4678 Gerona Way, Santa Barbara, California, 93110 in order to help defray the substantial costs of hotel accommodations in Santa Barbara. We lease approximately 750 square feet in this location under a lease agreement that expires on February 28, 2012. Monthly rental payments under the lease are currently $3,200.
In Johannesburg, South Africa, our Multimedia Solutions subsidiary leases approximately 921 square meters of office space pursuant to a lease that expires on September 30, 2012. Monthly rental payments under the lease are 112,000 South African Rand, or approximately $14,900 U.S. Dollars, per month and increase each year under the current lease by 8%.
Our Multimedia Solutions subsidiary also owns residential real property in Johannesburg which was acquired by the Company as part of the subsidiary’s acquisition in August 2008. The properties consist of four townhouses. There are mortgages on the properties, the payments on which are approximately $1,000 per month in the aggregate.
Each of our facilities is covered by insurance and we believe them to be suitable for their respective uses and adequate for our present needs. Our leased facilities are comprised of general commercial office space and we believe that suitable additional or substitute space will be available to accommodate the foreseeable expansion of our operations.
Item 3. Legal Proceedings.
From time to time, we may be involved in litigation relating to claims arising out of our operations in the normal course of business, including claims of alleged infringement, misuse or misappropriation of intellectual property rights of third parties. As of the date of this report, we are not a party to any such litigation which we believe would have a material adverse effect on us.
Item 4. (Removed and Reserved).
33
PART II
Item 5. Market for Registrant’s Common Equity, Related Stockholder Matters and Issuer Purchases of Equity Securities.
Our common stock is quoted on the Pink Quote system maintained by Pink OTC Markets Inc., under the symbol “LNCM.” The following table sets forth, for the periods indicated, the high and low sales prices per share of our common stock as reported on the Pink OTC Markets Inc. Quotations for the OTC Pink Sheets are market quotations that reflect inter-dealer prices without retail mark-up, mark-down or commission and may not necessarily represent actual transactions.
|
High
|
Low
|
||
|
2010
|
|||
|
Fourth Quarter
|
$3.80
|
$1.75
|
|
|
Third Quarter
|
$5.50
|
$1.05
|
|
|
Second Quarter
|
$6.45
|
$5.00
|
|
|
First Quarter
|
$6.40
|
$3.99
|
|
|
2009
|
|||
|
Fourth Quarter
|
$4.15
|
$1.55
|
|
|
Third Quarter
|
$3.85
|
$2.01
|
|
|
Second Quarter
|
$5.00
|
$2.40
|
|
|
First Quarter
|
$5.00
|
$2.07
|
|
As of March 11, 2011 there were 71,145,659 shares of our common stock outstanding held by approximately 623 holders of record.
Of our outstanding shares of common stock, 45,952,409 shares currently trade in the public float and 71,145,649 shares have been issued in private placement transactions.
Recent Sales of Unregistered Securities
On November 29, 2010, we issued 182,268 shares of unregistered common stock to designees of Floss Limited. 157,268 of the shares were issued in consideration for the conversion of all of the accrued principal and interest on a convertible promissory note that we issued to Floss Limited on November 11, 2009 in the amount of approximately $354,000. The remaining 25,000 shares were issued as incentive shares for Floss Limited purchasing the convertible promissory note. The issuance of the shares of our common stock to the designees of Floss Limited was made in a private placement transaction under Section 4(2) of the Securities Act of 1933, as amended.
On December 1, 2010, we issued shares of unregistered common stock to certain consultants of the Company, including 55,915 shares to Glen Akselrod, 12,000 shares to Baretto Pacific Corporation, 32,453 shares to Shaun Stapleton, 1,962 shares to Ryan Hudson Bennett and 1,500 shares to Steve Baum. The shares were issued in exchange for services previously rendered to the Company. We recorded the value of the shares issued to the consultants at approximately $120,000. The issuances of the shares of our common stock to the consultants were made in private placement transactions under Section 4(2) of the Securities Act of 1933, as amended.
On December 17, 2010, we issued 521,777 shares of unregistered common stock to Angelos Gateway Limited in consideration for the acquisition of certain assets by our subsidiary, Lenco Technology Group, from Angelos Gateway Limited. The shares issued to Angelos Gateway Limited are subject to a lock-up agreement. Pursuant to the lock-up agreement, one quarter of the shares may be sold six months following the closing of the transaction, one half may be sold one year following the closing of the transaction, three quarters may be sold eighteen months following the closing of the transaction and all of the shares may be sold two years following the closing of the transaction. The issuance of the shares of our common stock to Angelos Gateway Limited was made in a private placement transaction under Section 4(2) of the Securities Act of 1933, as amended.
In each of the foregoing transactions where we indicate that we relied upon Section 4(2) of the Securities Act in issuing securities, our reliance was based upon the following factors: (a) the issuance of the securities was an isolated private transaction by us which did not involve a public offering; (b) there were only a limited number of offerees; (c) there were no subsequent or contemporaneous public offerings of the securities by us; (d) the securities were not broken down into smaller denominations; and (e) the negotiations for the sale of the stock took place directly between the offeree and us.
34
Dividends
We have never declared or paid cash dividends on our common stock. We currently intend to retain future earnings, if any, to finance the growth and development of our business. Payment of future dividends, if any, will be at the discretion of our board of directors and will depend on our financial condition, results of operations, capital requirements and such other factors as the board of directors deems relevant. As long as any of our Series A Convertible Preferred Stock is outstanding, we are prohibited from declaring any dividend on our common stock without the consent of a majority of the then outstanding preferred stock, including the consent of Pablo Enterprises LLC (or its successor).
Item 6. Selected Financial Data.
As a smaller reporting company we are not required to provide this information.
35
Item 7. Management’s Discussion and Analysis of Financial Condition and Results of Operations.
The following discussion of our financial condition and results of operations should be read in conjunction with our consolidated financial statements and the related notes and other financial information appearing elsewhere in this report.
Overview
We develop, own and operate mobile phone, internet and internet broadcasting advertising platforms that are used by mobile telephone network operators (“Wireless Carriers”) and manufacturers, retailers and commercial enterprises (“Brand Owners”) to attract, monetize and retain relationships with consumers. During 2010, we broadened our market reach to include mobile and internet monetization of advertising for terrestrial radio and “pure-play” internet broadcasters.
We have been engaged in our current line of business, mobile and internet marketing, since early 2008. Since March 1, 2009, we have managed our business in two operating segments; the mobile phone platform segment and the internet platform segment.
Our mobile phone advertising platform provides Wireless Carriers with software and services which they use to manage and track the distribution of SMS and MMS messages through their their MMS Messaging Switch Center (“MMSC”). By making use of our MMS messaging platforms, a Wireless Carrier is able to enhance the revenue generated from its existing MMS network infrastructure, increase the efficiency of their MMSC, and improve the overall quality of the MMS messages which they deliver to their subscribers. Our mobile phone platform is based on our proprietary FlightPlan, FlightDeck and SGW software platforms and related applications. These software platforms facilitate the development of advertising content, compression of the advertisement to reduce file size, formatting the message to accommodate the configuration of various mobile phone handset models, and transmission of the advertisement through the Wireless Carrier’s network. In addition, we provide Wireless Carriers with software and services that enable them to manage the range of products that they offer to their subscribers, including mobile newspapers and mobile internet, or ‘mobi sites.” Our technical solutions have typically been well received by the Wireless Carriers who we approach and over the next twelve months, we believe that we will be able to expand the number of customers who make use of our solutions.
Our internet advertising platform operates under the Lenco Multimedia Inc. (formerly AdMax Media Inc.) and AdMaximizer brands and provides cutting edge technology which is used by Brand Owners to generate consumer leads for their businesses. We provide Brand Owners with advertising products and services to reach out to consumers online in a highly-focused manner. Our platform is designed to provide the Brand Owner with broad consumer access, better response rates on advertisements, higher quality leads and the ability to measure the success of each advertising campaign.
During 2010, we expanded into the mobile and internet broadcasting advertising segment with the acquisition of Jetcast, Inc. as a new wholly owned subsidiary. Subsequent to December 31, 2010, we renamed Jetcast, Inc. to Lenco Media Inc. Lenco Media Inc. provides products designed to make internet broadcasting profitable for broadcasters and advertisers. Lenco Media Inc.’s UniversalPlayer™, RadioLoyalty™, ReplaceAds™ and Jetcast® brand streaming products eliminate costs and increase revenue for broadcasters and increase advertisers’ return on their advertising investment. In January 2011, ReplaceAds™ served 1.1 billion page impressions to the unique listeners. We are in the process of integrating a number of our solutions into the Jetcast, Inc. platform which we believe will enable us to monetize the significant traffic that is generated monthly via ReplaceAds™. We view the acquisition as strategic in our efforts to develop an organization that provides Brand Owners with global access to new media channels and compelling technology. It also provides a mechanism to create and manage lists of consumers by interest groups. As we continue to expand the use of our UniversalPlayer™ to a large broadcaster base, we expect to see significant increases in revenue with this addition.
For additional information related to our operating segments, see Note 16 “Segment Information” to our consolidated financial statements.
Our primary products and solutions have been adopted by and are in use by Brand Owners in the United States, South Africa and Australia. Over the past couple of years, we developed a number of highly competitive and innovative new products and solutions which will enable us to expand our operations in the near future. In particular, we have invested significant time and resources in building relationships with Wireless Carriers and Brand Owners in Asia, Australia, New Zealand, the Middle East and the United Kingdom. We believe that our mobile greeting cards, mobile statement solution, bulk MMS messaging server, mobile and internet radio broadcasting platform and ability to integrate our AdMaximizer platform into our mobile platform will provide compelling opportunities for us.
The Company was incorporated in 1999 in Delaware under the name of Shochet Holdings Corporation. Prior to 2008, the Company completed an initial public offering, underwent several changes of control and was engaged in several different businesses, which included discount brokerage, financial services, mortgage banking and apparel, ultimately we were operating as a shell company seeking a combination with another operating company. Our predecessors had generated losses of approximately $15.8 million which are reflected in our retained losses.
36
Recent Acquisitions
In August 2010, our Lenco Multimedia Inc. (formerly AdMax Media, Inc.) subsidiary entered into an Asset Purchase Agreement with G2AA, LLC pursuant to which we acquired certain assets related to an online and mobile automotive marketing business. We issued an aggregate of 275,000 shares of common stock, valued at approximately $1.0 million, in payment of the purchase price for the assets.
In September 2010, we completed the acquisition of Jetcast, Inc. as a new wholly-owned subsidiary (now renamed Lenco Media Inc.). Pursuant to the merger agreement, we paid $500,000 in cash and issued 4,008,453 unregistered shares of our common stock to the former Jetcast, Inc. stockholders. In addition, we agreed to pay up to approximately $4.3 million in cash and up to $20.7 million in the form of unregistered shares of our common stock to the former Jetcast, Inc. stockholders upon the achievement of future operating targets.
In December 2010, Lenco Technology Group Ltd., (“LTG”) our wholly-owned subsidiary, entered into an asset purchase agreement with Angelos Gateway Limited (“Angelos”). In connection with the purchase and sale agreement, Angelos sold and transferred certain software and IP, relating to the deployment of the Signaling Gateway (“SGW”) system. LTG must pay $400,000 cash consideration over the ninety day period from the acquisition date, plus interest at six percent over that period. We also issued 521,277 shares of restricted common stock to vest over a two year period which will be recorded as compensation expense related to the continued employment of a key mobile programmer that was instrumental in the development of the SGW assets. The total consideration for the assets purchased is valued at approximately $404,000.
Recent Financing Transactions
During June and July 2010, we converted an aggregate principal amount of approximately $3.5 million of convertible notes payable to 1,003,662 shares of our common stock.
In September 2010, we sold an aggregate of 100,000 shares of our Series A Convertible Preferred Stock at a purchase price of $100.00 per share, raising gross proceeds of $10.0 million. The preferred stock was sold pursuant to the terms of a securities purchase agreement dated September 23, 2010 between the Company and certain accredited investors. The lead investor for the financing was Pablo Enterprises LLC, which purchased $10.0 million of the preferred stock. As a condition to the financing, the lead investor requested that our management team, Michael Levinsohn, a member of our board of directors and our chief executive officer, Thomas Banks, a member of our board of directors and our chief financial officer, and Michael Hill, President of Lenco Multimedia Inc. (formerly AdMax Media Inc.), a wholly-owned subsidiary of our company, purchase in the aggregate $750,000 worth of the preferred stock. Our management team formed an entity under the name Sterling Capital Partners Inc., which agreed to purchase such amount of the preferred stock on the same terms and conditions as the other investor in the financing. There were no discounts, sales or underwriting commissions incurred in connection with the financing. The proceeds will be used for general working capital purposes, including supporting the expansion of our mobile phone segment into new markets.
In November 2010, Floss Limited converted a $300,000 convertible promissory note plus accrued interest of approximately $54,000 to 157,268 shares of our common stock. Additionally, we owed 25,000 shares of common stock as in inducement payment to enter into the convertible note, which 25,000 shares were also issued in November 2010.
Discontinued Operations
On December 30, 2010, AdMax Media Inc. sold the assets used in its educational lead generation service business (“EDU Vertical”) and their name, AdMax Media Inc., to a newly-formed, unrelated third-party company organized under the name AdMax Media, Inc. (“Newco”). The asset sale was pursuant to the asset purchase agreement with Silverback Network, Inc. (“Silverback”) dated December 3, 2010 as amended on December 28, 2010. The purchase price for the assets was $2.8 million. At the closing, Newco paid $2.5 million to AdMax and $125,000 to an escrow account to secure certain of AdMax’s indemnification obligations under the asset purchase agreement. The $125,000 in the escrow account and the remaining $150,000 will be paid by June 28, 2011 and these amounts have been recorded as a purchase price receivable at December 31, 2010. In addition, the amount collected by Newco over the minimum accounts receivables amount of $700,000, is expected to be approximately $383,000 and has been recorded in accounts receivable at December 31, 2010. Operating results for AdMax Media’s EDU Vertical business have been presented in the accompanying consolidated statements of operations as discontinued operations for the years ended December 31, 2010 and 2009. In addition, the current assets related to EDU Vertical have been presented in the accompanying consolidated balance sheets as “Net assets related to discontinued operations” for the year ended December 31, 2009.
37
During the second half of 2010, revenues and profits from the EDU Vertical declined steadily. We attribute this decline to online schools decreasing their advertising budgets as a result of uncertainty related to continued U.S. government funding in the current economic environment. As a result, our management determined it was in the best interest of the Company to sell the assets related to EDU Vertical before further degradation of their potential realizable sales value occurred.
Subsequent Events
In January 2011, we repaid outstanding convertible notes payable of approximately $1.4 million plus the accrued interest related to those notes to Agile Opportunity Fund, LLC and all of the notes that were recorded as part of the Superfly assets acquisition with the exception of the note to MOSD Holdings. See “Legal Proceedings” in Part 1B Item 3 above for further discussion of this item.
In January 2011, we formally changed the name of our AdMax Media Inc. subsidiary to Lenco Multimedia Inc.
In January and February 2011, the Company made its first two payments to Angelos Gateway Limited in connection with the purchase sale agreement entered into in December 2010. The aggregate amount of the first two payments was approximately $278,000 and the final payment of approximately $126,000 will be made on March 17, 2011.
In February 2011, we formally changed the name of our wholly-owned subsidiary Jetcast, Inc. to Lenco Media Inc. In addition, our wholly-owned subsidiary that once fell under the AdMax Media Inc. name has been changed to Lenco Multimedia Inc.
In February 2011, we issued options to purchase 5,885,000 shares of common stock to certain employees of our Capital Supreme Pty Ltd subsidiary and to the senior executives of Lenco Mobile Inc. under our 2009 Equity Incentive Plan. These stock options were issued on February 22, 2011 with an exercise price based on the stock price on the close of the last business day, February 18, 2011of $2.15 per share. The stock options issued to the employees of Capital Supreme Pty Ltd will be subject to vesting based on achieving certain EBITDA targets. The stock options issued to the senior executives of Lenco Mobile Inc. will vest quarterly over three years.
In March 2011, we changed the make-up of our board of directors to include Philip B. Harris and James L. Liang as independent directors. Jonathan Fox resigned as a member of the board of directors but remains and officer of the Company. With the addition of Mr. Harris and Mr. Liang and the continuance of Mr. Ronald Wagner as in independent director, the Company now has three independent board members and two company management board members (Mr. Levinsohn and Mr. Banks). The three independent members are the sole members of the Audit Committee (Ronald Wagner), Nominating and Governance Committee (Philip Harris) and Compensation Committee (James Liang) with the person marked in parenthesis as the committee chairperson, respectively.
Revenue Generation
We generate revenues through the sale or license of advertising products and the performance of services. Our mobile and internet and internet broadcasting businesses operate under a number of different contractual relationships and generate revenue from a number of different sources, including the following:
|
·
|
Retainers: Some of our clients, including certain Wireless Carriers, pay us fixed monthly fees for the right to use defined products and services. For example, we periodically enter into contracts to host and maintain mobile access gateways; back-end connectivity; MMS and SMS messaging connectivity; monitoring, quality assurance and support in exchange for a monthly retainer. Retainers are generally negotiated on a term of six months or one year, depending on the nature of the product or service we provide. Revenues from retainer arrangements are generally recognized ratably over the term of the contract in accordance with ASC topic 605-20-25-3. These services are accounted for as a single unit of accounting as they do not meet the criteria for segregation into multiple deliverable units for purposes of revenue recognition as per ASC topic 605-25-25-5.
|
|
·
|
Program contracts: We enter into certain program contracts with clients, including Brand Owners, under which we provide a defined service for a fixed fee per transaction. For example, our mobile statement products are used by some of our clients to deliver monthly statements to the mobile phones to their respective subscribers or consumers. We earn a fixed fee for each statement sent to a mobile phone. Revenues from these contracts are recognized upon provision of such services.
|
|
·
|
Transaction fees: In certain instances we earn revenues on a transaction basis. For example, under the terms of our agreements with Wireless Carriers and Brand Owners, we earn transaction fees when a wireless subscriber downloads content into a mobile phone via one of our servers. A significant portion of our internet and internet broadcasting businesses are transaction-based. Often Brand Owners pay us on the basis of the number of qualified consumer leads we generated in an online campaign, or the number of advertisements we served on our UniversalPlayer™. Transaction fees are recognized as revenue in the period in which the transaction giving rise to the fee occurs.
|
38
|
·
|
Licenses of mobile platforms: We earn royalties from the license of our FlightPlan, FlightDeck and SGW platforms to Wireless Carriers. These platforms are connected to the Wireless Carriers’ data centers and earn fees ratably over the time period that they provide service to the Wireless Carriers or on a per message charge depending on the individual agreement with the Wireless Carrier. With agreements that are based on a period of time in which the Wireless Carrier utilized the platforms, revenues from these licenses are generally recognized ratably over the term of the contract in which the platforms will be utilized as per ASC topic 605-20-25-3. For those Wireless Carriers that agree to a per message basis to pay for the utilization of our platforms, we recognize revenue in the period in which the transaction giving rise to the revenue on a per message basis occurs.
|
|
·
|
Advisory and service fees: We earn advisory and service fees when Brand Owners hire us to assist in the design and execution of either a mobile or an online advertising campaign. We provide services from the initial conceptualization through to the creation of the content, website and mobi site development, database design/development, and all other such services to successfully implement the mobile and internet marketing campaign, including final product dissemination to consumers and measurement of success rates. Fees for these services are recognized as revenue when the services have been performed. Each of these services are priced, billed and recorded as revenue separately and in the period in which the services are performed.
|
Critical Accounting Policies and Estimates
Management believes that the most critical accounting policies important to understanding its financial statements and financial condition are its policies concerning currency conversion, revenue recognition, accounts receivable and its related allowance for doubtful account.
Currency Conversion. The business of our mobile phone segment has historically been conducted in the South African Rand. During 2010, we had increasing exposure to other currencies as we opened offices and incurred expenses in Singapore, Mexico, Colombia, South Korea and the U.K. Through our master licenses in Australia and New Zealand, we generated a small amount of revenue in Australia in 2010. All assets and liabilities are translated from foreign currencies into U.S. dollars at the exchange rates prevailing at the balance sheet dates, and all income and expenditure items are translated at the average rates for each of the periods presented.
Revenue Recognition. We generate revenue from a variety of transactions, including retainers, program contracts, transaction fees, licenses of mobile platforms, and advisory and service fees. See “Revenue Generation” above. Revenue recognition varies depending on the type of transaction, and may involve recognizing revenues over the term of a contract, a period in which services are performed, at the time a transaction is performed, to ensure revenue recognition for multiple deliverables is accounted for appropriately in our financial statements. Because a significant portion of our sales may be tied to large advertising campaigns ordered from time to time, the timing of when the revenue is recognized may have a significant impact on results of operations for any quarter or annual period.
Accounts Receivable and Allowance for Doubtful Accounts. Management exercises its judgment in establishing allowances for doubtful accounts receivable. This judgment is based on historical write-off percentages and information collected from individual customers. We have traditionally experienced high customer concentration, resulting in large accounts receivable from individual customers. The determination of the creditworthiness of these customers and whether or not an allowance is appropriate could have a significant impact on our results of operations for any quarter.
In addition to the critical accounting policies above, the preparation of financial statements in conformity with United States generally accepted accounting principles, or “GAAP,” requires management to make estimates and assumptions that affect the reported amounts of assets and liabilities, the disclosure of contingent assets and liabilities at the date of the financial statements and the reported amounts of revenues and expenses during the reporting periods. Management routinely makes judgments and estimates about the effects of matters that are inherently uncertain. As the number of variables and assumptions affecting the probable future resolution of the uncertainties increase, these judgments become even more subjective and complex.
39
Results of Operations
The following tables set forth our results of operations on a consolidated basis for the periods presented. The period-to-period comparison of financial results is not necessarily indicative of future results.
|
Year Ended December 31,
|
||||||||
|
2010
|
2009
|
|||||||
|
Revenue
|
$ | 8,357,331 | $ | 9,336,791 | ||||
|
Cost of sales
|
2,614,363 | 3,132,375 | ||||||
|
Gross profit
|
5,742,968 | 6,204,416 | ||||||
|
Operating expense:
|
||||||||
|
Sales and marketing
|
926,977 | 345,536 | ||||||
|
General and administrative
|
9,163,201 | 4,850,803 | ||||||
|
Research and development
|
532,538 | 262,316 | ||||||
|
Depreciation and amortization
|
3,937,268 | 2,242,237 | ||||||
|
Impairment of goodwill and intangibles
|
875,960 | - | ||||||
|
Total operating expense
|
15,435,944 | 7,700,892 | ||||||
|
Loss from operations
|
(9,692,976 | ) | (1,496,476 | ) | ||||
|
Total other expense
|
(90,744 | ) | (469,611 | ) | ||||
|
Loss from operations before provision for income taxes
|
(9,783,720 | ) | (1,966,087 | ) | ||||
|
Provision for income taxes
|
(58,302 | ) | 334,159 | |||||
|
Loss from continuing operations
|
(9,725,418 | ) | (2,300,246 | ) | ||||
|
Income from discontinued operations
|
232,595 | 726,192 | ||||||
|
Gain on sale of discontinued operations, net of tax $0
|
1,916,771 | - | ||||||
|
Net loss
|
$ | (7,576,052 | ) | $ | (1,574,054 | ) | ||
|
Net loss attributable to noncontrolling interest
|
71,613 | - | ||||||
|
Net loss attributable to Lenco Mobile Inc.
|
$ | (7,504,439 | ) | $ | (1,574,054 | ) | ||
|
Preferred stock dividend
|
(165,193 | ) | - | |||||
|
Series A Preferred Stock accretion beneficial conversion feature
|
(1,458,236 | ) | - | |||||
|
Net loss attributable to common stockholders
|
$ | (9,127,868 | ) | $ | (1,574,054 | ) | ||
Comparison of Year Ended December 31, 2010 to Year Ended December 31, 2009
Revenues
The financial results for the years ended December 31, 2010 and for December 31, 2009 have been presented taking into account the sale of our online EDU lead generation business and reporting that as discontinued operations. For the year ended December 31, 2010, revenues were approximately $8.4 million compared to $9.3 million for the year ended December 31, 2009. The decrease in revenues is attributable to general decline in our core businesses and to the discontinuation of our lead generation business for the education market. Revenues for our mobile segment decreased by approximately $1.4 million from $7.7 million in 2009 to $6.3 million in 2010 due to deteriorating economic conditions and lower advertising spending by customers in South Africa, which has historically been the primary market for our mobile phone business. Revenues from our continuing operating internet segment were $2.1 million in 2010 as compared to $4.5 million in 2009. The drop was related to a decline in data and lead sales in verticals outside of the education market. The discontinuation of operations related to our lead generation for the education vertical results in the reclassification of $7.6 million of revenue from 2010 and $2.9 million of revenue from 2009 to discontinued operations. We believe the Company is well-positioned for revenue growth in 2011 from 2010 levels stemming from growth in the international mobile business and the mobile and internet radio broadcasting platform.
Cost of Sales
For the year ended December 31, 2010, cost of sales was $2.6 million compared to $3.1 million for the year ended December 31, 2009. The decrease in cost of sales is attributable to our decrease in revenue in 2010 compared to 2009. Cost of sales for our mobile phone segment was $1.7 million for 2010 compared to $3.8 million for 2009 and cost of sales for our internet advertising segment was approximately $939,000 for 2010 compared to $2.3 million for 2009. We believe the Company will have costs of sales increases in 2011 as compared to 2010 related to the expectation of increased revenues, as described above.
40
Gross Margin
For the year ended December 31, 2010, gross margin as a percentage of revenues was 69% compared to 66% for the year ended December 31, 2009. Our mobile phone segment has generally generated higher gross margins than our internet segment and revenues from our mobile phone segment increased as a percentage of our overall revenue in 2010. Cost of sales as percentage of overall revenue, and consequently gross margin, varies depending on the change in product mix. As a result, period to period comparisons of our gross margin may not provide meaningful information concerning expected future trends. For 2011, we believe our gross margins will remain in the same range as 2010 and 2009 figures but this may vary based on product mix of sales, territories where growth occurs and other factors.
Operating expenses
For the year ended December 31, 2010, operating expenses were $15.4 million compared to $7.7 million for the year ended December 31, 2009.
Selling and marketing expenses for the year ended December 31, 2010 were approximately $927,000 compared to $346,000 for 2009. Sales and marketing costs increased due to increased sales efforts with Wireless Carriers and Brand Owners internationally, increasing our travel costs and staffing costs.
General and administrative expenses for the year ended December 31, 2010 were approximately $9.2 million compared to $4.9 million for 2009. The increase in general and administrative expenses was attributable primarily to increased staffing related to our 2010 acquisitions and a full year of staffing costs for our 2009 acquisitions. We incurred over $400,000 in costs related to international expansion of our mobile phone business. In addition, during 2010, we had increased professional fees related to acquisitions, corporate matters, investor relations, and other increased costs of administration related to operating as a public company and efforts to apply for listing on a national stock exchange. Legal, professional and accounting costs for 2010 were approximately $1.6 million and for 2009 were $1.0 million.
Research and development expenses were approximately $533,000 for the year ended December 31, 2010 compared to $262,000 in 2009. We increased research and development spending in an effort to maintain a technical leadership position with our platforms and to best serve our customers with cutting edge and high performing products.
Depreciation and amortization expenses were approximately $3.9 million for the year ended December 31, 2010, compared to $2.2 million for 2009. Depreciation and amortization increased due to having a full year of amortization on assets acquired during 2009 and also related to new depreciation and amortization of 2010 assets acquired.
We also had impairment of approximately $876,000 in 2010 related to goodwill and other intangibles that had a focus on EDU vertical markets which we feel are positioned for diminishing returns over the near future.
Operating expenses will continue to increase in 2011 as a full year of depreciation and amortization are calculated on historical assets acquired and as we continue to staff to manage international expansion of our mobile product offerings.
Other Income (Expense)
For the year ended December 31, 2010, other income (expense) was a net expense of approximately $91,000. This consisted of a gain of approximately $631,000 from a Settlement and Release Agreement with Superfly Advertising, Inc. offset by approximately $722,000 of interest expense. For the year ended December 31, 2009, other income (expense) was a net expense of approximately $470,000. This stemmed primarily from interest expense and a $200,000 charge for debt modification related to debt assumed from the Superfly Advertising, Inc. asset acquisition in March 2009 as well as other additional debt secured during the remainder of 2009.
Provision for Income Taxes
For the year ended December 31, 2010 and 2009, we did not record any tax benefit for the income before tax losses incurred in the U.S. as we recorded a 100% valuation allowance on the potential benefit. Once our U.S. operations achieve consistent profitability from a tax-reporting perspective we will record the tax benefits of U.S. pre-tax losses including any allowable tax benefit from historical losses. The income tax provision showing in the table above in 2010 and 2009, stemmed primarily from our international tax positions.
Profit from discontinued operations and gain on sale of discontinued operations, net of tax
Operating results for AdMax Media’s EDU Vertical business have been presented in the accompanying consolidated statements of operations as discontinued operation for the years ended December 31, 2010 and 2009 as further described in Note 2 to the accompanying consolidated financial statements. In addition, the current assets related to EDU Vertical have been presented in the accompanying consolidated balance sheets as “Net current assets related to discontinued operations” for the years ended December 31, 2010 and 2009, where applicable. As required by U.S. GAAP, we presented a net figure for the historical operating figures as profits from discontinued operations of approximately $0.2 million and $0.7 million for 2010 and 2009, respectively. With the sale of those assets to a third-party, we recorded a gain on sale on the sale of discontinued operations, net of tax $0, of $1.9 million.
41
Preferred stock dividend and accretion of beneficial conversion feature
The Company determined that the preferred stock issued in September 2010 contained an embedded beneficial conversion feature and we recorded a preferred stock discount of $10.0 million which will be treated as a deemed dividend and amortized over twenty four months to accumulated deficit. In addition, the holders of the preferred stock are entitled to cumulative dividends at the rate per share (as a percentage of the stated value per share) of 6.0% per annum. For the year ended December 31, 2010, we amortized approximately $1.5 million as a deemed dividend and accrued approximately $0.2 million for the dividends payable under this agreement.
Net loss attributable to common stockholders
For the year ended December 31, 2010, net loss attributable to Lenco Mobile Inc. was $7.5 million, and for the year ended December 31, 2009, net loss was $1.6 million.
Liquidity and Capital Resources
At December 31, 2010, we had cash and cash equivalents of approximately $9.3 million compared to $0.4 million at December 31, 2009. The increase in cash and cash equivalents was primarily attributed to the proceeds of September 2010 Preferred Series A stock financing. In addition, at December 31, 2010, accounts receivable, net of allowances, were $1.2 million compared to $1.9 million at December 31, 2009. The decrease in accounts receivable was primarily attributed to an improved collections of accounts receivable balances at year end, in addition to a decrease in revenues from our subsidiary Multimedia Solutions subsidiary in South Africa. At December 31, 2010, we had working capital of $6.9 million compared to a working capital deficit of $2.0 million at December 31, 2009.
For the twelve months ended December 31, 2010, we used $4.9 million of cash from operations resulting from a net loss attributable to Lenco Mobile Inc. of $7.5 million offset by adjustments for depreciation, amortization, preferred stock dividends and accretions and other adjustments of $4.6 million, and decreased by changes in operating assets and liabilities of approximately $0.3 million.
Investment activities provided cash in the amount of $1.6 million during the twelve months ended December 31, 2010. We received cash from the sale of EDU lead generation business of $2.5 million and the acquisition of assets related to G2AA of $0.3 million. These amounts were offset by approximately $0.5 million in cash paid for the acquisition of Jetcast, Inc., $0.3 million in capital expenditures for property and equipment and $0.4 million in expenditures for intangible assets. As of December 31, 2010, we do not have any significant commitments for capital expenditures.
Financing activities provided net cash in the amount of $12.2 million during the twelve months ended December 31, 2010, related to the $10.8 million Series A Preferred financing and $2.0 million of promissory and convertible notes that we issued during 2010 less cash payments on debt of $0.2 million.
Our primary need for capital is to support our expansion into selected international markets, expand the use of our UniversalPlayer™ for our mobile and internet radio product. We are currently negotiating contracts with additional Wireless Carriers around the world. As we secure contracts with Wireless Carriers, we intend to put the equipment and personnel infrastructure in place that is necessary to service those new accounts. If our operations do not generate sufficient cash flow to support this expansion, we intend to finance these costs through the sale of debt or equity securities.
At the time of this report, we have an unused credit facility with ABSA Bank in South Africa for R1.7 million (or approximately $255,000 USD). Other than this facility we do not currently have available credit facilities. There can be no assurances that any future financing will be made available to us, or made available on terms that are favorable to us or our current stockholders. If we cannot secure capital when needed, we may be forced to limit our geographic expansion or curtail certain of our business operations.
Off-Balance Sheet Arrangements
As of December 31, 2010, we did not have any significant off-balance sheet arrangements.
42
Contractual Obligations and Commitments
The following is a summary of our contractual cash obligations as of December 31, 2010:
| Payments Due By Period | ||||||||||||||||||||
|
Less than
|
More than
|
|||||||||||||||||||
|
Contractual Obligations
|
1 year
|
1-3 years
|
3-5 years
|
5 years
|
Total
|
|||||||||||||||
|
Convertible Promissory Notes
|
$ | 1,625,750 | $ | - | $ | - | $ | - | $ | 1,625,750 | ||||||||||
|
Capital Leases and Mortgages
|
229,048 | 178,687 | - | - | $ | 407,735 | ||||||||||||||
|
Operating Leases
|
274,640 | 291,047 | 20,870 | - | $ | 586,557 | ||||||||||||||
|
Total Contractual Obligations
|
$ | 2,129,438 | $ | 469,734 | $ | 20,870 | $ | - | $ | 2,620,042 | ||||||||||
Convertible Promissory Notes. The convertible promissory notes were issued in February 2009 and matured on January 16, 2011. Subsequent to the period covered by this report, we repaid the convertible promissory notes in full at maturity.
Other Capital Leases and Mortgages. We have various capital leases network and computer equipment in our South African office expiring in various years through 2013. There is one capital lease that bears interest at 11.0% and one at 11.5%. We also have mortgages which relate to the four townhouses that we own in South Africa. The mortgage payments aggregate to approximately $1,000 per month and bear interest at 12.2%.
Operating Leases. We have operating leases for multiple facilities, including our corporate headquarters in Santa Barbara, California. These leases are show in Item 2 “Properties” above. See Note 17 to our financial statement for a schedule of the amounts payable under these leases.
Recent Accounting Pronouncements
Please see the section entitled “Recent Accounting Pronouncements” contained in Note 1 to our financial statements included in this annual report on Form 10-K.
Item 7A. Quantitative and Qualitative Disclosures About Market Risk.
As a smaller reporting company we are not required to provide this information.
43
Item 8. Financial Statements and Supplementary Data.
REPORT OF INDEPENDENT REGISTERED PUBLIC ACCOUNTING FIRM
To the Board of Directors
Lenco Mobile Inc. and Subsidiaries
Santa Barbara, California
We have audited the accompanying consolidated balance sheet of Lenco Mobile Inc. and Subsidiaries (collectively, the “Company”) as of December 31, 2010, and the related consolidated statements of operations and comprehensive loss, shareholders’ equity and cash flows for the year ended December 31, 2010. These consolidated financial statements are the responsibility of the Company's management. Our responsibility is to express an opinion on these consolidated financial statements based on our audit. The consolidated financial statements of the Company for the year ended December 31, 2009, were audited by other auditors whose report, dated April 8, 2010, on those consolidated financial statements included an explanatory paragraph that expressed substantial doubt about the Company's ability to continue as a going concern.
We conducted our audit in accordance with the standards of the Public Company Accounting Oversight Board (United States). Those standards require that we plan and perform the audit to obtain reasonable assurance about whether the consolidated financial statements are free of material misstatement. The Company is not required to have, nor were engaged to perform an audit of its internal control over financial reporting. Our audit included consideration of internal control over financial reporting as a basis for designing audit procedures that are appropriate in the circumstances, but not for the purpose of expressing an opinion on the effectiveness of the Company’s internal control over financial reporting. Accordingly, we express no such opinion. An audit includes examining, on a test basis, evidence supporting the amounts and disclosures in the financial statements. An audit also includes assessing the accounting principles used and significant estimates made by management, as well as evaluating the overall consolidated financial statement presentation. We believe that our audit provides a reasonable basis for our opinion.
In our opinion, the consolidated financial statements referred to above present fairly, in all material respects, the financial position of the Company as of December 31, 2010, and the results of its operations and its cash flows for the year ended in conformity with accounting principles generally accepted in the United States of America. Also, in our opinion, the related financial statement schedules, when considered in relation to the basic consolidated financial statements taken as a whole, presents fairly in all material respects the information set forth therein.
As discussed above, the consolidated financial statements of the Company as of December 31, 2009, and for the year then ended were audited by other auditors. As described in Note 2, these consolidated financial statements have been retroactively restated to account for the impact of discontinued operations. We audited the adjustments described in Note 2 that were applied to restate the 2009 consolidated financial statements. In our opinion, such adjustments are appropriate and have been properly applied. However, we were not engaged to audit, review, or apply any procedures to the 2009 consolidated financial statements of the Company other than with respect to such adjustments and, accordingly, we do not express an opinion or any other form of assurance on the 2009 consolidated financial statements taken as a whole.
We were not engaged to examine management's assessment of the effectiveness of the Company’s internal control over financial reporting as of December 31, 2010, included in the accompanying Management’s Report on Internal Control over Financial Reporting and, accordingly, we do not express an opinion thereon.
/s/ SingerLewak LLP
Los Angeles, California
March 28, 2011
44
REPORT OF INDEPENDENT REGISTERED PUBLIC ACCOUNTING FIRM
To the Board of Directors of Lenco Mobile Inc. and Subsidiaries
Santa Barbara, California
We have audited, before the effects of the adjustments to record the effects of discontinued operations described in Note 2, the accompanying consolidated balance sheet of Lenco Mobile Inc. and Subsidiaries (collectively, “the Company”) as of December 31, 2009 and the related consolidated statement of operations, comprehensive income, shareholders’ equity and cash flows for the year ended December 31, 2009 (the effects of the adjustments discussed in Note 2 are not presented herein). The Company’s management is responsible for these financial statements. Our responsibility is to express an opinion on these financial statements based on our audit.
We conducted our audit in accordance with the standards of the Public Company Accounting Oversight Board (United States). Those standards require that we plan and perform the audit to obtain reasonable assurance about whether the financial statements are free of material misstatement. The Company is not required to have, nor were we engaged to perform, an audit of its internal control over financial reporting. Our audit included consideration of internal control over financial reporting as a basis for designing audit procedures that are appropriate in the circumstances, but not for the purpose of expressing an opinion on the effectiveness of the Company’s internal control over financial reporting. Accordingly, we express no such opinion. An audit also includes examining, on a test basis, evidence supporting the amounts and disclosures in the financial statements, assessing the accounting principles used and significant estimates made by management, as well as evaluating the overall financial statement presentation. We believe that our audits provide a reasonable basis for our opinion.
In our opinion, the financial statements referred to above, before the effects of the adjustments to record the effects of discontinued operations described in Note 2, present fairly, in all material respects, the financial position of the Company as of December 31, 2009 and the results of its operations and its cash flows for the year ended December 31, 2009 in conformity with accounting principles generally accepted in the United States of America.
We were not engaged to audit, review, or apply any procedures to the adjustments to record the effects of discontinued operations as described in Note 2 and , accordingly we do not express an opinion or any form of assurance about whether such adjustments are appropriate and have been properly applied. Those adjustments were audited by SingerLewak LLP.
/s/ Gruber & Company, LLC
Lake Saint Louis, Missouri
April 8, 2010.
45
Lenco Mobile Inc.
and its subsidiaries
Consolidated Balance Sheets
| As of December 31, | ||||||||
|
2010
|
2009
|
|||||||
|
ASSETS
|
||||||||
|
Current assets:
|
||||||||
|
Cash and cash equivalents
|
$ | 9,282,898 | $ | 386,811 | ||||
|
Investments
|
431,250 | - | ||||||
|
Accounts receivable, net
|
1,247,683 | 1,932,995 | ||||||
|
Purchase price receivable
|
275,000 | - | ||||||
|
Notes receivable, current portion
|
40,000 | 65,000 | ||||||
|
Other current assets
|
296,630 | 489,439 | ||||||
|
Income taxes receivable
|
492,889 | - | ||||||
|
Net assets related to discontinued operations
|
- | 838,384 | ||||||
|
Total current assets
|
12,066,350 | 3,712,629 | ||||||
|
Property and equipment, net
|
1,303,965 | 1,395,115 | ||||||
|
Other noncurrent assets:
|
||||||||
|
Intangible assets - goodwill
|
13,983,214 | 3,562,322 | ||||||
|
Intangible assets - other, net
|
20,422,664 | 10,300,766 | ||||||
|
Other noncurrent assets
|
29,700 | 20,685 | ||||||
|
Total other noncurrent assets
|
34,435,578 | 13,883,773 | ||||||
|
Total assets
|
$ | 47,805,893 | $ | 18,991,517 | ||||
|
LIABILITIES AND SHAREHOLDERS' EQUITY
|
||||||||
|
Current liabilities:
|
||||||||
|
Accounts payable and accrued expenses
|
$ | 2,314,066 | $ | 1,299,934 | ||||
|
Current portion of long-term debt, net of debt discount (convertible debt portion of $1,625,750 and $3,563,101, respectively)
|
1,759,110 | 3,635,376 | ||||||
|
Preferred dividend payable
|
165,193 | - | ||||||
|
Preferred stock deposit liability
|
400,000 | - | ||||||
|
Current contingent consideration liability
|
479,689 | 607,950 | ||||||
|
Income taxes payable
|
- | 126,988 | ||||||
|
Warrant put liability
|
60,000 | - | ||||||
|
Total current liabilities
|
5,178,058 | 5,670,248 | ||||||
|
Long-term debt, less current portion
|
133,842 | 95,916 | ||||||
|
Warrant put liability, less current portion
|
- | 60,000 | ||||||
|
Deferred tax liability
|
1,900,565 | - | ||||||
|
Contingent consideration liability, net of current portion
|
12,237,896 | 782,835 | ||||||
|
Total liabilities
|
19,450,361 | 6,608,999 | ||||||
|
Shareholders' equity:
|
||||||||
|
Preferred Stock, Series A 1,000,000 shares authorized, $.001 par value, 100,000 shares issued and outstanding at December 31, 2010 and 0 at December 31, 2009
|
100 | - | ||||||
|
Common stock, 250,000,000 shares authorized, $.001 par value, 71,145,659 and 65,049,084 shares issued and outstanding at December 31, 2010 and December 31, 2009, respectively
|
71,145 | 65,049 | ||||||
|
Additional paid in capital
|
54,243,114 | 29,274,041 | ||||||
|
Accumulated other comprehensive income
|
568,530 | 371,204 | ||||||
|
Accumulated deficit
|
(26,455,744 | ) | (17,327,776 | ) | ||||
|
Total Lenco Mobile Inc. shareholders' equity
|
28,427,145 | 12,382,518 | ||||||
|
Noncontrolling interest (deficit)
|
(71,613 | ) | - | |||||
|
Total equity
|
28,355,532 | 12,382,518 | ||||||
|
Total liabilities and shareholders' equity
|
$ | 47,805,893 | $ | 18,991,517 | ||||
The accompanying notes are integral part of these consolidated financial statements.
46
Lenco Mobile Inc.
and its subsidiaries
Consolidated Statements of Operations
|
Years Ended December 31,
|
||||||||
|
2010
|
2009
|
|||||||
|
Revenue
|
$ | 8,357,331 | $ | 9,336,791 | ||||
|
Cost of sales
|
2,614,363 | 3,132,375 | ||||||
|
Gross profit
|
5,742,968 | 6,204,416 | ||||||
|
Operating expense:
|
||||||||
|
Sales and marketing
|
926,977 | 345,536 | ||||||
|
General and administrative
|
9,163,201 | 4,850,803 | ||||||
|
Research and development
|
532,538 | 262,316 | ||||||
|
Depreciation and amortization
|
3,937,268 | 2,242,237 | ||||||
|
Impairment of goodwill and intangibles
|
875,960 | - | ||||||
|
Total operating expense
|
15,435,944 | 7,700,892 | ||||||
|
Loss from operations
|
(9,692,976 | ) | (1,496,476 | ) | ||||
|
Other income (expense):
|
||||||||
|
Interest expense, net
|
(722,104 | ) | (301,611 | ) | ||||
|
Other income (expense), net
|
631,360 | (168,000 | ) | |||||
|
Total other income (expense)
|
(90,744 | ) | (469,611 | ) | ||||
|
Loss from operations before provision for income taxes
|
(9,783,720 | ) | (1,966,087 | ) | ||||
|
Provision for income taxes
|
(58,302 | ) | 334,159 | |||||
|
Loss from continuing operations
|
(9,725,418 | ) | (2,300,246 | ) | ||||
|
Income from discontinued operations
|
232,595 | 726,192 | ||||||
|
Gain on sale of discontinued operations, net of tax $0
|
1,916,771 | - | ||||||
|
Net loss
|
(7,576,052 | ) | (1,574,054 | ) | ||||
|
Net loss attributable to noncontrolling interest
|
71,613 | - | ||||||
|
Net loss attributable to Lenco Mobile Inc.
|
(7,504,439 | ) | (1,574,054 | ) | ||||
|
Preferred stock dividends
|
(165,193 | ) | - | |||||
|
Series A Preferred Stock accretion of beneficial conversion feature
|
(1,458,236 | ) | - | |||||
|
Net loss attributable to common stockholders
|
$ | (9,127,868 | ) | $ | (1,574,054 | ) | ||
|
Basic and diluted net loss per share applicable to common stockholders
|
||||||||
|
Continuing operations
|
$ | (0.14 | ) | $ | (0.04 | ) | ||
|
Discontinued operations
|
$ | 0.03 | $ | 0.01 | ||||
|
Net loss per share applicable to common stockholders
|
$ | (0.11 | ) | $ | (0.03 | ) | ||
|
Weighted average shares outstanding - basic and diluted
|
66,778,400 | 55,824,204 | ||||||
|
Years Ended December 31,
|
||||||||
| 2010 | 2009 | |||||||
|
Net loss
|
$ | (7,576,052 | ) | $ | (1,574,054 | ) | ||
|
Foreign currency translation adjustment
|
341,076 | 675,684 | ||||||
|
Unrealized loss on investments
|
(143,750 | ) | - | |||||
|
Total comprehensive loss
|
$ | (7,378,726 | ) | $ | (898,370 | ) | ||
The accompanying notes are integral part of these consolidated financial statements.
47
Lenco Mobile Inc.
and its subsidiaries
Consolidated Statement of Shareholders’ Equity
Years Ended December 31, 2010 and 2009
|
Other
|
||||||||||||||||||||||||||||||||||||
|
Additional
|
Non-
|
Accumulated
|
Total
|
|||||||||||||||||||||||||||||||||
| Common Stock | Preferred Stock |
Paid
|
Controlling
|
Comprehensive
|
Accumulated
|
Shareholders'
|
||||||||||||||||||||||||||||||
|
Shares
|
Total
|
Shares
|
Total
|
in Capital
|
Interest
|
Income/(Loss)
|
Deficit
|
Equity/(Loss)
|
||||||||||||||||||||||||||||
|
Balance, Dec. 31, 2008
|
40,311,179 | $ | 41,511 | 207 | $ | - | $ | 19,033,644 | $ | - | $ | (304,480 | ) | $ | (15,753,722 | ) | $ | 3,016,953 | ||||||||||||||||||
|
Common stock issued in acquisitions
|
9,225,309 | 8,025 | - | - | 9,901,136 | - | - | - | 9,909,161 | |||||||||||||||||||||||||||
|
Common stock issued in note conversions
|
5,162,596 | 5,163 | - | - | 349,611 | - | - | - | 354,774 | |||||||||||||||||||||||||||
|
Preferred stock converted to common stock
|
10,350,000 | 10,350 | (207 | ) | - | (10,350 | ) | - | - | - | - | |||||||||||||||||||||||||
|
Net loss
|
- | - | - | - | - | - | (1,574,054 | ) | (1,574,054 | ) | ||||||||||||||||||||||||||
|
Other comprehensive income
|
- | - | - | - | - | - | 675,684 | - | 675,684 | |||||||||||||||||||||||||||
|
Balance, Dec 31, 2009
|
65,049,084 | $ | 65,049 | - | $ | - | $ | 29,274,041 | $ | - | $ | 371,204 | $ | (17,327,776 | ) | $ | 12,382,518 | |||||||||||||||||||
|
Common stock issued in acquisitions
|
4,804,730 | 4,804 | - | - | 9,131,495 | - | - | - | 9,136,299 | |||||||||||||||||||||||||||
|
Common stock issued in note conversions
|
1,291,845 | 1,292 | - | - | 4,379,342 | - | - | - | 4,380,634 | |||||||||||||||||||||||||||
|
Issuance of preferred stock
|
- | - | 100,000 | 100 | 9,999,900 | - | - | - | 10,000,000 | |||||||||||||||||||||||||||
|
Accretion of beneficial conversion feature
|
- | - | - | - | 1,458,336 | - | - | (1,458,336 | ) | - | ||||||||||||||||||||||||||
|
Preferred stock dividend
|
- | - | - | - | - | - | - | (165,193 | ) | (165,193 | ) | |||||||||||||||||||||||||
|
Net Loss
|
- | - | - | - | - | (71,613 | ) | - | (7,504,439 | ) | (7,576,052 | ) | ||||||||||||||||||||||||
|
Other comprehensive income
|
- | - | - | - | - | - | 197,326 | - | 197,326 | |||||||||||||||||||||||||||
|
Balance, Dec 31, 2010
|
71,145,659 | $ | 71,145 | 100,000 | $ | 100 | $ | 54,243,114 | $ | (71,613 | ) | $ | 568,530 | $ | (26,455,744 | ) | $ | 28,355,532 | ||||||||||||||||||
The accompanying notes are integral part of these consolidated financial statements.
48
Lenco Mobile Inc. and its subsidiaries
Consolidated Statements of Cash Flows
|
Years Ended December 31,
|
||||||||
|
2010
|
2009
|
|||||||
|
Cash flows from operating activities:
|
||||||||
|
Net loss attributable to Lenco Mobile Inc.
|
$ | (7,504,439 | ) | $ | (1,574,054 | ) | ||
|
Adjustments to reconcile net loss to net cash provided by (used in) operating activities:
|
||||||||
|
Non-controlling interest
|
(71,613 | ) | - | |||||
|
Depreciation, amortization and other
|
3,827,256 | 2,276,401 | ||||||
|
Amortization of debt discounts
|
640,089 | 154,496 | ||||||
|
Loss on debt modification
|
- | 168,000 | ||||||
|
Performed services for common stock
|
(442,039 | ) | - | |||||
|
Gain on sale of discontinued operation
|
(1,916,771 | ) | - | |||||
|
Impairmentof goodwill and intangibles
|
875,960 | - | ||||||
|
Loss on write-down of note receivable
|
25,000 | - | ||||||
|
Changes in operating assets and liabilities, net of impact of acquisitions:
|
||||||||
|
Accounts receivable
|
853,273 | (858,414 | ) | |||||
|
Other current and non-current assets
|
118,901 | 30,862 | ||||||
|
Accounts payable, accrued expenses, and other current liabilities
|
(571,119 | ) | (145,809 | ) | ||||
|
Income taxes receivable
|
(680,787 | ) | (20,222 | ) | ||||
|
Net cash provided by (used in) operating activities
|
(4,846,289 | ) | 31,260 | |||||
|
Cash flows from investing activities:
|
||||||||
|
Purchases of property and equipment
|
(319,201 | ) | (462,925 | ) | ||||
|
Purchases and expenditures for intangible assets
|
(383,006 | ) | (200,708 | ) | ||||
|
Proceeds from the sale of data list and website assets
|
- | 425,000 | ||||||
|
Proceeds from sale of discontinued operations
|
2,525,000 | - | ||||||
|
Cash paid for acquisition of Jetcast, Inc.
|
(500,026 | ) | - | |||||
|
Cash acquired in acquisition of assets from G2AA, LLC
|
285,000 | - | ||||||
|
Net cash provided by (used in) investing activities
|
1,607,767 | (238,633 | ) | |||||
|
Cash flows from financing activities:
|
||||||||
|
Payment of long-term debt
|
(213,988 | ) | (174,738 | ) | ||||
|
Proceeds from issuance of long-term debt
|
2,019,000 | 752,351 | ||||||
|
Deposit of issuances of Series A Preferred Stock
|
400,000 | - | ||||||
|
Proceeds from issuance of Series A Preferred Stock
|
10,000,000 | - | ||||||
|
Net cash provided by (used in) financing activities
|
12,205,012 | 577,613 | ||||||
|
Effect of exchange rate changes on cash and cash equivalents
|
(70,403 | ) | 13,326 | |||||
|
Net change in cash and cash equivalents
|
8,896,087 | 383,566 | ||||||
|
Cash and cash equivalents, beginning of period
|
386,811 | 3,245 | ||||||
|
Cash and cash equivalents, end of period
|
$ | 9,282,898 | $ | 386,811 | ||||
|
Supplemental disclosure of cash flow information:
|
||||||||
|
Cash paid for income taxes
|
$ | 493,682 | $ | 363,096 | ||||
|
Cash paid for interest
|
$ | 569,640 | $ | 11,545 | ||||
|
Supplemental disclosure of non-cash investing and financing activities:
|
||||||||
|
Common stock issued for acquisition of Superfly assets
|
$ | - | $ | 8,587,205 | ||||
|
Conversion of Elvena Enterprises note payable and accrued interest into common stock
|
$ | - | $ | 206,274 | ||||
|
Notes payables assumed related to former Superfly notes
|
$ | - | $ | 2,707,500 | ||||
|
Note receivable received for sale of equipment to third party
|
$ | - | $ | 65,000 | ||||
|
Conversion of 207 preferred stock for 10,350,000 shares of common stock
|
$ | - | $ | 350 | ||||
|
Conversion of notes and accrued interest for 668,680 shares of common stock
|
$ | 1,888,087 | $ | - | ||||
|
Issuance of 492,250 shares of common stock for payment on debt
|
$ | 1,969,000 | $ | - | ||||
|
Common stock issued for acquisition of Jetcast, Inc.
|
$ | 8,084,913 | $ | - | ||||
|
Common stock issued for acquisition of G2AA, LLC
|
$ | 1,038,147 | $ | - | ||||
|
Common stock issued for acquisition of Angelos Gateway Limited
|
$ | 665,451 | $ | - | ||||
|
Issued 50,000 shares common stock to extend note payable
|
$ | 188,754 | $ | - | ||||
|
Purchase of equipment through capital lease obligations
|
$ | 113,215 | $ | - | ||||
|
Preferred stock dividends and accretions
|
$ | 1,623,429 | $ | - | ||||
The accompanying notes are integral part of these consolidated financial statements.
49
LENCO MOBILE INC.
NOTES TO CONSOLIDATED FINANCIAL STATEMENTS
FOR YEARS ENDED DECEMBER 31, 2010 AND 2009
NOTE 1 – ORGANIZATION AND SIGNIFICANT ACCOUNTING POLICIES
Organization and Nature of Business
We develop, own and operate mobile phone, internet and internet broadcasting advertising platforms that are used by mobile telephone network operators (“Wireless Carriers”) and manufacturers, retailers and commercial enterprises (“Brand Owners”) to attract, retain and monetize relationships with consumers. During 2010, we have broadened our market reach to include mobile and internet monetization of advertising for terrestrial radio and “pure-play” internet broadcasters.
We were incorporated in 1999 in Delaware under the name of Shochet Holdings Corporation and we have been engaged in our current line of business, mobile and internet marketing, since early 2008. Prior to 2008, Shochet Holdings Corporation completed an initial public offering, underwent several changes of control and were engaged in several different businesses, which included discount brokerage, financial services, mortgage banking and apparel, ultimately we were operating as a shell company seeking a combination with another operating company. The shell company and its predecessors had generated losses of approximately $15.8 million which are reflected in our retained losses.
Since March 1, 2009, we have managed our business in two operating segments; the mobile phone platform segment and the internet platform segment. A segment is determined primarily by the method in which it delivers its products and services. For additional information relating to our operating segments see Note 16 “Segment Information” to our consolidated financial statements.
Our primary products and solutions have been adopted by and are in use by Brand Owners in the United States and South Africa. Over the past couple of years, we have worked to expand our operations into new geographic territories and developed a number of highly competitive and innovative new products and solutions which we believe will enable us to expand our operations in the near future. In particular we have invested significant time and resources in building relationships with Wireless Carriers and Brand Owners in Asia, Australia, New Zealand and the United Kingdom. We believe that our mobile greeting cards, our mobile financial statement solution, our bulk MMS messaging server and our ability to integrate our AdMaximizer and Jetcast platforms into our mobile platform will provide compelling opportunities for us.
Basis of Presentation and Principals of Consolidation
The accompanying consolidated financial statements include the accounts of Lenco Mobile Inc. and its 100% wholly-owned subsidiaries Lenco Multimedia Inc. (formerly AdMax Media Inc.), Capital Supreme (Pty) Ltd, Lenco International Ltd, Lenco Mobile USA Inc., Lenco Media Inc. (formerly Jetcast, Inc.) and Lenco Technology Group Ltd. The Company has a 75% interest in a Mexican subsidiary, Soluciones de Buro Moviles, S.A. and an arrangement to initiate operations in South Korea with a 50% interest. In addition, we are currently funding all expenses for our Colombia operation and expect that it will officially be recognized as a subsidiary in 2011 under the name Lenco Mobile Colombia SAS. All significant intercompany balances and transactions have been eliminated in consolidation. The accompanying financial statements have been prepared in conformity with accounting principles generally accepted in the United States of America (U.S. GAAP).
Foreign Currency Translation
Our financial statements are presented in United States Dollars (“USD” or “$”). All subsidiary operations that utilize a functional currency other than USD are translated from local currencies used into USD in accordance with Financial Accounting Standards Board (“FASB”) Accounting Standards Codification (“ASC”) topic 830-30, “Foreign Currency Matters – Translation of Financial Statements”. Accordingly, all assets and liabilities are translated at the exchange rates prevailing at the balance sheet dates and all income and expenditure items are translated at the average rates for each of the periods presented. To the extent that transactions occur regularly throughout the year, they are translated at the average rate of exchange for the year since this is deemed to provide a good approximation of the actual exchange rates at which those transactions occurred. The symbol “R” when used before all the figures in these consolidated financial statements and related footnotes signifies a denomination of South African Rands.
Comprehensive Income (Loss)
We follow ASC 220, “Comprehensive Income.” This statement establishes standards for reporting comprehensive income and its components in financial statements. Comprehensive income, as defined, includes all changes in equity (net assets) during a period from transactions and other events and circumstances from non-owner sources. Examples of items to be included in comprehensive income, which are excluded from net income, include foreign currency translation adjustments and unrealized gains and losses on available-for-sale securities.
50
Noncontrolling Interest
The Company follows ASC topic 810, “Consolidation,” which establishes standards governing the accounting for and reporting of noncontrolling interests (NCIs) in partially-owned consolidated subsidiaries and the loss of control of subsidiaries. Certain provisions of this standard indicate, among other things, that NCIs be treated as a separate component of equity, not as a liability, that increases and decreases in the parent’s ownership interest that leave control intact be treated as equity transactions rather than as step acquisitions or dilution gains or losses, and that losses of a partially owned consolidated subsidiary be allocated to the NCI even when such allocation might result in a deficit balance. This standard also required changes to certain presentation and disclosure requirements.
The net income (loss) attributed to the NCI was separately designated in the accompanying consolidated statements of operations and comprehensive loss. Losses attributable to the NCI in a subsidiary may exceed the NCI’s interests in the subsidiary’s equity. The excess attributable to the NCI is attributed to those interests. The NCI shall continue to be attributed its share of losses even if that attribution results in a deficit NCI balance.
Cash and Cash Equivalents
We consider all highly liquid instruments purchased with a maturity of three months or less as cash equivalents.
Investments
Investments as of December 31, 2010 consisted of corporate securities received in exchange for services rendered and held as available-for-sale. Investments classified as available-for-sale are stated at fair value with unrealized gains and losses, net of taxes, reported in accumulated other comprehensive loss in the accompanying consolidated statements of operations and comprehensive loss. We classify our available-for-sale investments as current and non-current based on their actual remaining time to maturity. We do not recognize changes in the fair value of our available-for-sale investments in income unless a decline in value is considered other-than-temporary in accordance with the authoritative guidance.
Our investment policy is designed to limit exposure to any one issuer depending on credit quality. We use information provided by third parties to adjust the carrying value of certain of our investments to fair value at the end of each period. Fair values are based on valuation models that use market quotes and, for certain investments, assumptions as to the creditworthiness of the entities issuing those underlying instruments.
Accounts Receivable
We extend credit based on an evaluation of a customer’s financial condition and payment history. Significant management judgment is required to determine the allowance for sales returns and doubtful accounts. Management determines the adequacy of the allowance based on historical write-off percentages and information collected from individual customers. Accounts receivable are charged off against the allowance when collectability is determined to be permanently impaired. At December 31, 2010 and December 31, 2009, the allowance for doubtful accounts was approximately $95,000 and $38,000, respectively.
Property and Equipment
Property and equipment is stated at cost less accumulated depreciation. Repairs and maintenance are charged to operations as incurred. Property and equipment is depreciated on a straight-line basis over the estimated useful lives of the related assets, as follows:
|
Furniture and fixtures
|
5-6 years
|
|
IT equipment
|
3 years
|
|
Computer software
|
2-5 years
|
|
Leasehold improvements
|
Shorter of useful life or life of the lease
|
51
Impairment of Long-Lived Assets
We apply the provisions of ASC Topic 360, “Property, Plant, and Equipment,” which addresses financial accounting and reporting for the impairment or disposal of long-lived assets. We evaluate the recoverability of its long-lived assets if circumstances indicate impairment may have occurred. This analysis is performed by comparing the respective carrying values of the assets to the current and expected future cash flows, on an undiscounted basis, to be generated from such assets. ASC 360 requires impairment losses to be recorded on long-lived assets used in operations when indicators of impairment are present and the undiscounted cash flows estimated to be generated by those assets are less than the assets’ carrying amounts. In that event, a loss is recognized based on the amount by which the carrying amount exceeds the fair value of the long-lived assets. Loss on long-lived assets to be disposed of is determined in a similar manner, except that fair values are reduced for the cost of disposal.
Based on our review of long-lived assets at December 31, 2010, we determined approximately $630,000 of intangibles were impaired and accordingly wrote off these amounts. In 2009, there was no impairment on our long-lived assets.
Research and Development
At this time, we have relatively little in research and development expense and we expect this amount to increase as we continue to develop and acquire unique technologies. Research and development expense for the years ended December 31, 2010 and 2009 were approximately $533,000 and $262,000, respectively.
Software
Purchased software and the direct costs associated with the customization and installation thereof are capitalized. Expenditure on internally-developed software is capitalized if it meets the criteria for capitalizing development expenditure. Other software development expenditures are charged to operations when incurred.
Patents and Trademarks
Expenditures on purchased patents and trademarks are capitalized. Expenditures incurred to extend the term of the patents or trademarks is capitalized. All other expenditures are charged to operations when incurred.
Use of Estimates
The preparation of financial statements in conformity with accounting principles generally accepted in the United States of America requires management to make estimates and assumptions that affect the reported amounts of assets and liabilities and disclosures of contingent assets and liabilities at the date of the financial statements and the reported amounts of revenue and expenses during the reporting periods. Our most significant estimates include intangible assets and goodwill. Actual results could differ from these estimates.
Revenue Recognition
Revenue is recognized net of indirect taxes, rebates, chargebacks and trade discounts and consists primarily of the sale transactional marketing services and advisory services rendered. We generate revenue primarily from per transaction fees, retainers, advisory and service fees and to a lesser extent license fees. Revenue recognition varies depending on the type of transaction, and may involve recognizing revenues over the term of a contract, a period in which services are performed, at the time a transaction is performed or for licensing transactions, in accordance with SEC Staff Accounting Bulletin No. 101, “Revenue Recognition in Financial Statements” as delineated below:
Revenue is recognized when the following criteria are met:
|
·
|
When persuasive evidence of an arrangement exists. Contracts and customer purchase orders are generally used to determine the existence of an arrangement.
|
|
·
|
Delivery has occurred or services have been rendered and the significant risks and rewards of ownership have been transferred to the purchaser. Completion of services or delivery or messages to mobile phone subscribers on behalf of our customers are the general components of delivery in our business.
|
|
·
|
The selling price is fixed or determinable. We assess whether the selling price is fixed or determinable based on the payment terms associated with the transaction and whether the sales price is subject to refund or adjustment.
|
|
·
|
Collectability is reasonably assured. We assess collectability based primarily on the creditworthiness of the customer as determined by credit checks and analysis, as well as the customers’ payment history.
|
52
We generate revenues through the sale or license of advertising products and the performance of services. Our mobile and internet and internet broadcasting businesses operate under a number of different contractual relationships and generate revenue from a number of different sources, including the following:
|
·
|
Retainers: Some of our clients, including certain Wireless Carriers, pay us fixed monthly fees for the right to use defined products and services. For example, we periodically enter into contracts to host and maintain mobile access gateways; back-end connectivity; MMS and SMS messaging connectivity; monitoring, quality assurance and support in exchange for a monthly retainer. Retainers are generally negotiated on a term of six months or one year, depending on the nature of the product or service we provide. Revenues from retainer arrangements are generally recognized ratably over the term of the contract in accordance with ASC topic 605-20-25-3. These services are accounted for as a single unit of accounting as they do not meet the criteria for segregation into multiple deliverable units for purposes of revenue recognition as per ASC topic 605-25-25-5.
|
|
·
|
Program contracts: We enter into certain program contracts with clients, including Brand Owners, under which we provide a defined service for a fixed fee per transaction. For example, our mobile statement products are used by some of our clients to deliver monthly statements to the mobile phones to their respective subscribers or consumers. We earn a fixed fee for each statement sent to a mobile phone. Revenues from these contracts are recognized upon provision of such services.
|
|
·
|
Transaction fees: In certain instances we earn revenues on a transaction basis. For example, under the terms of our agreements with Wireless Carriers and Brand Owners, we earn transaction fees when a wireless subscriber downloads content into a mobile phone via one of our servers. A significant portion of our internet and internet broadcasting businesses are transaction-based. Often Brand Owners pay us on the basis of the number of qualified consumer leads we generated in an online campaign, or the number of advertisements we served on our UniversalPlayer™. Transaction fees are recognized as revenue in the period in which the transaction giving rise to the fee occurs.
|
|
·
|
Licenses of mobile platforms: We earn royalties from the license of our FlightPlan, FlightDeck and SGW platforms to Wireless Carriers. These platforms are connected to the Wireless Carriers’ messaging centers and earn fees ratably over the time period that they provide service to the Wireless Carriers or on a per message charge depending on the individual agreement with the Wireless Carrier. With agreements that are based on a period of time in which the Wireless Carrier utilized the platforms, revenues from these licenses are generally recognized ratably over the term of the contract in which the platforms will be utilized as per ASC topic 605-20-25-3. For those Wireless Carriers that agree to a per message basis to pay for the utilization of our platforms, we recognize revenue in the period in which the transaction giving rise to the revenue on a per message basis occurs.
|
|
·
|
Advisory and service fees: We earn advisory and service fees when Brand Owners hire us to assist in the design and execution of either a mobile or an online advertising campaign. We provide services from the initial conceptualization through to the creation of the content, website and mobi site development, database design/development, and all other such services to successfully implement the mobile and internet marketing campaign, including final product dissemination to consumers and measurement of success rates. Fees for these services are recognized as revenue when the services have been performed. Each of these services are priced, billed and recorded as revenue separately and in the period in which the services are performed.
|
53
From time to time we may receive revenue in advance of the services performed, which are recorded as deferred revenues. At December 31, 2010 and December 31, 2009, deferred revenue was approximately $4,000 and $7,000, respectively which is included in “Accounts payable and accrued expenses” on the accompanying Consolidated Balance Sheets.
Stock Based Compensation
We record stock-based compensation in accordance with ASC Topic 718, “Compensation – Stock Compensation” which requires companies to measure compensation cost for stock-based employee compensation at fair value at the grant date and recognize the expense over the employee’s requisite service period. We expense the grant-date fair value of stock options and other equity-based compensation issued to employees and non-employees. As of December 31, 2010 and 2009, there were no options outstanding.
Fair Value of Financial Instruments
ASC Topic 820, “Fair Value Measurements and Disclosures,” requires disclosure of the fair value of financial instruments held by the Company. ASC 820 defines a three-tier value hierarchy that prioritizes the inputs used in the valuation methodologies in measuring fair-value.
|
·
|
Level 1 – Include observable inputs that reflect quoted prices (unadjusted) for identical assets or liabilities in active markets.
|
|
·
|
Level 2 – Include other inputs that are either directly or indirectly observable in the market place.
|
|
·
|
Level 3 – Include unobservable inputs which are supported by little or no market activity.
|
As of December 31, 2010, our only financial assets include cash and cash equivalents and investments, which are presented at fair value based on Level 1 inputs.
The carrying values of our other financial instruments, including accounts receivable, accounts payable, accrued liabilities, short-term debt approximate their fair values due to their short maturities. The carrying values of our long-term liabilities approximate their fair values based on current rates of interest for instruments with similar characteristics.
Business Combinations
We apply ASC 805 to account for acquisitions of businesses. The cost of an acquisition is measured as the aggregate of the fair values at the date of the change of control, liabilities incurred, equity instruments issued. Identifiable intangible assets, liabilities and contingent liabilities acquired or assumed are measured separately at their fair value as of the acquisition date. The excess of the cost of the acquisition over the fair value of the identifiable net assets acquired is recorded as goodwill.
The determination of fair values for the identifiable assets acquired and liabilities assumed is based on various assumptions and valuation methodologies requiring considerable management judgment. The most significant variables in these valuations are discount rates, terminal values, the number of years on which to base the cash flow projections, as well as the assumptions and estimates used to determine the cash inflows and outflows.
See note 8 for disclosure related to these combinations.
Concentration of Credit Risk
Financial instruments, which potentially subject us to concentrations of credit risk, consist of cash and cash equivalents and accounts receivable. We extend credit based on an evaluation of the customer’s financial condition, usually on an unsecured basis. Exposure to losses on receivables is principally dependent on each customer’s financial condition. We monitor our exposure for credit losses and maintain allowances for anticipated losses, as required.
Advertising Costs
Advertising costs are expensed as incurred and totaled approximately $287,000 and $55,000 for the years ended December 31, 2010 and 2009, respectively. The increase in advertising expense was primarily related to 2010 being the first full year to actively increase our revenue stream and advertise our products and services
54
Income Taxes
We account for income taxes in accordance with ASC Topic 740, “Income Taxes.” Under ASC 740, deferred income taxes are recognized for the tax consequences in future years of differences between the tax basis of assets and liabilities and their financial statement reported amounts at each period end, based on enacted tax laws and statutory tax rates applicable to the periods in which the differences are expected to affect taxable income. Valuation allowances are established, when necessary, to reduce deferred tax assets to the amount expected to be realized. The provision for income taxes represents the tax expense for the period, if any, and the change during the period in deferred tax assets and liabilities.
Under ASC 740, a tax position is recognized as a benefit only if it is “more likely than not” that the tax position would be sustained in a tax examination, with a tax examination being presumed to occur. The evaluation of a tax position is a two-step process. The first step is to determine whether it is more-likely-than-not that a tax position will be sustained upon examination, including the resolution of any related appeals or litigation based on the technical merits of that position. The second step is to measure a tax position that meets the more-likely-than-not threshold to determine the amount of benefit to be recognized in the financial statements. A tax position is measured at the largest amount of benefit that is greater than 50 percent likely of being realized upon ultimate settlement. Tax positions that previously failed to meet the more-likely-than-not recognition threshold should be recognized in the first subsequent period in which the threshold is met. Previously recognized tax positions that no longer meet the more-likely-than-not criteria should be de-recognized in the first subsequent financial reporting period in which the threshold is no longer met. The Company does not believe that it has any uncertain tax positions. As of December 31, 2010, the open tax years of the Company were 2007 to 2010.
Earnings (loss) per Share
We calculate earnings per share in accordance with the ASC Topic 260-10, “Earnings Per Share.” Basic earnings (loss) per share is computed by dividing earnings (loss) available to common stockholders by the weighted-average number of common stock outstanding. Diluted earnings (loss) per share is computed similar to basic earnings (loss) per share except that the denominator is increased to include additional common stock available upon exercise of stock options and warrants using the treasury stock method, except for periods of operating loss for which no common share equivalents are included because their effect would be anti-dilutive. Dilution is computed by applying the treasury stock method. Under this method, warrants and options are assumed to be exercised at the beginning of the period (or at the time of issuance, if later), and as if funds obtained thereby were used to purchase common stock at the average market price during the period.
As of December 31, 2010 and 2009, there were 1,394,166 and 1,494,166 warrants outstanding, respectively; these warrants were excluded from the computation because the effect of including them would have been anti-dilutive. Potentially dilutive shares related to convertible debentures, convertible preferred stock and outstanding options and warrants were excluded from the shares used to calculate diluted earnings per share as their inclusion would be anti-dilutive due to the net losses incurred.
Recent Accounting Pronouncements
In January 2010, FASB issued ASU No. 2010-06 – Improving Disclosures about Fair Value Measurements. This update provides amendments to Subtopic 820-10 that requires new disclosure as follows: 1) Transfers in and out of Levels 1 and 2. A reporting entity should disclose separately the amounts of significant transfers in and out of Level 1 and Level 2 fair value measurements and describe the reasons for the transfers. 2) Activity in Level 3 fair value measurements. In the reconciliation for fair value measurements using significant unobservable inputs (Level 3), a reporting entity should present separately information about purchases, sales, issuances, and settlements (that is, on a gross basis rather than as one net number). This update provides amendments to Subtopic 820-10 that clarifies existing disclosures as follows: 1) Level of disaggregation. A reporting entity should provide fair value measurement disclosures for each class of assets and liabilities. A class is often a subset of assets or liabilities within a line item in the statement of financial position. A reporting entity needs to use judgment in determining the appropriate classes of assets and liabilities. 2) Disclosures about inputs and valuation techniques. A reporting entity should provide disclosures about the valuation techniques and inputs used to measure fair value for both recurring and nonrecurring fair value measurements. Those disclosures are required for fair value measurements that fall in either Level 2 or Level 3. The new disclosures and clarifications of existing disclosures are effective for interim and annual reporting periods beginning after December 15, 2009, except for the disclosures about purchases, sales, issuances, and settlements in the roll forward of activity in Level 3 fair value measurements. Thos disclosures are effective for fiscal years beginning after December 15, 2010, and for interim periods within those fiscal years. The Company is currently evaluating the impact of this ASU; however, we do not expect the adoption of this ASU to have a material impact on our consolidated financial statements.
ASU 2010-28, Intangibles – Goodwill and Other (Topic 350) - When to Perform Step 2 of the Goodwill Impairment Test for Reporting Units with Zero or Negative Carrying Amounts - a consensus of the FASB Emerging Issues Task Force This ASU modifies Step 1 of the goodwill impairment test for reporting units with zero or negative carrying amounts. For those reporting units, an entity is required to perform Step 2 of the goodwill impairment test if it is more likely than not that a goodwill impairment exists. In determining whether it is more likely than not that goodwill impairment exists, an entity should consider whether there are any adverse qualitative factors indicating that an impairment may exist. For public entities, the amendments are effective for fiscal years, and interim periods within those years, beginning after December 15, 2010. The Company is currently evaluating the impact of this ASU; however, we do not expect the adoption of this ASU to have a material impact on our consolidated financial statements.
55
ASU 2010-29, Business Combinations (Topic 805) - Disclosure of Supplementary Pro Forma Information for Business Combinations - a consensus of the FASB Emerging Issues Task Force This ASU specifies that if a public entity presents comparative financial statements, the entity should disclose revenue and earnings of the combined entity as though the business combination(s) that occurred during the current year had occurred as of the beginning of the comparable prior annual reporting period only. The ASU also expands the supplemental pro forma disclosures under ASC Topic 805. The amendments are effective prospectively for business combinations for which the acquisition date is on or after December 15, 2010. The Company is currently evaluating the impact of this ASU; however, we do not expect the adoption of this ASU to have a material impact on our consolidated financial statements.
NOTE 2 – DISCONTINUED OPERATIONS
On December 30, 2010, AdMax Media Inc. sold the assets used in its educational lead generation service business (“EDU Vertical”) and their name, AdMax Media Inc., to a newly-formed, unrelated third-party company organized under the name AdMax Media, Inc. (“Newco”). The asset sale was pursuant to the asset purchase agreement with Silverback Network, Inc. (“Silverback”) dated December 3, 2010 as amended on December 28, 2010. The purchase price for the assets was $2.8 million. At the closing, Newco paid $2.5 million to AdMax and $125,000 to an escrow account to secure certain of AdMax’s indemnification obligations under the asset purchase agreement. The $125,000 in the escrow account and the remaining $150,000 will be paid by June 28, 2011 and these amounts have been recorded as a purchase price receivable at December 31, 2010. In addition, the amount collected by Newco over the minimum accounts receivables amount of $700,000, is expected to be approximately $383,000 and has been recorded in accounts receivable at December 31, 2010. Operating results for AdMax Media’s EDU Vertical business have been presented in the accompanying consolidated statements of operations as discontinued operations for the years ended December 31, 2010 and 2009. In addition, the current assets related to EDU Vertical have been presented in the accompanying consolidated balance sheets as “Net assets related to discontinued operations” for the year ended December 31, 2009.
During the second half of calendar 2010, revenues and profits from the EDU Vertical steadily declined likely as a result of decreasing online schools’ advertising budgets. We believe this was likely tied to increasing scrutiny from the U.S. government on online educational funding with taxpayer dollars. Executive management determined it was in the best interest of the Company to sell the assets related to EDU Vertical before further degradation of their potential realizable sales value occurred.
Accordingly, operating results for EDU Vertical have been presented in the accompanying consolidated statement of operations for fiscal 2010 and 2009 as discontinued operations and are summarized below:
|
Year Ended December 31,
|
||||||||
|
2010
|
2009
|
|||||||
|
Revenue
|
$ | 15,949,845 | $ | 12,226,488 | ||||
|
Revenue related to discontinued operations
|
(7,592,514 | ) | (2,889,697 | ) | ||||
|
Net revenue
|
8,357,331 | 9,336,791 | ||||||
|
Cost of sales
|
8,855,654 | 4,964,194 | ||||||
|
Cost of sales related to discontinued operations
|
(6,241,291 | ) | (1,831,819 | ) | ||||
|
Net cost of sales
|
$ | 2,614,363 | $ | 3,132,375 | ||||
|
Gross profit
|
$ | 7,094,191 | $ | 7,262,294 | ||||
|
Gross profit after discontinued operations
|
$ | 5,742,968 | $ | 6,204,416 | ||||
56
NOTE 3 – INVESTMENTS
The following tables summarize our available-for-sale investments:
|
|
Cost
|
Gross
Unrealized
Gains
|
Gross
Unrealized
Loss
|
Fair
Value
|
|
|
Publicly traded equity security (Level 1 inputs)
|
$ 575,000
|
$ -
|
$ (143,750)
|
$ 431,250
|
We evaluated our publicly traded equity securities as of December 31, 2010 and determined that there is no current indication of an other-than-temporary impairment. If the unrealized loss in 2010 continues through the next fiscal year, we will evaluate the security for an other-than-temporary impairment. This determination will be based on several factors, which include the length of time and extent to which fair value has been less than the cost basis and the financial condition and near-term prospects of the issuer, and our intent and ability to hold the publicly traded equity securities for a period of time sufficient to allow for any anticipated recovery in market value.
NOTE 4 – ACCOUNTS RECEIVABLE, NET
Accounts receivable, net consisted of the following:
|
December 31,
|
December 31,
|
|||||||
|
2010
|
2009
|
|||||||
|
Accounts receivable – trade
|
$ | 1,342,403 | $ | 1,971,239 | ||||
|
Allowance for doubtful accounts
|
(94,720 | ) | (38,244 | ) | ||||
|
Accounts receivable, net
|
$ | 1,247,683 | $ | 1,932,995 | ||||
Approximately 58% and 33% of gross accounts receivable at December 31, 2010 and December 31, 2009, respectively, were from our three largest customers. Of these customers, Vodacom (Pty) Ltd represents an account receivable balance of 20% of gross accounts receivable at December 31, 2010.
NOTE 5 – NOTES RECEIVABLE
In April, 2009, we sold certain equipment and computers at the carrying costs to a third party entity for a current note receivable of $65,000 bearing interest at 10% per annum. We were to be paid in monthly, equal installments over a period of two years. The third party entity has not made any payments to date, and as such we have exercised our right to accelerate all amounts due under the note. In 2010, we wrote down the note to $40,000. The note is secured with a personal guarantee of the holder and we expect to collect the $40,000.
NOTE 6 – OTHER CURRENT ASSETS
Other assets consisted of the following:
|
December 31,
|
December 31,
|
|||||||
|
2010
|
2009
|
|||||||
|
Prepaid expenses
|
$ | 126,029 | $ | 81,826 | ||||
|
Due from Superfly Advertising Inc. for expenses paid
|
- | 272,281 | ||||||
|
Debt issuance costs, net
|
18,876 | 52,885 | ||||||
|
Original issue discount, net
|
6,389 | 80,375 | ||||||
|
Other
|
145,336 | 2,072 | ||||||
|
Other current assets
|
$ | 296,630 | $ | 489,439 | ||||
57
NOTE 7 – PROPERTY AND EQUIPMENT
At December 31, 2010 and 2009 property and equipment, net consisted of the following:
|
|
December 31,
|
December 31,
|
||||||
|
2010
|
2009
|
|||||||
|
Furniture and fixtures
|
$ | 650,605 | $ | 623,648 | ||||
|
Leasehold improvements
|
210,609 | 180,134 | ||||||
|
Building - held for sale
|
115,394 | 103,312 | ||||||
|
Computer and network equipment
|
926,165 | 618,887 | ||||||
|
Computer software
|
241,604 | 206,437 | ||||||
|
Total cost of property and equipment
|
2,144,377 | 1,732,418 | ||||||
|
Accumulated depreciation
|
(840,412 | ) | (337,303 | ) | ||||
|
Property and equipment, net
|
$ | 1,303,965 | $ | 1,395,115 | ||||
At December 31, 2010 and December 31, 2009, we classified a parcel of residential property with a cost of R764,708 (as of December 31, 2010 and December 31, 2009, this is approximately $115,000 and $103,000, respectively) as held for sale presented in “Property and Equipment, net” in the accompanying Consolidated Balance Sheets. No depreciation or amortization is provided on property and equipment from the date they are classified as held for sale.
NOTE 8 – BUSINESS ACQUISITIONS
Acquisition of Assets of Superfly Advertising, Inc.
On February 28, 2009, we entered into an Asset Purchase Agreement with Superfly Advertising, Inc., a Delaware corporation (see Note 1) whereby our subsidiary AdMax Media Inc. acquired certain assets related to our internet segment. Interim financial statements from the date of acquisition, March 1, 2009, forward include the operations of AdMax Media Inc. We accounted for the acquisition in accordance with ASC topic 805-10 “Business Combinations” and incurred approximately $70,000 in legal and accounting-related costs related to the acquisition that were expensed as incurred in 2009. The aggregate consideration paid for the assets and assumed liabilities was valued at approximately $8.7 million.
The goodwill balance of approximately $2.3 million represents the excess of the purchase price of businesses over the fair value of the identifiable net assets acquired and is representative of the expected synergies from combining with the other operations under Lenco Mobile Inc. In addition, goodwill is also inclusive of other intangible assets that do not qualify for separate recognition. There is no contingent consideration arrangements existing affecting the acquired assets, liabilities or goodwill balances. The goodwill is deductible for tax purposes.
The value of the major classes of assets and liabilities assumed in the February 28, 2009 acquisition were as follows:
|
Major classes of assets and liabilities
|
Amounts
|
|||
|
Accounts receivable, net
|
$ | 578,717 | ||
|
Other current assets
|
372,135 | |||
|
Fixed assets
|
1,139,073 | |||
|
Other non-current assets
|
18,404 | |||
|
Secondary domain names
|
530,285 | |||
|
Onlinesupplier.com
|
425,000 | |||
|
AdMax marketing contact database
|
2,984,526 | |||
|
AdMaximizer/Realtime3
|
3,870,068 | |||
|
Goodwill
|
2,247,288 | |||
|
Accounts payable and accrued expenses
|
(770,790 | ) | ||
|
Notes payable
|
(2,707,500 | ) | ||
|
Total Purchase Price
|
$ | 8,687,206 | ||
58
Acquisition of Assets of Simply Ideas, LLC
On October 16, 2009 we entered into an Asset Purchase Agreement pursuant to which our AdMax Media Inc. subsidiary acquired certain assets of Simply Ideas, LLC, a Florida limited liability company. Simply Ideas, LLC was engaged in the business of online lead generation and marketing services, primarily serving the secondary education industry. In connection with the acquisition, we paid $25,000 in cash with $25,000 to be paid in 2010 and issued an aggregate of 725,309 shares of our common stock valued at approximately $1.4 million to Simply Ideas, LLC, in exchange for the transfer of certain specified assets including websites, URLs, contracts and software platforms related to online advertising, primarily in the education industry. We incurred approximately $20,000 in legal and accounting-related costs related to the acquisition that were expensed as incurred in 2009. The aggregate consideration paid for the assets was valued at approximately $1.4 million and will be allocated among the assets acquired and liabilities assumed as follows (amortization period indicated in parenthesis):
|
Major classes of assets and liabilities
|
Amounts
|
|||
|
Accounts receivable
|
$ | - | ||
|
Fixed Assets
|
3,000 | |||
|
Simply Ideas Lead Gen software
|
103,110 | |||
|
MicroGravity Media software
|
281,011 | |||
|
Premium websites
|
112,299 | |||
|
Live websites
|
337,847 | |||
|
Database
|
6,152 | |||
|
Secondary domain names
|
347,383 | |||
|
Goodwill
|
246,154 | |||
|
Accounts payable and accrued expenses
|
(40,000 | ) | ||
|
Purchase Price
|
$ | 1,396,956 | ||
Acquisition of G2AA, LLC
On August 13, 2010, we entered into an asset purchase agreement with G2AA, LLC pursuant to which we acquired assets related to an online and mobile automotive marketing business. We accounted for the acquisition in accordance with ASC topic 805-10 “Business Combinations” and incurred approximately $20,000 in legal and accounting-related costs related to the acquisition that were expensed as incurred in 2010. We issued an aggregate of 275,000 shares of common stock, valued at approximately $1.0 million as consideration for the assets.
The value of the major classes of assets and liabilities assumed in the acquisition were as follows as of the acquisition date and end of the measurement date on September 30, 2010 prior to recording any amortization:
|
Major classes of assets and liabilities
|
Amounts
|
|||
|
Cash
|
$ | 285,000 | ||
|
Software
|
15,000 | |||
|
Database
|
15,000 | |||
|
Websites
|
96,000 | |||
|
Secondary Domain Names
|
240,000 | |||
|
Goodwill
|
387,147 | |||
|
Purchase Price
|
$ | 1,038,147 | ||
The goodwill balance of approximately $387,000 represents the excess of the purchase price of businesses over the fair value of the identifiable net assets acquired and is representative of the expected synergies from combining with the other operations under Lenco Mobile Inc. In addition, goodwill is also inclusive of other intangible assets that do not qualify for separate recognition. There is no contingent consideration arrangements existing affecting the acquired assets, liabilities or goodwill balances. The goodwill is deductible for tax purposes.
59
Acquisition of Jetcast, Inc.
On September 28, 2010, we completed the acquisition of Jetcast, Inc. (“Jetcast”). Jetcast provides products and services designed to make internet broadcasting profitable for broadcasters and advertisers. The acquisition was structured as a triangular merger and was completed pursuant to the terms of the agreement and plan of merger dated September 17, 2010 among us, Jetco Sub, Inc., our wholly-owned subsidiary, Jetcast and Jetcast’s stockholders. Interim financial statements from the date of acquisition, September 28, 2010 and forward include the operations of Jetcast, Inc. We accounted for the acquisition as per ASC topic 805-10 “Business Combinations” and incurred approximately $50,000 in legal and accounting-related costs related to the acquisition that were expensed as incurred in 2010. We paid approximately $500,000 in cash and issued 4,001,235 unregistered shares of our common stock to the former Jetcast stockholders which are valued at approximately $20.3 million. In addition, we will pay up to approximately $4.3 million in cash and up to $20.7 million in the form of unregistered shares of our common stock issuable to the former Jetcast stockholders in connection with the achievement of future revenue targets.
The value of the major classes of assets and liabilities assumed in the September 28, 2010 acquisition were as follows as of the acquisition date and end of the measurement date on September 30, 2010 prior to recording any amortization:
|
Major classes of assets and liabilities
|
Amounts
|
|||
|
Accounts Receivable
|
$ | 78,067 | ||
|
Fixed Assets
|
2,070 | |||
|
Intangible assets - Relationships with Stations
|
1,292,392 | |||
|
Intangible assets - Universal Player
|
8,809,557 | |||
|
Intangible assets - Legacy Universal Player
|
216,250 | |||
|
Intangible assets - RadioLoyalty
|
978,432 | |||
|
Intangible assets - Employment Agreements
|
1,160,403 | |||
|
Intangible assets - URL’s
|
286,991 | |||
|
Goodwill
|
10,134,024 | |||
|
Accounts Payable and Accrued Expenses
|
(262,045 | ) | ||
|
Net deferred tax liability
|
(1,900,565 | ) | ||
|
Purchase Price
|
$ | 20,795,576 | ||
The goodwill balance of approximately $10.1 million represents the excess of the purchase price of businesses over the fair value of the identifiable net assets acquired and is representative of the expected synergies from combining with the other operations under Lenco Mobile Inc. In addition, goodwill is also inclusive of other intangible assets that do not qualify for separate recognition. The goodwill is not deductible for tax purposes.
Acquistion of Angelos Gateway Limited
In December 2010, Lenco Technology Group Ltd., (“LTG”) our wholly-owned subsidiary, entered into an asset purchase agreement with Angelos Gateway Limited (“Angelos”), pursuant to which we acquired certain software and IP relating to the deployment of the Signaling Gateway (“SGW”) system. LTG must pay $400,000 cash consideration over the ninety day period from the acquisition date, plus interest at six percent over that period. We also issued 521,277 shares of restricted common stock to vest over a two year period which will be recorded as compensation expense related to the continued employment of key mobile programmers instrumental in the ongoing development of the SGW assets. The total consideration for the assets purchased is valued at approximately $404,000.
Pro Forma Supplemental Information
The supplemental information on an unaudited pro forma financial basis presents the combined results of Lenco Mobile Inc. and its 2010 acquisitions as if the acquisitions had occurred on January 1 for the year ended December 31, 2009:
|
Year Ended
|
||||||||
| December 31, 2010 | December 31, 2009 | |||||||
|
(unaudited)
|
(unaudited)
|
|||||||
|
Revenue
|
8,733,977 | $ | 10,841,185 | |||||
|
Net loss attributable to common stockholders
|
(10,322,181 | ) | $ | (5,364,218 | ) | |||
|
Net loss attributable to common stockholders per share
|
(0.14 | ) | $ | (0.08 | ) | |||
60
NOTE 9 – GOODWILL
Goodwill represents the excess of the purchase price of businesses over the fair value of the identifiable net assets acquired. In accordance with ASC 350-20 “Intangibles - Goodwill and Other” goodwill and other indefinite life intangible assets are no longer amortized, but instead tested for impairment at least annually. The impairment test for goodwill uses a two-step approach, which is performed at the reporting unit level. Step one compares the fair value of the reporting unit (calculated using a discounted cash flow method) to its carrying value. If the carrying value exceeds the fair value, there is a potential impairment and step two must be performed. Step two compares the carrying value of the reporting unit’s goodwill to its implied fair value (i.e., fair value of the reporting unit less the fair value of the unit’s assets and liabilities, including identifiable intangible assets). If the carrying value of goodwill exceeds its implied fair value, the excess is required to be recorded as an impairment charge.
We perform the goodwill impairment test annually in the fourth quarter or when indicators of impairment are present. The net carrying value of goodwill was approximately $14.0 million and $3.6 million at December 31, 2010 and December 31, 2009, respectively and was comprised of the following:
|
Change due to
|
||||||||||||||||||||
|
|
foreign currency
|
|
||||||||||||||||||
|
December 31,
2009
|
Acquisitions
|
Impairments
|
translation
changes
|
December 31,
2010
|
||||||||||||||||
|
Cell Card IP
|
$ | 49,551 | $ | - | $ | - | $ | - | $ | 49,551 | ||||||||||
|
Digital Vouchers Technology
|
207,228 | - | - | - | 207,228 | |||||||||||||||
|
Capital Supreme(Pty) Ltd.
|
812,101 | - | - | 94,975 | 907,076 | |||||||||||||||
|
Superfly (Consumer Loyalty and Legacy Media, LLC)
|
2,247,288 | - | - | - | 2,247,288 | |||||||||||||||
|
Simply Ideas, LLC
|
246,154 | - | (246,154 | ) | - | - | ||||||||||||||
|
GoToAutoAccessories.com
|
- | 387,147 | - | - | 387,147 | |||||||||||||||
|
Jetcast
|
- | 10,134,024 | - | - | 10,134,024 | |||||||||||||||
|
Lenco Tech - SGW
|
- | 50,900 | - | - | 50,900 | |||||||||||||||
|
Total Goodwill
|
$ | 3,562,322 | $ | 10,572,071 | $ | (246,154 | ) | $ | 94,975 | $ | 13,983,214 | |||||||||
NOTE 10 – INTANGIBLES – OTHER, NET
In accordance with ASC 350-20 “Intangibles - Goodwill and Other” intangible assets that have finite lives are amortized over the period during which the asset is expected to contribute directly or indirectly to future cash flows of the entity (useful lives). The amortization method should reflect the pattern in which the asset’s economic benefits are consumed by the entity. If the pattern cannot be determined, the straight-line method is used.
Intangible assets resulting from the acquisitions of entities accounted for using the purchase method of accounting are recorded at the estimated fair value of the assets acquired. Identifiable intangible assets are comprised of purchased customer relationships, trademarks and trade names, developed technologies and other intangible assets. The fair values of these identified intangible assets are based upon expected future cash flows or income, which take into consideration certain assumptions such as customer turnover, tradenames and patent lives. These determinations are primarily based upon the Company’s historical experience and expected benefit of the intangible asset. If it is determined that such assumptions are not accurate, then the resulting change will impact the fair value of the intangible asset. Identifiable intangible assets are amortized using the straight-line method over estimated useful lives ranging from one to 20 years.
The changes in carrying amount of intangible assets for the years ended December 31, 2010 and December 31, 2009 were as follows:
|
Balance as of
January 1, 2010 |
Additions
|
Amortization
|
Deductions
|
Foreign
Exchange |
Balance as of
December 31, 2010 |
|||||||||||||||||||
|
Intangible assets with indefinite lives
|
$ | 1,327,814 | $ | 622,991 | $ | - | $ | (450,146 | ) | $ | - | $ | 1,500,659 | |||||||||||
|
Intangible assets subject to amortization
|
8,972,953 | 13,172,951 | (3,124,450 | ) | (179,661 | ) | 80,214 | 18,922,008 | ||||||||||||||||
|
Total
|
$ | 10,300,767 | $ | 13,795,942 | $ | (3,124,450 | ) | $ | (629,807 | ) | $ | 80,214 | $ | 20,422,667 | ||||||||||
|
Balance as of
January 1, 2009 |
Additions
|
Amortization
|
Deductions
|
Foreign
Exchange |
Balance as of
December 31, 2009 |
|||||||||||||||||||
|
Intangible assets with indefinite lives
|
$ | - | $ | 1,327,814 | $ | - | $ | - | $ | - | $ | 1,327,814 | ||||||||||||
|
Intangible assets subject to amortization
|
3,075,534 | 7,704,120 | (1,950,962 | ) | - | 144,260 | 8,972,952 | |||||||||||||||||
|
Total
|
$ | 3,075,534 | $ | 9,031,934 | $ | (1,950,962 | ) | $ | - | $ | 144,260 | $ | 10,300,766 | |||||||||||
61
Amortization expense for the years ended December 31, 2010 and December 31, 2009 equaled approximately $3.1 million and $2.0 million, respectively.
Balances as of December 31, 2010 consisted of:
|
Amortization
|
Accumulated
|
Balance as of
|
||||||||||||
|
Period
|
Cost
|
Amortization
|
December 31, 2010
|
|||||||||||
|
Intangible assets with indefinite lives
|
none
|
$ | 1,500,659 | $ | - | $ | 1,500,659 | |||||||
|
Employment agreements
|
22 months
|
1,160,403 | (158,237 | ) | 1,002,166 | |||||||||
|
Non-compete agreements
|
5 years
|
68,768 | (6,725 | ) | 62,043 | |||||||||
|
Purchased technologies
|
3 - 10 years
|
20,065,631 | (4,429,896 | ) | 15,635,735 | |||||||||
|
Marketing databases
|
7 years
|
3,005,678 | (783,616 | ) | 2,222,062 | |||||||||
|
Total
|
$ | 25,801,139 | $ | (5,378,474 | ) | $ | 20,422,665 | |||||||
Balances as of December 31, 2009 consisted of:
|
Amortization
|
Accumulated
|
Balance as of
|
||||||||||||
|
Period
|
Cost
|
Amortization
|
December 31, 2009
|
|||||||||||
|
Intangible assets with indefinite lives
|
none
|
$ | 1,327,814 | $ | - | $ | 1,327,814 | |||||||
|
Employment agreements
|
22 months
|
- | - | - | ||||||||||
|
Non-compete agreements
|
5 years
|
20,391 | (2,589 | ) | 17,802 | |||||||||
|
Purchased technologies
|
3 - 10 years
|
8,215,907 | (1,895,852 | ) | 6,320,055 | |||||||||
|
Marketing databases
|
7 years
|
2,990,678 | (355,484 | ) | 2,635,194 | |||||||||
|
Total
|
$ | 12,554,790 | $ | (2,253,925 | ) | $ | 10,300,865 | |||||||
62
Estimated aggregate amortization expense for each of the next five fiscal years is:
|
Fiscal Year
|
||||
|
2011
|
$ | 5,764,565 | ||
|
2012
|
5,437,139 | |||
|
2013
|
3,561,549 | |||
|
2014
|
2,729,855 | |||
|
2015
|
715,765 | |||
|
Thereafter
|
713,137 | |||
|
Total amortization
|
$ | 18,922,008 | ||
NOTE 11- ACCOUNTS PAYABLE AND ACCRUED EXPENSES
Accounts payable and accrued expenses were comprised of the following:
|
December 31,
|
December 31,
|
|||||||
|
2010
|
2009
|
|||||||
|
Accounts payable
|
$ | 1,947,762 | $ | 965,474 | ||||
|
Accrued expenses
|
$ | 361,896 | 327,397 | |||||
|
Deferred revenue
|
$ | 4,408 | 7,063 | |||||
|
Accounts payable and accrued expenses
|
$ | 2,314,066 | $ | 1,299,934 | ||||
Approximately 39% of gross accounts payable at December 31, 2010, were from two accounts; Maren Group and Angelos Gateway Limited. These balances are not expected to be as significant in 2011, as the amounts due to Maren Group and Angelos Gateway Limited relate to acquisitions that occurred in 2010.
63
NOTE 12 – DEBT
Our debt is comprised of the following:
|
December 31,
|
December 31,
|
|||||||
|
2010
|
2009
|
|||||||
|
The Company issued seven convertible promissory notes, for an aggregate principal amount of $2,082,500 on February 28, 2009. The convertible promissory notes bear interest at a rate of 9.649% to 12% per annum and are unsecured. The principal and all accrued and unpaid interest for the remaining $497,500 notes was due and payable on January 16, 2011, as amended. The convertible promissory notes are convertible into shares of our common stock at any time at the option of the holder at a conversion price of $3.00 per share. During 2010, the holders of $1,585,000 of the $2,082,500 notes originally issued were repaid. As of January 16, 2011, the remaining $497,500 and accrued interest was paid in full.
|
$ | 497,500 | $ | 2,082,500 | ||||
|
On July 16, 2009, we agreed to issue 25,000 shares of our common stock, a promissory note in the amount of $718,500 and warrants to purchase 600,000 shares of our common stock to Agile Opportunity Fund, LLC in consideration for the transaction with Agile Opportunity Fund, LLC and Superfly Advertising, Inc. and the cancellation of the $625,000 promissory note and warrants we issued to Superfly Advertising, Inc. on February 28, 2009. The promissory note bears interest at a rate of 18%, becomes due onJanuary 16, 2011, as amended and is convertible into shares of our common stock at the conversion price of $3.00 per share. As of January 16, 2011, the $668,250 and accrued interest was paid in full.
|
668,250 | 668,250 | ||||||
|
On November 10, 2009, the Company issued a convertible promissory note for $300,000 to Floss Limited. The interest rate is 18% per annum and is due on November 10, 2010. The notes are convertible into shares of common stock at a conversion price of $2.25 per share of common stock. On November 10, 2010, this note was converted into 157,268 shares of common stock.
|
- | 300,000 | ||||||
|
On November 29, 2009, the Company issued a note payable with a face amount of $460,000 to Agile Opportunity Fund. The interest rate is 18% and is due on January 16, 2011, as amended. As of January 16, 2011, the $460,000 and accrued interest was paid in full.
|
460,000 | 460,000 | ||||||
|
On December 12, 2009, the Company issued a note payable with a face amount of $52,351 to Bridges Investment. The note bears interest at 12% and is due on March 31, 2010. The Company. This note was paid in full in March 2010.
|
- | 52,351 | ||||||
|
On November 1, 2007, the Company entered into a mortgage loan agreement to purchase a building in South Africa (see Note 2) with a cost of $82,227. The mortgage note payable is due with 240 payments of approximately $1,000 per month including interest at 12.20% per annum. Due to currency rate fluctuations the balance of the mortgage loan in U.S. Dollars may also fluctuate.
|
105,495 | 107,926 | ||||||
|
In 2010, our subsidiary Multimedia Solutions entered into several capital lease agreements for network and computer equipment. See detail below.
|
80,507 | - | ||||||
|
Total debt payable at December 31, 2010 and 2009
|
$ | 1,811,752 | $ | 3,671,027 | ||||
|
Accrued interest, net of debt discounts at December 31, 2010 and 2009
|
81,200 | 72,275 | ||||||
|
Current maturities of debt payable
|
1,677,910 | 3,563,101 | ||||||
|
Total current maturities and accrued interest
|
$ | 1,759,110 | $ | 3,635,376 | ||||
|
Long-term debt payable, net of current maturities and accrued interest
|
$ | 133,842 | $ | 95,916 | ||||
Pursuant to the issuance of the approximately $719,000 and the $460,000 notes to Agile Opportunity Fund, LLC, we recorded a $43,500 and $60,000 original issue discounts, respectively. We have amortized the original issue discounts over the life of the notes. In 2009, the Company had amortized approximately $23,000 of this expense. As of December 31, 2010, we had amortized the remaining $80,000 which is recorded as interest expense on the accompanying consolidated statements of operations.
Pursuant to the issuance of the $460,000 note to Agile Opportunity Fund, LLC, we issued 20,000 incentive shares of our common stock, 75,000 Series A Warrants and 75,000 Series B Warrants to purchase shares of our common stock. Based on the relative fair value of these equity instruments, we recorded a debt discount of approximately $134,000. We amortized the debt discount over the life of the note. In 2009, we had amortized approximately $11,000 of this expense. As of December 31, 2010, we had amortized the remaining $122,000 which is recorded as interest expense on the accompanying consolidated statements of operations.
Pursuant to the issuance of the $460,000 note to Agile Opportunity Fund, LLC, we paid approximately $70,000 to consummate the transaction and recorded this amount as debt issue costs in the accompanying consolidated balance sheets. We are amortizing the debt discount over the life of the note. In 2009, we had amortized approximately $17,000 of this expense. As of December 31, 2010, we have amortized the remaining $53,000, which is recorded as interest expense on the accompanying consolidated statements of operations. In addition, certain warrants issued in connection with the February 2009 promissory had additional valuation of approximately $161,000 that we recorded in interest expense in 2010.
64
At December 31, 2010 and 2009 there was approximately $81,000 and $183,000 in unpaid accrued interest on debt.
During 2010, we entered into two capital lease obligations that expire in various years through 2013 and bear interest at 11.0% and 11.5%. The assets and liabilities under these capital leases are recorded at the lower of the present value of the minimum lease payments or the fair value of the asset. The assets are depreciated over the lower of their related lease terms or their estimated productive lives. Amortization (or depreciation) of assets under capital leases is included in depreciation expense for the year ended December 31, 2010.
Depreciation on assets under capital leases charged to expense for the year ended December 31, 2010 was approximately $22,000.
Following is a summary of property held under capital leases:
|
December 31,
2010
|
December 31,
2009
|
|||||||
|
Network and computer equipment
|
$
|
102,764
|
$
|
-
|
||||
|
Less: Accumulated amortization (or depreciation)
|
(22,257
|
)
|
-
|
|||||
|
Net book value of equipment under capital lease obligations
|
$
|
80,507
|
$
|
-
|
||||
The following tables summarize our capital lease obligations:
|
December 31,
2010
|
December 31,
2009
|
|||||||
|
Current portion of obligations under capital leases
|
$
|
35,353
|
$
|
-
|
||||
|
Noncurrent portion of obligations under capital leases
|
35,192
|
-
|
||||||
|
Total obligations under capital leases
|
$
|
70,545
|
$
|
-
|
||||
Minimum future lease payments under capital leases as of December 31, 2010 for each over the next three years and in the aggregate are:
|
2011
|
$ | 41,532 | ||
|
2012
|
20,880 | |||
|
2013
|
18,095 | |||
|
Minimum future lease payments
|
$ | 80,507 | ||
|
Less: Interest portion
|
(9,962 | ) | ||
|
Present value of future minimum lease payments
|
$ | 70,545 |
NOTE 13 – CONTINGENT LIABILITIES
Historical Operations
The Company was incorporated in 1999 and became engaged in the current business of mobile and internet marketing in early 2008. Between 1999 and 2008, the Company was engaged in different lines of business including discount brokerage and financial services, mortgage banking, and apparel. Current management was not involved with the Company prior to early 2008. There may be risks and liabilities resulting from the conduct of the Company’s business prior to February 2008 that are unknown to the management of our Company and not disclosed in these financial statements. In the event that any liabilities, liens, judgments, warrants, options, or other claims against the Company arise, these will be recorded when discovered.
Profit Warranty Related to Capital Supreme Purchase
On August 11, 2008, we acquired Capital Supreme, (Pty) Ltd (“Capital Supreme”), a company based in Johannesburg, South Africa, doing business as Multimedia Solutions. The acquisition was affected under the terms of a Sale and Purchase Agreement, in which our Lenco International, Ltd. subsidiary acquired all of the outstanding capital stock of Multimedia Solutions in exchange for 25 million South African Rand or approximately $3.2 million.
We have remeasured the contingent liability at December 31, 2010 and will continue to do so at each reporting date until the contingency is resolved with the change in fair value being recognized in earnings in accordance with ASC 805-10 “Business Combinations.” The remeasurement of the balance of this contingent liability from December 31, 2009 to December 31, 2010 resulted in no net effect to the Consolidated Statements of Operations.
65
Contingent Payment to Former Shareholders Related to the Jetcast, Inc. Merger
On September 28, 2010, we completed the acquisition of Jetcast, Inc. In connection with the closing of the merger and pursuant to the merger agreement, we will pay up to approximately $4.3 million in cash and up to $20.7 million in the form of unregistered shares of our common stock issuable to the Jetcast former shareholders in connection with surpassing future revenue targets.
We have remeasured the contingent liability at December 31, 2010 and will continue to do so at each reporting date until the contingency is resolved with the change in fair value being recognized in earnings accordingly with ASC 805-10 “Business Combinations.” We have calculated a remaining liability related to these contingent events of approximately $12.2 million which is included in the “Contingent consideration liability, net of current portion” shown on the accompanying consolidated balance sheet as of December 31, 2010.
Legal Proceedings
From time to time, we may be involved in litigation relating to claims arising out of our operations in the normal course of business, including claims of alleged infringement, misuse or misappropriation of intellectual property rights of third parties. At December 31, 2010, we are not a party to any such litigation which management believes would have a material adverse effect on our financial position or results of operations.
NOTE 14 – COMMON STOCK
During 2010, we issued common stock in connection with the following promissory note conversions, promissory note restructuring and consulting services:
|
Promissory Note
|
Common
|
|||||||||||||
|
and
|
Conversion
|
Stock
|
||||||||||||
|
Date
|
Name
|
Accrued Interest
|
Price
|
Issued
|
||||||||||
|
June 14, 2010
|
Richard Berman
|
$ | 1,360,985 | $ | 3.00 | 453,662 | ||||||||
|
June 16, 2010
|
Rendez-Vous Management Limited
|
1,269,000 | 4.00 | 317,250 | ||||||||||
|
June 24, 2010
|
Angelique de Maison
|
173,250 | 3.00 | 57,750 | ||||||||||
|
July 12, 2010
|
Rendez-Vous Management Limited
|
700,000 | 4.00 | 175,000 | ||||||||||
|
August 13, 2010
|
Agile Opportunity Fund, LLC debt restructuring and extension consideration
|
- | - | 50,000 | ||||||||||
|
October 1, 2010
|
Floss note conversion and additional incentive shares
|
353,852 | 2.25 | 182,268 | ||||||||||
|
December 1, 2010
|
Consulting shares issued for various services
|
- | - | 55,915 | ||||||||||
|
Total common shares issued in connection with debt conversions and consulting services during 2010
|
$ | 3,857,087 | $ | - | 1,291,845 | |||||||||
During 2009, we issued common stock in connection with the following promissory note conversions, promissory note restructuring and consulting services:
|
Promissory Note
|
Common
|
|||||||||||||
|
and
|
Conversion
|
Stock
|
||||||||||||
|
Date
|
Name
|
Accrued Interest
|
Price
|
Issued
|
||||||||||
|
October 28, 2009
|
Tamino Investments consulting services
|
$ | - | $ | - | 3,917,595 | ||||||||
|
May 18, 2009
|
Elvena Enterprises, Inc debt converserion and restructuring consideration
|
210,024 | 3.00 | 1,200,000 | ||||||||||
|
July 31, 2009
|
Agile Opportunity Fund, LLC debt restructuring and extension consideration
|
- | - | 45,000 | ||||||||||
|
May 14, 2009
|
MC2 Squared Michael Crow Consulting
|
- | - | 1,500,000 | ||||||||||
|
May 14, 2009
|
MC2 Squared Michael Crow Consulting - Cancelled
|
- | - | (1,500,000 | ) | |||||||||
|
Total common shares issued in connection with debt conversions and consulting services during 2009
|
$ | 210,024 | 5,162,595 | |||||||||||
During 2010, we issued common stock in connection with the following acquisitions:
|
Common Stock
|
||||||
|
Date
|
Name
|
Issued
|
||||
|
August 17, 2010
|
G2AA acquisition
|
275,000 | ||||
|
September 29, 2010
|
Jetcast, Inc. acquisition
|
4,008,453 | ||||
|
December 17, 2010
|
Agelos Gateway Limited acquisition
|
521,277 | ||||
|
Total common shares in connection with acquisitions during 2010
|
4,804,730 | |||||
66
During 2009, we issued common stock in connection with the following acquisitions:
|
Common Stock
|
||||||
|
Date
|
Name
|
Issued
|
||||
|
February 28, 2009
|
Superfly acquisition
|
5,000,000 | ||||
|
May 4, 2009
|
Eden Marketing acquisition
|
3,500,000 | ||||
|
October 16, 2009
|
Simply Ideas acquisition
|
725,309 | ||||
|
Total common shares in connection with acquisitions during 2009
|
9,225,309 | |||||
During 2009, we issued common stock in connection with the following preferred stock conversions:
|
Preferred Stock
|
Conversion
|
Common Stock
|
||||||||||||
|
Date
|
Name
|
Converted
|
Price
|
Issued
|
||||||||||
|
7/2/2009
|
Target Equity
|
200 | $ | 50,000 | 10,000,000 | |||||||||
|
5/15/2009
|
Rendez-Vous Management Limited
|
7 | 50,000 | 350,000 | ||||||||||
|
Total common shares issued in connection with preferred stock conversions during 2009
|
207 | $ | - | 10,350,000 | ||||||||||
NOTE 15 – PREFERRED STOCK
Series A Convertible Preferred Stock Financing
During 2010, we sold an aggregate of 100,000 shares of our Series A Convertible Preferred Stock at a purchase price of $100 per share, raising gross proceeds of $10.0 million. There were no discounts, sales or underwriting commissions incurred in connection with the financing. The proceeds will be used for general working capital purposes, including supporting the expansion of our mobile phone segment into new markets.
The preferred stock was sold pursuant to the terms of a securities purchase agreement dated September 23, 2010 between the Company and certain accredited investors. The lead investor for the financing was Pablo Enterprises LLC, who purchased $10 million of the preferred stock. As a condition to the financing, the lead investor, required that certain members of our management team purchase in the aggregate $750,000 worth of the preferred stock. Our management team formed an entity under the name Sterling Capital Partners Inc., which agreed to purchase such amount of the preferred stock on the same terms and conditions as the other investor in the financing. As of December 31, 2010, Sterling Capital Partners Inc. had funded $350,000 of the $750,000 investment and we had not issued the 7,500 shares of preferred stock. The remaining $400,000 to be funded was recorded as a preferred stock liability at December 31, 2010. In February 2011, the 7,500 shares were issued and the total remaining amount of $400,000 from Sterling Capital Partners was collected.
The following is a summary the terms of the Series A preferred stock issued on September 23, 2010:
Stated Value: The stated value per share of preferred stock is $100, subject to increase for accreted dividends.
Voting Rights: The holders of the preferred stock vote on an as-converted basis together with the holders of our common stock as a single class, except with respect to any increase or decrease in the authorized shares of our common stock, as to which the holders of the preferred stock have no right to vote.
Dividends: The holders of the preferred stock are entitled to cumulative dividends at the rate per share (as a percentage of the stated value per share) of 6.0% per annum. Dividends are payable (i) quarterly on March 31, June 30, September 30 and December 31 and (ii) when and to the extent shares of the preferred stock are converted into common stock. Dividends accrete to, and increase, the outstanding stated value of the preferred stock and compound quarterly on March 31, June 30, September 30 and December 31.
Voluntary Conversion: A holder of preferred stock can elect to convert its preferred stock into shares of our common stock at any time from and after the earlier of: (i) the second anniversary of the original issue date of the preferred stock and (ii) the date that our company’s earnings before interest, taxes, depreciation and amortization (“EBITDA”) over the prior four fiscal quarters exceeds $15 million. Each share of preferred stock is convertible into that number of shares of our common stock determined by dividing the stated value of such share of preferred stock (as increased for accreted dividends) by the conversion price.
Conversion Price: The conversion price is initially $1.50, subject to adjustment if (i) we pay any stock dividends or if we subdivide, combine or reclassify our common stock or (ii) our company’s EBITDA for the 15 month period ended December 31, 2011 is less than $27.0 million and our company’s EBITDA for the 27 month period ended December 31, 2012 is less than $65.0 million. With respect to the adjustment effected pursuant to clause (ii), the conversion price is reduced by $0.03 per share if EBITDA for the 27 month period ended December 31, 2012 is less than $65.0 million, and the conversion price is reduced by an additional $0.03 per share for each $1.0 million difference between actual EBITDA for such 27 month period and $65.0 million, subject to a conversion price floor of $0.25 per share.
67
Automatic Conversion: The preferred stock automatically converts if: (i) our company’s EBITDA for the 15 month period ended December 31, 2011 is equal to or greater than $27.0 million, or (ii) our company’s EBITDA for the 27 month period ended December 31, 2012 is equal to or greater than $65.0 million. However, an automatic conversion may only occur if our common stock, including the shares issuable upon conversion of the preferred stock, is trading on a national securities exchange at the time of conversion.
Liquidation Preference: The holders of preferred stock are entitled to receive out of our assets, whether capital or surplus, before any distribution or payment shall be made to the holders of our common stock or other junior securities, an amount per share of preferred stock equal to the sum of (i) the stated value of the preferred stock (as increased for accreted dividends), plus (ii) any accrued dividends thereon that have not accreted to the stated value through the date of liquidation, plus (iii) such amount necessary to make the aggregate of all amounts paid with respect to such share of preferred stock equal to an internal rate of return of 30% per annum.
Redemption: We can redeem the preferred stock at any time after the five-year anniversary of the original issue date of the preferred stock by paying cash in an amount equal to the sum of (i) the stated value of the preferred stock, plus (ii) any accrued dividends thereon that have not accreted to the stated value through the date of redemption, plus (iii) such amount necessary to make the aggregate of all amounts paid with respect to such share of preferred stock equal to an internal rate of return of 30% per annum. We must give the holders of the preferred stock at least 30 days advance notice of our intent to redeem the preferred stock and we must honor any conversion of the preferred stock before the redemption date.
In addition, we determined that the preferred stock contained an embedded beneficial conversion feature and we determined under ASC 815 that the embedded conversion feature did not need to be bifurcated from the preferred stock. We calculated the intrinsic value of the beneficial conversion feature to be approximately $13.3 million. Because the maximum discount cannot exceed the $10.0 million face amount of the preferred stock, we recorded a preferred stock discount of $10.0 million which will be treated as a deemed dividend and amortized over twenty four months to accumulated deficit. For the year ended December 31, 2010, we amortized approximately $1.5 million as a deemed dividend and accrued approximately $165,000 for the dividends payable under this agreement.
NOTE 16– SEGMENT INFORMATION
Since 2009, our products and operations have been managed in two segments; the mobile phone segment and the internet segment. We manage the operations of our recently acquired Lenco Media, Inc. business as part of the internet segment, which we now refer to as the internet and internet broadcasting segment. A segment is determined primarily by the method of delivery of our products and services. Management reviews our assets on a consolidated basis because it is not meaningful to allocate assets to the various segments. Management evaluates segment performance based on revenues and operating income. We do not allocate income taxes or charges determined to be non-recurring in nature.
The mobile phone segment primarily operates in South Africa, but we have begun to earn revenues in Australia. The internet and internet broadcasting segment primarily operates in the United States. The table below sets forth our revenue, costs of sales, gross profit and income or loss from operations for each of our operating segments for the year ended December 31, 2010.
|
Revenue
|
Cost of sales
|
Gross profit
|
Sales, marketing, administrative, & R&D expense
|
Depreciation & amortization expense
|
Impairment
|
Loss from operations
|
|||||||||||||||||||||
|
Mobile phone
|
$ | 6,274,968 | $ | 1,675,135 | $ | 4,599,833 | $ | 4,451,704 | $ | 838,315 | $ | - | $ | (690,186 | ) | ||||||||||||
|
Internet and internet broadcasting
|
2,082,363 | 939,228 | 1,143,135 | 4,073,372 | 2,636,859 | 875,960 | (6,443,056 | ) | |||||||||||||||||||
|
Corporate costs
|
- | - | - | 2,097,640 | 462,094 | (2,559,734 | ) | ||||||||||||||||||||
|
Total consolidated
|
$ | 8,357,331 | $ | 2,614,363 | $ | 5,742,968 | $ | 10,622,716 | $ | 3,937,268 | $ | 875,960 | $ | (9,692,976 | ) | ||||||||||||
68
NOTE 17 – OPERATING LEASES
Leases of assets under which all the risks and benefits of ownership are effectively retained by the lessor are classified as operating leases. Lease payments under an operating lease are charged to the income statement over the lease term on a straight-line basis unless another basis is more representative of the pattern of use.
We lease office space in South Africa under operating leases with lease terms beginning May 1, 2007 through September 30, 2012 including various options to renew.
We lease our headquarters’ office space, and a corporate apartment in Santa Barbara, California. These headquarters space is in one building with multiple units that are under various lease terms beginning April 1, 2009 through November 30, 2014. The leases include an option to renew for multiple year periods.
We do not have operating leases other than these leases for space described above. Operating lease expense for the year ended December 31, 2010 and December 31, 2009 was approximately $453,000 and $229,000, respectively.
Minimum lease payments per annum are as follows:
|
Year Ending Decmeber 31,
|
Total Amount
|
|||
|
2011
|
274,640 | |||
|
2012
|
196,056 | |||
|
2013
|
94,992 | |||
|
2014
|
20,870 | |||
| $ | 586,558 | |||
NOTE 18 – WARRANTS & WARRANT PUT LIABILITY
We account for the issuance of common stock purchase warrants issued and other free standing derivative financial instruments in accordance with the provisions of ASC 815-40-25 “Derivatives and Hedging”. Under this standard we classify as equity any contracts that (i) require physical settlement or net-share settlement or (ii) gives us a choice of net-cash settlement or settlement in its own shares (physical settlement or net-share settlement). We classify as assets or liabilities any contracts that (i) require net-cash settlement (including a requirement to net cash settle the contract if an event occurs and if that event is outside of our control) or (ii) gives the counterparty a choice of net-cash settlement or settlement in shares (physical settlement or net-share settlement).
In November 2009, we issued 75,000 Series A Warrants to Agile Opportunities Fund with an exercise price of $3.25 that expire on November 30, 2014, and 75,000 Series B Warrants with an exercise price of $3.40 that expire on November 30, 2014. The Series B warrants contain a provision that allows the holder to put the options back to us for $60,000. Since the warrants were issued with debt and incentive shares, we used the relative fair value to determine the amount to record on the financial statements. We determined the fair value of the Series A Warrants using the Black-Scholes-Merton model with the following assumptions, risk free rate of return of 2.01%; volatility of 67.40; dividend yield of 0%; and expected term of 5.0 years.
The fair value for the Series A Warrants was approximately $62,000 with a calculated relative fair value of approximately $46,000. Because the Series B Warrants could be put back to the Company for $60,000, we used $60,000 as the relative fair value of the Series B Warrants. In addition, certain warrants issued in connection with the February 2009 promissory had additional valuation of approximately $161,000 that we recorded in interest expense in 2010.
The warrants only provide for physical settlement or net-share settlement. In addition, there is no requirement that the underlying shares be registered under the Securities Act of 1933, which could result in a requirement to make a net-cash settlement. Accordingly, we classified the relative fair value of the Series A and Series B Warrants as equity.
The following table summarizes the warrant activity:
|
Weighted
|
|||||||||
|
Weighted
|
Average
|
||||||||
|
Average
|
Remaining
|
||||||||
|
Number of
|
Exercise
|
Contractual
|
|||||||
|
Warrants
|
Price
|
Life (in years)
|
|||||||
|
Outstanding, December 31, 2008
|
-
|
||||||||
|
Granted
|
1,344,166
|
3.00
|
|||||||
|
Exercised
|
150,000
|
3.33
|
|||||||
|
Exchanged
|
-
|
||||||||
|
Forfeited
|
-
|
||||||||
|
Outstanding, December 31, 2009
|
1,494,166
|
3.03
|
|||||||
|
Granted
|
-
|
||||||||
|
Exercised
|
-
|
||||||||
|
Forfeited
|
(100,000)
|
3.00
|
|||||||
|
Outstanding, December 31, 2010
|
1,394,166
|
$
|
3.03
|
3.24
|
|||||
|
Exercisable, December 31, 2010
|
1,394,166
|
$
|
3.03
|
3.24
|
|||||
69
NOTE 19 – CONCENTRATIONS
Customers
A significant portion of our revenues is derived from a limited number of Wireless Carriers. For the year ended December 31, 2010, we derived approximately 58% of our revenues from relationships with three Wireless Carriers or Brand Owners. We have established relationships with a number of Wireless Carriers, and expect to continue to generate a substantial majority of revenues through distribution relationships with fewer than twenty Wireless Carriers for the foreseeable future. If any of the Wireless Carriers decides not to allow us to access their MMS messaging delivery platforms, or decides to terminate or modify the terms of its agreement with the Company or if there is consolidation among Wireless Carriers, we may be unable to replace the affected agreement with acceptable alternatives, causing it to lose access to that Wireless Carrier’s subscribers and the revenues they afford. In addition, having revenues concentrated among a limited number of Wireless Carriers also creates a concentration of financial risk. In the event that any significant Wireless Carriers were unable to fulfill their payment obligations our operating results and cash position would suffer. If any of these eventualities come to pass, it could materially reduce our revenues.
In 2010, our internet advertising business generated 25% of our total revenues from our 2 largest internet network customers. Our top four customers, therefore, accounted for 64% of total revenues in 2010. We continue to expand both our mobile and internet client base but a change in one or all of these relationships would have short-term revenue implications.
In 2009, our internet advertising business generated 16% of our total revenues from our 2 largest internet network customers. Our top four customers, therefore, accounted for 36% of total revenues in 2009. We continue to expand both our mobile and internet client base but a change in one or all of these relationships would have short-term revenue implications.
Suppliers
We purchase bulk message services from Wireless Carriers on a purchase order basis. We do not have long term contracts with Wireless Carriers to protect our access to the network or the prices we pay for network access. Any failure to secure new purchase orders from Brand Owners, inability to access Wireless Carrier networks at reasonable rates, would have a substantial negative impact on our business.
NOTE 20 – EMPLOYEE BENEFIT PLAN
We have a 401(k) defined contribution plan and profit sharing plan for eligible employees under the name of Lenco Mobile Inc. Retirement Plan and Trust. Under the defined contribution plan, employees can make voluntary contributions not to exceed the limits established by the Internal Revenue Code. We did not make any matching contributions during the year ended December 31, 2010.
NOTE 21 – GOVERNMENT REGULATION
Our operations are subject to a number of regulations. Our operating activities in South Africa are governed under the state, commercial and labor regulations of that Country. Our products and services are subject to regulation by regulatory agencies in the countries where it operates.
We are subject to federal and state laws and government regulations concerning employee safety and health and environmental matters. The Department of Labor, Occupational Safety and Health Administration, the United States Environmental Protection Agency, and other federal and state agencies have the authority to establish regulations that may have an impact on its operations.
NOTE 22 – INCOME TAXES
The income tax charge is determined based on net income before tax for the year and includes deferred tax and Secondary Taxation on Companies.
Current tax: The current tax charge is the calculated tax payable on the taxable income for the year using enacted or substantively enacted tax rates and any adjustments to tax payable in respect of prior years.
70
Deferred tax: Deferred tax is provided for using the liability method, on all temporary differences between the carrying values of assets and liabilities for accounting purposes and the amounts used for tax purposes and on any tax losses. No deferred tax is provided on temporary differences relating to:
|
·
|
the initial recognition of goodwill;
|
|
·
|
the initial recognition (other than in a business combination) of an asset or liability to the extent that neither accounting nor taxable profit is affected on acquisition; and
|
|
·
|
investments in subsidiaries to the extent they will probably not reverse in the foreseeable future.
|
The provision for deferred tax is calculated using enacted or substantively enacted tax rates at the reporting date that are expected to apply when the asset is realized or liability settled. A deferred tax asset is recognized to the extent that it is probable that future taxable profits will be available against which the deferred tax asset can be realized.
Our income tax provision (benefit) is comprised of the following:
|
December 31,
|
December 31,
|
|||||||
|
2010
|
2009
|
|||||||
|
Current:
|
||||||||
|
Federal
|
$ | - | $ | - | ||||
|
Foreign
|
(67,102 | ) | 333,359 | |||||
|
State
|
8,800 | 800 | ||||||
|
Total current
|
$ | (58,302 | ) | $ | 334,159 | |||
|
Deferred:
|
||||||||
|
Federal
|
$ | - | $ | - | ||||
|
Foreign
|
- | - | ||||||
|
State
|
- | - | ||||||
|
Total deferred
|
$ | - | $ | - | ||||
|
Total Income Tax Expense
|
$ | (58,302 | ) | $ | 334,159 | |||
Significant components of our deferred tax assets and (liabilities) are set forth below:
|
December 31,
|
December 31,
|
|||||||
|
2010
|
2009
|
|||||||
|
State Taxes
|
$ | 251,517 | $ | 47,266 | ||||
|
Amortization - Intangibles
|
(4,445,078 | ) | 244,284 | |||||
|
Bad Debt Expense
|
27,456 | 13,385 | ||||||
|
Foreign Tax Credit
|
479,696 | 479,696 | ||||||
|
Net Operating Loss Carryforawrd
|
1,785,844 | 277,568 | ||||||
|
Deferred Tax Assets
|
(1,900,565 | ) | 1,062,199 | |||||
|
Valuation Allowance
|
- | (1,062,199 | ) | |||||
|
Net Deferred Tax Assets (Liability)
|
$ | (1,900,565 | ) | $ | - | |||
71
U.S. and foreign income before income taxes are set forth below:
|
December 31,
|
December 31,
|
|||||||
|
2010
|
2009
|
|||||||
|
U.S.
|
$ | (6,687,478 | ) | $ | (2,696,184 | ) | ||
|
Foreign
|
(875,263 | ) | 1,456,289 | |||||
|
Income Before Taxes
|
$ | (7,562,741 | ) | $ | (1,239,895 | ) | ||
The reconciliation of income taxes calculated at the U.S. federal tax statutory rate to our effective tax rate is set forth below:
|
December 31,
|
December 31,
|
|||||||||||
|
2010
|
2009
|
|||||||||||
|
Income tax expense @ 35%
|
$ | (2,646,959 | ) | 35.0% | $ | (433,963 | ) | 35.0% | ||||
|
State income taxes (benefit), net of federal taxes
|
- | 0.0% | (42,274 | ) | 3.4% | |||||||
|
State income tax
|
8,800 | (0.1)% | 800 | (0.1)% | ||||||||
|
Penalty
|
10,500 | (0.1)% | - | 0.0% | ||||||||
|
Meals and entertainment
|
24,037 | (0.3)% | - | 0.0% | ||||||||
|
Warrant interest expense
|
96,780 | (1.3)% | - | 0.0% | ||||||||
|
Amortization
|
3,749,980 | (49.6)% | 468,624 | (1.3)% | ||||||||
|
Foreign tax credit
|
- | 0.0% | (479,696 | ) | 38.7% | |||||||
|
Difference in foreign tax rate
|
(239,241 | ) | 3.2% | (176,342 | ) | 14.2% | ||||||
|
Change in valuation allowance
|
(1,062,199 | ) | 14.0% | 997,010 | (80.4)% | |||||||
|
Total income tax expense
|
$ | (58,302 | ) | 0.8% | $ | 334,159 | (27.0)% | |||||
We have previously not provided deferred tax on the undistributed earnings of foreign investments. Management estimates that the total net undistributed earnings upon which deferred tax has not been provided total approximately $160,000 at December 31, 2010. Such net undistributed earnings are held in the Multimedia Solutions subsidiary, which is a South Africa corporation.
As of December 31, 2010, we had NOL carryforwards for federal, state and foreign income tax purposes of $5 million, $2 million and $1 million, respectively. Such carryforwards may be used to reduce taxable income in those jurisdictions through 2030 subject to limitations of Section 382 of the Internal Revenue Code (“IRC”). For the year ended December 31, 2010, we believe an ownership change may have occurred, as defined by Sections 382 and 383 of the IRC, which could result in the forfeiture of a significant portion of our net operating loss and credit carryforwards. We are currently analyzing whether a change occurred and the related impact on our gross deferred tax assets, if any. As our analysis is not complete, the impact to our gross deferred tax assets is uncertain. The NOL carryforwards will begin expiring in 2028.
Paragraph 31a of FAS 109 and Accounting Principles Board Opinion No. 23, Accounting for Income Taxes – Special Areas (APB 23), and within the reference of FASB ASC topic 740 ”Income Taxes,” allow a taxpayer to identify certain unremitted earnings of foreign investments as being indefinitely reinvested and, consequently, the taxpayer does not provide deferred taxes on the outside basis difference related to those earnings (“outside basis differences”). We believe that their permanent reinvestment position is subject to a potential change in the U.S. tax rules.
NOTE 23 – RELATED PARTY TRANSACTIONS
Rendez-Vous Management, Ltd. owns more than 5% of our outstanding common stock. Rendez-Vous Management, Ltd. is owned by two trusts. Mr. Levinsohn, our Chief Executive Officer is one of a class of beneficiaries of one of the two trusts.
On April 9, 2010 and June 16, 2010, we issued to Rendez-Vous Management, Ltd. notes in exchange for cash in the amounts of $500,000 and $700,000, respectively. The loans are interest free and due on demand. We paid $50,000 on April 9, 2010 against the oldest amounts loaned to us from Rendez-Vous Management, Ltd.
In June 2010, we paid off approximately $1.3 million notes payable outstanding to Rendez-Vous Management, Ltd., by issuance of our common stock at a price of $4.00 per share.
On July 13, 2010, the $700,000 note payable to Rendez-Vous Management, Ltd. was paid off by issuance to shares of our common stock at $4.00 per share.
72
As of December 31, 2010, Michael Hill, President of the Lenco Multimedia Inc. subsidiary, had a short-term note outstanding to the Company of approximately $57,000. This note bears an interest rate of 6% and is due and payable on December 30, 2011.
The Company has also consolidated the financial statements of Creative Content Messaging Pty. Ltd. (“CCM”), a related organization that provides certain content delivery services to the Company. CCM was evaluated under the variable interest consolidation rules and the Company was determined to be the primary beneficiary of CCM. As of December 31, 2010 all activity within CCM was not material.
NOTE 24 – SUBSEQUENT EVENTS
In January 2011, we repaid outstanding convertible notes payable of approximately $1.4 million plus the accrued interest related to those notes to Agile Opportunity Fund, LLC and all of the notes that were recorded as part of the Superfly assets acquisition with the exception of $260,000 in notes due to MOSD Holdings.
In January 2011, we formally changed the name of the subsidiary held under the AdMax Media Inc. name to Lenco Multimedia Inc.
In January and February 2011, the Company made its first two payments to Angelos Gateway Limited in connection with the purchase sale agreement entered into in December 2010. The aggregate amount of the first two payments was approximately $278,000 and the final payment of approximately $126,000 was made on March 17, 2011.
In February 2011, management completed their funding of the Series A Preferred stock transaction by finalizing their funding of $750,000 as per the September 2010 Series A Preferred agreement.
In February 2011, we formally changed the name of our wholly-owned subsidiary Jetcast, Inc. to Lenco Media Inc. In addition, our wholly-owned subsidiary that once fell under the AdMax Media Inc. name has been changed to Lenco Multimedia Inc.
In February 2011, we issued 5,885,000 options to purchase shares of common stock to certain employees of our Capital Supreme Pty Ltd subsidiary and to the senior executives of Lenco Mobile Inc. under our 2009 Equity Incentive Plan. These stock options were issued on February 22, 2011 with an exercise price based on the stock price on the close of the last business day, February 18, 2011 of $2.15 per share. The stock options issued to the employees of Capital Supreme will be subject to vesting based on achieving certain EBITDA targets. The stock options issued to the senior executives of Lenco Mobile Inc. will vest quarterly over three years.
In March 2011, we changed the composition of our board of directors to include Philip B. Harris and James L. Liang as independent directors. Jonathan Fox resigned as a member of the board of directors but remains and officer of the Company. With the addition of Mr. Harris and Mr. Liang and the continuance of Mr. Ronald Wagner as an independent director, we now have three independent board members and two company management board members (Mr. Levinsohn and Mr. Banks). The three independent members are the sole members of the Audit Committee (Ronald Wagner), Nominating and Governance Committee (Philip Harris) and Compensation Committee (James Liang) with the person marked in parenthesis as the committee chairperson, respectively.
73
Item 9. Changes in and Disagreements With Accountants on Accounting and Financial Disclosure
None.
Item 9A. Controls and Procedures
Evaluation of Disclosure Controls and Procedures
We maintain disclosure controls and procedures that are designed to ensure that information that we are required to file or submit under the Exchange Act is recorded, processed, summarized and reported, within the time periods specified in the SEC’s rules and forms. Disclosure controls and procedures include, without limitation, controls and procedures designed to ensure that information required to be disclosed is accumulated and communicated to our management, including our principal executive and principal financial officers, as appropriate to allow timely decisions regarding required disclosure.
Our management, with the participation of our Chief Executive Officer and Chief Financial Officer, evaluated the effectiveness of our disclosure controls and procedures as of December 31, 2010. Based on that evaluation, our Chief Executive Officer and Chief Financial Officer concluded that our disclosure controls and procedures were ineffective as of December 31, 2010 because of certain material weaknesses in our internal controls over financial reporting identified below.
Management’s Annual Report on Assessment of Internal Control over Financial Reporting
Our management is responsible for establishing and maintaining adequate internal control over financial reporting for the Company. Internal control over financial reporting is defined in Rule 13a-15(f) and 15d-15(f) promulgated under the Securities Exchange Act of 1934 as a process designed by, or under the supervision of, the Company’s principal executive and principal financial officers and effected by the Company’s Board of Directors, management and other personnel, to provide reasonable assurance regarding the reliability of financial reporting and the preparation of financial statements for external purposes in accordance with U.S. Generally Accepted Accounting Principles and includes those policies and procedures that:
|
|
·
|
Pertain to the maintenance of records that in reasonable detail accurately and fairly reflect the transactions and dispositions of the assets of the Company;
|
|
|
·
|
Provide reasonable assurance that transactions are recorded as necessary to permit preparation of financial statements in accordance with U.S. Generally Accepted Accounting Principles, and that receipts and expenditures of the Company are being made only in accordance with authorizations of management and directors of the Company; and
|
|
|
·
|
Provide reasonable assurance regarding prevention or timely detection of unauthorized acquisition, use or disposition of the Company’s assets that could have a material effect on the financial statements.
|
Our management assessed the effectiveness of the Company’s internal control over financial reporting as of December 31, 2010. In making this assessment, our management used the criteria set forth in the framework established by the Committee of Sponsoring Organizations of the Treadway Commission (COSO) entitled “Internal Control – Integrated Framework.”
Based on their assessment, management concluded that, as of December 31, 2010, the Company’s internal control over financial reporting was not effective based on those criteria, because of the material weaknesses identified below.
A material weakness is a deficiency, or a combination of deficiencies, in internal control over financial reporting, such that there is a more than remote likelihood that a material misstatement of the company’s annual or interim financial statements will not be prevented or detected on a timely basis.
During management’s annual review of our internal control over financial reporting, we determined the following processes contain material weaknesses as of December 31, 2010:
|
|
·
|
we have not completed the design and implementation of effective internal control policies and procedures necessary to provide reasonable assurance regarding the preparation of financial statements in accordance with GAAP;
|
74
|
|
·
|
we did not maintain sufficient in-house personnel resources with the technical accounting knowledge, expertise and training in the selection, application and implementation of GAAP to certain complex or non-routine transactions;
|
|
|
·
|
we did not maintain adequate segregation of duties for staff members responsible for certain financial accounting and reporting functions;
|
|
|
·
|
we have not completed the design and implementation of effective internal control policies and procedures related to risk assessment and fraud prevention and detection activities;
|
|
|
·
|
we have not completed the design and implementation of effective internal control policies and procedures necessary to provide reasonable assurance regarding the accuracy and integrity of spreadsheets and other “off system” work papers that are used in the financial accounting process; and
|
|
|
·
|
we have not completed the design and implementation of internal control policies and procedures necessary to provide reasonable assurance with respect to the accuracy and completeness of assertions and disclosures related to significant financial statement accounts, and with respect to IT general and application controls.
|
Our management does not believe that any of our annual or interim financial statements issued to-date contain a material misstatement as a result of the aforementioned weaknesses in our internal controls. However, these material weaknesses related to the entity as a whole affect all of our significant accounts and could result in a material misstatement to our annual or interim consolidated financial statements that would not be prevented or detected.
Our management is in the process of identifying the steps necessary to address the material weaknesses existing as of December 31, 2010 described above, as follows:
|
(1)
|
Investing in additional enhancements to our IT systems including enhancements to uniform and universal financial reporting and fully-integrated operating platforms across all of the Company’s subsidiaries, and security over user access and administration;
|
|
(2)
|
Hiring additional accounting and operations personnel with adequate experience, skills and knowledge relating to complex, non-routine transactions are directly involved in the review and accounting evaluation of our complex, non-routine transactions and further segregating duties of financial personnel;
|
|
(3)
|
Documenting, to standards established by senior accounting personnel and the principal accounting officer, the review and analysis and related conclusions with respect to complex, non-routine transactions;
|
|
(4)
|
Evaluating an internal audit function in relation to the Company’s financial resources and requirements; and
|
|
(5)
|
Creating policy and procedures manuals for the accounting, finance and IT functions.
|
The Company is developing the remediation plans for the material weaknesses identified above. These remediation efforts are expected to continue through fiscal 2011 and into 2012.
This annual report does not include an attestation report of our registered public accounting firm regarding internal control over financial reporting. Management’s report was not subject to attestation by the company’s registered public accounting firm pursuant to rules of the SEC that permit the company to provide only management’s report in this annual report.
Our management, including our Chief Executive Officer and Chief Financial Officer, does not expect that our disclosure controls or internal controls over financial reporting will prevent all errors or all instances of fraud. A control system, no matter how well designed and operated, can provide only reasonable, not absolute, assurance that the control system’s objectives will be met. Further, the design of a control system must reflect the fact that there are resource constraints, and the benefits of controls must be considered relative to their costs. Because of the inherent limitations in all control systems, no evaluation of controls can provide absolute assurance that all control issues and instances of fraud, if any, within our company have been detected. These inherent limitations include the realities that judgments in decision-making can be faulty, and that breakdowns can occur because of simple error or mistake. Controls can also be circumvented by the individual acts of some persons, by collusion of two or more people, or by management override of the controls. The design of any system of controls is based in part upon certain assumptions about the likelihood of future events, and any design may not succeed in achieving its stated goals under all potential future conditions. Over time, controls may become inadequate because of changes in conditions or deterioration in the degree of compliance with policies or procedures. Projections of any evaluation of effectiveness to future periods are subject to the risk that controls may become inadequate because of changes in conditions, or that the degree of compliance with the policies or procedures may deteriorate. Because of the inherent limitation of a cost-effective control system, misstatements due to error or fraud may occur and not be detected.
75
Changes in Internal Control over Financial Reporting
There were no changes in the Company’s internal control over financial reporting during the fourth quarter ended December 31, 2010 relative to prior reporting periods that have materially affected, or are reasonably likely to materially affect, the Company’s internal control over financial reporting, except as follows.
In January 2011, the Company hired a Corporate Controller in an effort to facilitate financial reporting processes, improve our in-house technical accounting knowledge, and increase the effectiveness of the internal controls over financial reporting.
This Annual report on Form 10-K does not include an attestation report by our registered public accounting firm regarding internal control over financial reporting. Management’s report was not subject to attestation by our registered public accounting firm pursuant to temporary rules of the SEC that permit us to provide only our management’s report in this Annual report on Form 10-K.
Item 9B. Other Information
None.
76
PART III
Item 10. Directors, Executive Officers and Corporate Governance.
The information required by Item 10 will be contained in, and is hereby incorporated by reference to, our Proxy Statement relating to our 2011 Annual Meeting of Stockholders, which will be filed with the Securities and Exchange Commission no later than 120 days after the end of the fiscal year ended December 31, 2010.
Item 11. Executive Compensation.
The information required by Item 11 will be contained in, and is hereby incorporated by reference to, our Proxy Statement relating to our 2011 Annual Meeting of Stockholders, which will be filed with the Securities and Exchange Commission no later than 120 days after the end of the fiscal year ended December 31, 2010.
Item 12. Security Ownership of Certain Beneficial Owners and Management and Related Stockholder Matters.
The information required by Item 12 will be contained in, and is hereby incorporated by reference to, our Proxy Statement relating to our 2011 Annual Meeting of Stockholders, which will be filed with the Securities and Exchange Commission no later than 120 days after the end of the fiscal year ended December 31, 2010.
Item 13. Certain Relationships and Related Transactions, and Director Independence.
The information required by Item 13 will be contained in, and is hereby incorporated by reference to, our Proxy Statement relating to our 2011 Annual Meeting of Stockholders, which will be filed with the Securities and Exchange Commission no later than 120 days after the end of the fiscal year ended December 31, 2010.
Item 14. Principal Accounting Fees and Services.
The information required by Item 14 will be contained in, and is hereby incorporated by reference to, our Proxy Statement relating to our 2011 Annual Meeting of Stockholders, which will be filed with the Securities and Exchange Commission no later than 120 days after the end of the fiscal year ended December 31, 2010.
77
PART IV
Item 15. Exhibits and Financial Statement Schedules.
The following documents are filed as part of this report:
(1) Financial Statements. The financial statements listed below are included under Item 7 of this report:
|
·
|
Consolidated Balance Sheets as of December 31, 2010 and 2009;
|
|
·
|
Consolidated Statements of Operations for the years ended December 31, 2010 and 2009;
|
|
·
|
Consolidated Statements of Stockholders’ Equity for the years ended December 31, 2010 and 2009;
|
|
·
|
Consolidated Statements of Cash Flows for the years ended December 31, 2010 and 2009; and
|
|
·
|
Notes to Consolidated Financial Statements.
|
(2) Financial Statement Schedules. The following financial statement schedules are included under Item 7 of this report: None.
(3) Exhibits. The following exhibit index shows those exhibits filed with this report and those incorporated by reference:
|
Exhibit No.
|
Document Description
|
Incorporation by Reference
|
||
|
2.1
|
Agreement and Plan of Merger dated July, 2009 between Mobicom USA Corporation and Lenco USA Inc.
|
Filed as an exhibit to the registrant’s Form 10/A (file no. 000153830) filed on December 16, 2009 and incorporated by reference herein.
|
||
|
2.2
|
Agreement and Plan of Merger dated September 17, 2010 among the registrant, Jetco Sub, Inc., Jetcast, Inc., and the stockholders of Jetcast, Inc.
|
Filed as an exhibit to the registrant’s Form 8-K filed on September 22, 2010 and incorporated herein by reference.
|
||
|
3.1
|
Amended and Restated Certificate of Incorporation
|
Filed as an exhibit to the registrant’s Form 10/A (file no. 000153830) filed on November 18, 2009 and incorporated by reference herein.
|
||
|
3.2
|
Certificate of Designation of Preferences, Rights and Limitations of Series A Convertible Preferred Stock
|
Filed as an exhibit to the registrant’s Form 8-K filed on September 28, 2010 and incorporated herein by reference.
|
||
|
3.3
|
Amended and Restated Bylaws
|
Filed as an exhibit to the registrant’s Form 10 (file no. 000153830) filed on November 9, 2009 and incorporated by reference herein.
|
||
|
4.1
|
Specimen Common Stock Certificate
|
Filed as an exhibit to the registrant’s Form 10 (file no. 000153830) filed on November 9, 2009 and incorporated by reference herein.
|
||
|
4.2
|
Form of Convertible Promissory Note issued by the registrant on February 28, 2009
|
Filed as an exhibit to the registrant’s Form 10 (file no. 000153830) filed on November 9, 2009 and incorporated by reference herein.
|
||
|
4.3
|
Form of Common Stock Purchase Warrant issued by the registrant on February 28, 2009
|
Filed as an exhibit to the registrant’s Form 10 (file no. 000153830) filed on November 9, 2009 and incorporated by reference herein.
|
||
|
4.4
|
Promissory Note issued by the registrant to Agile Opportunity Fund LLC on July 31, 2009
|
Filed as an exhibit to the registrant’s Form 10 (file no. 000153830) filed on November 9, 2009 and incorporated by reference herein.
|
||
|
4.5
|
Security Agreement dated July 31, 2009 between the registrant’s subsidiary and Agile Opportunity Fund, LLC
|
Filed as an exhibit to the registrant’s Form 10/A (file no. 000153830) filed on November 18, 2009 and incorporated by reference herein.
|
||
|
4.6
|
Convertible Promissory Note issued by the registrant Agile Opportunity Fund, LLC on November 30, 2009
|
Filed as an exhibit to the registrant’s Form 10/A (file no. 000153830) filed on December 16, 2009 and incorporated by reference herein.
|
||
|
4.7
|
Common Stock Purchase Warrant issued by the registrant to Agile Opportunity Fund, LLC on November 30, 2009
|
Filed as an exhibit to the registrant’s Form 10/A (file no. 000153830) filed on December 16, 2009 and incorporated by reference herein.
|
78
|
4.8
|
Common Stock Purchase Warrant issued by the registrant to Agile Opportunity Fund, LLC on November 30, 2009
|
Filed as an exhibit to the registrant’s Form 10/A (file no. 000153830) filed on December 16, 2009 and incorporated by reference herein.
|
||
|
4.9
|
Form of Promissory Note issued by the registrant to Floss Limited on November 10, 2009
|
Filed as an exhibit to the registrant’s Form 10/A (file no. 000154830) filed on April 15, 2010 and incorporated by reference herein.
|
||
|
4.10
|
Form of Promissory Note Amendment to Promissory Notes Issued by the registrant on February 28, 2010
|
Filed as an exhibit to the registrant’s Form 10 (file no. 000153830) filed on April 15 , 2010 and incorporated by reference herein.
|
||
|
4.11
|
Amendment No. 2 to Convertible Promissory Note dated June 30, 2010
|
Filed as an exhibit to the registrant’s Form 8-K filed on July 1, 2010 and incorporated herein by reference.
|
||
|
4.12
|
Amendment No. 2 to Convertible Promissory Note dated July 14, 2010
|
Filed as an exhibit to the registrant’s Form 8-K filed on July 15, 2010 and incorporated herein by reference.
|
||
|
10.1
|
Asset Purchase Agreement dated February 28, 2009 among the registrant, the registrant’s subsidiary, Superfly Advertising, Inc., a Delaware corporation, and Superfly Advertising, Inc., an Indiana corporation
|
Filed as an exhibit to the registrant’s Form 10 (file no. 000153830) filed on November 9, 2009 and incorporated by reference herein.
|
||
|
10.2
|
Securities Purchase and Amendment Agreement dated November 30, 2009 between the registrant and Agile Opportunity Fund, LLC
|
Filed as an exhibit to the registrant’s Form 10/A (file no. 000153830) filed on December 16, 2009 and incorporated by reference herein.
|
||
|
10.3
|
Asset Purchase Agreement dated December 3, 2010 among the registrant, AdMax Media Inc. and Silverback Network, Inc.
|
Filed as an exhibit to the registrant’s Form 8-K filed on December 9, 2010 and incorporated herein by reference.
|
||
|
10.4
|
Amendment to Asset Purchase Agreement dated December 28, 2010 between AdMax Media Inc. and Silverback Network, Inc.
|
Filed as an exhibit to the registrant’s Form 8-K filed on January 4, 2011 and incorporated herein by reference.
|
||
|
10.5
|
Form of Agreement of Lease between Capital Supreme (Pty), Ltd. and ME Heidi Wood
|
Filed as an exhibit to the registrant’s Form 10 (file no. 000153830) filed on November 9, 2009 and incorporated by reference herein.
|
||
|
10.6
|
Agreement of Lease dated March 14, 2009 between Gutierrez Partners, LLC and Lenco USA Inc. for the property located at 347 Chapala Street, Santa Barbara, CA 93101, as amended
|
Filed as an exhibit to the registrant’s Form 10 (file no. 000153830) filed on November 9, 2009 and incorporated by reference herein.
|
||
|
10.7
|
Agreement of Lease dated March 31, 2009 between Gutierrez Partners, LLC and Lenco USA Inc. for the property located at 345 Chapala Street, Santa Barbara, CA 93101, as amended
|
Filed as an exhibit to the registrant’s Form 10 (file no. 000153830) filed on November 9, 2009 and incorporated by reference herein.
|
||
|
10.8
|
Agreement of Lease dated October 9, 2009, by and between Gutierrez Partners, LLC and Lenco USA Inc. for the property located at 109 West Gutierrez Street, Santa Barbara, CA 93101, as amended
|
Filed as an exhibit to the registrant’s Form 10 (file no. 000153830) filed on November 9, 2009 and incorporated by reference herein.
|
||
|
10.9
|
Agreement of Lease dated October 12, 2009 by and between Gutierrez Partners, LLC and Lenco USA Inc. for the property located at 113 West Gutierrez Street, Santa Barbara, CA 93101, as amended
|
Filed as an exhibit to the registrant’s Form 10 (file no. 000153830) filed on November 9, 2009 and incorporated by reference herein.
|
||
|
10.10
|
Agreement of Lease dated October 12, 2009, by and between Gutierrez Partners, LLC and Lenco USA Inc. for the property located at 111 West Gutierrez Street, Santa Barbara, CA 93101, as amended
|
Filed as an exhibit to the registrant’s Form 10 (file no. 000153830) filed on November 9, 2009 and incorporated by reference herein.
|
||
|
10.11
|
Employment Agreement dated July 16, 2007 between the registrant and Eddie Groenewald*
|
Filed as an exhibit to the registrant’s Form 10/A (file no. 000153830) filed on November 18, 2009 and incorporated by reference herein.
|
||
|
10.12
|
Addendum to Employment Agreement dated September, 2008 between the registrant and Eddie Groenewald*
|
Filed as an exhibit to the registrant’s Form 10/A (file no. 000153830) filed on December 16, 2009 and incorporated by reference herein.
|
||
|
10.13
|
Employment Agreement dated July 1, 2009 between the registrant and Darin Heisterkamp*
|
Filed as an exhibit to the registrant’s Form 10 (file no. 000153830) filed on November 9, 2009 and incorporated by reference herein.
|
||
|
10.14
|
Employment Agreement dated September 1, 2009 between the registrant and Michael Levinsohn*
|
Filed as an exhibit to the registrant’s Form 10 (file no. 000153830) filed on November 9, 2009 and incorporated by reference herein.
|
79
|
10.15
|
Separation Agreement and General Release dated February 26, 2010 by and between Lenco Mobile USA Inc. and Darin Heisterkamp*
|
Filed as an exhibit to the registrant’s Form 8-K filed on March 4, 2010 and incorporated by reference herein.
|
||
|
10.16
|
2009 Equity Incentive Plan*
|
Filed as an exhibit to the registrant’s Form 10/A (file no. 000153830) filed on November 18, 2009 and incorporated by reference herein.
|
||
|
10.17
|
Form of Nonqualified Stock Option*
|
Filed as an exhibit to the registrant’s Form 10 (file no. 000153830) filed on November 9, 2009 and incorporated by reference herein.
|
||
|
10.18
|
Form of Incentive Stock Option*
|
Filed as an exhibit to the registrant’s Form 10 (file no. 000153830) filed on November 9, 2009 and incorporated by reference herein.
|
||
|
10.19
|
Form of Indemnification Agreement*
|
Filed as an exhibit to the registrant’s Form 8-K filed on March 3, 2011 and incorporated herein by reference.
|
||
|
10.20
|
Client Services Agreement dated September, 2006 between Consumer Loyalty Group, Inc. and Datascension, Inc. with respect to call center operations
|
Filed as an exhibit to the registrant’s Form 10/A (file no. 000153830) filed on November 18, 2009 and incorporated by reference herein.
|
||
|
10.21
|
Master License Agreement for the Australia Region dated January 15, 2009 between the registrant’s subsidiary and Multimedia Solutions Australia (Pty) Ltd.
|
Filed as an exhibit to the registrant’s Form 10 (file no. 000153830) filed on November 9, 2009 and incorporated by reference herein.
|
||
|
10.22
|
Commercial Service Agreement dated September 17, 2009 between the registrant and OpenMarket Inc.
|
Filed as an exhibit to the registrant’s Form 10 (file no. 000153830) filed on November 9, 2009 and incorporated by reference herein.
|
||
|
10.23
|
Long Term Partnering Agreement dated October 20, 2009 between the registrant’s subsidiary and Deloitte Consulting
|
Filed as an exhibit to the registrant’s Form 10/A (file no. 000153830) filed on November 18, 2009 and incorporated by reference herein.
|
||
|
10.24
|
Restructuring and Securities Purchase Agreement dated July 31, 2009 among the registrant, Agile Opportunity Fund, LLC, and Superfly Advertising, Inc.
|
Filed as an exhibit to the registrant’s Form 10 (file no. 000153830) filed on November 9, 2009 and incorporated by reference herein.
|
||
|
10.25
|
Securities Purchase Agreement dated June 15, 2010 between the registrant and Rendez-Vous Management Limited
|
Filed as an exhibit to the registrant’s Form 8-K filed on June 21, 2010 and incorporated by reference herein.
|
||
|
10.26
|
Securities Purchase Agreement dated July 12, 2010 among the registrant and Rendez-Vous Management Limited
|
Filed as an exhibit to the registrant’s Form 8-K filed on July 15, 2010 and incorporated herein by reference.
|
||
|
10.27
|
Securities Purchase and Amendment Agreement dated August 13, 2010 among the registrant, AdMax Media Inc. and Agile Opportunity Fund, LLC
|
Filed as an exhibit to the registrant’s Form 8-K filed on August 16, 2010 and incorporated herein by reference.
|
||
|
10.28
|
Securities Purchase Agreement dated September 23, 2010 among the registrant and the purchasers identified therein
|
Filed as an exhibit to the registrant’s Form 8-K filed on September 28, 2010 and incorporated herein by reference.
|
||
|
14.1
|
Code of Ethics
|
Filed herewith.
|
||
|
21.1
|
Subsidiaries of the Registrant
|
Filed as an exhibit to the registrant’s Form 10/A (file no. 000153830) filed on November 18, 2009 and incorporated by reference herein.
|
||
|
24.1
|
Power of Attorney
|
Included on signature page.
|
||
|
31.1
|
Rule 13a-14(a)/15d-14(a) Certification of Chief Executive Officer
|
Filed herewith.
|
||
|
31.2
|
Rule 13a-14(a)/15d-14(a) Certification of Chief Accounting Officer
|
Filed herewith.
|
||
|
32
|
Section 1350 Certification
|
Filed herewith.
|
||
| 99.1 | Press Release | Filed herewith. | ||
* Management contract or compensatory plan or arrangement
80
SIGNATURES
Pursuant to the requirements of Section 13 or 15(d) of the Securities Exchange Act of 1934, Lenco Mobile Inc., the registrant, has duly caused this report to be signed on its behalf by the undersigned, thereunto duly authorized.
|
March 29, 2011
|
LENCO MOBILE INC.
|
|
|
By:
|
/s/ Michael Levinsohn
|
|
|
Michael Levinsohn
|
||
|
Chief Executive Officer
|
||
POWER OF ATTORNEY
KNOW ALL PERSONS BY THESE PRESENTS, that each person whose signature appears below hereby severally constitutes and appoints Michael Levinsohn and Thomas Banks, and each of them, his true and lawful attorney-in-fact and agent, with full power of substitution and re-substitution for him and in his name, place and stead, in any and all capacities to sign any and all amendments to this report, and to file the same, with all exhibits thereto, and other documents in connection therewith, with the Commission, granting unto said attorney-in-fact and agents, and each of them, full power and authority to do and perform each and every act and thing requisite or necessary fully to all intents and purposes as he might or could do in person, hereby ratifying and confirming all that each said attorneys-in-fact and agents or any of them or their or his substitute or substitutes, may lawfully do or cause to be done by virtue hereof.
Pursuant to the requirements of the Securities Exchange Act of 1934, this report has been signed below by the following persons on behalf of Lenco Mobile Inc., in the capacities and on the dates indicated.
|
March 29, 2011
|
/s/ Michael Levinsohn
|
|
|
Michael Levinsohn, Chief Executive Officer and Director
|
||
|
March 29, 2011
|
/s/ Thomas Banks
|
|
|
Thomas Banks, Chief Financial Officer and Director
|
||
|
March 29, 2011
|
/s/ James Liang
|
|
|
James Liang, Director
|
||
|
March 29, 2011
|
/s/ Philip Harris
|
|
|
Philip Harris, Director
|
||
|
March 29, 2011
|
/s/ Ronald Wagner
|
|
|
Ronald Wagner, Director
|
81