Attached files
Table of Contents
UNITED STATES
SECURITIES AND EXCHANGE COMMISSION
WASHINGTON, D.C. 20549
FORM 10-K
| x | ANNUAL REPORT PURSUANT TO SECTION 13 OR 15(d) OF THE SECURITIES EXCHANGE ACT OF 1934 |
For the fiscal year ended December 31, 2010
OR
| ¨ | TRANSITION REPORT PURSUANT TO SECTION 13 OR 15(d) OF THE SECURITIES EXCHANGE ACT OF 1934 |
For the transition period from to
Commission file number: 001-34749
REACHLOCAL, INC.
(Exact name of registrant as specified in its charter)
| Delaware | 20-0498783 | |
| (State or other jurisdiction of incorporation or organization) |
(I.R.S. Employer Identification No.) | |
| 21700 Oxnard Street, Suite 1600 Woodland Hills, California |
91367 | |
| (Address of principal executive offices) | (Zip Code) | |
(818) 274-0260
(Registrant’s telephone number, including area code)
None
(Former name, former address and former fiscal year, if changed since last report)
Securities registered pursuant to Section 12(b) of the Act:
| Title of each class |
Name of each exchange on which registered | |
| Common Stock, $0.00001 par value per share | The NASDAQ Stock Market LLC |
Securities registered pursuant to Section 12(g) of the Act:
None
(Title of Class)
(Title of Class)
Indicate by check mark if the registrant is a well-known seasoned issuer, as defined in Rule 405 of the Securities Act. Yes ¨ No x
Indicate by check mark if the registrant is not required to file reports pursuant to Section 13 or Section 15(d) of the Exchange Act. Yes ¨ No x
Indicate by check mark whether the registrant (1) has filed all reports required to be filed by Section 13 or 15(d) of the Securities Exchange Act of 1934 during the preceding 12 months (or for such shorter period that the registrant was required to file such reports), and (2) has been subject to such filing requirements for the past 90 days. Yes x No ¨
Indicate by check mark whether the registrant has submitted electronically and posted on its corporate Web site, if any, every Interactive Data File required to be submitted and posted pursuant to Rule 405 of Regulation S-T (§ 232.405 of this chapter) during the preceding 12 months (or for such shorter period that the registrant was required to submit and post such files). Yes ¨ No ¨
Indicate by check mark if disclosure of delinquent filers pursuant to Item 405 of Regulation S-K is not contained herein, and will not be contained, to the best of registrant’s knowledge, in definitive proxy or information statements incorporated by reference in Part III of this Form 10-K or any amendment to this Form 10-K. x
Indicate by check mark whether the registrant is a large accelerated filer, an accelerated filer, or a non-accelerated filer. See definition of “accelerated filer and large accelerated filer” in Rule 12b-2 of the Exchange Act.
| Large accelerated filer | ¨ | Accelerated filer | ¨ | |||
| Non-accelerated filer | x (Do not check if a smaller reporting company) | Smaller reporting company | ¨ | |||
Indicate by check mark whether the registrant is a shell company (as defined in Rule 12b-2 of the Exchange Act). Yes ¨ No x
As of June 30, 2010, the aggregate market value of the common stock held by non-affiliates of the registrant was $116,958,129 based on a closing price of $12.97 on the NASDAQ Global Market on such date.
| Class |
Outstanding at March 23, 2011 | |
| Common Stock, $0.00001 par value per share | 28,733,291 shares |
Documents Incorporated by Reference
Portions of the registrant’s Proxy Statement relating to the registrant’s 2011 Annual Meeting of Stockholders are incorporated by reference into Part III of this Annual Report on Form 10-K where indicated.
Table of Contents
INDEX TO FORM 10-K
| Page | ||||||
| Item 1. |
Business | 1 | ||||
| Item 1A. |
Risk Factors | 9 | ||||
| Item 1B. |
Unresolved Staff Comments | 23 | ||||
| Item 2. |
Properties | 23 | ||||
| Item 3. |
Legal Proceedings | 23 | ||||
| Item 4. |
(Remove and Reserved) | 23 | ||||
| Item 5. |
24 | |||||
| Item 6. |
Selected Financial Data | 26 | ||||
| Item 7. |
Management’s Discussion and Analysis of Financial Condition and Results of Operations | 29 | ||||
| Item 7A. |
Quantitative and Qualitative Disclosure About Market Risk | 47 | ||||
| Item 8. |
Financial Statements and Supplementary Data | 47 | ||||
| Item 9. |
Changes in and Disagreements with Accountants on Accounting and Financial Disclosure | 47 | ||||
| Item 9A. |
Controls and Procedures | 47 | ||||
| Item 9B. |
Other Information | 48 | ||||
| Item 10. |
Directors, Executive Officers and Corporate Governance | 49 | ||||
| Item 11. |
Executive Compensation | 49 | ||||
| Item 12. |
Security Ownership of Certain Beneficial Owners and Management and Related Stockholder Matters |
49 | ||||
| Item 13. |
Certain Relationships and Related Transactions, and Director Independence | 49 | ||||
| Item 14. |
Principal Accounting Fees and Services | 49 | ||||
| Item 15. |
Exhibits, Financial Statement Schedules | 50 | ||||
Table of Contents
CAUTIONARY NOTICE REGARDING FORWARD-LOOKING STATEMENTS
In this document, ReachLocal, Inc. and its subsidiaries are referred to as “we,” “our,” “us,” the “Company” or “ReachLocal.”
This annual report on Form 10-K contains “forward-looking statements” that involve risks and uncertainties, as well as assumptions that, if they never materialize or prove incorrect, could cause our results to differ materially from those expressed or implied by such forward-looking statements. The statements contained in this Annual Report on Form 10-K that are not purely historical are forward-looking statements within the meaning of Section 27A of the Securities Act of 1933, as amended, (the “Securities Act”) and Section 21E of the Securities Exchange Act of 1934, as amended (the “Exchange Act”). Forward-looking statements are often identified by the use of words such as, but not limited to, “anticipate,” “believe,” “can,” “continue,” “could,” “estimate,” “expect,” “intend,” “may,” “will,” “plan,” “project,” “seek,” “should,” “target,” “will,” “would,” and similar expressions or variations intended to identify forward-looking statements. These statements are based on the beliefs and assumptions of our management based on information currently available to management. Such forward-looking statements are subject to risks, uncertainties and other important factors that could cause actual results and the timing of certain events to differ materially from future results expressed or implied by such forward-looking statements. Factors that could cause or contribute to such differences include, but are not limited to, those discussed in Part I, Item 1A, “Risk Factors” included in this Form 10-K. Furthermore, such forward-looking statements speak only as of the date of this report. Except as required by law, we undertake no obligation to update any forward-looking statements to reflect events or circumstances after the date of such statements.
Business Overview
Our mission is to help small and medium-sized businesses, or SMBs, acquire, maintain and retain customers via the Internet. We offer a comprehensive suite of online marketing and reporting solutions, including search engine marketing, display advertising, Web presence, remarketing, local deals and online marketing analytics, each targeted to the SMB market. We deliver these solutions to SMBs through a combination of our proprietary RL Platform and our direct, “feet-on-the-street” sales force of Internet Marketing Consultants, or IMCs, and select third-party agencies and resellers.
We use our RL Platform to create advertising campaigns for SMBs to target potential customers in their geographic area, optimize those campaigns in real time and track tangible results. Through a single Internet advertising budget, we enable our clients to reach local customers across all the major search engines and leading general interest and vertically focused online publishers. Based in or near the cities in which our clients operate, our IMCs establish a direct consultative relationship with our clients and, empowered by the RL Platform, work with the clients to achieve their marketing objectives.
At December 31, 2010, we managed 22,700 Active Campaigns across 16,900 Active Advertisers, a substantial majority of which we calculate spend from $500 to $3,000 per month with us. Our clients include SMBs in a number of industry verticals, such as home repair and improvement, automobile sales and repair, medical and health services, legal services and retail and personal services. Since inception, we have delivered to our SMB clients nearly 500 million geographically targeted clicks and 40 million phone calls. At December 31, 2010, we employed 665 IMCs in North America, Australia, the United Kingdom and Germany and work with over 360 third-party agencies and resellers that use the RL Platform to serve their SMB clients. We continue to expand our IMC sales force both in existing and new markets.
We generate revenue by providing online advertising solutions for our clients through our ReachSearch, ReachDisplay, ReachCast, Remarketing and other products and services. We reported $291.7 million in revenue in 2010 and $203.1 million in 2009 (an increase of 43.6%), Adjusted EBITDA of $0.8 million in 2010 and $1.4 million in 2009, as well as a $12.3 million loss from operations in 2010 and a $6.0 million loss from operations in 2009. See Part II, Item 7, “Management’s Discussion and Analysis of Financial Condition and Results of Operations – Non-GAAP Financial Measures” for our definition of Adjusted EBITDA, why we present it and for a reconciliation of our Adjusted EBITDA to loss from operations for each of the periods presented.
In February 2011, we acquired DealOn, LLC (“DealOn”) which has a local deals business that operates in 18 markets across the United States, in addition to a product suite including the DealOn.com destination site, a white-label and co-branded deals platform allowing online publishers to offer deals to their customers, and the recently launched OfferEx deal exchange which enables other deal sites and publishers to supply and/or resell deals through an exchange.
1
Table of Contents
Industry Overview
The Local SMB Advertising Market
SMBs serving local markets represent significant economic activity, control substantial purchasing power and address the needs of hundreds of millions of consumers. These SMBs include businesses such as lawyers, physicians, car dealers, dentists, plumbers, florists and local operations of national chains. To generate and sustain their businesses, SMBs spend money marketing their services to acquire, maintain and retain customers. These expenditures are a critical component of the operating budget for many SMBs, particularly given the potential value of each customer over the lifetime of the relationship. For example, a new dental patient may generate several hundred dollars in revenue during the first visit, thousands of dollars in subsequent visits and make referrals to friends and family that generate significant additional revenue.
An SMB’s owner and operator is also typically its chief marketing officer because the business is too small to justify hiring dedicated marketing personnel. Companies that operate traditional offline media formats, such as the yellow pages, newspapers, radio stations and direct mail publishers, adapted to the limited amount of time and effort that SMB owners and operators are normally able to devote to advertising and marketing by developing products, distribution and service delivery models that greatly simplified the marketing process for SMBs. The products sold by these offline media companies—namely, space in their directories and periodicals or time on the radio and television—were easy to understand (e.g., a flat $1,500 a month for a quarter page ad in the yellow pages). Because of their scale, these traditional offline media companies were able to deploy direct local sales forces that walked into the SMB’s place of business, presented a media package that gave the SMB broad customer reach through a single advertising purchase, assisted in the creation of the media advertisement for the SMB and ultimately asked the SMB to do little more than write a check. The SMB owner and operator was able to focus his or her efforts on running the business with little attention to these marketing efforts.
Marketing in the offline world for an SMB was therefore relatively straightforward. There were a limited number of advertising channels, the channel owners sent dedicated personnel to visit and serve the SMB, and the SMB did not need to invest resources in managing the process.
The Digitization of Local Advertising
Over the past decade, the local advertising market for SMBs and other local businesses has undergone rapid and fundamental changes. The delivery and consumption of local advertising, like all media, is becoming increasingly fragmented and digitized. Many consumers who used to search for a local business in the yellow pages are now going online and searching on Google, checking reviews on Yelp and Citysearch, buying coupons on Groupon and LivingSocial, and asking their friends for their opinions through Facebook and Twitter. Similarly, many consumers who used to read the newspaper are now accessing the news through news sites, portals and blogs. This consumer-led digital transformation has profoundly disrupted the ways that businesses of all sizes need to acquire, maintain and retain their customers. As the Internet continues to grow and evolve, we believe that these trends will accelerate. To keep pace with this transformation, we believe that SMBs need to follow their customers and move an increasing portion of their marketing efforts and spend online.
The Local Challenge
The growth of local online advertising spend has, however, significantly lagged the increase in online media consumption. We believe that this lag is the result of two significant challenges:
| • | The Product Challenge: Re-create with online media the ease of purchasing and breadth of customer reach to which SMBs are accustomed with offline media. For owners and operators of SMBs, building an efficient and effective online marketing presence is a significant challenge, especially given the highly fragmented landscape of digital media publishers. While it is possible for an SMB to purchase search and display media online through various self-service advertising platforms, we believe that these online advertising products do not address the fundamental needs and business realities of the SMB advertiser, which include a lack of time and resources, lack of expertise, lack of economic incentive relative to the time required and their typical levels of advertising spend, and lack of transparency into performance. |
| • | The Distribution Challenge: Re-create the ability to sell local online advertising products to SMBs in the manner to which they are accustomed purchasing offline advertising products. Selling advertising to SMBs is difficult, and creating and sustaining a local sales force to address the SMB market requires substantial investment. The SMB market is fragmented, and SMB owners and operators are busy running their businesses and have little time to consider new marketing options. Accordingly, SMBs require a third party to work with them in developing their marketing strategy. |
2
Table of Contents
The ReachLocal Solution
We combine advanced, publisher-agnostic technology and an experienced, digitally sophisticated direct sales force to provide SMBs with a single, easy to use and cost-effective solution to acquire, maintain and retain customers using digital media. Our target market is SMBs that spend at least $5,000 per year on advertising.
The Product Solution
We have built a technology platform, the RL Platform, that addresses the needs of the SMB and re-creates the simplicity and effectiveness with which SMBs have traditionally purchased offline advertising. Our product solutions include the following key features:
| • | One Check: The Internet Budget. Through the simplicity of a single Internet advertising budget, the RL Platform allows us to connect SMBs to multiple online publishers. We connect the SMB to a broad range of destinations on the Internet, including: |
| • | major search engines such as Google, Yahoo!, Microsoft, AOL and Ask.com; |
| • | an extensive network of local search and directory sites such as Local.com, MagicYellow and Citysearch; |
| • | leading display advertising networks such as Yahoo!/Right Media and the Google display network; |
| • | leading social media sites, such as Facebook and Twitter; and |
| • | a network of local deal sites. |
The RL Platform automates connections to publicly available, self-service advertising and social media platforms through application programming interfaces, or APIs, specific to those platforms. The RL Platform also allows us to provide SMBs with access to a greater breadth of media because we are able to leverage our significant customer base to gain access to advertising inventory typically unavailable to an SMB with a modest advertising budget. By combining these features, the RL Platform allows us to offer SMBs the simplicity of a single Internet advertising budget that connects them to a diverse array of online publishers.
| • | Do It for Me: End-to-End Execution. The RL Platform is a proprietary, end-to-end technology platform that enables us to execute an online marketing campaign on behalf of an SMB. The RL Platform is a software-based solution that combines back-end automation and optimization technologies to manage advertising spend across a broad array of online publishers and media outlets. For advertisers interested in search engine marketing, the RL Platform automates the build-up of keyword search criteria for the leading search engines using a library of approximately 12 million keywords. The RL Platform matches, sets and optimizes the bids for these keywords based on the SMB’s products and services as well as the SMB’s targeted geographic areas. For advertisers interested in display advertising, the RL Platform places display advertisements on websites selected in accordance with an SMB’s target geographic, demographic and behavioral profiles. For advertisers seeking social media and web presence solutions, the RL Platform integrates with leading social media sites, such as Facebook and Twitter. |
| • | Do It Better Than I Can: Efficient and Optimized Buying. The RL Platform runs a set of proprietary algorithms multiple times a day to evaluate each publisher and each keyword and dynamically shifts spend to continuously optimize and improve the performance of our SMBs’ campaigns. We have run tens of thousands of online marketing campaigns for SMBs, and this scale and experience in purchasing online advertising from publishers allows us to make more efficient and effective purchasing decisions on behalf of our clients. |
| • | Prove It: Calls, not Just Clicks. We employ a proprietary reverse proxy technology that automatically tracks campaign-generated activity, such as phone calls, e-mails and site navigation, without requiring the SMB to alter its website or maintain a separate website. SMBs can log in to the RL Platform to monitor their advertising spend on a daily basis and determine, for example, which online campaign generated which phone call. In addition, the RL Platform allows the SMB to use reverse lookup technology to see who called and provides a recording of each phone call. The ability of our RL Platform to allow SMBs to track accurately offline activity — principally phone calls — is a critical source of differentiation from available self-service online advertising platforms, which currently provide SMBs no data regarding offline activity. |
Each of our products includes, through a single budget, access to multiple publishers, some of which are not available to SMBs, as well as access to our proprietary optimization and tracking technologies that dynamically adjust the publishers to which we allocate clients’ media spend in order to meet their performance objectives. For these reasons, while we rely on third-party publishers for the substantial majority of the media we purchase on behalf of our clients, we are not simply a reseller of media; rather, we market our products as a complete package of media optimized for the client using our RL Platform.
The Distribution Solution
Our distribution solution is built around a direct, locally based sales force of IMCs who, empowered by the RL Platform, engage with our clients to help them achieve their marketing objectives in the consultative manner to which SMBs are accustomed.
3
Table of Contents
The key characteristics of our IMC sales force are as follows:
| • | Internet-Focused and Trained. Our IMCs are 100% focused on selling Internet-based advertising products. This exclusive focus is unlike the sales forces of existing offline media companies that cross-sell online and offline advertising, often with an inherent bias towards their own offline products. |
| • | Locally Based. Our 665 IMCs are located in 47 markets in North America, Australia, the United Kingdom and Germany where their clients are based, enabling them to provide the personal connection that is necessary for the IMC to develop and maintain a relationship with our clients. In our experience, our Direct Local clients, a substantial majority of which we calculate spend from $500 to $3,000 per month, require face-to-face interaction that is consistent with the way the SMB has historically purchased offline media. |
| • | Consultative. Our IMCs are trained to consult with, educate and guide SMBs through the opportunities arising from and mechanics of purchasing online advertising. |
In addition, we have a separate sales channel targeting national brands with operations in multiple local markets and select third-party agencies and resellers.
We believe that the ReachLocal solution, a combination of technology and human capital, gives our SMB clients access to technology and media that they could not access by themselves, and we prove that it works in ways they understand. We allow SMBs to write a single check while we do the rest.
The ReachLocal Advantage
We have been a pioneer in addressing the needs of SMBs seeking local Internet advertising solutions and have focused solely on this market for more than six years.
Scale and Experience
We have run tens of thousands of online marketing campaigns for SMBs. Our scale and experience in purchasing online advertising from publishers allows us to make more efficient and effective purchasing decisions on behalf of our clients. In addition, the RL Platform enables us to connect our SMB clients to a wide array of online publishers. Our platform not only allows us to expand the reach of our publisher network, but also allows us quickly to test and identify better performing advertising options for our clients. In addition, our leadership position in the local Internet advertising market provides us with the ability to attract and retain as IMCs experienced local salespeople who understand the transformative power of the Internet.
Client Relationships
Our IMCs establish a direct relationship with SMB clients. In 2010 and 2009, we generated 75% and 70%, respectively, of our revenue through our Direct Local channel. As new online advertising opportunities emerge, such as mobile, video and social media, we believe that having a direct client relationship will enable us to offer additional products and services to our clients. We are able to leverage both our sales force and the collective purchasing power of our SMB clients for the mutual benefit of our clients and third-party publishers. We provide publishers with no or a limited sales force access to SMB clients, which, in turn, enables us to offer our SMB clients advertising opportunities that they would not be able to obtain on their own. We believe that adding more publishers will attract additional advertisers which, in turn, will attract still more publishers.
Technology
Running thousands of SMB online advertising campaigns simultaneously across multiple publishers poses significant technical challenges. While technologies exist to help larger companies manage and optimize their online marketing spend, we believe that such solutions are too expensive and too complex to scale down to the typical SMB’s monthly advertising budget. We have built our services, systems and networks for maximum scalability and flexibility to manage these types of campaigns, and we have invested heavily in automation technologies that reduce the level of human intervention required to support these campaigns. This automation is critical to our ability to scale our business and deliver moderately budgeted campaigns in a cost-effective manner. We continually strive to develop technologies that allow us to improve the match of our solutions to the demands of our SMB clients. For example, our development of our reverse proxy technology has opened up a new way for SMBs to track and understand the tangible results of their online advertising, enabling us to incorporate offline conversion events, such as phone calls, into the optimization of the client’s online marketing campaign. As we continue to gather online and offline conversion data from marketing campaigns conducted through our RL Platform, we will continue to refine our operations to increase efficiencies and generate better results for our SMB clients.
4
Table of Contents
Our Strategy
We believe that we are in the early stages of a large and long-term business opportunity presented by the shift of local marketing budgets from traditional media formats to digital media formats. Our strategy for pursuing this opportunity includes the following key components:
| • | Continue Investment in Growing our IMC Sales Force. We intend to continue to increase the size of our IMC sales force and the geographic footprint of our operations. We expect domestic and international expansion of our IMC sales force in both existing and new markets to be a key driver of growth for our business. |
| • | Increase IMC Productivity. We intend to continue to invest in our service delivery model to provide our IMCs with additional capacity to manage and acquire more advertisers. For example, we have invested in expanding our existing customer support team to include campaign performance personnel, who have assumed many of the day-to-day campaign management obligations of our IMCs. |
| • | Expand Media Offerings. We intend to continue expanding the number of media options available to our SMB clients. Through the launch of the RL Media Xchange, we have developed a platform that enables us more easily to connect our SMB advertisers to a broader array of online publishers and, in the future, to reach customers through new formats such as mobile and video. Our plan is to be able to fulfill, track and optimize an SMB’s entire digital media plan, regardless of media property or format. |
| • | Develop Complementary Products in Adjacent Digital Marketing Segments. Our current products target our clients’ needs to acquire customers through online media buying. We believe that there will be continued movement towards digital platforms in the other segments of an SMB’s marketing activities, such as digital presence, reputation management, lead optimization and local deal commerce. To address these and other needs, we plan to continue investing in the internal development or potential acquisition of products and services in these adjacent segments. For example, with the technology acquired through the SMB:LIVE Corporation (“SMB:LIVE”) and DealOn acquisitions, we have launched ReachCast, our digital presence and reputation management solution, and entered the local deals marketplace. |
Products and Services
We offer a comprehensive suite of SMB-focused online marketing and reporting solutions, including search engine marketing, display advertising, remarketing, digital presence and online marketing analytics, all of which run on our RL Platform.
| • | ReachSearch. Our ReachSearch product is focused on assuring that our clients’ advertisements appear prominently among the search results when local consumers enter certain keywords on leading local search sites such as Google, Yahoo! and Microsoft. The RL Platform is directly integrated into the advertising platforms of these and other leading search engines via APIs. In addition, as part of the ReachSearch product, our SMB clients also receive placement in the search results of our extensive network of online publishers and directory sites called the ReachLocal Search Network. This network provides additional qualified local traffic to the SMB and allows the SMB to reach potential customers across a broader range of sites. |
The RL Platform automatically matches keywords for a business’ products or services through its extensive category taxonomy and keyword library, and its optimization engine dynamically adjusts keyword-level bids based on which keywords at which publishers are driving the most online leads and phone calls at the lowest price. Based on the SMB’s business and targeted geographic area, the RL Platform automatically paces the SMB’s target monthly budget and allocates and optimizes that budget across search publishers. Our ReachSearch product was introduced in 2004.
| • | ReachDisplay. Our ReachDisplay product is primarily focused on maximizing the exposure for an SMB that wants to broadcast a message to a specific target online audience. There are various ReachDisplay products that allow an SMB to target different demographic, vertical and behavioral customer segments. For general exposure in a specific geographic area, the ReachDisplay Awareness package provides the SMB with reach across a network of sites. For advertisers wishing to target by vertical or by specific customer behavior, we offer additional display packages. For example, the ReachDisplay Automotive package provides SMBs in the automotive vertical access to audiences visiting automotive sites as well as customers whose previous behavior indicates that they may be in the market to purchase a car. We offer more than 20 different display advertising products across a wide variety of publishing partners, including Yahoo!/Right Media, Google Display Network, Collective Media and Facebook. Our ReachDisplay product was introduced in 2009. |
| • | ReachRemarketing. Our remarketing product allows us to target consumers who have previously visited a specific SMB client’s website, either through a ReachSearch campaign or a ReachDisplay campaign. When the potential customer visits any other site within our remarketing network, we can remarket to the target customer on behalf of that SMB. Because many purchases from local merchants involve an extended research process, providing the SMB with the ability to stay in front of a potential customer who has expressed an initial interest can lead to sales that might not have resulted from a single advertising impression. Our remarketing product, which we introduced in 2009, can be purchased on a standalone basis or can be bundled into the ReachSearch and ReachDisplay product lines. |
5
Table of Contents
| • | ReachCast. ReachCast combines a proprietary technology platform with an expert service team to help SMBs build and optimize their Web presence for the purpose of driving online search discovery, powering reputation management, and managing social media marketing. As part of the ReachCast service, each SMB is partnered with an expert Web Presence Professional or “WPP”, who works directly with the business to develop a strategy to meet their specific goals, starting with a consultation and initial setup of ReachCast and presence creation across Google, Facebook, Twitter and local directories. Then in consultation with the business, the WPP regularly creates and publishes custom content, posts to social media sites, engages with fans and followers, and monitors online reputation. |
| • | TotalTrack, TotalLiveChat, TotalVideoNow, TotalBannerNow. As part of our mission to provide a comprehensive suite of digital marketing solutions to SMBs, we have developed various products to address specific marketing needs, such as lead optimization, online analytics and digital creative solutions. |
Underlying our key products is the ReachLocal Xchange, or the RL Xchange. The RL Xchange consists of the RL Media Xchange and the RL Solutions Xchange. Introduced in 2009, the RL Media Xchange is a platform that allows us to test and offer additional online media buying options to our SMB clients. The RL Media Xchange provides a standardized web interface and API for media publishers to create and present media offers to our IMCs, agencies and resellers and report back to us on the performance of the campaigns they are running. We then import that information into the same platform that our clients use to view the reports for all of their campaigns. The RL Media Xchange allows us to provide our clients access to media publishers they would not be able to access on their own, and it provides online publishers with the ability to access the fragmented SMB market through a common platform.
Starting in late 2010, we have also extended our product vision to include consumer web sites with a local market focus. In November 2010, Bizzy launched in beta a personalized local business recommendation engine for consumers. Bizzy, based on consumer inputs, derives a set of recommendations for local businesses from people who have evidenced similar interests. In February 2011, we acquired DealOn. With DealOn, we acquired a local deals business that operates in 18 markets across the United States, in addition to a product suite including the DealOn.com destination site, a white-label and co-branded deals platform allowing online publishers to offer deals to their customers, and the recently launched OfferEx deal exchange which enables other deal sites and publishers to supply and/or resell deals through an exchange. In 2011, we expect that Bizzy will also be a forum for offering local deals through the DealOn platform.
Distribution
We distribute our products and services directly though our sales force of IMCs, who are focused on serving SMBs in their local markets, as well as a separate sales force targeting national brands with operations in multiple local markets and select third-party agencies and resellers.
Internet Marketing Consultants
Our IMCs sell our services directly to our SMB clients through an in-person, consultative sales process. Over time, an individual IMC can build a valuable relationship with his or her clients by delivering measurable results via the RL Platform. Our IMCs are trained to explain the benefits of a digitally focused marketing strategy to SMBs which are generally preoccupied with operating and managing their businesses. As an IMC develops a portfolio of SMB clients, the IMC is responsible for calling on and maintaining contact with each client, working with each client to evaluate the performance of its digital campaigns and discussing available options and opportunities to extend or expand each client’s digital spend strategy.
At December 31, 2010, we employed 559 IMCs in North America and an additional 106 IMCs internationally. Our IMCs are located in 47 markets in North America, Australia, the United Kingdom and Germany.
We make a significant investment in the hiring, training and ongoing support of our IMCs while they develop a portfolio of SMB clients. Our IMC development program divides IMCs into two groups: Underclassmen, which consists of IMCs during their first 12 months of employment; and Upperclassmen, which consists of IMCs with more than 12 months of employment. Increasing the number of our IMCs has been the principal engine for our growth. In particular, our growth is driven by the increase in the number of Upperclassmen, who are significantly more productive than our Underclassmen. Our recruitment, training and performance system is designed with the objective of increasing the number of our Upperclassmen over time and increasing the percentage of Underclassmen who become Upperclassmen.
At December 31, 2010, we had 379 Underclassmen and 286 Upperclassmen. We have created a system to identify and develop our Underclassmen into Upperclassmen, key elements of which include:
| • | Recruitment. We invest heavily in recruiting our sales force and have developed an in-house team of specialized recruiters. Typically, each month we hire one to two classes of 20 - 30 IMCs, with the hiring weighted towards the first 10 |
6
Table of Contents
| months of the year. IMC recruits are generally required to have at least three to five years of sales experience, preferably serving the SMB market. We generally seek experience selling online advertising and require that all IMC hires be technically proficient. Although many recruits come from traditional media companies where they have sold to the SMB market, we seek IMCs who understand the transformative power of the Internet and who have seen, first hand, the flow of advertising dollars online. |
| • | Training. Each IMC attends a mandatory one week boot camp training session at our sales headquarters in Plano, Texas or, for international IMCs, a similar boot camp closer to their principal office locations. During the week, IMCs learn our business model and their responsibilities in it, learn the fundamentals of search engine and display marketing and social media and reputation management, and are trained on the RL Platform and our suite of products. Once an IMC returns to his or her specific office, the IMC engages in a standard onboarding process that includes hands-on instruction in prospecting SMB clients, scheduling and tracking appointments, and developing presentations for prospective clients. During the remainder of their first 12 months, Underclassmen are required to participate in ongoing training sessions that include general industry updates, RL Platform updates and presentations from Upperclassmen who provide guidance on how to sell to and serve specific SMB verticals. |
| • | Focus on Performance. In order to track performance and underscore expectations, Underclassmen are provided a roadmap of expected performance milestones and receive constant support and counseling during this period to assist them in meeting the milestones and otherwise building a portfolio of SMB clients. We also use this support system to identify and try to remediate any problems if an IMC’s performance deviates too far from expected revenue contributions. |
With each new class of IMCs, we track how the IMCs are performing relative to a standard level of revenue growth and other performance metrics for each month after their training. We do not expect all Underclassmen to become Upperclassmen, and our investment decisions anticipate the cost of attrition. We maintain data on the past and current performance of our IMCs, which we use as a basis for our hiring decisions. The performance of past and current IMCs allows us to adjust our investment model in the event there are significant changes in macroeconomic or competitive conditions.
National Brands, Agencies and Resellers
We have a separate sales force targeting national brands with operations in multiple local markets as well as a number of third-party agencies and resellers. The sales process for national brands can differ from the process employed by our IMCs and often requires an endorsement by, and potentially a direct financial contribution from, the parent entity such as a franchisor. If a local operation of one of our national brands requires face-to-face contact with a local sales representative, we are able to offer one of our IMCs to service that local operation.
In addition, we sell and provide access to our RL Platform to select third-party agencies and resellers in customer segments where they have a sales force with established relationships with their SMB client base. We currently have over 360 agencies and resellers actively selling on our RL Platform. We have a team that is responsible for identifying potential agencies and resellers, training their sales forces to sell our products and services and supporting the relationships on an ongoing basis.
Customer Service
Our customer service organization is responsible for providing ongoing support to our sales forces, advertisers and resellers, including technical assistance with the use of the RL Platform, as well as providing product- and campaign-specific technical assistance and recommendations to our SMB clients.
We also field an advanced campaign management team that is responsible for reviewing larger budget accounts and optimizing the overall performance of the products on a category-by-category level. Our RL Platform has a set of administrator-only tools that is used by the campaign management team to efficiently evaluate the success of ongoing campaigns and to recommend ways for our clients to improve their performance.
With a combination of employees in the United States and India, we have a dedicated team focused on the provisioning and review of campaigns before they are deployed. This team is responsible for reviewing the keywords that are automatically generated by the RL Platform, ensuring that the creative aspects of the campaign and editorial standards conform to best practices and overseeing the reverse proxy services for our clients. This team employs automated tools to increase the number of campaigns that can be provisioned per person per day.
Our team of Web Presence Professionals is responsible for the delivery of the ReachCast service, which includes creating and publishing custom content, posting to social media sites, engaging with fans and followers, and monitoring online reputation.
Technology Operations
Our RL Platform is hosted in various data centers. Our primary data center hardware is co-located in El Segundo, California. We also maintain smaller regional data centers in Ashburn, Virginia; London, England; and Sydney, Australia. We also have a
7
Table of Contents
business continuity and disaster recovery data center hosted in Chandler, Arizona. All facilities employ around-the-clock security personnel, video surveillance and monitoring and are serviced by onsite electrical generators and fire detection and suppression systems. All facilities also have multiple Tier 1 connections to the Internet. We continuously monitor the performance and availability of our products and have well documented procedures to respond to incidents. In addition, we utilize cloud computing providers for certain of our products and services.
We architect our applications to enable us to scale our operations quickly while reducing deployment costs. We have a highly-available, scalable infrastructure that employs hardware load-balancers, redundant interconnected network switches and firewalls, replicated databases and fault-tolerant storage devices.
Product and Technology Development
We devote a substantial portion of our resources to developing new solutions and enhancing existing solutions, conducting product testing and quality assurance testing and improving core technology. We have teams of product and engineering professionals located in various locations in the United States and India.
Intellectual Property
Our success and ability to compete is dependent in part on our ability to develop and maintain the proprietary aspects of our technology and operate without infringing upon the proprietary rights of others. We have patent applications pending on some of our technology, but rely primarily on a combination of copyright, trade secret and trademark laws, confidentiality procedures, contractual provisions and other similar measures to protect our proprietary technology and information. Among other practices, we enter into confidentiality agreements with our employees, consultants and business partners, and we control access to and distribution of our proprietary information.
On an ongoing basis, we consider trademark registration for some of our product names, slogans and logos in the United States and in some foreign countries. ReachLocal and TotalTrack are registered U.S. trademarks. We have registered ReachLocal as a trademark in Australia, Canada, the European Union, India and Japan. ReachSearch, ReachDisplay, ReachCast, and Bizzy are other trademarks of our company.
We are the registrant of the Internet domain name for our websites as well as for our proxy services, in addition to the international extensions of those domains. The information on, or accessible through, our websites does not constitute part of, and is not incorporated into, this Annual Report.
Customers
We currently primarily sell to SMB advertisers, national brands, and agencies and resellers. No single advertiser, national brands, or agency or reseller represents more than 10% of our total consolidated revenue.
Competition
The market for local online advertising solutions is intensely competitive and rapidly changing, and with the introduction of new technologies and market entrants, we expect competition to intensify in the future. Many of our current and potential competitors enjoy substantial competitive advantages, such as greater name recognition, longer operating histories and larger marketing budgets, as well as substantially greater financial, technical and other resources. In addition, many of our current and potential competitors have established marketing relationships and access to larger customer bases.
Our competitors include:
| • | Internet Marketing Providers. We compete with large Internet marketing providers such as Google, Yahoo! and Microsoft. These providers typically offer their products and services through disparate, online-only, self-service platforms. We compete with these companies on the basis of our IMC sales force, our product offerings and our publisher-agnostic services to our clients. Although we compete against the self-service offerings of these large providers, we also have business relationships with them and we believe we are an important customer for their locally-targeted search inventory. We also believe that we provide a valuable service to these companies by connecting them to a large number of SMBs, which are generally disinclined to purchase online advertising via self-service platforms. |
| • | Traditional, Offline Media Companies. We compete with traditional yellow page and newspaper companies with large, direct sales forces. While these traditional media companies have made investments to address the migration of advertising expenditures away from their existing print products, we believe that they face the prospect of cannibalizing their existing higher margin products that they own and the challenge of re-training and restructuring their sales forces, most of whom have only sold print products and many of whom still receive the majority of their income from selling those products. We compete with these companies on the basis of the strength and breadth of our technology platform and product offering and our focus exclusively on Internet advertising. |
| • | Other SMB Marketing Providers. We also compete with technology companies providing online marketing platforms focused on the SMB market, as well as new market entrants, such as Groupon and LivingSocial, which are actively focused on new forms of online marketing solutions for SMBs and building significant direct sales forces. We compete |
8
Table of Contents
| with these companies based on our scale, technological platform, breadth of product suite, size and geographic scope of our IMCs and established publisher relationships. |
Government Regulation
We are subject to general business regulations and laws as well as regulations and laws specifically governing the Internet. Existing and future laws and regulations may impede the growth of the Internet or other online services. These regulations and laws may cover taxation, tariffs, user privacy, data protection, pricing, content, copyrights, distribution, electronic contracts and other communications, consumer protection, broadband residential Internet access and the characteristics and quality of services. It is not clear how existing laws governing issues such as property ownership, sales and other taxes, libel and personal privacy apply to the Internet. Unfavorable resolution of these issues may substantially harm our business and operating results.
Employees
At December 31, 2010 we had 1,101 employees in North America and 280 employees outside of North America. None of our employees are represented by labor unions. We believe that relations with our employees are good.
Available Information
We file reports with the Securities and Exchange commission (the “SEC”), including annual reports on Form 10-K, quarterly reports on Form 10-Q, current reports on Form 8-K and any other filings required by the SEC. We make available free of charge in the investor relations section of our corporate website (http://investors.reachlocal.com) our annual report on form 10-K, quarterly reports on form 10-Q, current reports on form 8-K, and all amendments to those reports as soon as reasonably practicable after such material is electronically filed with or furnished to the SEC. References to the Company’s corporate website address in this report are intended to be inactive textual references only, and none of the information contained on our website is part of this report or incorporated in this report by reference.
The public may read and copy any materials we file with the SEC at the SEC’s Public Reference Room at 100 F Street, NE, Washington, DC 20549. The public may obtain information on the operation of the Public Reference room by calling the SEC at 1-800-SEC-0330. The SEC maintains an Internet site (http://www.sec.gov) that contains reports, proxy and information statements, and other information regarding issuers that file electronically with the SEC.
You should carefully consider the risks described below and the other information in this Annual Report on Form 10-K.
Risks Related to Our Business
We are an early stage company in an emerging market with an unproven business model and a limited operating history, which makes it difficult to evaluate our current business and future prospects and may increase the risk of your investment.
We have only a limited operating history, and our current business and future prospects are difficult to evaluate. We commenced operations in late 2004. We have developed a strategy for taking advantage of what we believe is a shift of local marketing budgets from traditional media formats to digital media formats, but we cannot assure you that our strategy will not fail or prove less successful than other approaches. You must consider our business and prospects in light of the risks and difficulties we encounter as an early stage company in the new and rapidly evolving online marketing industry. These risks and difficulties include:
| • | our new and unproven business model; |
| • | maintaining the effectiveness of our RL Platform, and adapting our technology to new market opportunities and challenges; |
| • | our limited number of product offerings and risks associated with developing and selling new product offerings; |
| • | continuing to attract new SMB clients, many of whom have not previously advertised online and may not understand the value to their businesses of our products and services; and |
| • | effectively managing rapid growth in our sales force, personnel and operations. |
Failing to successfully address these challenges or others could significantly harm our business, financial condition, results of operations and liquidity.
We have incurred significant operating losses in the past and may incur significant operating losses in the future.
As of December 31, 2010 we have an accumulated deficit of approximately $16.0 million, and we expect to incur net operating losses for the foreseeable future. We expect our operating expenses to increase in the future as we expand our operations. Our business strategy contemplates hiring significant numbers of additional IMCs, both in new and existing markets, as well as making substantial investments in new and existing products, which will require significant expenditures. In addition, as a public company, we incur significant additional legal, accounting and other expenses that we did not incur as a private company. If our revenue does not grow to offset these increased expenses, we will not be profitable. We also expect that a variety of factors, including increased competition and the maturation of our business, will cause our revenue growth rate to decline in the future, and we cannot assure you that our revenue will continue to grow or will not decline. As a result, you should not consider our historical revenue growth as indicative of our future performance. Furthermore, if our operating expenses exceed our expectations, our financial performance will be adversely affected.
We purchase most of our media from Google, and our business could be adversely affected if Google takes actions that are adverse to our interests. Similar actions from Yahoo!, Microsoft and other media providers could adversely affect our business, though to a lesser degree.
Nearly all of our cost of revenue is for the purchase of media, and a substantial majority of the media we purchase is from Google. Google accounts for a large majority of all U.S. searches, and Google’s share in foreign markets is often even greater. As a result, we expect that our business will depend upon media purchases from Google for the foreseeable future. This dependence makes us vulnerable to actions that Google may take to change the manner in which it sells AdWords, as described below, or conducts its business on a number of levels:
| • | Google Can Choose to Change the Terms and Conditions Upon Which it Does Business with Us. Google can act unilaterally to change the terms and conditions for our purchase of media, and Google has done so in the past. In July 2010, Google announced new reporting requirements for companies such as ours, which took effect in February 2011. These new requirements require, among other things, monthly reporting to our clients of AdWords costs, clicks, and impressions. Because this policy only recently took effect, we cannot at this time fully assess the degree to which Google’s |
9
Table of Contents
| imposition of this policy will affect our business. In addition, future changes by Google to the terms and conditions upon which we purchase media could materially and adversely affect our business. |
| • | Competitive Risk. Google offers its products directly to SMBs through an online self-service option. Google enjoys substantial competitive advantages over us, such as substantially greater financial, technical and other resources. In addition, Google continues to launch products that are targeted directly at SMBs, which Google does not always make available to third parties. While we cannot assess at this time the effect of Google’s offering such products directly to SMBs, the prices charged by Google for direct service are lower than the prices we charge for the same media. |
| • | Technology Risk. Our RL Platform interacts with Google through publicly available application programming interfaces, or APIs. If Google were to discontinue the availability of all or a portion of these APIs to us, we may have to change our technology, incur additional costs or discontinue certain products or services that we currently offer our clients. Any of these changes could adversely affect our ability to provide effective online marketing and reporting solutions to our clients. In addition, Google may decide to alter the amount it charges us for the right to use its APIs, which would decrease our gross margin absent any change in our pricing to our customers. |
| • | Editorial Control. Google closely monitors the experience of end-users, and from time-to-time its editorial personnel request that companies alter their services based on Google’s determination that aspects of such services could adversely affect the end-user experience. For example, each of our media products includes TotalTrack, a tracking service powered by our proprietary reverse proxy technology. If Google were to determine that the tracking URLs utilized by our TotalTrack service adversely affects the end-user’s experience, Google could require us to alter or suspend the way we implement our tracking solutions. Such a change would significantly decrease our ability to optimize our clients’ advertising campaigns and limit our ability to provide the level of campaign performance reporting that we currently provide to our clients. |
| • | Rebate/Incentive Risk. Google retains broad authority with respect to its rebate programs and has, from time to time, canceled rebate programs. For example, effective December 31, 2008, Google terminated a publisher rebate provided as part of its North American Authorized AdWords Reseller program, which was the primary reason that our cost of revenue as a percentage of revenue increased from 52.8% in 2008 to 54.5% in 2010. Google also has, and may in the future, impose requirements to allocate a specific percentage of our search revenue to Google in order for us to qualify for preferential access, rebates or other financial incentives. |
In addition, any new developments or rumors of developments regarding Google’s business practices that affect the local online advertising industry may create perceptions with our customers or investors that our ability to compete has been impaired.
The above risks also apply to other publishers from whom we purchase media, including Yahoo! and Microsoft. In particular, the combination of the Microsoft and Yahoo! search engine advertising platforms in the fourth quarter of 2010 in North America has resulted in a reduction in the aggregate amount of publisher rebates that we have historically received from each of those companies, and for 2011 we expect that this combination will continue to result in an overall reduction in rebates as a percentage of total spend with these publishers.
We purchase a significant majority of our media from Google, Yahoo! and Microsoft in an auction marketplace. If we are unable to purchase media from any one of these companies, if prices for media significantly increase or if the manner in which the media is sold changes, our business could be adversely affected.
Our success depends on our ability to purchase media from Google, Yahoo!, and Microsoft at reasonable prices so that we can provide our clients with a reasonable return on the advertising expenditures they make through us. We generally purchase this media in an auction marketplace. Increased competition or other factors may cause the cost of the media that we purchase from Google, Yahoo! and Microsoft to rise. In particular, if our expectation that local SMB advertising will increasingly migrate to the Internet is correct, the marketing budget available to bid in these auctions will increase and the price of media may increase substantially. An increase in the cost of media in these marketplaces without a corresponding increase in our media buying efficiency could result in an increase in our cost of revenue as a percentage of revenue even if our business expands. In addition, such an increase could result in an increase in the prices we must charge our clients or a decrease in our ability to fulfill our clients’ service expectations. Furthermore, the Internet search companies that operate these media marketplaces may change the operating rules or bidding procedures in ways that decrease the effectiveness of the technology that we use to optimize our purchases or otherwise prevent us from purchasing media at reasonable prices or at all. Any change in our ability to provide effective online marketing campaigns to our clients may adversely affect our ability to attract and retain clients.
Failure to adequately recruit, train and retain our Internet Marketing Consultants would impede our growth and could harm our business, operating results and financial condition.
10
Table of Contents
Our ability to maintain or grow revenue and achieve profitability will depend, in large part, on increasing the size of our direct sales force of IMCs. We divide our IMCs into two groups: Underclassmen, who are IMCs during their first 12 months of employment, and Upperclassmen, who are IMCs with more than 12 months of employment. Generally, Upperclassmen are more productive than Underclassmen and generate revenue in excess of direct and allocable costs, while Underclassmen do not. Accordingly, we rely on the success of our Upperclassmen to fund our investment in Underclassmen. As we attempt to achieve larger scale in our business, if our Upperclassmen are not as successful as we anticipate, or if our Underclassmen do not successfully develop into productive Upperclassmen, our ability to grow revenue will suffer, our costs may increase and we may not ever become profitable. We assume a certain level of attrition when we hire new Underclassmen. We base that assumption on our historical experience and future expectations, and our assumptions may prove wrong. If our IMC attrition is greater than anticipated, our business will be harmed. In addition, as more companies seek to capitalize on the shift to online media, competition for knowledgeable and qualified online media sales personnel will increase. Moreover, employees that we hire from our competitors have in the past and may in the future be subject to claims of breach of noncompetition and non-solicitation obligations owed to their former employers, which could impact our ability to attract and hire high-quality candidates and potentially subject us to litigation. If we are unable to effectively recruit, train and retain IMCs, we may not be able to grow our sales force, our revenue may suffer or our costs may increase.
The market in which we participate is intensely competitive, and if we do not compete effectively, our operating results could be harmed.
The market for online marketing solutions is intensely competitive and rapidly changing, and with the emergence of new technologies and market entrants, we expect competition to intensify in the future.
Our competitors include:
| • | Internet Marketing Providers. We compete with large Internet marketing providers such as Google, Yahoo! and Microsoft. These providers typically offer their products and services through disparate, online-only, self-service platforms. |
| • | Traditional, Offline Media Companies. We compete with traditional yellow page, newspaper, television and radio companies that, in many cases, have large, direct sales forces. |
| • | Other SMB Marketing Providers. We also compete with technology companies providing online marketing platforms focused on the SMB market, as well as new market entrants, such as Groupon and LivingSocial, which are actively focused on new forms of online marketing solutions for SMBs and building significant direct sales forces. |
Many of our current and potential competitors enjoy substantial competitive advantages, such as greater name recognition, longer operating histories, substantially greater financial, technical and other resources and, in some cases, the ability to combine their online marketing products with traditional offline media such as newspapers or yellow pages. These companies may use these advantages to offer products similar to ours at a lower price, develop different products to compete with our current solutions and respond more quickly and effectively than we can to new or changing opportunities, technologies, standards or client requirements. In particular, if major Internet search companies such as Google, Yahoo! and Microsoft decide to devote greater resources to develop and market online advertising offerings directly to SMBs, greater numbers of our clients and potential clients may choose to purchase online advertising services directly from these competitors, particularly if and as the ease of their self-service models increases. In addition, many of our current and potential competitors have established marketing relationships with and access to larger client bases and are heavily investing in recruiting sales personnel, which might affect our ability to achieve our IMC hiring targets. As the market for local online advertising increases, we expect new competitors, business models and solutions to emerge, some of which may be superior to ours. We also believe that the marketplace for online media is more transparent than other media marketplaces. Our competitors may use information available to them to price their products at a discount to the prices that we currently offer. Even if our online marketing and reporting solutions are more effective than those offered by our competitors, potential clients might adopt competitive products and services in lieu of purchasing our solutions. For all of these reasons, we may not be able to compete successfully against our current and potential competitors.
We depend on key personnel to operate our business, and if we are unable to retain our current personnel or hire additional personnel, our ability to develop and successfully market our business could be harmed.
We believe that our future success is highly dependent on the contributions of our executive officers, as well as our ability to attract and retain highly skilled managerial, sales, technical and finance personnel. Qualified individuals are in high demand, and we may incur significant costs to attract them. All of our U.S. officers and other U.S. employees are at-will employees, which means they may terminate their employment relationship with us at any time, and their knowledge of our business and industry would be extremely difficult to replace. If we are unable to attract and retain our executive officers and key employees, our business, operating results and financial condition will be harmed. In addition, our management team has a long history of working together, and we believe that our key executives have developed highly successful and effective working relationships. If one or more of these individuals leave, we may not be able to fully integrate new executives or replicate the current dynamic, and our operations could suffer.
11
Table of Contents
Volatility or lack of performance in our stock price may also affect our ability to attract and retain our key employees. Our executive officers have become vested in a substantial amount of stock or stock options. Employees may be more likely to leave us if the shares they own or the shares underlying their options have significantly appreciated in value relative to the original purchase prices of the shares or the exercise prices of the options, or if the exercise prices of the options that they hold are significantly above the market price of our common stock.
The impact of worldwide economic conditions, including the resulting effect on advertising budgets, may adversely affect our business, operating results and financial condition.
Our performance is subject to worldwide economic conditions and their impact on levels of advertising. We believe that continuing economic difficulties have adversely affected our business. We responded to the recession that commenced in late 2008 by reducing the number of IMCs we hired in early 2009, which resulted in a decline in our Upperclassmen headcount in the first quarter of 2010. We also believe that the recession adversely impacted IMC productivity and contributed to a decrease in our National Brands, Agencies and Resellers revenue in 2009. We believe the economic conditions in the United States remain challenging.
To the extent that economic difficulties continue, or worldwide economic conditions materially deteriorate, our existing and potential clients may no longer consider investment in our online marketing solutions a necessity, or may elect to reduce advertising budgets. Historically, economic downturns have resulted in overall reductions in advertising spending. In particular, online marketing advertising solutions may be viewed by some of our existing and potential clients as a lower priority and may be among the first expenditures reduced as a result of unfavorable economic conditions. These developments could have an adverse effect on our business, operating results and financial condition.
If we fail to increase the number of our clients or retain existing clients, our revenue and our business will be harmed.
Our ability to grow our business depends in large part on maintaining and expanding our client base. To do so, we must convince prospective clients of the benefits of our RL Platform and existing clients of the continuing value of our products and services. The online marketing industry is new and rapidly evolving, and many prospective clients may not be familiar with the benefits of online marketing. These businesses may generally favor using more traditional methods of local advertising, such as newspapers or print yellow pages directories. In addition, as the online media options for SMBs proliferate and our clients become more familiar with such options, we cannot assure you that we will be successful in maintaining or expanding our client base.
SMB marketing and advertising campaigns are often sporadic and difficult to predict, as they may be driven by seasonal promotions or business dynamics, evolving product and service offerings, available budgets and other factors. Some SMBs advertise only periodically, such as to promote sales or special offers. Because we need to address these business considerations of our clients, we do not require clients to enter into long-term obligations to purchase our products and services. Many do not renew their campaigns, and some cancel. We must continually add new clients both to replace clients who choose not to renew their advertising campaigns and to grow our business beyond our current client base. A client’s decision not to renew may be based on a number of factors, including dissatisfaction with our products and services, inability to continue operations and spending levels or because their campaigns were event-driven or otherwise intentionally limited in scope or duration. If our clients increasingly fail to fulfill their contracts or increasingly do not renew their advertising campaigns with us, or if we are unable to attract new clients in numbers greater than the number of clients that we lose, our client base will decrease and our business, financial condition and operating results will be adversely affected.
A significant portion of our revenue is generated by our national brands, agencies and resellers. If we are not able to maintain relationships with one or more of them, our sales may suffer and our revenue may decline.
We distribute our products and services through a separate sales force for national brands with operations in multiple local markets, as well as select third-party agencies and resellers. Because these national brands, agencies and resellers generally represent an aggregated group of SMB clients, if our relationship with one or more of these persons or companies were restricted or terminated, our sales would decrease and our revenue would be adversely affected, potentially materially. In addition, our strategy of distributing our products and services to our clients through our Direct Local channel and through our National Brands, Agencies and Resellers channel may result in distribution channel conflicts. Our direct local sales efforts may compete with our third-party agency and resellers and, to the extent different third-party agencies and resellers target the same clients, they may also come into conflict with each other. While we have certain policies in place to address these potential conflicts, there can be no assurance that these channel conflicts will not materially adversely affect our relationship with existing third-party agencies and resellers or adversely affect our ability to attract new third-party agencies and resellers. In the event that any of our relationships with existing third-party agencies and resellers are terminated or we are unable to attract new third-party agencies and resellers as a result of these distribution channel conflicts, our sales may suffer and our revenue may decline.
If SMBs increasingly opt to perform advertising tasks on their own, their demand for our products and services would decrease, negatively affecting our revenue.
12
Table of Contents
Large Internet marketing providers such as Google, Yahoo! and Microsoft offer online advertising products and services through self-service platforms. As SMBs become more familiar with and experienced in interacting online, they may prefer to actively manage their own Internet presence and their demand for our products and services may decrease. We cannot predict the evolving experiences and preferences of SMBs, which may become more fully integrated into digitized modes of commerce and communication, and cannot assure you that we can develop our products and services in a manner that will suit their needs and expectations faster or more effectively than our competitors, or at all. If we are not able to do so, our results of operations would suffer.
Our future success depends in part on our ability to effectively develop and sell additional products, services and features.
We invest in the development of new products and services with the expectation that we will be able to effectively offer them to our clients. For example, in the fourth quarter of 2010, we began the North American rollout of our ReachCast product, which is our full service digital presence platform, and we continued to beta test our Bizzy product, a personalized local recommendation engine. In addition, we plan to develop or potentially acquire other products and services that address new segments of an SMB’s marketing activities. For instance, in February 2011, we acquired DealOn to accelerate our entry into the deal commerce space. Our future revenue depends in part on our ability to stay competitive with our product and service offerings. Our ability to develop and launch new products on our expected timelines, or at all, is subject to numerous risks and uncertainties, such as the difficulties of designing complex software products, achieving desired functionality and integrating the new products with our existing technology.
The sale of new or additional features, products and services, the value or utility of which may be different from our current products and services or less easily understood by our clients, may require increasingly sophisticated and costly sales efforts and increased operating expenses, as well as additional training of our IMCs and education for our SMB clients. New product launches require the investment of resources in advance of any revenue generation. If new products fail to achieve market acceptance, we may never realize a return on this investment. If these efforts are not successful, our business may suffer. Further, many SMBs have modest advertising budgets. Accordingly, we cannot assure you that the successful introduction of new products or services will not adversely affect sales of our current products and services or that our SMB clients will increase their aggregate spending as a result of the introduction of new products and services.
With the evolution of Bizzy in November 2010 into a consumer-facing local business recommendation engine, and the acquisition of DealOn in February 2011, we are making our first foray into the development and dissemination of consumer-facing products and consumer-facing transactions, respectively, which requires different expertise and skills than our core business, which has a predominantly business-to-business focus. Consequently, our introduction of consumer facing products may not be successful, and will expose us to consumer risks that we have not had to previously address.
We expect a number of factors to cause our operating results to fluctuate on a quarterly and annual basis, which may make it difficult to predict our future performance.
Our revenue and operating results could vary significantly from quarter-to-quarter and year-to-year because of a variety of factors, many of which are outside of our control. As a result, comparing our operating results on a period-to-period basis may not be meaningful. In addition to other risk factors discussed in this section, factors that may contribute to the variability of our quarterly and annual results include:
| • | unilateral actions taken by Google or other media providers; |
| • | seasonal variations in advertising budgets and media pricing; |
| • | seasonal variations in IMC hiring; the rate at which SMBs migrate their advertising spending online; |
| • | the timing and stage of product and technology development; |
| • | our ability to appropriately set the price of non-media products; |
| • | our ability to develop, introduce and manage consumer-facing products; |
| • | the impact of worldwide economic conditions on our revenue and expenses; |
| • | our ability to accurately forecast revenue and appropriately plan our expenses; |
| • | the attraction and retention of qualified employees and key personnel; |
| • | the effectiveness of our internal controls; |
| • | our ability to effectively manage our growth; |
| • | the timing of and our ability to enter new markets and manage expansion in new markets; |
| • | our ability to successfully manage any future acquisitions of businesses, solutions or technologies; |
| • | interruptions in service and any related impact on our reputation; |
13
Table of Contents
| • | the impact of fluctuations in currency exchange rates, particularly the relative strength of the US Dollar to the currencies in the countries in which we do business and its impact on our consolidated revenues and results of operations; |
| • | the effects of natural or man-made catastrophic events; and |
| • | changes in government regulation affecting our business. |
As a result of these and other factors, the results of any prior quarterly or annual periods should not be relied upon as indications of our future operating performance. In addition, our operating results may not meet the expectations of investors.
We may be unsuccessful in managing or growing our international operations, which could harm our business, operating results and financial condition.
We currently have international sales operations in Australia, the United Kingdom, Canada and Germany, and campaign support services in India. Revenue from international operations outside North America accounted for 17.1% and 6.7% of total revenue for the years ended December 31, 2010 and in 2009, respectively. Over the long term, we intend to expand our international operations to new markets and countries. We may incur losses or otherwise fail to enter new markets successfully.
Our ability to operate internationally involves various risks, including the need to invest significant resources, the possibility that returns on such investments will not be achieved in the near future and competitive environments with which we are unfamiliar. Our international operations may not prove to be successful in certain or any markets. In addition, we have incurred and expect to continue to incur significant expenses as we attempt to establish our presence in particular international markets. Our current and any future international expansion plans will require management attention and resources and may be unsuccessful. While we entered the German market in the fourth quarter of 2010, our primary focus in international operations has been in English-speaking countries. We, therefore, have limited experience in modifying our technology and selling our solutions in non-English speaking international markets. Furthermore, in many international markets, we would not be the first entrant, and there may exist greater competition with stronger brand recognition than we have faced in our current markets. Different privacy, censorship and liability standards and regulations and different intellectual property laws in foreign countries may cause our business and operating results to suffer.
Our international operations may also fail to succeed due to other risks inherent in foreign operations, including:
| • | difficulties or delays in developing a network of clients in one or more international markets; |
| • | legal, political or systemic restrictions on the ability of U.S. companies to market products and services or otherwise do business in foreign countries; |
| • | international intellectual property laws that may be insufficient to protect our intellectual property or permit us to successfully defend ourselves or our intellectual property in international lawsuits; |
| • | difficulties in staffing and managing foreign operations; |
| • | greater difficulty in accounts receivable collection; |
| • | currency fluctuations or a weakening U.S. dollar, which can increase costs of international expansion; |
| • | potential adverse tax consequences; |
| • | lack of infrastructure to adequately conduct electronic commerce transactions; and |
| • | price controls or other restrictions on foreign currency. |
As a result of these obstacles, we may find it impossible or prohibitively expensive to continue or expand our international operations, which could harm our business, operating results and financial condition.
Growth may place significant demands on our management and our infrastructure.
We have experienced substantial growth in our business. This growth has placed and may continue to place significant demands on our management and our operational and financial infrastructure. As our operations grow in size, scope and complexity, we will need to improve and upgrade our systems and infrastructure to offer an increasing number of clients enhanced solutions, features and functionality. The expansion of our systems and infrastructure will require us to commit substantial financial, operational and technical resources in advance of an increase in the volume of business, with no assurance that the volume of business will increase. Continued growth could also strain our ability to maintain reliable service levels for our clients, develop and improve our operational, financial and management controls, enhance our reporting systems and procedures and recruit, train and retain highly skilled personnel. Managing our growth will require significant expenditures and allocation of valuable management resources. If we fail to maintain the necessary level of discipline and efficiency in our organization as it grows, our business, operating results and financial condition would be harmed.
Our independent registered public accounting firm reported to us that, at December 31, 2010, we had a significant deficiency in our internal controls.
14
Table of Contents
Our independent registered public accounting firm reported to us that, at December 31, 2010, we had a significant deficiency in our internal controls with respect to our processes for calculating the costs to be capitalized for internally developed software. Under standards established by the Public Company Accounting Oversight Board, or PCAOB, a “significant deficiency” is a deficiency, or a combination of deficiencies, in internal control over financial reporting that is important enough to merit attention by those responsible for oversight of the registrant’s financial reporting. A significant deficiency is less severe than a “material weakness,” which the PCAOB defines as a deficiency, or combination of deficiencies, in internal control over financial reporting, such that there is a reasonable possibility that a material misstatement of our annual or interim financial statements will not be prevented or detected on a timely basis.
The significant deficiency with respect to the calculation of capitalized software development costs pertains to our dependence on non-financial personnel and various processes which we use to capture the contemporaneous documentation of how each project meets the criteria for capitalization and the frequency and consistency of collection of estimates used to quantify the costs to be capitalized. We are in the continuing process of remediating this significant deficiency by establishing additional control systems to assure that such contemporaneous documentation is prepared and the frequency of collecting data is increased.
In connection with our 2009 financial statements, our independent registered public accounting firm reported to us that, at December 31, 2009, we also had a significant deficiency in our internal controls with respect to our method of performing the consolidation process for our financial reports. The significant deficiency relating to our consolidation process pertained to our use of multiple spreadsheets and a manual process to effect the consolidation. We have begun the process of remediating this significant deficiency by implementing additional systems to automate a significant portion of the consolidation and reporting process. We are in the process of designing and implementing an Oracle Hyperion financial reporting system that will streamline the financial reporting process and standardize our chart of accounts and financial reporting templates across all of our subsidiaries. As of December 31, 2010, the system has been implemented and continues to be developed and tested.
Our remediation efforts may not, however, enable us to remedy the significant deficiencies or avoid material weaknesses or other significant deficiencies in the future. In addition, this significant deficiency, any material weaknesses and any other significant deficiencies will need to be addressed as part of the evaluation of our internal controls over financial reporting pursuant to Section 404 of the Sarbanes-Oxley Act of 2002 and may impair our ability to comply with Section 404, which will first be applicable to us with respect to our Annual Report on Form 10-K to be filed in 2012.
Our ability to deliver reporting and tracking solutions to our clients depends upon the quality, availability, policies and prices of third-party call tracking providers, website hosting companies and domain registrars.
We rely on third parties to provide our call tracking and recording services. In certain geographies, we rely on a single call tracking provider. In the event the provider were to terminate our relationship or stop providing these services, our ability to provide our tracking services could be impaired. We may not be able to find an alternative provider in time to avoid a disruption of our services or at all, and we cannot be certain that such provider’s services would be compatible with our products without significant modifications or cost, if at all. Our proxy servers, which underlie key elements of our tracking services, require the use of various domains and IP address blocks. If domain registrars, website hosting companies or Internet service providers determined that our use of such domains and IP blocks were in violation of their terms of service or internet policies, such companies could elect to block our traffic. For example, several website hosting companies have blocked traffic from our reverse proxy servers for a group of our SMB clients, resulting in our inability to provide our full tracking services to those clients. Our ability to address or mitigate these risks may be limited. The failure of all or part of our tracking services could result in a loss of clients and associated revenue and could harm our results of operations.
We rely on bandwidth providers, data centers and other third parties for key aspects of the process of providing online marketing solutions to our clients, and any failure or interruption in the services provided by these third parties could harm our ability to operate our business and damage our reputation.
We rely on third-party vendors, including data center, SaaS, cloud computing Internet infrastructure and bandwidth providers. Any disruption in the services provided by these third-party providers or any failure of these third-party providers to handle current or higher volumes of use could significantly harm our business. Any financial or other difficulties our providers face may have negative effects on our business, the nature and extent of which we cannot predict. We exercise little control over these third-party vendors, which increases our vulnerability to problems with the services they provide. We have experienced and expect to continue to experience interruptions and delays in service and availability for such elements. Any errors, failures, interruptions or delays experienced in connection with these third-party technologies and information services could negatively impact our relationship with our clients and adversely affect our brand and our business and could expose us to liabilities to third parties.
Client complaints or negative publicity about our customer service or other business practices could adversely affect our reputation and brand.
Client complaints or negative publicity about our technology, personnel or customer service could severely diminish confidence in and the use of our products and services. Effective customer service requires significant personnel expense, and this expense, if not
15
Table of Contents
managed properly, could significantly impact our operating results. Moreover, failure to provide our clients with high-quality customer experiences for any reason could substantially harm our reputation and our brand and adversely affect our efforts to develop as a trusted provider of online marketing and reporting solutions for the SMB market.
Rapid technological changes may render our online marketing and reporting solutions obsolete or decrease the attractiveness of our solutions to our clients.
To remain competitive, we must continue to enhance and improve the functionality and features of our RL Platform. The Internet, access to the Internet and the online marketing and advertising industry are rapidly changing. Our competitors are constantly developing new products and services in online marketing and advertising. As a result, we must continue to invest significant resources in order to enhance our existing products and services and introduce new products and services that clients can easily and effectively use. If competitors introduce new solutions embodying new technologies, or if new industry practices emerge, our existing technology may become obsolete. Our future success will depend on our ability to:
| • | enhance our existing solutions; |
| • | develop new solutions and technologies that address the increasingly sophisticated and varied needs of our prospective clients; and |
| • | respond to technological advances and emerging industry practices on a cost-effective and timely basis. |
Developing our online marketing and reporting solutions and the underlying technology entail significant technical and business risks. We may use new technologies ineffectively, or we may fail to adapt our RL Platform and network infrastructure to client requirements or emerging industry practices. If we face material delays in introducing new or enhanced solutions, our clients may forego the use of our solutions in favor of those of our competitors.
Future acquisitions could disrupt our business and harm our financial condition and operating results.
Our success will depend, in part, on our ability to expand our offerings and markets and grow our business in response to changing technologies, client demands and competitive pressures. In some circumstances, such as our acquisitions of SMB:LIVE and DealOn, we may determine to do so through the acquisition of complementary businesses, solutions or technologies rather than through internal development. The identification of suitable acquisition candidates can be difficult, time-consuming and costly, and we may not be able to successfully complete identified acquisitions. Furthermore, even if we successfully complete an acquisition, we may not be able to successfully assimilate and integrate the business, technologies, solutions, personnel or operations of the company that we acquired, particularly if key personnel of an acquired company decide not to work for us. In addition, we may borrow to complete an acquisition, which would increase our costs, or issue equity securities, which would dilute our stockholders’ ownership and could adversely affect the price of our common stock. Historically, we have primarily grown organically, rather than through acquisitions. As a result, we have limited experience in identifying and executing acquisition opportunities. Acquisitions may also involve the entry into geographic or business markets in which we have little or no prior experience. Consequently, we may not achieve anticipated benefits of the acquisitions which could harm our operating results.
We may require additional capital to respond to business opportunities, challenges, acquisitions or unforeseen circumstances. If capital is not available to us, our business, operating results and financial condition may be harmed.
We may require additional capital to operate or expand our business. In addition, some of the product development initiatives we have in the early stages of development, such as our deal commerce platform and Bizzy , may require substantial additional capital resources before they begin to generate material revenue. Additional funds may not be available when we need them, on terms that are acceptable to us, or at all. Any debt financing secured by us in the future could involve restrictive covenants relating to our capital raising activities and other financial and operational matters, which may make it more difficult for us to obtain additional capital and to pursue business opportunities, including potential acquisitions. If we do not have funds available to enhance our solutions, maintain the competitiveness of our technology or pursue business opportunities, we may not be able to service our existing clients or acquire new clients, which could have an adverse effect on our business, operating results and financial condition.
Our business is subject to the risks of earthquakes, fires, floods and other natural catastrophic events and to interruption by man-made problems such as computer viruses or terrorism.
Our systems and operations are vulnerable to damage or interruption from earthquakes, fires, floods, power losses, telecommunications failures, terrorist attacks, acts of war, human errors, break-ins and similar events. For example, a significant natural disaster, such as an earthquake, fire or flood, could have a material adverse impact on our business, operating results and financial condition, and our insurance coverage will likely be insufficient to compensate us for losses that may occur. Our servers may also be vulnerable to computer viruses, break-ins and similar disruptions from unauthorized tampering with our computer systems, which could lead to interruptions, delays, loss of critical data or the unauthorized disclosure of confidential intellectual property or client data. We may not have sufficient protection or recovery plans in certain circumstances, such as natural disasters affecting the Los Angeles area, and our business interruption insurance may be insufficient to compensate us for losses that may occur. As we rely
16
Table of Contents
heavily on our servers, computer and communications systems and the Internet to conduct our business and provide high quality customer service, such disruptions could negatively impact our ability to run our business, which could have an adverse affect on our operating results and financial condition.
If our security measures are breached and unauthorized access is obtained to a client’s data, our service may be perceived as not being secure and clients may curtail or stop using our service.
Our service involves the storage and transmission of clients’ proprietary information, such as credit card and bank account numbers, and security breaches could expose us to a risk of loss of this information, litigation and possible liability. Our payment services may be susceptible to credit card and other payment fraud schemes, including unauthorized use of credit cards, debit cards or bank account information, identity theft or merchant fraud.
For example, in April 2010 we experienced a security breach of our Australian platform, which resulted in disruption of advertising campaigns. The breach also required bringing the Australian platform offline for approximately thirty-six hours, which resulted in limitations on customer reporting and delayed implementation of a few new campaigns. While the disruption did not result in any compromise of customer credit card or our internal human resources information, we cannot assure that future breaches will not occur nor that any such breaches will not compromise commercially sensitive data.
If our security measures are breached in the future as a result of third-party action, employee error, malfeasance or otherwise, and as a result, someone obtains unauthorized access to our clients’ data, our reputation will be damaged, our business may suffer and we could incur significant liability. Because techniques used to obtain unauthorized access or to sabotage systems change frequently and generally are not recognized until launched against a target, we may be unable to anticipate these techniques or to implement adequate preventative measures. If an actual or perceived breach of our security occurs, the market perception of the effectiveness of our security measures could be harmed and we could lose sales and clients.
We are subject to a number of risks related to credit card payments we accept. If we fail to be in compliance with applicable credit card rules and regulations, we may incur additional fees, fines and ultimately the revocation of the right to use the credit card company, which would have a material adverse effect on our business, financial condition or results of operations.
A majority of our clients’ campaigns were paid for using a credit card or debit card. For credit and debit card payments, we pay interchange and other fees, which may increase over time and raise our operating expenses and adversely affect our net income. We are also subject to payment card association operating rules, certification requirements and rules governing electronic funds transfers, which could change or be reinterpreted to make it difficult or impossible for us to comply. We believe we are compliant with the Payment Card Industry Data Security Standard, which incorporates Visa’s Cardholder Information Security Program and MasterCard’s Site Data Protection standard. However, there is no guarantee that we will maintain such compliance or that compliance will prevent illegal or improper use of our payment system. If we fail to comply with these rules or requirements, we may be subject to fines and higher transaction fees and lose our ability to accept credit and debit card payments from our clients. A failure to adequately control fraudulent credit card transactions would result in significantly higher credit card-related costs and could have a material adverse effect on our business, financial condition or results of operations.
Our revenue may be negatively affected if we are required to charge sales tax or other transaction taxes on all or a portion of our past and future sales to customers located in jurisdictions where we are currently not collecting and reporting tax.
We generally do not charge, collect or have imposed upon us sales or other transaction taxes related to the products and services we sell, except for certain corporate level taxes and transaction level taxes outside of the United States. However, many states, local jurisdictions or one or more countries may seek to impose sales or other transaction tax obligations on us in the future. A successful assertion by any state, local jurisdiction or country in which we do business that we should be collecting sales or other transaction taxes on the sale of our products or services could result in substantial tax liabilities related to past sales, create increased administrative burdens or costs, discourage clients from purchasing products or services from us, decrease our ability to compete or otherwise substantially harm our business and results of operations. The imposition of new laws requiring the collection of sales or other transaction taxes on the sale of our products or services (or the introduction of new products or services that are subject to existing transaction taxes) could create increased administrative burdens or costs, discourage clients from purchasing products or services from us, decrease our ability to compete or otherwise substantially harm our business and results of operations.
Failure to adequately protect our intellectual property could substantially harm our business and operating results.
Because our business is heavily dependent on our intellectual property, including our proprietary technology, the protection of our intellectual property rights is crucial to the success of our business. We rely on a combination of intellectual property rights, including trade secrets, patent applications, copyrights and trademarks, as well as contractual restrictions, to safeguard our intellectual property. These afford only limited protection. Despite our efforts to protect our proprietary rights, unauthorized parties may attempt to copy aspects of our online marketing and reporting solutions, technology, software and functionality or obtain and use information that we consider proprietary. Moreover, policing our proprietary rights is difficult and may not always be effective. In particular,
17
Table of Contents
because we sell our solutions internationally, we may need to enforce our rights under the laws of countries that do not protect proprietary rights to as great an extent as do the laws of the United States.
Our proprietary technology is not currently protected by any issued patents, and policing our rights to such technology may be hindered if we are unable to obtain any patents. In addition, the type and extent of patent claims that may be issued to us in the future is uncertain, and any patents that are issued may not contain claims that permit us to stop competitors from using similar technology. In light of the costs of obtaining patent protection, at times we may choose not to protect certain innovations that later on prove to be highly important. To the extent that the various technologies underlying any patent applications are determined to be business methods, the law around these types of patents is rapidly developing, and pending changes may impact our ability to protect our technology and proprietary use thereof through patents.
We have registered ReachLocal and other trademarks as trademarks in the United States and in certain other countries. Some of our trade names are not eligible to receive trademark protection. Also, trademark protection may not be available, or sought by us, in every country in which our technology and products are available online. Competitors may adopt service names similar to ours, or purchase our trademarks and confusingly similar terms as keywords in Internet search engine advertising programs, thereby impeding our ability to build brand identity and possibly leading to client confusion. In addition, there could be potential trade name or trademark infringement claims brought by owners of other registered trademarks or trademarks that incorporate variations of the term ReachLocal or our other trademarks.
Litigation or proceedings before the U.S. Patent and Trademark Office or other governmental authorities and administrative bodies in the United States and abroad may be necessary in the future to enforce our intellectual property rights, to protect our patent rights, trade secrets and domain names and to determine the validity and scope of the proprietary rights of others. Our efforts to enforce or protect our proprietary rights may be ineffective and could result in substantial costs and diversion of resources and could substantially harm our operating results.
Confidentiality agreements with employees and others may not adequately prevent disclosure of trade secrets and other proprietary information.
In order to protect our proprietary technology and processes, we rely in part on confidentiality agreements with our employees, licensees, independent contractors and other advisors. These agreements may not effectively prevent disclosure of confidential information and may not provide an adequate remedy in the event of unauthorized disclosure of confidential information. In addition, others may independently discover trade secrets and proprietary information, and in such cases we could not assert any trade secret rights against such parties. Costly and time-consuming litigation could be necessary to enforce and determine the scope of our proprietary rights, and failure to obtain or maintain trade secret protection could adversely affect our competitive business position.
Assertions by third parties of infringement by us of their intellectual property rights could result in significant costs and substantially harm our business and operating results.
Companies in the Internet, technology and media industries own large numbers of patents, copyrights, trademarks and trade secrets and frequently litigate or threaten litigation based on allegations of infringement or other violations of intellectual property rights. Other parties have asserted, and may in the future assert, that we have infringed their intellectual property rights. For instance, after our acquisition of DealOn, a number of parties have alleged that DealOn is violating the patents of such parties and one such party has initiated litigation against DealOn. These types of litigations may involve patent holding companies or other adverse patent owners who have no relevant product revenue, and therefore our own issued and pending patents, if any, may provide little or no deterrence. In addition, we have been and could in the future become involved in disputes over the use of keywords by our clients, to the extent such clients’ competitors allege the use of such keywords on our RL platform violates such competitors’ trademark rights. We cannot predict whether assertions of third-party intellectual property rights or claims arising from such assertions will substantially harm our business and operating results. If we are forced to defend against any infringement claims, whether they are with or without merit or are determined in our favor, we may face costly litigation and diversion of technical and management personnel. Furthermore, an adverse outcome of a dispute may require us to pay damages, potentially including treble damages and attorneys’ fees, if we are found to have willfully infringed a party’s patent or copyright rights; cease making, licensing or using solutions that are alleged to incorporate the intellectual property of others; expend additional development resources to redesign our solutions; and enter into potentially unfavorable royalty or license agreements in order to obtain the right to use necessary technologies. Royalty or licensing agreements, if required, may be unavailable on terms acceptable to us, or at all. Over time, we expect that we will increasingly be subject to infringement claims as the number of competitors in our industry segment grows or as our presence and visibility within the industry increases.
We could lose clients if we or our media partners fail to detect click-through or other fraud on advertisements in a manner that is acceptable to our clients.
We are exposed to the risk of fraudulent clicks or actions on our third-party publishers’ websites. We may lose clients, or in the future we may have to refund revenue that our clients have paid to us and that was later attributed to, or suspected to be caused by,
18
Table of Contents
click-through fraud. Click-through fraud occurs when an individual clicks on an ad displayed on a website or an automated system is used to create such clicks with little to no intent of viewing the underlying content. If fraudulent clicks are not detected, the affected clients may become dissatisfied with our campaigns, which in turn may lead to loss of clients and the related revenue.
If the technology that we currently use to target the delivery of online advertisements is restricted or becomes subject to regulation, our expenses could increase and we could lose clients.
Websites typically place small files of non-personalized information, commonly known as cookies, on an Internet user’s hard drive. For example, our remarketing product uses cookies for its remarketing capabilities, which involves showing a consumer an ad for the website of an advertiser that the consumer has previously visited. Most currently available Internet browsers allow Internet users to modify their browser settings to prevent cookies from being stored on their hard drive, and some users currently do so. Microsoft’s Internet Explorer was recently updated to further enable consumers to prevent any kind of online tracking. Internet users can also delete cookies from their hard drives at any time. In addition, some Internet commentators and privacy advocates have suggested limiting or eliminating the use of cookies and other tracking technologies, and legislation has been introduced in some jurisdictions to regulate the use of such technologies.
In 2009, the Federal Trade Commission, or the FTC, issued a report on Self-Regulatory Principles for Online Behavioral Advertising which promoted principles designed to encourage meaningful self-regulation with regard to online behavioral advertising within the industry. In 2010, the FTC issued a Privacy Report calling for broader restrictions on behavioral advertising including a “do not track” mechanism allowing computer users to “opt out” of behavioral tracking. As evidenced by such reports, the FTC supports self-regulation within the industry, and strongly encourages that industry participants come up with more meaningful and rigorous self-regulation, but does not believe the industry is moving quickly enough or broadly enough to address privacy concerns.
In Europe, amendments to the European Privacy and Electronic Communications Directive (due to implemented by the end of May of this year) are likely to increase the restrictive nature of the obligations binding on us and our clients for the use of these technologies, as they introduce requirements for Internet users to provide prior consent to the use of these technologies. Discussion in Europe suggests that use of these technologies specifically for behavioral advertising purposes may require active “opt in” consent over and above any more general requirements for Internet user consent. Implementation of these amendments may therefore require us and our customers to alter the way in which we and they use cookies, from both a technical and a commercial view point, which may limit the effectiveness of our local online advertising solutions both in Europe and elsewhere. If the use or effectiveness of cookies and similar technologies were limited in Europe, we expect that we would need to switch to other technologies to gather demographic and behavioral information. While such technologies currently exist, they are substantially less effective than cookies. Replacement of cookies could require significant reengineering time and resources, might not be completed in time to avoid losing customers, and might not be commercially feasible. Although amendments to the European Privacy and Electronic Communications Directive have been implemented at a European Union level, it is for each of the European Union member states to enact legislation to incorporate these amendments into its national laws. The amended rules applicable in each member state may therefore differ from jurisdiction to jurisdiction, and we and our clients must ensure compliance with these rules in each jurisdiction in which we or they use personal data.
We cannot yet determine the full impact of all these proposed changes. However, if the gathering of profiling information on users were to be curtailed, Internet advertising would be less effective, which would reduce demand for Internet advertising and harm our business. The development and implementation of new technologies and procedures could be expensive and time consuming, and may limit or delay our ability to develop and market new products and services.
Some of our services may utilize “open source” software, and any failure to comply with the terms of one or more of these open source licenses could negatively affect our business.
Some of our services may utilize software licensed by its authors or other third parties under so-called “open source” licenses, including, but not limited to, the GNU General Public License and the GNU Lesser General Public License. Some of those licenses may require that we make available source code for modifications or derivative works we create using the open source software, that we provide notices with our products and that we license any modifications or derivative works under an open source license or rights of further use to third parties. If we combine our proprietary software with open source software, we could be required to release the source code of our proprietary software. Although we take steps to ensure that our software engineers properly isolate our proprietary software they design from open source software components, we may not control the product development efforts of our engineers and we cannot be certain that they have not inappropriately incorporated open source software into our proprietary technologies. If an author or other third party that distributes open source software were to obtain a judgment against us based on allegations that we had not complied with the terms of any applicable open source license, we could be subject to liability for copyright infringement damages and breach of contract. In addition, we could be enjoined from selling our services that contained the open source software and required to make the source code for the open source software available, to grant third parties certain rights of further use of our software or to remove the open source software from our services, which could disrupt our distribution and sale of some of our services.
19
Table of Contents
We could be subject to legal claims, government enforcement actions and damage to our reputation and held liable for our or our clients’ failure to comply with federal, state and foreign laws, regulations or policies governing consumer privacy and telecommunications secrecy which could materially harm our business.
Recent growing public concern regarding privacy and the collection, distribution and use of information about individuals has led to increased federal, state and foreign scrutiny and legislative and regulatory activity concerning data collection and use practices. We and our clients are currently subject to various federal, state and foreign laws concerning the collection and use of information regarding individuals, and more stringent legislation regarding privacy and data security measures has been enacted or is pending in numerous states, the United States Congress, in Europe and in other countries. In addition, privacy or consumer protection related self-regulatory measures, changes in technology or pressure caused by public opinion may impact our ability to provide, market or further develop our current services.
In the United States, key privacy laws relating to our business include the Children’s Online Privacy Protection Act, the Federal Drivers Privacy Protection Act of 1994, the privacy provisions of the Gramm-Leach-Bliley Act, and the Federal CAN-SPAM Act of 2003. The President of the United States has publicly supported passage of a “bill of rights” for Internet users with legally enforceable standards for the collection, use and transfer of personal data and the Federal Trade Commission has called for broader limitations on behavioral advertising to supplement or replace existing self regulation.
In Europe, key privacy laws include the Data Protection Directive and the Privacy and Electronic Communications Directive in Europe. The European Union’s directives limit both the ability to use electronic communications in relation to Internet users, and the ability to collect and use information regarding Internet users. These directives are implemented differently in each European Union member state and we and our clients will therefore be subject to the local implementing laws in their relevant member state. These restrictions in relation to targeted advertising may become significantly more onerous in the future following the introduction of an amendment to the Privacy and Electronic Communications Directive, which may require a material change in our and our clients’ use of certain common technologies (including cookies) used to track and target Internet advertising. Our interception and monitoring of telephone calls in Europe is also subject to and restricted by the Telecoms Privacy Directive.
Our Australia operations are subject to privacy and data security measures under the Privacy Act 1988 and other privacy laws. The Privacy Act 1988 may be amended in 2011 to provide for greater powers to the regulator and more extensive penalties for breaches.
In addition to government activity, privacy advocacy groups and the technology and direct marketing industries are considering various new, additional or different self-regulatory standards. Since many of the proposed standards, guidelines, laws and regulations are new or just being developed, and a consensus on privacy and data usage has not been reached, we cannot yet determine the full impact all of these proposed laws or regulations may have on our business. We do anticipate, however, that these new measures will require us and our customers to modify our technology and privacy practices and devote additional resources to monitoring and adapting to the new requirements as they are put into effect.
We cannot assure you that our clients are currently in compliance, or will remain in compliance, with these laws, standards and their own privacy policies. While we have taken steps designed to ensure compliance with the current privacy and consumer protection regime in all material respects, given their nature and our geographical diversity, and the difficulties inherent in applying the non-US laws and regulations to our current US-based business model and the various technologies we use, there could be areas where we are non-compliant. We may be held liable if our clients use our online marketing and reporting solutions in a manner that is not in compliance with applicable laws, standards or their own stated privacy policies. Our failure to comply could result in liability and sanctions (which could include giving undertakings to regulatory authorities to change our operations, adverse publicity, substantial financial penalties and/or criminal proceedings) and materially harm our business.
Government regulation of the Internet is evolving, and unfavorable changes could substantially harm our business and operating results.
We are subject to general business regulations and laws as well as regulations and laws specifically governing the Internet. Existing and future laws and regulations may impede the growth in use of the Internet and online services. The application of existing laws to the Internet and online services governing issues such as property ownership, sales and other taxes, libel and personal privacy has not yet been settled. Unfavorable resolution of these issues may substantially harm our business and operating results. Other laws and regulations that have been adopted, or may be adopted in the future, that may affect our business include those covering user privacy, data protection, spyware, “do not email” lists, access to high speed and broadband service, pricing, taxation, tariffs, patents, copyrights, trademarks, trade secrets, export of encryption technology, electronic contracting, click-fraud, acceptable content, search terms, lead generation, behavioral targeting, consumer protection, and quality of products and services. Any changes in regulations or laws that hinder growth of the Internet generally or that decrease the acceptance of the Internet as a communications, commercial and advertising medium could adversely affect our business. See also Part 1, Item 1A, “Risk Factors— If the technology that we currently use to target the delivery of online advertisements is restricted or becomes subject to regulation, our expenses could increase and we could lose clients.”
Risks Related to Owning Our Common Stock
Our stock price may be volatile, and the value of an investment in our common stock may decline.
Shares of our common stock were sold in our initial public offering in May 19, 2010 at a price of $13.00 per share, and our common stock has subsequently traded as high as $28.02 and as low as $11.80 through March 23, 2011. An active, liquid and orderly market for our common stock may not be developed or sustained, which could depress the trading price of our common stock.
20
Table of Contents
The trading price of our common stock may be subject to wide fluctuations in response to various factors, some of which are beyond our control, including:
| • | our operating performance and the operating performance of similar companies; |
| • | the overall performance of the equity markets; |
| • | the number of shares of our common stock publicly owned and available for trading; |
| • | threatened or actual litigation; |
| • | changes in laws or regulations relating to our solutions; |
| • | any major change in our board of directors or management; |
| • | publication of research reports about us or our industry or changes in recommendations or withdrawal of research coverage by securities analysts; |
| • | large volumes of sales of our shares of common stock by existing stockholders; and |
| • | general political and economic conditions. |
In addition, the stock market in general, and the market for Internet-related companies in particular, has experienced extreme price and volume fluctuations that have often been unrelated or disproportionate to the operating performance of those companies. Securities class action litigation has often been instituted against companies following periods of volatility in the overall market and in the market price of a company’s securities. This litigation, if instituted against us, could result in very substantial costs, divert our management’s attention and resources and harm our business, operating results and financial condition. In addition, the recent distress in the financial markets has also resulted in extreme volatility in security prices.
Future sales of shares of our common stock by stockholders could depress the price of our common stock.
Approximately 68% of our common stock is held by our directors, officers and entities affiliated with our directors. Such shares have not been subject to lock-up agreements since November 2010. A number of members of our management team have adopted 10b5-1 trading plans covering approximately 0.8 million shares of common stock. In addition, insiders may seek to sell shares without the adoption of trading plans. If there are substantial sales of our common stock in the public market, the trading price of our common stock could decline significantly. In addition, as of December 31, 2010 approximately 6.2 million shares subject to outstanding options under our 2004 Stock Plan and our Amended and Restated 2008 Stock Incentive Plan, are eligible for sale in the public market in the future, subject to certain legal and contractual limitations. If these additional shares are sold, or if it is perceived that they will be sold, in the public market, the price of our common stock could decline substantially.
As a result of becoming a public company, we are obligated to develop and maintain proper and effective internal controls over financial reporting and will be subject to other requirements that will be burdensome and costly. We may not complete our analysis of our internal controls over financial reporting in a timely manner, or these internal controls may not be determined to be effective, which may adversely affect investor confidence in our company and, as a result, the value of our common stock.
We are required, pursuant to Section 404 of the Sarbanes-Oxley Act of 2002 (Section 404), to furnish a report by management on, among other things, the effectiveness of our internal control over financial reporting for the fiscal year ending on December 31, 2011. This assessment will need to include disclosure of any material weaknesses identified by our management in our internal control over financial reporting, as well as a statement that our auditors have issued an attestation report on our management’s assessment of our internal controls.
We are engaged in the costly and challenging process of compiling the system and processing documentation before we perform the evaluation needed to comply with Section 404. We may not be able to complete our evaluation, testing and any required remediation in a timely fashion. During the evaluation and testing process, if we identify one or more material weaknesses in our internal control over financial reporting, we will be unable to assert that our internal control is effective. If we are unable to assert that our internal control over financial reporting is effective, or if our auditors are unable to attest that our management’s report is fairly stated or they are unable to express an opinion on the effectiveness of our internal control, we could lose investor confidence in the accuracy and completeness of our financial reports, which would have a material adverse effect on the price of our common stock. Failure to comply with the new rules might make it more difficult for us to obtain certain types of insurance, including director and officer liability insurance, and we might be forced to accept reduced policy limits and coverage and/or incur substantially higher costs to obtain the same or similar coverage. The impact of these events could also make it more difficult for us to attract and retain qualified persons to serve on our board of directors, on committees of our board of directors, or as executive officers.
If securities or industry analysts do not publish research or publish inaccurate or unfavorable research about our business, our stock price and trading volume could decline.
The trading market for our common stock depends in part on the research and reports that securities or industry analysts publish about us or our business.
21
Table of Contents
if one or more of the analysts who cover us downgrade our stock or publish inaccurate or unfavorable research about our business, our stock price would likely decline. If one or more of these analysts cease coverage of our company or fail to publish reports on us regularly, demand for our stock could decrease, which might cause our stock price and trading volume to decline.
Our management continues to have broad discretion over the use of the proceeds we received in our initial public offering and might not apply the proceeds in ways that increase the value of your investment.
Our management generally has broad discretion to use the net proceeds to us from our initial public offering, and our stockholders will be relying on the judgment of our management regarding the application of these proceeds. Our management might not apply the net proceeds from the offering in ways that increase the value of our stockholders’ investment. To date, we have used the net proceeds of our initial public offering to fulfill a deferred payment obligation in connection with our acquisition in September 2009 of the approximately 53% of our Australian operations that we did not already own. We will also use a portion of the net proceeds for the acquisition of businesses, solutions and technologies that we believe are complementary to our own. We have not otherwise allocated the net proceeds from the offering for any specific purposes. Until we use the net proceeds to us from the offering, we plan to invest them, and these investments may not yield a favorable rate of return. If we do not invest or apply the net proceeds from the offering in ways that enhance stockholder value, we may fail to achieve expected financial results, which could cause our stock price to decline.
Investment funds managed by VantagePoint Venture Partners own a substantial amount of our stock and have significant influence over our business. In the aggregate, insiders own a majority of our outstanding stock.
As of December 31, 2010, VantagePoint Venture Partners, one of our early venture capital investors, beneficially owned approximately 45% of our outstanding common stock. As a result, VantagePoint has significant influence over the outcome of matters submitted to our stockholders for approval, including the election of directors. VantagePoint’s significant ownership also could affect the market price of our common stock by, for example, delaying, deferring or preventing a change in corporate control, impeding a merger, consolidation, takeover or other business combination involving us, or discouraging a potential acquiror from making a tender offer or otherwise attempting to obtain control of us. Alan Salzman, the Chief Executive Officer of Vantage Point, serves as Chairman of our board of directors.
Our current directors and executive officers as a group beneficially own approximately 68% of our outstanding common stock.
Certain provisions in our charter documents and Delaware law could discourage takeover attempts and lead to management entrenchment.
Our certificate of incorporation and bylaws contain provisions that could have the effect of delaying or preventing changes in control or changes in our management without the consent of our board of directors, including, among other things:
| • | a classified board of directors with three-year staggered terms, which may delay the ability of stockholders to change the membership of a majority of our board of directors; |
| • | no cumulative voting in the election of directors, which limits the ability of minority stockholders to elect director candidates; |
| • | the ability of our board of directors to determine to issue shares of preferred stock and to determine the price and other terms of those shares, including preferences and voting rights, without stockholder approval, which could be used to significantly dilute the ownership of a hostile acquirer; |
| • | the exclusive right of our board of directors to elect a director to fill a vacancy created by the expansion of our board of directors or the resignation, death or removal of a director, which prevents stockholders from being able to fill vacancies on our board of directors; |
| • | a prohibition on stockholder action by written consent, which forces stockholder action to be taken at an annual or special meeting of our stockholders; |
| • | the requirement that a special meeting of stockholders may be called only by the chairman of our board of directors, the Chief Executive Officer, the president (in absence of a Chief Executive Officer) or our board of directors, which may delay the ability of our stockholders to force consideration of a proposal or to take action, including the removal of directors; |
| • | the requirement for the affirmative vote of holders of at least 66 2/3% of the voting power of all of the then outstanding shares of the voting stock, voting together as a single class, to amend the provisions of our certificate of incorporation relating to the issuance of preferred stock and management of our business or our bylaws, which may inhibit the ability of an acquiror from amending our certificate of incorporation or bylaws to facilitate a hostile acquisition; |
22
Table of Contents
| • | the ability of our board of directors, by majority vote, to amend the bylaws, which may allow our board of directors to take additional actions to prevent a hostile acquisition and inhibit the ability of an acquiror from amending the bylaws to facilitate a hostile acquisition; and |
| • | advance notice procedures that stockholders must comply with in order to nominate candidates to our board of directors or to propose matters to be acted upon at a stockholders’ meeting, which may discourage or deter a potential acquiror from conducting a solicitation of proxies to elect the acquiror’s own slate of directors or otherwise attempting to obtain control of us. |
We are also subject to certain anti-takeover provisions under Delaware law. Under Delaware law, a corporation may not, in general, engage in a business combination with any holder of 15% or more of its capital stock unless the holder has held the stock for three years or, among other things, our board of directors has approved the transaction.
Item 1B. Unresolved Staff Comments.
None.
We do not own any real estate. We lease a 38,592 square-foot facility for our corporate headquarters in Woodland Hills, California and a 41,594 square-foot facility for our sales headquarters in Plano, Texas. We also have 50 leases for sales offices, support facilities and data centers in other locations in North America and overseas.
From time to time we are involved in legal proceedings arising in the ordinary course of our business. We believe that there is no litigation pending that is likely to have a material adverse effect on our results of operations and financial condition.
On March 1, 2010, a class action lawsuit was filed by two of our former employees in California Superior Court in Los Angeles, California. The complaint alleged wage and hour violations in a Fair Labor Standards Act collective action and a California class action. On November 17, 2010, we executed a memorandum of understanding to settle the class action for $0.8 million, which includes legal expenses. The memorandum of understanding remains subject to confirmation by the presiding court. On or about February 2, 2011 a second class action lawsuit was filed by former employees which also alleged substantially similar wage and hour violations. Accordingly, this lawsuit will be consolidated with the prior class action and it is not expected to disrupt the prior settlement or result in material additional costs.
DealOn, a company we acquired in February 2011, has been sued in a patent infringement matter and has also received two letters claiming that its technology infringes other third-party patents. The case is at an early stage and we have not yet determined the amount of liability, if any, that may result from the lawsuit or other claims. At this time, however, we do not believe that this litigation will have a material adverse effect on the Company.
Item 4. (Removed and Reserved).
23
Table of Contents
Item 5. Market for Registrant’s Common Equity, Related Stockholder Matters and Issuer Purchases of Equity Securities.
Our common stock has been traded on The Nasdaq Global Select Market since May 20, 2010 under the symbol “RLOC.” The following table sets forth the high and low sales price for our common stock as reported by The Nasdaq Global Select Market for the period indicated.
| High | Low | |||||||
| Quarter ended June 30, 2010 (beginning May 20, 2010) |
$ | 16.99 | $ | 11.80 | ||||
| Quarter ended September 30, 2010 |
15.25 | 12.25 | ||||||
| Quarter ended December 31, 2010 |
21.14 | 13.43 | ||||||
As of March 23, 2011, we had approximately 50 stockholders of record of our common stock and the closing price of our common stock was $20.66.
We have never declared or paid, and do not anticipate declaring or paying, any cash dividends on our common stock. Any future determination as to the declaration and payment of dividends, if any, will be at the discretion of our board of directors and will depend on then existing conditions, including our financial condition, operating results, contractual restrictions, capital requirements, business prospects and other factors our board of directors may deem relevant.
Stock Price Performance Graph
This performance graph shall not be deemed “soliciting material” or to be “filed” with the Securities and Exchange Commission for purposes of Section 18 of the Exchange Act or otherwise subject to the liabilities under that Section, and shall not be deemed to be incorporated by reference into any filing of ReachLocal, Inc. under the Securities Act or the Exchange Act.
The following graph compares, for the period from May 20, 2010 through December 31, 2010, the total cumulative stockholder return on our common stock with the total cumulative return of the NASDAQ Composite Index and the RDG Internet Composite Index. Measurement points are April 30, 2010 for NASDAQ Composite Index and RDG Internet Composite Index, the initial trading day of our common stock, the closing price on May 20, 2010, and December 31, 2010. The graph assumes a $100 investment at the beginning of the period in our common stock, the stocks represented in the NASDAQ Composite Index and the stocks represented in the RDG Internet Composite Index, and reinvestment of any dividends. Historical stock price performance should not be relied upon as an indication of future stock price performance:
24
Table of Contents
COMPARISON OF 7 MONTH CUMULATIVE TOTAL RETURN *
Among ReachLocal Inc., the NASDAQ Composite Index
and the RDG Internet Composite Index
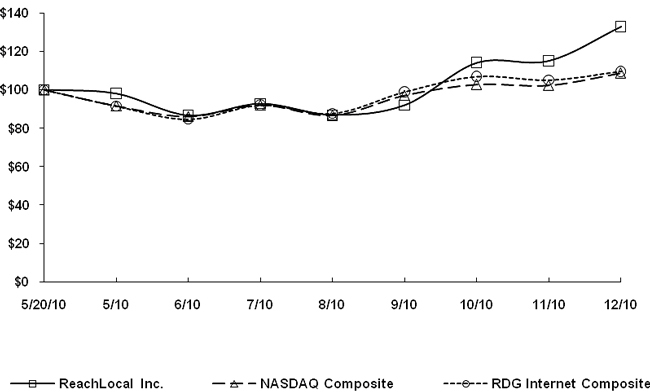
| * | $100 invested on 5/20/10 in stock or 4/30/10 in index, including reinvestment of dividends. |
Fiscal year ending December 31.
| 5/20/10 | 5/10 | 6/10 | 7/10 | 8/10 | 9/10 | 10/10 | 11/10 | 12/10 | ||||||||||||||||||||||||||||
| ReachLocal Inc. |
100.00 | 98.00 | 86.58 | 92.72 | 86.85 | 91.99 | 114.09 | 115.09 | 132.91 | |||||||||||||||||||||||||||
| NASDAQ Composite |
100.00 | 91.68 | 86.16 | 92.11 | 86.75 | 97.18 | 102.82 | 102.34 | 108.76 | |||||||||||||||||||||||||||
| RDG Internet Composite |
100.00 | 91.52 | 84.78 | 92.08 | 87.73 | 98.96 | 106.89 | 105.06 | 109.55 | |||||||||||||||||||||||||||
Recent Sales of Unregistered Securities
On February 22, 2010, we agreed to issue up to 364,692 shares of common stock as partial deferred consideration for the acquisition of SMB:LIVE Corporation.
Use of Proceeds from Registered Securities
On May 19, 2010, our registration statement on Form S-1 (File No. 333-163905) was declared effective for our initial public offering, pursuant to which we registered the offering and sale of 3,941,103 shares of common stock, including shares from the exercise of the underwriters’ option to purchase 625,000 shares, and the associated sale of 850,564 shares of common stock by selling stockholders at a public offering price of $13.00 per share. J.P. Morgan and Merrill Lynch, Pierce, Fenner & Smith Incorporated were the joint book running managers and representatives of the underwriters.
As a result of the offering, we received net proceeds of approximately $42.0 million, after deducting underwriting discounts and commissions of approximately $3.6 million and offering expenses payable by us of approximately $5.6 million. No offering expenses were paid directly or indirectly to any of our directors or officers or their associates or to persons owning ten percent or more of our common stock or to any other affiliates. The net offering proceeds have been invested into cash and money market accounts.
There has been no material change in the planned use of proceeds from our initial public offering as described in our final prospectus filed with the SEC pursuant to Rule 424(b).
25
Table of Contents
Item 6. Selected Financial Data.
The data set forth below are qualified in their entirety by reference to, and should be read in conjunction with Part II, Item 7, “Management’s Discussion and Analysis of Financial Condition and Results of Operations” and the consolidated financial statements, related notes and other financial information included elsewhere in this report. The consolidated statements of operations data for the years ended December 31, 2010, 2009 and 2008 and the consolidated balance sheet data as of December 31, 2010 and 2009 are derived from our audited consolidated financial statements included elsewhere in this report. The consolidated statements of operations data for the years ended December 31, 2007 and 2006 and the consolidated balance sheet data as of December 31, 2008, 2007 and 2006 are derived from our audited consolidated financial statements not included in this report. Historical results are not necessarily indicative of the results to be expected in the future.
| Year Ended December 31, | ||||||||||||||||||||
| 2010 | 2009 | 2008 | 2007 | 2006 | ||||||||||||||||
| Consolidated Statements of Operations: |
|
|||||||||||||||||||
| (in thousands, except per share data) |
||||||||||||||||||||
| Revenue |
$ | 291,689 | $ | 203,117 | $ | 146,687 | $ | 68,356 | $ | 25,635 | ||||||||||
| Cost of revenue (1) |
159,019 | 112,218 | 77,496 | 39,262 | 16,702 | |||||||||||||||
| Operating expenses: |
||||||||||||||||||||
| Selling and marketing (1) |
110,024 | 76,175 | 61,054 | 24,435 | 8,062 | |||||||||||||||
| Product and technology (1) |
11,239 | 5,167 | 2,938 | 1,911 | 695 | |||||||||||||||
| General and administrative (1) |
23,695 | 15,534 | 12,128 | 5,804 | 1,475 | |||||||||||||||
| Total operating expenses |
144,958 | 96,876 | 76,120 | 32,150 | 10,232 | |||||||||||||||
| Loss from operations |
(12,288 | ) | (5,977 | ) | (6,929 | ) | (3,056 | ) | (1,299 | ) | ||||||||||
| Gain on acquisition of ReachLocal Australia |
— | 16,223 | — | — | — | |||||||||||||||
| Equity in losses of ReachLocal Australia |
— | — | (813 | ) | (250 | ) | — | |||||||||||||
| Other income (expense), net |
601 | (7 | ) | 889 | 669 | 181 | ||||||||||||||
| Income (loss) before provision for income taxes |
(11,687 | ) | 10,239 | (6,853 | ) | (2,637 | ) | (1,118 | ) | |||||||||||
| Provision (benefit) for income taxes |
(540 | ) | 217 | 145 | 11 | 9 | ||||||||||||||
| Net income (loss) |
(11,147 | ) | $ | 10,022 | $ | (6,998 | ) | $ | (2,648 | ) | $ | (1,127 | ) | |||||||
| Pro forma net income per share (unaudited)(2): |
||||||||||||||||||||
| Basic |
$ | (0.42 | ) | $ | 0.44 | $ | (0.31 | ) | ||||||||||||
| Diluted |
$ | (0.42 | ) | $ | 0.41 | $ | (0.31 | ) | ||||||||||||
| Pro forma weighted average shares outstanding used in calculating net income per share (unaudited)(2): |
||||||||||||||||||||
| Basic |
26,286 | 22,995 | 22,389 | |||||||||||||||||
| Diluted |
26,286 | 24,613 | 22,389 | |||||||||||||||||
26
Table of Contents
| (1) | Stock-based compensation, net of capitalization, and depreciation and amortization included in the above line items (in thousands): |
| Year Ended December 31, | ||||||||||||||||||||
| 2010 | 2009 | 2008 | 2007 | 2006 | ||||||||||||||||
| Stock-based compensation: |
||||||||||||||||||||
| Cost of revenue |
$ | 244 | $ | 86 | $ | 34 | $ | 18 | $ | 13 | ||||||||||
| Selling and marketing |
1,218 | 566 | 338 | 94 | 45 | |||||||||||||||
| Product and technology |
1,183 | 164 | 73 | 16 | 27 | |||||||||||||||
| General and administrative |
3,123 | 2,145 | 1,366 | 278 | 150 | |||||||||||||||
| $ | 5,768 | $ | 2,961 | $ | 1,811 | $ | 406 | $ | 235 | |||||||||||
| Year Ended December 31, | ||||||||||||||||||||
| 2010 | 2009 | 2008 | 2007 | 2006 | ||||||||||||||||
| Depreciation and amortization: |
||||||||||||||||||||
| Cost of revenue |
$ | 364 | $ | 261 | $ | 186 | $ | 83 | $ | 40 | ||||||||||
| Selling and marketing |
1,060 | 892 | 596 | 205 | 21 | |||||||||||||||
| Product and technology |
4,202 | 1,765 | 916 | 603 | 397 | |||||||||||||||
| General and administrative |
1,078 | 430 | 154 | 49 | 18 | |||||||||||||||
| $ | 6,704 | $ | 3,348 | $ | 1,852 | $ | 940 | $ | 476 | |||||||||||
| (2) | See Note 2 to our consolidated financial statements for an explanation of the method used to calculate pro forma basic and diluted net income per share of common stock. |
| December 31, | ||||||||||||||||||||
| 2010 | 2009 | 2008 | 2007 | 2006 | ||||||||||||||||
| Consolidated Balance Sheet Data: |
||||||||||||||||||||
| (in thousands) |
||||||||||||||||||||
| Cash, cash equivalents and short-term investments |
$ | 88,114 | $ | 43,416 | $ | 39,127 | $ | 31,912 | $ | 5,760 | ||||||||||
| Working capital |
26,894 | (6,714 | ) | 15,256 | 22,913 | 5,832 | ||||||||||||||
| Total assets |
150,580 | 97,887 | 51,124 | 38,881 | 11,032 | |||||||||||||||
| Total liabilities |
68,564 | 55,769 | 28,610 | 12,590 | 3,232 | |||||||||||||||
| Total stockholders’ equity |
82,016 | 42,118 | 22,514 | 26,291 | 7,801 | |||||||||||||||
| Year Ended December 31, | ||||||||||||||||
| 2010 | 2009 | 2008 | 2007 | |||||||||||||
| Other Financial Data: |
||||||||||||||||
| (in thousands) |
||||||||||||||||
| Net cash provided by operating activities |
$ | 17,675 | $ | 14,308 | $ | 12,062 | $ | 7,421 | ||||||||
| Capital Expenditures (unaudited) (3) |
10,078 | 5,805 | 5,152 | 2,479 | ||||||||||||
| Non-GAAP Financial Measures (unaudited): |
||||||||||||||||
| Adjusted EBITDA (4) |
786 | 1,393 | (3,266 | ) | (1,710 | ) | ||||||||||
| Underclassmen Expense (5) |
36,073 | 26,824 | 27,886 | 10,044 | ||||||||||||
| December 31, | ||||||||||||||||
| 2010 | 2009 | 2008 | 2007 | |||||||||||||
| Other Operational Data: |
||||||||||||||||
| Number of IMCs: |
||||||||||||||||
| Upperclassmen |
286 | 235 | 80 | 16 | ||||||||||||
| Underclassmen |
379 | 280 | 337 | 152 | ||||||||||||
| Total |
665 | 515 | 417 | 168 | ||||||||||||
| Active Advertisers (6) |
16,900 | 14,700 | 11,600 | 7,400 | ||||||||||||
| Active Campaigns (7) |
22,700 | 18,600 | 13,500 | 8,900 | ||||||||||||
27
Table of Contents
| (3) | Represents purchases of property and equipment and the amount of software development costs capitalized, in aggregate, excluding stock-based compensation and the acquisition of ReachLocal Australia in September 2009 (see Note 4 to our consolidated financial statements). |
| (4) | See Part II, Item 7, “Management’s Discussion and Analysis of Financial Condition and Results of Operations – Non-GAAP Financial Measures” for our definition of Adjusted EBITDA, why we present it and for a reconciliation of our Adjusted EBITDA to loss from operations for each of the periods presented. |
| (5) | See Part II, Item 7, “Management’s Discussion and Analysis of Financial Condition and Results of Operations – Non-GAAP Financial Measures” for our definition of Underclassmen Expense. |
| (6) | Active Advertisers is a number we calculate to approximate the number of clients directly served through our Direct Local channel as well as clients served through our National Brands, Agencies and Resellers channel. We calculate Active Advertisers by adjusting the number of Active Campaigns to combine clients with more than one Active Campaign as a single Active Advertiser. Clients with more than one location are generally reflected as multiple Active Advertisers. Because this number includes clients served through the National Brands, Agencies and Resellers channel, Active Advertisers includes entities with which we do not have a direct client relationship. Numbers are rounded to the nearest hundred. |
| (7) | Active Campaigns is a number we calculate to approximate the number of individual products or services we are managing under contract for Active Advertisers. For example, if we were performing both ReachSearch and ReachDisplay campaigns for a client, we consider that two Active Campaigns. Similarly, if a client purchased ReachSearch campaigns for two different products or purposes, we consider that two Active Campaigns. Numbers are rounded to the nearest hundred. |
28
Table of Contents
Item 7. Management’s Discussion and Analysis of Financial Condition and Results of Operations.
You should read the following discussion together with Part II, Item 6, “Selected Financial Data” and our consolidated financial statements and the related notes included elsewhere in this Annual Report. This discussion contains forward-looking statements about our business and operations. Our actual results may differ materially from those we currently anticipate as a result of many factors, including those we describe in Part I, Item 1A, “Risk Factors” and elsewhere in this Annual Report. See Part I, “Cautionary Notice Regarding Forward-Looking Statements.”
Overview
Our mission is to help small- and medium-sized businesses, or SMBs, acquire, maintain and retain customers via the Internet. We offer a comprehensive suite of online marketing and reporting solutions, including search engine marketing, Web presence, display advertising, remarketing and online marketing analytics, each targeted to the SMB market. We deliver these solutions to SMBs through a combination of our proprietary RL Platform and our direct, “feet-on-the-street” sales force of Internet Marketing Consultants, or IMCs, and select third-party agencies and resellers.
We use our RL Platform to create advertising campaigns for SMBs to target potential customers in their geographic area, optimize those campaigns in real time and track tangible results. Through a single Internet advertising budget, we enable our clients to reach local customers across all the major search engines and leading general interest and vertically focused online publishers. In 2010, we expanded the RL Platform to include our ReachCast full-service Web presence and social media solution. We added local deals to our suite of products available to our SMB clients in 2011. Based in or near the cities in which our clients operate, our IMCs establish a direct consultative relationship with our clients and, empowered by the RL Platform, work with the clients to achieve their marketing objectives. We generate revenue by providing online advertising solutions for our clients through our search engine marketing product, ReachSearch, our display advertising product, ReachDisplay, and our remarketing product. We sell our ReachSearch, ReachDisplay and remarketing products based on a package pricing model in which our clients commit to a fixed fee that includes the media; the optimization, reporting and tracking technologies of the RL Platform; and the personnel dedicated to support and manage their campaigns. While we do not commit to a specific set of results, we work with our clients to meet their marketing objectives. For our ReachSearch product, we believe clients evaluate performance based on the number and quality of leads (phone, email and other) received. For our ReachDisplay and remarketing products, we believe clients focus on the numbers of customers reached and the accuracy of targeting achieved through the campaign. Each of these products includes access to multiple publishers, some of which are not directly available to SMBs, as well as access to our proprietary optimization and tracking technologies that dynamically adjust the publishers to which we allocate clients’ media spend in order to meet their performance objectives. For these reasons, while we rely on third-party publishers for the substantial majority of the media we purchase on behalf of our clients, we are not simply a reseller of media; rather, we market our products as a complete package of media optimized for the client. We also generate revenue from digital marketing solutions for our clients that do not include the purchase of third-party media through our campaign performance tracking product, TotalTrack, through our assisted chat product, TotalLiveChat, and through ReachCast. Each of our products is sold to our clients in a single budget to simplify the purchasing process.
Nearly all of our cost of revenue is for the purchase of media and nearly all of the media we purchase is from Google, Yahoo! and Microsoft. A substantial majority of the media we purchase is from Google. We generally purchase this media in an auction marketplace. We believe that our technology enables us to purchase this media efficiently and, as a result, allows us to fulfill our clients’ expected level of performance. However, an increase in the cost of media in these marketplaces without a corresponding increase in our media buying efficiency could result in an increase in our cost of revenue as a percentage of revenue even if our business expands. In addition, such an increase could result in an increase in the prices we must charge our clients or a decrease in our ability to fulfill our clients’ service expectations at the existing package price. While we enter into rebate and incentive programs with some publishers, these incentive programs are subject to change or cancellation with little notice, and, on occasion, these incentives have been cancelled, reduced or have required us to comply with rules that reduce the benefit of the incentives from what we previously received. For further information, see Part I, Item 1A, “Risk Factors—We purchase most of our media from Google, and our business could be adversely affected if Google takes actions that are adverse to our interests.”
We first offered our products and services solely through third-party agencies and resellers that, in turn, offered them to their end advertiser clients. In 2007, we began to allocate resources to focus on sales to national or regional businesses with multiple locations, such as franchisors, which we refer to as national brands. Because the sale to agencies, resellers and national brands involves negotiations with businesses that generally represent an aggregated group of SMB advertisers, we group them together as our National Brands, Agencies and Resellers channel. In 2006, we made the strategic decision to invest in creating a direct local sales force and began selling our products and services through our IMCs. We refer to sales through our IMCs as our Direct Local channel. Sales in the Direct Local channel accounted for 75% of our revenue in 2010 and 70% of our revenue in 2009. Our ongoing investment in increasing the number of our IMCs has been the principal engine for our growth, and it is our largest operating expense.
In December 2006, we entered our first market outside of North America through a joint venture in Australia. On September 11, 2009, we acquired the remaining interest in our Australian joint venture. In connection with the ReachLocal Australia acquisition, we recognized a non-cash gain of $16.2 million in 2009. We now own all our international operations and currently have sales operations
29
Table of Contents
in Australia, Germany, the United Kingdom and Canada. At December 31, 2010, 106 of our 665 total IMCs were located outside of North America.
On February 22, 2010, we acquired SMB:LIVE, which included the team and core technology for our ReachCast solution launched later that year, for consideration of up to approximately $8.5 million in cash and stock. On the closing date, we paid $2.8 million in cash. The balance of the purchase price, or the SMB Deferred Consideration, of up to $5.7 million will be payable based upon the achievement of certain employee retention milestones through February 2012. Approximately $4.7 million of the SMB Deferred Consideration is payable in 364,692 shares of our common stock, based on our initial public offering price of $13.00 per share, and approximately $1.0 million will be payable in cash. As the SMB Deferred Consideration is contingent upon retention objectives with regard to the acquired employees, we will recognize such amounts as compensation expense over the period in which the SMB Deferred Consideration may be earned.
In June 2010, we beta launched Bizzy, our customer retention and acquisition platform, that enables SMBs to connect to and communicate with their customer base. In November 2010, we evolved the Bizzy platform into a personalized local business recommendation engine for consumers.
On February 8, 2011, the Company acquired all of the outstanding member interests of DealOn, for consideration of up to approximately $9.7 million in cash and stock. The consideration is subject to a working capital adjustment if the net working capital is less than zero, which is expected to reduce the purchase price by approximately $0.2 million. On the closing date, the Company paid $5.8 million in cash and issued 82,878 shares of its common stock. The balance of the purchase price (the “DealOn Deferred Consideration”) is estimated to total up to $1.5 million and 22,095 common shares of the Company’s common stock, which are both payable, subject to adjustment under the terms of the acquisition agreement, in three installments, with 50% payable in February 2012, 25% payable in August 2012 and 25% payable in February 2013.
We were formed in 2003 and remained a development-stage company until the end of 2004. Prior to 2007, we financed our operations and capital expenditures through private sales of preferred stock. Since 2007, we have financed our operations, our expansion of our IMC sales force and the extension of our Direct Local channel into new territories through cash provided by operations. Deferred revenue arising from prepayment by the majority of our Direct Local clients and vendor trade financing are major components of our cash flow from operations. Although we expect that cash flow from operations, existing cash balances and proceeds from our 2010 initial public offering will be sufficient to continue funding our expansion activities, these investments, including investments in developing new products and services for our clients and potential additional acquisitions, could require us to seek additional equity or debt financing, and that financing may not be available on terms favorable to us or at all. In addition, expansion in the number of IMCs and rapid expansion of new products and services for our clients could require significant capital and entail non-capitalized expenses that could diminish our income from operations.
30
Table of Contents
Business Model and Operating Metrics
Our Direct Local channel has grown rapidly. As a percentage of revenue, Direct Local revenue has increased to 75% in 2010 from 70% in 2009. Growth in Direct Local revenue is primarily driven by the growth in the number of IMCs and increases in IMC productivity.
Typically, each month we hire one to two classes of 20-30 IMCs, with the hiring weighted towards the first ten months of the year. We refer to IMCs with 12 months or less of experience as Underclassmen. With each new class of Underclassmen, we track how they are performing relative to a standard level of revenue growth and other performance metrics for each month after their training. Understanding the performance of past and current Underclassmen allows us to adjust our investment in additional Underclassmen in the event we detect significant changes in their productivity.
We believe the key factors that affect the productivity of our IMCs are:
| • | IMC Tenure. As IMCs mature, they, on average, grow their advertiser base or sell additional products to existing advertisers, resulting in greater revenue productivity. In particular, Upperclassmen, those IMCs with more than 12 months of employment, are more productive than Underclassmen. As more and more IMCs mature and become Upperclassmen, as Upperclassmen become a higher percent of total IMCs, and as existing Upperclassmen mature, we expect overall IMC productivity to increase. |
| • | Macroeconomic Conditions. Macroeconomic conditions directly impact the amount of money SMBs allocate to market their business. Commencing in mid-2008, IMC productivity was significantly impacted by the economic recession as some of our SMB clients were forced to close or temporarily suspend their operations, while others curtailed their marketing expenditures in light of a contraction in consumer spending. At the end of 2009 and throughout 2010, our IMC productivity remained higher than those levels experienced at the end of 2008. However, we believe the economic conditions remain challenging, particularly in North America. This has impacted new advertiser acquisition more than sales to existing advertisers. |
| • | Number of Products. We believe that expanding our comprehensive suite of online marketing and reporting products and services will allow us to generate more revenue from each SMB relationship. Prior to 2009, we primarily offered a single product, ReachSearch. Since then, we have launched our ReachDisplay and our remarketing products in 2009 and our TotalLiveChat and ReachCast products in 2010. In 2011, through our acquisition of DealOn, we offer a daily deals product. |
| • | IMC Capacity. We continually endeavor to enhance the productivity of our IMCs. Our business model therefore contemplates additional investments in technology and support personnel to assist our IMCs in managing and maintaining existing clients in order to increase their capacity to acquire new clients. For example, we have invested in expanding our existing customer support team to include campaign performance personnel, who have assumed many of the day-to-day campaign management obligations of our IMCs. |
| • | Client Tenure. One of the most time-consuming activities for our IMCs is the process of prospecting, arranging a time to visit and obtaining the first order for our products and services from a new client. A key factor in IMC productivity is therefore the success of our efforts to continue to sell our products and services to existing clients, which requires significantly less of an IMC’s time. We believe that a measure of the success of these efforts is the percentage of our revenue generated by sales to clients with different tenures. For this purpose, on an annual basis, we divide our clients into three groups to measure their revenue contribution: |
| • | Trial Period Clients. We characterize a client’s initial four months as the “trial period” because the most common term for a new client’s first agreement is four months, and we believe that four months is the shortest period in which performance of an advertising campaign can be fully assessed. Trial period clients represented 28%, 32% and 42% of our revenue for years ended December 31, 2010, 2009 and 2008, respectively. |
| • | First-Year Post-Trial Clients. We characterize a client that continues to advertise through us after its four-month trial period and for up to one year after its trial period as a First-Year Post-Trial Client. First-Year Post-Trial Clients represented 38%, 43% and 42% of our revenue for years ended December 31, 2010, 2009 and 2008, respectively. |
| • | Long-Term Clients. We characterize clients that continue to advertise through us for more than one year after their trial period as Long-Term Clients. Long-Term Clients represented 34%, 25% and 16% of our revenue for years ended December 31, 2010, 2009 and 2008, respectively. |
31
Table of Contents
We regularly review a number of other financial and operating metrics to evaluate our business, determine the allocation of resources and make decisions regarding business strategies. The following table shows certain key operating metrics for the three years ended December 31, 2010, 2009 and 2008.
| December 31, | ||||||||||||
| 2010 | 2009 | 2008 | ||||||||||
| Number of IMCs (at period end): |
||||||||||||
| Upperclassmen |
286 | 235 | 80 | |||||||||
| Underclassmen |
379 | 280 | 337 | |||||||||
| Total |
665 | 515 | 417 | |||||||||
| Underclassmen Expense (in thousands) (1) |
$ | 36,073 | $ | 26,824 | $ | 27,886 | ||||||
| Active Advertisers (at period end) (2) |
16,900 | 14,700 | 11,600 | |||||||||
| Active Campaigns (at period end) (3) |
22,700 | 18,600 | 13,500 | |||||||||
| (1) | See Part II, Item 7, “Management’s Discussion and Analysis of Financial Condition and Results of Operations – Non-GAAP Financial Measures” for our definition of Underclassmen Expense. |
| (2) | See Part II, Item 6, “Selected Financial Data” for our definition of Active Advertisers. |
| (3) | See Part II, Item 6, “Selected Financial Data” for our definition of Active Campaigns. |
Number of IMCs
Our ongoing investment in increasing the number of our IMCs has been the principal engine for our growth. In particular, our growth is driven by the increase in the number of Upperclassmen, who are significantly more productive than our Underclassmen. As such, we believe that our ability to grow our business is highly dependent on our ability to grow the number of our Upperclassmen. Beyond our hiring practices, which determine the number of IMCs to be hired as well as the rate at which we hire them, the increase in the number of Upperclassmen depends primarily on the productivity of Underclassmen, as the majority of Underclassmen attrition has been involuntary and is based on performance relative to a standard level of revenue growth and other performance metrics determined by us. We do not expect all Underclassmen to become Upperclassmen, and our investment decisions anticipate the cost of attrition. The performance of past and current IMCs allows us to adjust our investment model in the event there are significant changes in macroeconomic or competitive conditions.
Due to the economic recession, we temporarily ceased hiring IMCs in North America during the first quarter of 2009 and have hired IMCs at a slower rate than in prior periods beginning at the end of March 2009. As a result, the number of our Upperclassmen declined in the first quarter of 2010 and grew at a slower rate in 2010 than in 2009. During 2010, we resumed the levels of hiring we experienced in early 2008. In the first half of 2010, we both raised the minimum standard we use to graduate Underclassmen and reduced the time to terminate unproductive Underclassmen. These initiatives have resulted in improving the overall productivity of our Upperclassmen.
Underclassmen Expense
Underclassmen do not in the aggregate make a positive contribution to operating income. Our largest operating expenses include the hiring, training and retention of Underclassmen in support of our goal of developing more Upperclassmen.
Underclassmen Expense is a number we calculate to approximate our investment in Underclassmen and is comprised of the selling and marketing expenses we allocate to Underclassmen during a reporting period. The amount includes the direct salaries and allocated benefits of the Underclassmen (excluding commissions), training and sales organization expenses, including depreciation, allocated based on relative headcount and marketing expenses allocated based on relative revenue. While we believe that Underclassmen Expense provides useful information regarding our approximate investment in Underclassmen, the methodology we use to arrive at our estimated Underclassmen Expense was developed internally by management, is not a concept or method recognized by GAAP and other companies may use different methodologies to calculate or approximate measures similar to Underclassmen Expense. Accordingly, our calculation of Underclassmen Expense may not be comparable to similar measures used by other companies.
We determine the amount to invest in Underclassmen Expense based on our objectives for development of the business and the key factors affecting IMC productivity described above.
32
Table of Contents
The increase in Underclassmen Expense in 2010 as compared to the preceding year was primarily attributable to our decision to recommence hiring in the second quarter of 2009 as well as the inclusion of the operations of ReachLocal Australia, both of which have led to an increase in Underclassmen in 2010.
Active Advertisers and Active Campaigns
We track the number of Active Advertisers and Active Campaigns to evaluate the growth, scale and diversification of our business. We also use these metrics to determine the needs and capacity of our sales forces, our support organization and other personnel and resources.
Active Advertisers and Active Campaigns increased in 2010 due to an increase in the number of IMCs selling our products, an increase in their productivity, and from the growth of our National Brands, Agencies and Resellers channel. The average number of Active Campaigns per an Active Advertiser has increased since 2008 as our SMB clients have purchased products such as ReachDisplay, TotalLiveChat and ReachCast in addition to ReachSearch.
Basis of Presentation
Sources of Revenue
We derive our revenue principally from the provision and sale of online advertising to our clients. Revenue includes the sale of our ReachSearch, ReachDisplay, remarketing and other products based on a package pricing model in which our clients commit to a fixed fee that includes the media, the optimization, reporting and tracking technologies of the RL Platform, and the personnel dedicated to support and manage their campaigns; the sale of our ReachCast, TotalTrack and TotalLiveChat products; and set-up, management and service fees associated with these products and other services. We distribute our products and services directly through our sales force of IMCs, who are focused on serving SMBs in their local markets through an in-person, consultative process, which we refer to as our Direct Local channel, as well as a separate sales force targeting our National Brands, Agencies and Resellers channel. The sales cycle for sales to SMBs ranges from one day to over a month. Sales to our National Brands, Agencies and Resellers clients generally require several months.
We typically enter into multi-month agreements for the delivery of our ReachSearch, ReachDisplay and ReachCast products. Under our agreements, our SMB clients typically pay, in advance, a fixed fee on a monthly basis, which includes all charges for the included technology and media services, management, third-party content and other costs and fees. We record these prepayments as deferred revenue and only record revenue for income statement purposes as we purchase media and perform other services on behalf of clients. Generally, when at least 85% of requisite purchases and other services have occurred and an additional campaign cycle remains under the agreement, we make an additional billing or automatic collection for the next campaign cycle.
Our National Brands, Agencies and Resellers clients enter into agreements of various lengths or that are indefinite. Our National Brands, Agencies and Resellers clients either pay in a manner similar to Direct Local clients or are extended credit privileges with payment generally due in 30 to 60 days. There were $3.3 million of related accounts receivables at December 31, 2010.
Cost of Revenue
Cost of revenue consists primarily of costs of online media acquired from third-party publishers. From time to time, publishers offer the Company rebates based upon various factors and operating rules, including the amount of media purchased. Cost of revenue also includes third-party telephone and information services costs, data center and third-party hosting costs, credit card processing fees, third-party content and other direct costs.
In addition, cost of revenue includes costs to initiate, operate and manage clients’ campaigns, other than costs associated with the Company’s sales force, which are reflected as selling and marketing expenses. Cost of revenue includes salaries, benefits, bonuses and stock-based compensation for the related staff, including the cost of Web Presence Professionals who are the principal service providers for the Company’s ReachCast product, and allocated overhead such as depreciation expense, rent and utilities, as well as an allocable portion of our technical operations costs.
Operating Expenses
Selling and Marketing. Selling and marketing expenses consist primarily of personnel and related expenses for our selling and marketing staff, including salaries and wages, commissions, benefits, bonuses and stock-based compensation; travel and business costs; training, recruitment, marketing and promotional events; advertising; other brand building and product marketing expenses; and occupancy, technology and other direct overhead costs. A portion of the compensation for IMCs, sales management and other employees in the sales organization is based on commissions.
Product and Technology. Product and technology expenses consist primarily of personnel and related expenses for our product development and technology staff, including salaries, benefits, bonuses and stock-based compensation, and the cost of certain third-
33
Table of Contents
party service providers and other expenses, including occupancy, technology and other direct overhead costs. Technology operations costs, including related personnel and third-party costs, are included in product and technology expenses.
We capitalize a portion of costs for software development and, accordingly, include amortization of those costs as product and technology expenses as the RL Platform addresses all aspects of our activities, including supporting the IMC selling and consultation process, online publisher integration, efficiencies and optimization, providing insight to our clients into the results and effects of their online advertising campaigns and supporting all of the financial and other back-office functions of our business.
Following the acquisition of SMB:LIVE on February 22, 2010, product and technology expenses also include the amortization of the technology obtained in the acquisition and the expenses related to the deferred payment obligations for that acquisition related to product and technology personnel.
General and Administrative. General and administrative expenses consist primarily of personnel and related expenses for executive, legal, finance, human resources and corporate communications, including wages, benefits, bonuses and stock-based compensation, professional fees, insurance premiums and other expenses, including occupancy, technology and other direct overhead, certain costs in preparation to become a public company and other corporate expenses. During 2010 and 2009, we strengthened our management and corporate infrastructure, particularly in our finance department, and implemented financial reporting, compliance and other infrastructure in preparation for becoming a public company.
Critical Accounting Policies and Estimates
The preparation of our consolidated financial statements in conformity with U.S. generally accepted accounting principles, or GAAP, requires us to make estimates and assumptions that affect the reported amounts of assets and liabilities and disclosure of contingent assets and liabilities at the date of the consolidated financial statements and the reported amounts of revenue and expenses. We continually evaluate our estimates, judgments and assumptions based on available information and experience. Because the use of estimates is inherent in the financial reporting process, actual results could differ from those estimates.
Revenue Recognition
We recognize revenue for our services when all of the following criteria are satisfied:
| • | persuasive evidence of an arrangement exists; |
| • | services have been performed; |
| • | the selling price is fixed or determinable; and |
| • | collectability is reasonably assured. |
Generally, we recognize revenue as the cost for the third-party media is incurred, which is upon delivery of the advertising on behalf of our clients. We recognize revenue for our ReachSearch product as clicks are recorded on sponsored links on the various search engines and for our ReachDisplay product when the display advertisements record impressions or as otherwise provided in our agreement with the applicable publisher. The Company recognizes revenue for its ReachCast product on a straight line basis over the applicable service period for each campaign. We recognize revenue when we charge set-up, management or other fees on a straight line basis over the term of the related campaign contract or the completion of any obligation for services, if shorter. When we receive advance payments from our clients, we record these amounts as deferred revenue until the revenue is recognized. When we extend credit, we record a receivable when the revenue is recognized.
Our Direct Local clients, which represented 75% of revenue for 2010, generally prepay for services either by credit card, check or electronic debit prior to the commencement of each approximately 30-day cycle of a campaign.
When we sell through agencies, we either receive payment in advance of services or in some cases we extend credit. We pay each agency an agreed-upon commission based on the revenue we earn or cash we receive. Some agency clients who have been extended credit may offset the amount otherwise due to us by any commissions they have earned. We evaluate whether it is appropriate to record the gross amount of campaign revenue or the net amount earned after commissions. As we are the primary party obligated in the arrangement, subject to the credit risk and with discretion over both price and media, we recognize the gross amount of such sales as revenue and any commissions are recognized as a selling and marketing expense.
We also have a small number of resellers that integrate our product offerings and services, including ReachSearch, ReachDisplay, remarketing and TotalTrack, into their product offerings. In each case, the resellers integrate with our RL Platform through a custom API. Resellers are responsible for the price and specifications of the integrated product offered to their clients. Resellers pay us in arrears, net of commissions and other adjustments. We recognize revenue generated under reseller agreements net of the agreed-upon commissions and other adjustments earned or retained by the reseller, as we believe that the reseller has retained sufficient control and bears sufficient risks to be considered the primary obligor in those arrangements.
When we offer future incentives to our clients in exchange for minimum annual commitments, we estimate the amount of the future incentives that will be earned by our clients and defer a portion of the otherwise recognizable revenue. Our estimate is based upon a statistical analysis of previous campaigns for which such incentives were offered. Should a client not meet its minimum annual
34
Table of Contents
commitment and therefore no longer qualify for the incentive, we recognize the revenue previously deferred related to the estimated incentive. Our estimates are based upon historical actual results and unexpected changes in client purchasing patterns could render our estimates inaccurate.
Stock-based Compensation
We account for stock-based compensation based on fair value. We follow the attribution method that requires companies to reduce current stock-based compensation expenses by the effect of anticipated forfeitures. We estimate forfeitures based upon our historical experience, which has resulted in a small expected forfeiture rate.
The fair value of each award is estimated on the date of the grant and amortized over the requisite service period, which is the vesting period.
We use the Black-Scholes option pricing model to estimate the fair value of stock-based payment awards on the date of grant. Determining the fair value of stock-based awards at the grant date under this model requires judgment, including estimating our value per share of common stock, volatility, expected term and risk-free interest rate. The assumptions used in calculating the fair value of stock-based awards represent our best estimates based on management judgment and subjective future expectations. These estimates involve inherent uncertainties. If any of the assumptions used in the Black-Scholes model significantly changes, stock-based compensation for future awards may differ materially from the awards granted previously.
Prior to our initial public offering in May 2010, the fair values of the common stock underlying stock options granted were estimated by our board of directors, which intended all options granted to be exercisable at a price per share not less than the per share fair market value of our common stock underlying those options on the date of grant. In the absence of a public trading market, our board of directors considered numerous objective and subjective factors to determine its best estimate of the fair market value of our common stock as of the date of each option grant, including but not limited to, the following factors:
| • | transactions in our common stock; |
| • | third-party valuations of our common stock; |
| • | the rights, preferences and privileges of our preferred stock relative to the common stock; |
| • | our performance and stage of development; and |
| • | the likelihood of achieving a liquidity event for the shares of common stock underlying these stock options, such as an initial public offering or sale of our company, given prevailing market conditions. |
After our initial public offering, the fair values of our common stock underlying stock options granted were based on the market price of our common stock.
We granted stock options with the following exercise prices during 2010:
| Grant Dates |
Number of
Shares Underlying Options |
Exercise Price Per Share |
Estimated Fair Value Per Underlying Share as of Grant Date |
Intrinsic Value Per Share at Date of Grant |
||||||||||||
| May 2010 |
1,300,750 | $ | 13.00 | $ | 13.00 | $ | — | |||||||||
| July 2010 |
119,750 | $ | 13.48 | $ | 13.48 | $ | — | |||||||||
| October 2010 |
210,150 | $ | 17.02 | $ | 17.02 | $ | — | |||||||||
We estimate the fair value of each option award on the date of grant using the Black-Scholes option pricing model. We determined weighted average valuation assumptions as follows:
| • | Volatility. As we do not have a trading history for our common stock, the expected stock price volatility for our common stock was estimated by taking the median historic price volatility for industry peers based on daily price observations over a period equivalent to the expected term of the stock option grants. Industry peers consist of several public companies in the technology industry similar in size, stage of life cycle and financial leverage. We did not rely on implied volatilities of traded options in our industry peers’ common stock because the volume of activity was relatively low. |
| • | Expected term. The expected term was estimated using the simplified method allowed under SEC Staff Accounting Bulletin No. 107, Share-Based Payment. We use this method because we do not have adequate historical data to estimate future terms and we are unable to obtain objective, measurable and comparative historical data of comparable companies. |
| • | Risk free interest rate. The risk free interest rate is based on the yields of U.S. Treasury securities with maturities similar to the expected term of the options for each option group. |
| • | Dividend yield. We have never declared or paid any cash dividends and do not presently plan to pay cash dividends in the foreseeable future. Consequently, we used an expected dividend yield of zero. |
35
Table of Contents
The following table summarizes the assumptions relating to our stock options granted during 2010:
| Expected dividend yield |
0 | % | ||
| Risk free interest rate |
1.91 | % | ||
| Expected life, in years |
4.75 | |||
| Expected volatility |
56 | % |
In addition, we estimate the forfeiture rate using our historical experience with forfeitures. We review the estimated forfeiture rates each period end and make changes as factors affecting the forfeiture rate calculations and assumptions change.
Using the Black-Scholes option pricing model, we recorded non-cash stock-based compensation expenses related to employee stock options granted of approximately $5.2 million and $2.7 million during 2010, and 2009, respectively, which includes $1.2 million of SMB:LIVE deferred stock compensation during 2010. At December 31, 2010, we had unrecorded compensation costs of $14.5 million related to unvested stock options and deferred stock consideration. The unrecognized compensation expense is expected to be recognized over a weighted average period of 1.4 years.
During 2010, we also issued 135,000 restricted stock units. Twenty-five percent of the restricted stock units vest on the first anniversary of the vesting commencement date, and the remainder of the units vests in equal monthly installments over the next 36 months thereafter. During 2010 and 2009, we recorded non-cash stock-based compensation expense of approximately $0.6 million and $0.3 million related to restricted stock units, respectively. At December 31, 2010, we had $1.6 million of unrecognized compensation expense related to unvested restricted stock units. Changes in assumptions could impact the amount of restricted stock compensation expense.
Software Development Costs
We capitalize our costs to develop internal-use software when management has determined the development efforts will result in new or additional functionality or results in new products. Costs incurred prior to meeting these criteria and costs associated with ongoing maintenance are expensed as incurred. We track our costs by project and by each release and objectively determine which projects resulted in additional functionality or new products for which we can improve our offerings and market presence. Our developers, engineers and quality assurance staff currently estimate their time spent on various projects on a weekly basis so we may determine the approximate amount of costs that should be capitalized. Our senior management team reviews these estimates to determine the appropriate level of capitalization. We monitor our existing capitalized software and reduce its carrying value as the result of releases that render previous features or functions obsolete or otherwise reduce the value of previously capitalized costs.
Costs capitalized as software development costs are amortized on a straight-line basis over the estimated useful life of the software of three years. Amortization of those costs is included in product and technology expenses as the RL Platform addresses all aspects of our activities, including supporting the IMC selling and consultation process, online publisher integration, efficiencies and optimization, providing insight to our clients into the results and effects of their online advertising campaigns and supporting all of the financial and other back office functions of our business.
Income Taxes
We use the liability method of accounting for income taxes. Significant judgment is required in determining the consolidated provision for income taxes and evaluating our tax positions. In the ordinary course of business, there are many transactions and calculations for which the ultimate tax settlement is uncertain. As a result, we recognize tax liabilities based on estimates of whether additional taxes and interest will be due. These tax liabilities are recognized when, despite our belief that our tax return positions are supportable, we believe that it is more likely than not that those positions may not be fully sustained upon review by tax authorities.
For the periods presented, income tax expense represents minimum income taxes imposed by state, foreign and local tax jurisdictions applicable to our activities. We are otherwise generating net operating losses in the various tax jurisdictions in which we operate. We believe that it is likely that taxes imposed by state, local and foreign jurisdictions will increase in magnitude, particularly to the extent we become profitable in certain foreign jurisdictions before the time we obtain profitability on a consolidated basis.
Due to a history of losses, we have provided a valuation allowance against our deferred tax assets as more fully described in Note 10 of the consolidated financial statements. The ability to utilize these losses, any future losses and any other tax credits or attributes may be restricted or eliminated by changes in our ownership, including potentially as a result of our public offering, changes in legislation and other rules affecting the ability to offset future taxable income with losses from prior periods. Future determinations on the need for a valuation allowance on our net deferred tax assets will be made on a quarterly basis, and our assessment at December 31, 2010 reflects a continued need for a valuation allowance.
As a result of the acquisition of the portion of ReachLocal Australia that we did not previously own, we recognized a non-cash gain of $16.2 million. We did not record an income tax provision on the gain since management intends to hold its investment in ReachLocal Australia permanently.
36
Table of Contents
As a result of the acquisition of SMB:LIVE, we recorded a one-time discrete deferred tax benefit of $0.7 million from intangible assets recorded on the date of acquisition.
We are required to file income tax returns in the United States and various foreign jurisdictions, which requires us to interpret the applicable tax laws and regulations in effect in such jurisdictions. Such returns are, and from time to time, have been subject to audit by the various federal, state and foreign taxing authorities, which may disagree with our tax positions. We believe that our accruals for tax liabilities are adequate for all open audit years based on our assessment of many factors, including past experience and interpretations of tax law. We review and update our estimates in light of changing facts and circumstances, such as the closing of a tax audit, the lapse of a statute of limitations or a material change in estimate. To the extent that the final tax outcome of these matters differs from our expectations, such differences will impact income tax expense in the period in which such determination is made.
We recognize interest and penalties related to unrecognized tax benefits within the income tax expense line in the accompanying consolidated statement of operations and any accrued amounts are included within the related tax liability line in the consolidated balance sheet.
Goodwill and Intangible Assets
At December 31, 2010, we had $34.1 million of goodwill, which resulted from the acquisition of the portion of ReachLocal Australia that we did not previously own and the acquisition of SMB:LIVE. In addition, in accounting for the acquisitions of ReachLocal Australia and SMB:LIVE, we recorded other intangible assets related to pre-existing client relationships and purchased technology, respectively. We report finite-lived, acquisition-related intangible assets at fair value, net of accumulated amortization. Identifiable intangible assets are amortized on a straight-line basis over their estimated useful lives of three years. Straight-line amortization is used because no other pattern over which the economic benefits will be consumed can be reliably determined. We evaluate our goodwill for impairment using a two-step process that is performed at least annually, or whenever events or circumstances indicate that goodwill may be impaired. The first step is a comparison of the fair value of an internal reporting unit with its carrying amount, including goodwill. For 2010, we had reporting units representing the various domestic and international markets in which we currently operate. If the fair value of the reporting unit exceeds its carrying value, goodwill of the reporting unit is not considered impaired and the second step is unnecessary. If the carrying value of the reporting unit exceeds its fair value, the second step is performed to measure the amount of impairment by comparing the carrying amount of the goodwill to a determination of the implied value of the goodwill. If the carrying amount of goodwill is greater than the implied value, an impairment is recognized for the difference.
We evaluate our intangible assets for impairment whenever events or circumstances indicate an impairment may exist. The impairment loss is the amount by which the carrying value of the asset exceeds its fair value. We estimate fair value utilizing the projected discounted cash flow method and a discount rate determined by our management to be commensurate with the risk inherent in our current business model. When calculating fair value, we make assumptions regarding estimated future cash flows, discount rates and other factors. No impairment of goodwill or intangible assets was recorded during 2010 or 2009.
37
Table of Contents
Results of Operations
Comparison of the Years Ended December 31, 2010, 2009 and 2008
| Year
Ended December 31, |
||||||||||||
| 2010 | 2009 | 2008 | ||||||||||
| (in thousands, except per share data) |
||||||||||||
| Revenue |
$ | 291,689 | $ | 203,117 | $ | 146,687 | ||||||
| Cost of revenue (1) |
159,019 | 112,218 | 77,496 | |||||||||
| Operating expenses: |
||||||||||||
| Selling and marketing (1) |
110,024 | 76,175 | 61,054 | |||||||||
| Product and technology (1) |
11,239 | 5,167 | 2,938 | |||||||||
| General and administrative (1) |
23,695 | 15,534 | 12,128 | |||||||||
| Total operating expenses |
144,958 | 96,876 | 76,120 | |||||||||
| Loss from operations |
(12,288 | ) | (5,977 | ) | (6,929 | ) | ||||||
| Gain on acquisitions of ReachLocal Australia |
— | 16,223 | — | |||||||||
| Equity in losses of ReachLocal Australia |
— | — | (813 | ) | ||||||||
| Other income (expense), net |
601 | (7 | ) | 889 | ||||||||
| Income (loss) before provision for income taxes |
(11,687 | ) | 10,239 | (6,853 | ) | |||||||
| Provision (benefit) for income taxes |
(540 | ) | 217 | 145 | ||||||||
| Net income (loss) |
(11,147 | ) | 10,022 | (6,998 | ) | |||||||
| Undistributed income attributable to preferred stockholders |
— | 8,638 | — | |||||||||
| Net income (loss) available to common stockholders |
$ | (11,147 | ) | $ | 1,384 | $ | (6,998 | ) | ||||
| Net income (loss) per share available to common stockholders: |
||||||||||||
| Basic |
$ | (0.56 | ) | $ | 0.22 | $ | (1.23 | ) | ||||
| Diluted |
$ | (0.56 | ) | $ | 0.18 | $ | (1.23 | ) | ||||
| Weighted average common shares used in computation of net income (loss) per share available to common stockholders: |
||||||||||||
| Basic |
19,867 | 6,283 | 5,677 | |||||||||
| Diluted |
19,867 | 7,901 | 5,677 | |||||||||
| The following earnings per share information is presented as if all preferred shares were converted into common stock as of the beginning of the period presented. |
||||||||||||
| Pro-forma net income (loss) per share, as if converted: |
||||||||||||
| Basic |
$ | (0.42 | ) | $ | 0.44 | $ | (0.31 | ) | ||||
| Diluted |
$ | (0.42 | ) | $ | 0.41 | $ | (0.31 | ) | ||||
| Pro-forma weighted average common shares used in computation of net income (loss) per share, as if converted: |
||||||||||||
| Basic |
26,286 | 22,995 | 22,389 | |||||||||
| Diluted |
26,286 | 24,613 | 22,389 | |||||||||
38
Table of Contents
| (1) | Stock-based compensation, net of capitalization, and depreciation and amortization included in above line items (in thousands): |
| Year Ended December 31, | ||||||||||||
| 2010 | 2009 | 2008 | ||||||||||
| Stock-based compensation: | ||||||||||||
| Cost of revenue |
$ | 244 | $ | 86 | $ | 34 | ||||||
| Selling and marketing |
1,218 | 566 | 338 | |||||||||
| Product and technology |
1,183 | 164 | 73 | |||||||||
| General and administrative |
3,123 | 2,145 | 1,366 | |||||||||
| $ | 5,768 | $ | 2,961 | $ | 1,811 | |||||||
| Depreciation and amortization: | ||||||||||||
| Cost of revenue |
$ | 364 | $ | 261 | $ | 186 | ||||||
| Selling and marketing |
1,060 | 892 | 596 | |||||||||
| Product and technology |
4,202 | 1,765 | 916 | |||||||||
| General and administrative |
1,078 | 430 | 154 | |||||||||
| $ | 6,704 | $ | 3,348 | $ | 1,852 | |||||||
Revenue
| Year Ended December 31, | ||||||||||||||||||||
| 2010 | 2009 | 2008 | 2010-2009 % Change |
2009-2008 % Change |
||||||||||||||||
| (in thousands) | ||||||||||||||||||||
| Direct Local |
$ | 217,846 | $ | 141,492 | $ | 82,852 | 54.0 | % | 70.8 | % | ||||||||||
| National Brands, Agencies and Resellers |
73,843 | 61,625 | 63,835 | 19.8 | (3.5 | ) | ||||||||||||||
| Total revenue |
$ | 291,689 | $ | 203,117 | $ | 146,687 | 43.6 | % | 38.5 | % | ||||||||||
| At period end: |
||||||||||||||||||||
| Number of IMCs: |
||||||||||||||||||||
| Upperclassmen |
286 | 235 | 80 | 21.7 | % | 193.8 | % | |||||||||||||
| Underclassmen |
379 | 280 | 337 | 35.4 | (16.9 | ) | ||||||||||||||
| Total |
665 | 515 | 417 | 29.1 | % | 23.5 | % | |||||||||||||
| Active Advertisers |
16,900 | 14,700 | 11,600 | 15.0 | % | 26.7 | % | |||||||||||||
| Active Campaigns |
22,700 | 18,600 | 13,500 | 22.0 | % | 37.8 | % | |||||||||||||
The increase of $76.4 million in our Direct Local revenue in 2010 reflects an incremental $24.4 million of Direct Local revenue attributable to ReachLocal Australia, which we began to consolidate after our September 2009 acquisition of the portion of ReachLocal Australia that we did not already own. Excluding the impact of the ReachLocal Australia acquisition, the incremental revenue contributed by our Upperclassmen IMCs who were already Upperclassmen at the end of 2009 contributed the largest portion of the revenue growth in 2010. The increased contribution of our new Upperclassmen—that is, IMCs who were Underclassmen at the end of 2009 and subsequently became Upperclassmen in 2010—represented the next largest portion of revenue growth, followed by the revenue contributed by our new Underclassmen hired in 2010.
The increase of $12.2 million in our National Brands, Agencies and Resellers revenue was primarily due to an $8.5 million increase in revenue from our National Brands clients. The increase in National Brands client revenue was primarily due to the growth in the number of National Brands clients, both domestically and internationally, and to a lesser extent increased revenues from National Brands clients which were already clients in 2009. The growth in Agencies and Resellers revenues resulted from new Agencies acquired in 2010.
The increase of $58.6 million in our Direct Local revenue from 2008 to 2009 was primarily due to the increased productivity of our existing IMC sales force. In particular, the increased contribution of our new Upperclassmen—that is, IMCs who were Underclassmen in 2008 who became Upperclassmen in 2009—represented the largest portion of the revenue growth. The increase in revenue from our existing Upperclassmen—that is, IMCs who were already Upperclasssmen in 2008, represented the next largest portion of the revenue growth, followed closely by the incremental revenue contributed by the new Underclassmen IMCs hired in 2009. The increase in productivity of our IMC sales force was primarily attributable to the increase in tenure of our existing IMCs in
39
Table of Contents
addition to the release of our ReachDisplay product. The increase in our Direct Local revenue in this period includes $6.1 million of revenue attributable to ReachLocal Australia from September 11, 2009.
The decrease of $2.2 million in our National Brands, Agencies and Resellers revenue from 2008 to 2009 was primarily due to a reduction in the number of agencies and resellers selling our products and services, as well as a reduction in the sales by our agencies and resellers. In no case was the reduction in revenue from a single agency or reseller material to the total National Brands, Agencies and Resellers revenue. We believe that the combination of macroeconomic conditions affecting advertising agencies in general during this period and a relative increase in our focus on the national brands portion of this channel were the primary factors affecting the sales reductions in this period. During this period, the revenue from our agencies and resellers declined by $8.8 million, which was partially offset by an increase of $6.6 million in revenue from our national brands.
Cost of Revenue
| Year
Ended December 31, |
Year
Ended December 31, |
|||||||||||||||||||||||||||||||
| 2010 | 2009 | 2008 | 2010-2009 % Change |
2009-2008 % Change |
2010 | 2009 | 2008 | |||||||||||||||||||||||||
| (in thousands) | (as a percentage of revenue) | |||||||||||||||||||||||||||||||
| Cost of revenue |
$ | 159,019 | $ | 112,218 | $ | 77,496 | 41.7 | % | 44.8 | % | 54.5 | % | 55.2 | % | 52.8 | % | ||||||||||||||||
The decrease in our cost of revenue as a percentage of revenue from 2009 to 2010 was primarily due to an increase in publisher rebates, the effect of changes in geographic, product and service mix and increased media buying efficiency. These decreases were partially offset by higher costs associated with the expansion of the campaign performance group as part of our strategy to enhance the productivity of our IMCs and improve customer satisfaction and the initial build-out of our web presence professionals group in advance of the launch of our ReachCast product in the fourth quarter of 2010. Publisher rebates as a percentage of revenue increased to 1.9% of revenue in 2010 from 1.2% in 2009, due to an increase in rebates from existing and new publishers in North America other than Google, and the full year inclusion of publisher rebates, predominantly from Google, of our ReachLocal Australia operation, which receives higher rebates as a percentage of revenue.
The increase in our cost of revenue as a percentage of revenue from 2008 to 2009 was primarily due to a decrease in publisher rebates, partially offset by a reduction in the relative amount of media we purchased to fulfill service requirements, increased media buying efficiency and reductions in negotiated merchant card processing rates. Publisher rebates as a percentage of revenue decreased from 4.1% in 2008 to 1.2% in 2009, due primarily to the cancellation, effective January 1, 2009, of our Google rebate in North America.
Our cost of revenue as a percentage of revenue will be affected in the future by the mix and relative amount of media we purchase to fulfill service requirements, the availability and amount of publisher rebates, the mix of products and services we offer, our media buying efficiency and, over the next several quarters, the increased costs of support and delivery as we grow our campaign performance and web presence professional groups.
Operating Expenses
We have significantly increased the scale of our operations. We intend to continue to increase our operating scale by increasing our sales force, product offerings and the infrastructure to support them. In managing our business for increased scale, we expect each category of operating expenses to increase. We are not a mature business where operating expense expansion can be tied to current revenue and revenue growth with a goal of meeting a particular immediate operating income target. Rather, we are intentionally incurring expenses to support our long-term growth plans, acknowledging that these investments may put pressure on near term periodic operating results and increase our operating expenses as a percentage of revenue.
40
Table of Contents
Selling and Marketing
| Year
Ended December 31, |
Year
Ended December 31, |
|||||||||||||||||||||||||||||||
| 2010 | 2009 | 2008 | 2010-2009 % Change |
2009-2008 % Change |
2010 | 2009 | 2008 | |||||||||||||||||||||||||
| (in thousands) | (as a percentage of revenue) | |||||||||||||||||||||||||||||||
| Salaries, benefits and other costs |
$ | 75,690 | $ | 50,466 | $ | 39,485 | 50.0 | % | 27.8 | % | 25.9 | % | 24.8 | % | 26.9 | % | ||||||||||||||||
| Commission expense |
34,334 | 25,709 | 21,569 | 33.5 | 19.2 | 11.8 | 12.7 | 14.7 | ||||||||||||||||||||||||
| Total selling and marketing |
$ | 110,024 | $ | 76,175 | $ | 61,054 | 44.4 | % | 24.8 | % | 37.7 | % | 37.5 | % | 41.6 | % | ||||||||||||||||
| Underclassmen Expense included above, excluding commissions |
$ | 36,073 | $ | 26,824 | $ | 27,886 | 34.5 | % | (3.8 | )% | ||||||||||||||||||||||
The increase in absolute dollars of salaries, benefits and other costs in selling and marketing expenses from 2009 to 2010 was primarily due to an increase in our IMC headcount and related recruiting, training, and facilities costs . The increase also reflects the inclusion of an incremental $7.2 million of non-commission expenses of ReachLocal Australia for 2010. We also, we incurred an incremental $1.9 million of non-commission expenses related to the beta launch of Bizzy and the acquisition of SMB:LIVE, for which there were no comparable amounts in 2009.
The increase in commission expense in absolute dollars for 2010 compared to 2009, was due to increases in our revenue in our sales channels. As a percentage of revenue, commission expense decreased due to a higher percentage of Direct Local channel revenue, including the additional Direct Local revenue from ReachLocal Australia, for which we pay lower commission rates. We do not expect continued decreases in commission expense as a percentage of revenue due to an expected higher percentage of Upperclassmen, who generally earn higher commission rates based on increased production.
The increase in absolute dollars in salaries, benefits and other costs in selling and marketing expenses from 2008 to 2009 was primarily due to an increase in our IMC headcount and related recruiting, training and facilities costs, and the expenses of ReachLocal Australia sales personnel after September 11, 2009. The decrease in selling and marketing expenses as a percentage of revenue from 2008 to 2009 was primarily due to increased revenue arising from increases in both the number of Upperclassmen and the relative percentage of Upperclassmen to all IMCs. Underclassmen Expense declined from 2008 to 2009 due to our decision not to hire Underclassmen in North America until the end of the first quarter of 2009 and to hire Underclassmen at a reduced rate for the remainder of 2009.
The increase in commission expense in absolute dollars from 2008 to 2009 was due to increases in our revenue in our sales channels. As a percentage of revenue, commission expense decreased due to a higher percentage of Direct Local channel revenue, for which we pay lower commission rates.
The increase in Underclassmen Expense in absolute dollars from 2009 to 2010 was primarily due to increased IMC hiring in 2010, as well as the inclusion of Australia’s Underclassmen starting on September 11, 2009. As we continue to invest in additional Underclassmen and retain additional Upperclassmen, selling and marketing expenses will continue to increase in absolute dollars.
41
Table of Contents
Product and Technology
| Year
Ended December 31, |
Year
Ended December 31, |
|||||||||||||||||||||||||||||||
| 2010 | 2009 | 2008 | 2010-2009 % Change |
2009-2008 % Change |
2010 | 2009 | 2008 | |||||||||||||||||||||||||
| (in thousands) | (as a percentage of revenue) | |||||||||||||||||||||||||||||||
| Product and technology |
$ | 11,239 | $ | 5,167 | $ | 2,938 | 117.5 | % | 75.9 | % | 3.9 | % | 2.5 | % | 2.0 | % | ||||||||||||||||
| Capitalized software development costs from product and technology resources |
8,431 | 3,971 | 1,390 | 112.3 | 185.7 | 2.9 | 2.0 | 0.9 | ||||||||||||||||||||||||
| Total product and technology costs expensed and capitalized |
$ | 19,670 | $ | 9,138 | $ | 4,328 | 115.3 | % | 111.1 | % | 6.7 | % | 4.5 | % | 3.0 | % | ||||||||||||||||
The increase in product and technology expenses in both absolute dollars and as a percentage of revenue from 2009 to 2010 was primarily attributable to a $3.1 million increase in compensation for additional headcount, which includes $1.7 million of compensation expense related to SMB:LIVE, for which no comparative amounts existed in 2009, and $0.8 million increase related to Bizzy. The remaining increase was due to a $2.1 million increase in amortization of capitalized software and intangibles; and $0.8 million increase in facilities and software maintenance costs and consultant fees primarily related to SMB:LIVE for which no comparative amounts existed in 2009.
The increase in the amount of software development costs capitalized both in absolute dollars and as a percentage of revenue in 2010 as compared to 2009 was a result of investment in the development of ReachCast, which commenced in the first quarter of 2010 with the acquisition of SMB:LIVE, the continuing development of Bizzy, and additional product enhancements to the RL Platform.
The increase in product and technology expenses in both absolute dollars and as a percentage of revenue from 2008 to 2009 was primarily attributable to a $0.9 million increase in compensation due to additional headcount and to an increase of $0.7 million in amortization expense of capitalized software development costs. The increase in product and technology headcount was due to a planned increase in our product development and engineering efforts focused on newly released products, including ReachDisplay, as well as the commencement of development of Bizzy. The increase in the amount of software development costs capitalized from 2008 to 2009 both in absolute dollars and as a percentage of revenue was a result of increased investment in new products, and RL Platform functionality.
We expect the amount of product and technology costs expensed and capitalized to increase in absolute dollars in the future due to the continued expansion of our product development efforts, including the ongoing development and roll-out of the technology acquired in our acquisitions of SMB:LIVE and DealOn and the increased costs associated with supporting a broader product offering. The amount of such costs capitalized will vary from period to period depending upon the status of our product development efforts.
General and Administrative
| Year
Ended December 31, |
Year
Ended December 31, |
|||||||||||||||||||||||||||||||
| 2010 | 2009 | 2008 | 2010-2009 % Change |
2009-2008 % Change |
2010 | 2009 | 2008 | |||||||||||||||||||||||||
| (in thousands) | (as a percentage of revenue) | |||||||||||||||||||||||||||||||
| General and administrative |
$ | 23,695 | $ | 15,534 | $ | 12,128 | 52.5 | % | 28.1 | % | 8.1 | % | 7.6 | % | 8.3 | % | ||||||||||||||||
The increase in general and administrative expenses in both absolute dollars and percentage of revenue from 2009 to 2010 was primarily due to an increase of $3.9 million in expense for additional administrative headcount and professional service fees necessary for our transition to being a public company. In addition, the incremental general and administrative expenses of ReachLocal Australia
42
Table of Contents
and SMB:LIVE added $2.5 million of general and administrative expenses. We also accrued $0.8 million of incremental expenses in connection with a memorandum of understanding to settle a class action lawsuit, which settlement is still subject to court approval.
The increase in general and administrative expenses in absolute dollars from 2008 to 2009 was primarily attributable to an increase of $2.9 million in salaries and benefits and a $0.4 million increase in facilities costs, each associated with an increase in our administrative headcount as we prepared to become a public company. General and administrative costs decreased as a percentage of revenue from 2008 to 2009 due to increased revenue.
We expect general and administrative expenses to increase in absolute dollars as we continue to add administrative personnel and incur additional professional fees and other expenses resulting from continued growth and the compliance requirements associated with being a public company.
Gain on Acquisition of ReachLocal Australia
Our purchase of the equity interests in ReachLocal Australia that we did not previously own on September 11, 2009 required that we recognize a gain associated with the proportionate fair value of the assets acquired and liabilities assumed to the carrying value of the shares we already owned. Prior to the acquisition, our interest in ReachLocal Australia had a carrying value of zero as a result of our share of the losses recognized under the equity method of accounting. On the date of the acquisition, our investment was adjusted to fair value, resulting in the one-time non-cash gain of $16.2 million.
Other Income (Expense), Net
The increase in other income in both absolute dollars and as a percentage of revenue from 2009 to 2010, is attributable to an increase in interest income during the current period.
The decrease in other income (expense), net from 2008 to 2009 was primarily attributable to lower yields on our investments as a result of the economic recession.
Provision (Benefit) for Income Taxes
The income tax benefit of $0.5 million for 2010 was primarily attributable to the acquisition of SMB:LIVE, in which we recorded a one-time discrete deferred tax benefit of $0.7 million, which was partially offset by state, local and foreign income taxes of $0.2 million.
43
Table of Contents
Non-GAAP Financial Measures
In addition to our GAAP results discussed above, we believe Adjusted EBITDA and Underclassmen Expense are useful to investors in evaluating our operating performance. For the twelve months ended December 31, 2010, 2009 and 2008 our Adjusted EBITDA and Underclassmen Expense were as follows:
| Year Ended December 31, | ||||||||||||
| 2010 | 2009 | 2008 | ||||||||||
| (in thousands) | ||||||||||||
| Non-GAAP Financial Measures (unaudited): |
||||||||||||
| Adjusted EBITDA (1) |
786 | 1,393 | (3,266 | ) | ||||||||
| Underclassmen Expense (2) |
36,073 | 26,824 | 27,886 | |||||||||
| (1) | Our management uses Adjusted EBITDA because (i) it is a key basis upon which our management assesses our operating performance; (ii) it may be a factor in the evaluation of the performance of our management in determining compensation; (iii) we use it, in conjunction with GAAP measures such as revenue and income (loss) from operations, for operational decision-making purposes; and (iv) we believe it is one of the primary metrics investors use in evaluating Internet marketing companies. |
Our management believes that Adjusted EBITDA permits an assessment of our operating performance, in addition to our performance based on our GAAP results, that is useful in assessing the progress of the business. By excluding (i) the effects of accounting for business combinations and associated acquisition and integration costs, which obscure the measurable performance of the business operations; (ii) depreciation and amortization and other non-operating income and expense, each of which may vary from period to period without any correlation to underlying operating performance; and (iii) stock-based compensation, which is a non-cash expense, we believe that we are able to gain a fuller view of the operating performance of the business. We provide information relating to our Adjusted EBITDA so that investors have the same data that we employ in assessing our overall operations. We believe that trends in our Adjusted EBITDA are a valuable indicator of operating performance on a consolidated basis and of our ability to produce operating cash flow to fund working capital needs, capital expenditures and investments in Underclassmen.
In addition, we believe Adjusted EBITDA and similar measures are widely used by investors, securities analysts, ratings agencies and other interested parties in our industry as a measure of financial performance and debt-service capabilities. Our use of Adjusted EBITDA has limitations as an analytical tool, and you should not consider it in isolation or as a substitute for analysis of our results as reported under GAAP. Some of these limitations are:
| • | Adjusted EBITDA does not reflect our cash expenditures for capital equipment or other contractual commitments; |
| • | Although depreciation and amortization are non-cash charges, the assets being depreciated and amortized may have to be replaced in the future, and Adjusted EBITDA does not reflect capital expenditure requirements for such replacements; |
| • | Adjusted EBITDA does not reflect changes in, or cash requirements for, our working capital needs; |
| • | Adjusted EBITDA does not consider the potentially dilutive impact of issuing equity-based compensation to our management team and employees; |
| • | Adjusted EBITDA does not reflect the potentially significant interest expense or the cash requirements necessary to service interest or principal payments on indebtedness we may incur in the future; |
| • | Adjusted EBITDA does not reflect income and expense items that relate to our financing and investing activities, any of which could significantly affect our results of operations or be a significant use of cash; |
| • | Adjusted EBITDA does not reflect certain tax payments that may represent a reduction in cash available to us; and |
| • | Other companies, including companies in our industry, calculate Adjusted EBITDA measures differently, which reduces their usefulness as a comparative measure. |
Adjusted EBITDA is not intended to replace operating income (loss), net income (loss) and other measures of financial performance reported in accordance with GAAP. Rather, Adjusted EBITDA is a measure of operating performance that you may consider in addition to those measures. Because of these limitations, Adjusted EBITDA should not be considered as a measure of discretionary cash available to us to invest in the growth of our business. We compensate for these limitations by relying primarily on our GAAP results, including cash flows provided by operating activities, and using total Adjusted EBITDA as a supplemental financial measure.
The following table presents a reconciliation of Adjusted EBITDA to our loss from operations for each of the periods indicated:
| Year Ended December 31, | ||||||||||||
| 2010 | 2009 | 2008 | ||||||||||
| (in thousands) | ||||||||||||
| Loss from operations |
$ | (12,288 | ) | $ | (5,977 | ) | $ | (6,929 | ) | |||
| Add: |
||||||||||||
| Stock-based compensation, net |
5,768 | 2,961 | 1,811 | |||||||||
| Depreciation and amortization |
6,704 | 3,348 | 1,852 | |||||||||
| Acquisition and integration costs |
602 | 389 | — | |||||||||
| Amortization of step-down in deferred revenue on acquisition of ReachLocal Australia, net of tax |
— | 672 | — | |||||||||
| Adjusted EBITDA |
$ | 786 | $ | 1,393 | $ | (3,266 | ) | |||||
| (2) | Underclassmen Expense is a number we calculate to approximate our investment in Underclassmen and is comprised of the selling and marketing expenses we allocate to Underclassmen during a reporting period. The amount includes the direct salaries and allocated benefits of the Underclassmen (excluding commissions), training and sales organization expenses including depreciation allocated based on relative headcount and marketing expenses allocated based on relative revenue. While we believe that Underclassmen Expense provides useful information regarding our approximated investment in Underclassmen, the methodology we use to arrive at our estimated |
44
Table of Contents
| Underclassmen Expense was developed internally by the company, is not a concept or method recognized by GAAP and other companies may use different methodologies to calculate or approximate measures similar to Underclassmen Expense. Accordingly, our calculation of Underclassmen Expense may not be comparable to similar measures used by other companies. |
Liquidity and Capital Resources
| Year Ended December 31, | ||||||||||||
| 2010 | 2009 | 2008 | ||||||||||
| Consolidated Statements of Cash Flow Data: |
||||||||||||
| (in thousands) |
||||||||||||
| Net cash provided by operating activities |
$ | 17,675 | $ | 14,308 | $ | 12,062 | ||||||
| Net cash provided by (used in) investing activities |
(18,327 | ) | (16,862 | ) | 17,165 | |||||||
| Net cash provided by (used in) financing activities |
44,097 | (979 | ) | 1,323 | ||||||||
| Capital Expenditures (1) |
10,078 | 5,805 | 5,152 | |||||||||
| (1) | Represents purchases of property and equipment and the amount of software development costs capitalized, on an aggregate basis, excluding stock-based compensation and the acquisition of ReachLocal Australia (see Note 4 to the consolidated financial statements). |
At December 31, 2010, we had cash and cash equivalents of $79.9 million and short-term investments of $8.2 million. Cash and cash equivalents consist of cash, money market accounts and certificates of deposit. Short term investments consist of certificates of deposit with original maturities in excess of three months. To date, we have experienced no loss of our invested cash, cash equivalents or short-term investments. We cannot, however, provide any assurances that access to our invested cash, cash equivalents and short-term investments will not be impacted by adverse conditions in the financial markets.
At December 31, 2010, we had no long-term indebtedness for borrowed money and are not subject to any restrictive bank covenants. At December 31, 2010, we had $0.8 million in restricted certificates of deposit to secure letters of credit issued to landlords and as security for certain other operating activities.
At December 31, 2010, our contractual or purchase commitments for capital expenditures that were not reflected on our balance sheet as a liability were less than $0.4 million, such amounts representing unfilled purchase orders of computer equipment. In addition, at December 31, 2010, we had significant internal product and technology resources working on projects that met the criteria for capitalization as software development costs and others that did not, although none of the projects in process were long-term projects (greater than one year). The amount capitalized for such projects in future periods will be evaluated by management and will impact the portion of costs for those internal resources that reduces net cash provided by operating activities and the portion of such costs that reduces net cash provided by investing activities. Funding for the committed capital expenditures, including software development costs, is expected to be provided by operating cash flow.
Prior to 2007, we financed our operations and capital expenditures through private sales of preferred stock. Since 2007, we have financed our operations, our expansion of our IMC salesforce and the extension of our Direct Local channel into new territories through cash provided by operations. Deferred revenue arising from prepayment by the great majority of our clients and vendor trade financing, principally for the purchase of media, are major components of our cash flow from operations, and the cash provided by deferred revenue and accounts payable has increased since the beginning of 2007 as our business has continued to grow. In general, to the extent our revenue from our Direct Local channel continues to grow, we would expect both the amount of deferred revenue from customer prepayments and the amount of vendor financing for purchased media to increase, which, subject to offset from changes in other operating costs, cash demands or vendor terms, would result in an increase in net cash provided by operations. Should revenue from the Direct Local channel decrease, the amount of deferred revenue and vendor financing would likely decrease, which, subject to changes in other accounts, would cause net cash provided by operations to be reduced, potentially to a negative amount.
Although we expect that cash flow from operations, existing cash balances and proceeds from our initial public offering will be sufficient to continue funding our expansion activities, these investments, including investments in developing new products and services for our clients, could require us to seek additional equity or debt financing, and that financing may not be available on terms favorable to us or at all. In addition, expansion in the number of IMCs and rapid expansion of new products and services for our clients could require significant capital and entail non-capitalized expenses that could diminish our income from operations. Further, in light of the additional capital provided by our initial public offering and assuming a stable macroeconomic climate and continued favorable operating cash flow, we intend to continue to increase our investment in Underclassmen and in the development of new products.
Operating Activities
Our cash flow from operating activities in 2010 resulted primarily from changes in our operating assets and liabilities, with accounts payable and accrued liabilities increasing $10.3 million and deferred revenue and rent increasing $8.0 million, both due to the growth of our business. We had a net loss in 2010 of $11.1 million, which included non-cash depreciation and amortization of $6.7 million and non-cash stock-based compensation of $5.8 million.
Operating activities provided $14.3 million of cash in 2009. The cash flow from operating activities primarily resulted from changes in our operating assets and liabilities, with accounts payable and accrued liabilities increasing $8.4 million and deferred
45
Table of Contents
revenue increasing $6.2 million. Accounts payable at December 31, 2009 includes approximately $2.1 million in deferred expenses relating to our initial public offering. Net income of $10.0 million included a non-cash gain of $16.2 million from our purchase of the remaining interest in ReachLocal Australia.
Our operating activities provided $12.1 million of cash in 2008, with accounts payable and accrued liabilities increasing $10.8 million and deferred revenue increasing $4.9 million. We had a net loss in 2008 of $7.0 million, which included non-cash depreciation and amortization of $1.9 million and non-cash stock-based compensation of $1.8 million.
Investing Activities
Our primary investing activities have consisted of purchases of property and equipment, capitalized software development costs, short-term investments, and business acquisitions. Our purchases of property and equipment and capitalized software may vary from period to period due to the timing of the expansion of our operations and our software development efforts. In 2010, we invested $2.8 million, net of cash acquired, in the purchase of SMB:LIVE. The terms of our purchase agreement require us to make additional payments in 2011 and 2012 of up to $0.4 million and $0.6 million, respectively. In 2009, we acquired the remaining interest of ReachLocal Australia and invested $8.9 million in net cash. Of this investment, $3.1 million was paid, net of cash acquired, in 2009 and the balance was paid in conjunction with our initial public offering in 2010. We expect to continue to use capital for acquisitions, purchases of property and equipment and development of software.
On February 8, 2011, we acquired DealOn for up to approximately $9.7 million in cash and stock. On the closing date, the Company paid $5.8 million in cash and issued 82,878 shares of its common stock. The balance of the purchase price is estimated to total up to $1.5 million and 22,095 common shares of our stock, payable in three installments, with 50% payable February 2012, 25% payable August 2012 and 25% payable February 2013.
Financing Activities
In 2010, we received $42.0 million in net proceeds from the sale of shares of common stock in connection with our initial public offering, after deducting underwriting discounts and commissions and offering expenses payable by us.
Off-Balance Sheet Arrangements
At December 31, 2010, we did not have any off-balance sheet arrangements.
Contractual Obligations
The consideration we paid for the shares of ReachLocal Australia that we did not own included a deferred payment obligation of $6.1 million. On May 19, 2010, we satisfied the deferred payment obligation for $5.9 million and realized a $0.2 million foreign currency exchange gain.
The consideration we paid for SMB:LIVE includes a deferred payment obligation of up to approximately $1.0 in cash and $4.7 million in common stock based upon the achievement of certain milestones tied to employee retention objectives.
We lease our primary office space in Woodland Hills, California and other locations under various non-cancelable operating leases that expire between 2010 and 2021. We have no debt obligations. All property and equipment have been purchased for cash, and we have no capital lease obligations recorded in the financial statements. We have no material long-term purchase obligations outstanding with any vendors or third parties other than the SMB deferred payment obligations.
As of December 31, 2010, future minimum payments under non-cancelable operating leases are as follows (in thousands):
| Year Ended December 31: |
Payments Under Operating Leases (1) |
Purchase Obligations (2) |
||||||
| (in thousands) | ||||||||
| 2011 |
6,164 | 2,100 | ||||||
| 2012 |
4,995 | |||||||
| 2013 |
4,895 | |||||||
| 2014 |
3,278 | |||||||
| 2015 |
2,755 | |||||||
| Thereafter |
9,559 | |||||||
| Total future minimum payments |
$ | 31,646 | $ | 2,100 | ||||
| (1) | Table does not include deferred payment obligations in connection with acquisition of SMB:LIVE. |
| (2) | Represents obligations denominated in Australian dollar, which has been translated to United States dollars. |
Recently Issued Accounting Standards
46
Table of Contents
For information about recently issued accounting standards, refer to Note 2 to our Consolidated Financial Statements.
Item 7A. Quantitative and Qualitative Disclosures About Market Risk.
We are exposed to market risk in the ordinary course of our business. These risks primarily include interest rate, foreign exchange and inflation risks.
Interest Rate Fluctuation Risk
We do not have any long-term indebtedness for borrowed money. Our investments include cash, cash equivalents and short-term investments. Cash and cash equivalents and short-term investments consist of cash, money market accounts and certificates of deposit. The primary objective of our investment activities is to preserve principal while maximizing income without significantly increasing risk. We do not enter into investments for trading or speculative purposes. Our investments are exposed to market risk due to a fluctuation in interest rates, which may affect our interest income and the fair market value of our investments. Due to the short-term nature of our investment portfolio, we do not believe an immediate 10% increase in interest rates would have a material effect on the fair market value of our portfolio, and therefore we do not expect our operating results or cash flows to be materially affected to any degree by a sudden change in market interest rates.
Foreign Currency Exchange Risk
We have foreign currency risks related to our revenue and operating expenses denominated in currencies other than the U.S. dollar, principally the Australian dollar, the British pound sterling, the Canadian dollar, the Indian rupee and the European euro. An unfavorable change in these exchange rates relative to the dollar would result in an unfavorable impact on revenue and operating income. For 2010, an unfavorable 10 percent change in exchange rates would result in a decrease in revenue of $5.9 million and a increase in our operating loss for the period of less than $0.1 million. We currently do not hedge or otherwise manage our currency exposure. As a result of our acquisition of the portion of ReachLocal Australia that we did not previously own and as our international operations mature, our risks associated with fluctuations in currency rates will become greater, and we will continue to reassess our approach to managing this risk. In addition, currency fluctuations or a weakening U.S. dollar can increase the costs of our international expansion.
Inflation Risk
We do not believe that inflation has had a material effect on our business, financial condition or results of operations. If our costs were to become subject to significant inflationary pressures, we may not be able to fully offset such higher costs through price increases. Our inability or failure to do so could harm our business, financial condition and results of operations.
Item 8. Financial Statements and Supplementary Data.
Please refer to Item 15—Exhibits and Financial Statement Schedules.
Item 9. Changes in and Disagreements With Accountants on Accounting and Financial Disclosure.
None.
Item 9A. Controls and Procedures.
| (a) | Evaluation of Disclosure Controls and Procedures |
Disclosure Controls and Procedures
Under the supervision and with the participation of our management, including our Chief Executive Officer and Chief Financial Officer, we have evaluated the effectiveness of our disclosure controls and procedures pursuant to Exchange Act Rule 13a-15(b) as of December 31, 2010. Based on that evaluation, our Chief Executive Officer and Chief Financial Officer have concluded that these disclosure controls and procedures were effective to provide reasonable assurance that information required to be disclosed by us in reports we file or submit under the Exchange Act is (1) recorded, processed, summarized, and reported within the time periods specified in the Securities and Exchange Commission’s rules and forms, and (2) is accumulated and communicated to our management, including our Chief Executive Officer and Chief Financial Officer, as appropriate to allow timely decisions regarding required disclosures.
47
Table of Contents
| (b) | Management’s Annual Report on Internal Control Over Financial Reporting |
This Annual Report does not include a report of management’s assessment regarding internal control over financial reporting or an attestation report of our registered public accounting firm as permitted in this transition period under the rules of the SEC for newly public companies.
| (c) | Changes in Internal Control Over Financial Reporting |
There were no changes in our internal control over financial reporting that occurred during the quarter ended December 31, 2010 that have materially affected, or are reasonably likely to materially affect, our internal control over financial reporting.
None.
48
Table of Contents
Item 10. Directors, Executive Officers and Corporate Governance.
The information required by this item is incorporated by reference to our Proxy Statement for our 2011 Annual Meeting of Stockholders, and is incorporated herein by reference.
We have adopted a code of business conduct and ethics applicable to our directors, officers (including our principal executive officer and principal financial officer) and employees. The Code of Business Conduct and Ethics is available on the investor relations section of our website at www.reachlocal.com under “Corporate Governance.”
We intend to satisfy the disclosure requirement under Item 5.05 of Form 8-K regarding an amendment to, or waiver from , a provision of this Code of Business Conduct and Ethics by posting such information on our website, at the address and location specified above and, to the extent required by the listing standards of The NASDAQ Stock Market, by filing a Current Report on Form 8-K with the SEC, disclosing such information.
Item 11. Executive Compensation.
The information required by this item is incorporated by reference to our Proxy Statement for our 2011 Annual Meeting of Stockholders, and is incorporated herein by reference.
Item 12. Security Ownership of Certain Beneficial Owners and Management and Related Stockholder Matters.
The information required by this item is incorporated by reference to our Proxy Statement for our 2011 Annual Meeting of Stockholders, and is incorporated herein by reference.
Item 13. Certain Relationships and Related Transactions, and Director Independence.
The information required by this item is incorporated by reference to our Proxy Statement for our 2011 Annual Meeting of Stockholders, and is incorporated herein by reference.
Item 14. Principal Accounting Fees and Services.
The information required by this item is incorporated by reference to our Proxy Statement for our 2011 Annual Meeting of Stockholders, and is incorporated herein by reference.
49
Table of Contents
Item 15. Exhibits, Financial Statement Schedules.
We have filed the following documents as part of this Annual Report on Form 10-K:
| Page | ||||||
| (1) |
ReachLocal, Inc. Consolidated Financial Statements |
|||||
| Report of Independent Registered Public Accounting Firm, Grant Thornton LLP |
F-2 | |||||
| Consolidated Balance Sheets |
F-3 | |||||
| Consolidated Statements of Operations |
F-4 | |||||
| Consolidated Statements of Stockholders’ Equity and Comprehensive Income (Loss) |
F-5 | |||||
| Consolidated Statements of Cash Flows |
F-7 | |||||
| Notes to the Consolidated Financial Statements |
F-8 | |||||
| (2) |
Schedule II – Valuation and Qualifying Accounts |
|||||
50
Table of Contents
| Page | ||||
| ReachLocal, Inc. |
||||
| Report of Independent Registered Public Accounting Firm, Grant Thornton LLP |
F-2 | |||
| F-3 | ||||
| F-4 | ||||
| Consolidated Statements of Stockholders’ Equity and Comprehensive Income (Loss) |
F-5 | |||
| F-7 | ||||
| F-8 | ||||
F-1
Table of Contents
REPORT OF INDEPENDENT REGISTERED PUBLIC ACCOUNTING FIRM
Board of Directors and Stockholders
ReachLocal, Inc.,
We have audited the accompanying consolidated balance sheets of ReachLocal, Inc. (the “Company”) as of December 31, 2010 and 2009, and the related consolidated statements of operations, stockholders’ equity and comprehensive income (loss), and cash flows for each of the three years in the period ended December 31, 2010. These financial statements are the responsibility of the Company’s management. Our responsibility is to express an opinion on these financial statements based on our audits.
We conducted our audits in accordance with the standards of the Public Company Accounting Oversight Board (United States). Those standards require that we plan and perform the audit to obtain reasonable assurance about whether the financial statements are free of material misstatement. The Company is not required to have, nor were we engaged to perform, an audit of its internal control over financial reporting. Our audit included consideration of internal control over financial reporting as a basis for designing audit procedures that are appropriate in the circumstances, but not for the purpose of expressing an opinion on the effectiveness of the Company’s internal control over financial reporting. Accordingly, we express no such opinion. An audit also includes examining, on a test basis, evidence supporting the amounts and disclosures in the financial statements, assessing the accounting principles used and significant estimates made by management, as well as evaluating the overall financial statement presentation. We believe that our audits provide a reasonable basis for our opinion.
In our opinion, the consolidated financial statements referred to above present fairly, in all material respects, the financial position of ReachLocal, Inc. as of December 31, 2010 and 2009, and the results of its consolidated operations and its consolidated cash flows for each of the three years in the period ended December 31, 2010, in conformity with accounting principles generally accepted in the United States of America.
/s/ GRANT THORNTON LLP
Woodland Hills, California
March 28, 2011
F-2
Table of Contents
CONSOLIDATED BALANCE SHEETS
(in thousands, except per share data)
| December 31, | ||||||||
| 2010 | 2009 | |||||||
| Assets |
||||||||
| Current assets: |
||||||||
| Cash and cash equivalents |
$ | 79,906 | $ | 35,379 | ||||
| Short-term investments |
8,208 | 8,037 | ||||||
| Accounts receivable, net of allowance for doubtful accounts of $373 and $142 at December 31, 2010 and 2009, respectively |
3,295 | 3,229 | ||||||
| Prepaid expenses and other current assets |
2,376 | 1,590 | ||||||
| Total current assets |
93,785 | 48,235 | ||||||
| Property and equipment, net |
6,710 | 4,900 | ||||||
| Capitalized software development costs, net |
10,803 | 5,099 | ||||||
| Restricted certificates of deposit |
801 | 1,131 | ||||||
| Intangible assets, net |
2,963 | 2,068 | ||||||
| Other assets |
1,400 | 967 | ||||||
| Deferred offering costs |
— | 3,099 | ||||||
| Goodwill |
34,118 | 32,388 | ||||||
| Total assets |
$ | 150,580 | $ | 97,887 | ||||
| Liabilities and Stockholders’ Equity |
||||||||
| Current Liabilities: |
||||||||
| Accounts payable |
$ | 27,471 | $ | 21,498 | ||||
| Accrued expenses |
14,234 | 10,342 | ||||||
| Deferred payment obligations |
530 | 5,955 | ||||||
| Deferred revenue and other current liabilities |
24,656 | 17,154 | ||||||
| Total current liabilities |
66,891 | 54,949 | ||||||
| Deferred rent and other liabilities |
1,673 | 820 | ||||||
| Total liabilities |
68,564 | 55,769 | ||||||
| Commitments and contingencies (Note 7) |
||||||||
| Stockholders’ Equity: |
||||||||
| Convertible preferred stock, Series A, $0.0002 par value—0 and 1,221 shares authorized, issued and outstanding at December 31, 2010 and 2009, respectively |
— | 1 | ||||||
| Convertible preferred stock, Series B-1, $0.0002 par value—0 and 3,615 shares authorized, issued and outstanding at December 31, 2010 and 2009, respectively |
— | 1 | ||||||
| Convertible preferred stock, Series B-2, $0.0002 par value—0 and 5,272 shares authorized, issued and outstanding at December 31, 2010 and 2009, respectively |
— | 1 | ||||||
| Convertible preferred stock, Series C, $0.0002 par value—0 and 371 shares authorized, issued and outstanding at December 31, 2010 and 2009, respectively |
— | — | ||||||
| Convertible preferred stock, Series D, $0.0002 par value—0 and 5,974 shares authorized, issued and outstanding at December 31, 2010 and 2009, respectively |
— | 1 | ||||||
| Common stock, $0.00001 and $0.0002 par value—140,000 shares authorized; 28,165 and 6,932 shares issued and outstanding at December 31, 2010 and 2009, respectively |
— | 1 | ||||||
| Receivable from stockholder |
(87 | ) | (99 | ) | ||||
| Additional paid-in capital |
98,140 | 47,247 | ||||||
| Accumulated deficit |
(16,044 | ) | (4,897 | ) | ||||
| Accumulated other comprehensive income (loss) |
7 | (138 | ) | |||||
| Total stockholders’ equity |
82,016 | 42,118 | ||||||
| Total liabilities and stockholders’ equity |
$ | 150,580 | $ | 97,887 | ||||
See notes to consolidated financial statements.
F-3
Table of Contents
CONSOLIDATED STATEMENTS OF OPERATIONS
(in thousands, except per share data)
| Year Ended December 31, | ||||||||||||
| 2010 | 2009 | 2008 | ||||||||||
| Revenue |
$ | 291,689 | $ | 203,117 | $ | 146,687 | ||||||
| Cost of revenue |
159,019 | 112,218 | 77,496 | |||||||||
| Operating expenses: |
||||||||||||
| Selling and marketing |
110,024 | 76,175 | 61,054 | |||||||||
| Product and technology |
11,239 | 5,167 | 2,938 | |||||||||
| General and administrative |
23,695 | 15,534 | 12,128 | |||||||||
| Total operating expenses |
144,958 | 96,876 | 76,120 | |||||||||
| Loss from operations |
(12,288 | ) | (5,977 | ) | (6,929 | ) | ||||||
| Gain on acquisition of ReachLocal Australia |
— | 16,223 | — | |||||||||
| Equity in losses of ReachLocal Australia |
— | — | (813 | ) | ||||||||
| Other income (expense), net |
601 | (7 | ) | 889 | ||||||||
| Income (loss) before provision (benefit) for income taxes |
(11,687 | ) | 10,239 | (6,853 | ) | |||||||
| Provision (benefit) for income taxes |
(540 | ) | 217 | 145 | ||||||||
| Net income (loss) |
(11,147 | ) | 10,022 | (6,998 | ) | |||||||
| Undistributed income attributable to preferred stockholders |
— | 8,638 | — | |||||||||
| Net income (loss) available to common stockholders |
$ | (11,147 | ) | $ | 1,384 | $ | (6,998 | ) | ||||
| Net income (loss) per share available to common stockholders: |
||||||||||||
| Basic |
$ | (0.56 | ) | $ | 0.22 | $ | (1.23 | ) | ||||
| Diluted |
$ | (0.56 | ) | $ | 0.18 | $ | (1.23 | ) | ||||
| Weighted average common shares used in computation of net income (loss) per share available to common stockholders: |
||||||||||||
| Basic |
19,867 | 6,283 | 5,677 | |||||||||
| Diluted |
19,867 | 7,901 | 5,677 | |||||||||
| The following earnings per share information is presented as if all preferred shares were converted into common stock as of the beginning of the period presented. |
||||||||||||
| Pro forma net income (loss) per share, as if converted: |
||||||||||||
| Basic |
$ | (0.42 | ) | $ | 0.44 | $ | (0.31 | ) | ||||
| Diluted |
$ | (0.42 | ) | $ | 0.41 | $ | (0.31 | ) | ||||
| Pro forma weighted average common shares used in computation of net income (loss) per share, as if converted: |
||||||||||||
| Basic |
26,286 | 22,995 | 22,389 | |||||||||
| Diluted |
26,286 | 24,613 | 22,389 | |||||||||
See notes to consolidated financial statements.
F-4
Table of Contents
CONSOLIDATED STATEMENTS OF STOCKHOLDERS’ EQUITY AND COMPREHENSIVE INCOME (LOSS)
(in thousands)
| Series A Convertible Preferred Stock |
Series B-1 Convertible Preferred Stock |
Series B-2 Convertible Preferred Stock |
Series C Convertible Preferred Stock |
Series D Convertible Preferred Stock |
Common Stock |
Receivable from |
Additional Paid-in |
Accumulated | Accumulated Other Income |
Total Stockholders’ |
||||||||||||||||||||||||||||||||||||||||||||||||||||||||||
| Shares | Amount | Shares | Amount | Shares | Amount | Shares | Amount | Shares | Amount | Shares | Amount | Stockholder | Capital | Deficit | (Loss) | Equity | ||||||||||||||||||||||||||||||||||||||||||||||||||||
| Balance as of December 31, 2007 |
1,221 | $ | 1 | 3,615 | $ | 1 | 5,272 | $ | 1 | 371 | — | 5,974 | $ | 1 | 6,127 | $ | 1 | $ | (227) | $ | 34,434 | $ | (7,921) | $ | — | $ | 26,291 | |||||||||||||||||||||||||||||||||||||||||
| Exercise of stock options |
— | — | — | — | — | — | — | — | — | — | 31 | — | — | 12 | — | — | 12 | |||||||||||||||||||||||||||||||||||||||||||||||||||
| Redemption of restricted stock |
— | — | — | — | — | — | — | — | — | — | (44) | — | — | 35 | — | — | 35 | |||||||||||||||||||||||||||||||||||||||||||||||||||
| Sale of common stock |
— | — | — | — | — | — | — | — | — | — | 143 | — | — | 1,312 | — | — | 1,312 | |||||||||||||||||||||||||||||||||||||||||||||||||||
| Stock-based compensation |
— | — | — | — | — | — | — | — | — | — | — | — | — | 1,903 | — | — | 1,903 | |||||||||||||||||||||||||||||||||||||||||||||||||||
| Foreign currency translation adjustments |
— | — | — | — | — | — | — | — | — | — | — | — | — | — | — | (41) | (41) | |||||||||||||||||||||||||||||||||||||||||||||||||||
| Net loss |
— | — | — | — | — | — | — | — | — | — | — | — | — | — | (6,998) | — | (6,998) | |||||||||||||||||||||||||||||||||||||||||||||||||||
| Comprehensive loss |
— | — | — | — | — | — | — | — | — | — | — | — | — | — | — | — | (7,039) | |||||||||||||||||||||||||||||||||||||||||||||||||||
| Balance as of December 31, 2008 |
1,221 | 1 | 3,615 | 1 | 5,272 | 1 | 371 | — | 5,974 | 1 | 6,257 | 1 | (227) | 37,696 | (14,919) | (41) | 22,514 | |||||||||||||||||||||||||||||||||||||||||||||||||||
| Exercise of stock options |
— | — | — | — | — | — | — | — | — | — | 76 | — | — | 54 | — | — | 54 | |||||||||||||||||||||||||||||||||||||||||||||||||||
| Common and restricted stock issued in business combination |
— | — | — | — | — | — | — | — | — | — | 599 | — | — | 6,244 | — | — | 6,244 | |||||||||||||||||||||||||||||||||||||||||||||||||||
| Stock-based compensation |
— | — | — | — | — | — | — | — | — | — | — | — | — | 3,253 | — | — | 3,253 | |||||||||||||||||||||||||||||||||||||||||||||||||||
| Receivable from stockholder (1) |
— | — | — | — | — | — | — | — | — | — | — | — | 128 | — | — | — | 128 | |||||||||||||||||||||||||||||||||||||||||||||||||||
| Foreign currency translation adjustments |
— | — | — | — | — | — | — | — | — | — | — | — | — | — | — | (97) | (97) | |||||||||||||||||||||||||||||||||||||||||||||||||||
| Net income |
— | — | — | — | — | — | — | — | — | — | — | — | — | — | 10,022 | — | 10,022 | |||||||||||||||||||||||||||||||||||||||||||||||||||
| Comprehensive income |
— | — | — | — | — | — | — | — | — | — | — | — | — | — | — | — | 9,925 | |||||||||||||||||||||||||||||||||||||||||||||||||||
| Balance as of December 31, 2009 |
1,221 | 1 | 3,615 | 1 | 5,272 | 1 | 371 | — | 5,974 | 1 | 6,932 | 1 | (99) | 47,247 | (4,897) | (138) | 42,118 | |||||||||||||||||||||||||||||||||||||||||||||||||||
| Preferred stock conversion |
(1,221) | (1) | (3,615) | (1) | (5,272) | (1) | (371) | — | (5,974) | (1) | 16,712 | — | — | 4 | — | — | — | |||||||||||||||||||||||||||||||||||||||||||||||||||
| Issuance of common stock, net of costs |
— | — | — | — | — | — | — | — | — | — | 3,941 | — | — | 41,996 | — | — | 41,996 | |||||||||||||||||||||||||||||||||||||||||||||||||||
| Par value adjustment |
— | — | — | — | — | — | — | — | — | — | (1) | — | 1 | — | — | — | ||||||||||||||||||||||||||||||||||||||||||||||||||||
| Exercise of stock options |
— | — | — | — | — | — | — | — | — | — | 536 | — | — | 1,068 | — | — | 1,068 | |||||||||||||||||||||||||||||||||||||||||||||||||||
| Stock-based compensation |
— | — | — | — | — | — | — | — | — | — | — | — | — | 7,746 | — | — | 7,746 | |||||||||||||||||||||||||||||||||||||||||||||||||||
F-5
Table of Contents
| Series A Convertible Preferred Stock |
Series B-1 Convertible Preferred Stock |
Series B-2 Convertible Preferred Stock |
Series C Convertible Preferred Stock |
Series D Convertible Preferred Stock |
Common Stock |
Receivable from |
Additional Paid-in |
Accumulated | Accumulated Other Income |
Total Stockholders’ |
||||||||||||||||||||||||||||||||||||||||||||||||||||||||||
| Shares | Amount | Shares | Amount | Shares | Amount | Shares | Amount | Shares | Amount | Shares | Amount | Stockholder | Capital | Deficit | (Loss) | Equity | ||||||||||||||||||||||||||||||||||||||||||||||||||||
| Issuance of common stock in connection with vesting of restricted stock, exercise of warrant and BOD share plan compensation |
— | $ | — | — | $ | — | — | $ | — | — | $ | — | — | $ | — | 44 | $ | — | $ | — | $ | 78 | $ | — | $ | — | $ | 78 | ||||||||||||||||||||||||||||||||||||||||
| Foreign currency translation adjustments |
— | — | — | — | — | — | — | — | — | — | — | — | 12 | — | — | 145 | 157 | |||||||||||||||||||||||||||||||||||||||||||||||||||
| Net loss |
— | — | — | — | — | — | — | — | — | — | — | — | — | — | (11,147) | — | (11,147) | |||||||||||||||||||||||||||||||||||||||||||||||||||
| Comprehensive loss |
— | — | — | — | — | — | — | — | — | — | — | — | — | — | — | — | (10,990) | |||||||||||||||||||||||||||||||||||||||||||||||||||
| Balance as of December 31, |
— | $ | — | — | $ | — | — | $ | — | — | $ | — | — | $ | — | 28,165 | $ | — | $ | (87) | $ | 98,140 | $ | (16,044) | $ | 7 | $ | 82,016 | ||||||||||||||||||||||||||||||||||||||||
| (1) | Amount reflects the write-off of the receivable from stockholder of $227,000 net of the assumption of loans of $96,000 in connection with the acquisition of ReachLocal Australia (Note 12). |
See notes to consolidated financial statements.
F-6
Table of Contents
CONSOLIDATED STATEMENTS OF CASH FLOWS
(in thousands)
| Year Ended December 31, | ||||||||||||
| 2010 | 2009 | 2008 | ||||||||||
| Cash flow from operating activities: |
||||||||||||
| Net income (loss) |
$ | (11,147 | ) | $ | 10,022 | $ | (6,998 | ) | ||||
| Adjustments to reconcile net income (loss) to net cash provided by operating activities: |
||||||||||||
| Depreciation and amortization |
6,704 | 3,348 | 1,852 | |||||||||
| Stock-based compensation, net |
5,768 | 2,961 | 1,811 | |||||||||
| Provision for doubtful accounts |
252 | 12 | 212 | |||||||||
| Provision for deferred income taxes |
(702 | ) | — | — | ||||||||
| Interest and foreign currency gain on payment obligations, net |
(102 | ) | — | — | ||||||||
| Equity in losses of ReachLocal Australia |
— | — | 813 | |||||||||
| Write-off of stockholder loan |
— | 227 | — | |||||||||
| Gain on purchase of ReachLocal Australia |
— | (16,223 | ) | — | ||||||||
| Changes in operating assets and liabilities: |
||||||||||||
| Accounts receivable |
(171 | ) | 49 | (826 | ) | |||||||
| Prepaid expenses and other current assets |
(778 | ) | (598 | ) | (75 | ) | ||||||
| Other assets |
(430 | ) | (105 | ) | (603 | ) | ||||||
| Accounts payable and accrued expenses |
10,301 | 8,382 | 10,793 | |||||||||
| Deferred revenue, rent and other liabilities |
7,980 | 6,233 | 5,083 | |||||||||
| Net cash provided by operating activities |
17,675 | 14,308 | 12,062 | |||||||||
| Cash flow from investing activities: |
||||||||||||
| Additions to property, equipment and software |
(9,929 | ) | (5,593 | ) | (5,152 | ) | ||||||
| Purchase of ReachLocal Australia, net of acquired cash |
(5,853 | ) | (3,083 | ) | — | |||||||
| Purchase of SMB:LIVE, net of acquired cash |
(2,759 | ) | — | — | ||||||||
| Cash contributed to ReachLocal Australia |
— | — | (813 | ) | ||||||||
| Purchases of restricted certificates of deposit |
(204 | ) | (456 | ) | (65 | ) | ||||||
| Proceeds from maturity of certificates of deposit |
589 | — | — | |||||||||
| Purchases of short-term investments |
(171 | ) | (7,730 | ) | (155 | ) | ||||||
| Proceeds from sale of short-term investments |
— | — | 23,350 | |||||||||
| Net cash provided by (used in) investing activities |
(18,327 | ) | (16,862 | ) | 17,165 | |||||||
| Cash flow from financing activities: |
||||||||||||
| Proceeds from exercise of stock options |
1,068 | 54 | 11 | |||||||||
| Proceeds from initial public offering |
47,649 | — | — | |||||||||
| Proceeds from issuance of common stock |
— | — | 1,312 | |||||||||
| Deferred offering costs |
(4,620 | ) | (1,033 | ) | — | |||||||
| Net cash provided by (used in) financing activities |
44,097 | (979 | ) | 1,323 | ||||||||
| Effect of exchange rate changes on cash |
1,082 | 92 | (139 | ) | ||||||||
| Net change in cash and cash equivalents |
44,527 | (3,441 | ) | 30,411 | ||||||||
| Cash and cash equivalents—beginning of period |
35,379 | 38,820 | 8,409 | |||||||||
| Cash and cash equivalents—end of period |
$ | 79,906 | $ | 35,379 | $ | 38,820 | ||||||
| Supplemental disclosure of other cash flow information: |
||||||||||||
| Cash paid for interest |
$ | 184 | $ | — | $ | — | ||||||
| Cash paid for income taxes |
$ | 214 | $ | 277 | $ | 214 | ||||||
| Supplemental disclosure of non-cash investing and financing activities: |
||||||||||||
| Capitalized software development costs resulting from stock-based compensation and deferred payment obligations |
$ | 2,461 | $ | 292 | $ | 92 | ||||||
| Accrued offering costs |
$ | — | $ | 2,066 | $ | — | ||||||
| Accrued purchases of fixed assets |
$ | 149 | $ | 212 | $ | — | ||||||
| Deferred payment obligation |
$ | 530 | $ | 5,955 | $ | — | ||||||
See notes to consolidated financial statements.
F-7
Table of Contents
NOTES TO CONSOLIDATED FINANCIAL STATEMENTS
1. Organization and Description of Business
ReachLocal, Inc. (the “Company”) was incorporated in the state of Delaware in August 2003. The Company’s operations are located in the United States, Canada, Australia, the United Kingdom, India and Germany. The Company’s mission is to help small- and medium-sized businesses (SMBs) acquire, maintain and retain customers via the Internet. ReachLocal offers a comprehensive suite of online marketing solutions, including search engine marketing (ReachSearch™), Web presence (ReachCast™), display advertising (ReachDisplay™) and remarketing, online marketing analytics (TotalTrack®), and an out-of-the-box assisted chat service (TotalLiveChat™), each targeted to the SMB market. The Company delivers these solutions to SMBs through a combination of its proprietary RL Platform and its direct, internally-trained, “feet-on-the-street” sales force of Internet Marketing Consultants, or IMCs, which the Company refers to as its Direct Local Channel. In addition, the Company sells to national brands with operations in multiple local markets and select third-party agencies and resellers through its National Brands, Agencies, and Resellers channel.
2. Summary of Significant Accounting Policies
Principles of Consolidation
The consolidated financial statements include the accounts of ReachLocal, Inc. and its wholly-owned subsidiaries. All significant intercompany balances and transactions have been eliminated in consolidation.
Use of Estimates
The preparation of financial statements in conformity with accounting principles generally accepted in the United States of America requires management to make estimates and assumptions that affect the reported amounts of assets and liabilities and disclosure of contingent assets and liabilities at the date of the financial statements and the reported amounts of income and expenses during the reporting period. These estimates are based on information available as of the date of the financial statements. Therefore, actual results could differ from those estimates.
Conversion of Preferred Stock
All of the outstanding shares of convertible preferred stock converted into shares of common stock upon the consummation of the Company’s initial public offering in May 2010.
Foreign Currency Translation
The Company’s operations are conducted in several countries around the world, and the financial statements of its foreign subsidiaries are reported in the applicable foreign currencies (functional currencies). Financial information is translated from the applicable functional currency to the U.S. dollar, the reporting currency, for inclusion in the Company’s consolidated financial statements. Income, expenses, and cash flows are translated at average exchange rates prevailing during the period, and assets and liabilities are translated at exchange rates in effect at the balance sheet date. Resulting translation adjustments are included as a component of accumulated other comprehensive income (loss), net in stockholders’ equity. Foreign currency translation adjustments are generally not adjusted for income taxes as they are primarily related to indefinite investments in foreign subsidiaries. Foreign exchange transaction gains and losses are included in other income (expense), net in the accompanying consolidated statements of operations. Exchange gains and losses on intercompany balances that are considered permanently invested are also included as a component of accumulated other comprehensive loss in stockholders’ equity.
Foreign currency translation adjustments included in other comprehensive loss, were $145,000, ($97,000) and ($41,000) for the years ended December 31, 2010, 2009 and 2008. For the years ended December 31, 2010, 2009, and 2008, the Company recorded $209,000, $5,000, and ($79,000) of other income (loss) from foreign exchange transactions, respectively.
Following the Company’s initial public offering, the Company paid its deferred payment obligation related to the acquisition of ReachLocal Australia and recorded a $207,000 foreign currency exchange gain in connection with the payment during the three months ended June 30, 2010.
F-8
Table of Contents
Cash and Cash Equivalents
The Company reports all highly liquid short-term investments with original maturities of three months or less at the time of purchase as cash equivalents. As of December 31, 2010 and 2009, cash equivalents consist of demand deposits and money market accounts. Cash equivalents are stated at cost, which approximates fair value.
Short-Term Investments
The Company classifies short-term investments when the original maturity is less than one year, or when the Company intends to sell the investment within one year. As of December 31, 2010 and 2009, short-term investments consisted of certificates of deposit. All of the short-term investments are classified as available-for-sale.
Financial Instruments
For certain of the Company’s financial instruments, including cash and cash equivalents, accounts receivable, accounts payable and other accrued liabilities, the carrying amounts approximate fair value due to their short maturities.
Restricted Cash
Restricted cash represents certificates of deposit held at financial institutions, which are pledged as collateral for letters of credit related to lease commitments. The restrictions will lapse when the letters of credit expire at the end of the respective lease terms in 2021. As of December 31, 2010 and 2009, the Company had restricted certificates of deposit in the amounts of $801,000, and $1,131,000, respectively. Restricted certificates of deposit are classified as non-current assets.
Concentrations of Credit Risk
Financial instruments that potentially subject the Company to concentration of credit risk consist primarily of cash and cash equivalents, restricted cash, short-term investments and accounts receivable. The Company holds its cash and cash equivalents, short-term investments and restricted cash with major financial institutions around the world.
Cash and cash equivalents and certificates of deposit are deposited with a limited number of financial institutions in the United States, Australia, United Kingdom and Canada. The balances held at any one financial institution are generally in excess of Federal Deposit Insurance Corporation (“FDIC”) insurance limits or, in foreign territories, local insurance limits. To date, the Company has not experienced any loss or lack of access to cash in its operating accounts. However, the Company can provide no assurances that access to its cash and cash equivalents will not be impacted by adverse conditions in the financial markets. As of December 31, 2010, domestic bank balances in excess of insured limits were $69,073,000. The Company had $16,115,000 in excess of insured limits in foreign bank accounts as of December 31, 2010.
The Company’s customers are dispersed both geographically and across a broad range of industries. Receivables are generated primarily through agencies. Management performs ongoing evaluation of trade receivables for collectibility and provides an allowance for potentially uncollectible accounts. The following table summarizes the change in the Company’s allowance for doubtful accounts for each of the three years ended December 31, 2010, 2009 and 2008 (in thousands):
| December 31 | ||||||||||||
| 2010 | 2009 | 2008 | ||||||||||
| Allowance for doubtful accounts as of the beginning of the period |
$ | 142 | $ | 314 | $ | 102 | ||||||
| Additions charged to expense |
252 | 12 | 212 | |||||||||
| Write-offs |
(21 | ) | (184 | ) | — | |||||||
| Allowance for doubtful accounts as of the end of the period |
$ | 373 | $ | 142 | $ | 314 | ||||||
As of December 31, 2010, one client accounted for 13% of the total accounts receivable balance. As of December 31, 2009, the same client accounted for 14% of the total accounts receivable balance.
In 2010, 2009, and 2008, no client accounted for more than 10% of the Company’s total revenue.
During 2010, 2009, and 2008, nearly all of the Company’s cost of revenue was for the purchase of media and nearly all of the media the Company purchased was from Google, Yahoo! and Microsoft. During each of the years
F-9
Table of Contents
ended December 31, 2010, 2009, and 2008, a substantial majority of the media the Company purchased was from Google.
Deferred Offering Costs
Deferred offering costs of $3,099,000 are included in the accompanying consolidated balance sheet at December 31, 2009. Upon the consummation of the Company’s initial public offering, these amounts were offset against the proceeds of the offering. There were no amounts capitalized as of December 31, 2010.
Property and Equipment
Property and equipment are recorded at cost and depreciated using the straight-line method over the estimated useful life of the assets or, where applicable and if shorter, over the lease term. Upon retirement or sale, the cost of assets disposed of and the related accumulated depreciation are eliminated from the accounts and any resulting gain or loss is credited or charged to operations. Repairs and maintenance costs are expensed as incurred.
Estimated useful lives of assets are as follows:
| Computer hardware and software |
3 years | |||
| Office equipment |
5 years | |||
| Furniture and fixtures |
7 years | |||
| Leasehold improvements |
Shorter of 3 years or term of lease |
Software Development Costs
The Company capitalizes costs to develop software when management has determined that the development efforts will result in new or additional functionality or new products. Costs capitalized as internal use software are amortized on a straight-line basis over the estimated useful life of the software, estimated to be three years. Costs incurred prior to meeting these criteria and costs associated with ongoing maintenance are expensed as incurred and are recorded along with amortization of capitalized software development costs as product and technology expenses within the accompanying consolidated statements of operations.
Goodwill
At December 31, 2010 and 2009, the Company had $34,118,000 and $32,388,000 of goodwill, respectively, which resulted from the acquisitions of ReachLocal Australia and SMB:LIVE.
Management evaluates goodwill for impairment using a two-step process that is performed at least annually, or whenever events or circumstances indicate that goodwill may be impaired. The first step is a comparison of the estimated fair value of an internal reporting unit with its carrying amount, including goodwill. If the estimated fair value of the reporting unit exceeds its carrying value, goodwill of the reporting unit is not considered impaired and the second step is unnecessary. If the carrying value of the reporting unit exceeds its estimated fair value, the second step is performed to measure the amount of impairment by comparing the carrying amount of the goodwill to a determination of the implied value of the goodwill. If the carrying amount of goodwill is greater than the implied value, an impairment is recognized for the difference. Management performs an annual impairment test of goodwill as of the first day of each fiscal fourth quarter. Based on management’s goodwill impairment evaluation, no impairment of goodwill was recognized for the year ended December 31, 2010. As of December 31, 2009, the Company had not observed any events or circumstances indicating that goodwill had been impaired due to the recent acquisition of ReachLocal Australia, and accordingly, no impairment review of goodwill was performed.
Long-Lived Assets
Management reviews the carrying values of long-lived assets, including intangible assets, for possible impairment whenever events or changes in circumstance indicate that the related carrying amount may not be recoverable. Undiscounted cash flows are compared to the carrying value and when required, impairment losses on assets to be held and used are recognized based on the excess of the asset’s carrying amount over the estimated fair value of the asset. Long-lived assets to be disposed of are reported at the lower of carrying amount or estimated fair value less cost to sell. Management has determined that there was no impairment of long-lived assets as of December 31, 2010 and 2009.
In accounting for the 2009 ReachLocal Australia acquisition, the Company recorded other intangible assets related to pre-existing client relationships of $2,300,000. At December 31, 2010 and 2009, the Company had $1,302,000 and $2,068,000, respectively, of intangible assets resulting from the acquisition. In accounting for the 2010 acquisition of SMB:LIVE, the Company recorded other intangible assets related to purchased technology of $2,300,000. At December 31, 2010, the Company had $1,661,000 of intangible assets resulting from the acquisition.
F-10
Table of Contents
The Company reports finite-lived, acquisition-related intangible assets at fair value, net of accumulated amortization. Identifiable intangible assets are amortized on a straight-line basis over their estimated useful lives of three years. Straight-line amortization is used because no other pattern over which the economic benefits will be consumed can be reliably determined.
Leases
The Company leases various facilities under agreements accounted for as operating leases. For leases that contain escalation or rent concessions provisions, management recognizes rent expense during the lease term on a straight-line basis over the term of the lease. The difference between rent paid and straight-line rent expense is recorded as a deferred rent liability in the accompanying consolidated balance sheets.
Revenue Recognition
The Company recognizes revenue for its services when all of the following criteria are satisfied:
| • | persuasive evidence of an arrangement exists; |
| • | services have been performed; |
| • | the selling price is fixed or determinable; and |
| • | collectability is reasonably assured. |
The Company recognizes revenue as the cost for the third-party media is incurred, which is upon delivery of the advertising on behalf of its clients. The Company recognizes revenue for its ReachSearch product as clicks are recorded on sponsored links on the various search engines and for its ReachDisplay product when the display advertisements record impressions or as otherwise provided in its agreement with the applicable publisher. The Company recognizes revenue for its ReachCast product on a straight line basis over the applicable service period for each campaign. The Company recognizes revenue when it charges set-up, management service or other fees on a straight line basis over the term of the related campaign contract or the completion of any obligation for services, if shorter. When the Company receives advance payments from clients, management records these amounts as deferred revenue until the revenue is recognized. When the Company extends credit, management records a receivable when the revenue is recognized.
When the Company sells through agencies, it either receives payment in advance of services or in some cases extends credit. The Company pays each agency an agreed-upon commission based on the revenue it earns or cash it receives. Some agency clients who have been extended credit may offset the amount otherwise due to the Company by any commissions they have earned. Management evaluates whether it is appropriate to record the gross amount of campaign revenue or the net amount earned after commissions. As the Company is the primary party obligated in the arrangement, subject to the credit risk, with discretion over both price and media, management recognizes the gross amount of such sales as revenue and any commissions are recognized as a selling and marketing expense.
The Company also has a small number of resellers. Resellers integrate the Company’s services, including ReachSearch, ReachDisplay, remarketing and TotalTrack, into their product offerings. In each case, the resellers integrate with the Company’s RL Platform through a custom Application Programming Interface (API). Resellers are responsible for the price and specifications of the integrated product offered to their clients. Resellers pay the Company in arrears, net of commissions and other adjustments. Management recognizes revenue generated under reseller agreements net of the agreed-upon commissions and other adjustments earned or retained by the reseller, as management believes that the reseller has retained sufficient control and bears sufficient risks to be considered the primary obligor in those arrangements.
The Company offers future incentives to clients in exchange for minimum annual commitments. In these circumstances, management estimates the amount of the future incentives that will be earned by clients and defers a portion of the otherwise recognizable revenue. Estimates are based upon a statistical analysis of previous campaigns for which such incentives were offered. Should a client not meet its minimum annual commitment and no longer qualify for the incentive, management recognizes the revenue previously deferred related to the estimated incentive.
Cost of Revenue
Cost of revenue consists primarily of the cost of media acquired from third-party publishers. Media cost is classified as cost of revenue in the corresponding period in which revenue is recognized. From time to time, publishers offer the Company rebates based upon various factors and operating rules, including the amount of media purchased. Management records these rebates in the period in which they are earned as a reduction to cost of revenue and the corresponding payable to the applicable publisher. Cost of revenue also includes third-party telephone and information services costs, data center and third-party hosting costs, credit card processing fees, third-
F-11
Table of Contents
party content and other direct costs. In addition, cost of revenue includes costs to initiate, operate and manage clients’ campaigns, other than costs associated with the Company’s sales force, which are reflected as selling and marketing expenses. Cost of revenue include includes salaries, benefits, bonuses and stock-based compensation for the related staff, including the cost of Web Presence Professionals who are the principal service providers for the Company’s ReachCast product, and allocated overhead such as depreciation expense, rent and utilities, as well as an allocable portion of the Company’s technical operations costs.
Selling and Marketing Expenses
Selling and marketing expenses consist primarily of personnel and related expenses for selling and marketing staff, including salaries and wages, commissions, benefits, bonuses and stock-based compensation; travel and business costs; training, recruitment, marketing and promotional events; advertising; other brand building and product marketing expenses; and occupancy, technology and other direct overhead costs. A portion of the compensation for IMCs, sales management and other employees in the sales organization is based on commissions. In addition, the cost of agency commissions is included in selling and marketing expenses.
Product and Technology Expenses
Product and technology expenses consist primarily of personnel and related expenses for product development and technology staff, including salaries, benefits, bonuses and stock-based compensation, and the cost of certain third-party service providers and other expenses, including occupancy, technology and other direct overhead costs. Technology operations costs, including related personnel and third-party costs, are included in product and technology expenses. The Company capitalizes a portion of its software development costs (Note 6) and, accordingly, includes amortization of those costs as costs of product and technology, as the RL Platform and the Company’s other systems address all aspects of the Company’s activities, including supporting the IMC selling and consultation process, online publisher integration, efficiencies and optimization, providing insight to clients into the results and effects of their online advertising campaigns and supporting all of the financial and other back-office functions of the business.
General and Administrative Expenses
General and administrative expenses consist primarily of personnel and related expenses for executive, legal, finance, human resources and corporate communications, including wages, benefits, bonuses and stock-based compensation, professional fees, insurance premiums and other expenses, including occupancy, technology and other direct overhead, certain costs in preparation to become a public company and other corporate expenses.
Advertising Expenses
The Company expenses advertising as incurred. Advertising expense was $1,633,000, $638,000 and $611,000 for the years ended December 31, 2010, 2009 and 2008, respectively.
Stock-Based Compensation
The Company accounts for stock-based compensation based on fair value. The Company follows the attribution method, which requires companies to reduce current stock-based compensation expenses recorded by the effect of anticipated forfeitures. Management estimates forfeitures based upon its historical experience, which has resulted in a small expected forfeiture rate.
The fair value of each award is estimated on the date of the grant and amortized over the requisite service period, which is the vesting period. The Company uses the Black-Scholes option pricing model to estimate the fair value of stock-based awards on the date of grant. Determining the fair value of stock-based awards at the grant date under this model requires judgment, including estimating the value per share of common stock, volatility, expected term and risk-free interest rate. The assumptions used in calculating the fair value of stock-based awards represent management’s estimate based on judgment and subjective future expectations. These estimates involve inherent uncertainties. If any of the assumptions used in the Black-Scholes model significantly changes, stock-based compensation for future awards may differ materially from the awards granted previously.
Net Income (Loss) Per Share
Basic net income (loss) per share available to common stockholders is computed by dividing the net income (loss) available to common stockholders for the period by the weighted average number of common shares outstanding during the period. Diluted net income (loss) per share available to common stockholders is computed by dividing the net income (loss) for the period by the weighted average number of common and potential dilutive shares outstanding during the period, to the extent such shares are dilutive. Potential dilutive shares are composed of
F-12
Table of Contents
incremental common shares issuable upon the exercise of stock options, warrants and unvested restricted shares using the treasury stock method and convertible preferred stock under the if-converted method, where such conversions are dilutive.
The following potentially dilutive securities have been excluded from the calculation of diluted net income (loss) per common share as they would be anti-dilutive (in thousands):
| Year Ended December 31, | ||||||||||||
| 2010 | 2009 | 2008 | ||||||||||
| Weighted average convertible preferred stock |
6,419 | 16,712 | 16,712 | |||||||||
| SMB:LIVE acquisition—deferred stock consideration |
312 | — | — | |||||||||
| Restricted stock subject to repurchase |
94 | — | 508 | |||||||||
| Stock options and warrant |
2,645 | 1,610 | 2,685 | |||||||||
| 9,470 | 18,322 | 19,905 | ||||||||||
The following table sets forth a reconciliation of the number of the numerator and denominator used in the calculation of basic and diluted net income (loss) per share for the periods indicated (in thousands, except per share data):
| Year Ended December 31, | ||||||||||||
| 2010 | 2009 | 2008 | ||||||||||
| Net income (loss) available to common stockholders |
$ | (11,147 | ) | $ | 1,384 | $ | (6,998 | ) | ||||
| Basic shares: |
||||||||||||
| Weighted average number of common shares outstanding |
19,867 | 6,283 | 5,677 | |||||||||
| Diluted shares: |
||||||||||||
| Weighted average number of common shares outstanding |
19,867 | 6,283 | 5,677 | |||||||||
| Add restricted stock subject to repurchase |
— | 196 | — | |||||||||
| Add options and warrants to purchase common shares |
— | 1,422 | — | |||||||||
| Weighted average shares used to compute diluted net income (loss) per share available to common shareholders |
19,867 | 7,901 | 5,677 | |||||||||
| Net income (loss) per share: |
||||||||||||
| Basic |
$ | (0.56 | ) | $ | 0.22 | $ | (1.23 | ) | ||||
| Diluted |
$ | (0.56 | ) | $ | 0.18 | $ | (1.23 | ) | ||||
F-13
Table of Contents
Unaudited Pro Forma Net Income (Loss) Per Share
Pro forma basic and diluted net income (loss) per share has been computed to give effect to the conversion of the Company’s preferred stock (using the “if converted” method) into common stock as though the conversion had occurred at the beginning of the periods (in thousands, except per share data):
| Year Ended December 31, | ||||||||||||
| 2010 | 2009 | 2008 | ||||||||||
| Net income (loss) |
$ | (11,147 | ) | $ | 10,022 | $ | (6,998 | ) | ||||
| Basic shares: |
||||||||||||
| Weighted average number of common shares outstanding |
19,867 | 6,283 | 5,677 | |||||||||
| Add conversion of preferred stock |
6,419 | 16,712 | 16,712 | |||||||||
| 26,286 | 22,995 | 22,389 | ||||||||||
| Diluted shares: |
||||||||||||
| Weighted average number of common shares outstanding |
19,867 | 6,283 | 5,677 | |||||||||
| Add restricted stock subject to repurchase |
— | 196 | — | |||||||||
| Add options and warrants to purchase common shares |
— | 1,422 | — | |||||||||
| Add conversion of preferred stock |
6,419 | 16,712 | 16,712 | |||||||||
| Weighted average shares used to compute diluted net income (loss) per share available to common shareholders |
26,286 | 24,613 | 22,389 | |||||||||
| Net income (loss) per share: |
||||||||||||
| Basic |
$ | (0.42 | ) | $ | 0.44 | $ | (0.31 | ) | ||||
| Diluted |
$ | (0.42 | ) | $ | 0.41 | $ | (0.31 | ) | ||||
Income Taxes
The Company records income taxes using the asset and liability method which requires the recognition of deferred tax assets and liabilities for the expected future tax consequences of events that have been recognized in its financial statements or tax returns. In estimating future tax consequences, generally all expected future events other than enactments or changes in the tax law or rates are considered. Valuation allowances are provided when necessary to reduce deferred tax assets to the amount expected to be realized.
The Company applies ASC Topic 740-10, Income Taxes, by defining the confidence level that a tax position must meet in order to be recognized in the financial statements. The Company records tax benefits for income tax positions only if it is “more-likely-than-not” to be sustained based solely on its technical merits as of the reporting date. Management considers many factors when evaluating and estimating tax positions and tax benefits, which may require periodic adjustments and which may differ from actual outcomes. The Company follows a comprehensive model for the financial statement recognition, measurement, presentation and disclosure of uncertain tax positions taken or expected to be taken in income tax returns. The Company’s policy is to recognize interest and penalties related to unrecognized tax benefits in income tax expense.
Recently Adopted Accounting Standards
ASC Topic 810, Consolidation, eliminates the quantitative approach previously required for determining the primary beneficiary of a variable interest entity and requires ongoing qualitative reassessments of whether an enterprise is the primary beneficiary of a variable interest entity. Additionally, this pronouncement requires additional disclosures about an enterprise’s involvement in variable interest entities and is effective for the Company as of January 1, 2009. The adoption of this pronouncement did not have a material impact on the consolidated financial statements.
ASC Topic 260-10, Earnings per Share, provides that unvested stock-based payment awards that contain non-forfeitable rights to dividends or dividend equivalents (whether paid or unpaid) are participating securities and shall be included in the computation of earnings per share pursuant to the two-class method. Upon adoption, companies are required to retrospectively adjust their earnings per share data (including any amounts related to interim periods, summaries of earnings, and selected financial data) to conform to this pronouncement. This pronouncement is
F-14
Table of Contents
effective for us as of January 1, 2009. The adoption of this pronouncement did not have a material impact on the consolidated financial statements.
ASC Topic 805, Business Combinations, establishes principles and requirements regarding how an acquirer in a business combination recognizes and measures the assets acquired, liabilities assumed, contingent consideration, contractual contingencies and any noncontrolling interest in the acquiree and addresses the recognition and measurement of goodwill acquired in a business combination. This guidance also requires certain disclosures to enable users of the financial statements to evaluate the nature and financial effects of the business combination. This pronouncement is effective for the Company as of January 1, 2009. Management has applied this standard in recording the acquisition of ReachLocal Australia and SMB:LIVE. See Note 4.
ASC Topic 350-30, Intangibles—Goodwill and Other, General Intangibles Other than Goodwill, requires companies estimating the useful life of a recognized intangible asset to consider their historical experience in renewing or extending similar arrangements or, in the absence of historical experience, to consider assumptions that market participants would use about renewal or extension. This pronouncement was effective for the Company as of January 1, 2009 and the adoption did not have a material effect on the consolidated financial statements.
ASC Topic 820, Fair Value Measurements and Disclosures, delays the effective date of certain fair value measurements to fiscal years beginning after November 15, 2008 for all nonfinancial assets and liabilities, except those that are recognized or disclosed at fair value in the financial statements on a recurring basis (at least annually). Assets and liabilities subject to this deferral include goodwill, intangible assets, and long-lived assets measured at fair value for impairment assessments, and nonfinancial assets and liabilities initially measured at fair value in a business combination. This pronouncement was effective for the Company as of January 1, 2009 and the adoption did not have a material effect on the consolidated financial statements as management has not elected to re-measure any of its non-financial assets or liabilities.
ASC Topic 810-10-65-1, Consolidation—Overall, Transition, establishes accounting and reporting standards for the non-controlling interest in a subsidiary and for the deconsolidation of a subsidiary. This pronouncement was effective for the Company as of January 1, 2009. The Company has no minority interests reported in the financial statements, thus the adoption of this pronouncement did not have a material effect on the consolidated financial statements. Effective June 30, 2009, the Company adopted three Accounting Standard Updates, or ASUs, which were intended to provide additional application guidance and enhanced disclosures regarding fair value measurements and impairments of securities. They also provide additional guidelines for estimating fair value in accordance with fair value accounting. The first ASU, as codified in ASC Topic 820-10, provides additional guidelines for estimating fair value in accordance with fair value accounting. The second ASU, as codified in ASC Topic 320-10 changes accounting requirements for other-than-temporary-impairment (OTTI) for debt securities by replacing the current requirement that a holder have the positive intent and ability to hold an impaired security to recovery in order to conclude an impairment was temporary with a requirement that an entity conclude it does not intend to sell an impaired security and it will not be required to sell the security before the recovery of its amortized cost basis. The third ASU, as codified in ASC Topic 825-10, increases the frequency of fair value disclosures. These updates are effective for fiscal years and interim periods ended after June 15, 2009. The adoption of these accounting updates did not have a material impact on the consolidated financial statements.
Recently Issued Accounting Pronouncements
In October 2009, ASU No. 2009-13, Multiple-Deliverable Revenue Arrangements, or ASU 2009-13, was issued. This ASU, as codified in ASC Topic 605-25-65, amends existing revenue recognition accounting pronouncements that are currently within the scope of ASC Subtopic 605-25. The consensus to ASU 2009-13 provides accounting principles and application guidance on whether multiple deliverables exist, how the arrangement should be separated, and the consideration allocated. This guidance eliminates the requirement to establish the fair value of undelivered products and services and instead provides for separate revenue recognition based upon management’s estimate of the selling price for an undelivered item when there is no other means to determine the fair value of that undelivered item. This new approach is effective prospectively for revenue arrangements entered into or materially modified in fiscal years beginning on or after June 15, 2010 and allows for retroactive application. This pronouncement is effective for the Company as of January 1, 2011. Management is currently evaluating the potential impact of this standard on the financial position and results of operations.
ASC Topic 605-28, Revenue Recognition—Milestone Method, specifies guidance that must be met for a vendor to recognize consideration that is contingent upon achievement of a substantive milestone in its entirety in the period in which the milestone is achieved. The guidance applies to milestones in arrangements within the scope of this pronouncement regardless of whether the arrangement is determined to have single or multiple deliverables or units of accounting. The pronouncement will be effective for fiscal years, and interim periods within those years, beginning on or after June 15, 2010. This pronouncement is effective for the Company as of January 1, 2011.
F-15
Table of Contents
Management is currently evaluating the potential impact of this standard on the financial position and results of operations.
ASC Topic 820-10, Fair Value Measurements and Disclosures (Topic 820): Improving Disclosures about Fair Value Measurements, amends previous guidance on fair value measurements to add new requirements for disclosures about transfers into and out of Levels 1 and 2 and separate disclosures about purchases, sales, issuances, and settlements relating to Level 3 measurement on a gross basis rather than on a net basis as currently required. This guidance also clarifies existing fair value disclosures about the level of disaggregation and about inputs and valuation techniques used to measure fair value. This guidance is effective for annual and interim periods beginning after December 15, 2010, except for the requirement to provide the level 3 activities of purchases, sales, issuances, and settlements on a gross basis, which will be effective for annual and interim periods beginning after December 15, 2010. This pronouncement is effective for the Company as of January 1, 2011. Management is currently evaluating the potential impact of this standard on the financial position and results of operations.
3. Fair Value of Financial Instruments
The Company applies the fair value hierarchy for financial instruments. Fair value is defined as the exchange price that would be received for an asset or paid to transfer a liability (an exit price) in the principal or most advantageous market for the asset or liability in an orderly transaction between market participants on the measurement date. Valuation techniques used to measure fair value maximize the use of observable inputs and minimize the use of unobservable inputs. The fair value hierarchy is based on three levels of inputs, of which the first two are considered observable and the last is considered unobservable, that are used to measure fair value:
| • | Level 1—Quoted prices in active markets for identical assets or liabilities. |
| • | Level 2—Inputs other than Level 1 that are observable, either directly or indirectly, such as quoted prices for similar assets or liabilities, quoted prices in markets that are not active, or other inputs that are observable or can be corroborated by observable market data for substantially the full term of the assets or liabilities. |
| • | Level 3—Unobservable inputs that are supported by little or no market activity and that are significant to the fair value of the assets or liabilities. The following table summarizes the basis used to measure certain of the Company’s financial assets that are carried at fair value (in thousands): |
| Balance at December 31, 2010 |
Basis of Fair Value Measurement | |||||||||||||||
| Quoted Prices in Active Markets for Identical Items (Level 1) |
Significant
Other Observable Inputs (Level 2) |
Significant Unobservable Inputs (Level 3) |
||||||||||||||
| Cash and cash equivalents |
$ | 79,906 | $ | 79,906 | $ | — | $ | — | ||||||||
| Certificates of deposit |
$ | 9,009 | $ | 9,009 | $ | — | $ | — | ||||||||
| Basis of Fair Value Measurement | ||||||||||||||||
| Balance
at December 31, 2009 |
Quoted Prices in Active Markets for Identical Items (Level 1) |
Significant
Other Observable Inputs (Level 2) |
Significant Unobservable Inputs (Level 3) |
|||||||||||||
| Cash and cash equivalents |
$ | 35,379 | $ | 35,379 | $ | — | $ | — | ||||||||
| Certificates of deposit |
$ | 9,168 | $ | 9,168 | $ | — | $ | — | ||||||||
4. Acquisitions
Acquisition of ReachLocal Australia
On December 21, 2006, the Company and NetUs Pty. Ltd. (“NetUs”) established ReachLocal Australia Pty Ltd. (“ReachLocal Australia”), a 50/50 joint venture, to provide the Company’s online marketing services to the defined territories of Australia and New Zealand. In exchange for its ownership interest and concurrent with the formation of the joint venture, the Company entered into a software license agreement with ReachLocal Australia. Under the terms of the joint venture agreement, the Company was not contractually obligated to provide any funding to ReachLocal Australia. Under the software license agreement, the Company developed and supported proprietary software, similar to its current proprietary software used in the United States, for the exclusive use of ReachLocal Australia for Internet advertising campaigns in the defined territories of Australia and New Zealand (the “Australian Platform”). The Company granted ReachLocal Australia an exclusive perpetual right and license to use the Australian Platform and agreed to provide services required under the agreement within the defined territories.
F-16
Table of Contents
On December 22, 2006, ReachLocal Australia entered into an Executive Equity Participation Agreement with Elysium Corporation Pty Ltd. (“Elysium”). Elysium is the trustee of The Power Family Discretionary Trust, and the agreement was in exchange for the service and employment of Steven Power, Managing Director of ReachLocal Australia. Pursuant to the agreement, Elysium was issued 5% of the outstanding capital stock of ReachLocal Australia and both the Company’s and NetUs’ fully diluted ownership was reduced to 47.5%.
On March 13, 2007, the Company and NetUs entered into a first amendment to the software license agreement and a first amendment to the joint venture agreement. Pursuant to the agreement, the Company agreed to provide a credit of $250,000 towards future upgrades and modifications of the Australian Platform to offset charges otherwise allowed under the software license agreement. In addition, NetUs increased its funding obligation to ReachLocal Australia by an additional $750,000 up to a maximum of $2,750,000.
ReachLocal Australia had minimal operations in 2006. During 2007, the Company’s proportionate loss in ReachLocal Australia exceeded the carrying value of its investment. Accordingly, the Company recorded a loss in the amount of $250,000 to reduce the carrying value of the investment in ReachLocal Australia to zero. No additional loss accruals were recorded in 2007 as the Company had no obligation for additional contributions to ReachLocal Australia at that time.
On March 25, 2008, the Company and NetUs entered into the second amendment to the joint venture agreement providing that each party would provide additional funding up to Australian $900,000 for a combined total of Australian $1,800,000 to meet the working capital requirements of the business. During 2008, the Company made the required funding payments of Australian $900,000 and due to continued losses of ReachLocal Australia, the entire commitment was recognized as equity in losses of unconsolidated joint venture in the accompanying 2008 consolidated statement of operations.
On September 11, 2009, the Company acquired the remaining interest in ReachLocal Australia for approximately $17,931,000, which consisted of the issuance of 598,665 shares of common stock (including 22,000 shares of restricted stock—see Note 9) valued at $10.43 per share (which represented the latest quarterly valuation of the Company’s common stock performed prior to the acquisition date), a cash payment in the amount of $5,810,000 and a non-interest bearing deferred payment obligation of $6,141,000, due upon the closing of the Company’s initial public offering. For purposes of determining the Company’s acquisition consideration, management discounted the note to its estimated net present value of $5,876,000. The deferred payment obligation was satisfied upon the closing of the Company’s initial public offering; and the Company recognized both interest expense and an exchange gain related to the obligation. There was no contingent consideration issued in conjunction with the purchase. The assets acquired by the Company include cash, accounts receivable, intangible assets, property, plant and equipment, and other current assets. As a result of this transaction, ReachLocal Australia became a wholly owned subsidiary of the Company. In conjunction with the acquisition, the Company incurred approximately $312,000 in costs that are reflected in general and administrative expense in the accompanying consolidated financial statements for 2009.
The Company recorded the assets and liabilities acquired at their respective fair values, and the Company recorded a gain of $16,223,000, which represents its share of the excess of fair value over the carrying value of the investment in ReachLocal Australia. The Company did not record a deferred income tax liability associated with the gain since the excess of the amount for financial reporting over the corresponding tax basis is permanent in duration. The following table summarizes the fair value of assets and liabilities acquired (in thousands):
| Assets acquired: |
||||
| Cash |
$ | 2,727 | ||
| Property and equipment |
334 | |||
| Other current assets (including accounts receivable) |
190 | |||
| Intangible assets |
2,300 | |||
| Goodwill |
32,388 | |||
| Total assets acquired |
37,939 | |||
| Liabilities assumed: |
||||
| Accounts payable |
3,170 | |||
| Deferred revenue |
615 | |||
| Total fair value of assets and liabilities acquired |
$ | 34,154 | ||
The acquisition of ReachLocal Australia allows the Company to provide services directly to the Australia and New Zealand markets. This factor contributed to a purchase price in excess of the fair value of the net tangible and intangible assets acquired, and, as a result, the Company recorded goodwill in connection with this transaction.
F-17
Table of Contents
The intangible assets acquired consist of customer relationships, which are being amortized over their estimated useful life of three years using the straight line amortization method. At December 31, 2010, the remaining amortization of intangibles is as follows (in thousands):
| Year ending December 31, |
||||
| 2011 |
767 | |||
| 2012 |
534 | |||
| Total |
$ | 1,301 | ||
Amortization expense for the intangible assets was $768,000 and $231,000 for the years ended December 31, 2010 and 2009, respectively. Accumulated amortization for the intangible asset was $999,000 and $231,000 as of December 31, 2010 and 2009, respectively.
The results of the ReachLocal Australia operations for the period post-acquisition have been included in the Company’s consolidated financial statements and include $32,708,000 of revenue for the year ended December 31, 2010 and $6,119,000 of revenue for the period from September 11, 2009 to December 31, 2009.
Acquisition of SMB:LIVE
On February 22, 2010, the Company acquired all of the issued and outstanding common stock of SMB:LIVE Corporation (“SMB:LIVE”) for consideration of approximately $8,491,000 in cash and stock. SMB:LIVE is a provider of data syndication and social media monitoring products and services to SMBs. With the technology acquired through the SMB:LIVE acquisition, the Company is developing a digital presence and reputation management solution designed to enable an SMB to publish multi-media content from a single interface to a business profile page hosted by the Company as well as to local directory sites, search engines and social media sites, including Twitter and Facebook. In addition, the Company will provide automated monitoring of local review sites, social media sites, and local blogs for references to the SMB or comments related to the SMB’s business to provide an SMB with feedback, alerts and analytics to assist it in managing its online reputation.
On the closing date, the Company paid $2,758,000 in cash as part of the purchase price. The balance of the consideration (the “Deferred Consideration”), of up to $5,733,000, is payable in cash and stock of the Company and is subject to the achievement of certain employee retention objectives. These retention objectives require a minimum number of the acquired personnel to remain continuously employed for each milestone payment as described below. If such retention objectives are not met, all or a portion of the Deferred Consideration will be forfeited. All of the acquired employees were sellers and they represent the majority of sellers. The Company will recognize the Deferred Consideration amounts as compensation expense over the period in which it is earned. Of the SMB:LIVE Deferred Consideration $4,741,000 is payable in 364,692 shares of the Company’s common stock, based on the initial public offering price of $13.00 per share, and the balance is payable in cash. The following table summarizes the SMB:LIVE Deferred Consideration milestone payments, assuming all retention objectives are met and there have been no offsets for indemnity claims (in thousands):
| Deferred Cash Consideration |
Deferred Stock Consideration |
Total | ||||||||||
| February 22, 2011 |
$ | 165 | $ | 1,171 | $ | 1,336 | ||||||
| August 22, 2011 |
252 | 1,214 | 1,466 | |||||||||
| February 22, 2012 |
575 | 2,356 | 2,931 | |||||||||
| Total Deferred Consideration |
$ | 992 | $ | 4,741 | $ | 5,733 | ||||||
In connection with the acquisition, the Company incurred approximately $286,000 in costs that are reflected in general and administrative expense in the accompanying consolidated financial statements for the year ended December 31, 2010. As of December 31, 2010, the Company has recorded $3,246,000 of SMB:LIVE total deferred consideration in the form of a liability of $530,000 related to the deferred cash consideration and additional paid-in capital of $2,716,000 pertaining to the deferred stock consideration. Of the $530,000 of deferred cash consideration recorded, $412,000 was capitalized as software development costs, and the balance of $118,000 was expensed. Of the $2,716,000 of deferred stock consideration recorded, $1,515,000 was capitalized as software development costs, and the balance of $1,201,000 was expensed.
The Company recorded the assets and liabilities acquired at their respective fair values. The following table summarizes the fair value of assets and liabilities acquired (in thousands):
F-18
Table of Contents
| Assets acquired: |
||||
| Cash |
$ | 5 | ||
| Accounts receivable |
142 | |||
| Property and equipment |
39 | |||
| Other current assets |
13 | |||
| Intangible assets |
2,300 | |||
| Goodwill |
1,730 | |||
| Total assets acquired |
4,229 | |||
| Liabilities assumed: |
||||
| Accounts payable and accrued expenses |
732 | |||
| Other current liabilities |
38 | |||
| Deferred tax liability |
702 | |||
| Total fair value of assets and liabilities acquired |
$ | 2,759 | ||
The intangible assets acquired consist of SMB:LIVE’s developed technology, which is being amortized over its estimated useful life of three years using the straight line method. At December 31, 2010, the remaining amortization of intangibles is as follows (in thousands):
| Year Ended December 31, |
||||
| 2011 |
767 | |||
| 2012 |
767 | |||
| 2013 |
128 | |||
| Total |
$ | 1,662 | ||
For the year ended December 31, 2010, amortization expense related to the acquired developed technology was $638,000.
The results of the SMB:LIVE’s operations for the period post-acquisition have been included in the Company’s consolidated financial statements. Revenue from the acquired legacy products and services are immaterial for the year ended December 31, 2010.
5. Property and Equipment
Property and equipment consisted of the following (in thousands):
| December 31, | ||||||||
| 2010 | 2009 | |||||||
| Computer hardware and software |
$ | 7,100 | $ | 4,126 | ||||
| Office equipment |
1,081 | 660 | ||||||
| Furniture and fixtures |
2,653 | 1,931 | ||||||
| Leasehold improvements |
1,298 | 1,149 | ||||||
| Assets not placed in service |
309 | 361 | ||||||
| 12,441 | 8,227 | |||||||
| Less: Accumulated depreciation and amortization |
(5,731 | ) | (3,327 | ) | ||||
| $ | 6,710 | $ | 4,900 | |||||
Depreciation expense for property and equipment was $2,354,000, $1,680,000 and $1,094,000 for the years ended December 31, 2010, 2009 and 2008, respectively.
F-19
Table of Contents
6. Software Development Costs
Capitalized software development costs consisted of the following (in thousands):
| December 31, | ||||||||
| 2010 | 2009 | |||||||
| Capitalized software development costs |
$ | 17,125 | $ | 8,477 | ||||
| Accumulated amortization |
(6,322 | ) | (3,378 | ) | ||||
| Capitalized software development costs, net |
$ | 10,803 | $ | 5,099 | ||||
The Company recorded amortization expense of $2,944,000, $1,437,000 and $758,000 for the years ended December 31, 2010, 2009 and 2008, respectively. As of December 31, 2010, $1,570,000 of capitalized software development costs are related to projects still in development and are not being amortized.
7. Commitments and Contingencies
The Company leases office facilities under operating lease agreements that expire at various dates through 2021. The terms of the Company’s lease agreements provide for rental payments on a graduated basis. The Company recognizes rent expense on a straight-line basis over the lease term.
Rental expense, principally for leased office space under operating lease commitments, was $6,378,000, $4,599,000 and $3,717,000 for the years ended December 31, 2010, 2009 and 2008, respectively.
As of December 31, 2010, future minimum payments under non-cancelable operating leases are as follows (in thousands):
| Year Ended December 31, |
||||
| 2011 |
6,164 | |||
| 2012 |
4,995 | |||
| 2013 |
4,895 | |||
| 2014 |
3,278 | |||
| 2015 |
2,755 | |||
| Thereafter |
9,559 | |||
| $ | 31,646 | |||
The company has a $2.1m purchase obligation between ReachLocal Australia and Google effective for the first quarter of 2011.
Letters of Credit and Restricted Certificates of Deposit
As of December 31, 2010 and 2009, the Company maintained letters of credit totaling $801,000 and $1,131,000, respectively, to secure its obligations under facility operating lease agreements. The letters of credit are collateralized by restricted certificates of deposit and automatically renew for successive one-year periods over the duration of the lease term. As of December 31, 2010 and 2009, the Company was required to maintain cash reserve balances of at least $801,000 and $1,131,000, respectively, to secure these letters of credit. These amounts were classified as restricted certificates of deposit in the accompanying consolidated balance sheets.
Litigation
The Company is subject to various legal proceedings and claims arising in the ordinary course of business. Although occasional adverse decisions or settlements may occur, management believes that the final disposition of such matters will not have a material adverse effect on the Company’s financial position, results of operations or cash flows.
On March 1, 2010, a class action lawsuit was filed by two of the Company’s former employees in California Superior Court in Los Angeles, California. The complaint alleged wage and hour violations in a Fair Labor Standards Act collective action and a California class action. On November 17, 2010, the Company executed a memorandum of understanding to settle the class action for $800,000, which includes legal costs resulting in a charge of $832,000 in the 2010. The Company has signed the memorandum of understanding to resolve the litigation in its entirety, thereby avoiding any further expense and distraction associated with the litigation. The memorandum of understanding remains subject to confirmation by the court.
F-20
Table of Contents
Deferred Payment Obligations
As part of the consideration paid for ReachLocal Australia, the Company was required to make a lump sum payment to the sellers in the approximate amount of $6,141,000 including interest. The timing of this payment was the earlier of September 11, 2010 or the consummation of the Company’s initial public offering or other liquidating transaction. On May 19, 2010, the Company satisfied the deferred payment obligation related to the acquisition of ReachLocal Australia for $5,853,000, imputed interest of $81,000 and realized a $207,000 foreign currency exchange gain.
As part of the consideration paid for SMB:LIVE, the Company will pay up to approximately $992,000 in cash and $4,741,000 in stock based upon the achievement of certain milestones tied to employee retention objectives. Depending upon the achievement of the employee retention objectives, the deferred consideration may be reduced or eliminated (see Notes 4, 9 and 15).
8. Stockholder’s Equity
Common Stock
At December 31, 2010, there were 140,000,000 shares of common stock authorized. At December 31, 2010 and 2009, there were 28,165,023 and 6,932,324 shares, respectively, issued and outstanding. Holders of common stock are entitled to dividends if and when declared by the board of directors.
Initial Public Offering
On May 19, 2010, the Company issued 3,941,103 shares of common stock, including shares from the exercise of the underwriters’ option to purchase 625,000 shares, at a price of $13.00 per share, raising proceeds to the Company of $42.0 million, net of underwriting discounts and commissions and offering costs.
Upon the completion of the initial public offering, the Company amended and restated its certificate of incorporation to authorize the Company to issue up to 140,000,000 shares of common stock, at $0.00001 par value per share.
Convertible Preferred Stock
Upon the completion of the initial public offering, all of the then outstanding shares of convertible preferred stock were converted to 16,712,120 shares of common stock with a par value of $0.00001 per share.
Series A Convertible Preferred Stock
In February 2004, the Company issued 813,955 shares of Series A convertible preferred stock (“Series A preferred stock”) at $0.61 per share, resulting in gross proceeds of approximately $500,000. In May 2004, the Company amended its certificate of incorporation to increase the authorized shares of the Series A preferred stock to 1,221,120 shares. This issuance resulted in an additional 407,165 shares of Series A preferred stock for gross proceeds of approximately $250,000.
Series B Convertible Preferred Stock
In June 2004, the Company issued 3,615,330 shares of Series B-1 convertible preferred stock (“Series B-1 preferred stock”) at $0.55 per share and 5,271,980 shares of Series B-2 convertible preferred stock (“Series B-2 preferred stock”) at $0.95 per share. The gross proceeds approximated $2,000,000 and $4,984,000 for the Series B-1 preferred stock and B-2 preferred stock.
Series C Convertible Preferred Stock
In June 2006, the Company issued 2,221,890 shares of Series C convertible preferred stock (“Series C preferred stock”) at $1.35 per share, resulting in gross proceeds of approximately $3,000,000. In September 2006, the Company issued an additional 1,481,260 shares of Series C preferred stock at $1.35 per share, resulting in gross proceeds for approximately $2,000,000.
Series D Convertible Preferred Stock
In September 2007, the Company issued 5,974,612 shares of Company’s Series D convertible preferred stock (“Series D preferred stock”) at $9.23 per share, resulting in gross proceeds of approximately $55,122,000. In conjunction with the Series D financing, the Company repurchased 1,978,000 shares of common stock and 1,666,418 shares of Series C convertible preferred stock for a net of $32,416,000. Immediately following the close of the Series D financing, 1,666,417 shares of Series C convertible preferred stock converted into 1,666,417 shares of common stock, leaving 370,315 shares of Series C outstanding.
F-21
Table of Contents
Reserved shares
In conjunction with the acquisition of SMB:LIVE (Note 4), the Company may be required to issue up to 364,692 shares of its common stock, if at all, in three tranches on February 22, 2011, August 22, 2011 and February 22, 2012.
Warrants
In 2007, the Company issued a warrant to purchase 76,137 shares of common stock with an exercise price of $9.23 per share which contained a net exercise provision. In connection with the public offering, in May 2010, the holder exercised the warrant on a net exercise basis and received 22,102 shares of the Company’s common stock.
9. Stock-Based Compensation
Stock Options Plans
On April 21, 2004, the Company adopted the 2004 Stock Plan (the “2004 Plan”), as amended. Grants under the 2004 Plan may be incentive stock options or nonqualified stock options or awards. The 2004 Plan is administered by the Company’s board of directors, which has the authority to designate participants and determine the number and type of awards to be granted, the time at which awards are exercisable, the method of payment and any other terms or conditions of the awards. The vesting of these awards vary subject to the participant’s period of future service, or otherwise at the discretion of the Company’s board of directors. The majority of awards vest over four years and have a term of 10 years. There were no shares available for grant under the 2004 Plan as of December 31, 2010 and 2009.
On July 1, 2008, the Company adopted the 2008 Stock Incentive Plan (the “2008 Plan”) and retired the 2004 Plan. Options outstanding under the 2004 Plan are unaffected by the retirement of the 2004 Plan. The aggregate number of shares of the Company’s common stock available for issuance pursuant to awards granted under the 2008 Plan is equal to the sum of (x) 5,471,350 plus (y) any shares of the Company’s common stock subject to awards under the 2004 Plan that terminate, expire or lapse for any reason or are settled in cash after the date the 2008 Plan originally became effective, and (z) an annual increase in shares on the first day of each year beginning in 2011 and ending in 2018. The annual increase will be equal to the lesser of (A) 2,500,000 shares (as adjusted for stock splits, stock combinations, stock dividends and similar matters), (B) 4.5% of the Company’s common stock outstanding on the last day of the prior year or (C) such smaller number of shares as may be determined by the Board. The 2008 Plan is administered by the Company’s compensation committee, which has the authority to designate participants and determine the number and type of awards to be granted, the time at which awards are exercisable, the method of payment and any other terms or conditions of the awards. The vesting of these awards vary subject to the participant’s period of future service, or otherwise at the discretion of the compensation committee. The majority of awards issued under the 2008 Plan vest over four years, and have a term of seven years. There were 735,620 and 141,401 shares available for grant under the 2008 Plan as of December 31, 2010 and 2009, respectively. On January 1, 2011, an additional 1,267,426 shares were added to the pool under the evergreen provision.
F-22
Table of Contents
The following table summarizes vested and unvested options activity as follows (number of shares in thousands):
| All Options | Vested Options | Unvested Options | ||||||||||||||||||||||
| Shares | Weighted Average Exercise Price |
Shares | Weighted Average Exercise Price |
Shares | Weighted Average Exercise Price |
|||||||||||||||||||
| Outstanding at December 31, 2007 |
1,874 | 2.06 | 730 | 0.34 | 1,144 | 3.17 | ||||||||||||||||||
| Granted |
2,539 | 10.62 | — | — | 2,539 | 10.62 | ||||||||||||||||||
| Options vesting |
— | — | 631 | 4.52 | (631 | ) | 4.52 | |||||||||||||||||
| Exercised |
(31 | ) | 0.36 | (31 | ) | 0.36 | — | — | ||||||||||||||||
| Forfeited |
(74 | ) | 7.34 | (4 | ) | 2.44 | (70 | ) | 7.64 | |||||||||||||||
| Outstanding at December 31, 2008 |
4,308 | 7.03 | 1,326 | 2.41 | 2,982 | 9.09 | ||||||||||||||||||
| Granted |
1,323 | 11.21 | 66 | 10.91 | 1,257 | 11.22 | ||||||||||||||||||
| Options vesting |
— | — | 1,189 | 8.43 | (1,189 | ) | 8.43 | |||||||||||||||||
| Exercised |
(76 | ) | 0.65 | (76 | ) | 0.65 | — | — | ||||||||||||||||
| Forfeited |
(159 | ) | 9.89 | (32 | ) | 10.14 | (127 | ) | 9.83 | |||||||||||||||
| Outstanding at December 31, 2009 |
5,396 | 8.04 | 2,473 | 5.55 | 2,923 | 10.19 | ||||||||||||||||||
| Granted |
1,631 | 13.56 | 10 | 13.00 | 1,621 | 13.56 | ||||||||||||||||||
| Options vesting |
— | — | 1,324 | 9.50 | (1,324 | ) | 9.50 | |||||||||||||||||
| Exercised |
(536 | ) | 2.07 | (536 | ) | 2.07 | — | — | ||||||||||||||||
| Forfeited |
(256 | ) | 11.43 | (24 | ) | 10.67 | (232 | ) | 11.51 | |||||||||||||||
| Outstanding at December 31, 2010 |
6,235 | 9.88 | 3,247 | 7.58 | 2,988 | 12.45 | ||||||||||||||||||
The assumptions utilized for purposes of the Black-Scholes pricing model are summarized as follows:
| • | Volatility—As the Company does not have trading history for its common stock, the expected stock price volatility was estimated by taking the median historic price volatility for industry peers based on daily price observations over a period equivalent to the expected term of the stock option grants. Industry peers consist of several public companies in the technology industry similar in size, stage of life cycle and financial leverage. Management did not rely on implied volatilities of traded options in its industry peers’ common stock because the volume of activity was relatively low. |
| • | Expected term—The expected term was estimated using the simplified method allowed under Securities and Exchange Commission Staff Accounting Bulletin No. 107, Share-Based Payment. Management uses this method because it does not have adequate historical data to estimate future terms and it is unable to obtain objective, measurable and comparative historical data of comparable companies. |
| • | Risk free rate—The risk free interest rate is based on the yields of U.S. Treasury securities with maturities similar to the expected term of the options for each option group. |
| • | Dividend yield—The Company has never declared or paid any cash dividends and do not presently plan to pay cash dividends in the foreseeable future. Consequently, management used an expected dividend yield of zero. |
In addition, management estimates the forfeiture rate based on its historical experience with forfeitures and reviews estimated forfeiture rates each period-end, and makes changes as factors affecting the forfeiture rate calculations and assumptions change.
The following table summarizes the weighted average assumptions used to estimate the fair value of stock options granted during the years ended December 31, 2010, 2009 and 2008.
| Year Ended December 31, | ||||||||||||
| 2010 | 2009 | 2008 | ||||||||||
| Expected dividend yield |
0 | % | 0 | % | 0 | % | ||||||
| Risk-free interest rate |
1.91 | % | 2.16 | % | 3.11 | % | ||||||
| Expected life (in years) |
4.75 | 4.73 | 5.01 | |||||||||
| Expected volatility |
56 | % | 55 | % | 55 | % | ||||||
| Weighted average fair value per share |
$ | 6.55 | $ | 3.66 | $ | 3.09 | ||||||
The weighted average remaining contractual life of all options outstanding as of December 31, 2010 and 2009 was 5.45 years and 6.12 years, respectively. Furthermore, the aggregate intrinsic value of all options outstanding as
F-23
Table of Contents
of December 31, 2010 and 2009 was $62,505,000 and $26,850,000, respectively. The aggregate intrinsic value of options vested and exercisable at December 31, 2010 and 2009 was $40,582,000 and $18,524,000 based on the fair value of the Company’s common stock. The remaining contractual life for options vested and exercisable at December 31, 2010 was 5.19 years. The per share weighted average grant date fair value of unvested options as of December 31, 2010, 2009 and 2008 was $5.12, $3.66 and $2.63, respectively. The per share weighted average grant date fair value of options vested during 2010 and 2009 was $2.81 and $2.42, respectively. The total fair value of shares vested during the year ended 2010 and 2009 was $3,725,000 and $2,981,000, respectively. The per share weighted average grant date fair value of options forfeited during 2010 and 2009 was $4.61 and $3.18, respectively.
Prior to the initial public offering, the Company computed the aggregate intrinsic value amounts based on the difference between the original exercise price of the options and the fair value of common stock, which was $13.04 at December 31, 2009. After the initial public offering, the Company computes the aggregate intrinsic value amounts based on the difference between the original exercise price and the closing market price on the day of the exercise. The aggregate intrinsic value of stock options exercised during the year ended December 31, 2010, 2009 and 2008 was $6,748,000, $535,000 and $254,000, respectively.
F-24
Table of Contents
The options outstanding and vested and exercisable as of December 31, 2010 have been segregated into ranges for additional disclosure as follows (number of options in thousands):
| Range of Exercise Prices (in dollars) |
Options Outstanding | Options Vested and Exercisable |
||||||||||||||||||
| Number | Weighted
Average Remaining Contractual Life (in years) |
Weighted Average Exercise Price |
Number | Weighted Average Exercise Price |
||||||||||||||||
| $0.00 - 0.10 |
93 | 3.38 | $ | 0.06 | 93 | $ | 0.06 | |||||||||||||
| $0.11 - 0.20 |
15 | 3.96 | 0.14 | 15 | 0.14 | |||||||||||||||
| $0.21 - 0.30 |
168 | 4.49 | 0.24 | 168 | 0.24 | |||||||||||||||
| $0.31 - 0.40 |
348 | 5.47 | 0.33 | 348 | 0.33 | |||||||||||||||
| $1.03 |
319 | 6.48 | 1.03 | 319 | 1.03 | |||||||||||||||
| $9.23 |
673 | 5.21 | 9.23 | 556 | 9.23 | |||||||||||||||
| $10.91 |
2,820 | 4.94 | 10.91 | 1,668 | 10.91 | |||||||||||||||
| $12.30 |
246 | 5.82 | 12.30 | 71 | 12.30 | |||||||||||||||
| $13.00 |
1,233 | 6.39 | 13.00 | 9 | 13.00 | |||||||||||||||
| $13.48 |
110 | 6.58 | 13.48 | — | — | |||||||||||||||
| $17.02 |
210 | 6.83 | 17.02 | — | — | |||||||||||||||
| 6,235 | 5.45 | $ | 9.88 | 3,247 | $ | 7.58 | ||||||||||||||
Restricted Stock
From 2003 through 2006, the Company entered into restricted stock agreements with key employees in exchange for notes receivable. Under these agreements, the Company has the right to repurchase any unvested shares from the holder at the original issuance price in the event of separation from the Company. The restricted stock vests ratably over a service period, generally four years, and accelerates upon the occurrence of certain events as defined in the restricted stock agreements. In connection with the Series D preferred stock issuance in September 2007, all of the notes receivable outstanding for these shares were paid in full, except one in the amount of $227,000. In May 2009, the Company re-negotiated the terms of this employee’s compensation agreement and forgave the note (see Note 12).
During the year ended December 31, 2010, we issued 135,000 restricted stock units. Twenty-five percent of the restricted stock units vest on the first anniversary of the vesting commencement date, and the remainder of the units vests in equal monthly installments over the next 36 months thereafter.
In conjunction with the purchase of ReachLocal Australia (Note 4), the Company issued 22,000 shares of restricted stock to employees of ReachLocal Australia. These shares vest ratably over service periods ranging from two to three years. Stock-based compensation expense related to these shares was not significant for 2010 and 2009.
The following table summarizes the activity of restricted stock agreements (in thousands):
| Restricted Stock |
Vested | Unvested | ||||||||||
| Outstanding at December 31, 2007 |
2,550 | 1,849 | 701 | |||||||||
| Vested |
— | 342 | (342 | ) | ||||||||
| Repurchase of restricted stock |
(44 | ) | — | (44 | ) | |||||||
| Outstanding at December 31, 2008 |
2,506 | 2,191 | 315 | |||||||||
| Vested |
— | 230 | (230 | ) | ||||||||
| Issuance of restricted stock |
22 | — | 22 | |||||||||
| Outstanding at December 31, 2009 |
2,528 | 2,421 | 107 | |||||||||
| Vested |
— | 114 | (114 | ) | ||||||||
| Cancellations |
(1 | ) | — | (1 | ) | |||||||
| Issuance of restricted stock |
135 | — | 135 | |||||||||
| Outstanding at December 31, 2010 |
2,662 | 2,535 | 127 | |||||||||
Deferred Stock Consideration
In conjunction with the acquisition of SMB:LIVE, the Company is obligated to issue up to 364,692 shares of common stock subject to the achievement of certain employee retention objectives. These retention objectives require a minimum number of the acquired personnel to remain continuously employed for each milestone payment
F-25
Table of Contents
as described in Note 4. If such retention objectives are not met, all or a portion of the Deferred Consideration will be forfeited.
Stock-based compensation expense
In conjunction with the Company’s stock option plan, restricted shares and reserved shares issuable in connection with SMB:LIVE, the Company records stock-based compensation expense net of capitalized stock-based compensation in association with software development costs. The following table summarizes stock-based compensation (in thousands):
| December 31, | ||||||||||||
| 2010 | 2009 | 2008 | ||||||||||
| Stock-based compensation |
$ | 7,827 | $ | 3,253 | $ | 1,903 | ||||||
| Less: Capitalized stock-based compensation |
2,059 | 292 | 92 | |||||||||
| Stock-based compensation expense, net |
$ | 5,768 | $ | 2,961 | $ | 1,811 | ||||||
Stock-based compensation, net of capitalization, is included in the accompanying consolidated statements of operations, in the following caption (in thousands):
| December 31, | ||||||||||||
| 2010 | 2009 | 2008 | ||||||||||
| Stock compensation, net of capitalization |
||||||||||||
| Cost of revenue |
$ | 244 | $ | 86 | $ | 34 | ||||||
| Selling and marketing |
1,218 | 566 | 338 | |||||||||
| Product and technology |
1,183 | 164 | 73 | |||||||||
| General and administrative |
3,123 | 2,145 | 1,366 | |||||||||
| $ | 5,768 | $ | 2,961 | $ | 1,811 | |||||||
As of December 31, 2010, there was $16,092,000 of unrecognized stock-based compensation related to restricted stock, outstanding stock options, and SMB:LIVE deferred stock consideration, net of estimated forfeitures. This amount is expected to be recognized over a weighted average period of 1.4 years. Future stock-based compensation for these awards may differ in the event actual forfeitures may deviate from management’s estimates.
10. Income Taxes
The provision for income taxes for the years ended December 31, 2010, 2009 and 2008, consists of minimum state and foreign income taxes payable in the various jurisdictions in which the Company operates. In 2010, the Company recorded a one-time $702,000 discrete deferred tax benefit related to the acquisition of SMB:LIVE. Significant components of the provision for income taxes are as follows (in thousands):
| Year Ended December 31, | ||||||||||||
| 2010 | 2009 | 2008 | ||||||||||
| Current: |
||||||||||||
| Federal |
$ | — | $ | — | $ | — | ||||||
| State |
64 | 217 | 145 | |||||||||
| Foreign |
96 | — | — | |||||||||
| 160 | 217 | 145 | ||||||||||
| Deferred: |
||||||||||||
| Federal |
(2,829 | ) | 575 | (664 | ) | |||||||
| State |
(477 | ) | 58 | (127 | ) | |||||||
| Foreign |
(101 | ) | (2,018 | ) | (752 | ) | ||||||
| (3,407 | ) | (1,385 | ) | (1,543 | ) | |||||||
| Valuation allowance |
2,707 | 1,385 | 1,543 | |||||||||
| Total provision for income taxes |
$ | (540 | ) | $ | 217 | $ | 145 | |||||
In 2009, the Company recorded a non-cash gain of $16,223,000 in conjunction with the acquisition of ReachLocal Australia (see Note 4). As the Company intends to hold its investment in ReachLocal Australia
F-26
Table of Contents
permanently, the Company did not recognize a provision for income taxes on the gain or the resulting temporary difference. However, should the Company later sell or liquidate its interest in ReachLocal Australia, it would recognize an estimated tax provision of $6,100,000 on the untaxed amount.
The provision for income taxes differs from the amount computed by applying the federal statutory income tax rate to income before income taxes as follows (in thousands):
| Year Ended December 31, | ||||||||||||
| 2010 | 2009 | 2008 | ||||||||||
| Income tax benefit at the federal statutory rate (34%) |
$ | (3,964 | ) | $ | 3,481 | $ | (2,330 | ) | ||||
| State income tax benefit, net of federal tax benefit |
(413 | ) | 295 | (77 | ) | |||||||
| Foreign income taxes, net |
(372 | ) | (809 | ) | 282 | |||||||
| Non-deductible stock-based compensation |
2,169 | 1,019 | 675 | |||||||||
| Gain on acquisition of ReachLocal Australia |
— | (5,516 | ) | — | ||||||||
| Change in valuation allowance |
2,707 | 1,385 | 1,543 | |||||||||
| Acquisition of SMB:LIVE |
(702 | ) | — | — | ||||||||
| Other |
35 | 362 | 52 | |||||||||
| $ | (540 | ) | $ | 217 | $ | 145 | ||||||
The components of net deferred income tax assets and liabilities are as follows (in thousands):
| December 31, | ||||||||
| 2010 | 2009 | |||||||
| Deferred tax assets: |
||||||||
| Vacation accrual |
$ | 700 | $ | 481 | ||||
| Allowance for doubtful accounts |
151 | 58 | ||||||
| Accrued expenses |
1,071 | 640 | ||||||
| Deferred rent |
692 | 431 | ||||||
| Net operating loss carryforward |
8,944 | 5,104 | ||||||
| State taxes |
22 | — | ||||||
| Other |
76 | — | ||||||
| Gross deferred tax assets |
11,656 | 6,714 | ||||||
| Less: valuation allowance |
(7,386 | ) | (4,679 | ) | ||||
| Net deferred tax assets |
4,270 | 2,035 | ||||||
| Deferred tax liabilities: |
||||||||
| State income taxes |
— | (30 | ) | |||||
| Intangible assets |
(1,064 | ) | (621 | ) | ||||
| Capitalized software |
(1,186 | ) | — | |||||
| Depreciation and amortization |
(2,020 | ) | (1,384 | ) | ||||
| Net deferred tax asset (liability) |
$ | — | $ | — | ||||
In accounting for the acquisition of ReachLocal Australia, the Company recorded intangible assets and adjustments to deferred revenue that resulted in additional temporary differences and the recording of a deferred tax liability of $0.8 million. As a result, the Company also reflects a net deferred tax asset of the same amount to recognize a net deferred asset for a portion of the tax attributes acquired. Absent additional evidence of realizability in the future, the Company will increase the valuation allowance against such deferred tax assets as the temporary differences and related deferred tax liability are reduced through the amortization of the amounts recorded in the purchase accounting.
The following table summarizes the Company’s net operating loss carry-forwards as of December 31, 2010:
| Net operating loss: |
Balance
at December 31, 2010 (in thousands) |
Beginning Expiration Year | ||||
| Federal |
$ | 14,957 | 2024 | |||
| State |
10,003 | Various jurisdictions from 2013 to 2028 | ||||
| Foreign |
9,716 | Generally do not expire, but are subject to certain limitations | ||||
F-27
Table of Contents
Due to the Company’s history of operating losses there is substantial uncertainty surrounding whether the Company will ultimately realize its deferred tax assets. Accordingly, these tax assets have been fully reserved as of December 31, 2010, 2009 and 2008.
The aggregate changes in the balance of gross unrecognized tax benefits within the provision for income taxes in the accompanying consolidated statement were as follows (in thousands):
| Year Ended December 31, | ||||||||
| 2010 | 2009 | |||||||
| Gross unrecognized tax benefit as of January 1, |
$ | 2,000 | $ | 2,000 | ||||
| Increases related to tax positions taken |
— | — | ||||||
| Gross unrecognized tax benefit as of December 31, |
$ | 2,000 | $ | 2,000 | ||||
The Company does not expect significant changes to the unrecognized tax benefits in the next 12 months.
The Company’s income tax returns since inception are open to examination by federal, state, and foreign tax authorities. In August of 2010, the Internal Revenue Service initiated an examination of the Company’s U.S. consolidated 2008 income tax return that was finalized in March 2011 with no proposed adjustments.
11. 401(k) Plan
In February 2007, the Company established a defined contribution savings plan under Section 401(k) of the Internal Revenue Code. The plan is available to all full-time employees and allows participants to defer a portion of their annual compensation on a pre-tax basis. The Company may contribute to the plan at the discretion of its board of directors. No contributions have been made to the plan during the years ended December 31, 2010, 2009 and 2008.
12. Related Party Transactions
In September 2009, as part of the ReachLocal Australia acquisition, the Company assumed $96,000 of loan receivables from Company stockholders. The balance of these loans was $87,000 and $99,000 at December 31, 2010 and 2009, respectively and is classified as a component of stockholders equity on the accompanying consolidated balance sheets.
On May 18, 2009, the Company was a party to stock purchase agreements pursuant to which certain holders of more than 5% of the Company’s capital stock purchased additional shares of the Company’s common stock from certain of the Company’s directors and executive officers and other stockholders. The Company’s participation in these transactions was limited to the approval of these transfers by the disinterested members of the board of directors, waiver of certain rights of first refusal with respect to the shares being sold, making certain representations and warranties relating to the Company’s approval of these transactions and valid issuance of the shares being sold as well as to perform various administrative functions associated with these transfers.
In May 2009, a loan receivable of $227,000 related to an earlier purchase of shares from one of the Company’s officers, which together with accrued interest totaled approximately $248,000, was forgiven in full. In addition to forgiving his loan, the Company agreed to pay the officer approximately $142,000 to defray the costs associated with the taxation on the forgiveness of his debt.
During 2008, the Company recognized $61,000 in revenue from ReachLocal Australia in connection with the software license agreement. There was no revenue recognized during the year ended December 31, 2010. During 2009, the amount of revenue recognized from ReachLocal Australia was not significant.
In October 2007, the Company entered into an agreement to lease office space from a portfolio company of one of its investors. Total rent paid to the entity was $110,000 and $145,000 for the years ended December 31, 2009 and 2008, respectively. The lease expired in October 2009 in accordance with its terms.
In 2007, the Company agreed to provide a $250,000 credit to ReachLocal Australia for upgrades and modifications to the Australian Platform and against charges otherwise allowed under the software license agreement. The amount of these services for the years ended December 31, 2009 and 2008 were $27,000 and $89,000, respectively.
13. Segment Information
F-28
Table of Contents
Management has determined that it operates in one segment in accordance with ASC Topic 280, Segment Reporting, as it only reports profit and loss information on an aggregate basis to its chief executive officer, who is the Company’s chief operating decision maker.
Revenue by geographic region with respect to the Direct Local channel and national brands is based on the physical location of the sales office, and with respect to agencies and resellers, is based on the physical location of the agency or reseller. The following summarizes revenue by geographic region (in thousands):
| Year Ended December 31, | ||||||||||||
| 2010 | 2009 | 2008 | ||||||||||
| Revenue: |
||||||||||||
| North America |
$ | 241,696 | $ | 189,467 | $ | 145,413 | ||||||
| International |
49,993 | 13,650 | 1,274 | |||||||||
| $ | 291,689 | $ | 203,117 | $ | 146,687 | |||||||
| Long Lived Assets: |
||||||||||||
| North America |
$ | 7,039 | $ | 5,985 | ||||||||
| International |
1,649 | 801 | ||||||||||
| $ | 8,688 | $ | 6,786 | |||||||||
14. Quarterly Information (Unaudited)
The following table sets forth unaudited quarterly consolidated statement of operations data for the four quarters of each of 2010 and 2009. Management has prepared the statement of operations data for each of these quarters on the same basis as the audited consolidated financial statements and, in the opinion of the management, the statement of operations data includes all adjustments, consisting solely of normal recurring adjustments, necessary for the fair statement of the results of operations for these periods. These quarterly results of operations are not necessarily indicative of the Company’s operating results for any future period (in thousands):
| Dec 31, 2010 |
Sept 30, 2010 |
June 30, 2010 |
Mar 31, 2010 |
Dec 31, 2009 |
Sept 30, 2009 |
June 30, 2009 |
Mar 31, 2009 |
|||||||||||||||||||||||||
| Revenue |
$ | 80,580 | $ | 77,121 | $ | 70,362 | $ | 63,626 | $ | 59,802 | $ | 52,610 | $ | 47,970 | $ | 42,735 | ||||||||||||||||
| Cost of revenue (1) |
43,561 | 42,172 | 38,447 | 34,839 | 32,604 | 29,173 | 26,618 | 23,823 | ||||||||||||||||||||||||
| Operating expenses: |
||||||||||||||||||||||||||||||||
| Selling and marketing (1) |
30,869 | 28,874 | 26,341 | 23,940 | 22,240 | 19,174 | 17,681 | 17,080 | ||||||||||||||||||||||||
| Product and technology (1) |
3,358 | 3,015 | 2,522 | 2,344 | 1,586 | 1,319 | 1,288 | 974 | ||||||||||||||||||||||||
| General and administrative (1) |
6,689 | 6,003 | 5,618 | 5,385 | 4,936 | 4,179 | 3,362 | 3,057 | ||||||||||||||||||||||||
| Total operating expenses |
40,916 | 37,892 | 34,481 | 31,669 | 28,762 | 24,672 | 22,331 | 21,111 | ||||||||||||||||||||||||
| Loss from operations |
$ | (3,897 | ) | $ | (2,943 | ) | $ | (2,566 | ) | $ | (2,882 | ) | $ | (1,564 | ) | $ | (1,235 | ) | $ | (979 | ) | $ | (2,199 | ) | ||||||||
| (1) Stock-based compensation, net of capitalization included in the above line items (in thousands): |
| |||||||||||||||||||||||||||||||
| Cost of revenue |
$ | 32 | $ | 51 | $ | 70 | $ | 91 | $ | 28 | $ | 33 | $ | 15 | $ | 10 | ||||||||||||||||
| Selling and marketing |
453 | 324 | 260 | 181 | 144 | 180 | 173 | 69 | ||||||||||||||||||||||||
| Product and technology |
357 | 303 | 259 | 264 | 63 | 69 | 15 | 17 | ||||||||||||||||||||||||
| General and administrative |
892 | 871 | 811 | 549 | 618 | 526 | 554 | 447 | ||||||||||||||||||||||||
| Total |
$ | 1,734 | $ | 1,549 | $ | 1,400 | $ | 1,085 | $ | 853 | $ | 808 | $ | 757 | $ | 543 | ||||||||||||||||
F-29
Table of Contents
15. Subsequent Events
Acquisition of DealOn
On February 8, 2011, the Company entered into an Agreement (the “Acquisition Agreement”) to acquire all of the outstanding member interests of DealOn for consideration of up to approximately $9.7 million in cash and stock. The consideration is subject to a working capital adjustment if the net working capital is less than zero, which is expected to reduce the purchase price by approximately $0.2 million. On the closing date, the Company paid $5.8 million in cash and issued 82,878 shares of its common stock. The balance of the purchase price (the “DealOn Deferred Consideration”) is estimated to total up to $1.5 million and 22,095 common shares of the Company’s stock, which are both payable, subject to adjustment under the terms of the Acquisition Agreement, in three installments, with 50% payable February 2012, 25% payable August 2012 and 25% payable February 2013. The transaction is an asset acquisition for US federal and relevant state tax purposes. Management is in the process of determining the allocation of purchase price.
Payment of SMB:LIVE Deferred Payment Obligation
On February 22, 2011, the Company made a deferred payment required under the SMB:LIVE acquisition agreement in the amount of $165,000 and issued 90,062 shares of its common stock (see Notes 4, 7, 8 and 9). The payment made reflected an adjustment for working capital as stipulated under the Merger Agreement. The remaining obligation under the Merger Agreement for deferred cash consideration is $827,000 and $3,570,000 of deferred stock consideration.
F-30
Table of Contents
Schedule II: Valuation and Qualifying Accounts
| Balance at Beginning of Period |
Charged to Expenses/ Against Revenue |
Write-Offs, Net of Recoveries |
Balance at End of Period |
|||||||||||||
| Allowance for doubtful accounts (in thousands) |
||||||||||||||||
| Year ended December 31, 2010 |
$ | 142 | $ | 252 | $ | (21 | ) | $ | 373 | |||||||
| Year ended December 31, 2009 |
$ | 314 | $ | 12 | $ | (184 | ) | $ | 142 | |||||||
| Year ended December 31, 2008 |
$ | 102 | $ | 212 | $ | — | $ | 314 | ||||||||
Table of Contents
(3) Exhibits
| Exhibit |
Description of Document | |
| 3.01 | Amended and Restated Certificate of Incorporation of ReachLocal, Inc., dated May 19, 2010 | |
| 3.02 | Amended and Restated Bylaws of ReachLocal, Inc. | |
| 4.01 | Form of ReachLocal, Inc. Common Stock Certificate (incorporated by reference to Exhibit 4.01 to the Company’s Amendment No. 3 to the Registration Statement on Form S-1 (File No. 333-163905) filed with the SEC on April 27, 2010) | |
| 4.02 | Second Amended and Restated Investors’ Rights Agreement, by and among ReachLocal, Inc., the Investors listed on Exhibit A, Exhibit B, Exhibit C and Exhibit D thereto, and the Founders listed on Exhibit E thereto, dated as of September 17, 2007 and as amended as of July 1, 2008, May 14, 2009, and May 18, 2009 (incorporated by reference to Exhibit 4.02 to the Company’s Amendment No. 1 to the Registration Statement on Form S-1 (File No. 333-163905) filed with the SEC on February 2, 2010) | |
| 4.03 | Stockholders Agreement, by and between ReachLocal, Inc. and NetUs Pty Limited ACN 117 674 030, dated as of September 11, 2009 (incorporated by reference to Exhibit 4.03 to the Company’s Amendment No. 1 to the Registration Statement on Form S-1 (File No. 333-163905) filed with the SEC on February 2, 2010) | |
| 10.01* | Indemnification Agreement entered into by and between ReachLocal, Inc. and Zorik Gordon | |
| 10.02* | Indemnification Agreement entered into by and between ReachLocal, Inc. and David Carlick | |
| 10.03* | Indemnification Agreement entered into by and between ReachLocal, Inc. and Robert Dykes | |
| 10.04* | Indemnification Agreement entered into by and between ReachLocal, Inc. and James Geiger | |
| 10.05* | Indemnification Agreement entered into by and between ReachLocal, Inc. and Habib Kairouz | |
| 10.06* | Indemnification Agreement entered into by and between ReachLocal, Inc. and Alan Salzman | |
| 10.07* | Indemnification Agreement entered into by and between ReachLocal, Inc. and Jason Whitt | |
| 10.08* | Indemnification Agreement entered into by and between ReachLocal, Inc. and Nathan Hanks | |
| 10.09* | Indemnification Agreement entered into by and between ReachLocal, Inc. and Michael Kline | |
| 10.10* | Indemnification Agreement entered into by and between ReachLocal, Inc. and Ross G. Landsbaum | |
| 10.11* | Indemnification Agreement entered into by and between ReachLocal, Inc. and Gadi Shamia | |
| 10.12* | Indemnification Agreement entered into by and between ReachLocal, Inc. and Jeffrey L. Hagins | |
| 10.13 | Lease Agreement, dated as of June 2, 2006, by and between ReachLocal, Inc. and CB Parkway Business Center, Ltd., as amended (incorporated by reference to Exhibit 10.02 to the Company’s Amendment No. 1 to the Registration Statement on Form S-1 (File No. 333-163905) filed with the SEC on February 2, 2010) | |
| 10.14 | Office Lease, dated as of August 30, 2006, by and between ReachLocal, Inc and Douglas Emmett 2000, LLC, as amended (incorporated by reference to Exhibit 10.03 to the Company’s Amendment No. 3 to the Registration Statement on Form S-1 (File No. 333-163905) filed with the SEC on April 27, 2010) | |
Table of Contents
| Exhibit |
Description of Document | |
| 10.15 | Second Amendment to Office Lease, dated as of September 1, 2010 between Douglas Emmett 2000, LLC, as Landlord and ReachLocal, Inc., as Tenant (incorporated by reference to Exhibit 10.1 to the Company’s Quarterly Report on Form 10-Q for the quarter ended September 30, 2010 (File No. 001-34749) filed with the Securities and Exchange Commission on November 4, 2010) | |
| 10.16* | ReachLocal, Inc. 2004 Stock Plan, adopted April 21, 2004, as amended as of April 8, 2005, July 31, 2006 and September 17, 2007 (incorporated by reference to Exhibit 10.04 to the Company’s Amendment No. 1 to the Registration Statement on Form S-1 (File No. 333-163905) filed with the SEC on February 2, 2010) | |
| 10.17* | Form of Option Agreement (Regulation D Early Exercise) (incorporated by reference to Exhibit 10.06 to the Company’s Amendment No. 1 to the Registration Statement on Form S-1 (File No. 333-163905) filed with the SEC on February 2, 2010) | |
| 10.18* | Form of Option Agreement (Rule 701) (incorporated by reference to Exhibit 10.07 to the Company’s Amendment No. 1 to the Registration Statement on Form S-1 (File No. 333-163905) filed with the SEC on February 2, 2010) | |
| 10.19* | 2009 Executive Bonus Plan, effective as of January 1, 2009 (incorporated by reference to Exhibit 10.08 to the Company’s Amendment No. 1 to the Registration Statement on Form S-1 (File No. 333-163905) filed with the SEC on February 2, 2010) | |
| 10.20* | ReachLocal, Inc. Change in Control and Severance Policy for Senior Management, effective as of February 21, 2010 (incorporated by reference to Exhibit 10.09 to the Company’s Amendment No. 3 to the Registration Statement on Form S-1 (File No. 333-163905) filed with the SEC on April 27, 2010) | |
| 10.21* | Offer Letter between ReachLocal, Inc. and Zorik Gordon, dated May 14, 2004 (incorporated by reference to Exhibit 10.10 to the Company’s Amendment No. 1 to the Registration Statement on Form S-1 (File No. 333-163905) filed with the SEC on February 2, 2010) | |
| 10.22* | Offer Letter between ReachLocal, Inc. and Michael Kline, dated May 14, 2004 (incorporated by reference to Exhibit 10.11 to the Company’s Amendment No. 1 to the Registration Statement on Form S-1 (File No. 333-163905) filed with the SEC on February 2, 2010) | |
| 10.23* | Offer of Employment by and between ReachLocal, Inc. and Ross G. Landsbaum, dated as of May 30, 2008 (incorporated by reference to Exhibit 10.12 to the Company’s Amendment No. 1 to the Registration Statement on Form S-1 (File No. 333-163905) filed with the SEC on February 2, 2010) | |
| 10.24* | Offer Letter between ReachLocal, Inc. and Gadi Shamia, dated February 27, 2009 (incorporated by reference to Exhibit 10.13 to the Company’s Amendment No. 1 to the Registration Statement on Form S-1 (File No. 333-163905) filed with the SEC on February 2, 2010) | |
| 10.25* | Offer of Employment by and between ReachLocal, Inc. and Nathan Hanks, dated as of May 6, 2009 (incorporated by reference to Exhibit 10.14 to the Company’s Amendment No. 1 to the Registration Statement on Form S-1 (File No. 333-163905) filed with the SEC on February 2, 2010) | |
| 10.26* | Offer of Employment by and between ReachLocal, Inc. and Jeffrey L. Hagins, dated August 23, 2010 | |
| 10.27* | Form of Amended and Restated Restricted Stock Purchase Agreement (incorporated by reference to Exhibit 10.15 to the Company’s Amendment No. 1 to the Registration Statement on Form S-1 (File No. 333-163905) filed with the SEC on February 2, 2010) | |
| 10.28* | Share Purchase Agreement, by and among ReachLocal, Inc. and the Persons listed on Annex A thereto, dated as of September 11, 2009 (incorporated by reference to Exhibit 10.16 to the Company’s Amendment No. 2 to the Registration Statement on Form S-1 (File No. 333-163905) filed with the SEC on February 24, 2010) | |
Table of Contents
| Exhibit |
Description of Document | |
| 10.29* | ReachLocal, Inc. Incentive Bonus Plan, effective as of February 21, 2010 (incorporated by reference to Exhibit 10.17 to the Company’s Amendment No. 3 to the Registration Statement on Form S-1 (File No. 333-163905) filed with the SEC on April 27, 2010) | |
| 10.30* | ReachLocal, Inc. Director Stock Plan (incorporated by reference to Exhibit 10.18 to the Company’s Amendment No. 3 to the Registration Statement on Form S-1 (File No. 333-163905) filed with the SEC on April 27, 2010) | |
| 10.31* | Amendment to Offer Letter between ReachLocal, Inc. and Zorik Gordon, dated February 22, 2010 (incorporated by reference to Exhibit 10.19 to the Company’s Amendment No. 3 to the Registration Statement on Form S-1 (File No. 333-163905) filed with the SEC on April 27, 2010) | |
| 10.32* | Amendment to Offer Letter between ReachLocal, Inc. and Michael Kine, dated February 22, 2010 (incorporated by reference to Exhibit 10.20 to the Company’s Amendment No. 3 to the Registration Statement on Form S-1 (File No. 333-163905) filed with the SEC on April 27, 2010) | |
| 10.33* | Amendment to Offer of Employment between ReachLocal, Inc. and Nathan Hanks, dated February 22, 2010 (incorporated by reference to Exhibit 10.21 to the Company’s Amendment No. 3 to the Registration Statement on Form S-1 (File No. 333-163905) filed with the SEC on April 27, 2010) | |
| 10.34* | Amended and Restated ReachLocal, Inc. 2008 Stock Incentive Plan | |
| 10.35* | Form of Restricted Stock Unit Award Agreement (incorporated by reference to Exhibit 10.23 to the Company’s Amendment No. 4 to the Registration Statement on Form S-1 (File No. 333-163905) filed with the SEC on May 3, 2010) | |
| 10.36* | Form of Stock Option Agreement (incorporated by reference to Exhibit 10.24 to the Company’s Amendment No. 4 to the Registration Statement on Form S-1 (File No. 333-163905) filed with the SEC on May 3, 2010) | |
| 10.37* | Form of Executive Stock Option Agreement (incorporated by reference to Exhibit 10.25 to the Company’s Amendment No. 5 to the Registration Statement on Form S-1 (File No. 333-163905) filed with the SEC on May 18, 2010) | |
| 10.38* | Form of Senior Executive Stock Option Agreement | |
| 10.39* | Form of UK Executive Stock Option Agreement | |
| 14.01 | Code of Business Conduct and Ethics | |
| 21.01 | List of subsidiaries of ReachLocal, Inc. | |
| 23.01 | Consent of Independent Registered Public Accounting Firm, Grant Thornton LLP | |
| 24.01 | Power of Attorney (included on signature page to this Annual Report on Form 10-K) | |
| 31.01 | Certification of the Chief Executive Officer pursuant to Rules 13a-14(a) and 15d-14(a) of the Securities Exchange Act of 1934, as amended, as adopted pursuant to Section 302 of the Sarbanes-Oxley Act of 2002 | |
| 31.02 | Certification of the Chief Financial Officer pursuant to Rules 13a-14(a) and 15d-14(a) of the Securities Exchange Act of 1934, as amended, as adopted pursuant to Section 302 of the Sarbanes-Oxley Act of 2002 | |
Table of Contents
| Exhibit |
Description of Document | |
| 32.01† | Certification of the Chief Executive Officer pursuant to 18 U.S.C. Section 1350, as adopted pursuant to Section 906 of the Sarbanes-Oxley Act of 2002 | |
| 32.02† | Certification of the Chief Financial Officer pursuant to 18 U.S.C. Section 1350, as adopted pursuant to Section 906 of the Sarbanes-Oxley Act of 2002 | |
| * | Indicates management contract or compensatory plan, contract or arrangement. |
| † | Indicated exhibits furnished herewith. |
Table of Contents
Pursuant to the requirements of Section 13 or 15(d) of the Securities Exchange Act of 1934, the registrant has duly caused this report to be signed on its behalf by the undersigned, thereunto duly authorized, as of March 28, 2011.
| REACHLOCAL, INC. | ||
| By: | /s/ Zorik Gordon | |
| Name: | Zorik Gordon | |
| Title: | President and Chief Executive Officer | |
POWER OF ATTORNEY
Each person whose individual signature appears below hereby authorizes and appoints Zorik Gordon and Ross G. Landsbaum, and each of them, with full power of substitution and resubstitution and full power to act without the other, as his or her true and lawful attorney-in-fact and agent to act in his or her name, place and stead and to execute in the name and on behalf of each person, individually and in each capacity stated below, solely for the purposes of filing any and all amendments to this Annual Report on Form 10-K, and to file the same, with all exhibits thereto, and other documents in connection therewith, with the Securities and Exchange Commission, granting unto said attorneys-in-fact and agents, and each of them, full power and authority to do and perform each and every act and thing, ratifying and confirming all that said attorneys-in-fact and agents or any of them or their or his substitute or substitutes may lawfully do or cause to be done by virtue thereof solely for the purposes stated therein.
Pursuant to the requirements of the Securities Exchange Act of 1934, this report has been signed below by the following persons on behalf of the registrant and in the capacities as of March 28, 2011.
| Signature |
Title |
Date | ||
| /s/ Zorik Gordon Zorik Gordon |
President and Chief Executive Officer, Director (Principal Executive Officer) |
March 28, 2011 | ||
| /s/ Ross G. Landsbaum Ross G. Landsbaum |
Chief Financial Officer (Principal Financial Officer) |
March 28, 2011 | ||
| /s/ Chris Powell Chris Powell |
Senior Vice President, Corporate Controller (Principal Accounting Officer) |
March 28, 2011 | ||
Table of Contents
| /s/ David Carlick David Carlick |
Director | March 28, 2011 | ||
| /s/ Robert Dykes Robert Dykes |
Director | March 28, 2011 | ||
| /s/ James Geiger James Geiger |
Director | March 28, 2011 | ||
| /s/ Habib Kairouz Habib Kairouz |
Director | March 28, 2011 | ||
| /s/ Alan Salzman Alan Salzman |
Director | March 28, 2011 | ||
| /s/ Jason Whitt Jason Whitt |
Director | March 28, 2011 | ||
Table of Contents
| Exhibit |
Description of Document | |
| 3.01 | Amended and Restated Certificate of Incorporation of ReachLocal, Inc., dated May 19, 2010 | |
| 3.02 | Amended and Restated Bylaws of ReachLocal, Inc. | |
| 4.01 | Form of ReachLocal, Inc. Common Stock Certificate (incorporated by reference to Exhibit 4.01 to the Company’s Amendment No. 3 to the Registration Statement on Form S-1 (File No. 333-163905) filed with the SEC on April 27, 2010) | |
| 4.02 | Second Amended and Restated Investors’ Rights Agreement, by and among ReachLocal, Inc., the Investors listed on Exhibit A, Exhibit B, Exhibit C and Exhibit D thereto, and the Founders listed on Exhibit E thereto, dated as of September 17, 2007 and as amended as of July 1, 2008, May 14, 2009, and May 18, 2009 (incorporated by reference to Exhibit 4.02 to the Company’s Amendment No. 1 to the Registration Statement on Form S-1 (File No. 333-163905) filed with the SEC on February 2, 2010) | |
| 4.03 | Stockholders Agreement, by and between ReachLocal, Inc. and NetUs Pty Limited ACN 117 674 030, dated as of September 11, 2009 (incorporated by reference to Exhibit 4.03 to the Company’s Amendment No. 1 to the Registration Statement on Form S-1 (File No. 333-163905) filed with the SEC on February 2, 2010) | |
| 10.01* | Indemnification Agreement entered into by and between ReachLocal, Inc. and Zorik Gordon | |
| 10.02* | Indemnification Agreement entered into by and between ReachLocal, Inc. and David Carlick | |
| 10.03* | Indemnification Agreement entered into by and between ReachLocal, Inc. and Robert Dykes | |
| 10.04* | Indemnification Agreement entered into by and between ReachLocal, Inc. and James Geiger | |
| 10.05* | Indemnification Agreement entered into by and between ReachLocal, Inc. and Habib Kairouz | |
| 10.06* | Indemnification Agreement entered into by and between ReachLocal, Inc. and Alan Salzman | |
| 10.07* | Indemnification Agreement entered into by and between ReachLocal, Inc. and Jason Whitt | |
| 10.08* | Indemnification Agreement entered into by and between ReachLocal, Inc. and Nathan Hanks | |
| 10.09* | Indemnification Agreement entered into by and between ReachLocal, Inc. and Michael Kline | |
| 10.10* | Indemnification Agreement entered into by and between ReachLocal, Inc. and Ross G. Landsbaum | |
| 10.11* | Indemnification Agreement entered into by and between ReachLocal, Inc. and Gadi Shamia | |
| 10.12* | Indemnification Agreement entered into by and between ReachLocal, Inc. and Jeffrey L. Hagins | |
| 10.13 | Lease Agreement, dated as of June 2, 2006, by and between ReachLocal, Inc. and CB Parkway Business Center, Ltd., as amended (incorporated by reference to Exhibit 10.02 to the Company’s Amendment No. 1 to the Registration Statement on Form S-1 (File No. 333-163905) filed with the SEC on February 2, 2010) | |
| 10.14 | Office Lease, dated as of August 30, 2006, by and between ReachLocal, Inc and Douglas Emmett 2000, LLC, as amended (incorporated by reference to Exhibit 10.03 to the Company’s Amendment No. 3 to the Registration Statement on Form S-1 (File No. 333-163905) filed with the SEC on April 27, 2010) | |
Table of Contents
| Exhibit |
Description of Document | |
| 10.14 | Second Amendment to Office Lease, dated as of September 1, 2010 between Douglas Emmett 2000, LLC, as Landlord and ReachLocal, Inc., as Tenant (incorporated by reference to Exhibit 10.1 to the Company’s Quarterly Report on Form 10-Q for the quarter ended September 30, 2010 (File No. 001-34749) filed with the Securities and Exchange Commission on November 4, 2010) | |
| 10.15* | ReachLocal, Inc. 2004 Stock Plan, adopted April 21, 2004, as amended as of April 8, 2005, July 31, 2006 and September 17, 2007 (incorporated by reference to Exhibit 10.04 to the Company’s Amendment No. 1 to the Registration Statement on Form S-1 (File No. 333-163905) filed with the SEC on February 2, 2010) | |
| 10.16* | Form of Option Agreement (Regulation D Early Exercise) (incorporated by reference to Exhibit 10.06 to the Company’s Amendment No. 1 to the Registration Statement on Form S-1 (File No. 333-163905) filed with the SEC on February 2, 2010) | |
| 10.17* | Form of Option Agreement (Rule 701) (incorporated by reference to Exhibit 10.07 to the Company’s Amendment No. 1 to the Registration Statement on Form S-1 (File No. 333-163905) filed with the SEC on February 2, 2010) | |
| 10.18* | 2009 Executive Bonus Plan, effective as of January 1, 2009 (incorporated by reference to Exhibit 10.08 to the Company’s Amendment No. 1 to the Registration Statement on Form S-1 (File No. 333-163905) filed with the SEC on February 2, 2010) | |
| 10.19* | ReachLocal, Inc. Change in Control and Severance Policy for Senior Management, effective as of February 21, 2010 (incorporated by reference to Exhibit 10.09 to the Company’s Amendment No. 3 to the Registration Statement on Form S-1 (File No. 333-163905) filed with the SEC on April 27, 2010) | |
| 10.20* | Offer Letter between ReachLocal, Inc. and Zorik Gordon, dated May 14, 2004 (incorporated by reference to Exhibit 10.10 to the Company’s Amendment No. 1 to the Registration Statement on Form S-1 (File No. 333-163905) filed with the SEC on February 2, 2010) | |
| 10.21* | Offer Letter between ReachLocal, Inc. and Michael Kline, dated May 14, 2004 (incorporated by reference to Exhibit 10.11 to the Company’s Amendment No. 1 to the Registration Statement on Form S-1 (File No. 333-163905) filed with the SEC on February 2, 2010) | |
| 10.22* | Offer of Employment by and between ReachLocal, Inc. and Ross G. Landsbaum, dated as of May 30, 2008 (incorporated by reference to Exhibit 10.12 to the Company’s Amendment No. 1 to the Registration Statement on Form S-1 (File No. 333-163905) filed with the SEC on February 2, 2010) | |
| 10.23* | Offer Letter between ReachLocal, Inc. and Gadi Shamia, dated February 27, 2009 (incorporated by reference to Exhibit 10.13 to the Company’s Amendment No. 1 to the Registration Statement on Form S-1 (File No. 333-163905) filed with the SEC on February 2, 2010) | |
| 10.24* | Offer of Employment by and between ReachLocal, Inc. and Nathan Hanks, dated as of May 6, 2009 (incorporated by reference to Exhibit 10.14 to the Company’s Amendment No. 1 to the Registration Statement on Form S-1 (File No. 333-163905) filed with the SEC on February 2, 2010) | |
| 10.25* | Form of Amended and Restated Restricted Stock Purchase Agreement (incorporated by reference to Exhibit 10.15 to the Company’s Amendment No. 1 to the Registration Statement on Form S-1 (File No. 333-163905) filed with the SEC on February 2, 2010) | |
| 10.26* | Share Purchase Agreement, by and among ReachLocal, Inc. and the Persons listed on Annex A thereto, dated as of September 11, 2009 (incorporated by reference to Exhibit 10.16 to the Company’s Amendment No. 2 to the Registration Statement on Form S-1 (File No. 333-163905) filed with the SEC on February 24, 2010) | |
Table of Contents
| Exhibit |
Description of Document | |
| 10.29* | ReachLocal, Inc. Incentive Bonus Plan, effective as of February 21, 2010 (incorporated by reference to Exhibit 10.17 to the Company’s Amendment No. 3 to the Registration Statement on Form S-1 (File No. 333-163905) filed with the SEC on April 27, 2010) | |
| 10.30* | ReachLocal, Inc. Director Stock Plan (incorporated by reference to Exhibit 10.18 to the Company’s Amendment No. 3 to the Registration Statement on Form S-1 (File No. 333-163905) filed with the SEC on April 27, 2010) | |
| 10.31* | Amendment to Offer Letter between ReachLocal, Inc. and Zorik Gordon, dated February 22, 2010 (incorporated by reference to Exhibit 10.19 to the Company’s Amendment No. 3 to the Registration Statement on Form S-1 (File No. 333-163905) filed with the SEC on April 27, 2010) | |
| 10.32* | Amendment to Offer Letter between ReachLocal, Inc. and Michael Kine, dated February 22, 2010 (incorporated by reference to Exhibit 10.20 to the Company’s Amendment No. 3 to the Registration Statement on Form S-1 (File No. 333-163905) filed with the SEC on April 27, 2010) | |
| 10.33* | Amendment to Offer of Employment between ReachLocal, Inc. and Nathan Hanks, dated February 22, 2010 (incorporated by reference to Exhibit 10.21 to the Company’s Amendment No. 3 to the Registration Statement on Form S-1 (File No. 333-163905) filed with the SEC on April 27, 2010) | |
| 10.34* | Amended and Restated ReachLocal, Inc. 2008 Stock Incentive Plan | |
| 10.35* | Form of Restricted Stock Unit Award Agreement (incorporated by reference to Exhibit 10.23 to the Company’s Amendment No. 4 to the Registration Statement on Form S-1 (File No. 333-163905) filed with the SEC on May 3, 2010) | |
| 10.36* | Form of Stock Option Agreement (incorporated by reference to Exhibit 10.24 to the Company’s Amendment No. 4 to the Registration Statement on Form S-1 (File No. 333-163905) filed with the SEC on May 3, 2010) | |
| 10.37* | Form of Executive Stock Option Agreement (incorporated by reference to Exhibit 10.25 to the Company’s Amendment No. 5 to the Registration Statement on Form S-1 (File No. 333-163905) filed with the SEC on May 18, 2010) | |
| 10.38* | Form of Senior Executive Stock Option Agreement | |
| 10.39* | Form of UK Executive Stock Option Agreement | |
| 14.01 | Code of Business Conduct and Ethics | |
| 21.01 | List of subsidiaries of ReachLocal, Inc. | |
| 23.01 | Consent of Independent Registered Public Accounting Firm, Grant Thornton LLP | |
| 24.01 | Power of Attorney (included on signature page to this Annual Report on Form 10-K) | |
| 31.01 | Certification of the Chief Executive Officer pursuant to Rules 13a-14(a) and 15d-14(a) of the Securities Exchange Act of 1934, as amended, as adopted pursuant to Section 302 of the Sarbanes-Oxley Act of 2002 | |
| 31.02 | Certification of the Chief Financial Officer pursuant to Rules 13a-14(a) and 15d-14(a) of the Securities Exchange Act of 1934, as amended, as adopted pursuant to Section 302 of the Sarbanes-Oxley Act of 2002 | |
Table of Contents
| Exhibit |
Description of Document | |
| 32.01† | Certification of the Chief Executive Officer pursuant to 18 U.S.C. Section 1350, as adopted pursuant to Section 906 of the Sarbanes-Oxley Act of 2002 | |
| 32.02† | Certification of the Chief Financial Officer pursuant to 18 U.S.C. Section 1350, as adopted pursuant to Section 906 of the Sarbanes-Oxley Act of 2002 | |
| * | Indicates management contract or compensatory plan, contract or arrangement. |
| † | Indicated exhibits furnished herewith. |