Attached files
| file | filename |
|---|---|
| 8-K - 8-K - InvenTrust Properties Corp. | a11-8690_18k.htm |
Exhibit 99.1
|
|
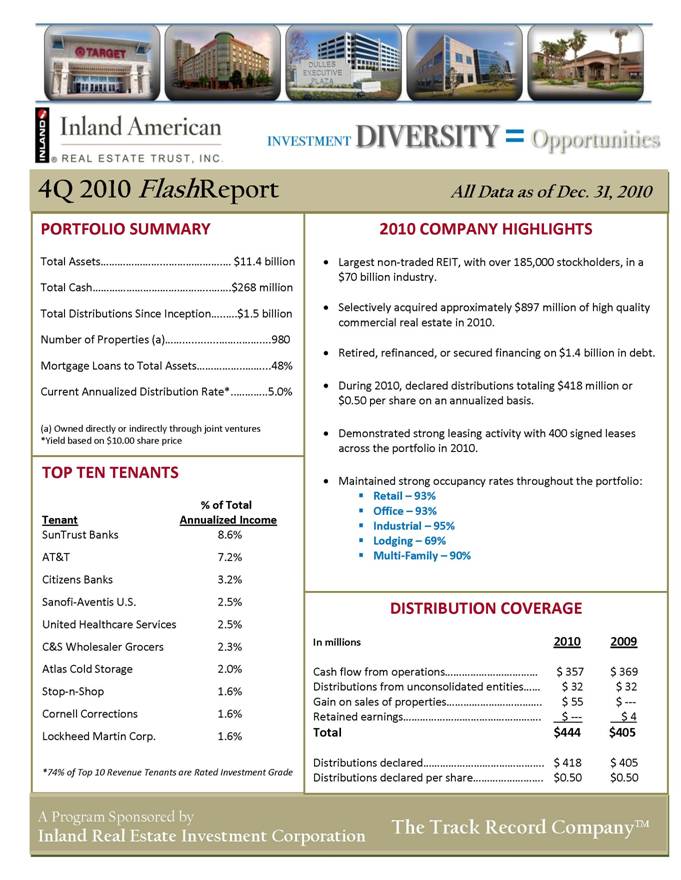
Inland American REAL ESTATE TRUST, INC. INVESTMENT DIVERSITY = Opportunities 4Q 2010 FlashReport All Data as of Dec. 31, 2010 2010 COMPANY HIGHLIGHTS . Largest non-traded REIT, with over 185,000 stockholders, in a $70 billion industry. . Selectively acquired approximately $897 million of high quality commercial real estate in 2010. . Retired, refinanced, or secured financing on $1.4 billion in debt. . During 2010, declared distributions totaling $418 million or $0.50 per share on an annualized basis. . Demonstrated strong leasing activity with 400 signed leases across the portfolio in 2010. . Maintained strong occupancy rates throughout the portfolio: . Retail – 93% . Office – 93% . Industrial – 95% . Lodging – 69% . Multi-Family – 90% PORTFOLIO SUMMARY Total Assets $11.4 billion Total Cash $268 million Total Distributions Since Inception $1.5 billion Number of Properties (a) 980 Mortgage Loans to Total Assets 48% Current Annualized Distribution Rate* 5.0% (a) Owned directly or indirectly through joint ventures *Yield based on $10.00 share price TOP TEN TENANTS % of Total Tenant Annualized Income SunTrust Banks 8.6% AT&T 7.2% Citizens Banks 3.2% Sanofi-Aventis U.S. 2.5% United Healthcare Services 2.5% C&S Wholesaler Grocers 2.3% Atlas Cold Storage 2.0% Stop-n-Shop 1.6% Cornell Corrections 1.6% Lockheed Martin Corp. 1.6% *74% of Top 10 Revenue Tenants are Rated Investment Grade DISTRIBUTION COVERAGE In millions 2010 2009 Cash flow from operations $ 357 $ 369 Distributions from unconsolidated entities $ 32 $ 32 Gain on sales of properties $ 55 $ — Retained earnings $ — $ 4 Total $444 $405 Distributions declared $ 418 $ 405 Distributions declared per share $0.50 $0.50 A Program Sponsored by Inland Real Estate Investment Corporation The Track Record Company™ |
|
|
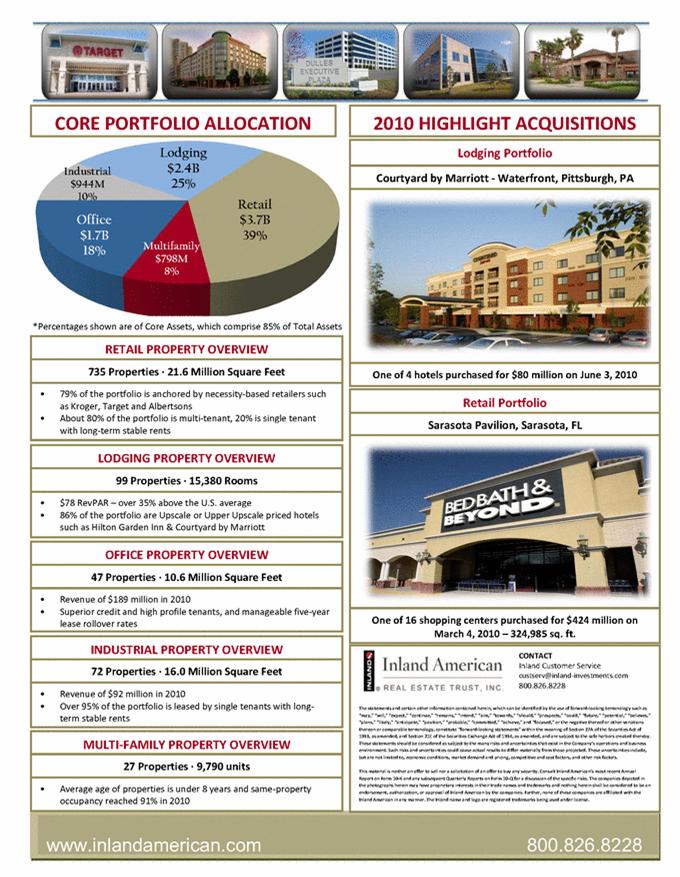
Retail $3.7B 39% Multifamily $798M 8% Office $1.7B 18% Industrial $944M 10% Lodging $2.4B 25% CORE PORTFOLIO ALLOCATION 2010 HIGHLIGHT ACQUISITIONS *Percentages shown are of Core Assets, which comprise 85% of Total Assets www.inlandamerican.com 800.826.8228 RETAIL PROPERTY OVERVIEW 735 Properties 21.6 Million Square Feet 79% of the portfolio is anchored by necessity-based retailers such as Kroger, Target and Albertsons About 80% of the portfolio is multi-tenant, 20% is single tenant with long-term stable rents LODGING PROPERTY OVERVIEW 99 Properties 15,380 Rooms $78 RevPAR – over 35% above the U.S. average 86% of the portfolio are Upscale or Upper Upscale priced hotels such as Hilton Garden Inn & Courtyard by Marriott INDUSTRIAL PROPERTY OVERVIEW 72 Properties 16.0 Million Square Feet Revenue of $92 million in 2010 Over 95% of the portfolio is leased by single tenants with long-term stable rents OFFICE PROPERTY OVERVIEW 47 Properties 10.6 Million Square Feet Revenue of $189 million in 2010 Superior credit and high profile tenants, and manageable five-year lease rollover rates Lodging Portfolio Courtyard by Marriott - Waterfront, Pittsburgh, PA CONTACT Inland Customer Service custserv@inland-investments.com 800.826.8228 The statements and certain other information contained herein, which can be identified by the use of forward-looking terminology such as “may,” “will,” “expect,” “continue,” “remains,” “intend,” “aim,” “towards,” “should,” “prospects,” “could,” “future,” “potential,” “believes,” “plans,” “likely,” “anticipate,” “position,” “probable,” “committed,” “achieve,” and “focused,” or the negative thereof or other variations thereon or comparable terminology, constitute “forward-looking statements” within the meaning of Section 27A of the Securities Act of 1933, as amended, and Section 21E of the Securities Exchange Act of 1934, as amended, and are subject to the safe harbors created thereby. These statements should be considered as subject to the many risks and uncertainties that exist in the Company’s operations and business environment. Such risks and uncertainties could cause actual results to differ materially from those projected. These uncertainties include, but are not limited to, economic conditions, market demand and pricing, competitive and cost factors, and other risk factors. This material is neither an offer to sell nor a solicitation of an offer to buy any security. Consult Inland American’s most recent Annual Report on Form 10-K and any subsequent Quarterly Reports on Form 10-Q for a discussion of the specific risks. The companies depicted in the photographs herein may have proprietary interests in their trade names and trademarks and nothing herein shall be considered to be an endorsement, authorization, or approval of Inland American by the companies. Further, none of these companies are affiliated with the Inland American in any manner. The Inland name and logo are registered trademarks being used under license. MULTI-FAMILY PROPERTY OVERVIEW 27 Properties 9,790 units Average age of properties is under 8 years and same-property occupancy reached 91% in 2010 One of 4 hotels purchased for $80 million on June 3, 2010 Retail Portfolio Sarasota Pavilion, Sarasota, FL One of 16 shopping centers purchased for $424 million on March 4, 2010 – 324,985 sq. ft. |