Attached files
| file | filename |
|---|---|
| EX-32.1 - EX-32.1 - Hawaiian Telcom Holdco, Inc. | a2203032zex-32_1.htm |
| EX-31.2 - EX-31.2 - Hawaiian Telcom Holdco, Inc. | a2203032zex-31_2.htm |
| EX-32.2 - EX-32.2 - Hawaiian Telcom Holdco, Inc. | a2203032zex-32_2.htm |
| EX-31.1 - EX-31.1 - Hawaiian Telcom Holdco, Inc. | a2203032zex-31_1.htm |
| EX-23.1 - EX-23.1 - Hawaiian Telcom Holdco, Inc. | a2203032zex-23_1.htm |
| EX-10.36 - EX-10.36 - Hawaiian Telcom Holdco, Inc. | a2203032zex-10_36.htm |
| EX-10.25 - EX-10.25 - Hawaiian Telcom Holdco, Inc. | a2203032zex-10_25.htm |
UNITED STATES
SECURITIES AND EXCHANGE COMMISSION
Washington, D.C. 20549
FORM 10-K
| (Mark one) | ||
ý |
ANNUAL REPORT PURSUANT TO SECTIONS 13 OR 15(d) OF THE SECURITIES EXCHANGE ACT OF 1934 |
|
For the fiscal year ended December 31, 2010 |
||
OR |
||
o |
TRANSITION REPORT PURSUANT TO SECTION 13 OR 15(d) OF THE SECURITIES EXCHANGE ACT OF 1934 |
|
Commission File No. 000-54196
HAWAIIAN TELCOM HOLDCO, INC.
(Exact name of registrant as specified in its charter)
| Delaware (State or other jurisdiction of incorporation or organization) |
16-1710376 (I.R.S. Employer Identification No.) |
1177 Bishop Street
Honolulu, Hawaii 96813
(Address of principal executive offices) (Zip Code)
808-546-4511
(Registrant's telephone number, including area code)
Securities to be registered pursuant to Section 12(b) of the Act: None
Securities to be registered pursuant to Section 12(g) of the Act:
| |
Common Stock, par value $0.01 per share | |
||
|---|---|---|---|---|
| (Title of class) |
Indicate by check mark if the registrant is a well-known seasoned issuer as defined in Rule 405 of the Securities Act. Yes o No ý
Indicate by check mark if the registrant is not required to file reports pursuant to Section 13 or Section 15(d) of the Act. Yes o No ý
Indicate by check mark whether the registrant (1) has filed all reports required to be filed by Section 13 or 15 (d) of the Securities Exchange Act of 1934 during the preceding 12 months (or for such shorter period that the registrant was required to file such reports), and (2) has been subject to such filing requirements for the past 90 days. Yes ý No o
Indicate by check mark whether the registrant has submitted electronically and posted on its corporate Web site, if any, every Interactive Data File required to be submitted and posted pursuant to Rule 405 of Regulation S-T (§ 232.405 of this chapter) during the preceding 12 months (or for such shorter period that the registrant was required to submit and post such files). Yes o No o
Indicate by check mark if disclosure of delinquent filers pursuant to Item 405 of Regulation S-K is not contained herein, and will not be contained, to the best of registrant's knowledge, in definitive proxy or information statements incorporated by reference in Part III of this Form 10-K or any amendment to this Form 10-K. ý
Indicate by check mark whether the registrant is a large accelerated filer, an accelerated filer, a non-accelerated filer or a smaller reporting company. See the definitions of "large accelerated filer," "accelerated filer" and "smaller reporting company" in Rule 12b-2 of the Exchange Act.
| Large Accelerated Filer o | Accelerated Filer o | Non-Accelerated Filer ý (Do not check if a smaller reporting company) |
Smaller Reporting Company o |
Indicate by check mark whether the registrant is a shell company (as defined in Rule 12b-2 of the Exchange Act). Yes o No ý
As of June 30, 2010, there were no shares of voting or non-voting common equity held by non-affiliates of the registrant.
Indicate by check mark whether the registrant has filed all documents and reports required to be filed by Section 12, 13 or 15(d) of the Securities Exchange Act of 1934 subsequent to the distribution of securities under a plan confirmed by a court. Yes ý No o
As of March 28, 2011, 10,138,346 shares of the registrant's common stock, $0.10 par value, were outstanding.
DOCUMENTS INCORPORATED BY REFERENCE
Portions of registrant's Proxy Statement dated March 28, 2011 (Part III of Form 10-K)
TABLE OF CONTENTS
i
This Annual Report on Form 10-K contains certain statements that constitute forward-looking statements within the meaning of the Private Securities Litigation Reform Act of 1995. In particular, any statement, projection or estimate that includes or references the words "believes", "anticipates", "intends", "expects", or any similar expression falls within the safe harbor of forward-looking statements contained in the Reform Act. These forward-looking statements are subject to certain risks and uncertainties that could cause actual results to differ materially from our historical experience and our present expectations or projections. Forward-looking statements by us are based on estimates, projections, beliefs, and assumptions of management and are not guarantees of future performance. Such forward-looking statements may be contained in this Form 10-K under "Item 1A—Risk Factors" and "Item 7—Management's Discussion and Analysis of Financial Condition and Results of Operations" and elsewhere. In light of these risks, uncertainties and assumptions, you should not place undue reliance on any forward-looking statements. Additional risks that we may currently deem immaterial or that are not currently known to us could also cause the forward-looking events discussed in this Form 10-K not to occur as described. Except as otherwise required by applicable securities laws, we undertake no obligation to publicly update or revise any forward-looking statements, whether as a result of new information, future events, changed circumstances or any other reason after the date of this Form 10-K.
ii
Business Overview
Hawaiian Telcom Holdco, Inc. (the "Company") is the largest full-service provider of communications services and products in Hawaii. We operate two primary business segments:
Wireline Services. This segment provides local telephone service including voice and data transport, enhanced custom calling features, network access, directory assistance and private lines. In addition, the Wireline Services segment provides high-speed Internet, long distance services, next generation Internet protocol (IP)-based network services, customer premises equipment, data solutions, billing and collection, and pay telephone services, and expects to provide an IP-based, next generation television service beginning in 2011. Our current services are offered on all of Hawaii's major islands. As of March 1, 2011, our telecommunication operations served approximately 437,500 local access lines, of which 55% served residential customers and 44% served business customers, with the remaining 1% serving other customers; 225,400 long distance lines, of which 65% served residential customers and 35% served business customers; and 100,700 high-speed Internet lines, which served 82,800 retail residential lines, 16,700 retail business lines, and 1,200 wholesale business and resale lines.
Other. This segment consists primarily of wireless services, including the sale of wireless handsets and accessories.
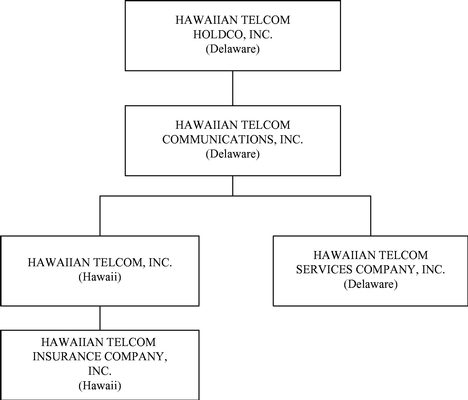
History and Organizational Structure
General
The Company was incorporated in Delaware in 2004. Originally incorporated in Hawaii in 1883 as Mutual Telephone Company, our Hawaiian Telcom, Inc. subsidiary has a strong heritage of over 125 years as Hawaii's communications carrier. From 1967 to May 1, 2005, we operated as a division of Verizon Communications Inc. (Verizon) or its predecessors. On May 2, 2005, the Verizon businesses conducted in Hawaii (comprised of Verizon Hawaii Inc. and carved-out components of Verizon Information Services, GTE.NET LLC (dba Verizon Online), Bell Atlantic Communications Inc. (dba Verizon Long Distance) and Verizon Select Services, Inc. (collectively, the "Verizon Hawaii Business")) were transferred to Verizon Holdco LLC, which then was merged (the "2005 Acquisition") with and into Hawaiian Telcom Communications, Inc., a Delaware corporation and wholly-owned subsidiary of the Company. As a result of the 2005 Acquisition, we became a stand-alone provider of communications services, operating as Hawaiian Telcom, Inc. (fka Verizon Hawaii Inc.) and Hawaiian Telcom Services Company, Inc., both wholly-owned subsidiaries of Hawaiian Telcom Communications, Inc.
Hawaiian Telcom, Inc., a Hawaii corporation, operates our regulated local exchange carrier business. It has a wholly-owned subsidiary, Hawaiian Telcom Insurance Company, Incorporated, which is a captive insurance subsidiary that until December 31, 2003 provided auto liability, general liability and worker's compensation insurance to Verizon Hawaii Inc. on a direct basis, and which continues to settle claims related to incidents which occurred prior to January 1, 2004. Current incidents are insured with external carriers.
Hawaiian Telcom Services Company, Inc., a Delaware corporation, operates our other businesses including our long distance, Internet, advanced communication and network services and wireless businesses. It also operated a directories publishing business until November 30, 2007, when it consummated the sale of the business to HYP Media Holdings LLC, a Delaware limited liability company and wholly-owned subsidiary of CBD Investor, Inc. In connection with the sale, HYP Media Holdings LLC entered into a 50-year publishing agreement pursuant to which it serves as the exclusive,
1
official publisher of telephone directories on behalf of Hawaiian Telcom, Inc. Under this agreement, HYP Media Holdings LLC publishes both white and yellow pages print telephone directories under the Hawaiian Telcom® brand.
The following is a chart of our organizational structure.
Bankruptcy Proceedings
On December 1, 2008, the Company, Hawaiian Telcom Communications, Inc., Hawaiian Telcom, Inc., Hawaiian Telcom Services Company, Inc. and certain other affiliates (collectively, the "Debtors") filed voluntary petitions for relief under chapter 11 of the U.S. Bankruptcy Code in the United States Bankruptcy Court for the District of Delaware (later transferred to the United States Bankruptcy Court for the District of Hawaii (the "Bankruptcy Court")) in order to facilitate a balance sheet restructuring. At the time of our chapter 11 filing, we had more than $1.1 billion of debt, consisting of approximately $575 million in senior secured debt under an Amended and Restated Credit Agreement dated as of June 1, 2007, $500 million in Senior Notes and Subordinated Notes, $40 million in unpaid trade debt, and $15 million in senior secured obligations under various swap agreements. In November 2009, the Bankruptcy Court confirmed the Debtors' chapter 11 plan of reorganization (the "Plan of Reorganization") at the conclusion of the confirmation hearing and entered a written confirmation order (the "Confirmation Order") on December 30, 2009. The Confirmation Order allowed us to emerge from chapter 11 with a significantly deleveraged capital structure.
Under the Plan of Reorganization, the senior secured lenders under the Amended and Restated Credit Agreement and the swap counterparties (collectively, the "Senior Secured Creditors") received nearly all of the new equity of the reorganized Company, and, after making disbursements pursuant to the Plan of Reorganization, we emerged with approximately $75 million in cash to enable continuation
2
of our operations in the ordinary course of business. Among other things, the Plan of Reorganization and the Confirmation Order provided for, on or about the Effective Date (defined below):
- •
- the cancellation of the Debtors' obligations under the Amended and Restated Credit Agreement, Senior Notes Indenture and
Subordinated Notes Indenture;
- •
- the cancellation of all outstanding shares of the existing stock of the Company and cancellation of all outstanding
options and other rights to purchase or otherwise receive shares of the existing stock of the Company;
- •
- the authorization to issue up to (i) 245 million shares of new common stock of the Company (the "New Common
Stock"), of which 10 million shares were issued to the holders of senior secured claims and 135,063 shares were issued to certain holders of unsecured claims who exercised subscription rights
for the right to receive shares of New Common Stock, and (ii) 5 million shares of preferred stock;
- •
- the reservation of 10% of the outstanding New Common Stock on a fully diluted basis for a new management compensation
incentive program (the "2010 Equity Incentive Plan");
- •
- the issuance to certain holders of Senior Notes with allowed claims of (i) subscription rights entitling them to
purchase their pro rata share of 3,125,000 shares of the New Common Stock at a subscription purchase price of $16.00 per share based on the Company's $160 million equity value under the Plan of
Reorganization and (ii) warrants to acquire shares of New Common Stock equal to 12.75% of the outstanding New Common Stock (on a diluted basis prior to consideration of the 2010 Equity
Incentive Plan) at a 12.5% discount to the Company's $160 million equity value and with an expiration date of five years from the Effective Date;
- •
- the receipt by unsecured creditors of cash in an amount equal to their pro rata share of $500,000;
- •
- the execution by the Debtors of and entry into a new senior secured term loan with the Senior Secured Creditors with a
first priority lien on all assets of the Debtors in the original principal amount of $300 million (the "New Term Loan"), with customary carve-outs and baskets including a basket for
a first-out senior secured revolving credit facility with a first priority lien on all assets of the Debtors in the original principal amount of $30 million (the "Revolving Credit
Facility") with the Senior Secured Creditors; and
- •
- the selection of a new Board of Directors of the Company by the Senior Secured Creditors, with the current Chief Executive Officer continuing to serve as a Director.
The Plan of Reorganization became effective, and the Company and other Debtors emerged from chapter 11, on October 28, 2010 (the "Effective Date"), following obtaining necessary regulatory approvals from the Federal Communications Commission (FCC) and the Public Utilities Commission of the State of Hawaii (HPUC) and satisfaction of other requisite conditions.
Industry Overview
The telecommunications industry is comprised of companies involved in the transmission of voice, data and video communications over various media and through various technologies. There are two predominant types of local telephone service providers, or carriers, in the telecommunications industry: incumbent local exchange carriers (ILECs) and competitive local exchange carriers (CLECs). An ILEC refers to the regional Bell operating companies (RBOCs), which were the local telephone companies created from the break up of AT&T in 1984, as well as small and midsize independent telephone companies, such as Hawaiian Telcom, Inc., Cincinnati Bell Inc. and Consolidated Communications, Inc., which sell local telephone service. These ILECs were the traditional monopoly providers of local telephone service prior to the passage of the Telecommunications Act of 1996. On the other hand, a
3
CLEC is a competitor to local telephone companies that has been granted permission by a state regulatory commission to offer local telephone service in an area already served by an ILEC.
In recent years, the U.S. telecommunications industry has undergone significant structural changes. Many of the largest service providers have achieved growth through acquisitions and mergers, while an increasing number of competitive providers have restructured or entered bankruptcy to obtain protection from their creditors. Since 2001, capital in the form of public financing has been generally difficult to obtain for new entrants and competitive providers. Capital constraints have caused a number of competitive providers to change their business plans, resulting in consolidation. Despite these changes, the demand for all types of telecommunications services, particularly data services, has not diminished, and telecommunications companies increasingly bundle services and provide integrated offerings for end-user customers.
Hawaii's telecommunications industry remains active, and demand for telecommunications services is strong, due in part to the comparative advantage provided by the state's geographic position. With its location between the mainland United States and Asia, Hawaii has been and will likely continue to be a surfacing location for cables running between the two continents. Hawaii is also connected to the mainland United States and Asia via several satellite networks.
Our Business Strategy
Our primary objective is to grow our business with a focus on delivering superior service to our customers, so that we can be recognized as the number one service provider of innovative "Always OnSM" communication, information and entertainment solutions to the people and businesses of Hawaii.
The key elements of our business strategy include the following:
- •
- Further leverage our broadband
network. Our broadband network is the foundation for our services to our customers, and we continue to expand its footprint and invest
in advanced technology platforms that support advanced communications services. We completed the build out of our Multiprotocol Label Switching (MPLS) core network statewide and continue to deploy
fiber-to-the-node (FTTN) access technologies over fiber optic cables to enhance and expand the speed and reach of our broadband network. We are deploying
high-speed VDSL2 technology, which will enable us to deliver new broadband consumer services, such as next generation television service, over our broadband network. We have deployed
advanced services to upgrade business customers, including business Voice over Internet Protocol (VoIP), Internet protocol Virtual Private Network (IP-VPN), and managed services, and
continue to enhance our services by adding new features and functionality.
- •
- Drive a customer- and sales-focused
organization. We have organized our operations to focus effectively on our customers and ensure the successful delivery of our services.
We strive to deliver a consistent and comprehensive customer experience. In addition, we have restructured the sales compensation program to better drive sales results and developed a more
comprehensive sales training program.
- •
- Deliver new and innovative products and solutions to attract and retain customers. We have successfully added and expect to continue to add new products and services to our customer offerings. We offer a full range of services including voice, Internet, data, customer premises equipment (CPE), wireless, and advanced communication and network services supported by the reach and reliability of our network and Hawaii's only 24x7 state-of-the-art network operations center. Our suite of IP-based services such as our business VoIP and IP-VPN services better positions us to compete for new customers and drive winback opportunities while also allowing us to improve retention of existing customers by migrating them from legacy services. Our planned next generation television service is an important growth component for our consumer
4
- •
- Improve operating profitability and capital efficiencies. We maintain a disciplined approach to managing operating expenses and capital spending. Our focus on driving operational improvements in our business has resulted in cost savings, and we have identified several key initiatives that we believe will further improve our cost structure. In addition, we continue to review and renegotiate contracts with key IT and outsource suppliers, which has led to additional cost savings. We manage our capital expenditures to optimize returns through disciplined planning and targeted investment of capital. Our strategy will be to continue to make strategic investments in our business in order to position us for long-term growth.
products portfolio and critical to our strategy to win the home and capture a share of the significant video and entertainment market opportunity that we currently do not address today.
Our Competitive Strengths
We believe the following are among our core competitive strengths and enable us to differentiate ourselves in the marketplace and help us successfully execute our business strategy:
- •
- Strong Local
Presence. We have been serving Hawaii's communities for over 125 years and employ approximately 1,400 employees statewide. Each
year, we donate to various local charities and our employees volunteer thousands of hours of community service. We understand our customers' needs because they are our needs as well. We share Hawaii's
history, heritage, and values. We are locally managed, making us more competitive and responsive to Hawaii's consumers and businesses.
- •
- Growth-Oriented Product
Portfolio. We are the only communications service provider in our market that can provide such a broad array of services to both
consumers and business customers that includes voice, Internet, data, CPE, wireless, and advanced communication and IP-based network services. Our expanding service suite, including
high-quality enhanced data networking services such as our business VoIP and IP-VPN services, and our managed services, are targeted at the key growth areas in our marketplace.
Our proposed next generation video service, employing Microsoft® Mediaroom™, is targeted at capturing a share of the significant video and entertainment market opportunity that
we currently do not address today.
- •
- Advanced Network
Infrastructure. We own the State's most extensive and reliable communications network, which includes approximately 75,000 strand miles
of fiber optic cable and more than 11,000 route miles of copper wire distribution lines. We completed the build out of our MPLS core network, which is deployed statewide and allows us to deliver
IP-based services to well over 90% of the State's population. Our network is supported by Hawaii's only 24x7 state-of-the-art network operations center.
We continue to push fiber deeper into the network and to enhance and expand the speed and reach of our broadband network, which we believe will enable us to offer new products and services that will
generate growth in our business and allow us to compete more effectively in the marketplace.
- •
- Attractive Market
Characteristics. Hawaii compares favorably to national averages in median household income ($64,661 vs. $51,425) (more so for Oahu
($67,066) where the majority of the population resides). Our market is characterized by high density, with approximately 70% of the state's population concentrated on Oahu over an area of
approximately 598 square miles, or 1,500 persons per square mile. In addition, 37% of the households in Hawaii reside in multi-dwelling units (MDUs)—43% on Oahu—which compares
favorably to 22% in the U.S. overall. More specifically, 25% of the households on Oahu reside in housing structures with 20 or more units versus 8% in the U.S. overall.
- •
- Strong Management Team. We have assembled an experienced management team that we believe is well-qualified to lead our Company and execute our strategy. Our management team has
5
significant operational experience in the telecommunications industry combined with extensive knowledge of our local market, which will be a critical driver of our success going forward.
Our Products and Services
Wireline Services
Local Exchange Services
Our local exchange carrier business generates revenue from local network services, network access services and certain other services, each of which is described below.
Local Network Services
Our traditional local network service enables customers to originate and receive telephone calls within a defined "exchange" area. We provide basic local services on a retail basis to residential and business customers, generally for a fixed monthly recurring charge. Basic local service also includes non-recurring charges to customers for the installation of new products and services. Basic local exchange services are enhanced with a variety of value-added services such as call waiting, caller ID, voice messaging, three-way calling, call forwarding and speed dialing. Value-added services may be purchased individually or as part of a package offering for a monthly recurring charge. We also offer other local exchange services such as local private line and inside wire maintenance. The rates that can be charged to customers for basic local and certain other services are regulated by the HPUC. We charge business customers higher rates to recover a portion of the costs of providing local service to residential customers, as is customary in the industry. See "—Regulation" for further discussion of regulatory matters.
Network Access Services
Our network access services are offered in connection with the origination and termination of long distance, or toll, calls that typically involve more than one company in the provision of end-to-end long distance service. Since toll calls are generally billed to the customer originating the call, a mechanism is required to compensate each company providing services relating to the call. This mechanism is the access charge, which we bill to each interexchange carrier for the use of our facilities to access our customers. In addition, we bill a component of access charges directly to our customers. Our network access services generate intrastate access revenue when an intrastate long distance call that involves us and an interexchange carrier is originated and terminated within Hawaii. This access charge is regulated by the HPUC. Similarly, our network access services generate interstate access revenue when an interstate long distance call is originated from a Hawaii local calling area served by us and is terminated in a local calling area in another state and vice versa. Interstate access charges are regulated by the FCC. We also offer special access voice and data services, which are a key area of growth driven by demand for increasing bandwidth from business and wholesale customers. Special access services include switched and non-switched (or dedicated) services such as point-to-point single channel circuits, Synchronous Optical Network (SONET) and Time Division Multiplexing (TDM) transport services, as well as IP-based private networks. See "—Regulation" for further discussion of access charges.
Long Distance Services
We provide long distance services to transmit international calls, interLATA (Local Access Transport Area) domestic calls and regional toll calls made to points outside a customers' local calling area, but within our local service area (intraLATA toll). In Hawaii, each of the islands is a local calling area, and calls between the islands are intraLATA toll calls. Other long distance services include 800-number services and wide area telecommunication services, or WATS, private line services, and operator services associated with long distance calls. As of March 1, 2011, we served approximately
6
225,400 long distance lines, of which 65% served residential customers and 35% served business customers.
Internet Services
We provide high-speed Internet (HSI) access to our residential and business customers. Our data network enables us to provide extensive high-speed network access. We have HSI available in 79 of our 86 central offices. As of March 1, 2011, we served approximately 82,800 retail residential HSI lines, 16,700 retail business HSI lines, and 1,200 wholesale business and resale HSI lines. We also provided dial-up Internet access to approximately 1,400 subscribers as of the same date.
Advanced Communication and Network Services
The role of business communication providers is evolving. Consistent with this, we have been pursuing opportunities to expand into application-centric, advanced communication and network services. Our advanced communication and network services include Managed Services, deployed in 2008, which provides customers with security audit and monitoring, fault monitoring, and performance management services; Routed Network Service, a high-performance IP network service for business customers launched in April 2009; Enhanced Internet Protocol Data Service, a multipoint Ethernet virtual private local area network service launched in May 2007; and Business All-in-One, a business VoIP service launched in December 2009 to provide small-to-medium-sized businesses with complete communication needs in a hosted package.
Next Generation Television Service
We continued preparations to launch our next generation television service. Our planned video service will be a critical growth component for our consumer products portfolio and an anticipated anchor of our service bundling strategy. During 2010, we continued to develop a network capable of providing integrated digital video, high-speed broadband and voice services to new and existing customers. We also completed and made operational our video head end. Negotiations with the Cable TV Division of the State of Hawaii Department of Commerce and Consumer Affairs concerning our application for a video franchise for the island of Oahu are ongoing. In addition to investing in our network to offer video services, we have developed the requisite hardware and software platform and secured programming content. Our ability to provide an attractive and successful video offering will depend significantly on the results of these regulatory and infrastructure development efforts.
Other Wireline Services
We seek to capitalize on our local presence and network infrastructure by offering other services to customers and interexchange carriers. Sales and maintenance of customer premises equipment to the business markets are an important source of local exchange revenues. Customer premises equipment services are also an area of potential growth as attractive contracts with major equipment providers allow us to offer complete voice and data network and management solutions. For the wholesale or carrier market, we offer services including operator services, billing and collection services and space and power rents for collocation services. We also offer public pay telephone services at approximately 4,900 locations throughout the State of Hawaii.
Other
We offer wireless services pursuant to a mobile virtual network operator (MVNO) services agreement with Sprint Spectrum, L.P. (Sprint). That agreement allows us to resell Sprint wireless services, including access to Sprint's nationwide personal communication service (PCS) wireless network to residential and business customers in Hawaii under the Hawaiian Telcom® brand name. The services agreement with Sprint was effective as of May 2009 and has a term of three years and is renewable for up to three additional one-year terms after the initial period.
7
Markets and Customers
Wireline Services
We have been a telecommunications provider in Hawaii for more than 125 years. Our market consists of 86 central offices serving an area of approximately 6,263 square miles on the islands of Oahu, Maui, Hawaii, Kauai, Molokai and Lanai. We are the incumbent provider of local exchange services within this area and own the state's most extensive local telecommunications network, with approximately 437,500 local access lines served as of March 1, 2011, of which 55% served residential customers, 44% served business customers and the remaining 1% served other customers. Other customers include (1) interexchange carriers that pay for access to long distance calling customers located within our local service area and (2) CLECs that pay for wholesale access to our network to provide competitive local service on either a resale or unbundled network element (UNE) basis as prescribed under the Communications Act of 1934, as amended (the "Communications Act").
Our market is characterized by high population density, with approximately 70% of the state's population concentrated on Oahu. This concentration of customers and commerce provides opportunities to leverage our network infrastructure to deliver products and services efficiently and in a cost-effective manner and to market and sell our services more effectively. Given Hawaii's geographic location, its distance from the mainland United States and the diversity of its population (approximately 39% being of Asian descent), Hawaii residents and businesses have telecommunications needs that may be different from those on the mainland United States. Furthermore, in 2010, the median household income in Hawaii is estimated at approximately $64,600, compared to the national average of approximately $51,400. For the foregoing reasons, our strategy is to leverage the distinctive qualities of the Hawaii market to develop customized, local marketing strategies.
Our business marketplace is dominated by several key industries. State and federal government account for 24% of gross state product. With the U.S. Pacific Command, one of the largest U.S. unified service commands, based in Hawaii and approximately 37,000 military personnel stationed in Hawaii, the federal government is one of our largest customers. The hospitality industry and financial institutions also account for a significant portion of our business. The operations of these leading sectors are communications intensive, and we believe that they are dependent on our modern, reliable services. Hawaii's small business market (in the aggregate) is also a key driver of Hawaii's economy—approximately 95% of the companies in Hawaii employ fewer than 50 employees, and these businesses make up a market of approximately 51,000 business customers. We believe that these business customers represent an underserved segment that we are targeting aggressively with new product and service offerings.
Other
We have been providing wireless services since 2005. It is estimated that there are approximately 1,180,000 wireless subscribers in Hawaii. Currently, less than 1% of these subscribers utilize us as their wireless provider. We are investigating opportunities to capture a greater share of this market and to leverage the Hawaiian Telcom® brand and our existing customer base to enhance customer loyalty for our various product and service offerings.
Competition
The telecommunications industry is highly competitive. We experience competition from many communications service providers, including the local cable operator Oceanic Time Warner (Oceanic), wireless carriers, long distance providers, competitive local exchange carriers, Internet service providers, Internet information providers, over-the-top hybrid voice providers, and other companies that offer network services and managed enterprise solutions. Many of these companies have a strong market presence, brand recognition, and existing customer relationships, all of which contribute to competition
8
that may affect our future revenue growth. We expect competition to intensify as a result of the entrance of new competitors and the rapid development of new technologies, products and services.
The local cable operator Oceanic Time Warner, a subsidiary of Time Warner Cable Inc., the second largest cable operator in the United States, is one of our most significant competitors. Approximately 90% of the households in Hawaii (94% of households on Oahu) subscribe to Oceanic's cable service and it has majority market share in high-speed Internet, which Oceanic uses as a platform to offer voice services utilizing VoIP technology, and markets these services through competitive bundled offerings. In addition, Oceanic has targeted communications service offerings to small and medium-sized businesses.
Wireless communications services continue to constitute a significant source of competition, especially as wireless carriers expand and improve their network coverage and continue to lower their prices. As a result, some customers have chosen to completely forego use of traditional wireline phone service and instead rely solely on wireless services. We anticipate the wireless substitution trend will continue, and could pose additional threat to our high-speed Internet product, particularly if wireless service rates continue to decline and the wireless service providers upgrade their networks to 4G technology and are able to deliver faster data speeds. Over-the-top hybrid providers, such as Skype and Magic Jack, also offer the capability to provide local voice and long distance calls using an internet-equipped personal computer.
The advanced communication and network services business is highly competitive due to the absence of significant barriers to entry. The emergence of non-traditional, application-centric players in the market is redefining the role of communications providers. We currently compete for business customers with vendors such as tw telecom of hawaii l.p., Pacific LightNet, Inc., NetEnterprise Inc., Tri-net Solutions, L.L.C., Systemmetrics Corporation and other traditional and non-traditional carriers.
We employ a number of strategies to combat the competitive pressures. Our strategies are focused on preserving and generating new revenues through customer retention, upgrading and up selling services to existing customers, new customer growth, winbacks of former customers, new product and feature deployment, and by managing our profitability and cash flow through targeted reductions in operating expenses and efficient deployment of capital. Key to success in these strategies is continued enhancement and expansion in the speed and reach of our broadband network, which we believe will enable us to offer new products and services that will generate growth in our business and allow us to compete more effectively in the marketplace. Another key is a focus on enhancing the customer experience, as we believe exceptional customer service will differentiate us from our competition. Customers expect industry leading service from their service providers. As technologies and services evolve, the requirement of the carrier to excel in this area is crucial for customer retention.
Network Architecture and Technology
Our strategy is to build and operate the most technologically advanced communications network in the state of Hawaii. Pursuing such a strategy has enabled us, among other things, to begin offering advanced communications and network services beginning in 2007. In 2010, we invested approximately $61.3 million in our network including significant expenditures to expand the reach, capacity, and resiliency of our IP-based packet and broadband network. Significant strides were made in 2010 to add hundreds of miles to our state-leading fiber network and continuing our transformation toward an optical, IP-based broadband network.
Packet Optical Network
We continued expansion of our statewide MPLS network in 2010. Growth from new services offered on our MPLS network, such as our Enhanced Internet Protocol Data Service and Routed Network Service, as well as growth from our high-speed Internet service, continue to drive increases in
9
the backbone bandwidth requirements and improvements to our mesh designs. To meet the explosive bandwidth growth of our consumer and business customers, we continue to add additional broadband capacity and increase the resiliency and reliability of our network. In 2010, we upgraded our border routers to larger systems and added 20 gigabytes of bandwidth on our trans-Pacific fiber route to the mainland. Evaluation and lab testing of industry leading Packet Optical Transport Systems were done in our Innovation Center to introduce this technology into our network in 2011 to meet our growing bandwidth needs while greatly reducing the cost per gigabyte. Evolution in our MPLS core will continue toward a converged packet optical networking platform. Our current backbone infrastructure consists of two border routers, seven core MPLS routers, 36 service edge routers, 21 Frame Relay switches and 13 asynchronous transfer mode (ATM) switches. There are also 809 Synchronous Optical Network (SONET) rings in service.
Our telecommunication infrastructure includes more than 13,500 sheath miles of fiber optic cable and copper wire distribution lines. Submarine and deep-sea fiber optic cables connect the islands of Kauai, Oahu, Maui and Hawaii, while digital microwave provides other inter-island connections. In addition to our owned interisland cables between Oahu and Kauai, Oahu and Maui, and Maui and Hawaii, we are also connected by trans-Pacific fiber optic cables between the Hawaiian islands and to the U.S. Mainland which provide ring diversity to protect our communications between the islands and high-speed broadband links in and out of the State.
Voice Network
In 2009, we installed a new VoIP application server for the introduction of our new Business All-in-One business VoIP (BVoIP) service. The new BVoIP service targets our small-to-midsize business market, combining voice and data services over an IP connection to the customer. In addition, we added a new, next generation voicemail platform to the network that we believe ties in well with our IP migration strategy and positions us for new unified communication services. Our voicemail customers migrated off the old TDM platform onto our new voicemail platform in 2010. Plans are being finalized to consolidate this network into a much smaller IP softswitch platform.
As of March 1, 2011, we owned 107 local base and remote switches and five tandem switches serving approximately 446,600 total lines on the islands of Hawaii, Kauai, Lanai, Maui, Molokai and Oahu. All of our access lines are served by digital switches provided predominantly by Alcatel-Lucent and Genband. Since 2002, we have updated our infrastructure to meet the technological needs of our customers. Our switches on every island are linked through a combination of extensive aerial, underground and undersea cable, as well as microwave facilities, allowing us to provide our services to customers in a very challenging geographical territory. In 2010, we also replaced and upgraded our signal transfer points (STPs) to a next generation IP-based router.
Access Infrastructure
In 2010, we continued to deploy fiber-to-the-premise (FTTP) solutions to serve green field multi-dwelling unit (MDU) and single-family subdivision developments, adding 13 new developments. By laying fiber and utilizing various passive optical network components from these developments to our central offices, we can further leverage the capabilities of our MPLS backbone, provide higher bandwidth services to our customers, including the proposed video services, and reduce maintenance costs. Additionally, in 2010 we continued our replacement of obsolete digital loop carrier equipment with new broadband loop carrier (BLC) equipment. The versatile BLCs are IP-based and offer a wide range of services including landline telephone service, DSL, Ethernet over copper, and gigabit passive optical network service. At the same time, we retired and removed over 22 miles of copper cable from our network. These projects further our transformation to a broadband network and replace copper lines once served by TDM switches. Through this strategy, we seek to meet the bandwidth needs of our customers in an economical manner.
10
Next Generation Television Service
The implementation of IP-based television service is driving one of the largest network transformations in the telecommunications industry. Our next generation television service will enable the delivery of multimedia services over our IP-based network and provide our customers with new viewing experiences and applications. In 2010, we reached a major milestone by successfully completing a pilot deployment to select trial participants. In 2011, we will continue to invest in the network to increase the reach of our next generation television service.
Network Surveillance and Operations
Network management operations are provided by our Network Operations Center (NOC) located in Honolulu. The NOC provides surveillance 24x7, 365 days a year, over our statewide network consisting of 86 central offices and associated interoffice facilities. We have a customer service center which also operates on a 24x7, 365 days a year basis to handle customer inquiries, repairs, and provide call completion services. All customer installations and repairs requiring a field technician are offered during extended hours and coordinated by our Dispatch Center. All construction activity, for both outside and inside plant, is coordinated by our engineering operations team located at our Honolulu office.
In addition to our network infrastructure, we operate a wide range of equipment from large boom trucks to small passenger vehicles, mobile generators, and other miscellaneous trailers, tools and test equipment. We own or lease most of our administrative and maintenance facilities, central offices, remote switching platforms, and transport and distribution network facilities. Our assets are located primarily in the State of Hawaii.
Information Technology and Support Systems
Since the 2005 Acquisition, we have made substantial investments in a new back-office and IT infrastructure. We initially engaged BearingPoint, Inc. (BearingPoint) to build the back-office and IT infrastructure. In February 2007, we terminated our relationship with BearingPoint and transferred certain services previously performed by BearingPoint to Accenture LLP (Accenture). See "—Transition to Becoming a Stand-alone Provider." In 2009, we signed a five-year agreement with Accenture that amended the prior agreement and lowered costs while improving operational efficiencies.
We continue to enhance our back-office systems and IT infrastructure with the objective of improving and expanding our customer services and streamlining our operations. We implemented the capability for ordering and provisioning new products and services for our customers while increasing productivity and improving operational capabilities.
To support the launch of new products in 2010, we implemented ordering, provisioning, and service assurance functionality for our next generation television service. We developed automation that enabled us to offer higher Internet access speeds and to provide certain existing customers with higher Internet access speeds without cost to them.
Continuing improvement initiatives are being conducted that are aimed at improving the quality and movement of data across systems, enhancing operational productivity, and ensuring that customer orders are processed accurately and in a timely fashion. These initiatives included creating on-line ordering capability for packaged CENTREX business customers, which represent the largest group of business customers, as well as introducing automated flow-through from order entry through billing for orders from our wholesale customers. These efforts reduced manual processing of complex orders, increased productivity, and enhanced overall data quality. Order flow-through continues to improve, manual processing queues are now at the lowest levels since the 2005 Acquisition, and order backlogs are down 85% from 2008 due to systems and process improvements. The end result is increased data
11
integrity, faster order processing speeds, higher levels of automated order flow-through, increased productivity, and an improved customer experience.
A number of other IT initiatives in 2010 were aimed at delivering advanced technologies to our customers as well as delivering a superior service experience for our customers. We deployed an advanced mobile workforce management system that provides us with enhanced capabilities to manage customer appointments. Operating systems were upgraded to provision a number of new network devices needed to deliver our next generation television and HSI services.
To make the delivery of IT services more cost effective and efficient, we consolidated two of our three data centers and revised the working agreement with the service provider managing the consolidated data center. We are in the planning stages of refreshing data center infrastructure that has reached the end of its serviceable life with state-of-the-art technology involving server virtualization and cloud computing. This effort will result in lower operating costs and energy consumption at our data centers as well as more efficient and reliable operations.
Employees
As of March 1, 2011, we employed approximately 1,400 full-time employees in Hawaii. Of the total employees, 57% were represented by the International Brotherhood of Electrical Workers (IBEW) Local 1357. The current collective bargaining agreement with IBEW Local 1357 is effective from September 13, 2008 through September 12, 2011. We expect to re-negotiate the collective bargaining agreement in 2011. Under the Plan of Reorganization, the collective bargaining agreement was assumed upon emergence from chapter 11. We believe that management currently has a constructive relationship with the represented and non-represented employee groups.
Insurance
We have insurance to cover risks incurred in the ordinary course of business, including errors and omissions, general liability, property coverage (which includes business interruption), director and officers and employment practices liability, auto, crime, fiduciary and worker's compensation insurance in amounts typical of similar operators in our industry and with reputable insurance providers. Central office equipment, buildings, furniture and fixtures and certain operating and other equipment are insured under a blanket property insurance program. This program provides substantial coverage against "all risks" of loss including fire, windstorm, flood, earthquake, and other perils not specifically excluded by the terms of the policies. As is typical in the telecommunications industry, we are self-insured for damage or loss to certain of our transmission facilities, including our buried, undersea and above-ground transmission lines. We believe that our insurance coverage is adequate; however, if we become subject to substantial uninsured liabilities due to damage or loss to such facilities, our financial results may be adversely affected.
Regulation
Federal and State Regulation of Telecommunications Services
Our telephone operations generally are subject to the jurisdiction of the FCC with respect to interstate services and the HPUC with respect to intrastate services. The following summary does not purport to describe all current and proposed applicable federal and state regulation.
Competition
We face increasing competition in all areas of our business. Regulatory changes brought on by the 1996 amendments to the Communications Act, regulatory and judicial actions, and the development of new technologies, products and services have created opportunities for alternative telecommunication
12
service providers, many of which are subject to fewer regulatory constraints than our ILEC. We are unable to predict definitively the impact that the ongoing changes in the telecommunications industry will ultimately have on our business, results of operations or financial condition. The financial impact will depend on several factors, including the timing, extent and success of competition in our markets, the timing and outcome of various regulatory proceedings and any appeals, the timing, extent and success of our pursuit of new opportunities resulting from the amendments to the Communications Act and technological advances, and any changes in the state or federal laws or regulations governing communications.
Universal Service
As a provider of interstate telecommunications, we are required to contribute to federal universal service programs. The FCC adjusts the contribution amount quarterly and may increase or decrease this amount depending on demand for support and the total base of contributors. Pending proposals to change the contribution methodology could increase or reduce our total obligation to this funding. We also draw Interstate Access Support from this funding.
On December 31, 2007, we filed a petition with the FCC requesting a waiver to determine our eligibility to receive federal high-cost loop support according to our average line costs per wire center instead of our statewide average line costs. Grant of the petition would increase the amount of support we receive. There is no definite timeframe for an FCC decision on this petition.
In April 2010, in response to a remand from the United States Court of Appeals for the Tenth Circuit, the FCC reaffirmed its non-rural mechanism for distributing universal service high-cost loop support without significant change. At the same time, the FCC began a proceeding to replace the existing universal service mechanism with a new fund that would be designed to support high-speed broadband and voice service for those areas of the country which would not receive such services without government support. In February 2011, the FCC adopted a Notice of Proposed Rulemaking that included a number of proposals relating to reforming existing universal service support mechanisms. One of the proposals proposes to phase out Interstate Access Support in two years beginning on January 1, 2012. The money thereby saved is expected to be used to support the provision of broadband services in unserved areas through a competitive bidding mechanism. The intention of the rulemaking is to replace eventually all of the existing high cost support for voice services with mechanisms that would fund broadband deployment (that would include a voice component), including providing one-time capital support as well as ongoing operational support for areas where broadband services could not be economically provided without government support. We do not know when this proceeding will be concluded, how the FCC will implement the proposals, if at all, or how such proceeding will impact our pending support level or waiver petition.
Government Regulation of Retail Rates
The FCC and the HPUC are the two agencies that regulate telecommunications services. In general, the FCC regulates interstate service, and the HPUC regulates intrastate service. The HPUC has, slowly over time, reduced its rate regulation of some of our services. The HPUC classifies all regulated telecommunications services as fully competitive, partially competitive, or non-competitive.
In 2009, the Hawaii State Legislature passed Act 180, which it clarified with an amendment in 2010 (Act 8). As amended, Act 180 requires that the HPUC treat all intrastate retail telecommunications services, including intrastate toll (i.e., inter-island), central exchange (Centrex), residential and business local exchange services, integrated service digital network (ISDN) private lines and special assemblies, and directory assistance, as "fully competitive" under the HPUC's rules with certain qualifications. In addition, HPUC approval and cost support filings are no longer required to establish or reduce rates or to bundle service offerings; however, all service offerings must be priced
13
above the service's long-run incremental cost, and the HPUC can require us to provide such cost support demonstrating compliance with its costing rules at any time. If the HPUC is not satisfied, it retains the ability to investigate the offering and to suspend the offering pending the outcome of its investigation. In addition, HPUC approval is required in order to increase the rate for a service to a level that is greater than the rate for the retail service in the tariff at the time of implementation of either Act 180 or Act 8, whichever is applicable. Local rates historically have been set at a level that will allow the recovery of embedded costs for local service. Recognized costs include an allowance for a rate of return on investment in plant used and useful to provide local service. Competitive forces may cause us to be unable to raise our local rates in the future
The classification of retail local exchange intrastate services as fully competitive and the ability to bundle the services with other fully or partially competitive services or other services that are not within the HPUC's jurisdiction enable us to charge a discounted rate for bundled service offerings and have helped us to respond to competition.
State and Federal Regulation of Long Distance Services
We are subject to certain conditions imposed by the HPUC and the FCC on the manner in which we conduct our long distance operations. For example, we are prohibited from joint ownership of local and long-distance telephone transmission or switching facilities. The HPUC is responsible for ensuring that our ILEC does not discriminate against other long distance providers.
Federal Requirements
As an ILEC, we are subject to a number of access and interconnection requirements under federal law. Among other things, an ILEC must negotiate in good faith with other carriers requesting interconnection and access to UNEs and must offer its competitors access to UNEs, such as local loops and inter-office transport, at regulated rates. However, we are no longer required to provide our competitors with access to switching UNEs, or the combination of loop, transport and switching UNEs known as the UNE Platform (UNE-P). The FCC also has limited our obligation to unbundle fiber facilities to multiple dwelling units, such as apartment buildings, and to homes and offices deployed in fiber-to-the-curb and fiber-to-the-premises arrangements. In addition, federal law regulates competitors' requests to collocate facilities within our central offices and to have access to our subscriber list information in order to produce competing directories, and other matters, including the manner in which we must protect our customers' information. The FCC currently is examining its pricing standard for UNEs and may modify other aspects of its UNE rules as market conditions change. The FCC also has imposed specific rules regarding the manner and time within which a customer's telephone number must be ported to a competing carrier's service.
Interstate and Intrastate Access Charges
The rates that we can charge for interstate access are regulated by the FCC. The FCC has made various reforms to the existing rate structure for access charges, which, combined with the development of competition, have generally caused the aggregate amount of access charges paid by long-distance carriers to decrease over time. For example, the FCC has instituted caps on the per-minute rate we can charge for our switched access services as well as on our monthly subscriber line charges (SLCs). The FCC has adopted rules for special access services that provide for pricing flexibility and ultimately the removal of services from price regulation when prescribed competitive thresholds are met. We currently have pricing flexibility for certain special access services offered throughout our territory. The FCC currently is considering whether to modify the special access pricing rules for price cap carriers like us, including whether the pricing flexibility rules should be modified or eliminated. On May 18, 2008, the FCC granted our request for pricing flexibility for certain special access services offered on the neighbor islands. We also have pricing flexibility for certain special access services offered on Oahu.
14
Our intrastate access rates are set forth in an interim tariff approved by the HPUC in 1995 and are based on our embedded costs. Although it has been the HPUC's intention to initiate a proceeding to adopt permanent access rates based on a forward-looking cost methodology, the HPUC has not yet initiated a proceeding to do so.
Federal Framework for Intercarrier Compensation
The FCC has an ongoing rulemaking that could fundamentally restructure the regulatory regime for intercarrier compensation. Intercarrier compensation consists of state and interstate access charges and local reciprocal compensation. This comprehensive reform proposal seeks, among other things, to unify state and interstate intercarrier charges in certain circumstances, provide a mechanism to replace intercarrier revenues lost through rate unification, and resolve a number of outstanding disputes among carriers regarding interconnection and compensation obligations. The FCC has also sought comment on whether access charges should apply to VoIP or other Internet protocol-based service providers. The FCC in February 2011 adopted a Further Notice of Proposed Rulemaking that proposed to establish a relatively gradual phase-down of intercarrier compensation that would occur in conjunction with the changes to universal service identified previously in this section. It currently is unknown what specific actions the FCC will take in this proceeding or when it will implement such actions.
The FCC has found that Internet-bound traffic is not subject to reciprocal compensation under Section 251(b)(5) of the Communications Act. Instead, the FCC established a federal rate cap for this traffic, which is and will remain $0.0007 per minute until the FCC decides otherwise.
Federal Regulatory Classification of Broadband and Internet Services
The FCC has been considering whether, and under what circumstances, services that employ Internet protocol are "telecommunications services" subject to regulations that apply to other telecommunications services, but it has not definitively ruled on the issue and instead has made a series of decisions addressing specific services and regulations. For example, some VoIP providers must comply with the federal wiretap law and with FCC requirements to provide enhanced 911 emergency calling capabilities, ensure disability access and provide local number portability. Certain VoIP providers are exempt from state telecommunications market entry regulation. As a result, our VoIP competitors may be less heavily regulated than we are.
In September 2005, the FCC ruled that ILECs like ours may offer dedicated broadband Internet access service as an information service. As a result, we are no longer required to offer the underlying broadband transmission capacity used to provide our HSI service on a tariffed, common carrier basis to competing Internet Service Providers (ISPs). This decision gives us greater flexibility in how we offer and price such transmission capacity. It also puts us on more even footing with our cable competitors in the broadband market since the FCC had previously held that high-speed Internet access service delivered using cable television facilities constitutes an information service not subject to common carrier regulations, a determination that was upheld by the United States Supreme Court.
In March 2006, a request of Verizon that sought forbearance from Title II regulation for certain specified advanced broadband special access services was deemed granted by operation of law. This forbearance grant was applicable to us since Hawaiian Telcom Communications, Inc. was part of Verizon when the original Verizon petition for forbearance was filed. This action permits us to deregulate covered advanced broadband special access services, giving us greater flexibility in our pricing and terms and conditions of offering.
In February 2009, Congress enacted a law that required the FCC to establish a national broadband plan to promote broadband service availability to all Americans. This plan was released by the FCC in March 2010 and contained recommendations on how to promote the provision of broadband in unserved and underserved areas of the country, including an increase in the speed at which current
15
customers can obtain broadband services. It also addressed how to increase the adoption of broadband services by those consumers who currently do not have access to those services. The FCC announced that there will be additional rulemakings to implement the recommendations of the plan. It is not known how this plan will impact our business operations given that the rules have not yet been adopted.
In December 2010, the FCC adopted "net neutrality" rules, termed "open Internet" rules, that would bar Internet service providers from blocking or slowing Web content sent to homes and businesses. The rules continue to treat broadband Internet access services under the FCC's Title I authority, but adopted as rules the existing guidelines applicable to Internet service providers. The FCC also adopted three additional rules concerning blocking, non-discrimination, and transparency. The no-blocking rule prohibits a fixed broadband Internet access service provider from blocking lawful content, applications, services, or devices, subject to reasonable network management. The anti-discrimination rule prohibits a fixed broadband Internet access service provider from unreasonably discriminating in the transmission of lawful network traffic over a consumer's broadband Internet access services, subject to reasonable network management. Wireless broadband providers are not subject to these two rules, but only to a scaled-back version of the no-blocking rule applicable to fixed providers. The transparency rule requires all Internet access service providers to disclose publicly accurate information regarding their network management practices, performance, and commercial terms of service so that consumers are able to make informed choices and device providers are able to develop, market, and maintain Internet offerings. The FCC's net neutrality rules are being challenged in the courts.
Other Federal and State Regulatory Proceedings
The FCC has been exploring whether to modify its rules requiring utilities to provide telecommunications carriers and cable television companies with access to their poles, ducts, and rights of way. These proposals seek, among other things, to require access to poles and conduit within a shorter period of time, and to better limit make ready costs. These proposals, if adopted, would tend to increase the burdens and costs of pole and conduit owners such as us. We cannot predict what rule changes the FCC might make or when it might adopt them.
Currently pending before the HPUC is a proceeding, filed on October 6, 2006, concerning our service quality and performance levels and standards in relation to our wholesale and retail customers. The HPUC, as part of its approval of the 2005 Acquisition pursuant to which we acquired Verizon's Hawaii assets, had called for such service quality review to take place beginning six months after the systems cutover from Verizon, which occurred April 1, 2006. The Consumer Advocate of the State of Hawaii, the Department of Defense, tw telecom of hawaii l.p. (fka Time Warner Telecom of Hawaii LLP) and Pacific LightNet, Inc. are parties to the proceeding. In general, the HPUC is examining the effect that the 2005 Acquisition had on our wholesale and retail customers, including whether any audit or other remedy should be required to mitigate any negative effects. The HPUC also is addressing whether any of the current service quality standards with which we are required to comply should be modified or eliminated and whether any new standards should be enacted, including whether a procedure should be established to impose fines for any failure to meet the service standards. All formal filings provided for in the schedule established by the HPUC, as well as a hearing, have been completed. We continue to file periodic service quality reports as required by the HPUC. We cannot predict the outcome of this or other proceedings before the FCC, the HPUC or the courts.
16
Environmental, Health and Safety Regulations
We are subject to various environmental, health and safety laws and regulations that govern our operations and may adversely affect our costs. Some of our properties use, or may have used in the past, on-site facilities or underground storage tanks for the storage of hazardous materials that could create the potential for the release of hazardous substances or contamination of the environment. We cannot predict with any certainty our future capital expenditure requirements for environmental regulatory compliance, although we have not currently identified any of our facilities as requiring major expenditures for environmental remediation or to achieve compliance with environmental regulations.
Business Transactions
Transition to Becoming a Stand-alone Provider
Verizon and its affiliates historically provided our predecessor with services that were critical to the operation of our businesses. In connection with the 2005 Acquisition, we had engaged BearingPoint to build a back-office and IT infrastructure in order to enable us to migrate off Verizon's software systems and begin operating as a stand alone provider of telecommunications services. These "build services" generally consisted of integration and installation of software, databases, hardware, operating systems and internal network systems; providing the services of the primary and back-up data centers; providing certain training; and business process definition. The new back-office and IT infrastructure was integrated with certain core operations support systems purchased from Verizon as part of the 2005 Acquisition and provided network operations support functions and operated our billing systems, customer relationship management systems, corporate finance systems, human resource and payroll systems. We completed our transition from Verizon's software systems in April 2006 by (a) terminating the services from Verizon and transitioning those services to us and (b) migrating the data used in Verizon's Hawaii Business from Verizon's systems to our systems. However, while the major network operational systems were built and functioned without significant problems following the April 2006 transition, critical systems related to back-office functions, such as customer care, order management, billing, supply chain and other systems interfacing with our financial systems, lacked significant functionality. This led to deficiencies in billings and collections, revenue assurance and order entry flow-through. To help remediate the deficiencies, we engaged the services of Accenture. Under an Application Services Agreement with Accenture effective as of February 2007, Accenture agreed to perform certain of the application development and management services previously provided by BearingPoint and assumed responsibility for the completion and ongoing development of applications from BearingPoint. We subsequently executed an Amended and Restated Master Application Services Agreement with Accenture effective as of March 2009 to provide long-term IT support services.
Through the maintenance and remediation efforts beginning in 2006 and continuing into 2011, we have seen substantial improvements in system stability and reductions in system defect rates. Implementation of order-to-cash flow-through upgrades continues to improve overall performance and accuracy of orders and invoices and to reduce third-party support costs. These improvements in stability and accuracy have allowed the implementation and support of new products and services for our customers, such as new product bundles and HSI products, and provided us with improved capability to offer targeted and timed promotions.
Intellectual Property Agreements
Although the merger agreement for the 2005 Acquisition contains several provisions relating to the disposition of intellectual property assets related to our business, such as an obligation of GTE to use commercially reasonable efforts from signing of the merger agreement through May 2, 2006 to obtain for us the right to use all third-party network element software that is installed on our network elements in Hawaii, our ownership, rights and licenses of intellectual property are generally established
17
under an Intellectual Property Agreement and Verizon Proprietary Software License Agreement entered into with GTE on May 2, 2005.
Pursuant to the Intellectual Property Agreement, we acquired certain trademarks and trade names that relate to our business, although the majority of the marks and names that were used in the business before the 2005 Acquisition were retained by Verizon and GTE, which required us to undertake a re-branding process. We also acquired (a) the copyrights to 41 specified phone books and compilation copyrights to all of the white page, yellow page and other telephone print directory products published by Verizon's Hawaii Business for use by its customers (subject to a license back to GTE in such copyrights), (b) all customer proprietary network information (other than subscriber list information) that relates solely to customers of Verizon's Hawaii Business and (c) a joint ownership interest (with GTE) in the other non-technical proprietary business information relating to Verizon's Hawaii Business. In addition, under the Intellectual Property Agreement we are licensing from GTE all other intellectual property used in the business (other than trademarks, third-party intellectual property and Verizon proprietary software).
Pursuant to the Verizon Proprietary Software License Agreement with GTE, we have nonexclusive, perpetual, internal-use only licenses to use certain Verizon proprietary software (including object and source code) that was used by Verizon in connection with Verizon's Hawaii Business. The software licensed to us consists of numerous back-office systems that were used in various operations of Verizon's Hawaii Business. The software includes, among other things, the assignment, activation and inventory system (AAIS); an automated workforce administration system (AWAS); an FTTP and HSI loop qualification system (LQP); and data exchange utility and connection engine systems (DEU/DEUCE). In addition, Verizon's AIN Service Logic programs are licensed to us perpetually pursuant to the Verizon Proprietary AIN Software License Agreement, entered into in May 2005.
Agreements Relating to Directories Publishing
In November 2007, we completed the sale of our directories publishing business to HYP Media Holdings LLC ("HYP Holdings"), a wholly-owned subsidiary of CBD Investor, Inc. ("CBD"). The sale was made pursuant to the Purchase Agreement dated as of April 29, 2007 among Hawaiian Telcom Communications, Inc., Hawaiian Telcom Services Company, Inc. and HYP Holdings as assignee of CBD, for a cash purchase price of $435.0 million plus certain adjustments related to working capital. In connection with the sale, we transferred the copyrights to our phone books (including those acquired from GTE) to HYP Media LLC, a wholly-owned subsidiary of HYP Holdings, and licensed to HYP Media LLC the right to use several of our trademarks in connection with certain of its directory products. We also entered into continuing commercial arrangements with HYP Media LLC relating to the directory publishing business, including but not limited to a 50-year publishing agreement pursuant to which HYP Media LLC will serve as the exclusive official publisher of telephone directories on behalf of Hawaiian Telcom, Inc. Under this agreement, HYP Media LLC will publish both white and yellow pages print directories under the Hawaiian Telcom® brand. Also as part of this transaction, HYP Media LLC assumed our rights and obligations under our directory services agreement with L.M. Berry and Company, a subsidiary of AT&T. In April 2008, The Berry Company LLC, an affiliate of HYP Media LLC, acquired substantially all the assets of L.M. Berry and Company's Independent Line of Business, including the directory services agreement. In July 2008, HYP Media LLC assigned all its rights under the directory services agreement to HYP Media Finance LLC, an indirect, wholly owned subsidiary of HYP Media LLC. Under the directory services agreement, The Berry Company LLC (as assignee of L.M. Berry and Company), on behalf of HYP Media Finance LLC, is responsible for selling advertising in the Hawaiian Telcom, Inc. print directories as well as for the publication, printing and distribution of the print directories.
18
Agreement Relating to Procurement and Logistics
We entered into a Supply Chain Services Agreement with KGP Logistics, Inc. ("KGP") dated December 7, 2009, pursuant to which KGP provides us with a variety of telecommunications products and handles the logistics with respect to such products, including procurement, shipping, warranty returns and related services such as testing.
We have the ability to purchase a significant portion of our telecommunications equipment from KGP under the agreement. The agreement is non-exclusive and has no minimum purchase requirements. The agreement also contains benchmarking and most-favored-customer provisions that enable us to receive pricing that is roughly equivalent to prices generally available to similarly situated customers in the telecommunications industry. The term of the agreement is two years from December 7, 2009 with the option to extend the agreement for up to three renewal terms of one year each. We may terminate the agreement for convenience at any time upon 180 days notice to KGP.
Agreements Relating to our Wireless Business
Sprint Wireless Agreement
We entered into a Private Label PCS Services Agreement with Sprint, dated as of May 8, 2009, by which we purchase wireless telephone and data services from Sprint and resell those services to our own end users under the Hawaiian Telcom® brand name. This agreement allows us to buy airtime from Sprint at wholesale rates that decline with volume. The agreement has a term of three years and is renewable for up to three additional one-year terms after the initial period.
Other Agreements
We have contracts with other parties that provide the equipment and other services that are necessary to our wireless business. In August 2007, we entered into a Non-Exclusive License and Servicing Agreement with Qualution Systems Inc. to utilize its Catalyst customer relations management software application suite, for which we pay a flat monthly fee. The agreement, which has a term of two years and is renewable for additional one-year terms, replaced our mobile virtual network enabler agreement with Mobile Technology Services, pursuant to which we previously obtained various back-office services for our wireless business. We purchase our wireless handsets and related equipment through an agreement with Brightpoint, Inc. and Aerovoice that has no specific term or minimum purchase requirement.
You should carefully consider the risks described below as well as the other information contained in this Registration Statement. The risks described below are not the only risks facing us. Any of the following risks could materially adversely affect our business, financial condition or results of operations.
Risks Related To Our Emergence From Bankruptcy
Our actual financial results may vary significantly from the projections filed with the Bankruptcy Court.
In connection with the chapter 11 reorganization, the Debtors were required to prepare projected financial information to demonstrate to the Bankruptcy Court the feasibility of the Plan of Reorganization and the ability of the Debtors to continue operations upon emergence from bankruptcy. The projections reflected numerous assumptions concerning anticipated future performance and prevailing and anticipated market and economic conditions that were and continue to be beyond our and the other Debtors' control and that may not materialize. Projections are inherently subject to uncertainties and to a wide variety of significant business, economic and competitive risks. Our actual results may vary from those contemplated by the projections and the variations may be material.
19
Neither these projections nor any form of the disclosure statement should be considered or relied upon in connection with the purchase of our securities.
Because our consolidated financial statements are required to reflect fresh-start reporting adjustments to be made upon emergence from bankruptcy, the financial information in our financial statements prepared after the fresh-start date is not comparable to our financial information from prior periods.
All conditions required for the adoption of fresh-start reporting were met upon emergence from chapter 11 on October 28, 2010. For accounting convenience, we adopted fresh-start accounting as of October 31, 2010. Fresh-start reporting requires that the reorganization or enterprise value, which is intended to reflect the fair value of the entity and approximates the amount a willing buyer would pay for the assets of the entity immediately after the reorganization, be allocated in conformity with the purchase method of accounting for business combinations. As required by purchase accounting, our assets and liabilities were adjusted to fair value. In addition, under fresh-start reporting the accumulated deficit was eliminated. Thus, our future consolidated balance sheets and consolidated statement of operations will not be comparable in many respects to these statements for periods prior to October 31, 2010. The lack of comparable historical information may discourage investors from purchasing our securities. Additionally, the financial information included in this Annual Report on Form 10-K may not be indicative of future financial information.
There is uncertainty regarding our ability to execute our strategic plan.
We have incurred significant losses from continuing operations for each fiscal year since inception prior to emergence from bankruptcy. Our ability to continue as a going concern is dependent upon, among other things: (i) our ability to successfully achieve improved operating performance; (ii) our ability to maintain adequate cash on hand; (iii) our ability to generate cash from operations; and (iv) our ability to establish and maintain profitability.
As discussed under "Operational Matters," we are in the process of implementing our revised strategic plan. The strategic plan served as a basis for our Plan of Reorganization. It is possible that the actual outcome of one or more of management's plans could be materially different or that one or more of management's significant judgments or estimates about the potential effects of the risks and uncertainties could prove to be materially incorrect. If one or more of these possible outcomes is realized, we may not be able to continue as a going concern and you could lose some or all of your investment.
If we experience an ownership change, it could have adverse tax consequences.
Pursuant to the Plan of Reorganization, we amended the certificate of incorporation of the Company to add certain restrictions on the acquisition of its stock to reduce the likelihood of an "ownership change" that could have adverse U.S. federal income tax consequences. Despite these restrictions, an ownership change with adverse tax consequences is still possible. Although we will monitor transfers of our stock in order to take additional action, if feasible, to avoid an ownership change, there can be no assurance that we will not suffer an ownership change with substantial adverse tax consequences.
20
Risks Relating to our Business
Our business faces a variety of financial, operating and market risks, including the following:
Deficiencies in our critical back-office systems and IT infrastructure have negatively impacted our ability to operate as a stand-alone provider of telecommunication services, which has had an adverse effect on our business and results of operations.
To facilitate our transition to a stand-alone telecommunications provider following the 2005 Acquisition, we engaged BearingPoint to build and operate a back-office and IT infrastructure, including critical business processes, software applications (such as billing systems, corporate finance systems, human resources and payroll systems and customer relationship management systems), and hardware. This back-office and IT infrastructure was necessary to enable us to migrate off software systems provided by Verizon. On April 1, 2006, we ceased receiving services from Verizon. While the major network operational systems were built and functioned without significant problems at and after the April 1, 2006 cutover date, critical systems related to back-office functions lacked significant functionality, which led to customer care, order management and billing systems issues, which substantially impacted both customer satisfaction and collection efforts. In 2007, we entered into an Application Services Agreement with Accenture pursuant to which Accenture agreed to perform certain of the application development and management services previously performed by BearingPoint. We subsequently entered into an Amended and Restated Master Application Services Agreement with Accenture effective as of March 2009 to provide long-term information technology support services.
It also has been necessary for us to incur significant incremental expenses to retain third-party service providers to provide manual processing services in order to operate our business. In addition to the costs of third-party service providers, we also incurred additional internal labor costs, in the form of diversion from other efforts. We expect to continue to incur incremental costs in the future, although the amount of such costs has declined and should continue to decline over time as our systems functionality improves.
In addition to the significant expenses we have incurred, our lack of fully functional back-office and IT systems has adversely impacted our ability to fully implement our business strategy and effectively compete in the marketplace, which has had a negative effect on our business and results of operations. While we are continuing to work to improve the functionality of our systems and we have achieved significant improvement, there is no certainty that these activities will be entirely successful or when we will achieve the desired level of functionality. Until we are able to achieve this level of functionality, the deficiencies in our back-office and IT infrastructure may continue to negatively impact our ability to effectively compete in the marketplace and may continue to have an adverse effect on our business and operations.
We have limited experience operating as a stand-alone provider of telecommunications services.
We have limited experience operating as a stand-alone provider of telecommunications services. The increased costs and lack of flexibility associated with operating as a stand-alone provider of telecommunication services could negatively impact our financial results and ability to maintain compliance with the covenant requirements of the new credit facilities that we entered into in connection with our emergence from chapter 11 on October 28, 2010.
We have made and expect to continue to make a significant amount of capital expenditures and to incur incremental transition related expenses in connection with our transition to a fully functional stand-alone provider of telecommunications services.
In connection with our transition to a stand-alone telecommunications provider, we have made and expect to continue to make a significant amount of capital expenditures to, among other things,
21
enhance the capabilities of our network, enhance the functionality of our existing IT systems, and support the deployment of new products and services. We intend to fund these capital expenditures and expenses with operating cash flows and funds available to us under the new credit facilities that we entered into in connection with our emergence from chapter 11 on October 28, 2010. If the amount of capital expenditures and expenses required to be a fully functional stand-alone provider of telecommunications services exceeds those that are contemplated by our current business plan, our cash flows and available financing may be insufficient to fund such capital expenditures and expenses and to provide us with the liquidity that we otherwise would require.
We rely on several material agreements to operate our business. The loss of certain of these agreements, or the failure of any third party to perform under certain of these agreements, could have a material adverse effect on our business.
Since May 2005, several critical services historically provided by Verizon and its affiliates are provided by third-party service providers. For example, we have entered into agreements with Accenture and other third parties for the provision of, among other things, critical printing, billing, and IT services.
The expiration or termination of certain of our material agreements by third- party service providers could have a material adverse effect on our business. Upon expiration or termination of these agreements, we may not be able to replace the services provided to us in a timely manner or on terms and conditions, including service levels and cost, favorable to us. The failure of these third-party service providers to satisfy their obligations under their agreements with us could have a material adverse effect on our business. Additionally, if these third-party service providers were to seek U.S. bankruptcy law protection, our agreements with such service providers, and such service providers' ability to provide the services under those agreements, could be adversely impacted, and although we may have a claim for damages against the bankruptcy estate, the claim may or may not be paid in the bankruptcy proceeding.
Our business is subject to extensive governmental regulation. Applicable legislation and regulations and changes to them could adversely affect our business.
We operate in a heavily regulated industry, and most of our revenues come from the provision of services regulated by the FCC and the HPUC. Laws and regulations applicable to us and our competitors may be, and have been, challenged in the courts and could be changed by federal or state legislative initiative, judicial review or regulatory agencies at any time. We cannot predict the impact of future developments or changes to the regulatory environment or the impact such developments or changes would have on us.
There are a number of FCC policies under review that could have a significant impact on us. Changes to inter-carrier compensation that could impact our access revenues are possible. Changes to the universal service contribution methodology also have been proposed. Changes in FCC policies may increase our obligations and/or reduce our revenue. Further, the FCC's decisions are subject to judicial review. The uncertainty created by these pending FCC proceedings and related litigation make it difficult to predict their impact on us.
In addition, state government regulation also is a source of business uncertainty. The outcome of the service quality proceeding, a requirement from the 2005 Acquisition, is not certain. In response to competitors' requests, the HPUC may initiate a proceeding to re-evaluate performance measures and to evaluate whether performance incentives applicable to our provision of services to competitors should be adopted. The HPUC also has deferred several matters from earlier telecommunications proceedings, which could be initiated in the future. We cannot predict whether state proceedings will be initiated or the possible outcome of such proceedings at this time.
22
A reduction by the HPUC or the FCC of the rates we charge our customers would reduce our revenues and could reduce our earnings.
The rates we charge our local telephone customers are based, in part, on a rate-of-return authorized by the HPUC on capital invested in our network. These authorized rates, as well as allowable investment and expenses, are subject to review and change by the HPUC at any time. If the HPUC orders us to reduce our rates, our revenues would be reduced and our earnings also could be reduced absent corresponding reductions in costs or growth in services.
We cannot assure you that our rates will remain at their current levels. In connection with the HPUC Order approving the Plan of Reorganization, we agreed with the Division of Consumer Advocacy that we would not submit a rate case with a test year earlier than 2013, unless the HPUC determines that it would be in the public interest to waive this requirement. In addition, the HPUC order received in connection with the 2007 sale of our directories publishing business imposed a condition requiring the imputation of revenues. Specifically, a directory publishing revenue credit in the annual amount of $42.6 million per year must be added as regulated revenues into the calculation of Hawaiian Telcom, Inc.'s earnings from 2008 to 2022 in all future rate cases, alternative form of regulation proceedings, or other proceedings before the HPUC investigating Hawaiian Telcom, Inc.'s earnings or financial performance. Such conditions may adversely affect our ability to obtain rate increases in the future.
Also, our local exchange service competitors may gain a competitive advantage based on rules which favor competitors. For example, competitors have the ability to purchase our services at discounted rates set by the HPUC and to resell them at rates that are not subject to the level of regulatory scrutiny generally faced by us. Additionally, as a result of the state regulators permitting our competitors to intervene in rate-setting proceedings, there is a potential that such competitors could obtain business sensitive information about us during such proceedings.
The FCC approves tariffs for interstate access and subscriber line charges, both of which are components of our network access revenue. The FCC currently is considering whether to restrain special access pricing by carriers like us subject to price caps on interstate rates. The FCC also is considering proposals to reduce switched interstate access charges for carriers like us and may require us to recover the foregone revenue from our end users. If the FCC lowers interstate switched or special access charges, we may be required to recover more revenue through subscriber line charges or forego this revenue altogether. This could reduce our revenue or impair our competitive position.
The telecommunications industry is increasingly competitive, and we may have difficulty competing effectively.
All sectors of the telecommunications industry are competitive. Competition in the markets in which we operate could:
- •
- reduce our customer base;
- •
- require us to lower rates and other prices in order to compete; or
- •
- require us to increase marketing expenditures and the use of discounting and promotional campaigns.
Any of these factors could adversely affect our business.
Wireline Services. As the ILEC, we face competition from resellers, local providers who lease UNEs from us and, to a lesser degree, from facilities-based providers of local telephone services.
We have historically faced access line losses as a result of competition and substitution of traditional wireline services with wireless services. Access line losses have been faced by the industry as a whole, and we cannot assure you that access line losses will not continue in the future. In particular,
23
the increasing penetration of high-speed internet and VoIP could lead to further primary and second access line losses.
Interconnection duties are governed, in part, by telecommunications rules and regulations related to the UNEs that must be provided. These rules and regulations remain subject to ongoing modifications. Our business is subject to extensive governmental regulation, and applicable legislation and regulations and changes to them could adversely affect our business. However, we received some regulatory relief in 2009 when the Hawaii State Legislature passed Act 180, which classified retail local exchange intrastate services as fully competitive. While HPUC approval and cost support filings are no longer required to establish or modify rates or to bundle service offerings, HPUC approval is required to raise the rate that existed for the retail service in the tariff at the time of implementation of Act 180. In addition, while cellular wireless services have historically complemented traditional local exchange and long distance services, existing and emerging wireless and IP technologies are increasingly competitive with local exchange and, particularly, long distance services in some or all of our service areas.
Internet Services. We expect that the Internet access services business will continue to be highly competitive due to the absence of significant barriers to entry. We currently compete with a number of established online services companies, inter-exchange carriers and cable companies. Competition is particularly intense for broadband services.
Advanced Communication and Network Services. The advanced communication and network services business is highly competitive. Many non-traditional players have emerged in the business communications market, attracted by the absence of significant barriers to entry. Many of these non-traditional players are capable of focusing on highly specialized areas of the market.
Next Generation Television Service. The market for video services in Hawaii is dominated by Oceanic. On the island of Oahu, in particular, 94% of households on Oahu already are customers of Oceanic's cable service. Through Hawaiian Telcom Services Company, Inc., we filed an application for a video franchise for the island of Oahu with the State of Hawaii Department of Commerce and Consumer Affairs (DCCA). There is no assurance the DCCA will grant the franchise, or that the franchise will be granted on a timely basis or on terms that are not unfavorable. Any such franchise may impose fees, burdens and conditions that do not take into account Oceanic's dominant position and consequently impose a relatively greater regulatory and financial burden on us or otherwise make it not feasible for us to compete with Oceanic or place us at a competitive disadvantage.
Wireless Services. We provide wireless telecommunications services by use of a MVNO model in which we resell another carrier's facilities-based wireless services under the Hawaiian Telcom® brand name. The market in Hawaii for wireless telecommunications services is subject to intense competition. In addition, our wireless business may be less profitable than the wireless businesses of other telecommunications companies due to our use of a MVNO model.
If we do not adapt to technological changes in the telecommunications industry, we could lose customers or market share.
The telecommunications industry is subject to rapid and significant changes in technology, frequent new service introductions and evolving industry standards. We cannot predict the effect of these changes on our competitive position, profitability or industry. Technological developments may reduce the competitiveness of our network and require unbudgeted upgrades or the procurement of additional products that could be expensive and time consuming to implement. In addition, new products and services arising out of technological developments may reduce the attractiveness of our services. If we fail to adapt successfully to technological changes or fail to obtain access to important new technologies, we could lose customers and be limited in our ability to attract new customers and sell
24
new services to our existing customers. An element of our business strategy is to deliver enhanced and ancillary services to customers. The successful delivery of new services is uncertain and dependent on many factors, and we may not generate anticipated revenues from such services.
The successful operation and growth of our businesses are dependent on economic conditions in Hawaii.
Substantially all of our customers and operations are located in Hawaii. Because of our geographical position, the successful operation and growth of our businesses is dependent on economic conditions in Hawaii. The Hawaii economy, in turn, is dependent upon many factors, including:
- •
- the level of government and military spending;
- •
- the development of the local financial services industry;
- •
- the strength of the Hawaii tourism industry;
- •
- the continued growth in services industries; and
- •
- the absence of hurricanes or other natural disasters and terrorism incidents.
The customer base for telecommunications services in Hawaii is small and geographically concentrated. The population of Hawaii is approximately 1.36 million, approximately 70% of whom live on the island of Oahu. Any adverse development affecting Oahu, or Hawaii generally, could substantially impact our ability to do business.
Labor shortages or increased labor costs in Hawaii could have a material adverse effect on our operations. We cannot assure you that we will be able to continue to hire and retain a sufficient labor force of qualified persons. Our business could suffer if we are unsuccessful in negotiating a new collective bargaining agreement. As of March 1, 2011, 57% of our workforce was represented by IBEW Local 1357. Our current collective bargaining agreement will expire on September 12, 2011. Although we believe that our relations with our employees are good, we cannot assure you that future collective bargaining agreement negotiations will not result in significant increases in the cost of labor, or that a breakdown in such negotiations or relations will not result in the disruption of our operations.
We depend on key members of our executive management team.
Our future success as a stand-alone telecommunications provider is highly dependent upon members of our executive management team. Although certain of these members are subject to employment agreements and participate in the various incentive plans, such employment agreements may be terminated and the loss of the services of any such individuals or other key personnel could have a material adverse effect upon our future success as a stand-alone telecommunications provider. We do not maintain any "key person" insurance on any of our personnel. In 2008, we hired a new senior management team, including hiring Eric K. Yeaman as President and Chief Executive Officer, in an effort to explore strategic opportunities and improve operating results. Our future success will be dependent in part upon the abilities of the new senior management team to leverage their extensive management and operating experience to improve our financial performance and business operations.
Our indebtedness could adversely affect our financial condition.
Following our emergence from chapter 11, we still have a significant amount of indebtedness in relation to our equity. Under the Plan of Reorganization, upon our emergence on October 28, 2010, our obligations under our former senior credit facilities and the indentures governing our former notes were cancelled, and we entered into the New Term Loan in the amount of $300 million and the Revolving Credit Facility in the amount of $30 million, each with a first priority lien on all assets of the Debtors.
25
Even with the reduction in debt, the debt service requirements of our indebtedness could:
- •
- make it more difficult for us to satisfy the service requirements of our other obligations, including pension funding
obligations, investments required to maintain and upgrade our network and service fleet, investments required to introduce and deploy new products and services, as well as the operating costs of our
businesses;
- •
- increase our vulnerability to general adverse economic and industry conditions;
- •
- require us to dedicate a higher than desired portion of our cash flow from operations to payments on our indebtedness,
thereby reducing the availability of our cash flow to fund working capital, capital expenditures, research and development efforts and other general corporate purposes;
- •
- limit our flexibility in planning for, or reacting to, changes in our business and the industry in which we operate;
- •
- make it difficult to secure credit terms with our vendors;
- •
- place us at a competitive disadvantage compared to our competitors that have less debt; and
- •
- limit our ability to borrow additional funds.
In addition, the terms of the New Term Loan and the Revolving Credit Facility contain financial and other restrictive covenants that limit our ability to engage in activities that may be in our long-term best interests. Our failure to comply with those covenants could result in an event of default which, if not cured or waived, could result in the acceleration of all of our debts.
The New Term Loan has a maturity date in 2015 and the Revolving Credit Facility has a maturity date in 2011. We generally do not expect to generate the necessary cash flow to repay the New Term Loan in its entirety by the maturity date and such repayment in full is dependent upon the ability to refinance the New Term Loan on reasonable terms. The ability to refinance the indebtedness on reasonable terms before the maturity date cannot be assured.
To service our indebtedness, we will require a significant amount of cash. Our ability to generate cash depends on many factors beyond our control.
Our ability to make payments on and to refinance our new indebtedness and to fund planned capital expenditures will depend on our ability to generate cash in the future. This, to a certain extent, is subject to general economic, financial, competitive, legislative, regulatory and other factors that are beyond our control.
We cannot assure you that our business will generate sufficient cash flow from operations or that future borrowings will be available to us in an amount sufficient to enable us to pay our indebtedness or to fund our other liquidity needs. We will likely need to refinance all or a portion of our indebtedness on or before maturity. We cannot assure you that we will be able to refinance any of our indebtedness on commercially reasonable terms or at all.
Restrictive covenants in the agreements governing the new indebtedness entered into upon emergence from chapter 11 on October 28, 2010 restrict our ability to pursue our business strategies, and a breach of such covenants may result in the acceleration of our long-term debt maturities.
The restrictive covenants in the New Term Loan and Revolving Credit Facility limit our ability, among other things, to:
- •
- incur additional indebtedness;
26
- •
- pay dividends or make distributions in respect of our capital stock or to make certain other restricted payments or
investments;
- •
- sell assets, including capital stock of subsidiaries;
- •
- consolidate, merge, sell or otherwise dispose of all or substantially all of our assets;
- •
- enter into transactions with our affiliates;
- •
- invest in new products and services or make capital expenditures; and
- •
- incur liens.
In addition, the restrictive covenants may prohibit us from prepaying our other indebtedness and require us to maintain compliance with specified financial ratios. Our ability to comply with these ratios may be affected by events beyond our control.
Item 1B. Unresolved Staff Comments.
None
We own our corporate headquarters, which is located in 1177 Bishop Street, Honolulu, Hawaii 96813 and consists of over 465,000 square feet of office space. We also have other properties consisting primarily of approximately 112 owned (including part-owned) and approximately 61 leased real estate properties, including our administrative facilities and facilities for call centers, retail store use, switching equipment, fiber optic networks, microwave radio and cable and wire facilities, cable head-end equipment, coaxial distribution networks, routers and servers used in our wireline business. See Item 1, "Business—Network Architecture and Technology." There are no material real estate properties relating to our wireless business. For purposes of Hawaii state law, we are classified as a public utility and, accordingly, do not pay any property taxes. Substantially all of our assets (including those of our subsidiaries) are pledged for the New Term Loan.
We are involved in various claims, legal actions and regulatory proceedings arising from time to time in the ordinary course of business. Other than the matter set forth below, in the opinion of management, the ultimate disposition of these matters will not have a material adverse effect on our combined financial position, results of operations or cash flows.
On December 1, 2008, the Company, Hawaiian Telcom Communications, Inc., Hawaiian Telcom, Inc., Hawaiian Telcom Services Company, Inc., and certain other affiliates filed voluntary petitions for relief under chapter 11 of the U.S. Bankruptcy Code in the United States Bankruptcy Court for the District of Delaware in order to facilitate the balance sheet restructuring. Venue of the chapter 11 cases was transferred to the United States Bankruptcy Court for the District of Hawaii on December 22, 2008. The Bankruptcy Court entered a Confirmation Order on December 30, 2009 confirming our Plan of Reorganization. The Plan of Reorganization became effective, and the Company and other Debtors emerged from chapter 11, on October 28, 2010. In the course of the chapter 11 cases, various creditors, including certain of our Named Executive Officers, had filed proofs of claim. These claims are being resolved as part of the resolution of the chapter 11 cases, and we continue to evaluate possible objections to certain proofs of claim. Under our Plan of Reorganization, $500,000 was set aside to cover claims of unsecured creditors.
27
Item 5. Market for Registrant's Common Equity, Related Stockholder Matters and Issuer Purchases of Equity Securities.
Market Information
Our New Common Stock was registered under Section 12 of the Securities Exchange Act of 1934 effective December 3, 2010 and began trading over the counter on December 21, 2010, under the symbol "HWTL". Prior to that time, there was no public market for our New Common Stock. The holders of our New Common Stock are entitled to one vote per share on any matter to be voted upon by stockholders. The following table sets forth the high and low sales prices of our New Common Stock for the period from December 3, 2010 through December 31, 2010:
| |
High | Low | |||||
|---|---|---|---|---|---|---|---|
December 3, 2010 through December 31, 2010 |
$ | 28.00 | $ | 18.25 | |||
Holders
As of March 14, 2011, there were 38 holders of record of our New Common Stock and approximately 221 beneficial owners.
Dividends
We have not declared or paid any dividends on our New Common Stock. Our New Term Loan and Revolving Credit Facility limit our ability to declare or pay dividends.
Sales of Unregistered Equity Securities
In connection with our emergence from chapter 11 bankruptcy on October 28, 2010, pursuant to the Plan of Reorganization we issued 10,000,000 shares of our New Common Stock to the Senior Secured Creditors and issued 1,481,055 warrants to certain holders of Senior Notes to acquire shares of New Common Stock. See Item 1, "Business—History and Organizational Structure—Bankruptcy Proceedings". The shares and warrants were issued in reliance upon the exemption provided by Section 1145 of the Bankruptcy Code, which exemption also applies to the issuance of the New Common Stock deliverable upon exercise of the warrants.
Also pursuant to the Plan of Reorganization, certain senior notes holders with allowed claims (the "eligible senior notes claim holders") who certified that they were qualified institutional buyers as defined in Rule 144A under the Securities Act of 1933, as amended, or accredited investors as defined in Rule 501 under the Securities Act of 1933, as amended, received subscription rights entitling them to purchase their pro rata share of 3,125,000 shares of the New Common Stock to be issued on the Effective Date or as soon as practicable thereafter. The rights offering commenced on September 23, 2009 and expired on September 30, 2009. Holders of subscription rights intending to participate in the rights offering were required to elect to exercise their subscription rights and pay the subscription purchase price of $16.00 per share prior to the expiration of the rights offering. The rights offering was subject to a minimum participation of $1,000,000. A total of three eligible senior notes claim holders timely exercised their subscription rights, paying a total of $2,161,008 for the right to receive a total of 135,063 shares of New Common Stock.
28
Securities Authorized for Issuance Under Equity Compensation Plans.
Securities authorized for issuance under equity compensation plans as of December 31, 2010 included:
Plan Category
|
Number of securities to be issued upon exercise of outstanding options, warrants and rights |
Weighted-average exercise price of outstanding options, warrants and rights |
Number of securities remaining available for future issuance under equity compensation plans (excluding securities reflected in column (a)) |
|||||||
|---|---|---|---|---|---|---|---|---|---|---|
| |
(a) |
(b) |
(c) |
|||||||
Equity Compensation Plans Approved by Security Holders |
— | — | — | |||||||
Equity Compensation Plans not Approved by Security Holders* |
490,964 | — | 909,036 | |||||||
Total |
490,964 | — | 909,036 | |||||||
- *
- The 2010 Equity Incentive Plan was authorized by the Plan of Reorganization. Under the 2010 Equity Incentive Plan, the securities remaining available for future issuance may be issued either as restricted stock, restricted stock units, stock appreciation rights, stock options, or other stock or stock-based awards.
Purchases of Equity Securities by the Issuer and Affiliated Purchasers
None.
29
Stockholder Return Performance Graph
The graph below compares the cumulative total stockholder return on our New Common Stock with the cumulative total return on the Standards & Poor's ("S&P") 500 Stock Index, and the Dow Jones Telecom Index for the period beginning December 21, 2010 (the date our New Common Stock commenced trading) and ending December 31, 2010, assuming an initial investment of $100 with reinvestment of dividends.
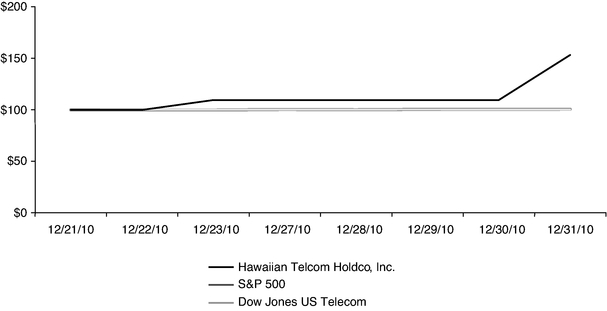
| |
12/21/10 | 12/22/10 | 12/23/10 | 12/27/10 | 12/28/10 | 12/29/10 | 12/30/10 | 12/31/10 | |||||||||||||||||
|---|---|---|---|---|---|---|---|---|---|---|---|---|---|---|---|---|---|---|---|---|---|---|---|---|---|
Hawaiian Telcom Holdco, Inc. |
100.00 | 100.00 | 109.59 | 109.59 | 109.59 | 109.59 | 109.59 | 153.42 | |||||||||||||||||
S&P 500 |
100.00 | 100.34 | 100.17 | 100.23 | 100.31 | 100.41 | 100.26 | 100.24 | |||||||||||||||||
Dow Jones US Telecom |
100.00 | 100.00 | 99.87 | 100.43 | 100.13 | 100.52 | 100.47 | 100.65 | |||||||||||||||||
The foregoing performance graph and related information shall not be deemed "soliciting material" or to be "filed" with the SEC, nor shall such information be incorporated by reference into any future filings under the Securities Act of 1933 or the Securities Exchange Act of 1934, each as amended, except to the extent we specifically incorporate it by reference into such filing.
30
Item 6. Selected Financial Data
The following data should be read in conjunction with "Management's Discussion and Analysis of Financial Condition and Results of Operations" and our consolidated financial statements and related notes thereto included elsewhere in this annual report.
Selected Financial Data (dollars in thousands, except per share amounts)
| |
Predecessor(1) | Successor(1) | |||||||||||||||||
|---|---|---|---|---|---|---|---|---|---|---|---|---|---|---|---|---|---|---|---|
| |
Year Ended December 31, | Period from January 1 to October 31, 2010 |
Period from November 1 to December 31, 2010 |
||||||||||||||||
| |
2006 | 2007 | 2008 | 2009 | |||||||||||||||
Statement of operations data: |
|||||||||||||||||||
Operating revenues |
$ | 503,135 | $ | 483,676 | $ | 447,755 | $ | 408,595 | $ | 334,686 | $ | 66,759 | |||||||
Depreciation and amortization |
163,967 | 159,872 | 160,278 | 164,376 | 136,661 | 9,723 | |||||||||||||
Operating income (loss) |
(55,047 | ) | (85,719 | ) | (51,422 | ) | (56,794 | ) | (42,902 | ) | 7,981 | ||||||||
Interest expense |
80,256 | 85,945 | 89,467 | 30,089 | 23,398 | 4,329 | |||||||||||||
Provision (benefit) for income tax |
2,482 | (73,600 | ) | (956 | ) | (2,985 | ) | (346 | ) | — | |||||||||
Income (loss) from continuing operations |
(137,358 | ) | (105,605 | ) | (158,647 | ) | (130,734 | ) | 185,794 | 3,129 | |||||||||
Income (loss) from discontinued operations(2) |
(7,279 | ) | 156,631 | — | — | — | — | ||||||||||||
Net income (loss)(3) |
(144,637 | ) | 51,026 | (158,647 | ) | (130,734 | ) | 185,794 | 3,129 | ||||||||||
Net earnings (loss) per common share—basic: |
|||||||||||||||||||
Continuing operations |
$ | (337.94 | ) | $ | (246.74 | ) | $ | (370.67 | ) | $ | (305.45 | ) | $ | 434.10 | $ | 0.31 | |||
Discontinued operations |
— | 365.96 | — | — | — | — | |||||||||||||
Net income (loss) |
$ | (337.94 | ) | $ | 119.22 | $ | (370.67 | ) | $ | (305.45 | ) | $ | 434.10 | $ | 0.31 | ||||
Net earnings (loss) per common share—diluted: |
|||||||||||||||||||
Continuing operations |
$ | (337.94 | ) | $ | (246.74 | ) | $ | (370.67 | ) | $ | (305.45 | ) | $ | 434.10 | $ | 0.30 | |||
Discontinued operations |
— | 365.96 | — | — | — | — | |||||||||||||
Net income (loss) |
$ | (337.94 | ) | $ | 119.22 | $ | (370.67 | ) | $ | (305.45 | ) | $ | 434.10 | $ | 0.30 | ||||
Statement of cash flow data—net cash provided by (used in): |
|||||||||||||||||||
Operating activities |
$ | 38,299 | $ | 101,508 | $ | 61,664 | $ | 95,112 | $ | 48,909 | $ | 12,921 | |||||||
Investing activities(4) |
(104,368 | ) | 63,160 | 199,414 | (87,537 | ) | (57,659 | ) | (21,235 | ) | |||||||||
Financing activities |
60,500 | (160,648 | ) | (180,875 | ) | — | 2,161 | — | |||||||||||
Balance Sheet data (as of end of period): |
|||||||||||||||||||
Cash and cash equivalents(5) |
$ | 4,752 | $ | 8,772 | $ | 88,975 | $ | 96,550 | $ | 94,138 | $ | 81,647 | |||||||
Property, plant and equipment, net |
818,172 | 794,051 | 744,277 | 711,265 | 670,714 | 459,781 | |||||||||||||
Total assets |
1,712,164 | 1,571,540 | 1,273,078 | 1,183,677 | 1,103,969 | 646,036 | |||||||||||||
Long-term debt(6) |
1,380,500 | 989,700 | 1,074,500 | 1,085,797 | 1,097,369 | 300,000 | |||||||||||||
Stockholders' equity (deficiency) |
102,039 | 135,180 | (72,516 | ) | (180,264 | ) | (262,796 | ) | 178,792 | ||||||||||
- (1)
- Although
the Company emerged from bankrupcty on October 28, 2010, the Predecessor adopted "fresh-start" accounting as of October 31, 2010.
Under the provisions of fresh-start accounting, a new entity is deemed created for financial reporting purposes. References to "Successor" refer to the Company after October 31, 2010 after
giving effect to provisions of the Plan of Reorganization and application of fresh-start accounting. References to "Predecessor" refer to the Company on and prior to October 31, 2010.
- (2)
- In
2007, the Company sold its directories publishing segment to an unrelated entity which resulted in a gain on sale of $231.8 million.
- (3)
- The
net income (loss) for the years ended December 31, 2008 and 2009, for the period from January 1 to October 31, 2010 and for the
period November 1 to December 31, 2010 includes gain (charges) for reorganization items amounting to ($7.9) million, ($43.0) million, $251.7 million and
($0.5) million, respectively. Net income for the year ended December 31, 2007 includes a $42.2 million gain on settlement of a legal dispute.
- (4)
- The
Company's investing activities during the year ended December 31, 2007 include the sale of the directories publishing segment.
- (5)
- Cash
and cash equivalents at December 31, 2007 excludes segregated cash of $271.5 million in a short-term Treasury money market account.
Proceeds from the sale of the directories publishing segment had been temporarily invested in this account.
- (6)
- Long-term debt includes debt classified as liabilities subject to compromise.
31
Item 7. Management's Discussion and Analysis of Financial Condition and Results of Operations
Background
In the following discussion and analysis of financial condition and results of operations, unless the context otherwise requires, "we," "us" or the "Company" refers, collectively, to Hawaiian Telcom Holdco, Inc. and its subsidiaries.
The statements in the discussion and analysis regarding industry outlook, our expectations regarding the future performance of our business and the other non-historical statements in the discussion and analysis are forward-looking statements. These forward-looking statements are subject to numerous risks and uncertainties, including, but not limited to, the risks and uncertainties described in Item 1A, "Risk Factors." Our actual results may differ materially from those contained in any forward-looking statements. You should read the following discussion together with Item 6, "Selected Financial Data" and our consolidated financial statements and related notes thereto included elsewhere in this annual report.
Chapter 11 Reorganization
On December 1, 2008, we and certain of our subsidiaries filed voluntary petitions for relief under Chapter 11 of the Bankruptcy Code and on October 28, 2010, the Company emerged from Chapter 11. For further information regarding these petitions, see Note 2 to the consolidated financial statements.
Under the Plan of Reorganization, all of the existing common stock and stock options were cancelled upon emergence and the equity holders received no recovery. Our emergence from Chapter 11 on the emergence date resulted in a new reporting entity and the new shares of common stock were issued to the former secured lenders and swap counterparties. We adopted fresh-start reporting as of October 31, 2010. As required by fresh-start accounting, our assets and liabilities have been adjusted to fair value. Accordingly, our financial condition and results of operations after October 31, 2010 are not comparable to the financial condition and result of operations for periods prior to and on October 31, 2010.
Operational Matters
We have operated as a stand-alone service provider since the acquisition of the Company from Verizon Communications, Inc. on May 2, 2005. Our transition to becoming a stand-alone service provider included the requirement to build back-office and IT infrastructure to allow us to migrate off software systems that the Company used prior to the 2005 acquisition. This build requirement generally consisted of integration and installation of software, databases, hardware, operating systems, and internal network systems. On April 1, 2006, we cutover from the legacy Verizon systems to our new back-office and IT infrastructure. While the major network operational systems functioned without significant problems, critical systems related to back-office functions, such as customer care, order management, billing, supply chain, and other systems interfacing with our financial systems, lacked significant functionality. This led to deficiencies in order accuracy, service provisioning, billing and collections, revenue assurance and overall customer service. We responded by undertaking substantial efforts to address the deficiencies and succeeded in achieving significant improvements since 2006 in the functionality of the related systems. Among other things, we reduced our service order backlog by over 80% from 2008 and reduced the billing fallout rate to normal levels for our industry.
Although our systems are now more stable and more reliable, we continue to experience certain systems functionality issues which continue to adversely affect our overall customer experience and require us to continue to incur incremental expenses to retain third-party service providers to provide call center and manual processing services. As a result, we continue to focus on improvement of our IT systems and automation of business processes. This includes investment in our systems to provide for
32
automation of new products and services as well as additional automation for existing products and services. These improvements are expected to reduce manual efforts and improve automated flow-through, resulting in more accurate provisioning and billing of services to our customers.
Our original strategic plan was designed to focus on opportunities to leverage our incumbent market position, enhance the penetration of certain underperforming products, introduce new products, services and bundles tailored to the specific needs of the local market, and reposition the Company as a locally branded, managed and operated full service telecommunications provider. Our ability to execute the initiatives contemplated in our original strategic plan were hindered by the functionality deficiencies experienced after the 2006 cutover to the new operating, financial and administrative information technology systems. Management was required to commit substantial resources to respond to the lack of functionality in the Company's critical back-office systems. As a result, our ability to invest in new technologies, introduce new products and enhance our customer service experience was delayed and negatively impacted our financial performance and financial condition.
We have since implemented revised strategies designed to stabilize our business and position the Company for growth. We have introduced a number of innovative new products and advanced communications solutions into the marketplace, successfully deployed next-generation network technologies capable of reaching over 90% of the State population, improved the automation of our systems, grown our broadband market share and made significant progress in rebuilding the brand and image of the Company. We believe the successful execution of these strategies has stabilized our customers, our employees and our operating results.
We are in the process of implementing new strategies which focus on growing the business, delivering superior service and improving financial performance. We continue to evaluate the feasibility of various new product and service offerings in order to respond to customer demand and gain market share in our business, consumer and wholesale channels. We may also pursue other business development opportunities, cost reduction initiatives and asset rationalization options to improve financial performance and liquidity. There can be no assurance that these new strategies will be successful or even if successful whether the Company will have the resources to fund such strategies, or that the investments in these new strategies will be recovered.
Segments and Sources of Revenue
We operate in two reportable segments (Wireline Services and Other) based on how resources are allocated and performance is assessed by our chief operating decision maker. Our chief operating decision maker is our Chief Executive Officer.
Wireline Services
The Wireline Services segment derives revenue from the following sources:
Local Telephone Services—We receive revenue from providing local exchange telephone services. These revenues include monthly charges for basic service, local private line services and enhanced calling features such as voice mail, caller ID and 3-way calling.
Network Access Services—We receive revenue from charges established to compensate us for origination, transport and termination of calls for long distance and other interexchange carriers. These include subscriber line charges imposed on end users, and switched and special access (data line) charges paid by carriers and others.
Long Distance Services—We receive revenue from providing toll, or long distance, services to our customers.
Internet Services—We provide HSI and dial-up Internet to our residential and business customers.
33
Other Telecommunication Services and Sales—Other services and sales include managed services, inside wire maintenance, and installation and maintenance of customer premise equipment. In 2010, the Company began offering customers a digital television service in select areas on a no-fee trial basis.
Other
We receive revenue from wireless services, including the sale of wireless handsets and other wireless accessories.
Results of Operations for the Years Ended December 31, 2010, 2009 and 2008
As discussed above, we emerged from Chapter 11 and adopted fresh-start reporting on October 31, 2010. References to "Predecessor" refer to the Company prior to and on October 31, 2010. References to "Successor" refer to the Company after October 31, 2010 after giving effect to the cancellation of the existing common stock and issuance of new securities in accordance with the Plan of Reorganization and application of fresh-start reporting. As a result of the application of fresh-start reporting, the Successor's financial statements are not comparable with the Predecessor's financial statements. However, for purposes of the discussion of the results of operations, the combined ten months ended October 31, 2010 and two months ended December 31, 2010 have been compared to the year ended December 31, 2009. We believe this combined information is useful to the readers of this Annual Report in understanding changes in our results of operations. Significant changes in operating results for the Successor, as compared to Predecessor periods, relate primarily to depreciation and amortization because of changes in the basis of long-lived assets, and changes in interest expense with a new borrowing facility in place. In this discussion, we will disclose the fresh-start and other impacts on our results of operations that vary from historical Predecessor periods to aid in the understanding of our financial performance. We have also provided a discussion and analysis of a comparison for the Predecessor results for the years ended December 31, 2009 and 2008.
The Successor reported net income of $3.1 million for the period from November 1 to December 31, 2010 and the Predecessor reported net income of $185.8 million (including reorganization related income of $251.7 million) for the period January 1 to October 31, 2010. The Predecessor reported a net loss of $130.7 million and $158.6 million for the years ended December 31, 2009 and 2008, respectively.
34
Operating Revenues
The following tables summarize our volume information as of December 31, 2010, 2009 and 2008, and our operating revenues for the years ended December 31, 2010, 2009 and 2008.
| |
Successor | Predecessor | 2010 vs. 2009 Change |
2009 vs. 2008 Change |
|||||||||||||||||||
|---|---|---|---|---|---|---|---|---|---|---|---|---|---|---|---|---|---|---|---|---|---|---|---|
| |
December 31, 2010 |
December 31, 2009 |
December 31, 2008 |
||||||||||||||||||||
| |
Number | Percentage | Number | Percentage | |||||||||||||||||||
Switched access lines |
|||||||||||||||||||||||
Residential |
241,506 | 262,428 | 291,512 | (20,922 | ) | (8.0 | )% | (29,084 | ) | (10.0 | )% | ||||||||||||
Business |
194,890 | 202,649 | 213,676 | (7,759 | ) | (3.8 | )% | (11,027 | ) | (5.2 | )% | ||||||||||||
Public |
4,791 | 4,947 | 5,255 | (156 | ) | (3.2 | )% | (308 | ) | (5.9 | )% | ||||||||||||
|
441,187 | 470,024 | 510,443 | (28,837 | ) | (6.1 | )% | (40,419 | ) | (7.9 | )% | ||||||||||||
High-Speed Internet lines |
|||||||||||||||||||||||
Residential |
81,770 | 79,256 | 78,028 | 2,514 | 3.2 | % | 1,228 | 1.6 | % | ||||||||||||||
Business |
16,728 | 15,530 | 16,791 | 1,198 | 7.7 | % | (1,261 | ) | (7.5 | )% | |||||||||||||
Wholesale |
1,206 | 1,242 | 849 | (36 | ) | (2.9 | )% | 393 | 46.3 | % | |||||||||||||
|
99,704 | 96,028 | 95,668 | 3,676 | 3.8 | % | 360 | 0.4 | % | ||||||||||||||
Long distance lines |
|||||||||||||||||||||||
Residential |
147,983 | 158,354 | 167,628 | (10,371 | ) | (6.5 | )% | (9,274 | ) | (5.5 | )% | ||||||||||||
Business |
79,323 | 81,669 | 84,431 | (2,346 | ) | (2.9 | )% | (2,762 | ) | (3.3 | )% | ||||||||||||
|
227,306 | 240,023 | 252,059 | (12,717 | ) | (5.3 | )% | (12,036 | ) | (4.8 | )% | ||||||||||||
2010 compared to 2009
Operating Revenues (dollars in thousands)
| |
Combined | Successor | Predecessor | |
|
||||||||||||||||
|---|---|---|---|---|---|---|---|---|---|---|---|---|---|---|---|---|---|---|---|---|---|
| |
For the Year Ended December 31, 2010 |
Period from November 1 to December 31, 2010 |
Period from January 1 to October 31, 2010 |
For the Year Ended December 31, 2009 |
Year-over-Year Change | ||||||||||||||||
| |
Amount | Percentage | |||||||||||||||||||
Wireline Services |
|||||||||||||||||||||
Local services |
$ | 155,982 | $ | 25,004 | $ | 130,978 | $ | 172,094 | $ | (16,112 | ) | (9.4 | )% | ||||||||
Network access services |
132,771 | 22,764 | 110,007 | 130,068 | 2,703 | 2.1 | % | ||||||||||||||
Long distance services |
34,694 | 5,539 | 29,155 | 35,703 | (1,009 | ) | (2.8 | )% | |||||||||||||
High-Speed Internet and |
|||||||||||||||||||||
other Internet |
34,302 | 5,949 | 28,353 | 33,864 | 438 | 1.3 | % | ||||||||||||||
Other services and sales |
38,961 | 6,732 | 32,229 | 31,404 | 7,557 | 24.1 | % | ||||||||||||||
|
396,710 | 65,988 | 330,722 | 403,133 | (6,423 | ) | (1.6 | )% | |||||||||||||
Other |
4,735 | 771 | 3,964 | 5,462 | (727 | ) | (13.3 | )% | |||||||||||||
|
$ | 401,445 | $ | 66,759 | $ | 334,686 | $ | 408,595 | $ | (7,150 | ) | (1.7 | )% | ||||||||
The decrease in local services revenues was caused primarily by the decline in switched access lines of 6.1% ($10.5 million as a percentage of 2009 revenue) as well as competitive pricing pressures which is the majority of the cause of the remaining dollar decline. Continued competition in the telecommunications industry has increasingly resulted in customers using technologies other than traditional phone lines for voice and data. Residential customers are increasingly moving local voice service to VoIP technology offered by cable providers, as well as using wireless services in place of traditional wireline phone service. Generally, VoIP technology offered by cable providers is less expensive than traditional wireline phone service, requiring us to respond with more competitive
35
pricing. Also, residential "second lines" continue to be disconnected as customers switch from dial-up Internet services to HSI and cable broadband Internet service. Additionally, Competitive Local Exchange Carriers (CLECs) and our cable competitor continue to focus on business customers and selling services to our customer base.
In an effort to slow the rate of line loss, we are continuing retention and acquisition programs, and are increasingly focusing efforts on bundling of services. We have instituted various "saves" campaigns designed to focus on specific circumstances where we believe customer churn is controllable. These campaigns include targeted offers to "at risk" customers as well as other promotional tools designed to enhance customer retention. We are also reemphasizing win-back and employee referral programs. Additionally, we are intensifying our efforts relative to developing tools and training to enhance our customer service capability to improve customer retention.
Network access revenue increased in 2010 as compared to the year ended December 31, 2009. The increase in demand for data services generated additional revenue of $7.1 million which was partially offset by the decline in switched access lines.
The decrease in long distance revenue was primarily because of the decline in long distance lines partially offset by customers switching to flat rate and bundled plans which has increased the average rate per long distance line.
HSI and other Internet revenues increased slightly when compared to the prior year as a 3.8% growth in our HSI subscriber growth ($1.3 million as a percentage of 2009 revenue) was partially offset by lower rates in response to the competitive environment. We are continuing to focus on upgrading our network to expand the reach of our higher bandwidth premium services.
The increase in other services and sales was related to more sales and installations of customer premise equipment for certain large government customers in 2010.
Other revenues, primarily consisting of revenues generated from our wireless operation, decreased as we attempted to focus our marketing efforts on other segments of our business. We had approximately 7,500 and 8,400 external wireless subscribers as of December 31, 2010 and 2009, respectively.
2009 compared to 2008
Operating Revenues (dollars in thousands)
| |
Predecessor | Change | ||||||||||||
|---|---|---|---|---|---|---|---|---|---|---|---|---|---|---|
| |
2009 | 2008 | Amount | Percentage | ||||||||||
Wireline Services |
||||||||||||||
Local services |
$ | 172,094 | $ | 193,696 | $ | (21,602 | ) | (11.2 | )% | |||||
Network access services |
130,068 | 134,550 | (4,482 | ) | (3.3 | )% | ||||||||
Long distance services |
35,703 | 36,087 | (384 | ) | (1.1 | )% | ||||||||
High-Speed Internet and other Internet |
33,864 | 34,076 | (212 | ) | (0.6 | )% | ||||||||
Other services and sales |
31,404 | 41,214 | (9,810 | ) | (23.8 | )% | ||||||||
|
403,133 | 439,623 | (36,490 | ) | (8.3 | )% | ||||||||
Other |
5,462 | 8,132 | (2,670 | ) | (32.8 | )% | ||||||||
|
$ | 408,595 | $ | 447,755 | $ | (39,160 | ) | (8.7 | )% | |||||
The decrease in local services revenues in 2009 was caused by the decline in switched access lines. The decline in switched access lines from 2008 to 2009 was caused by the same factors discussed previously for the decline from 2009 to 2010.
36
For 2009, network access revenue decreased compared to 2008. The decrease was related to declines in carrier and end user access revenues with the fewer switched access lines served as discussed above for local services revenue.
Long distance revenue was comparable to the same period in the prior year despite the year-over-year reduction in long-distance lines. Revenue assurance initiatives and systems improvements implemented at the end of 2008 resulted in more accurate and timely rating of long distance usage during 2009.
HSI and other Internet revenues was comparable to 2008 as total HSI subscriber counts remained relatively unchanged.
The decrease in other services and sales was primarily related to a substantial decline in sales and installations of customer premise equipment as our customers reduced investments in new communications equipment in response to the overall economic downturn in 2009.
Other revenues, primarily consisting of revenues generated from our wireless operation, decreased as we focused our marketing efforts on other segments of our business and revisited our wireless business strategy in 2009. We entered into a new wireless arrangement in the third quarter of 2009, improving our access to handsets and the overall financial terms of the arrangement. We had approximately 8,400 and 11,700 external wireless subscribers as of December 31, 2009 and 2008, respectively.
Operating Costs and Expenses
We are continuing to incur certain expenses in our efforts to become a stand-alone provider of telecommunication services as well as certain costs associated with the realignment of our management workforce. In addition, the Company continues to incur costs related to improvements to the functionality of certain IT systems as well as manual work around efforts. These expenses, referred to as contingency costs, represent additional amounts paid to external vendors to maintain acceptable operating performance until certain system improvements can be completed. The major components of such expenses incurred for the years ended December 31, 2010, 2009 and 2008 are summarized as follows (dollars in thousands):
| |
Combined | Successor | Predecessor | |||||||||||||
|---|---|---|---|---|---|---|---|---|---|---|---|---|---|---|---|---|
| |
For the Year Ended December 31, 2010 |
|
|
For the Year Ended December 31, |
||||||||||||
| |
Period from November 1 to December 31 2010 |
Period from January 1 to October 31, 2010 |
||||||||||||||
| |
2009 | 2008 | ||||||||||||||
Employee separation and relocation costs |
$ | — | $ | — | $ | — | $ | — | $ | 3,506 | ||||||
Pension non periodic costs and gains |
— | — | — | 4,558 | ||||||||||||
Transition management team |
— | — | — | 2,689 | ||||||||||||
Executive team transition |
— | — | 2,762 | 2,762 | ||||||||||||
Contingency contracted services |
2,503 | 482 | 2,021 | 4,061 | 6,800 | |||||||||||
Other |
387 | 17 | 370 | 1,558 | 2,105 | |||||||||||
37
2010 compared to 2009
The following table summarizes our costs and expenses for 2010 compared to the costs and expenses for 2009 (dollars in thousands):
| |
Combined | Successor | Predecessor | |
|
||||||||||||||
|---|---|---|---|---|---|---|---|---|---|---|---|---|---|---|---|---|---|---|---|
| |
For the Year Ended December 31, 2010 |
|
|
For the Year Ended December 31, 2009 |
|
|
|||||||||||||
| |
Period from November 1 to December 31, 2010 |
Period from January 1 to October 31, 2010 |
Year-over-Year Change | ||||||||||||||||
| |
Amount | Percentage | |||||||||||||||||
Cost of revenues (exclusive of depreciation and amortization) |
$ | 162,231 | $ | 27,117 | $ | 135,114 | $ | 158,196 | $ | 4,035 | 2.6 | % | |||||||
Selling, general and administrative expenses |
127,751 | 21,938 | 105,813 | 142,817 | (15,066 | ) | (10.5 | )% | |||||||||||
Depreciation and amortization |
146,384 | 9,723 | 136,661 | 164,376 | (17,992 | ) | (10.9 | )% | |||||||||||
|
$ | 436,366 | $ | 58,778 | $ | 377,588 | $ | 465,389 | $ | (29,023 | ) | (6.2 | )% | ||||||
Our total headcount as of December 31, 2010 was 1,431 compared to 1,450 as of December 31, 2009. Employee related costs are included in both cost of revenues and selling, general and administrative expenses.
Cost of revenues consists of costs we incur to provide our products and services including those for operating and maintaining our networks, installing and maintaining customer premise equipment, and cost of goods sold directly associated with various products. The increase was because of an increase in customer premise equipment costs of $8.9 million as a result of increased customer premise equipment revenues offset by a decline in long distance costs, wireless costs and reciprocal compensation of $4.7 million with better management of the related connection agreements with other carriers.
Selling, general and administrative expenses include costs related to sales and marketing, customer service, information systems and other administrative functions. The decrease was because of more favorable rates on information technology outsourcing for a benefit of $8.1 million, a decline in bad debt costs with improved collection efforts of $3.4 million and a decline of $3.4 million in certain wage related transition costs.
Depreciation and amortization decreased because of the new lower basis assigned to our long-lived assets in fresh-start accounting.
38
2009 compared to 2008
The following table summarizes our costs and expense for the year ended December 31, 2009 compared to the year ended December 31, 2008 (dollars in thousands).
| |
Predecessor | |
|
||||||||||
|---|---|---|---|---|---|---|---|---|---|---|---|---|---|
| |
For the Year Ended December 31, |
Change | |||||||||||
| |
2009 | 2008 | Amount | Percentage | |||||||||
Cost of revenues (exclusive of depreciation and amortization) |
$ | 158,196 | $ | 171,929 | $ | (13,733 | ) | (8.0 | )% | ||||
Selling, general and administrative expenses |
142,817 | 165,832 | (23,015 | ) | (13.9 | )% | |||||||
Depreciation and amortization |
164,376 | 160,278 | 4,098 | 2.6 | % | ||||||||
Restructuring |
— | 1,138 | (1,138 | ) | (100.0 | )% | |||||||
|
$ | 465,389 | $ | 499,177 | $ | (33,788 | ) | (6.8 | )% | ||||
Our total headcount as of December 31, 2009 was 1,450 compared to 1,444 as of December 31, 2008.
The decrease in cost of services and sales was primarily caused by the decline in costs related to sales and installations of customer premise equipment of $7.4 million and the decline in electricity costs of $6.8 million as a result of reduced rates.
Selling, general and administrative expenses for the year ended December 31, 2009 decreased when compared to the same period in the prior year. In 2008, the Company's Chief Executive Officer along with certain other senior executives resigned and the Board of Directors engaged Zolfo Cooper LLC to provide interim executive management services to the Company. As such, the Company incurred severance costs of $3.0 million for the departing executives and additional expenses for the services received from Zolfo Cooper LLC amounting to $4.6 million. Costs for Zolfo Cooper LLC and severance were not incurred in 2009. The remaining decrease is primarily due to reductions in certain employee benefit costs and our cost reduction efforts including more favorable rates on information technology outsourcing resulting in a benefit of $7.2 million.
Depreciation and amortization increased for the year ended December 31, 2009 compared to the same period in 2008. The increase is because of additional assets placed in service.
We incurred restructuring expenses of $1.1 million in the third quarter of 2008. All of the costs were incurred for professional fees for restructuring advisors.
39
Other Income and (Expense)
The following tables summarize other income (expense) for the years ended December 31, 2010 and 2009 (dollars in thousands).
2010 compared to 2009
| |
Combined | Successor | Predecessor | |
|
||||||||||||||
|---|---|---|---|---|---|---|---|---|---|---|---|---|---|---|---|---|---|---|---|
| |
For the Year Ended December 31, 2010 |
|
|
|
|
|
|||||||||||||
| |
Period from November 1 to December 31, 2010 |
Period from January 1 to October 31, 2010 |
For the Year Ended December 31, 2009 |
Year-over-Year Change | |||||||||||||||
| |
Amount | Percentage | |||||||||||||||||
Interest expense |
$ | (27,727 | ) | $ | (4,329 | ) | $ | (23,398 | ) | $ | (30,089 | ) | $ | 2,362 | (8 | )% | |||
Loss on interest rate swaps |
— | — | — | (3,967 | ) | 3,967 | (100 | )% | |||||||||||
Interest income and other |
90 | 16 | 74 | 136 | (46 | ) | (34 | )% | |||||||||||
|
$ | (27,637 | ) | $ | (4,313 | ) | $ | (23,324 | ) | $ | (33,920 | ) | $ | 6,283 | (19 | )% | |||
Interest expense decreased for 2010 compared to 2009 because of the elimination of debt issue cost amortization as such costs were written off in December 2009.
In the first quarter of 2009, as we negotiated the terms of our restructuring with our lenders, we concluded the notional amount being hedged in our hedge effectiveness documentation was greater than the expected amount of debt outstanding during the remaining term of the original hedges because of an agreed upon reduction in the interest payments. A loss of $4.0 million was recognized in the first quarter of 2009 for the additional amount of ineffectiveness on our interest rate swaps.
2009 compared to 2008
The following tables summarize other income (expense) for the years ended December 31, 2009 and 2008 (dollars in thousands).
| |
Predecessor | |
|
||||||||||
|---|---|---|---|---|---|---|---|---|---|---|---|---|---|
| |
For the Year Ended December 31, |
Change | |||||||||||
| |
2009 | 2008 | Amount | Percentage | |||||||||
Interest expense |
$ | (30,089 | ) | $ | (89,467 | ) | $ | 59,378 | (66 | )% | |||
Loss on early extinguishment of debt |
— | (3,456 | ) | 3,456 | (100 | )% | |||||||
Loss on interest rate swaps |
(3,967 | ) | (8,875 | ) | 4,908 | (55 | )% | ||||||
Interest income and other |
136 | 1,484 | (1,348 | ) | (91 | )% | |||||||
|
$ | (33,920 | ) | $ | (100,314 | ) | $ | 66,394 | (66 | )% | |||
Interest expense decreased primarily because we were no longer paying or accruing interest on unsecured debt in conjunction with the Chapter 11 proceeding.
In January 2008, we repaid $211.0 million of Tranche C term loan using proceeds from the sale of the directories publishing segment. In addition, the amount of the revolver availability decreased from $200.0 million at December 31, 2007 to $90.0 million at September 30, 2008. As a result of the repayment of debt and reduction in the availability on the revolving credit facility, we expensed deferred financing costs resulting in a loss on early extinguishment of debt of $3.5 million for the year ended December 31, 2008.
In the first quarter of 2009, as we negotiated the terms of our restructuring with our lenders, we concluded the notional amount being hedged in our hedge effectiveness documentation was greater
40
than the expected amount of debt outstanding during the remaining term of the original hedges because of an agreed upon reduction in the interest payments. A loss of $4.0 million was recognized in the first quarter of 2009 for the additional amount of ineffectiveness on our interest rate swaps.
Because of the capital restructuring effort which we began in the third quarter of 2008, we concluded it is no longer probable but only reasonably possible that we would continue to pay the variable-rate interest specified in our hedge effectiveness documentation. Hence, beginning in the third quarter of 2008, changes in the value of the hedges were recognized in the consolidated statements of operations resulting in a loss in 2008 for $8.9 million.
Reorganization Items
Reorganization items represent amounts incurred as a direct result of the Company's Chapter 11 filing and are presented separately in our consolidated statements of operations. Such (income) and expense items consist of the following (dollars in thousands):
| |
Combined | Successor | Predecessor | |||||||||||||
|---|---|---|---|---|---|---|---|---|---|---|---|---|---|---|---|---|
| |
For the Year Ended December 31, 2010 |
Period from November 1 to December 31, 2010 |
Period from January 1 to October 31, 2010 |
For the Year Ended December 31, 2009 |
For the Year Ended December 31, 2008 |
|||||||||||
Professional fees |
$ | 11,125 | $ | 539 | $ | 10,586 | $ | 33,904 | $ | 7,872 | ||||||
Cancellation of liability |
— | — | — | (733 | ) | — | ||||||||||
Effects of the plan of reorganization |
(708,590 | ) | — | (708,590 | ) | — | — | |||||||||
Fresh-start valuation of assets and liabilities |
445,796 | — | 445,796 | — | — | |||||||||||
Expense deferred financing costs |
— | — | — | 9,870 | — | |||||||||||
Other |
534 | — | 534 | (36 | ) | (5 | ) | |||||||||
|
$ | (251,135 | ) | $ | 539 | $ | (251,674 | ) | $ | 43,005 | $ | 7,867 | ||||
The implementation of the plan of reorganization resulted in income of $708.6 million. This reflects the discharge of prepetition liabilities in accordance with the plan of reorganization offset by the value of new debt and equity issued in conjunction with the plan.
In conjunction with the adoption of the plan of reorganization, we adopted fresh-start reporting resulting in changes to carrying value of assets and liabilities to reflect fair values. The loss recorded from the adoption of fresh-start amounted to $445.8 million.
Income Tax Benefit
The income tax benefit differs from amounts determined by applying the statutory federal income tax rate of 34% to the loss before income taxes primarily because of changes in the valuation allowance established for the recovery of deferred income tax assets.
A valuation allowance has been provided at December 31, 2010 and 2009 for our deferred tax assets because of the uncertainty as to the realization of such assets. We will continue to assess the recoverability of deferred tax assets and the related valuation allowance. To the extent that we generate taxable income in future years and it is determined that such valuation allowance is no longer required, the tax benefit of the remaining deferred tax assets will be recognized at such time.
41
Liquidity and Capital Resources
As of December 31, 2010, we had cash of $81.6 million. From an ongoing operating perspective, our cash requirements going into 2011 will consist of supporting the development and introduction of new products, capital expenditure projects, pension funding obligations and other changes in working capital. A combination of cash-on-hand and cash generated from operating activities will be used to fund the operating activities of the Company.
We have continued to take actions to conserve cash and improve liquidity. Actions have also been taken to generate further operating efficiencies and focus on expense management. In order to reduce our cash usage we will continue to execute our cash management program.
We have taken a number of other actions to improve operating results, including efforts to simplify product offerings, improve our customer service experience and increase our revenue enhancement activities. There can be no assurance that these additional actions will result in improved overall cash flow. We continue to have sizable retirement obligations for our existing employee base. Sustained declines in the value of pension trust assets and relatively high levels of pension lump sum benefit payments will increase the magnitude of future plan contributions.
Agreements with the Hawaii Public Utilities Commission and the debt agreements of Hawaiian Telcom Communications, Inc. limit the ability of our subsidiaries to pay dividends to the parent company and restrict the net assets of all of our subsidiaries. Generally, this prohibits us from currently paying dividends to our shareholders. As the parent company has no operations, debt or other obligations, this restriction has no other immediate impact on our operations.
Cash Flows
Our primary source of funds continues to be cash generated from operations. We use the net cash generated from operations to fund network expansion and modernization. We expect that our capital spending requirements will continue to be financed through internally generated funds. We also expect to use cash generated in future periods for debt service. Additional debt or equity financing may be needed to fund additional development activities or to maintain our capital structure to ensure financial flexibility.
Net cash provided by operations amounted to $12.9 million for the period from November 1 to December 31, 2010. Net cash provided by operations amounted to $61.8 million for 2010 on a combined basis and $95.1 million for 2009 for the Predecessor. Our cash flows from operations are impacted by our results of operations, changes in working capital and payments on certain long-term liabilities such as pension obligations. Our results of operations were discussed above. The decrease in cash provided by operating activities is primarily because of pension plan contributions of $23.9 million in 2010 as well as a payment of certain liabilities which could not be paid until our emergence from Chapter 11. We typically generate positive cash flow from operations and expect to do so in 2011. We anticipate using the cash generated by operations for capital expenditures and, in future periods, for required debt payments.
Cash used in investing activities was comprised of $21.2 million of capital expenditures for the period from November 1 to December 31, 2010 and $57.7 million for the period January 1 to October 31, 2010. The level of capital expenditures is expected to be comparable in 2011 as we invest in systems to support new product introductions and transform our network to enable next-generation technologies.
Cash provided by financing activities for the period from January 1 to October 31, 2010 was from the receipt of proceeds of $2.1 million from the sale of stock.
42
Outstanding Debt and Financing Arrangements
As of December 31, 2010, we had outstanding $300.0 million in aggregate long-term debt. Our bank credit facilities contain various negative and affirmative covenants that restrict, among other things, incurrence of additional indebtedness, payment of dividends, redemptions of stock, other distributions to shareholders and sales of assets. In addition, there are financial covenants which have the following metrics as of December 31, 2010: leverage with maximum allowed ratio of 3.20:1 of indebtedness to earnings before interest, taxes, depreciation and amortization, as defined; minimum liquidity of cash and available unused revolver borrowing no less than $35.0 million; and a maximum level of annual capital expenditures of $96.2 million. We were in compliance with these covenants as of December 31, 2010.
Under the Plan of Reorganization, our obligations under our senior credit facilities and the indentures governing our notes were cancelled, and we entered into a new term loan in the amount of $300.0 million. The new term loan has a maturity date of 2015. We do not expect to generate the necessary cash flow from operations to repay the facility in its entirety by the maturity date and repayment is dependent on our ability to refinance the credit facility at reasonable terms. The ability to refinance the indebtedness at reasonable terms before maturity cannot be assured.
Contractual Obligations
The following table sets forth our long-term debt and contractual obligations for the next several years. Pension funding obligations are based on known funding. Additional obligations are expected in future periods. Obligations are as follows (dollars in thousands):
| |
2011 | 2012 | 2013 | 2014 | 2015 | 2016 and Thereafter |
Total | ||||||||||||||||
|---|---|---|---|---|---|---|---|---|---|---|---|---|---|---|---|---|---|---|---|---|---|---|---|
Term loan facility |
— | — | — | — | 300,000 | — | 300,000 | ||||||||||||||||
Debt interest(1) |
27,000 | 27,000 | 27,000 | 27,000 | 22,500 | — | 130,500 | ||||||||||||||||
Pension funding obligations |
17,024 | — | — | — | — | — | 17,024 | ||||||||||||||||
Operating leases |
1,667 | 1,314 | 895 | 897 | 837 | 8,754 | 14,364 | ||||||||||||||||
Supplier contracts |
14,699 | 12,810 | 12,850 | 5,085 | 1,765 | — | 47,209 | ||||||||||||||||
Total |
$ | 60,390 | $ | 41,124 | $ | 40,745 | $ | 32,982 | $ | 325,102 | $ | 8,754 | $ | 509,097 | |||||||||
- (1)
- Computed
based on debt outstanding and the interest rate in effect at December 31, 2010 for the contractual term.
We do not maintain any off balance sheet financing or other arrangements.
Critical Accounting Policies and Estimates
The preparation of consolidated financial statements in conformity with accounting principles generally accepted in the United States of America requires management to make estimates and assumptions that affect amounts reported in consolidated financial statements. Changes in these estimates and assumptions are considered reasonably possible and may have a material effect on the consolidated financial statements and thus actual results could differ from the amounts reported and disclosed herein. The following is a summary of certain policies considered critical by management.
Fresh-Start Reporting
We adopted fresh-start reporting as of October 31, 2010. Fresh-start reporting was required because holders of existing voting stock before filing and confirmation of the plan of reorganization received less than 50% of the voting shares of the emerging entity and our reorganization value was
43
less than our post petition liabilities and allowed claims. Fresh-start required us to allocate our reorganization value to our assets and liabilities in a manner similar to which is required for purchase business combinations. Under the provisions of fresh-start accounting, a new entity has been deemed created for financial reporting purposes.
We allocated the reorganization value to our tangible assets and liabilities and identifiable intangible assets. The allocation of the reorganization value requires management to make significant estimates in determining the fair value of Predecessor assets and liabilities as well as with respect to new intangible assets. These estimates are based on historical experience and information obtained from management. These estimates can include, but are not limited to, the cash flows that an asset is expected to generate in the future and the appropriate weighted average cost of capital. These estimates are inherently uncertain and unpredictable. In addition, unanticipated events and circumstances may occur which may affect the accuracy and validity of such estimates.
The fair value of property, plant and equipment was based on the highest and best use of specific properties. To determine fair value we considered and applied either the market approach or cost approach depending on the nature of the asset and the availability of information. The market or sales comparison approach relies upon recent sales or offerings of similar assets on the market to arrive at a probable selling price. Certain adjustments were made to reconcile differences in attributes between the comparable sales and the appraised assets. The cost approach considers the amount required to construct or purchase a new asset of equal utility at current prices, with adjustments in value for physical deterioration, functional obsolescence and economic obsolescence.
The fair value of intangible assets including the brand name and customer relationship intangibles was determined based on discounted cash flows from projections of results for our operations.
Long-term debt was based on the debt issued in conjunction with the plan of reorganization. This was assumed to approximate fair value given that the terms of the debt were negotiated recently between us and our lenders in conjunction with development of the plan of reorganization. The employee benefit obligations were recognized based on the funded status of the benefit plans.
Indefinite-Lived Intangible Assets
Intangible assets not subject to amortization are tested for impairment annually in the fourth quarter, or when events or changes in circumstances indicate that the asset might be impaired. The impairment test consists of a comparison of the fair value of the intangible asset with its carrying value. If the carrying value of an indefinite-lived intangible asset exceeds its fair value, an impairment loss is recognized in an amount equal to that excess. Fair value is an estimate based on the present value of an expected range of future cash flows. The expected range of future cash flows is based on internal forecasts developed utilizing management's knowledge of the business and the anticipated effects of market forces. The use of different assumptions or estimates of future cash flows could produce different impairment amounts (or none at all). Significant assumptions which are reasonably possible of changing in future periods relate to projection of future cash flows generated by the indefinite-lived intangible assets which are dependent on projections of company-wide revenues in future periods.
Impairment of Long-Lived Assets and Definite-Lived Intangibles
We assess the recoverability of long-lived assets, including property, plant and equipment and definite-lived intangible assets, whenever events or changes in circumstances indicate that the carrying amount of an asset may not be recoverable. In such cases, if the sum of the expected cash flows, undiscounted and without interest, resulting from use of the asset is less than the carrying amount, an impairment loss is recognized based on the difference between the carrying amount and the fair value of the assets. When determining future cash flow estimates, we consider historical operating results, as adjusted to reflect current and anticipated operating conditions. Estimating future cash flows requires
44
significant judgment by us in such areas as future economic conditions, industry specific conditions and necessary capital expenditures. The use of different assumptions or estimates for future cash flows could produce different impairment amounts (or none at all) for long-lived assets, including identifiable intangible assets subject to amortization. Significant assumptions which are reasonably possible of changing in future periods relate to projection of future cash flows generated by the long-lived assets which are dependent on projections of company-wide profitability and capital expenditures for maintaining our network in future periods. In addition, estimates of the cash generating useful lives are also critical to such evaluations.
Revenue Recognition
We recognize revenue when evidence of an arrangement exists, the earnings process is complete and collectability is reasonably assured. We recognize service revenues based upon usage of our local exchange network and facilities and contract fees. In general, fixed fees for local telephone, Internet access and certain other services are billed one month in advance and recognized the following month when earned. Revenue from other products that are not fixed fee or that exceed contracted amounts is recognized when such services are provided. Long distance revenues are generally billed in arrears and recognized as service is provided.
Allowance for Doubtful Accounts
Our allowance for doubtful accounts reflects reserves for customer receivables to reduce receivables to amounts expected to be collected. In estimating uncollectible amounts, management considers factors such as current overall economic conditions, industry-specific economic conditions, historical customer performance and anticipated customer performance. While we believe our process effectively addresses our exposure for doubtful accounts, changes in economic, industry or specific customer conditions may require adjustment to the allowance for doubtful accounts recognized by us.
Income Taxes
Management calculates the income tax provision, current and deferred income taxes along with the valuation allowance based upon various complex estimates and interpretations of income tax laws and regulations. Deferred tax assets are reduced by a valuation allowance to the extent that it is more likely than not that they will not be realized. The most significant assumption in this process are projections of future income which are reasonably possible of changing in future periods. To the extent we begin to generate taxable income in future years and it is determined the valuation allowance is no longer required, the tax benefit for the remaining deferred tax assets will be recognized at such time.
Employee-Related Benefits
We incur certain employee-related costs associated with pensions and post-retirement health care benefits. In order to measure the expense associated with these employee-related benefits, management must make a variety of estimates, including discount rates used to measure the present value of certain liabilities, assumed rates of return on assets set aside to fund these expenses, compensation increases, employee turnover rates, anticipated mortality rates and anticipated healthcare costs. The estimates used by management are based on our historical experience, as well as current facts and circumstances. We use third-party specialists to assist management in appropriately measuring the expenses associated with these employee-related benefits. Different estimates could result in our recognizing different amounts of expense over different time periods.
The discount rate used for determining the year-end benefit plan obligation was generally calculated using a weighting of expected benefit payments and rates associated with high-quality U.S.
45
corporate bonds for each year of expected payment to derive a single estimated rate at which the benefits could be effectively settled.
The estimated return on plan assets was based on historical trends combined with long-term expectations. In selecting the rate of return on plan assets for purposes of determining net periodic benefit cost, we considered economic forecasts for the types of investments held by the plans (primarily equity and fixed income investments), and the plans' asset allocations. While primary emphasis was on the economic forecasts of long-term returns, consideration of given to the past performance of the plans' assets. The assumption is based on consideration of all inputs, with a focus on long-term trends to avoid short-term market influences. Assumptions are not changed unless structural trends in the underlying economy are identified, our asset strategy changes, or there are significant changes in other inputs. The method for selecting the expected return on plan assets did not change from prior periods.
Item 7A. Quantitative and Qualitative Disclosures About Market Risk
As of December 31, 2010, our floating rate obligations consisted of $300.0 million of debt outstanding under our term loan facility. Accordingly, our earnings and cash flow are affected by changes in interest rates. Based on our borrowings at December 31, 2010 and assuming a 1.0 percentage point increase in the average interest rate under these borrowings, we estimate that our annual interest expense would increase by approximately $3.0 million.
46
Item 8. Financial Statements and Supplementary Data
Index to Financial Statements
47
Report of Independent Registered Public Accounting Firm
To
the Stockholders and Board of Directors of
Hawaiian Telcom Holdco, Inc.
Honolulu, Hawaii
We have audited the accompanying consolidated balance sheets of Hawaiian Telcom Holdco, Inc. and subsidiaries (the "Company") as of December 31, 2010 (Successor Company balance sheet) and December 31, 2009 (Predecessor Company balance sheet), and the related consolidated statements of operations, changes in stockholders' equity (deficiency), and cash flows for the two months ended December 31, 2010 (Successor Company operations) and for the ten months ended October 31, 2010 and for each of the two years in the period ended December 31, 2009 (Predecessor Company operations). These consolidated financial statements are the responsibility of the Company's management. Our responsibility is to express an opinion on these financial statements based on our audits.
We conducted our audits in accordance with the standards of the Public Company Accounting Oversight Board (United States). Those standards require that we plan and perform the audit to obtain reasonable assurance about whether the financial statements are free of material misstatement. The Company is not required to have, nor were we engaged to perform, an audit of its internal control over financial reporting. Our audits included consideration of internal control over financial reporting as a basis for designing audit procedures that are appropriate in the circumstances, but not for the purpose of expressing an opinion on the effectiveness of the Company's internal control over financial reporting. Accordingly, we express no such opinion. An audit also includes examining, on a test basis, evidence supporting the amounts and disclosures in the financial statements, assessing the accounting principles used and significant estimates made by management, as well as evaluating the overall financial statement presentation. We believe that our audits provide a reasonable basis for our opinion.
As discussed in Note 2 to the consolidated financial statements, on December 30, 2009, the Bankruptcy Court entered an order confirming the plan of reorganization which became effective after the close of business on October 28, 2010. Accordingly, the accompanying financial statements have been prepared in conformity with Accounting Standards Codification 852, Reorganizations, for the Successor Company as a new entity with assets, liabilities, and a capital structure having carrying values not comparable with prior periods as described in Note 4 to the consolidated financial statements.
In our opinion, the Successor Company consolidated financial statements present fairly, in all material respects, the financial position of Hawaiian Telcom Holdco, Inc. and subsidiaries as of December 31, 2010 and the results of its operations and its cash flows for the two months ended December 31, 2010 in conformity with accounting principles generally accepted in the United States of America. Further, in our opinion, the Predecessor Company consolidated financial statements referred to above present fairly, in all material respects, the financial position of the Predecessor Company as of December 31, 2009 and the results of its operations and its cash flows for the ten months ended October 31, 2010, and for each of the two years in the period ended December 31, 2009, in conformity with accounting principles generally accepted in the United States of America.
/s/ DELOITTE & TOUCHE LLP
Honolulu,
Hawaii
March 25, 2011
48
Hawaiian Telcom Holdco, Inc.
Consolidated Statements of Operations
(Dollars in thousands, except per share amounts)
| |
|
Predecessor | |||||||||||||
|---|---|---|---|---|---|---|---|---|---|---|---|---|---|---|---|
| |
Successor | ||||||||||||||
| |
|
For the Year Ended December 31, |
|||||||||||||
| |
Period from November 1 to December 31, 2010 |
Period from January 1 to October 31, 2010 |
|||||||||||||
| |
2009 | 2008 | |||||||||||||
Operating revenues |
$ | 66,759 | $ | 334,686 | $ | 408,595 | $ | 447,755 | |||||||
Operating expenses: |
|||||||||||||||
Cost of revenues (exclusive of depreciation and amortization) |
27,117 | 135,114 | 158,196 | 171,929 | |||||||||||
Selling, general and administrative |
21,938 | 105,813 | 142,817 | 165,832 | |||||||||||
Depreciation and amortization |
9,723 | 136,661 | 164,376 | 160,278 | |||||||||||
Restructuring |
— | — | — | 1,138 | |||||||||||
Total operating expenses |
58,778 | 377,588 | 465,389 | 499,177 | |||||||||||
Operating income (loss) |
7,981 | (42,902 | ) | (56,794 | ) | (51,422 | ) | ||||||||
Other income (expense): |
|||||||||||||||
Interest expense (contractual interest was $62,642 for the period from January 1 to October 31, 2010 and $79,667 and $93,787 for the years ended December 31, 2009 and 2008, respectively) |
(4,329 | ) | (23,398 | ) | (30,089 | ) | (89,467 | ) | |||||||
Loss on early extinguishment of debt |
— | — | — | (3,456 | ) | ||||||||||
Loss on interest rate swaps |
— | — | (3,967 | ) | (8,875 | ) | |||||||||
Interest income and other |
16 | 74 | 136 | 1,484 | |||||||||||
Total other expense |
(4,313 | ) | (23,324 | ) | (33,920 | ) | (100,314 | ) | |||||||
Income (loss) before reorganization items and income tax benefit |
3,668 | (66,226 | ) | (90,714 | ) | (151,736 | ) | ||||||||
Reorganization items—(income) expense |
539 | (251,674 | ) | 43,005 | 7,867 | ||||||||||
Income (loss) before income tax benefit |
3,129 | 185,448 | (133,719 | ) | (159,603 | ) | |||||||||
Income tax benefit |
— | (346 | ) | (2,985 | ) | (956 | ) | ||||||||
Net income (loss) |
$ | 3,129 | $ | 185,794 | $ | (130,734 | ) | $ | (158,647 | ) | |||||
Net income (loss) per common share— |
|||||||||||||||
Basic |
$ | 0.31 | $ | 434.10 | $ | (305.45 | ) | $ | (370.67 | ) | |||||
Diluted |
$ | 0.30 | $ | 434.10 | $ | (305.45 | ) | $ | (370.67 | ) | |||||
Weighted average shares used to compute |
|||||||||||||||
net loss per common share— |
|||||||||||||||
Basic |
10,135,063 | 428,000 | 428,000 | 428,000 | |||||||||||
Diluted |
10,302,542 | 428,000 | 428,000 | 428,000 | |||||||||||
See accompanying notes to consolidated financial statements.
49
Hawaiian Telcom Holdco, Inc.
Consolidated Balance Sheets
(Dollars in thousands, except per share information)
| |
Successor | Predecessor | ||||||||
|---|---|---|---|---|---|---|---|---|---|---|
| |
December 31, 2010 | December 31, 2009 | ||||||||
Assets |
||||||||||
Current assets |
||||||||||
Cash and cash equivalents |
$ | 81,647 | $ | 96,550 | ||||||
Receivables, net |
39,222 | 47,655 | ||||||||
Material and supplies |
8,431 | 3,871 | ||||||||
Prepaid expenses |
5,707 | 4,691 | ||||||||
Other current assets |
4,566 | 8,326 | ||||||||
Total current assets |
139,573 | 161,093 | ||||||||
Property, plant and equipment, net |
459,781 | 711,265 | ||||||||
Deferred financing and other assets |
3,367 | 9,456 | ||||||||
Intangible assets, net |
43,315 | 301,863 | ||||||||
Total assets |
$ | 646,036 | $ | 1,183,677 | ||||||
Liabilities and Stockholders' Equity (Deficiency) |
||||||||||
Liabilities not subject to compromise |
||||||||||
Current liabilities |
||||||||||
Accounts payable |
$ | 24,162 | $ | 30,972 | ||||||
Accrued expenses |
28,752 | 27,950 | ||||||||
Advance billings and customer deposits |
14,948 | 13,954 | ||||||||
Other current liabilities |
2,810 | 5,075 | ||||||||
Total current liabilities |
70,672 | 77,951 | ||||||||
Long-term debt |
300,000 | — | ||||||||
Employee benefit obligations |
94,453 | 113,748 | ||||||||
Other liabilities |
2,119 | 4,658 | ||||||||
Total liabilities not subject to compromise |
467,244 | 196,357 | ||||||||
Liabilities subject to compromise |
— | 1,167,584 | ||||||||
Total liabilities |
467,244 | 1,363,941 | ||||||||
Commitments and contingencies (Note 17) |
||||||||||
Stockholders' equity (deficiency) |
||||||||||
New common stock, par value of $0.01 per share, 245,000,000 shares authorized and 10,135,063 shares issued and outstanding |
101 | — | ||||||||
Old common stock, par value of $0.01 per share, 480,000 shares authorized and 428,000 shares issued and cancelled |
— | 4 | ||||||||
Additional paid-in capital |
162,169 | 428,993 | ||||||||
Accumulated other comprehensive income (loss) |
13,393 | (33,191 | ) | |||||||
Retained earnings (accumulated deficit) |
3,129 | (576,070 | ) | |||||||
Total stockholders' equity (deficiency) |
178,792 | (180,264 | ) | |||||||
Total liabilities and stockholders' equity (deficiency) |
$ | 646,036 | $ | 1,183,677 | ||||||
See accompanying notes to consolidated financial statements.
50
Hawaiian Telcom Holdco, Inc.
Consolidated Statements of Cash Flows
(Dollars in thousands)
| |
|
Predecessor | |||||||||||||
|---|---|---|---|---|---|---|---|---|---|---|---|---|---|---|---|
| |
Successor | ||||||||||||||
| |
|
For the Year Ended December 31, |
|||||||||||||
| |
Period from November 1 to December 31, 2010 |
Period from January 1 to October 31, 2010 |
|||||||||||||
| |
2009 | 2008 | |||||||||||||
Cash flows from operating activities: |
|||||||||||||||
Net income (loss) |
$ | 3,129 | $ | 185,794 | $ | (130,734 | ) | $ | (158,647 | ) | |||||
Adjustments to reconcile net income (loss) to net cash provided by operating activities |
|||||||||||||||
Depreciation and amortization |
9,723 | 136,661 | 164,376 | 160,278 | |||||||||||
Employee retirement benefits |
1,463 | (13,366 | ) | 11,244 | 12,872 | ||||||||||
Provision for uncollectibles |
674 | 4,851 | 8,898 | 9,414 | |||||||||||
Loss on early extinguishment of debt |
— | — | — | 3,456 | |||||||||||
Loss on interest rate swaps |
— | — | 3,967 | 8,875 | |||||||||||
Interest cost added to loan principal |
— | 11,573 | 11,297 | — | |||||||||||
Reorganization items |
539 | (251,674 | ) | 43,005 | 7,867 | ||||||||||
Changes in operating assets and liabilities: |
|||||||||||||||
Receivables |
840 | (2,961 | ) | 2,244 | (2,819 | ) | |||||||||
Material and supplies |
(2,936 | ) | (1,624 | ) | 2,391 | 338 | |||||||||
Prepaid expenses and other current assets |
4,626 | (4,925 | ) | (3,462 | ) | (1,322 | ) | ||||||||
Accounts payable and accrued expenses |
(1,615 | ) | (1,158 | ) | 5,964 | 32,547 | |||||||||
Income taxes payable |
— | — | — | (1,150 | ) | ||||||||||
Advance billings and customer deposits |
(714 | ) | 1,708 | (1,363 | ) | (179 | ) | ||||||||
Other current liabilities |
174 | 413 | 72 | (9,049 | ) | ||||||||||
Other, net |
83 | 1,475 | 2,574 | 5,450 | |||||||||||
Net cash provided by operating activities before reorganization items |
15,986 | 66,767 | 120,473 | 67,931 | |||||||||||
Operating cash flows used by reorganization items |
(3,065 | ) | (17,858 | ) | (25,361 | ) | (6,267 | ) | |||||||
Net cash provided by operating activities |
12,921 | 48,909 | 95,112 | 61,664 | |||||||||||
Cash flows from investing activities: |
|||||||||||||||
Capital expenditures |
(21,235 | ) | (57,659 | ) | (87,537 | ) | (73,250 | ) | |||||||
Transfer of segregated cash |
— | — | — | 271,464 | |||||||||||
Proceeds from sale of investments |
— | — | — | 1,200 | |||||||||||
Net cash provided by (used in) investing activities |
(21,235 | ) | (57,659 | ) | (87,537 | ) | 199,414 | ||||||||
Cash flows from financing activities: |
|||||||||||||||
Proceeds from stock issuance |
— | 2,161 | — | — | |||||||||||
Proceeds from issuance of debt |
— | — | — | 86,800 | |||||||||||
Repayment of debt |
— | — | — | (265,000 | ) | ||||||||||
Other |
— | — | — | (2,675 | ) | ||||||||||
Net cash provided by (used in) financing activities |
— | 2,161 | — | (180,875 | ) | ||||||||||
Net change in cash and cash equivalents |
(8,314 | ) | (6,589 | ) | 7,575 | 80,203 | |||||||||
Cash and cash equivalents, beginning of period |
89,961 | 96,550 | 88,975 | 8,772 | |||||||||||
Cash and cash equivalents, end of period |
$ | 81,647 | $ | 89,961 | $ | 96,550 | $ | 88,975 | |||||||
See accompanying notes to consolidated financial statements.
51
Hawaiian Telcom Holdco, Inc.
Consolidated Statements of Changes in Stockholders' Equity (Deficiency)
(Dollars in thousands, except share
information)
| |
Common Stock | |
Accumulated Other Comprehensive Income (Loss) |
Retained Earnings (Accumulated Deficit) |
Total Stockholders' Equity (Deficiency) |
||||||||||||||||
|---|---|---|---|---|---|---|---|---|---|---|---|---|---|---|---|---|---|---|---|---|---|
| |
Additional Paid-In Capital |
||||||||||||||||||||
| |
Shares | Amount | |||||||||||||||||||
Balance, January 1, 2008 (Predecessor) |
428,000 | $ | 4 | $ | 428,561 | $ | (6,696 | ) | $ | (286,689 | ) | $ | 135,180 | ||||||||
Stock based compensation |
— | — | 352 | — | — | 352 | |||||||||||||||
For the year ended December 31, 2008: |
|||||||||||||||||||||
Net loss |
— | — | — | — | (158,647 | ) | (158,647 | ) | |||||||||||||
Other comprehensive loss— |
|||||||||||||||||||||
Gain on cash flow hedging derivatives |
— | — | — | 866 | — | 866 | |||||||||||||||
Retirement plans loss |
— | — | — | (50,301 | ) | — | (50,301 | ) | |||||||||||||
Unrealized gain on investments |
— | — | — | 34 | — | 34 | |||||||||||||||
Total other comprehensive loss |
(49,401 | ) | |||||||||||||||||||
Comprehensive loss |
(208,048 | ) | |||||||||||||||||||
Balance, December 31, 2008 (Predecessor) |
428,000 | 4 | 428,913 | (56,097 | ) | (445,336 | ) | (72,516 | ) | ||||||||||||
Stock based compensation |
— | — | 80 | — | — | 80 | |||||||||||||||
For the year ended December 31, 2009: |
|||||||||||||||||||||
Net loss |
— | — | — | — | (130,734 | ) | (130,734 | ) | |||||||||||||
Other comprehensive income— |
|||||||||||||||||||||
Gain on cash flow hedging derivatives |
— | — | — | 5,156 | — | 5,156 | |||||||||||||||
Retirement plans gain |
— | — | — | 17,846 | — | 17,846 | |||||||||||||||
Unrealized loss on investments |
— | — | — | (96 | ) | — | (96 | ) | |||||||||||||
Total other comprehensive income |
22,906 | ||||||||||||||||||||
Comprehensive loss |
(107,828 | ) | |||||||||||||||||||
Balance, December 31, 2009 (Predecessor) |
428,000 | 4 | 428,993 | (33,191 | ) | (576,070 | ) | (180,264 | ) | ||||||||||||
Stock based compensation |
— | — | 65 | — | — | 65 | |||||||||||||||
For the period January 1 to October 31, 2010: |
|||||||||||||||||||||
Net income |
— | — | — | — | 185,794 | 185,794 | |||||||||||||||
Other comprehensive loss— |
|||||||||||||||||||||
Retirement plans loss |
— | — | — | (6,017 | ) | — | (6,017 | ) | |||||||||||||
Gain on cash flow hedging derivatives |
— | — | — | 416 | — | 416 | |||||||||||||||
Unrealized gain on investments |
— | — | — | 6 | — | 6 | |||||||||||||||
Total other comprehensive loss |
(5,595 | ) | |||||||||||||||||||
Comprehensive income |
180,199 | ||||||||||||||||||||
Balance, October 31, 2010 (Predecessor) |
428,000 | $ | 4 | $ | 429,058 | $ | (38,786 | ) | $ | (390,276 | ) | $ | — | ||||||||
See accompanying notes to consolidated financial statements.
52
Hawaiian Telcom Holdco, Inc.
Consolidated Statements of Changes in Stockholders' Equity (Deficiency) (Continued)
(Dollars in thousands, except share information)
| |
Common Stock | |
Accumulated Other Comprehensive Income (Loss) |
Retained Earnings (Accumulated Deficit) |
Total Stockholders' Equity (Deficiency) |
||||||||||||||||
|---|---|---|---|---|---|---|---|---|---|---|---|---|---|---|---|---|---|---|---|---|---|
| |
Additional Paid-In Capital |
||||||||||||||||||||
| |
Shares | Amount | |||||||||||||||||||
Balance, October 31, 2010 (Predecessor) |
428,000 | $ | 4 | $ | 429,058 | $ | (38,786 | ) | $ | (390,276 | ) | $ | — | ||||||||
Cancellation of Predecessor common stock |
(428,000 | ) | (4 | ) | 4 | — | — | — | |||||||||||||
Elimination of Predecessor accumulated deficit and accumulated other comprehensive loss |
— | — | (429,062 | ) | 38,786 | 390,276 | — | ||||||||||||||
Issuance of new equity interests in connection with emergence from Chapter 11 |
10,000,000 | 100 | 159,900 | — | — | 160,000 | |||||||||||||||
Sale of common stock |
135,063 | 1 | 2,160 | — | — | 2,161 | |||||||||||||||
Balance, November 1, 2010 (Successor) |
10,135,063 | 101 | 162,060 | — | — | 162,161 | |||||||||||||||
Stock based compensation |
— | — | 109 | — | — | 109 | |||||||||||||||
For the period November 1 to December 31, 2010: |
|||||||||||||||||||||
Net income |
— | — | — | — | 3,129 | 3,129 | |||||||||||||||
Other comprehensive income— |
|||||||||||||||||||||
Retirement plans gain |
— | — | — | 13,409 | — | 13,409 | |||||||||||||||
Unrealized loss on investments |
— | — | — | (16 | ) | — | (16 | ) | |||||||||||||
Total other comprehensive income |
13,393 | ||||||||||||||||||||
Comprehensive income |
16,522 | ||||||||||||||||||||
Balance, December 31, 2010 (Successor) |
10,135,063 | $ | 101 | $ | 162,169 | $ | 13,393 | $ | 3,129 | $ | 178,792 | ||||||||||
See accompanying notes to consolidated financial statements.
53
Hawaiian Telcom Holdco, Inc.
Notes to Consolidated Financial Statements
1. Description of Business
Business Description
Hawaiian Telcom Holdco, Inc. and subsidiaries (the "Company") is the incumbent local exchange carrier for the State of Hawaii with an integrated telecommunications network servicing approximately 441,000 switched access lines as of December 31, 2010. The Company also served approximately 227,000 long distance lines and 100,000 High-Speed Internet (HSI) connections as of that date.
The Company provides a range of voice, data and video communication services to residential and commercial customers. Local telephone service is provided on each island in Hawaii and intraLATA (Local Access Transport Area) toll service is provided among the islands. InterLATA toll services between Hawaii and domestic points within the United States are provided by long-distance carriers, which connect to the Company's local facilities for call origination and termination. Business and residential customers also pay access charges to the Company to connect to the local network to obtain long-distance service. In addition, the Company provides Internet access services for customers located in Hawaii, including both HSI and remote dial-up for residential and business customers; long-distance telecommunications services for interLATA and international toll traffic originating in Hawaii; and customer premise equipment sales and services. The Company offers Hawaiian Telcom® branded wireless services to residential and commercial customers through a leased network. In 2010, the Company began offering customers a digital television service in select areas on a no-fee trial basis and expects to launch this service commercially in 2011.
The communication services the Company provides are subject to regulation by the Public Utilities Commission of the State of Hawaii (HPUC) with respect to intrastate rates and services and other matters, and the State of Hawaii Department of Commerce and Consumer Affairs with respect to digital television. Certain agreements with the HPUC limit the amount of dividends and other distributions the Company may pay as well as place restrictions on certain transactions affecting the operations and capital structure of the Company. The Federal Communication Commission (FCC) regulates rates that the Company charges long-distance carriers and other end-user subscribers for interstate access services and interstate traffic.
As a result of the adoption of fresh-start reporting, the financial statements before and on October 31, 2010 are not comparable to the financial statements for the period after October 31, 2010. References to "Successor" refer to the Company after October 31, 2010 after giving effect to the adoption of fresh-start reporting. References to "Predecessor" refer to the Company prior to and on October 31, 2010. See Note 2 for further details.
Organization
The Company has one direct subsidiary, Hawaiian Telcom Communications, Inc. which has two direct subsidiaries—Hawaiian Telcom, Inc. and Hawaiian Telcom Services Company, Inc. Hawaiian Telcom, Inc. operates the regulated local exchange carrier and Hawaiian Telcom Services Company, Inc. operates all other businesses. Hawaiian Telcom Insurance Company, Incorporated is a captive insurance subsidiary of Hawaiian Telcom, Inc. and, until December 31, 2003, provided auto liability, general liability and worker's compensation insurance to its parent. The captive subsidiary continues to settle claims related to incidents which occurred prior to January 1, 2004. The Company insures current incidents with external carriers.
54
Hawaiian Telcom Holdco, Inc.
Notes to Consolidated Financial Statements (Continued)
2. Chapter 11 Reorganization
On December 1, 2008 (the "Petition Date"), Hawaiian Telcom Holdco, Inc. and its subsidiaries, with the exception of Hawaiian Telcom Insurance Company, Incorporated (the "Non-Debtor"), (collectively the "Debtors") filed voluntary petitions for reorganization under Chapter 11 of Title 11 of the United States Code (the "Bankruptcy Code") in the United States Bankruptcy Court for the District of Delaware. The cases were transferred to the District of Hawaii on December 22, 2008 (the "Bankruptcy Court"). The cases were being jointly administered under Case No. 08-02005. The Debtors continued to operate as "debtors-in-possession" under the jurisdiction of the Bankruptcy Court and orders of the Bankruptcy Court. In general, as debtors-in-possession, the Debtors were authorized under Chapter 11 to continue to operate as an ongoing business but could not engage in transactions outside the ordinary course of business without the prior approval of the Bankruptcy Court.
The Bankruptcy Court had approved various motions for relief designed to allow the Company to continue normal operations. The Bankruptcy Court's orders authorized the Company, among other things, to: (a) use cash collateral; (b) pay prepetition and postpetition employee wages, salaries, benefits and other employee obligations; (c) honor customer service programs; and (d) continue maintenance of existing bank accounts and existing cash management systems.
Subject to certain exceptions in the Bankruptcy Code, the Chapter 11 filings automatically stayed the initiation or continuation of most actions against the Debtors, including most actions to collect prepetition indebtedness or to exercise control over the property of the bankruptcy estates. As a result, absent an order from the Bankruptcy Court, creditors were precluded from collection on prepetition debts and substantially all prepetition liabilities were subject to compromise.
Under the Bankruptcy Code, the Debtors also had the right to assume, assume and assign, or reject certain executory contracts and unexpired leases, subject to the approval of the Bankruptcy Court and certain other conditions. Generally, the assumption of an executory contract or unexpired lease requires the debtor to cure certain existing defaults under the contract, including the payment of accrued but unpaid prepetition liabilities. Rejection of an executory contract or unexpired lease typically is treated as a breach of the contract or lease, immediately prior to the Chapter 11 filing. Subject to certain exceptions, this rejection relieves the debtor from performing its future obligations under that contract but entitles the counterparty to assert a prepetition general unsecured claim for damages. Parties to the executory contracts or unexpired leases rejected by a debtor may file proofs of claim against the debtor's estate for damages.
On June 3, 2009, the Debtors filed a plan of reorganization with the Bankruptcy Court together with the disclosure statement. On August 28, 2009, the Bankruptcy Court approved distribution of the disclosure statement for vote by the prepetition creditors. On November 13, 2009, the judge of the Bankruptcy Court ruled that the plan as presented was approved. The final confirmation order was issued by the Court on December 30, 2009. The plan of reorganization, including the proposed debt and equity structure, was subject to approval of the HPUC and Federal Communications Commission (FCC). Approvals were obtained in September 2010 and relevant appeal periods expired in October 2010.
After satisfying all conditions precedent to emergence under the Plan, the Company emerged from Chapter 11 effective as of October 28, 2010 ("Emergence Date"). On the Emergence Date the Company entered into a revised credit agreement with its former secured lenders for $300.0 million. The new facility is secured by substantially all of the assets of the Company and has customary terms and conditions. See Note 10 for further information on the new term loan.
55
Hawaiian Telcom Holdco, Inc.
Notes to Consolidated Financial Statements (Continued)
2. Chapter 11 Reorganization (Continued)
On the emergence date, all authorized common stock of the Predecessor was cancelled. The secured lenders received 10,000,000 new common stock shares with a par value of $0.01 per share. The Company received gross proceeds of $2.1 million for 135,063 shares of new common stock issued to the participants of a rights offering. In addition 1,400,000 shares of new common stock were reserved for issuance pursuant to the equity incentive plan. Warrants to purchase 1,481,055 shares of new common stock for $14.00 per share were issued to holders of the Predecessor senior floating notes and senior fixed rate notes.
Pursuant to the plan of reorganization, allowed administrative, priority tax, priority non-tax, secured tax and other secured claims will be paid in full in cash. For certain Predecessor contracts that were accepted by the Successor, the Company paid cure amounts for prepetition claims amounting to $6.7 million. All other claims are to be settled for a fraction of the claim for cash not exceeding $0.5 million.
Restructuring
In the third quarter of 2008, the Company began evaluating various capital restructuring alternatives. The Company incurred expenses amounting to $1.1 million related to such efforts. All of the costs were incurred for professional fees for restructuring advisors.
3. Summary of Significant Accounting Policies
The accompanying consolidated financial statements of the Company have been prepared by the Company in accordance with accounting principles generally accepted in the United States of America.
Use of Estimates
The preparation of financial statements in conformity with accounting principles generally accepted in the United States of America requires management to make estimates and assumptions that affect the reported amounts of assets and liabilities and disclosure of contingent assets and liabilities at the date of the financial statements and the reported amounts of revenue and expenses during the reporting periods. Actual results could differ from those estimates.
Principles of Consolidation
The consolidated financial statements of the Company include the results of operations, financial position, and cash flows of Hawaiian Telcom Holdco, Inc. and its wholly owned subsidiaries. All intercompany balances and transactions have been eliminated in consolidation.
Revenue Recognition
Revenue is recognized when evidence of an arrangement exists, the earnings process is complete and collectibility is reasonably assured. The prices for most services are filed in tariffs with the regulatory body that exercises jurisdiction over the services.
Basic local service, enhanced calling features such as caller ID, special access circuits, long-distance flat rate calling plans, most data services, HSI and wireless services are billed one month in advance. Revenue for these services is recognized in the month services are rendered. The portion of advance-billed services associated with services that will be delivered in a subsequent period is deferred and recorded as a liability in advance billings and customer deposits.
56
Hawaiian Telcom Holdco, Inc.
Notes to Consolidated Financial Statements (Continued)
3. Summary of Significant Accounting Policies (Continued)
Amounts billed to customers for activating wireline service are deferred and recognized over the average customer relationship. The costs associated with activating such services are deferred and recognized as an operating expense over the same period. Costs in excess of revenues are recognized as expense in the period in which activation occurs.
Revenues for providing usage based services, such as per-minute long-distance service and access charges billed to long-distance companies for originating and terminating long-distance calls on the Company's network, are billed in arrears. Revenues for these services are estimated based on actual rated usage and, where necessary, historical usage patterns, and are recognized in the month services are rendered.
Universal Service revenues are government-sponsored support received in association with providing service in mostly rural, high-cost areas. These revenues are typically based on information provided by the Company and are calculated by the government agency responsible for administering the support program. These revenues are recognized in the period the service is provided.
Telephone equipment revenues generated from retail channels are recorded at the point of sale. Telecommunication systems and structured cabling project revenues are recognized on a percentage completion basis, generally based on the relative portion of costs incurred to total estimated costs of a project, except for short duration projects which are recognized upon completion of the project. Maintenance services are recorded when the service is provided.
Taxes Collected from Customers
The Company presents taxes collected from customers and remitted to governmental authorities on a gross basis, including such amounts in the Company's reported operating revenues. Such amounts represent primarily Hawaii state general excise taxes and HPUC fees. Such taxes and fees amounted to $1.1 million for the period from November 1, 2010 to December 31, 2010 and $5.2 million for the period from January 1 to October 31, 2010. Such taxes and fees amounted to $5.9 million and $6.6 million for the years ended December 31, 2009 and 2008, respectively.
Cash and Cash Equivalents
Cash and cash equivalents include cash and money market accounts with maturities at acquisition of three months or less. The majority of cash balances at December 31, 2010 are held in two banks in demand deposit accounts.
Supplemental Non-Cash Investing and Financing Activities
Accounts payable included $0.9 million and $6.9 million at December 31, 2010 and 2009, respectively, for additions to property, plant and equipment.
Segregated cash
At December 31, 2007, the Company presented segregated cash which represented cash proceeds from the sale of its directories publishing segment as such funds were required to be used to repay long-term debt based on a requirement by the HPUC and the terms of the Company's bank debt agreement. Such repayments had been made by December 31, 2008.
57
Hawaiian Telcom Holdco, Inc.
Notes to Consolidated Financial Statements (Continued)
3. Summary of Significant Accounting Policies (Continued)
Receivables
The Company recognizes accounts receivable net of an allowance for doubtful accounts. The Company makes estimates of the uncollectibility of its accounts receivables by specifically analyzing accounts receivables and historic bad debts, customer concentrations, customer creditworthiness, current economic trends and changes in its customer payment terms when evaluating the adequacy of the allowance for doubtful accounts. After multiple attempts at collection of delinquent accounts, the balance due is deemed uncollectible and charged against the allowance.
Material and Supplies
Material and supplies which consist mainly of cable, supplies and replacement parts, are stated at the lower of cost, determined principally by the average cost method, or net realizable value.
Property and Depreciation
Property, plant and equipment are carried at cost. Depreciation has been calculated using the composite remaining life methodology and straight-line depreciation rates. The composite method depreciates the remaining net investment in telephone plant over remaining economic asset lives by asset category. This method requires periodic review and revision of depreciation rates. The average economic lives utilized for assets recognized in conjunction with the Company's fresh-start accounting in October 2010 (see Note 4) are as follows: buildings—18 years; cable and wire—11 years; switching and circuit equipment—3 years; and other property—2 to 4 years. The average economic lives utilized for assets acquired in conjunction with the acquisition of the Company in May 2005 were as follows: buildings—34 years; cable and wire—5 to 20 years; switching and circuit equipment—1 to 15 years; and other property—1 to 20 years. The average economic lives for all other assets (i.e., primarily new additions) are as follows: building—34 years; cable and wire—11 to 37 years; switching and circuit equipment—6 to 15 years; and other property—5 to 17 years.
Software
The Company capitalizes the costs associated with externally acquired software for internal use. Project costs associated with internally developed software are segregated into three project stages: preliminary project stage, application development stage and post-implementation stage. Costs associated with both the preliminary project stage and post-implementation stage are expensed as incurred. Costs associated with the application development stage are capitalized. Software maintenance and training costs are expensed as incurred. Capitalized software is generally amortized on a straight-line method basis over its useful life, not to exceed five years.
Intangible Assets
Indefinite-lived intangible assets are not amortized. Such assets are reviewed annually, or more frequently under various conditions, for impairment. Impairment occurs when the fair value of the asset is less than the carrying value. The Company performs its annual impairment test during the fourth quarter, primarily using a discounted cash flow methodology. Intangible assets with definite lives, including the value assigned to the customer base, are being amortized over the remaining estimated lives. For customer relationship intangibles, amortization is calculated using a declining balance method in relation to estimated retention lives of acquired customers.
58
Hawaiian Telcom Holdco, Inc.
Notes to Consolidated Financial Statements (Continued)
3. Summary of Significant Accounting Policies (Continued)
Impairment of Long-Lived Assets
The Company assesses the recoverability of long-lived assets, including property, plant and equipment and definite-lived intangible assets, whenever events or changes in circumstances indicate that the carrying amount of an asset may not be recoverable. In such cases, if the sum of the expected cash flows, undiscounted and without interest, resulting from use of the asset are less than the carrying amount, an impairment loss is recognized based on the difference between the carrying amount and the fair value of the assets.
Debt Issuance
Deferred financing costs were amortized over the term of the related debt issuance.
Derivative Financial Instruments
The Company accounts for all derivative financial instruments, such as interest rate swap agreements, by recognizing the derivative on the balance sheet at fair value, regardless of the purpose or intent of holding them. In addition, for derivative financial instruments that qualify for hedge accounting, changes in the fair value will either be offset against the change in the fair value of the hedged assets, liabilities, or firm commitment, through earnings, or recognized in stockholders' equity as a component of accumulated other comprehensive income (loss) until the hedged item is recognized in earnings, depending on whether the derivative is being used to hedge changes in fair value or cash flows. The Company measures hedge effectiveness by formally assessing, at least quarterly, the historical and probable future high correlation of changes in the fair value of expected future cash flows of the hedged item. The ineffective portion of a derivative's change in fair value will be immediately recognized in other income or expense.
Income Taxes
Deferred tax assets and liabilities are determined based on the differences between the financial reporting and tax bases of assets and liabilities at each balance sheet date using enacted tax rates expected to be in effect in the year the differences are expected to reverse. Deferred tax assets are reduced by a valuation allowance to the extent that it is unlikely they will be realized.
The Company recognizes interest and penalties related to unrecognized tax benefits within income tax expense in the accompanying consolidated statements of operations.
Employee Benefit Plans
Pension and postretirement health and life insurance benefits earned during the year as well as interest on projected benefit obligations are accrued currently. Prior service costs and credits resulting from changes in plan benefits are amortized over the average remaining service period of the employees expected to receive benefits.
Maintenance and Repairs
The cost of maintenance and repairs, including the cost of replacing minor items not constituting substantial betterments, is charged to expense as these costs are incurred.
59
Hawaiian Telcom Holdco, Inc.
Notes to Consolidated Financial Statements (Continued)
3. Summary of Significant Accounting Policies (Continued)
Advertising
Advertising costs are expensed as incurred. Advertising expense amounted to $1.0 million for the period from November 1 to December 31, 2010 and $4.4 million for the period January 1 to October 31, 2010. Advertising expense amounted to $5.7 million and $5.9 million for the years ended December 31, 2009, and 2008, respectively.
Stock Based Compensation
The Company accounts for stock-based compensation at fair value using the prospective method for all new awards granted, modified or settled after January 1, 2006.
Earnings per Share
Basic earnings per share is based on the weighted effect of all common shares issued and outstanding, and is calculated by dividing earnings by the weighted average shares outstanding during the period. Diluted earnings per share is calculated by dividing earnings, adjusted for the effect, if any, from assumed conversion of all potentially dilutive common shares outstanding, by the weighted average number of common shares used in the basic earnings per share calculation plus the number of common shares that would be issued assuming conversion of all potentially dilutive common shares outstanding. The computation of diluted earnings per share excludes the impact of outstanding stock options, for Predecessor periods as they were antidilutive to earnings per share. The denominator used to compute basic and diluted earnings per share by the Successor for the period November 1 to December 31, 2010 is as follows:
Basic earnings per share—weighted average shares |
10,135,063 | |||
Effect of dilutive securities: |
||||
Employee and director restricted stock units |
50,554 | |||
Warrants |
116,925 | |||
Diluted earnings per share—weighted average shares |
10,302,542 | |||
New Accounting Pronouncement
In October 2009, the Financial Accounting Standards Board issued guidance on revenue arrangements with multiple deliverables effective for the Company's 2011 calendar year. The guidance revises the criteria for separating, measuring, and allocating arrangement consideration to each deliverable in a multiple element arrangement. The guidance requires companies to allocate revenue using the relative selling price of each deliverable, which must be estimated if the Company does not have a history of selling the deliverable on a stand-alone basis or third-party evidence of selling price. The Company does not expect the adoption of this guidance to have a material impact on its financial statements.
4. Fresh-Start Reporting
Although the Company emerged from bankruptcy on October 28, 2010, the Predecessor adopted "fresh-start" accounting as of October 31, 2010 for accounting convenience. Fresh-start accounting was required because holders of existing voting shares immediately before filing and confirmation of the plan of reorganization received less than 50% of the voting shares of the emerging entity and the
60
Hawaiian Telcom Holdco, Inc.
Notes to Consolidated Financial Statements (Continued)
4. Fresh-Start Reporting (Continued)
Company's reorganization value was less than its post petition liabilities and allowed claims. Fresh-start accounting requires the Successor to allocate its reorganization value to its assets and liabilities in a manner similar to that which is used for purchase business combinations. Under the provisions of fresh-start accounting, a new entity is deemed created for financial reporting purposes. References to Successor refer to the Company after October 31, 2010 after giving effect to provisions of the plan and application of fresh-start accounting. References to Predecessor refer to the Company prior to and on October 31, 2010. Accordingly, the financial information disclosed under the heading Successor is presented on a basis different from, and is therefore not comparable to, the financial information disclosed under the heading Predecessor.
The consolidated balance sheet as of December 31, 2010 gives effect to adjustments to the carrying value of assets or amounts and classifications of liabilities that were necessary when adopting fresh-start accounting. The statements of operations and cash flows for the period from January 1, 2010 to October 31, 2010 reflect the operations of the Predecessor which includes the gain from discharge of debt and application of fresh-start reporting. The adoption of fresh-start accounting had a material effect on the consolidated financial statements as of October 31, 2010 and will have a material impact on the consolidated statements of operations for periods subsequent to October 31, 2010.
The emergence from Chapter 11 proceedings on the Emergence Date resulted in a new reporting entity and adoption of fresh-start accounting as of October 31, 2010. Reorganization adjustments have been made in the financial information to reflect the discharge of prepetition liabilities and the adoption of fresh-start accounting. Reorganization adjustments resulted primarily from the: (i) changes in the carrying values of assets and liabilities to reflect fair values including the establishment of certain intangible assets; (ii) discharge of the Company's prepetition liabilities; (iii) addition of new financing; (iv) cash distributions paid or payable to prepetition creditors; and (v) issuance of Successor new common stock and cancellation of old common stock.
To facilitate the calculation of the enterprise value of the Successor, the Company developed a set of financial projections included in the plan of reorganization. Based on these financial projections, the equity value was determined by the Company using various valuation methods including (i) a comparison of the Company and its projected performance to the market values of comparable companies; (ii) a review and analysis of several recent transactions of companies in similar industries to the Company; and (iii) a calculation of present value of the future cash flows of the Company under its projections. Sensitive assumptions used in these analyses include the Company's current earnings capacity, the appropriate market multiple to apply to such earnings capacity, the Company's future cash flows which were projected for a period of five years, and the weighted average cost of capital which was developed with a traditional capital asset pricing model.
The estimated enterprise value, and corresponding equity value, is highly dependent on achieving the future financial results in the projections as well as the realization of certain other assumptions. The estimated equity value of the Company was calculated to be approximately $160.0 million. The estimates and assumptions made in this valuation are inherently subject to significant uncertainties and the resolution of contingencies beyond the reasonable control of the Company. Accordingly, there can be no assurance that the estimates, assumptions and amounts reflected in the valuations will be realized and the actual results could vary materially. Moreover, the market value of the Company's common stock may differ materially from the equity valuation.
61
Hawaiian Telcom Holdco, Inc.
Notes to Consolidated Financial Statements (Continued)
4. Fresh-Start Reporting (Continued)
The effects of the plan of reorganization and fresh-start reporting as of October 31, 2010 are as follows:
| |
Predecessor October 31, 2010 |
Plan Reorganization Adjustments |
Fresh-Start Valuation Adjustments |
Successor October 31, 2010(a) |
||||||||||||
|---|---|---|---|---|---|---|---|---|---|---|---|---|---|---|---|---|
Assets |
||||||||||||||||
Current assets |
||||||||||||||||
Cash and cash equivalents |
$ | 94,138 | $ | (4,177 | )(b)(c) | $ | — | $ | 89,961 | |||||||
Receivables, net |
40,736 | — | — | 40,736 | ||||||||||||
Material and supplies |
5,495 | — | — | 5,495 | ||||||||||||
Prepaid expenses |
6,494 | — | — | 6,494 | ||||||||||||
Other current assets |
11,448 | — | (3,043 | )(d) | 8,405 | |||||||||||
Total current assets |
158,311 | (4,177 | ) | (3,043 | ) | 151,091 | ||||||||||
Property, plant and equipment, net |
670,714 | — | (221,801 | )(d) | 448,913 | |||||||||||
Intangible assets, net |
268,293 | — | (223,993 | )(d) | 44,300 | |||||||||||
Other assets |
6,651 | — | (3,107 | )(d) | 3,544 | |||||||||||
Total assets |
$ | 1,103,969 | $ | (4,177 | ) | $ | (451,944 | ) | $ | 647,848 | ||||||
Liabilities and Stockholders' Equity (Deficiency) |
||||||||||||||||
Liabilities not subject to compromise |
||||||||||||||||
Current liabilities |
||||||||||||||||
Accounts payable |
$ | 26,907 | $ | 898 | (b) | $ | — | $ | 27,805 | |||||||
Accrued expenses |
31,392 | — | — | 31,392 | ||||||||||||
Advance billings and customer deposits |
15,662 | — | — | 15,662 | ||||||||||||
Other current liabilities |
5,679 | — | (3,043 | )(d) | 2,636 | |||||||||||
Total current liabilities |
79,640 | 898 | (3,043 | ) | 77,495 | |||||||||||
Long-term debt |
— | 300,000 | (b) | — | 300,000 | |||||||||||
Employee benefit obligations |
106,400 | — | — | 106,400 | ||||||||||||
Other liabilities |
4,899 | — | (3,107 | )(d) | 1,792 | |||||||||||
Total liabilities not subject to compromise |
190,939 | 300,898 | (6,150 | ) | 485,687 | |||||||||||
Liabilities subject to compromise |
1,175,826 | (1,175,826 | )(b) | — | — | |||||||||||
Total liabilities |
1,366,765 | (874,928 | ) | (6,150 | ) | 485,687 | ||||||||||
Stockholders' equity (deficiency) |
||||||||||||||||
Common stock |
4 | 97 | (c) | — | (e) | 101 | ||||||||||
Additional paid-in capital |
429,058 | 162,064 | (c) | (429,062 | )(e) | 162,060 | ||||||||||
Accumulated other comprehensive loss |
(38,786 | ) | — | 38,786 | (e) | — | ||||||||||
Accumulated deficit |
(653,072 | ) | 708,590 | (c) | (55,518 | )(e) | — | |||||||||
Total stockholders' equity (deficiency) |
(262,796 | ) | 870,751 | (445,794 | ) | 162,161 | ||||||||||
Total liabilities and stockholders' |
||||||||||||||||
equity (deficiency) |
$ | 1,103,969 | $ | (4,177 | ) | $ | (451,944 | ) | $ | 647,848 | ||||||
- (a)
- The consolidated balance sheet reflects the effect of implementing the plan of reorganization and fresh start reporting which were required for financial reporting upon emergence. Under fresh-start reporting, reorganization enterprise value of $460.0 million was allocated $160.0 million to equity and $300.0 million to the new term loan.
62
Hawaiian Telcom Holdco, Inc.
Notes to Consolidated Financial Statements (Continued)
4. Fresh-Start Reporting (Continued)
- (b)
- Reflects
the discharge of prepetition liabilities in accordance with the plan of reorganization and the reclassification of the remaining liabilities
subject to compromise to the appropriate liability accounts. Liabilities were satisfied with the payment of cash $6.3 million (including contract cure costs), a new term loan of
$300.0 million and issuance of equity of $160.0 million for both common stock and warrants.
- (c)
- Reflects
the issuance of new common stock and warrants to prepetition creditors and the gain on discharge of liabilities subject to compromise. This
includes sale of stock for proceeds of $2.1 million, net of cancellation of old common stock.
- (d)
- Reflects
changes to the carrying value of assets and liabilities to reflect fair values.
- (e)
- Reflects the elimination of historical accumulated deficit and other equity accounts and an adjustment to shareholders' equity to result in the estimated reorganized equity value.
In conjunction with the adoption of fresh-start accounting, the majority of assets and liabilities were recorded at fair value as of October 31, 2010. The major assumptions used in determining the new basis were as follows.
For cash and cash equivalents, accounts receivable, other short-term assets, accounts payable and other short-term liabilities the Predecessor carrying amount approximated fair value because of the short-term maturity of these assets and liabilities. Gross contractual cash flows due on accounts receivable at October 31, 2010 amounted to $53.2 million and the estimated uncollectible balance was $12.4 million.
Deferred activation fee revenue and related costs were given no recognition by the Successor as there is no continuing legal obligation to provide services to customers. The related assets and liabilities are included in other current assets, other assets, other current liabilities and other liabilities.
The fair value of property, plant and equipment was based on the highest and best use of specific properties. To determine fair value the Company considered and applied either the market approach or cost approach depending on the nature of the asset and the availability of information. The market or sales comparison approach relies upon recent sales or offerings of similar assets on the market to arrive at a probable selling price. Certain adjustments were made to reconcile differences in attributes between the comparable sales and the appraised assets. The cost approach considers the amount required to construct or purchase a new asset of equal utility at current prices, with adjustments in value for physical deterioration, functional obsolescence and economic obsolescence.
The fair value of intangible assets including the brand name and customer relationship intangibles was determined based on discounted cash flows from projections of results for the Company's operations.
Long-term debt was based on the debt issued in conjunction with the plan of reorganization. This was assumed to approximate fair value given that the terms of the debt were negotiated recently between the Company and lenders in conjunction with development of the plan of reorganization. The employee benefit obligations were recognized based on the funded status of the benefit plans.
5. Reorganization
The accompanying consolidated financial statements have been prepared in accordance with accounting standards for financial reporting by entities in reorganization under the Bankruptcy Code. In accordance with those standards, all prepetition liabilities subject to compromise have been
63
Hawaiian Telcom Holdco, Inc.
Notes to Consolidated Financial Statements (Continued)
5. Reorganization (Continued)
segregated in the consolidated balance sheet of the Predecessor and classified as liabilities subject to compromise at the estimated amount of the allowable claims. Liabilities not subject to compromise are separately classified as current or noncurrent. The Predecessor's consolidated statements of operations for the period from January 1 to October 31, 2010 and for the years ended December 31, 2009 and 2008 present the results of operations during the Chapter 11 proceedings. As such, any revenues, expenses, and gains and losses realized or incurred that are directly related to the bankruptcy case are reported separately as reorganization items due to the bankruptcy. The operations and financial position of the Non-Debtor, included in the consolidated statements of operations and consolidated balance sheets, are not significant.
Reorganization Items
Reorganization items represent expense or income amounts that were recognized as a direct result of the Chapter 11 filing and are presented separately in the consolidated statements of operations. Such (income) and expense items consist of the following (dollars in thousands):
| |
Successor | Predecessor | |||||||||||
|---|---|---|---|---|---|---|---|---|---|---|---|---|---|
| |
Period from November 1 to December 31, 2010 |
Period from January 1 to October 31, 2010 |
For the Year Ended December 31, 2009 |
For the Year Ended December 31, 2008 |
|||||||||
Professional fees |
$ | 539 | $ | 10,586 | $ | 33,904 | $ | 7,872 | |||||
Cancellation of liability |
— | — | (733 | ) | — | ||||||||
Effects of the plan of reorganization |
— | (708,590 | ) | — | — | ||||||||
Fresh-start valuation of assets and liabilities |
— | 445,794 | — | — | |||||||||
Expense deferred financing costs |
— | — | 9,870 | — | |||||||||
Other |
— | 536 | (36 | ) | (5 | ) | |||||||
|
$ | 539 | $ | (251,674 | ) | $ | 43,005 | $ | 7,867 | ||||
Deferred financing costs amounting to $9.9 million were expensed in December 2009 when the Bankruptcy Court approved the amount of the allowed claims for the bank and senior notes debt. The amount of the approved claim was equivalent to the carrying value of the debt, exclusive of the debt issuance costs.
Professional fees relate to legal, financial advisory and other professional costs directly associated with the reorganization process. The cancellation of liability relates to amounts owed to Accenture (see Note 17).
Net cash paid for reorganization items, consisting of professional and other fees, amounted to $3.1 million and $17.9 million for the period from November 1 to December 31, 2010 and for the period from January 1 to October 31, 2010, respectively. Net cash paid for reorganization items, consisting of professional and other fees, amounted to $25.4 million and $6.3 million for the years ended December 31, 2009 and 2008, respectively.
64
Hawaiian Telcom Holdco, Inc.
Notes to Consolidated Financial Statements (Continued)
5. Reorganization (Continued)
Liabilities Subject to Compromise
Liabilities subject to compromise refer to liabilities incurred prior to the Petition Date. The amounts of the various categories of liabilities that were subject to compromise are set forth below. These amounts represented the estimates of known or potential prepetition date claims that were likely to be resolved in connection with the bankruptcy filings. Such claims were open to future adjustments. Adjustments may have resulted from negotiations, actions of the Bankruptcy Court, rejection of the executory contracts and unexpired leases, the determination of the value securing claims, proof of claim or other events.
Liabilities subject to compromise of the Predecessor at December 31, 2009 consisted of the following (dollars in thousands):
Notes payable to banks, revolving credit facility |
$ | 91,486 | ||
Notes payable to banks, Tranche C term loan |
494,311 | |||
Senior floating rate notes |
150,000 | |||
Senior fixed rate notes |
200,000 | |||
Senior subordinated notes |
150,000 | |||
Senior notes accrued interest |
29,914 | |||
Settlement on swap liability |
15,621 | |||
Accounts payable |
34,724 | |||
Other |
1,528 | |||
|
$ | 1,167,584 | ||
Liabilities of the Predecessor not subject to compromise included: (1) liabilities held by the Non-Debtor entity; (2) liabilities incurred after the Petition Date; (3) prepetition date liabilities that the Debtors expected to pay in full, even though certain of these amounts could not be paid until a plan of reorganization was effective; and (4) prepetition date liabilities that had been approved for payment by the Bankruptcy Court and that the Debtors expected to pay (in advance of a plan of reorganization) in the ordinary course of business, including certain employee-related items (e.g., salaries, vacation, and medical benefits).
6. Receivables
Receivables consisted of the following (dollars in thousands):
| |
Successor | Predecessor | |||||
|---|---|---|---|---|---|---|---|
| |
December 31, 2010 |
December 31, 2009 |
|||||
Customers and other |
$ | 40,024 | $ | 60,655 | |||
Allowance for doubtful accounts |
(802 | ) | (13,000 | ) | |||
|
$ | 39,222 | $ | 47,655 | |||
Receivables were stated at fair value in fresh-start accounting which resulted in the allowance for doubtful accounts being eliminated as of October 31, 2010. Collectability of receivables is considered in the determination of the fair value of the accounts receivable.
65
Hawaiian Telcom Holdco, Inc.
Notes to Consolidated Financial Statements (Continued)
6. Receivables (Continued)
The Company grants credit to customers in the normal course of business. At December 31, 2010 and 2009, the Company did not have customer balances representing more than 10% of total receivables. During the periods January 1 to October 31, 2010 and November 1 to December 31, 2010, and for the years ended December 31, 2009 and 2008, the Company had no customers that represented more than 10% of total revenues.
The following is a summary of activity for the allowance for doubtful accounts (dollars in thousands):
| |
Beginning Balance |
Additional Charges to Costs and Expenses |
Recoveries to (Deductions from) Allowance |
Ending Balance |
|||||||||
|---|---|---|---|---|---|---|---|---|---|---|---|---|---|
Successor |
|||||||||||||
November 1 to December 31, 2010 |
$ | — | $ | 674 | $ | 128 | $ | 802 | |||||
Predecessor |
|||||||||||||
January 1 to October 31, 2010 |
$ | 13,000 | $ | 4,851 | $ | (5,407 | ) | $ | 12,444 | ||||
Year ended December 31, 2009 |
18,453 | 8,898 | (14,351 | ) | 13,000 | ||||||||
Year ended December 31, 2008 |
24,041 | 9,414 | (15,002 | ) | 18,453 | ||||||||
7. Property, Plant and Equipment
Property, plant and equipment consisted of the following (dollars in thousands):
| |
Successor | Predecessor | |||||
|---|---|---|---|---|---|---|---|
| |
December 31, 2010 |
December 31, 2009 |
|||||
Land |
$ | 74,809 | $ | 59,013 | |||
Buildings |
89,224 | 128,256 | |||||
Central office equipment |
74,264 | 375,672 | |||||
Outside communications plant |
180,174 | 433,047 | |||||
Furniture, vehicles and other work equipment |
12,043 | 53,318 | |||||
Construction in progress |
25,895 | 23,072 | |||||
Software |
11,435 | 105,307 | |||||
Other |
471 | 5,081 | |||||
|
468,315 | 1,182,766 | |||||
Less accumulated depreciation and amortization |
8,534 | 471,501 | |||||
Total property, plant and equipment, net |
$ | 459,781 | $ | 711,265 | |||
Depreciation expense amounted to $8.7 million for the period from November 1 to December 31, 2010 and $103.1 million for the period from January 1 to October 31, 2010. Depreciation expense amounted to $121.3 million and $114.1 million for the years ended December 31, 2009 and 2008, respectively.
66
Hawaiian Telcom Holdco, Inc.
Notes to Consolidated Financial Statements (Continued)
8. Goodwill and Intangible Assets
In conjunction with fresh-start accounting as of October 31, 2010, the Successor recognized identifiable intangible assets of $44.3 million. The excess purchase price paid by the Predecessor over its estimates of the fair values of tangible assets and liabilities of acquired businesses amounted to $612.0 million of identifiable intangible assets and $216.9 million of goodwill ($535.1 million of identifiable intangible assets and no goodwill remaining after certain asset sales and impairment losses recognized in prior years).
The gross carrying amount and accumulated amortization of the identifiable intangible assets are as follows (dollars in thousands):
| |
Successor | Predecessor | ||||||||||||||||||
|---|---|---|---|---|---|---|---|---|---|---|---|---|---|---|---|---|---|---|---|---|
| |
December 31, 2010 | December 31, 2009 | ||||||||||||||||||
| |
Gross Carrying Value |
Accumulated Amortization |
Net Carrying Value |
Gross Carrying Value |
Accumulated Amortization |
Net Carrying Value |
||||||||||||||
Subject to amortization: |
||||||||||||||||||||
Customer relationships |
$ | 17,000 | $ | 985 | $ | 16,015 | $ | 503,900 | $ | 229,237 | $ | 274,663 | ||||||||
Covenant not to compete |
— | — | — | 4,000 | 4,000 | — | ||||||||||||||
|
17,000 | 985 | 16,015 | 507,900 | 233,237 | 274,663 | ||||||||||||||
Not subject to amortization: |
||||||||||||||||||||
Brand name |
27,300 | — | 27,300 | 27,200 | — | 27,200 | ||||||||||||||
|
27,300 | — | 27,300 | 27,200 | — | 27,200 | ||||||||||||||
|
$ | 44,300 | $ | 985 | $ | 43,315 | $ | 535,100 | $ | 233,237 | $ | 301,863 | ||||||||
The estimated useful lives for intangibles subject to amortization are as follows:
| |
Successor | Predecessor | ||||||
|---|---|---|---|---|---|---|---|---|
| |
Life | Weighted Average Life |
Life | Weighted Average Life |
||||
Customer relationships |
10 years | 10 years | 8 - 15 years | 13 years | ||||
Covenant not to compete |
NA | NA | 2 years | 2 years | ||||
All amortizable intangibles |
10 years | 13 years | ||||||
The determination of useful lives for customer relationships was made based on historical and expected customer attrition rates. The Company uses an accelerated amortization method reflecting the rate of expected customer attrition.
Amortization expense amounted to $1.0 million for the period from November 1 to December 31, 2010 and $33.6 million for the period from January 1 to October 31, 2010. Amortization expense amounted to $43.1 million and $46.2 million for the years ended December 31, 2009 and 2008,
67
Hawaiian Telcom Holdco, Inc.
Notes to Consolidated Financial Statements (Continued)
8. Goodwill and Intangible Assets (Continued)
respectively. Estimated amortization expense for the next five years and thereafter is as follows (dollars in thousands):
2011 |
$ | 3,039 | ||
2012 |
2,730 | |||
2013 |
2,421 | |||
2014 |
2,112 | |||
2015 |
1,803 | |||
Thereafter |
3,910 | |||
|
$ | 16,015 | ||
9. Accrued Expenses
Accrued expenses consisted of the following (dollars in thousands):
| |
Successor | Predecessor | |||||
|---|---|---|---|---|---|---|---|
| |
December 31, 2010 |
December 31, 2009 |
|||||
Salaries and benefits |
$ | 21,382 | $ | 25,381 | |||
Interest |
4,875 | — | |||||
Other taxes |
2,495 | 2,569 | |||||
|
$ | 28,752 | $ | 27,950 | |||
10. Long-Term Debt
Long-term debt consisted of the following (dollars in thousands):
| |
|
|
Successor | Predecessor | |||||||
|---|---|---|---|---|---|---|---|---|---|---|---|
| |
Interest Rate at December 31, 2010 |
|
|||||||||
| |
Final Maturity |
December 31, 2010 |
December 31, 2009 |
||||||||
Notes payable to banks, new term loan |
9.00% | October 28, 2015 | $ | 300,000 | $ | — | |||||
Notes payable to banks, revolving credit facility |
NA | NA | — | 91,486 | |||||||
Notes payable to banks, Tranche C term loan |
NA | NA | — | 494,311 | |||||||
Senior floating rate notes |
NA | NA | — | 150,000 | |||||||
Senior fixed rate notes |
NA | NA | — | 200,000 | |||||||
Senior subordinated notes |
NA | NA | — | 150,000 | |||||||
|
300,000 | 1,085,797 | |||||||||
Less liabilities subject to compromise |
— | (1,085,797 | ) | ||||||||
|
$ | 300,000 | $ | — | |||||||
68
Hawaiian Telcom Holdco, Inc.
Notes to Consolidated Financial Statements (Continued)
10. Long-Term Debt (Continued)
Notes Payable to Banks (Successor)
The Successor has a new revolving credit facility which matures on October 27, 2011 and has an available balance of $30.0 million with no amounts drawn as of December 31, 2010. A commitment fee is payable quarterly to the lender under the facility. Interest on amounts outstanding is based on, at the Company's option, the bank prime rate plus a margin of 3.0% or the Eurocurrency rate for one, two, three or six month periods but no less than 5.5% plus a margin of 4.0%.
The new term loan has an original principal amount of $300.0 million and will mature on October 28, 2015. For each fiscal year that the Company has a cash balance that is greater than $67.5 million, the Company shall prepay, no later than 105 days after fiscal year end, loans in an aggregate amount equal to the lesser of (i) 75% of excess cash flow, as defined, for such fiscal year; and (ii) the amount by which the cash balance exceeds $67.5 million. In addition, the Company must make prepayment on loans in the case of certain prepayment events such as large asset sales.
The loans on the new term loan bear interest at a Eurocurrency rate on deposits for one, two, three or six month periods but no less than 3% plus a margin of 6%. The Company may request interest at the rate of 3.0% and 1.5% be paid-in-kind for 2010 and 2011, respectively, and added to the principal balance of the loan.
The obligations under the bank facilities are guaranteed by the Company and each subsidiary with certain exceptions. In addition, the bank credit facilities are collateralized by substantially all of the Company's assets.
The bank credit facilities contain various negative and affirmative covenants that restrict, among other things, incurrence of additional indebtedness, payment of dividends, redemptions of stock, other distributions to shareholders and sales of assets. In addition, there are financial covenants consisting of a leverage ratio, minimum liquidity and a maximum level of capital expenditures.
No term loan prepayment is anticipated for 2011. The balance of the term loan is due in 2015.
The term loan includes a provision whereby members of the lender group may request that the Company make an offer to exchange term loan debt for equity at the then fair value of common equity shares. The Company, in its sole discretion, can make the offer or not. The Company, in its sole discretion, can also initiate an offer to exchange term loan debt for equity at the then fair value of common equity shares. Members of the lender group are not required to accept such offers.
Predecessor Debt Classification
In accordance with accounting standards for financial reporting by entities in reorganization under the Bankruptcy Code, the unsecured senior floating rate notes, senior fixed rate notes and senior subordinated notes were presented as liabilities subject to compromise. In addition, as the Predecessor bank debt was under secured, it was also presented as a liability subject to compromise.
Notes Payable to Banks (Predecessor)
Borrowings under the bank credit facilities provided for interest at a rate equal to the applicable margin plus, at the Company's option, either: (a) a base rate determined by reference to the higher of (1) prime rate, as defined, and (2) the federal funds rate plus 1/2 of 1%; or (b) a Eurocurrency rate on deposits of one-, two-, three- or six-month periods (or nine- or 12-month periods if, at the time of the
69
Hawaiian Telcom Holdco, Inc.
Notes to Consolidated Financial Statements (Continued)
10. Long-Term Debt (Continued)
borrowing, all lenders agree to make such a duration available). The Eurocurrency rates could not be selected for any interest periods beginning when the Company was in default on the credit facilities. The Company continued to pay all interest due on the bank credit facilities through February 28, 2009. Effective March 1, 2009, the Company agreed with its secured lenders (bank debt lenders and swap counterparties) to pay a reduced level of interest. Beginning on March 1, 2009 through the effective date of the plan of reorganization, interest was being paid to all secured lenders based on a principal balance of $300.0 million. The difference between the stated rate of interest and interest paid, became an additional secured obligation of the secured lenders. The interest on the bank credit facilities that was added to the principal balance amounted to $11.6 million for the period from January 1 to October 31, 2010 and $11.3 million for the year ended December 31, 2009.
In January 2008, the Company repaid $211.0 million of the Tranche C term loan using the proceeds from the sale of the directories publishing segment. In January 2008, the Company also obtained a permanent reduction in the revolver commitment from $200.0 million to $150.0 million. On June 1, 2008, the revolver availability further declined to the $90.0 million level when a provision in the Company's credit agreement which permitted it to increase the available commitment to $150.0 million lapsed. The HPUC had denied the Company's request for approval to invoke this provision of the credit agreement. As a result of the repayment of debt and reduction in the availability on the revolving credit facility, the Company expensed deferred financing costs resulting in a loss on early extinguishment of debt of $3.5 million for the year ended December 31, 2008.
Senior Notes (Predecessor)
The senior notes were general unsecured obligations. The senior floating rate notes in the aggregate principal amount of $150.0 million provided for interest at a rate reset and payable semi-annually at LIBOR, as defined, plus 5.50%. The senior fixed rate notes in the aggregate principal amount of $200.0 million provided for interest at a rate of 9.75% per year. The senior subordinated notes in the aggregate principal amount of $150.0 million provided for interest at a rate of 12.50% per year.
Capitalized Interest
Interest capitalized by the Company amounted to $0.8 million for the period from January 1 to October 31, 2010 and $0.4 million for the period from November 1 to December 31, 2010. Interest capitalized by the Company amounted to $1.5 million in each of the years ended December 31, 2009 and 2008.
Contractual Interest Expense
The Company recorded postpetition interest on prepetition obligations only to the extent it believed the interest would be paid during the bankruptcy proceedings or that it was probable that the interest would be an allowed claim. Had the Company recorded interest expense based on all of the prepetition contractual obligations, interest expense would have increased by $39.2 million for the period from January 1 to October 31, 2010 and $49.6 million and $4.3 million for the years ended December 31, 2009 and 2008, respectively.
70
Hawaiian Telcom Holdco, Inc.
Notes to Consolidated Financial Statements (Continued)
11. Derivative Instruments and Hedging Activities
Prior to 2010, the Company utilized a combination of fixed-rate and variable-rate debt to finance its operations. The variable-rate debt exposed the Company to variability in interest payments due to changes in interest rates. Management believed that it was prudent to mitigate the interest rate risk on a portion of its variable-rate borrowings. To meet this objective, management maintained interest rate swap agreements to manage fluctuations in cash flows resulting from adverse changes in interest rates on its term loans and notes.
Changes in the fair value of interest rate swaps designated as hedging instruments that effectively offset the variability of cash flows associated with the Company's variable-rate debt obligations are reported in accumulated other comprehensive loss. These amounts are subsequently reclassified into interest expense as a yield adjustment of the hedged interest payment in the same period in which the related interest payments affect earnings.
In January 2008, the Company terminated one of its swaps with a notional value of $115.4 million. As a result, the Company paid $2.7 million which represented the fair value of the hedge on the settlement date. The swap was previously designated as a cash flow hedge maturing December 31, 2010. The fair value adjustments to the hedged instrument were being recognized as an increase to interest expense over the remaining term of the previously hedged instrument.
On December 1, 2008 and December 2, 2008, the Company's swap agreements were terminated by the counterparties under the default provisions of the agreements. The swap termination liability of $15.6 million, included in liabilities subject to compromise of the Predecessor, was collateralized by the same assets that collateralized bank debt and was of the same priority as bank debt in the Chapter 11 proceeding.
Because of the capital restructuring efforts which began in the third quarter of 2008, the Company concluded it was no longer probable but only reasonably possible that the Company would continue to pay the variable-rate interest specified in its hedge effectiveness documentation. Hence, beginning in the third quarter of 2008 through December 2008, changes in the value of the hedges were recognized in the consolidated statements of operations.
In the first quarter of 2009, as the Company negotiated the terms of its restructuring with its lenders, the Company concluded that the notional amount being hedged in the Company's hedge effectiveness documentation was greater than the expected amount of debt outstanding during the remaining term of the original hedges because of the agreed upon reduction in interest payments (see Note 10). A loss of $4.0 million was recognized in the first quarter of 2009 for the additional amount of ineffectiveness in the Company's interest rate swaps.
71
Hawaiian Telcom Holdco, Inc.
Notes to Consolidated Financial Statements (Continued)
11. Derivative Instruments and Hedging Activities (Continued)
The impact of the interest rate swaps, classified as cash flow hedges, was as follows (dollars in thousands):
| |
Predecessor | |||||||||
|---|---|---|---|---|---|---|---|---|---|---|
| |
|
For the Year Ended December 31, | ||||||||
| |
Period from January 1 to October 31, 2010 |
|||||||||
| |
2009 | 2008 | ||||||||
Amount of loss reclassified from accumulated other comprehensive loss into income (effective portion) recognized as interest expense |
$ | 416 | $ | 1,189 | $ | 3,035 | ||||
Loss recognized in income on derivative (ineffective portion) included in other income (expense) |
— | (3,967 | ) | (8,875 | ) | |||||
Amounts included in accumulated other comprehensive loss for the cash flow hedges were reclassified into earnings as cash interest was paid on the underlying debt that was hedged. There are no ongoing interest rate hedging activities.
12. Employee Benefit Plans
Pension and Other Postretirement Benefits
Upon adoption of fresh-start accounting on October 31, 2010, the Company completed a revaluation of the pension and other postretirement benefit liabilities. The Company also accelerated the recognition of net unrecognized actuarial gains and losses.
The Company sponsors a defined benefit pension plan and postretirement health and life insurance benefits for union employees. The Company also sponsors a cash balance pension plan for nonunion employees and certain management employees receive postretirement health and life insurance under grandfathered provisions of a terminated plan.
72
Hawaiian Telcom Holdco, Inc.
Notes to Consolidated Financial Statements (Continued)
12. Employee Benefit Plans (Continued)
The change in projected benefit obligation, change in plan assets, funded status and weighted average actuarial assumptions were as follows (dollars in thousands):
Pension Benefits
| |
Successor | Predecessor | ||||||||
|---|---|---|---|---|---|---|---|---|---|---|
| |
December 31, 2010 |
October 31, 2010 |
December 31, 2009 |
|||||||
Change in projected benefit obligation: |
||||||||||
Obligation at beginning of period |
$ | 205,597 | $ | 181,087 | $ | 166,364 | ||||
Service cost |
1,279 | 5,948 | 6,957 | |||||||
Interest cost |
1,759 | 8,332 | 9,442 | |||||||
Actuarial (gain) loss |
(3,775 | ) | 10,834 | (1,195 | ) | |||||
Benefits paid |
(145 | ) | (604 | ) | (481 | ) | ||||
Obligation at end of period |
204,715 | 205,597 | 181,087 | |||||||
Change in plan assets: |
||||||||||
Fair value of plan assets at beginning of period |
139,592 | 104,310 | 82,540 | |||||||
Actual return on plan assets |
5,589 | 12,026 | 22,201 | |||||||
Employer contributions |
— | 23,860 | 50 | |||||||
Benefits paid |
(145 | ) | (604 | ) | (481 | ) | ||||
Fair value of plan assets at end of period |
145,036 | 139,592 | 104,310 | |||||||
Funded status: |
||||||||||
Plan assets less than projected benefit obligation |
$ | (59,679 | ) | $ | (66,005 | ) | $ | (76,777 | ) | |
Amounts recognized on balance sheet: |
||||||||||
Employee benefit obligation |
$ | (59,679 | ) | $ | (66,005 | ) | $ | (76,777 | ) | |
Actuarial gain (loss) recognized in accumulated other comprehensive income (loss) |
$ | 7,534 | $ | (3,976 | ) | $ | (36,115 | ) | ||
Actuarial assumptions: |
||||||||||
Measurement date |
12/31/2010 | 10/31/2010 | 12/31/2009 | |||||||
Discount rate |
5.47% to 5.64% | 5.18% to 5.52% | 5.85% | |||||||
Rate of compensation increase |
3.50% to 5.00% | 3.50% to 5.00% | 3.50% to 5.00% | |||||||
73
Hawaiian Telcom Holdco, Inc.
Notes to Consolidated Financial Statements (Continued)
12. Employee Benefit Plans (Continued)
Other Postretirement Benefits
| |
Successor | Predecessor | ||||||||
|---|---|---|---|---|---|---|---|---|---|---|
| |
December 31, 2010 |
October 31, 2010 |
December 31, 2009 |
|||||||
Change in projected benefit obligation: |
||||||||||
Obligation at beginning of period |
$ | 42,451 | $ | 38,926 | $ | 38,244 | ||||
Service cost |
183 | 940 | 1,027 | |||||||
Interest cost |
402 | 1,920 | 2,091 | |||||||
Actuarial (gain) loss |
(5,875 | ) | 1,952 | (899 | ) | |||||
Benefits paid |
(260 | ) | (1,287 | ) | (1,537 | ) | ||||
Obligation at end of period |
36,901 | 42,451 | 38,926 | |||||||
Change in plan assets: |
||||||||||
Fair value of plan assets at beginning of period |
— | — | — | |||||||
Employer contributions |
260 | 1,287 | 1,537 | |||||||
Benefits paid |
(260 | ) | (1,287 | ) | (1,537 | ) | ||||
Fair value of plan assets at end of period |
— | — | — | |||||||
Funded status: |
||||||||||
Plan assets less than projected benefit obligation |
$ | (36,901 | ) | $ | (42,451 | ) | $ | (38,926 | ) | |
Amounts recognized on balance sheet: |
||||||||||
Other current liabilities |
$ | (2,127 | ) | $ | (2,057 | ) | $ | (1,955 | ) | |
Employee benefit obligation |
(34,774 | ) | (40,394 | ) | (36,971 | ) | ||||
Net amount recognized |
$ | (36,901 | ) | $ | (42,451 | ) | $ | (38,926 | ) | |
Actuarial gain (loss) recognized in accumulated other comprehensive income (loss) |
$ | 5,875 | $ | (2,041 | ) | $ | 3,363 | |||
Actuarial assumptions: |
||||||||||
Measurement date |
12/31/2010 | 10/31/2010 | 12/31/2009 | |||||||
Discount rate |
5.65% to 5.96% | 5.55% to 5.98% | 6.20% | |||||||
The estimated amount of the actuarial gain to be amortized from accumulated other comprehensive income (loss) during 2011 is $0.4 million for other postretirement benefits and none for pension benefits.
74
Hawaiian Telcom Holdco, Inc.
Notes to Consolidated Financial Statements (Continued)
12. Employee Benefit Plans (Continued)
The Company accrues the costs of pension and postretirement benefits over the period from the date of hire until the date the employee becomes fully eligible for benefits. The following provides the components of benefit costs and weighted average actuarial assumptions for the period from November 1 to December 31, 2010, for the period from January 1 to October 31, 2010, and for years ended December 31, 2009 and 2008 (dollars in thousands):
Pension Benefits
| |
Successor | Predecessor | |||||||||||
|---|---|---|---|---|---|---|---|---|---|---|---|---|---|
| |
Period from November 1 to December 31, 2010 |
Period from January 1 to October 31, 2010 |
For the Year Ended December 31, | ||||||||||
| |
2009 | 2008 | |||||||||||
Service cost |
$ | 1,279 | $ | 5,948 | $ | 6,957 | $ | 7,295 | |||||
Interest cost |
1,759 | 8,332 | 9,442 | 11,244 | |||||||||
Expected asset return |
(1,831 | ) | (6,597 | ) | (5,934 | ) | (11,661 | ) | |||||
Amortization of net (gain) loss |
— | 1,428 | 2,838 | 8 | |||||||||
Net periodic benefit cost |
1,207 | 9,111 | 13,303 | 6,886 | |||||||||
Settlement loss |
— | — | — | 4,129 | |||||||||
Termination benefit cost |
— | — | — | 420 | |||||||||
Total benefit cost |
$ | 1,207 | $ | 9,111 | $ | 13,303 | $ | 11,435 | |||||
Actuarial assumptions: |
|||||||||||||
Discount rate |
5.18% to 5.52% | 5.85% | 6.25% | 6.25% | |||||||||
Expected return on plan assets |
8.00% | 8.00% | 8.00% | 8.00% | |||||||||
Long-term rate of compensation increase |
3.50% to 5.00% | 3.50% to 5.00% | 3.50% to 5.00% | 3.50% to 5.00% | |||||||||
Other Postretirement Benefits
| |
Successor | Predecessor | |||||||||||
|---|---|---|---|---|---|---|---|---|---|---|---|---|---|
| |
|
|
For the Year Ended December 31, |
||||||||||
| |
Period from November 1 to December 31, 2010 |
Period from January 1 to October 31, 2010 |
|||||||||||
| |
2009 | 2008 | |||||||||||
Service cost |
$ | 183 | $ | 940 | $ | 1,027 | $ | 1,260 | |||||
Interest cost |
402 | 1,920 | 2,091 | 2,200 | |||||||||
Amortization of net (gain) loss |
— | (89 | ) | (271 | ) | (191 | ) | ||||||
Total benefit cost |
$ | 585 | $ | 2,771 | $ | 2,847 | $ | 3,269 | |||||
Actuarial assumptions: |
|||||||||||||
Discount rate |
5.55% to 5.98% | 6.20% | 6.25% | 6.25% | |||||||||
Assumed health care cost trend rate, current |
8.50 | % | 9.00% | 9.00% | 9.00% | ||||||||
Assumed health care cost trend rate, ultimate |
5.00 | % | 5.00% | 5.00% | 5.00% | ||||||||
Assumed health care cost trend rate, ultimate year |
2018 | 2018 | 2018 | 2013 | |||||||||
75
Hawaiian Telcom Holdco, Inc.
Notes to Consolidated Financial Statements (Continued)
12. Employee Benefit Plans (Continued)
During the first quarter of 2008, the Company provided an early retirement benefit to selected employees in conjunction with a planned reduction in the Company's workforce. The cost of such benefit amounted to $0.4 million.
Benefits paid during 2008 included lump sum payments resulting in deemed settlements of $38.0 million and a loss on settlement of $4.1 million.
In conjunction with negotiation of a new collective bargaining agreement for the Company's union employees, the Company amended its union defined benefit pension plan to provide no pension benefits to new union employees hired on or after September 13, 2008. The Company has also eliminated retiree medical benefits for union employees hired after the same date. Union employees hired on or after September 13, 2008 will receive an additional matching contribution in the Company's union 401(k) plan for a total contribution up to 6% of compensation.
The measurement date for all plans was December 31, 2010, October 31, 2010 and December 31, 2009. The accumulated benefit obligation for the pension plans amounted to $178.3 million and $154.5 million at December 31, 2010 and 2009, respectively. For both plans, the accumulated benefit obligation was in excess of plan assets as of December 31, 2010 and 2009.
The Company based its selection of an assumed discount rate for 2011 net periodic benefit cost and December 31, 2010 disclosure (as well as October 31, 2010 disclosure) on a cash flow matching analysis that utilized bond information provided by a bond pricing service for all non-callable, high quality bonds (i.e., rated AA- or better) as of December 31 and October 31, 2010, respectively. The matching of bond income to anticipated benefit cash flows was refined for 2010 but the basic methods of selecting the assumed discount rate and expected return on plan assets at December 31, 2010 did not change from December 31 2009.
In selecting the expected rate of return on plan assets of 8% for 2011 net periodic benefit cost, the Company considered economic forecasts for the types of investments held by the plans (primarily equity and fixed income investments), the plans' asset allocations and the past performance of the plans' assets. The expected rate of return on plan assets was based on various factors including historical experience and long-term inflation assumptions. The Company's expected long-term rate of return on plan assets is determined using the target allocation of assets which is based on the goal of earning the highest rate of return while maintaining risk at acceptable levels. The plan strives to have assets sufficiently diversified so that adverse or unexpected results from a security class will not have a significant adverse impact on the entire portfolio.
The Company's overall investment strategy is to primarily invest for long-term growth with sufficient investments available to fund near-term benefit payments. The Company aims for diversification of asset types, fund strategies and fund managers. The target allocations for plan assets are 60 percent equity securities and 40 percent fixed income securities. Equity securities primarily include investments in equity funds and common stock of individual companies. Together these investments are diversified in both large and small cap companies located in the United States and internationally. Fixed income securities are in funds that invest in bonds of companies from diversified industries, mortgage-backed securities and U.S. Treasuries.
Accounting standards establish a fair value hierarchy when measuring the fair value of pension plan assets. The three levels of inputs within the hierarchy are defined as follows. Level 1 is quoted prices for identical assets or liabilities in active markets. Level 2 is significant other observable inputs
76
Hawaiian Telcom Holdco, Inc.
Notes to Consolidated Financial Statements (Continued)
12. Employee Benefit Plans (Continued)
other than level 1 prices such as quoted prices for similar assets or liabilities; quoted prices in markets that are not active; or other inputs that are observable or can be corroborated by observable market data. Level 3 is significant unobservable inputs that reflect the Company's own assumptions as to how market participants would price an asset.
The fair values of the Company's pension plan assets at December 31, 2010 and 2009, based on trading values or fund net asset value, by asset category and basis of valuation are as follows (dollars in thousands):
| |
Quoted Prices in Active Markets for Identical Assets (Level 1) |
Significant Other Observable Inputs (Level 2) |
Significant Unobservable Inputs (Level 3) |
Total | |||||||||
|---|---|---|---|---|---|---|---|---|---|---|---|---|---|
2010 (Successor) |
|||||||||||||
Common stocks—domestic large cap |
$ | 6,438 | $ | — | $ | — | $ | 6,438 | |||||
Equity funds—large cap index |
— | 88,692 | — | 88,692 | |||||||||
Fixed income funds—diversified bond |
— | 49,698 | — | 49,698 | |||||||||
Short term investment funds |
— | 208 | — | 208 | |||||||||
|
$ | 6,438 | $ | 138,598 | $ | — | $ | 145,036 | |||||
2009 (Predecessor) |
|||||||||||||
Common stocks—domestic large cap |
$ | 9,875 | $ | — | $ | — | $ | 9,875 | |||||
Equity funds—large cap index |
— | 52,988 | — | 52,988 | |||||||||
Fixed income funds—diversified bond |
— | 41,340 | — | 41,340 | |||||||||
Short term investment funds |
— | 107 | — | 107 | |||||||||
|
$ | 9,875 | $ | 94,435 | $ | — | $ | 104,310 | |||||
The fair values of the financial instruments shown in the table above represent the Company's best estimates of the amounts that would be received upon sale of those assets or that would be paid to transfer those liabilities in an orderly transaction between market participants at that date. Those fair value measurements maximize the use of observable inputs. However, in situations where there is little, if any, market activity for the asset or liability at the measurement date, the fair value measurement reflects the Company's judgments about the assumptions that market participants would use in pricing the asset or liability. Those judgments are developed by the Company based on the best information available in the circumstances.
The Company used the following valuation methodologies for assets measured at fair value. There have been no changes in the methodologies used at December 31, 2010 and 2009.
Equity securities (Level 1) were valued at the closing price reported on the active market on which the individual securities are traded.
Fixed income securities, equity securities, and mutual funds (Level 2) were valued as follows. Fixed income securities are valued based on yields currently available on comparable securities of issuers with similar credit ratings. Equity securities and mutual funds include commingled equity funds that are not open to public investment and are valued at the net asset value per share.
77
Hawaiian Telcom Holdco, Inc.
Notes to Consolidated Financial Statements (Continued)
12. Employee Benefit Plans (Continued)
All contributions made were as required by law. The Company expects to contribute $17.0 million to its defined benefit pension plans in 2011.
The Company projects that it will make the following benefit payments for the years ended December 31 (dollars in thousands):
| |
Pension Plans Benefits Paid |
Other Postretirement Benefits Paid |
|||||
|---|---|---|---|---|---|---|---|
2011 |
$ | 36,181 | $ | 2,184 | |||
2012 |
19,000 | 2,329 | |||||
2013 |
19,403 | 2,520 | |||||
2014 |
17,562 | 2,691 | |||||
2015 |
19,965 | 2,858 | |||||
2016 through 2020 |
83,756 | 14,847 | |||||
|
$ | 195,867 | $ | 27,429 | |||
Assumed health care costs trend rates have a significant impact on the amounts reported for other postretirement benefits. A one-percentage point change in the assumed health care cost trend rates would have the following annual effects (dollars in thousands):
| |
1-Percentage Point Increase |
1-Percentage Point Decrease |
|||||
|---|---|---|---|---|---|---|---|
Effect on total of service and interest costs components |
$ | 229 | $ | (185 | ) | ||
Effect on postretirement benefit obligation |
1,761 | (1,674 | ) | ||||
401(k) Plan
The Company participates in two 401(k) employee savings plans that allow for voluntary contributions into designated investment funds by eligible employees with the Company matching employee contributions, up to a maximum of 5% of compensation for union employees hired before September 13, 2008, 6% for union employees hired on or after September 13, 2008, and 6% of compensation for non-union employees. Company contributions were $0.8 million for the period from November 1 to December 31, 2010 and $3.2 million for the period from January 1 to October 31, 2010. Company contributions were $3.6 million and $3.4 million for the years ended December 31, 2009 and 2008, respectively.
78
Hawaiian Telcom Holdco, Inc.
Notes to Consolidated Financial Statements (Continued)
13. Income Taxes
The components of the income tax benefit are as follows (dollars in thousands):
| |
Successor | Predecessor | ||||||||||||
|---|---|---|---|---|---|---|---|---|---|---|---|---|---|---|
| |
|
|
For the Year Ended December 31, |
|||||||||||
| |
Period from November 1 to December 31, 2010 |
Period from January 1 to October 31, 2010 |
||||||||||||
| |
2009 | 2008 | ||||||||||||
Current |
||||||||||||||
Federal |
$ | — | $ | — | $ | (2,229 | ) | $ | (265 | ) | ||||
State and local |
— | (346 | ) | (756 | ) | (691 | ) | |||||||
|
— | (346 | ) | (2,985 | ) | (956 | ) | |||||||
Deferred |
— | — | — | — | ||||||||||
Total income tax benefit |
$ | — | $ | (346 | ) | $ | (2,985 | ) | $ | (956 | ) | |||
For the year ended December 31, 2009, the Company recognized a benefit of $2.2 million for 2008 net operating losses that could be carried back, as provided for by the Worker, Homeownership, and Business Assistance Act of 2009, to reduce the alternative minimum tax that the Company paid in prior years. The credit for income taxes differs from the amounts determined by applying the statutory federal income tax rate of 34% to the income or loss before income taxes for the following reasons (dollars in thousands):
| |
|
Predecessor | ||||||||||||
|---|---|---|---|---|---|---|---|---|---|---|---|---|---|---|
| |
Successor | |||||||||||||
| |
|
For the Year Ended December 31, | ||||||||||||
| |
Period from November 1 to December 31, 2010 |
Period from January 1 to October 31, 2010 |
||||||||||||
| |
2009 | 2008 | ||||||||||||
Income tax (benefit) at federal rate |
$ | 1,064 | $ | 63,052 | $ | (46,802 | ) | $ | (55,861 | ) | ||||
Increase (decrease) resulting from: |
||||||||||||||
State income taxes, net of federal income tax |
132 | 7,833 | (5,349 | ) | (6,384 | ) | ||||||||
Permanent differences |
31,322 | 1,498 | — | — | ||||||||||
Other, net |
(210 | ) | (346 | ) | (756 | ) | (691 | ) | ||||||
Valuation allowance |
(32,308 | ) | (72,383 | ) | 49,922 | 61,980 | ||||||||
Total income tax benefit |
$ | — | $ | (346 | ) | $ | (2,985 | ) | $ | (956 | ) | |||
79
Hawaiian Telcom Holdco, Inc.
Notes to Consolidated Financial Statements (Continued)
13. Income Taxes (Continued)
Deferred income taxes consisted of the following (dollars in thousands):
| |
Successor | Predecessor | ||||||
|---|---|---|---|---|---|---|---|---|
| |
December 31, 2010 |
December 31, 2009 |
||||||
Deferred tax liabilities: |
||||||||
Property and equipment |
$ | 32,643 | $ | 35,347 | ||||
Other basis differences |
77 | 23,883 | ||||||
|
32,720 | 59,230 | ||||||
Deferred tax assets: |
||||||||
Net operating loss and credit carryforwards |
2,473 | 169,065 | ||||||
Intangible assets |
92,615 | 54,559 | ||||||
Expenses deferred for tax |
7,377 | 19,083 | ||||||
Employee benefits |
22,061 | 26,375 | ||||||
Other basis differences |
3,388 | 28,758 | ||||||
Non-deductible liabilities and allowances |
— | 10,805 | ||||||
|
127,914 | 308,645 | ||||||
Valuation allowance |
(95,194 | ) | (249,415 | ) | ||||
|
32,720 | 59,230 | ||||||
Deferred tax liability, net |
$ | — | $ | — | ||||
As a result of the Company's emergence from bankruptcy, the Company reduced the available federal and state net operating loss carryforward and adjusted the tax reporting basis of tangible and intangible assets for the discharge of indebtedness income. Because of the distribution of new common stock to the secured lenders, the Company reduced net operating loss carryforward for certain interest payments made to those lenders during the past three years. In addition to the adjustment to the tax reporting basis as described above, the fresh-start accounting adjustments also created additional basis differences between income tax and financial reporting.
A valuation allowance has been provided at December 31, 2010 and 2009 for the deferred tax assets because of the uncertainty of future realization of such amounts. The Company will continue to assess the recoverability of deferred tax assets and the related valuation allowance. To the extent that the Company generates taxable income in future periods and it determines that such valuation
80
Hawaiian Telcom Holdco, Inc.
Notes to Consolidated Financial Statements (Continued)
13. Income Taxes (Continued)
allowance is no longer required, the tax benefit of the remaining deferred tax assets will be recognized at that time. The following is a summary of activity for the valuation allowance (dollars in thousands):
| |
Beginning Balance |
Charge (Credit) to Income Tax Expense |
Charge (Credit) to Equity Accounts |
Ending Balance |
|||||||||
|---|---|---|---|---|---|---|---|---|---|---|---|---|---|
Successor |
|||||||||||||
November 1 to December 31, 2010 |
$ | 127,502 | $ | (32,308 | ) | $ | — | $ | 95,194 | ||||
Predecessor |
|||||||||||||
January 1 to October 31, 2010 |
$ | 249,415 | $ | (72,383 | ) | $ | — | $ | 177,032 | ||||
Year ended December 31, 2009 |
209,200 | 49,922 | (9,707 | ) | 249,415 | ||||||||
Year ended December 31, 2008 |
123,000 | 61,980 | 24,220 | 209,200 | |||||||||
The Company evaluates its tax positions for liability recognition. As of December 31, 2010, the Company had no unrecognized tax benefits. No interest or penalties related to tax assessments were recognized in the Company's consolidated statements of operations for the years ended December 31, 2010, 2009 or 2008. All tax years from 2007 remain open for both federal and Hawaii state purposes.
14. Stockholder's Equity
Successor
The plan of reorganization became effective and the Company emerged from bankruptcy on October 28, 2010. The Company applied fresh-start reporting effective October 31, 2010. The Predecessor's common stock was cancelled as of the Emergence Date with no distribution made to holders of such stock. The equity structure of the Successor is discussed below.
Successor Common Stock
On the Emergence Date, the Successor Company, a Delaware Corporation, filed a new certificate of incorporation authorizing 245,000,000 shares of new common stock with $0.01 par value per share. Pursuant to the plan of reorganization, the Successor issued 10,000,000 shares of new common stock to certain creditors in satisfaction of claims. The Company received gross proceeds of $2.1 million from the sale of 135,063 shares of new common stock.
Warrants to purchase 1,481,055 shares of new common stock for $14.00 per share were issued to holders of the Predecessor senior floating rate notes and senior fixed rate notes. The warrants to purchase shares may be exercised anytime from January 26, 2011 to the maturity on October 28, 2015. The warrants are included in the reorganization equity valuation of $160.0 million.
Successor Equity Incentive Plan
On the Emergence Date, the new equity incentive plan became effective pursuant to the plan of reorganization. The Compensation Committee of the Company's Board of Directors may grant awards under the plan in the form of incentive stock options, non-qualified stock options, stock appreciation rights, restricted stock, restricted stock units and other stock-based awards. The maximum number of
81
Hawaiian Telcom Holdco, Inc.
Notes to Consolidated Financial Statements (Continued)
14. Stockholder's Equity (Continued)
shares issuable under the new equity incentive plan is 1,400,000 shares. All grants under the equity incentive plan will be issued to acquire shares at the fair value on date of grant.
As of December 31, 2010, all awards were restricted stock units.
Restricted Stock Units
Restricted stock units are generally subject to forfeiture if employment terminates prior to release of the restrictions. The Company expenses the cost of restricted stock units, which is determined to be the fair market value of the shares at the date of grant, ratably over the period during which the restrictions lapse.
Restricted stock units have either service conditions or performance conditions for vesting. Those with service conditions vest in equal installments on each of the first through fourth anniversaries of the date of grant except for those granted to directors which vest over three years. Those with performance conditions vest in equal installments over four years based on the achievement of performance goals to be established by the Compensation Committee of the Company's Board of Directors. Shares of common stock delivered in respect of vested performance based units shall be subject to transfer restrictions which lapse in equal installments on each of the first three anniversaries of the date on which the performance based stock units become vested.
Nonvested restricted stock units as of December 31, 2010 and changes during the period November 1 to December 31, 2010 were as follows:
| |
Shares | Weighted- Average Grant-Date Fair Value |
|||||
|---|---|---|---|---|---|---|---|
Nonvested at October 31, 2010 |
— | $ | — | ||||
Granted |
253,595 | 12 | |||||
Vested |
— | — | |||||
Forfeited |
(6,817 | ) | 12 | ||||
Nonvested at December 31, 2010 |
246,778 | $ | 12 | ||||
As of December 31, 2010, restricted stock units for 237,371 performance based shares had been distributed but the specific performance goals had yet to be determined and communicated. As such, the restricted stock units were not deemed granted for accounting purposes.
As of December 31, 2010, there was $2.5 million of unrecognized share-based compensation expense related to nonvested restricted stock unit awards expected to vest. The cost is expected to be recognized over a weighted-average period of 4 years.
Other Disclosures
The Successor recognized compensation expense of $0.1 million for the period from November 1 to December 31, 2010. There was no cash received under all share-based payment arrangements during the same period. The Company did not receive any tax benefits for the tax deductions from share-based payment arrangements during the period as well.
82
Hawaiian Telcom Holdco, Inc.
Notes to Consolidated Financial Statements (Continued)
14. Stockholder's Equity (Continued)
Predecessor
On November 8, 2005, the Predecessor adopted a stock option plan (the "Plan") that permitted the grant of options to its key employees and independent directors and those of its wholly owned subsidiaries. The purpose of the Plan was primarily to align compensation for key executives with the performance of the Company. All options were to be granted at an exercise price that was greater than or equal to the fair value of the common stock of the Company on the date the stock option was granted. All options were cancelled with the effectiveness of the plan of reorganization.
The Company recognized $0.1 million, $0.1 million and $0.4 million of share-based compensation expense for the period from January 1 to October 31, 2010 and for the years ended December 31, 2009 and 2008, respectively, related to option grants.
15. Leases
The Company leases certain facilities and equipment for use in the Company's operations under several operating agreements. Certain of the leases provide for escalation or renegotiation of rental rates, and for extension of lease terms. Total rent expense for the Company amounted to $0.5 million for the period from November 1, 2010 to December 31, 2010, $2.4 million for the period from January 1 to October 31, 2010. Total rent expense amounted to $3.0 million and $3.4 million for the years ended December 31, 2009 and 2008, respectively.
Information on the aggregate minimum rental commitments under non-cancelable operating leases is as follows (dollars in thousands):
Years ended, December 31: |
|||||
2011 |
$ | 1,667 | |||
2012 |
1,314 | ||||
2013 |
895 | ||||
2014 |
897 | ||||
2015 |
837 | ||||
Thereafter |
8,754 | ||||
|
$ | 14,364 | |||
83
Hawaiian Telcom Holdco, Inc.
Notes to Consolidated Financial Statements (Continued)
16. Accumulated Other Comprehensive Income (Loss)
The components of accumulated other comprehensive income (loss) are as follows (dollars in thousands):
| |
Gain (Loss) on Cash Flow Hedging of Derivatives |
Unrealized Gain (Loss) on Investments |
Defined Benefit Postretirement Plans |
Total | |||||||||
|---|---|---|---|---|---|---|---|---|---|---|---|---|---|
January 1, 2008 (Predecessor) |
$ | (6,484 | ) | $ | 85 | $ | (297 | ) | $ | (6,696 | ) | ||
Other comprehensive income (loss) for 2008 |
866 | 34 | (50,301 | ) | (49,401 | ) | |||||||
December 31, 2008 (Predecessor) |
(5,618 | ) | 119 | (50,598 | ) | (56,097 | ) | ||||||
Other comprehensive income (loss) for 2009 |
5,156 | (96 | ) | 17,846 | 22,906 | ||||||||
December 31, 2009 (Predecessor) |
(462 | ) | 23 | (32,752 | ) | (33,191 | ) | ||||||
Other comprehensive income (loss) for the period from January 1 to October 31, 2010 |
416 | 6 | (6,017 | ) | (5,595 | ) | |||||||
October 31, 2010 (Predecessor) |
(46 | ) | 29 | (38,769 | ) | (38,786 | ) | ||||||
Elimination of Predecessor accumulated other comprehensive loss |
46 | (29 | ) | 38,769 | 38,786 | ||||||||
November 1, 2010 (Successor) |
— | — | — | — | |||||||||
Other comprehensive income (loss) for the period from November 1 to December 31, 2010 |
— | (16 | ) | 13,409 | 13,393 | ||||||||
December 31, 2010 (Successor) |
$ | — | $ | (16 | ) | $ | 13,409 | $ | 13,393 | ||||
17. Commitments and Contingencies
Long-Term Fixed Supplier Commitments
The Company has entered into agreements with various entities under long-term fixed contractual commitments primarily for technology related services. Annual fixed fee commitments for agreements in effect at December 31, 2010, amounted to the following (dollars in thousands):
Years ended, December 31: |
|||||
2011 |
$ | 14,699 | |||
2012 |
12,810 | ||||
2013 |
12,850 | ||||
2014 |
5,085 | ||||
2015 |
1,765 | ||||
|
$ | 47,209 | |||
Under the long-term agreements, the Company incurred fees amounting to $3.1 million for the period from November 1 to December 31, 2010 and $13.1 million for the period January 1 to October 31, 2010. Fees amounting to $15.4 million and $6.1 million were incurred under the long-term agreements for the years ended December 31, 2009 and 2008, respectively.
84
Hawaiian Telcom Holdco, Inc.
Notes to Consolidated Financial Statements (Continued)
17. Commitments and Contingencies (Continued)
Collective Bargaining Agreement
The Company has a collective bargaining agreement with the International Brotherhood of Electrical Workers Local 1357. The agreement expires on September 12, 2011 and covers about 57% of the workforce.
Third Party Claims
In the normal course of conducting its business, the Company is involved in various disputes with third parties, including vendors and customers. The outcome of such disputes is generally uncertain and subject to commercial negotiations. The Company periodically assesses its liabilities in connection with these matters and records reserves for those matters where it is probable that a loss has been incurred and the loss can be reasonably estimated. Based on management's most recent assessment, the Company believes that the risk of loss in excess of liabilities recorded is not material for all outstanding claims and disputes and the ultimate outcome of such matters will not have a material adverse effect on the Company's results of operations, cash flows or financial position.
Litigation
The Company is involved in litigation arising in the normal course of business. The outcome of this litigation is not expected to have a material adverse impact on the Company's consolidated financial statements.
Accenture Contract
In March 2009, the Company entered into an agreement with Accenture to provide information technology application maintenance services for a period of five years at a monthly cost ranging from $0.8 million to $1.1 million for a total commitment of $49.1 million. The contract allows for cancellation with the payment of certain wind-down expenses. The contract was subject to approval by the Bankruptcy Court which was received in April 2009. The contract includes a provision to waive payment of prepetition liabilities to Accenture amounting to $0.7 million. The Company recognized the cancellation of this liability in the second quarter of 2009 when the Bankruptcy Court approval was obtained.
18. Related Party Transactions
In 2005, the Company entered into a management consulting agreement with The Carlyle Group (the Predecessor's "Sponsor" and controlling owner through their managed equity funds). The agreement allowed the Company access to the Sponsor's expertise in areas such as corporate management, financial transactions, product strategy, investment, acquisitions and other matters that relate to the Company's business, administration and policies. The agreement was terminated September 30, 2008. Under the agreement, the Company incurred advisory fees of $0.8 million for the year ended December 31, 2008.
19. Fair Value of Financial Instruments
The following method and assumptions were used to estimate the fair value of each class of financial instruments for which it is practical to estimate the fair value. It was not practical to estimate
85
Hawaiian Telcom Holdco, Inc.
Notes to Consolidated Financial Statements (Continued)
19. Fair Value of Financial Instruments (Continued)
the fair value of most financial liabilities as of December 31, 2009 because of the Chapter 11 proceeding.
Cash and cash equivalents, accounts receivable and accounts payable—The carrying amount approximates fair value because of the short maturities of these instruments.
Investment securities—The fair value of investment securities is based on quoted market prices. Investment securities are included in deferred financing and other assets on the consolidated balance sheets.
Debt—The fair value of debt is based on discounted cash flows using current rates on comparable debt.
The estimated fair value of financial instruments is as follows (dollars in thousands):
| |
Carrying Value |
Fair Value |
||||||
|---|---|---|---|---|---|---|---|---|
December 31, 2010 (Successor) |
||||||||
Assets—investment in U.S. Treasury obligations (Level 1) |
$ | 1,805 | $ | 1,805 | ||||
Liabilities—long-term debt (carried at cost) |
300,000 | 300,000 | ||||||
December 31, 2009 (Predecessor) |
||||||||
Assets—investment in U.S. Treasury obligations (Level 1) |
$ | 2,090 | $ | 2,090 | ||||
Fair Value Measurements
Fair value for accounting purposes is the price that would be received to sell an asset or paid to transfer a liability in an orderly transaction between market participants at the measurement date (exit price).
Accounting standards establish a fair value hierarchy that prioritizes the inputs used to measure fair value. The hierarchy gives the highest priority to unadjusted quoted prices in active markets for identical assets or liabilities (Level 1 measurement) and the lowest priority to unobservable inputs (Level 3 measurement).
Assets measured at fair value on a recurring basis represent investment securities included in deferred financing and other assets. A summary is as follows (dollars in thousands):
| |
Succesor | Predecessor | ||||||
|---|---|---|---|---|---|---|---|---|
| |
December 31, 2010 |
December 31, 2009 |
||||||
Fair value measurements using: |
||||||||
Quoted prices in active markets for identical assets (Level 1) |
$ | 1,805 | $ | 2,090 | ||||
Significant other observable inputs (Level 2) |
— | — | ||||||
Significant unobservable inputs (Level 3) |
— | — | ||||||
|
$ | 1,805 | $ | 2,090 | ||||
86
Hawaiian Telcom Holdco, Inc.
Notes to Consolidated Financial Statements (Continued)
19. Fair Value of Financial Instruments (Continued)
Assets and liabilities measured at fair value on a non-recurring basis for the year ended December 31, 2010 represent all asset and liabilities recognized in conjunction with fresh-start accounting as of October 31, 2010. A summary of the revalued assets and liabilities is included in Note 4 including a discussion of the valuation methodology. The majority of assets and liabilities were revalued using level 3 significant unobservable inputs.
20. Cash Flow Information
Supplemental cash flow information is as follows:
| |
|
Predecessor | ||||||||||||
|---|---|---|---|---|---|---|---|---|---|---|---|---|---|---|
| |
Successor | |||||||||||||
| |
|
For the Year Ended December 31, |
||||||||||||
| |
Period from November 1 to December 31, 2010 |
Period from January 1 to October 31, 2010 |
||||||||||||
| |
2009 | 2008 | ||||||||||||
Cash paid during the year: |
||||||||||||||
Income taxes paid, net of refunds |
$ | — | $ | — | $ | — | $ | 459 | ||||||
Interest paid, net of amounts capitalized |
— | 10,865 | 14,863 | 62,793 | ||||||||||
21. Segment Information
The Company operates in two reportable segments (Wireline Services and Other) based on how resources are allocated and performance is assessed by the Chief Executive Officer, the Company's chief operating decision maker. The Wireline Services segment provides local telephone service including voice and data transport, enhanced custom calling features, network access, directory assistance and private lines. In addition, the Wireline Services segment provides television, Internet, long distance services, managed services, customer premise equipment, data solutions, billing and collection, and pay telephone services. The Other segment consists primarily of wireless services.
87
Hawaiian Telcom Holdco, Inc.
Notes to Consolidated Financial Statements (Continued)
21. Segment Information (Continued)
The following table provides operating financial information for the Company's two reportable segments (dollars in thousands):
| |
Wireline Services |
Other | Intersegment Elimination |
Total | |||||||||||
|---|---|---|---|---|---|---|---|---|---|---|---|---|---|---|---|
Successor |
|||||||||||||||
Period from November 1 to December 31, 2010 Operating revenues |
|||||||||||||||
Local voice and other retail services |
$ | 43,224 | $ | 1,009 | $ | (238 | ) | $ | 43,995 | ||||||
Network access services |
22,764 | — | — | 22,764 | |||||||||||
|
$ | 65,988 | $ | 1,009 | $ | (238 | ) | $ | 66,759 | ||||||
Depreciation and amortization |
$ | 9,723 | $ | — | $ | — | $ | 9,723 | |||||||
Net income (loss) |
3,640 | (511 | ) | — | 3,129 | ||||||||||
Capital expenditures |
19,134 | — | — | 19,134 | |||||||||||
Assets as of December 31, 2010 |
$ | 645,425 | $ | 611 | $ | — | $ | 646,036 | |||||||
Predecessor |
|||||||||||||||
Period from January 1 to October 31, 2010 |
|||||||||||||||
Operating revenues |
|||||||||||||||
Local voice and other retail services |
$ | 220,714 | $ | 5,179 | $ | (1,214 | ) | $ | 224,679 | ||||||
Network access services |
110,007 | — | — | 110,007 | |||||||||||
|
$ | 330,721 | $ | 5,179 | $ | (1,214 | ) | $ | 334,686 | ||||||
Depreciation and amortization |
$ | 136,564 | $ | 97 | $ | — | $ | 136,661 | |||||||
Net income (loss) |
188,398 | (2,604 | ) | — | 185,794 | ||||||||||
Capital expenditures |
60,053 | — | — | 60,053 | |||||||||||
For the year ended and as of December 31, 2009 Operating revenues |
|||||||||||||||
Local voice and other retail services |
$ | 273,065 | $ | 6,906 | $ | (1,444 | ) | $ | 278,527 | ||||||
Network access services |
130,068 | — | — | 130,068 | |||||||||||
|
$ | 403,133 | $ | 6,906 | $ | (1,444 | ) | $ | 408,595 | ||||||
Depreciation and amortization |
$ | 164,247 | $ | 129 | $ | — | $ | 164,376 | |||||||
Net loss |
(127,351 | ) | (3,383 | ) | — | (130,734 | ) | ||||||||
Capital expenditures |
89,361 | — | — | 89,361 | |||||||||||
Assets |
1,182,783 | 894 | — | 1,183,677 | |||||||||||
For the year ended and as of December 31, 2008 Operating revenues |
|||||||||||||||
Local voice and other retail services |
$ | 305,074 | $ | 9,391 | $ | (1,260 | ) | $ | 313,205 | ||||||
Network access services |
134,550 | — | — | 134,550 | |||||||||||
|
$ | 439,624 | $ | 9,391 | $ | (1,260 | ) | $ | 447,755 | ||||||
Depreciation and amortization |
$ | 160,149 | $ | 129 | $ | — | $ | 160,278 | |||||||
Net loss |
(153,895 | ) | (3,492 | ) | (1,260 | ) | (158,647 | ) | |||||||
Capital expenditures |
73,250 | — | — | 73,250 | |||||||||||
Assets |
1,272,757 | 321 | — | 1,273,078 | |||||||||||
88
Hawaiian Telcom Holdco, Inc.
Notes to Consolidated Financial Statements (Continued)