Attached files
| file | filename |
|---|---|
| 8-K - FORM 8-K - BILL BARRETT CORP | d8k.htm |
Exhibit 99.1

2010
FINANCIAL HIGHLIGHTS
| 2010 | 2009 | 2008 | ||||||||||
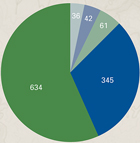
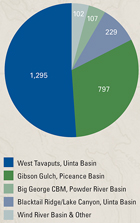
| Proved Reserves and Acreage |
||||||||||||
| Natural Gas, Bcf |
1,040.3 | 918.1 | 784.3 | |||||||||
| Oil, MMBbls |
13.0 | 7.8 | 5.7 | |||||||||
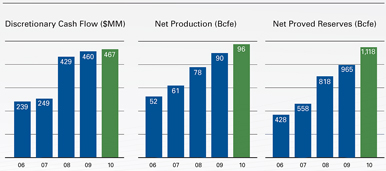
| Natural Gas Equivalents, Bcfe1 |
1,118.3 | 964.8 | 818.3 | |||||||||
| Percent Developed |
48 | % | 50 | % | 53 | % | ||||||
| Percent Natural Gas |
93 | % | 95 | % | 96 | % | ||||||
| Pretax PV-10, millions2 |
$ | 1,496 | $ | 685 | $ | 1,039 | ||||||
| Net Undeveloped Acreage, rounded |
1,340,000 | 1,251,000 | 1,203,000 | |||||||||
| Production |
||||||||||||
| Natural Gas, Bcf |
90.0 | 85.5 | 73.6 | |||||||||
| Oil, MBbls |
1,089 | 710 | 661 | |||||||||
| Natural Gas Equivalents, Bcfe |
96.5 | 89.7 | 77.6 | |||||||||
| Average Daily Production, MMcfe |
264 | 246 | 212 | |||||||||
| Percent Natural Gas |
93 | % | 95 | % | 95 | % | ||||||
| Average Realized Prices |
||||||||||||
| Natural Gas, including hedge effect, per Mcf |
$ | 6.74 | $ | 6.96 | $ | 7.61 | ||||||
| Oil Prices, including hedge effect, per Bbl |
$ | 69.91 | $ | 59.03 | $ | 69.55 | ||||||
| Operating Statistics |
||||||||||||
| Reserve Replacement |
263 | % | 264 | % | 436 | % | ||||||
| Capital Expenditures, millions |
$ | 473 | $ | 406 | $ | 601 | ||||||
| Producing Wells, gross/net |
1,860/1,448 | 1,585/1,236 | 1,463/1,140 | |||||||||
| Wells Drilled, gross/net |
275/182 | 186/164 | 430/331 | |||||||||
| Financial Data |
||||||||||||
| Net Income, millions |
$ | 81 | $ | 50 | $ | 105 | ||||||
| Earnings Per Share, diluted |
$ | 1.75 | $ | 1.12 | $ | 2.34 | ||||||
| Discretionary Cash Flow,2 millions |
$ | 467 | $ | 460 | $ | 429 | ||||||
| Production Revenue, per Mcfe |
$ | 7.07 | $ | 7.10 | $ | 7.81 | ||||||
| Lease Operating Expenses and Gathering, Transportation and Processing, per Mcfe |
$ | 1.26 | $ | 1.15 | $ | 1.08 | ||||||
| Production Taxes, per Mcfe |
$ | 0.34 | $ | 0.15 | $ | 0.57 | ||||||
| G&A, excluding non-cash stock-based compensation, per Mcfe |
$ | 0.42 | $ | 0.42 | $ | 0.52 | ||||||
| Depletion, Depreciation, and Amortization, per Mcfe |
$ | 2.70 | $ | 2.83 | $ | 2.66 | ||||||
| Discretionary Cash Flow,2 per Mcfe |
$ | 4.84 | $ | 5.12 | $ | 5.53 | ||||||
| Finding and Development Cost,2 per Mcfe |
$ | 1.84 | $ | 1.68 | $ | 1.76 | ||||||
| Finding and Development Cost, three-year average,2 per Mcfe |
$ | 1.76 | $ | 1.74 | $ | 1.99 | ||||||
| 1 | One barrel of oil is the energy equivalent of six Mcf of natural gas |
| 2 | A non-GAAP measure – see following disclosure |

TRACK RECORD OF GROWTH
|
|
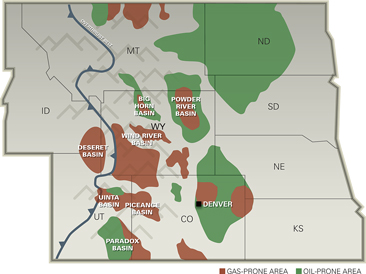
U.S. ROCKY MOUNTAIN FOCUS
|


|
Forward-Looking Statements
This report contains forward-looking statements regarding Bill Barrett Corporation’s future plans and expected performance based on assumptions the Company believes to be reasonable. A number of risks and uncertainties could cause actual results to differ materially from these statements, including, without limitation, fluctuations in oil and gas prices, the ability to receive drilling permits and other regulatory approvals, the availability and costs of services and materials, and other risk factors described in the Company’s accompanying Annual Report on Form 10-K for the year ended December 31, 2010.
New York Stock Exchange Certification
The New York Stock Exchange’s Rule 303A.12(a) requires chief executive officers of listed companies to certify that they are not aware of any violations by their companies of the exchange’s corporate governance listing standards. This annual certification by the chief executive officer of Bill Barrett Corporation has been filed with the New York Stock Exchange. In addition, Bill Barrett Corporation has filed, as exhibits to its most recently filed Form 10-K, the Securities and Exchange Commission (SEC) certifications required for the chief executive officer and chief financial officer under Section 302 of the Sarbanes-Oxley Act.
Non-GAAP Measures
Discretionary cash flow is computed by the Company as net income plus depreciation, depletion, and amortization, impairment expenses, deferred income taxes, dry hole costs and abandonment expenses, exploration expenses, non-cash stock-based compensation, losses (gains) on disposals of properties, and certain other non-cash charges. The non-GAAP measure of discretionary cash flow is presented because management believes that it provides useful additional information to investors for analysis of the Company’s ability to internally generate funds for exploration, development and acquisitions. In addition, discretionary cash flow is widely used by professional research analysts and others in the valuation, comparison and investment recommendations of companies in the oil and gas exploration and production industry, and many investors use the published research of industry research analysts in making investment decisions. Discretionary cash flow should not be considered in isolation or as a substitute for net income, income from operations, net cash provided by operating activities or other income, profitability, cash flow or liquidity measures prepared in accordance with accounting principles generally accepted in the United States of America (“GAAP”). Because discretionary cash flow excludes some, but not all, items that affect net income and net cash provided by operating activities and may vary among companies, the discretionary cash flow amounts presented may not be comparable to similarly titled measures of other companies.
Finding and development cost, or F&D cost, per Mcfe, is calculated by the Company beginning with “Total costs incurred” adjusted to: subtract the asset retirement obligation amount; subtract material non-cash capital items, subtract proceeds received from joint exploration agreements and certain property sales; and subtract capitalized interest; divided by reserve additions for the year. Consistent with industry practice, future capital expenditures to develop proved undeveloped reserves or capital associated with furniture, fixtures and equipment are not included in costs incurred. The method the Company uses to calculate its F&D cost may differ significantly from methods used by other companies to compute similar measures. As a result, the Company’s F&D cost may not be comparable to similar measures provided by other companies. The Company believes that providing a non-GAAP measure of F&D cost is useful to investors in evaluating the cost, on a per Mcfe basis, to add proved reserves. However, this measure is provided in addition to, and not as an alternative for, and should be read in conjunction with, the information contained in its financial statements prepared in accordance with GAAP. Due to various factors, including timing differences in the addition of proved reserves and the related costs to develop those reserves, F&D cost does not necessarily reflect precisely the costs associated with particular reserves. As a result of various factors that could materially affect the timing and amounts of future increases in reserves and the timing and amounts of future costs, the Company cannot assure you that its future F&D cost will not differ materially from those presented.
Pretax PV-10 is the present value of the cash flows from proved reserves, based on a Colorado Interstate Gas natural gas price of $3.95 per MMBtu and a West Texas Intermediate oil price of $75.96 per barrel, before the effect of income taxes and discounted at 10% per annum.
For a reconciliation of these non-GAAP measures to financial information prepared in accordance with GAAP, refer to our Current Reports on Form 8-K, including the February 23, 2011 Form 8-K, filed with the SEC.
Reserve Disclosure
The SEC, under its recently revised guidelines, permits oil and gas companies to disclose probable and possible reserves in their filings with the SEC. The Company does not plan to include probable and possible reserve estimates in its filings with the SEC.
The Company has provided internally generated estimates for probable and possible reserves in this report. The estimates conform to SEC guidelines. They are not prepared or reviewed by third-party engineers. Our probable and possible reserve estimates are determined using strip pricing, which we use internally for planning and budgeting purposes. The Company’s estimate of probable and possible reserves is provided in this presentation because management believes it is useful, additional information that is widely used by the investment community in the valuation, comparison and analysis of companies. U.S. investors are urged to consider closely the disclosure in our Annual Report on Form 10-K for the year-ended December 31, 2010, available on the Company’s website at www.billbarrettcorp.com or from the corporate offices at 1099 18th Street, Suite 2300, Denver, CO 80202. You can also obtain this form from the SEC by calling 1-800-SEC-0330 or at www.sec.gov. | |
| BOARD OF DIRECTORS
Fredrick J. Barrett, Chairman of the Board, Chief Executive Officer and President
James M. Fitzgibbons, Past Chairman of Davidson Cotton Company
Randy A. Foutch, Chairman and Chief Executive Officer of Laredo Petroleum, Inc.
Jim W. Mogg, Lead Director; Past Chairman of DCP Midstream Partners
William F. Owens, Former Governor of Colorado
Edmund P. Segner, Past President and Chief of Staff of EOG Resources, Inc.
Randy I. Stein, Tax, Accounting and Business Consultant, Former Principal of PricewaterhouseCoopers LLP
Michael E. Wiley, Past Chairman and Chief Executive Officer of Baker Hughes Incorporated
OFFICERS
Fredrick J. Barrett, Chairman of the Board, Chief Executive Officer and President
Robert W. Howard, Chief Financial Officer and Treasurer
R. Scot Woodall, Chief Operating Officer
Francis B. Barron, Executive Vice President—General Counsel and Secretary
Kurt M. Reinecke, Executive Vice President—Exploration
Terry R. Barrett, Senior Vice President—Exploration
Lynn Boone Henry, Senior Vice President—Planning and Reserves
David R. Macosko, Senior Vice President—Accounting
Stephen W. Rawlings, Senior Vice President—Operations
Wilfred R. Roux, Senior Vice President—Geophysics
Huntington T. Walker, Senior Vice President—Land
Duane J. Zavadil, Senior Vice President—Government and Regulatory Affairs
Michael R. Craig, Vice President—Information Technology
William M. Crawford, Vice President—Finance
Jennifer C. Martin, Vice President—Investor Relations
Larry A. Parnell, Vice President—Business Development
Troy L. Schindler, Vice President—Drilling
Monty D. Shed, Vice President—Production
Michele Vion, Vice President—Human Resources |
CORPORATE INFORMATION
Corporate Office
1099 Eighteenth Street Suite 2300 Denver, Colorado 80202 Telephone: 303-293-9100 Fax: 303-291-0420 www.billbarrettcorp.com
Investor Relations
Jennifer Martin Vice President—Investor Relations jmartin@billbarrettcorp.com
Annual Stockholders’ Meeting
Our annual stockholders’ meeting will be held at 9:30 a.m. (MDT) on Thursday, May 12, 2011 at The Westin Denver Downtown Tabor Auditorium 1672 Lawrence Street Denver, Colorado 80202
Transfer Agent
BNY Mellon Shareowner Services 480 Washington Boulevard Jersey City, New Jersey 07310 1-866-683-2961 (dedicated line) 1-800-522-6645 (main) Internet: www.bnymellon.com/shareowner/isd
Independent Auditors
Deloitte & Touche LLP Denver, Colorado
Independent and Outside Reservoir Engineers
Netherland, Sewell & Associates, Inc. Dallas,Texas |
Design: Rassman Design Printing: RR Donnelley

1099 18th Street, Suite 2300
Denver, Colorado 80202
303-293-9100
www.billbarrettcorp.com
