Attached files
| file | filename |
|---|---|
| 8-K - FORM 8-K - Pinnacle Foods Finance LLC | d8k.htm |
 Pinnacle
Foods Barclays Capital 2011 High Yield Bond
and Syndicated Loan Conference
March 24, 2011
Exhibit
99.1 |
| 2
Forward-Looking Statements and GAAP Reconciliation
Forward-looking statements should not be read as a guarantee of future performance or
results, and will not necessarily be accurate indications of the times at, or by which,
such performance or results will be achieved or whether such performance or results will
ever be achieved. Forward-looking information is based on information available at
the time and management’s good faith belief with respect to future events, and is
subject to risks and uncertainties that could cause actual performance or results to differ
materially from those expressed in the statements.
Forward-looking statements speak only as of the date the statements are made.
Pinnacle Foods Finance LLC (“Pinnacle Foods,” “Pinnacle”
or the “Company”) assumes no obligation to update forward-looking statements to
reflect actual results, changes in assumptions or changes in other factors affecting
forward-looking information except to the extent required by applicable securities
laws. If the Company does update one or more forward-looking statements, no
inference should be drawn that the Company will make additional updates with respect
thereto or with respect to other forward-looking statements. SEC
rules
regulate
the
use
of
“non-GAAP
financial
measures”
in
public
disclosures,
such
as
free
cash
flow,
“EBITDA”
“Adjusted
EBITDA”
and “Consolidated EBITDA”, that are derived on the basis of methodologies other
than in accordance with generally accepted accounting principles, or
“GAAP.” These rules govern the manner in which non-GAAP financial
measures may be publicly presented and prohibit in all filings with the SEC, among
other things: •
exclusion of charges or liabilities that require, or will require, cash settlement or would
have required cash settlement, absent an ability to settle in another manner, from a
non-GAAP financial measure; and •
adjustment of a non-GAAP financial measure to eliminate or smooth items identified as
non-recurring, infrequent or unusual, when the nature of the charge or gain is such
that it has occurred in the past two years or is reasonably likely to recur within the
next two years.
We have included non-GAAP financial measures in this presentation, including free cash
flow, EBITDA, Adjusted EBITDA and Consolidated EBITDA, that may not comply with the SEC
rules governing the presentation of non-GAAP financial measures. In addition,
the Company’s measurements of Consolidated EBITDA are based on definitions of EBITDA included in certain of the
Company’s debt agreements and, as a result, may not be comparable to those of other
companies. Also, free cash flow may not be comparable to similarly titled amounts
presented by other companies. |
 3
The Marketplace was Challenging in 2010…
“In short, revenue growth is being compressed for food
manufacturers because a protracted lack of growth for
their retailer partners is creating a more adversarial,
discount oriented dynamic.”
UBS -
June 3, 2010
“Current industry volume growth is so bleak already that
it’s hard for us to see the possibility of a significant further
deterioration.”
Barclays Capital -
October 21, 2010
“We see risk that food company’s margins retrace recent
gains given the sluggish topline growth and heightened
competitive backdrop.”
Goldman Sachs -
October 17, 2010 |
 4
In a Tough Environment, Pinnacle Delivered Solid
Results in 2010
* Product Contribution = Gross Margin less consumer marketing and brokerage
**After adjusting actual results for adjustments per Senior Credit Facility and Bond
Indentures |
 5
Key Performance Drivers
•
Brand strength
•
Pinnacle brands hold #1 or #2 market position in 8 of 12 major category segments in which
they compete
•
Limited private label penetration
•
Enhanced innovation capabilities driving improved pipeline
•
New agency partners |
 Category
Segments Major Brands
Market Position
IRI Market
Share
Frozen Vegetables
#1
26.7
Shelf-Stable Pickles, Peppers and Relish
#1
18.7
Baking Mixes and Frostings
#2
17.1
Frozen Complete Bagged Meals
#2
17.4
Table Syrups
#2
18.5
Frozen Prepared Seafood
#2
19.2
Frozen Waffles, Pancakes and French Toast
#2
15.1
Frozen Breakfast Entrées / Savory
Handhelds
#2
7.9
Canned Meat
#3
10.5
Bagels
#3
7.4
Single-Serve Frozen Dinners and Entrées
#4
8.8
Frozen Pizza-for-One
#4
10.1
Source: IRI -
52 week end Dec. 26, 2010 -
Total US Food
Iconic, Leading Brand Equities
Pinnacle holds the #1 or #2 market position in 8 of the 12 major
category segments
Categories with above average private label penetration
6 |
 Enhanced
Innovation Capabilities Driving Improved Pipeline New Consumers
Health & Wellness
Premium / Experience
New Segment
7 |
 8
Improved Marketing/Alignment with New Agency Partners
Agency
Key Clients
BBDO (Creative Advertising)
Starbucks, GE, Fed Ex, Mars, Diageo, Gillette
TBWA (Creative Advertising)
Apple, Absolute, Adidas, Visa, McDonalds, P+G
Zenith Optimedia (Media Buying)
HP, Lexus, Nestle, Verizon, Darden, P+G
8 |
| Key Performance
Drivers •
Brand strength
•
Pinnacle brands hold #1 or #2 market position in 8 of 12 major category segments in which
they compete
•
Limited private label penetration
•
Enhanced innovation capabilities driving improved pipeline
•
New agency partners
•
Portfolio diversification
•
Participation in a broad set of categories
•
Scale where needed –
5
largest frozen food company
th
9 |
 10
Snacks
4% 4%
Private Label 7%
4%
5%
5%
20%
Canada
3% Other 5% 5%
6%
9%
10%
Other
5% Foodservice 7% Participation in a Broad Set of Categories
___________________________
LTM as of 12/26/10.
Duncan Hines Grocery Division
Birds Eye Frozen Division
Specialty Foods Division |
 11
$5,342
16.8
$1,712
5.4
$1,508
4.7
$1,450
4.6
$1,288
4.0
$1,231
3.9
$913
2.9
$801
2.5
$618
1.9
$553
1.7
$ Share
Source: IRI -
52 week end Dec. 26, 2010 -
Total US Food
Pinnacle Ranks Fifth in Frozen
$ Sales ($MM) |
| 12
Key Performance Drivers
•
Brand strength
•
Pinnacle brands hold #1 or #2 market position in 8 of 12 major category segments in which they
compete •
Limited private label penetration
•
Enhanced innovation capabilities driving improved pipeline
•
New agency partners
•
Portfolio diversification
•
Participation in a broad set of categories
•
Scale
where
needed
–
5
largest
frozen
food
company
•
Nimble, responsive organization
•
Experienced senior team
•
Management alignment to value creation
•
Speed
–
Birds
Eye
integration
th |
 |
 14
Birds Eye integration has been well executed
Supply Chain integrated by 6/30/10 -
“one order/one invoice”
Supply Chain integrated by 6/30/10 -
“one order/one invoice”
Full business integration by 9/30/2010
Full business integration by 9/30/2010
Hired/on-boarded 130 open positions
Hired/on-boarded 130 open positions
Upgraded management capabilities
Upgraded management capabilities
Achieved $25MM of synergies in 2010
Achieved $25MM of synergies in 2010
Actions in place to deliver an additional $25MM of synergies in 2011
Actions in place to deliver an additional $25MM of synergies in 2011
|
 15
Key Performance Drivers
•
Brand strength
•
Pinnacle brands hold #1 or #2 market position in 8 of 12 major category segments in which they
compete •
Limited private label penetration
•
Enhanced innovation capabilities driving improved pipeline
•
New agency partners
•
Portfolio diversification
•
Participation in a broad set of categories
•
Scale
where
needed
–
5
largest
frozen
food
company
•
Nimble, responsive organization
•
Experienced senior team
•
Management alignment to value creation
•
Speed
–
Birds
Eye
integration
•
Dependable financial model
•
Solid 2010 financial results
•
Refinanced debt; extending maturity and lowering debt service cost
•
Accelerating productivity / pricing actions
th |
 Financial Performance |
 17
2010 Year in Review
•
Strong
results
with
Adjusted
EBITDA
up
+14%
y-o-y
to
$447
million
(1)
•
Generated $202 million of free cash flow in FY 2010
•
Gross Margin +240 bps from favorable product mix, Birds Eye acquisition synergies,
productivity initiatives and favorable commodity prices as a result of good 2009 crop
season
(2)
.
•
Net
Leverage
has
declined
from
6.0x
at
the
time
of
the
Birds
Eye
transaction
to
5.7x
as
of
December 2010
•
Net Sales decline of -4.7% in 2010 was driven by the Company’s continued efforts to
deemphasize Private Label and Foodservice offerings, its announced discontinuation of
Birds Eye's Steamfresh Meals and Swanson Classics in the U.S., and a tough trading
environment •
North American Retail sales (ex. Exited Businesses) declined 1.2% 2010 vs. 2009
•
Refinanced debt…extending maturity and lowering debt service cost
•
Leverage neutral transaction with reduction in overall cost of capital
•
Replaced Term Loan C with $442MM Term Loan D and $400MM 8.25% Senior Notes
•
Term Loan D applicable margin 150bps lower than Term Loan C
•
Enhanced current debt maturity profile (New Senior Notes due September 2017)
___________________________
1.
Before variable product contribution from exited businesses of $2.8mm and estimated synergies
yet to be realized associated with the Birds Eye Acquisition of $25mm.
2.
After adjusting actual results for adjustments per Senior Credit Facility and Bond
Indentures |
 18
2010 Financial Summary
___________________________
1.
Pro forma for Birds Eye acquisition.
Actual
Actual
($s in millions)
2009
(1)
2010
$
%
Net Sales
2,548
$
2,437
$
(111)
$
-4.4%
North American Retail (ex. exited businesses)
2,036
2,012
(24)
-1.2%
COPS
1,935
1,835
100
5.2%
% Net Sales
75.9%
75.3%
Gross Profit
613
602
(11)
-1.8%
% Net Sales
24.1%
24.7%
Advertising and Consumer
84
59
25
29.8%
% Net Sales
3.3%
2.4%
SG&A and other
273
278
(5)
-1.8%
% Net Sales
10.7%
11.4%
EBIT
256
265
9
3.5%
% Net Sales
10.0%
10.9%
Depreciation & Amortization
83
78
(5)
-6.0%
Reported EBITDA
339
343
4
1.2%
% Net Sales
13.3%
14.1%
Adjusted EBITDA
391
$
447
$
56
14.3%
% Net Sales
15.3%
18.3%
Variance to Prior Year |
 19
2010 Consolidated EBITDA Reconciliation
___________________________
1.
Pro forma for Birds Eye acquisition.
Actual
Actual
($s in millions)
2009
(1)
2010
Reported EBITDA
339
$
343
$
Adjustments per Senior Credit Facility and Bond Indentures
Non-cash items
8
72
Non-recurring items
40
27
Other adjustment items
4
5
Subtotal - Adjusted EBITDA
391
447
Variable product contribution from exited businesses
24
3
Net cost savings to be realized as a result of initiatives taken
12
Estimated synergies associated with the Birds Eye acquisition
45
25
Consolidated EBITDA (per Senior Credit Facility and Bond Indentures)
472
$
475
$ |
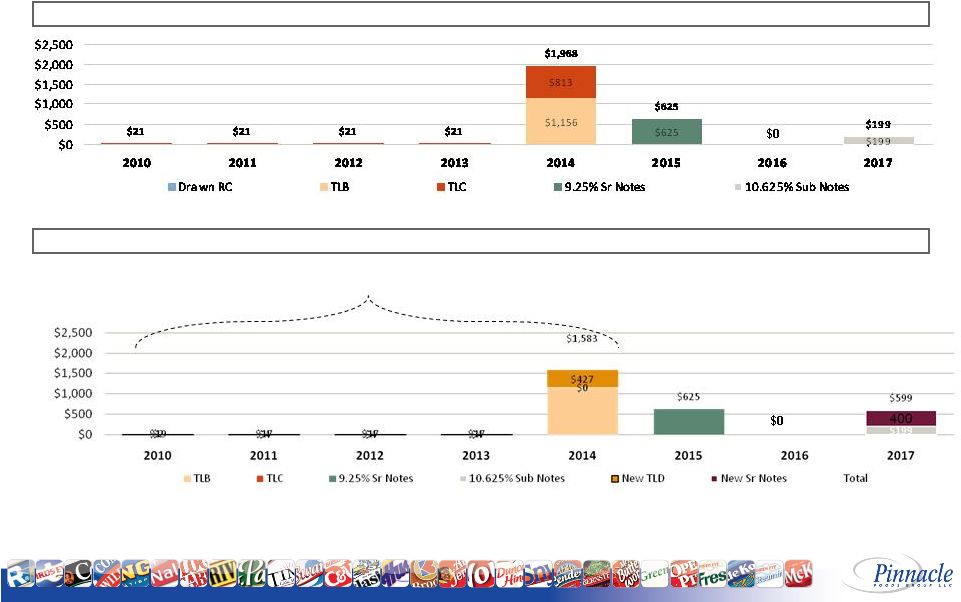 20
Refinanced Debt; Extending Maturity and Lowering
Debt Service Costs
Debt Maturities Post Refinancing
Debt Maturities Pre Refinancing
~$400mm
Reduction
___________________________
Note: Excludes maturity of Revolving Credit Facility which was undrawn as of
December 26, 2010. |
 21
December 2010 Debt Structure
($s in millions)
December 2010
Revolving Credit Facility
$ ----
Term Loan B
1,199.4
Term Loan D
368.2
9.25% Senior Notes
625.0
8.25% Senior Notes
400.0
10.625% Senior Subordinated Notes
199.0
Other Debt
15.8
Total Debt
2,807.4
Cash
(115.3)
Total Net Debt
2,692.1
Total Leverage Ratio (per Senior Credit Facility and
Bond Indentures)
5.7 |
 22
Accelerating Productivity Initiatives
Targeting
the
high
end
of
our
range
of
3.5%
-
-
4.0%
of
cost
of
products
sold
Productivity
and
pricing
actions
offsetting
inflation
Full
line
of
sight
on
2011
input
costs
Structured,
multi-functional
team
and
process
in
place
Multi-year
capital
investment
to
accelerate
productivity
including
2011
footprint
consolidation
___________________________
1.
Excluding Birds Eye
Procurement
Procurement
Procurement
Manufacturing
Manufacturing
Manufacturing
Logistics
Logistics
Logistics
2009 (1)
2010
2011 Target |
 23
Announced Pricing Partially Offsetting Inflation
Category
Effective Date
Baking Mixes / Frosting
1/03/11
Syrups
3/07/11
Canned Fruit
3/07/11
Waffles
3/28/11
Bagels
3/28/11
Vegetables
5/2/11
Seafood
5/2/11
Hungry-Man
(classic fried chicken)
5/2/11 |
 Food for
Thought: Solid 2010 Financial Results in
a Challenging Environment
Successful Integration of
Birds Eye Acquisition
Re-energized Innovation
Pipeline
Accelerating Productivity
Refinanced Debt; Extending
Maturity and Lowering Debt
Service Costs |
 25
Key Investment Highlights
Successful History
of Brand
Renovation and
Product
Innovation
Proven
Management
Team
Continued
Solid Financial
Performance
Delivering
$50mm in
Synergies
Proven Brand
Equities
Birds Eye
Integration
Successfully
Completed
High Recurring
Cash Flow |