Attached files
| file | filename |
|---|---|
| 8-K - FIRST MERCHANTS CORP 8-K 3-24-2011 - FIRST MERCHANTS CORP | form8k.htm |
 |
 |
|||
 |
 |
The Strength of Big, the Service of Small
2010 annual report
|
||
 |
||||
|
First Merchants Corporation
|
|||
|
Corporate Profile
|
|||
|
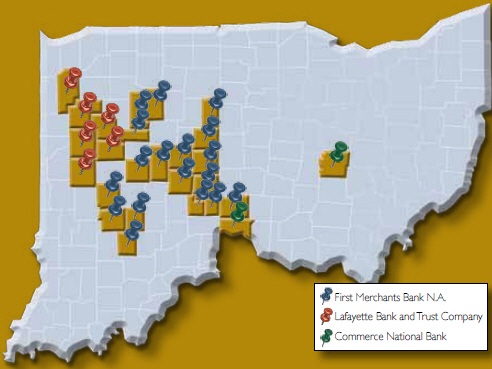
First Merchants Corporation (Nasdaq: FRME) is the largest financial holding company based in Central Indiana. Since 1893, First Merchants has provided the best of what banking can offer, customer-valued products and services delivered locally by bankers who are known and trusted in their communities. The Corporation has grown to include banks with 79 locations in 23 Indiana and 2 Ohio counties, a trust company and a multi-line insurance company. As of December 31, 2010 total asset size of First Merchants Corporation was $4.2 billion.
We are focused on building deep, lifelong client relationships and providing maximum shareholder value. We provide an experience where customers can bank with their neighbors, realizing that our business begins and ends with people.
|
BANK DIVISIONS
Bank divisions within the corporation include:
First Merchants Bank N.A., in Adams, Brown, Delaware, Fayette, Hamilton, Hendricks, Henry, Howard, Jay, Johnson, Madison, Miami, Morgan, Randolph, Union, Wabash, Wayne in Indiana and Butler County, Ohio.
Lafayette Bank and Trust Company, a division of First Merchants Bank N.A., in Carroll, Clinton, Jasper, Montgomery, Tippecanoe and White Counties.
Commerce National Bank, a division of First Merchants Bank N.A., in Franklin County, Ohio.
First Merchants Trust Company, a division of First Merchants Bank, N.A., represents one of the largest trust companies in the state of Indiana.
The Corporation also operates First Merchants Insurance Group, a full-service property, casualty, personal lines, and health care insurance agency.
 |
||
|
Table of Contents
|
|||
|
Financial Highlights
|
1
|
||
|
To Our Stockholders
|
2
|
||
|
The Year in Review
|
4
|
||
|
Financial Statements
|
8
|
||
|
Locations
|
15
|
||
|
Directors & Executive Officers
|
17
|
||
|
Corporate Information
|
17
|
||
|
MISSION
To deliver superior personalized financial solutions to consumer and closely held commercial clients in diverse community markets by providing sound advice and products that exceed customer expectations.
|
|||
2010 Annual Report 1
FINANCIAL HIGHLIGHTS
|
December 31
|
Percent
|
|||||||||||
|
(Dollars in thousands, except share data)
|
2010
|
2009
|
Change
|
|||||||||
|
YEAR-END BALANCES
|
||||||||||||
|
Total Assets
|
$ | 4,170,848 | $ | 4,480,952 | - | 6.9 | % | |||||
|
Total Loans
|
2,857,152 | 3,277,824 | - | 12.8 | ||||||||
|
Total Deposits
|
3,268,880 | 3,536,536 | - | 7.6 | ||||||||
|
Total Stockholders' Equity
|
454,408 | 463,785 | - | 2.0 | ||||||||
|
RESULTS OF OPERATIONS
|
||||||||||||
|
Net Interest Income
|
$ | 143,569 | $ | 153,346 | - | 6.4 | % | |||||
|
Total Other Income
|
48,544 | 51,201 | - | 5.2 | ||||||||
|
Provision for Loan Losses
|
46,483 | 122,176 | - | 62.0 | ||||||||
|
Total Other Expenses
|
142,311 | 151,558 | - | 6.1 | ||||||||
|
Net Income (Loss) available to common stockholders
|
11,722 | (45,742 | ) | + | 125.6 | |||||||
|
PER SHARE DATA
|
||||||||||||
|
Net Income (Loss) Per Share (Diluted) available to common stockholders
|
$ | 0.48 | $ | (2.17 | ) | + | 122.1 | % | ||||
|
Cash Dividends Paid - Common
|
0.04 | 0.47 | - | 91.5 | ||||||||
|
December 31 Book Value - Common
|
15.11 | 16.55 | - | 8.7 | ||||||||
|
December 31 Market Value (Bid Price) - Common
|
8.86 | 5.94 | + | 49.2 | ||||||||
|
FINANCIAL RATIOS
|
||||||||||||
|
Return on Average Assets
|
0.27 | % | (0.98 | )% | + | 127.6 | % | |||||
|
Return on Average Stockholders' Equity
|
2.49 | (9.59 | ) | + | 126.0 | |||||||
|
Allowance for Loan Losses as % of Total Loans
|
2.90 | 2.81 | + | 3.2 | ||||||||
See Annual Report on Form 10-K for complete consolidated financials.
|
Average Stockholders' Equity
(in millions)
|
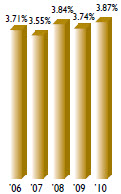
Net Interest Margin
on Earning Assets
|
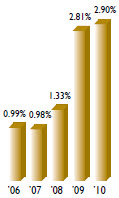
Allowance as % of Loans
|
Loan to Deposit Ratio
|
 |
 |
 |
 |
2 First Merchants Corporation
|
TO OUR STOCKHOLDERS:
|
||
|
The results of 2010 are much better than those of 2009 — a $57 million positive swing in profitability and a $14 million improvement in earnings in the fourth quarter over those of the same quarter of 2009. Certainly a substantial improvement, but not nearly what we can achieve.
Here are a few comparative highlights: (a more detailed analysis follows in the “The Year in Review,” beginning on page 4.) Earnings per share for 2010 were $0.48 compared with a loss of $2.17 per share in 2009. The improved results reflected an approximate $10 million gain achieved when we restructured some of our CPP capital (Government’s Capital Purchase Program), improved net investment income, and substantially reduced amounts needed to provide for loan losses, thus indicating an improving trend in the quality of our loans.
Simultaneously, our net interest margin improved 13 basis points to 3.87 percent of earning assets from the previous year. This resulted from additional core deposits, improved funding costs and reduced interest rates in effect in 2010. Equally important, our net interest margin was 5.2 percent better than our banking peers.
Finally, earnings from operations were the highest in our fourth quarter, and it appears that trend is continuing in 2011, barring any unforeseen events this year. That said, 2010 figures are history, and we believe that shareholders want to know more about the outlook for 2011.
THE LOOK AHEAD
First, the economy seems to be recovering from the doldrums of the past two years. Second, our two largest
|
 Charles E. Schalliol, Chairman, (left) with Michael C. Rechin, President & CEO
markets (Indianapolis, Indiana, and Columbus, Ohio,) are achieving improved results largely because we’ve hit upon a successful marketing strategy that attracts higher-income, financially sound commercial borrowers. As a result, we are able to channel funds beyond the needs of our mature markets into these growing markets without the usual costs to fund these additional loans. Because these are quality relationships located in markets where we already have staff to administer and service these relationships, our costs relative to them are more economical.
OPTIMAL SIZE
The costs to a be a public corporation and an FDIC insured bank weigh disproportionately heavily on small bank holding companies, as they have relatively few bank offices to absorb these costs. As a result they have little left over for marketing ventures and improving customer services.
|
|
“Marked improvements throughout the Company enabled us to earn demonstrably more in 2010 than in 2009. More important, we are better positioned in all of our markets to drive earnings even higher.”
— Michael C. Rechin, President and CEO
|
 |
||
2010 Annual Report 3
|
Consequently, their ability to compete is challenged. Some may become available for mutually beneficial acquisitions that will fit well within our community banking model. With more than $4 billion in assets we are well positioned to secure additional growth in the marketplace.
Our size (the largest in central Indiana) relative to the national banking giants also plays in our favor: Simply stated, we are more nimble and able to prioritize service.
Our ability to move quickly becomes strategically decisive in delivering customer service. This we think will prove to be the factor that determines future banking prosperity. Size also impacts costs. The smaller banks find their pay structure insufficient to attract outstanding personnel, and the giant national banks have layers of bureaucracy that slow the decision process and make many loans less profitable.
In short we’re large enough to outcompete smaller banks when it comes to introducing and delivering new products and services and yet agile enough to outmaneuver the larger banks when it comes to personalized service.
While attractive acquisitions will almost certainly become available in the years ahead, we do not rely on them as the primary driver to boost earnings. Rather, we believe the lion’s share of our results will be derived primarily from expanding our core business, which is precisely our focus for the next several years.
Shareholder Relations
A sizable portion of our plan going forward is to make the inherent worth of our bank holding company more readily
|
visible to the investing community. Given what the near-term future appears to hold, we believe that value investors may well be attracted to our stock as it is presently selling for just under 90 percent of tangible book value.
We plan to utilize our website more effectively and make our investment rationale more transparent to our shareholders.
Further, we recognize the present dividend falls short of what income investors require. We plan to address this as soon as a larger payout becomes assuredly sustainable.
Finally, at the start of 2010, we challenged our associates to deliver the service that would be the envy in all of our markets, streamlined our operations to bring us a unified front throughout our systems and improved our capital structure to enable us to thrive as we embark upon the next phase of our growth plan. We believe we are well on our way.
Sincerely,
/s/ Michael C. Rechin
Michael C. Rechin
President and CEO
/s/ Charles E. Schalliol
Charles E. Schalliol
Chairman of the Board
March 21, 2011
|
|
Total Capital to
Risk-weighted Assets
|
Tier 1 Capital to
Risk-weighted Assets
|
Tier 1 Capital
to Average Assets
|
Tangible Capital
to Tangible Assets
|
 |
 |
 |
 |
4 First Merchants Corporation
 |
THE YEAR IN REVIEW
IMPROVEMENTS IN STOCKHOLDERS’ EQUITY
Our efforts during this past year resulted in improved performance throughout the organization. Our primary efforts were to improve our capital structure, specifically the mix of Hybrid Capital and Equity Capital. Here’s what we did and why it’s important.
In February 2009, we decided to participate in the U.S. Treasury’s voluntary Capital Purchase Program (CPP ) and received $116 million in equity capital by issuing 116,000 shares of Preferred Stock and a warrant to purchase additional shares of the company’s common stock.
Fast forward to March of 2010. Here we took the initiative and presented the U.S. Treasury with a proposal to exchange $46.4 million of the Company’s cumulative perpetual preferred stock for trust preferred securities. They agreed, and on June 30th we completed the transaction, which resulted in a $10.1 million gain due to the favorable accounting treatment of the newer securities. This transaction increased the holding company’s Tangible Common Equity Ratio nearly 25 basis points.
Second, we raised $24.15 million in private placement equity by selling 4.2 million common shares to six different institutional investors. All told these activities improved the bank’s key capital ratios to even healthier levels and substantially above the “well capitalized” regulatory guidelines.
|
|||
 |
||||
|
Top: Because of the accelerated growth of their Company, Mr. Patrick James, CEO and David Washburn of Heritage Technologies partnered with First Merchants and secured $11.5 million in loans to build a 30,000 sq. ft. expansion to add new product lines to their mirconutrient business. Middle: Home to Super Bowl 2012, Indianapolis is growing faster than the national average and is one of the Bank’s fastest growing markets. Right: We grew deposits last year in our Lafayette market, home to the Purdue Research Park where more than 140 companies working in the fields of life sciences, advanced manufacturing and engineering, have originated. First Merchants has developed several banking relationships with companies located at the 725 acre campus just north of Purdue University.
|
 |
2010 Annual Report 5
|
A RET URN TO PROFITABILITY
For the year, the Company earned $0.48 cents per common share from net income totaling $11.7 million. This compares quite favorably to 2009’s results of a loss of $2.17 per common share and a net loss of $45.7 million. The $57 million swing to the positive was driven by prudent management of the loan portfolio which resulted in a dramatic $75.7 million reduction in the provision for loan losses to $46.5 million compared with $122.2 million in 2009. Net interest income after provision for loan losses increased 211% to $97 million, up from $31.1 million in 2009. This, along with a reduction in our expenses, proved our resiliency to adapt to what is still a sluggish economy.
|
 |
|
Above: Not content to stand pat, the Bank continues to invest in its mature markets. First Merchants is investing nearly $1 million to upgrade its Madison Street location in Muncie.
|
Because of a nation-wide consumer focus on reducing debt and much uncertainty in the job market, our total assets were down $311 million to $4.17 billion at the end of 2010. We simply did not lend as much money last year as we did in 2009, and total loans, including those held for sale decreased by $421 million to $2.86 billion.
|
|
|
However, we did not sit idle. We used the additional liquidity to pay down higher-priced deposit liabilities and advances from the Federal Home Loan Bank. These reductions totaled $400 million for 2010.
Further, we took the remaining surplus funds and reinvested them in our investment portfolio which now totals $827 million, an increase of $264 million during the past year. Its yield is an enviable 4.15% compared with our peer group’s average of approximately 3.75%. Management has worked diligently on the portfolio and is pleased with its position over the near term.
THE ONLY CONSTANT IS CHANGE
One of the most important accomplishments last year was the melding of our back-office operations into one common platform that will enable us to move decisively quicker and more profitably when we implement system wide changes in our efforts to better serve our customer. Part of it was necessitated because of the various banking charters that we maintained and part of it was caused by the evolution of banking software. Previously the Company had nine different charters. Now we have one. This has become increasingly important as a direct result of the dramatic changes in the banking industry and the demographic changes of our customers.
|
6 First Merchants Corporation

|
In 1990 there were slightly more than 15,000 banks. Today that number is 7,830. This consolidation is expected to accelerate in the next five years with estimates putting the number of banks at 5,000, an additional 33% reduction.
In addition to consolidation, banks today are faced with the online banking explosion of services. Households banking on line grew 170% from 2001 to 2009. Mobile banking software, unheard of a few years ago, is now available for
|
 |
|
|
Above: Columbus, OH: Our custom marketing program, unheard of for a bank our size, is geared toward privately held companies with an emphasis in healthcare. The Bank provided several loans to Drs. Love and Barry that enabled them to greatly expand their dental practice as well as assisted them in restructuring the partnership. While the dental practice had several competitive banking bids to chose from ultimately their access to the Bank’s senior management for counsel and service let them choose First Merchants division, Commerce National.
|
2010 Annual Report 7
|
just about every smartphone. Generation Y consumers value mobile device capabilities more than the availability of branches and ATMs when choosing a bank. Couple this definite transition from a physical to a virtual distribution of banking services and one can see how a single platform from which new services and features can be implemented immediately delivers a compelling argument for First Merchants. As banking regulations become increasingly onerous for smaller banks, even the higher performing ones will have to consider a merger if they want to serve these changing demographics.
Our back-office operations center is intelligently designed to handle a demonstrably larger asset base than it does currently with no discernible increase in expense.
BOAR D OF DIRECTORS CHANGES
We wish to acknowledge the departure of two board members. Thomas Clark has chosen to not stand for reelection after 22 years of faithful and valuable service.
Barry Hudson is leaving us because he has reached the mandatory retirement age for our directors. Barry joined us with the acquisition of First National Bank of Portland in 1999 and has been a banking and community leader in our East Central Indiana markets. Their candor and advice in these trying times were especially valuable, and each will be sorely missed.
We wish them well in their future endeavors.
|
Small business
loans will help
drive earnings
in our markets
in 2011.
|
|||
 |
||||
|
Total Return Performance
The following graph compares the cumulative 5-year total return to shareholders on First Merchants Corporation’s common stock relative to the cumulative total returns of the Russell 2000 index and the SNL Bank $1B – $5B index. The graph assumes that the value of the investment in the Corporation’s common stock and in each of the indexes (including reinvestment of dividends) was $100 on December 31, 2005 and tracks it through December 31, 2010.
|
||
 |
|
Index
|
Dec. 31, 2005
|
Dec. 31, 2006
|
Dec. 31, 2007
|
Dec. 31, 2008
|
Dec. 31, 2009
|
Dec. 31, 2010
|
|||||||||||||||||||
|
First Merchants Corporation
|
100.00 | 108.47 | 90.75 | 96.23 | 27.29 | 40.91 | |||||||||||||||||||
|
Russell 2000
|
100.00 | 118.37 | 116.51 | 77.15 | 98.11 | 124.46 | |||||||||||||||||||
|
SNL Bank $1B-$5B
|
100.00 | 115.72 | 84.29 | 69.91 | 50.11 | 56.81 | |||||||||||||||||||
The stock price performance included in this graph is not necessarily indicative of future stock price performance.
8 First Merchants Corporation
FIVE–YEAR SUMMARY OF SELECTED FINANCIAL DATA
|
(Dollars In thousands, except share data)
|
2010
|
2009
|
2008
|
2007
|
2006
|
|||||||||||||||
|
OPERATIONS(1)
|
||||||||||||||||||||
|
Net Interest Income Fully Taxable Equivalent (FTE) Basis
|
$ | 149,434 | $ | 159,068 | $ | 133,083 | $ | 117,247 | $ | 114,076 | ||||||||||
|
Less Tax Equivalent Adjustment
|
5,865 | 5,722 | 3,699 | 4,127 | 3,981 | |||||||||||||||
|
Net Interest Income
|
143,569 | 153,346 | 129,384 | 113,120 | 110,095 | |||||||||||||||
|
Provision for Loan Losses
|
46,483 | 122,176 | 28,238 | 8,507 | 6,258 | |||||||||||||||
|
Net Interest Income After Provision for Loan Losses
|
97,086 | 31,170 | 101,146 | 104,613 | 103,837 | |||||||||||||||
|
Total Other Income
|
48,544 | 51,201 | 36,367 | 40,551 | 34,613 | |||||||||||||||
|
Total Other Expenses
|
142,311 | 151,558 | 108,792 | 102,182 | 96,057 | |||||||||||||||
|
Income (Loss) Before Income Tax Expense (Benefit)
|
3,319 | (69,187 | ) | 28,721 | 42,982 | 42,393 | ||||||||||||||
|
Income Tax Expense (Benefit)
|
(3,590 | ) | (28,424 | ) | 8,083 | 11,343 | 12,195 | |||||||||||||
|
Net Income (Loss)
|
6,303 | (40,763 | ) | 20,638 | 31,639 | 30,198 | ||||||||||||||
|
Gain on Exchange of Preferred Stock to Trust Preferred Debt
|
10,052 | |||||||||||||||||||
|
Preferred Stock Dividends and Discount Accretion
|
(5,239 | ) | (4,979 | ) | ||||||||||||||||
|
Net Income (Loss) Available to Common Stockholders
|
$ | 11,722 | $ | (45,742 | ) | $ | 20,638 | $ | 31,639 | $ | 30,198 | |||||||||
|
PER SHARE DATA
|
||||||||||||||||||||
|
Basic Net Income (Loss) Available to Common Stockholders
|
$ | 0.48 | $ | (2.17 | ) | $ | 1.14 | $ | 1.73 | $ | 1.64 | |||||||||
|
Diluted Net Income (Loss) Available to Common Stockholders
|
0.48 | (2.17 | ) | 1.14 | 1.73 | 1.64 | ||||||||||||||
|
Cash Dividends Paid - Common
|
0.04 | 0.47 | 0.92 | 0.92 | 0.92 | |||||||||||||||
|
December 31 Book Value - Common
|
15.11 | 16.55 | 18.69 | 18.88 | 17.75 | |||||||||||||||
|
December 31 Tangible Book Value - Common
|
9.21 | 9.25 | 10.93 | 11.60 | 10.52 | |||||||||||||||
|
December 31 Market Value (Bid Price) - Common
|
8.86 | 5.94 | 22.21 | 27.84 | 27.19 | |||||||||||||||
|
AVERAGE BALANCES (2)
|
||||||||||||||||||||
|
Total Assets
|
$ | 4,271,715 | $ | 4,674,590 | $ | 3,811,166 | $ | 3,639,772 | $ | 3,371,386 | ||||||||||
|
Total Loans (2)
|
3,050,850 | 3,546,316 | 3,002,628 | 2,794,824 | 2,569,847 | |||||||||||||||
|
Total Deposits
|
3,337,747 | 3,603,509 | 2,902,902 | 2,752,443 | 2,568,070 | |||||||||||||||
|
Securities Sold Under Repurchase Agreements (long-term portion)
|
24,250 | 24,250 | 34,250 | 23,813 | ||||||||||||||||
|
Total Federal Home Loan Bank Advances
|
107,753 | 243,105 | 237,791 | 259,463 | 234,629 | |||||||||||||||
|
Total Subordinated Debentures, Revolving Credit Lines and Term Loans
|
126,650 | 110,826 | 107,752 | 104,680 | 99,456 | |||||||||||||||
|
Total Stockholders' Equity
|
470,379 | 477,148 | 349,594 | 330,786 | 319,519 | |||||||||||||||
|
YEAR-END BALANCES (1)
|
||||||||||||||||||||
|
Total Assets
|
$ | 4,170,848 | $ | 4,480,952 | $ | 4,784,155 | $ | 3,782,087 | $ | 3,554,870 | ||||||||||
|
Total Loans (2)
|
2,857,152 | 3,277,824 | 3,726,247 | 2,880,578 | 2,698,014 | |||||||||||||||
|
Total Deposits
|
3,268,880 | 3,536,536 | 3,718,811 | 2,884,121 | 2,750,538 | |||||||||||||||
|
Securities Sold Under Repurchase Agreements (long-term portion)
|
24,250 | 24,250 | 34,250 | 34,250 | ||||||||||||||||
|
Total Federal Home Loan Bank Advances
|
82,684 | 129,749 | 360,217 | 294,101 | 242,408 | |||||||||||||||
|
Total Subordinated Debentures, Revolving Credit Lines and Term Loans
|
226,440 | 194,790 | 135,826 | 115,826 | 83,956 | |||||||||||||||
|
Total Stockholders' Equity
|
454,408 | 463,785 | 395,903 | 339,936 | 327,325 | |||||||||||||||
|
FINANCIAL RATIOS (1)
|
||||||||||||||||||||
|
Return on Average Assets
|
0.27 | % | -0.98 | % | 0.54 | % | 0.87 | % | 0.90 | % | ||||||||||
|
Return on Average Stockholders' Equity
|
2.49 | (9.59 | ) | 5.90 | 9.56 | 9.45 | ||||||||||||||
|
Average Earning Assets to Total Assets (1)
|
90.42 | 94.74 | 72.39 | 90.15 | 91.15 | |||||||||||||||
|
Allowance for Loan Losses as % of Total Loans
|
2.90 | 2.81 | 1.33 | 0.98 | 0.99 | |||||||||||||||
|
Dividend Payout Ratio
|
8.33 | n/m | (3) | 80.70 | 53.18 | 56.10 | ||||||||||||||
|
Average Stockholders' Equity to Average Assets
|
11.01 | 10.21 | 9.17 | 9.09 | 9.48 | |||||||||||||||
|
Tax Equivalent Yield on Earning Assets
|
5.32 | 5.56 | 6.44 | 7.10 | 6.92 | |||||||||||||||
|
Cost of Supporting Liabilities
|
1.45 | 1.82 | 2.60 | 3.55 | 3.21 | |||||||||||||||
|
Net Interest Margin on Earning Assets
|
3.87 | 3.74 | 3.84 | 3.55 | 3.71 | |||||||||||||||
The following selected data has been taken from the Corporation's consolidated financial statements. Refer to First Merchants Corporations Annual Report on Form 10-K for complete consolidated financials.
______________________________
|
(1)
|
On December 31, 2008, the Corporation acquired 100 percent of the outstanding stock of Lincoln Bancorp, the holding company of Lincoln Bank; which was located in Plainfield, Indiana. Lincoln Bank was a state chartered bank with branches in central Indiana. Lincoln Bancorp was merged into the Corporation and in 2009, Lincoln Bank was ultimately merged into First Merchants Bank, National Association, a subsidiary of the Corporation. The Corporation issued approximately 3,040,415 shares of its common stock at a cost of $19.78 per share and approximately $16.8 million in cash to complete the transaction. As a result of the acquisition, the Corporation has an opportunity to increase its customer base and continue to increase its market share. The purchase had a recorded acquisition price of $77,290,000, including investments of $122,093,000; loans of $628,277,000, premises and equipment of $15,624,000; other assets of $86,091,000; deposits of $655,370,000; other liabilities of $136,280,000 and goodwill of $19,813,000. Additionally, core deposit intangibles totaling $12,461,000 were recognized and will be amortized over ten years. The combination was accounted for under the purchase method of accounting. All assets and liabilities were recorded at their fair values as of December 3!, 2008. The purchase accounting adjustments are being amortized over the life of the respective asset or liability.
|
|
(2)
|
Includes loans held for sale.
|
|
(3)
|
Not meaningful.
|
2010 Annual Report 9
CONSOLIDATED BALANCE SHEETS
|
(Dollars In thousands, except share data)
|
December 31,
|
|||||||
|
2010
|
2009
|
|||||||
|
ASSETS
|
||||||||
|
Cash and due from banks
|
$ | 50,844 | $ | 76,801 | ||||
|
Federal funds sold
|
7,463 | 102,346 | ||||||
|
Cash and cash equivalents
|
58,307 | 179,147 | ||||||
|
Interest-bearing time deposits
|
65,216 | 74,025 | ||||||
|
Investment securities available for sale
|
539,370 | 413,607 | ||||||
|
Investment securities held to maturity (fair value of $286,270 and $147,336)
|
287,427 | 149,510 | ||||||
|
Mortgage loans held for sale
|
21,469 | 8,036 | ||||||
|
Loans
|
2,835,683 | 3,269,788 | ||||||
|
Less: Allowance for loan losses
|
(82,977 | ) | (92,131 | ) | ||||
|
Net loans
|
2,752,706 | 3,177,657 | ||||||
|
Premises and equipment
|
52,450 | 55,804 | ||||||
|
Federal Reserve and Federal Home Loan Bank stock
|
33,884 | 38,576 | ||||||
|
Interest receivable
|
18,674 | 20,818 | ||||||
|
Core deposit intangibles
|
12,662 | 17,383 | ||||||
|
Goodwill
|
141,357 | 141,357 | ||||||
|
Cash surrender value of life insurance
|
96,731 | 94,636 | ||||||
|
Other real estate owned
|
20,927 | 14,879 | ||||||
|
Tax asset, deferred and receivable
|
45,623 | 64,394 | ||||||
|
Other assets
|
24,045 | 31,123 | ||||||
|
TOTAL ASSETS
|
$ | 4,170,848 | $ | 4,480,952 | ||||
|
LIABILITIES
|
||||||||
|
Deposits:
|
||||||||
|
Noninterest-bearing
|
$ | 583,696 | $ | 516,487 | ||||
|
Interest-bearing
|
2,685,184 | 3,020,049 | ||||||
|
Total deposits
|
3,268,880 | 3,536,536 | ||||||
|
Borrowings:
|
||||||||
|
Securities sold under repurchase agreements
|
109,871 | 125,687 | ||||||
|
Federal Home Loan Bank advances
|
82,684 | 129,749 | ||||||
|
Subordinated debentures, revolving credit lines and term loans
|
226,440 | 194,790 | ||||||
|
Total Borrowings
|
418,995 | 450,226 | ||||||
|
Interest payable
|
4,262 | 5,711 | ||||||
|
Other liabilities
|
24,303 | 24,694 | ||||||
|
Total Liabilities
|
3,716,440 | 4,017,167 | ||||||
|
COMMITMENTS AND CONTINGENT LIABILITIES STOCKHOLDERS' EQUITY
|
||||||||
|
Preferred Stock, no-par value:
|
||||||||
|
Authorized - 500,000 shares
|
||||||||
|
Series A, issued and outstanding - 69,600 and 116,000 shares
|
67,880 | 112,373 | ||||||
|
Cumulative Preferred Stock, $1,000 par value, $1,000 liquidation value:
|
||||||||
|
Authorized - 600 shares
|
||||||||
|
Issued and outstanding - 125 shares
|
125 | 125 | ||||||
|
Common Stock, $.125 stated value:
|
||||||||
|
Authorized - 50,000,000 shares
|
||||||||
|
Issued and outstanding - 25,574,251 and 21,227,741 shares
|
3,197 | 2,653 | ||||||
|
Additional paid-in capital
|
232,503 | 206,600 | ||||||
|
Retained earnings
|
160,860 | 150,860 | ||||||
|
Accumulated other comprehensive loss
|
(10,157 | ) | (8,826 | ) | ||||
|
Total Stockholders' Equity
|
454,408 | 463,785 | ||||||
|
TOTAL LIABILITIES AND STOCKHOLDERS' EQUITY
|
$ | 4,170,848 | $ | 4,480,952 | ||||
See Annual Report on Form 10-K for complete consolidated financials.
10 First Merchants Corporation
CONSOLIDATED STATEMENTS OF OPERATIONS
|
December 31,
|
||||||||||||
|
(Dollars In thousands, except share data)
|
2010
|
2009
|
2008
|
|||||||||
|
INTEREST INCOME
|
||||||||||||
|
Loans receivable:
|
||||||||||||
|
Taxable
|
$ | 174,070 | $ | 205,616 | $ | 198,385 | ||||||
|
Tax-exempt
|
515 | 1,038 | 1,013 | |||||||||
|
Investment securities:
|
||||||||||||
|
Taxable
|
12,957 | 12,335 | 12,046 | |||||||||
|
Tax-exempt
|
10,377 | 9,587 | 5,855 | |||||||||
|
Federal funds sold
|
26 | 118 | 28 | |||||||||
|
Deposits with financial institutions
|
381 | 366 | 755 | |||||||||
|
Federal Reserve and Federal Home Loan Bank stock
|
1,252 | 1,379 | 1,391 | |||||||||
|
Total Interest Income
|
199,578 | 230,439 | 219,473 | |||||||||
|
INTEREST EXPENSE
|
||||||||||||
|
Deposits
|
39,876 | 58,391 | 67,581 | |||||||||
|
Federal funds purchased
|
5 | 28 | 1,856 | |||||||||
|
Securities sold under repurchase agreements
|
1,712 | 1,997 | 2,600 | |||||||||
|
Federal Home Loan Bank advances
|
5,368 | 9,232 | 11,168 | |||||||||
|
Subordinated debentures, revolving credit lines and term loans
|
9,048 | 7,445 | 6,884 | |||||||||
|
Total Interest Expense
|
56,009 | 77,093 | 90,089 | |||||||||
|
NET INTEREST INCOME
|
143,569 | 153,346 | 129,384 | |||||||||
|
Provision for loan losses
|
46,483 | 122,176 | 28,238 | |||||||||
|
NET INTEREST INCOME AFTER PROVISION FOR LOAN LOSSES
|
97,086 | 31,170 | 101,146 | |||||||||
|
OTHER INCOME
|
||||||||||||
|
Service charges on deposit accounts
|
13,283 | 15,128 | 13,002 | |||||||||
|
Fiduciary activities
|
7,692 | 7,409 | 8,031 | |||||||||
|
Other customer fees
|
8,990 | 7,922 | 6,776 | |||||||||
|
Commission income
|
6,225 | 6,397 | 5,824 | |||||||||
|
Earnings on cash surrender value of life insurance
|
2,098 | 1,614 | (267 | ) | ||||||||
|
Net gains and fees on sales of loans
|
6,806 | 6,849 | 2,490 | |||||||||
|
Net realized gains on sales of available for sale securities
|
3,406 | 11,141 | 599 | |||||||||
|
Other-than-temporary impairment on available for sale securities
|
(3,049 | ) | (11,134 | ) | (2,682 | ) | ||||||
|
Portion of loss recognized in other comprehensive income before taxes
|
1,505 | 4,405 | ||||||||||
|
Net impairment losses recognized in earnings
|
(1,544 | ) | (6,729 | ) | (2,682 | ) | ||||||
|
Other income
|
1,588 | 1,470 | 2,594 | |||||||||
|
Total other Income
|
48,544 | 51,201 | 36,367 | |||||||||
|
OTHER EXPENSES
|
||||||||||||
|
Salaries and employee benefits
|
73,253 | 76,325 | 63,006 | |||||||||
|
Net occupancy
|
9,935 | 10,250 | 7,711 | |||||||||
|
Equipment
|
7,323 | 7,595 | 6,659 | |||||||||
|
Marketing
|
1,970 | 2,134 | 2,311 | |||||||||
|
Outside data processing fees
|
5,093 | 6,186 | 4,087 | |||||||||
|
Printing and office supplies
|
1,259 | 1,419 | 1,214 | |||||||||
|
Core deposit amortization
|
4,721 | 5,109 | 3,216 | |||||||||
|
FDIC assessments
|
8,121 | 10,394 | 857 | |||||||||
|
Other real estate owned and credit related expenses
|
12,436 | 9,823 | 2,785 | |||||||||
|
Other expenses
|
18,200 | 22,323 | 16,946 | |||||||||
|
Total other Expenses
|
142,311 | 151,558 | 108,792 | |||||||||
|
INCOME (LOSS) BEFORE INCOME TAX
|
3,319 | (69, 187 | ) | 28,721 | ||||||||
|
Income tax expense (benefit)
|
(3,590 | ) | (28,424 | ) | 8,083 | |||||||
|
NET INCOME (LOSS)
|
6,909 | (40,763 | ) | 20,638 | ||||||||
|
Gain on exchange of preferred stock for trust preferred debt
|
10,052 | |||||||||||
|
Preferred stock dividends and discount accretion
|
(5,239 | ) | (4,979 | ) | ||||||||
|
NET INCOME (LOSS) AVAILABLE TO COMMON STOCKHOLDERS
|
$ | 11,722 | $ | (45,742 | ) | $ | 20,638 | |||||
|
NET INCOME (LOSS) AVAILABLE TO COMMON STOCKHOLDERS PER SHARE:
|
||||||||||||
|
Basic
|
$ | 0.48 | $ | (2.17 | ) | $ | 1.14 | |||||
|
Diluted
|
$ | 0.48 | $ | (2.17 | ) | $ | 1.14 | |||||
See Annual Report on Form -K for complete consolidated financials.
2010 Annual Report 11
CONSOLIDATED STATEMENTS OF COMPREHENSIVE INCOME (LOSS)
| December 31, | ||||||||||||
|
(Dollars In thousands, except share data)
|
2010
|
2009
|
2008
|
|||||||||
|
Net income (loss)
|
$ | 6,909 | $ | (40,763 | ) | $ | 20,638 | |||||
|
Other comprehensive income (loss), net of tax:
|
||||||||||||
|
Unrealized holding gain (loss) on securities available for sale arising during the period, net of tax of $106, ($5,587) and $1,356
|
(197 | ) |
!0,376
|
(2,5!8)
|
||||||||
|
Unrealized gain (loss) on securities available for sale for which a portion of an other-than-temporary impairment has been recognized in income, net of tax of $539, $1,333 and $0
|
(1,001 | ) | (2,476 | ) | ||||||||
|
Unrealized gains (losses) on cash flow hedges:
|
||||||||||||
|
Unrealized gains (losses) arising during the period, net of tax of ($155), $622 and ($1)
|
288 | (933 | ) | 2 | ||||||||
|
Reclassification adjustment for gains (losses) included in net income net of tax of $652, $1,544 and ($833)
|
(1,210 | ) | (2,868 | ) |
!,250
|
|||||||
|
Defined Benefit Pension Plans, net of tax of ($526), ($1,826) and $7,689
|
||||||||||||
|
Net Gain Arising During Period
|
156 | 3,043 |
(!!,5!8)
|
|||||||||
|
Prior Service Cost Arising During Period
|
583 | (326 | ) | |||||||||
|
Amortization of Prior Service Cost
|
50 | 22 |
(!5)
|
|||||||||
| (1,331 | ) | 6,838 |
(!2,799)
|
|||||||||
|
Comprehensive income (loss)
|
$ | 5,578 | $ | (33,925 | ) | $ | 7,839 | |||||
The following table represents the components of accumulated other comprehensive income:
|
December 31,
|
||||||||
|
(Dollars In thousands)
|
2010
|
2009
|
||||||
|
Net unrealized gain (loss) on securities available for sale
|
$ | 2,767 | $ | 6,650 | ||||
|
Net unrealized loss on securities available for sale for which a portion of an other-than-temporary impairment has been recognized in income
|
(1,001 | ) | (2,476 | ) | ||||
|
Net realized gain on cash flow hedges
|
288 | |||||||
|
Defined Benefit Plans
|
(12,211 | ) |
(!3,000)
|
|||||
| $ | (10,157 | ) | $ | (8,826 | ) | |||
See Annual Report on Form 10-K for complete consolidated financials.
12 First Merchants Corporation
|
|
Preferred
|
|||||||
|
(Dollars In thousands, except share data)
|
Shares
|
Amount
|
||||||
|
BALANCES, DECEMBER 31, 2007
|
||||||||
|
Net Income for 2008
|
||||||||
|
Cash Dividends ($.92 per Share)
|
||||||||
|
Effects of changing the pension plan measurement date pursuant to FASB No. 158
|
||||||||
|
Service Cost, interest cost and expected rate of return on plan assets for October 1 - December 31, 2009, net of tax
|
||||||||
|
Amortization of prior service costs for October 1 - December 31, 2007, net of tax
|
||||||||
|
Cumulative preferred stock issued
|
125 | $ | 125 | |||||
|
Other Comprehensive Income (Loss), Net ofTax
|
||||||||
|
Tax Benefit from Stock Options Exercised
|
||||||||
|
Share-based Compensation
|
||||||||
|
Stock Issued Under Employee Benefit Plans
|
||||||||
|
Stock Issued Under Dividend Reinvestment and Stock Purchase Plan
|
||||||||
|
Stock Options Exercised
|
||||||||
|
Stock Redeemed
|
||||||||
|
Issuance of Stock Related to Acquisitions
|
||||||||
|
BALANCES, DECEMBER 31, 2008
|
125 | $ | 125 | |||||
|
Net Loss for 2009
|
||||||||
|
Cash Dividends on Common Stock ($.47 per Share)
|
||||||||
|
Cash Dividends on Preferred Stock under Capital Purchase Program
|
||||||||
|
Warrants issued under Capital Purchase Program
|
||||||||
|
Accretion of Discount on Preferred Stock
|
619 | |||||||
|
Preferred Stock issued under Capital Purchase Program
|
116,000 | 111,754 | ||||||
|
Other Comprehensive Income, Net of Tax
|
||||||||
|
Tax Benefit from Stock Options Exercised
|
||||||||
|
Share-based Compensation
|
||||||||
|
Stock Issued Under Employee Benefit Plans
|
||||||||
|
Stock Issued Under Dividend Reinvestment and Stock Purchase Plan
|
||||||||
|
Stock Options Exercised
|
||||||||
|
Stock Redeemed
|
||||||||
|
Adjustment to issuance of stock related to acquisition
|
||||||||
|
BALANCES, DECEMBER 31, 2009
|
116,125 | $ | 112,498 | |||||
|
Comprehensive Income
|
||||||||
|
Net Income
|
||||||||
|
Other Comprehensive Income, Net of Tax
|
||||||||
|
Cash Dividends on Common Stock ($.04 per Share)
|
||||||||
|
Cash Dividends on Preferred Stock under Capital Purchase Program
|
||||||||
|
Cumulative Preferred Stock Converted to Trust Preferred Securities
|
(46,400 | ) | (45,099 | ) | ||||
|
Accretion of Discount on Preferred Stock
|
606 | |||||||
|
Private Stock Issuance
|
||||||||
|
Tax Benefit (Loss) from Stock Options Exercised
|
||||||||
|
Share-based Compensation
|
||||||||
|
Stock Issued Under Employee Benefit Plans
|
||||||||
|
Stock Issued Under Dividend Reinvestment and Stock Purchase Plan
|
||||||||
|
Stock Redeemed
|
||||||||
|
BALANCES, DECEMBER 31, 2010
|
69,725 | $ | 68,005 | |||||
See Annual Report on Form 10-K for complete consolidated financials.
2010 Annual Report 13
|
Common Stock
|
||||||||||||||||||||
|
Shares
|
Amount
|
Additional
Paid in Capital
|
Retained
Earnings
|
Accumulated
Other Comprehensive
Income (Loss)
|
Total
|
|||||||||||||||
|
18,002,787
|
$ | 2,250 | $ | 137,801 | $ | 202,750 | $ | (2,865 | ) | $ | 339,936 | |||||||||
| 20,638 | 20,638 | |||||||||||||||||||
| (16,775 | ) | (16,775 | ) | |||||||||||||||||
| (64 | ) | (64 | ) | |||||||||||||||||
| (53 | ) | (53 | ) | |||||||||||||||||
| 125 | ||||||||||||||||||||
| (12,799 | ) | (12,799 | ) | |||||||||||||||||
| I56 | I56 | |||||||||||||||||||
|
225
|
1 | 1,897 | 1,898 | |||||||||||||||||
|
50,II9
|
6 | 767 | 773 | |||||||||||||||||
|
44,554
|
6 | 1,015 | 1,021 | |||||||||||||||||
|
122,890
|
15 | 1,618 | 1,633 | |||||||||||||||||
|
(134,169)
|
(17 | ) | (2,171 | ) | (2,188 | ) | ||||||||||||||
|
3,091,717
|
386 | 61,216 | 61,602 | |||||||||||||||||
|
21,178,123
|
$ | 2,647 | $ | 202,299 | $ | 206,496 | $ | (15,664 | ) | $ | 395,903 | |||||||||
| (40,763 | ) | (40,763 | ) | |||||||||||||||||
| (9,985 | ) | (9,985 | ) | |||||||||||||||||
| (4,269 | ) | (4,269 | ) | |||||||||||||||||
| 4,245 | 4,245 | |||||||||||||||||||
| (619 | ) | — | ||||||||||||||||||
| 111,754 | ||||||||||||||||||||
| 6,838 | 6,838 | |||||||||||||||||||
| 60 | 60 | |||||||||||||||||||
|
50,564
|
6 | 2,288 | 2,294 | |||||||||||||||||
|
122,572
|
I6 | 809 | 825 | |||||||||||||||||
|
65,015
|
8 | 519 | 527 | |||||||||||||||||
|
(14,059)
|
(2 | ) | (191 | ) | (193 | ) | ||||||||||||||
|
(174,474)
|
(22 | ) | (3,429 | ) | (3,451 | ) | ||||||||||||||
|
21,227,741
|
$ | 2,653 | $ | 206,600 | $ | 150,860 | $ | (8,826 | ) | $ | 463,785 | |||||||||
| 6,909 | 6,909 | |||||||||||||||||||
| (1,331 | ) | (1,331 | ) | |||||||||||||||||
| (989 | ) | (989 | ) | |||||||||||||||||
| (5,366 | ) | (5,366 | ) | |||||||||||||||||
| 10,052 | (35,047 | ) | ||||||||||||||||||
| (606 | ) | — | ||||||||||||||||||
|
4,200,000
|
525 | 23,625 | 24,150 | |||||||||||||||||
| (50 | ) | (50 | ) | |||||||||||||||||
|
49,833
|
6 | 1,744 | 1,750 | |||||||||||||||||
|
97,966
|
I2 | 570 | 582 | |||||||||||||||||
|
11,545
|
2 | 89 | 91 | |||||||||||||||||
|
(12,834)
|
(1 | ) | (75 | ) | (76 | ) | ||||||||||||||
|
25,574,251
|
$ | 3,197 | $ | 232,503 | $ | 160,860 | $ | (10,157 | ) | $ | 454,408 | |||||||||
14 First Merchants Corporation
CONSOLIDATED STATEMENTS OF CASH FLOWS
| December 31, | ||||||||||||
|
(Dollars In thousands)
|
2010
|
2009
|
2008
|
|||||||||
|
Cash Flow From Operating Activities:
|
||||||||||||
|
Net income (loss)
|
$ | 6,909 | $ | (40,763 | ) | $ | 20,638 | |||||
|
Adjustments to reconcile net income (loss) to net cash provided by operating activities:
|
||||||||||||
|
Provision for loan losses
|
46,483 | 122,176 | 28,238 | |||||||||
|
Depreciation and amortization
|
5,702 | 5,962 | 4,613 | |||||||||
|
Change in deferred taxes
|
(1,810 | ) | (10,858 | ) | (8,666 | ) | ||||||
|
Share-based compensation
|
1,750 | 2,294 | 1,898 | |||||||||
|
Tax expense (benefit) from stock options exercised
|
50 | (60 | ) | (156 | ) | |||||||
|
Mortgage loans originated for sale
|
(254,712 | ) | (305,778 | ) | (102,591 | ) | ||||||
|
Proceeds from sales of mortgage loans
|
241,279 | 302,037 | 104,250 | |||||||||
|
Gains on sales of securities available for sale
|
(3,406 | ) | (11,141 | ) | (599 | ) | ||||||
|
Recognized loss on other-than-temporary-impairment
|
1,544 | 6,729 | 2,682 | |||||||||
|
Change in interest receivable
|
2,144 | 3,158 | 2,858 | |||||||||
|
Change in interest payable
|
(1,449 | ) | (3,133 | ) | (1,217 | ) | ||||||
|
Pension adjustment for measurement date change
|
(117 | ) | ||||||||||
|
Other adjustments
|
36,567 | (53,013 | ) | (12,818 | ) | |||||||
|
Net cash provided by operating activities
|
$ | 81,051 | $ | 17,610 | $ | 39,013 | ||||||
|
Cash Flows from Investing Activities:
|
||||||||||||
|
Net change in interest-bearing deposits
|
$ | 8,809 | $ | (35,202 | ) | $ | 10,716 | |||||
|
Purchases of:
|
||||||||||||
|
Securities available for sale
|
(311,465 | ) | (385,697 | ) | (100,988 | ) | ||||||
|
Securities held to maturity
|
(180,311 | ) | (165,844 | ) | (29,058 | ) | ||||||
|
Proceeds from sales of securities available for sale
|
117,804 | 309,246 | 60,335 | |||||||||
|
Proceeds from maturities of
|
||||||||||||
|
Securities available for sale
|
65,688 | 134,337 | 139,825 | |||||||||
|
Securities held to maturity
|
40,825 | 38,568 | 17,042 | |||||||||
|
Proceeds from sales of mortgages
|
33,452 | |||||||||||
|
Change in Federal Reserve and Federal Home Loan Bank stock
|
4,692 | (4,257 | ) | (261 | ) | |||||||
|
Purchase of bank owned life insurance
|
(706 | ) | ||||||||||
|
Net cash paid in acquisitions
|
6,934 | |||||||||||
|
Net change in loans
|
345,518 | 296,416 | (250,621 | ) | ||||||||
|
Proceeds from the sale of other real estate owned
|
20,641 | 39,595 | 10,775 | |||||||||
|
Other adjustments
|
(2,348 | ) | (2,125 | ) | (4,181 | ) | ||||||
|
Net cash provided by (used in) investing activities
|
$ | 109,853 | $ | 258,489 | $ | (140,188 | ) | |||||
|
Cash Flows from Financing Activities:
|
||||||||||||
|
Net change in :
|
||||||||||||
|
Demand and savings deposits
|
$ | 84,993 | $ | 184,228 | $ | 74,992 | ||||||
|
Certificates of deposit and other time deposits
|
(352,649 | ) | (366,503 | ) | 144,328 | |||||||
|
Borrowings
|
2,382 | 126,587 | 961,074 | |||||||||
|
Repayment of borrowings
|
(65,247 | ) | (294,715 | ) | (1,048,161 | ) | ||||||
|
Cash dividends on common stock
|
(989 | ) | (9,985 | ) | (16,775 | ) | ||||||
|
Cash dividends on preferred stock
|
(4,931 | ) | (4,269 | ) | ||||||||
|
Stock issued in private equity placement
|
24,150 | |||||||||||
|
Stock issued under employee benefit plans
|
582 | 825 | 773 | |||||||||
|
Stock issued under dividend reinvestment and stock purchase plans
|
91 | 527 | 1,021 | |||||||||
|
Stock options exercised
|
1,633 | |||||||||||
|
Cumulative preferred stock issued
|
116,000 | 125 | ||||||||||
|
Tax (expense) benefit from stock options exercised
|
(50 | ) | 60 | 156 | ||||||||
|
Stock redeemed
|
(76 | ) | (193 | ) | (2,188 | ) | ||||||
|
Net cash provided by (used in) financing activities
|
$ | (311,744 | ) | $ | (247,438 | ) | $ | 116,978 | ||||
|
Net Change in Cash and Cash Equivalents
|
(120,840 | ) | 28,661 | 15,803 | ||||||||
|
Cash and Cash Equivalents, January 1
|
179,147 | 150,486 | 134,683 | |||||||||
|
Cash and Cash Equivalents, December 31
|
$ | 58,307 | $ | 179,147 | $ | 150,486 | ||||||
|
Additional cash flows information:
|
||||||||||||
|
Interest paid
|
$ | 57,458 | $ | 80,226 | $ | 89,570 | ||||||
|
Income tax paid (refunded)
|
(17,674 | ) | 3,184 | 18,393 | ||||||||
|
Exchange of preferred stock for trust preferred debt
|
46,400 | |||||||||||
|
Loans transferred to other real estate owned
|
32,950 | 42,708 | 24,647 | |||||||||
See Annual Report on Form 10-K for complete consolidated financials.
| 2010 Annual Report 15 | ||
LOCATIONS
|
INDIANA
ADAMS COUNTY
Decatur Downtown
103 East Monroe Street
Decatur, IN 46733
(260) 724-2157
Decatur Main
520 North 13th Street
Decatur, IN 46733
(260) 724-2157
Decatur ATM
Adams County
Memorial Hospital
1100 Mercer Avenue
Decatur, IN 46733
Woodcrest
1300 Mercer Avenue
Decatur, IN 46733
(260) 724-2157
BROWN COUNTY
Nashville
189 Commercial Drive
Nashville, IN 47448
(812) 988-1200
CARROLL COUNTY
Flora
805 East Columbia Street
Flora, IN 46929
(574) 967-4318
CLINTON COUNTY
Frankfort
1900 East Wabash Street
Frankfort, IN 46041
(765) 654-8742
Frankfort Downtown
60 South Main Street
Frankfort, IN 46041
(765) 654-8533
DELAWARE COUNTY
Albany
937 West Walnut Street
Albany, IN 47320
(765) 789-4426
|
Daleville
14500 West Davis Drive
Daleville, IN 47334
( 765) 378-7077
Daleville ATM
9301 South Innovation Drive
Daleville, IN 47334
East Jackson
101 South Country Club Road
Muncie, IN 47303
( 76 5) 747-1332
Eaton
107 East Harris Street
Eaton, IN 47338
(765) 396-3311
Eaton ATM
Marathon VP
170 00 North State Road 3
Eaton, IN 47338
Madison
2101 South Madison Street
Muncie, IN 47302
( 76 5) 747-15 41
Muncie Main
200 East Jackson Street
Muncie, IN 47305
( 76 5) 747-150 0
Northwest
1628 West McGalliard Road
Muncie, IN 47304
(765) 747-1552
Southway
3700 South Madison Street
Muncie, IN 47302
( 76 5) 747-1574
Tillotson
801 South Tillotson Avenue
Muncie, IN 47304
( 76 5) 747-1335
Village
1701 West University Avenue
Muncie, IN 47303
(765) 747-1592
|
Westminster Village
5801 West Bethel Avenue
Muncie, IN 47304
(765) 378-8760
Yorktown
1501 North Nebo Road
Muncie, IN 47304
(765) 747-4910
First Merchants Insurance Group
302 East Jackson Street
Muncie, IN 47307
(765) 213-3400
FAYETTE COUNTY
Connersville 9th Street
832 North Central Avenue
Connersville, IN 47331
(765) 827-0811
Connersville North
3030 Western Avenue
Connersville, IN 47331
(765) 827-9846
HAMILTON COUNTY
Carmel
One East Carmel Drive
Suite 100
Carmel, IN 46032
(317) 844-5675
Fishers
12514 East 116th Street
Fishers, IN 46037
(317) 913-9020
Indianapolis
10333 North Meridian Street
Suite 350
Indianapolis, IN 46290
(317) 844-2980
Noblesville
17833 Foundation Drive
Noblesville, IN 46060
(317) 770-7570
Westfield
3002 State Road 32 East
Westfield, IN 46074
(317) 867-5488
|
HENDRICKS COUNTY
Avon
7648 East U.S. Highway 36
Avon, IN 46123
(317) 272-0467
Brownsburg
975 East Main Street
Brownsburg, IN 46112
(317) 852-3134
Plainfield
1121 East Main Street
Plainfield, IN 46168
(317) 837-3640
HENRY COUNTY
Middletown
790 West Mill Street
Middletown, IN 47356
(765) 354-2291
Mooreland
1 10 South Broad Street
Mooreland, IN 47360
(765) 766-5375
Sulphur Springs
105 East Main Street
Sulphur Springs, IN 47388
(765) 533-4171
HOWARD COUNTY
Kokomo
1306 East Gano Street
Kokomo, IN 46901
( 765) 236 -0730
JAPSER COUNTY
Demotte
437 North Halleck Street
Demotte, IN 46310
(219) 987-5812
Remington
101 East Division Street
Remington, IN 47977
(219) 261-2161
Rensselaer
200 West Washington Street
Rensselaer, IN 47978
(219) 866-7121
|
 |
16 First Merchants Corporation
|
Rensselaer ATM
St. Joseph College
Halleck Center
910 West Schaefer Circle
Rensselaer, IN 47978
JAY COUNTY
Portland Main
112 West Main Street
Portland, IN 47371
(260) 726-7158
Portland Supercenter
218 West Lincoln Street
Portland, IN 47371
(260) 726-7158
JOHNSON COUNTY
Franklin
2259 North Morton Street
Franklin, IN 46131
(317) 346-7474
Emerson
1250 North Emerson Avenue
Greenwood, IN 46143
(317) 881-1414
Greenwood Mall
1275 U.S. Highway 31 North
Greenwood, IN 46142
(317) 884-1045
Greenwood - State Road 135
996 South State Road 135
Greenwood, IN 46143
(317) 882-4790
Worthsville Road
18 Providence Drive
Greenwood, IN 46143
(317) 883-3559
Trafalgar
110 North State Road 135
Trafalgar, IN 46181
(317) 878-4111
Treybourne
648 Treybourne Driv
Greenwood, IN 46142
(317) 883-8811
MADISON COUNTY
Anderson Main
33 West 10th Street
Anderson, IN 46016
(765) 622-9773
University
1933 University Blvd.
Anderson, IN 46012
(765) 640-4973
53rd Street
1526 East 53rd Street
Anderson, IN 46013
(765) 648-4950
Nichol
2825 Nichol Avenue
Anderson, IN 46011
(765)640-4981
Anderson ATM
Anderson University
1100 East 5th Street
Anderson, IN 46012
|
Hartman
416 East Hartman Road
Anderson, IN 46012
(765) 608-3336
Heritage
3055 U.S. Highway 36 West\
Pendleton, IN 46064
(765) 778-9793
Ingalls ATM
227 North Swain Street
Ingalls, IN 46048
Lapel
1011 North Main Street
Lapel, IN 46051 (765) 534-3181
Pendleton
100 East State Street
Pendleton, IN 46064
(765) 778-2132
First Merchants Insurance Group
915 Jackson Street
Anderson, IN 46016
(765)644-7818
First Merchants Insurance Group
117 North Pendleton Avenue
Pendleton, IN 46064
(765) 778-2525
MIAMI COUNTY
Maconaquah
990 West Main Street Peru, IN 46970
(765) 472-4363
Miami
855 North Broadway
Peru, IN 46970
(765) 472-0253
Montgomery Office
Crawfordsville
134 South Washington Street
Crawfordsville, IN 47933
(765) 362-0200
MORGAN COUNTY
Mooresville
1010 North Old State Road 67
Mooresville, IN 46158
(317) 834-4100
Morgantown
180 West Washington Street
Morgantown, IN 46160
(812) 597-4425
RANDOLPH COUNTY Union City
450 West Chestnut Street
Union City, IN 47390
(765) 964-3702
Winchester
122 West Washington Street
Winchester, IN 47394
(765) 584-2501
First Merchants Insurance Group
207 North Columbia
Union City, IN 47390
(765) 964-3116
|
First Merchants Insurance Group
107 South Main Street
Winchester, IN 47394
(765) 584-1121
TIPPECANOE COUNTY
26 East
3901 State Road 26 East
Lafayette, IN 47905
(765) 423-7167
Attica ATM
Super test
301 South Brady Street
Attica, IN 47918
Elston
2862 U.S. Highway 231 South
Lafayette, IN 47909
(765) 423-7166
Lafayette Station
2504 Teal Road
Lafayette, IN 47905
(765) 423-7164
Lafayette Main
250 Main Street
Lafayette, IN 47901
(765) 423-7100
Lafayette - 350 South ATM
Super test
1803 East 350 South
Lafayette, IN 47909
Lafayette ATM
Super test
1309 Sagamore Parkway South
Lafayette, IN 47905
Market Square
2200 Elmwood Avenue
Lafayette, IN 47904
(765) 423-7163
Purdue ATM
Purdue University
Memorial Union
101 North Grant Street
West Lafayette, IN 47906
Tippecanoe Court
2513 Maple Point Drive
Lafayette, IN 47905
(765) 423-3821
Valley Lakes
1803 East 350 South
Lafayette, IN 47909
(765) 423-3841
West Lafayette
2329 North Salisbury Street
West Lafayette, IN 47906
(765) 423-7162
West Lafayette ATM
JB Battlefield
5851 State Road 43 North
West Lafayette, IN 47906
UNION COUNTY
Liberty
107 West Union Street
Liberty, IN 47353
(765) 458-5131
|
WABASH COUNTY
Chippewa
1250 North Cass Street
Wabash, IN 46992
(260) 563-4116
Meshingomesia
901 State Road 114 West
North Manchester, IN 46962
(260) 982-7504
Wabash Downtown
189 West Market Street
Wabash, IN 46992
(260) 563-4116
WAYNE COUNTY
Richmond - Chester Blvd
2206 Chester Blvd.
Richmond, IN 47374
(765) 935-4505
Richmond - Glen Miller
1 Glen Miller Parkway
Richmond, IN 47374
(765) 962-8150
WHITE COUNTY
Brookston
103 North Prairie Street
Brookston, IN 47923
(765) 563-6400
Monticello Main
116 East Washington Street
Monticello, IN 47960
(574) 583-4666
Monticello WalMart
1088 West Broadway Street
Monticello, IN 47960
(574) 583-3078
Reynolds
105 East 2nd Street
Reynolds, IN 47980
(219) 984-5471
OHIO
BUTLER COUNTY
Oxford
4 North College Avenue
Oxford, OH 45056
(513) 524-8301
FRANKLIN COUNTY
Columbus Main
3650 Olentangy River Road
Suite 100
Columbus, OH 43214
(614) 583-2200
HAMILTON COUNTY
Cincinnati
8170 Corporate Park Drive
Suite 240
Cincinnati, OH 45242
(513) 794-7450
|
|
2010 Annual Report
|
|||
|
CORPORATE
INFORMATION
|
|||
|
BOARD OF DIRECTORS AND EXECUTIVE OFFICERS
|
|||
|
BOARD
Charles E. Schalliol
Chairman
Baker and Daniels LLP
Of Counsel
Michael C. Rechin
First Merchants Corporation
President and Chief Executive Officer
Thomas B. Clark
Jarden Corporation
Chairman of the Board, President
and Chief Executive Officer (retired)
Jerry R. Engle
First Merchants Bank, N.A.
Senior Vice President and
Community Leader
Roderick English
The James Monroe Group, LLC
President and Chief Executive Officer
Dr. Jo Ann M. Gora
Ball State University
President
William L. Hoy
Columbus Sign Company
Chief Executive Officer and Co-Owner
Barry J. Hudson
First National Bank of Portland
Chairman of the Board (retired)
Patrick A. Sherman
Sherman & Armbruster, LLP
Partner and CPA
|
Terry L. Walker
Muncie Power Products, Inc.
Chairman of the Board and
Chief Executive Officer
Jean L. Wojtowicz
Cambridge Capital
Management Corporation
President and Chief Executive Officer
MANAGEMENT
Michael C. Rechin
President and Chief Executive Officer
Mark K. Hardwick
Executive Vice President
and Chief Financial Officer
Michael J. Stewart
Executive Vice President
and Chief Banking Officer
Jami L. Bradshaw
Senior Vice President and
Chief Accounting Officer
Robert R. Connors
Senior Vice President, Operations
and Technology
Kimberly J. Ellington
Senior Vice President and
Director of Human Resources
Jeffrey B. Lorentson
Senior Vice President
and Chief Risk Officer
John J. Martin
Senior Vice President
and Chief Credit Officer
|
Corporate Headquarters
200 East Jackson Street
P. O. Box 792
Muncie, IN 47305-2814
(765) 747-1500
Ticker Symbol
NASDAQ: FRME
Transfer Agent and Registrar
American Stock Transfer & Trust Co.
6201 15th Ave
Brooklyn, NY 11219
(800) 937-5449
Form 10-K and Proxy Statement
A copy of the company’s Form 10-K and Proxy
Statement will be sent to shareholders upon written
request to Mark K. Hardwick, Executive Vice President
and Chief Financial Officer
Website
www.firstmerchants.com
Investor Relations Contact
David L. Ortega
(765) 378-8937 or (800) 262-4261, Ext. 28937
dortega@firstmerchants.com
Independent Registered Public Accounting Firm
BKD, LLP
Indianapolis, IN
Annual Meeting
Tuesday, May 3, 2011 at the Horizon Convention
Center, 401 South High Street, Muncie, IN 47305
at 3:30 p.m., local time.
Summary Annual Report
This report is in a summary format. It is intended to
present 2010 results in a simple, readable style. The
more detailed operational
and financial material is
part of the Annual Report on Form 10-K.
|
|
|
OUR VISION
A community bank focused on building deep, lifelong client relationships and providing maximum shareholder value. We provide an experience where customers can bank with their neighbors, realizing that our business begins and ends with people.
|
|||
| Design and Production by www.annualreportsinc.com | |||
 200 East Jackson Street
P.O. Box 792
Muncie, IN 47305
(765) 747-1500
www.firstmerchants.com
|
|||