Exhibit 99.1


To our Stockholders:
Capstead has come a long way in 25 years. In 1985, we were created and listed on the New York Stock Exchange
as an outlet for a large mortgage banking firm’s nonconforming residential mortgage loan production,
utilizing the real estate investment trust (“REIT”) model in a novel way. Nonconforming mortgage loans do not qualify for purchase by Fannie Mae and Freddie Mac (each a government sponsored enterprise, or “GSE”), or by Ginnie
Mae, an agency of the federal government (together, the “agencies”). In the following years, we evolved into one of the largest nonconforming mortgage loan conduits and later built a significant mortgage servicing platform. We exited the
conduit business in 1994 in order to avoid residential credit risk, and in 1998 we sold our mortgage servicing business. In 2000, we adopted our current investment
strategy of managing a conservatively leveraged portfolio of agency-guaranteed adjustable-rate mortgage
(“ARM”) securities that carry an implied AAA rating with limited, if any, credit risk, particularly in light of the conservatorship of the GSEs by the federal government in 2008.
Investing in agency-guaranteed mortgage securities virtually eliminates our exposure to the credit risk of the underlying mortgage
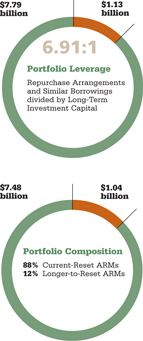
loans, and our focus on ARM securities is designed to produce attractive risk-adjusted returns over the long term while reducing, but not eliminating, sensitivity to changes in interest rates. At December 31, 2010, 88% of our investment
portfolio consisted of current-reset ARM securities that will adjust to a more current rate of interest in less

The U.S. REIT industry has come a long way too, celebrating its 50th anniversary in 2010.
than 18 months, with nearly all of the remainder consisting of ARM securities that will reset in rate in three years on average. Our investment strategy
differentiates us from our peers because the coupon interest rates on mortgage loans
FINANCIAL HIGHLIGHTS
|
|
|
|
|
|
|
|
|
|
|
|
|
| (In thousands, except per share data) |
|
2010 |
|
|
2009 |
|
|
2008 |
|
|
|
|
|
| For the year ended December 31: |
|
|
|
|
|
|
|
|
|
|
|
|
| Net interest margin |
|
$ |
143,527 |
|
|
$ |
185,765 |
|
|
$ |
142,036 |
|
| Net income |
|
|
126,896 |
|
|
|
129,263 |
|
|
|
125,923 |
|
| Earnings per diluted common share |
|
|
1.52 |
|
|
|
1.66 |
|
|
|
1.93 |
|
|
|
|
|
| As of December 31: |
|
|
|
|
|
|
|
|
|
|
|
|
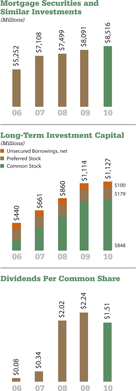
| Mortgage securities and similar investments |
|
|
8,515,691 |
|
|
|
8,091,103 |
|
|
|
7,499,249 |
|
| Repurchase arrangements and similar borrowings |
|
|
7,792,743 |
|
|
|
7,435,256 |
|
|
|
6,751,500 |
|
| Long-term investment capital: |
|
|
|
|
|
|
|
|
|
|
|
|
| Unsecured borrowings, net |
|
|
99,978 |
|
|
|
99,978 |
|
|
|
99,978 |
|
| Stockholders’ equity |
|
|
1,027,425 |
|
|
|
1,013,941 |
|
|
|
760,450 |
|
[ P.1 ]
Capstead Mortgage Corporation

REITs were created by the U.S. Congress in 1960 to make real estate investing available to all investors.
underlying current-reset ARM securities reset to more current interest rates within a relatively short
period of time, allowing for a recovery of financing spreads diminished during periods of rising interest rates and providing for smaller fluctuations in portfolio values from changes in interest rates compared with portfolios that contain a
significant amount of fixed-rate mortgage securities.
Not only did we celebrate our 25th Anniversary in 2010, but our
operating results were one of the best in our Company’s history. We reported net income of $126.9 million in 2010, which together with $129.3 million in 2009 and $125.9 million in 2008, makes this the best consecutive three-year period in
Capstead’s 25-year history. Over this same three-year period, our book value grew 30% to $12.02 per common share from $9.25 per common share at December 31, 2007.
That is not to say 2010 was without its challenges. In February, the GSEs announced programs to buyout a backlog of seriously delinquent loans from their guarantee portfolios. This created a period of
sharply higher mortgage prepayments as delinquent loans were removed from the GSE securities that we own. As a result, our portfolio runoff (mortgage prepayments and scheduled payments) increased to over $2.9 billion in 2010, nearly doubling runoff
experienced in 2009. After the delinquency backlog cleared in July, mortgage prepayments declined considerably allowing for a recovery in net interest margins and earnings temporarily diminished by high levels of investment premium amortization
charges and lower portfolio balances and leverage.
Despite the high level of mortgage prepayments resulting from the GSE buyout programs,
market conditions continued to be favorable for investors in agency-guaranteed residential mortgage securities. Prices for our investment portfolio remained strong, and the availability of financing at attractive interest rates remained plentiful.
With 2010 portfolio acquisitions totaling almost $3.3 billion, we were able to more than replace all of the year’s accelerated runoff contributing to an increase in our investment portfolio to over $8.5 billion by the end of 2010.
While our investment strategy involves a measured use of leverage, our experience and discipline in the use of this leverage has
allowed us to successfully navigate the turbulent markets seen in recent years. With long-term investment capital of over $1.1 billion at December 31, 2010, our portfolio leverage remained relatively modest at 6.91 to one. Our available
liquidity at year-end totaled over $650 million, which should provide ample liquidity to manage our existing investment portfolio and to take advantage of opportunities to acquire additional agency-guaranteed ARM securities.
On what could have significant political and economic implications for years to come, in February 2011, the Department of the Treasury
released the Administration’s plan to reform America’s housing finance market. We applaud elements of the plan designed to address fundamental flaws in the mortgage market by improving underwriting standards and by phasing in higher
down-payment requirements.
[ P.2 ]
Capstead Mortgage Corporation


Formed in 1985, Capstead has the distinction of being the oldest residential mortgage REIT. Our most recent five-year
compound annual growth rate of over 29% is well above our peers.
The Administration’s plan also calls for gradually reducing the GSEs’ footprint
in housing finance by lowering conforming loan limits and eventually winding down the size of the GSEs’ investment portfolios, which together currently total $1.5 trillion.
More importantly, the Administration’s plan puts forth several longer-term reform options for structuring the government’s
future role in the housing market. Each of the three options presented would produce a market where the private sector plays the dominant role in providing mortgage credit, and each option has its advantages and disadvantages.
While the debate in Washington will likely be fierce at times, what cannot be lost in the debate is the critical role the GSEs play in
providing access to home mortgages at reasonable rates for creditworthy Americans throughout the economic cycle and the liquidity the GSEs provide to the mortgage market during periods of market disruptions.
The Treasury Secretary has pledged that the reform process will proceed in a responsible and careful manner in order to “support
the recovery and the process of repair of the housing market.” We believe any significant changes to the housing finance market will take years to develop and, in the end, the government will continue to provide a guarantee of conforming
mortgage loans.
Regarding monetary policy, the Federal Open Market Committee (“FOMC”) of the Federal Reserve
continues to signal that higher short-term interest rates are not forthcoming for some time. We believe the recent economic recovery remains too fragile to withstand an aggressive
tightening policy by the FOMC and that they will first use other tools to achieve their policy objectives before resorting to increasing the federal funds rate. Should this prove to be the case,
our borrowing rates could remain low throughout 2011.
Our recent success in re-leveraging our long-term investment capital,
together with the favorable prepay characteristics of our seasoned portfolio of agency-guaranteed ARM securities and continued low borrowing rates, bolsters our expectations that we will continue to produce strong financial results in 2011. As
market conditions evolve, we will continue to be opportunistic in growing our holdings of agency-guaranteed ARM securities and our investment capital, while remaining mindful of the market’s recent history in determining the appropriate amount
of leverage and liquidity required to prudently manage our portfolio.
We look forward to our next 25 years, and on behalf
of our board of directors and all of our employees, thank you for your continued support and investment.
Sincerely,

Andrew F. Jacobs
President and CEO
March 1, 2011
[ P.5 ]
Capstead Mortgage Corporation
Consolidated Balance Sheets
(In thousands, except per share amounts)
|
|
|
|
|
|
|
|
|
| |
|
December 31 |
|
| |
|
2010 |
|
|
2009 |
|
| Assets: |
|
|
|
|
|
|
|
|
| Mortgage securities and similar investments ($8.22 billion and $7.86 billion pledged under repurchase arrangements,
respectively) |
|
$ |
8,515,691 |
|
|
$ |
8,091,103 |
|
| Cash collateral receivable from interest rate swap counterparties |
|
|
35,289 |
|
|
|
30,485 |
|
| Interest rate swap agreements at fair value |
|
|
9,597 |
|
|
|
1,758 |
|
| Cash and cash equivalents |
|
|
359,590 |
|
|
|
409,623 |
|
| Receivables and other assets |
|
|
76,078 |
|
|
|
92,817 |
|
| Investments in unconsolidated affiliates |
|
|
3,117 |
|
|
|
3,117 |
|
|
|
|
|
|
|
|
|
|
|
|
$ |
8,999,362 |
|
|
$ |
8,628,903 |
|
|
|
|
|
|
|
|
|
|
|
|
|
| Liabilities: |
|
|
|
|
|
|
|
|
| Repurchase arrangements and similar borrowings |
|
$ |
7,792,743 |
|
|
$ |
7,435,256 |
|
| Cash collateral payable to interest rate swap counterparties |
|
|
9,024 |
|
|
|
— |
|
| Interest rate swap agreements at fair value |
|
|
16,337 |
|
|
|
9,218 |
|
| Unsecured borrowings |
|
|
103,095 |
|
|
|
103,095 |
|
| Common stock dividend payable |
|
|
27,401 |
|
|
|
37,432 |
|
| Accounts payable and accrued expenses |
|
|
23,337 |
|
|
|
29,961 |
|
|
|
|
|
|
|
|
|
|
|
|
|
7,971,937 |
|
|
|
7,614,962 |
|
|
|
|
|
|
|
|
|
|
|
|
|
| Stockholders’ equity: |
|
|
|
|
|
|
|
|
| Preferred stock - $0.10 par value; 100,000 shares authorized: |
|
|
|
|
|
|
|
|
| $1.60 Cumulative Preferred Stock, Series A, 187 and 188 shares issued and outstanding at December 31, 2010 and
December 31, 2009, respectively ($3,073 aggregate liquidation preference) |
|
|
2,620 |
|
|
|
2,630 |
|
| $1.26 Cumulative Convertible Preferred Stock, Series B, 15,819 shares issued and outstanding at December 31, 2010 and
December 31, 2009 ($180,023 aggregate liquidation preference) |
|
|
176,703 |
|
|
|
176,703 |
|
| Common stock - $0.01 par value; 250,000 shares authorized: |
|
|
|
|
|
|
|
|
| 70,259 and 69,319 shares issued and outstanding at December 31, 2010 and December 31, 2009,
respectively |
|
|
703 |
|
|
|
693 |
|
| Paid-in capital |
|
|
1,028,382 |
|
|
|
1,017,185 |
|
| Accumulated deficit |
|
|
(354,883 |
) |
|
|
(356,154 |
) |
| Accumulated other comprehensive income |
|
|
173,900 |
|
|
|
172,884 |
|
|
|
|
|
|
|
|
|
|
|
|
|
1,027,425 |
|
|
|
1,013,941 |
|
|
|
|
|
|
|
|
|
|
|
|
$ |
8,999,362 |
|
|
$ |
8,628,903 |
|
|
|
|
|
|
|
|
|
|
|
|
|
| Book value per common share (based on common shares outstanding and calculated assuming liquidation preferences for the Series
A and B preferred stock) |
|
$ |
12.02 |
|
|
$ |
11.99 |
|
See the accompanying notes to our
consolidated financial statements included in our Annual Report on Form 10-K filed with the Securities and Exchange Commission on March 1, 2011, and available on our website at www.capstead.com.
[ P.6 ]
Capstead Mortgage Corporation
Consolidated Statements of Income
(In thousands, except per share amounts)
|
|
|
|
|
|
|
|
|
|
|
|
|
| |
|
Year Ended December 31 |
|
| |
|
2010 |
|
|
2009 |
|
|
2008 |
|
| Interest income: |
|
|
|
|
|
|
|
|
|
|
|
|
| Mortgage securities and similar investments |
|
$ |
199,300 |
|
|
$ |
314,100 |
|
|
$ |
398,285 |
|
| Other |
|
|
478 |
|
|
|
495 |
|
|
|
2,204 |
|
|
|
|
|
|
|
|
|
|
|
|
|
|
|
|
|
199,778 |
|
|
|
314,595 |
|
|
|
400,489 |
|
|
|
|
|
|
|
|
|
|
|
|
|
|
| Interest expense: |
|
|
|
|
|
|
|
|
|
|
|
|
| Repurchase arrangements and similar borrowings |
|
|
(47,502 |
) |
|
|
(120,083 |
) |
|
|
(249,706 |
) |
| Unsecured borrowings |
|
|
(8,747 |
) |
|
|
(8,747 |
) |
|
|
(8,747 |
) |
| Other |
|
|
(2 |
) |
|
|
— |
|
|
|
— |
|
|
|
|
|
|
|
|
|
|
|
|
|
|
|
|
|
(56,251 |
) |
|
|
(128,830 |
) |
|
|
(258,453 |
) |
|
|
|
|
|
|
|
|
|
|
|
|
|
|
|
|
143,527 |
|
|
|
185,765 |
|
|
|
142,036 |
|
|
|
|
|
|
|
|
|
|
|
|
|
|
| Other revenue (expense): |
|
|
|
|
|
|
|
|
|
|
|
|
| Impairment and related charges associated with investments in commercial real estate loans |
|
|
— |
|
|
|
(40,423 |
) |
|
|
— |
|
| Miscellaneous other revenue (expense) |
|
|
(904 |
) |
|
|
(218 |
) |
|
|
(1,593 |
) |
| Incentive compensation expense |
|
|
(5,055 |
) |
|
|
(4,769 |
) |
|
|
(6,000 |
) |
| General and administrative expense |
|
|
(10,931 |
) |
|
|
(11,351 |
) |
|
|
(8,779 |
) |
|
|
|
|
|
|
|
|
|
|
|
|
|
|
|
|
(16,890 |
) |
|
|
(56,761 |
) |
|
|
(16,372 |
) |
|
|
|
|
|
|
|
|
|
|
|
|
|
|
|
|
|
| Income before equity in earnings of unconsolidated affiliates |
|
|
126,637 |
|
|
|
129,004 |
|
|
|
125,664 |
|
| Equity in earnings of unconsolidated affiliates |
|
|
259 |
|
|
|
259 |
|
|
|
259 |
|
|
|
|
|
|
|
|
|
|
|
|
|
|
| Net income |
|
$ |
126,896 |
|
|
$ |
129,263 |
|
|
$ |
125,923 |
|
|
|
|
|
|
|
|
|
|
|
|
|
|
|
|
|
|
| Net income available to common stockholders: |
|
|
|
|
|
|
|
|
|
|
|
|
| Net income |
|
$ |
126,896 |
|
|
$ |
129,263 |
|
|
$ |
125,923 |
|
| Less cash dividends paid on preferred shares |
|
|
(20,233 |
) |
|
|
(20,239 |
) |
|
|
(20,251 |
) |
|
|
|
|
|
|
|
|
|
|
|
|
|
|
|
$ |
106,663 |
|
|
$ |
109,024 |
|
|
$ |
105,672 |
|
|
|
|
|
|
|
|
|
|
|
|
|
|
| Earnings per common share: |
|
|
|
|
|
|
|
|
|
|
|
|
| Basic |
|
$ |
1.53 |
|
|
$ |
1.67 |
|
|
$ |
1.94 |
|
| Diluted |
|
|
1.52 |
|
|
|
1.66 |
|
|
|
1.93 |
|
|
|
|
|
| Cash dividends per common share |
|
|
1.51 |
|
|
|
2.24 |
|
|
|
2.02 |
|
|
|
|
|
| Average number of common shares outstanding: |
|
|
|
|
|
|
|
|
|
|
|
|
| Basic |
|
|
69,552 |
|
|
|
65,045 |
|
|
|
54,007 |
|
| Diluted |
|
|
69,901 |
|
|
|
65,449 |
|
|
|
54,468 |
|
See the accompanying notes to our
consolidated financial statements included in our Annual Report on Form 10-K filed with the Securities and Exchange Commission on March 1, 2011, and available on our website at www.capstead.com.
[ P.7 ]
Capstead Mortgage Corporation
|
|
|
|
|
|
|
| Directors |
|
|
|
|
|
|
|
|
|
|
| Jack Biegler Private
Investments Chairman of the Board |
|
Gary Keiser Private
Investments |
|
Christopher W. Mahowald
President, RSF Management and RSF Partners |
|
Mark S. Whiting Managing
Partner,
Drawbridge Partners, LLC |
|
|
|
|
| Andrew F. Jacobs President and
Chief Executive Officer |
|
Paul M. Low Private
Investments Chairman Emeritus |
|
Michael G. O’Neil Private
Investments |
|
|
|
|
|
|
| Officers |
|
|
|
|
|
|
|
|
|
|
| President and CEO |
|
Executive Vice Presidents |
|
Senior Vice Presidents |
|
Vice Presidents |
|
|
|
|
| Andrew F. Jacobs President and
Chief Executive Officer |
|
Phillip A. Reinsch Chief
Financial Officer and Secretary |
|
Michael W. Brown Asset and
Liability Management and Treasurer |
|
Diane F. Wilson Financial
Accounting and Reporting |
|
|
|
|
|
|
Robert R. Spears, Jr. Director
of Residential Mortgage Investments |
|
D. Christopher Sieber
Financial Accounting and
Reporting |
|
Richard A. Wolf Asset and
Liability Management |
25th Anniversary Celebrated at NYSE

[ P.8 ]
Capstead Mortgage Corporation
Corporate Shareholder Information
Transfer Agent and Registrar
Inquiries concerning dividend payments, lost certificates, change of address and account information should be directed to:
Wells Fargo Shareowner Services
Post Office Box 64854
St. Paul, Minnesota 55164-0854
(800) 468-9716
www.wellsfargo.com/shareownerservices
Preferred Share Conversions
Holders of the
Series A and Series B preferred shares may convert into common shares at any time.
Holders of the Series A and Series B preferred shares are
advised to carefully consider whether or not it is economically advantageous to convert into common shares, considering the conversion ratio as well as the prevailing market prices and dividends of both the common and preferred shares.
If conversion is requested after one or more preferred record dates and on or before the record date for payment of quarterly dividends on the common
shares, the preferred holder requesting conversion must return to Capstead all preferred share dividends declared and paid for the corresponding quarter.
Available Information
Capstead makes available on its website at www.capstead.com, free of charge, its annual report on Form 10-K, quarterly reports on Form 10-Q, current reports on Form 8-K, investor presentations, quarterly
fact sheets, press releases, charters for the committees of the board of directors, the Board of Directors Guidelines, the Code of Business Conduct and Ethics, the Financial Code of Professional Conduct and other company information, including
amendments to such documents and waivers, if any, to the codes. Such information is also furnished upon written request to:
Capstead Mortgage Corporation
Attention: Stockholder Relations
8401 North Central Expressway
Suite 800
Dallas, Texas 75225-4410
Annual Meeting
The annual meeting of
stockholders will be held at 9:00 A.M. central time on Wednesday, May 4, 2011 at:
8401 North Central Expressway
Suite 345
Dallas, Texas 75225-4410
Total Return Performance*
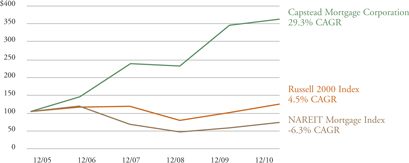
| * |
Total Returns and compound annual growth rates (“CAGR”) are based on the following cumulative total returns assuming the investment of $100 on
December 31, 2005 and the reinvestment of dividends. The performance shown is not necessarily indicative of future results. |
|
|
|
|
|
|
|
|
|
|
|
|
|
|
|
|
|
|
|
|
|
|
|
|
|
| |
|
Cumulative Periods Ending December 31, |
|
| |
|
2005 |
|
|
2006 |
|
|
2007 |
|
|
2008 |
|
|
2009 |
|
|
2010 |
|
| Capstead Mortgage Corporation |
|
$ |
100.00 |
|
|
$ |
144.35 |
|
|
$ |
235.95 |
|
|
$ |
229.63 |
|
|
$ |
344.99 |
|
|
$ |
360.91 |
|
| Russell 2000 Index |
|
|
100.00 |
|
|
|
118.37 |
|
|
|
116.51 |
|
|
|
77.15 |
|
|
|
98.11 |
|
|
|
124.46 |
|
| NAREIT Mortgage Index |
|
|
100.00 |
|
|
|
119.32 |
|
|
|
68.79 |
|
|
|
47.25 |
|
|
|
58.89 |
|
|
|
72.20 |
|
[ P.9 ]
Capstead Mortgage Corporation