Attached files
Table of Contents
SECURITIES AND EXCHANGE COMMISSION
Washington, D.C. 20549
FORM 10-K
ANNUAL REPORT PURSUANT TO SECTION 13 OR 15(D) OF THE SECURITIES
EXCHANGE ACT OF 1934 (THE “EXCHANGE ACT”)
For the Fiscal year ended December 31, 2010
Commission file number 1-31557
Wachovia Preferred Funding Corp.
(Exact name of registrant as specified in its charter)
| Delaware | 56-1986430 | |||||
| (State of incorporation) | (I.R.S. Employer Identification No.) |
90 South 7th Street, 13th Floor
Minneapolis, Minnesota 55402
(Address of principal executive offices)
(Zip Code)
(855) 825-1437
(Registrant’s telephone number, including area code)
Securities registered pursuant to Section 12(b) of the Exchange Act:
| TITLE OF EACH CLASS | NAME OF EXCHANGE ON WHICH REGISTERED | |
| 7.25% Non-cumulative Exchangeable Perpetual Series A Preferred Securities |
New York Stock Exchange, Inc. (the “NYSE”) |
Securities registered pursuant to Section 12(g) of the Exchange Act:
TITLE OF EACH CLASS
None
Indicate by check mark if the registrant is a well-known seasoned issuer, as defined in Rule 405 of the Securities Act. Yes ¨ No þ
Indicate by check mark if the registrant is not required to file reports pursuant to Section 13 or Section 15(d) of the Act. Yes ¨ No þ
Indicate by check mark whether the registrant (1) has filed all reports required to be filed by Section 13 or 15(d) of the Exchange Act during the preceding 12 months (or for such shorter period that the registrant was required to file such reports), and (2) has been subject to such filing requirements for the past 90 days. Yes þ No ¨
Indicate by check mark whether the registrant has submitted electronically and posted on its corporate Web site, if any, every Interactive Data File required to be submitted and posted pursuant to Rule 405 of Regulation S-T during the preceding 12 months (or for such shorter period that the registrant was required to submit and post such files). Yes ¨ No ¨
Indicate by check mark if disclosure of delinquent filers pursuant to Item 405 of Regulation S-K is not contained herein, and will not be contained, to the best of registrant’s knowledge, in definitive proxy or information statements incorporated by reference in Part III of this Form 10-K or any amendment to this Form 10-K. ¨
Indicate by check mark whether the registrant is a large accelerated filer, an accelerated filer, a non-accelerated filer, or a smaller reporting company.
| Large accelerated filer ¨ |
Accelerated filer ¨ | Non-accelerated filer þ (Do not check if a smaller reporting company.) |
Smaller reporting company ¨ |
Indicate by check mark whether the registrant is a shell company (defined in Rule 12b-2 of the Exchange Act). Yes ¨ No þ
State the aggregate market value of the voting and non-voting common equity held by non-affiliates computed by reference to the price at which the common equity was last sold as of the last business day of the registrant’s completed second fiscal quarter: None (as of June 30, 2010, none of Wachovia Preferred Funding Corp.’s voting or nonvoting common equity was held by non-affiliates).
As of February 28, 2011, there were 99,999,900 shares of the registrant’s common stock outstanding.
| DOCUMENTS INCORPORATED BY REFERENCE IN FORM 10-K | ||||
| Incorporated Documents |
Where Incorporated in Form 10-K | |||
| Certain portions of Wachovia Preferred Funding Corp.’s Proxy Statement for the Annual Meeting of Stockholders to be held May 10, 2011. |
Part III-Items 10, 11, 12, 13 and 14. | |||
Item 15.1 of Wells Fargo & Company’s Annual Report on Form 10-K for the fiscal year ended December 31, 2010 (excluding the list of exhibits incorporated therein by reference).
Table of Contents
CROSS-REFERENCE INDEX
1
Table of Contents
| Item 1. | Business. |
General
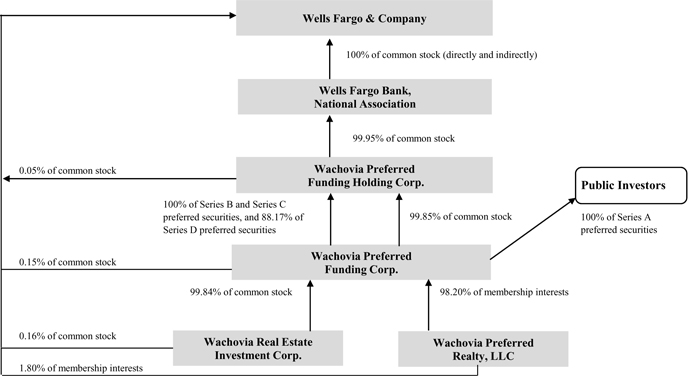
Wachovia Preferred Funding Corp. (Wachovia Funding) is a Delaware corporation, formed in July 2002, and the survivor of a merger with First Union Real Estate Asset Company of Connecticut, which was formed in 1996. As of December 31, 2010, Wachovia Funding is a direct subsidiary of Wachovia Preferred Funding Holding Corp. (Wachovia Preferred Holding) and an indirect subsidiary of both Wells Fargo & Company, a Delaware corporation (Wells Fargo) and Wells Fargo Bank, National Association (the Bank). Wachovia Preferred Holding owns 99.85% of our common stock and Wells Fargo owns the remaining 0.15%. The Bank owns 99.95% of the common stock of Wachovia Preferred Holding and Wells Fargo owns the remaining 0.05%. Wachovia Preferred Holding owns 88.17% of our Series D preferred securities, while the remaining 11.83% is owned by 108 employees of Wells Fargo or its affiliates.
On December 31, 2008, Wells Fargo acquired Wachovia Corporation, a North Carolina corporation (Wachovia) by a merger of Wachovia with and into Wells Fargo. As a result of this acquisition, each outstanding share of Wachovia common stock was converted into 0.1991 shares of Wells Fargo common stock and each share of Wachovia preferred stock outstanding or reserved for issuance was converted into a share of Wells Fargo preferred stock with substantially identical terms. The acquisition did not directly affect the outstanding shares of capital stock of Wachovia Funding. However, the Wachovia Funding Series A preferred securities are now conditionally exchangeable for shares of Wells Fargo preferred stock instead of Wachovia preferred stock. Following the acquisition, all subsidiaries of Wachovia became subsidiaries of Wells Fargo. On March 20, 2010, Wachovia Bank, National Association merged with and into the Bank, with the Bank as the surviving entity.
One of our subsidiaries, Wachovia Real Estate Investment Corp. (WREIC), was formed as a Delaware corporation in 1996 and has operated as a real estate investment trust (a REIT) since its formation. Of the 645 shares of WREIC common stock outstanding, we own 644 shares or 99.84% and the remaining one share is owned by Wells Fargo. Of the 667 shares of WREIC preferred stock outstanding, we own 533.3 shares or 79.96%, 127 shares or 19.04% are owned by employees of Wells Fargo or its affiliates and 6.7 shares or 1.00% are owned by Wells Fargo.
Our other subsidiary, Wachovia Preferred Realty, LLC (WPR), was formed as a Delaware limited liability company in October 2002. Under the REIT Modernization Act, which became effective on January 1, 2001, a REIT is permitted to own “taxable REIT subsidiaries” which are subject to taxation similar to corporations that do not qualify as REITs or for other special tax rules. We own 98.20% of the outstanding membership interests in WPR and the remaining 1.80% is owned by the Bank. Our majority ownership of WPR provides us with additional flexibility by allowing us to hold assets that earn non-qualifying REIT income while maintaining our REIT status.
2
Table of Contents
Our legal and organizational structure as of December 31, 2010 is:
Our principal business objective is to acquire, hold and manage domestic mortgage assets, and other authorized investments that will generate net income for distribution to our shareholders.
Although we have the authority to acquire interests in an unlimited number of mortgage and other assets from unaffiliated third parties, as of December 31, 2010, substantially all of our interests in mortgage and other assets that we have acquired have been acquired from the Bank or an affiliate pursuant to loan participation agreements between the Bank or its affiliate and us. The Bank either originated the mortgage assets, purchased them from other financial institutions or acquired them as part of the acquisition of other financial institutions. We may also acquire from time to time mortgage-backed securities and a limited amount of additional non-mortgage related securities from the Bank and its affiliates. We may also acquire from time to time mortgage assets or other assets from unaffiliated third parties.
The loans in our portfolio are serviced by the Bank pursuant to the terms of participation and servicing agreements between the Bank and us. The Bank has delegated servicing responsibility for certain of the residential mortgage loans to third parties, which are not affiliated with the Bank or us.
General Description of Mortgage Assets and Other Authorized Investments; Investment Policy
The Internal Revenue Code of 1986, as amended, (the Code) requires us to invest at least 75% of the total value of our assets in real estate assets, which includes residential mortgage loans and commercial mortgage loans, including participation interests in residential or commercial mortgage loans, mortgage-backed securities eligible to be held by REITs, cash, cash equivalents, including receivables and government securities, and other real estate assets. We refer to these types of assets as “REIT Qualified Assets.” The Code permits us to invest up to 25% of the value of a REIT’s total assets in non-real-estate-related securities as defined in the Investment Company Act of 1940, as amended (the Investment Company Act). However, we have established a policy of limiting authorized investments that are not Qualifying Interests (as defined herein) to no more than 20% of the value of our total assets to comply with the Investment Company Act. Under the Investment Company Act, the term “security” is defined broadly to include, among other things, any note, stock, treasury stock, debenture, evidence of indebtedness, or certificate of interest or participation in any profit sharing agreement or a group or index of securities. The Code also requires that not more than 20% of the value of a REIT’s assets constitute securities issued by taxable REIT subsidiaries and that the value of any one issuer’s securities, other than those securities included in the 75% test, may not exceed 5% of the value of the total assets of the REIT. In addition, under the Code, the REIT may not own more than 10% of the voting securities or more than 10% of the value of the outstanding securities of any one issuer, other than those securities included in the 75% test, the securities of wholly-owned qualified REIT subsidiaries or taxable REIT subsidiaries. Generally, the Code designation for REIT Qualified Assets is less stringent than the Investment Company Act designation for Qualifying Interests, due to the ability under the Code to treat cash and cash equivalents as REIT Qualified Assets and a lower required ratio of REIT Qualified
3
Table of Contents
Assets to total assets. For the tax year ended December 31, 2010, we expect to be taxed as a REIT, and we intend to comply with the relevant provisions of the Code to be taxed as a REIT.
REITs generally are subject to tax at the maximum corporate rate on income from foreclosure property less deductible expenses directly connected with the production of that income. Income from foreclosure property includes gain from the sale of foreclosure property and income from operating foreclosure property, but income that would be qualifying income for purposes of the 75% gross income test is not treated as income from foreclosure property. Qualifying income for purposes of the 75% gross income test includes, generally, rental income and gain from the sale of property not held as inventory or for sale in the ordinary course of a trade or business. In accordance with the terms of the commercial and industrial, commercial real estate and residential mortgage participation and servicing agreements, we maintain the authority to decide whether to foreclose on collateral that secures a loan. In the event we determine a foreclosure proceeding is appropriate, we may direct the Bank to prosecute the foreclosure on our behalf. Upon sale or other disposition of foreclosure property, the Bank will remit to us the proceeds less the cost of holding and selling the foreclosure property.
Commercial and Industrial and Commercial Real Estate Loans
We own participation interests in commercial and industrial loans secured by non-real property such as industrial equipment, furniture and fixtures, and inventory. Participation interests acquired in commercial real estate loans are secured by real property such as office buildings, multi-family properties of five units or more, industrial, warehouse and self-storage properties, office and industrial condominiums, retail space, strip shopping centers, mixed use commercial properties, mobile home parks, nursing homes, hotels and motels, churches and farms. In addition, some of our commercial and industrial loans are unsecured. Such unsecured loans are more likely than loans secured by real estate or personal property collateral to result in a loss upon default. Commercial and industrial and commercial real estate loans also may not be fully amortizing. This means that the loans may have a significant principal balance or “balloon” payment due on maturity. Additionally, there is no requirement regarding the percentage of any commercial and industrial or commercial real estate property that must be leased at the time we acquire a participation interest in a commercial and industrial or commercial real estate loan secured by such property nor are commercial and industrial loans required to have third party guarantees.
Commercial properties, particularly industrial and warehouse properties, generally are subject to relatively greater environmental risks than non-commercial properties. This gives rise to increased costs of compliance with environmental laws and regulations. We may be affected by environmental liabilities related to the underlying real property, which could exceed the value of the real property. Although the Bank has exercised and will continue to exercise due diligence to discover potential environmental liabilities prior to our acquisition of any participation in loans secured by such property, hazardous substances or wastes, contaminants, pollutants, or their sources may be discovered on properties during our ownership of the participation interests. To the extent that we acquire any participation in loans secured by such real property directly from unaffiliated third parties, we intend to exercise due diligence to discover any such potential environmental liabilities prior to our acquisition of such participation. Nevertheless there can be no assurance that we would not incur full recourse liability for the entire cost of any removal and clean up on a property, that the cost of removal and cleanup would not exceed the value of the property or that we could recoup any of the costs from any third party.
In general, our commercial and commercial real estate loans are subjected to individual grading assessment of borrower and collateral quality. We evaluate credit quality using these ratings and have provided a breakdown of pass and criticized credit quality metrics in the Notes to the Financial Statements in this Report, which we believe reflects the underlying risk of both the borrower and collateral quality. Foreclosures of defaulted commercial and industrial or commercial real estate loans generally are subject to a number of complicating factors, including environmental considerations, which are not generally present in foreclosures of residential mortgage loans.
Home Equity Loans
We own participation interests in home equity loans secured by a first or junior lien mortgage which primarily is on the borrower’s residence. These loans typically are made for reasons such as home improvements, acquisition of furniture and fixtures, purchases of automobiles and debt consolidation. Generally, junior liens are repaid on an installment basis and income is accrued based on the outstanding balance of the loan. First liens are repaid on an amortizing basis. Loans currently underlying the home equity loan participations bear interest at fixed and variable rates.
Residential Mortgage Loans
We have acquired both conforming and non-conforming residential mortgage loans from the Bank. Conforming residential mortgage loans comply with the requirements for inclusion in a loan guarantee or purchase program sponsored by either the Federal Home Loan Mortgage Corporation (FHLMC) or the Federal National Mortgage Association (FNMA). Non-conforming residential mortgage loans are residential mortgage loans that do not qualify in one or more respects for purchase by FHLMC or FNMA under their standard programs. A majority of the non-conforming residential mortgage loans acquired by us to date are non-conforming because they have original principal balances which exceeded the requirements for FHLMC or FNMA programs, the original terms are shorter than the minimum requirements for FHLMC or FNMA programs at the time of origination, the original balances are less than the minimum
4
Table of Contents
requirements for FHLMC or FNMA programs, or generally because they vary in certain other respects from the requirements of such programs other than the requirements relating to creditworthiness of the mortgagors.
Each residential mortgage loan is evidenced by a promissory note secured by a mortgage or deed of trust or other similar security instrument creating a first lien on one-to-four family residential property. Residential real estate properties underlying residential mortgage loans consist of single-family detached units, individual condominium units, two-to-four-family dwelling units and townhouses.
Our portfolio of residential mortgage loans currently consists of both adjustable and fixed rate mortgage loans and we may purchase additional interests in both types of residential mortgage loans in the future.
Dividend Policy
We currently expect to distribute annually an aggregate amount of dividends with respect to our outstanding capital stock equal to approximately 100% of our REIT taxable income for federal income tax purposes, which excludes capital gains. Such dividend distributions may in some periods exceed net income determined under U.S. generally accepted accounting principles (GAAP) due to differences in the timing of income and expense recognition for REIT taxable income determination purposes. In order to remain qualified as a REIT, we are required to distribute annually at least 90% of our REIT taxable income to our shareholders.
Dividends are authorized and declared at the discretion of our board of directors. Factors that would generally be considered by our board of directors in making this determination are our distributable funds, financial condition and capital needs, the impact of current and pending legislation and regulations, Delaware corporation law, economic conditions, tax considerations and our continued qualification as a REIT. We currently expect that both our cash available for distribution and our REIT taxable income will be in excess of the amounts needed to pay dividends on all outstanding series of preferred securities, even in the event of a significant drop in interest rate levels or increase in loan loss reserves because:
| — | substantially all of our mortgage assets and other authorized investments are interest-bearing; |
| — | while from time-to-time we may incur indebtedness, we will not incur an aggregate amount that exceeds 20% of our stockholders’ equity; |
| — | we expect that our interest-earning assets will continue to exceed the liquidation preference of our preferred stock; and |
| — | we anticipate that, in addition to cash flows from operations, additional cash will be available from principal payments on our loan portfolio. |
Accordingly, we expect that we will, after paying the dividends on all classes of preferred securities, pay dividends to holders of shares of our common stock in an amount sufficient to comply with applicable requirements regarding qualification as a REIT.
In January 2011, our board of directors declared a dividend in the amount of $2.5 billion payable to holders of our common stock on January 21, 2011. This dividend reduced relatively high levels of cash on Wachovia Funding’s balance sheet resulting from loan pay-downs in order to maintain Qualifying Assets greater than 80% of total assets. Based on our current expectations of loan pay-downs and anticipated reinvestment in REIT Qualified Assets during 2011, management expects to request our board of directors to consider a return of up to an additional $3.0 billion of capital to our holders of common stock in 2011. In January 2011, our board of directors also declared dividends payable to holders of our preferred securities payable on March 31, 2011, in accordance with our certificate of incorporation.
Under certain circumstances, including any determination that the Bank’s relationship to us results in an unsafe and unsound banking practice, the Office of the Comptroller of the Currency (the OCC) has the authority to issue an order that restricts our ability to make dividend payments to our shareholders, including holders of the Series A preferred securities. Banking capital adequacy rules limit the total dividend payments made by a consolidated banking entity to be the sum of earnings for the current year and prior two years less dividends paid during the same periods. Any dividends paid in excess of this amount can only be made with the approval of the Bank’s regulator.
Conflicts of Interest and Related Management Policies and Programs
General. In administering our loan portfolio and other authorized investments pursuant to the participation and servicing agreements, the Bank has a high degree of autonomy. The Bank has, however, adopted certain policies to guide the administration with respect to the acquisition and disposition of assets, use of capital and leverage, credit risk management, and certain other activities. These agreements with the Bank may be amended from time to time at the discretion of our board of directors and, in certain circumstances, subject to the approval of a majority of our Independent Directors, but without a vote of our shareholders, including holders of the Series A preferred securities.
5
Table of Contents
Asset Acquisition and Disposition Policies. It is our policy to purchase, or accept as capital contributions, loans or participation interests in loans from the Bank or its affiliates that generally are:
| — | performing, meaning they are current; |
| — | unencumbered; and |
| — | secured by real property such that they are REIT Qualified Assets. |
We may, however, from time to time acquire loans or participation interests in loans directly from unaffiliated third parties. It is our intention that any loans or participation interests acquired directly from unaffiliated third parties will meet the same general criteria as the loans or participation interests we acquire from the Bank or its affiliates.
Our policy also allows for investment in loans or assets that are not REIT Qualified Assets up to but not exceeding the statutory limitations imposed on organizations that qualify as a REIT under the Code. In the past, we have purchased or accepted as capital contributions loans and participation interests in loans both secured and not secured by real property along with other assets. We anticipate that we will acquire, or receive as capital contributions, interests in additional real estate-secured loans from the Bank or its affiliates. We may from time to time acquire loans or loan participation interests from unaffiliated third parties. We may use any proceeds received in connection with the repayment or disposition of loan participation interests in our portfolio to acquire additional loans. Although we are not precluded from purchasing additional types of loans, loan participation interests or other assets, we anticipate that participation interests in additional loans acquired by us will be of the types described above under the heading “—General Description of Mortgage Assets and Other Authorized Investments; Investment Policy.” In addition, we will not invest in assets that are not REIT Qualified Assets if such investments would cause us to violate the requirements for taxation as a REIT under the Code.
We may from time to time acquire a limited amount of other authorized investments. Although we currently do not intend to acquire any mortgage-backed securities representing interests in or obligations backed by pools of mortgage loans that are secured by single-family residential, multi-family or commercial real estate properties located throughout the United States, we are not restricted from doing so. We do not intend to acquire any interest-only or principal-only mortgage-backed securities. At December 31, 2010, we did not hold any mortgage-backed securities.
We currently anticipate that the Bank or its affiliates will continue to act as servicer of any additional commercial loans that we acquire through purchase or participation interests from the Bank or its affiliates. We anticipate that any such servicing arrangement that we enter into in the future with the Bank or its affiliates will contain fees and other terms that most likely will be substantially equivalent to but may be more favorable to us than those that would be contained in servicing arrangements entered into with unaffiliated third parties. To the extent we acquire additional loans or participation interests from unaffiliated third parties, we anticipate that such loans or participation interests may be serviced by entities other than the Bank or its affiliates. It is our policy that any servicing arrangements with unaffiliated third parties will be consistent with standard industry practices.
Credit Risk Management Policies. For a description of our credit risk management policies, see “Item 7. Management’s Discussion and Analysis of Financial Condition and Results of Operations—Risk Management.”
Conflict of Interest Policies. Because of the nature of our relationship with the Bank or its affiliates, it is likely that conflicts of interest will arise with respect to certain transactions, including, without limitation, our acquisition of participation interests in loans from, or disposition of participation interests in loans to the Bank, foreclosure on defaulted loans, management of the cash collateral related to the interest rate swaps and the modification of either the participation or servicing agreements. It is our policy that the terms of any financial dealings with the Bank will be consistent with those available from third parties in the lending industry.
Conflicts of interest among us and the Bank or its affiliates may also arise in connection with making decisions that bear upon the credit arrangements that the Bank or its affiliates may have with a borrower under a loan. Conflicts also could arise in connection with actions taken by us or the Bank or its affiliates. It is our intention that any agreements and transactions between us on the one hand, and the Bank or its affiliates on the other hand, including, without limitation, any loan participation agreements, be fair to all parties and consistent with market terms for such types of transactions. The requirement in our certificate of incorporation that certain of our actions be approved by a majority of our Independent Directors also is intended to ensure fair dealings among us and the Bank or its affiliates. There can be no assurance, however, that any such agreement or transaction will be on terms as favorable to us as could have been obtained from unaffiliated third parties.
Other Policies. We intend to operate in a manner that will not subject us to regulation under the Investment Company Act. Therefore, we do not intend to:
| — | invest in the securities of other issuers for the purpose of exercising control over such issuers; |
| — | underwrite securities of other issuers; |
6
Table of Contents
| — | actively trade in loans or other investments; |
| — | offer securities in exchange for property; or |
| — | make loans to third parties, including our officers, directors or other affiliates. |
The Investment Company Act exempts entities that, directly or through majority-owned subsidiaries, are “primarily engaged in the business of purchasing or otherwise acquiring mortgages and other liens on and interests in real estate.” We refer to these interests as “Qualifying Interests.” Under current interpretations by the staff of the Securities and Exchange Commission (SEC), in order to qualify for this exemption, we, among other things, must maintain at least 55% of our assets in Qualifying Interests and also may be required to maintain an additional 25% in Qualifying Interests or other real estate-related assets. The provisions of the Investment Company Act therefore may limit the assets that we may acquire. We have established a policy of limiting authorized investments that are not Qualifying Interests to no more than 20% of the value of our total assets to comply with these provisions.
We currently make investments and operate our business in such a manner consistent with the requirements of the Code to qualify as a REIT. However, future economic, market, legal, tax or other considerations may cause our board of directors, subject to approval by a majority of our Independent Directors, to determine that it is in our best interest and the best interest of our shareholders to revoke our REIT status. The Code prohibits us from electing REIT status for the four taxable years following the year of such revocation. See also “Item 7. Management’s Discussion and Analysis of Financial Condition and Results of Operations.”
Servicing
The loans currently in our portfolio are serviced by the Bank or their affiliates pursuant to the terms of participation and servicing agreements between the Bank or its affiliates and us. The Bank has delegated servicing responsibility for certain of the residential mortgage loans to third parties that are not affiliated with us or the Bank or its affiliates.
We pay the Bank a monthly loan servicing fee for their services under the terms of the loan participation and servicing agreements. The amount and terms of the fee are determined by mutual agreement of the Bank and us from time to time during the terms of the participation and servicing agreements.
Included in loan servicing costs were fees paid to the Bank for the years ended December 31, 2010 and 2009, of $58.5 million and $63.0 million, respectively. The monthly servicing fee with respect to the commercial loans is based on the total committed amount of each loan multiplied by a percentage per annum. For home equity loan products, the monthly fee was equal to the outstanding principal balance of each loan multiplied by a percentage per annum. Home equity loan products have a higher servicing fee compared with other loan products. For servicing fees related to residential mortgage products the monthly fee was equal to the outstanding principal of each loan multiplied by a percentage per annum or a flat fee per month.
The participation and servicing agreements currently in place require the Bank to service the loans in our portfolio in a manner substantially the same as for similar work performed by the Bank for transactions on their own behalf. The Bank or its affiliates collect and remit principal and interest payments, maintain perfected collateral positions, and submit and pursue insurance claims. The Bank and its affiliates also provide accounting and reporting services required by us for our participation interests and loans. We also may direct the Bank to dispose of any loans that are classified as nonperforming, are placed in a nonperforming status or are renegotiated due to the financial deterioration of the borrower. The Bank is required to pay all expenses related to the performance of its duties under the participation and servicing agreements, including any payment to its affiliates or third parties for servicing the loans.
In accordance with the terms of the commercial and industrial, commercial real estate and residential loan participation and servicing agreements currently in place, we maintain the authority to decide whether to foreclose on collateral that secures a loan. In the event we determine a foreclosure proceeding is appropriate, we may direct the Bank to prosecute the foreclosure on our behalf. Upon sale or other disposition of foreclosure property, the Bank will remit to us the proceeds less the cost of holding and selling the foreclosure property.
To the extent we acquire additional loans or participation interests directly from unaffiliated third parties in the future, we may also enter into servicing agreements with such unaffiliated third parties.
Competition
In order to qualify as a REIT under the Code, we can only be a passive investor in real estate loans and certain other assets. Thus, we do not originate loans. We anticipate that we will continue to hold interests in mortgage and other loans in addition to those in the current portfolio and that a majority of all of these loans will be obtained from the Bank, although we may also purchase loans from unaffiliated third parties. The Bank competes with mortgage conduit programs, investment banking firms, savings and loan associations, banks, savings banks, finance companies, mortgage bankers or insurance companies in acquiring and originating loans.
7
Table of Contents
To the extent we acquire additional loans or participation interests directly from unaffiliated third parties in the future, we will face competition similar to that which the Bank faces in acquiring such loans or participation interests.
Regulatory Considerations
Various legislative and regulatory proposals concerning the financial services industry are pending in Congress, the legislatures in states in which we conduct operations and before various regulatory agencies that supervise our operations. Given the uncertainty of the legislative and regulatory process, we cannot assess the impact of any such legislation or regulations on our financial condition or results of operations.
As a REIT, we are subject to regulation under the Code. The Code requires us to invest at least 75% of the total value of our assets in REIT Qualified Assets. See “—General Description of Mortgage Assets and Other Authorized Investments; Investment Policy” for more detailed descriptions of the requirements of the Code applicable to us. In addition, we intend to operate in a manner that will not subject us to regulation under the Investment Company Act. See “—Conflicts of Interest and Related Management Policies and Programs—Other Policies” for a more detailed description of the requirements we have to follow in order not to be subject to regulation under the Investment Company Act.
Under certain circumstances, including any determination that the Bank’s relationship to us results in unsafe and unsound banking practices, the OCC has the authority to restrict our ability to make dividend payments to our shareholders. See “—Dividend Policy” for a more detailed description of such restrictions.
Moreover, our Series A preferred securities are automatically exchangeable for depositary shares representing Series G, Class A preferred stock of Wells Fargo at the direction of the OCC if any of the following events occurs:
| — | the Bank becomes undercapitalized under the OCC’s “prompt corrective action” regulations; |
| — | the Bank is placed into conservatorship or receivership; or |
| — | the OCC, in its sole discretion, anticipates that the Bank may become “undercapitalized” in the near term or takes supervisory action that limits the payment of dividends by us and in connection therewith directs an exchange. |
In an exchange, holders of our Series A preferred securities would receive one depositary share representing a one-sixth interest in one share of Wells Fargo Series G, Class A preferred stock for each of our Series A preferred securities. The Wells Fargo Series G, Class A preferred stock will be non-cumulative, perpetual, non-voting preferred stock of Wells Fargo ranking equally upon issuance with the most senior preferred stock of Wells Fargo then outstanding. If such an exchange occurs, holders of our Series A preferred securities would own an investment in Wells Fargo and not in us at a time when the Bank’s and, ultimately, Wells Fargo’s financial condition is deteriorating or the Bank may have been placed into conservatorship or receivership. At December 31, 2010, the Bank was considered “well-capitalized” under risk-based capital guidelines issued by banking regulators.
In the event that Wachovia Funding is liquidated or dissolved, the holders of the preferred securities will be entitled to a liquidation preference for each security plus any authorized, declared and unpaid dividends that will be paid prior to any payments to common stockholders or general unsecured creditors. With respect to the payment of dividends and liquidation preference, the Series A preferred securities rank on parity with Series B and Series D preferred securities and senior to the common stock and Series C preferred securities. In the event that a supervisory event occurs in which the Bank is placed into conservatorship or receivership, the Series A and Series B preferred securities are convertible into certain preferred stock of Wells Fargo.
Except upon the occurrence of a Special Event (as defined below), the Series A preferred securities are not redeemable prior to December 31, 2022. On or after such date, we may redeem these securities for cash, in whole or in part, with the prior approval of the OCC, at the redemption price of $25 per security, plus authorized, declared, but unpaid dividends to the date of redemption. The Series B and Series C preferred securities may be redeemed for cash, in whole or in part, with the prior approval of the OCC, at redemption prices of $25 and $1,000 per security, respectively, plus authorized, declared, but unpaid dividends to the date of redemption, including any accumulation of any unpaid dividends for the Series C preferred securities. We can redeem the Series D preferred securities in whole or in part at any time at $1,000 per security plus authorized, declared and unpaid dividends.
A Special Event means: a Tax Event; an Investment Company Act Event; or a Regulatory Capital Event.
Tax Event means our determination, based on the receipt by us of a legal opinion, that there is a significant risk that dividends paid or to be paid by us with respect to our capital stock are not or will not be fully deductible by us for United States Federal income tax purposes or that we are or will be subject to additional taxes, duties, or other governmental charges, in an amount we reasonably determine to be significant as a result of:
8
Table of Contents
| — | any amendment to, clarification of, or change in, the laws, treaties, or related regulations of the United States or any of its political subdivisions or their taxing authorities affecting taxation; or |
| — | any judicial decision, official administrative pronouncement, published or private ruling, technical advice memorandum, Chief Counsel Advice, as such term is defined in the Code, regulatory procedure, notice, or official announcement. |
Investment Company Act Event means our determination, based on the receipt by us of a legal opinion, that there is a significant risk that we are or will be considered an “investment company” that is required to be registered under the Investment Company Act, as a result of the occurrence of a change in law or regulation or a written change in interpretation or application of law or regulation by any legislative body, court, governmental agency, or regulatory authority.
Regulatory Capital Event means our determination, based on the receipt by us of a legal opinion, that there is a significant risk that the Series A preferred securities will no longer constitute Tier 1 capital of the Bank or Wells Fargo for purposes of the capital adequacy guidelines or policies of the OCC or the Federal Reserve Board, or their respective successor as the Bank’s and Wells Fargo’s, respectively, primary Federal banking regulator, as a result of any amendments to, clarification of, or change in applicable laws or related regulations or official interpretations or policies; or any official administrative pronouncement or judicial decision interpreting or applying such laws or regulations.
We continue to evaluate the potential impact on liquidity management of regulatory proposals, including Basel III and those required under the Dodd-Frank Act, as they move closer to the final rule-making process.
For more information concerning Wells Fargo and the Bank, please see Part IV, Item 15.1 of Wells Fargo’s Annual Report on Form 10-K for the year ended December 31, 2010, which is incorporated by reference herein (excluding the list of exhibits incorporated therein by reference), and the audited supplementary consolidating financial information filed herewith as Exhibit (99).
Employees
We have two executive officers and eight additional non-executive officers. Our current executive officers are also executive officers of Wells Fargo. We do not anticipate that we will require any additional employees because employees of the Bank and its affiliates are servicing the loans under the participation and servicing agreements. All of our officers are also officers or employees of Wells Fargo and/or certain of its affiliates, including the Bank. We maintain corporate records and audited financial statements that are separate from those of the Bank. Except as borrowers under home equity or residential mortgage loans, none of our officers, employees or directors will have any direct or indirect pecuniary interest in any mortgage asset to be acquired or disposed of by us or in any transaction in which we have an interest or will engage in acquiring, holding and managing mortgage assets. However, 108 employees of Wells Fargo or its affiliates, including certain of the non-executive officers discussed above, own one Series D preferred security each.
Executive Offices
Our principal executive offices are located at 90 South 7th Street, 13th Floor, Minneapolis, Minnesota 55402 (telephone number (855) 825-1437).
Available Information
Wachovia Funding does not maintain its own website. Our Annual Reports on Form 10-K, Quarterly Reports on Form 10-Q, Current Reports on Form 8-K and amendments to those reports filed or furnished pursuant to Section 13(a) or 15(d) of the Securities Exchange Act of 1934 are accessible on the SEC’s website, www.sec.gov and on Wells Fargo’s website, www.wellsfargo.com at “About Us> Investor Relations More>Wachovia Information>SEC Filings and Regulatory Reports.”
9
Table of Contents
| Item 1A. | Risk Factors. |
Information in response to this item can be found under the “Risk Factors” section in this Report which information is incorporated by reference into this item.
| Item 1B. | Unresolved Staff Comments. |
None.
| Item 2. | Properties. |
Wachovia Funding does not own any properties and our primary executive offices are used primarily by affiliates of Wells Fargo. Because we do not have any of our own employees who are not also employees of Wells Fargo or the Bank, we do not need office space for such employees. All officers of Wachovia Funding are also officers of Wells Fargo or the Bank or affiliates and perform their services from office space owned or leased by Wells Fargo or the Bank, as applicable.
| Item 3. | Legal Proceedings. |
Information in response to this item can be found under Note 3 Commitments, Guarantees and Other Matters in this Report which information is incorporated by reference into this item.
| Item 4. | [Removed and Reserved.] |
10
Table of Contents
| Item 5. | Market For Registrant’s Common Equity, Related Stockholder Matters and Issuer Purchases of Equity Securities. |
General
Our common stock is 99.85% owned by Wachovia Preferred Holding and 0.15% owned by Wells Fargo and is not listed on any securities exchange. Wachovia Funding’s Series A preferred securities have been listed on the NYSE since January 10, 2003.
Prior to the December 2002 public offering of Wachovia Funding’s Series A preferred securities, Wachovia Preferred Holding acquired (i) 30,000,000 of Wachovia Funding’s Series A preferred securities, liquidation preference $25.00 per security, (ii) 40,000,000 of Wachovia Funding’s Series B preferred securities, liquidation preference $25.00 per security, and (iii) 4,233,754 of Wachovia Funding’s Series C preferred securities, liquidation preference $1,000 per security. The Series A, Series B and Series C preferred securities were acquired by Wachovia Preferred Holding in exchange for participations in commercial and industrial and commercial real estate loans with an aggregate fair value of $6.0 billion. The issuance of Wachovia Funding’s Series A, Series B and Series C preferred securities to Wachovia Preferred Holding was made in a private placement exempt from registration pursuant to Section 4(2) of the Securities Act. The Series A and Series B preferred securities are conditionally exchangeable, upon certain regulatory events, into preferred stock (or depositary shares representing such stock) of Wells Fargo.
In December 2002 and June 2003, Wachovia Preferred Holding sold 18,000,000 shares and 12,000,000 shares, respectively, of our Series A preferred securities in registered public offerings. Wachovia Funding did not receive any of the proceeds from these offerings.
Dividends
For the year ended December 31, 2010, Wachovia Funding declared and paid (i) cash dividends of $1.81 per share on its Series A preferred securities, (ii) cash dividends of $0.54 per share on its Series B preferred securities, (iii) cash dividends of $25.91 per share on its Series C preferred securities, and (iv) cash dividends of $85.00 per share on its Series D preferred securities. Wachovia Funding also paid dividends of $7.97 per share on its common stock in 2010. Please see “—Item 1. Business–Dividend Policy” for a description of our policies regarding dividends and for information regarding actions taken by our board of directors in January 2011.
Equity Compensation Plans
Wachovia Funding does not have any equity compensation plans. Our two executive officers are executive officers of Wells Fargo and receive certain equity-based compensation from Wells Fargo. See “Executive Compensation” in our definitive proxy statement to be filed no later than April 30, 2011, for more information.
Recent Sales of Unregistered Securities
Not applicable.
Purchases of Equity Securities by the Issuer and Affiliated Purchasers
Not applicable.
| Item 6. | Selected Consolidated Financial Data. |
On December 31, 2008, Wells Fargo acquired Wachovia and accordingly, under purchase accounting, the assets and liabilities of Wachovia and its subsidiaries, including Wachovia Funding, were recorded at their respective fair values at December 31, 2008. The more significant fair value adjustments were recorded to the loan portfolio.
Because the acquisition occurred on the last day of the 2008 reporting period, the income statement for 2008 was not affected by purchase accounting. Where disclosures include 2008 and prior years’ data, information for periods not affected by purchase accounting are labeled herein as “predecessor” and those reflecting purchase accounting are labeled “successor.”
As reflected on the following page, selected consolidated financial data for the six years ended December 31, 2010, is derived from our audited consolidated financial statements. This data should be read in conjunction with the consolidated financial statements, related notes and other financial information presented elsewhere in this Annual Report on Form 10-K, and the audited supplementary consolidating financial information filed herewith as Exhibit (99).
11
Table of Contents
|
Years ended December 31, |
||||||||||||||||||||||||
| (in thousands, except per share amounts) | 2010 | 2009 | 2008 | 2007 | 2006 | 2005 | ||||||||||||||||||
| (Successor) | (Successor) | (Successor) | (Predecessor) | (Predecessor) | (Predecessor) | |||||||||||||||||||
| Income statement data (1) |
||||||||||||||||||||||||
| Net interest income |
$ | 1,172,132 | 1,161,542 | 1,166,033 | 1,199,298 | 1,157,209 | 801,809 | |||||||||||||||||
| Noninterest income |
20,862 | 5,250 | 22,502 | 8,682 | (2,846 | ) | (7,309 | ) | ||||||||||||||||
| Revenue |
1,192,994 | 1,166,792 | 1,188,535 | 1,207,980 | 1,154,363 | 794,500 | ||||||||||||||||||
| Provision for credit losses |
354,025 | 217,573 | 321,605 | 21,162 | (9,251 | ) | 1,211 | |||||||||||||||||
| Noninterest expense |
68,635 | 79,974 | 86,493 | 102,947 | 104,039 | 67,641 | ||||||||||||||||||
| Net income |
769,416 | 867,650 | 767,276 | 1,067,033 | 1,046,154 | 721,522 | ||||||||||||||||||
| Diluted earnings per common share |
5.84 | 7.07 | 4.74 | 6.80 | 6.71 | 4.40 | ||||||||||||||||||
| Dividends declared per common share |
7.97 | 9.00 | 6.95 | 6.67 | 6.35 | 3.69 | ||||||||||||||||||
| Balance sheet data |
||||||||||||||||||||||||
| Cash and cash equivalents |
$ | 2,774,299 | 2,092,523 | 1,358,129 | 1,394,729 | 1,382,021 | 1,484,535 | |||||||||||||||||
| Loans, net of unearned income |
15,506,564 | 16,401,604 | 17,481,505 | 16,606,273 | 16,795,417 | 16,196,661 | ||||||||||||||||||
| Allowance for loan losses |
(402,960 | ) | (337,431 | ) | (269,343 | ) | (93,095 | ) | (81,350 | ) | (96,115 | ) | ||||||||||||
| Total assets |
18,178,117 | 18,410,128 | 18,836,915 | 18,233,647 | 18,427,969 | 17,896,219 | ||||||||||||||||||
| Total liabilities |
56,244 | 74,805 | 250,887 | 389,905 | 596,777 | 100,569 | ||||||||||||||||||
| Total stockholders’ equity |
18,121,873 | 18,335,323 | 18,586,028 | 17,843,742 | 17,831,192 | 17,795,650 | ||||||||||||||||||
| (1) | 2008 income statement data based on predecessor. |
12
Table of Contents
This Annual Report, including the Financial Review and the Financial Statements and related Notes, contains forward-looking statements, which may include forecasts of our financial results and condition, expectations for our operations and business, and our assumptions for those forecasts and expectations. Do not unduly rely on forward-looking statements. Actual results might differ materially from our forward-looking statements due to several factors. Some of these factors are described in the Financial Review and in the Financial Statements and related Notes. For a discussion of other factors, refer to the “Risk Factors” section in this Report.
“Wachovia Funding”, “we”, “our” and “us” refer to Wachovia Preferred Funding Corp. “Wachovia Preferred Holding” refers to Wachovia Preferred Funding Holding Corp., the “Bank” refers to Wells Fargo Bank, National Association including predecessor entities, “Wachovia” refers to Wachovia Corporation, a North Carolina corporation, and “Wells Fargo” refers to Wells Fargo & Company.
| Item 7. | Management’s Discussion and Analysis of Financial Condition and Results of Operations. |
FINANCIAL REVIEW
Summary Financial Data
|
(in thousands, except per share data) |
2010 | 2009 | 2008 (3) | |||||||||
| (Successor) | (Successor) | (Successor) | ||||||||||
| For the year |
||||||||||||
| Net income |
$ | 769,416 | 867,650 | 767,276 | ||||||||
| Net income available to common stockholders |
583,550 | 706,972 | 474,047 | |||||||||
| Dilluted earnings per common share |
5.84 | 7.07 | 4.74 | |||||||||
| Profitability ratios |
||||||||||||
| Return on average assets |
4.18 % | 4.60 | 4.20 | |||||||||
| Return on average stockholders’ equity |
4.19 | 4.67 | 4.29 | |||||||||
| Average stockholders’ equity to assets |
99.70 | 98.40 | 98.07 | |||||||||
| Dividend payout ratio |
127.74 | 122.25 | 128.80 | |||||||||
| Total revenue |
$ | 1,192,994 | 1,166,792 | 1,188,535 | ||||||||
| Average loans |
15,830,856 | 17,110,538 | 16,346,575 | |||||||||
| Average assets |
18,401,911 | 18,879,972 | 18,258,032 | |||||||||
| Net interest margin |
6.39 % | 6.20 | 6.53 | |||||||||
| Net loan charge-offs |
$ | 284,904 | 149,780 | 89,176 | ||||||||
| As a percentage of average total loans |
1.80 % | 0.88 | 0.55 | |||||||||
| At year end |
||||||||||||
| Loans, net of unearned |
$ | 15,506,564 | 16,401,604 | 17,481,505 | ||||||||
| Allowance for loan losses |
402,960 | 337,431 | 269,343 | |||||||||
| As a percentage of total loans |
2.60 % | 2.06 | 1.54 | |||||||||
| Assets |
$ | 18,178,117 | 18,410,128 | 18,836,915 | ||||||||
| Total stockholders’ equity |
18,121,873 | 18,335,323 | 18,586,028 | |||||||||
| Total nonaccrual loans and other nonperforming assets (1) |
372,717 | 209,822 | 3,779 | |||||||||
| As a percentage of total loans |
2.40 % | 1.28 | 0.02 | |||||||||
| Loans 90 days or more past due and still accruing (2) |
$ | 40,384 | 50,532 | 3,146 | ||||||||
| (1) | Excludes loans that are accounted for as purchased credit-impaired (PCI) loans. As a result of Wells Fargo’s acquisition of Wachovia, subtainially all nonaccrual loans were eliminated in purchase accounting. |
| (2) | The carrying value of PCI loans contractually 90 days or more past due is excluded. These PCI loans are considered to be accruing due to the existence of the accretable yield and not based on consideration given to contractual interest payments. |
| (3) | 2008 income statement data based on predecessor. |
The following discussion and analysis of our financial condition and results of operations should be read in conjunction with selected consolidated financial data set forth in Item 6 and our audited consolidated financial statements and related notes included in this Form 10-K.
OVERVIEW
Wachovia Funding is engaged in acquiring, holding and managing domestic real estate-related assets, and other authorized investments that generate net income for distribution to our shareholders. We are classified as a real estate investment trust (REIT) for income tax purposes. As of December 31, 2010, we had $18.2 billion in assets, which included $15.5 billion in loans. One of our subsidiaries, Wachovia Real Estate Investment Corp. (WREIC), has operated as a REIT since its formation in 1996. Our other subsidiary, Wachovia Preferred Realty, LLC (WPR), provides us with additional flexibility to hold assets that earn non-qualifying REIT income while we maintain our REIT status. Under the REIT Modernization Act, which became effective on January 1, 2001, a
13
Table of Contents
REIT is permitted to own “taxable REIT subsidiaries” which are subject to taxation similar to corporations that do not qualify as REITs or for other special tax rules.
We are a direct subsidiary of Wachovia Preferred Holding and an indirect subsidiary of Wells Fargo and the Bank. On March 20, 2010, Wachovia Bank, National Association, a wholly-owned subsidiary of Wells Fargo, merged with and into the Bank, with the Bank as the surviving entity. As a result of this merger, the Bank acquired all of the assets and assumed all of the liabilities of Wachovia Bank, National Association, including without limitation, the liabilities as a servicer of our loan participation interest portfolio. At December 31, 2010, the Bank was considered “well-capitalized” under risk-based capital guidelines issued by banking regulators.
Although we have the authority to acquire interests in an unlimited number of mortgage and other assets from unaffiliated third parties, as of December 31, 2010, substantially all of our interests in mortgage and other assets that we have acquired have been from the Bank or an affiliate pursuant to loan participation agreements between the Bank or its affiliate and us. The Bank originated the mortgage assets, purchased them from other financial institutions or acquired them as part of the acquisition of other financial institutions. We may also acquire from time to time mortgage-backed securities and a limited amount of additional non-mortgage related securities from the Bank and its affiliates, as well as mortgage assets or other assets from unaffiliated third parties. The loans in our portfolio are serviced by the Bank pursuant to the terms of participation and servicing agreements between the Bank and us. The Bank has delegated servicing responsibility for certain of the residential mortgage loans to third parties, which are not affiliated with the Bank or us.
For the tax year ended December 31, 2010, we expect to be taxed as a REIT, and we intend to comply with the relevant provisions of the Internal Revenue Code (the Code) to be taxed as a REIT. These provisions for qualifying as a REIT for federal income tax purposes are complex, involving many requirements, including among others, distributing the majority of our earnings to shareholders and satisfying certain asset, income and stock ownership tests. To the extent we meet those provisions, with the exception of the income of our taxable REIT subsidiary, we will not be subject to federal income tax on net income. We currently believe that we continue to satisfy each of these requirements and therefore continue to qualify as a REIT. We continue to monitor each of these complex tests.
In the event we do not continue to qualify as a REIT, we believe there should be minimal adverse effect of that characterization to us or to our shareholders:
| — | From a shareholder’s perspective, the dividends we pay as a REIT are ordinary income not eligible for the dividends received deduction for corporate shareholders or for the favorable maximum 15% rate applicable to qualified dividends received by non-corporate taxpayers. If we were not a REIT, dividends we pay generally would qualify for the dividends received deduction and the favorable tax rate applicable to non-corporate taxpayers. |
| — | In addition, we would no longer be eligible for the dividends paid deduction, thereby creating a tax liability for us. Wells Fargo agreed to make, or cause its subsidiaries to make, a capital contribution to us equal in amount to any income taxes payable by us. Therefore, we believe a failure to qualify as a REIT would not result in any net capital impact to us. |
For 2010, our net income was $769.4 million, or $5.84 per common share, compared with $867.7 million, or $7.07 a year ago. The decrease in net income was largely due to a higher provision for credit losses recorded in 2010. The provision for credit losses was $354.0 million in 2010, compared with $217.6 million for 2009. Net charge-offs were $284.9 million (1.80% of average total loans outstanding) for 2010 compared with $149.8 million (0.88%) in 2009.
Distributions made to holders of our preferred securities totaled $185.9 million in 2010, which included $54.4 million in dividends paid on our Series A preferred securities held by non-affiliated investors. Dividends on preferred stock were $160.7 million in 2009, which included $54.4 million in dividends on our Series A preferred securities.
Loans, which include loans and loan participation interests, totaled $15.5 billion at December 31, 2010, down from $16.4 billion at December 31, 2009. Loans represented approximately 85% and 89% of assets at December 31, 2010 and 2009, respectively. Our consumer loans include real estate 1-4 family first mortgages and real estate 1-4 family junior lien mortgages, and our commercial loans include commercial and industrial and commercial real estate (CRE) loans. The change in loans from the end of 2009 primarily reflected pay-downs, charge-offs and loan sales, partially offset by additional loan purchases from the Bank.
Certain loans acquired by Wells Fargo in the Wachovia acquisition completed on December 31, 2008, including loans held by Wachovia Funding, had evidence of credit deterioration since origination and it was probable that we would not collect all contractual principal and interest. Such purchased credit-impaired (PCI) loans were recorded at fair value with no carryover of the related allowance for loan losses. PCI loans were less than 1 percent of total loans at December 31, 2010 and 2009.
14
Table of Contents
In third quarter 2010, the Bank restructured a commercial lending relationship, which affected a participation interest from the Bank to Wachovia Funding. As a result, the Bank was required to purchase the participation interest, a commercial PCI loan, from Wachovia Funding at the unpaid principal balance. That participation interest had been recorded on our balance sheet at a value that was less than the unpaid principal balance. As a result of this transaction, we recorded a gain on sale to affiliate of $18.0 million.
Nonaccrual loans at December 31, 2010 were $366.8 million, up from $207.5 million at December 31, 2009. The increase in nonaccrual loans largely reflected increases in CRE and real estate 1-4 family loans, due to slow disposition.
We believe it is important to maintain a well controlled operating environment and manage risks inherent in our business. We manage our credit risk by setting what we believe are sound credit policies for acquired loans, while monitoring and reviewing the performance of our loan portfolio. We manage interest rate and market risks inherent in our asset and liability balances within established ranges, while ensuring adequate liquidity and funding. We maintain strong capital levels to support our business.
In each of the years in the three-year period ended December 31, 2010, we purchased loans from the Bank at estimated fair value. In 2010, 2009 and 2008, Wachovia Funding paid $3.2 billion, $2.7 billion and $3.6 billion, respectively, for consumer loans.
On December 31, 2008, Wells Fargo acquired Wachovia and accordingly, under purchase accounting, the assets and liabilities of Wachovia and its subsidiaries were recorded at their respective fair values at December 31, 2008. The more significant fair value adjustments were recorded to the loan portfolio. Because the acquisition occurred on the last day of the 2008 reporting period, the Statement of Income for 2008 was not affected by purchase accounting. Where disclosures include 2008 and prior years’ data, information for periods not affected by purchase accounting are labeled herein as “predecessor” and those reflecting purchase accounting are labeled “successor.” Refer to Note 1 to Notes to Consolidated Financial Statements in this Report for further information. As a result of the acquisition, the consolidated financial information of Wachovia Funding for the period after the acquisition is presented on a different cost basis than that for the periods before the acquisition, and therefore, is not comparable.
Earnings Performance
Net income available to common stockholders. We earned net income available to common stockholders of $583.6 million and $707.0 million in 2010 and 2009, respectively. This decrease was primarily attributable to higher provision for credit losses and higher dividends on preferred stock (due to an increase in an index rate in 2010), partially offset by gain on loan sales to affiliate, lower noninterest expense and higher net interest income.
Interest Income. Interest income of $1.2 billion in 2010 increased $10.2 million, or 1%, compared with 2009, due to a higher average yield on total interest-earning assets, partially offset by lower average interest-earning assets. The average yield on total interest-earning assets was 6.39% in 2010 compared with 6.20% in 2009. The overall increase in the average yield on the combined consumer and commercial loan portfolio was primarily attributable to an increase in the accretion of discounts on purchased consumer loans. In 2010 and 2009, interest income included $234.2 million and $124.0 million, respectively of discount accretion. The increase in discount accretion was primarily driven by (i) an acceleration of accretion due to loan pay-downs or loan pay-offs attributable to loan refinancing activity and (ii) an increase in amount of accretable discount in 2010 resulting from consumer loan purchases.
Average consumer and commercial loans decreased $862.9 million and $416.8 million to $14.0 billion and $1.8 billion, respectively, in 2010 and 2009 due to pay-downs, charge-offs and loan sales, partially offset by an increase in consumer loan reinvestments. When business conditions are suitable, we anticipate that we will reinvest loan pay-downs primarily in consumer real-estate secured loans and other REIT-eligible assets. See the interest rate risk management section under “Risk Management” for more information on interest rates and interest income.
The average balances, interest income and yields related to interest-earning assets for the years ended December 31, 2010 and 2009, are presented in the following table.
|
Year ended December 31, |
||||||||||||||||||||||||
| 2010 | 2009 | |||||||||||||||||||||||
| (in thousands) | Average balance |
Interest income |
Yields | Average balance |
Interest income |
Yields | ||||||||||||||||||
| Commercial loans (1) |
$ | 1,787,851 | 44,582 | 2.49 | % | $ | 2,204,638 | 56,113 | 2.55 | % | ||||||||||||||
| Real estate 1-4 family |
14,043,005 | 1,126,280 | 8.02 | 14,905,900 | 1,104,451 | 7.41 | ||||||||||||||||||
| Interest-bearing deposits in banks and other interest-earning assets |
2,522,215 | 1,279 | 0.05 | 1,641,713 | 1,358 | 0.08 | ||||||||||||||||||
| Total interest-earning assets |
$ | 18,353,071 | 1,172,141 | 6.39 | % | $ | 18,752,251 | 1,161,922 | 6.20 | % | ||||||||||||||
| (1) | 2010 includes taxable-equivalent adjustments. |
15
Table of Contents
We allocate the changes in net interest income to changes in either average balances or average interest rates. Because of the numerous simultaneous volume and rate changes during any period, it is not possible to precisely allocate such changes between volume and rate. For this table, changes that are not solely due to either volume or rate are allocated to these categories in proportion of the percentage changes in average volume and average interest rate. The dollar amount of change in interest income related to our interest-earning assets for the year ended December 31, 2010, is presented in the following table.
|
2010 Compared to 2009 |
||||||||||||
| Interest | Variance | |||||||||||
| income | attributable to | |||||||||||
| (in thousands) | variance | Rate | Volume | |||||||||
| Interest-earning assets |
||||||||||||
| Commercial loans |
$ | (11,531) | (1,030) | (10,501) | ||||||||
| Real estate 1-4 family |
21,829 | 88,400 | (66,571) | |||||||||
| Interest-bearing bank balances and other interest earning assets |
(79) | (666) | 587 | |||||||||
| Total interest-earning assets |
$ | 10,219 | 86,704 | (76,485) | ||||||||
Interest Expense. We did not have any borrowings on our line of credit in 2010; therefore, no interest expense was incurred, compared with $380 thousand in 2009. The line of credit with the Bank averaged $210.8 million for 2009.
Provision for Credit Losses. The provision for credit losses was $354.0 million in 2010 compared with $217.6 million in 2009. The 2010 increase in the provision for credit losses resulted from higher net charge-offs as well as a provision build to increase the allowance for loan losses. The increase in charge-offs compared with a year ago was in part attributable to minimal early-2009 charge-offs on non-PCI loans, which were all in performing status at the time of the Wachovia merger, as well as the challenging economic and housing conditions impacting the consumer real estate portfolio. The allowance increase was primarily due to credit deterioration as well as growth in troubled debt restructurings (TDRs) Please refer to the “—Balance Sheet Analysis and Risk Management-Allowance for Credit Losses” sections in this Report for further information on the allowance for loan losses.
Noninterest Income. Noninterest income totaled $20.9 million in 2010 compared with $5.3 million in 2009. The 2010 results include gain on loan sales to affiliate of $17.7 million. Refer to Note 8 to Notes to Consolidated Financial Statements in this Report for further information. Noninterest income also includes gains on interest rate swaps. Our interest rate swaps lose value in an increasing rate environment and gain value in a declining rate environment. The gain on interest rate swaps was $2.5 million in 2010 compared with a gain of $4.1 million in 2009. The lower gain in 2010 primarily reflects a lower magnitude of interest rate decreases compared with 2009. Included in gain on interest rate swaps was expense associated with derivative cash collateral received of $275 thousand and $360 thousand in 2010 and 2009, respectively.
Noninterest Expense. Noninterest expense totaled $68.6 million in 2010 compared with $80.0 million in the same period a year ago. Noninterest expense primarily consists of loan servicing costs, and to a lesser extent, management fees and other expenses.
Loan servicing costs decreased $6.9 million to $59.1 million in 2010, which reflected a decrease in the commercial and consumer loan portfolios. These costs are driven by the size and mix of our loan portfolio. Home equity loan products generally cost more to service than other loan products. All loans are serviced by the Bank pursuant to our participation and servicing agreements which include market-based fees. For home equity loan products, the monthly servicing fee charge is equal to the outstanding principal balance of each loan multiplied by a percentage per annum. For servicing fees related to residential mortgage products the monthly fee is equal to the outstanding principal of each loan multiplied by a percentage per annum or a flat fee per month. For commercial loans, the monthly fee is based on the total committed amount of each loan multiplied by a percentage per annum.
Management fees were $4.6 million in 2010 compared with $10.2 million in 2009, primarily reflecting a change in allocation methodology. Management fees represent reimbursements for general overhead expenses paid on our behalf. For 2010, management fees are calculated based on Wells Fargo’s total monthly allocated costs multiplied by a formula. The formula is based on Wachovia Funding’s proportion of Wells Fargo’s consolidated: 1) full-time equivalent employees (FTEs), 2) total average assets and 3) total revenue. In 2009, Wachovia Funding was assessed monthly management fees based on its relative percentage of the Bank’s total consolidated assets and noninterest expense.
Other expense primarily consists of costs associated with foreclosures on residential properties.
Income Tax Expense. Income tax expense, which is based on the pre-tax income of WPR, our taxable REIT subsidiary, was $918 thousand in 2010 compared with $1.6 million in 2009. WPR holds our interest rate swaps as well as certain cash investments. The decrease in income tax expense for 2010 was primarily related to the reduction in pre-tax income.
16
Table of Contents
Earnings Performance – Comparison of 2009 with 2008
Net income available to common stockholders. We earned net income available to common stockholders of $707.0 million and $474.0 million in 2009 and 2008, respectively. This increase was attributable to lower dividends on preferred stock (due to a decrease in the applicable index rate in 2009), lower provision for credit losses, lower management fees and lower income tax expense, partially offset by lower gains on interest rate swaps and lower net interest income.
Interest Income. Interest income of $1.2 billion in 2009 decreased $10.3 million, or 1%, compared with 2008. Higher average interest-earning assets were more than offset by decreases in interest rates compared with 2008. The average interest rate on total interest-earning assets was 6.20% in 2009 compared with 6.53% in 2008 which reflects the impact of a lower interest rate environment in 2009.
During 2009 average consumer loans increased $1.4 billion to $14.9 billion and average commercial loans decreased $643.6 million to $2.2 billion. These changes resulted from reinvesting commercial loan pay-downs in consumer loans combined with additional consumer loan purchases and 2008 purchase accounting adjustments. In 2009, interest income included $124.0 million from the accretion of discounts on purchased consumer loans primarily driven by an acceleration of accretion from repayment of loans during the period. Interest income on cash invested in overnight eurodollar deposits decreased $29.5 million to $1.4 million in 2009 compared with 2008, driven by significantly lower short-term interest rates from the same period one year ago.
The average balances, interest income and yields related to interest-earning assets for the years ended December 31, 2009 and 2008, are presented below.
|
Year ended December 31, |
||||||||||||||||||||||||
| 2009 | 2008 | |||||||||||||||||||||||
| (Successor) | (Predecessor) | |||||||||||||||||||||||
| (in thousands) | Average balance |
Interest income |
Yields | Average balance |
Interest income |
Yields | ||||||||||||||||||
| Commercial loans |
$ | 2,204,638 | 56,113 | 2.55 | % | $ | 2,848,256 | 130,127 | 4.57 | % | ||||||||||||||
| Real estate 1-4 family |
14,905,900 | 1,104,451 | 7.41 | 13,498,319 | 1,011,162 | 7.49 | ||||||||||||||||||
| Interest-bearing deposits in banks and other interest-earning assets |
1,641,713 | 1,358 | 0.08 | 1,592,639 | 30,892 | 1.94 | ||||||||||||||||||
| Total interest-earning assets |
$ | 18,752,251 | 1,161,922 | 6.20 | % | $ | 17,939,214 | 1,172,181 | 6.53 | % | ||||||||||||||
The dollar amount of change in interest income related to our interest-earning assets for the year ended December 31, 2009, is presented below.
|
2009 Compared to 2008 |
||||||||||||
| Interest | Variance | |||||||||||
| income | attributable to | |||||||||||
| (in thousands) | variance | Rate | Volume | |||||||||
| Interest-earning assets |
||||||||||||
| Commercial loans |
$ | (74,014) | (51,121) | (22,893) | ||||||||
| Real estate 1-4 family |
93,289 | (11,579) | 104,868 | |||||||||
| Interest-bearing bank balances and other interest earning assets |
(29,534) | (30,030) | 496 | |||||||||
| Total interest-earning assets |
$ | (10,259) | (92,730) | 82,471 | ||||||||
Interest Expense. Interest expense decreased to $380 thousand in 2009 compared with $6.1 million in 2008, primarily reflecting a significantly lower rate environment in 2009 compared with the same period one year ago. The line of credit with the Bank averaged $210.8 million in 2009 compared with $246.8 million in 2008. At December 31, 2009, there was no outstanding balance under the line of credit with the Bank.
Provision for Credit Losses. The provision for credit losses was $217.6 million in 2009 compared with $321.6 million in 2008. The decrease in the provision for credit losses resulted from the accounting for PCI loans, which offset credit deterioration in the non-impaired portfolio. Refer to Note 1 to Notes to Consolidated Financial Statements in this Report for more information on PCI loans.
Noninterest Income. Noninterest income totaled $5.3 million in 2009 compared with $22.5 million in 2008. Noninterest income included gains on interest rate swaps and other income. Our interest rate swaps lose value in an increasing rate environment and gain value in a declining rate environment. The gain on interest rate swaps was $4.1 million in 2009 compared with a gain of $16.1 million in 2008. The lower gain in 2009 primarily reflected a lower magnitude of interest rate decreases in 2009 compared with 2008.
17
Table of Contents
Included in gain on interest rate swaps was expense associated with derivative cash collateral received of $360 thousand and $5.6 million in 2009 and 2008, respectively.
Noninterest Expense. Noninterest expense totaled $80.0 million in 2009 compared with $86.5 million in 2008. Noninterest expense primarily consists of loan servicing costs, and to a lesser extent, management fees and other expenses.
Loan servicing costs increased $683 thousand to $66.0 million in 2009, which reflected the impact of reinvesting pay-downs in additional purchases of consumer loans.
Management fees were $10.2 million in 2009 compared with $18.7 million in 2008, primarily reflecting a decrease in the allocable expense base. In 2009, an affiliate was assessed monthly management fees based on its relative percentage of the Bank’s total consolidated assets and noninterest expense. For 2008, monthly management fees were assessed to affiliates with over $10 million in qualifying assets. If an affiliate qualified for an allocation, the affiliate was assessed monthly management fees based on its relative percentage of the Bank’s total consolidated assets and noninterest expense.
Other expense primarily consisted of costs associated with foreclosures on residential properties.
Income Tax Expense. Income tax expense, which is based on the pre-tax income of WPR, our taxable REIT subsidiary, was $1.6 million in 2009 compared with $13.2 million in 2008. WPR holds our interest rate swaps as well as certain cash investments. The decrease in income tax expense for 2009 was primarily related to the reduction in pre-tax income and lower state income tax expense.
Balance Sheet Analysis
Total Assets. Our assets primarily consist of commercial and consumer loans, although we have the authority to hold assets other than loans. Total assets were $18.2 billion at December 31, 2010, compared with $18.4 billion at December 31, 2009. Loans, net of unearned income were 85% of total assets at December 31, 2010, compared to 89% at December 31, 2009.
Cash and cash equivalents. Cash and cash equivalents increased $681.8 million to $2.8 billion at December 31, 2010, compared to $2.1 billion at December 31, 2009. The increase in 2010 is attributable to loan pay-downs and pay-offs exceeding loan reinvestment opportunities.
Loans. Loans, net of unearned income decreased $895.0 million to $15.5 billion at December 31, 2010, compared with December 31, 2009, primarily reflecting pay-downs, charge-offs and loan sales across the entire portfolio, partially offset by an increase in consumer loan reinvestments. In 2010 and 2009, we purchased consumer loans from the Bank at estimated fair value of $3.2 billion and $2.7 billion, respectively. At December 31, 2010 and 2009, consumer loans represented 90% and 88% of loans, respectively, and commercial loans represented the balance of our loan portfolio.
Commercial loan maturities for the years ended December 31, 2010 and 2009, are presented below.
|
December 31, |
||||||||
| (in thousands) | 2010 | 2009 | ||||||
| Fixed rate |
||||||||
| 1 year or less |
$ | 18,442 | 16,389 | |||||
| 1-5 years |
62,201 | 73,668 | ||||||
| After 5 years |
60,375 | 55,638 | ||||||
| Total fixed rate |
141,018 | 145,695 | ||||||
| Adjustable rate |
||||||||
| 1 year or less |
404,700 | 513,245 | ||||||
| 1-5 years |
623,139 | 838,721 | ||||||
| After 5 years |
384,344 | 494,072 | ||||||
| Total adjustable rate |
1,412,183 | 1,846,038 | ||||||
| Total commercial |
$ | 1,553,201 | 1,991,733 | |||||
Allowance for Loan Losses. The allowance for loan losses increased $65.5 million from December 31, 2009, to $403.0 million at December 31, 2010. The allowance increase in 2010 was due to credit deterioration, primarily driven by a continuation of challenging housing related economic conditions and increased loan modifications accounted for as TDRs.
18
Table of Contents
At December 31, 2010, the allowance for loan losses included $377.2 million for consumer loans and $25.8 million for commercial loans. The total allowance reflects management’s estimate of credit losses inherent in the loan portfolio at the balance sheet date. The “—Risk Management—Allowance for Credit Losses” section describes how management estimates the allowance for loan losses and the allowance for unfunded credit commitments.
Interest Rate Swaps. Interest rate swaps, net were $1.0 million at December 31, 2010, and $976 thousand at December 31, 2009, which represents the fair value of our net position in interest rate swaps.
Accounts Receivable—Affiliates, Net. Accounts receivable from affiliates, net was $218.4 million at December 31, 2010, compared with $166.4 million at December 31, 2009, as a result of intercompany transactions related to net loan pay-downs, interest receipts and funding with the Bank.
Risk Management
We use Wells Fargo’s risk management framework to manage our credit, interest rate, market and liquidity risks. The following discussion highlights this framework as it relates to how we manage each of these risks.
Credit Risk Management
Our credit risk management process is governed centrally, but provides for decentralized management and accountability by our lines of business. Our overall credit process includes comprehensive credit policies, judgmental or statistical credit underwriting, frequent and detailed risk measurement and modeling, extensive credit training programs, and a continual loan review and audit process. In addition, banking regulatory examiners review and perform detailed tests of our credit underwriting, loan administration and allowance processes.
A key to our credit risk management is adhering to a well controlled underwriting process, which we believe is appropriate for the needs of our customers as well as investors who purchase the loans or securities collateralized by the loans. We approve applications and make loans only if we believe the customer has the ability to repay the loan or line of credit according to all its terms. Our underwriting of loans collateralized by residential real property includes appraisals or automated valuation models (AVMs) to support property values. AVMs are computer-based tools used to estimate the market value of homes. AVMs are a lower-cost alternative to appraisals and support valuations of large numbers of properties in a short period of time. AVMs estimate property values based on processing large volumes of market data including market comparables and price trends for local market areas. The primary risk associated with the use of AVMs is that the value of an individual property may vary significantly from the average for the market area. We have processes to periodically validate AVMs and specific risk management guidelines addressing the circumstances when AVMs may be used. Generally AVMs are used in underwriting to support property values on loan originations only where the loan amount is under $250,000. For underwriting residential property loans of $250,000 or more, we require property visitation appraisals by qualified independent appraisers.
We continually evaluate and modify our credit policies to address appropriate levels of risk. Accordingly, from time to time, we designate certain portfolios and loan products as non-strategic or high risk to limit or cease their continued origination as we actively work to limit losses and reduce our exposures.
Measuring and monitoring our credit risk is an ongoing process that tracks delinquencies, collateral values, FICO scores, economic trends by geographic areas, loan-level risk grading for certain portfolios (typically commercial) and other indications of credit risk. Our credit risk monitoring process is designed to enable early identification of developing risk and to support our determination of an adequate allowance for credit losses. The following analysis reviews the relevant concentrations and certain credit metrics of our significant portfolios. See Note 2 (Loans and Allowance for Credit Losses) to Financial Statements in this Report for more analysis and credit metric information.
By the nature of our status as a REIT, the composition of the loans underlying the participation interests are highly concentrated in real estate. The following table is a summary of the geographical distribution of our loan portfolio for the top five states with loans outstanding.
19
Table of Contents
| (in thousands) | Commercial |
Real estate |
Real estate 1-4 family junior lien mortgage |
Total | % of total loans |
|||||||||||||||
| December 31, 2010 |
||||||||||||||||||||
| Florida |
$ | 391,856 | 1,185,654 | 570,048 | 2,147,558 | 14 | % | |||||||||||||
| New Jersey |
264,307 | 896,035 | 838,485 | 1,998,827 | 13 | |||||||||||||||
| Pennsylvania |
144,856 | 1,093,041 | 684,832 | 1,922,729 | 12 | |||||||||||||||
| North Carolina |
296,138 | 874,113 | 331,358 | 1,501,609 | 10 | |||||||||||||||
| California |
7,462 | 1,358,768 | 43,853 | 1,410,083 | 9 | |||||||||||||||
| All other states |
448,582 | 4,479,222 | 1,597,954 | 6,525,758 | 42 | |||||||||||||||
| Total loans |
$ | 1,553,201 | 9,886,833 | 4,066,530 | 15,506,564 | 100 | % | |||||||||||||
The following table is a summary of our commercial and industrial loans by industry.
| December 31, 2010 |
||||||||
| (in thousands) | Total | % of total loans |
||||||
| Finance |
$ | 50,984 | 24 | % | ||||
| Real estate-other (1) |
32,626 | 16 | ||||||
| Public administration |
28,669 | 14 | ||||||
| Food and beverage |
28,373 | 14 | ||||||
| Investors |
25,049 | 12 | ||||||
| Industrial equipment |
11,593 | 6 | ||||||
| Healthcare |
6,730 | 3 | ||||||
| Crops |
6,631 | 3 | ||||||
| Other |
19,163 | 8 | ||||||
| Total commercial and industrial loans |
$ | 209,818 | 100 | % | ||||
| (1) | Includes lessors, building operators and real estate agents. |
The following table is a summary of CRE loans by state and property type.
| December 31, 2010 | ||||||||||||||||
| (in thousands) | Real estate |
Real estate |
Total | % of total loans |
||||||||||||
| By state: |
||||||||||||||||
| Florida |
$ | 311,194 | 36,395 | 347,589 | 26 | % | ||||||||||
| North Carolina |
281,313 | 12,912 | 294,225 | 22 | ||||||||||||
| New Jersey |
209,054 | 2,287 | 211,341 | 16 | ||||||||||||
| Pennsylvania |
100,776 | 3,427 | 104,203 | 8 | ||||||||||||
| South Carolina |
82,080 | 3,279 | 85,359 | 6 | ||||||||||||
| All other states |
282,933 | 17,733 | 300,666 | 22 | ||||||||||||
| Total loans |
$ | 1,267,350 | 76,033 | 1,343,383 | 100 | % | ||||||||||
| By property: |
||||||||||||||||
| Office buildings |
$ | 333,954 | 817 | 334,771 | 25 | % | ||||||||||
| Industrial/warehouse |
251,503 | 2,597 | 254,100 | 19 | ||||||||||||
| Retail (excluding |
201,969 | 8,782 | 210,751 | 16 | ||||||||||||
| Shopping center |
139,918 | - | 139,918 | 10 | ||||||||||||
| Real estate - other |
104,358 | 21,035 | 125,393 | 9 | ||||||||||||
| Hotel/motel |
87,241 | 553 | 87,794 | 7 | ||||||||||||
| Apartments |
67,783 | 10,095 | 77,878 | 6 | ||||||||||||
| Institutional |
58,953 | - | 58,953 | 4 | ||||||||||||
| Land (excluding 1-4 family) |
10,832 | 30,929 | 41,761 | 3 | ||||||||||||
| 1-4 family structure |
6,321 | 1,225 | 7,546 | 1 | ||||||||||||
| Other |
4,518 | - | 4,518 | - | ||||||||||||
| Total loans |
$ | 1,267,350 | 76,033 | 1,343,383 | 100 | % | ||||||||||
20
Table of Contents
The following table is a summary of real estate 1-4 family mortgage loans by state and combined loan-to-value (CLTV) ratio.
|
December 31, 2010 |
||||||||
| (in thousands) | Real estate 1-4 family |
Current CLTV ratio (1) |
||||||
| Pennsylvania |
$ | 1,777,873 | 65 | % | ||||
| Florida |
1,755,702 | 88 | ||||||
| New Jersey |
1,734,520 | 69 | ||||||
| California |
1,402,621 | 60 | ||||||
| North Carolina |
1,205,471 | 70 | ||||||
| All other states |
6,077,176 | 73 | % | |||||
| Total loans |
$ | 13,953,363 | ||||||
| (1) | Collateral values are generally determined using automated valuation models (AVMs) and are updated quarterly. AVMs are computer-based tools used to estimate market values of homes based on processing large volumes of market data including market comparables and price trends for local market areas. |
The following table includes recent quarterly data, by geographical area, for our home equity portfolio, which reflected the largest portion of our credit losses in 2010.
HOME EQUITY PORTFOLIO (1)
|
% of loans |
Loss rate | |||||||||||||||||||||||||||||||||||
| two payments | (annualized) | |||||||||||||||||||||||||||||||||||
| Outstanding balances | or more past due | Quarter ended | ||||||||||||||||||||||||||||||||||
| (in thousands) | Dec. 31, 2010 |
Sept. 30, 2010 |
June 30, 2010 |
Dec. 31, 2010 |
Sept. 30, 2010 |
June 30, 2010 |
Dec. 31, 2010 |
Sept. 30, 2010 |
June 30, 2010 |
|||||||||||||||||||||||||||
| New Jersey |
$ | 833,984 | 905,689 | 965,837 | 4.73 | % | 4.51 | 4.28 | 3.15 | 3.91 | 2.63 | |||||||||||||||||||||||||
| Pennsylvania |
681,232 | 736,292 | 782,754 | 3.52 | 3.16 | 2.81 | 1.62 | 1.54 | 1.42 | |||||||||||||||||||||||||||
| Florida |
568,037 | 611,776 | 639,796 | 6.72 | 6.93 | 6.75 | 9.83 | 9.29 | 10.50 | |||||||||||||||||||||||||||
| Virginia |
410,781 | 444,102 | 473,064 | 3.72 | 3.44 | 3.52 | 2.77 | 4.43 | 4.71 | |||||||||||||||||||||||||||
| North Carolina |
328,089 | 360,421 | 378,562 | 3.66 | 3.52 | 3.00 | 2.45 | 2.75 | 2.92 | |||||||||||||||||||||||||||
| Other |
1,220,888 | 1,313,885 | 1,391,806 | 4.55 | 4.74 | 4.60 | 3.49 | 4.32 | 3.41 | |||||||||||||||||||||||||||
| Total |
$ | 4,043,011 | 4,372,165 | 4,631,819 | 4.56 | 4.50 | 4.29 | 3.84 | 4.35 | 3.98 | ||||||||||||||||||||||||||
| (1) | Consists of real estate 1-4 family junior lien mortgages, excluding PCI loans. |
Nonaccrual Loans and Other Nonperforming Assets
The following table shows the comparative data for nonaccrual loans and other nonperforming assets. We generally place loans on nonaccrual status when:
| — | the full and timely collection of interest or principal becomes uncertain; |
| — | they are 90 days (120 days with respect to real estate 1-4 family first and junior lien mortgages) past due for interest or principal (unless both well-secured and in the process of collection); or |
| — | part of the principal balance has been charged off and no restructuring has occurred. |
Note 1 (Summary of Significant Accounting Policies – Loans) to Financial Statements in this Report describes our accounting policy for nonaccrual and impaired loans.
21
Table of Contents
NONACCRUAL LOANS AND OTHER NONPERFORMING ASSETS
|
December 31, |
||||||||
| (in thousands) | 2010 | 2009 | ||||||
| Nonaccrual loans |
||||||||
| Commercial: |
||||||||
| Commercial and industrial |
$ | 2,454 | 3,510 | |||||
| Real estate mortgage |
21,491 | 4,869 | ||||||
| Real estate construction |
366 | - | ||||||
| Total commercial |
24,311 | 8,379 | ||||||
| Consumer: |
||||||||
| Real estate 1-4 family first mortgage |
225,297 | 119,666 | ||||||
| Real estate 1-4 family junior lien mortgage |
117,218 | 79,495 | ||||||
| Total consumer |
342,515 | 199,161 | ||||||
| Total nonaccrual loans |
366,826 | 207,540 | ||||||
| Other nonperforming assets |
||||||||
| Foreclosed assets |
5,891 | 2,282 | ||||||
| Total nonaccrual loans and other nonperforming assets |
$ | 372,717 | 209,822 | |||||
| As a percentage of total loans |
2.40 | % | 1.28 | |||||
Nonaccrual loans increased to $366.8 million at December 31, 2010, from $207.5 million at December 31, 2009. The increase was primarily related to commercial real estate and consumer real estate 1-4 family mortgage loans, due to continued slow dispositions.
Typically, changes to nonaccrual loans period-over-period represent inflows for loans that reach a specified past due status or where we believe that the full collection of principal is in doubt, offset by reductions for loans that are charged off, sold, transferred to foreclosed properties, or are no longer classified as nonaccrual because they return to accrual status. Dispositions have been slower in this economic cycle for a few reasons. Modification programs, including government and proprietary, require customers to provide updated documentation and complete trial repayment periods, to evidence sustained performance, before the loan can be removed from nonaccrual status. In addition, for loans in foreclosure, many states, including Florida where Wachovia Funding has significant exposures, have enacted legislation that significantly increases the time frames to complete the foreclosure process, meaning that loans will remain in nonaccrual status for longer periods. In addition, recent foreclosure moratoriums are causing an even greater slow down in dispositions in some states. At the conclusion of the foreclosure process, we continue to sell real estate owned in a timely fashion.
Troubled Debt Restructurings (TDRs)
The following table provides information regarding loans modified in TDRs.
| (in thousands) |
Dec. 31, |
Sept. 30, 2010 |
June 30, 2010 |
Mar. 31 2010 |
Dec. 31, 2009 (1) |
|||||||||||||||
| Consumer TDRs: |
||||||||||||||||||||
| Real estate 1-4 family first mortgage |
$ | 131,159 | 117,916 | 87,853 | 69,113 | 54,129 | ||||||||||||||
| Real estate 1-4 family junior lien mortgage |
78,187 | 74,258 | 68,371 | 63,676 | 61,882 | |||||||||||||||
| Total consumer TDRs |
209,346 | 192,174 | 156,224 | 132,789 | 116,011 | |||||||||||||||
| Commercial TDRs |
2,454 | - | - | - | - | |||||||||||||||
| Total TDRs |
$ | 211,800 | 192,174 | 156,224 | 132,789 | 116,011 | ||||||||||||||
| TDRs on nonaccrual status |
$ | 69,134 | 74,882 | 29,784 | 14,461 | 9,801 | ||||||||||||||
| TDRs on accrual status |
142,666 | 117,292 | 126,440 | 118,328 | 106,210 | |||||||||||||||
| Total TDRs |
$ | 211,800 | 192,174 | 156,224 | 132,789 | 116,011 | ||||||||||||||
(1) Revised to correct previously reported amounts.
We establish an allowance for loan losses when a loan is modified in a TDR, which for consumer loans was $51.9 million at December 31, 2010, and $30.3 million at December 31, 2009. Total charge-offs related to loans modified in a TDR were $6.1 million and $3.8 million in 2010 and 2009, respectively.
Our nonaccrual policies are generally the same for all loan types when a restructuring is involved. We underwrite loans at the time of restructuring to determine whether there is sufficient evidence of sustained repayment capacity based on the borrower’s documented
22
Table of Contents
income, debt to income ratios, and other factors. Any loans lacking sufficient evidence of sustained repayment capacity at the time of modification are charged down to the fair value of the collateral, if applicable. If the borrower has demonstrated performance under the previous terms and the underwriting process shows the capacity to continue to perform under the restructured terms, the loan will remain in accruing status. Otherwise, the loan will be placed in nonaccrual status generally until the borrower demonstrates a sustained period of performance, generally six consecutive months of payments, or equivalent, inclusive of consecutive payments made prior to modification. Loans will also be placed on nonaccrual, and a corresponding charge-off is recorded to the loan balance, if we believe that principal and interest contractually due under the modified agreement will not be collectible.
We do not forgive principal for a majority of our TDRs, but in those situations where principal is forgiven, the entire amount of such principal forgiveness is immediately charged off. When a TDR performs in accordance with its modified terms, the loan either continues to accrue interest (for performing loans), or will return to accrual status after the borrower demonstrates a sustained period of performance.
LOANS 90 DAYS OR MORE PAST DUE AND STILL ACCRUING (1)
|
December 31, |
||||||||
| (in thousands) |
2010 | 2009 | ||||||
| Commercial: |
||||||||
| Commercial and industrial |
$ | 1 | - | |||||
| Real estate mortgage |
3,419 | 9,445 | ||||||
| Real estate construction |
- | - | ||||||
| Total commercial |
3,420 | 9,445 | ||||||
| Consumer: |
||||||||
| Real estate 1-4 family first mortgage |
22,319 | 20,681 | ||||||
| Real estate 1-4 family junior lien mortgage |
14,645 | 20,406 | ||||||
| Total consumer |
36,964 | 41,087 | ||||||
| Total |
$ | 40,384 | 50,532 | |||||
| (1) | The carrying value of PCI loans contractually 90 days or more past due was $10.9 million and $47.6 million at December 31, 2010 and 2009, respectively. These amounts are excluded from the above table as PCI loan accretable yield interest recognition is independent from the underlying contractual loan delinquency status. |
Net Charge-offs
Net charge-offs in 2010 were $284.9 million (1.80% of average total loans outstanding) compared with $149.8 million (0.88%) a year ago. The increase in charge-offs was in part attributable to challenging economic and housing conditions impacting the consumer real estate portfolio, as well as a lower level of charge-offs on our non-PCI loans in early 2009, because such loans were all in performing status at the time of the Wachovia merger. The majority of the increase was in consumer real estate, which has a higher concentration of home equity loans geographically located in the eastern United States. Collateral value stabilization and delinquency improvements have lagged in this portfolio which continued to experience elevated losses. These conditions also contributed to increases in the allowance for credit losses.
Net charge-offs in the 1-4 family first mortgage portfolio totaled $90.7 million in 2010 compared with $45.8 million a year ago. Net charge-offs in the real estate 1-4 family junior lien portfolio were $191.2 million in 2010 compared with $103.8 million a year ago. Our relatively high-quality real estate 1-4 family mortgage portfolio continued to reflect relatively low loss rates compared to industry trends. Until housing prices fully stabilize, these credit losses are expected to remain elevated, but may decline as economic recovery continues.
Commercial and industrial and CRE net charge-offs in 2010 were $2.9 million while 2009 charge-offs were $227 thousand. Although economic stress and decreased commercial real estate values have resulted in the deterioration of our commercial and industrial and CRE credit portfolios, there have been relatively small losses. Due to the larger dollar amounts associated with individual commercial and industrial and CRE loans, loss recognition tends to be irregular and exhibits more variation than consumer loan portfolios.
Allowance for Credit Losses
The allowance for credit losses, which consists of the allowance for loan losses and the allowance for unfunded credit commitments, is management’s estimate of credit losses inherent in the loan portfolio and unfunded credit commitments at the balance sheet date, excluding loans carried at fair value. The detail of the changes in the allowance for credit losses by portfolio segment (including charge-offs and recoveries by loan class) is in Note 2 (Loans and Allowance for Credit Losses) to Financial Statements in this Report.
23
Table of Contents
We employ a disciplined process and methodology to establish our allowance for loan losses each quarter. This process takes into consideration many factors, including historical and forecasted loss trends, loan-level credit quality ratings and loan grade specific loss factors. In addition, we review several credit ratio trends, such as the ratio of the allowance for loan losses to nonaccrual loans and the ratio of the allowance for loan losses to net charge-offs. These trends are not determinative of the adequacy of the allowance as we use several analytical tools in determining the adequacy of the allowance.
At December 31, 2010, the allowance for loan losses totaled $403.0 million (2.60% of total loans), compared with $337.4 million (2.06%), at December 31, 2009.
The ratio of the allowance for credit losses to total nonaccrual loans was 110% and 163% at December 31, 2010 and 2009, respectively. In general, this ratio may fluctuate significantly from period to period due to such factors as the mix of loan types in the portfolio, borrower credit strength and the value and marketability of collateral.
We believe the allowance for credit losses of $403.6 million was adequate to cover credit losses inherent in the loan portfolio, including unfunded credit commitments, at December 31, 2010. The allowance for credit losses is evaluated on a quarterly basis and considers existing factors at the time, including economic or market conditions and ongoing internal and external examination processes. Due to the sensitivity of the allowance for credit losses to changes in the economic environment, it is possible that unanticipated economic deterioration would create incremental credit losses not anticipated as of the balance sheet date. Our process for determining the adequacy of the allowance for credit losses is discussed in the “Critical Accounting Policies” section.
ASSET/LIABILITY MANAGEMENT
Asset/liability management involves the evaluation, monitoring and management of interest rate risk, market risk and liquidity and funding.
Interest Rate Risk
Interest rate risk is the sensitivity of earnings to changes in interest rates. Approximately 17% of our loan portfolio consisted of variable rate loans at December 31, 2010. In a declining rate environment, we may experience a reduction in interest income on our loan portfolio and a corresponding decrease in funds available to be distributed to our shareholders. The reduction in interest income may result from downward adjustment of the indices upon which the interest rates on loans are based and from prepayments of loans with fixed interest rates, resulting in reinvestment of the proceeds in lower yielding assets.
At December 31, 2010, approximately 83% of the balance of our loans had fixed interest rates. Such loans tend to increase our interest rate risk. We monitor the rate sensitivity of assets acquired. Our methods for evaluating interest rate risk include an analysis of interest-rate sensitivity “gap,” which is defined as the difference between interest-earning assets and interest-bearing liabilities maturing or repricing within a given time period. A gap is considered positive when the amount of interest rate-sensitive assets exceeds the amount of interest rate-sensitive liabilities. A gap is considered negative when the amount of interest rate-sensitive liabilities exceeds interest rate-sensitive assets.
During a period of rising interest rates, a negative gap would tend to adversely affect net interest income, while a positive gap would tend to result in an increase in net interest income. During a period of falling interest rates, a negative gap would tend to result in an increase in net interest income, while a positive gap would tend to affect net interest income adversely. Because different types of assets and liabilities with the same or similar maturities may react differently to changes in overall market rates or conditions, changes in interest rates may affect net interest income positively or negatively even if an institution is perfectly matched in each maturity category.
At December 31, 2010, $5.5 billion, or 30% of our assets, had variable interest rates and could be expected to reprice with changes in interest rates. At December 31, 2010, our liabilities were $56.2 million, or less than 1% of our assets, while stockholders’ equity was $18.1 billion, or greater than 99% of our assets. This positive gap between our assets and liabilities indicates that an increase in interest rates would result in an increase in net interest income and a decrease in interest rates would result in a decrease in net interest income.
Our rate-sensitive assets and liabilities at December 31, 2010, are presented below. Assets that immediately reprice are placed in the overnight column. The allowance for loan losses is not included in loans. At December 31, 2010 the fair value of the loan portfolio was $16.4 billion with fixed rate loans and loan participations of approximately $13.6 billion and variable rate loans and loan participations of approximately $2.8 billion.
24
Table of Contents
|
December 31, 2010 |
||||||||||||||||||||||||
| (in thousands) | Overnight | Within one year |
One to three years |
Three to five years |
Over five years |
Total | ||||||||||||||||||
| Rate-sensitive assets |
||||||||||||||||||||||||
| Interest-bearing deposits in banks |
$ | 2,774,299 | - | - | - | - | 2,774,299 | |||||||||||||||||
| Loans and loan participations |
||||||||||||||||||||||||
| Fixed rate |
- | 73,572 | 174,495 | 512,933 | 12,053,032 | 12,814,032 | ||||||||||||||||||
| Variable rate |
- | 405,275 | 401,925 | 243,896 | 1,641,436 | 2,692,532 | ||||||||||||||||||
| Total rate-sensitive assets |
$ | 2,774,299 | 478,847 | 576,420 | 756,829 | 13,694,468 | 18,280,863 | |||||||||||||||||
| Total rate-sensitive liabilities |
$ | - | - | - | - | - | - | |||||||||||||||||
All of our derivatives are economic hedges and none are treated as accounting hedges. In addition, all our derivatives (currently consisting of interest rate swaps) are recorded at fair value in the balance sheet. When we have more than one transaction with a counterparty and there is a legally enforceable master netting agreement between the parties, the net of the gain and loss positions are recorded as an asset or a liability in our consolidated balance sheet. Realized and unrealized gains and losses are recorded as a net gain or loss on interest rate swaps in our consolidated statement of income.
In 2001, the Bank contributed receive-fixed interest rate swaps with a notional amount of $4.25 billion and a fair value of $673.0 million to us in exchange for common stock. The unaffiliated counterparty to the receive-fixed interest rate swaps provided cash collateral to us. We pay interest to the counterparty on the collateral at a short-term interest rate. Shortly after the contribution of the receive-fixed interest rate swaps, we entered into pay-fixed interest rate swaps with a notional amount of $4.25 billion that serve as an economic hedge of the contributed swaps. All interest rate swaps are transacted with the same unaffiliated third party.
At December 31, 2010, our position in interest rate swaps was an asset of $422.6 million, a liability of $316.3 million, and a cash collateral payable of $105.3 million. The position in the interest rate swap is recorded as a net amount on our consolidated balance sheet at fair value, as positions with the same counterparty are netted as part of a legally enforceable master netting agreement between Wachovia Funding and the derivative counterparty, and is reported net of the cash collateral received and paid.
At December 31, 2010, our receive-fixed interest rate swaps with a notional amount of $4.1 billion had a weighted average maturity of 1.46 years, weighted average receive rate of 7.45% and weighted average pay rate of 0.30%. Our pay-fixed interest rate swaps with a notional amount of $4.1 billion had a weighted average maturity of 1.46 years, weighted average receive rate of 0.30% and weighted average pay rate of 5.72% at December 31, 2010. All the interest rate swaps have variable pay or receive rates based on three- or six-month LIBOR, and they are the pay or receive rates in effect at December 31, 2010.
Market Risk
Market risk is the risk of loss from adverse changes in market prices and interest rates. Market risk arises primarily from interest rate risk inherent in lending, investment in derivative financial instruments and borrowing activities.
Due to the difference in fixed rates in our interest rate swaps, volatility is expected given certain interest rate fluctuations. If market rates were to decrease 100 basis points or 200 basis points, we would recognize short-term net gains on our interest rate swaps of $1.0 million or $2.1 million, respectively. If interest rates were to increase 100 basis points or 200 basis points, we would recognize short-term net losses on our interest rate swaps of $1.0 million or $2.0 million, respectively. These short-term fluctuations will eventually offset over the life of the interest rate swaps when held to maturity, with no change in cash flow occurring for the net positions. The changes in value of the net swap positions were calculated under the assumption there was a parallel shift in the LIBOR curve using 100 basis point and 200 basis point shifts, respectively.
Liquidity and Funding
The objective of effective liquidity management is to ensure that we can meet customer loan requests and other cash commitments efficiently under both normal operating conditions and under unpredictable circumstances of industry or market stress. To achieve this objective, Wells Fargo’s Corporate Asset/Liability Management Committee establishes and monitors liquidity guidelines that require sufficient asset-based liquidity to cover potential funding requirements and to avoid over-dependence on volatile, less reliable funding markets.
Proceeds received from pay-downs of loans are typically sufficient to fund existing lending commitments and loan purchases. Depending upon the timing of the loan purchases, we may draw on the line of credit we have with the Bank as a short-term liquidity source. Wachovia Funding has a $1.0 billion line of credit with the Bank, and our subsidiaries WREIC and WPR have lines of credit with the Bank of $1.0 billion and $200.0 million, respectively. Each of these lines is under a revolving demand note at a rate equal to the federal funds rate. Generally, we repay these borrowings within several months as we receive cash on loan pay-downs from our
25
Table of Contents
loan portfolio. At December 31, 2010, there were no borrowings outstanding on our line of credit with the Bank. Should a longer-term liquidity need arise, we could issue additional common or preferred stock, subject to any pre-approval rights of our shareholders. We do not have and do not anticipate having any material capital expenditures in the foreseeable future. We believe our existing sources of liquidity are sufficient to meet our funding needs.
Wachovia Funding’s primary liquidity needs are to pay operating expenses, fund our lending commitments, purchase loans as the underlying loans mature or repay, and pay dividends. Operating expenses and dividends are expected to be funded through cash generated by operations, while funding commitments and the acquisition of additional participation interests in loans are intended to be funded with the proceeds obtained from repayment of principal balances by individual borrowers. We expect to distribute annually an aggregate amount of dividends with respect to outstanding capital stock equal to approximately 100 percent of our REIT taxable income for federal tax purposes. Such distributions may in some periods exceed net income determined under U.S. generally accepted accounting principles (GAAP). Refer to Note 7 (Income Taxes) to Financial Statements in this Report for further information.
To the extent that Wachovia Funding’s board of directors determines that additional funding is required, we may raise funds through additional equity offerings, debt financings, retention of cash flow or a combination of these methods. However, any cash flow retention must be consistent with the provisions of the Investment Company Act and the Code which requires the distribution by a REIT of at least 90% of its REIT taxable income, excluding capital gains, and must take into account taxes that would be imposed on undistributed income. In addition, any necessary liquidity could be obtained by drawing on lines of credit with the Bank.
At December 31, 2010, our liabilities principally consist of deferred income tax liabilities. Our certificate of incorporation does not contain any limitation on the amount or percentage of debt, funded or otherwise, we may incur, except the incurrence of debt for borrowed money or our guarantee of debt for borrowed money in excess of amounts borrowed or guaranteed. However, as part of issuing our Series A preferred securities, we have a covenant in which we agree not to incur indebtedness over 20% of our stockholders’ equity unless approved by two-thirds of the Series A preferred securities, voting as a separate class.
In January 2011, our board of directors declared a dividend in the amount of $2.5 billion payable to holders of our common stock on January 21, 2011. This dividend reduced relatively high levels of cash on Wachovia Funding’s balance sheet resulting from loan pay-downs in order to maintain Qualifying Assets greater than 80% of total assets. Based on our current expectations of loan pay-downs and anticipated reinvestment in REIT Qualified Assets during 2011, management expects to request our board of directors to consider a return of up to an additional $3.0 billion of capital to our holders of common stock in 2011. In January 2011, our board of directors also declared dividends payable to holders of our preferred securities payable on March 31, 2011, in accordance with our certificate of incorporation.
Critical Accounting Policy
Our significant accounting policies (see Note 1 (Summary of Significant Accounting Policies) to Financial Statements in this Report) are fundamental to understanding our results of operations and financial condition because they require that we use estimates and assumptions that may affect the value of our assets or liabilities and financial results. We have identified the allowance for credit losses policy as being particularly sensitive in terms of judgments and the extent to which estimates are used.
Management has reviewed and approved this critical accounting policy and has discussed it with the board of directors.
Allowance for Credit Losses (ACL)
As a subsidiary of Wells Fargo, our loans are subject to the same analysis of the adequacy of the allowance for credit losses applied to loans maintained in Wells Fargo’s subsidiaries, including the Bank.
The allowance for credit losses, which consists of the allowance for loan losses and the allowance for unfunded credit commitments, is management’s estimate of credit losses inherent in the loan portfolio, including unfunded commitments at the balance sheet date. We develop and document our allowance methodology at the portfolio segment level. Our loan portfolio consists of a commercial loan portfolio segment and a consumer loan portfolio segment.
We employ a disciplined process and methodology to establish our allowance for credit losses. The total allowance for credit losses considers both impaired and unimpaired loans. While our methodology attributes portions of the allowance to specific portfolio segments, the entire allowance for credit losses is available to absorb credit losses inherent in the total loan portfolio, including unfunded commitments. No single statistic or measurement determines the adequacy of the allowance for credit losses.
26
Table of Contents
Commercial Portfolio Segment
The allowance for credit losses for unimpaired commercial loans is estimated through the application of loss factors to loans based on credit risk rating for each loan. In addition, the allowance for credit losses for unfunded commitments is estimated by applying these loss factors to loan equivalent exposures. The loss factors reflect the estimated default probability and quality of the underlying collateral. The loss factors used are statistically derived through the observation of historical losses incurred for loans within each credit risk rating over a relevant specified period of time. As appropriate, we adjust or supplement these loss factors and estimates to reflect other risks that may be identified from current conditions and developments in selected portfolios.
The allowance also includes an amount for estimated credit losses on impaired loans such as nonaccrual loans and loans that have been modified in a TDR, whether on accrual or nonaccrual status.
Consumer Portfolio Segment
Loans are pooled generally by product type with similar risk characteristics. Losses are estimated using forecasted losses to represent our best estimate of inherent loss based on historical experience, quantitative and other mathematical techniques over the loss emergence period. Each business group exercises significant judgment in the determination of the credit loss estimation model type and/or segmentation method that fits the credit risk characteristics of its portfolio. We use both internally developed and vendor supplied models in this process. We often use roll rate or net flow models as well as econometric/statistical models for loss projections. Management must use judgment in establishing additional input metrics for the modeling processes, such as portfolio segmentation by sub-product. In addition, we establish an allowance for consumer loans that have been modified in a TDR, whether on accrual or nonaccrual status.
The models used to determine the allowance are validated by our internal model validation group operating in accordance with our policies.
Other ACL Matters
An allowance for impaired consumer and commercial loans is measured based on an estimate of cash flows, both principal and interest, expected to be collected or an assessment of the fair value of collateral underlying the impaired loan, if applicable. Management exercises significant judgment to develop these estimates.
The allowance for credit losses for both portfolio segments includes an amount for imprecision or uncertainty that may change from period to period. This amount represents management’s judgment of risks inherent in the processes and assumptions used in establishing the allowance. This imprecision considers economic environmental factors, modeling assumptions and performance, process risk, and other subjective factors, including industry trends.
Sensitivity to Changes
Changes in the allowance for credit losses and, therefore, in the related provision expense can materially affect net income. The establishment of the allowance for credit losses relies on a consistent quarterly process that requires significant management review and judgment. Management considers changes in economic conditions, customer behavior, and collateral value, among other influences. From time to time, economic factors or business decisions such as the addition or liquidation of a loan product or business unit, may affect the loan portfolio, causing management to provide or release amounts from the allowance for credit losses.
The allowance for credit losses for commercial loans, including unfunded credit commitments (individually risk weighted) is sensitive to credit risk ratings assigned to each credit exposure. Commercial loan risk ratings are evaluated based on each situation by experienced senior credit officers and are subject to periodic review by an independent internal team of credit specialists.
The allowance for credit losses for consumer loans (statistically modeled) is sensitive to economic assumptions and delinquency trends. Forecasted losses are modeled using a range of economic scenarios.
Assuming a one risk rating downgrade throughout our commercial portfolio segment and a stressed economic scenario for modeled losses on our consumer portfolio segment could imply an additional allowance requirement of approximately $81 million.
Assuming a one risk rating upgrade throughout our commercial portfolio segment and a strong recovery economic scenario for modeled losses on our consumer portfolio segment could imply a reduced allowance requirement of approximately $57 million.
27
Table of Contents
The sensitivity analyses provided are hypothetical scenarios and are not considered probable. They do not represent management’s view of inherent losses in the portfolio as of the balance sheet date. Because significant judgment is used, it is possible that others performing similar analyses could reach different conclusions.
See the “Risk Management – Credit Risk Management” section and Note 2 (Loans and Allowance for Credit Losses) to Financial Statements in this Report for further discussion of our allowance.
Current Accounting Developments
The following accounting pronouncement has been issued by the Financial Accounting Standards Board (FASB):
| — | Accounting Standards Update (ASU) 2011-01, Deferral of the Effective Date of Disclosures about Troubled Debt Restructurings in Update No. 2010-20. |
ASU 2011-01 defers the effective date for disclosures on TDRs. The deferral is intended to provide the FASB with additional time to complete a separate TDR project, with new disclosures expected to be effective for second quarter 2011. For more information on the disclosure requirements for TDRs, see the discussion on ASU 2010-20, Disclosures about the Credit Quality of Financing Receivables and the Allowance for Credit Losses, in Note 1 (Summary of Significant Accounting Policies) to Financial Statements in this Report.
FORWARD-LOOKING STATEMENTS
This Report contains “forward-looking statements” within the meaning of the Private Securities Litigation Reform Act of 1995. Forward-looking statements can be identified by words such as “anticipates,” “intends,” “plans,” “seeks,” “believes,” “estimates,” “expects,” “projects,” “outlook,” “forecast,” “will,” “may,” “could,” “should,” “can” and similar references to future periods. Examples of forward-looking statements include, but are not limited to, statements we make about: future results of Wachovia Funding; expectations for consumer and commercial credit losses, life-of-loan losses, and the sufficiency of our credit loss allowance to cover future credit losses; the expected outcome and impact of legal, regulatory and legislative developments; and Wachovia Funding’s plans, objectives and strategies.
Forward-looking statements are based on our current expectations and assumptions regarding our business, the economy and other future conditions. Because forward-looking statements relate to the future, they are subject to inherent uncertainties, risks and changes in circumstances that are difficult to predict. Our actual results may differ materially from those contemplated by the forward-looking statements. We caution you, therefore, against relying on any of these forward-looking statements. They are neither statements of historical fact nor guarantees or assurances of future performance. While there is no assurance that any list of risks and uncertainties or risk factors is complete, important factors that could cause actual results to differ materially from those in the forward-looking statements include the following, without limitation:
| — | the effect of political and economic conditions and geopolitical events; |
| — | economic conditions that affect the general economy, housing prices, the job market, consumer confidence and spending habits, including our borrowers repayment of our loan participations; |
| — | the level and volatility of the capital markets, interest rates, currency values and other market indices that affect the value of our assets and liabilities; |
| — | the availability and cost of both credit and capital as well as the credit ratings assigned to our debt instruments; |
| — | investor sentiment and confidence in the financial markets; |
| — | our reputation; |
| — | the impact of current, pending and future legislation, regulation and legal actions, including capital standards applicable to the Bank or Wells Fargo; |
| — | changes in accounting standards, rules and interpretations; |
| — | mergers and acquisitions, and our ability to integrate them; |
| — | various monetary and fiscal policies and regulations of the U.S. and foreign governments; |
| — | financial services reform and other current, pending or future legislation or regulation that could have a negative effect on our revenue and businesses, including the Dodd-Frank Wall Street Reform and Consumer Protection Act (the Dodd-Frank Act) and legislation; and |
| — | the other factors described in “Risk Factors” below. |
Any forward-looking statement made by us in this Report speaks only as of the date on which it is made. Factors or events that could cause our actual results to differ may emerge from time to time, and it is not possible for us to predict all of them. We undertake no
28
Table of Contents
obligation to publicly update any forward-looking statement, whether as a result of new information, future developments or otherwise, except as may be required by law.
RISK FACTORS
An investment in Wachovia Funding involves risk, including the possibility that the value of the investment could fall substantially and that dividends or other distributions on the investment could be reduced or eliminated. The following are the most significant risks associated with that business:
Our financial results and condition may be adversely affected by difficult business and economic conditions, particularly if home prices continue to fall or unemployment does not improve or continues to increase.
Our financial performance is affected by general business and economic conditions in the United States and abroad, and a worsening of current business and economic conditions could adversely affect our business, results of operations and financial condition. For example, significant declines in home prices over the last several years and continued high unemployment have resulted in elevated credit costs and have adversely affected our credit performance and financial results. If home prices continue to fall or unemployment does not improve or rises we would expect to incur higher than normal charge-offs and provision expense from increases in our allowance for credit losses. These conditions may adversely affect not only consumer loan performance but also commercial and industrial and commercial real estate loans, especially those business borrowers that rely on the health of industries or properties that may experience deteriorating economic conditions.
We are effectively controlled by Wells Fargo and our relationship with Wells Fargo and/or the Bank may create potential conflicts of interest.
All of our officers and one of our directors are also officers of Wells Fargo or the Bank or their affiliates. Wells Fargo, the Bank and Wachovia Preferred Holding control a substantial majority of our outstanding voting shares and, in effect, have the right to elect all of our directors, including independent directors, except under limited circumstances if we fail to pay dividends.
The Bank may have interests that are not identical to our interests. Wells Fargo, the ultimate parent of the Bank may have investment goals and strategies that differ from those of the holders of the Series A preferred securities. Consequently, conflicts of interest between us, on one hand, and the Bank and/or Wells Fargo, on the other hand, may arise.
We are dependent on the officers and employees of Wells Fargo and the Bank for our business activities and our relationship with Wells Fargo and/or the Bank may create potential conflicts of interest.
Wells Fargo and the Bank are involved in virtually every aspect of our operations. The Bank administers our day-to-day activities under the terms of participation and servicing agreements between the Bank and us. We are dependent on the diligence and skill of the officers and employees of the Bank for the selection, structuring and monitoring of the loans in our portfolio and our other authorized investments and business opportunities. The Bank manages our cash collateral related to our interest rate swaps.
Despite our belief that the terms of the loan participation and servicing agreements between the Bank and us reflect terms consistent with those negotiated on an arms-length basis, our dependency on the Bank’s officers and employees and our close relationship with the Bank may create potential conflicts of interest. Specifically, such conflicts of interest may arise because the employees of the Bank have the power to set the amount of the service fees paid to the Bank, modify the loan participation and servicing agreements, and make business decisions with respect to servicing of the underlying loans, particularly the loans that are placed on nonaccrual status or are otherwise non-performing.
The loans in our portfolio are subject to economic conditions that could negatively affect the value of the collateral securing such loans and/or the results of our operations.
The value of the collateral underlying our loans and/or the results of our operations could be affected by various conditions in the economy, such as:
| — | changes in interest rates; |
| — | local and other economic conditions affecting real estate and other collateral values; |
| — | sudden or unexpected changes in economic conditions, including changes that might result from terrorist attacks and the United States’ response to such attacks; |
29
Table of Contents
| — | the continued financial stability of a borrower and the borrower’s ability to make loan principal and interest payments, which may be adversely affected by job loss, recession, divorce, illness or personal bankruptcy; |
| — | the ability of tenants to make lease payments; |
| — | the ability of a property to attract and retain tenants, which may be affected by conditions such as an oversupply of space or a reduction in demand for rental space in the area, the attractiveness of properties to tenants, competition from other available space, and the ability of the owner to pay leasing commissions, provide adequate maintenance and insurance, pay tenant improvement costs, and make other tenant concessions; |
| — | the availability of credit to refinance loans at or prior to maturity; and |
| — | increased operating costs, including energy costs, real estate taxes, and costs of compliance with environmental controls and regulations. |
If we lose our exemption under the Investment Company Act it could have a material adverse effect on us.
We believe that we are not, and intend to conduct our operations so as not to become, regulated as an investment company under the Investment Company Act. Under the Investment Company Act, a non-exempt entity that is an investment company is required to register with the SEC and is subject to extensive, restrictive and potentially adverse regulation relating to, among other things, operating methods, management, capital structure, dividends and transactions with affiliates. If a change in the laws or the interpretations of those laws were to occur, we could be required to either change the manner in which we conduct our operations to avoid being required to register as an investment company or register as an investment company, either of which could have a material adverse effect on us and the price of our securities. Further, in order to ensure that we at all times continue to qualify for the exemption, we may be required at times to adopt less efficient methods of financing certain of our assets than would otherwise be the case and may be precluded from acquiring certain types of assets whose yield is somewhat higher than the yield on assets that could be purchased in a manner consistent with the exemption. The net effect of these factors may lower at times our net interest income. Finally, if we were an unregistered investment company, there would be a risk that we would be subject to monetary penalties and injunctive relief in an action brought by the SEC, that we would be unable to enforce contracts with third parties and that third parties could seek to obtain rescission of transactions undertaken during the period we were determined to be an unregistered investment company.
Legislative and regulatory proposals may restrict or limit our ability to engage in our current businesses or in businesses that we desire to enter into.
We continue to evaluate the potential impact on liquidity management of regulatory proposals, including Basel III and those required under the Dodd-Frank Act, as they move closer to the final rule-making process.
Proposed capital standards, if adopted, may cause our Series A preferred securities to be redeemed early.
Except in certain circumstances, our Series A preferred securities may not be redeemed prior to December 31, 2022. Prior to that date, among other things, if regulators adopt capital standards that do not permit Wells Fargo or the Bank to treat our Series A preferred securities as Tier 1 capital, we may determine to redeem the Series A preferred securities, as provided in our certificate of incorporation. Although any such redemption must be in whole for a redemption price of $25.00 per Series A security, plus all authorized, declared but unpaid dividends to the date of redemption, such event may have an adverse effect on the trading price for the Series A preferred securities.
We may suffer adverse tax consequences if we fail to qualify as a REIT.
No assurance can be given that Wachovia Funding will be able to continue to operate in a manner so as to remain qualified as a REIT. Qualification as a REIT involves the application of highly technical and complex tax law provisions for which there are limited judicial and administrative interpretations and involves the determination of various factual matters and circumstances not entirely within our control. No assurance can be given that new legislation or new regulations, administrative interpretations, or court decisions will not significantly change the tax laws in the future with respect to qualification as a REIT or the federal income tax consequences of such qualification in a way that would materially and adversely affect Wachovia Funding’s ability to operate. Any such new legislation, regulation, interpretation or decision could be the basis of a tax event that would permit us to redeem all or any preferred securities, including the Series A preferred securities. If Wachovia Funding were to fail to qualify as a REIT, the dividends on preferred securities would not be deductible for federal income tax purposes. In that event, Wachovia Funding could face a tax liability that could consequently result in a reduction in our net income after taxes, which could also adversely affect our ability to pay dividends to common and preferred securities holders.
30
Table of Contents
Although Wachovia Funding currently intends to operate in a manner designed to qualify as a REIT, future economic, market, legal, tax or other considerations may cause it to determine that it is in its best interests and the best interests of holders of common and preferred securities to revoke the REIT election.
Changes in accounting policies or accounting standards, and changes in how accounting standards are interpreted or applied, could materially affect how we report our financial results and conditions.
Our accounting policies are fundamental to determining and understanding our financial results and condition. Some of these policies require use of estimates and assumptions that may affect the value of our assets or liabilities and financial results. Further, our policies related to the allowance for credit are critical because they require management to make difficult, subjective and complex judgments about matters that are inherently uncertain and because it is likely that materially different amounts would be reported under different conditions or using different assumptions. For a description of these policies, refer to “Item 7 Management’s Discussion and Analysis of Financial Condition and Results of Operations—Critical Accounting Policies.”
From time to time FASB and the SEC change the financial accounting and reporting standards that govern the preparation of our external financial statements. In addition, accounting standard setters and those who interpret the accounting standards (such as the FASB, SEC, banking regulators and our outside auditors) may change or even reverse their previous interpretations or positions on how these standards should be applied. Changes in financial accounting and reporting standards and changes in current interpretations may be beyond our control, can be hard to predict and could materially affect how we report our financial results and condition. We may be required to apply a new or revised standard retroactively or apply an existing standard differently, also retroactively, in each case resulting in our potentially restating prior period financial statements in material amounts.
CONTROLS AND PROCEDURES
Disclosure Controls and Procedures
As required by SEC rules, Wachovia Funding’s management evaluated the effectiveness, as of December 31, 2010, of disclosure controls and procedures. Wachovia Funding’s chief executive officer and chief financial officer participated in the evaluation. Based on this evaluation, the chief executive officer and chief financial officer concluded that Wachovia Funding’s disclosure controls and procedures were effective as of December 31, 2010.
Internal Control Over Financial Reporting
Internal control over financial reporting is defined in Rule 13a-15(f) promulgated under the Securities Exchange Act of 1934 as a process designed by, or under the supervision of, Wachovia Funding’s principal executive and principal financial officers and effected by Wachovia Funding’s board of directors, management and other personnel, to provide reasonable assurance regarding the reliability of financial reporting and the preparation of financial statements for external purposes in accordance with GAAP and includes those policies and procedures that:
| — | pertain to the maintenance of records that in reasonable detail accurately and fairly reflect the transactions and dispositions of assets of Wachovia Funding; |
| — | provide reasonable assurance that transactions are recorded as necessary to permit preparation of financial statements in accordance with GAAP, and that receipts and expenditures of Wachovia Funding are being made only in accordance with authorizations of management and directors of Wachovia Funding; and |
| — | provide reasonable assurance regarding prevention or timely detection of unauthorized acquisition, use or disposition of Wachovia Funding’s assets that could have a material effect on the financial statements. |
Because of its inherent limitations, internal control over financial reporting may not prevent or detect misstatements. Projections of any evaluation of effectiveness to future periods are subject to the risk that controls may become inadequate because of changes in conditions, or that the degree of compliance with the policies or procedures may deteriorate. No change occurred during any quarter in 2010 that has materially affected, or is reasonably likely to materially affect, Wachovia Funding’s internal control over financial reporting.
31
Table of Contents
Management’s Report on Internal Control Over Financial Reporting
Management assessed the effectiveness of internal control over financial reporting as of December 31, 2010, using the criteria set forth by the Committee of Sponsoring Organizations of the Treadway Commission (COSO) in Internal Control – Integrated Framework. Based on this assessment, management concluded that as of December 31, 2010, Wachovia Funding’s internal control over financial reporting was effective.
Management is also responsible for the preparation and fair presentation of the consolidated financial statements and other financial information contained in this report. The accompanying consolidated financial statements were prepared in conformity with GAAP and include, as necessary, best estimates and judgments by management.
KPMG LLP, an independent, registered public accounting firm, has audited Wachovia Funding’s consolidated balance sheets as of December 31, 2010 and 2009, and the related consolidated statements of income, changes in stockholders’ equity and cash flows for each of the years in the three-year period ended December 31, 2010, as stated in their report which is included herein. Pursuant to an exemption for certain registrants under the Dodd-Frank Act, this Annual Report on Form 10-K does not include an attestation report of Wachovia Funding’s registered public accounting firm regarding internal control over financial reporting.
Item 7A. Quantitative and Qualitative Disclosures About Market Risk.
Information required by this Item 7A is set forth in Item 7 under the caption “Risk Management.”
Item 8. Financial Statements and Supplementary Data.
The following consolidated financial statements of Wachovia Funding and its subsidiaries at December 31, 2010, are included in this report at the pages indicated:
| Page | ||
| 36 | ||
| 37 | ||
| 38 | ||
| 39 | ||
| 40 | ||
| 41 |
32
Table of Contents
Quarterly Financial Data
Condensed Consolidated Statement of Income - Quarterly (Unaudited)
|
2010 Quarter ended |
2009 Quarter ended |
|||||||||||||||||||||||||||||||||||
| (in thousands) |
Dec. 31 | Sept. 30 | June 30 | Mar. 31 | Dec. 31 | Sept. 30 | June 30 | Mar. 31 | ||||||||||||||||||||||||||||
|
Interest income |
$ 322,936 | 298,153 | 278,615 | 272,428 | 275,481 | 314,386 | 293,948 | 278,107 | ||||||||||||||||||||||||||||
|
Interest expense |
- | - | - | - | - | 148 | 68 | 164 | ||||||||||||||||||||||||||||
|
Net interest income |
322,936 | 298,153 | 278,615 | 272,428 | 275,481 | 314,238 | 293,880 | 277,943 | ||||||||||||||||||||||||||||
| Provision for credit losses |
39,570 | 98,105 | 92,211 | 124,139 | 76,031 | 48,321 | 79,337 | 13,884 | ||||||||||||||||||||||||||||
| Net interest income after |
||||||||||||||||||||||||||||||||||||
| provision for credit losses |
283,366 | 200,048 | 186,404 | 148,289 | 199,450 | 265,917 | 214,543 | 264,059 | ||||||||||||||||||||||||||||
|
Noninterest income |
||||||||||||||||||||||||||||||||||||
| Gain on interest rate swaps |
57 | 749 | 500 | 1,148 | 554 | 1,853 | 328 | 1,349 | ||||||||||||||||||||||||||||
| Gain (loss) on loan sales to affiliate |
- | 17,974 | (4 | ) | (256 | ) | - | - | - | - | ||||||||||||||||||||||||||
| Other income |
186 | 152 | 158 | 198 | 407 | 321 | 258 | 180 | ||||||||||||||||||||||||||||
| Total other income |
243 | 18,875 | 654 | 1,090 | 961 | 2,174 | 586 | 1,529 | ||||||||||||||||||||||||||||
|
Noninterest expense |
||||||||||||||||||||||||||||||||||||
| Loan servicing costs |
13,777 | 14,483 | 15,215 | 15,625 | 16,218 | 15,750 | 16,591 | 17,411 | ||||||||||||||||||||||||||||
| Management fees |
1,186 | 1,152 | 1,142 | 1,100 | 1,644 | 2,797 | 2,697 | 3,102 | ||||||||||||||||||||||||||||
| Other |
2,060 | 1,127 | 1,018 | 750 | 999 | 1,754 | 569 | 442 | ||||||||||||||||||||||||||||
| Total noninterest expense |
17,023 | 16,762 | 17,375 | 17,475 | 18,861 | 20,301 | 19,857 | 20,955 | ||||||||||||||||||||||||||||
|
Income before income tax expense |
266,586 | 202,161 | 169,683 | 131,904 | 181,550 | 247,790 | 195,272 | 244,633 | ||||||||||||||||||||||||||||
| Income tax expense (benefit) |
(10 | ) | 323 | 168 | 437 | (1,827 | ) | 856 | 1,430 | 1,136 | ||||||||||||||||||||||||||
|
Net income |
266,596 | 201,838 | 169,515 | 131,467 | 183,377 | 246,934 | 193,842 | 243,497 | ||||||||||||||||||||||||||||
|
Dividends on preferred stock |
45,817 | 48,957 | 45,829 | 45,263 | 36,757 | 34,975 | 43,004 | 45,942 | ||||||||||||||||||||||||||||
|
Net income available to common stockholders |
$ 220,779 | 152,881 | 123,686 | 86,204 | 146,620 | 211,959 | 150,838 | 197,555 | ||||||||||||||||||||||||||||
|
Per common share information |
||||||||||||||||||||||||||||||||||||
| Basic earnings |
2.21 | 1.53 | 1.24 | 0.86 | 1.47 | 2.12 | 1.51 | 1.98 | ||||||||||||||||||||||||||||
| Diluted earnings |
2.21 | 1.53 | 1.24 | 0.86 | 1.47 | 2.12 | 1.51 | 1.98 | ||||||||||||||||||||||||||||
|
Average common shares |
||||||||||||||||||||||||||||||||||||
|
Basic |
99,999.9 | 99,999.9 | 99,999.9 | 99,999.9 | 99,999.9 | 99,999.9 | 99,999.9 | 99,999.9 | ||||||||||||||||||||||||||||
| Diluted
|
|
99,999.9
|
|
|
99,999.9
|
|
|
99,999.9
|
|
|
99,999.9
|
|
|
99,999.9
|
|
|
99,999.9
|
|
|
99,999.9
|
|
|
99,999.9
|
| ||||||||||||
Item 9. Changes In and Disagreements with Accountants on Accounting and Financial Disclosure.
None.
Item 9A. Controls and Procedures.
Information in response to this item can be found under the “Controls and Procedures” section in this Report which information is incorporated by reference into this item.
Not applicable.
33
Table of Contents
Item 10. Directors and Executive Officers and Corporate Governance.
Information required by this item is set forth under the captions “Nominees for Election at the 2011 Annual Meeting”, “Section 16(a) Beneficial Ownership Reporting Compliance”, “Attendance and Committees of the Board – Communications with Directors”, “Attendance and Committees of the Board – Code of Ethics”, and “Attendance and Committees of the Board – Audit Committee” of Wachovia Funding’s 2011 proxy statement to be filed with the SEC no later than April 30, 2011, and incorporated by reference herein.
Executive Officers of Wachovia Funding
Mark C. Oman (age 56). President, Chief Executive Officer and Director since February 2009. Also, Senior Executive Vice President (Home and Consumer Finance), Wells Fargo, since August 2005 and Group Executive Vice President (Home and Consumer Finance), Wells Fargo, from September 2002 to August 2005.
Timothy J. Sloan (age 50). Senior Executive Vice President and Chief Financial Officer since February 2011. Also, Senior Executive Vice President and Chief Financial Officer, Wells Fargo, since February 2011, Senior Executive Vice President and Chief Administrative Officer from September 2010 to February 2011 and Executive Vice President of Wells Fargo Bank, N.A. since August 2003.
Item 11. Executive Compensation.
Information required by this item is set forth under the captions “Director Compensation” and “Executive Compensation” of Wachovia Funding’s 2011 proxy statement to be filed with the SEC no later than April 30, 2011, and incorporated by reference herein.
Item 12. Security Ownership of Certain Beneficial Owners and Management and Related Stockholder Matters.
Information required by this item is set forth under the caption “Security Ownership of Certain Beneficial Owners and Management” of Wachovia Funding’s 2011 proxy statement to be filed with the SEC no later than April 30, 2011, and incorporated by reference herein.
Item 13. Certain Relationships and Related Transactions, and Director Independence.
Information required by this item is set forth under the caption “Director Independence” of Wachovia Funding’s 2011 proxy statement to be filed with the SEC no later than April 30, 2011, and incorporated by reference herein.
Item 14. Principal Accounting Fees and Services.
Information required by this item is set forth under the caption “Independent Registered Public Accounting Firm” of Wachovia Funding’s 2011 proxy statement to be filed with the SEC no later than April 30, 2011, and incorporated by reference herein.
34
Table of Contents
Item 15. Exhibits, Financial Statement Schedules.
The following consolidated financial statements of Wachovia Funding and its subsidiaries at December 31, 2010, are included in this report at the pages indicated:
| Page | ||
| 36 | ||
| 37 | ||
| 38 | ||
| 39 | ||
| 40 | ||
| 41 |
A list of the exhibits to this Form 10-K is set forth on the Exhibit Index immediately preceding such exhibits and is incorporated herein by reference. All financial statement schedules are omitted since the required information is either not applicable, is immaterial or is included in our consolidated financial statements and notes thereto.
35
Table of Contents
REPORT OF INDEPENDENT REGISTERED PUBLIC ACCOUNTING FIRM
Board of Directors
Wachovia Preferred Funding Corp.
We have audited the accompanying consolidated balance sheets of Wachovia Preferred Funding Corp. and subsidiaries, a subsidiary of Wells Fargo & Company, as of December 31, 2010 and 2009 (Successor), and the related consolidated statements of income, changes in stockholders’ equity and cash flows for each of the years in the three-year period ended December 31, 2010 (Successor in 2010 and 2009 and Predecessor in 2008). These consolidated financial statements are the responsibility of Wachovia Preferred Funding Corp.’s management. Our responsibility is to express an opinion on these consolidated financial statements based on our audits.
We conducted our audits in accordance with the standards of the Public Company Accounting Oversight Board (United States). Those standards require that we plan and perform the audit to obtain reasonable assurance about whether the financial statements are free of material misstatement. An audit includes examining, on a test basis, evidence supporting the amounts and disclosures in the financial statements. An audit also includes assessing the accounting principles used and significant estimates made by management, as well as evaluating the overall financial statement presentation. We believe that our audits provide a reasonable basis for our opinion.
In our opinion, the consolidated financial statements referred to above present fairly, in all material respects, the financial position of Wachovia Preferred Funding Corp. and subsidiaries as of December 31, 2010 and 2009 (Successor), and the results of their operations and their cash flows for each of the years in the three-year period ended December 31, 2010 (Successor in 2010 and 2009 and Predecessor in 2008), in conformity with U.S. generally accepted accounting principles.
As discussed in Note 1 to the consolidated financial statements, effective December 31, 2008, Wells Fargo & Company acquired all of the outstanding stock of Wachovia Corporation in a business combination accounted for as a purchase. Prior to the acquisition, Wachovia Preferred Funding Corp. was a subsidiary of Wachovia Corporation. As a result of the acquisition, the consolidated financial information of Wachovia Preferred Funding Corp. for the period after the acquisition is presented on a different cost basis than that for the periods before the acquisition, and therefore, is not comparable.
/s/ KPMG LLP
Charlotte, North Carolina
March 23, 2011
36
Table of Contents
Wachovia Preferred Funding Corp. and Subsidiaries
Consolidated Statement of Income
|
Years ended December 31, |
||||||||||
| (in thousands, except per share amounts) | 2010 | 2009 | 2008 | |||||||
| (Successor) | (Successor) | (Predecessor) | ||||||||
| Interest income |
$1,172,132 | 1,161,922 | 1,172,181 | |||||||
| Interest expense |
- | 380 | 6,148 | |||||||
|
Net interest income |
1,172,132 | 1,161,542 | 1,166,033 | |||||||
| Provision for credit losses |
354,025 | 217,573 | 321,605 | |||||||
|
Net interest income after provision for credit losses |
818,107 | 943,969 | 844,428 | |||||||
|
Noninterest income |
||||||||||
| Gain on interest rate swaps |
2,454 | 4,084 | 16,059 | |||||||
| Gain on loan sales to affiliate |
17,714 | - | - | |||||||
| Other income |
694 | 1,166 | 6,443 | |||||||
|
Total noninterest income |
20,862 | 5,250 | 22,502 | |||||||
|
Noninterest expense |
||||||||||
| Loan servicing costs |
59,100 | 65,970 | 65,287 | |||||||
| Management fees |
4,580 | 10,240 | 18,675 | |||||||
| Other |
4,955 | 3,764 | 2,531 | |||||||
|
Total noninterest expense |
68,635 | 79,974 | 86,493 | |||||||
|
Income before income tax expense |
770,334 | 869,245 | 780,437 | |||||||
| Income tax expense |
918 | 1,595 | 13,161 | |||||||
|
Net income |
769,416 | 867,650 | 767,276 | |||||||
| Dividends on preferred stock |
185,866 | 160,678 | 293,229 | |||||||
|
Net income available to common stockholders |
$ 583,550 | 706,972 | 474,047 | |||||||
|
Per common share information |
||||||||||
| Basic earnings |
$ 5.84 | 7.07 | 4.74 | |||||||
| Diluted earnings |
$ 5.84 | 7.07 | 4.74 | |||||||
|
Average common shares |
||||||||||
| Basic |
99,999.9 | 99,999.9 | 99,999.9 | |||||||
| Diluted
|
99,999.9
|
|
99,999.9
|
|
|
99,999.9
|
| |||
The accompanying notes are an integral part of these statements.
37
Table of Contents
Wachovia Preferred Funding Corp. and Subsidiaries
Consolidated Balance Sheet
|
December 31, |
||||||||
| (in thousands, except shares) | 2010 | 2009 | ||||||
|
Assets |
||||||||
| Cash and cash equivalents |
$ | 2,774,299 | 2,092,523 | |||||
| Loans, net of unearned income |
15,506,564 | 16,401,604 | ||||||
| Allowance for loan losses |
(402,960 | ) | (337,431 | ) | ||||
| Net loans |
15,103,604 | 16,064,173 | ||||||
| Interest rate swaps, net |
1,013 | 976 | ||||||
| Accounts receivable - affiliates, net |
218,394 | 166,388 | ||||||
| Other assets |
80,807 | 86,068 | ||||||
| Total assets |
$ | 18,178,117 | 18,410,128 | |||||
|
Liabilities |
||||||||
| Deferred income tax liabilities |
$ | 30,255 | 49,971 | |||||
| Other liabilities |
25,989 | 24,834 | ||||||
| Total liabilities |
56,244 | 74,805 | ||||||
| Stockholders’ Equity |
||||||||
| Preferred stock |
||||||||
| Series A preferred securities, $0.01 par value per share, $750 million |
300 | 300 | ||||||
| Series B preferred securities, $0.01 par value per share, $1.0 billion |
400 | 400 | ||||||
| Series C preferred securities, $0.01 par value per share, $4.2 billion |
43 | 43 | ||||||
| Series D preferred securities, $0.01 par value per share, $913,000 |
- | - | ||||||
| Common stock, $0.01 par value, 100,000,000 shares authorized, 99,999,900 |
1,000 | 1,000 | ||||||
| Additional paid-in capital |
18,526,608 | 18,526,608 | ||||||
| Retained earnings (deficit) |
(406,478 | ) | (193,028 | ) | ||||
|
Total stockholders’ equity |
18,121,873 | 18,335,323 | ||||||
| Total liabilities and stockholders’ equity |
$ | 18,178,117 | 18,410,128 | |||||
The accompanying notes are an integral part of these statements.
38
Table of Contents
Wachovia Preferred Funding Corp. and Subsidiaries
Consolidated Statement of Changes in Stockholders’ Equity
| (in thousands, except per share data) | Preferred stock |
Common stock |
Additional paid-in capital |
Retained earnings (deficit) |
Total stockholders’ equity |
|||||||||||||||
| Balance, December 31, 2007 (Predecessor) |
$ | 743 | 1,000 | 17,467,786 | 374,213 | 17,843,742 | ||||||||||||||
| Net income |
- | - | - | 767,276 | 767,276 | |||||||||||||||
| Cash dividends |
||||||||||||||||||||
| Series A preferred securities at $1.81 per share |
- | - | - | (54,375 | ) | (54,375 | ) | |||||||||||||
| Series B preferred securities at $1.34 per share |
- | - | - | (53,550 | ) | (53,550 | ) | |||||||||||||
| Series C preferred securities at $43.75 per share |
- | - | - | (185,226 | ) | (185,226 | ) | |||||||||||||
| Series D preferred securities at $85.00 per share |
- | - | - | (78 | ) | (78 | ) | |||||||||||||
| Common stock at $6.95 per share |
- | - | - | (695,000 | ) | (695,000 | ) | |||||||||||||
| Changes incident to business combinations |
- | - | 1,116,499 | (153,260 | ) | 963,239 | ||||||||||||||
| Balance, December 31, 2008 (Successor) |
$ | 743 | 1,000 | 18,584,285 | - | 18,586,028 | ||||||||||||||
| Net income |
- | - | - | 867,650 | 867,650 | |||||||||||||||
| Cash dividends |
||||||||||||||||||||
| Series A preferred securities at $1.81 per share |
- | - | - | (54,375 | ) | (54,375 | ) | |||||||||||||
| Series B preferred securities at $0.68 per share |
- | - | - | (27,123 | ) | (27,123 | ) | |||||||||||||
| Series C preferred securities at $18.68 per share |
- | - | - | (79,102 | ) | (79,102 | ) | |||||||||||||
| Series D preferred securities at $85.00 per share |
- | - | - | (78 | ) | (78 | ) | |||||||||||||
| Common stock at $9.00 per share |
- | - | - | (900,000 | ) | (900,000 | ) | |||||||||||||
| Changes incident to business combinations |
- | - | (57,677 | ) | - | (57,677 | ) | |||||||||||||
| Balance, December 31, 2009 (Successor) |
$ | 743 | 1,000 | 18,526,608 | (193,028 | ) | 18,335,323 | |||||||||||||
| Net income |
- | - | - | 769,416 | 769,416 | |||||||||||||||
| Cash dividends |
||||||||||||||||||||
| Series A preferred securities at $1.81 per share |
- | - | - | (54,375 | ) | (54,375 | ) | |||||||||||||
| Series B preferred securities at $0.54 per share |
- | - | - | (21,711 | ) | (21,711 | ) | |||||||||||||
| Series C preferred securities at $25.91 per share |
- | - | - | (109,702 | ) | (109,702 | ) | |||||||||||||
| Series D preferred securities at $85.00 per share |
- | - | - | (78 | ) | (78 | ) | |||||||||||||
| Common stock at $ 7.97 per share |
- | - | - | (797,000 | ) | (797,000 | ) | |||||||||||||
| Balance, December 31, 2010 (Successor) |
$ | 743 | 1,000 | 18,526,608 | (406,478 | ) | 18,121,873 | |||||||||||||
The accompanying notes are an integral part of these statements.
39
Table of Contents
Wachovia Preferred Funding Corp. and Subsidiaries
Consolidated Statement of Cash Flows
|
Years ended December 31, |
||||||||||||||
| (in thousands) | 2010 | 2009 | 2008 | |||||||||||
| (Successor) | (Successor) | (Predecessor) | ||||||||||||
| Cash flows from operating activities: |
||||||||||||||
| Net income |
$ | 769,416 | 867,650 | 767,276 | ||||||||||
| Adjustments to reconcile net income to net cash |
||||||||||||||
| (Accretion) amortization of discount and premium on loans |
(236,895 | ) | (126,903 | ) | 1,510 | |||||||||
| Gain on loan sales to affiliate |
17,714 | - | - | |||||||||||
| Provision for credit losses |
354,025 | 217,573 | 321,605 | |||||||||||
| Deferred income tax benefits |
(19,716 | ) | (12,158 | ) | (8,236 | ) | ||||||||
| Interest rate swaps |
(2,728 | ) | (4,444 | ) | (21,627 | ) | ||||||||
| Accounts receivable/payable - affiliates, net |
(2,520 | ) | 1,874 | - | ||||||||||
| Other assets and other liabilities, net |
6,416 | 20,506 | (4,128 | ) | ||||||||||
| Net cash provided by operating activities |
885,712 | 964,098 | 1,056,400 | |||||||||||
| Cash flows from investing activities: |
||||||||||||||
| Increase (decrease) in cash realized from |
||||||||||||||
| Loans: |
||||||||||||||
| Purchases |
(3,231,285 | ) | (2,728,467 | ) | (3,590,954 | ) | ||||||||
| Proceeds from payments and sales |
4,007,524 | 3,724,785 | 3,594,155 | |||||||||||
| Interest rate swaps |
71,046 | 71,046 | 71,046 | |||||||||||
| Net cash provided by investing activities |
847,285 | 1,067,364 | 74,247 | |||||||||||
| Cash flows from financing activities: |
||||||||||||||
| Decrease in cash realized from |
||||||||||||||
| Line of credit with affiliate |
- | (170,000 | ) | (130,000 | ) | |||||||||
| Collateral held on interest rate swaps |
(68,355 | ) | (66,305 | ) | (49,103 | ) | ||||||||
| Cash dividends paid |
(982,866 | ) | (1,060,763 | ) | (988,144 | ) | ||||||||
| Net cash used by financing activities |
(1,051,221 | ) | (1,297,068 | ) | (1,167,247 | ) | ||||||||
| Net change in cash and cash equivalents |
681,776 | 734,394 | (36,600 | ) | ||||||||||
| Cash and cash equivalents at beginning of period |
2,092,523 | 1,358,129 | 1,394,729 | |||||||||||
| Cash and cash equivalents at end of period |
$ | 2,774,299 | 2,092,523 | 1,358,129 | ||||||||||
| Supplemental cash flow disclosures: |
||||||||||||||
| Cash paid for interest |
$ | 275 | 740 | 11,717 | ||||||||||
| Cash paid for income taxes |
19,000 | 13,278 | 25,838 | |||||||||||
| Change in noncash items: |
||||||||||||||
| Dividends payable to affiliates |
- | (85 | ) | 85 | ||||||||||
| Loan payments, net, settled through affiliate |
(49,486 | ) | (1,258 | ) | 62,781 | |||||||||
| Transfers from loans to foreclosed assets
|
|
11,438
|
|
|
4,400
|
(1)
|
|
4,433
|
|
(1)
| ||||
| (1) | Revised to correct previously reported amounts. |
The accompanying notes are an integral part of these statements.
40
Table of Contents
NOTE 1: SUMMARY OF SIGNIFICANT ACCOUNTING POLICIES
GENERAL
Wachovia Preferred Funding Corp. (Wachovia Funding) is a direct subsidiary of Wachovia Preferred Funding Holding Corp. (Wachovia Preferred Holding) and an indirect subsidiary of both Wells Fargo & Company (Wells Fargo) and Wells Fargo Bank, National Association (the Bank). Wells Fargo acquired Wachovia Corporation, a North Carolina corporation (Wachovia), effective December 31, 2008. On March 20, 2010, Wachovia Bank, National Association, a wholly-owned subsidiary of Wells Fargo, merged with and into the Bank, with the Bank as the surviving entity. Wachovia Funding is a real estate investment trust (REIT) for income tax purposes.
As a result of the Wachovia acquisition, each outstanding share of Wachovia common stock was converted into 0.1991 shares of Wells Fargo common stock and each share of Wachovia preferred stock outstanding or reserved for issuance was converted into a share of Wells Fargo preferred stock with substantially identical terms. Following the acquisition, all subsidiaries of Wachovia became subsidiaries of Wells Fargo. However, the Wachovia Funding Series A preferred securities are now conditionally exchangeable for shares of Wells Fargo preferred stock instead of Wachovia preferred stock.
As a result of the Wells Fargo acquisition of Wachovia, under purchase accounting, the assets and liabilities of Wachovia Funding were recorded at their respective fair values at December 31, 2008. The more significant fair value adjustments were recorded to the loan portfolio. Because the acquisition occurred on the last day of the reporting period, the Statement of Income for 2008 was not affected by purchase accounting. Where disclosures include 2008 and prior years’ data, information for periods not affected by purchase accounting are labeled herein as “predecessor” and those reflecting purchase accounting are labeled “successor.” As a result of the acquisition, the consolidated financial information of Wachovia Funding for the period after the acquisition is presented on a different cost basis than that for the periods before the acquisition, and therefore, is not comparable.
One of Wachovia Funding’s subsidiaries, Wachovia Real Estate Investment Corp. (WREIC), a Delaware corporation, has operated as a REIT since its formation in 1996. Of the 645 shares of WREIC common shares outstanding, Wachovia Funding owns 644 shares, or 99.84%, and the remaining one share is owned by Wells Fargo. Of the 667 shares of preferred stock outstanding, Wachovia Funding owns 533.3 shares, 127 shares are owned by employees of Wells Fargo or its affiliates and 6.7 shares are owned by Wells Fargo.
Wachovia Funding’s other subsidiary is Wachovia Preferred Realty, LLC (WPR), a Delaware limited liability company. Under the REIT Modernization Act, a REIT is permitted to own “taxable REIT subsidiaries,” which are subject to taxation similar to corporations that do not qualify as REITs or for other special tax rules. WPR is a taxable REIT subsidiary that holds assets that earn non-qualifying REIT income. WPR holds interest-rate swaps and related cash collateral. Wachovia Funding owns 98.20% of the outstanding member interests in WPR and the remaining 1.80% is owned by the Bank.
The accounting and reporting policies of Wachovia Funding are in accordance with U.S. generally accepted accounting principles (GAAP). The preparation of the financial statements in accordance with GAAP requires management to make estimates based on assumptions about future economic and market conditions that affect the reported amounts of assets and liabilities at the date of the financial statements and income and expenses during the reporting period and the related disclosures. Although our estimates contemplate current conditions and how we expect them to change in the future, it is reasonably possible that actual future conditions could be worse than anticipated in those estimates, which could materially affect our results of operations and financial condition. Management has made significant estimates related to the allowance for credit losses (Note 2) and valuing financial instruments (Note 5). Actual results could differ from those estimates.
CONSOLIDATION
The consolidated financial statements include the accounts of Wachovia Funding and its subsidiaries. In consolidation, all significant intercompany accounts and transactions are eliminated.
CASH AND CASH EQUIVALENTS
Cash and cash equivalents include cash and due from banks and interest-bearing bank balances. Generally, cash and cash equivalents have maturities of three months or less, and accordingly, the carrying amount of these instruments is deemed to be a reasonable estimate of fair value.
41
Table of Contents
LOANS
Wachovia Funding purchases certain loans from the Bank at fair value. While these transfers represent legal sales by the Bank, they are not treated as sales under GAAP because of the Bank’s direct and indirect ownership interest in Wachovia Funding. Accordingly, Wachovia Funding’s assets represent non-recourse receivables from the Bank which are fully collateralized by the underlying loans. The assets continue to be classified as loans in our financial statements because the returns on and recoverability of these non-recourse receivables are entirely dependent on the performance of the underlying loans. At December 31, 2010, the outstanding balance of these loans purchased from the Bank amounted to $13.4 billion. The remainder of Wachovia Funding’s outstanding loan balance was received through a contribution of assets in 2005 and prior years from Wachovia Preferred Holding, its parent corporation. Immediately prior to the contribution, Wachovia Preferred Holding received a contribution of the same assets from the Bank. These contributed assets were recorded as an increase to loans and to additional paid-in capital.
Loans are recorded at the principal balance outstanding, net of any cumulative charge-offs and unamortized premium or discount on purchased loans. Interest income is recognized on an accrual basis. Premiums and discounts are amortized as an adjustment to the yield over the contractual life of the loan using the interest method. If a prepayment occurs on a loan, any related premium or discount is recognized as an adjustment to yield in the results of operations in the period in which the prepayment occurs.
Loans acquired in a transfer, including business combinations where there is evidence of credit deterioration since origination and it is probable at the date of acquisition that we will not collect all contractually required principal and interest payments are accounted for as purchased credit-impaired (PCI) loans. PCI loans are initially recorded at fair value, which include estimated future credit losses expected to be incurred over the life of the loan. Accordingly, the historical allowance for credit losses is not carried over. PCI loans were less than 1 percent of total loans at December 31, 2010 and 2009.
NONACCRUAL AND PAST DUE LOANS
We generally place loans on nonaccrual status when:
| — | the full and timely collection of interest or principal becomes uncertain; |
| — | they are 90 days (120 days with respect to real estate 1-4 family first and junior lien mortgages) past due for interest or principal, unless both well-secured and in the process of collection; or |
| — | part of the principal balance has been charged off and no restructuring has occurred. |
PCI loans are written down at acquisition to fair value using an estimate of cash flows deemed to be collectible. Accordingly, such loans are no longer classified as nonaccrual even though they may be contractually past due because we expect to fully collect the new carrying values of such loans (that is, the new cost basis arising out of purchase accounting).
When we place a loan on nonaccrual status, we reverse the accrued unpaid interest receivable against interest income and amortization of any net deferred fees is suspended. A loan will remain in accruing status provided it is both well-secured and in the process of collection. If the ultimate collectability of a loan is in doubt and the loan is on nonaccrual, the cost recovery method is used and cash collected is applied to first reduce the principal outstanding. Generally, we return a loan to accrual status when all delinquent interest and principal become current under the terms of the loan agreement and collectability of remaining principal and interest is no longer doubtful.
For modified loans, we underwrite at the time of a restructuring to determine if there is sufficient evidence of sustained repayment capacity based on the borrower’s financial strength, including documented income, debt to income ratios and other factors. If the borrower has demonstrated performance under the previous terms and the underwriting process shows the capacity to continue to perform under the restructured terms, the loan will remain in accruing status. When a loan classified as a troubled debt restructuring (TDR) performs in accordance with its modified terms, the loan either continues to accrue interest (for performing loans) or will return to accrual status after the borrower demonstrates a sustained period of performance (generally six consecutive months of payments, or equivalent, inclusive of consecutive payments made prior to the modification). Loans will be placed on nonaccrual status and a corresponding charge-off is recorded if we believe it is probable that principal and interest contractually due under the modified terms of the agreement will not be collectible.
Our loans are considered past due when contractually required principal or interest payments have not been made on the due dates.
42
Table of Contents
LOAN CHARGE-OFF POLICIES
For commercial loans, we generally fully charge off or charge down to net realizable value for loans secured by collateral when:
| — | management judges the loan to be uncollectible; |
| — | repayment is deemed to be protracted beyond reasonable time frames; |
| — | the loan has been classified as a loss by either our internal loan review process or our banking regulatory agencies; |
| — | the customer has filed bankruptcy and the loss becomes evident owing to a lack of assets; or |
| — | the loan is 180 days past due unless both well-secured and in the process of collection. |
For consumer loans, our charge-off policies are as follows:
| — | 1-4 family first and junior lien mortgages – We generally charge down to net realizable value when the loan is 180 days past due. |
IMPAIRED LOANS
We consider a loan to be impaired when, based on current information and events, we determine that we will not be able to collect all amounts due according to the loan contract, including scheduled interest payments. Our impaired loans include commercial and industrial and commercial real estate (CRE) on nonaccrual status for which we determine that we will not be able to collect all amounts due and consumer, commercial and industrial and CRE modified in a TDR, on both accrual and nonaccrual status.
When we identify a loan as impaired, we measure the impairment based on the present value of expected future cash flows, discounted at the loan’s effective interest rate. When collateral is the sole source of repayment for the loan, we may measure impairment based on the fair value of the collateral. If foreclosure is probable, we use the current fair value of the collateral less selling costs, instead of discounted cash flows.
If we determine that the value of an impaired loan is less than the recorded investment in the loan (net of previous charge-offs, deferred loan fees or costs and unamortized premium or discount), we recognize impairment. When the value of an impaired loan is calculated by discounting expected cash flows, interest income is recognized using the loan’s effective interest rate over the remaining life of the loan.
TROUBLED DEBT RESTRUCTURINGS (TDRs)
In situations where, for economic or legal reasons related to a borrower’s financial difficulties, we grant a concession for other than an insignificant period of time to the borrower that we would not otherwise consider, the related loan is classified as a TDR. We strive to identify borrowers in financial difficulty early and work with them to modify their loan to more affordable terms before it reaches nonaccrual status. These modified terms may include rate reductions, principal forgiveness, term extensions, payment forbearance and other actions intended to minimize our economic loss and to avoid foreclosure or repossession of the collateral. For modifications where we forgive principal, the entire amount of such principal forgiveness is immediately charged off. Loans classified as TDRs are considered impaired loans.
ALLOWANCE FOR CREDIT LOSSES
The allowance for credit losses, which consists of the allowance for loan losses and the allowance for unfunded credit commitments, is management’s estimate of credit losses inherent in the loan portfolio, including unfunded credit commitments, at the balance sheet date.
DERIVATIVES
All derivatives (primarily interest rate swaps) are recorded at fair value on the balance sheet. Realized and unrealized gains and losses are included as a gain (loss) on interest rate swaps in the results of operations. In connection with Wachovia Funding’s derivative activities, we may obtain collateral from, or deliver collateral to derivative counterparties. The amount of collateral required is based on the level of credit risk and on the strength of the individual counterparty. Generally, the form of the collateral required is cash. All of our derivatives are economic hedges and none are treated as accounting hedges.
Derivatives are reported net of cash collateral received and paid. Additionally, positions with the same counterparty are netted as a part of a legally enforceable master netting agreement between us and the derivative counterparty.
43
Table of Contents
INCOME TAXES
Wachovia Funding and WREIC are taxed as REITs under relevant sections of the Internal Revenue Code (the Code). A REIT is generally not subject to federal income tax to the extent it complies with the relevant provisions of the Code, including distributing the majority of its taxable earnings to shareholders and as long as certain asset, income and stock ownership tests are met. For the tax year ended December 31, 2010, Wachovia Funding and WREIC complied with these provisions and, with the exception of WPR, are not subject to federal income tax. We expect to be taxed as a REIT. Wachovia Funding and WREIC file separate federal income tax returns for the tax years ended December 31, 2010, 2009 and 2008, and therefore are not included in the Wells Fargo (2010 and 2009) or Wachovia (2008) consolidated tax returns or subject to the allocation of federal income tax liability (benefit) resulting from these consolidated tax returns. In addition, Wachovia Funding and WREIC will file unitary state income tax returns along with other subsidiaries of Wells Fargo in 2010 and 2009 and filed with Wachovia in 2008.
The provisions for qualifying as a REIT for federal income tax purposes are complex, involving many requirements, including among others, distributing the majority of our earnings to shareholders and satisfying certain asset, income and stock ownership tests. To the extent we meet those provisions, with the exception of the income of our taxable REIT subsidiary, WPR, we will not be subject to federal income tax on net income. We currently believe that we continue to satisfy each of these requirements and therefore continue to qualify as a REIT. We continue to monitor each of these complex tests.
In the event we do not continue to qualify as a REIT, we believe there should be minimal adverse effect of that characterization to us or to our shareholders:
| — | From a shareholder’s perspective, the dividends we pay as a REIT are ordinary income not eligible for the dividends received deduction for corporate shareholders or for the favorable maximum 15% rate applicable to qualified dividends received by non- corporate taxpayers. If we were not a REIT, dividends we pay generally would qualify for the dividends received deduction and the favorable tax rate applicable to non-corporate taxpayers. |
| — | In addition, we would no longer be eligible for the dividends paid deduction, thereby creating a tax liability for us. Wells Fargo agreed to make, or cause its subsidiaries to make, a capital contribution to us equal in amount to any income taxes payable by us. Therefore, we believe a failure to qualify as a REIT would not result in any net capital impact to us. |
WPR has elected to be taxed as a corporation and a taxable REIT subsidiary. WPR files its own separate federal income tax return, and current federal income taxes, if any, for WPR are separately calculated and paid. In addition, WPR will file unitary state income tax returns along with other subsidiaries of Wells Fargo in 2010 and 2009 and has filed with Wachovia in 2008.
EARNINGS PER SHARE
Basic earnings per share is computed by dividing income available to common stockholders by the weighted average number of shares of common stock outstanding for the period. Diluted earnings per share is computed by dividing income available to common stockholders by the sum of the weighted average number of shares adjusted to include the effect of potentially dilutive shares. Income available to common stockholders is computed as net income less dividends on preferred stock. There were no potentially dilutive shares in any period presented and accordingly, basic and diluted earnings per share are the same.
NEW ACCOUNTING STANDARDS
In first quarter 2010, we adopted the following accounting updates to the Financial Accounting Standards Board (FASB) Accounting Standards Codification:
| — | Accounting Standards Update (ASU or Update) 2010-6, Improving Disclosures about Fair Value Measurements; |
| — | ASU 2009-16, Accounting for Transfers of Financial Assets (FAS 166, Accounting for Transfers of Financial Assets – an amendment of FASB Statement No. 140); |
| — | ASU 2009-17, Improvements to Financial Reporting by Enterprises Involved with Variable Interest Entities (FAS 167, Amendments to FASB Interpretation No. 46(R)); and |
| — | ASU 2010-10, Amendments for Certain Investment Funds. |
In third quarter 2010, we adopted the following accounting updates to the FASB Accounting Standards Codification:
| — | ASU 2010-18, Effect of a Loan Modification When the Loan is Part of a Pool That is Accounted for as a Single Asset. |
In fourth quarter 2010, we adopted the following accounting updates to the FASB Accounting Standards Codification:
44
Table of Contents
| — | ASU 2010-20, Disclosures about the Credit Quality of Financing Receivables and the Allowance for Credit Losses. |
Information about these accounting updates is further described in more detail below.
ASU 2010-6 amends the disclosure requirements for fair value measurements. Companies are now required to disclose significant transfers in and out of Levels 1 and 2 of the fair value hierarchy, whereas the previous rules only required the disclosure of transfers in and out of Level 3. Additionally, in the rollforward of Level 3 activity, companies must present information on purchases, sales, issuances, and settlements on a gross basis rather than on a net basis. The Update also clarifies that fair value measurement disclosures should be presented for each class of assets and liabilities. A class is typically a subset of a line item in the statement of financial position. Companies should also provide information about the valuation techniques and inputs used to measure fair value for both recurring and nonrecurring instruments classified as either Level 2 or Level 3. We adopted this guidance in first quarter 2010 with prospective application, except for the new requirement related to the Level 3 rollforward. Gross presentation in the Level 3 rollforward is effective for us in first quarter 2011 with prospective application. Our adoption of the Update did not affect our consolidated financial results since it amends only the disclosure requirements for fair value measurements.
ASU 2009-16 (FAS 166) modifies certain guidance contained in ASC 860, Transfers and Servicing. This pronouncement eliminates the concept of qualifying special purpose entities (QSPEs) and provides additional criteria transferors must use to evaluate transfers of financial assets. The Update also requires that any assets or liabilities retained from a transfer accounted for as a sale must be initially recognized at fair value. We adopted this guidance in first quarter 2010 with prospective application for transfers that occurred on and after January 1, 2010. Our adoption of this standard did not have an impact on our financial statements.
ASU 2009-17 (FAS 167) amends several key consolidation provisions related to variable interest entities (VIEs), which are included in ASC 810, Consolidation. The scope of the new guidance includes entities that were previously designated as QSPEs. The Update also changes the approach companies must use to identify VIEs for which they are deemed to be the primary beneficiary and are required to consolidate. Under the new guidance, a VIE’s primary beneficiary is the entity that has the power to direct the VIE’s significant activities, and has an obligation to absorb losses or the right to receive benefits that could be potentially significant to the VIE. The Update also requires companies to continually reassess whether they are the primary beneficiary of a VIE, whereas the previous rules only required reconsideration upon the occurrence of certain triggering events. Our adoption of FAS 167 did not have an impact on our financial statements.
ASU 2010-10 amends consolidation accounting guidance to defer indefinitely the application of ASU 2009-17 to certain investment funds. The amendment was effective for us in first quarter 2010. Our adoption of this standard did not have an impact on our financial statements.
ASU 2010-18 provides guidance for modified PCI loans that are accounted for within a pool. Under the new guidance, modified PCI loans should not be removed from a pool even if those loans would otherwise be deemed TDRs. The Update also clarifies that entities should consider the impact of modifications on a pool of PCI loans when evaluating that pool for impairment. These accounting changes were effective for us in third quarter 2010 with early adoption permitted. Our adoption of this Update did not affect our consolidated financial statement results, as the new guidance is consistent with our current accounting practice.
ASU 2010-20 requires enhanced disclosures for the allowance for credit losses and financing receivables, which include certain loans and long-term accounts receivable. Companies are required to disaggregate credit quality information, including receivables on nonaccrual status and aging of past due receivables by class of financing receivable, and roll forward the allowance for credit losses by portfolio segment. Portfolio segment is the level at which an entity develops and documents a systematic method to determine its allowance for credit losses. Class of financing receivable is generally a disaggregation of portfolio segment. This guidance was effective for us in fourth quarter 2010 with prospective application. Companies must also provide supplemental information on the nature and extent of TDRs and their effect on the allowance for credit losses. Under ASU 2011-01, Deferral of the Effective Date of Disclosures about Troubled Debt Restructurings in Update No. 2010-20, these TDR disclosures have been deferred to coincide with a separate FASB TDR project, with an expected effective date in second quarter 2011. Our adoption did not affect our consolidated financial statement results since it amends only the disclosure requirements for financing receivables and the allowance for credit losses.
RECLASSIFICATIONS
Certain amounts in 2009 and 2008 were reclassified to conform with the presentation in 2010. These reclassifications had no effect on Wachovia Funding’s previously reported consolidated financial position or results of operations.
45
Table of Contents
SUBSEQUENT EVENTS
We have evaluated the effects of subsequent events that have occurred subsequent to period end December 31, 2010. During this period there have been no material events that would require recognition in our 2010 consolidated financial statements or disclosure in the Notes to Financial Statements.
In January 2011, Wachovia Funding’s board of directors declared a dividend in the amount of $2.5 billion payable to holders of its common stock on January 21, 2011. This dividend reduced relatively high levels of cash on Wachovia Funding’s balance sheet resulting from loan pay-downs in order to maintain Qualifying Assets greater than 80% of total assets. Wachovia Funding’s board of directors also declared dividends payable to holders of its preferred securities payable on March 31, 2011, in accordance with Wachovia Funding’s certificate of incorporation.
46
Table of Contents
NOTE 2: LOANS AND ALLOWANCE FOR CREDIT LOSSES
Wachovia Funding obtains participation interests in loans originated or purchased by the Bank. By the nature of Wachovia Funding’s status as a REIT, the composition of the loans underlying the participation interests are highly concentrated in real estate. Underlying loans are concentrated primarily in Florida, New Jersey, Pennsylvania, North Carolina and California. These markets include approximately 58% and 64% of Wachovia Funding’s total loan balance at December 31, 2010 and 2009, respectively.
The following table reflects the major categories of the loan portfolio at December 31, 2010 and 2009.
|
December 31, |
||||||||||
| (in thousands) | 2010 | 2009 | ||||||||
| Commercial: |
||||||||||
| Commercial and industrial |
$ | 209,818 | 287,578 | |||||||
| Real estate mortgage |
1,267,350 | 1,518,849 | (1) | |||||||
| Real estate construction |
76,033 | 185,306 | (1) | |||||||
| Total commercial |
1,553,201 | 1,991,733 | ||||||||
| Consumer: |
||||||||||
| Real estate 1-4 family first mortgage |
9,886,833 | 9,133,283 | ||||||||
| Real estate 1-4 family junior lien mortgage |
4,066,530 | 5,276,588 | ||||||||
| Total consumer |
13,953,363 | 14,409,871 | ||||||||
| Total loans |
$ | 15,506,564 | 16,401,604 | |||||||
| (1) | Balances have been revised to conform with the current presentation. |
In third quarter 2010, the Bank restructured a commercial lending relationship, which affected a participation interest from the Bank to Wachovia Funding. As a result, the Bank was required to purchase the participation interest, a commercial PCI loan, from Wachovia Funding at the unpaid principal balance. That participation interest had been recorded on our balance sheet at a value that was less than the unpaid principal balance. As a result of this transaction, we recorded a gain on sale to affiliate of $18.0 million.
The following table summarizes the amounts paid (excluding accrued interest receivable of $13.4 million) or received for purchases and sales of loans, respectively. This activity relates to purchases of loans from the Bank, described above.
|
December 31, 2010 |
||||||||||||
| (in thousands) | Commercial | Consumer | Total | |||||||||
| Purchases |
$ | - | 3,217,894 | 3,217,894 | ||||||||
| Sales
|
|
(43,080
|
)
|
|
(122,533
|
)
|
|
(165,613
|
)
| |||
The contract or notional amount of commercial loan commitments to extend credit at December 31, 2010 and 2009 was $538.4 million and $666.7 million, respectively. Loan commitments are discussed in more detail in Note 3 in this Report.
47
Table of Contents
ALLOWANCE FOR CREDIT LOSSES (ACL)
The ACL is management’s estimate of credit losses inherent in the loan portfolio, including unfunded credit commitments, at the balance sheet date. We have an established process to determine the adequacy of the allowance for credit losses that assesses the losses inherent in our portfolio and related unfunded credit commitments. While we attribute portions of the allowance to specific portfolio segments, the entire allowance is available to absorb credit losses inherent in the total loan portfolio and unfunded credit commitments.
Our process involves procedures to appropriately consider the unique risk characteristics of our commercial and consumer loan portfolio segments. For each portfolio segment, impairment is measured collectively for groups of loans with similar characteristics or individually for impaired loans.
Our allowance levels are influenced by loan volumes, loan grade migration or delinquency status, historic loss experience influencing loss factors, and other conditions influencing loss expectations, such as economic conditions. We have had limited changes in our allowance methodology primarily associated with integration alignment of loss estimation processes between Wells Fargo and Wachovia. Those changes did not significantly impact the allowance for credit losses.
Commercial Portfolio Segment ACL Methodology
Generally, commercial loans are assessed for estimated losses by grading each loan using various risk factors as identified through periodic reviews. We apply historic grade-specific loss factors to the aggregation of each funded grade pool. These historic loss factors are also used to estimate losses for unfunded credit commitments. In the development of our statistically derived loan grade loss factors, we observe historical losses over a relevant period for each loan grade. These loss estimates are adjusted as appropriate based on additional analysis of long-term average loss experience compared to previously forecasted losses, external loss data or other risks identified from current economic conditions and credit quality trends.
The allowance also includes an amount for the estimated impairment on nonaccrual commercial loans and commercial loans modified in a TDR, whether on accrual or nonaccrual status.
Consumer Portfolio Segment ACL Methodology
For consumer loans, not identified as a TDR, we determine the allowance on a collective basis utilizing forecasted losses to represent our best estimate of inherent loss. We pool loans, generally by product types with similar risk characteristics. As appropriate, to achieve greater accuracy, we may further stratify selected portfolios by sub-product or other predictive characteristics. Models designed for each pool are utilized to develop the loss estimates. We use assumptions for these pools in our forecast models, such as historic delinquency and default, loss severity, home price trends, unemployment trends, and other key economic variables that may influence the frequency and severity of losses in the pool.
In addition, we establish an allowance for consumer loans modified in a TDR, whether on accrual or nonaccrual status.
Other ACL Matters
The allowance for credit losses for both portfolio segments includes an amount for imprecision or uncertainty that may change from period to period. This amount represents management’s judgment of risks inherent in the processes and assumptions used in establishing the allowance. This imprecision considers economic environmental factors, modeling assumptions and performance, process risk, and other subjective factors, including industry trends.
48
Table of Contents
The allowance for credit losses consists of the allowance for loan losses and the allowance for unfunded credit commitments. Changes in the allowance for credit losses were:
| (in thousands) |
2010 |
2009 | 2008 | |||||||||
| (Successor) | (Successor) | (Predecessor) | ||||||||||
| Balance, beginning of period |
$ | 337,871 | 269,913 | 93,583 | ||||||||
| Provision for credit losses |
354,025 | 217,573 | 321,605 | |||||||||
| Interest income on certain impaired loans (1) |
(3,437 | ) | - | - | ||||||||
| Loan charge-offs: |
||||||||||||
| Commercial: |
||||||||||||
| Commercial and industrial |
- | (6 | ) | 826 | ||||||||
| Real estate mortgage |
(2,935 | ) | (198 | ) | (1,073 | ) | ||||||
| Real estate construction |
(168 | ) | (27 | ) | - | |||||||
| Total commercial |
(3,103 | ) | (231 | ) | (247 | ) | ||||||
| Consumer: |
||||||||||||
| Real estate 1-4 family first mortgage |
(91,980 | ) | (46,967 | ) (2) | (45,745 | ) | ||||||
| Real estate 1-4 family junior lien mortgage |
(197,282 | ) | (105,855 | ) (2) | (43,868 | ) | ||||||
| Total consumer |
(289,262 | ) | (152,822 | ) | (89,613 | ) | ||||||
| Total loan charge-offs |
(292,365 | ) | (153,053 | ) | (89,860 | ) | ||||||
| Loan recoveries: |
||||||||||||
| Commercial: |
||||||||||||
| Commercial and industrial |
158 | - | - | |||||||||
| Real estate mortgage |
- | 4 | 135 | |||||||||
| Real estate construction |
- | - | - | |||||||||
| Total commercial |
158 | 4 | 135 | |||||||||
| Consumer: |
||||||||||||
| Real estate 1-4 family first mortgage |
1,252 | 1,203 | (2) | 279 | ||||||||
| Real estate 1-4 family junior lien mortgage |
6,051 | 2,066 | (2) | 270 | ||||||||
| Total consumer |
7,303 | 3,269 | 549 | |||||||||
| Total loan recoveries |
7,461 | 3,273 | 684 | |||||||||
| Net loan charge-offs |
(284,904 | ) | (149,780 | ) | (89,176 | ) | ||||||
| Allowances related to business combinations/other |
- | 165 | (56,099 | ) | ||||||||
| Balance, end of period |
$ | 403,555 | 337,871 | 269,913 | ||||||||
| Components: |
||||||||||||
| Allowance for loan losses |
$ | 402,960 | 337,431 | 269,343 | ||||||||
| Allowance for unfunded credit commitments |
595 | 440 | 570 | |||||||||
| Allowance for credit losses |
$ | 403,555 | 337,871 | 269,913 | ||||||||
| Net loan charge-offs as a percentage of average total loans |
1.80 | % | 0.88 | 0.55 | ||||||||
| Allowance for loan losses as a percentage of total loans |
2.60 | 2.06 | 1.54 | |||||||||
| Allowance for credit losses as a percentage of total loans |
2.60 | 2.06 | 1.54 | |||||||||
| (1) | Effective 2010, certain impaired loans with an allowance calculated by discounting expected cash flows using the loan’s effective interest rate over the remaining life of the loan recognize reductions in allowance as interest income. |
| (2) | Balances have been revised to correct previously reported amounts. |
The following table summarizes the activity in the allowance for credit losses by our commercial and consumer portfolio segments.
|
Year ended December 31, 2010 |
||||||||||||
| (in thousands) |
Commercial | Consumer | Total | |||||||||
| Balance, beginning of year |
$ | 18,973 | 318,898 | 337,871 | ||||||||
| Provision for credit losses |
10,385 | 343,640 | 354,025 | |||||||||
| Interest income on certain impaired loans |
- | (3,437 | ) | (3,437 | ) | |||||||
| Loan charge-offs |
(3,103 | ) | (289,262 | ) | (292,365 | ) | ||||||
| Loan recoveries |
158 | 7,303 | 7,461 | |||||||||
| Net loan charge-offs |
(2,945 | ) | (281,959 | ) | (284,904 | ) | ||||||
| Balance, end of year |
$ | 26,413 | 377,142 | 403,555 | ||||||||
49
Table of Contents
The following table disaggregates our allowance for credit losses and recorded investment in loans by impairment methodology.
|
|
December 31, 2010 |
| ||||||||||||||||||||||||||
| Allowance for credit losses | Recorded investment in loans | |||||||||||||||||||||||||||
| (in thousands) | Commercial | Consumer | Total | Commercial | Consumer | Total | ||||||||||||||||||||||
| Collectively evaluated (1) |
$ | 15,852 | 325,261 | 341,113 | 1,521,028 | 13,678,399 | 15,199,427 | |||||||||||||||||||||
| Individually evaluated (2) |
10,561 | 51,881 | 62,442 | 23,263 | 209,346 | 232,609 | ||||||||||||||||||||||
| PCI (3) |
- | - | - | 8,910 | 65,618 | 74,528 | ||||||||||||||||||||||
| Total |
$ | 26,413 | 377,142 | 403,555 | 1,553,201 | 13,953,363 | 15,506,564 | |||||||||||||||||||||
| (1) | Represents loans collectively evaluated for impairment in accordance with ASC 450-20, Loss Contingencies (formerly FAS 5), and pursuant to amendments by ASU 2010-20 regarding allowance for unimpaired loans. |
| (2) | Represents loans individually evaluated for impairment in accordance with ASC 310-10, Receivables (formerly FAS 114), and pursuant to amendments by ASU 2010-20 regarding allowance for impaired loans. |
| (3) | Represents the allowance and related loan carrying value determined in accordance with ASC 310-30, Receivables – Loans and Debt Securities Acquired with Deteriorated Credit Quality (formerly SOP 03-3), and pursuant to amendments by ASU 2010-20 regarding allowance for PCI loans. |
Credit Quality
We monitor credit quality as indicated by evaluating various attributes and utilize such information in our evaluation of the adequacy of the allowance for credit losses. The following sections provide the credit quality indicators we most closely monitor. The majority of credit quality indicators are based on December 31, 2010 information, with the exception of the credit quality indicators for updated Fair Isaac Corporation (credit rating) (FICO) and updated loan-to-value (LTV)/combined-loan-to-value (CLTV), which are updated quarterly. Generally, these indicators are updated in the last month of each quarter.
Commercial Credit Quality Indicators
In addition to monitoring commercial loan concentration risk, we manage a consistent process for assessing commercial loan credit quality. Commercial loans are subject to individual risk assessment using our internal borrower and collateral quality ratings. Our ratings are aligned to Pass and Criticized categories. The Criticized category includes Special Mention, Substandard, and Doubtful categories which are defined by banking regulatory agencies. The table below provides a breakdown of outstanding commercial loans by risk category.
|
|
December 31, 2010 |
| ||||||||||||||
| (in thousands) | Commercial and industrial |
Real estate mortgage |
Real estate construction |
Total | ||||||||||||
| By risk category: |
||||||||||||||||
| Pass |
$ | 206,362 | 1,087,574 | 68,838 | 1,362,774 | |||||||||||
| Criticized |
3,456 | 179,776 | 7,195 | 190,427 | ||||||||||||
| Total commercial loans |
$ | 209,818 | 1,267,350 | 76,033 | 1,553,201 | |||||||||||
In addition, while we monitor past due status, we do not consider it a key driver of our credit risk management practices for commercial loans. The following table provides past due information for commercial loans.
|
December 31, 2010 |
||||||||||||||||
| (in thousands) | Commercial and industrial |
Real estate mortgage |
Real estate |
Total | ||||||||||||
| By delinquency status: |
||||||||||||||||
| Current or 1-29 days past due (DPD) |
$ | 207,363 | 1,238,311 | 74,440 | 1,520,114 | |||||||||||
| 30-89 DPD |
- | 4,129 | 1,227 | 5,356 | ||||||||||||
| 90+ DPD and still accruing |
1 | 3,419 | - | 3,420 | ||||||||||||
| Nonaccruing |
2,454 | 21,491 | 366 | 24,311 | ||||||||||||
| Total commercial loans |
$ | 209,818 | 1,267,350 | 76,033 | 1,553,201 | |||||||||||
50
Table of Contents
Consumer Credit Quality Indicators
We have various classes of consumer loans that present respective unique risks. Loan delinquency, FICO credit scores and LTV for loan types are common credit quality indicators that we monitor and utilize in our evaluation of the adequacy of the allowance for credit losses for the consumer portfolio segment.
The majority of our loss estimation techniques used for the allowance for credit losses rely on delinquency matrix models or delinquency roll rate models. Therefore, delinquency is an important indicator of credit quality and the establishment of our allowance for credit losses.
The following table provides the outstanding balances of our consumer portfolio by delinquency status.
|
December 31, 2010 |
||||||||||||
| (in thousands) | Real estate 1-4 family first mortgage |
Real estate junior lien mortgage |
Total | |||||||||
| By delinquency status: |
||||||||||||
| Current |
$ | 9,329,130 | 3,653,515 | 12,982,645 | ||||||||
| 1-29 DPD |
240,362 | 227,877 | 468,239 | |||||||||
| 30-59 DPD |
90,734 | 57,608 | 148,342 | |||||||||
| 60-89 DPD |
49,688 | 34,843 | 84,531 | |||||||||
| 90-119 DPD |
35,593 | 21,674 | 57,267 | |||||||||
| 120-179 DPD |
54,874 | 41,498 | 96,372 | |||||||||
| 180+ DPD |
110,100 | 33,986 | 144,086 | |||||||||
| Remaining PCI accounting adjustments |
(23,648 | ) | (4,471 | ) | (28,119 | ) | ||||||
| Total consumer loans |
$ | 9,886,833 | 4,066,530 | 13,953,363 | ||||||||
The following table provides a breakdown of our consumer portfolio by updated FICO. We obtain FICO scores at loan origination and the scores are updated at least quarterly. FICO is not available for certain loan types and may not be obtained if we deem it unnecessary due to strong collateral and other borrower attributes.
|
December 31, 2010 |
||||||||||||
| (in thousands) | Real estate 1-4 family first mortgage |
Real estate 1-4 family junior lien mortgage |
Total | |||||||||
| By FICO: |
||||||||||||
| < 600 |
$ | 592,306 | 478,837 | 1,071,143 | ||||||||
| 600-639 |
308,528 | 219,499 | 528,027 | |||||||||
| 640-679 |
594,252 | 363,377 | 957,629 | |||||||||
| 680-719 |
1,240,345 | 583,981 | 1,824,326 | |||||||||
| 720-759 |
1,882,147 | 811,697 | 2,693,844 | |||||||||
| 760-799 |
3,136,616 | 932,872 | 4,069,488 | |||||||||
| 800 + |
1,608,139 | 492,220 | 2,100,359 | |||||||||
| No score/unknown |
548,148 | 188,518 | 736,666 | |||||||||
| Remaining PCI accounting adjustments |
(23,648 | ) | (4,471 | ) | (28,119 | ) | ||||||
| Total consumer loans |
$ | 9,886,833 | 4,066,530 | 13,953,363 | ||||||||
LTV refers to the ratio comparing the loan’s unpaid principal balance to the property’s collateral value. CLTV refers to the combination of first and junior lien ratios. We determine LTVs and CLTVs at loan origination by obtaining independent valuations. LTVs and CLTVs are updated quarterly using a cascade approach which first uses values provided by automated valuation models (AVMs) for the respective property. If an AVM is not available, then the value is estimated using the original appraised value adjusted by the change in Home Price Index (HPI) for the property location. If an HPI is not available, the original appraised value is used. The HPI value is normally the only method considered for high value properties as the AVM values have proven less accurate for these properties.
51
Table of Contents
The table below shows the most current LTV and CLTV distribution of the real estate 1-4 family first and junior lien mortgage loan portfolios. In recent years, the residential real estate markets have experienced significant declines in property values and several markets, particularly California and Florida have experienced declines that turned out to be more significant than the national decline. These trends are considered in the way that we monitor credit risk and establish our allowance for credit losses. Certain loans do not have an LTV or CLTV primarily due to industry data availability and portfolios acquired or serviced by other institutions.
|
December 31, 2010 |
||||||||||||
| (in thousands) | Real estate 1-4 family first mortgage by LTV |
Real estate 1-4 family junior lien mortgage by CLTV |
Total | |||||||||
| By LTV/CLTV: |
||||||||||||
| 0-60% |
$ | 4,196,364 | 963,813 | 5,160,177 | ||||||||
| 60.01-80% |
3,276,565 | 799,961 | 4,076,526 | |||||||||
| 80.01-100% |
1,457,583 | 1,010,522 | 2,468,105 | |||||||||
| 100.01-120% (1) |
538,686 | 698,335 | 1,237,021 | |||||||||
| > 120% (1) |
316,528 | 546,039 | 862,567 | |||||||||
| No LTV/CLTV available |
124,755 | 52,331 | 177,086 | |||||||||
| Remaining PCI accounting adjustments |
(23,648 | ) | (4,471 | ) | (28,119 | ) | ||||||
| Total consumer loans |
$ | 9,886,833 | 4,066,530 | 13,953,363 | ||||||||
| (1) | Reflects total loan balances with LTV/CLTV amounts in excess of 100%. In the event of default, the loss content would generally be limited to only the amount in excess of 100% LTV/CLTV. |
NONACCRUAL LOANS
The following table provides loans on nonaccrual status. PCI loans are excluded from this table due to the existence of the accretable yield.
|
December 31, |
||||||||
| (in thousands) | 2010 | 2009 | ||||||
| Commercial: |
||||||||
| Commercial and industrial |
$ | 2,454 | 3,510 | |||||
| Real estate mortgage |
21,491 | 4,869 | ||||||
| Real estate construction |
366 | - | ||||||
| Total commercial |
24,311 | 8,379 | ||||||
| Consumer: |
||||||||
| Real estate 1-4 family first mortgage |
225,297 | 119,666 | ||||||
| Real estate 1-4 family junior lien mortgage |
117,218 | 79,495 | ||||||
| Total consumer |
342,515 | 199,161 | ||||||
| Total nonaccrual loans |
$ | 366,826 | 207,540 | |||||
52
Table of Contents
LOANS 90 DAYS OR MORE PAST DUE AND STILL ACCRUING
Certain loans 90 days or more past due as to interest or principal are still accruing, because they are (1) well-secured and in the process of collection or (2) real estate 1-4 family mortgage loans exempt under regulatory rules from being classified as nonaccrual until later delinquency, usually 120 days. PCI loans of $10.9 million at December 31, 2010, and $47.6 million at December 31, 2009, are excluded from this disclosure even though they are 90 days or more contractually past due. These PCI loans are considered to be accruing due to the existence of the accretable yield and not based on consideration given to contractual interest payments.
Non-PCI loans 90 days or more past due and still accruing were $40.4 million at December 31, 2010, and $50.5 million at December 31, 2009. The following table shows non-PCI loans 90 days or more past due and still accruing.
|
December 31, |
||||||||
| (in thousands) | 2010 | 2009 | ||||||
| Commercial: |
||||||||
| Commercial and industrial |
$ | 1 | - | |||||
| Real estate mortgage |
3,419 | 9,445 | ||||||
| Real estate construction |
- | - | ||||||
| Total commercial |
3,420 | 9,445 | ||||||
| Consumer: |
||||||||
| Real estate 1-4 family first mortgage |
22,319 | 20,681 | ||||||
| Real estate 1-4 family junior lien mortgage |
14,645 | 20,406 | ||||||
| Total consumer |
36,964 | 41,087 | ||||||
| Total past due |
$ | 40,384 | 50,532 | |||||
IMPAIRED LOANS
The table below summarizes key information for impaired loans. Our impaired loans include loans on nonaccrual status in the commercial portfolio segment and loans modified in a TDR, whether on accrual or nonaccrual status. These impaired loans may have estimated impairment which is included in the allowance for credit losses. Impaired loans exclude PCI loans. See the “Loans” section in Note 1 for our policies on impaired loans and PCI loans.
|
December 31, 2010 |
||||||||||||||||
| Recorded investment | ||||||||||||||||
| (in thousands) |
Unpaid principal balance |
Impaired loans |
Impaired loans with related allowance for credit losses |
Related credit losses |
||||||||||||
| Commercial: |
||||||||||||||||
| Commercial and industrial |
$ | 4,537 | 3,151 | 3,151 | 1,102 | |||||||||||
| Real estate mortgage |
22,506 | 19,746 | 19,746 | 9,337 | ||||||||||||
| Real estate construction |
389 | 366 | 366 | 122 | ||||||||||||
| Total commercial |
27,432 | 23,263 | 23,263 | 10,561 | ||||||||||||
| Consumer: |
||||||||||||||||
| Real estate 1-4 family first mortgage |
137,296 | 131,159 | 131,159 | 19,205 | ||||||||||||
| Real estate 1-4 family junior lien mortgage |
82,335 | 78,187 | 78,187 | 32,676 | ||||||||||||
| Total consumer |
219,631 | 209,346 | 209,346 | 51,881 | ||||||||||||
| Total |
$ | 247,063 | 232,609 | 232,609 | 62,442 | |||||||||||
53
Table of Contents
The following table provides the average recorded investment in impaired loans and the amount of interest income recognized on impaired loans.
|
Year ended December 31, 2010 |
||||||||
| (in thousands) | Average recorded investment |
Recognized interest income |
||||||
| Commercial: |
||||||||
| Commercial and industrial |
$ | - | - | |||||
| Real estate mortgage |
14,489 | 236 | ||||||
| Real estate construction |
350 | 6 | ||||||
| Total commercial |
14,839 | 242 | ||||||
| Consumer: |
||||||||
| Real estate 1-4 family first mortgage |
88,533 | 3,979 | ||||||
| Real estate 1-4 family junior lien mortgage |
67,065 | 3,352 | ||||||
| Total consumer |
155,598 | 7,331 | ||||||
| Total impaired loans |
$ | 170,437 | 7,573 | |||||
The following table presents interest income recognized on impaired loans by method.
|
(in thousands) |
|
Year ended December 31, 2010 |
| |
| Cash basis of accounting |
$ 874 | |||
| Other (1) |
6,699 | |||
| Total interest income |
$ 7,573 |
| (1) | Includes interest recognized on accruing TDRs and interest recognized related to the passage of time on certain impaired loans. See footnote 1 to the table of changes in the allowance for credit losses. |
54
Table of Contents
NOTE 3: COMMITMENTS, GUARANTEES AND OTHER MATTERS
Wachovia Funding does not have any consumer lines of credit. Wachovia Funding’s commercial loan portfolio includes unfunded loan commitments that are provided in the normal course of business. For commercial borrowers, loan commitments generally take the form of revolving credit arrangements to finance customers’ working capital requirements. These instruments are not recorded on the balance sheet until funds are advanced under the commitment. For lending commitments, the contractual amount of a commitment represents the maximum potential credit risk if the entire commitment is funded and the borrower does not perform according to the terms of the contract. Some of these commitments expire without being funded, and accordingly, total contractual amounts are not representative of actual future credit exposure or liquidity requirements.
Loan commitments create credit risk in the event that the counterparty draws on the commitment and subsequently fails to perform under the terms of the lending agreement. This risk is incorporated into our overall evaluation of credit risk, and to the extent necessary, an allowance for loan losses is recorded on these commitments. Uncertainties around the timing and amount of funding under these commitments may create liquidity risk for Wachovia Funding.
The contract or notional amount of commercial loan commitments to extend credit at December 31, 2010 and 2009 was $538.4 million and $666.7 million, respectively. The fair value of commitments to extend credit is estimated using the fees currently charged to enter into similar agreements, taking into account the remaining terms of the agreements and the current creditworthiness of the counterparties. The estimated fair value of commitments to extend credit at December 31, 2010, was negative $595 thousand. The estimated fair value of lending commitments is negative due to the current economic environment, and represents the estimated amount that Wachovia Funding would need to pay a third party to assume our December 31, 2010, exposure on lending commitments.
As part of the loan participation agreements with the Bank, Wachovia Funding provides an indemnification to the Bank if certain events occur. These contingencies generally relate to claims or judgments arising out of participated loans that are not the result of gross negligence or intentional misconduct by the Bank. Wachovia Funding has not been required to make payments under the indemnification clauses in 2010, 2009 or 2008. Since there are no stated or notional amounts included in the indemnification clauses and the contingencies triggering the obligation to indemnify have not occurred and are not expected to occur, Wachovia Funding is not able to estimate the maximum amount of future payments under the indemnification clauses. There are no amounts reflected on the consolidated balance sheet at December 31, 2010, related to these indemnifications.
Wachovia Funding is not currently involved in nor, to our knowledge, currently threatened with any material litigation. From time to time we may become involved in routine litigation arising in the ordinary course of business. We do not believe that the eventual outcome of any such routine litigation will, in the aggregate, have a material adverse effect on our consolidated financial statements. However, in the event of unexpected future developments, it is possible that the ultimate resolution of those matters, if unfavorable, could be material to our consolidated financial statements for any particular period.
55
Table of Contents
NOTE 4: DERIVATIVES
We use derivative financial instruments as economic hedges and none are treated as accounting hedges. By using derivatives, we are exposed to credit risk if counterparties to the derivative contracts do not perform as expected. If a counterparty fails to perform, our counterparty credit risk is equal to the amount reported as a derivative asset in our balance sheet. The amounts reported as a derivative asset are derivative contracts in a gain position, and to the extent subject to master netting arrangements, net of derivatives in a loss position with the same counterparty and cash collateral received. We minimize counterparty credit risk through credit approvals, limits, monitoring procedures, and executing master netting arrangements and obtaining collateral, where appropriate. Derivative balances and related cash collateral amounts are shown net in the balance sheet as long as they are subject to master netting agreements and meet the criteria for net presentation. Counterparty credit risk related to derivatives is considered and, if material, accounted for separately.
At December 31, 2010, receive-fixed interest rate swaps with a notional amount of $4.1 billion had a weighted average maturity of 1.46 years, weighted average receive rate of 7.45% and weighted average pay rate of 0.30%. Pay-fixed interest rate swaps with a notional amount of $4.1 billion had a weighted average maturity of 1.46 years, weighted average receive rate of 0.30% and weighted average pay rate of 5.72% at December 31, 2010. All of the interest rate swaps have variable pay or receive rates based on three- or six-month LIBOR.
The total notional amounts and fair values for derivatives of which none of the derivatives are designated as hedging instruments were:
|
December 31, 2010 |
December 31, 2009 |
|||||||||||||||||||||||
|
Fair value |
Fair value | |||||||||||||||||||||||
| (in thousands) | Notional or contractual amount |
Asset derivatives |
Liability derivatives |
Notional or contractual amount |
Asset derivatives |
Liability derivatives |
||||||||||||||||||
|
Interest rate swaps |
$8,200,000 | 422,597 | 316,327 | 8,200,000 | 578,790 | 404,203 | ||||||||||||||||||
| Netting (1) |
(421,584) | (316,327) | (577,814) | (404,203) | ||||||||||||||||||||
| Total |
$ 1,013 | - | 976 | - | ||||||||||||||||||||
| (1) | Derivatives are reported net of cash collateral received and paid. Additionally, positions with the same counterparty are netted as part of a legally enforceable master netting agreement between Wachovia Funding and the derivative counterparty. |
At December 31, 2010, our position in interest rate swaps, which is recorded as a net amount on our consolidated balance sheet at fair value, was an asset of $422.6 million, a liability of $316.3 million, and a cash collateral payable of $105.3 million.
Gains recognized in the consolidated statement of income related to derivatives not designated as hedging instruments in 2010, 2009 and 2008 were $2.5 million, $4.1 million and $16.1 million, respectively.
56
Table of Contents
NOTE 5: FAIR VALUES OF ASSETS AND LIABILITIES
Under our fair value framework, fair value measurements must reflect assumptions market participants would use in pricing an asset or liability.
Fair value represents the price that would be received to sell an asset or paid to transfer a liability in an orderly transaction between market participants in the principal market. If there is no principal market, an entity should use the most advantageous market for the specific asset or liability at the measurement date (referred to as an exit price). We group our assets and liabilities measured at fair value in three levels based on the markets in which the assets and liabilities are traded and the reliability of the assumptions used to determine fair value. These levels are:
| • | Level 1 – Valuation is based upon quoted prices for identical instruments traded in active markets. |
| • | Level 2 – Valuation is based upon quoted prices for similar instruments in active markets, quoted prices for identical or similar instruments in markets that are not active, and model-based valuation techniques for which all significant assumptions are observable in the market. |
| • | Level 3 – Valuation is generated from model-based techniques that use significant assumptions not observable in the market. These unobservable assumptions reflect estimates of assumptions that market participants would use in pricing the asset or liability. |
In the determination of the classification of financial instruments in Level 2 or Level 3 of the fair value hierarchy, we consider all available information, including observable market data, indications of market liquidity and orderliness, and our understanding of the valuation techniques and significant inputs used. For securities in inactive markets, we use a predetermined percentage to evaluate the impact of fair value adjustments derived from weighting both external and internal indications of value to determine if the instrument is classified as Level 2 or Level 3. Based upon the specific facts and circumstances of each instrument or instrument category, judgments are made regarding the significance of the Level 3 inputs to the instruments’ fair value measurement in its entirety. If Level 3 inputs are considered significant, the instrument is classified as Level 3.
DETERMINATION OF FAIR VALUE
In determining fair value, Wachovia Funding uses market prices of the same or similar instruments whenever such prices are available. A fair value measurement assumes that an asset or liability is exchanged in an orderly transaction between market participants, and accordingly, fair value is not determined based upon a forced liquidation or distressed sale. Where necessary, Wachovia Funding estimates fair value using other market observable data such as prices for synthetic or derivative instruments, market indices, and industry ratings of underlying collateral or models employing techniques such as discounted cash flow analyses. The assumptions used in the models, which typically include assumptions for interest rates, credit losses and prepayments, are verified against market observable data where possible. Market observable real estate data is used in valuing instruments where the underlying collateral is real estate or where the fair value of an instrument being valued highly correlates to real estate prices. Where appropriate, Wachovia Funding may use a combination of these valuation approaches.
Where the market price of the same or similar instruments is not available, the valuation of financial instruments becomes more subjective and involves a high degree of judgment. Where modeling techniques are used, the models are subject to validation procedures by our internal valuation model validation group in accordance with risk management policies and procedures. Further, pricing data is subject to verification.
DERIVATIVES
Wachovia Funding’s derivatives are executed over the counter (OTC). As no quoted market prices exist for such instruments, OTC derivatives are valued using internal valuation techniques. Valuation techniques and inputs to internally-developed models depend on the type of derivative and the nature of the underlying rate, price or index upon which the derivative’s value is based. Key inputs can include yield curves, credit curves, foreign-exchange rates, prepayment rates, volatility measurements and correlation of such inputs. Where model inputs can be observed in a liquid market and the model selection does not require significant judgment, such derivatives are typically classified within Level 2 of the fair value hierarchy. Examples of derivatives within Level 2 include generic interest rate swaps.
57
Table of Contents
Wachovia Funding’s interest rate swaps are recorded at fair value. The fair value of interest rate swaps is estimated using discounted cash flow analyses based on observable market data.
LOANS
Wachovia Funding does not record loans at fair value on a recurring basis. As such, valuation techniques discussed herein for loans are primarily for disclosing estimated fair values. However, from time to time, we record nonrecurring fair value adjustments to loans to primarily reflect partial write-downs that are based on the current appraised value of the collateral.
The fair value estimates for disclosure purposes differentiate loans based on their financial characteristics, such as product classification, loan category, pricing features and remaining maturity. Prepayment and credit loss estimates are evaluated by product and loan rate.
The fair value of commercial and industrial and commercial real estate loans is calculated by discounting contractual cash flows, adjusted for credit loss estimates, using discount rates that reflect our current pricing for loans with similar characteristics and remaining maturity.
For real estate 1-4 family first and junior lien mortgages, fair value is calculated by discounting contractual cash flows, adjusted for prepayment and credit loss estimates, using discount rates based on current industry pricing (where readily available) or our own estimate of an appropriate risk-adjusted discount rate for loans of similar size, type, remaining maturity and repricing characteristics.
ITEMS MEASURED AT FAIR VALUE ON A RECURRING BASIS
The following table presents Wachovia Funding’s assets and liabilities that are measured at fair value on a recurring basis at December 31, 2010 and 2009, for each of the fair value hierarchy levels.
|
(in thousands) |
Level 1 | Level 2 | Level 3 | Netting (1) | Total | |||||||||||||||
| Balance at December 31, 2010 |
||||||||||||||||||||
| Assets |
||||||||||||||||||||
| Interest rate swaps |
$ | - | 422,597 | - | (421,584 | ) | 1,013 | |||||||||||||
| Total assets at fair value |
$ | - | 422,597 | - | (421,584 | ) | 1,013 | |||||||||||||
| Liabilities |
||||||||||||||||||||
| Interest rate swaps |
$ | - | 316,327 | - | (316,327 | ) | - | |||||||||||||
| Total liabilities at fair value |
$ | - | 316,327 | - | (316,327 | ) | - | |||||||||||||
| Balance at December 31, 2009 |
||||||||||||||||||||
| Assets |
||||||||||||||||||||
| Interest rate swaps |
$ | - | 578,790 | - | (577,814 | ) | 976 | |||||||||||||
| Total assets at fair value |
$ | - | 578,790 | - | (577,814 | ) | 976 | |||||||||||||
| Liabilities |
||||||||||||||||||||
| Interest rate swaps |
$ | - | 404,203 | - | (404,203 | ) | - | |||||||||||||
| Total liabilities at fair value |
$ | - | 404,203 | - | (404,203 | ) | - | |||||||||||||
| (1) | Derivatives are reported net of cash collateral received and paid. Additionally, positions with the same counterparty are netted as a part of a legally enforceable master netting agreement between Wachovia Funding and the derivative counterparty. See Note 4 for additional information on the treatment of master netting arrangements related to derivative contracts. |
As of December 31, 2010, Wachovia Funding assets or liabilities measured at fair value on a nonrecurring basis were insignificant. Additionally, Wachovia Funding did not elect fair value option for any financial instruments as permitted in FASB ASC 825, Financial Instruments, which allows companies to elect to carry certain financial instruments at fair value with corresponding changes in fair value reported in the results of operations.
58
Table of Contents
DISCLOSURES ABOUT FAIR VALUE OF FINANCIAL INSTRUMENTS
Information about the fair value of on-balance sheet financial instruments at December 31, 2010 and 2009 is presented below.
|
December 31, 2010 |
December 31, 2009 |
|||||||||||||||
| (in thousands) | Carrying amount |
Estimated fair value |
Carrying amount |
Estimated fair value |
||||||||||||
| Financial assets |
||||||||||||||||
| Cash and cash equivalents |
$ 2,774,299 | 2,774,299 | 2,092,523 | 2,092,523 | ||||||||||||
| Loans, net of unearned income and allowance for loan losses (1) |
15,103,604 | 16,354,121 | 16,064,173 | 16,183,305 | ||||||||||||
| Interest rate swaps (2) |
1,013 | 1,013 | 976 | 976 | ||||||||||||
| Accounts receivable - affiliates, net |
218,394 | 218,394 | 166,388 | 166,388 | ||||||||||||
| Other financial assets |
77,131 | 77,131 | 82,621 | 82,621 | ||||||||||||
| Financial liabilities |
||||||||||||||||
| Other financial liabilities
|
|
19,389
|
|
|
19,389
|
|
|
19,259
|
|
|
19,259
|
| ||||
| (1) | Unearned income was $785.2 million and $732.0 million at December 31, 2010 and 2009, respectively. Allowance for loan losses was $403.0 million at December 31, 2010 and $337.4 million at December 31, 2009. |
| (2) | Interest rate swaps are reported net of cash collateral received of $105.3 million and $173.6 million at December 31, 2010 and December 31, 2009, respectively, pursuant to the accounting requirements for net presentation. See Note 4 for additional information on derivatives. |
Substantially all the other financial assets and liabilities have maturities of three months or less, and accordingly, the carrying amount is deemed to be a reasonable estimate of fair value.
We have not included assets and liabilities that are not financial instruments in our disclosure, such as certain other assets, deferred income tax liabilities and certain other liabilities. The total of the fair value calculations presented does not represent, and should not be construed to represent, the underlying value of Wachovia Funding.
59
Table of Contents
NOTE 6: COMMON AND PREFERRED STOCK
Wachovia Funding has authorized preferred and common stock. In order to remain qualified as a REIT, Wachovia Funding must distribute annually at least 90% of taxable earnings. The following table provides detail of preferred stock.
|
December 31, |
||||||||||||||||||||||||
| 2010 | 2009 | |||||||||||||||||||||||
| (in thousands, except shares and liquidation preference per share) | Liquidation preference per share |
Shares authorized |
Shares issued and outstanding |
Par value | Carrying value |
Carrying value |
||||||||||||||||||
|
Series A |
||||||||||||||||||||||||
| 7.25% Non-Cumulative Exchangeable, Perpetual Series A Preferred Securities |
$ | 25 | 30,000,000 | 30,000,000 | $ | 300 | 300 | 300 | ||||||||||||||||
|
Series B |
||||||||||||||||||||||||
| Floating rate (three-month LIBOR plus 1.83%) Non-Cumulative Exchangeable, Perpetual Series B Preferred Securities |
25 | 40,000,000 | 40,000,000 | 400 | 400 | 400 | ||||||||||||||||||
|
Series C |
||||||||||||||||||||||||
| Floating rate (three-month LIBOR plus 2.25%) Cumulative, Perpetual Series C Preferred Securities (1) |
1,000 | 5,000,000 | 4,233,754 | 43 | 43 | 43 | ||||||||||||||||||
|
Series D |
||||||||||||||||||||||||
| 8.50% Non-Cumulative, Perpetual Series D Preferred Securities |
$ | 1,000 | 913 | 913 | - | - | - | |||||||||||||||||
| Total |
75,000,913 | 74,234,667 | $ | 743 | 743 | 743 | ||||||||||||||||||
(1) Prior to third quarter of 2009, interest rate was three-month LIBOR plus 0.85%.
In the event that Wachovia Funding is liquidated or dissolved, the holders of the preferred securities will be entitled to a liquidation preference for each security plus any authorized, declared and unpaid dividends that will be paid prior to any payments to common stockholders or general unsecured creditors. With respect to the payment of dividends and liquidation preference, the Series A preferred securities rank on parity with Series B and Series D preferred securities and senior to the common stock and Series C preferred securities. In the event that a supervisory event occurs in which the Bank is placed into conservatorship or receivership, the Series A and Series B preferred securities are convertible into certain preferred stock of Wells Fargo.
Except upon the occurrence of a Special Event (as defined below), the Series A preferred securities are not redeemable prior to December 31, 2022. On or after such date, we may redeem these securities for cash, in whole or in part, with the prior approval of the Office of the Comptroller of the Currency (OCC), at the redemption price of $25 per security, plus authorized, declared, but unpaid dividends to the date of redemption. The Series B and Series C preferred securities may be redeemed for cash, in whole or in part, with the prior approval of the OCC, at redemption prices of $25 and $1,000 per security, respectively, plus authorized, declared, but unpaid dividends to the date of redemption, including any accumulation of any unpaid dividends for the Series C preferred securities. We can redeem the Series D preferred securities in whole or in part at any time at $1,000 per security plus authorized, declared and unpaid dividends.
A Special Event means: a Tax Event; an Investment Company Act Event; or a Regulatory Capital Event.
Tax Event means our determination, based on the receipt by us of a legal opinion, that there is a significant risk that dividends paid or to be paid by us with respect to our capital stock are not or will not be fully deductible by us for United States Federal income tax purposes or that we are or will be subject to additional taxes, duties, or other governmental charges, in an amount we reasonably determine to be significant as a result of:
| — | any amendment to, clarification of, or change in, the laws, treaties, or related regulations of the United States or any of its political subdivisions or their taxing authorities affecting taxation; or |
| — | any judicial decision, official administrative pronouncement, published or private ruling, technical advice memorandum, Chief Counsel Advice, as such term is defined in the Code, regulatory procedure, notice, or official announcement. |
Investment Company Act Event means our determination, based on the receipt by us of a legal opinion, that there is a significant risk that we are or will be considered an “investment company” that is required to be registered under the Investment Company Act, as a result of the occurrence of a change in law or regulation or a written change in interpretation or application of law or regulation by any legislative body, court, governmental agency, or regulatory authority.
60
Table of Contents
Regulatory Capital Event means our determination, based on the receipt by us of a legal opinion, that there is a significant risk that the Series A preferred securities will no longer constitute Tier 1 capital of the Bank or Wells Fargo for purposes of the capital adequacy guidelines or policies of the OCC or the Federal Reserve Board, or their respective successor as the Bank’s and Wells Fargo’s, respectively, primary Federal banking regulator, as a result of any amendments to, clarification of, or change in applicable laws or related regulations or official interpretations or policies; or any official administrative pronouncement or judicial decision interpreting or applying such laws or regulations.
We continue to evaluate the potential impact on liquidity management of regulatory proposals, including Basel III and those required under the Dodd-Frank Act, as they move closer to the final rule-making process.
61
Table of Contents
NOTE 7: INCOME TAXES
The components of income tax expense were:
| (in thousands) |
2010 |
2009 | 2008 | |||||||||
| (Successor) | (Successor) | (Predecessor) | ||||||||||
| Current income tax expense |
||||||||||||
| Federal |
$ | 18,146 | 14,928 | 18,175 | ||||||||
| State |
- | 1,238 | 3,222 | |||||||||
| Total current income tax expense |
18,146 | 16,166 | 21,397 | |||||||||
| Deferred income tax expense (benefit) |
||||||||||||
|
Federal |
(17,228) | (13,455) | (8,245) | |||||||||
| State |
- | (1,116) | 9 | |||||||||
| Total deferred income tax expense (benefit) |
(17,228) | (14,571) | (8,236) | |||||||||
| Total income tax expense |
$ | 918 | 1,595 | 13,161 | ||||||||
The reconciliation of federal income tax rates and amounts to the effective income tax rates and amounts for each of the years in the three-year period ended December 31, 2010, is presented below.
|
2010 |
2009 | 2008 | ||||||||||||||||||||||
| (in thousands) | Amount | (Successor) pre-tax |
Amount | (Successor) pre-tax |
Amount | (Predecessor) pre-tax |
||||||||||||||||||
| Income before income tax expense |
$ | 770,334 | 869,245 | 780,437 | ||||||||||||||||||||
| Tax at federal income tax rate |
$ | 269,617 | 35.0 | % | $ | 304,235 | 35.0 | % | $ | 273,153 | 35.0 | % | ||||||||||||
| Reasons for differences in federal income tax rate and effective tax rate |
||||||||||||||||||||||||
| REIT income not subject to federal taxation |
(268,699) | (34.9) | (302,720) | (34.8) | (263,091) | (33.7) | ||||||||||||||||||
| State income taxes, net |
- | - | 80 | - | 3,099 | 0.4 | ||||||||||||||||||
| Total |
$ | 918 | 0.1 | % | $ | 1,595 | 0.2 | % | $ | 13,161 | 1.7 | % | ||||||||||||
In 2010, 2009 and 2008, the income before income tax expense of $770.3 million, $869.2 million and $780.4 million, respectively, included $767.7 million, $864.9 million and $751.7 million, respectively, of REIT income not subject to federal taxation. The remaining income before income taxes of $2.6 million, $4.3 million and $28.7 million in 2010, 2009 and 2008, respectively, is income before income taxes of WPR. Income tax expense was $918 thousand, $1.6 million and $13.2 million, respectively, for 2010, 2009 and 2008. The decrease in income tax expense over the three year period was primarily related to the reduction in pre-tax income and the adoption of the Wells Fargo state tax settlement policy.
The sources of temporary differences that give rise to deferred income tax liabilities are interest rate swap contracts. The related tax effects at December 31, 2010, 2009 and 2008, were $30.3 million, $50.0 million and $62.1 million, respectively. The deferred income tax liability for 2010 reflects a $2.5 million reduction related to state tax settlement policy conformity and in 2009 included a $2.4 million increase related to purchase accounting adjustments recorded due to the acquisition of Wachovia by Wells Fargo.
Deferred income tax assets and liabilities are established for WPR to recognize the expected future tax consequences attributable to temporary differences between the financial statement carrying amount and the tax basis of assets and liabilities. Deferred income tax assets and liabilities are measured using enacted tax rates expected to apply to taxable income in the years in which those temporary differences are expected to be recovered or settled. The effect of a change in tax rates on deferred income tax assets and liabilities is recognized in income during the period that includes the enactment date.
At December 31, 2010, WPR had no federal net operating loss carry forwards.
Wachovia Funding evaluates uncertain tax positions in accordance with FASB ASC 740, Income Taxes. Based upon its current evaluation, Wachovia Funding has concluded that there are no significant uncertain tax positions relevant to the jurisdictions where it is required to file income tax returns requiring recognition in the financial statements at December 31, 2010.
62
Table of Contents
Wachovia Funding recognizes accrued interest and penalties, as appropriate, related to unrecognized income tax benefits in the effective tax rate. Wachovia Funding recognized no interest in 2010 and the balance of accrued interest was zero at December 31, 2010.
Management monitors proposed and issued tax law, regulations and cases to determine the potential impact to uncertain income tax positions. At December 31, 2010, management had not identified any potential subsequent events that would have a material impact on unrecognized income tax benefits within the next twelve months.
We are subject to U.S. federal income tax as well as income tax in certain state jurisdictions. We are not subject to federal income tax examinations for taxable years prior to 2007 or state income tax examinations for taxable years prior to 2006.
63
Table of Contents
NOTE 8: TRANSACTIONS WITH RELATED PARTIES
Wachovia Funding, as a subsidiary, is subject to certain income and expense allocations from affiliated parties for various services received. In addition, we enter into transactions with affiliated parties in the normal course of business. The principal items related to transactions with affiliated parties included in the accompanying consolidated balance sheets and consolidated statements of operations are described below. Due to the nature of common ownership of Wachovia Funding and the affiliated parties by Wells Fargo, the following transactions could differ from those conducted with unaffiliated parties.
As part of its investment activities, Wachovia Funding obtains loans and/or 100% interests in loan participations (which are both reflected as loans in the accompanying consolidated financial statements). As of December 31, 2010 and 2009, substantially all of our loans are in the form of loan participation interests. Although we may purchase loans from third parties, we have historically purchased loan participation interests from the Bank in loans it originated or purchased.
In 2010, we paid the Bank $3.2 billion in cash for a participation interest in consumer loans, which reflected fair value purchase prices.
In third quarter 2010, the Bank restructured a commercial lending relationship, which affected a participation interest from the Bank to Wachovia Funding. As a result, the Bank was required to purchase the participation interest, a commercial PCI loan, from Wachovia Funding at the unpaid principal balance. That participation interest had been recorded on our balance sheet at a value that was less than the unpaid principal balance. As a result of this transaction, we recorded a gain on sale to affiliate of $18.0 million.
The Bank services our loans on our behalf, which includes delegating servicing to third parties in the case of a portion of our residential mortgage products. We pay the Bank a percentage per annum fee for this service on commercial loans and on home equity loan products. For servicing fees related to residential mortgage products the monthly fee is equal to the outstanding principal of each loan multiplied by a percentage per annum or a flat fee per month. Included in loan servicing costs are fees paid to affiliates of $58.5 million in 2010, $63.0 million in 2009 and $64.6 million in 2008. Management fees represent reimbursements for general overhead expenses paid on our behalf. For 2010, management fees are calculated based on Wells Fargo’s total monthly allocated costs multiplied by a formula. The formula is based on our proportion of Wells Fargo’s consolidated: 1) full-time equivalent employees (FTEs), 2) total average assets and 3) total revenue. In 2009, Wachovia Funding was assessed monthly management fees based on its relative percentage of the Bank’s total consolidated assets and noninterest expense. For 2008, as an affiliate qualifying for an allocation with over $10 million in qualifying assets, we were assessed management fees based on our relative percentage of total consolidated assets and noninterest expense. These expenses amounted to $4.6 million in 2010, $10.2 million in 2009 and $18.7 million in 2008.
Eurodollar deposits with the Bank are our primary cash management vehicle. In each of the years in the three-year period ended 2010, we also entered into certain loan participations with affiliates and were allocated a portion of all income associated with those loans. At December 31, 2010 and 2009, eurodollar deposit investments due from the Bank included in cash and cash equivalents were $2.8 billion and $2.1 billion, respectively. Interest income earned on eurodollar deposit investments included in interest income was $1.3 million in 2010, $1.4 million in 2009 and $30.9 million in 2008.
Wachovia Funding has a swap servicing and fee agreement with the Bank whereby the Bank provides operational, back office, book entry, record keeping and valuation services related to our interest rate swaps. In consideration of these services, we pay the Bank 0.015% multiplied by the net amount actually paid under the interest rate swaps on the swaps’ payment date. Amounts paid under this agreement were $11 thousand in 2010, $13 thousand in 2009 and $11 thousand in 2008, and were included in loan servicing costs.
The Bank acts as our collateral custodian in connection with collateral pledged to us related to our interest rate swaps. For this service, we pay the Bank a fee equal to the sum of 0.05% multiplied by the fair value of noncash collateral and 0.05% multiplied by the amount of cash collateral. Amounts paid under this agreement were $79 thousand in 2010, $113 thousand in 2009 and $155 thousand in 2008. In addition, the Bank is permitted to rehypothecate and use as its own the collateral held by the Bank as our custodian. The Bank pays us a fee equal to the sum of 0.05% multiplied by the fair value of the noncash collateral it holds as custodian and the amount of cash collateral held multiplied by a market rate of interest. The collateral agreement with the counterparty allows us to repledge the collateral free of any right of redemption or other right of the counterparty in such collateral without any obligation on our part to maintain possession or control of equivalent collateral. Pursuant to the rehypothecation agreement, we had invested $105.3 million, $173.6 million and $239.9 million of cash collateral in interest-bearing investments with the Bank or other Wells Fargo subsidiaries at December 31, 2010, 2009 and 2008, respectively. Amounts received under this agreement were $345 thousand in 2010, $595 thousand in 2009 and $13.4 million in 2008, and were included in interest income on eurodollar investments noted above.
64
Table of Contents
The Bank also provides a guaranty of our obligations under the interest rate swaps when the swaps are in a net payable position. In consideration, we pay the Bank a monthly fee in arrears equal to 0.03% multiplied by the absolute value of the net notional amount of the interest rate swaps. No amount was paid under this agreement in 2010, 2009 and 2008.
Wachovia Funding has a line of credit with the Bank. Under the terms of that facility, we can borrow up to $2.2 billion under revolving demand notes at a rate of interest equal to the average federal funds rate. At December 31, 2010 and 2009, we had no outstandings under this facility.
65
Table of Contents
NOTE 9: WACHOVIA PREFERRED FUNDING CORP. (PARENT)
The Parent, under the terms of a revolving credit agreement, can borrow from the Bank up to $1.0 billion at a rate of interest equal to the federal funds rate. At December 31, 2010, there were no borrowings outstanding between the Parent and the Bank. The Parent’s condensed financial statements follow.
Condensed Statement of Income
|
Years ended December 31, |
||||||||||||
| (in thousands) | 2010 | 2009 | 2008 | |||||||||
| (Successor) | (Successor) | (Predecessor) | ||||||||||
| Interest income |
$ |
903,056 |
|
924,400 | 872,958 | |||||||
| Interest expense |
- | 346 | 3,171 | |||||||||
| Net interest income |
903,056 | 924,054 | 869,787 | |||||||||
| Provision for credit losses |
274,096 | 165,912 | 248,459 | |||||||||
| Net interest income after provision for credit losses |
628,960 | 758,142 | 621,328 | |||||||||
| Noninterest income |
||||||||||||
| Other income |
173 | 422 | 5,976 | |||||||||
| Total noninterest income |
173 | 422 | 5,976 | |||||||||
| Noninterest expense |
||||||||||||
| Loan servicing costs |
43,988 | 49,669 | 50,267 | |||||||||
| Management fees |
3,442 | 7,461 | 13,328 | |||||||||
| Other |
3,975 | 2,814 | 1,697 | |||||||||
| Total noninterest expense |
51,405 | 59,944 | 65,292 | |||||||||
| Income before income tax expense and equity in undistributed net income of subsidiaries |
577,728 | 698,620 | 562,012 | |||||||||
| Income tax expense |
- | - | 2,102 | |||||||||
| Income before equity in undistributed net income of subsidiaries |
577,728 | 698,620 | 559,910 | |||||||||
| Equity in undistributed net income of subsidiaries |
191,688 | 169,030 | 207,366 | |||||||||
| Net income |
769,416 | 867,650 | 767,276 | |||||||||
| Dividends on preferred stock |
185,866 | 160,678 | 293,229 | |||||||||
| Net income available to common stockholders |
$ | 583,550 | 706,972 | 474,047 | ||||||||
66
Table of Contents
Condensed Balance Sheet
|
December 31, |
||||||||
| (in thousands, except shares) | 2010 | 2009 | ||||||
| Assets |
||||||||
| Cash and cash equivalents |
$ 1,615,493 | 521,947 | ||||||
| Loans, net of unearned income |
11,393,119 | 12,635,555 | ||||||
| Allowance for loan losses |
(322,921) | (267,969) | ||||||
| Net loans |
11,070,198 | 12,367,586 | ||||||
| Investment in wholly owned subsidiaries |
5,219,940 | 5,248,461 | ||||||
| Accounts receivable - affiliates, net |
158,128 | 127,248 | ||||||
| Other assets |
64,201 | 73,803 | ||||||
| Total assets |
$18,127,960 | 18,339,045 | ||||||
| Liabilities |
||||||||
| Other liabilities |
$ 6,087 | 3,722 | ||||||
| Total liabilities |
6,087 | 3,722 | ||||||
| Stockholders’ Equity |
||||||||
| Preferred stock |
||||||||
| Series A preferred securities, $0.01 par value per share, $750 million liquidation preference, non-cumulative and conditionally exchangeable, 30,000,000 shares authorized, issued and outstanding in 2010 and 2009 |
300 | 300 | ||||||
| Series B preferred securities, $0.01 par value per share, $1.0 billion liquidation preference, non-cumulative and conditionally exchangeable, 40,000,000 shares authorized, issued and outstanding in 2010 and 2009 |
400 | 400 | ||||||
| Series C preferred securities, $0.01 par value per share, $4.2 billion liquidation preference, cumulative, 5,000,000 shares authorized, 4,233,754 shares issued and outstanding in 2010 and 2009 |
43 | 43 | ||||||
| Series D preferred securities, $0.01 par value per share, $913,000 liquidation preference, non-cumulative, 913 shares authorized, issued and outstanding in 2010 and 2009 |
- | - | ||||||
| Common stock, $0.01 par value, 100,000,000 shares authorized, 99,999,900 shares issued and outstanding in 2010 and 2009 |
1,000 | 1,000 | ||||||
| Additional paid-in capital |
18,526,608 | 18,526,608 | ||||||
| Retained earnings (deficit) |
(406,478) | (193,028) | ||||||
| Total stockholders’ equity |
18,121,873 | 18,335,323 | ||||||
| Total liabilities and stockholders’ equity |
$18,127,960 | 18,339,045 | ||||||
67
Table of Contents
Condensed Statement of Cash Flows
|
Years ended December 31, |
||||||||||||
| (in thousands) | 2010 | 2009 | 2008 | |||||||||
| (Successor) | (Successor) | (Predecessor) | ||||||||||
| Cash flows from operating activities: |
||||||||||||
| Net income |
$ 769,416 | 867,650 | 767,276 | |||||||||
| Adjustments to reconcile net income to net cash provided (used) by operating activities |
||||||||||||
| (Accretion) amortization of discount and premium on loans |
(187,990) | (126,903) | 1,510 | |||||||||
| Equity in undistributed net income of subsidiaries |
(191,688) | (169,030) | (207,366) | |||||||||
| Provision for credit losses |
274,096 | 165,912 | 248,459 | |||||||||
| Accounts receivable/payable - affiliates, net |
(25,264) | 2,235 | (195) | |||||||||
| Other assets and other liabilities, net |
11,967 | (818) | (2,611) | |||||||||
| Net cash provided by operating activities |
650,537 | 739,046 | 807,073 | |||||||||
| Cash flows from investing activities: |
||||||||||||
| Increase (decrease) in cash realized from |
||||||||||||
| Investment in subsidiaries, net |
220,209 | 234,619 | 234,682 | |||||||||
| Loans: |
||||||||||||
| Purchases |
(1,801,826) | (2,728,467) | (2,802,333) | |||||||||
| Proceeds from payments and sales |
3,007,492 | 2,808,484 | 2,616,639 | |||||||||
| Net cash provided by investing activities |
1,425,875 | 314,636 | 48,988 | |||||||||
| Cash flows from financing activities: |
||||||||||||
| Decrease in cash realized from |
||||||||||||
| Cash dividends paid |
(982,866) | (1,060,678) | (988,229) | |||||||||
| Net cash used by financing activities |
(982,866) | (1,060,678) | (988,229) | |||||||||
| Net change in cash and cash equivalents |
1,093,546 | (6,996) | (132,168) | |||||||||
| Cash and cash equivalents at beginning of period |
521,947 | 528,943 | 661,111 | |||||||||
| Cash and cash equivalents at end of period |
$ 1,615,493 | 521,947 | 528,943 | |||||||||
| Supplemental cash flow disclosures: |
||||||||||||
| Cash paid for interest |
$ - | 346 | 3,171 | |||||||||
| Cash paid for income taxes |
- | 3,033 | 1,985 | |||||||||
| Change in noncash items: |
||||||||||||
| Loan payments, net, settled through affiliate |
(5,616) | (4,031) | 44,742 | |||||||||
| Transfers from loans to foreclosed assets
|
|
10,536
|
|
|
3,455
|
(1)
|
|
3,607
|
(1)
| |||
(1) Revised to correct previously reported amounts.
68
Table of Contents
Pursuant to the requirements of Section 13 or 15(d) of the Securities Exchange Act of 1934, the registrant has duly caused this report to be signed on its behalf by the undersigned, thereunto duly authorized.
| WACHOVIA PREFERRED FUNDING CORP. | ||||
| By: | /s/ RICHARD D. LEVY | |||
| Richard D. Levy Executive Vice President and Controller (Principal Accounting Officer) | ||||
Date: March 23, 2011
Pursuant to the requirements of the Securities Exchange Act of 1934, this report has been signed below by the following persons on behalf of the registrant and in the capacities indicated and on the date indicated.
| Signature |
Capacity | |
| MARK C. OMAN* |
President, Chief Executive Officer and Director, Wachovia Preferred Funding Corp. (Principal Executive Officer) | |
| Mark C. Oman | ||
| TIMOTHY J. SLOAN* |
Senior Executive Vice President and Chief Financial Officer, Wachovia Preferred Funding Corp. (Principal Financial Officer) | |
| Timothy J. Sloan | ||
| RICHARD D. LEVY* |
Executive Vice President and Controller, Wachovia Preferred Funding Corp. (Principal Accounting Officer) | |
| Richard D. Levy | ||
| JAMES E. ALWARD* |
Director | |
| James E. Alward | ||
| HOWARD T. HOOVER* |
Director | |
| Howard T. Hoover | ||
| CHARLES F. JONES* |
Director | |
| Charles F. Jones | ||
| * By Ross E. Jeffries, Jr., Attorney-in-Fact | ||
| /S/ Ross E. Jeffries, Jr. |
||
| Ross E. Jeffries, Jr. | ||
Date: March 23, 2011
69
Table of Contents
| Exhibit No. |
Description |
Location | ||
| (3)(a) | Certificate of Incorporation. | Incorporated by reference to Exhibit (3)(a) to Wachovia Funding’s Registration Statement on Form S-11 No. 333-99847. | ||
| (3)(b) | Form of Certificates of Designations for Series A, B, C and D preferred securities. | Incorporated by reference to Exhibit (3)(b) to Wachovia Funding’s Registration Statement on Form S-11 No. 333-99847. | ||
| (3)(c) | Form of Bylaws. | Incorporated by reference to Exhibit (3)(c) to Wachovia Funding’s Registration Statement on Form S-11 No. 333-99847. | ||
| (10)(a) | Form of Loan Participation Agreement and Agreement for Contribution between the Bank and Wachovia Preferred Holding. | Incorporated by reference to Exhibit (10)(a) to Wachovia Funding’s Registration Statement on Form S-11 No. 333-99847. | ||
| (10)(b) | Form of Loan Participation Assignment Agreement between Wachovia Preferred Holding and Wachovia Funding. | Incorporated by reference to Exhibit (10)(b) to Wachovia Funding’s Registration Statement on Form S-11 No. 333-99847. | ||
| (10)(c) | Form of Exchange Agreement among Wachovia, Wachovia Funding, and the Bank. | Incorporated by reference to Exhibit (10)(c) to Wachovia Funding’s Registration Statement on Form S-11 No. 333-99847. | ||
| (10)(d) | Promissory Note, dated as of September 1, 2002, between the Bank and Wachovia Funding. | Incorporated by reference to Exhibit (10)(d) to Wachovia Funding’s Registration Statement on Form S-11 No. 333-99847. | ||
| (12)(a) | Computations of Consolidated Ratios of Earnings to Fixed Charges. | Filed herewith. | ||
| (12)(b) | Computations of Consolidated Ratios of Earnings to Fixed Charges and Preferred Stock Dividends. | Filed herewith. | ||
| (21) | List of Subsidiaries. | Filed herewith. | ||
| (24) | Power of Attorney. | Filed herewith. | ||
| (31)(a) | Certification of principal executive officer pursuant to Section 302 of the Sarbanes-Oxley Act of 2002. | Filed herewith. | ||
| (31)(b) | Certification of principal financial officer pursuant to Section 302 of the Sarbanes-Oxley Act of 2002. | Filed herewith. | ||
| (32)(a) | Certification pursuant to 18 U.S.C. Section 1350, as adopted pursuant to Section 906 of the Sarbanes-Oxley Act of 2002. | Filed herewith. | ||
| (32)(b) | Certification pursuant to 18 U.S.C. Section 1350, as adopted pursuant to Section 906 of the Sarbanes-Oxley Act of 2002. | Filed herewith. | ||
| (99) | Wells Fargo & Company Supplementary Consolidating Financial Information. | Filed herewith. | ||
70