Attached files
| file | filename |
|---|---|
| 8-K - FORM 8-K - TUCSON ELECTRIC POWER CO | c14453e8vk.htm |
Exhibit 99.1
| UniSource Energy Corporation March 23-24, 2011 NYSE: UNS |
| Contact Information & Safe Harbor Investor Relations Contact Information M. Jo Smith, Director Chris Norman, Lead Analyst (520) 884.3650 (520) 884.3649 josmith@uns.com cnorman@uns.com Investor Information http://ir.uns.com Safe Harbor and Non-GAAP Measures This document contains forward-looking information that involves risks and uncertainties, that include, but are not limited to: state and federal regulatory and legislative decisions and actions; regional economic and market conditions which could affect customer growth and energy usage; weather variations affecting energy usage; the cost of debt and equity capital and access to capital markets; the performance of the stock market and changing interest rate environment, which affect the value of the company's pension and other postretirement benefit plan assets and the related contribution requirements and expense; unexpected increases in O&M expense; resolution of pending litigation matters; changes in accounting standards; changes in critical accounting estimates; the ongoing restructuring of the electric industry; changes to long-term contracts; the cost of fuel and power supplies; performance of TEP's generating plants; and other factors listed in UniSource Energy's Form 10-K and 10-Q filings with the Securities and Exchange Commission. The preceding factors may cause future results to differ materially from historical results or from outcomes currently expected by UniSource Energy. The Company's press releases and other communications may include certain non-Generally Accepted Accounting Principles (GAAP) financial measures. A "non-GAAP financial measure" is defined as a numerical measure of a company's financial performance, financial position or cash flows that excludes (or includes) amounts that are included in (or excluded from) the most directly comparable measure calculated and presented in accordance with GAAP in the Company's financial statements. Non-GAAP financial measures utilized by the Company include presentations of revenues, operating expenses, operating income and earnings (loss) per share. The Company uses these non-GAAP measures to evaluate the operations of the Company. Certain non-GAAP financial measures utilized by the Company exclude: the impact of non-recurring items: the effect of accounting changes or adjustments; expenses that are reimbursed by third parties; and other items. The Company's management believes that these non-GAAP financial measures provide useful information to investors by removing the effect of variances in GAAP reported results of operations that are not indicative of fundamental changes in the earnings or cash flow capacity of the Company's operations. Management also believes that the presentation of the non-GAAP financial measures is largely consistent with its past practice, as well as industry practice in general, and will enable investors and analysts to compare current non-GAAP measures with non-GAAP measures with respect to prior periods. 2 2 |

| Regulated Electric and Gas Utility Businesses 3 Largest Subsidiary of UNS 80% of Operating Revenues 81% of Total Assets Vertically Integrated Electric Utility 403,000 Electric Customers Gas & Electric T&D Businesses 146,000 Gas Customers 90,000 Electric Customers NYSE: UNS 2010 Operating Revenues: $1.5B Market Cap: $1.3B Enterprise Value: $3.1B 3 |
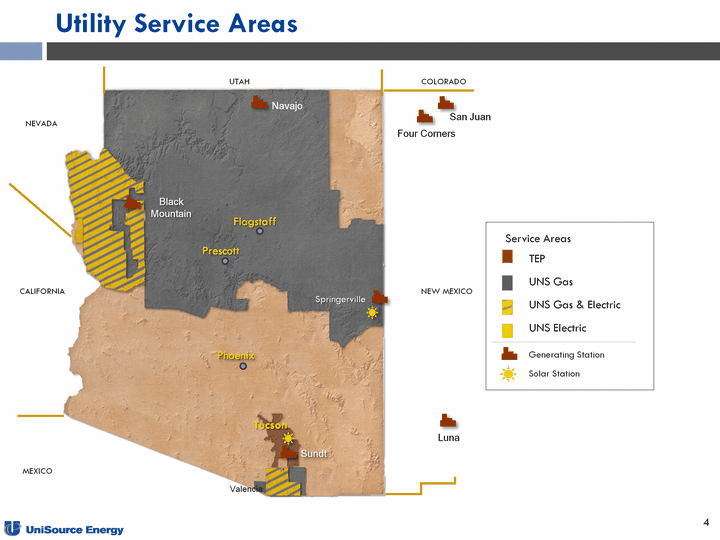
| Utility Service Areas Valencia Tucson San Juan Four Corners Luna Phoenix Flagstaff Prescott NEVADA UTAH COLORADO CALIFORNIA NEW MEXICO Navajo Springerville Black Mountain MEXICO Sundt Generating Station Solar Station Service Areas TEP UNS Gas UNS Gas & Electric UNS Electric 4 |
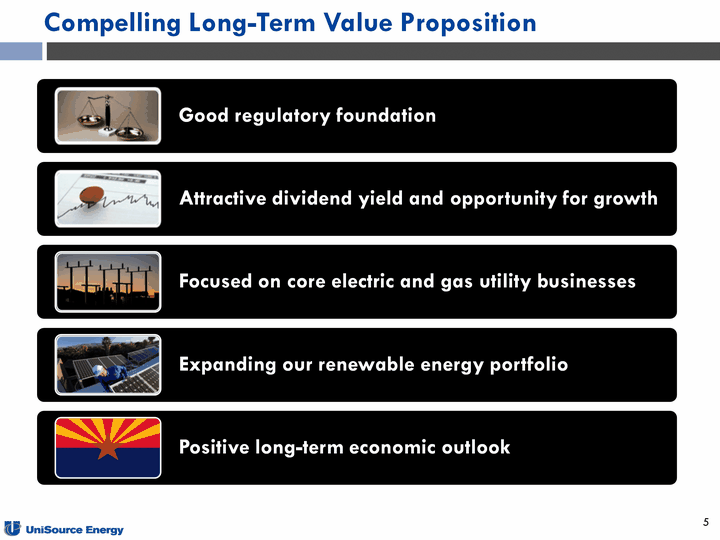
| Compelling Long-Term Value Proposition Compelling Long-Term Value Proposition 5 5 |
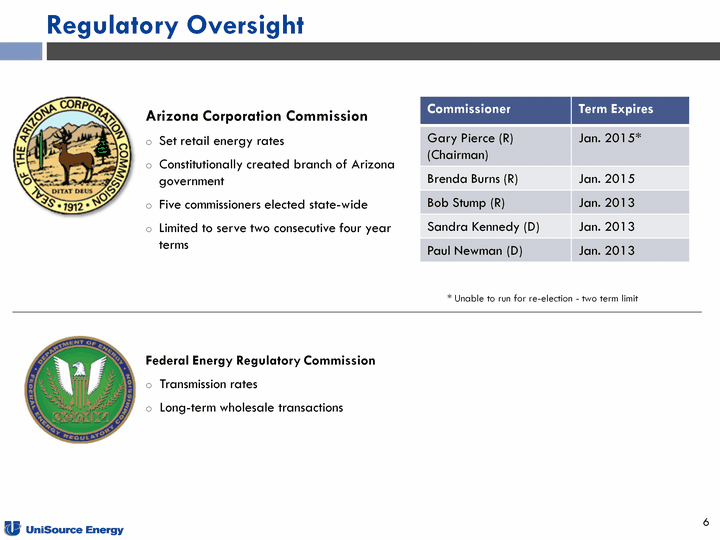
| Regulatory Oversight Arizona Corporation Commission Set retail energy rates Constitutionally created branch of Arizona government Five commissioners elected state-wide Limited to serve two consecutive four year terms 6 Commissioner Term Expires Gary Pierce (R)(Chairman) Jan. 2015* Brenda Burns (R) Jan. 2015 Bob Stump (R) Jan. 2013 Sandra Kennedy (D) Jan. 2013 Paul Newman (D) Jan. 2013 * Unable to run for re-election - two term limit Federal Energy Regulatory Commission Transmission rates Long-term wholesale transactions 6 |
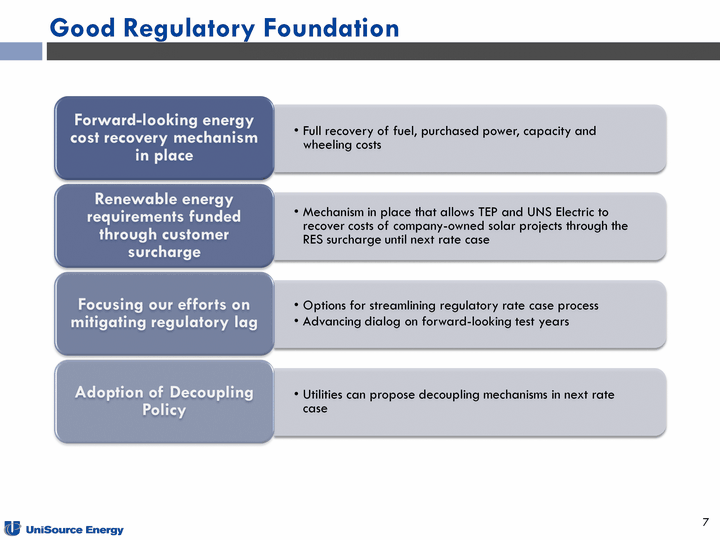
| Good Regulatory Foundation 7 |
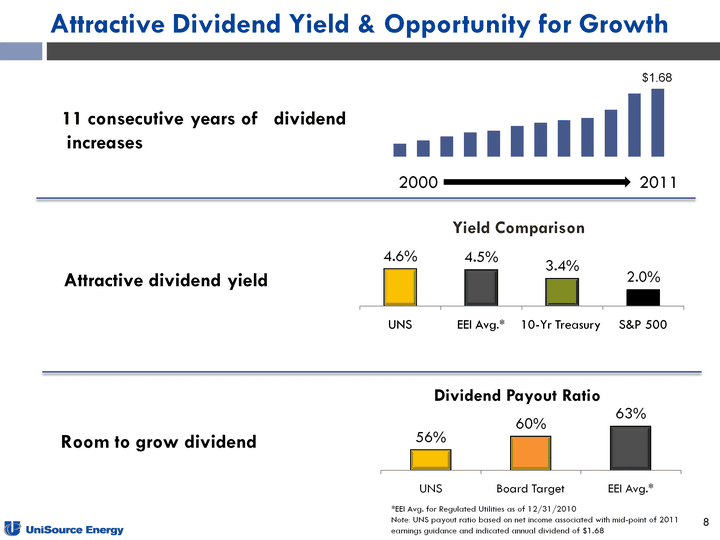
| Attractive Dividend Yield & Opportunity for Growth (CHART) Attractive dividend yield (CHART) Room to grow dividend 11 consecutive years of dividend increases 2000 2011 (CHART) *EEI Avg. for Regulated Utilities as of 12/31/2010 Note: UNS payout ratio based on net income associated with mid-point of 2011 earnings guidance and indicated annual dividend of $1.68 8 |

| Investing in Our Utility Businesses 9 1 A majority of capital investments are expected to be internally funded Capital expenditure estimates from 2010 Form 10-K. (CHART) (CHART) |
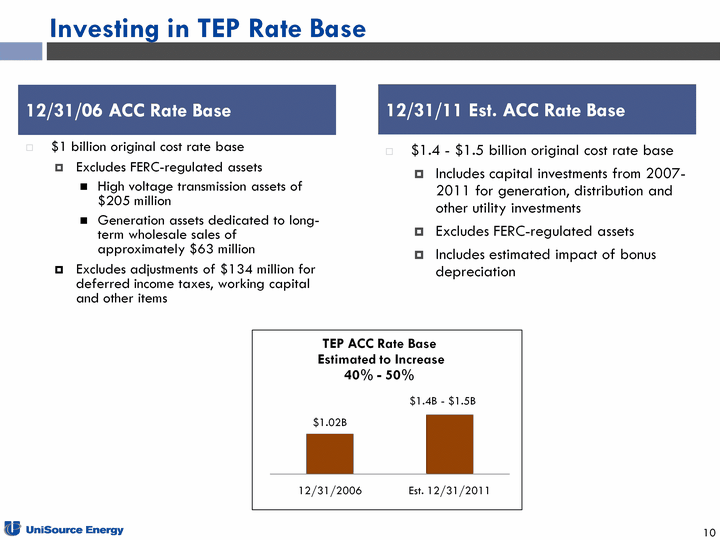
| Investing in TEP Rate Base 12/31/06 ACC Rate Base $1 billion original cost rate base Excludes FERC-regulated assets High voltage transmission assets of $205 million Generation assets dedicated to long- term wholesale sales of approximately $63 million Excludes adjustments of $134 million for deferred income taxes, working capital and other items 12/31/11 Est. ACC Rate Base $1.4 - $1.5 billion original cost rate base Includes capital investments from 2007- 2011 for generation, distribution and other utility investments Excludes FERC-regulated assets Includes estimated impact of bonus depreciation 10 (CHART) $1.4B - $1.5B |

| Investing in Community-Based Solar Projects Investing in Community-Based Solar Projects 11 $173 Million Sustainable Business Model Proven Technologies Cost Effective Supportive of Our Communities |
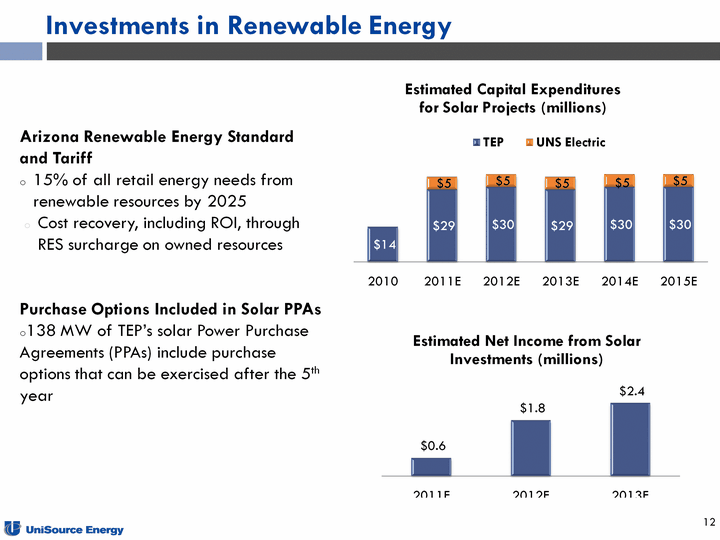
| Investments in Renewable Energy Arizona Renewable Energy Standard and Tariff 15% of all retail energy needs from renewable resources by 2025 Cost recovery, including ROI, through RES surcharge on owned resources Purchase Options Included in Solar PPAs 138 MW of TEP's solar Power Purchase Agreements (PPAs) include purchase options that can be exercised after the 5th year (CHART) (CHART) 12 |
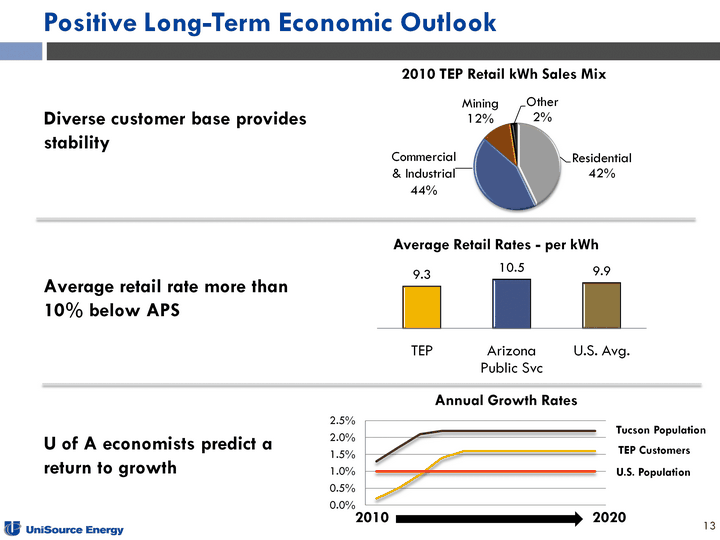
| Positive Long-Term Economic Outlook 13 (CHART) Average retail rate more than 10% below APS (CHART) Tucson Population TEP Customers U.S. Population 2010 2020 U of A economists predict a return to growth Diverse customer base provides stability |

| Supplemental Information 14 |
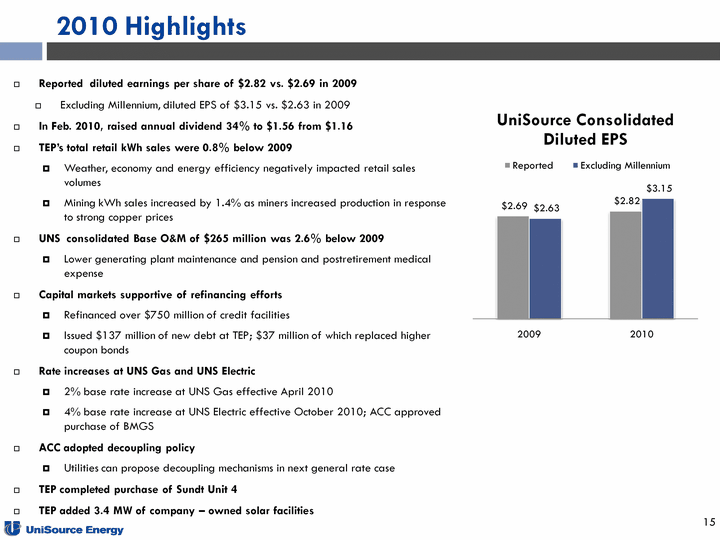
| 2010 Highlights Reported diluted earnings per share of $2.82 vs. $2.69 in 2009 Excluding Millennium, diluted EPS of $3.15 vs. $2.63 in 2009 In Feb. 2010, raised annual dividend 34% to $1.56 from $1.16 TEP's total retail kWh sales were 0.8% below 2009 Weather, economy and energy efficiency negatively impacted retail sales volumes Mining kWh sales increased by 1.4% as miners increased production in response to strong copper prices UNS consolidated Base O&M of $265 million was 2.6% below 2009 Lower generating plant maintenance and pension and postretirement medical expense Capital markets supportive of refinancing efforts Refinanced over $750 million of credit facilities Issued $137 million of new debt at TEP; $37 million of which replaced higher coupon bonds Rate increases at UNS Gas and UNS Electric 2% base rate increase at UNS Gas effective April 2010 4% base rate increase at UNS Electric effective October 2010; ACC approved purchase of BMGS ACC adopted decoupling policy Utilities can propose decoupling mechanisms in next general rate case TEP completed purchase of Sundt Unit 4 TEP added 3.4 MW of company - owned solar facilities 15 (CHART) |
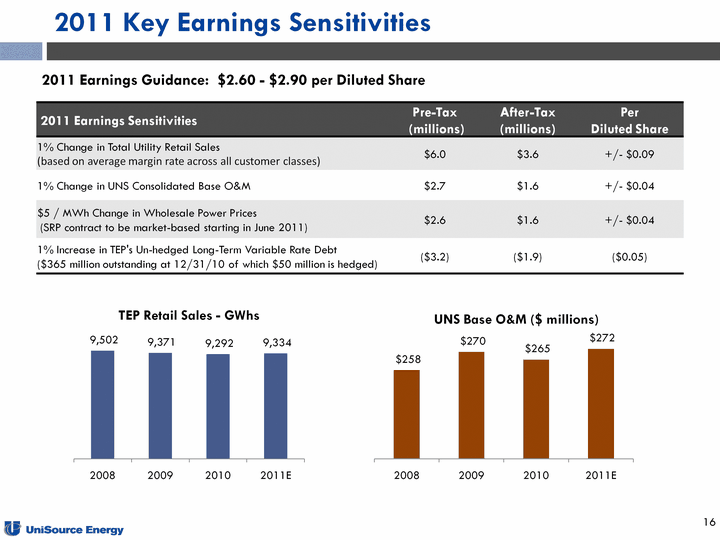
| 2011 Key Earnings Sensitivities 2011 Key Earnings Sensitivities (CHART) (CHART) 2011 Earnings Guidance: $2.60 - $2.90 per Diluted Share 16 |
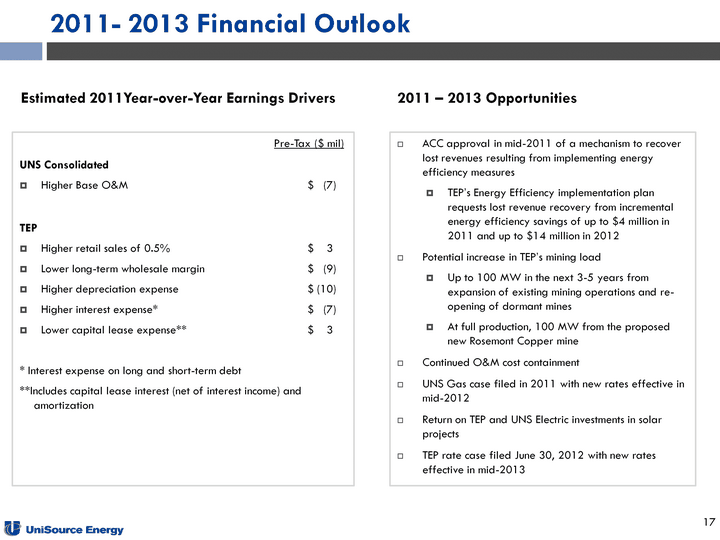
| 2011- 2013 Financial Outlook ACC approval in mid-2011 of a mechanism to recover lost revenues resulting from implementing energy efficiency measures TEP's Energy Efficiency implementation plan requests lost revenue recovery from incremental energy efficiency savings of up to $4 million in 2011 and up to $14 million in 2012 Potential increase in TEP's mining load Up to 100 MW in the next 3-5 years from expansion of existing mining operations and re- opening of dormant mines At full production, 100 MW from the proposed new Rosemont Copper mine Continued O&M cost containment UNS Gas case filed in 2011 with new rates effective in mid-2012 Return on TEP and UNS Electric investments in solar projects TEP rate case filed June 30, 2012 with new rates effective in mid-2013 Estimated 2011Year-over-Year Earnings Drivers 2011 - 2013 Opportunities 17 Pre-Tax ($ mil) UNS Consolidated Higher Base O&M $ (7) TEP Higher retail sales of 0.5% $ 3 Lower long-term wholesale margin $ (9) Higher depreciation expense $ (10) Higher interest expense* $ (7) Lower capital lease expense** $ 3 * Interest expense on long and short-term debt **Includes capital lease interest (net of interest income) and amortization |
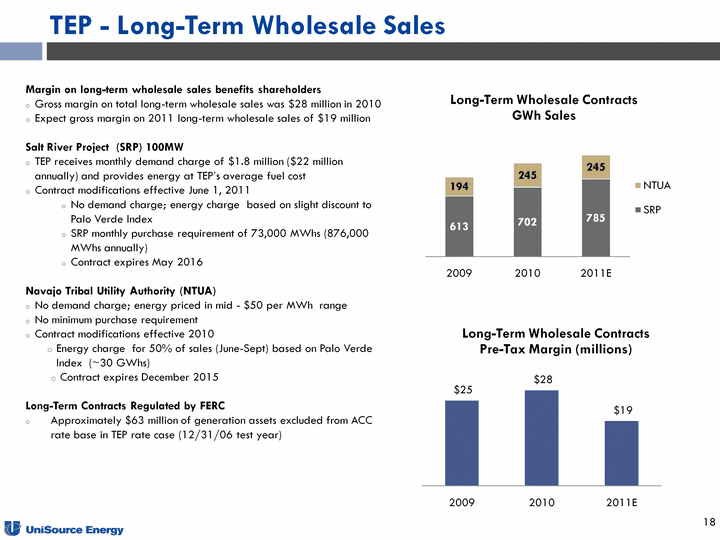
| TEP - Long-Term Wholesale Sales Margin on long-term wholesale sales benefits shareholders Gross margin on total long-term wholesale sales was $28 million in 2010 Expect gross margin on 2011 long-term wholesale sales of $19 million Salt River Project (SRP) 100MW TEP receives monthly demand charge of $1.8 million ($22 million annually) and provides energy at TEP's average fuel cost Contract modifications effective June 1, 2011 No demand charge; energy charge based on slight discount to Palo Verde Index SRP monthly purchase requirement of 73,000 MWhs (876,000 MWhs annually) Contract expires May 2016 Navajo Tribal Utility Authority (NTUA) No demand charge; energy priced in mid - $50 per MWh range No minimum purchase requirement Contract modifications effective 2010 Energy charge for 50% of sales (June-Sept) based on Palo Verde Index (~30 GWhs) Contract expires December 2015 Long-Term Contracts Regulated by FERC Approximately $63 million of generation assets excluded from ACC rate base in TEP rate case (12/31/06 test year) 18 (CHART) (CHART) |
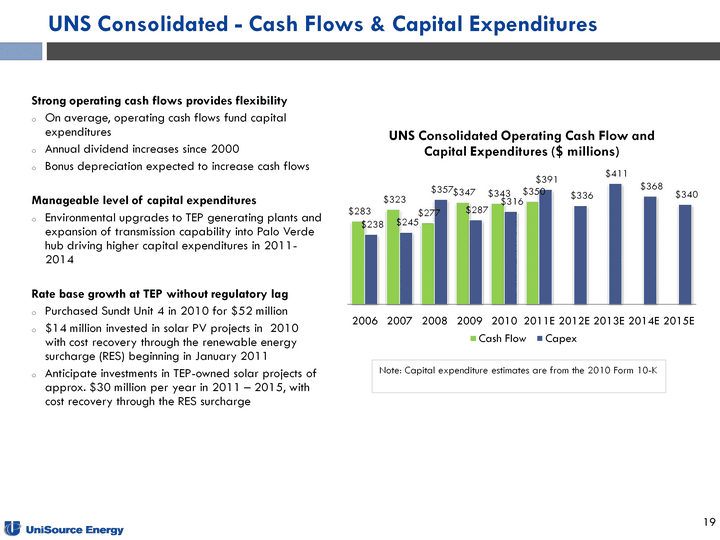
| UNS Consolidated - Cash Flows & Capital Expenditures Strong operating cash flows provides flexibility On average, operating cash flows fund capital expenditures Annual dividend increases since 2000 Bonus depreciation expected to increase cash flows Manageable level of capital expenditures Environmental upgrades to TEP generating plants and expansion of transmission capability into Palo Verde hub driving higher capital expenditures in 2011- 2014 Rate base growth at TEP without regulatory lag Purchased Sundt Unit 4 in 2010 for $52 million $14 million invested in solar PV projects in 2010 with cost recovery through the renewable energy surcharge (RES) beginning in January 2011 Anticipate investments in TEP-owned solar projects of approx. $30 million per year in 2011 - 2015, with cost recovery through the RES surcharge Note: Capital expenditure estimates are from the 2010 Form 10-K (CHART) 19 |

| Renewable Energy Leadership Arizona Renewable Energy Standard and Tariff RES requires 15% of all retail energy needs from renewable resources by 2025 Customer surcharge funds above market cost renewable energy Proposals to invest $173 million in solar photovoltaic projects over next 5 years TEP ACC approved 2011 investment of up to $28 million for ~ 7 MW Cost recovery, including ROI, through RES surcharge UNS Electric ACC approved annual investments of up to $5 million for ~1.25 MW from 2011-2014 Purchase Options Included in Solar PPAs 138 MW of TEP's solar Power Purchase Agreements (PPAs) include purchase options that can be exercised after the 5th year (CHART) 20 |
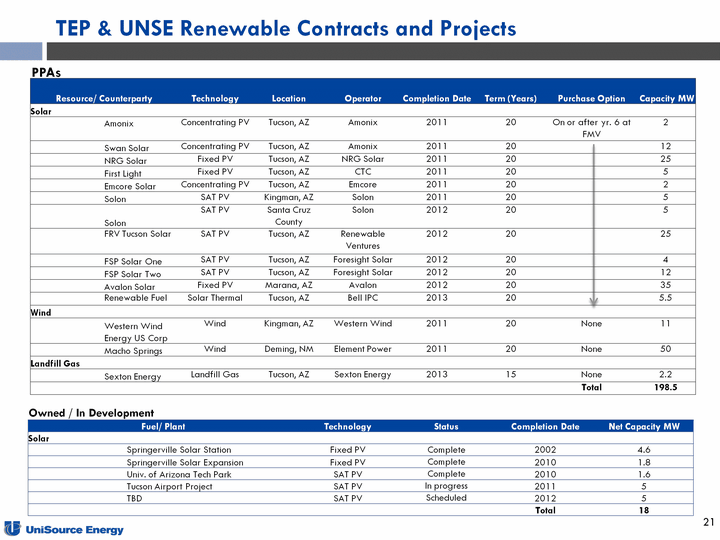
| TEP & UNSE Renewable Contracts and Projects PPAs Owned / In Development Resource/ Counterparty Resource/ Counterparty Technology Location Operator Completion Date Term (Years) Purchase Option Capacity MW Solar Solar Amonix Concentrating PV Tucson, AZ Amonix 2011 20 On or after yr. 6 at FMV 2 Swan Solar Concentrating PV Tucson, AZ Amonix 2011 20 12 NRG Solar Fixed PV Tucson, AZ NRG Solar 2011 20 25 First Light Fixed PV Tucson, AZ CTC 2011 20 5 Emcore Solar Concentrating PV Tucson, AZ Emcore 2011 20 2 Solon SAT PV Kingman, AZ Solon 2011 20 5 Solon SAT PV Santa Cruz County Solon 2012 20 5 FRV Tucson Solar SAT PV Tucson, AZ Renewable Ventures 2012 20 25 FSP Solar One SAT PV Tucson, AZ Foresight Solar 2012 20 4 FSP Solar Two SAT PV Tucson, AZ Foresight Solar 2012 20 12 Avalon Solar Fixed PV Marana, AZ Avalon 2012 20 35 Renewable Fuel Solar Thermal Tucson, AZ Bell IPC 2013 20 5.5 Wind Wind Western Wind Energy US Corp Wind Kingman, AZ Western Wind 2011 20 None 11 Macho Springs Wind Deming, NM Element Power 2011 20 None 50 Landfill Gas Landfill Gas Sexton Energy Landfill Gas Tucson, AZ Sexton Energy 2013 15 None 2.2 Total 198.5 Fuel/ Plant Fuel/ Plant Technology Status Completion Date Net Capacity MW Solar Solar Springerville Solar Station Fixed PV Complete 2002 4.6 Springerville Solar Expansion Fixed PV Complete 2010 1.8 Univ. of Arizona Tech Park SAT PV Complete 2010 1.6 Tucson Airport Project SAT PV In progress 2011 5 TBD SAT PV Scheduled 2012 5 Total 18 21 |

| Energy Efficiency Standards and Decoupling ACC approved Electric and Gas Energy Efficiency Standards in 2010 Designed to require TEP, UNS Electric, UNS Gas and other affected utilities to implement cost effective demand side management programs Electric EE Standards target total retail kWh savings in 2011 of 1.25% of 2010 sales Targeted kWh savings increase annually in subsequent years until they reach a cumulative annual reduction in retail kWh sales of 22% by 2020 Gas EE Standards target total retail therm savings in 2011 of 0.5% of 2010 sales Targeted savings increase annually in subsequent years until they reach a cumulative annual reduction in retail therm sales of 6% by 2020 ACC Decoupling Policy Adopted in December 2010 Designed to encourage energy conservation by restructuring utility rates to separate the recovery of fixed costs from the level of energy consumed Policy indicates that revenue per customer decoupling may be well suited for Arizona as it responds to customer growth Utilities can propose decoupling mechanism in next general rate case application TEP requested interim mechanism that would allow recovery of lost revenues resulting from the implementation of energy efficiency measures Requested recovery of up to $4 million in 2011 and up to $14 million in 2012 22 |

| TEP - Diverse Retail Customer Base TEP - Diverse Retail Customer Base TEP - Diverse Retail Customer Base 2010 Retail kWh Sales Mix University of Arizona Davis Monthan Air Force Base Freeport McMoRan (CHART) Customer Sector Freeport McMoRan Copper Mining Asarco Copper Mining University of Arizona Education Fort Huachuca, US Army Intelligence Center Military Raytheon Defense IBM Technology Davis Monthan Air Force Base Military Arizona Portland Cement Construction Liquid Air Manufacturing Largest Retail Customers 2010 Retail Margin Revenues Total = $551MM (CHART) 23 |

| TEP - Retail Customers Customer base continues to grow at a modest pace Long-term outlook positive with a customer growth rate of more than 1.5% by 2014 Expect local economy to gradually improve Positive indicators in home sales and inventories Economists at the University of Arizona consider the recession over in Arizona and expect growth to gradually resume Tucson unemployment rate 8.3% (as of Dec. 2010) vs. national average of 9.0% (as of Jan. 2011) Rate of Growth in Retail Customer Base (CHART) (CHART) Weak economic conditions impacted sales Recession resulted in year-over-year sales declines since 2008 In 2010, sales to mining customers increased 1.4% Modest growth expected to return in 2011 Anticipate increase in sales to mining and commercial customers in 2011 Retail sales in 2012 and 2013 expected to increase 1.5% - 2.5% 24 |
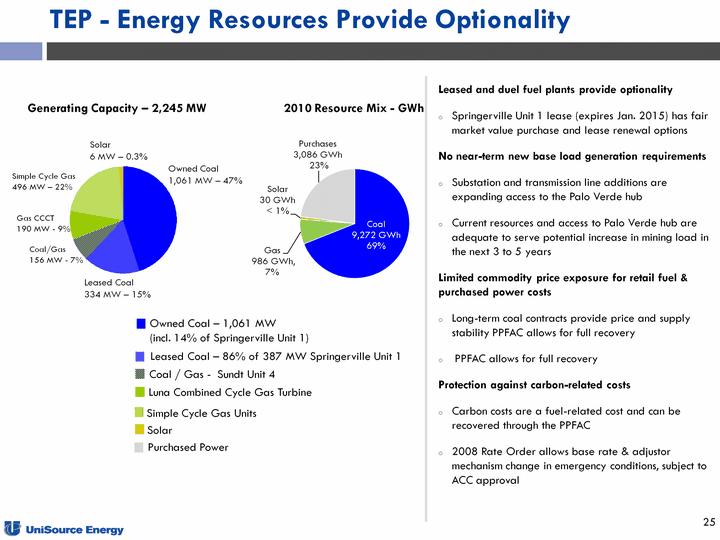
| TEP - Energy Resources Provide Optionality 2010 Resource Mix - GWh Generating Capacity - 2,245 MW Owned Coal - 1,061 MW (incl. 14% of Springerville Unit 1) Luna Combined Cycle Gas Turbine Purchased Power Simple Cycle Gas Units Gas CCCT 190 MW - 9% Coal/Gas 156 MW - 7% Simple Cycle Gas 496 MW - 22% Solar 6 MW - 0.3% Leased Coal - 86% of 387 MW Springerville Unit 1 Coal / Gas - Sundt Unit 4 Leased Coal 334 MW - 15% 334 MW - 15% 334 MW - 15% Solar (CHART) Owned Coal 1,061 MW - 47% Leased and duel fuel plants provide optionality Springerville Unit 1 lease (expires Jan. 2015) has fair market value purchase and lease renewal options No near-term new base load generation requirements Substation and transmission line additions are expanding access to the Palo Verde hub Current resources and access to Palo Verde hub are adequate to serve potential increase in mining load in the next 3 to 5 years Limited commodity price exposure for retail fuel & purchased power costs Long-term coal contracts provide price and supply stability PPFAC allows for full recovery PPFAC allows for full recovery Protection against carbon-related costs Carbon costs are a fuel-related cost and can be recovered through the PPFAC 2008 Rate Order allows base rate & adjustor mechanism change in emergency conditions, subject to ACC approval 25 |
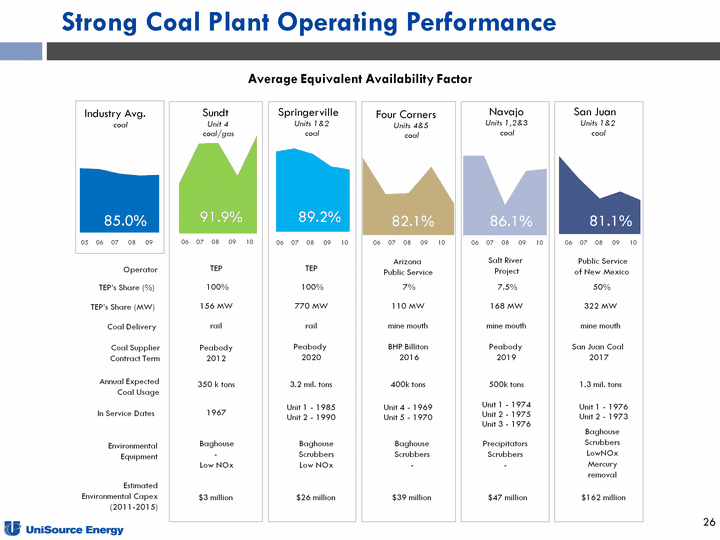
| Strong Coal Plant Operating Performance Average Equivalent Availability Factor Baghouse - Low NOx Environmental Equipment Operator TEP's Share (MW) Coal Delivery In Service Dates TEP's Share (%) TEP 156 MW rail 1967 100% TEP 770 MW rail Unit 1 - 1985 Unit 2 - 1990 100% Arizona Public Service 110 MW mine mouth Unit 4 - 1969 Unit 5 - 1970 7% Salt River Project 168 MW mine mouth Unit 1 - 1974 Unit 2 - 1975 Unit 3 - 1976 7.5% Public Service of New Mexico 322 MW mine mouth Unit 1 - 1976 Unit 2 - 1973 50% Coal Supplier Contract Term Peabody 2020 BHP Billiton 2016 Peabody 2019 San Juan Coal 2017 Peabody 2012 Annual Expected Coal Usage 350 k tons 3.2 mil. tons 400k tons 500k tons 1.3 mil. tons Baghouse Scrubbers Low NOx Baghouse Scrubbers - Precipitators Scrubbers - Baghouse Scrubbers LowNOx Mercury removal Sundt Unit 4 coal/gas Navajo Units 1,2&3 coal Industry Avg. coal Four Corners Units 4&5 coal San Juan Units 1&2 coal Springerville Units 1&2 coal (CHART) 93% 87% 87% 83% 05 06 07 08 09 91.9% (CHART) 89.2% (CHART) 82.1% (CHART) 86.1% (CHART) 81.1% (CHART) 85.0% 06 07 08 09 10 26 06 07 08 09 10 06 07 08 09 10 06 07 08 09 10 06 07 08 09 10 Estimated Environmental Capex (2011-2015) $3 million $26 million $39 million $47 million $162 million |
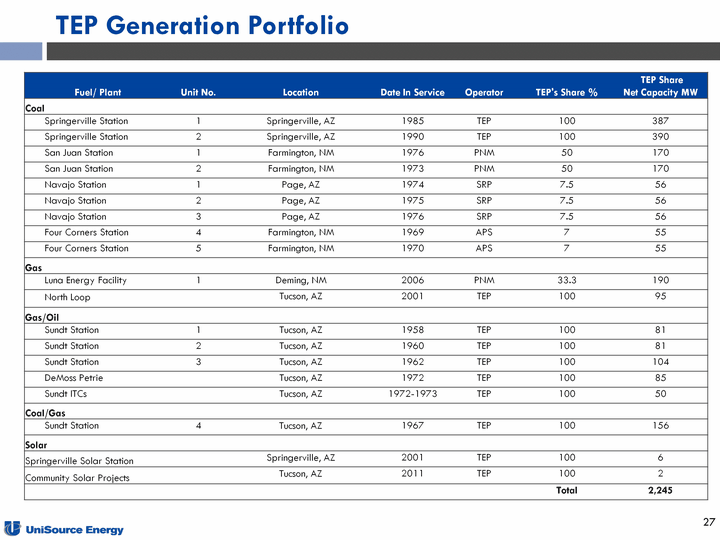
| TEP Generation Portfolio Fuel/ Plant Fuel/ Plant Unit No. Location Date In Service Operator TEP's Share % TEP Share Net Capacity MW Coal Coal Springerville Station 1 Springerville, AZ 1985 TEP 100 387 Springerville Station 2 Springerville, AZ 1990 TEP 100 390 San Juan Station 1 Farmington, NM 1976 PNM 50 170 San Juan Station 2 Farmington, NM 1973 PNM 50 170 Navajo Station 1 Page, AZ 1974 SRP 7.5 56 Navajo Station 2 Page, AZ 1975 SRP 7.5 56 Navajo Station 3 Page, AZ 1976 SRP 7.5 56 Four Corners Station 4 Farmington, NM 1969 APS 7 55 Four Corners Station 5 Farmington, NM 1970 APS 7 55 Gas Gas Luna Energy Facility 1 Deming, NM 2006 PNM 33.3 190 North Loop Tucson, AZ 2001 TEP 100 95 Gas/Oil Gas/Oil Sundt Station 1 Tucson, AZ 1958 TEP 100 81 Sundt Station 2 Tucson, AZ 1960 TEP 100 81 Sundt Station 3 Tucson, AZ 1962 TEP 100 104 DeMoss Petrie Tucson, AZ 1972 TEP 100 85 Sundt ITCs Tucson, AZ 1972-1973 TEP 100 50 Coal/Gas Coal/Gas Sundt Station 4 Tucson, AZ 1967 TEP 100 156 Solar Solar Springerville Solar Station Springerville Solar Station Springerville, AZ 2001 TEP 100 6 Community Solar Projects Community Solar Projects Tucson, AZ 2011 TEP 100 2 Total 2,245 27 |
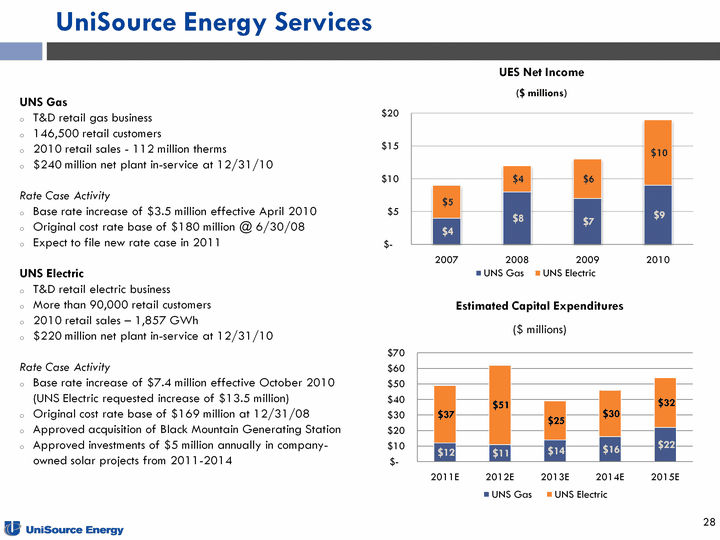
| UniSource Energy Services UNS Gas T&D retail gas business 146,500 retail customers 2010 retail sales - 112 million therms $240 million net plant in-service at 12/31/10 Rate Case Activity Base rate increase of $3.5 million effective April 2010 Original cost rate base of $180 million @ 6/30/08 Expect to file new rate case in 2011 UNS Electric T&D retail electric business More than 90,000 retail customers 2010 retail sales - 1,857 GWh $220 million net plant in-service at 12/31/10 Rate Case Activity Base rate increase of $7.4 million effective October 2010 (UNS Electric requested increase of $13.5 million) Original cost rate base of $169 million at 12/31/08 Approved acquisition of Black Mountain Generating Station Approved investments of $5 million annually in company- owned solar projects from 2011-2014 UES Net Income ($ millions) Estimated Capital Expenditures ($ millions) (CHART) (CHART) 28 |

| Credit Ratings Sufficient lines of credit TEP - $200 million; UES - $100 million; UNS - $125 million; mature in Nov. 2014 Credit ratings TEP received one notch upgrade from Fitch in Sept. 2010 TEP Fitch Secured BBB Unsecured BBB- Issuer BB+ Outlook S&P BBB+ BBB- BB+ Stable Moody's Baa1 Baa3 Baa3 Stable Stable UniSource Energy Moody's Ba1 Stable Secured Credit Facility Outlook UNS Electric Moody's Baa3 Stable Sr. Unsecured Notes (guaranteed) Outlook UNS Gas Moody's Baa3 Stable Sr. Unsecured Notes (guaranteed) Outlook 29 |

| Long-Term Debt Summary Balances as of 12/31/10 Rates as of 3/21/11 Interest Curr. Balance Issue Maturity Current Facilities Debt Issue Rate (in millions) Date Date Call Price Security Financed TEP Unsec. Ind. Dev. Bonds (Tax-Exempt) 2009 Pima A 4.950% 80 Oct-09 Oct-20 N/C Unsecured San Juan PC 2010 Coconino A 0.32% 37 Dec-10 Oct-32 100% Navajo PC 2009 Coconino A 5.125% 15 Oct-09 Oct-32 N/C 10 Navajo PC 1997 Pima A 6.100% 22 Sep-97 Sep-25 100% Local T&D 1998 Apache A 5.850% 84 Mar-98 Mar-28 100% SGS 1 PC 1998 Apache B 5.875% 100 Mar-98 Mar-33 100% SGS 2 PC 1998 Apache C 5.850% 16 Mar-98 Mar-26 100% Local T&D Subtotal $ 638 Var. Rate Bonds (Tax-Exempt) 1982 Pima A - Irvington 0.26% 39 Oct-82 Oct-22 100% Local T&D / Irvington 1982 Pima A 0.26% 40 Dec-82 Dec-22 100% Local T&D / 4 Corners PC 1983 Apache A 0.23% 100 Dec-83 Dec-18 100% SGS 2 1983 Apache B (Tranche A) 0.26% 80 Dec-83 Dec-18 100% SGS 2 1983 Apache C (Tranche A) 0.23% 50 Dec-83 Dec-18 100% SGS 2 1985 Apache A 0.23% 20 Dec-85 Dec-20 100% SGS 2 Subtotal $ 366 TEP TOTAL $ 1,004 2008 Pima A 6.375% 91 Mar-08 Sep-29 N/C 5 Local T&D UES UNS Gas Unsecured Notes 6.230% 50 Aug-03 Aug-11 MW + 50 Unsecured General Purpose UNS Gas Unsecured Notes 6.230% 50 Aug-03 Aug-15 MW + 50 General Purpose UNS Electric Unsecured Notes 6.500% 50 Aug-08 Aug-15 MW + 50 General Purpose UES TOTAL $ 200 UniSource Stand-Alone Sr. Unsec. Convertible Notes 4.500% 150 Mar-05 Mar-35 Par Unsecured General Purpose Revolving Credit Facility LIBOR + 3.00% 27 Nov-10 Nov-14 Par Unsecured General Purpose UNISOURCE STAND-ALONE TOTAL $ 177 UNISOURCE CONSOLIDATED TOTAL $1,410 2008 Pima B 5.750% 130 Jun-08 Sep-29 N/C 5 Local T&D UNS Electric Unsecured Notes 7.100% 50 Aug-08 Aug-23 MW + 50 General Purpose Secured UED Term Loan LIBOR + 3% 29 Feb-10 Mar-12 Par Black Mountain Mortgage Bonds 30 2010 Pima A 5.250% $ 100 Oct-10 Oct-40 N/C 10 Local T&D |
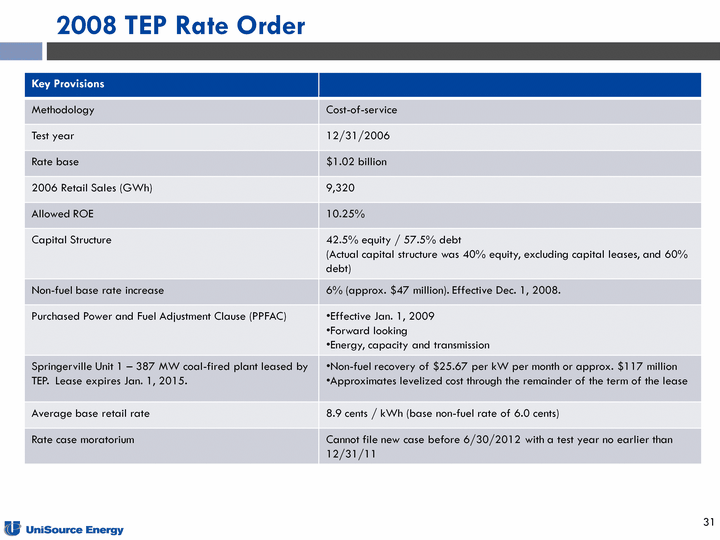
| 2008 TEP Rate Order Key Provisions Methodology Cost-of-service Test year 12/31/2006 Rate base $1.02 billion 2006 Retail Sales (GWh) 9,320 Allowed ROE 10.25% Capital Structure 42.5% equity / 57.5% debt (Actual capital structure was 40% equity, excluding capital leases, and 60% debt) Non-fuel base rate increase 6% (approx. $47 million). Effective Dec. 1, 2008. Purchased Power and Fuel Adjustment Clause (PPFAC) Effective Jan. 1, 2009Forward lookingEnergy, capacity and transmission Springerville Unit 1 - 387 MW coal-fired plant leased by TEP. Lease expires Jan. 1, 2015. Non-fuel recovery of $25.67 per kW per month or approx. $117 millionApproximates levelized cost through the remainder of the term of the lease Average base retail rate 8.9 cents / kWh (base non-fuel rate of 6.0 cents) Rate case moratorium Cannot file new case before 6/30/2012 with a test year no earlier than 12/31/11 31 |
