Attached files
UNITED STATES
SECURITIES AND EXCHANGE COMMISSION
Washington, D.C. 20549
FORM 10-K
(Mark one)
[X] ANNUAL REPORT PURSUANT TO SECTION 13 OR 15(d) OF THE SECURITIES EXCHANGE ACT OF 1934
For the fiscal year ended December 31, 2010
OR
[ ] TRANSITION REPORT PURSUANT TO SECTION 13 OR 15(d) OF THE SECURITIES EXCHANGE ACT OF 1934
REVETT MINERALS INC.
(Exact name of registrant as specified in its charter)
| Canada | Not Applicable |
| (State or other jurisdiction of incorporation | (IRS Employer Identification No.) |
| or organization) |
11115 East Montgomery, Suite G
Spokane Valley,
Washington 99206
(Address of principal executive offices)
Registrant's telephone number, including area code: (509) 921-2294
Securities registered pursuant to Section 12(b) of the Act: None
Securities registered under Section 12(g) of the Act:
Common Stock
Title of each class
Indicate by check mark if the Registrant is a well-known
seasoned issuer, as defined in Rule 405 of the Securities Act.
Yes [
] No [X]
Indicate by check mark if the Registrant is not required to file
reports pursuant to Section 13 or Section 15(d) of the Act.
Yes [
] No [X]
Indicate by check mark whether the Registrant (1) has filed all
reports required to be filed by Section 13 or 15(d) of the Securities Exchange
Act of 1934 during the preceding 12 months (or for such shorter period that the
Registrant was required to file such reports), and (2) has been subject to such
filing requirements for the past 90 days.
Yes [X] No
[ ]
Indicate by check mark if disclosure of delinquent filers pursuant to Item 405 of Regulation S-K is not contained herein, and will not be contained, to the best of Registrant’s knowledge, in definitive proxy or information statements incorporated by reference in Part III of this Form 10-K or any amendment to this Form 10-K. [ ]
Indicate by check mark whether the Registrant is a large accelerated filer, an accelerated filer, or a non-accelerated filer. See definition of “accelerated filer and large accelerated filer” in Rule 12b-2 of the Exchange Act.
Small Reporting Company [ ] Large accelerated filer [ ] Accelerated filer [ ] Non-accelerated filer [X]
Indicate by check mark whether the Registrant is a shell company
(as defined in Rule 12b-2 of the Exchange Act).
Yes [
] No [X]
The aggregate market value of the voting stock held by non-affiliates of the Registrant, computed by reference to the closing price at which such equity was last sold on the Toronto Stock Exchange, was approximately $39.5 million as of June 30, 2010, the last business day of the registrant’s most recently completed second fiscal quarter.
Shares of common stock outstanding at March 22, 2011: 33,516,884.
Documents Incorporated by Reference: None
TABLE OF CONTENTS
(ii)
Special Note on Forward-Looking Statements
Certain statements contained in this report (including information incorporated by reference) are “forward-looking statements” and are intended to be covered by the safe harbor provided for under Section 27A of the Securities Act of 1933, as amended, and Section 21E of the Securities Exchange Act of 1934, as amended. Our forward-looking statements include our current expectations and projections about future results, performance, prospects and opportunities. We have tried to identify these forward-looking statements by using words such as “may,” “might,” “will,” “expect,” “anticipate,” “believe,” “could,” “intend,” “plan,” “estimate” and similar expressions. These forward-looking statements are based on information currently available to us and are expressed in good faith and believed to have a reasonable basis. However, our forward-looking statements are subject to a number of risks, uncertainties and other factors that could cause our actual results, performance, prospects or opportunities to differ materially from those expressed in, or implied by, these forward-looking statements.
These risks, uncertainties and other factors include, but are not limited to, those set forth under Item 1A. — Business — Risk Factors. Given these risks and uncertainties, readers are cautioned not to place undue reliance on our forward-looking statements. Projections included in this Form 10-K have been prepared based on assumptions, which we believe to be reasonable, but not in accordance with United States generally accepted accounting principles (“GAAP”) or any guidelines of the Securities and Exchange Commission (“SEC”). Actual results will vary, perhaps materially, and we undertake no obligation to update the projections at any future date. You are strongly cautioned not to place undue reliance on such projections. All subsequent written and oral forward-looking statements attributable to Revett Minerals Inc. or to persons acting on our behalf are expressly qualified in their entirety by these cautionary statements. Except as required by federal securities laws, we do not intend to update or revise any forward-looking statements, whether as a result of new information, future events or otherwise.
[The balance of this page has been intentionally left blank.]
1
PART I
Item 1. Business.
|
Explanatory Note: As used in this report, the terms the “Company,” “we,” “us” and “our” are sometimes used to refer to Revett Minerals Inc. and, where the context so requires, its subsidiary corporations. Unless otherwise noted, all monetary denominations are in U.S. dollars. |
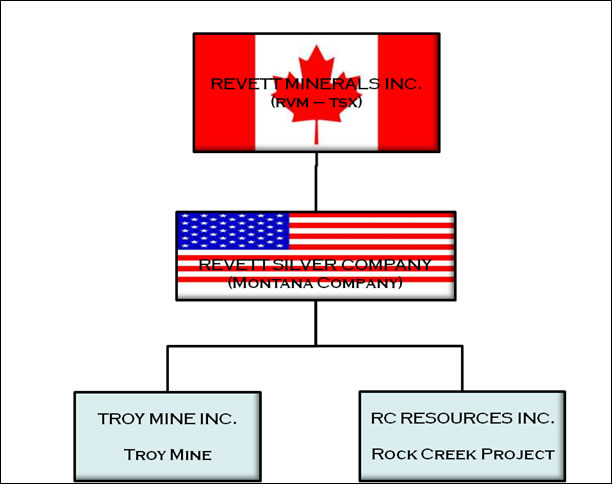
General Development of Business. Revett Minerals Inc. (“Revett Minerals”) was incorporated under the Canada Business Corporations Act in August 2004 to acquire Revett Silver Company (“Revett Silver”), a Montana corporation, and undertake a public offering of its common stock in Canada, transactions that were completed in February 2005. Revett Silver was organized in April 1999 (as Sterling Mining Company) to acquire the Troy mine (“Troy” or “Troy Mine”) and the Rock Creek project (“Rock Creek” or “Rock Creek Project”) from ASARCO Incorporated (“ASARCO”) and Kennecott Montana Company (“Kennecott”), transactions that were completed in October 1999 and February 2000. Revett Silver paid ASARCO and Kennecott approximately $25 million in total for these assets.
2
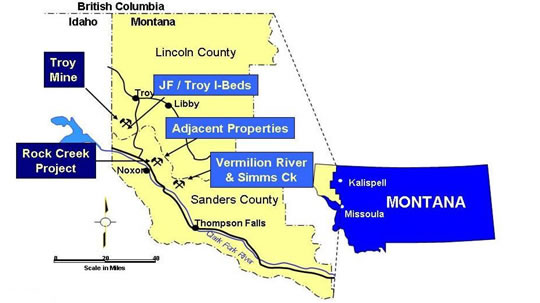
The following map depicts the locations of our two principal mining assets, Troy and Rock Creek and our other properties, all of which are located in northwestern Montana.
Troy is an underground copper and silver mine. From 1981 to 1993, the mine was operated by ASARCO and then placed on care and maintenance. The Company restarted operations at Troy in 2004 and resumed commercial production in January 2005. Rock Creek is a large development-stage underground copper and silver project. Revett Silver owns 100% of Troy and Rock Creek through two wholly-owned Montana subsidiaries, Troy Mine Inc. and RC Resources Inc., respectively.
On November 17, 2010, the Company completed a one for five common share consolidation. This report reflects the impact of this consolidation for all common shares and per share amounts reported herein.
At March 22, 2011, 33,516,884 common shares of Revett Minerals were issued and outstanding, and an additional 3,135,386 common shares were deemed outstanding pursuant to presently exercisable options and warrants. Such shares are listed for trading on the Toronto Stock Exchange under the symbol “RVM” and on the Over-the-Counter Bulletin Board under the symbol “RVMID”.
The principal executive office of the Company is located at 11115 East Montgomery, Suite G, Spokane Valley, Washington 99206, and its telephone number at that address is (509) 921-2294. Revett Minerals’ registered office is located at 1 First Canadian Place, 100 King Street West, Suite 1600, Toronto, Ontario, Canada M5X 1G5.
Financial Information about Segments. Revett Minerals’ operations comprise a single business segment, located in the United States. Information concerning its revenues, profits and losses, and total assets, liabilities and equity for the years ended December 31, 2010, 2009 and 2008 is included in the consolidated financial statements that appear elsewhere in this report.
Narrative Description of Business. Revett Minerals operates the Troy Mine, an underground copper and silver mine that has been in production since January 2005 and is engaged in the development of the Rock Creek Project.
The Troy Mine. Troy is an underground copper and silver mine located in Lincoln County, Montana, approximately fifteen miles south of the town of Troy. The mine comprises 24 patented lode-mining claims, approximately 569 unpatented lode-mining claims, 850 acres of fee land and 356 acres of patented land. The patented claims were legally surveyed in 1983. All of the mining claims are in good standing.
3
Revett Silver rehabilitated the mine in late 2004, and commenced commercial production in January 2005 following an eleven year care and maintenance period. Ore from the mine is extracted using the “room and pillar” method and is processed on site using standard flotation technology. The resulting copper and silver concentrate is sold under contract to a third party and is currently shipped by rail from a load out facility located in Libby, Montana.
The Troy concentrate typically contains between 34% and 40% copper, and between 70 to 110 ounces of silver per ton. During 2010, Troy produced 8.8 million pounds of copper and 1.0 million ounces of silver in concentrate. At December 31, 2010, the estimated proven and probable ore reserves at Troy were 10.5 million tons grading 1.21 ounces per ton silver and 0.47% copper using a net smelter return cut off of $25.57 per ton.
Rock Creek. Rock Creek is a development-stage copper and silver deposit located in Sanders County, Montana, approximately five miles northeast of Noxon, Montana and sixteen air miles from the Troy Mine. The project comprises 99 patented lode-mining claims, 162 unpatented lode-mining claims, 5 tunnel site claims, 85 mill site claims and 1,427 acres of fee land, 673 of which will be used as habitat replacement for grizzly bears. The patented claims lying within the Cabinet Mountain Wilderness Area convey mineral rights only; the claims lying outside the wilderness area convey both mineral and surface rights. The patented claims were legally surveyed in 1983 and occupy an area of approximately 1,809 acres. All of the Rock Creek Project mining claims are in good standing.
The next phase of development at Rock Creek is the completion of a two to three year evaluation program, estimated to cost from $20 million to $25 million, to determine if it is economical to develop the mineral deposit. The proposed evaluation program will include the development of an evaluation adit to collect additional technical information on the deposit, additional infill drilling to establish and confirm resource estimates, geotechnical design studies and bulk sampling of the mineralization for use in metallurgical testing. The evaluation program is subject to receipt of permits and approvals from the various federal and state agencies having jurisdiction over the project. In addition to permitting approval, the Company will also be required to satisfy certain mitigation requirements before it can develop the adit, which will include procurement of a reclamation bond and funding of a grizzly bear mitigation plan, design and construction of a water treatment facility and construction of improvements to the road leading to the proposed adit site.
The permitting process is complex and time-consuming. The deposit is located on United States Forest Service (the “Forest Service”) land (within the Kootenai National Forest) and under the Cabinet Mountains Wilderness Area, and federal and state approval is required to explore and develop it. In 2001, the Forest Service issued the final environmental impact statement (“Final EIS”) under the National Environmental Policy Act (“NEPA”). In 2003, the Forest Service and the Montana Department of Environmental Quality (the “DEQ”) issued a joint administrative decision approving the Company’s proposed plan of operations at the Rock Creek Project (the “Record of Decision”). The Record of Decision was based primarily on the findings in the Final EIS and a companion biological opinion issued by the U.S. Fish and Wildlife Service (“USFWS”) in 2003 pursuant to the requirements of the Endangered Species Act (“ESA”).
Several regional and national environmental groups challenged the Record of Decision and biological opinion under NEPA and the ESA. After exhausting their administrative appeals under the applicable statutory framework, these same groups initiated lawsuits in the Unites States District Court for the District of Montana seeking to overturn the Forest Service and USFWS determinations.
On May 4, 2010, the district court issued a decision dismissing the challenges of the environmental groups under the ESA, but vacating the 2001 Final EIS and Record of Decision, both of which were remanded to the Forest Service for further action. The district court determined that certain informational reports issued by the Forest Service in 2007 required the preparation and issuance of a supplemental EIS under NEPA. The environmental groups have appealed the dismissal of their ESA challenges to the Ninth Circuit Court of Appeals. The Company cannot reasonably predict how or when this appeal will be resolved. The defendants in the proceedings are the governmental agencies that issued or approved the permits, opinions and plan of operations. The Company is an intervener in the action. If the Company is required to submit a modified plan of operation for the Rock Creek Project, it would likely delay development and likely engender additional legal challenges and appeals, which could materially and adversely affect the Company. In the interim, the Company is working with the Forest Service to develop a supplemental EIS.
4
The Copper and Silver Markets. Copper and silver are internationally traded metals whose prices are determined by global economic conditions of supply and demand.
Historically, copper prices have been very volatile. The following table sets forth the average annual prices of copper on the London Metal Exchange since 2006, as reported by the exchange. During this period, average annual copper prices have ranged from a low of $2.32 per pound in 2009 to a high of $3.42 per pound in 2010.
LME Average Cash Official Price (US$/Pound)
| 2010 | 2009 | 2008 | 2007 | 2006 |
| 3.42 | 2.32 | 3.19 | 3.23 | 3.05 |
Copper is used in a variety of industrial and high technology applications throughout the world, including building construction, electrical generation and distribution, manufacturing electrical products, transportation and automotive industries. Copper is an excellent conductor of heat and electricity, is resistant to corrosive environments, is strong yet malleable and has a high tensile strength.
We believe copper prices will remain favourable in the long term because of lack of investment in exploration and mine development during the past decade or so. This has resulted in low to modest growth rates in supplies and inventory, compared to higher consumption rates that are attributable to continued consumption in the developed economies of North America, Europe and Asia, and rapid industrialization and emergence of consumer product markets in countries such as China and India.
Silver prices are also highly volatile from year to year. The following table illustrates the average annual London Bullion Market Association (“LBMA”) Silver Fix since 2006. These average annual prices have ranged from a low of $11.55 per ounce in 2006 to a high of $20.16 per ounce in 2010.
London Average Fix (US$/Ounce)
| 2010 | 2009 | 2008 | 2007 | 2006 |
| 20.16 | 14.65 | 15.03 | 13.38 | 11.55 |
We believe silver prices will remain generally favourable in the long term because of strong demand in the electronics industry and consistent demand from institutions that purchase and hold silver for investment purposes.
Environmental Matters. Like all mining companies doing business in the United States, the Company is subject to a variety of federal, state and local statutes, rules and regulations designed to protect the quality of the air and water, and threatened or endangered species in the vicinity of its mining operations. These include permitting or pre-operating approval requirements designed to ensure the environmental integrity of a proposed mining facility, operating requirements designed to mitigate the effects of discharges into the environment during mining operations, and reclamation or post-operation requirements designed to remediate the lands affected by mining activities once commercial operations have ceased. These laws are administered and enforced by various federal agencies and, in many instances, by state agencies operating under parallel state statutes and regulations. The principal environmental laws affecting the Company’s current and proposed operations at Troy and Rock Creek are described elsewhere in this report (Item 3. Legal Proceedings).
Employees. The Company had 197 full-time employees and one part-time employee at December 31, 2010. Approximately 192 of these employees work at Troy in production and management capacities, and the remainder work in management and administrative capacities at the Company’s corporate office. These employees are not represented by a collective bargaining unit.
5
Item 1A. Risk Factors.
Revett Minerals is a speculative investment, for many reasons, and the following risk factors should be carefully considered in evaluating it. In addition, this report contains forward-looking statements that involve known and unknown risks and uncertainties. These forward-looking statements include statements of our plans, objectives, expectations and intentions. Actual results could differ from those discussed in the forward-looking statements as a result of certain factors, including those set forth below. You should carefully consider the risks and uncertainties described below and the other information in this report before investing.
We have had losses in prior years. We have been engaged in commercial mining operations at Troy for just over six years and only recently attained a significant level of earnings. In 2010 we had net income of $4.4 million from revenues of $47.0 million. In 2009 we incurred a loss of $5.0 million on revenues of $33.1 million. In 2008 we incurred a loss of $6.7 million on revenues of $39.5 million, and in 2007 we earned $0.9 million on revenues of $38.9 million. Our loss in 2008 and 2009 was primarily due to significantly lower metal prices during the last half of 2008 and the first half of 2009.
Copper and silver prices fluctuate markedly. Our operations are significantly influenced by the price of copper and silver. Copper and silver prices fluctuate widely and are affected by numerous factors that are beyond our control, such as the strength of the United States dollar, global and regional industrial demand, and the political and economic conditions of major producing countries throughout the world. Since 1990, world average copper prices have fluctuated from a low of $0.71 per pound in 2002 to a high of $3.42 per pound in 2010, and world average annual silver prices have fluctuated from a low of $3.95 per ounce in 1992 to a high of $20.16 per ounce in 2010. As at December 31, 2010, we have contracts outstanding to sell 5.2 million pounds of copper at an average price of $3.55 per pound and 360,000 ounces of silver at an average price of $19.00. These contracts mature at various dates from March 2011 to February 2012.
There are other formidable risks to mining. We are subject to all of the risks inherent in the mining industry, including industrial accidents, labor disputes, environmental related issues, unusual or unexpected geologic formations, cave-ins, surface subsidence, flooding, power disruptions and periodic interruptions due to inclement weather. These risks could result in damage to or destruction of our mineral properties and production facilities, personal injury, environmental damage, delays, monetary losses and legal liability. In addition, we are subject to competition for new minerals properties, management and skilled miners from other mining companies, many of which have significantly greater resources than we do. We also have no control over changes in governmental regulation of mining activities, the speculative nature of mineral exploration and development, operating hazards, fluctuating metal prices and inflation and other economic conditions.
Environmental challenges could prevent us from ever developing Rock Creek. Our proposed development of Rock Creek has been challenged on environmental grounds by several regional and national environmental organizations at various times subsequent to the Forest Service’s issuance of a Record of Decision approving our plan of operation in 2003. Some of these challenges are substantial and ongoing, and allege violations of the procedural and substantive requirements of a variety of federal and state laws and regulations pertaining to our permitting activities at Rock Creek, including ESA, NEPA, the 1872 Mining Law, the Federal Land Policy Management Act, the Wilderness Act, the National Forest Management Act, the Clean Water Act, the Forest Service Organic Act of 1897 and the Administrative Procedural Act. Although we have generally been successful in addressing most of the environmental challenges to our operations, we cannot predict with any degree of certainty how the pending challenges will be resolved. Rock Creek is potentially the more significant of our two mining assets. Continued court challenges to the Record of Decision and its accompanying biological opinion have delayed us from proceeding with our planned development. If we are successful in defending these challenges, we still must comply with a number of requirements and conditions as development progresses, failing which we could be denied the ability to continue with our proposed activities at Rock Creek. (See the section of this report entitled “Legal Proceedings.”)
Our reclamation liability at Troy could be substantial. In acquiring Troy, we agreed to indemnify ASARCO and hold it harmless from all of the liabilities associated with the reclamation, restoration and closure of the mine. This entailed our procurement of a $12.9 million performance bond. We have submitted a revised reclamation plan for Troy to the Montana DEQ and they have been in the process of completing environmental analysis in cooperation with the Forest Service. The Agencies have given notice that an Environmental Impact Statement will be completed and subsequently changes may be made to the estimated reclamation costs and the amount of the performance bond. One of the key issues yet to be resolved is the extent to which we may be required to treat water from Troy after mining operations have ceased. We do not presently know whether our revised plan will actually result in increased reclamation costs at Troy. Laws governing the closure of mining operations in Montana have become more stringent since Troy was first placed into production, and could include provisions requiring us to perpetually treat all of the discharged water from the mine. These factors could result in the imposition of a higher performance bond. Further, our reclamation liability at Troy is not limited by the amount of the performance bond itself. The bond serves only as security for the payment of these obligations; any substantial increase in actual costs over and above the $16.8 million maximum allowed under the current surety agreement would necessarily be borne by the Company. Payment of such costs could have a material adverse effect on our financial condition.
6
We presently do not have the financial resources to develop Rock Creek. At December 31, 2010 we had cash and cash equivalents and short term investments of $8.8 million. We do not have sufficient cash to fund our evaluation program at Rock Creek and we do not have sufficient funds to allow us to develop a mine or begin mining operations should it prove feasible to do so. The estimated capital cost of constructing a mine at Rock Creek is in the range of $250 to $275 million and could change materially.
The Rock Creek mineral resources are not equivalent to reserves. This report includes information concerning the estimated size of our mineral resource at Rock Creek and the amount of ore that may be produced from the project were it to be developed. Since no ore has been produced from Rock Creek, these estimates are preliminary in nature. This report also includes information concerning mineral resources at Troy. Although we believe these amounts are significant, it does not mean the mineral resource can be economically mined. A mineral resource is not equivalent to a commercially mineable ore body or “proven reserves” or “probable reserves” under standards promulgated by the SEC, principally because they are less certain and not necessarily amenable to economic development. We will not be able to determine whether Rock Creek contains a commercially mineable ore body until our evaluation program has been completed and we have obtained a final, economic and technical feasibility study that will include an analysis of the amount of ore that can be economically produced under then-prevailing market conditions. United States investors are cautioned that the terms “measured mineral resources”, “indicated mineral resources” and “inferred mineral resources” are not recognized by the SEC. The estimation of mineral resources involves greater uncertainty as to their existence and economic feasibility than the estimation of proven and probable reserves. United States investors are cautioned not to assume that mineral resources will ever be converted into reserves.
Item 1B. Unresolved Staff Comments.
The Company is neither an accelerated filer nor a large accelerated filer as defined in Rule 12b-2 of the Exchange Act, nor a well-known seasoned issuer as defined in Rule 405 of the Securities Act. The Company does not have any unresolved staff comments outstanding at December 31, 2010.
Item 2. Properties.
We acquired our interest in the Troy Mine and Rock Creek Project in February 2005 through our acquisition of Revett Silver. Revett Silver, in turn, acquired Troy and Rock Creek from ASARCO and Kennecott in October 1999 and February 2000. Revett Silver holds Troy through its wholly-owned subsidiary Troy Mine Inc. and it holds Rock Creek through its wholly-owned subsidiary RC Resources Inc. Both properties are located in northwestern Montana
7

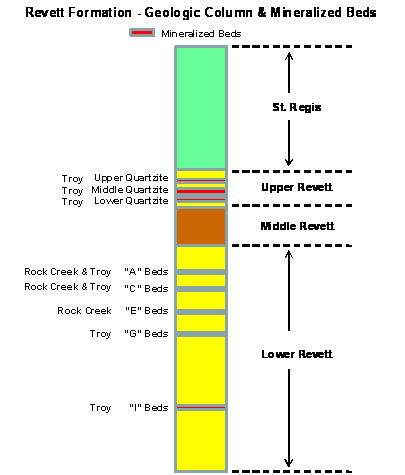
Geological Setting. The geology of the region is characterized by a thick sedimentary sequence Proterozoic in age. Within this sequence, there are four major conformable groups: Lower Belt, Ravalli, Middle Belt Carbonate and Missoula Groups. The Troy and Rock Creek deposits are found within the Ravalli Group, specifically in the Revett Formation. These formations represent a mature, clastic sandstone of varying thicknesses with the sulphide mineralization being stratabound and disseminated. Copper and silver mineralization occurs within favorable beds throughout the Revett Formation (in excess of 2,000 feet thick) as depicted in the following diagram.
8
Stratabound Copper-Silver Deposits. Base and precious metals mineralization is associated with sulphide dissemination occurring within selected portions of the Precambrian Belt Supergroup, and more specifically within the Revett Formation. This type of mineralization, referred to as stratabound disseminated copper deposits, is interpreted to result from the migration of hydrothermal solutions through unconsolidated porous sediments prior to, or during, diagenesis. This class of copper and silver deposits has received considerable research to understand their genesis and determine the fundamental controls on ore distribution. All deposits are very similar and exhibit consistent lateral metal and mineral zoning which were interpreted to derive from primary ore-forming processes.
Copper-Silver Mineralization. Copper is found in the sulphide minerals bornite and chalcocite and most often occurs as fine-grained disseminations with concentration of these minerals (less than two percent up to approximately six percent) along fractures, veinlets and bedding planes. There are two adjacent copper sulphide zones: the bornite-calcite zone and the chalcocite-chlorite zone. Significant amounts of silver are found only in these two copper sulphide zones, primarily as native silver. The thickness of these zones and their copper and silver grades are generally quite continuous across large areas, while locally there are segments considerably thinner or of lower grade. Enveloping the bornite-calcite and chalcocite-chlorite zones are four additional concentric mineral zones that generally have no economic interest. In concentric shells away from the core these are: the chalcopyrite-ankerite, chalcopyrite-calcite zones, galena-calcite and pyrite-calcite zones.
Physiography, Climate and Infrastructure. The Cabinet Mountains form a northwest-trending mountain range of rugged relief. Maximum relief in the area is about 5,500 feet ranging from 2,200 feet in the valleys to 7,700 feet at the peaks. The area’s topography is controlled by the underlying rock types and structural features. Rocks in the area are relatively competent and resistant to erosion. The talus slopes and hogback ridges are usually formed by the more weather resistant quartzite and limestone rocks.
9
The major land-forming features were created by the Rocky Mountain uplift that was active approximately 60 million years ago, and were subsequently modified by shifts in the earth’s crust, alpine glaciation and alluvial deposits. Topography in the area of the projects has been influenced by Pleistocene-age glaciation. In the northern part of the project area, Pleistocene alpine glaciers carved the landscape into a series of cirques, and horns characterized by nearly vertical cliffs, ledges, steep colluvial slopes and talus fields. Pleistocene-age glaciation scoured some lower elevation areas and created a veneer of glacial deposits. Glacial lake bed deposits, silt and clay accumulations approximately 1,000 feet in thickness were deposited in the low-elevation drainages.
The climate of the area is characterized by a combination of Pacific maritime and continental climates. The maritime influences are strongest in the winter when relatively warm, moist air from the Pacific Ocean is cooled as it is lifted over the mountains and mixes with colder Arctic air moving south. This results in snowfall with significant accumulations in the higher elevations. Continental influences are more prevalent in the summer with thundershowers during May and June followed by hot, dry weather into mid-September. Annual precipitation totals vary from about 30 inches along the Clark Fork River valley to about 80 inches at the highest elevations in the Cabinet Mountains. Temperatures in the area are moderate. During the summer months, minimum night-time temperatures are in the 50 to 60 degrees Fahrenheit range. Winter cold waves occur, but mild weather is more common. The long-term annual average temperature is about 45 degrees Fahrenheit. The warmest month, July, averages 65 degrees Fahrenheit and the coldest month, January, averages 24 degrees Fahrenheit.
The Troy Mine is located in Lincoln County, Montana which is sparsely inhabited with several rural communities. Libby, the county seat, is located approximately 32 miles northeast of the mine. The mine site is accessed by a seven mile paved mine road which connects to Montana Highway 56, a paved all-weather road connecting Montana Highway 200 to U.S. Highway 2. The copper concentrates from Troy are trucked to a leased load out facility and rail siding in Libby for rail shipment to a port as designated by our concentrate purchaser. The mine is connected to the local power grid managed by a local electric cooperative.
Rock Creek is located in Sanders County, Montana, approximately 5 miles northeast of the town of Noxon. Thompson Falls, the county seat, is located approximately 37 miles southeast of Noxon along Montana Highway 200. An active railway line parallels Highway 200 and will connect directly to a copper concentrate load out facility at the project site. Electrical service is available throughout the area including a high voltage power line which passes through the project area. Rock Creek is ideally situated from an infrastructure standpoint as all major services (power, highway, rail and water) are available within four miles of the planned and approved project site.
The local economy is based primarily on agriculture and tourism and, to a lesser extent, logging and the production of wood products. Unemployment in Lincoln and Sanders Counties is high relative to state and national unemployment rates.
Development History. The Company’s asset development dates back to 1963 when the Bear Creek Mining Company (a subsidiary of Kennecott Copper Corp.; “Kennecott”) discovered stratabound copper and silver mineralization in the Cabinet Mountains of northwestern Montana. Over the next two decades, extensive exploration activity delineated both the Troy and Rock Creek deposits. The Troy and Rock Creek deposits share many similarities in geology, geochemistry, and physiology. Based on extensive analysis of these similarities, the State and Federal agencies responsible for permitting and oversight of mining operations gained sufficient comfort from the environmentally compatible operating history at Troy to grant approvals for Rock Creek.
In 1973, ASARCO leased the Troy project from Kennecott and began permitting and development of the Troy Mine. Production commenced in August 1981 continuing until 1993 when operations were placed on care and maintenance due mainly to low metal prices. During the twelve year period of production, the Troy Mine produced approximately 4.0 million ounces of silver and 34 million pounds of copper per year. A total of 44.4 million ounces of silver and 389.9 million pounds of copper were produced during this period. The mine and plant improvements were owned by ASARCO with Kennecott retaining a 25% net profits interest.
10
In 1973, ASARCO also acquired Rock Creek claims from Kennecott and commenced an exploration program comprising 121 boreholes. According to a final exploration report prepared by ASARCO in 1989, the Rock Creek deposit contained a mineral resource estimated at 143.76 million tons grading an average of 0.68% copper and 1.65 ounces of silver per ton using a polygonal method.
In 1982 and 1983, U.S. Borax and Chemical Corporation, a subsidiary of Rio Tinto PLC (“U.S. Borax”), explored the lateral extensions of Rock Creek deposit on adjacent claims. In 1984 U.S. Borax estimated the mineral inventory of 48 million tons grading 0.54%Cu and 1.66opt Ag in three satellite zones (the “Adjacent Properties”) using a polygonal methodology. This mineral inventory and methodology has not been audited. Revett Silver acquired these Adjacent Properties in 2000 as part of the Kennecott (also a subsidiary of Rio Tinto) transaction.
Revett Silver subsequently acquired the mineral rights to two other exploration stage stratabound copper/silver prospects located south of, and on trend with Rock Creek, these being the Vermilion River and Sims Creek projects.
The Troy Mine. Troy is an underground “room and pillar” copper and silver mine with a conventional flotation mill located in Lincoln County, Montana. Developed by ASARCO in 1980 and 1981 at a cost of approximately $100 million, the mine comprises 24 patented lode-mining claims and approximately 569 unpatented lode-mining claims. We re-opened Troy in December 2004 at a cost of approximately $8 million, and have continuously operated it since then. Copper concentrate high in silver content is currently shipped by rail to offsite smelters under a renewable long term contract. The Troy concentrates typically contain 34% to 40% copper and 70 to 110 troy ounces of silver per ton. The Troy concentrates are considered high grade and clean with no deleterious elements.
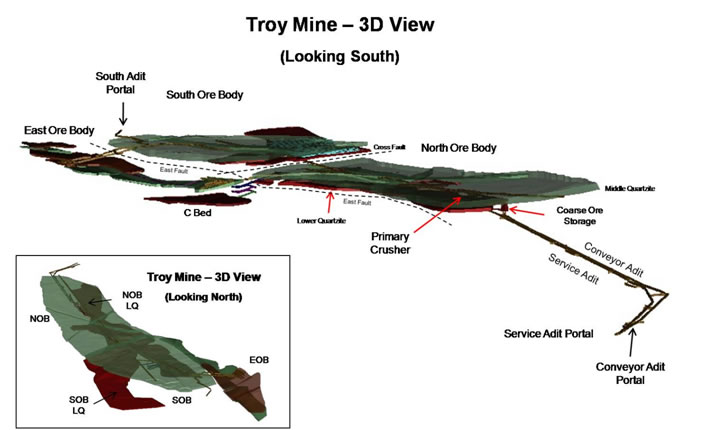
The Troy Deposit Economically significant mineralization occurs at Troy within a number of distinct stratigraphically adjacent quartzite sub-units. The Upper, Middle and Lower Quartzites are located within the Upper Member of the Revett Formation and the “A”, “C” and “I” Beds are contained in the Lower Member of the Revett Formation. In plan view, the stratiform deposit measures approximately 7,500 feet by 1,800 feet. In the vicinity of the mine, the stratigraphy is generally flat with a shallow dip of four degrees (7% grade). There are two styles of faults in the mine area. Northwest trending faults are brittle-ductile structures with common clay gouge as exemplified by the East Fault. The East Fault displays a close spatial relationship with the copper-silver mineralization. The second type of faults represents late brittle and generally open faults with sandy infill typified by the Cross Fault which separates the north and south ore bodies. These faults trend ENE to ESE and have steep southerly dips. These faults are late structures offsetting the mineralized sedimentary units. The Cross Fault also offsets the East Fault.
The Troy deposit has been subdivided into three separate mining areas; the North Ore Body (“NOB”), South Ore Body (“SOB”) and the East Ore Body (“EOB”), delineated primarily by the Cross Fault and the East Fault dissecting the mineralized quartzite sub-units (see following Mine Layout diagram). The main mining quartzite sub-unit has been the middle quartzite which averages approximately sixty feet thick. The NOB and SOB are mined in both the Lower and Middle Quartzite while the Middle and Upper Quartzite sub-units are mined in the EOB. No economic copper and silver mineralization was delineated in the Upper Quartzite west of the East Fault and similarly in the Lower Quartzite east of the East Fault (which represents the eastern boundary of the NOB and SOB). The South fault delineates the southern margin of the SOB. All other lateral ore boundaries are assay delimited and do not represent hard geological boundaries. Both the A and C Beds are mined in the South Ore Body.
11
Exploration drilling by the Company between 2006 and 2010 to delineate additional mineralization beneath the SOB in the lower member of the Revett formation was successful in discovering several new ore bodies located in the “C-Beds” as well as adding reserves in the “A” and “I” Beds in the South Ore Body. These deposits are now incorporated in our probable reserves (see following Troy Exploration discussion).
12
Current Troy Reserve Estimates (December 31, 2010)
| Ag Grade | Cu Grade | Contained | Contained | |||
| Category | Area | Million Tons | (Opt) | (%) | Ag (Moz) | Cu (Mlbs) |
| Proven Reserve | North Ore Body | 2.01 | 1.33 | 0.68 | 2.68 | 27.39 |
| South Ore Body | 0.93 | 1.60 | 0.83 | 1.49 | 15.50 | |
| East Ore Body | 0.08 | 1.26 | 0.63 | 0.09 | 0.95 | |
| Total Proven Reserve | 3.02 | 1.41 | 0.73 | 4.26 | 43.84 | |
| Probable Reserve | North Ore Body | 0.23 | 0.65 | 0.34 | 0.15 | 1.56 |
| South Ore Body | 0.19 | 0.71 | 0.35 | 0.13 | 1.31 | |
| East Ore Body | 0.91 | 1.40 | 0.61 | 1.28 | 11.07 | |
| Lower Revett A Bed | 0.82 | 0.90 | 0.27 | 0.73 | 4.46 | |
| Lower Revett C Bed | 1.32 | 1.56 | 0.56 | 2.06 | 14.62 | |
| Lower Revett I Bed | 4.02 | 1.02 | 0.27 | 4.09 | 21.81 | |
| Total Probable Reserve | 7.48 | 1.13 | 0.37 | 8.45 | 54.85 | |
| Proven & Probable Reserve | North Ore Body | 2.24 | 1.26 | 0.64 | 2.83 | 28.95 |
| South Ore Body | 1.12 | 1.45 | 0.75 | 1.62 | 16.81 | |
| East Ore Body | 0.99 | 1.39 | 0.61 | 1.38 | 12.02 | |
| Lower Revett A Bed | 0.82 | 0.90 | 0.27 | 0.73 | 4.46 | |
| Lower Revett C Bed | 1.32 | 1.56 | 0.56 | 2.06 | 14.62 | |
| Lower Revett I Bed | 4.02 | 1.02 | 0.27 | 4.09 | 21.81 | |
| Total Proven & Probable | 10.50 | 1.21 | 0.47 | 12.71 | 98.69 |
The following key factors were used in determining the foregoing reserves:
| Criteria | Silver | Copper | Other |
| Metal Prices (prior 5 year averages) | $14.90 | $3.02 | |
| NSR Cutoff (Incl. Royalty) | $25.57 / Ton | ||
| NSR by Metal (1.21 Ag, 0.47 Cu) | $14.86 | $24.28 | |
| Mining Recovery | 100% | ||
| Dilution (Incl. Reserve Calc.) | 0% | ||
| Metallurgical Recoveries – LOM Ave. | 87.5% | 86.0% |
13
Current Troy Resources Estimate (December 31, 2010)
| Ag Grade | Cu Grade | ||||
| Category | Area | Million Tons | (Opt) | (%) | |
| Measured Resource | North Ore Body | 28.02 | 1.32 | 0.65 | |
| South Ore Body | 17.08 | 1.47 | 0.71 | ||
| East Ore body | 3.15 | 1.13 | 0.52 | ||
| Total Measured Resource | Total | 48.25 | 1.36 | 0.67 | |
| Indicated Resource | North Ore Body | 0.12 | 0.65 | 0.34 | |
| South Ore Body | 2.62 | 0.96 | 0.27 | ||
| East Ore body | 2.75 | 1.34 | 0.62 | ||
| Lower Revett | 9.27 | 1.12 | 0.33 | ||
| Total Indicated Resource | Total | 14.76 | 1.13 | 0.37 | |
| Inferred Resource | North Ore Body | 0.00 | 0.00 | 0.00 | |
| South Ore Body | 0.00 | 0.00 | 0.00 | ||
| East Ore body | 0.00 | 0.00 | 0.00 | ||
| Total Inferred Resource | Total | 0.00 | 0.00 | 0.00 | |
| Total Measured & Indicated | North Ore Body | 28.14 | 1.32 | 0.65 | |
| South Ore Body | 19.70 | 1.40 | 0.66 | ||
| East Ore body | 5.89 | 1.23 | 0.56 | ||
| Lower Revett | 9.27 | 1.12 | 0.33 | ||
| Total Measured &Indicated | Total | 63.00 | 1.30 | 0.60 | |
| (Pillars Incl in Meas. & Ind.) | (Total) | (44.23) | (1.35) | (0.66) | |
| Total Inferred (JF Property)1 | Total | 11.00 | 1.40 | 0.40 |
| 1) |
Resources listed for the JF Property are a historical estimate within the meaning of National Instrument 43-101 of Canadian Securities Administrators (“NI 43-101”) and have not been audited by a qualified person. In 1992, ASARCO reported in an internal report a “Mineral Reserve” for the JF deposit of “11 million tons grading 0.4% Cu and 1.4 opt Ag.” This historical mineral resource estimate, which was prepared before the adoption of NI 43-101 and uses categories other than the ones set out in section 1.2 of NI 43-101, is considered relevant. A Qualified Person has not, however, done sufficient work to classify the historical estimate as current mineral resources and accordingly, we do not treat ASARCO’s historical estimate as current mineral resources. You are cautioned that the ASARCO historical estimate should not be relied upon. While we have not yet taken the steps to validate this drilling information with new drilling data, Larry Erickson, P Eng., a qualified person in accordance with NI 43-101, has reviewed ASARCO’s drilling data (i.e.; core logs, assay results, sections) and believes it to be reliable. |
Reserve and mineral resource estimates were performed by Larry Erickson, P. Eng., an employee of the Company. Reserve and mineral resource estimates conform to Canadian Standards on Mineral Resources and Mineral Reserves Definitions and Guidelines (CIM Guidelines, August 20, 2000) in compliance with NI 43-101 requirements. Proven and probable reserves do not include resources contained in planned pillars; only represents material scheduled to be extracted and milled. United States investors are cautioned that the terms “measured mineral resources”, “indicated mineral resources” and “inferred mineral resources” are not recognized by the SEC. The estimation of mineral resources involves greater uncertainty as to their existence and economic feasibility than the estimation of proven and probable reserves. United States investors are cautioned not to assume that mineral resources will ever be converted into reserves.
14
Operations. ASARCO operated Troy at approximately 8,500 tons per day (“tpd”) between 1981-1993 while mining primarily in the 60 foot thick Middle Quartzite unit where two-thirds of the production came from bench mining. We are currently operating at the planned rate of approximately 4,000 tpd with the majority of our mine plan focused on the remaining 30 to 40 foot thick East Ore Body, Lower Quartzites, C Bed and I Bed areas. We believe continued workforce training focused on safety and productivity combined with development of access to new mining areas such as the I Beds will help us work towards increasing production levels.
| Troy Mine Production | Total | ||||||||
| (1,000s) | 2006 | 2007 | 2008 | 2009 | 2010 | 2006-10 | 2011e | ||
| Mill Production (tons) | 945 | 1,109 | 1,307 | 1,337 | 1,363 | 6,061 | 1,444 | ||
| Grades | - Ag (opt) | 1.13 | 1.07 | 1.00 | 1.00 | 0.87 | 1.00 | 1.24 | |
| - Cu (%) | 0.46% | 0.50% | 0.43% | 0.38% | 0.40% | 0.43% | 0.46% | ||
| Recovery | - Ag (%) | 86.2% | 88.9% | 89.8% | 84.7% | 85.0% | 86.9% | 87.5% | |
| - Cu (%) | 83.6% | 86.9% | 87.5% | 83.2% | 81.0% | 84.5% | 85.7% | ||
| Production | - Ag (oz) | 917 | 1,054 | 1,179 | 1,128 | 1,008 | 5,294 | 1,300 | |
| - Cu (lbs) | 7,304 | 9,681 | 9,791 | 8,568 | 8,794 | 44,196 | 11,000 | ||
| Cash Cost ($/st) | $ 31.13 | $ 32.46 | $ 30.88 | $ 23.13 | $ 24.83 | $ 28.14 | $ 26.00 | ||
Note: Cash Costs are in dollars per short ton including all direct site costs, treatment, freight, refining and royalty costs. The cash cost per ton is a non-GAAP measure. The Company believes that cash cost per ton is a benchmark for performance and is well understood and widely reported in the mining industry.
In 2010, Troy achieved the highest mill throughput since the mine was reopened in December 2004. During the period when access to the higher grade C Bed area was being developed more of the Lower Quartzite ore (71% of the total) was being mined which resulted in lower head grades. The lower head grades, coupled with a period of lower metallurgical recoveries, due to a higher level of non-sulfide ores encountered, yielded lower silver and copper production and higher unit cash cost of production. Mining has now progressed through the higher non-sulfide area and recoveries and head grades have returned to normal in the fourth quarter as production began from the C Beds.
In 2011, we expect to process 1.4 million tons of ore grading 1.2 ounces per ton silver and 0.46% copper and recover 1.3 million ounces of silver and 11 million pounds of copper. The proven and probable reserves currently defined at Troy provide for a seven year life-of-mine plan at our current production rate.
Ongoing Troy Exploration. We have been exploring beneath and adjacent to the current workings at Troy for the past several drilling seasons. Our primary target has been stratabound copper/silver mineralization located in the “I-Beds” of the Lower Revett Formation, approximately 1,200 feet stratagraphically below the main ore body at the mine. ASARCO had initially identified mineralization in these beds during drill programs in the 1980s but did not follow up with subsequent drilling as metal prices began to fall in the early 1990s.
Since the Rock Creek Project is hosted in the upper quartzite units of the Lower Revett Formation, specifically the “A, C, E & G-Beds”, we believe the potential for ore grade mineralization exists in these and other beds. Our drilling confirmed mineralization in the “I-Beds” but also resulted in the discovery of a mineable reserve hosted in the “C-Beds” and “A Beds” directly beneath the current workings. Based on currently available information, the “C-Beds” contain probable reserves of 1.32 million tons grading 1.56 ounces per ton of silver and 0.56% copper. An access decline was completed to the “C Bed” area in the third quarter of 2010. We have also defined resources of 1.2 million tons grading 0.90 ounces per ton silver and 0.27% copper in the “A Beds” and 6.0 million tons grading 1.02 ounces per ton silver and 0.27% copper in the “I Beds”. Drilling primarily targeting expansion of the “I Beds” will continue in the 2011 drilling program which has been budgeted at $631,000.
15
Generalized Cross-Section of the Troy Mine Area Looking East
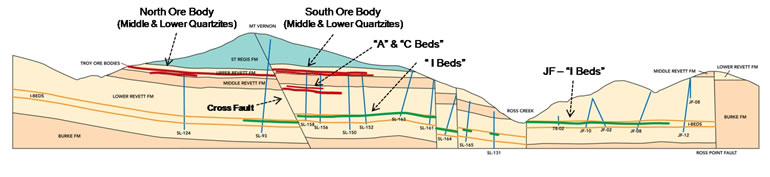
In addition to the “I-Bed” mineralization beneath the current Troy workings, ASARCO discovered and delineated the “JF” copper/silver deposit to the south of the mine. ASARCO reported in an internal report a “Mineral Reserve” for the JF deposit of “11 million tons grading 1.4 ounces per ton of silver and 0.4% copper.” We plan to re-assay existing core from the ASARCO drill program on the JF property and continue a confirmatory drill program on the area between Troy and JF as well as the JF deposit area.
Our longer range goals are to step out from the immediate mine area to explore for additional resources that would allow us to use our existing mine and processing infrastructure. There are promising mineralization trends to the north and east of the Troy Mine, which will be our initial targets. We have been expanding our claim holdings in these areas as well as reviewing prior geophysical and drill data.
Mine Reclamation Plan. We have posted a reclamation performance bond for the Troy Mine. The amount of the bond was $12.9 million as of December 31, 2010, which included $6.5 million in a restricted cash account. We are presently conducting environmental studies at the mine in conjunction with the DEQ and the Forest Service for completion of a revised reclamation plan. This plan, once accepted, may dictate a further adjustment of the amount of the reclamation performance bond. A key issue involving Troy’s reclamation and remediation is whether water discharges from the mine will require treatment even though there is presently no evidence of acid rock drainage nor any evidence of the mobilization of other deleterious constituents at the mine site. At December 31, 2010, we had accrued a $7.9 million liability relating to our reclamation and remediation obligations at Troy.
Rock Creek. Rock Creek is a large development-stage stratabound copper and silver deposit located in Sanders County, Montana. The project comprises 99 patented lode-mining claims, 162 unpatented lode-mining claims, 5 tunnel site claims and 85 mill site claims. The patented claims lying within the Cabinet Mountain Wilderness Area convey mineral rights only and the claims lying outside the wilderness area convey both mineral and surface rights. The patented claims were legally surveyed in 1983 and occupy an area of approximately 1,809 acres. All of the Rock Creek mining claims are in good standing. The project also includes 745 acres of fee land associated with project facilities and 673 acres of fee land to be used for grizzly bears mitigation purposes.
The project is approximately sixteen air miles or forty-five road miles from the Troy Mine. While the ore body lies under the Cabinet Mountain Wilderness area, the Company will access mining operations from outside the wilderness. The project development plan will be very similar to that used at the Troy Mine. The designs for Rock Creek contemplate operations at a rate of 10,000 tpd, producing on average fifty-two million pounds of copper and six million ounces of silver per year.
The Rock Creek Deposit. The stratigraphy in the vicinity of the Rock Creek Project is nearly identical to that found at the nearby Troy Mine. Bedrock exposed in the area consists primarily of the Revett and St. Regis Formations. In this area, Belt Supergroup rocks are gently folded and cut by several northwest-trending faults. In the vicinity of the deposit, two faults, the Copper Lake and Moran Faults, subdivide the deposit into three segments: The Chicago Peak, St. Paul and North Basin blocks. The more significant portion of the Rock Creek deposit forms an oblong body measuring at least 16,000 feet along the long axis by 7,200 feet along the short axis. The long axis of the copper and silver mineralization is generally oriented along the north-south direction. The copper and silver mineralization occurs within an anticlinal structure, plunging slightly to the northwest. The copper and silver mineralization occurs between elevations of 4,300 and 6,000 feet above mean sea level. Mineralization occurs primarily within quartzite units of the Lower Member of the Revett Formation and subordinately within siltite and argillite sub-units of the lower and middle Revett Formation. The Lower Member of the Revett has been locally subdivided into the same individual units as Troy named the “A” through “I” Quartzite Beds (from top to bottom). The bulk of the mineralization is confined to one layer, but locally there may be up to four vertically stacked, potentially minable layers. The copper and silver mineralization ranges in thickness from six feet up to a maximum of 235 feet, near the Copper Lake Fault. The average thickness is approximately twenty-seven feet.
16
Current Rock Creek Resource Estimates (December 31, 2009)
| Category | Area | Million Tons | Ag Grade | Cu Grade |
| (Opt) | (%) | |||
| Inferred Resource | Chicago Block | 78 | 1.4 | 0.65 |
| Saint Paul Block | 48 | 2.1 | 0.92 | |
| North Basin Block | 11 | 1.5 | 0.57 | |
| Total Inferred Resource | Total | 137 | 1.7 | 0.72 |
Permitting History and Status. After seventeen years of study and review, the Forest Service and DEQ jointly issued a Record of Decision in June 2003 approving our proposed plan of operation. The Record of Decision was based primarily on the findings detailed in the Final EIS issued in 2001 and a non-jeopardy biological opinion issued by the USFWS in May 2003. The Final EIS followed six years of public and inter-agency review and comment (the initial draft EIS was issued in October 1995) with subsequent project development modifications and mitigations, as required under NEPA. As is disclosed more fully in the section of this report entitled “Legal Proceedings” the Record of Decision and Final EIS have been remanded back to the Forest Service for further action by the Federal District Court in Montana and completion of a Supplemental EIS is now required to address several deficiencies noted by the Judgment.
The Company has support infrastructure including an office and core storage building at the site in anticipation of a favorable ruling from the courts. Approval was granted to construct the evaluation adit support facilities (office, shop, dry, etc.) on private land and reclamation bonding was provided.
Project Development. If we are allowed to proceed with our evaluation program at Rock Creek, we will install remaining infrastructure (including improvements to the access road, power transmission and a water treatment facility) and construct an adit approximately 7,000 feet long to gain access into the deposit. After mineralization is reached (at approximately 3,500 feet), we will then collect data to support a full technical and economic feasibility study. This process is expected to take approximately two to three years and will include both direct development in mineralization and an infill drilling program with a view to establishing proven and probable reserves within a portion of the ore body.
Assuming the feasibility study is positive, and financing is available, we will then commence construction of the 10,000 tpd mine and process facility. The longest lead time item will be the development of two parallel adits (approximately 15,500 feet) driven uphill at a 10% grade into the deposit; one for conveyor haulage out of the mine and the other for services and access for men and materials. Other underground construction in waste rock (such as the installation of primary crushing facilities) will be relatively limited since mine development for ore haulage will largely be confined to the ore zone. The processing plant and surface infrastructure will use conventional technology and will be based on the experience we have gained from operating the Troy processing plant. Construction, including development of the service and conveyor adits, is estimated to take about three years.
17
Other Properties. The Company has acquired the mineral rights to three other exploration-stage prospects located in the vicinity of Troy or Rock Creek: the Adjacent Properties at Rock Creek (the “Adjacent Properties”), the JF Property at Troy (discussed above) and the Vermillion River and Sims Creek properties south east of Rock Creek. All of these projects are Revett Formation-hosted, stratabound silver and copper prospects.
The Adjacent Properties are comprised of three unpatented claim groups, Copper Gulch, Horizon Basin and Rock Peak, which cover lateral extensions of the Rock Creek deposit. The prior owners of the Adjacent Properties drilled 36 boreholes into the mineralization of these claims groups and estimated the mineral inventory of 48 million tons grading 0.54% Cu and 1.66 opt Ag in three satellite zones using a polygonal methodology. This mineral inventory and methodology has not been audited.
The JF property consists of an unpatented claim group located approximately one mile south of the Troy Mine. ASARCO conducted a limited drilling program on the property over 20 years ago, consisting of twelve diamond drill holes totaling 12,183 feet and three smaller holes that tested the mineralization outcropping totaling 752 feet. The drill hole spacing ranged from 250 to 700 feet, and revealed copper-silver mineralization in a flat lying north-south trending zone approximately 800 feet wide and approximately one mile long, with an estimated average thickness of 27 feet. The JF deposit remains open on its east, west and south margins. We believe confirmation of a commercially mineable resource on the JF property could extend the life of the Troy Mine by as much as five years.
The Vermillion River and the Sims Creek properties consist of two unpatented claim groups located approximately 25 miles southeast of Rock Creek. Limited drilling was conducted by the previous owner of the Vermillion River claim group. The Sims group is untested.
Item 3. Legal Proceedings.
Revett Minerals and certain of its subsidiaries are parties to several pending legal actions in the federal and state courts as of the date of this report, most of which are predicated on alleged violations of various federal and state environmental laws and regulations at Troy and Rock Creek. These pending actions and the primary federal and state laws and regulations to which we are subject are set forth below:
The Federal Clean Water Act and the Montana Water Quality Act. The federal Clean Water Act and the Montana Water Quality Act are the principal environmental protection laws regulating the Company’s operations at Troy and Rock Creek pertaining to water quality. The federal act imposes limitations on water discharges into waters of the United States, including discharges from point sources such as mine facilities, and is administered by the federal Environmental Protection Agency. The Montana act imposes similar limitations on discharges into state waters and is administered by the Montana DEQ.
The Company holds all of the permits required for discharge to groundwater at Troy and is in the process of designing a water treatment facility for its proposed evaluation activities at Rock Creek. The Company has also established an environmental risk transfer program to cover the reclamation and remediation costs at Troy once mining operations cease. There are two components to this program: a $12.9 million surety bond that is held in trust that can be used only for reclamation and remediation; and a prepaid insurance policy that protects the Company from reclamation and remediation costs in excess of the cash bond. The surety bond is secured by restricted cash and is included among the Company’s long-term assets. Interest on the bond is recorded as income when earned. The Company amortizes the costs associated with the environmental risk transfer program using the units of production method, which is consistent with the manner in which it accounts for other asset retirement obligations pertaining to its mining assets. The DEQ is currently preparing an environmental assessment to determine the adequacy of the final reclamation plan. One of the key items under review is the long term effectiveness of metals attenuation in the tailings facility.
The Company held a water discharge permit (“MPDES Permit”) under the Montana Water Quality Act pertaining to its proposed development at the Rock Creek Project; however it was challenged in Montana state court by several environmental organizations, who contended that the DEQ arbitrarily issued the permit without first conducting a required non-degradation review. MPDES Permits are required to be renewed every five years and an application for renewal had been prepared as the case progressed. The case was taken to the Montana Supreme Court and a decision was issued on December 4, 2008 whereby the MPDES Permit application was remanded to Montana DEQ “for further proceedings in conformity herewith”. The Company will continue to pursue the renewal of the MPDES Permit with Montana DEQ; however, the MPDES Permit is not required for Phase 1 of the Project (the evaluation adit) due to the permitting approval of treated water discharge via an infiltration pond. The Company will be required to post a bond with the DEQ in conjunction with its proposed evaluation activities at Rock Creek which will cover water treatment activities. Management estimates that the initial amount of this bond will be approximately $3 million for the first phase of the project subject to increases if and when Rock Creek is commercially developed.
18
The Endangered Species Act. ESA requires federal agencies to ensure that any action authorized, funded or carried out by such agency is not likely to jeopardize the continued existence of any endangered species or threatened species. ESA’s definition of “species” includes any distinct population segment of any vertebrate fish or wildlife that interbreeds when mature. In order to facilitate the conservation of imperilled species, ESA establishes an interagency consultation process. When a federal agency proposes an action that “may affect” a listed species, which in the case of the Rock Creek Project includes grizzly bears and bull trout, the Forest Service must provide a “biological assessment” of the effects of the proposed action. Unless the USFWS determines that the proposed action will have no adverse effect on listed species, it must review all of the information provided by the action agency, as well as any other relevant information, and prepare a “biological opinion” setting forth the effects of the proposed action. In preparing such an opinion, the USFWS must use the best available scientific and commercial data to determine whether the proposed action is likely to jeopardize the species, the amount and extent of any incidental “taking” or harm to the species that may result from the action, and whether it should identify any conservation measures to promote the recovery of the listed species. ESA also provides that, once the interagency consultation process has been initiated, neither the federal agency nor the permit or license applicant (in this case, the Company) may make any irreversible commitment of resources with respect to the proposed agency action that would have the effect of foreclosing the formulation or implementation of any reasonable or prudent measures to avoid jeopardizing the listed species.
The USFWS issued a biological opinion in May 2003, which concluded that the proposed development of Rock Creek would not jeopardize the continued existence of grizzly bears or bull trout. The opinion was subsequently challenged by several environmental organizations on ESA grounds in a lawsuit brought in the United States District Court for the District of Montana and was later remanded to the USFWS for further study. In October 2006 the USFWS issued a revised biological opinion reaffirming its earlier decision. The revised opinion was also challenged in the district court. On May 4, 2010, the district court issued a decision dismissing the groups’ ESA challenge. That dismissal has been appealed to the Ninth Circuit Court of Appeals. (See the section of this report entitled “Legal Proceedings.”)
The Wilderness Act. The federal Wilderness Act of 1964 created a National Wilderness Preservation System composed of federally owned areas designated by Congress as “wilderness areas.” “Wilderness” is generally defined in the Act as “an area where the earth and its community of life are untrammelled by man, where man himself is a visitor who does not remain.” Once included in the system, the Act requires that these areas be administered by the federal department or agency having prior jurisdiction in the system in such a manner as to preserve their wilderness character and leave them unimpaired for future use and enjoyment as wilderness. The Cabinet Mountains Wilderness Area overlays Rock Creek and was included in the National Wilderness Preservation System in 1964. The Wilderness Act does not affect mineral leasing activities conducted prior to 1983, however it does authorize the Secretary of Agriculture (through the Forest Service) to impose such reasonable stipulations as are necessary to protect the wilderness character of the land for the purposes for which they are leased, permitted or licensed. In the case of Rock Creek, these stipulations have been the focus of public opposition to the development of the project.
The Federal Clean Air Act and the Montana Air Quality Act. The federal Clean Air Act limits the ambient air discharge of certain materials deemed to be hazardous and establishes a federal air quality permitting program for such discharges. The Montana Air Quality Act imposes similar limitations and permitting requirements. Hazardous materials are defined in both acts and in their enabling regulations to include various metals. The Company holds all of the required air quality permits pertaining to its operations at Troy. In December 2001, it obtained an air quality permit from the DEQ with respect to Rock Creek, however an environmental group subsequently challenged that permit, contending that nitrous emissions from diesel-powered mining equipment operating underground would exceed permitted levels. The suit was voluntarily dismissed during the first quarter of 2003.
19
The National Environmental Policy Act and the Montana Environmental Policy Act. NEPA requires all governmental agencies to consider the impact of major federal actions on the human environment. The state act mandates similar considerations with respect to major state actions. Because Rock Creek is located on federal lands, the Company was required to prepare and file an EIS outlining the environmental effects of its proposed operations and the Company’s plans to ameliorate the effects of Rock Creek’s operations. The final EIS for Rock Creek was issued in 2001, and the Forest Service, the lead government agency on the project, released its Record of Decision on the Company’s proposed operating plan in June 2003. The Company is working with the Forest Service to develop a supplemental EIS as required by the district court’s May 4, 2010 decision. (See the section of this report entitled “Legal Proceedings.”)
The Federal Comprehensive Environmental Response, Compensation and Liability Act and the Montana Metal Mine Reclamation Act. The federal Comprehensive Environmental Response, Compensation and Liability Act (“CERCLA”) imposes clean-up and reclamation obligations stemming from unlawful discharges into the environment, and establishes significant criminal and civil penalties against those persons who are primarily responsible for such discharges. The Montana Metal Mine Reclamation Act (“MMRA”) is similar to CERCLA in principal, but focuses principally on the clean up and reclamation of mining properties and unlawful discharges from mining operations. CERCLA is jointly administered and enforced by the Environmental Protection Agency and the DEQ. The MMRA is administered and enforced by the DEQ alone. A number of opposition groups have challenged the validity of Troy’s closure plan. (See the section of this report entitled “Legal Proceedings.”)
The Multiple-Use Sustained Yield Act of 1960 and the National Forest Management Act of 1974. The federal Multiple-Use Sustained Yield Act of 1960 (“MUSYA”) directs the Secretary of the U.S. Department of Agriculture to administer Forest Service and other federal lands in ways that promote multiple uses of these resources (such as outdoor recreation, grazing, timber harvesting and mining) and are protective of watersheds, fish and wildlife, thereby balancing the needs of current and future generations. The federal National Forest Management Act of 1974 requires the Secretary to adopt and implement regulations pertaining to land and resource management plans that are consistent with MUSYA’s objectives.
The Resource Conservation and Recovery Act. Resource Conservation and Recovery Act (“RCRA”) was designed and implemented to regulate the disposal of hazardous wastes. It mandates that such wastes be treated, disposed of or stored, and requires those doing so to obtain permits from the Environmental Protection Agency or the authorized state regulatory authority.
Troy-Related Actions.
Cabinet Resource Group, Inc. v. Montana Department of Environmental Quality, Revett Minerals Inc. and Genesis Inc., Montana Nineteenth Judicial District Court in and for Lincoln County (Case No. DV-07-118). This action was brought in 2007. The plaintiff, a regional environmental organization, alleges that Troy Mine Inc. is operating Troy in violation of the MMRA because of deficiencies in its reclamation plan, and that all of the defendants have violated the Montana constitution and various state statutes and regulations by allowing such operations to continue. The plaintiff seeks a declaration that the Troy operating permit and reclamation plan are void and invalid; alternatively, it seeks a writ of mandamus from the court requiring DEQ to enforce the MMRA and presumably suspend or revoke the operating permit, declare a forfeiture of the Company’s performance bond, and enjoin the Company from further operations at Troy pending approval of a reclamation plan. The plaintiff also alleges DEQ failed to maintain a clean and healthful environment in violation of the Montana constitution.
We have answered the complaint and asserted several affirmative defenses to plaintiff’s claims. We have also filed a motion seeking to dismiss Revett Minerals on the grounds that it does not do business in Montana. Discovery has been substantially completed, although no trial date has been set. The court has indicated that it will not set a trial date until DEQ has completed its required review of the reclamation plan. We are funding an ongoing environmental impact statement with DEQ concerning proposed revisions to the existing reclamation plan and increased performance bond requirements, and therefore believes the claim is without merit.
20
Rock Creek-Related Actions.
Rock Creek Alliance, Clark Fork Coalition, Cabinet Resource Group, Montana Wilderness Association, Earthworks, and Alliance for the Wild Rockies, Plaintiffs, vs. United States Forest Service, U.S. Department of Agriculture, Tom Tidwell, in his official capacity as Regional Forester for the Northern Region, Paul Bradford, in his official capacity as Forest Supervisor of the Kootenai National Forest, and Ed Schafer, in his official capacity as Secretary of the U.S. Department of Agriculture, Defendants, United States District Court for the District of Montana, Missoula Division, Case No. CV-05-107-M-DWM (“Case 1”). Rock Creek Alliance, Cabinet Resource Group, Sierra Club, Earthworks, Alliance for the Wild Rockies, Natural Resources Defense Council, Trout Unlimited, Idaho Council of Trout Unlimited, Pacific Rivers Council, and Great Old Broads for Wilderness vs. United States Fish and Wildlife Service, United States District Court for the District of Montana, Missoula Division, case No. CV-08-28-M-DWM (“Case 2”). Revett Silver is a defendant-intervener in both cases.
The complaint in Case 1 was originally filed in June 2005 and was amended in February 2008. The complaint alleges violations of the ESA, NEPA, the Clean Water Act, the Forest Service Organic Administration Act of 1897 and the National Forest Management Act, and specifically challenges the 2001 final EIS, the 2003 Record of Decision, the Plan of Operations, the 2007 determination letter from the Forest Service and the three supplemental information reports issued by the Forest Service in 2007. The complaint in Case 2 was filed in February 2008. It alleges violations of Section 7 of the ESA and specifically challenges the USFWS’ “no jeopardy” findings with regard to grizzly bears and bull trout in the USFWS’ 2006 biological opinion and the 2007 supplement to that opinion. Plaintiffs seek determinations in both cases that the governmental agencies violated the aforementioned statutes and should be enjoined from authorizing or approving any further activities relating to the Rock Creek Project until they are in compliance.
The two cases were subsequently consolidated and cross motions for summary judgment were filed. On May 4, 2010, the district court entered a decision dismissing the environmental groups’ ESA challenges, yet vacated the 2001 Final EIS and Record of Decision, both of which were remanded to the Forest Service with directives to update the NEPA analysis of the Rock Creek Project’s effect on the bull trout population and habitat, and to incorporate sediment reduction measures to minimize the adverse environmental effect of Phase I of the mine project. The Company is currently working with the Forest Service on a supplemental EIS to address the issues identified in the court’s decision. The environmental groups have appealed the dismissal of their ESA challenges to the Ninth Circuit Court of Appeals. All of the briefing had been completed as of the date of this report, but oral argument had not yet been scheduled.
Management’s Analysis of Actions pertaining to Rock Creek. Management expects the Forest Service will be able to complete a supplemental EIS addressing the issues raised by the court’s decision in Case 1, and that once that supplemental EIS is issued, the Forest Service will be in a position to issue a revised Record of Decision for the Rock Creek Project. The Company is currently working with the Forest Service on the supplemental EIS.
Management cannot predict with any degree of certainty whether the Company and the USFWS will be successful in defending the Ninth Circuit appeal of the district court’s decision dismissing the environmental groups’ ESA challenges.
Even if the Company successfully completes a supplemental EIS addressing the issues identified in the Case 1 decision and successfully defends the appeal of the ESA dismissal in Case 2, there could be continuing delays to the Company’s planned evaluation program at Rock Creek. These delays could make it more difficult to obtain the financing needed to fund commercial development. Even if the Company is ultimately successful in defending these matters, it still must comply with a number of requirements and conditions as development of Rock Creek progresses, failing which it could be denied the ability to continue.
Item 4. Submission of Matters to a Vote of Security Holders.
No matters were submitted to a vote of our security holders through the solicitation of proxies or otherwise during the fourth quarter of 2010.
21
PART II
Item 5. Market for Registrant’s Common Equity and Related Stockholder Matters.
Market Information. The following table sets forth the high and low closing prices per share, denominated in Canadian dollars, for our common stock for each quarter of 2010, 2009 and 2008 as reported on the Toronto Stock Exchange. The prices reflect inter-dealer prices without regard to retail mark-ups, markdowns or commissions, and do not necessarily reflect actual transactions. As of March 22, 2011, the Federal Reserve Bank of New York noon buying rate was $0.9844 Canadian dollars per U.S. dollar.
| 2010 | 2009 | ||||
| Low | High | Low | High | ||
| First Quarter | (Cdn) $1.65 | (Cdn) $2.30 | (Cdn) $0.35 | (Cdn) $0.65 | |
| Second Quarter | (Cdn) $1.48 | (Cdn) $2.05 | (Cdn) $0.45 | (Cdn) $1.00 | |
| Third Quarter | (Cdn) $1.33 | (Cdn) $2.50 | (Cdn) $0.45 | (Cdn) $0.85 | |
| Fourth Quarter | (Cdn) $2.15 | (Cdn) $4.90. | (Cdn) $0.65 | (Cdn) $1.75 | |
| 2008 | |||||
| Low | High | ||||
| First Quarter | (Cdn) $3.40 | (Cdn) $4.80 | |||
| Second Quarter | (Cdn) $2.65 | (Cdn) $3.90 | |||
| Third Quarter | (Cdn) $1.55 | (Cdn) $3.10 | |||
| Fourth Quarter | (Cdn) $0.20 | (Cdn) $2.20 |
Shareholders. The Company had 131 shareholders of record as of March 22, 2011.
Dividends. The Company has not declared or paid any cash or stock dividends on its common stock since inception, and does not anticipate declaring or paying any cash or stock dividends in the foreseeable future.
Securities Authorized for Issuance under Equity Incentive Plans. The following table sets forth information as of March 22, 2011 concerning securities authorized for issuance pursuant to Revett Mineral’s equity compensation plans.
Equity Compensation Plan Information
| Number of securities remaining | |||
| Number of securities to be | available for future issuance | ||
| issued upon exercise of | Weighted average exercise | under equity compensation plans | |
| outstanding options, warrants | price of outstanding options, | (excluding securities reflected | |
| Plan Category | and rights | warrants and rights | in column (a)) |
| (a) | (b) | (c) | |
| Equity compensation plans approved by security holders | 3,135,386 | $2.23 | 1,356,427 |
Sales of Unregistered Securities. Revett Minerals sold the following securities during the past three years without registering them under the Securities Act:
- On February 1, 2008, Revett Minerals issued 141,400 shares of its common stock in exchange for 707,000 shares of Revett Silver Class B common stock held beneficially and of record by 2 persons, increasing Revett Mineral’s interest in Revett Silver from 67.0% to 69.8%. There were no underwriting discounts or commissions. Revett Minerals offered and sold these securities in reliance on the exemption from the registration requirements of the Securities Act afforded by Section 4(2) thereof.
22
-
On January 5, 2009, Royal Gold, Inc. exercised its right to convert 728,275 shares of common stock of Revett Silver and 121,012 common shares of Revett Minerals owned by Royal Gold into a perpetual, non-participating one percent net smelter royalty on future revenues generated by the Rock Creek Project.
-
On February 12, 2009, Revett Minerals issued 2 million units, each unit consisted of one common share of the Company and three-quarters of one purchase warrant, at $0.30 per unit. Each full warrant allows the holder to acquire one common share of the Company at $0.50 for a period of two years. The units were purchased by sixteen purchasers, fourteen of whom resided in the United States and two of whom resided in Canada. Revett Minerals offered and sold these securities to persons residing in the United States in reliance on the exemption from the registration requirements of the Securities Act afforded by Section 4(2) thereof. It offered and sold the securities to persons residing outside the United States in reliance on Regulation S adopted under the Securities Act.
-
In March 2009, Revett Minerals issued 4,110,700 of its common shares in exchange for 20,553,500 Class B common shares of Revett Silver, increasing Revett Minerals’ interest in Revett Silver from 69.8% to 94.2%. There were no underwriting discounts or commissions. Revett Minerals offered and sold these securities in reliance on the exemption from the registration requirements of the Securities Act afforded by Section 4(2) thereof.
-
In April 2009, under an existing Shareholder Participation Rights Agreement with Silver Wheaton Inc., Revett Minerals completed a private placement of 771,112 common shares and realized gross proceeds of approximately $0.3 million. Revett Minerals offered and sold these securities in reliance on Regulation S adopted under the
Securities Act. -
In June 2009, Revett Minerals issued 428,930 common shares in exchange for 2,144,650 Class B common shares of Revett Silver, increasing Revett Minerals’ interest in Revett Silver from 94.2% to 96.7%. There were no underwriting discounts or commissions. Revett Minerals offered and sold the securities in reliance on the exemption from the registration requirements of the Securities Act afforded by Section 4(2) thereof.
-
In August 2009, Revett Minerals issued 1,666,667 common shares to a lender as principal payment on a note payable. The principal of the note payable was reduced by $1.0 million. Revett Minerals offered and sold these securities in reliance on Regulation S adopted under the Securities Act.
-
In October 2009, Revett Minerals issued 702,620 shares to satisfy a debt. The fair value of the shares issued was $0.5 million. Revett Minerals offered and sold these securities in reliance on the exemption from the registration requirements of the Securities Act afforded by Section 4(2) thereof.
-
On December 31, 2009, Revett Minerals issued 593,667 common shares in exchange for 2,968,335 Class B common shares of Revett Silver, increasing Revett Minerals’ interest in Revett Silver from 96.7% to 100%. There were no underwriting discounts or commissions. Revett Minerals offered and sold these securities in reliance on the exemption from the registration requirements of the Securities Act afforded by Section 4(2) thereof.
-
On January 13, 2010, under an existing Shareholder Participation Rights Agreement with Silver Wheaton Inc., Revett Minerals issued 722,780 common shares in a private placement for Cdn$1.60 per share or gross proceeds of Cdn$1.2 million. Revett Minerals offered and sold these securities in reliance on Regulation S adopted under the
Securities Act. -
In March 2010, Revett Minerals issued 166,836 common shares to settle accrued payables to employees and a director in the amount of $0.4 million. Revett Minerals offered and sold these securities in reliance on the exemption from the registration requirements of the Securities Act afforded by Section 4(2) thereof.
-
In August 2010, Revett Minerals issued 2,908,545 units for net proceed of $3.9 million. Each unit consisted of one common share and one-half of a warrant, with each whole warrant exercisable into one common share at Cdn$1.75 per share, exercisable until August 24, 2013. Revett Minerals also issued 8,281 warrants and paid $0.02 million cash as a finders fee. Revett Minerals offered and sold these securities to persons residing in the United States in reliance on the exemption from the registration requirements of the Securities Act afforded by Section 4(2) thereof.
It offered and sold the securities to persons residing outside the United States
in reliance on Regulation S adopted under the Securities Act.
23
- During the year ended December 31, 2010, Revett Minerals issued 691,500
common shares upon the exercise of stock options previously granted to employees
and consultants, resulting in gross proceeds of $0.5 million. Revett Minerals
offered and sold these securities in reliance on the exemption from the registration
requirements of the Securities Act afforded by Section 4(2) thereof.
- During the year ended December 31, 2010, 3,492,500 warrants were exercised resulting in proceeds of $2.7 million. $2.0 million of these proceeds were used to fully repay a note payable. Revett Minerals offered and sold these securities to persons residing in the United States in reliance on the exemption from the registration requirements of the Securities Act afforded by Section 4(2) thereof. It offered and sold the securities to persons residing outside the United States in reliance on Regulation S adopted under the Securities Act.
Repurchases of Equity Securities by the Registrant or Affiliated Purchasers. Neither the Company nor any affiliated purchaser repurchased any equity securities of the Company in any month during the fiscal year ended December 31, 2010.
[The balance of this page has been intentionally left blank.]
24
Item 6. Selected Financial Data.
Selected Historical Financial Data. The following tables set forth Revett Minerals’ selected historical financial data as of and for the years ended December 31, 2010, 2009, 2008, 2007 and 2006. The year end financial data has been derived from our consolidated audited financial statements, and should be read in conjunction with the Management’s Discussion and Analysis section of this report and our audited consolidated financial statements and the notes thereto.
| As at December 31 | |||||||||||||||
| (expressed in thousands of dollars) | |||||||||||||||
| 2010 | 2009 | 2008 | 2007 | 2006 | |||||||||||
| Balance Sheet Data: | |||||||||||||||
| Current assets | $ | 16,385 | $ | 7,779 | $ | 5,992 | $ | 24,721 | $ | 29,299 | |||||
| Property, plant and equipment | 54,044 | 52,319 | 63,228 | 60,714 | 56,012 | ||||||||||
| Restricted cash | 6,498 | 6,633 | 7,597 | 7,389 | 7,043 | ||||||||||
| Other assets | 931 | 969 | 1,125 | 1,264 | 1,849 | ||||||||||
| Total assets | $ | 77,858 | $ | 67,700 | $ | 77,942 | $ | 94,085 | $ | 94,203 | |||||
| Current liabilities | $ | 5,737 | $ | 7,981 | $ | 10,470 | $ | 14,523 | $ | 10,235 | |||||
| Long-term debt | 768 | 2,572 | 579 | 1,784 | 9,354 | ||||||||||
| Reclamation and remediation liability | 7,946 | 8,166 | 7,526 | 7,141 | 7,603 | ||||||||||
| Future income taxes | - | - | 5,917 | 8,391 | 8,353 | ||||||||||
| Total liabilities | $ | 14,451 | $ | 18,719 | $ | 24,492 | $ | 31,839 | $ | 35,545 | |||||
| Non-controlling interest | - | - | 5,253 | 8,175 | 8,524 | ||||||||||
| Shareholders' equity | 63,407 | 48,981 | 48,197 | 54,071 | 50,134 | ||||||||||
| Total liabilities and shareholders’ equity | $ | 77,858 | $ | 67,700 | $ | 77,942 | $ | 94,085 | $ | 94,203 | |||||
| For the Years Ended December 31, | |||||||||||||||
| (expressed in thousands of dollars, except share and per share amounts) | |||||||||||||||
| 2010 | 2009 | 2008 | 2007 | 2006 | |||||||||||
| Income Statement Data: | |||||||||||||||
| Revenue | $ | 47,004 | $ | 33,092 | $ | 39,487 | $ | 38,885 | $ | 31,381 | |||||
| Cost of sales | 34,385 | 32,115 | 40,727 | 30,894 | 25,043 | ||||||||||
| Depreciation and depletion | 2,275 | 2,361 | 1,864 | 1,393 | 1,280 | ||||||||||
| Exploration | 702 | 343 | 2,120 | 2,131 | 1,417 | ||||||||||
| General and administrative | 4,044 | 2,833 | 5,578 | 4,518 | 3,558 | ||||||||||
| Accretion of reclamation | 694 | 640 | 590 | 559 | 596 | ||||||||||
| Total expenses | $ | 42,100 | $ | 38,292 | $ | 50,879 | 39,495 | $ | 31,894 | ||||||
| Other income (expenses): | (451 | ) | (386 | ) | (674 | ) | 1,454 | (1,073 | ) | ||||||
| Income (loss) before income taxes | |||||||||||||||
| and non-controlling interest | 4,453 | (5,586 | ) | (12,066 | ) | 844 | (1,586 | ) | |||||||
| Net income (loss) for the period | 4,420 | (4,967 | ) | (6,690 | ) | 871 | (1,731 | ) | |||||||
| Deficit, beginning of period | (15,457 | ) | (10,490 | ) | (3,800 | ) | (4,671 | ) | (2,940 | ) | |||||
| Deficit, end of period | $ | (11,037 | ) | $ | (15,457 | ) | $ | (10,490 | ) | $ | (3,800 | ) | $ | (4,671 | ) |
| Per Share Data: | |||||||||||||||
| Basic income (loss) per share | $ | 0.16 | $ | (0.23 | ) | $ | (0.45 | ) | $ | 0.05 | $ | (0.15 | ) | ||
| Fully diluted income (loss) per share | $ | 0.15 | $ | (0.23 | ) | $ | (0.45 | ) | $ | 0.05 | $ | (0.15 | ) | ||
| Weighted average number of shares | |||||||||||||||
| Outstanding- Basic | 27,928,475 | 21,260,952 | 14,996,511 | 14,661,763 | 12,258,442 | ||||||||||
| - Fully diluted | 30,456,214 | 21,260,952 | 14,996,511 | 14,715,942 | 12,258,442 | ||||||||||
| Dividends paid during the period | - | - | - | - | - | ||||||||||
25
Item 7. Management’s Discussion and Analysis of Financial Condition and Results of Operation.
|
Explanatory Note: The following discussion of our financial condition and results of operation should be read in conjunction with Revett Minerals’ consolidated audited financial statements as at December 31, 2010 and 2009 and the years ended December 31, 2010, 2009 and 2008, which include the accounts of Revett Minerals and its wholly-owned subsidiary Revett Silver, and the accounts of Revett Silver’s wholly owned subsidiaries, Troy Mine Inc. and RC Resources Inc. These financial statements have been prepared in accordance with Canadian generally accepted accounting principles and have been reconciled to U.S. generally accepted accounting principles (“US GAAP”). See Note 15 to the consolidated financial statements for the reconciliation to US GAAP. |
Overview. Our principal mining properties are the Troy Mine and the Rock Creek Project. Our subsidiary, Revett Silver, acquired these properties from ASARCO and Kennecott in 1999 and 2000 at a total cost of approximately $25 million. The Troy Mine was kept on a care and maintenance basis from 1999 until 2004 and was reopened in late 2004 with commercial production recommencing in January 2005. Troy is an underground copper and silver mine located in Lincoln County, Montana, approximately fifteen miles south of the town of Troy and Rock Creek is a large exploration-stage copper and silver property located in Sanders County, Montana, approximately five miles northeast of Noxon, Montana. Since 2000, we have also been pursuing an operating permit for Rock Creek. These activities and other corporate activities have been funded from proceeds received from sales of our common stock, from the sale of some of our deeded property and cash flow from Troy operations.
Our goals are to continue to increase production and profitability at Troy and successfully develop Rock Creek. While we believe we can achieve the former, evaluating Rock Creek and putting it into production if it is economical to do so are formidable challenges. Consequently, we cannot give an assurance that Rock Creek can be successfully developed.
Results of Operations.
Comparison of Years Ended December 31, 2010 and 2009. During 2010 the most significant event affecting our financial performance was the increase in the price of copper and silver. Metal prices will continue to be the most significant factor influencing our operations going forward. The following are highlights of the changes over these two periods:
-
Our revenues increased in 2010 because of a significant increase in the price of copper and silver as compared to 2009. For 2010 the average price of copper was $3.42 per pound ($2.33 in 2009) and the average price of silver was $20.16 per ounce ($14.67 in 2009). This favorable pricing variance, coupled with a 1% increase in payable copper production due to higher throughput resulted in higher revenues in 2010 as compared to 2009.
-
Our cost of goods sold during 2010 increased by $2.3 million to $34.4 million, a 7% increase when compared to 2009. The increase in cost of goods sold is primarily the result of higher mill production , labor costs (as the 10% pay reduction in 2009 for all workers at the Troy Mine was restored in 2010), higher cost for consumables (such as fuel, explosives, milling reagents and other milling consumables) and re-instatement of a royalty in the third quarter of 2010.
-
Other expenses recorded during the year included the non-cash accretion for reclamation and remediation liability of $0.6 million (unchanged from 2009), exploration and development expenditures at Troy and Rock Creek of $0.7 million (compared to $0.3 million in 2009), and net other expense of $0.5 million (compared to a net other income of $0.4 million in 2009).
-
Troy produced 8,794,445 pounds of copper in concentrate and 1,008,089 ounces of silver in concentrate in 2010 compared to 8,624,059 pounds of copper in concentrate and 1,135,281 ounces of silver in concentrate in 2009. The lower silver production in 2010 is a result of mining lower ore grades (13% lower).
26
-
Milling throughput at Troy for 2010 was 1,362,890 tons of ore (3,807 tons per day), which was approximately 2% higher than 2009. Metal grades for silver and copper during the year were slightly lower than our operating projections due primarily to increased production in the South Ore Body lower quartzite area while access to the C Bed area was being developed.
-
The 2010 increase in administration costs was due to the restoration of the 20% reduction in management salaries during 2009, and an increase in legal and consulting fees along with increased emphasis in investor relations during 2010.
The following table compares our key operating statistics for the twelve months ended December 31, 2010 compared to the same periods in 2009 and 2008:
| Years Ended | |||
| Item | December 31, 2010 | December 31, 2009 | December 31, 2008 |
| Tons milled | 1,362,890 | 1,337,224 | 1,307,447 |
| Tons milled per day | 3,807 | 3,735 | 3,642 |
| Copper grade | 0.40 percent | 0.39 percent | 0.43 percent |
| Copper recovery | 81.16 percent | 83.17 percent | 87.54 percent |
| Copper production | 8,794,445 pounds | 8,624,059 pounds | 9,791,145 pounds |
| Copper sold (payable) | 8,499,831 pounds | 8,335,153 pounds | 9,463,142 pounds |
| Silver grade | 0.87 ounces per ton | 1.00 ounces per ton | 1.00 ounces per ton |
| Silver recovery | 85.05 percent | 84.70 percent | 89.83 percent |
| Silver production | 1,008,089 ounces | 1,135,281 ounces | 1,178,913 ounces |
| Silver sold (payable) | 927,442 ounces | 1,022,888 ounces | 1,061,021 ounces |
Expenses pertaining to Rock Creek totaled $0.4 million during the year ended December 31, 2010 ($0.3 million in 2009), and were comprised of legal fees of approximately $0.2 million; consulting fees of approximately $0.1 million; and public relations and miscellaneous expenditures of approximately $0.1 million including funding of ongoing grizzly bear mitigation.
Comparison of Years Ended December 31, 2009 and 2008. During the first half of 2009 the most significant event affecting our financial performance was the dramatic decline in the price of copper and silver. The following are highlights of the changes over these two periods:
-
Our revenues decreased in 2009 because of a significant decrease in the price of copper and silver over the first six months of the year. For the first six months of 2009 the average price of copper was $1.83 per pound ($3.68 in same period of 2008) and the average price of silver was $13.17 per ounce ($17.43 in the same period of 2008). For the full year copper prices averaged $2.32 per pound and silver prices averaged $14.65 per ounce, compared to 2008 pricing of $3.15 per pound of copper and $15.02 per ounce for silver. This pricing variance, coupled with a 10% decrease in payable copper production due to lower copper grades, resulted in lower revenues in 2009 as compared to 2008.
-
Our cost of goods sold during 2009 decreased by $8.7 million to $32.1 million, a 21% improvement when compared to 2008, despite a 3% increase in tons milled. The decrease in cost of goods sold is primarily the result of lower labor costs (chiefly due to a 10% pay reduction for all workers at the Troy Mine), lower cost for consumables (such as fuel, explosives, milling reagents and other milling consumables) and successful efforts to reduce the consumption of consumables through increased operating efficiencies and a continued focus on obtaining the lowest costs possible.
-
Other expenses recorded during the year included the non-cash accretion for reclamation and remediation liability of $0.6 million (unchanged from 2008), general and administrative costs of $2.8 million (compared to $5.6 million in 2008), exploration and development expenditures at Troy and Rock Creek of $0.3 million (compared to $2.1 million in 2008), and net other expense of $0.4 million (compared to a net other income of $0.6 million in 2008).
27
- The 2009 decrease in administration costs was due to a 20% decrease in management
salaries, a one-time severance payment of $0.6 million (paid and expensed
in 2008), a $0.5 million decrease in directors’ fees, and a $2.0 million
decrease in legal and consulting fees. Exploration and development spending
was $0.3 million in 2009 compared to $2.1 million in 2008. This lower exploration
and development expense was attributable to our overall effort to reduce spending.
- Troy produced 8,624,059 pounds of copper in concentrate and 1,127,639 ounces
of silver in concentrate in 2009 compared to 9,791,145 pounds of copper in
concentrate and 1,178,913 ounces of silver in concentrate in 2008. The lower
production in 2009 is a result of mining lower ore grades and lower recovery
rates.
- Milling throughput at Troy for 2009 was 1,337,225 tons of ore (3,735 tons per day), which was approximately 3% more mill throughput than was achieved in 2008. We did not meet our operating projections of 4,238 tons per day at Troy due to twelve days of lost production attributable to electrical issues and a safety review. Extensive training programs were implemented to improve the workforce knowledge during the year, which resulted in increased throughput of 3,840 tons per day in the fourth quarter. Metal grades for silver and copper during the year were slightly lower than our operating projections due primarily to increased production in the South Ore Body lower quartzite area.
Liquidity and Capital Resources.
Our liquidity position is directly related to the level of concentrate production, the cost of this production and the provisional and final prices received for the copper and silver in concentrate that is sold. During 2010, commodity prices in general and copper/silver prices in particular increased dramatically. This price increase resulted in a corresponding increase in our cash and working capital position as at December 31, 2010. At December 31, 2010, we had positive working capital of $10.6 million (compared to negative working capital of $0.2 million at the end of 2009). In 2010, we were able to retire our debt through repayment of principal and the issuance of common stock. In order to hedge against price volatility in 2011, we have sold forward 5.2 million pounds of copper at an average price of $3.55 per pound and 360,000 ounces of silver at an average price of $19.00 per ounce. We raised $8.3 million in 2010 through the issue of shares, including the exercise of stock options and warrants. We used $2.0 million from the proceeds of a warrant exercise to settle a note payable in full. Improved copper and silver prices throughout 2010 have positively impacted the our cash flows and we have sold forward a significant portion of 2011production at fixed prices which, based on historic and expected future costs, would result in profitable mining operations. Accordingly, we believe we will be able to generate sufficient cash flow to continue as a going concern beyond December 31, 2011. We are also investigating a number of alternative means of raising additional capital with potential lenders and investors. No assurance can be given that these efforts will prove to be successful.
Capital spending in 2010 totaled $4.9 million of which $0.3 was financed by a capital lease. The primary capital spending was for the development for access to the C Bed area of the Troy Mine, which was $3.9 million. Other acquisitions included claim purchases around the Troy Mine and a 980H Loader for improved mine productivity.
Capital spending in 2009 totaled $1.4 million of which $1.1 million was financed by a capital lease. Other expenses include engineering costs for a water treatment plant and site facilities for Rock Creek and various pieces of equipment at Troy.
Capital spending in 2008 totaled $3.7 million, $0.3 million of which was financed by capital leases. The main capital items were the acquisition of an exploration drill, conveyor belting, mine development expenditures, and engineering expenditures of $0.4 million pertaining to a water treatment plant at Rock Creek.
Financing Activities.
On January 13, 2010, under an existing Shareholder Participation Rights Agreement, we completed a private placement of 722,780 common shares and realized gross proceeds of Cdn$1.2 million.
28
In March 2010, we issued 166,836 common shares to settle accrued payables to employees and directors in the amount of $0.4 million.
In August 2010, we issued 2,908,545 units for net proceed of $3.9 million. Each unit consisted of one common share and one-half of a warrant, with each whole warrant exercisable into one common share at Cdn $1.75 per share, exercisable until August 24, 2013. The Company also issued 8,281 warrants and paid $0.02 million cash as a finders fee.
During the year ended December 31, 2010, we issued 691,500 common shares upon the exercise stock options previously granted to employees and consultants, resulting in gross proceeds of $0.5 million.
During the year ended December 31, 2010, 3,492,500 warrants were exercised resulting in proceeds of $2.7 million. $2.0 million of these proceeds were used to fully repay a note payable.
In February 2009, we completed a private placement of 2,000,000 units (each unit consisting of one share of common stock and three quarters of one common stock purchase warrant, with each warrant exercisable to purchase one share for $0.50) and realized gross proceeds of approximately $0.6 million. All of these warrants were exercised during 2010, resulting in the issuance of 1,500,000 additional shares of common stock.
In April 2009, under an existing Shareholder Participation Rights Agreement, we completed a private placement of 771,112 shares and realized gross proceeds of approximately $0.3 million.
During January 2009, we entered into a capital lease in the amount of $1.1 million for a CAT haul truck for use at Troy.
During 2008, we entered into capital leases totaling $0.3 million to purchase a 980 Loader ($0.1 million) and an exploration drill ($0.2 million) for use at Troy.
Off-Balance Sheet Arrangements.
The original purchase agreement with Kennecott gives Kennecott the right to exchange the 450,000 shares of Revett Minerals common stock that it owns for a two percent net smelter return royalty from the sale of metals extracted from a defined portion of Rock Creek. This royalty obligation would commence the date the project achieves an 80 percent production rate and would continue until Kennecott has received payments, which is currently estimated to be $9.9 million. On March 21, 2011, the company purchased this 2% through the issuance of 275,000 common shares.
Royal Gold, Inc. holds a 3% gross smelter royalty (amended agreement October 13, 2009) on a defined area of production from the Troy Mine and a 1% net smelter royalty on production from Rock Creek.
Tabular Disclosure of Contractual Obligations. The following table sets forth information as of December 31, 2010 concerning our known debt obligations, royalty obligations, capital lease obligations and reclamation obligations.
| Payments Due by Period | |||||||||||||||
| (expressed in thousands of dollars) | |||||||||||||||
| Contractual Obligation | Total | < 1 Year | 1 to 3 Years | 3 to 5 Years | > 5 Years | ||||||||||
| Accrued liabilities | $ | 5,737 | $ | 5,737 | $ | 0 | $ | 0 | $ | 0 | |||||
| Capital lease obligations | $ | 1,392 | $ | 624 | $ | 720 | $ | 48 | $ | 0 | |||||
| Operating leases | $ | 354 | $ | 354 | $ | 0 | $ | 0 | $ | 0 | |||||
| Long-term reclamation costs | $ | 14,362 | $ | 0 | $ | 0 | $ | 0 | $ | 14,362 | |||||
| Total contractual obligations | $ | 21,845 | $ | 6,715 | $ | 720 | $ | 48 | $ | 14,362 | |||||
Our long term debt at December 31, 2010 consisted of capital lease obligations related to the purchase of equipment used at the Troy Mine.
29
Related Party Transactions. There were no related party transactions in 2010, 2009 or 2008.
Proposed Transactions. There are no proposed transactions at December 31, 2010.
Principal Risks and Uncertainties. As is described elsewhere in this report, our proposed development of Rock Creek has been challenged on environmental grounds by several regional and national environmental organizations. Although we have generally been successful in addressing most of the environmental challenges to our operations, we cannot predict with any degree of certainty how the pending challenges will be resolved. Rock Creek is the more significant of our two mining assets; continued court challenges will inevitably delay us from proceeding with our planned development and a successful challenge could prevent us from developing the project at all. If we are successful in defending these challenges, we still must comply with a number of requirements and conditions as development progresses, failing which we could be denied the ability to continue with our proposed activities at Rock Creek. We are also subject to other significant risks. (See “Risk Factors” and “Legal Proceedings.”)
Critical Accounting Estimates. Our significant accounting polices are presented in Note 2 of the audited financial statements included in this report and the adjustments for United States generally accepted accounting principles purposes are presented in Note 15 to the 2010 year end financial statements included in this report. As described in Note 2, we are required to make estimates and assumptions that affect the reported amounts and related disclosures of assets, liabilities, revenue and expenses. Our estimates are based on our experience and our interpretation of economic, political, regulatory and other factors that influence our business prospects. These estimates have a significant effect on the financials statements and actual results may differ significantly from our estimates.
We believe the most critical estimates pertain to future metal prices, our estimates of proven and probable reserves at Troy, the valuation of mineral property, plant and equipment, and the estimate of the final reclamation and closure obligations at Troy. These estimates required us to make assumptions that were highly uncertain at the time the accounting estimates were made, and changes in them are reasonably likely to occur from time to time. The major critical accounting estimates include but are not limited to the following:
Future Metal Prices. Metal price estimates are key components that determine the valuation of some of our significant assets and liabilities, including the cost and carrying value for property, plant and equipment, inventories, future tax assets and liabilities, certain accounts receivable and the fair value of forward metal contracts. Metal prices, historically, have been very volatile with recent prices being near their highs for the last decade and these prices have influenced our property, plant and equipment carrying values and the estimates of reserves. We can offer no assurance that prices will continue at the levels experienced for the past few years. Changes in metal prices may result in changes in the value of derivatives and other financial instruments recognized in impairment charges on mineral property, plant and equipment and write down of inventories to net realizable value.
Embedded Financial Derivatives. Some of our assets and liabilities may contain embedded derivatives for which no corresponding market value may be readily determined. This includes the estimates of future copper and silver prices in the pricing mechanism through which we sell our copper (what we refer to as the open quotational period). We make estimates of the fair value of these instruments using forward metal prices.
Mineral Resources and Reserves, and the Carrying Values of Mineral Properties, Plant, and Equipment. Mineral resources and reserves are estimated by professional geologists and engineers in accordance with recognized industry, professional and regulatory standards. Reserve estimates are based on future metal prices, future operating costs, mill throughput and various technical, geological, engineering, and construction parameters. Changes in any of these factors could cause a significant change in the resources and reserves estimated, which, in turn, could have a material effect on the carrying value of mineral property, plant and equipment.
We have completed a life of mine undiscounted cash flow analysis of Troy based upon our most recent proven and probable ore reserves, expected production rates and costs, and estimated revenues (which are in turn based on estimated metal prices for copper and silver of $3.00 per pound and $15.00 per ounce, respectively, in 2011, and $3.02 per pound and $14.90 per ounce, respectively, for years thereafter until the end of the mine life. The projected undiscounted cash flows to be generated exceeded the carrying costs of Troy, and no write-down was required at December 31, 2010. However, these estimates are based on significant assumptions. While we have analyzed external and internal data in arriving at these assumptions, and while we believe they are reasonable, it is possible future conditions may change and that these changes could result in different assumptions which might result in an impairment of the carrying value of our mineral property, plant and equipment.
30
Costs related to the acquisition of property and mineral rights, construction of production facilities and the development of mine infrastructure are capitalized. Costs of permitting, evaluation and feasibility are only capitalized upon completion of an analysis which demonstrates the economic viability of the mineral deposit. Specifically, drilling and related costs incurred on sites without an existing mine and on areas outside the boundary of a known mineral deposit that contains proven and probable reserves are accounted for as exploration expenditures and are expensed as incurred. Drilling and related costs incurred to define and delineate a residual minerals deposit that has not previously been classified as a proven or probable reserve at a development stage or production stage mine will only be capitalized when management determines there is sufficient evidence that the expenditure will result in a future economic benefit to the Company in the accounting period when the expenditure is made. Diversity of practice exists among participants in the mining industry regarding the accounting treatment of these costs. Some mining companies elect not to capitalize drilling and related costs to convert mineral resources to reserves at their development or productions stage properties, but, instead, treat them as expenses.
Management evaluates whether or not there is sufficient geologic and economic certainty of being able to convert a mineral deposit into a proven or probable reserve at a development stage or production stage mine, based upon the known geology and metallurgy, existing or planned mining and processing facilities, and existing operating permits and environmental programs. Prior to capitalizing such costs, management must determine that the following conditions have been met: (a) there is a probable future economic benefit to the Company; (b) the Company has or can obtain the economic benefit and control access to it; and (c) the transaction or event giving rise to the economic benefit has already occurred. Once commercial production has commenced, these costs are amortized using the units-of-production method based on proven and probable reserves. Production facilities and equipment are stated at cost and are depreciated using the straight-line or units-of-production method at rates sufficient to depreciate the assets over their estimated useful lives, not to exceed the life of the mine to which the assets relate. Vehicles and office equipment are stated at cost and are depreciated using the straight-line method over estimated useful lives of three to six years. Maintenance and repairs are charged to operations as incurred. Betterments of a major nature are capitalized. When assets are retired or sold, the costs and related accumulated depreciation are eliminated from the accounts and any resulting gain or loss is reflected in the statement of operations. The carrying value of property, plant and equipment is dependant on the rates used for depreciation and depletion, which themselves are estimates.
Concentrate Receivables and Revenue. We sell our copper in concentrate based upon our own assays of metal content, moisture content and the estimated dry weight of the copper concentrate loaded in rail cars. These weight and assay estimates are subject to final confirmation by the receiving smelter and are subject to change. In addition, we record the anticipated revenue to be received from the sale of each concentrate shipment based upon our determination of the weight and assays of each shipment and in accordance with the contract to which the sale relates. Preliminary payments are thus based upon copper and silver prices that are determined prior to the date of the provisional invoice, whereas the final price received is determined by quoted metal prices in periods subsequent to the date of the provisional invoice. Changes in these estimates or in metal prices could result in a significant change to the results from operations.
Reclamation and Remediation Obligations. We have a legal obligation to reclaim our mineral properties and have estimated the cost of these obligations in accordance with current standards of applicable laws and regulations. These estimates are reviewed by third party consultants and government authorities. In arriving at these estimates, we must also estimate the timing and magnitude of future payments for remediation work, as well as prevailing rates of interest during the remediation period, in order to determine its periodic accretion and the depreciation expense. There were no material changes in our estimates of final reclamation and remediation obligations during 2010, 2009 and 2008, however, the end of mine life of Troy in 2010 did change from 2016 to 2018, which necessitated changes in the depreciation and accretion charges relating to the asset retirement obligation. We cannot predict the effect of a material increase in these estimates on our financial position.
31
Stock-Based Compensation Expense. We from time to time grant stock options to employees, directors and service providers. We use the Black-Scholes option pricing model to estimate a value for these options. This model requires management to make estimates of the expected volatility of our common stock, the expected term of the option to exercise, the expected future forfeiture rate, and future interest rates. Changes in these estimates and the conditions underlying the grants of options could cause a significant change in the stock-based compensation expense charged in any period.
Valuation Allowances for Future Income Taxes. We are required to make estimates of the valuation allowances for future income taxes. This requires us to estimate whether we will attain certain levels of future taxable income and thereby avail ourselves, or lose, estimated tax assets. These estimates require us to estimate future metal prices, future operating costs and production levels; which are themselves subject to a high degree of uncertainty.
Financial and Other Instruments. We have in the past and may in the future, engage in hedging activities in order to protect the price of copper and silver that we have produced or will produce in future periods. These hedging activities are limited to less than 50% of our planned production in any one month.
We are required by applicable accounting standards to fair value (i.e., mark to market) the amount of concentrate that has been shipped and provisionally priced, but for which final prices have not yet been determined. At each month end, we then adjust our revenue to account for future prices. In order to do this, we must estimate the future prices that will prevail when the final prices are determined. We use future contract prices in effect as at the end of each month to estimate these prices. At December 31, 2010, we had 1.4 million pounds of copper and 0.2 million ounces of silver that had not been final priced; and the mark to market value of these receivables was a liability of $0.01 million.
Forward sales with the company’s customer that have not been shipped have been designated as normal purchase and sales by applicable accounting standards and are not marked to market. As at December 31, 2010, the Company had contracts outstanding to sell 5.2 million pounds of copper at an average price of $3.55 per pound and 360,000 ounces of silver at an average price of $19.00. These contracts mature at various dates from March 2001 to February 2012. Accordingly, the effects of these contracts are accounted for in the period they are settled.
New Accounting Standards to be Adopted.
In February 2008, the Canadian Accounting Financial Standards Board confirmed that Canadian public companies will be required to adopt International Financial Reporting Standards (IFRS) for fiscal years beginning on or after January 1, 2011. The Company is currently planning to adopt accounting principles generally accepted in the United States of America (“US GAAP”) as permitted by Canadian Securities regulatory authorities effective January 1, 2011. Material difference between Canadian GAAP and US GAAP and their impact on the consolidated financial statements are disclosed in note 15.
Item 7A. Quantitative and Qualitative Disclosures About Market Risk.
Our earnings and cash flow are significantly affected by changes in the market price of copper and silver. The prices of both metals can fluctuate widely and are influenced by numerous factors such as demand, production levels, and world political and economic events and the strength of the US dollar. During the past eighteen years the average annual price of copper has ranged from a low of $0.71 per pound to a high of $3.44 per pound. Average annual silver prices over this same period have ranged from a low of $3.95 per ounce to a high of $20.17. Should the price of copper or silver decline substantially, the value of Troy and Rock Creek could fall dramatically and the future operation of Troy and the future exploration and development at Rock Creek could both be at risk.
During the twelve months ended December 31, 2010, we reported sales revenue of $47.0 million on sales of approximately 8.5 million pounds of payable copper and 0.9 million ounces of payable silver. During this period copper and silver prices averaged $3.42 per pound and $20.16 per ounce respectively. Had the price of copper or silver changed by $1.00 each, revenue would have changed by approximately $9.4 million.
A substantial portion of our cash and short term investments are invested in certificates of deposit or high quality government and corporate fixed income securities, all of which are denominated in US dollars. With the uncertainty in the financial markets the value of these fixed income securities could change. Approximately $2.3 million of our short term investments are in the form of certificates of deposit issued by a major Canadian chartered bank and are denominated in Canadian dollars which exposes us to some foreign exchange risk.
Item 8. Financial Statements and Supplementary Data.
The consolidated balance sheets of the Company as at December 31, 2010 and 2009, and consolidated statements of operations and comprehensive income (loss), shareholders’ equity and cash flows for each of the years in the three year period ended December 31, 2010. included in this report have been audited by KPMG LLP, Vancouver, British Columbia, Canada, independent registered public accountants. Such financial statements have been prepared in accordance with Canadian generally accepted accounting principles, but contain a reconciliation to generally accepted accounting principles in the United States.
32
Consolidated Financial Statements
(Expressed in thousands of
United States dollars)
REVETT MINERALS
INC.
Years ended December 31, 2010, 2009 and 2008
| KPMG LLP | Telephone | (604) 691-3000 |
| Chartered Accountants | Fax | (604) 691-3031 |
| PO Box 10426 777 Dunsmuir Street | Internet | www.kpmg.ca |
| Vancouver BC V7Y 1K3 | ||
| Canada |
INDEPENDENT AUDITORS' REPORT OF REGISTERED
PUBLIC ACCOUNTING FIRM
To the Shareholders of Revett Minerals Inc.
We have audited the accompanying consolidated financial statements of Revett Minerals Inc. (the Company), which comprise the consolidated balance sheets as at December 31, 2010 and 2009, the consolidated statements of operations and comprehensive income (loss), shareholders' equity and cash flows for each of the years in the three-year period ended December 31, 2010, and notes, comprising a summary of significant accounting policies and other explanatory information.
Management's Responsibility for the Consolidated Financial Statements
Management is responsible for the preparation and fair presentation of these consolidated financial statements in accordance with Canadian generally accepted accounting principles, and for such internal control as management determines is necessary to enable the preparation of consolidated financial statements that are free from material misstatement, whether due to fraud or error.
Auditors’ Responsibility
Our responsibility is to express an opinion on these consolidated financial statements based on our audits. We conducted our audits in accordance with Canadian generally accepted auditing standards and the standards of the Public Company Accounting Oversight Board (United States). Those standards require that we comply with ethical requirements and plan and perform the audit to obtain reasonable assurance about whether the consolidated financial statements are free from material misstatement.
An audit involves performing procedures to obtain audit evidence about the amounts and disclosures in the consolidated financial statements. The procedures selected depend on our judgment, including the assessment of the risks of material misstatement of the consolidated financial statements, whether due to fraud or error. In making those risk assessments, we consider internal control relevant to the entity's preparation and fair presentation of the consolidated financial statements in order to design audit procedures that are appropriate in the circumstances. An audit also includes evaluating the appropriateness of accounting policies used and the reasonableness of accounting estimates made by management, as well as evaluating the overall presentation of the consolidated financial statements.
We believe that the audit evidence we have obtained in our audits is sufficient and appropriate to provide a basis for our audit opinion.
KPMG LLP is a Canadian limited liability
partnership and a member firm of the KPMG |
Revett Minerals Inc.
Page 2
Opinion
In our opinion, the consolidated financial statements present fairly, in all material respects, the financial position of Revett Minerals Inc. as at December 31, 2010 and 2009 and its results of operations and its cash flows for each of the years in three-year period ended December 31, 2010 in accordance with Canadian generally accepted accounting principles.
/s/ KPMG LLP
Chartered Accountants
March 22, 2011
Vancouver,
Canada
| REVETT MINERALS INC. |
| Consolidated Balance Sheets |
| (Expressed in thousands of United States dollars) |
| December 31, 2010 and 2009 |
| 2010 | 2009 | |||||
| Assets | ||||||
| Current assets: | ||||||
| Cash and cash equivalents | $ | 8,766 | $ | 2,622 | ||
| Accounts receivable | 3,553 | 1,237 | ||||
| Inventories (note 4) | 3,674 | 3,630 | ||||
| Prepaid expenses and deposits | 392 | 290 | ||||
| 16,385 | 7,779 | |||||
| Mineral property, plant and equipment (note 5) | 54,044 | 52,319 | ||||
| Restricted cash (note 6) | 6,498 | 6,633 | ||||
| Other assets (note 6) | 931 | 969 | ||||
| $ | 77,858 | $ | 67,700 | |||
| Liabilities and Shareholders’ Equity | ||||||
| Current liabilities | ||||||
| Trade accounts payable | $ | 2,624 | $ | 3,251 | ||
| Payroll liabilities | 547 | 965 | ||||
| Income, property and mining taxes | 1,398 | 1,409 | ||||
| Other accrued liabilities | 544 | 753 | ||||
| Current portion of long-term debt (note 7) | 624 | 1,603 | ||||
| 5,737 | 7,981 | |||||
| Long-term debt (note 7) | 768 | 2,572 | ||||
| Reclamation and remediation liability (note 8) | 7,946 | 8,166 | ||||
| 14,451 | 18,719 | |||||
| Shareholders’ equity: | ||||||
| Share
capital (note
10): Authorized: unlimited no par common shares Issued and outstanding: 33,177,884 common shares (2009 - 25,195,723) |
69,866 | 60,988 | ||||
| Contributed surplus | 4,578 | 3,450 | ||||
| Deficit | (11,037 | ) | (15,457 | ) | ||
| 63,407 | 48,981 | |||||
| Commitments and contingencies (note 12) | ||||||
| Subsequent events (note 16) | ||||||
| $ | 77,858 | $ | 67,700 |
See accompanying notes to the consolidated financial statements.
Approved on behalf of the Board:
| "Timothy R. Lindsey" | Director | "Larry M. Okada" | Director |
F-1
| REVETT MINERALS INC. |
| Consolidated Statements of Operations and Comprehensive Income (Loss) |
| (Expressed in thousands of United States dollars, except per share amounts) |
| Years ended December 31, 2010, 2009 and 2008 |
| 2010 | 2009 | 2008 | |||||||
| Revenue | $ | 47,004 | $ | 33,092 | $ | 39,487 | |||
| Expenses: | |||||||||
| Cost of sales | 34,385 | 32,114 | 40,727 | ||||||
| Depreciation and depletion | 2,275 | 2,361 | 1,864 | ||||||
| Exploration | 702 | 343 | 2,120 | ||||||
| General and administrative | 4,044 | 2,834 | 5,578 | ||||||
| Accretion of reclamation and remediation liability | 694 | 640 | 590 | ||||||
| 42,100 | 38,292 | 50,879 | |||||||
| Income (loss) from operations | 4,904 | (5,200 | ) | (11,392 | ) | ||||
| Other income (expenses): | |||||||||
| Interest expense | (601 | ) | (544 | ) | (974 | ) | |||
| Interest and other income | 117 | 145 | 1,046 | ||||||
| Foreign exchange gain (loss) | 33 | 13 | (746 | ) | |||||
| (451 | ) | (386 | ) | (674 | ) | ||||
| Income (loss) before income taxes and non- | |||||||||
| controlling interest | 4,453 | (5,586 | ) | (12,066 | ) | ||||
| Income tax (expense) recovery (note 11) | (33 | ) | 228 | 2,685 | |||||
| Income (loss) before non-controlling interest | 4,420 | (5,358 | ) | (9,381 | ) | ||||
| Non-controlling interest | - | 391 | 2,691 | ||||||
| Net income (loss) and comprehensive income (loss) for the year | $ | 4,420 | $ | (4,967 | ) | $ | (6,690 | ) | |
| Basic income (loss) per share | $ | 0.16 | $ | (0.23 | ) | $ | (0.45 | ) | |
| Fully diluted income (loss) per share | $ | 0.15 | $ | (0.23 | ) | $ | (0.45 | ) | |
| Weighted average number of shares outstanding: | |||||||||
| Basic | 27,928,475 | 21,260,952 | 14,996,551 | ||||||
| Diluted | 30,460,768 | 21,260,952 | 14,996,551 |
See accompanying notes to consolidated financial statements.
F-2
| REVETT MINERALS INC. |
| Consolidated Statements of Shareholders’ Equity |
| (Expressed in thousands of United States dollars, except share amounts) |
| Years ended December 31, 2010, 2009 and 2008 |
| Common shares | Contributed | ||||||||||||||
| Shares | Amount | surplus | Deficit | Total | |||||||||||
| Balance, December 31, 2007 | 14,859,140 | $ | 56,315 | $ | 1,556 | $ | (3,800 | ) | $ | 54,071 | |||||
| Issued to acquire non controlling interest | 141,400 | 556 | - | - | 556 | ||||||||||
| Issued to settle severance obligation | 41,599 | 28 | - | - | 28 | ||||||||||
| Stock-based compensation on options granted | - | - | 232 | - | 232 | ||||||||||
| Net loss for the year | - | - | - | (6,690 | ) | (6,690 | ) | ||||||||
| Balance, December 31, 2008 | 15,042,139 | 56,899 | 1,788 | (10,490 | ) | 48,197 | |||||||||
| Issued to acquire non controlling interest (note 3(a)) | 5,116,697 | 2,388 | - | - | 2,388 | ||||||||||
| Issue of shares for cash (note 10(a)) | 771,112 | 279 | - | - | 279 | ||||||||||
| Issue of units for cash (note 10(a)) | 2,000,000 | 323 | 241 | - | 564 | ||||||||||
| Issue of shares and warrants on debt restructuring (note 7) | 1,666,667 | 1,000 | 621 | - | 1,621 | ||||||||||
| Issue of shares for settlement of accounts payable (note 10(a)) | 702,620 | 545 | - | - | 545 | ||||||||||
| Issue of shares for exercise of warrants and options | 17,500 | 12 | (4 | ) | - | 8 | |||||||||
| Redemption of shares for royalty (note 3(b)) | (121,012 | ) | (458 | ) | 417 | - | (41 | ) | |||||||
| Stock-based compensation on options granted | - | - | 387 | - | 387 | ||||||||||
| Net loss for the year | - | - | - | (4,967 | ) | (4,967 | ) | ||||||||
| Balance, December 31, 2009 | 25,195,723 | 60,988 | 3,450 | (15,457 | ) | 48,981 | |||||||||
| Issue of units for cash (note 10(a)) | 2,908,545 | 2,940 | 913 | 3,853 | |||||||||||
| Issue of common shares for cash (note 10(a)) | 722,780 | 1,147 | - | - | 1,147 | ||||||||||
| Issue of shares for settlement of accounts payable (note 10(a)) | 166,836 | 359 | - | - | 359 | ||||||||||
| Issue of shares for exercise of warrants | 3,492,500 | 3,621 | (875 | ) | - | 2,746 | |||||||||
| Issue of shares for exercise of options | 691,500 | 811 | (301 | ) | - | 510 | |||||||||
| Stock-based compensation on options granted | - | - | 1,025 | - | 1,025 | ||||||||||
| Warrants issued on settlement of legal action (note 10(a)) | - | - | 366 | - | 366 | ||||||||||
| Net income for the year | - | - | - | 4,420 | 4,420 | ||||||||||
| Balance, December 31, 2010 | 33,177,884 | $ | 69,866 | $ | 4,578 | $ | (11,037 | ) | $ | 63,407 | |||||
See accompanying notes to consolidated financial statements.
F-3
| REVETT MINERALS INC. |
| Consolidated Statements of Cash Flows |
| (Expressed in thousands of United States dollars) |
| Years ended December 31, 2010, 2009 and 2008 |
| 2010 | 2009 | 2008 | |||||||
| Cash provided by (used in): | |||||||||
| Operating activities: | |||||||||
| Net income (loss) for the year | $ | 4,420 | $ | (4,967 | ) | $ | (6,690 | ) | |
| Items not involving cash: | |||||||||
| Depreciation and depletion | 2,275 | 2,361 | 1,864 | ||||||
| Accretion of debt | 393 | 70 | - | ||||||
| Accretion of reclamation and remediation liability | 694 | 640 | 590 | ||||||
| Unrealized foreign currency exchange (gain) loss | (33 | ) | (13 | ) | 746 | ||||
| Stock-based compensation | 1,025 | 387 | 260 | ||||||
| Loss on disposal of fixed assets | 2 | - | 88 | ||||||
| Future income tax recovery | - | (228 | ) | (2,685 | ) | ||||
| Non-controlling interest | - | (391 | ) | (2,691 | ) | ||||
| Accrued interest from reclamation trust | (30 | ) | (59 | ) | (211 | ) | |||
| Amortization of insurance premiums | 157 | 156 | 139 | ||||||
| Loss on debt settlement | - | 151 | - | ||||||
| Gain on settlement of forward contract | (734 | ) | - | - | |||||
| Warrants issued on settlement of legal action | 366 | - | - | ||||||
| Changes in non-cash working capital: | |||||||||
| Accounts receivables | (2,316 | ) | (1,013 | ) | 220 | ||||
| Income taxes receivable | - | 99 | 1,151 | ||||||
| Inventories | (44 | ) | 65 | 824 | |||||
| Prepaid expenses and deposits | (102 | ) | 51 | 157 | |||||
| Accounts payable and accrued liabilities | (908 | ) | 2,315 | 4,097 | |||||
| 5,165 | (376 | ) | (2,141 | ) | |||||
| Financing activities: | |||||||||
| Proceeds from issuance of common stock | 8,256 | 851 | - | ||||||
| Repayment of debt | (2,151 | ) | (1,389 | ) | (8,716 | ) | |||
| Repayment of capital leases | (623 | ) | (557 | ) | (977 | ) | |||
| 5,482 | (1,095 | ) | (9,693 | ) | |||||
| Investing activities: | |||||||||
| Sale of short-term investments | - | - | 3,955 | ||||||
| Purchase of mineral property, plant and equipment | (4,582 | ) | (412 | ) | (3,797 | ) | |||
| Proceeds from sale of mineral interest and other assets | - | 1,836 | - | ||||||
| Release of restricted cash | 165 | 1,023 | - | ||||||
| Other long-term assets | (119 | ) | - | - | |||||
| (4,536 | ) | 2,447 | 158 | ||||||
| Impact of foreign exchange on cash and cash equivalents | 33 | 13 | (746 | ) | |||||
| Increase (decrease) in cash and cash equivalents | 6,144 | 989 | (12,422 | ) | |||||
| Cash and cash equivalents, beginning of year | 2,622 | 1,633 | 14,055 | ||||||
| Cash and cash equivalents, end of year | $ | 8,766 | $ | 2,622 | $ | 1,633 |
F-4
| REVETT MINERALS INC. |
| Consolidated Statements of Cash Flows, Continued |
| (Expressed in thousands of United States dollars) |
| Years ended December 31, 2010, 2009 and 2008 |
| 2010 | 2009 | 2008 | |||||||
| Supplemental disclosure of cash flow information: | |||||||||
| Cash paid for interest expense | $ | 219 | $ | 406 | $ | 814 | |||
| Cash received for interest income | 126 | 713 | |||||||
| Cash received for income taxes | - | 99 | 1,250 | ||||||
| Non-cash transactions: | |||||||||
| Acquisition of plant and equipment under capital lease | 332 | 1,082 | 338 | ||||||
| Reduction
of reclamation and remediation liability and offset to mineral property, plant and equipment |
914 | - | 206 | ||||||
| Shares issued to settle accounts payable | 359 | - | - | ||||||
| Debt repayment from settlement of forward contract | 734 | - | - | ||||||
| Warrants issued on settlement of legal action | 366 | - | - | ||||||
| Note payable in lieu of concentrate settlement payable | - | 4,292 | - | ||||||
| Common stock issued to acquire non controlling interest (note 3) | - | 2,388 | 556 | ||||||
| Common
stock issued in connection with debt restructuring and settlement of accounts payable |
- | 1,546 | - | ||||||
| Redemption of shares in exchange for royalty | - | 41 | - | ||||||
| Shares issued to settle severance obligations | - | - | 28 |
See accompanying notes to consolidated financial statements.
F-5
| REVETT MINERALS INC. |
| Notes to Consolidated Financial Statements |
| (Expressed in United States dollars, unless otherwise stated) |
| (Tabular amounts expressed in thousands of United States dollars, except share and per share amounts) |
| Years ended December 31, 2010, 2009 and 2008 |
| 1. | Nature of operations: |
|
Revett Minerals Inc. (“Revett Minerals” or the “Company”) was incorporated under the Canada Business Corporations Act in August 2004 for the purpose of accessing public markets to finance future development of the Rock Creek Project (“Rock Creek”) and provide the public with a vehicle for participating in the operations of the Troy Mine (“Troy”). Following the initial public offering (“IPO”) in February 2005, the Company acquired a 65% controlling interest in Revett Silver Company (“Revett Silver”) and as a result of subsequent acquisitions of the non controlling interests in Revett Silver, the Company now owns 100% of Revett Silver which in turn owns 100% of Rock Creek and Troy. Rock Creek is a development stage copper and silver property located in northwest Montana. Troy is an operating copper and silver mine also located in northwest Montana. |
||
| 2. | Significant accounting policies: |
|
| (a) | Basis of presentation: |
|
The consolidated financial statements of the Company have been prepared in accordance with Canadian generally accepted accounting principles and include the accounts of the Company’s 100% owned subsidiary, Revett Silver as at December 31, 2010 (2009 - 100%; 2008 - 69.8%), and Revett Silver’s wholly owned subsidiaries. All inter-company balances and transactions have been eliminated on consolidation. |
||
On November 17, 2010, the Company completed a one for five common share consolidation. All share and per share amounts reported in these financial statements, including comparative figures, have been adjusted to reflect the share consolidation. |
||
These financial statements are prepared on a going concern basis. Since December 31, 2009, the Company has received $8.3 million in cash through the issuance of common shares, has settled the remaining $2.5 million of note payable to its customer in full (note 7(a)), and settled a legal claim against the Company. In addition, improved copper and silver prices throughout 2010 have positively impacted the Company’s cash flows and the Company has sold forward a significant portion of 2011 production at fixed prices (note 13(d)(i)) which, based on historic and expected future costs, would result in profitable mining operations. Accordingly, the Company believes it will be able to generate sufficient cash flow to continue as a going concern beyond December 31, 2011. |
||
The Company’s earnings and cash flows are subject to copper and silver price volatility. In addition, the Company’s continuing operations in the long-term and the underlying value and recoverability of the Rock Creek property are dependent upon the existence of economically recoverable mineral reserves, obtaining the necessary operating permits for the Rock Creek property and future profitable production or sufficient proceeds from the sale of the Rock Creek property (note 12(a)(ii)). |
||
F-6
| REVETT MINERALS INC. |
| Notes to Consolidated Financial Statements |
| (Expressed in United States dollars, unless otherwise stated) |
| (Tabular amounts expressed in thousands of United States dollars, except share and per share amounts) |
| Years ended December 31, 2010, 2009 and 2008 |
| 2. | Significant accounting policies (continued): |
|
| (a) | Basis of presentation (continued): |
|
The Company changed the presentation of transportation and refining cost during the year ended December 31, 2010. In prior years, the transportation and refining costs were netted against revenues, whereas now the transportation and refining costs are included in cost of sales. The 2009 and 2008 revenues and cost of sales have each been increased by $3.6 million and $3.5 million, respectively, compared to amounts previously reported to reflect this presentation change. |
||
| (b) | Future accounting changes: |
|
Canada’s Accounting Standards Board has ratified a strategic plan that will result in Canadian GAAP, as used by publicly accountable enterprises, being fully converged with International Financial Reporting Standards (“IFRS”) as issued by the International Accounting Standards Board over a transitional period. Full adoption of IFRS is required for all publically accountable enterprises for fiscal years beginning on or after January 1, 2011. The Company will adopt accounting principles generally accepted in the United States of America (“US GAAP”) as permitted by Canadian Securities regulatory authorities effective January 1, 2011. Material differences between Canadian GAAP and US GAAP and their impact on the consolidated financial statements are disclosed in note 15. |
||
| (c) | Use of estimates: |
|
The preparation of financial statements requires management to make estimates and assumptions about future events that affect the amounts reported in the financial statements and accompanying notes and the disclosure of contingent assets and liabilities at the date of the financial statements. Significant areas requiring the use of estimates include the recoverability of mineral property, plant and equipment, the determination of the reclamation and remediation liability, assumptions used in determining the fair value of stock-based compensation, determination of valuation allowances for future income tax assets, measurement of concentrate inventory, expected economic lives and rates for depreciation, depletion and amortization, the fair value of certain financial instruments and the estimates of mineral reserves and mine life. Actual results may differ from these estimates. |
||
| (d) | Cash and cash equivalents: |
|
Cash and cash equivalents consist of funds deposited with various financial institutions and all short- term money market instruments which, on acquisition, have an original maturity of three months or less. The Company's cash and cash equivalents are not subject to any restriction. Cash and cash equivalents are designated as held for trading and recorded at fair value, with changes in fair value recognized in net income (loss). |
||
F-7
| REVETT MINERALS INC. |
| Notes to Consolidated Financial Statements |
| (Expressed in United States dollars, unless otherwise stated) |
| (Tabular amounts expressed in thousands of United States dollars, except share and per share amounts) |
| Years ended December 31, 2010, 2009 and 2008 |
| 2. | Significant accounting policies (continued): |
|
| (e) | Loans and receivables: |
|
Loans and receivables are accounted for at amortized cost. |
||
| (f) | Liabilities and debt: |
|
Accounts payable, long-term and other liabilities are accounted for at amortized cost. |
||
| (g) | Revenue recognition: |
|
Revenue is recognized when persuasive evidence of an arrangement exists, title and risk passes to the buyer, collection is reasonably assured and price is reasonably determinable. Copper and silver concentrates are sold under pricing arrangements where final prices are determined by quoted metal prices in periods subsequent to the date of sale. Revenues are recorded at the time of sale based on forward prices for the expected date of final settlement and are re-valued at each period end. Therefore, revenue from the sale of metals in concentrate are subject to mark-to-market adjustments and adjustment upon final settlement of estimated metal prices, weights, and assays. Adjustments to revenue for metal prices are recorded monthly and other adjustments are recorded on final settlement. |
||
| (h) | Stock-based compensation: |
|
The Company has a share option plan which is described in note 10(c). The Company records all stock-based payments using the fair value method. |
||
Compensation cost for options expected to vest is recognized in income (loss) on a straight-line basis over the relevant vesting period with a corresponding charge to contributed surplus. Consideration received on the exercise of stock options is recorded as share capital and the related contributed surplus is transferred to share capital. |
||
| (i) | Income (loss) per share: |
|
Basic income (loss) per common share has been calculated using the weighted average number of common shares issued and outstanding during the year. Diluted income (loss) per common share is calculated using the treasury stock method, which assumes that the proceeds to be received on exercise of outstanding stock options and warrants are used to repurchase shares of the Company at the average market price of the common shares for the year. Stock options and warrants are included in the calculation of diluted earnings per common share only if earnings are positive and to the extent the market price of the common shares exceeds the exercise price of the stock options and warrants. For the years ended December 31, 2009 and 2008, all of the outstanding warrants and options were excluded from the calculation of diluted income (loss) per common share as they were anti-dilutive. Anti-dilutive options and warrants for the year ended December 31, 2010 were 797,000 and 670,931, respectively. |
||
F-8
| REVETT MINERALS INC. |
| Notes to Consolidated Financial Statements |
| (Expressed in United States dollars, unless otherwise stated) |
| (Tabular amounts expressed in thousands of United States dollars, except share and per share amounts) |
| Years ended December 31, 2010, 2009 and 2008 |
| 2. | Significant accounting policies (continued): |
||
| (j) | Foreign currency translation: |
||
The Company’s functional currency is the United States dollar. Transactions and account balances originally stated in currencies other than the United States dollar have been translated into United States dollars as follows: |
|||
Revenue and expense items at the rate of exchange in effect on the dates they occur. |
|||
Non-monetary assets and liabilities at historical exchange rates, unless such items are carried at market, in which case they are translated at the exchange rate in effect on the balance sheet date. |
|||
Monetary assets and liabilities at the exchange rate in effect at the balance sheet date. |
|||
Exchange gains and losses are recorded in the statement of operations in the period in which they occur. |
|||
| (k) | Inventories: |
||
Material and supplies are valued at the lower of average cost and net realizable value. Stockpiled ore and work-in-process inventory are valued at the lower of the average production cost and net realizable value after an allowance for additional processing costs. Finished goods inventory which consists of copper and silver concentrate available for sale is valued at the lower of the average production cost and net realizable value. Production costs include the cost of raw materials, direct labor, mine site overhead expenses, and depreciation and depletion of mineral property, plant, and equipment. When the circumstances that previously caused inventories to be written down below costs no longer exist or there is clear evidence of an increase in net realizable value because of changed economic circumstances, the amount of any previous write-down to net realizable value is reversed. |
|||
| (l) | Mineral property, plant and equipment: |
||
Exploration costs are expensed as incurred. Costs related to the acquisition of property and mineral rights, construction of production facilities, and the development of mine infrastructure are capitalized. Costs of permitting, evaluation, and feasibility are only capitalized upon completion of an analysis which demonstrates the economic viability of the mineral deposit. Specifically, drilling and related costs incurred on sites without an existing mine and on areas outside the boundary of a known mineral deposit that contains proven and probable reserves are exploration expenditures and are expensed as incurred. Drilling and related costs incurred to define and delineate a residual mineral deposit that has not previously been classified as a proven or probable reserve at a development stage or production stage mine will only be capitalized when management determines there is sufficient evidence that the expenditure will result in a future economic benefit to the Company when the expenditure is made. |
|||
F-9
| REVETT MINERALS INC. |
| Notes to Consolidated Financial Statements |
| (Expressed in United States dollars, unless otherwise stated) |
| (Tabular amounts expressed in thousands of United States dollars, except share and per share amounts) |
| Years ended December 31, 2010, 2009 and 2008 |
| 2. | Significant accounting policies (continued): |
|
| (l) | Mineral property, plant and equipment (continued): |
|
Management evaluates whether or not there is sufficient geologic and economic certainty of being able to convert a mineral deposit into a proven or probable reserve at a development stage property, based upon the known geology and metallurgy, existing or planned mining and processing facilities, and existing operating permits and environmental programs. Costs are only capitalized when the following conditions have been met: (i) there is a probable future economic benefit to the Company; (ii) the Company has or can obtain the economic benefit and control access to it; and (iii) the transaction or event-giving rise to the economic benefit has already occurred. Once commercial production has commenced, these costs are amortized using the units-of-production method based on proven and probable reserves. Production facilities and equipment are stated at cost and are depreciated using the straight-line or units-of-production method at rates sufficient to depreciate the assets over their estimated useful lives, not to exceed the life of the mine to which the assets relate. Vehicles and office equipment are stated at cost and are depreciated using the straight-line method over estimated useful lives of three to six years. Maintenance and repairs are charged to operations as incurred. Betterments of a major nature are capitalized. |
||
| (m) | Impairment of long-lived assets: |
|
The Company reviews and evaluates its long-lived assets for impairment when events or changes in circumstances indicate that the related carrying amounts may not be recoverable. Recoverability of assets to be held and used is measured by a comparison of the carrying amount of an asset to its estimated undiscounted future cash flows expected to be generated by the asset. If the carrying amount exceeds the estimated undiscounted cash flows, an impairment loss is recognized based on the difference between the estimated fair value of the asset and its carrying value. |
||
Whenever events or circumstances indicate that an asset's fair value may not be at least equal to its carrying value, management of the Company reviews the net carrying value. This review involves consideration of the fair value of each property to determine whether a permanent impairment in value has occurred and whether any asset write down is necessary. The Company considers metals prices, cost of production, proven and probable reserves, and salvage value of the mineral property, plant, and equipment in its valuation. |
||
Management’s estimates are subject to risks and uncertainties of changes affecting the recoverability of the Company’s investment in its mineral property, plant, equipment, and mine development. Management's estimates of these factors are based on expected future conditions. Nonetheless, it is reasonably possible that in the near term, changes that would adversely affect management's estimate of net cash flows expected to be generated from its properties could occur. This could necessitate a write down for asset impairment. |
||
F-10
| REVETT MINERALS INC. |
| Notes to Consolidated Financial Statements |
| (Expressed in United States dollars, unless otherwise stated) |
| (Tabular amounts expressed in thousands of United States dollars, except share and per share amounts) |
| Years ended December 31, 2010, 2009 and 2008 |
| 2. | Significant accounting policies (continued): |
|
| (n) | Reclamation and remediation: |
|
The Company's mining and exploration activities are subject to various laws and regulations governing the protection of the environment. The Company recognizes the fair value of future reclamation and remediation as a liability in the period in which it incurs a legal obligation associated with the retirement of a tangible long-lived asset that results from the acquisition, construction, development, and/or normal use of the asset, if a reasonable estimate of fair value can be made. The liability is measured initially at fair value and the resulting cost capitalized into the carrying value of the related assets. In subsequent periods, the liability is adjusted for accretion of the discount and any change in the amount or timing of the underlying cash flows. The asset retirement cost capitalized to the related asset is depreciated over the remaining life of the asset. |
||
It is reasonably possible that the ultimate cost of remediation and reclamation could change in the future due to uncertainties associated with defining the nature and extent of environmental contamination, the application of laws and regulations by regulatory authorities and changes in remediation technology. The Company continually reviews its accrued liabilities as evidence becomes available indicating that its remediation and reclamation obligations may have changed. Any such increases in costs could materially impact the future amounts charged to operations for reclamation and remediation obligations. |
||
| (o) | Income taxes: |
|
The Company recognizes provision for income taxes based on the asset and liability method. The Company recognizes future income tax assets and liabilities and the expected future income tax consequences of events that have been recognized in its financial statements. Future income tax assets and liabilities are determined based on the temporary differences between the financial statement carrying amounts and the tax basis of assets and liabilities using enacted or substantively enacted tax rates in effect in the periods in which the temporary differences are expected to reverse. The effect on future income tax assets and liabilities of a change in tax rates is recognized in operations in the period that includes the date of substantive enactment. The Company records a valuation allowance against any portion of those future income tax assets that management believes will not be realized. |
||
| (p) | Derivative financial instruments: |
|
The Company may utilize derivative financial instruments to reduce cash flow risk relating to copper and silver sales. |
||
The Company recognizes derivative financial instruments on a mark-to-market basis with changes in fair value recognized in revenues for the period. Contracts designated as held for normal purchase and sale are not accounted for as derivatives and the effect of these contracts are accounted for only in the period of settlement. |
||
F-11
| REVETT MINERALS INC. |
| Notes to Consolidated Financial Statements |
| (Expressed in United States dollars, unless otherwise stated) |
| (Tabular amounts expressed in thousands of United States dollars, except share and per share amounts) |
| Years ended December 31, 2010, 2009 and 2008 |
| 3. | Acquisition of non-controlling interest: |
|
| (a) | Exchange of shares of Revett Silver: |
|
During March 2009, the Company issued 4,110,700 of its common shares in exchange for 20,553,500 number of Class B common shares of Revett Silver, increasing the Company’s interest in Revett Silver from 69.8% to 94.2%. The consideration was determined to be $1.4 million being the fair value of the Company’s common shares exchanged based on the quoted market value of the shares ($0.35 per share) and the applicable foreign exchange rate. |
||
During June 2009, the Company issued a further 428,930 of its common shares in exchange for 2,144,650 of Class B common shares of Revett Silver, increasing the Company’s interest in Revett Silver from 94.2% to 96.7%. The value of the consideration was determined to be $0.2 million being the fair value of the Company’s common shares exchanged based on the quoted market value of the shares ($0.55 per share) and the applicable foreign exchange rate. |
||
On December 31, 2009, the Company issued 577,067 of its common shares in exchange for 2,885,337 of Class B common shares of Revett Silver, increasing the Company’s interest in Revett Silver from 96.7% to 100%. The consideration was determined to be $0.8 million being the fair value of the Company’s common shares exchanged based on the quoted market value of the shares ($1.30 per share) and the applicable foreign exchange rate. |
||
The transactions were accounted for as a step acquisition of the non-controlling interest using the purchase method. The purchase price was allocated as follows: |
||
| Cost of acquisition, at fair value of shares issued | $ | 2,388 | ||
| Non-controlling interest acquired | $ | 4,759 | ||
| Mineral property, plant and equipment | (8,049 | ) | ||
| Future income taxes | 5,678 | |||
| $ | 2,388 |
As the fair value of the consideration, being the market value of the common shares issued was less than the carrying value of the net assets acquired, mineral property, plant and equipment was reduced by the excess. The reduction in the mineral property, plant, and equipment was allocated to the individual categories of mineral property, plant, and equipment for Troy and to the mineral property acquisition cost of Rock Creek on a pro-rata basis based on their carrying values.
F-12
| REVETT MINERALS INC. |
| Notes to Consolidated Financial Statements |
| (Expressed in United States dollars, unless otherwise stated) |
| (Tabular amounts expressed in thousands of United States dollars, except share and per share amounts) |
| Years ended December 31, 2010, 2009 and 2008 |
| 3. | Acquisition of non-controlling interest (continued): |
|
| (b) | Conversion of shares to royalty: |
|
On January 5, 2009, Royal Gold Inc. (“Royal Gold”) exercised its option to convert its 121,012 common shares of the Company and 728,275 common shares of Revett Silver into a one percent net smelter royalty on future production of Rock Creek. |
||
The conversion of the 121,012 common shares of the Company was accounted for as a redemption of shares at a cost of $0.04 million, being the fair market value of the common shares exchanged based on their quoted market value and applicable foreign exchange rate on the conversion date. This cost was allocated to the Rock Creek property and the difference between the cost of redemption and the stated or assigned value of the common shares was allocated to contributed surplus as follows: |
||
| Redemption value of common shares | $ | (41 | ) | |
| Stated value of common shares | $ | (458 | ) | |
| Contributed surplus | 417 | |||
| Allocated to mineral property | $ | (41 | ) |
The conversion of the Revett Silver shares was accounted for as an acquisition of non-controlling interest similar to the transactions described in note 3(a). The acquisition cost, being the fair market value of the Company’s common shares into which the Revett Silver shares were convertible based on the quoted market value of those shares on the conversion date, was allocated as follows:
| Cost of acquisition | $ | 48 | ||
| Non-controlling interest acquired | $ | 103 | ||
| Mineral property, plant and equipment | (89 | ) | ||
| Future income tax asset | 34 | |||
| $ | 48 |
F-13
| REVETT MINERALS INC. |
| Notes to Consolidated Financial Statements |
| (Expressed in United States dollars, unless otherwise stated) |
| (Tabular amounts expressed in thousands of United States dollars, except share and per share amounts) |
| Years ended December 31, 2010, 2009 and 2008 |
| 4. | Inventories: |
The major components of the Company’s inventory accounts at December 31, 2010 and 2009 are as follows: |
| 2010 | 2009 | ||||||
| Concentrate inventory | $ | 567 | $ | 885 | |||
| Material and supplies | 3,107 | 2,745 | |||||
| $ | 3,674 | $ | 3,630 |
The table below identifies the nature of expenses included in cost of sales:
| 2010 | 2009 | 2008 | ||||||||
| Raw materials and consumables used | $ | 11,618 | $ | 11,088 | $ | 13,963 | ||||
| Labor costs | 12,245 | 10,659 | 12,788 | |||||||
| Other costs | 10,204 | 10,873 | 13,169 | |||||||
| Net change in concentrate inventories | 318 | (505 | ) | 807 | ||||||
| $ | 34,385 | $ | 32,115 | $ | 40,727 |
Depreciation included in the cost of inventory is shown as depreciation expense when the inventory is sold.
| 5. | Mineral property, plant and equipment: |
The major components of the Company’s mineral property, plant and equipment accounts at December 31, 2010 and 2009 are as follows: |
| Accumulated | Net book | |||||||||
| 2010 | Cost | amortization | Value | |||||||
| Troy Mine: | ||||||||||
| Property acquisition and development costs | $ | 9,500 | $ | 4,555 | $ | 4,945 | ||||
| Plant and equipment | 13,730 | 5,032 | 8,698 | |||||||
| Buildings and structures | 2,846 | 977 | 1,869 | |||||||
| 26,076 | 10,564 | 15,512 | ||||||||
| Rock Creek property acquisition costs | 34,822 | - | 34,822 | |||||||
| Other corporate assets | 3,685 | 93 | 3,592 | |||||||
| Other mineral properties | 118 | - | 118 | |||||||
| $ | 64,701 | $ | 10,657 | $ | 54,044 |
F-14
| REVETT MINERALS INC. |
| Notes to Consolidated Financial Statements |
| (Expressed in United States dollars, unless otherwise stated) |
| (Tabular amounts expressed in thousands of United States dollars, except share and per share amounts) |
| Years ended December 31, 2010, 2009 and 2008 |
| 5. | Mineral property, plant and equipment (continued): |
| Accumulated | Net book | |||||||||
| 2009 | Cost | amortization | Value | |||||||
| Troy Mine: | ||||||||||
| Property acquisition and development costs | $ | 6,264 | $ | 3,665 | $ | 2,599 | ||||
| Plant and equipment | 13,212 | 3,812 | 9,400 | |||||||
| Buildings and structures | 2,518 | 724 | 1,794 | |||||||
| 21,994 | 8,201 | 13,793 | ||||||||
| Rock Creek property acquisition costs | 34,822 | - | 34,822 | |||||||
| Other corporate assets | 3,674 | 88 | 3,586 | |||||||
| Other mineral properties | 118 | - | 118 | |||||||
| $ | 60,608 | $ | 8,289 | $ | 52,319 |
The net book value of assets under capital leases at December 31, 2010 was $3.9 million (2009 -$3.9 million). No drilling costs were capitalized to convert mineral resources to reserves at the Troy Mine in any of the periods presented. No drilling costs were incurred and capitalized at the Rock Creek property for any of the periods presented.
Included in other corporate assets are Rock Creek mitigation lands with a carrying value of $3.6 million. This land will be gifted to the U.S. Forest Service or the State of Montana, as directed, as the Rock Creek evaluation program and mine development proceeds. The property costs for Rock Creek will be amortized when the property is placed into production or written off if Rock Creek cannot be developed.
| 6. | Restricted cash and other assets: |
On March 29, 2005, the Company purchased from a North American insurance company an environmental risk transfer program (the “ERTP”). The total cost of the ERTP was $8.4 million. Of this $8.4 million paid, $6.5 million was deposited in an interest-bearing account with the insurer (the “Commutation Account”). The Commutation Account principal plus interest earned are reserved exclusively to pay the Company's existing reclamation and mine closure liabilities at Troy. If the costs of reclaiming Troy are less than the value of the Commutation Account at that time, the Company will be entitled to a refund of the amount of the trust fund not expended. If the reclamation costs are expected to exceed the value of the Commutation Account, the insurance company will post additional collateral as required by the State of Montana for the excess up to a maximum limit of $16.8 million of total expenditures (including the amount funded by the Commutation Account). At December 31, 2010, the Commutation Account balance was $6.5 million (2009 - $6.6 million). |
|
The remaining $1.9 million paid comprises premiums paid to the insurer and Montana state taxes on the ERTP transaction. This remaining amount is considered a non-current asset and is being amortized over the life of Troy on a units-of-production basis. At December 31, 2010, the balance for the prepaid insurance was $1.0 million (2009 - $1.1 million), of which the long-term portion of $0.9 million (2009 - $1.0 million) is included in other assets. |
F-15
| REVETT MINERALS INC. |
| Notes to Consolidated Financial Statements |
| (Expressed in United States dollars, unless otherwise stated) |
| (Tabular amounts expressed in thousands of United States dollars, except share and per share amounts) |
| Years ended December 31, 2010, 2009 and 2008 |
| 7. | Long-term debt: |
At December 31, 2010 and 2009, the balance of the Company’s long-term debt was as follows: |
| 2010 | 2009 | ||||||
| Note payable (note (a)) | $ | - | $ | 2,492 | |||
| Capital leases (note (b)) | 1,392 | 1,683 | |||||
| 1,392 | 4,175 | ||||||
| Less current portion | 624 | 1,603 | |||||
| $ | 768 | $ | 2,572 |
| (a) | Note payable: |
|
On January 23, 2009, the Company entered into a Senior Floating Rate Note (the “Note”) for $4.3 million with an interest rate of LIBOR plus five percent with its primary concentrate sales customer. The Note was secured by a first mortgage on certain lands acquired for the Rock Creek Project. |
||
On August 24, 2009, the Company and its customer entered into an agreement to modify the terms of the Note. Of the outstanding principal value of the Note, $1.0 million was repaid through the issuance of 1.6 million common shares of the Company. The term of the remaining note payable of $3.1 million was extended with principal payments of $0.2 million due on December 31, 2009, $0.5 million payable on each June 30 and December 31 thereafter through December 31, 2011, and the remaining principal payment of $0.9 million due on June 30, 2012. The Company was also required to make additional payments equal to the amount by which the Company’s cash balance exceeds $3.0 million at the end of each quarter to a maximum payment of $0.5 million per quarter, commencing on March 31, 2010. The interest on the Note continued at LIBOR plus five percent payable on the last day of each quarter. In addition, the Company issued warrants to purchase up to 2,000,000 common shares of the Company at an exercise price of $1.00 per share with an expiry date of June 30, 2012. The fair value of the warrants was $0.6 million determined using the Black-Scholes option pricing formula with the following assumptions: volatility of 96.17%; risk free interest rate of 1.81% and expected life of 2 years. The value of the warrants was allocated between the remaining principal amount of the note and the amount settled through the issuance of shares based on the relative fair value of each component. The amount allocated to the remaining principal value of $0.4 million was netted against the remaining principal value of the note and was being amortized over the remaining life of the note using the effective interest method. The amount allocated to the debt settlement of $0.2 million was expensed. |
||
On October 20, 2010, the Company’s concentrate customer, elected to exercise 2,000,000 stock purchase warrants at an exercise price of $1.00 per share. The proceeds were used to settle, in full, the Company’s remaining note payable. The remaining unamortized discount of $0.2 million was included in interest expense on settlement of the Note. |
F-16
| REVETT MINERALS INC. |
| Notes to Consolidated Financial Statements |
| (Expressed in United States dollars, unless otherwise stated) |
| (Tabular amounts expressed in thousands of United States dollars, except share and per share amounts) |
| Years ended December 31, 2010, 2009 and 2008 |
| 7. | Long-term debt (continued): |
|
| (b) | Capital leases: |
|
The Company has entered into a number of capital leases to acquire new mining equipment for use at Troy. Obligations under capital leases are as follows: |
||
| 2011 | $ | 691 | ||
| 2012 | 396 | |||
| 2013 | 376 | |||
| 2014 and thereafter | 48 | |||
| Total minimum lease payments | 1,511 | |||
| Less amount representing interest (at rates ranging from 2.9% to 8.5%) | 119 | |||
| Present value of net minimum capital lease payments | 1,392 | |||
| Less current portion | 624 | |||
| $ | 768 |
For the year ended December 31, 2010, interest expense on capital leases was $0.1 million (2009 - $0.2 million; 2008 - $0.1 million).
| 8. | Reclamation and remediation liability: |
The Company’s mining properties are subject to various federal and state laws and regulations governing the protection of the environment. These laws and regulations are continually changing and are generally becoming more restrictive. The Company conducts its operations so as to protect the public health and environment and believes its operations are in compliance with all material applicable laws and regulations. The Company has recorded a reclamation and remediation liability for the estimated costs of reclaiming Troy. The Montana Department of Environmental Quality (“DEQ”) looks to the Company as primary obligor of the reclamation liabilities, and required the Company to post a reclamation bond in the amount of $12.9 million. The Company has purchased an environmental risk transfer program which will fund the expected reclamation and remediation liability at Troy and also provides cash collateral of $6.5 million as security to the DEQ for the required reclamation bond (note 6). |
F-17
| REVETT MINERALS INC. |
| Notes to Consolidated Financial Statements |
| (Expressed in United States dollars, unless otherwise stated) |
| (Tabular amounts expressed in thousands of United States dollars, except share and per share amounts) |
| Years ended December 31, 2010, 2009 and 2008 |
| 8. | Reclamation and remediation liability (continued): |
Changes in the reclamation and remediation liability for the years ended December 31, 2010 and 2009 are as follows: |
| 2010 | 2009 | ||||||
| Reclamation and remediation liability, beginning of year | $ | 8,166 | $ | 7,526 | |||
| Reduction in present value of liability due to mine life extension | (914 | ) | - | ||||
| Accretion expense | 694 | 640 | |||||
| $ | 7,946 | $ | 8,166 |
In 2010, the estimated end of the operating life of Troy was extended from 2016 to 2018. This resulted in a decrease of the reclamation and remediation liability of $0.9 million for 2010 with a corresponding decrease to the associated long-lived asset. The total undiscounted amount of the estimated future expenditures required to settle the environmental remediation obligation at December 31, 2010 was $14.4 million (2009 -$13.3 million). The environmental remediation expenditures are expected to occur at the end of mine operations, being 2018, and have been discounted at the Company’s credit-adjusted risk-free rate of 8.5% . Other assumptions used by management to determine the carrying amount of the asset retirement obligation are: labor costs based on current market place wages required to hire contractors to carry out reclamation activities; market risk premium for unforeseeable circumstances estimated at 8.5%; and the rate of inflation, estimated at 3.4%, over the expected years to settlement.
| 9. | Capital management: |
|
The Company has only one producing asset and limited access to financial markets at advantageous terms and conditions. The Company’s objectives in managing its capital are twofold: |
||
| (a) | to maintain sufficient liquidity to ensure the Company can meet its obligations as they become due and to ensure sufficient cash or debt facilities are in place to fund the Company’s growth objectives and projects; and |
|
| (b) | to minimize dilution of common equity now and in the future as and when the Company is required to access the capital markets. |
|
The Company defines capital to include debt and equity. The Company establishes the amount of capital in proportion to risk by managing the capital structure and making adjustments to it in light of changes in economic conditions and the risk characteristics of the underlying assets. In order to maintain or adjust its capital structure, the Company may issue new shares or seek debt financing. |
||
F-18
| REVETT MINERALS INC. |
| Notes to Consolidated Financial Statements |
| (Expressed in United States dollars, unless otherwise stated) |
| (Tabular amounts expressed in thousands of United States dollars, except share and per share amounts) |
| Years ended December 31, 2010, 2009 and 2008 |
| 9. | Capital management (continued): |
|
The Company’s size, limited operating history, and the limited magnitude of its internally generated cash may be inadequate to finance its planned development activities at Rock Creek and its exploration and property, plant and equipment requirements at Troy. These factors also make accessing the debt markets difficult and costly. The Company may, from time to time, sell equity to finance these cash requirements. The Company endeavors to sell its equity under the most favorable terms and conditions while attempting to minimize dilution to existing shareholders. To accomplish its objectives in managing capital, the Company continually monitors both the debt and equity markets to ensure the best possible price for any offering. The Company has decided not to pay dividends or repurchase any of its own outstanding equity for the foreseeable future. |
||
Neither the Company nor its subsidiaries are subject to any externally imposed capital requirements, loan covenants, or capital ratios. There were no changes to the Company’s approach to capital management for the year ended December 31, 2010. |
||
| 10. | Share capital: |
|
| (a) | Common shares: |
|
The Company has one class of no par value common stock of which an unlimited number are authorized for issue. The holders of common stock are entitled to receive dividends without restriction when and if declared by the Board of Directors. Holders of the Company’s common stock are not entitled to preemptive rights to acquire additional shares of common stock and do not have cumulative voting rights. On November 17, 2010, the Company completed a one for five share consolidation. All share and per share amounts in their financial statements, including comparative figures, have been adjusted to reflect the share consolidation. |
||
On January 5, 2009, Royal Gold exercised its option to convert its 121,012 common shares of the Company and 728,275 common shares of Revett Silver into a one percent net smelter royalty from future production at Rock Creek (note 3(b)). |
||
On February 12, 2009, the Company closed a private placement of 2,000,000 Equity Units for $0.30 per Unit or gross proceeds of $0.6 million. Each Unit consists of one common share of the Company, plus three-quarters of one purchase warrant. Each full purchase warrant allows holder to acquire one common share of the Company for a period of two years for $0.50 per full purchase warrant. If the closing price of the common shares of the Company is above CAD$0.50 per share for 15 consecutive trading days, the Company may accelerate the expiry of the warrants by issuing a press release to the effect that the warrants will expire 30 days following the date of such press release. The proceeds of the Units were allocated between the common shares and the warrants based on their relative fair values. The fair value of the common shares was based on the quoted market price and the fair value of the warrants was determined using the Black-Scholes option-pricing model with the following assumptions: stock price volatility - 70%; risk free interest rate - 0.89%; expected life - 2 years; and dividend rate - nil. |
||
F-19
| REVETT MINERALS INC. |
| Notes to Consolidated Financial Statements |
| (Expressed in United States dollars, unless otherwise stated) |
| (Tabular amounts expressed in thousands of United States dollars, except share and per share amounts) |
| Years ended December 31, 2010, 2009 and 2008 |
| 10. | Share capital (continued): |
|
| (a) | Common shares (continued): |
|
In April 2009, under an existing Shareholder Participation Rights Agreement, the Company completed a private placement of 771,112 shares and realized gross proceeds of approximately $0.3 million. |
||
In August 2009, the Company issued 1,666,667 common shares to its primary customer as principal payment on a note payable (see note 7(a)). The principal of the note payable was reduced by $1.0 million. |
||
In October 2009, the Company issued 702,620 shares to settle accounts payable. The fair value of the shares issued was $0.5 million. |
||
During the year ended December 31, 2009, the Company issued a total of 5,116,697 (2008 – 141,400) of its common shares in exchange for 25,583,487 of Class B common shares of Revett Silver, increasing the Company’s interest in Revett Silver from 69.8% to 100% (note 3(a)). |
||
On January 13, 2010, the Company issued 722,780 common shares in a private placement for CAD$1.60 per share or gross proceeds of CAD$1.2 million. |
||
In March 2010, the Company issued 166,836 common shares to settle accrued payables to employees and directors in the amount of $0.4 million. |
||
During August 2010, the Company issued 2,908,545 units for net proceeds of $3.0 million. Each unit consisted of one common share and one-half a warrant, with each whole warrant exercisable into common shares at CAD$1.75 per share, exercisable until August 24, 2013. The Company also issued 8,280 warrants and paid $0.02 million cash as a finder’s fee. The proceeds of units were allocated between the common shares and warrants issued on a relative fair value basis resulting in $2.9 million allocated to the common shares and $0.9 million to the warrants. The fair market value of the common shares was based on the market price of the shares on the issue date and the fair value of the warrants was determined using the Black-Scholes option pricing formula with the following assumptions: volatility of 110%; risk free interest rate of 0.77%; and expected life of 3.0 years. |
||
On October 7, 2010, ASARCO LLC (“ASARCO”) agreed to dismiss its lawsuit against the Company in exchange for the Company issuing 200,000 stock purchase warrants. These warrants have an exercise price of $1.50 per share and expire on October 7, 2013. These warrants were recognized at their fair value of $0.4 million and the related cost included in general and administrative expense. The fair value of the warrants was determined using the Black-Scholes option pricing formula using the following assumptions: volatility of 112%; risk free interest rate of 1.17%; and expected life of 3.0 years. |
||
During the year ended December 31, 2010, 3,492,500 warrants were exercised resulting in proceeds of $2.7 million. $2.0 million of these proceeds were used to fully repay a note payable. |
||
F-20
| REVETT MINERALS INC. |
| Notes to Consolidated Financial Statements |
| (Expressed in United States dollars, unless otherwise stated) |
| (Tabular amounts expressed in thousands of United States dollars, except share and per share amounts) |
| Years ended December 31, 2010, 2009 and 2008 |
| 10. | Share capital (continued): |
|
| (b) | Preferred stock: |
|
The Company is authorized to issue an unlimited number of no par preferred stock. The Company’s Board of Directors is authorized to create any series and, in connection with the creation of each series, to fix by resolution the number of shares of each series, and the designations, powers, preferences and rights; including liquidation, dividends, conversion and voting rights, as they may determine. At December 31, 2010 and 2009, no preferred stock was issued or outstanding. |
||
| (c) | Stock options: |
|
The Company has an Equity Incentive Plan (the “Plan”), the purpose of which is to enable the Company to attract and retain employees and to provide a means of compensating those employees, and directors, officers and other individuals or entities integral to the Company's success. The Plan is administered by the Company’s Board of Directors. |
||
The Plan requires the Company to reserve and have available for issue, 3,600,000 common shares, less that number of common shares reserved for issuance pursuant to stock options granted under the Revett Silver stock option plan. The aggregate number of common shares that may be issued to any holder or awarded to any grantee under the Plan may not exceed five percent of the outstanding common shares. Vesting of options is at the discretion of the Board at the time the options are granted. |
||
The continuity of stock options granted and outstanding is as follows: |
||
| 2010 | 2009 | 2008 | |||||||||||||||||
| Weight | Weight | Weight | |||||||||||||||||
| average | average | Number | average | ||||||||||||||||
| Number | exercise | Number | exercise | of shares | exercise | ||||||||||||||
| of shares | price | of shares | price | price | |||||||||||||||
| Outstanding, beginning of year | 1,714,000 | $ | 2.15 | 748,000 | $ | 5.05 | 747,000 | $ | 5.10 | ||||||||||
| Granted | 616,000 | 2.27 | 1,135,000 | 0.60 | 12,000 | 3.00 | |||||||||||||
| Cancelled | (331,000 | ) | 4.34 | (159,000 | ) | 4.85 | (11,000 | ) | 5.50 | ||||||||||
| Exercised | (691,500 | ) | 0.74 | (10,000 | ) | 0.50 | - | - | |||||||||||
| Outstanding, end of year | 1,307,500 | $ | 2.39 | 1,714,000 | $ | 2.15 | 748,000 | $ | 5.05 | ||||||||||
| Options exercisable | 1,307,500 | $ | 2.39 | 1,714,000 | 2.15 | 658,000 | $ | 5.05 | |||||||||||
F-21
| REVETT MINERALS INC. |
| Notes to Consolidated Financial Statements |
| (Expressed in United States dollars, unless otherwise stated) |
| (Tabular amounts expressed in thousands of United States dollars, except share and per share amounts) |
| Years ended December 31, 2010, 2009 and 2008 |
| 10. | Share capital (continued): |
|
| (c) | Stock options (continued): |
|
Details of the outstanding stock options as at December 31, 2010 are presented below: |
||
| Number of options granted | Number | ||||
| and outstanding | Exercise price | exercisable | Expiry date | ||
| 25,000 | US$0.75 | 25,000 | May 1, 2011 | ||
| 8,000 | CAD$6.25 | 8,000 | May 12, 2011 | ||
| 55,000 | US$0.45 | 55,000 | June 16, 2011 | ||
| 30,000 | US$2.15 | 30,000 | June 16, 2011 | ||
| 10,000 | US$1.65 | 10,000 | June 30, 2011 | ||
| 4,000 | CAD$6.25 | 4,000 | September 15, 2011 | ||
| 12,000 | US$2.15 | 12,000 | September 30, 2011 | ||
| 169,000 | CAD$5.50 | 169,000 | October 4, 2011 | ||
| 5,000 | CAD$7.25 | 5,000 | December 4, 2011 | ||
| 90,000 | CAD$5.55 | 90,000 | January 10,2012 | ||
| 8,000 | CAD$5.75 | 8,000 | March 5, 2012 | ||
| 6,000 | CAD$3.00 | 6,000 | April 29, 2013 | ||
| 10,000 | US$2.50 | 10,000 | November 1, 2013 | ||
| 20,000 | US$4.30 | 20,000 | December 13, 2013 | ||
| 15,000 | US$4.30 | 15,000 | December 13, 2013 | ||
| 187,500 | CAD$0.525 | 187,500 | March 31, 2014 | ||
| 53,000 | CAD$0.45 | 53,000 | April 27, 2014 | ||
| 110,000 | US$0.45 | 110,000 | September 10, 2014 | ||
| 20,000 | US$1.05 | 20,000 | November 2, 2014 | ||
| 30,000 | US$1.65 | 30,000 | December 30, 2014 | ||
| 400,000 | US$2.15 | 400,000 | March 15, 2015 | ||
| 20,000 | US$2.50 | 20,000 | December 13, 2015 | ||
| 20,000 | US$1.50 | 20,000 | June 17, 2015 | ||
| 1,307,500 | 1,307,500 |
The weighted average fair value of options granted during the year ended December 31, 2010 was $2.30 (2009 - $0.408; 2008 - $1.55) per share. The fair value of stock options granted was estimated using the Black-Scholes option pricing model with the following weighted average assumptions:
| (i) | Risk-free interest rate 1.02% to 1.17% (2009 - 1.18% to 2.69%; 2008 - 2.23% to 2.84%). |
|
| (ii) | Expected life - 5 years (2009 - 5 years; 2008 - 4 years). |
|
| (iii) | Volatility – 111% (2009 - 98%; 2008 - 71%). |
|
| (iv) | Expected dividends – nil. |
Total stock-based compensation recognized during the year ended December 31, 2010 was $1.0 million (2009 - $0.4 million; 2008 - $0.3 million).
F-22
| REVETT MINERALS INC. |
| Notes to Consolidated Financial Statements |
| (Expressed in United States dollars, unless otherwise stated) |
| (Tabular amounts expressed in thousands of United States dollars, except share and per share amounts) |
| Years ended December 31, 2010, 2009 and 2008 |
| 10. | Share capital (continued): |
|
| (d) | Share purchase warrants: |
|
As at December 31, 2010, the following share purchase warrants are outstanding: |
||
| Number | Exercise price | Expiry | ||||||||
| Revett Minerals | 60,000 | CAD$2.50 | October 2011 | |||||||
| Revett Minerals | 147,333 | US$5.00 | June 2012 | |||||||
| Revett Minerals | 1,217,717 | CAD$1.75 | August 24, 2013 | |||||||
| Revett Minerals | 244,836 | CAD$1.75 | August 31, 2013 | |||||||
| Revett Minerals | 200,000 | US$1.50 | October 7, 2013 | |||||||
| 1,869,886 |
| 11. | Income taxes: |
The Company’s income tax rate differs from the amounts computed by applying the combined United States federal and state statutory rate of 39.82% (2009 - 39.09%; 2008 – 39.09%) as follows: |
| 2010 | 2009 | 2008 | ||||||||
| Income (loss) before income taxes and non-controlling interest | $ | 4,453 | $ | (5,586 | ) | $ | (12,066 | ) | ||
| Expected tax recovery (expense) | $ | (1,773 | ) | $ | 2,184 | $ | 4,716 | |||
| Change in valuation allowance | 766 | (2,805 | ) | (271 | ) | |||||
| Depletion deduction | 1,288 | - | - | |||||||
| Other differences | (314 | ) | 849 | (1,760 | ) | |||||
| Income tax recovery (expense) | $ | (33 | ) | $ | 228 | $ | 2,685 |
The significant components of the Company’s future income tax assets and liabilities at December 31, 2010 and 2009 are as follows:
| 2010 | 2009 | ||||||
| Future income tax assets: | |||||||
| Reclamation and remediation | $ | 3,069 | $ | 3,192 | |||
| Net operating losses: | |||||||
| United States | 13,415 | 14,600 | |||||
| Canada | 2,707 | 2,374 | |||||
| Other assets | 751 | 338 | |||||
| Total future income tax assets | 19,942 | 20,504 | |||||
| Valuation allowance | (4,035 | ) | (4,801 | ) | |||
| Net future income tax assets | 15,907 | 15,703 | |||||
| Future income tax liabilities: | |||||||
| Mineral property, plant and equipment | $ | (15,907 | ) | $ | (15,703 | ) | |
| Net future income tax liability | $ | - | $ | - |
F-23
| REVETT MINERALS INC. |
| Notes to Consolidated Financial Statements |
| (Expressed in United States dollars, unless otherwise stated) |
| (Tabular amounts expressed in thousands of United States dollars, except share and per share amounts) |
| Years ended December 31, 2010, 2009 and 2008 |
| 11. | Income taxes (continued): |
||
At December 31, 2010, the Company has federal United States losses of approximately $34.4 million (2009 - $37.4 million), State losses of approximately $29.5 million (2009 - $32.6 million) and Canadian losses of approximately $11.8 million (2009 - $9.5 million), which may be carried forward and used to reduce certain taxable income in future years. The use of the United States losses that were incurred prior to the acquisition of Revett Silver is subject to an annual limitation of approximately $2.1 million. The United States and Canadian losses expire at various dates between 2019 and 2029. |
|||
| 12. | Commitments and contingencies: |
||
| (a) | Litigation: |
||
| (i) | Cabinet Resources Group, Inc. (plaintiff) v. Montana Department of Environmental Quality and Genesis Inc. (defendants): The plaintiff’s suit alleges that Troy is being operated in violation of the Montana Metal Mine Reclamation Act (“MMRA”) because of deficiencies in its reclamation plan and that all of the defendants have violated the Montana Constitution and various state statutes and regulations by allowing such operations to continue. The plaintiff seeks a declaration that the Troy operating permit and reclamation plan are void and invalid; alternatively it seeks a writ of madamus from the court requiring the DEQ to enforce the MMRA and presumably suspend or revoke Troy’s operating permit, declare a forfeiture of the Company’s performance bond and enjoin the Company from further operations at Troy pending approval of a new reclamation plan. The Company believes this action is without merit, particularly in view of on-going discussions with the DEQ concerning proposed revisions to the existing approved reclamation plan at Troy and the increased performance bonds provided to the DEQ. The Court has indicated that it will not set a trial date until DEQ has completed its required review of the reclamation plan. The Company is vigorously defending itself with respect to this action. |
||
F-24
| REVETT MINERALS INC. |
| Notes to Consolidated Financial Statements |
| (Expressed in United States dollars, unless otherwise stated) |
| (Tabular amounts expressed in thousands of United States dollars, except share and per share amounts) |
| Years ended December 31, 2010, 2009 and 2008 |
| 12. | Commitments and contingencies (continued): |
||
| (a) | Litigation (continued): |
||
| (ii) | Rock Creek Permitting Matters: |
||
There are a number of permitting challenges or letters of petition relating to the United States Forest Service (USFS) and DEQ granting the Rock Creek record of decision and supporting studies and analysis. These challenges have been mounted by individuals or organizations generally opposed to mining in the United States and are similar in nature to the claims described in (i) above. The Company, generally, is not named as a party to these actions but in certain cases has received intervener status due to the direct impact the outcome of these actions will have on the Company’s Rock Creek property development plans. Where the Company has prevailed, the decision of the court is being appealed by the plaintiffs or petitioners. Therefore, the outcome of these matters is not determinable. |
|||
On March 29, 2010, the US District Court ruled that the Forest Service's decision to approve the Rock Creek project is vacated and the 2003 Record of Decision and 2001 Final Environmental Impact Statement are set aside and remanded to the Forest Service for further action. Based on the Company's review of the judgment, the Company does not believe that the judgment prevents the Company from developing the Rock Creek project but it may delay such development until the Company is able to satisfactorily address the Court’s concerns. Although the Company believes that it will ultimately receive environmental and operating permits, it is possible that successful challenges could delay or prevent the Company from developing the Rock Creek project which could result in the impairment and write-down of the carrying value related to the Rock Creek property. |
|||
| (b) | Kennecott royalty: |
||
Kennecott Royalty Company (“Kennecott”) has the right to acquire a 2% net smelter return royalty (the NSR royalty) from the sale of metals from a defined area of the Company's Rock Creek property anytime until the later of one year after Rock Creek achieves 80% of designed commercial capacity production or December 31, 2015. Kennecott is required to surrender 450,000 shares of the Company's common shares to acquire the NSR royalty. This NSR royalty terminates upon Kennecott's recovery of $8.0 million in total royalty payments plus an adjustment related to changes in the consumer price index. |
|||
| (c) | Operating leases: |
||
The Company has entered into a number of operating leases relating to the production and transportation of the copper concentrate produced at Troy. All such leases expire in 2011 and many may be renewed annually. Total operating lease costs recognized for the years ended December 31, 2010, 2009, and 2008 was $0.5 million, $0.5 million and $0.5 million, respectively. The obligations in 2011 under the terms of these leases are $0.4 million. |
|||
F-25
| REVETT MINERALS INC. |
| Notes to Consolidated Financial Statements |
| (Expressed in United States dollars, unless otherwise stated) |
| (Tabular amounts expressed in thousands of United States dollars, except share and per share amounts) |
| Years ended December 31, 2010, 2009 and 2008 |
| 12. | Commitments and contingencies (continued): |
|
| (d) | Royal Gold royalty: |
|
In October 2004, Revett Silver sold Royal Gold two royalties on production from the Troy Mine for $7.25 million (the Production Payment) and $0.25 million (the Tail Royalty), respectively. The Production Payment royalty was a 7% gross smelter return royalty payable in cash on production and limited to the lesser of 90% of production revenue to be received on proven and probable reserves existing for Troy as at October 13, 2004 or $10.5 million. The Tail Royalty was payable in cash at the rate of 6.1% on the gross smelter returns from Troy for production revenue arising on between 100% and 115% of its proven and probable reserves which existed as at October 13, 2004 and then at the rate of 2% of production revenue on production revenues in excess of 115% of proven and probable reserves as at October 13, 2004. During 2009, production royalty obligations of $1.6 million were payable to Royal Gold. On October 13, 2009, the Company and Royal Gold agreed to restructure the Tail Royalty in exchange for a payment from Royal Gold to the Company in the amount of $ 1.6 million. The Company used the $1.6 million proceeds from the restructuring of the Tail Royalty to repay the $1.6 million production royalty obligation. The payment received from Royal Gold was credited against the Troy mineral property. The Tail Royalty was restructured to a 3% gross smelter return payable over the life of the Troy Mine commencing with production on and after July 1, 2010. |
||
| 13. | Financial instruments: |
|
| (a) | Financial risk management: |
|
The Company has exposure to credit risk, liquidity risk and market risk from its use of financial instruments. |
||
| (b) | Credit risk: |
|
Credit risk is the potential for loss if a counterparty or customer fails to meet its financial obligations, principally with respect to the Company’s cash and cash equivalents, restricted cash and accounts receivable and if applicable, from the counterparty’s failure to honor obligations on forward contracts. In general, the Company manages this risk by doing business with reputable, highly rated companies and by closely monitoring the prompt payment of all obligations owing it. |
||
Copper concentrate is sold to one customer under a long-term contract. This customer is a privately held international metal trading company and it is one of the largest metal trading companies in the world. The Company receives a 90% provisional payment 14 days from the rail bill of lading date and may be at risk for this payment and the remaining provisional payments on prior shipments should this company encounter significant liquidity problems. Since 2005, the Company has received prompt and timely payment for all outstanding metal sales invoices. All sales are finalized and are required to be settled within three months of the rail car arriving at the smelter. Therefore, if the Company’s current customer is unable to purchase the Company’s concentrate, the Company believes that another buyer could be found, although the terms and conditions may not be the same as those obtained from the current arrangement. |
||
F-26
| REVETT MINERALS INC. |
| Notes to Consolidated Financial Statements |
| (Expressed in United States dollars, unless otherwise stated) |
| (Tabular amounts expressed in thousands of United States dollars, except share and per share amounts) |
| Years ended December 31, 2010, 2009 and 2008 |
| 13. | Financial instruments (continued): |
|
| (b) | Credit risk (continued): |
|
The Company may be exposed to credit risk on copper and silver forward contracts if the counterparty were not to honor its contractual commitment at settlement. The Company attempts to manage this risk by contracting only with reliable and reputable third parties. All current forward contracts are with its customer. |
||
The Company manages its credit risk associated with cash and cash equivalents through the use of large reputable regional financial institutions in the United States and in Canada by utilizing the services of one of Canada’s largest chartered banks. At December 31, 2010, the Company held cash and cash equivalents in the amount of $8.8 million. The Company uses two banking institutions, a local regional bank which holds approximately $6.5 million of the total, and a major Canadian chartered bank which holds approximately $2.3 million. The funds held by the Canadian chartered bank are only invested in certificates of deposit which have a typical maturity of less than a year and are cashable on demand. All of the total $6.5 million held in the regional bank is liquid, held in checking, or sweep accounts. The Board of Directors has approved a policy with respect to the investment of cash that includes criteria such as maximum length to maturity, concentration of holdings, portfolio liquidity requirements, and counterparty credit worthiness. |
||
The Company is required to provide third party financial assurance to the State of Montana regarding its reclamation obligations. This assurance is provided by an insurance company with a credit rating of A+ XV by AM Best, and this company also holds and controls the Commutation Account funds. The Commutation Account is used to secure the financial assurance required by the State. This provider of the financial assurance and the holder of the Commutation Account Funds must be approved by the State of Montana. However, should this company become insolvent, the State will require third party assurance from a different assurance company which may not be obtainable, in which case the operating permits at Troy and Rock Creek could be revoked. |
||
The carrying amount of financial assets represents the maximum credit exposure. At December 31, 2010, the Company’s gross credit exposure was as follows: |
||
| Cash and cash equivalents | $ | 8,766 | ||
| Accounts receivable | 3,553 | |||
| Restricted cash | 6,498 | |||
| $ | 18,817 |
F-27
| REVETT MINERALS INC. |
| Notes to Consolidated Financial Statements |
| (Expressed in United States dollars, unless otherwise stated) |
| (Tabular amounts expressed in thousands of United States dollars, except share and per share amounts) |
| Years ended December 31, 2010, 2009 and 2008 |
| 13. | Financial instruments (continued): |
|
| (c) | Liquidity risk: |
|
Liquidity risk is the risk the Company will not be able to obtain sufficient cash to meet its financial obligations as they come due. This risk is typically managed through the prudent investment of cash balances, through the close monitoring of discretionary expenditures, such as capital and exploration programs and by the preparation of detailed cash forecasts and monitoring trends in metal production and metal prices. Significant cash commitments at December 31, 2010 are as follows: |
||
| 1 year | 2-3 years | 3 plus years | Total | ||||||||||
| Accounts payable and accrued liabilities | $ | 5,113 | $ | - | $ | - | $ | 5,113 | |||||
| Capital leases (1) | 691 | 772 | 48 | 1,511 | |||||||||
| Operating leases | 354 | - | - | 354 | |||||||||
| Asset retirement obligation (2) | - | - | 14,362 | 14,362 |
| (1) | These amounts include interest. |
|
| (2) | These amounts represent the undiscounted cash flow estimates. |
| (d) | Market risk: |
||
Market risk is the risk that changes in market prices, such as commodity prices, foreign exchange rates, and interest rates will affect the Company’s income, cash flow or the value of its financial instruments. |
|||
| (i) | Commodity price risk: |
||
This is the largest market risk the Company is exposed to as changes in the prices of copper and silver will have a significant effect on revenue, cash flow and the value of concentrate receivables or payables because a significant portion of the Company’s sales are subject to a future pricing mechanism and changes in metal prices will change both revenue and the value of concentrate receivables or payables. The Company does have a hedging policy which permits the Company to fix the sales price of concentrate to be produced in the future or for which concentrate has been sold and for which final settlement has not occurred. |
|||
F-28
| REVETT MINERALS INC. |
| Notes to Consolidated Financial Statements |
| (Expressed in United States dollars, unless otherwise stated) |
| (Tabular amounts expressed in thousands of United States dollars, except share and per share amounts) |
| Years ended December 31, 2010, 2009 and 2008 |
| 13. | Financial instruments (continued): |
||
| (d) | Market risk: |
||
| (i) | Commodity price risk (continued): |
||
For financial statement purposes, the Company records at fair value the amount of silver and copper in concentrate sold to its customer for which final prices have not yet been determined. At each month-end, the Company adjusts its revenue to account for expected future prices and the corresponding expected future revenue and cash flow. In order to do this, the Company must make estimates of the future prices expected to prevail when final settlement occurs. The Company uses published forward prices for the period of expected settlement to estimate these expected prices. |
|||
At December 31, 2010, the Company had 1.5 million pounds of copper (2009 - 0.2 million pounds) priced at an average of $4.40 per pound (2009 - $3.38) and 156,613 ounces of silver (2009 - 17,438 ounces) priced at an average of $28.31 per ounce (2009 - $18.46), subject to final pricing in the first quarter of 2011. |
|||
A 10% change in the forward price of both metals at December 31, 2010 would change earnings by approximately $0.6 million for the year ended December 31, 2010. |
|||
As at December 31, 2010, the Company had contracts outstanding to sell 5.2 million pounds of copper at an average price of $3.55 per pound and 360,000 ounces of silver at an average price of $19.00. These contracts mature at various dates from March, 2011 to February, 2012. All contracts are with the Company’s customer and have been designated as normal purchase and sale. Accordingly, the effects of these contracts are accounted for in the period they are settled. |
|||
During the year, the Company and its primary concentrate customer agreed to financially settle forward contracts of 1.3 million pounds of copper and use the notional proceeds on settlement to repay a portion of the note payable owing to the customer. The Company recognized a gain of $0.7 million on the settlement of the forward contracts which is reflected in revenue. |
|||
| (ii) | Interest rate risk: |
||
At December 31, 2010, the Company had limited interest rate risk as the majority of its capital leases have fixed rates of interest and secondly, its cash investments are of a sufficiently short duration that changes in interest rates are unlikely to have significant effect on the value of these investments. |
|||
F-29
| REVETT MINERALS INC. |
| Notes to Consolidated Financial Statements |
| (Expressed in United States dollars, unless otherwise stated) |
| (Tabular amounts expressed in thousands of United States dollars, except share and per share amounts) |
| Years ended December 31, 2010, 2009 and 2008 |
| 13. | Financial instruments (continued): |
||
| (d) | Market risk (continued): |
||
| (iii) | Foreign exchange risk: |
||
The Company’s only foreign exchange risk is its exposure to the Canadian dollar which as at December 31, 2010 is limited to the $2.3 million dollars invested in Canadian dollars with a Canadian chartered bank. The Company has limited operating risk created through changes in foreign exchange because its operating assets are located in the United States, the U.S. dollar is the Company’s functional currency, and metal sales are priced in United States dollars. A 10% change in the value of the Canadian dollar against the U.S. dollar as at December 31, 2010, would have changed net income by less than $0.01 million, all other things being held constant. |
|||
| (e) | Fair values: |
||
The carrying values of cash and cash equivalents, accounts receivable, restricted cash, and accounts payable and accrued liabilities approximate fair value due to their limited time to maturity or ability to immediately convert them to cash in the normal course. The carrying value of concentrate settlement payable or receivable are marked to market each month using quoted forward prices as at the last trading day of each month, and accordingly are recognized at fair value. The carrying values of capital lease obligations approximate fair market values as they are based on market rates of interest. The fair value of the Company’s unrecognized outstanding forward sales contracts as at December 31, 2010 is a liability of approximately $7.9 million. |
|||
The Company classifies financial instruments recognized at fair value in accordance with a fair value hierarchy that prioritizes the inputs to valuation techniques used to measure fair value. The hierarchy gives the highest priority to unadjusted quoted prices in active markets for identical assets or liabilities (Level 1 measurements) and the lowest priority to unobservable inputs (Level 3 measurements). The three levels of the fair value hierarchy are described below: |
|||
| Level 1 | Unadjusted quoted prices in active markets that are accessible at the measurement date for identical, unrestricted assets or liabilities; |
|
| Level 2 | Quoted prices in markets that are not active, or inputs that are observable, either directly or indirectly, for substantially the full term of the asset or liability; and |
|
| Level 3 | Prices or valuation techniques that require inputs that are both significant to the fair value measurement and unobservable (supported by little or no market activity). |
F-30
| REVETT MINERALS INC. |
| Notes to Consolidated Financial Statements |
| (Expressed in United States dollars, unless otherwise stated) |
| (Tabular amounts expressed in thousands of United States dollars, except share and per share amounts) |
| Years ended December 31, 2010, 2009 and 2008 |
| 13. | Financial instruments (continued): |
|
| (e) | Fair values (continued): |
|
The following table sets forth the Company’s financial assets and liabilities measured at fair value by level within the fair value hierarchy. Assets and liabilities are classified in their entirety based on the lowest level of input that is significant to the fair value measurement. |
||
| Fair value at December 31, 2010 | |||||||||||||
| Total | Level 1 | Level 2 | Level 3 | ||||||||||
| Cash equivalents | $ | 8,766 | $ | 8,766 | $ | - | $ | - | |||||
| Restricted cash | 6,498 | 6,498 | - | - | |||||||||
| Concentrate receivables | 3,429 | - | 3,429 | - | |||||||||
| $ | 18,693 | $ | 15,264 | $ | 3,429 | $ | - | ||||||
The Company’s cash equivalent instruments including restricted cash are classified within Level 1 of the fair value hierarchy because they are valued using quoted market prices. The cash equivalent instruments that are valued based on quoted market prices in active markets are primarily money market securities and U.S. Treasury securities.
The Company’s concentrate receivable, which includes provisionally priced sales, are valued using pricing models and the Company generally uses similar models to value similar instruments. Where possible, the Company verifies the values produced by its pricing models to market prices. Valuation models require a variety of inputs, including contractual terms, market prices, yield curves, credit spreads, measures of volatility, and correlations of such inputs. Such instruments are typically classified within Level 2 of the fair value hierarchy.
| 14. | Segmented information: |
The Company considers itself to operate in a single segment being copper and silver mining and related activities including exploration, development, mining and processing. All revenues earned and mineral, property, plant and equipment are located in the United States. For all periods presented, all revenues, accounts receivables and concentrate settlements payable are from one customer pursuant to a concentrate sales agreement. |
F-31
| REVETT MINERALS INC. |
| Notes to Consolidated Financial Statements |
| (Expressed in United States dollars, unless otherwise stated) |
| (Tabular amounts expressed in thousands of United States dollars, except share and per share amounts) |
| Years ended December 31, 2010, 2009 and 2008 |
| 15. | Reconciliation to United States generally accepted accounting principles: |
The consolidated financial statements have been prepared in accordance with Canadian generally accepted accounting principles (“Canadian GAAP”), which differ in certain material respects from those principles that the Company would have followed had its consolidated financial statements been prepared in accordance with United States generally accepted accounting principles (“US GAAP”). |
|
The effect of the material measurement differences between Canadian GAAP and US GAAP on the amounts reported in the consolidated balance sheets, statements of operations and cash flows are as follows: |
| 2010 | 2009 | ||||||
| Total assets under Canadian GAAP | $ | 77,858 | $ | 67,700 | |||
| Adjustment to property, plant and equipment for acquisition of non-controlling interest (g) | 3,400 | 3,767 | |||||
| Unamortized finance costs | - | 401 | |||||
| Total assets under US GAAP | $ | 81,258 | $ | 71,868 | |||
| Total liabilities and non-controlling interest under Canadian GAAP | $ | 14,451 | $ | 18,719 | |||
| Warrants (f) | 5,876 | - | |||||
| Unamortized finance costs | - | 401 | |||||
| Total liabilities under US GAAP | 20,327 | 19,120 | |||||
| Temporary equity - shares redeemable at option of holder (a) | 676 | 676 | |||||
| Total liabilities and temporary equity | $ | 21,003 | $ | 19,796 | |||
| Shareholders’ equity under Canadian GAAP | $ | 63,407 | $ | 48,981 | |||
| Shares redeemable at option of holder (a) | (676 | ) | (676 | ) | |||
| Reclassification of warrants (f) | (1,209 | ) | - | ||||
| Adjustment to contributed surplus on acquisition of non- controlling interest (g) | 2,473 | 2,473 | |||||
| Adjustment to deficit for additional depreciation and income taxes (g) | 927 | 1,294 | |||||
| Mark-to-market loss on warrants (f) | (4,667 | ) | - | ||||
| Total shareholders’ equity under US GAAP | $ | 60,255 | $ | 52,072 |
F-32
| REVETT MINERALS INC. |
| Notes to Consolidated Financial Statements |
| (Expressed in United States dollars, unless otherwise stated) |
| (Tabular amounts expressed in thousands of United States dollars, except share and per share amounts) |
| Years ended December 31, 2010, 2009 and 2008 |
| 15. | Reconciliation to United States generally accepted accounting principles (continued): |
| 2010 | 2009 | 2008 | ||||||||
| Net income (loss) and comprehensive income (loss) under Canadian GAAP | $ | 4,420 | $ | (4,967 | ) | $ | (6,690 | ) | ||
| Depreciation (g) | (367 | ) | (325 | ) | - | |||||
| Income taxes (g) | - | 1,619 | - | |||||||
| Mark-to-market loss on warrants (f) | (4,667 | ) | - | - | ||||||
| Net loss and comprehensive loss under US GAAP | $ | (614 | ) | $ | (3,673 | ) | $ | (6,690 | ) | |
| Basic and diluted loss per share | $ | (0.02 | ) | $ | (0.15 | ) | $ | (0.45 | ) |
There are no material differences between Canadian GAAP and US GAAP with respect to total operating, financing or investing cash flows in the consolidated statement of cash flows.
| (a) | Redeemable shares: |
|
The Company has issued 450,000 common shares which are redeemable, at the option of the holder, into a net smelter return royalty as described in note 12(c). Under Canadian GAAP, the equity portion of these shares is classified as equity. Under US GAAP, the full value associated with the redeemable shares is classified as temporary equity. |
||
| (b) | Income taxes: |
|
For Canadian GAAP purposes, future income tax assets and liabilities are calculated based on substantially enacted tax rates in effect in the periods when the temporary differences are expected to reverse. For US GAAP purposes, enacted tax rates are used to calculate future income tax assets and liabilities. For all periods presented, there were no differences between the tax rates used for Canadian and US GAAP purposes. |
||
The Company has reviewed its income tax positions in its tax filings and, based on its review, the Company does not believe that any income tax positions taken are subject to material uncertainty if reviewed by the Internal Revenue Service or Canada Revenue Agency. In cases where the Company is charged interest and penalties on uncertain tax positions which do not meet the recognition criteria, the Company includes these in interest expense and other operating expenses respectively. Tax years subsequent to December 31, 2004 remain open for examination by the Internal Revenue Service and Canada Revenue Agency. However, in both jurisdictions, if the Company utilizes tax loss carry forwards in the future, those losses can be challenged in the year they are used even though the tax year in which they were incurred is statute barred. |
F-33
| REVETT MINERALS INC. |
| Notes to Consolidated Financial Statements |
| (Expressed in United States dollars, unless otherwise stated) |
| (Tabular amounts expressed in thousands of United States dollars, except share and per share amounts) |
| Years ended December 31, 2010, 2009 and 2008 |
| 15. | Reconciliation to United States generally accepted accounting principles (continued): |
|
| (c) | Equity units: |
|
Under Canadian GAAP, the proceeds received on issuance of equity units, consisting of common shares and warrants, are not required to be allocated to the individual common share and warrant components when the instrument and its components are all determined to be equity instruments. Under US GAAP, the Company is required to allocate the proceeds received on unit offerings to the individual common share and warrant components on a relative fair value basis when both components are determined to be classified as equity. Prior to 2009, the Company had not allocated its proceeds of unit offerings to the shares and warrants. Accordingly, under US GAAP, share capital would be reduced as at December 31, 2010 by $1.0 million. As these warrants had exercise prices denominated in Canadian dollars, for US GAAP purposes, these warrants were treated as financial liabilities at fair value with changes in fair value recognized in the net income (loss) (see also note 15(f) below). As the warrants expired unexercised, deficit would be decreased by $1.0 million at December 31, 2010 being the original fair value of these warrants recognized on issue. |
||
| (d) | Stock option plan and compensation expense: |
|
As at December 31, 2010, the weighted average intrinsic value of options outstanding and exercisable was $3.2 million (2009 - $1.1 million). |
||
As at December 31, 2010, the total unrecognized compensation cost related to unvested stock options is nil. |
||
| (e) | Inventory: |
|
Under Canadian GAAP, in certain circumstances, inventory written down to net realizable value may be written up to its original cost. Under US GAAP, such write-up would not be permitted. For all periods presented, no inventory was written up. |
||
| (f) | Warrants: |
|
Under Canadian GAAP, outstanding share purchase warrants are classified and accounted for as equity. Certain of the Company’s share purchase warrants have an exercise price denominated in a currency other than the Company's functional currency and are not considered to be indexed to the Company’s own stock. Accordingly, for US GAAP purposes, these warrants are classified and accounted for as a financial liability at their fair value with changes in fair value included in net income (loss). |
||
For the year ended December 31, 2010, the mark to market loss was $4.7 million (2009 - nil). The fair value of the warrants of $5.9 million as at December 31, 2010 has been determined using a Black-Sholes option pricing model using the following assumptions: expected life of 2.6 years: volatility of 118%; risk free discount note of 1.02%. This measurement would be designed as Level 2 in the fair value hierarchy. |
||
F-34
| REVETT MINERALS INC. |
| Notes to Consolidated Financial Statements |
| (Expressed in United States dollars, unless otherwise stated) |
| (Tabular amounts expressed in thousands of United States dollars, except share and per share amounts) |
| Years ended December 31, 2010, 2009 and 2008 |
| 15. | Reconciliation to United States generally accepted accounting principles (continued): |
|
| (g) | Non-controlling interest: |
|
For US GAAP purposes, non-controlling interest is classified as equity whereas for Canadian GAAP, it is classified between liabilities and equity. Also, net income (loss) before non-controlling interest, non-controlling interest, and net income (loss) presented under Canadian GAAP would be labeled net income (loss), net income (loss) attributable to non-controlling interest and net income (loss) attributable to the Company, respectively under US GAAP. |
||
The acquisition of the non-controlling interest during the year ended December 31, 2009 would be accounted for as an equity transaction for US GAAP purposes rather than a step acquisition using the purchase method. Accordingly, for US GAAP purposes, a reduction of mineral property, plant, and equipment of $4.1 million and a reduction of the future income tax liability of $1.6 million recorded for Canadian GAAP purposes would not be made under US GAAP and instead $2.5 million would be included in contributed surplus. In addition, under US GAAP, additional depreciation expense of $0.4 million (2009 - $0.3 million) for the year ended December 31, 2010 and a future income tax recovery of $1.6 million for the year ended December 31, 2009 was recognized. |
||
The following table shows the changes in the non-controlling interest under US GAAP during the year ended December 31, 2009: |
||
| 2009 | ||||
| Balance, beginning of year | $ | 5,253 | ||
| Loss attributable to non-controlling interest | (391 | ) | ||
| Acquisition of non-controlling interest | (4,862 | ) | ||
| Balance, end of year | $ | - |
The following table shows, using US GAAP measurements, the effect of changes to the Company’s interest in Revett Silver on shareholders’ equity attributable to the Company:
| 2010 | 2009 | ||||||
| Net loss under US GAAP attributable to the Company | $ | (614 | ) | $ | (3,673 | ) | |
| Increase in contributed surplus on acquisition of non- controlling interest | - | 2,473 | |||||
| Change from loss attributable to the Company and acquisition of non-controlling interest | $ | (614 | ) | $ | (1,200 | ) |
F-35
| REVETT MINERALS INC. |
| Notes to Consolidated Financial Statements |
| (Expressed in United States dollars, unless otherwise stated) |
| (Tabular amounts expressed in thousands of United States dollars, except share and per share amounts) |
| Years ended December 31, 2010, 2009 and 2008 |
| 15. | Reconciliation to United States generally accepted accounting principles (continued): |
|||
| (h) | Impact of recent United States accounting pronouncements: |
|||
| (i) | In February 2010, the Financial Accounting Standards Board (“FASB”) issued accounting standards update (“ASU”) 2010-09, which among other things, amended US GAAP with respect to the date through which evaluation of subsequent events must occur and under which circumstances such date must be disclosed. The new standard does not require the Company to disclose the date through which subsequent events have been evaluated as this guidance does not apply to entities who file with the Securities and Exchange Commission. However, the Company is required to disclose any material subsequent events up to the date it files it financial statements with the Securities and Exchange Commission. All of the amendments in this update became effective upon issuance. Adoption of this guidance did not have a material impact on our consolidated financial statements. |
|||
| (ii) | In April, 2010, the FASB issued ASU 2010-13 which addressed the classification of a share- based payment award with an exercise price denominated in the currency of a market in which the underlying equity security trades. The new standard clarifies that a share-based payment award with an exercise price denominated in the currency of a market in which a substantial portion of the entity’s equity securities trades is not considered to contain a market condition. Therefore, such an award is not classified as a liability if it otherwise qualifies as equity classification. Adoption of this guidance did not have a material impact on our consolidated financial statements. |
|||
| (iii) | In January 2010, the FASB issued ASU 2010-06, which requires new disclosures on fair value measurements as follows: |
|||
| 1. | The amounts of and reasons for significant transfers in and out of Levels 1 and 2. |
|||
| 2. | Separate information about purchases, sales, issuances, and settlements in Level 3 fair value measurements. |
|||
ASU 2010-06 also clarifies existing fair value measurement disclosures as follows: |
||||
| 1. | A reporting entity should provide fair value measurement disclosures for each class of assets and liabilities. A class is often a subset of assets or liabilities within a line item in the statement of financial position. |
|||
| 2. | A reporting entity should provide disclosures about the valuation techniques and inputs used to measure fair value for both recurring and nonrecurring fair value measurements. Those disclosures are required for fair value measurements that fall in either Level 2 or Level 3. |
|||
F-36
| REVETT MINERALS INC. |
| Notes to Consolidated Financial Statements |
| (Expressed in United States dollars, unless otherwise stated) |
| (Tabular amounts expressed in thousands of United States dollars, except share and per share amounts) |
| Years ended December 31, 2010, 2009 and 2008 |
| 15. | Reconciliation to United States generally accepted accounting principles (continued): |
|
| (h) | Impact of recent United States accounting pronouncements: |
|
The new disclosures and clarifications of existing disclosures discussed above are effective for interim and annual reporting periods beginning after December 15, 2009, except for the disclosures about purchases, sales, issuances and settlements in the roll forward of activity in Level 3 fair value measurements. Those disclosures are effective for fiscal years beginning after December 15, 2010, and for interim periods within those fiscal years. Adoption of this guidance has not, and is not expected to have a material impact on our consolidated financial statements. |
||
| 16. | Subsequent events: |
|
On March 16, 2011, the Company purchased the 2% net smelter royalty interest on future Rock Creek production (note 12(b)) that was previously owned by Kennecott. The Company issued 275,000 of its common shares with a fair market value of $1.2 million to acquire this royalty interest. |
||
F-37
Item 9. Changes in and Disagreements with Accountants on Accounting and Financial Disclosure.
There were no changes in or disagreements with the registrant’s accountants on accounting and financial disclosure during the year.
Item 9A. Controls and Procedures.
Management is responsible for adopting an internal control system that gives it and the board of directors reasonable assurance that the Company’s financial statements present fairly its financial position and activities. Management is also responsible for establishing and maintaining disclosure controls and procedures that provide reasonable assurance that material information concerning the Company including its consolidated subsidiaries is appropriately disclosed.
Disclosure Controls and Procedures. Our disclosure controls and procedures are designed to ensure that information we are required to disclose in our periodic reports and other information filed under the Exchange Act is recorded, processed, summarized and accurately reported within the time periods prescribed by the Securities and Exchange Commission’s rules. They include, without limitation, controls and procedures designed to ensure that such information is accumulated and promptly communicated to our management, including our chief executive officer and our chief financial officer and other principal accounting officers, so such persons can make timely decisions regarding disclosure.
In 2010, we evaluated the effectiveness of the design and operation of our disclosure controls and procedures as required by Rules 13(a)-15(e) and 15(d)-15(e) under the Exchange Act. This evaluation was performed under the supervision and with the participation of our management, including our chief executive officer and our chief financial officer. Based upon this evaluation, our chief executive officer and chief financial officer concluded that the design and operation of the Company’s disclosure controls and procedures were effective as at December 31, 2010 to ensure that information required to be disclosed by us in reports that we file under the Exchange Act, is gathered, reported, processed, summarized and reported within the time periods specified in the Securities and Exchange Commission’s rules and forms and is accumulated and communicated to management, including the chief executive officer and the chief financial officer, to allow timely decisions regarding required disclosure as specified under U.S. and Canadian securities laws.
Internal Controls over Financial Reporting. Management is responsible for establishing and maintaining adequate internal control over financial reporting as defined in Rules 13a-15(f) and 15d-15(f) under the Exchange Act. Our internal control over financial reporting is designed to provide reasonable assurance regarding the reliability of our financial reporting and preparation of our financial statements for external purposes in accordance with generally accepted accounting principles. Our internal control over financial reporting includes those policies and procedures that: pertain to the maintenance of records that in reasonable detail accurately and fairly reflect our transactions and disposition of assets; provide reasonable assurance that transactions are recorded as necessary to permit preparation of our financial statements in accordance with generally accepted accounting principles and that receipts and expenditures of our assets are being made only in accordance with the authorizations of management and directors; and provide reasonable assurance regarding the prevention or timely detection of unauthorized acquisitions, use or disposition of assets that could have a material effect on our financial statements.
33
We have evaluated the effectiveness of our internal control over financial reporting as defined in Rules 13a-15(f) and 15d-15(f) under the Exchange Act. This evaluation was performed under the supervision and with the participation of our management, including our chief executive officer and our chief financial officer, both of whom concluded that our internal control over financial reporting was effective as of December 31, 2010. That said, this report does not include an attestation report of our certified public accountants regarding our internal control over financial reporting. Our evaluation of the effectiveness of our internal control over financial reporting was not subject to attestation by our certified public accountants during the period covered by this report pursuant to temporary rules of the Securities Exchange Commission that permit us to provide only management’s report on such effectiveness in this report. Our evaluation of the effectiveness of our internal control over financial reporting in future periods may differ due to changing conditions or non-compliance with the policies and procedures we have established.
During the period covered by this annual report, no changes occurred in the Company’s internal control over financial reporting that have materially affected, or are reasonably likely to materially affect, the Company’s internal control over financial reporting.
Item 9B. Other Information.
There is no information that was required to be disclosed by the registrant on Form 8-K during the fourth quarter of the year ended December 31, 2010 that was not so disclosed.
[The balance of this page has been intentionally left blank.]
34
PART III
Item 10. Directors, Executive Officers and Corporate Governance.
Directors and Executive Officers. The names, ages, business experience (for at least the past five years) and positions of our directors and executive officers as of March 22, 2011 are set out below. The Company’s board of directors consisted of five members at such date. All directors serve until the next annual meeting of shareholders or until their successors are elected or appointed, and qualified. The board of directors appoints the executive officers annually.
| Director or Executive Officer | Age | Position with the Company |
| John G. Shanahan (1) (5) | 51 | President, Chief Executive Officer and Director |
| Kenneth S. Eickerman | 53 | Chief Financial Officer |
| Carson Rife | 53 | Chief Operating Officer |
| Monique Hayes | 45 | Corporate Secretary |
| Timothy R. Lindsey (1) (2)(3) (5) | 58 | Director and Chairman |
| Albert Appleton (1)(2)(4) | 62 | Director |
| Larry M. Okada (2)(3)(4) | 61 | Director |
| John B. McCombe(3)(4)(5) | 50 | Director |
| (1) |
Member of the Environmental Committee of the board of directors |
| (2) |
Member of the Compensation Committee of the board of directors |
| (3) |
Member of the Audit Committee of the board of directors |
| (4) |
Member of the Governance and Nominating Committee of the board of directors |
| (5) |
Member of the Safety Committee of the board of directors |
Biographies of Corporate Directors and Executive Officers.
John G. Shanahan. Mr. Shanahan was named the Company’s President and CEO in October 2008. Prior to becoming CEO, Mr. Shanahan was the chairman of the board of directors from 2005 until April 2009. Mr. Shanahan’s background is in commodity price risk management and he has held senior management positions with Barclays Capital, Rothschild Inc., Pasminco Ltd, and Australian Mining and Smelting. Mr. Shanahan holds a bachelor of commerce degree from the University of Melbourne, a graduate diploma in Systems Analysis and Design from the Royal Melbourne Institute of Technology, and an MBA degree from the Columbia School of Business.
Kenneth Eickerman. Mr. Eickerman was appointed Chief Financial Officer in December 2008. Prior to joining Revett Silver as an officer in April 2005, Mr. Eickerman was Controller of Mustang Line Contractors, Inc. (from May 2002 to March 2005), and Controller and Treasurer of Apollo Gold, Inc. (from February 1999 to May 2002). Before that, he worked in various finance capacities for Pegasus Gold, Inc. Mr. Eickerman graduated from the Washington State University and is a Certified Public Accountant licensed in the State of Washington.
Carson Rife. Mr. Rife was appointed Chief Operating Officer in December 2010. Mr. Rife has over twenty eight years of mine permitting, design and operations experience working on various gold and base metal projects primarily in Montana, Nevada and Australia. Prior to joining Revett Silver in February 2003, Mr. Rife was the Director of Engineering and Project Development for Apollo Gold, Inc. (from February 1998 to April 2002). From 1981 to 1997, Mr. Rife worked in various project design, construction and operation management capacities for Pegasus Gold Inc. Mr. Rife holds a bachelors of science degree in mining engineering from the Montana College of Mineral Science and Technology in Butte, Montana and is a member of SME and AUSIMM.
35
Monique Hayes. Ms. Hayes was appointed Corporate Secretary in December 2010. Ms. Hayes has over six years of investor relations experience in the mining industry and over ten years of general advertising, communications and brand management experience. Prior to joining Revett Silver in March 2009, Ms. Hayes worked for Sterling Mining, Public Dialog Direct, WhiteRunkle Advertising and Studio Interactive, working on several national accounts including AT&T Wireless, Bell Atlantic and NordicTrack. She attended City University and Northwestern University where she studied business management, brand strategy and communications.
Timothy R. Lindsey Director and Chairman of the Board. Mr. Lindsey has over thirty years of technical and executive leadership in exploration, production and business development in the U.S., Canada, Africa, Europe, Latin America, the CIS and Asia-Pacific. From March 2005 to the present, Mr. Lindsey has been a Principal of Lindsey Energy and Natural Resources, an independent consulting firm specializing in energy and mining industry issues. Mr. Lindsey received a bachelor of science in geology from Eastern Washington University and completed graduate studies-economic geology at the University of Montana.
Albert Appleton Director and Chairman of the Environmental Committee. Mr. Appleton has been an international environmental and public finance consultant since 2005. From 1994 to 2005, Mr. Appleton was a Senior Fellow of Infrastructure at the New York City Regional Plan Association and from 1990 to 1993 he was Commissioner of the New York City Department of Environmental Protection and Director of the New York City Water and Sewer System, where he was noted for his innovations in watershed protection, water conservation and water resource management and finance. Mr. Appleton is a graduate of Gonzaga University and Yale Law School.
John B. McCombe Director and Chairman of the Safety Committee. Mr. McCombe was appointed to the board effective November 2, 2010. Mr. McCombe has over twenty-five years of operating experience in North American and international mining and mineral processing operations. Most recently he held the position of Senior Vice President – Operating Strategy at IAMGOLD Corporation. Mr. McCombe graduated from Queen’s University with a Bachelor of Science in Mine Engineering and is a member of the Canadian Institute of Mining and Metallurgy. Upon graduation, Mr. McCombe joined Dickenson Mines (now Goldcorp) at their Red Lake operation where he held various mine and mill superintendent positions. From 1995 to 2005, Mr. McCombe was with Breakwater Resources where he was responsible for global operations.
Larry M. Okada Director and Chairman of the Audit Committee. Mr. Okada has extensive public finance and accounting experience with Deloitte & Touche, Staley Okada & Partners, and PricewaterhouseCoopers LLP. Mr. Okada is a Chartered Accountant in British Columbia and Alberta as well as a Certified Public Accountant in Washington State. Mr. Okada is currently a member of various committees with the Institute of Chartered Accountants of British Columbia.
Corporate Governance Practices and Policies The Company’s corporate governance practices and policies are administered by the board of directors, by committees of the board appointed to oversee specific aspects of the Company’s management and operations, and pursuant to written charters, mandates and policies adopted by the board and such committees. The overall goal of these practices and policies is to ensure that every aspect of the Company’s business is conducted in accordance with best corporate practice standards and the requirements of all applicable laws.
Independence of the Board. The Company’s board consists of five directors, four of whom are not executive officers and are thereby considered to be independent under the rules or the Toronto Stock Exchange. The non-independent director is John Shanahan, who also serves as the Company’s president and chief executive officer. The independent directors meet outside the presence of management and Mr. Shanahan prior to or during most regularly scheduled meetings of the board. During the year ended December 31, 2010, the Company’s board of directors met six times and the independent members of the board met separately six times.
Board Meetings. The board of directors is headed by a chairman of the board, a position that is currently occupied by Tim Lindsey. The chairman is responsible for determining the frequency and content of board meetings, ensuring that the directors are provided with meeting and briefing materials in a timely manner, ensuring management’s attendance at the meeting to deliver required reports and answer any questions the directors may have concerning the Company or its operations and, in general, conducing the meetings in an orderly, responsible and informative manner. The chairman also acts as the chair at the Company’s annual meeting of shareholders. These responsibilities are more fully described in the board’s charter, described below, and in a position description adopted by the board. Attendance for the six meetings is as follows: all directors attended all board meetings during the periods they were directors with the exception that Mr. Appleton was absent for one meeting.
36
The Board Charter. The board has adopted a governance document or charter that defines its management and supervisory responsibilities and the Company’s strategic objectives. The board’s primary responsibility under the charter is to foster the long term success of the Company and build long term value for its shareholders, all in a manner that is consistent with the board’s fiduciary duties and sound governance principles.
The board is empowered under its charter to delegate certain of these responsibilities to a committee or committees comprised of directors. Five such committees existed as of the date of this report: an audit committee, a compensation committee, a corporate governance and nominating committee, an environment committee and a safety committee, each of which is described in more detail below. These committees make recommendations and findings that are then reported directly to the entire board for approval. The mandate, composition and structure of each committee are also approved by the board.
The board has the following additional responsibilities:
-
it selects and appoints the Company’s president and chief executive officer, who is responsible for the Company’s day-to-day management and operations, and is responsible for the Company’s pursuit of its strategic goals;
-
it reviews and approves the persons selected by the president and chief executive officer to serve as other executive officers or senior managers of the Company;
-
it evaluates the performance of the Company’s executive officers and, with advice from the compensation committee of the board, reviews and approves their compensation and, if necessary, replaces them;
-
it periodically reviews and approves the Company’s operating strategies, sets objectives, performance targets and budgets, and measures the Company’s actual performance against such targets and budgets;
-
it reviews and approves the Company’s internal control policies, including, prospectively, the internal control policies mandated by Section 404 of the Sarbanes-Oxley Act of 2002;
-
it conducts annual on-site visits of the Company’s principal facilities and properties;
-
it approves all annual budgets and all acquisitions, divestitures and material investments;
-
it evaluates the Company’s risk management plans and its management succession plans;
-
in conjunction with the audit committee of the board, it reviews and approves all of the Company’s internal and external financial reports and all correspondence and communications to the Company’s shareholders;
-
it reviews and approves Company-wide policies, such as its timely disclosure policy, confidentiality and insider trading policy, and whistle blower policy, to ensure that such policies conform to best corporate standards, practices and applicable laws, and are being properly administered and followed; and
-
it ensures that the Company has other proper mechanisms in place to guide its activities in compliance with all applicable legal and regulatory requirements.
37
Orientation of New Directors and Continuing Education. The Company presently does not have a formal procedure for orienting new directors to the Company. This said, all new directors are given comprehensive information about the Company and its management when they are first appointed or elected, and are afforded the opportunity to meet with the Company executive officers and other members of senior management and to visit the Company’s operations and projects to gain a more complete understanding of the Company and its business.
Ethical Business Conduct. Management of the Company is committed to fostering and maintaining a culture of high ethical standards and compliance, and has adopted various policies (consisting of a code of business ethics, a timely disclosure policy, a confidentiality and insider trading policy, and a whistle blower policy) that are designed to ensure the integrity of its operations and activities. A key aspect of this commitment is ensuring that the Company’s employees work in an environment that encourages them to bring their concerns to the attention of management, who will promptly and professionally address them. All of the Company’s directors, executive officers and employees have been apprised on an annual basis of the content and objectives of these policies, specifically, how to report suspicious or potentially unethical or unlawful acts or conduct that violates the policies. Each of the Company’s employees is authorized to contact the Company’s outside counsel on a confidential basis if he or she becomes aware of acts or conduct that has been reported to, but not rectified by management.
Committees of the Board of Directors.
| Corp. Gov. | |||||
| Audit | Compensation | Safety | Environmental | & Nominating | |
| Director | Committee | Committee | Committee | Committee | Committee |
| John Shanahan | X | X | |||
| Tim Lindsey | X | Chair | X | X | |
| Al Appleton | X | Chair | X | ||
| Larry Okada | Chair | X | Chair | ||
| John McCombe | X | Chair | X | ||
| 2010 Meetings | 4 | 2 | 1 | 1 | 2 |
Audit Committee.
Composition and Responsibilities. The audit committee is comprised of three or more members of the board who are not also executive officers (and are therefore independent of the Company’s management), and operates pursuant to a charter adopted by the board. The charter generally authorizes the committee to assist the board in overseeing the Company’s financial reporting and its communications with the investing public. Specifically, the charter specifies that the audit committee is responsible for:
-
recommending the external auditors and approving their compensation;
-
overseeing the work of the external auditors, including the resolution of disagreements with management concerning financial reporting;
-
reviewing the external auditors’ audit plan, including the scope, procedures and timing of the audit;
-
reviewing the Company’s annual audited financial statements and the quarterly interim unaudited financial statements, satisfying itself that the financial statements are presented in accordance with generally accepted accounting principles, and reporting and recommending to the board, prior to their filing or dissemination, whether the financial statements should be approved;
-
with respect to the annual audited financial statements, discussing any significant issues regarding accounting principles, practices and judgments of management with management and the external auditors;
38
-
satisfying itself that the information contained in the annual audited financial statements and the quarterly interim financial statements are not significantly erroneous, misleading or incomplete, and that the audit or interim review functions have been effectively performed;
-
reviewing and, if appropriate, recommending to the board for approval management’s discussion and analysis relating to annual and interim financial statements, earnings press releases and any other public disclosures that are required to be reviewed by the committee under applicable law prior to their being filed or disseminated;
-
obtaining timely reports from the external auditors concerning accounting policies and practices, including any alternative treatments of financial information that were discussed with management;
-
pre-approving all non-audit services provided by the external auditors;
-
annually reviewing fees paid to the external auditors and other professionals with respect to audit and non-audit services;
-
approving the Company’s hiring of any current or former partner or employee of the Company’s current or any former external auditor;
-
monitoring and assessing the relationship between management and the external auditors, and supporting the independence and objectivity of the external auditors;
-
adopting policies regarding the receipt, retention and treatment of complaints received by the Company regarding accounting, internal accounting controls or auditing matters, including confidential anonymous submissions by employees of the Company regarding any questionable accounting or auditing matters;
-
making inquiries of management and the external auditors concerning internal and external significant financial risks or exposures affecting the Company, and assessing any steps management has taken to mitigate such risks or exposures;
-
reviewing post-audit or management letter containing the recommendations of the external auditors, as well as management’s response and subsequent follow-up to any identified weaknesses;
-
ensuring that the Company has adopted an appropriate standard of corporate conduct including, if necessary, a corporate code of business ethics applicable to the Company’s employees and any consultants retained by the Company;
-
overseeing any related party transactions involving the Company; and
-
performing such other activities as are consistent with the audit committee’s charter and applicable law that the committee or the board deem necessary or appropriate.
In fulfilling its responsibilities, the audit committee is authorized and empowered to conduct any investigation it deems necessary or appropriate and, in doing so, may request the attendance of the external auditors, as well as any officer of the Company, or the Company’s outside counsel, at any meeting of the committee or its advisors. The committee has unrestricted access to the books and records of the Company, and is authorized to retain special legal, accounting or other consultants or experts to assist it. The committee is further empowered to review and assess the adequacy of its mandate annually and submit any proposed revisions to the board of directors for approval.
The audit committee and its members are required to meet all applicable legal, regulatory and listing requirements, including applicable securities laws and regulations, the listing requirements of the Toronto Stock Exchange, and applicable provisions of the Canada Business Corporations Act. Each member of the committee is required to be both “independent” and “financially literate” as such terms are defined in Multilateral Instrument 52-110 adopted by the Canadian provincial securities regulatory authorities.
39
The audit committee meets no less often than quarterly, at the discretion of the chairman or a majority of its members, as circumstances dictate or as may be required by applicable legal or listing requirements. A minimum of two and at least 50% of the members of the committee present either in person or by telephone constitute a quorum for the conduct of committee business. Whenever a vacancy occurs, the remaining members may exercise all of their powers and responsibilities of the committee so long as a quorum of the committee members remains in office. Matters voted upon by the committee are decided by a majority of votes cast at the meeting. The committee may also take action in lieu of a meeting with the unanimous written consent of all the members. All decisions or recommendations of the committee require board approval prior to being implemented. The committee is required to keep a written record of its meetings, which are also submitted to the board.
Current Members. The audit committee is presently comprised of Larry Okada, Tim Lindsey and John McCombe, with Mr. Okada serving as chairman. During the year ended December 31, 2010, the committee met four times.
Compensation Committee.
Composition and Responsibilities. The compensation committee is comprised of two or more members of the board who are not also executive officers, and operates pursuant to a mandate adopted by the board. The mandate generally authorizes the committee to assist the board with respect to human resources, management continuity and compensation matters. Specifically, the mandate specifies that the compensation committee is responsible for:
-
reviewing compensation matters and making recommendations to the board concerning executive officer and director compensation, including salaries, bonuses, stock-based awards and grants, and the terms and conditions of employment contracts;
-
making recommendations to the board concerning general salary guidelines;
-
proposing, approving and overseeing the implementation of competitive, incentive-based compensation plans and proposals, in order to attract and retain quality personnel;
-
administering the Company’s compensation plans;
-
reviewing the Company’s benefits and perquisites plans or arrangements, and making recommendations to the board;
-
ensuring that the Company’s compensation philosophy and practices are consistent with the objectives of enhancing shareholder value and attracting and retaining qualified senior management personnel; and
-
overseeing the Company’s management succession planning.
The compensation committee meets at least annually to consider and make recommendations to the board. Typically, the principal executive officer of the Company makes recommendations to the committee concerning individual salary levels, bonuses, equity based incentives and other forms of compensation for all of the executive officers other than himself, which are then reviewed and submitted to the full board for approval. The compensation committee makes its own recommendation concerning the principal executive officer’s salary, bonus and other types of compensation. The compensation committee also reviews the adequacy and form of director compensation on an annual basis. In general the compensation committee strives to ensure the Company’s compensation is competitive with that of its peers, reflects the performance of the Company, and is aligned with the interest of the Company’s shareholders. In carrying out its mandate, the compensation committee is authorized to undertake such surveys as it deems appropriate and, if necessary, to hire outside consultants and advisors. The compensation committee also prepares an annual report regarding executive compensation that is included in the information circular that is disseminated to the Company’s shareholders in conjunction with each annual meeting of shareholders.
40
Current Members. The compensation committee is presently comprised of Tim Lindsey, Albert Appleton and Larry Okada, with Mr. Lindsey serving as chairman. During the year ended December 31, 2010, the committee met two times.
Compensation Committee Interlocks and Insider Participation. During the year ended December 31, 2010, (a) no executive officer of the Company served as a member of the compensation committee (or other board committee performing equivalent functions or, in the absence of any such committee, the entire board of directors) of another entity, one of whose executive officer’s served on the Company’s compensation committee; (b) one executive officer of the Company served as a director of another entity, one of whose executive officers served on the Company’s compensation committee; and (c) no executive officer of the Company served as a member of the compensation committee (or other board committee performing equivalent functions or, in the absence of any such committee, the entire board of directors) of another entity, one of whose executive officers served as a director of the Company. The compensation committee has reviewed and discussed Item 11 of this report, specifically including the subsection entitled “Compensation Discussion and Analysis.”
Corporate Governance and Nominating Committee.
Composition and Responsibilities. The corporate governance and nominating committee is comprised of three members of the board. The primary functions of the committee are to assess the effectiveness of the board and its individual members, periodically review and assess the Company’s governance practices, propose new nominees for or appointments to the board, and orient new directors as to Company’s operations, goals and strategies.
Current Members. The corporate governance and nominating committee is presently comprised of Albert Appleton, Larry Okada and John McCombe, with Mr. Okada serving as chairman. During the year ended December 31, 2010, the committee met two times.
Environmental Committee.
Composition and Responsibilities. The environmental committee is comprised of three directors, one of whom is an executive officer, and assists the board in overseeing environmental matters. The primary responsibility for environmental issues, including compliance with applicable laws and regulations rests with management. The committee assists the board of directors however in establishing, reviewing and complying with the Company’s policies and goals. The committee also oversees the performance of the Company in adhering to applicable laws and regulations.
Current Members. The environmental committee is presently comprised of John Shanahan, Albert Appleton and Tim Lindsey, with Mr. Appleton serving as chairman. During the year ended December 31, 2010, the committee met one time.
Safety Committee.
Composition and Responsibilities. The safety committee is comprised of three directors, one of whom is an executive officer, and assists the board in overseeing safety matters. The primary responsibility for safety issues, including compliance with applicable laws and regulations rests with management. The committee assists the board of directors however in establishing, reviewing and complying with the Company’s policies and goals. The committee also oversees the performance of the Company in adhering to applicable laws and regulations.
Current Members. The safety committee is presently comprised of John Shanahan, John McCombe and Tim Lindsey, with Mr. McCombe serving as chairman. During the year ended December 31, 2010, the committee met one time.
41
Item 11. Executive Compensation.
Summary Compensation Table. The following table summarizes the compensation for the fiscal years ended December 31, 2010, 2009 and 2008, of our principal executive officer, principal financial officer and our two other executive officers, and our one highly compensated other individual for whom such information would have been required had they been serving as executive officers as of December 31, 2010.
| Option | All Other | |||||||||||
| Name and | Salary | Bonus (1) | Awards (2) | Compensation | Total | |||||||
| Principal Position | Year | ($) | ($) | ($) | ($) | ($) | ||||||
| John G. Shanahan
(3) President and Chief Executive Officer |
2010 2009 2008 |
285,000 240,000 80,000 |
- - - |
64,500 16,909 - |
100,000 - - |
449,500 256,909 80,000 |
||||||
| Kenneth Eickerman (3)
Chief Financial Officer |
2010 2009 2008 |
128,560 98,268 101,716 |
- - 15,000 |
21,500 12,560 - |
30,698 - - |
(8)
|
180,758 110,828 116,716 |
|||||
| Carson Rife
(3),(4) Vice President and Chief Operating Officer |
2010 2009 2008 |
183,231 152,000 188,23 |
- - 52,500 |
43,000 15,387 - |
52,064 1,398 1,398 |
(4)(8) |
278,295 167,387 242,129 |
|||||
| Douglas Ward (7)
Vice President of Corporate Development |
2010 2009 2008 |
181,834 128,000 157,333 |
- - 45,000 |
21,500 12,560 - |
- - - |
203,334 140,560 202,333 |
||||||
| Monique Hayes (3)
Corporate Secretary |
2010 2009 2008 |
73,834 - - |
- - - |
21,500 - - |
- - - |
95,334 - - |
||||||
| William Orchow (5)
President and Chief Executive Officer |
2010 2009 2008 |
- - 201,875 |
- - 90,000 |
- - - |
- - 632,758 |
- - 924,633 |
||||||
| Scott Brunsdon (6)
Chief Financial Officer and Secretary |
2010 2009 2008 |
- - 186,833 |
- - 59,100 |
- - - |
- 307,167 - |
(6) |
- 307,167 245,933 |
|||||
| Douglas Miller General Manager of the Troy Mine |
2010 2009 2008 |
158,667 126,000 138,833 |
- - 1,500 |
34,400 13,989 - |
- - - |
193,067 139,989 140,333 |
(1) 2007 bonuses relate to performance during that year, but were awarded in March 2008.
(2) Options awards were valued using the Black-Scholes option pricing model. For a discussion of the assumptions used in valuing such option awards, see Note 9 to the Company’s consolidated financial statements included in this report. There were no forfeitures of option awards for the years shown.
(3) Reflects salary compensation paid to each of the named individuals during the periods reported. See the subsection of this report entitled “Employment Agreements with Executive Officers” for information concerning the named individuals’ base salaries for the year ending December 31, 2010.
(4) Amounts shown for Mr. Rife under “All other Compensation” include of automobile expense allowance of $1,398.
[Footnotes are continued on the following page.]
42
(5) Amounts shown for Mr. Orchow under “Option Awards” reflect the value of options awards granted to him during the periods shown. The amount shown under “All Other Compensation” reflects a severance payment to Mr. Orchow in 2008, following his resignation from the Company.
(6) Mr. Brunsdon resigned from the Company in December 2008. Pursuant to the terms of his employment agreement, the Company paid him a severance payment of $307,167 in 2009 following his resignation.
(7) Mr. Ward resigned from the Company on November 30, 2010.
(8) Amounts shown reflect the value of common shares received during the year.
Grants of Plan-Based Awards. The following table sets forth information concerning equity incentive plan awards that were granted to our principal executive officer, principal financial officer and our two other executive officers during the year ended December 31, 2010. None of the persons depicted in the table received stock awards or non-equity incentive plan awards during the year. None of such incentive plan awards are contingent on the achievement of performance goals.
| Grants of Plan-Based Awards | |||||||
| Estimated | Future | Payouts under | Grant | ||||
| Equity | Incentive | Plan Awards | Other Option | Exercise | Date | ||
| Threshold | Target | Maximum | Awards | Price | Value | ||
| Name | Grant Date | (#) | (#) | (#) | (#) | ($) | ($) |
| John Shanahan | 3/30/2010 | - | n/a | n/a | 30,000 | 2.15 | 64,500 |
| Ken Eickerman | 3/30/2010 | - | n/a | n/a | 10,000 | 2.15 | 21,500 |
| Carson Rife | 3/30/2010 | - | n/a | n/a | 20,000 | 2.15 | 43,000 |
| Monique Hayes | 3/30/2010 | - | n/a | n/a | 10,000 | 2.15 | 21,500 |
Outstanding Equity Awards at Fiscal Year-End. The following table sets forth information concerning the outstanding equity awards at December 31, 2010 held by our principal executive officer, principal financial officer and our two other executive officers:
| Outstanding Equity Awards at Fiscal Year-End | |||||
| Equity Incentive Plan Awards: | |||||
| Number of Securities Underlying | Number of Securities | Average | |||
| Unexercised Options | Underlying Unexercised | Exercise | Option | ||
| Exercisable | Unexercisable | Unearned Options | Price | Expiration | |
| Name | (#) | (#) | (#) | ($) | Dates |
| John Shanahan | 85,000 | 0 | 0 | 1.05 | 2014-2015 |
| Ken Eickerman | 23,000 | 0 | 0 | 4.06 | 2011-2015 |
| Carson Rife | 100,000 | 0 | 0 | 2.60 | 2011-2015 |
| Monique Hayes | 4,000 | 0 | 0 | 2.15 | 2015 |
Options Exercised in Last Fiscal Year. During the year ended December 31, 2010, the Chief Operating Officer exercised 10,000 stock options, the Chief Financial Officer exercised 45,000 stock options and the Corporate Secretary exercised 16,000 stock options.
Employment Agreements with Executive Officers. Each of our four executive officers has entered into an employment agreement with Revett Silver, our wholly-owned Montana subsidiary. Each agreement is for a term of three years and is renewable annually thereafter, and each provides for the payment of salary and medical and other fringe benefits, the award of stock options, and severance payments in the event the executive officer’s employment is terminated without cause, upon the occurrence of a change in control event, or other than for good reason. A “change in control” event occurs under the agreements when a person or entity beneficially acquires 25 percent or more of our voting securities, or when, in a contested election of directors, the persons who were directors immediately prior to the election contest cease to constitute a majority of the board of directors. “Good reason” is defined in the agreement to include a material change in the executive officer’s duties and responsibilities, a reduction in his salary or medical and other fringe benefits or, following a change in control, the Company’s failure to enter into a replacement employment agreement with the executive officer that is reasonably satisfactory to him.
43
Our agreement with John Shanahan is dated January 1, 2010 and provides for an annual base salary of $300,000, subject to periodic adjustments. If Mr. Shanahan’s employment is terminated without cause, he is entitled to eighteen months of salary and twelve months of benefits. If he is terminated following a change of control event or other than for good reason, he is entitled to 36 months of salary and twelve months of benefits. Mr. Shanahan may terminate the agreement unilaterally upon one month’s notice.
Our agreement with Kenneth Eickerman is dated May 30, 2007, amended January 16, 2010, and provides for an annual base salary of $135,000, subject to periodic adjustment. If Mr. Eickerman’s employment is terminated without cause, he is entitled to eighteen months of salary and twelve months of benefits. If he is terminated following a change of control event or other than for good reason, he is entitled to 36 months of salary and twelve months of benefits. Mr. Eickerman may terminate the agreement unilaterally upon one month’s notice.
Our agreement with Carson Rife is dated February 1, 2004, amended December 1, 2010, and provides for an annual base salary of $200,000, subject to periodic adjustment. If Mr. Rife’s employment is terminated without cause, he is entitled to eighteen months of salary and twelve months of benefits. If he is terminated following a change of control event or other than for good reason, he is entitled to 36 months of salary and twelve months of benefits. Mr. Rife may terminate the agreement unilaterally upon one month’s notice.
Our agreement with Monique Hayes is dated December 1, 2010 and provides for an annual base salary of $82,500, subject to periodic adjustment. During the year ended December 31, 2010, Ms. Hayes received a salary of $73,834. If Ms. Hayes’s employment is terminated without cause, she is entitled to eighteen months of salary and twelve months of benefits. If she is terminated following a change of control event or other than for good reason, she is entitled to 36 months of salary and twelve months of benefits. Ms. Hayes may terminate the agreement unilaterally upon one month’s notice.
Compensation of Directors. The following table sets forth information concerning the compensation of our directors for the fiscal year ended December 31, 2010. John Shanahan was also an executive officer of the Company. None of our directors received any other form of compensation during the year.
| Director Compensation | ||||||||||||
| Fees earned | Option | All Other | ||||||||||
| or Paid in Cash | Awards | Compensation | Total | |||||||||
| Name | ($) | ($) | ($) | ($) | ||||||||
| John G. Shanahan (1) | 0 | 0 | 0 | 0 | ||||||||
| John B. McCombe (1) | 5,831 | 50,000 | 0 | 55,831 | ||||||||
| Albert Appleton (1) | 20,205 | 29,000 | 0 | 49,205 | ||||||||
| Timothy R. Lindsey (1) | 46,247 | 64,500 | 75,000 | 185,747 | ||||||||
| Tony L. Alford | 13,750 | 64,500 | 25,000 | 103,250 | ||||||||
| Larry M. Okada (1) | 39,997 | 64,500 | 0 | 104,497 | ||||||||
_______________
(1) Current members
of the board of directors.
During the year ended December 31, 2010, directors other than Mr. Shanahan received an annual retainer of $25,000. In addition to these payments, the chairman of the board of directors received an additional $15,000 per year for serving as chairman.The chairman of the audit committee received $10,000 per year. The compensation, corporate governance and nominating, safety, and environmental committees each received an additional $5,000 per year. Directors are also reimbursed for travel expenses incurred in connection with their attendance at board and committee meetings, and directors who are not also executive officers are eligible to receive stock options under Revett Minerals equity incentive plan.
Compensation Discussion and Analysis.
Our Compensation Philosophy and Policies. Our executive compensation philosophy has been designed with the following objectives: to attract and retain the best possible executive talent; to provide an economic framework to motivate these executives to achieve goals consistent with our business strategy; to provide an alignment between executive and shareholder interests through stock option plans; to be competitive within our peer group of mining companies; and to provide a compensation package that recognizes an executive's individual results and contributions to the Company's relative and absolute performance.
44
Salary. The key elements to our executive compensation philosophy are salary, cash and stock bonus awards and incentive stock options. Salaries are based on the position held, the executive officer’s experience and performance, and the market for executive talent, the latter of which provides a comparison of salaries for similar positions at other mining companies.
Typically, the principal executive officer of the Company makes recommendations to the committee concerning individual salary levels, bonuses, equity based incentives and other forms of compensation for all of the executive officers other than himself, which are then reviewed and submitted to the full board for approval. The compensation committee makes its own recommendation concerning the principal executive officer’s salary, bonus and other types of compensation. The other executive officers play no role with respect to their compensation other than to meet with the compensation committee to establish agreed goals and objectives that are determinative of their respective bonuses. These goals and objectives are established at the beginning of each fiscal year.
The board of directors has traditionally maintained salary compensation at levels roughly in line with those of other companies within our peer group. Beginning in 2006 and continuing in 2010, the compensation committee surveyed the compensation paid to other executives within a peer group of companies comprised of First Majestic Silver Corp., Fronterra Copper Corporation, Mines Management, Inc., and Sabina Silver Corp. in order to establish compensation packages that were both competitive and appropriate to the Company’s situation.
Incentive Compensation. Executive officers of the Company are eligible to receive stock option awards and cash and stock bonuses. Stock option awards, whose value is a function of increases or decreases in the Company’s share price, are intended to provide incentives to attain longer term growth and performance objectives and enhance shareholder value. Cash and stock bonuses are intended to reflect shorter term (usually annual) accomplishments.
During the year ended December 31, 2010, the compensation committee and the board continued to modify and improve the formula-driven bonus plan for the Company’s executive officers that was first developed in 2006. This plan established the executive’s potential cash bonus at the beginning of the year (expressed as a percentage of the executive’s base salary) and the evaluation is based upon certain performance criteria using a weighted average approach. The criteria established for each of the executive officers is detailed below. The specific criteria and the individual weighting may change from year to year based upon the executive’s specific role with the Company, but include a combination of goals relating to the Company’s overall financial performance and the specific, individual goals that have been set for the executive, plus a discretionary element established by the board on the recommendation of the compensation committee. The following table sets forth the relative weighting of targeted performance areas that were established by the compensation committee and approved by the board of directors for each of the Company’s four executive officers for the year ending December 31, 2010:
| John | Ken | Carson | Monique | ||||||||||
| Objective | Shanahan | Eickerman | Rife | Hayes | |||||||||
| Stock price performance | 15% | 15% | 15% | 15% | |||||||||
| Cash flow and profitability | 10% | 15% | 10% | 5% | |||||||||
| Financing | 10% | 10% | 5% | 10% | |||||||||
| Safety performance | 15% | 5% | 20% | 5% | |||||||||
| Governmental relations | 10% | 5% | 10% | 5% | |||||||||
| Investor/public relations | 10% | 10% | 10% | 20% | |||||||||
| Strategy and positioning | 10% | 10% | 10% | 10% | |||||||||
| Corporate governance | 5% | 15% | 5% | 15% | |||||||||
| Discretionary | 15% | 15% | 15% | 15% |
45
The cash flow and profitability objectives will be measured against internal cash flow and mine throughput targets, and metal price assumptions. The safety performance objective will be measured by the lost time accident rate in the current year versus the prior year. Governmental relations and investor/public relations objectives are inherently more difficult to measure and will necessarily involve subjective determinations of the Company’s relationships with the permitting agencies, local stakeholders and elected officials; the tone and quality of the Company’s press coverage; the Company’s relationship with its shareholders; and its progress in meeting its goal of increasing the retail and institutional ownership of its common stock. The strategy and positioning objective is likewise less susceptible to measurement, and will involve an assessment of management’s ability to develop and implement a business strategy that will increase shareholder value and position the Company to take advantage of opportunities in the mining industry. The corporate governance objective will be measured by management’s ability to develop and implement financial control, governance and oversight procedures that comply with applicable law and ensure the integrity of its reported financial and non-financial information.
For 2010 the compensation committee and board of directors did not award any cash bonuses. During 2010, the compensation committee and the board awarded a total of 70,000 stock options to our four executive officers and a total of 130,000 stock options to our directors who are not also executive officers. The compensation committee and the board awarded cash bonuses aggregating $206,100 in 2008 to our executive officers in recognition of their ongoing efforts to grow the Company and obtain permits relating to Rock Creek during the prior year. No stock options were awarded to executives in 2008. In future years, the compensation committee will likely emphasize both cash bonuses and stock option awards in fashioning executive compensation.
Compensation of the Principal Executive Officer. On January 1, 2010, the Company and John Shanahan entered into an employment contract which provides for an annual salary of $300,000. During the year ended December 31, 2010, Mr. Shanahan was award 30,000 stock options with an exercise price of $2.15 per share. These stock options are immediately vested and expire on March 30, 2015. In addition, Mr. Shanahan received 46,512 common shares with a market value of $100,000.
Stock Option Plans.
The Revett Minerals Equity Incentive Plan. Revett Minerals maintains an equity incentive plan (the “Revett Minerals Plan”) that provides for the issuance of stock options, stock appreciation rights and shares of common stock in satisfaction of amounts owing for services. The Revett Minerals Plan was adopted by Revett Minerals’ shareholders on June 19, 2007, and amended on June 16, 2009, and is administered by the compensation committee and by the board. The material provisions of the Revett Minerals Plan and other relevant information are as follows:
-
Directors, executive officers, employees and consultants to the Company including its subsidiaries are eligible to participate in the Revett Minerals Plan.
-
A maximum of 3,600,000 shares of common stock (representing approximately 11% of the issued and outstanding shares of common stock of the Company as of the date of this report), are available for issuance under the Revett Minerals Plan.
-
Options for the purchase of a total of 1,307,500 shares of common stock (representing approximately 4% of the issued and outstanding shares of common stock of the Company as of the date of this report) have been granted under the Revett Minerals Plan.
-
The maximum number of shares of common stock with respect to which grants may be made to any one individual under the Revett Minerals Plan, together with any shares of common stock reserved for issuance to such individual under any other stock option plan or arrangement, may not exceed 5% of the number of outstanding shares of the Company’s common stock. In addition, the maximum number of shares of common stock with respect to which grants may be made (whether through grants of options or grants of stock) to the Company’s directors and executive officers may not exceed 10% of the number of outstanding shares of the Company’s common stock at any time.
46
-
The purchase price or exercise price of a share of common stock reserved for issuance pursuant to options granted under the Revett Minerals Plan is determined by the board of directors of the Company, taking into account any applicable rules of the Toronto Stock Exchange. However, in no event can the price be less than the closing price of the common stock on the Toronto Stock Exchange on the trading date immediately preceding the date of grant.
-
A stock appreciation right may be granted under the Revett Minerals Plan at the time an option is granted, or any time during the term of an option, and upon exercise of a stock appreciation right, the related option is cancelled to the extent unexercised, and the holder is entitled to receive payment of an amount equal to the difference between the then current market price and the exercise price. Payment of the appreciated value of the common stock may be solely in cash, in shares of common stock, or a combination thereof, in the discretion of the compensation committee and the board. Upon exercising an option, any related stock appreciation right is cancelled. No stock appreciation rights had been granted as of the date of this report.
Options vest at such times as the compensation committee or the board determine at the time of grant, provided that, subsequent to the time of grant, the compensation committee or the board may in their discretion permit an optionee to exercise any or all unvested options. -
No option can have a term of more than ten years measured from the date of grant.
-
Each option must specify the effect of termination of employment on the holder’s right to exercise the option. With respect to those options that have been granted as of the date of this report, the termination of an optionee’s employment for cause or his or her resignation for other than good reason terminates any unexercised options he or she may hold. If an optionee’s employment is terminated for reasons other than for cause or because of death or disability, or if an optionee resigns for good reason, then the unexercised options generally may be exercised for a period of one year following termination, but in no event after the expiry date of the option, subject to the discretion of the board to amend such provisions provided such amendment is not detrimental to the holder.
-
Options granted pursuant to the Revett Minerals Plan are non-assignable otherwise than by will or the laws of descent and distribution.
-
The board of directors may amend the Revett Minerals Plan subject to the prior approval of the Toronto Stock Exchange, which may in turn require shareholder approval of certain amendments.
Equity Compensation Plan Information. The following table sets forth certain information concerning options that have been granted pursuant to the Revett Minerals Plan as of December 31, 2010.
| Revett Minerals Inc. Incentive Stock Option Plans | |||
| Number of | |||
| Shares to be | Weighted average | shares available | |
| issued upon | exercise price of | for issuance under | |
| exercise | outstanding options | plan at FY end | |
| Stock Option Plan | (#) | ($) | (#) |
| Revett Minerals Equity Incentive Plan |
1,307,500 | $ 2.39 | 1,378,428 |
47
Item 12. Security Ownership of Certain Beneficial Owners and Management.
Security Ownership of Certain Beneficial Owners. The following table sets forth as of March 1, 2011 the names and address of, and number of shares beneficially owned by persons other than our directors and executive officers who are known to us to own more than five percent (5%) of Revett Minerals common shares. At such date, 33,177,884 common shares were outstanding. An additional 3,177,386 common shares were issuable at such date pursuant to presently exercisable options and warrants.
| Name and | Amount and Nature of Beneficial | Percent | |
| Address of Owner | Class of Security | Ownership (all direct unless otherwise noted) | of Class |
| Silver Wheaton Corp. | common stock | 5,285,979(1) | 16.0% |
| 666 Burrard Street, Suite 3400 | |||
| Vancouver, British Columbia V6C 2X8 | |||
| U.S. Global Investors, Inc. | common stock | 1,697,780 | 5.2% |
| 7900 Callaghan Road | |||
| San Antonio, Texas 78229 | |||
| Trafigura AG | common stock | 3,666,667 | 11.1% |
| 263 Tressor Blvd | |||
| Stamford, CT 06901 | |||
| Tony Alford | common stock | 2,095,477(2) | 7.0% |
| 7040 Interlaken Dr. | |||
| Kernesville, NC 27284 | |||
| Libra Advisors | common stock | 3,214,281(3) | 9.7% |
| 777 Third Ave, 27th Floor | |||
| New York, NY 10017 |
| (1) |
Consists of 5,041,143 common shares and presently exercisable warrants to purchase an additional 244,836 common shares. |
| (2) |
Consists of 2,010,477 common shares and presently exercisable options to purchase 85,000 common shares. Mr. Alford resigned his position as a director on June 16, 2010. |
| (3) |
Consists of 2,142,854 common shares and presently exercisable warrants to purchase an additional 1,071,427 common shares. |
[The balance of this page has been intentionally left blank.]
48
Security Ownership of Management. The following table sets forth as of March 1, 2011 the names of, and number of common shares of Revett Minerals beneficially owned by our directors and executive officers, and the number of common shares owned by our directors and officers as a group.
| Amount and Nature of | |||
| Beneficial Ownership | |||
| (all direct unless otherwise | |||
| Name of Director or Officer | Class of Security | noted) | Percent of Class |
| John G. Shanahan | common stock | 496,472 (1) | less than 2% |
| Kenneth Eickerman | common stock | 39,278 (2) | less than 1% |
| Carson Rife | common stock | 110,000 (3) | less than 1% |
| Monique Hayes | common stock | 4,000 (4) | less than 1% |
| Timothy Lindsey | common stock | 469,884 (5) | less than 2% |
| Larry Okada | common stock | 60,000 (6) | less than 1% |
| Albert Appleton | common stock | 20,000 (7) | less than 1% |
| John McCombe | common stock | 20,000 (8) | less than 1% |
| All directors and officers as a group (8 persons) |
common stock |
1,246,634(9) |
Less than 4% |
_______________
| (1) |
Consists of 411,472 common shares and presently exercisable options to purchase 85,000 common shares. |
| (2) |
Consists of 16,278 common shares and presently exercisable options to purchase 23,000 common shares. |
| (3) |
Consists of 10,000 common shares and presently exercisable options to purchase 100,000 common shares. |
| (4) |
Consists of presently exercisable options to purchase 4,000 common shares. |
| (5) |
Consists of 384,884 common shares and presently exercisable options to purchase 85,000 common shares. |
| (6) |
Consists of presently exercisable options to purchase 60,000 common shares. |
| (7) |
Consists of presently exercisable options to purchase 20,000 common shares. |
| (8) |
Consists of presently exercisable options to purchase 20,000 common shares. |
| (9) |
See notes (1) through (9), above. |
Changes in Control. The Company does not know of any arrangement, the operation of which may at a subsequent date result in a change in control of the Company.
49
Item 13. Certain Relationships and Related Transactions, and Director Independence.
There was no related party transactions during the fiscal year ended December 31, 2010. The Company’s board of directors was comprised of five directors throughout much of the year, four of whom were not also executive officers and are considered to be independent directors under the rules of the Toronto Stock Exchange. The independent directors are Timothy Lindsey, John McCombe, Albert Appleton and Larry Okada. John Shanahan who is the Company’s president and chief executive officer is considered not independent. Mr. Alford resigned his position on the Board of Directors during 2010.
Item 14. Principal Accounting Fees and Services.
Audit Fees. During the fiscal years ended December 31, 2010 and 2009, , KPMG LLP, Vancouver, British Columbia our independent certified public accountants, billed the Company Cdn $160,000 and Cdn $270,500, respectively, for professional services rendered by such firm for the audit of the Company and for reviewing certain of the Company’s periodic filings with the Securities and Exchange Commission.
Audit-Related Fees. During the fiscal years ended December 31, 2010 and 2009, KPMG LLP did not perform or bill the Company for any other audit related services.
Tax Fees. During the fiscal years ended December 31, 2010, KPMG LLP did not perform or bill the Company for any tax compliance, tax advice or tax planning services. During the fiscal year ended December 31, 2009, KPMG LLP billed the Company $9,900 for tax compliance, tax advise and tax planning services.
All Other Fees. During the fiscal years ended December 31, 2010 and 2009, KPMG LLP did not perform or bill the Company for any other services.
Audit Committee’s Pre-Approval Policies and Procedures.
The Company’s audit committee pre-approves all services provided to the Company by KPMG LLP or any other professional services firm that are related to the preparation of the Company’s financial statements.
[The balance of this page has been intentionally left blank.]
50
PART IV
Item 15. Exhibits and Financial Statement Schedules.
Financial Statements. The consolidated financial statements are included in elsewhere in this report.
Exhibits. The following exhibits are filed as part of this report or included herein by reference:
| Exhibit No. | Exhibit |
| 2.1 |
Agreement and Plan of Reorganization dated February 2, 2005, and the exhibits thereto, by and between Revett Silver Company and Revett Minerals Inc. Previously filed as Exhibit 2.1 to the registrant’s registration statement on Form 10 dated July 20, 2007. |
| 3.1 |
Articles of Incorporation of the registrant. Previously filed as Exhibit 3.1 to the registrant’s registration statement on Form 10 dated July 20, 2007. |
| 3.2 |
Bylaws of the registrant. Previously filed as Exhibit 3.2 to the registrant’s initial registration statement on Form 10 dated July 20, 2007. |
| 4.1 | |
| 10.1 |
Asset Purchase and Sale Agreement dated February 21, 2000, as amended, by and among Kennecott Montana Company, Sterling Mining Company (now Revett Silver) and Genesis Inc. Previously filed as Exhibit 10.1 to the registrant’s registration statement on Form 10 dated July 20, 2007. |
| * |
|
| * |
|
| 10.4 |
Revett Minerals Inc. Amended and Restated Equity Incentive Plan dated June 16, 2009. Filed herewith. |
| * |
|
| * |
|
| 10.7 |
Employment Agreement dated February 1, 2004 by and between Carson Rife and the registrant. Previously filed as Exhibit 10.7 to Amendment No. 1 to the registrant’s registration statement on Form 10 dated September 21, 2007. |
| * |
|
| * |
|
| 10.10 |
Employment Agreement dated January 1, 2010 by and between John Shanahan and the registrant. Previously filed as an exhibit to the registrant’s current report on Form 8-K dated January 22, 2010. |
| 10.11 |
Employment Agreement dated January 16, 2010 by and between Kenneth Eickerman and the registrant. Previously filed as an exhibit to the registrant’s current report on Form 8-K dated January 22, 2010. |
51
| 21.1 |
Subsidiaries of the registrant. Previously filed as Exhibit 21.1 to the registrant’s registration statement on Form 10 dated July 20, 2007. |
| 23.1 | |
| 31.1 |
Certification of the registrant’s principal executive officer. Filed herewith. |
| 31.2 |
Certification of the registrant’s principal financial officer. Filed herewith. |
| 32.1 | |
| 32.2 |
52
SIGNATURES
Pursuant to the requirements of Section 13 or 15(d) of the Securities Exchange Act of 1934, the registrant has duly caused this report to be signed on its behalf by the undersigned, thereunto duly authorized.
| Revett Minerals Inc. | |
| Date: March 22, 2011 | /s/ John Shanahan |
| John Shanahan, its president and | |
| principal executive officer |
Pursuant to the requirements of the Securities Exchange Act of 1934, this report has been signed below by the following persons on behalf of the registrant and in the capacities and on the dates indicated.
| Date: March 22, 2011 | /s/ Ken Eickerman |
| Ken Eickerman, | |
| the registrant’s principal accounting officer |
53