Attached files
| file | filename |
|---|---|
| EX-32.2 - EXHIBIT 32.2 - MLM INDEX FUND | ex32_2.htm |
| EX-31.1 - EXHIBIT 31.1 - MLM INDEX FUND | ex31_1.htm |
| EX-32.1 - EXHIBIT 32.1 - MLM INDEX FUND | ex32_1.htm |
| EX-31.2 - EXHIBIT 31.2 - MLM INDEX FUND | ex31_2.htm |
UNITED STATES
SECURITIES AND EXCHANGE COMMISSION
Washington, D.C. 20549
Form 10-K
(Mark One)
|
x
|
Annual report pursuant to Section 13 or 15 (d) of the Securities Exchange Act of 1934 for the fiscal year ended December 31, 2010
|
|
o
|
Transition report pursuant to Section 13 or 15 (d) of the Securities Exchange Act of 1934
|
For the transition period from __________________ to ___________________
Commission file number 0-49767
MLM INDEX™ FUND
(Exact name of registrant as specified in its charter)
|
Delaware
|
Unleveraged Series: 22-2897229
|
|
|
Leveraged Series: 22-3722683
|
||
|
Commodity L/S Unleveraged Series: 20-8806944
|
||
|
Commodity L/N Unleveraged Series: 27-1198002
|
||
|
(State of Incorporation)
|
(I.R.S. Employer Identification No.) |
|
405 South State Street
|
||
|
Newtown, PA
|
18940
|
|
|
(Address of principal executive offices)
|
(Zip Code)
|
Registrant’s telephone number, including area code: (267) 759-3500
Securities registered pursuant to Section 12 (b) of the Act:
|
Title of Each Class
|
Name of Exchange on Which Registered
|
|
|
None
|
None
|
Securities registered pursuant to Section 12 (g) of the Act:
Business Trust Interests – Unleveraged Series
Business Trust Interests – Leveraged Series
Business Trust Interests – Commodity L/S Unleveraged Series
Business Trust Interests – Commodity L/N Unleveraged Series
Indicate by check mark if the registrant is a well-known seasoned issuer, as defined in Rule 405 of the Securities Act.
Yes o. No x.
1
Indicate by check mark if the registrant is not required to file reports pursuant to Section 13 or Section 15(d) of the Act.
Yeso. No x.
Note – Checking the box above will not relieve any registrant required to file reports pursuant to Section 13 or 15(d) of the Exchange Act from their obligations under those Sections.
Indicate by check mark whether the registrant (1) has filed all reports required to be filed by Section 13 or 15(d) of the Securities Exchange Act of 1934 during the preceding 12 months (or for such shorter period that the registrant was required to file such reports) and (2) has been subject to such filing requirements for the past 90 days. Yes x No o.
Indicate by check mark whether the registrant has submitted electronically and posted on its corporate Web site, if any, every Interactive Data File required to be submitted and posted pursuant to Rule 405 of Regulation S-T (§232.405 of this chapter) during the preceding 12 months (or for such shorter period that the registrant was required to submit and post such files). Yes o No o.
Indicate by check mark if disclosure of delinquent filers pursuant to Item 405 of Regulation S-K is not contained herein, and will not be contained, to the best of registrant's knowledge, in definitive proxy or information statements incorporated by reference in Part III of this Form 10-K or any amendment to this Form 10-K. x
Indicate by check mark whether the registrant is a large accelerated filer, an accelerated filer, a non-accelerated filer or a smaller reporting company. See definition of “accelerated filer”, “large accelerated filer” and “smaller reporting company” in Rule 12b-2 of the Exchange Act. (Check one)
|
Large accelerated filer o
|
Accelerated filer o
|
|
|
Non-accelerated filer x
|
Smaller reporting company o
|
Indicate by check mark whether the registrant is a shell company (as defined in Rule 12b-2 of the Exchange Act). o Yes x No
As of June 30, 2010, the aggregate fair value of the business trust units of the Unleveraged Series of the registrant held by non-affiliates of the registrant was approximately $38.7 million, the aggregate fair value of the business trust units of the Leveraged Series of the registrant held by non-affiliates of the registrant was approximately $36.9 million, the aggregate fair value of the business trust units of the Commodity L/S Unleveraged Series of the registrant held by non-affiliates of the registrant was approximately $12.7 million, and the aggregate fair value of the business trust units of the Commodity L/N Unleveraged Series of the registrant held by non-affiliates of the registrant was approximately $23.1 million.
As of February15, 2011, the Trust had in issuance 33,624; 47,431; 11; 457,511Unleveraged Series trust units in the A, B, C and D classes respectively; 28,468; 85,272; 13; 207,168 Leveraged Series trust units in the A, B, C and D classes respectively; 123,631Commodity L/S Unleveraged Series in Class D and 453,843 Commodity L/N Unleveraged Series in Class D trust units.
Documents Incorporated by Reference: Certain exhibits in Item 15 are incorporated by reference in this Form 10-K, as specifically set forth in Item 15.
Forward Looking Statements
This Annual Report on Form 10-K contains “forward-looking statements” within the meaning of the Private Securities Litigation Reform Act of 1995 and other Federal Securities Laws. These forward-looking statements are based on our present intent, beliefs and expectations as well as assumptions made by and information currently available to us, but they are not guaranteed to occur and they may not occur. Although we believe that the expectations reflected in these forward-looking statements are reasonable, such statements are subject to known and unknown risks and uncertainties that may be beyond our control, which could cause actual performance or results to differ materially from projected performance or results expressed or implied by the forward-looking statements. Additional information concerning the factors that could cause actual results to differ materially from those in the forward-looking statements is contained in Item 1, “Business”, and Item 1A, “Risk Factors”. You should not place undue reliance upon forward-looking statements. Except as required by law, we undertake no obligation to update or release any forward-looking statements as a result of new information, future events or otherwise.
2
|
Page
|
|||
|
Item 1.
|
4
|
||
|
Item 1B.
|
18
|
||
|
Item 2.
|
18
|
||
|
Item 3.
|
18
|
||
|
Item 4.
|
18
|
||
|
Item 5.
|
19
|
||
|
Item 6.
|
23
|
||
|
Item 7.
|
26
|
||
|
Item 7A.
|
29
|
||
|
Item 8.
|
31
|
||
|
Item 9.
|
33
|
||
|
Item 9A.
|
33
|
||
|
Item 9B.
|
34
|
||
|
Item 10.
|
34
|
||
|
Item 11.
|
35
|
||
|
Item 12.
|
36
|
||
|
Item 13.
|
36
|
||
|
Item 14.
|
36
|
||
|
Item 15.
|
38
|
Item 1. Business
General and Business Segments
The MLM Index™ Fund (the “Trust”) is a business trust organized under the laws of Delaware. The Trust engages primarily in the speculative trading of a diversified portfolio of futures contracts using the MLM Index™ Trading Program (the “Trading Program”). Futures contracts are standardized contracts made on or through a commodity exchange and provide for future delivery of commodities, precious metals, foreign currencies or financial instruments and, in the case of certain contracts such as stock index futures contracts and Eurodollar futures contracts, provide for cash settlement. The Trust's objective is the appreciation of its assets through speculative trading. The Trust began trading on January 4, 1999.
The Trust consists of several separate series of interests (each, a “Series”), each with its own assets and liabilities. Under the Trust Agreement, the Trust may issue multiple Series of Interests. The Trust maintains separate and distinct records for each Series and the assets associated with each such Series are held and accounted for separately from the other assets of the Trust and of any other Series thereof. The debts, liabilities, obligations and expenses incurred, contracted for or otherwise existing with respect to a particular Series are enforceable against the assets of such Series only and not against the assets of the Trust generally or the assets of any other Series. A Statement of Financial Condition and Statement of Operations for each Series can be found in Item 15 of this document.
Mount Lucas Management Corporation (the “Manager”), a Delaware corporation, acts as the manager and trading advisor of the Trust. The Manager was formed in 1986 to act as an investment manager. As of December 31, 2010, the Manager had approximately $1.9 billion of assets under advisement. The Manager is a registered investment adviser under the Investment Advisers Act of 1940, a registered commodity trading advisor and commodity pool operator with the Commodity Futures Trading Commission (the "CFTC") and a member of the National Futures Association (the "NFA"). The Manager may from time to time operate other investment vehicles.
The Trust and the Manager maintain their principal business office at 405 South Street, Newtown, PA 18940 and their telephone number is 267-759-3500.
Wilmington Trust Company, a Delaware banking corporation, acts as trustee for the Trust. The Trustee's office is located at Rodney Square North, 1100 North Market Street, Wilmington, Delaware 19890. The Trustee is unaffiliated with the Manager. The Trustees duties and liabilities are limited to its express obligations under the Amended and Restated Declaration of Trust and Trust Agreement, dated as of August 31, 1998, among the Trustee, the Manager and the Interest Holders from time to time thereunder, as amended (the "Trust Agreement").
Citigroup Global Markets currently acts as clearing broker for all of the Series the Trust. A clearing broker accepts orders to trade futures on behalf of another party and accepts money to support such orders. The clearing broker is a futures commission merchant registered with the CFTC and is a member of the NFA.
Trading Program
Each series of the Trust trades speculatively in a wide range of futures contracts traded on U.S. and foreign exchanges using the Trading Program, which is based upon the MLM Index™ and various subsets (collectively, "MLM Index"). The MLM Index™ and the Trading Program are both proprietary products of the Manager. The Trading Program attempts to replicate the MLM Index™, before fees and expenses. Currently the Trust has four series of interests: the Unleveraged Series, the Leveraged Series, the Commodity L/S Unleveraged Series and the Commodity L/N Unleveraged Series. The Unleveraged Series attempts to replicate the MLM Index™ without any leverage, while the Leveraged Series trades the Trading Program at three times leverage. Leverage is the ability to control large dollar amounts of a commodity with a comparatively small amount of capital. The Leveraged Series purchases or sells $3 fair value of contracts for every $1 invested in the Series. The Commodity L/S Unleveraged Series and Commodity L/N Unleveraged Series attempt to replicate the MLM Commodity Long/Short Index and MLM Commodity Long/Neutral Index respectively, without leverage. The MLM Commodity Long/Short Index is a subset of the MLM Index and contains only the commodity futures contracts of the entire MLM Index. The MLM Commodity Long/Neutral Index contains the same commodity futures contracts, but does not have short positions when the MLM Index algorithm indicates a short position in a particular contract.
In attempting to replicate the MLM Index™, the Manager will invest in the same markets as the MLM Index™; use the same algorithm to determine long versus short positions; make the same allocations to each market; and generally execute positions at almost the same time. The Manager may also use swaps in attempting to replicate the MLM Index™. These swaps would be agreements with dealers to provide the returns which are the same as holding a specific number of futures contracts in a specific market, without holding the actual contracts. The economic effect on the Trust would be substantially identical to holding futures contracts. However, since the holder of swaps assumes additional counterparty risk, swaps are only held infrequently. For the year ended and as of December 31, 2010, none of the Series of the Trust neither held nor hold any swap positions.
The MLM Index™
In 1988, the Manager created the MLM Index™ as a benchmark of the returns to speculation in futures markets. Broadly speaking, the futures markets have two classes of participants, hedgers and speculators. Hedgers are the commercial businesses that use the futures markets to transfer unwanted or excessive price risk to those more willing to absorb that risk. Speculators are position holders who absorb this price risk. In essence, they provide "insurance" to the commercial interest so that the commercial interests can focus on their basic business while being protected from unforeseen changes in commodity prices, interest rates or foreign exchange rates. Basic finance theory argues that the reduction in risk experienced by the hedgers exacts a cost, or risk premium, that is earned by those holding the risk. The intent of the MLM Index™ is to measure this risk premium. In this general sense it is analogous to an index of stocks that measures the premium to holding equity risk.
Price risk in futures markets exists when markets rise and when they fall. For example, an operator of a wheat storage facility is damaged by a fall in the price of wheat in that the value of the inventory in their facility falls. On the other hand, a consumer of wheat, like a baker, incurs financial risk if the price of wheat rises, as the cost of future operations increases. In both cases, steady prices are favorable. Thus, an index designed to capture the risk premium earned must capture returns as markets move up and move down, yet suffer when markets are stable. The MLM Index™ is designed to measure this effect by taking long and short positions in the constituent markets. The existence of the long and short positions in the construction of the MLM Index™ is a significant innovation and important difference from other risk premium measurements.
The MLM Index™ currently invests in futures contracts on the following: Chicago corn, Chicago soybeans, New York sugar, Chicago wheat, Canadian Government Bonds, Euro Bunds, Japanese Government Bonds, Long Gilts, 10-year Treasury Notes, crude oil, heating oil, natural gas, unleaded gasoline, live cattle, New York gold, New York copper, Australian Dollar, British Pound, Canadian Dollar, Swiss Franc, Japanese Yen, and Euro Currency. The selection of the markets in the MLM Index™ is made by the Manager. The selection is based on a variety of factors, including liquidity of the underlying futures contract, the relationship with the other markets in the MLM Index™, and the reasonableness of including the market in the MLM Index™. The choice of markets for a calendar year is made in the December preceding the start of the year, and, except in unusual circumstances, markets are not normally added to or deleted from the MLM Index™ during a year. An extraordinary event that may lead to the removal of a contract during the year might be the permanent suspension of normal trading or an abrupt permanent change in the liquidity of the contract. For example, the Chicago Mercantile Exchange suspended floor trading of the Deutsche Mark contract in August of 2000, ahead of the announced schedule. If a commodity is traded on more than one futures exchange, only the one with the largest open interest is included in the MLM Index™. The open interest is the number of all long or short futures contracts in one delivery month for one market that have been entered into and not yet liquidated by an offsetting transaction or fulfilled by delivery. For example, Chicago Board of Trade wheat has larger open interest than Kansas City Board of Trade wheat; consequently, Chicago Board of Trade wheat is included in the MLM Index™ but Kansas City Board of Trade wheat is not.
In addition to the markets in the MLM Index™, the Manager determines which delivery months will be traded for each market in the MLM Index™. Generally, for each market, four deliveries are chosen that are both liquid and spaced throughout the calendar year. For example, for the Wheat market, the deliveries traded are March, May, July and December. The choice of deliveries is set for each calendar year, but can change due to similar extraordinary circumstances as with the market selection.
The calculation of the MLM Index™ is explained below.
Calculation of the MLM Index™
1. Determination of long or short futures position for each market.
The rate of return of an individual market depends on whether the market position is long or short. Since a futures contract eventually expires, the MLM Index™ is based on the unit asset value of a market, rather than on the actual futures price. This month's unit asset value of a futures market is determined by multiplying last month's value by 1 plus the percentage change in this month's nearby futures price. The market position is long during the current month if the market's closing value on the next-to-last trading day of the prior month is greater than or equal to the market's 252 business day moving average of closing values; otherwise, the market position is short.
2. Calculation of the monthly rate of return for each market.
If the market position is long, then the market monthly rate of return equals the percentage change in the market price during the month, i.e., the market monthly rate of return (%) equals the closing price of the current month divided by the closing price of the prior month, minus 1, times 100. If the market position is short, then the market monthly rate of return (%) equals -1 (minus one) times the percentage change in the market price during the month, i.e., the market monthly rate of return equals the closing price of the current month divided by the closing price of the prior month, minus 1, times -100 (minus 100).
3. Calculation of the monthly rate of return for the MLM Index™.
The monthly rate of return of the MLM Index™ equals the weighted average of the individual market monthly rates of return plus the Treasury Bill rate of return.
4. Determination of the MLM Index™ value.
The value of the MLM Index™ is computed by compounding the MLM Index™ monthly rates of return. The beginning value of the MLM Index™ is defined to be 1000 in January 1961. Each month thereafter, the MLM Index™ is changed by the monthly rate of return. That is, each month's MLM Index™ value is determined by multiplying the prior month's value by 1 plus the current percentage monthly rate of return.
The annual performance of the MLM Index™ and its subsets (MLM Commodity Long/Short Index and MLM Commodity Long/Neutral Index) for each of the past ten years is set forth below.
|
Year
|
Annual Return
|
Annual Return
|
Annual Return
|
|
MLM Index
|
MLM Commodity
|
MLM Commodity
|
|
| Long/Short Index | Long/Neutral Index | ||
|
2001
|
3.67%
|
-1.19
|
-12.13
|
|
2002
|
-1.63
|
-1.34
|
14.15
|
|
2003
|
3.92
|
6.41
|
16.21
|
|
2004
|
3.52
|
19.13
|
16.66
|
|
2005
|
3.75
|
4.56
|
16.67
|
|
2006
|
0.40
|
-4.28
|
-1.76
|
|
2007
|
2.87
|
2.19
|
16.71
|
|
2008
|
13.60
|
34.05
|
-1.40
|
|
2009
|
-2.71
|
-7.19
|
8.01
|
|
2010
|
3.49
|
5.28
|
11.49
|
The MLM Index™ is published daily on the Bloomberg system and is available from the Manager. Since the development of the MLM Index™, other firms have computed similar indices, including the CMI of AssetSight Corporation and an index computed by SAIS in Switzerland. Both indices are variations on the construction of the MLM Index™, either in the derivation of the long and short positions or the relative weights of the markets. In addition, there are many "commodity" indexes, such as the GSCI from Goldman Sachs and AIG Commodity Index. These indexes are long only, and do not include currencies or financial instruments.
Fees and Expenses
Set forth below is a summary of the basic fees that the each of the Series and Classes is subject to.
Brokerage Fee
Each Series of the Trust pays the Manager a brokerage fee at the annual rates set forth below.
|
Classes A and B Unleveraged Series
|
0.85% of net asset value
|
|
|
Classes C and D Unleveraged Series
|
0.40% of net asset value
|
|
|
Classes A and B Commodity L/S Unleveraged Series
|
0.85% of net asset value
|
|
|
Classes C and D Commodity L/S Unleveraged Series
|
0.40% of net asset value
|
|
|
Classes A and B Commodity L/N Unleveraged Series
|
0.85% of net asset value
|
|
|
Classes C and D Commodity L/N Unleveraged Series
|
0.40% of net asset value
|
|
|
Classes A and B Leveraged Series
|
1.75% of net asset value
|
|
|
Classes C and D Leveraged Series
|
0.90% of net asset value
|
The brokerage fee is based on net asset value as of the first day of each month. The net asset value of the Trust equals the sum of all cash, the fair value (or cost of liquidation) of all futures positions and the fair value of all other assets of the Trust, less all liabilities of the Trust (including accrued liabilities), in each case determined per Series by the Manager in accordance with U.S. generally accepted accounting principles. For purposes of determining the brokerage fee, there is no reduction for:
|
(1)
|
the accrued brokerage or management fees,
|
|
(2)
|
any allocation or reallocation of assets effective as of the day the brokerage fee is being calculated, or
|
|
(3)
|
any distributions or redemptions as of the day the brokerage fee is being calculated.
|
No assurance can be given that the brokerage fee will be competitive with the charges of other brokerage firms.
The Manager is responsible for paying all of the Trust's costs of executing and clearing futures trades, including floor brokerage expenses and give-up charges, as well as the NFA, exchange and clearing fees incurred in connection with the Trust's futures trading activities. The Manager may also pay from the brokerage fees, custody fees or amounts necessary for certain administrative and marketing assistance provided by broker/dealers who are also authorized selling agents. NFA fees equal $0.04 per round-turn trade of a futures contract.
Management Fee
Each Series is divided into Class A Interests, Class B Interests, Class C Interests and Class D interests. Class A and C Interests are generally sold through registered broker-dealers and Class B and D Interests are generally offered through fee-only advisors. The Trust pays the Manager a monthly management fee at the annual rates set forth below.
Unleveraged Series, Commodity L/S Unleveraged Series and Commodity L/N Unleveraged Series
Class A 1.50% of net asset value
Class B 0.50% of net asset value
Class C 1.00% of net asset value
Class D 0.50% of net asset value
Leveraged Series
Class A 2.80% of net asset value
Class B 1.30% of net asset value
Class C 2.05% of net asset value
Class D 1.30% of net asset value
The management fee is determined and paid as of the first day of each calendar month. For purposes of determining the management fee, there is no reduction for:
|
(1)
|
accrued management fees,
|
|
(2)
|
any allocation or reallocation of assets effective as of the day the management fee is being calculated, or
|
|
(3)
|
any distributions or redemptions as of the day the management fee is being calculated.
|
The Manager pays from the management fee an annual fee for interests sold by authorized selling agents appointed by the Manager for the Class A Series, in the amount of 100 basis points for the Unleveraged Series, Commodity L/S Unleveraged Series and Commodity L/N Unleveraged Series and 150 basis points for the Leveraged Series of the Trust's net asset value for each respective series; and for the Class C Series, in the amount of 50 basis points for the Unleveraged Series, Commodity L/S Unleveraged Series and Commodity L/N Unleveraged Series and 50 basis points for the Leveraged Series, L/S Leveraged Series and Commodity L/N Leveraged Series of the Trust's net asset value for each respective series. As of December 31, 2010, the L/S Leveraged Series and Commodity L/N Leveraged Series of the Trust have not commenced trading and have no assets.
Organizational Fee
Prior to January 1, 2010, investors in Classes A and B of each Series paid an organizational fee of 0.50% of their initial and any subsequent investment(s) (excluding exchanges) to the Manager to cover expenses associated with the organization of the Trust and the offering of interests. This fee will be deducted from each investment in determining the number of interests purchased. An organizational fee was charged until an investor’s total contribution was greater than or equal to $1,000,000. If the organizational expenses exceeded the organizational fees collected by the Manager, the Manager paid any costs above the collected fees. If the organizational fees paid to the Manager exceed actual organizational expenses, any excess was retained by the Manager and may be shared with consultants that the Manager may engage from time to time. Specifically, consultants who assist the Trust in distributing the interests may be paid a share of the organizational fees. Subsequent to January 1, 2010, the investors in classes A and B of all series no longer pay an organizational fee.
Operating and Administrative Expenses
Each Series of the Trust pays the Manager an annual fee of 0.35% of the net asset value as reimbursement for its legal, accounting and other routine administrative expenses and fees, including fees to the Trustee. The Trustee is paid an annual fee and reimbursed for out-of-pocket expenses. Each Series pays its own cash manager fees and banking fees. The relevant series generally pays any extraordinary expenses, including legal claims and liabilities and litigation costs and any indemnification related thereto. To the extent the extraordinary expenses arise as a result of the gross negligence or willful misconduct of the Manager, the Manager may be deemed responsible to pay the extraordinary expenses to that extent.
Selling Commission
Investors who subscribe for Class A Interests and Class C Interests will be charged a sales commission of 0% to 4% of the subscription amount, payable to the selling agent from the investor's investment. The amount of the sales commission is determined by the selling agent. Investors who subscribe for Class B Interests and Class D Interests will generally not be charged a sales commission.
Futures Trading
Futures Contracts
Futures contracts are contracts made on or through a commodity exchange and provide for future delivery of agricultural and industrial commodities, precious metals, foreign currencies or financial instruments and, in the case of certain contracts such as stock index futures contracts and Eurodollar futures contracts, provide for cash settlement. Futures contracts are uniform for each commodity on each exchange and vary only with respect to price and delivery time. A contract to buy or sell may be satisfied either by taking or making delivery of the commodity and payment or acceptance of the entire purchase price thereof, or by offsetting the obligation with a contract containing a matching contractual obligation on the same (or a linked) exchange prior to delivery. United States commodity exchanges individually or, in certain limited situations, in conjunction with certain foreign exchanges, provide a clearing mechanism to facilitate the matching of offsetting trades. Once trades made between members of an exchange have been confirmed, the clearinghouse becomes substituted for the clearing member acting on behalf of each buyer and each seller of contracts traded on the exchange and in effect becomes the other party to the trade. Thereafter, each clearing member firm party to the trade looks only to the clearinghouse for performance. Clearinghouses do not deal with customers, but only with member firms, and the guarantee of performance under open positions provided by the clearinghouse does not run to customers. If a customer’s commodity broker becomes bankrupt or insolvent, or otherwise defaults on such broker’s obligations to such customer, the customer in question may not receive all amounts owed to such customer in respect of his trading, despite the clearinghouse fully discharging all of its obligations.
Hedgers and Speculators
Two broad classifications of persons who trade in commodity futures are (1) hedgers and (2) speculators. Commercial interests, including banks and other financial institutions, and farmers, who market or process commodities, use the futures markets for hedging. Hedging is a protective procedure designed to minimize losses which may occur because of price fluctuations. The commodity markets enable the hedger to shift the risk of price fluctuations to the speculator. The usual objective of the hedger is to protect the expected profit from financial or other commercial operations, rather than to profit strictly from futures trading.
The speculator, such as the Trust, risks its capital with the expectation of making profits from the price fluctuations in futures contracts. The hedger seeks to offset any potential loss (measured as the difference between the price at which he had expected to buy or sell and the price at which he is eventually able to buy or sell) in the purchase or sale of the commodity hedged. Likewise, losses in futures trading might be offset by unexpected gains on transactions in the actual commodity. The speculator assumes the risks which the hedger seeks to avoid.
Speculators rarely expect to take or make delivery of the cash or actual physical commodity in the futures market. Rather, they generally close out their futures positions by entering into offsetting purchases or sales of futures contracts. Because the speculator may take either a long or short position in the futures markets, it is possible for the speculator to earn profits or incur losses regardless of the direction of price trends.
Trading Approaches
Commodity traders generally may be classified as either systematic or discretionary. A systematic trader will rely primarily on trading programs or models to generate trading signals. A systematic trader will also rely, to some degree, on judgmental decisions concerning, for example, what markets to follow and commodities to trade, when to liquidate a position in a contract month which is about to expire and how large a position to take in a particular commodity. The systems utilized to generate trading signals are changed from time to time, but the trading instructions generated by the then-current systems are generally followed without significant additional analysis or interpretation.
In contrast, discretionary traders, while sometimes utilizing a variety of price charts and computer programs to assist them in making trading decisions, make these decisions on the basis of their own judgment. It is possible to describe a discretionary trader's experience, the type of information which he consults, the number of commodities he follows or trades and the degree to which he leverages his accounts. However, in assessing the potential for future profitability in the case of a discretionary trader, the talents and abilities of the individual, rather than the profitability of any particular system or identifiable method, must be evaluated.
Margins
Margins are good faith deposits which must be made with a commodity broker in order to initiate or maintain an open position in a futures contract. When futures contracts are traded in the United States and on most exchanges abroad, both buyer and seller are required to post margins with the broker handling their trades as security for the performance of their buying and selling undertakings, and to offset losses on their trades due to daily fluctuations in the markets. Minimum margins usually are set by the exchanges.
A customer's margin deposit is treated as equity in his account. A change in the market price of the futures contract will increase or decrease the equity. If this equity decreases below the maintenance margin amount (generally 75% of the initial margin requirement), the broker will issue a margin call requiring the customer to increase the account's equity to the initial margin. Failure to honor such a margin call generally will result in the closing out of the open position. If, at the time such open position is closed, the account equity is negative, then the equity in the customer's remaining open positions, if any, in excess of the required margins, as well as the customer's cash reserves will be used to offset such debit balance, and if such equities and reserves are not sufficient the customer will be liable for the remaining unpaid balance.
United States Regulations
Commodity Exchange Act (“the CE Act”). The United States Congress enacted the CE Act to regulate trading in commodities, the exchanges on which they are traded, the individual brokers who are members of the exchanges, and commodity professionals and commodity brokerage houses that trade in these commodities in the United States.
Commodity Futures Trading Commission (the “CFTC”). The CFTC is an independent governmental agency which administers the CE Act and is authorized to promulgate rules thereunder. A function of the CFTC is to implement the objectives of the CE Act in preventing price manipulation and excessive speculation and promoting orderly and efficient commodity futures markets. The CFTC has adopted regulations covering, among other things:
|
|
·
|
the designation of contract markets;
|
|
|
·
|
the monitoring of United States commodity exchange rules;
|
|
|
·
|
the establishment of speculative position limits;
|
|
|
·
|
the registration of commodity brokers and brokerage houses, floor brokers, introducing brokers, leverage transaction merchants, commodity trading advisors, commodity pool operators and their principal employees engaged in non-clerical commodities activities (associated persons); and
|
|
|
·
|
the segregation of customers funds and record keeping by, and minimum financial requirements and periodic audits of, such registered commodity brokerage houses and professionals.
|
Under the CE Act, the CFTC is empowered, among other things, to:
|
|
·
|
hear and adjudicate complaints of any person (e.g., an Interest Holder) against all individuals and firms registered or subject to registration under the CE Act (reparations),
|
|
|
·
|
seek injunctions and restraining orders,
|
|
|
·
|
issue orders to cease and desist,
|
|
|
·
|
initiate disciplinary proceedings,
|
|
|
·
|
revoke, suspend or not renew registrations and
|
|
|
·
|
levy substantial fines.
|
The CE Act also provides for certain other private rights of action and the possibility of imprisonment for certain violations.
The CFTC has adopted extensive regulations affecting commodity pool operators and commodity trading advisors such as the Manager and their associated persons. These regulations, among other things, require the giving of disclosure documents to new customers and the retention of current trading and other records, prohibit pool operators from commingling pool assets with those of the operators or their other customers and require pool operators to provide their customers with periodic account statements and an annual report. Upon request by the CFTC, the Manager will also furnish the CFTC with the names and addresses of the interest holders, along with copies of all transactions with, and reports and other communications to, the interest holders.
United States Commodity Exchanges. United States commodity exchanges are given certain latitude in promulgating rules and regulations to control and regulate their members and clearing houses, as well as the trading conducted on their floors. Examples of current regulations by an exchange include establishment of initial and maintenance margin levels, size of trading units, daily price fluctuation limits and other contract specifications. Except for those rules relating to margins, all exchange rules and regulations relating to terms and conditions of contracts of sale or to other trading requirements currently must be reviewed and approved by the CFTC.
National Futures Association (the “NFA”). Substantially all commodity pool operators, commodity trading advisors, futures commission merchants, introducing brokers and their associated persons are members or associated members of the NFA. The NFA's principal regulatory operations include:
|
|
·
|
auditing the financial condition of futures commission merchants, introducing brokers, commodity pool operators and commodity trading advisors;
|
|
|
·
|
arbitrating commodity futures disputes between customers and NFA members;
|
|
|
·
|
conducting disciplinary proceedings; and
|
|
|
·
|
registering futures commission merchants, commodity pool operators, commodity trading advisors, introducing brokers and their respective associated persons, and floor brokers.
|
The regulation of commodities transactions in the United States is a rapidly changing area of law and the various regulatory procedures described herein are subject to modification by United States congressional action, changes in CFTC rules and amendments to exchange regulations and NFA regulations.
Item 1A. Risk Factors
Historical Results of the MLM Index™ may not be indicative of future results
The MLM Index™ historical results may not be indicative of future results. The MLM Index™ results are based on the analysis of a particular period of time. The future performance of the MLM Index™ is entirely unpredictable.
Performance of the Trust May be Different than the MLM Index™
Each Series attempts to replicate the MLM Index™. In doing so, each Series will establish positions in the futures markets. The prices at which a Series executes these positions may be significantly different than the prices used to calculate the MLM Index™. In addition, the Trust charges various fees and commissions which will lower the return of each Series vs. the MLM Index™. All these factors mean that Series performance will be different and in all likelihood lower than the results of the comparable MLM Index™.
Futures Trading Involves Substantial Leverage
Futures contracts are typically traded on margin. This means that a small amount of capital can be used to invest in contracts of much greater total value. The resulting leverage means that a relatively small change in the market price of a futures contract can produce a substantial profit or loss. Leverage enhances the Trust's sensitivity to market movements that can result in greater profits when the Trading Program anticipates the direction of the move correctly or greater losses when the Trading Program is incorrect. The Unleveraged Series, Commodity L/S Unleveraged Series and Commodity L/N Unleveraged Series attempt to replicate the MLM Index™, the MLM Commodity Long/Short Index and the MLM Commodity Long/Neutral Index respectively without leverage and the Leveraged Series trades the MLM Index™ at three times leverage.
Futures Trading Is Speculative, Highly Volatile and Can Result in Large Losses
A principal risk in futures trading is the rapid fluctuation in the market prices of futures contracts. A Series' profitability depends greatly on the Trading Program correctly anticipating trends in market prices. If the Trading Program incorrectly predicts the movement of futures prices, large losses could result. Price movements of futures contracts are influenced by such factors as: changing supply and demand relationships; government trade, fiscal, monetary and exchange control programs and policies; national and international political and economic events; and speculative frenzy and the emotions of the market place. The Manager has no control over these factors.
Illiquid Markets Could Make It Impossible for the Trust to Realize Profits or Limit Losses
Although each Series trades in ordinarily highly liquid markets, there may be circumstances in which it is not possible to execute a buy or sell order at the desired price, or to close out an open position, due to market conditions. Daily price fluctuation limits are established by the exchanges and approved by the CFTC. When the market price of a futures contract reaches its daily price fluctuation limit, no trades can be executed at prices outside such limit. The holder of a commodity futures contract (including a Series) may be locked into an adverse price movement for several days or more and lose considerably more than the initial margin put up to establish the position. Another possibility is the unforeseen closure of an exchange due to accident or government intervention.
Speculative Position Limits May Require the Manager to Modify Its Trading to the Detriment of the Trust
The exchanges have established and the CFTC has approved speculative position limits (referred to as position limits) on the maximum futures position which any person, or group of persons acting in concert, may hold or control in particular futures contracts. In addition, certain exchanges, in lieu of speculative position limits, have adopted position accountability requirements that could require a person whose positions in a contract exceed a specified level to provide information to the exchange relating to the nature of such person's trading strategy. The Manager may be required to reduce the size of the future positions which would otherwise be taken to avoid exceeding such limits or requirements. Such modification of the Trust's trades, if required, could adversely affect the operations and profitability of the Trust.
Trading of Swaps Could Subject the Trust to Substantial Losses
Each Series may enter into swap and similar transactions. Swap contracts are not traded on exchanges and are not subject to the same type of government regulation as exchange markets. As a result, many of the protections afforded to participants on organized exchanges and in a regulated environment are not available in connection with these transactions. The swap markets are "principals' markets," in which performance with respect to a swap contract is the responsibility only of the counterparty which the participant has entered into a contract, and not of any exchange or clearinghouse. As a result, the Trust is subject to the risk of the inability or refusal to perform with respect to such contracts on the part of the counterparties with which the Trust trades. Any such failure or refusal, whether due to insolvency, bankruptcy, default, or other cause, could subject the Trust to substantial losses. There are no limitations on daily price movements in swap transactions. Speculative position limits do not apply to swap transactions, although the counterparties with which each Series deals may limit the size or duration of positions available to a Series as a consequence of credit considerations. Participants in the swap markets are not required to make continuous markets in the swap contracts they trade. Participants could refuse to quote prices for swap contracts or quote prices with an unusually wide spread between the price at which they are prepared to buy and the price at which they are prepared to sell.
Substantial Expenses Will Cause Losses for the Trust Unless Offset by Profits and Interest Income
Each Series is subject to substantial fees and expenses, including brokerage fees, management fees and operating and administrative expenses. In addition, certain investors are subject to an organizational charge and/or a selling commission. Set forth below are tables which set forth the basic fees that each of the Series and Classes is subject to.
|
Leveraged Series
|
||||||||||||||||||||||||
|
Brokerage Fee
|
Management Fee
|
Organizational Fee
|
Admin Fee
|
Selling Expense
|
Total Fees and Commissions
|
|||||||||||||||||||
|
Class A
|
1.75 | % | 2.80 | % | N/A | * | 0.35 | % | 4.00 | % | 8.90 | % | ||||||||||||
|
Class B
|
1.75 | % | 1.30 | % | N/A | * | 0.35 | % | N/A | 3.40 | % | |||||||||||||
|
Class C
|
0.90 | % | 2.05 | % | N/A | 0.35 | % | 4.00 | % | 7.30 | % | |||||||||||||
|
Class D
|
0.90 | % | 1.30 | % | N/A | 0.35 | % | N/A | 2.55 | % | ||||||||||||||
|
Unleveraged Series, Commodity L/S Unleveraged Series and Commodity L/N Unleveraged Series
|
||||||||||||||||||||||||
|
Brokerage Fee
|
Management Fee
|
Organizational Fee
|
Admin Fee
|
Selling Expense
|
Total Fees and Commissions
|
|||||||||||||||||||
|
Class A
|
0.85 | % | 1.50 | % | N/A | * | 0.35 | % | 4.00 | % | 7.20 | % | ||||||||||||
|
Class B
|
0.85 | % | 0.50 | % | N/A | * | 0.35 | % | N/A | 2.20 | % | |||||||||||||
|
Class C
|
0.40 | % | 1.00 | % | N/A | 0.35 | % | 4.00 | % | 5.75 | % | |||||||||||||
|
Class D
|
0.40 | % | 0.50 | % | N/A | 0.35 | % | N/A | 1.25 | % | ||||||||||||||
*effective January 1, 2010
The Brokerage Fee and the Management Fee shall be paid to the Manager. It will be necessary for each Series to achieve gains from trading and interest income in excess of its charges for investors to realize increases in the net asset value of their interests. A Series may not be able to achieve any appreciation of its assets.
The Manager Alone Makes the Trust's Trading Decisions
The Manager makes all commodity trading decisions for all Series and, accordingly, the success of each Series largely depends upon the Manager's judgment and abilities to make the necessary adjustments to the Trading Program. There is no guarantee that the Trading Program's trading on behalf of the Trust will prove successful under all or any market conditions. The performance record of the Trading Program also reflects significant variations in profitability from period to period.
You Have No Right to Remove the Manager
Under the Trust Agreement, interest holders have no right to remove the Manager as manager of the Trust for cause or for any other reason.
The Manager Advises Other Clients
The Manager may be managing and advising large amounts of other funds for other clients at the same time as it is managing Trust assets and, as a result, the Trust may experience increased competition for the same contracts.
Limited Ability To Liquidate Investment In Interests
You can only redeem your interests at month-end upon 10 business days advance notice. The net asset value per interest may vary significantly from month-to-month. You will not know at the time you submit a redemption request what the redemption value of your interests will be. The restrictions imposed on redemptions limit your ability to protect yourself against major losses by redeeming part or all of your interests.
The Manager must consent before you can transfer or assign your interests and the securities laws provide additional restrictions on the transferability of interests. There will not be a secondary market for interests.
You Have No Rights Of Control
You will be unable to exercise any control over the business of the Trust. In addition, the Manager can cause a Series to redeem your interests upon 10 business days prior written notice for any reason in the Manager's sole discretion. The Manager may elect to cause a Series to redeem your interests when your continued holding of interests would or might violate any law or constitute a prohibited transaction under ERISA or the Internal Revenue Code and a statutory, class or individual exemption from the prohibited transaction provisions of ERISA for such transaction or transactions does not apply or cannot be obtained from the Department of Labor (or the Manager determines not to seek such an exemption).
You Have Limited Rights to Inspect Books and Records
You will have only limited rights to inspect the books and records of the Trust and the Manager. You will generally only have the right to inspect the books and records of the Trust and the Manager as are specifically granted under the Delaware Business Trust Act. In particular, information regarding positions held by a Series, to the extent deemed proprietary or confidential by the Manager, will not be made available to you except as required by law.
Limited Arms-Length Negotiation
The initial offering price per interest was established arbitrarily. Except for the agreements with the Trustee, the terms of this offering and the structure of the Trust have not been established as the result of arms-length negotiation.
Each Series Could Lose Assets and Have Its Trading Disrupted Due to the Bankruptcy of its Clearing Broker or Others
Each Series is subject to the risk of clearing broker, exchange or clearinghouse insolvency. Series assets could be lost or impounded in such an insolvency during lengthy bankruptcy proceedings. Were a substantial portion of a Series' capital tied up in a bankruptcy, the Manager might suspend or limit trading, perhaps causing a Series to miss significant profit opportunities.
Each Series Is Subject to Certain Conflicts of Interest
The Manager and the clearing broker are subject to certain actual and potential conflicts of interests.
Although the Manager is not affiliated with a commodity broker, the Manager may have a conflict of interest in selecting brokers because of long-standing business dealings with certain brokers. In addition, the Manager, its principals and affiliates may have commodity accounts at the same brokerage firms as the Trust, and, because of the amount traded through such brokerage firms, may pay lower commissions than the Trust.
The Manager, the clearing broker, their respective affiliates and each of their principals, directors, officers, employees and families may be trading and directing other futures accounts, including their own accounts. Each will not be aware of what others are doing on behalf of a Series, and they may take positions similar or opposite to those of a Series or in competition with a Series. Generally, a Series will enter orders only once a month. The Manager will allocate transactions among the Series of the Trust and other clients in a manner believed by the Manager to be equitable to each.
In certain instances, the clearing broker may have orders for trades from a Series and orders from its own employees and it might be deemed to have a conflict of interest between the sequence in which such orders are transmitted to the trading floor.
The Manager and its principals are engaged in substantial activities, including managing other accounts not involving the Trust, and will devote to the Trust such amount of their time as they determine reasonable and necessary. The compensation received by the Manager and its principals from such other accounts and entities may differ from the compensation it receives from the Trust.
Investment advisers and broker-dealers receiving continuing compensation from the Manager on interests sold by them will have a financial incentive to encourage investors to purchase and not to redeem their interests.
The Trust could be Taxed as a Corporation
In the opinion of the Trust's counsel, under current federal income tax law, each Series will be classified as a partnership and not as an association taxable as a corporation for federal income tax purposes, and each such Series should not be subject to federal income taxation as a corporation under the provisions applicable to so-called publicly traded partnerships. However, you should note that the Trust has not and will not request a ruling from the Internal Revenue Service to this effect. If the Trust or a Series were taxed as a corporation for federal income tax purposes, the net income of the Trust or a Series would be taxed to the Trust or a Series at corporate income tax rates, no losses of the Trust or a Series would be allowable as deductions to the interest holders, and all or a portion of any distributions by the Trust or a Series to the interest holders, other than liquidating distributions, would constitute dividends to the extent of the Trust's or a Series' current or accumulated earnings and profits and would be taxable as such.
You Are Taxed Every Year on Your Share of a Series' Profits Not Only When You Redeem as Would Be the Case if You Held Stocks or Bonds
You will be taxed each year on your investment in a Series, irrespective of whether you receive distributions or redeem any interests. In contrast, an investor holding stocks or bonds generally pays no tax on their capital appreciation until the securities are sold. Over time, the deferral of tax on stock and bond appreciation has a compounding effect.
Deductibility of Expenses May be Limited
You could be required to treat the management fees, as well as certain other expenses of a Series, as investment advisory fees, which are subject to substantial restrictions on deductibility for individual taxpayers. The Manager has not, to date, been classifying the management fee or such expenses as investment advisory fees, a position to which the Internal Revenue Service might object. Should the Internal Revenue Service re-characterize the management fee or other expenses as investment advisory fees, you may be required to pay additional taxes, interest and penalties.
The Series' Trading Gains May Be Taxed at Higher Rates
You will be taxed on your share of any trading profits of a Series at both short- and long-term capital gain rates. These tax rates are determined irrespective of how long you hold Interests. Consequently, the tax rate on a Series' trading gains may be higher than those applicable to other investments you hold for a comparable period.
Tax Could Be Due from You on Your Share of a Series' Interest Income Despite Overall Losses
You may be required to pay tax on your allocable share of a Series' interest income, even though the Series incurs overall losses. Trading losses can only be used by individuals to offset trading gains and $3,000 of interest income each year. Consequently, if you were allocated $5,000 of interest income net of expenses and $10,000 of net trading losses, you would owe tax on $2,000 of interest income even though you would have a $5,000 loss for the year. The $7,000 capital loss would carry forward, but subject to the same limitation on its deductibility against interest income.
Possibility of Tax Audit
There can be no assurance that tax returns of a Series will not be audited by the Internal Revenue Service or that such audits will not result in adjustments to such returns. If an audit results in an adjustment, you may be required to file amended returns and to pay additional taxes plus interest.
Employee Benefit Plan Considerations
Although the Manager will be a fiduciary to the ERISA investors with respect to the assets of such investors invested in a Series, neither the Manager, nor the Trustee, nor any of their affiliates, agents, or employees will act as a fiduciary to any ERISA investor with respect to the ERISA investor's decision to invest assets in a Series. Fiduciaries of prospective ERISA investors, in consultation with their advisors, should carefully consider the application of ERISA and the regulations issued there under on an investment in a Series.
Absence of Certain Statutory Registrations
The Trust is not registered as an investment company or mutual fund, which would subject it to extensive regulation under the Investment Company Act of 1940, as amended. If the Trust were required to register as an investment company, it would be subject to additional regulatory restrictions. Some of these restrictions would be fundamentally inconsistent with the operation of the Trust, including among other things, restrictions relating to the liquidity of portfolio investments, to the use of leverage, to custody requirements, and to the issuance of senior securities. As a result, it would be impractical for the Trust to continue its current operations. Consequently, you will not benefit from certain of the protections afforded by the Investment Company Act of 1940, as amended. However, the Manager is registered with the Securities and Exchange Commission under the Investment Advisers Act of 1940, as amended, and thus is an investment manager for purposes of ERISA. In addition, the Manager is registered as a commodity pool operator and a commodity trading advisor with the CFTC, is a member of the NFA and is subject to extensive regulation under the Commodity Exchange Act.
No Independent Counsel
No independent counsel has been selected to represent the interests of the interest holders and there have been no negotiations between the Manager and any interest holders in connection with the terms of the offering or the terms of the Trust Agreement.
Item 1B Unresolved Staff Comments
None
Item 2. Properties
The Trust does not own or lease any physical properties. The Trust's office is located within the office of the Manager at 405 South Street, Newtown, PA 18940.
Item 3. Legal Proceedings
There are no pending legal proceedings to which the Trust or the Manager is a party or to which any of their assets are subject.
Item 4. (Removed and Reserved)
Not applicable.
Item 5. Market For Registrant's Common Equity and Related Stockholder Matters
There currently is no established public trading market for the interests. As of December 31, 2010, approximately $36 million Leveraged Series interests were held by 494 owners, $50 million Unleveraged Series interests were held by 317 owners, $14 million Commodity L/S Unleveraged Series interests were held by 4 owners and $49 million Commodity L/N Unleveraged Series interests were held by 8 owners.
The interests are "restricted securities" within the meaning of Rule 144 promulgated under the Securities Act of 1933, as amended (the "Securities Act"), and may not be sold unless registered under the Securities Act or sold in accordance with an exemption therefrom, such as Rule 144. The Trust has no plans to register any of the interests for resale. In addition the Trust Agreement provides that an interest holder may transfer its interests only upon the approval of the Manager in the Manager's sole and absolute discretion.
Pursuant to the Trust Agreement, the Manager has the sole discretion to determine whether distributions (other than on redemption of interests), if any, will be made to interest holders. The Trust has never paid any distribution and does not anticipate paying any distributions of interest holders in the foreseeable future.
Recent Sales of Unregistered Securities
From October 1, 2010 to December 31, 2010, a total of 131,192 interests were sold for the aggregate net subscription amount of $13,841,400. Total number of purchasers was 14. There were no non-accredited investors during this period. Details of the sale of these interests are as follows:
|
Series
|
Date
|
Subscriptions
|
Units
|
Price
|
# of Purchasers
|
||||||||||||
|
|
|
|
|
|
|
||||||||||||
|
Leveraged A Units
|
10/1/2010
|
$ | 0 | 0 | $ | 0 | 0 | ||||||||||
|
Leveraged B Units
|
10/1/2010
|
74,550 | 696 | 107.05 | 2 | ||||||||||||
|
Leveraged C Units
|
10/1/2010
|
0 | 0 | 0 | 0 | ||||||||||||
|
Leveraged D Units
|
10/1/2010
|
0 | 0 | 0 | 0 | ||||||||||||
|
Leveraged A Units
|
11/1/2010
|
0 | 0 | 0 | 0 | ||||||||||||
|
Leveraged B Units
|
11/1/2010
|
0 | 0 | 0 | 0 | ||||||||||||
|
Leveraged C Units
|
11/1/2010
|
0 | 0 | 0 | 0 | ||||||||||||
|
Leveraged D Units
|
11/1/2010
|
0 | 0 | 0 | 0 | ||||||||||||
|
Leveraged A Units
|
12/1/2010
|
0 | 0 | 0 | 0 | ||||||||||||
|
Leveraged B Units
|
12/1/2010
|
0 | 0 | 0 | 0 | ||||||||||||
|
Leveraged C Units
|
12/1/2010
|
0 | 0 | 0 | 0 | ||||||||||||
|
Leveraged D Units
|
12/1/2010
|
285,000 | 2,654 | 107.39 | 2 | ||||||||||||
|
Total Leveraged Series
|
359,550 | 3,350 | 4 | ||||||||||||||
|
Unleveraged A Units
|
10/1/2010
|
0 | 0 | 0 | 0 | ||||||||||||
|
Unleveraged B Units
|
10/1/2010
|
61,050 | 483 | 126.39 | 1 | ||||||||||||
|
Unleveraged C Units
|
10/1/2010
|
0 | 0 | 0 | 0 | ||||||||||||
|
Unleveraged D Units
|
10/1/2010
|
2,599,938 | 22,849 | 113.79 | 4 | ||||||||||||
|
Unleveraged A Units
|
11/1/2010
|
0 | 0 | 0 | 0 | ||||||||||||
|
Unleveraged B Units
|
11/1/2010
|
0 | 0 | 0 | 0 | ||||||||||||
|
Unleveraged C Units
|
11/1/2010
|
0 | 0 | 0 | 0 | ||||||||||||
|
Unleveraged D Units
|
11/1/2010
|
699,938 | 6,083 | 115.07 | 2 | ||||||||||||
|
Unleveraged A Units
|
12/1/2010
|
0 | 0 | 0 | 0 | ||||||||||||
|
Unleveraged B Units
|
12/1/2010
|
924 | 7 | 125.51 | 1 | ||||||||||||
|
Unleveraged C Units
|
12/1/2010
|
0 | 0 | 0 | 0 | ||||||||||||
|
Unleveraged D Units
|
12/1/2010
|
120,000 | 1,061 | 113.09 | 1 | ||||||||||||
|
Total Unleveraged Series
|
3,481,850 | 30,476 | 9 | ||||||||||||||
|
Commodity L/S D Units
|
10/1/2010
|
0 | 0 | 0 | 0 | ||||||||||||
|
Commodity L/S D Units
|
11/1/2010
|
0 | 0 | 0 | 0 | ||||||||||||
|
Commodity L/S D Units
|
12/1/2010
|
0 | 0 | 0 | 0 | ||||||||||||
|
Total Commodity L/S Series
|
0 | 0 | 0 | ||||||||||||||
|
Commodity L/N D Units
|
10/1/2010
|
0 | 0 | 0 | 0 | ||||||||||||
|
Commodity L/N D Units
|
11/1/2010
|
10,000,000 | 97,359 | 102.72 | 1 | ||||||||||||
|
Commodity L/N D Units
|
12/1/2010
|
0 | 0 | 0 | 0 | ||||||||||||
|
Total Commodity L/N Series
|
10,000,000 | 97,359 | 1 | ||||||||||||||
|
Trust Total
|
$ | 13,841,400 | 131,192 | 14 | |||||||||||||
The price of the interests of each Class reflects the net asset value of interests in the Class. The interests were sold pursuant to Rule 506 of Regulation D and the sales were exempt from registration under the Securities Act of 1933. Purchasers of the interests completed subscription documents in which they represented that they were accredited investors as defined in Regulation D and a Form D was filed with the Securities and Exchange Commission in the time periods prescribed by Regulation D.
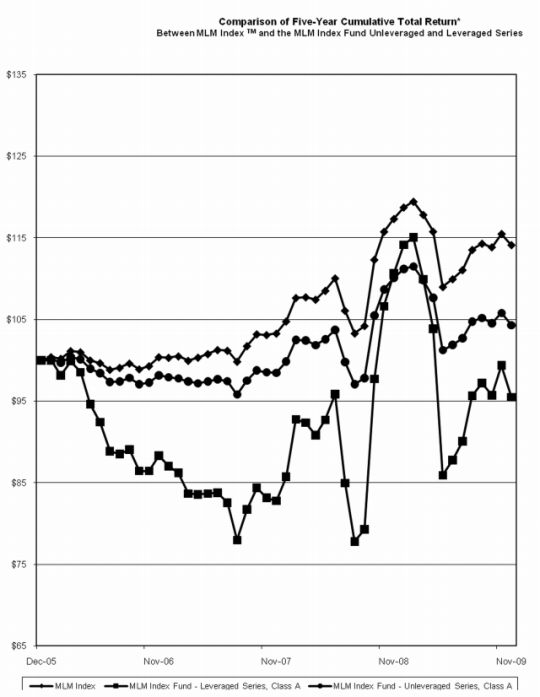
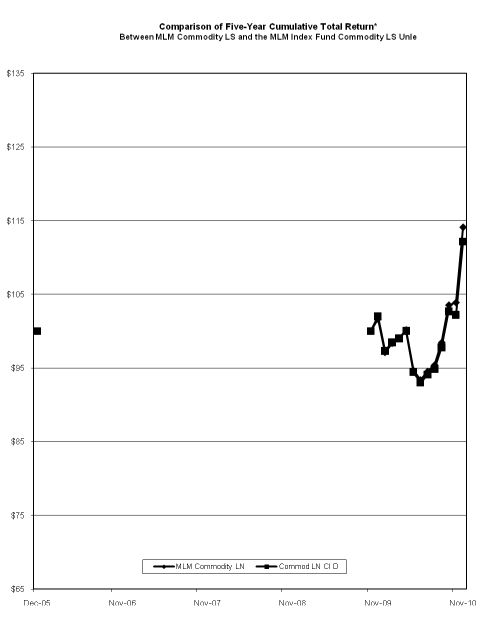
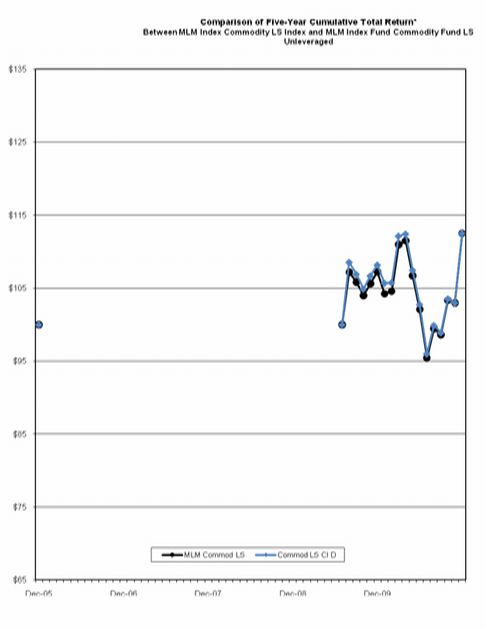
Five Year Cumulative Performance of the Trust
Since the Trust does not deal in equities, it cannot compare its return against an equivalent broad-based equities market index. As set forth below, the Trust has selected the MLM Index™, with which to compare its cumulative five-year return. Although the Trust contains multiple classes of interests, it has taken as a representative example, the highest fee classes in both the Leveraged and Unleveraged Series. In both cases, the Trust has indicated the cumulative total return for Class A interests for the Leveraged and Unleveraged Series.
So as to comply as much as possible with the promulgated rules, the Trust has used the MLM Index™ to compare its cumulative total return. Created in 1988, the MLM Index™ is a benchmark of the returns available to a futures investor. It is based on daily closing prices of the nearby contract month of a portfolio chosen from among the most active futures markets. The Index Committee of Mount Lucas Management Corporation makes the choice of markets for a calendar year in the December preceding the start of the year, and, except in unusual circumstances, markets are not normally added to or deleted from the MLM Index™ during a year. The MLM Index™ is a widely recognized benchmark for evaluating managed futures performance that is frequently discussed in periodicals such as the Wall Street Journal, Institutional Investor, Pension World and Pensions & Investments. Performance of the MLM Index™ is available through Bloomberg™, LP and Morningstar.
The MLM Index™ is unique in the industry in that the Index contains long and short positions in the various futures contracts. Since no other publicly available, widely distributed, transparent index in the market place has this feature it is not possible to compare the performance of the MLM Index Fund with another index.
The Comparison of Five-Year Cumulative Total Returns Graphs, set forth below, assumes that an investment in units in the Trust, and the MLM Index™, was $100 on December 31, 2005 or the start date of the Series, whichever occurred later. The Cumulative Total Return is based on unit price appreciation (there were no dividends declared or paid during the period) from December 31, 2005 through December 31, 2010.
|
12/31/06
|
12/31/07
|
12/31/08
|
12/31/09
|
12/31/10
|
|
|
MLM Index™
|
100.40
|
103.29
|
117.33
|
114.13
|
118.10
|
|
MLM Commodity Long/Short Index
|
107.24
|
112.52
|
|||
|
MLM Commodity Long/Neutral Index
|
101.65
|
114.10
|
|||
|
MLM Index Fund - Leveraged Series, Class A
|
88.29
|
82.76
|
100.63
|
95.48
|
99.99
|
|
MLM Index Fund - Unleveraged Series, Class A
|
98.17
|
98.46
|
110.11
|
104.30
|
104.88
|
|
MLM Index Fund – Commodity L/S Unleveraged Series, Class D
|
108.17
|
112.51
|
|||
|
MLM Index Fund – Commodity L/N Unleveraged Series, Class D
|
102.00
|
112.15
|
Item 6. Selected Financial Data
The Trust began trading on January 4, 1999. Set forth below is certain selected historical data for the Trust and each of its respective Series for the 5 years ended December 31, 2010. The selected historical financial data were derived from the financial statements of the Trust, which were audited by EisnerAmper LLP for years 2006 through 2010. The information set forth below should be read in conjunction with the Financial Statements and notes thereto contained elsewhere in this document.
Years Ended December 31,
|
2010
|
2009
|
2008
|
2007
|
2006
|
||||||||||||||||
|
Operations Data:
|
||||||||||||||||||||
|
Realized Gains
|
||||||||||||||||||||
| (Losses) | ||||||||||||||||||||
|
Leveraged Series
|
$ | (731,228 | ) | $ | 198,011 | $ | 11,308,833 | $ | (4,660,063 | ) | $ | (12,460,759 | ) | |||||||
|
Unleveraged Series
|
(13,088 | ) | 324,223 | 7,795,635 | (2,177,898 | ) | (3,968,131 | ) | ||||||||||||
|
Commodity L/N Unleveraged Series
|
631,617 | 4,594 | - | - | - | |||||||||||||||
|
Commodity L/S Unleveraged Series
|
(1,172,228 | ) | 205,095 | - | - | - | ||||||||||||||
|
Total
|
$ | (1,284,927 | ) | $ | 731,923 | $ | 19,104,468 | $ | (6,837,961 | ) | $ | (16,428,890 | ) | |||||||
|
Net Change in Unrealized Gains (Losses)
|
||||||||||||||||||||
|
Leveraged Series
|
$ | 4,174,060 | $ | (4,946,374 | ) | $ | 2,930,402 | $ | (612,748 | ) | $ | (5,582,435 | ) | |||||||
|
Unleveraged Series
|
1,843,174 | (2,556,563 | ) | 1,558,204 | 127,795 | (1,702,910 | ) | |||||||||||||
|
Commodity L/N Unleveraged Series
|
5,408,440 | 100,833 | - | - | - | |||||||||||||||
|
Commodity L/S Unleveraged Series
|
1,469,821 | 57,497 | - | - | - | |||||||||||||||
|
Total
|
$ | 12,895,495 | $ | (7,344,607 | ) | $ | 4,488,606 | $ | (484,953 | ) | $ | (7,285,345 | ) | |||||||
|
2010
|
2009
|
2008
|
2007
|
2006
|
||||||||||||||||
|
Interest Income
|
||||||||||||||||||||
|
Leveraged Series
|
$ | 24,329 | $ | 51,086 | $ | 949,382 | $ | 3,133,540 | $ | 6,947,358 | ||||||||||
|
Unleveraged Series
|
44,746 | 108,814 | 1,974,332 | 5,391,102 | 7,256,355 | |||||||||||||||
|
Commodity L/N Unleveraged Series
|
13,054 | - | - | - | - | |||||||||||||||
|
Commodity L/S Unleveraged Series
|
4,237 | - | - | - | - | |||||||||||||||
|
Total
|
$ | 86,366 | $ | 159,900 | $ | 2,923,714 | $ | 8,524,642 | $ | 14,203,713 | ||||||||||
|
Brokerage Commissions
|
||||||||||||||||||||
|
Leveraged Series
|
$ | 466,282 | $ | 592,105 | $ | 579,037 | $ | 860,634 | $ | 2,180,755 | ||||||||||
|
Unleveraged Series
|
237,734 | 362,198 | 398,556 | 584,137 | 908,722 | |||||||||||||||
|
Commodity L/N Unleveraged Series
|
94,306 | 1,667 | - | - | - | |||||||||||||||
|
Commodity L/S Unleveraged Series
|
41,609 | 5,270 | - | - | - | |||||||||||||||
|
Total
|
$ | 839,931 | $ | 961,240 | $ | 977,593 | $ | 1,444,771 | $ | 3,089,477 | ||||||||||
|
Management Fees
|
||||||||||||||||||||
|
Leveraged Series
|
$ | 548,317 | $ | 720,477 | $ | 668,846 | $ | 930,244 | $ | 2,260,375 | ||||||||||
|
Unleveraged Series
|
270,067 | 414,080 | 446,769 | 606,029 | 888,488 | |||||||||||||||
|
Commodity L/N Unleveraged Series
|
117,883 | 2,084 | - | - | - | |||||||||||||||
|
Commodity L/S Unleveraged Series
|
52,012 | 6,588 | - | - | - | |||||||||||||||
|
Total
|
$ | 988,279 | $ | 1,143,229 | $ | 1,115,615 | $ | 1,536,273 | $ | 3,148,863 | ||||||||||
|
Operating Expenses
|
||||||||||||||||||||
|
Leveraged Series
|
$ | 181,522 | $ | 273,557 | $ | 173,994 | $ | 718,369 | $ | 896,006 | ||||||||||
|
Unleveraged Series
|
232,177 | 391,907 | 332,446 | 681,081 | 929,934 | |||||||||||||||
|
Commodity L/N Unleveraged Series
|
95,549 | 1,459 | - | - | - | |||||||||||||||
|
Commodity L/S Unleveraged Series
|
42,085 | 5,574 | - | - | - | |||||||||||||||
|
Total
|
$ | 551,333 | $ | 672,497 | $ | 506,440 | $ | 1,399,451 | $ | 1,825,940 | ||||||||||
|
Net Income (Loss)
|
||||||||||||||||||||
|
Leveraged Series
|
$ | 2,271,040 | $ | (6,283,416 | ) | $ | 13,766,740 | $ | (4,648,518 | ) | $ | (16,432,972 | ) | |||||||
|
Unleveraged Series
|
1,134,854 | (3,291,711 | ) | 10,150,400 | 1,469,750 | (1,141,829 | ) | |||||||||||||
|
Commodity L/N Unleveraged Series
|
5,745,373 | 100,217 | - | - | - | |||||||||||||||
|
Commodity L/S Unleveraged Series
|
166,124 | 245,160 | - | - | - | |||||||||||||||
|
Total
|
$ | 9,317,391 | $ | (9,229,750 | ) | $ | 23,917,140 | $ | (3,178,768 | ) | $ | (17,574,801 | ) | |||||||
|
2010
|
2009
|
2008
|
2007
|
2006
|
||||||||||||||||
|
Financial Condition Data
|
||||||||||||||||||||
|
Investors' Interest
|
||||||||||||||||||||
|
Leveraged Series
|
$ | 36,025,320 | $ | 46,295,886 | $ | 51,982,221 | $ | 38,446,483 | $ | 105,628,317 | ||||||||||
|
Unleveraged Series
|
50,458,589 | 46,435,691 | 84,214,513 | 78,939,248 | 123,596,233 | |||||||||||||||
|
Commodity L/N Unleveraged Series
|
48,946,590 | 8,601,217 | - | - | - | |||||||||||||||
|
Commodity L/S Unleveraged Series
|
13,912,284 | 3,246,160 | - | - | - | |||||||||||||||
|
Total
|
$ | 149,342,783 | $ | 104,578,954 | $ | 136,196,734 | $ | 117,385,731 | $ | 229,224,550 | ||||||||||
|
Total Assets
|
||||||||||||||||||||
|
Leveraged Series
|
$ | 36,847,815 | $ | 48,102,341 | $ | 54,944,275 | $ | 40,139,770 | $ | 114,171,919 | ||||||||||
|
Unleveraged Series
|
50,964,459 | 70,001,656 | 84,666,129 | 79,877,166 | 131,089,103 | |||||||||||||||
|
Commodity L/N Unleveraged Series
|
48,990,089 | 8,604,968 | - | - | - | |||||||||||||||
|
Commodity L/S Unleveraged Series
|
13,925,388 | 3,247,962 | - | - | - | |||||||||||||||
|
Total
|
$ | 150,727,751 | $ | 129,956,927 | $ | 139,610,404 | $ | 120,016,936 | $ | 245,261,022 | ||||||||||
|
Net Asset Value Per Class A Leveraged Series Interest
|
95.00 | 90.73 | 105.12 | 78.88 | 83.94 | |||||||||||||||
|
Net Asset Value Per Class B Leveraged Series Interest
|
112.17 | 105.53 | 120.43 | 89.06 | 93.36 | |||||||||||||||
|
Net Asset Value Per Class C Leveraged Series Interest
|
91.75 | 86.24 | 98.31 | 72.63 | 76.06 | |||||||||||||||
|
Net Asset Value Per Class D Leveraged Series Interest
|
114.91 | 107.20 | 121.29 | 88.95 | 92.46 | |||||||||||||||
|
Net Asset Value Per Class A Unleveraged Series Interest
|
113.91 | 113.28 | 119.60 | 106.89 | 106.39 | |||||||||||||||
|
Net Asset Value Per Class B Unleveraged Series Interest
|
128.31 | 126.32 | 132.04 | 116.85 | 115.15 | |||||||||||||||
|
Net Asset Value Per Class C Unleveraged Series Interest
|
112.67 | 110.99 | 116.06 | 102.77 | 101.32 | |||||||||||||||
|
Net Asset Value Per Class D Unleveraged Series Interest
|
115.65 | 113.35 | 117.94 | 103.92 | 101.94 | |||||||||||||||
|
Net Asset Value Per Class D Commodity L/S Unleveraged Series Interest
|
112.53 | 108.17 | - | - | - | |||||||||||||||
|
Net Asset Value Per Class D Commodity L/N Unleveraged Series Interest
|
112.17 | 102.00 | - | - | - | |||||||||||||||
Item 7. Management's Discussion and Analysis of Financial Condition and Results of Operations
General
The purpose of the Trust is to replicate the results of the MLM Index™, an index designed to measure the risk premium available to futures traders. Designed as such, the results of the Trust and each of its respective Series depend on two factors, the results of the MLM Index™ itself, and the Manager's ability to replicate that Index. It is important to note that the Manager also calculates the results of the MLM Index™. Thus, their role is twofold - to calculate the results of the MLM Index™, and to replicate the results of the MLM Index™ for the Trust. Any changes made to the composition of the MLM Index™ by the MLM Index™ Committee of the Manager will affect the trading of the Trust and each of the Series , since the objective is to replicate the MLM Index™ as published.
Results of the MLM Index™
The MLM Index™ is calculated from the prices of 22 liquid futures markets. These markets are traded on domestic and foreign exchanges. For each market, the MLM Index™ generally uses the price of 4 different delivery months each year. For example, in the Japanese Yen futures market, the MLM Index™ uses the March, June, September and December delivery months. On the day before trading day, the MLM Index™ determines whether to hold a long or short position in each constituent contract based on the calculation methodology of the MLM Index™. Once established, that position is held for the subsequent period, at which time it is re-evaluated. The monthly results of each constituent market are then used to calculate the MLM Index™ return. The objective of the Trust is to replicate this monthly return. The MLM Commodity L/S Index is a subset of the MLM Index and contains only the commodity futures markets of the entire MLM Index. The MLM Commodity L/N Index contains the same commodity futures contracts, but does not have short positions when the MLM Index algorithm indicates a short position in a particular contract.
The volatility of the constituent markets in the MLM Index™ can affect the results of a Series. The influences on this volatility are varied and unpredictable. However, since the object of each Series is to replicate the MLM Index™, the Manager takes no unusual action to mitigate this volatility. The role of the Manager is to buy or sell the appropriate number of futures contracts in each constituent market such that the aggregate return of those positions replicates as closely as possible the results of the MLM Index™ and its subsets.
In order to accomplish this objective, the Manager must calculate the number of contracts based on the assets in each Series. Since the MLM Index™ rebalances positions each month, at that time the Manager must ascertain the asset level and execute orders to achieve the desired allocations. This is achieved by adding the performance results of each Series for the month to the assets at the beginning of the month, and adding additions of capital from new subscriptions and subtracting redemptions in order to determine the asset level at the end of the period.
Summary of Critical Accounting Policies
The financial statements have been prepared in conformity with U.S. generally accepted accounting principles requires management to make estimates and assumptions that affect the amounts reported in the financial statements and accompanying notes. Other than accruals maintained in the normal course of business, neither management or the Trust prepares, maintains or updates any estimates. Management believes that the estimates utilized in preparing the financial statements are reasonable and prudent; however, actual results could differ from those estimates. The Trust's significant accounting policies are described in detail in Note 2 of the Notes to Financial Statements.
The Trust records all investments at fair value in its financial statements, with changes in fair value reported as a component of realized and unrealized gain (loss) on investments in the Statements of Operations. Generally, fair values are based on market prices; however, in certain circumstances, significant judgments and estimates are involved in determining fair value in the absence of an active market closing price.
Financial Condition
To replicate the results of the MLM Index™, each Series must effect trades on domestic or foreign futures exchanges. Since inception of operations the Series had used Refco, LLC as its futures commission merchant. In October of 2005, the Trust moved its clearing accounts to Citigroup Global Markets. The Manager deposits a percentage of the assets of each Series into separate accounts at Citigroup Global Markets. The amount deposited is determined by the margin requirement established by the exchanges to hold the positions in each Series.
Each Series' assets are held in separate custodial accounts at State Street Bank and Trust (the “Bank"). The Trust has contracted with Credit Suisse Asset Management (CSAM) to manage the money in these accounts so as to maximize the interest income which accrues to each Series, while maintaining strict credit controls as determined by the CE Act. When Citigroup Global Markets requires additional assets to maintain the positions for a Series, the Bank makes a wire transfer to Citigroup Global Markets. If Citigroup Global Markets has surplus assets in a Series account, Citigroup Global Markets makes a wire transfer to the account at the Bank.
The Trust owns no capital assets and does not borrow money. Since the objective of the Trust is to replicate the results of the MLM Index™, its entire asset base participates in the speculative trading of futures contracts. As such, all the assets of each Series are at risk. The level of assets will be determined by the results of each Series, and the effect of addition of capital and the redemption of Series interests. These variables are impossible to predict with any certainty.
Liquidity
The majority of each Series' assets are held in liquid short-term interest rate instruments. Each Series takes substantial exposure in futures markets, which requires relatively small deposits, called margin, to hold the positions. As at December 31, 2010, increases (decreases) in cash and cash equivalents amounted to approximately ($10.7m), ($2.7m), $31.8m and $10.4m for the Unleveraged Series, Leveraged Series, Commodity L/N Series and the Commodity L/S Series of the Trust, respectively. As at December 31, 2010, increases (decreases) in due from broker amounted to approximately $(9.8m), $(11.7m), $3.2m and $(1.2m) for the Unleveraged Series, Leveraged Series, Commodity L/N Series and the Commodity L/S Series of the Trust, respectively. Net cash generated from operations amounted to approximately $9.1m, $9.8m, $(2.8m) and $(0.1m) for the Unleveraged Series, Leveraged Series, Commodity L/N Series and the Commodity L/S Series of the Trust, respectively. For the year ended December 31, 2010 the Unleveraged Series, Leveraged Series, Commodity L/N Series and the Commodity L/S Series generated net income from operations of $1.1m, $2.2m, $5.7m and $0.2m, respectively. In general, the each unleveraged Series will have about 5% of its assets on deposit with brokers as margin and each leveraged Series will have about 15% of its assets on deposit with brokers as margin, with the balance held in custodial accounts with a major financial institution.
A holder of interests in a Series may liquidate that holding at the end of any month at the net asset value of the interests, upon 10 days written notice to the Manager. While the Manager generally must honor all requests for redemption if presented in proper form, the Manager may suspend temporarily any redemption if the effect of such redemption, either alone or in conjunction with other redemptions, would impair the relevant Series' ability to operate if the impairment would be caused by a third party other than the Manager. Further, the right to obtain redemption is contingent upon the relevant Series having property sufficient to discharge its liabilities on the date of redemption. Under certain circumstances, the Manager may find it advisable to establish a reserve for contingent liabilities. In such event, the amount receivable by a redeeming holder of interests will be reduced by his proportionate share of the reserve. There is no secondary market for interests in the Trust, and none is anticipated. There are restrictions for transfer of interests.
Although each Series trades in futures contracts which are in general liquid, the exchanges impose daily trading limits, which act to suspend trading when a particular market or contract trades up or down to a pre-determined price level. Should this happen, and a Series was attempting to execute trades in that situation, the Series may not be able to accurately replicate the results of the MLM Index™. These rules have not had a material impact on the operation of any Series to date. Each Series generally trades only in the largest and most liquid futures contracts, and generally has available approximately 85%-95% of its assets in the form of highly liquid money market securities. The Trust believes that, except in extreme market conditions, all open positions can be liquidated in an efficient, orderly fashion.
Off-Balance Sheet Arrangements
The Trust has no off-balance sheet arrangements that it believes does or will be reasonably likely to have a material current or future effect on any Series' results of operations, financial condition, liquidity, capital expenditures or capital resources.
Market and Credit Risks
The nature of the Trust is such that it undertakes substantial market risk in following its mandate to replicate the MLM Index™ and its subsets. Although the Manager monitors the intraday and daily valuation of each portfolio, no extraordinary measures are taken to reduce market risk. Specifically, the Manager maintains positions required to match, as closely as possible, the return of the MLM Index™ and its subsets. There could be certain circumstances where the Manager might be called upon to make a change to this policy, such as the closing of an exchange or some other emergency situation. In such case, management would use its best efforts to respond to such circumstances with the interests of the investors in mind.
The MLM Index™ and its subsets are not designed to predict which market will exhibit positive performance in any given year. The Manager does not select the constituent markets based on expectations of future performance. The MLM Index™ and its subsets are designed to represent participation in a diverse basket of future contracts using a trend-following algorithm. The MLM Index™ and its subsets are a diversified Index producing different levels of return in the various sectors from year to year.
Each Series incurs various kinds of credit risk in its operations. In order to facilitate the trading of a Series, assets must be placed with Futures Commission Merchants. Management of the Trust deals only with established registered firms, and monitors their financial condition on an ongoing basis. In addition, if a Series were to enter into over the counter transactions, additional counterparty risk would be incurred. There were no OTC transactions during 2010 in any Series.
Results of Operations
At December 31, 2010, 2009 and 2008 the Series of the Trust had assets as follows:
|
Trust Series
|
December 31, 2010
|
December 31, 2009
|
December 31, 2008
|
|||||||||
|
Unleveraged Series
|
$ | 50,964,459 | $ | 70,001,656 | $ | 84,666,129 | ||||||
|
Leveraged Series
|
$ | 36,847,815 | $ | 48,102,341 | $ | 54,944,275 | ||||||
|
Commodity L/S Unleveraged Series
|
$ | 13,925,388 | $ | 3,247,962 | $ | - | ||||||
|
Commodity L/N Unleveraged Series
|
$ | 48,990,089 | $ | 8,604,968 | $ | - | ||||||
|
Total
|
$ | 150,727,751 | $ | 129,956,927 | $ | 139,610,404 | ||||||
At December 31, 2010, 2009 and 2008 the Series of the Trust had liabilities as follows:
|
Trust Series
|
December 31, 2010
|
December 31, 2009
|
December 31, 2008
|
|||||||||
|
Unleveraged Series
|
$ | 505,870 | $ | 23,565,965 | $ | 451,616 | ||||||
|
Leveraged Series
|
$ | 822,495 | $ | 1,806,455 | $ | 2,962,054 | ||||||
|
Commodity L/S Unleveraged Series
|
$ | 13,104 | $ | 1,802 | $ | - | ||||||
|
Commodity L/N Unleveraged Series
|
$ | 43,499 | $ | 3,751 | $ | - | ||||||
|
Total
|
$ | 1,384,968 | $ | 25,377,973 | $ | 3,413,670 | ||||||
Net income (loss) from operations for the Series of the Trust for the years ended December 31, 2010, 2009 and 2008 was as follows:
|
Trust Series
|
December 31, 2010
|
December 31, 2009
|
December 31, 2008
|
|||||||||
|
Unleveraged Series
|
$ | 1,134,854 | $ | (3,291,711 | ) | $ | 10,150,400 | |||||
|
Leveraged Series
|
$ | 2,271,040 | $ | (6,283,416 | ) | $ | 13,766,740 | |||||
|
Commodity L/S Unleveraged Series
|
$ | 166,124 | $ | 245,160 | $ | - | ||||||
|
Commodity L/N Unleveraged Series
|
$ | 5,745,373 | $ | 100,217 | $ | - | ||||||
|
Total
|
$ | 9,317,391 | $ | (9,229,750 | ) | $ | 23,917,140 | |||||
The Trust’s net income is usually directly related to the performance of the MLM Index™, which the Trust is designed to replicate. For the 12 months ending December 31, 2010, MLM Index™ performance was +3.49%, higher than the -2.71% recorded in 2009, and lower than the +13.60% recorded in 2008. A Series' performance may be negative in years when the MLM Index™ is positive or have greater losses when the MLM Index™ is negative due to the timing of subscriptions and redemptions, and the fees charged. Since inception of the Trust, the correlation of monthly results between each Series and the MLM Index™ adjusted for fees is 0.99.
The components of the return of the MLM Index™ are the capital gains earned from the changes in futures market prices, and the interest income earned on cash balances. The mechanics and rules of futures markets allow each Series to earn interest on approximately 100% of the assets in that Series. The interest income takes two forms, directly from the Series' futures broker paid on the margin deposits held by them, and excess cash.
Item 7A. Quantitative and Qualitative Disclosures About Market Risk
The following is a discussion of the quantification of market risk for each Series. Such calculations are often referred to as Value-at-Risk, or VAR. The method used here may or may not differ from other methods used for VAR calculations by other firms. There is no one fixed method of VAR calculation, and this method may not be comparable to other methods.
The market risk, or VAR of the Trust is directly related to the composition of the MLM Index™ and its subsets, and the ratio of each. Each month, the position of the MLM Index™ can be either long or short based on a 252 business day moving average rule. Since positions can be offset inside of sectors (one contract long in a particular commodity and one contract short in a related commodity), specific sector risk is less relevant than the historical risk of the MLM Index™ as a whole. Since the object of the Trust is to replicate the MLM Index™, it is reasonable to use the historic values of that Index to estimate market risk.
The VAR of each Series is calculated as follows:
|
|
1.
|
The manager calculates the standard deviation of the historical returns of the MLM Index™ and its subsets on an asset-weighted basis over two time periods, using daily returns over the preceding 1 year ending at the date of this report, and using monthly returns over the preceding 10 years. It is important to note that this calculation is made on the historical data of the MLM Index™ and its subsets. It is not based on the actual trading of the Trust and does not include any operational risk. The standard deviation is used to measure the dispersion of the returns of the MLM Index™ and its subsets.
|
|
|
2.
|
For the purposes of VAR, one attempts to estimate the size of a loss that may occur with some small probability. It does not estimate the possibility of some total loss, only the probability of a loss of some magnitude. The calculation is complicated by the fact that the standard deviation of the distribution assumes a normal distribution, which may or may not be a good estimate of the actual distribution. For the purposes of this estimate, the Manager has chosen to calculate the size of a daily and monthly loss that might occur with a probability of 1% (1 chance in 100). To do this, the standard deviation is multiplied by 2.35 to the standard 99% confidence interval, and by 1.5 to adjust for the possibility of a non-normal distribution. For daily returns, this estimate is a loss of 1.62%. For monthly returns the estimate is loss of 7.48%.
|
|
|
3.
|
To ascertain a dollar loss amount for each Series, the assets of the Series as of December 31, 2010 are multiplied by the estimate of the risk calculated in step 2 above. The risk estimate is based on the unleveraged and leveraged series of the Trust, with the leveraged assets having three times the risk of the unleveraged assets. Based on the asset levels as of December 31, 2010, the manager estimates that the amount each Series of the Trust could expect to lose as follows in any given day and in any given month.
|
|
Trust Series
|
Any Given Day
|
Any Given Month
|
|
Unleveraged Series
|
$ 910,000
|
$ 4.1 million
|
|
Leveraged Series
|
$1.6 million
|
$ 7.1 million
|
|
Commodity L/S Unleveraged Series
|
$ 460,000
|
$ 2.0 million
|
|
Commodity L/N Unleveraged Series
|
$1.5 million
|
$ 5.5 million
|
The estimate above, though reasonable, should not be taken as an assurance that losses in a Series could not be greater than these amounts. This is simply a quantitative estimate based on the historical performance of the MLM Index™ and its subsets. The loss that occurs with small probability may be substantially greater than the loss indicated above. Also, market conditions could change dramatically from the conditions that prevailed over the period used to calculate the estimate, affecting the realized volatility of the market. Furthermore, other factors could affect trading, such as the inability to execute orders in a particular market, due to operational or regulatory restrictions that may alter the pattern of a Series' returns. Specifically, the Manager advises other funds in addition to the Trust. In certain markets there is a limit to the size a position that one entity can control (speculative limits). Since positions cannot exceed speculative limits, the Manager may have to allocate positions across accounts and funds, resulting in a less than complete replication of the MLM Index™ and its subsets. It is best to remember the fact that, as outlined in the offering for the Trust, that all the assets invested are at risk of loss.
Since the calculation of the VAR does not look at the specific instrument risks, but rather the results of the MLM Index™ and its subsets as a whole, risks related to actual execution are not included in the calculation. For example, counter-party risks from OTC transactions are not factored into the calculation.
Additional market risk may be attributed to the actual execution of the orders for a Series. Each Series executes the majority of its orders on the last day of each month. As assets of a Series grow, large orders may be placed in periods of reduced liquidity. Such orders may move the markets in which they are executed, adversely affecting the performance of the Trust. The Manager makes every effort to execute all orders efficiently, but general levels of liquidity are beyond the control of management. In certain circumstances, markets may move to the daily trading limits imposed by the exchanges, and a Series may be unable to execute the necessary orders to replicate the MLM Index™ and its subsets, causing extensive slippage.
Non-Market Risk
Risk from Brokers - Each Series' futures commission merchant, Citigroup Global Markets, holds some portion of the assets of the Series as margin deposits for futures trading. A failure of Citigroup Global Markets could cause the portion of the Series’ assets held there to be at risk or unavailable for an undetermined period of time.
Speculative Limits - Certain futures exchanges require that positions deemed speculative in nature (as opposed to commercial hedge positions) cannot exceed certain pre-defined levels. All positions in the control of the Manager must be aggregated to determine compliance with these rules. Should the assets of the Manager reach a level such that positions may be capped, accurate replication of the MLM Index™ for the Trust may be difficult or impossible. The Manager may also use certain "Over The Counter" derivatives to achieve the same exposure without exceeding speculative limits. These OTC products would involve taking additional counter-party risk for a Series in order to achieve accurate replication of the MLM Index™. For example, if it was determined that a Series must hold 10 contracts of Soybeans for a specific delivery, the Series could execute the appropriate futures contracts on the appropriate futures exchange. Also, the Manager of each Series may choose to enter into a swap agreement, which would have substantially the same economic effect of the futures position, but would be executed in the over-the-counter market. The swap contract would change the nature of the counter-party from an organized exchange to a single dealer, and would materially increase the non-market risk of holding the position. No Series has yet utilized OTC swap contracts.
Item 8. Financial Statements and Supplementary Data
Each Series' financial statements, together with the independent registered public accounting firm’s report thereon, appear on pages F1 through F29 hereof.
Selected Quarterly Data is as follows:
|
2010
|
First Quarter
|
Second Quarter
|
Third Quarter
|
Fourth Quarter
|
Full Year
|
|||||||||||||||
|
Net realized and unrealized gain (loss) on investments
|
||||||||||||||||||||
|
Leveraged Series
|
$ | 948,684 | $ | (618,615 | ) | $ | 1,114,731 | $ | 1,998,032 | $ | 3,442,830 | |||||||||
|
Unleveraged Series
|
$ | 423,982 | $ | (214,146 | ) | $ | 640,641 | $ | 979,609 | $ | 1,830,086 | |||||||||
|
Commodity L/N Unleveraged Series
|
$ | (224,885 | ) | $ | (1,244,097 | ) | $ | 1,594,465 | $ | 5,914,574 | $ | 6,040,057 | ||||||||
|
Commodity L/S Unleveraged Series
|
$ | 129,400 | $ | (1,117,128 | ) | $ | (440,374 | ) | $ | 1,725,694 | $ | 297,593 | ||||||||
|
Total
|
$ | 1,277,182 | $ | (3,193,986 | ) | $ | 2,909,463 | $ | 10,617,909 | $ | 11,610,568 | |||||||||
|
Net income (loss)
|
||||||||||||||||||||
|
Leveraged Series
|
$ | 619,756 | $ | (917,585 | ) | $ | 841,293 | $ | 1,727,576 | $ | 2,271,040 | |||||||||
|
Unleveraged Series
|
$ | 234,237 | $ | (365,572 | ) | $ | 473,912 | $ | 792,277 | $ | 1,134,854 | |||||||||
|
Commodity L/N Unleveraged Series
|
$ | (251,374 | ) | $ | (1,296,782 | ) | $ | 1,505,444 | $ | 5,788,085 | $ | 5,745,373 | ||||||||
|
Commodity L/S Unleveraged Series
|
$ | 119,093 | $ | (1,159,775 | ) | $ | (479,289 | ) | $ | 1,686,095 | $ | 166,124 | ||||||||
|
Total
|
$ | 721,712 | $ | (3,739,714 | ) | $ | 2,341,360 | $ | 9,994,033 | $ | 9,317,391 | |||||||||
|
Net income (loss) per Investors’ Interest
|
||||||||||||||||||||
|
Leveraged Series
|
||||||||||||||||||||
|
Class A
|
$ | 1.28 | $ | (2.65 | ) | $ | 1.64 | $ | 4.00 | |||||||||||
|
Class B
|
$ | 1.89 | $ | (2.70 | ) | $ | 2.33 | $ | 5.12 | |||||||||||
|
Class C
|
$ | 1.56 | $ | (2.18 | ) | $ | 1.92 | $ | 4.21 | |||||||||||
|
Class D
|
$ | 2.15 | $ | (2.41 | ) | $ | 2.50 | $ | 5.47 | |||||||||||
|
Unleveraged Series
|
||||||||||||||||||||
|
Class A
|
$ | 0.23 | $ | (1.37 | ) | $ | 0.35 | $ | 1.42 | |||||||||||
|
Class B
|
$ | 0.57 | $ | (1.22 | ) | $ | 0.71 | $ | 1.92 | |||||||||||
|
Class C
|
$ | 0.48 | $ | (1.08 | ) | $ | 0.61 | $ | 1.67 | |||||||||||
|
Class D
|
$ | 0.64 | $ | (0.97 | ) | $ | 0.77 | $ | 1.86 | |||||||||||
|
Commodity L/N Unleveraged Series
|
||||||||||||||||||||
|
Class D
|
$ | (9.15 | ) | $ | (5.99 | ) | $ | 4.77 | $ | 14.36 | ||||||||||
|
Commodity Unleveraged Series
|
||||||||||||||||||||
|
Class D
|
$ | (10.14 | ) | $ | (9.37 | ) | $ | (3.88 | ) | $ | 13.64 | |||||||||
|
Net Asset Value per Investors’ Interest, at the end of period
|
||||||||||||||||||||
|
Leveraged Series
|
||||||||||||||||||||
|
Class A
|
$ | 92.01 | $ | 89.36 | $ | 91.00 | $ | 95.00 | ||||||||||||
|
Class B
|
$ | 107.42 | $ | 104.72 | $ | 107.05 | $ | 112.17 | ||||||||||||
|
Class C
|
$ | 87.80 | $ | 85.62 | $ | 87.54 | $ | 91.75 | ||||||||||||
|
Class D
|
$ | 109.35 | $ | 106.94 | $ | 109.44 | $ | 114.91 | ||||||||||||
|
Unleveraged Series
|
||||||||||||||||||||
|
Class A
|
$ | 113.51 | $ | 112.14 | $ | 112.49 | $ | 113.91 | ||||||||||||
|
Class B
|
$ | 126.89 | $ | 125.67 | $ | 126.39 | $ | 128.31 | ||||||||||||
|
Class C
|
$ | 111.47 | $ | 110.39 | $ | 111.00 | $ | 112.67 | ||||||||||||
|
Class D
|
$ | 113.99 | $ | 113.02 | $ | 113.79 | $ | 115.65 | ||||||||||||
|
Commodity L/N Unleveraged Series
|
||||||||||||||||||||
|
Class D
|
$ | 99.02 | $ | 93.03 | $ | 97.8 | $ | 112.17 | ||||||||||||
|
Commodity Unleveraged Series
|
||||||||||||||||||||
|
Class D
|
$ | 112.14 | $ | 102.77 | $ | 98.89 | $ | 112.53 | ||||||||||||
|
2009
|
First Quarter
|
Second Quarter
|
Third Quarter
|
Fourth Quarter
|
Full Year
|
|||||||||||||||
|
Net realized and unrealized gain (loss) on investments
|
||||||||||||||||||||
|
Leveraged Series
|
$ | 324,618 | $ | (10,168,153 | ) | $ | 5,324,539 | $ | (229,367 | ) | $ | (4,748,363 | ) | |||||||
|
Unleveraged Series
|
$ | 326,120 | $ | (5,077,583 | ) | $ | 2,625,123 | $ | (106,000 | ) | $ | (2,232,340 | ) | |||||||
|
Commodity L/N Unleveraged Series
|
$ | - | $ | - | $ | - | $ | 105,427 | $ | 105,427 | ||||||||||
|
Commodity L/S Unleveraged Series
|
$ | - | $ | - | $ | 213,887 | $ | 48,705 | $ | 262,592 | ||||||||||
|
Total
|
$ | 650,738 | $ | (15,245,736 | ) | $ | 8,163,549 | $ | (181,237 | ) | $ | (6,612,684 | ) | |||||||
|
Net income (loss)
|
||||||||||||||||||||
|
Leveraged Series
|
$ | (85,410 | ) | $ | (10,547,536 | ) | $ | 4,966,017 | $ | (616,488 | ) | $ | (6,283,416 | ) | ||||||
|
Unleveraged Series
|
$ | 36,462 | $ | (5,347,945 | ) | $ | 2,381,832 | $ | (362,058 | ) | $ | (3,291,711 | ) | |||||||
|
Commodity L/N Unleveraged Series
|
$ | - | $ | - | $ | - | $ | 100,217 | $ | 100,217 | ||||||||||
|
Commodity L/S Unleveraged Series
|
$ | - | $ | - | $ | 207,058 | $ | 38,102 | $ | 245,160 | ||||||||||
|
Total
|
$ | (48,948 | ) | $ | (15,895,482 | ) | $ | 7,554,907 | $ | (840,227 | ) | $ | (9,229,750 | ) | ||||||
|
Net income (loss) per Investors’ Interest
|
||||||||||||||||||||
|
Leveraged Series
|
||||||||||||||||||||
|
Class A
|
$ | (0.65 | ) | $ | (21.08 | ) | $ | 8.96 | $ | (1.62 | ) | |||||||||
|
Class B
|
$ | (0.29 | ) | $ | (23.86 | ) | $ | 10.74 | $ | (1.49 | ) | |||||||||
|
Class C
|
$ | (0.22 | ) | $ | (19.45 | ) | $ | 8.79 | $ | (1.19 | ) | |||||||||
|
Class D
|
$ | (0.04 | ) | $ | (23.85 | ) | $ | 11.08 | $ | (1.28 | ) | |||||||||
|
Unleveraged Series
|
||||||||||||||||||||
|
Class A
|
$ | (0.36 | ) | $ | (8.59 | ) | $ | 3.59 | $ | (0.96 | ) | |||||||||
|
Class B
|
$ | (0.06 | ) | $ | (9.20 | ) | $ | 4.29 | $ | (0.75 | ) | |||||||||
|
Class C
|
$ | (0.06 | ) | $ | (8.10 | ) | $ | 3.76 | $ | (0.67 | ) | |||||||||
|
Class D
|
$ | (0.08 | ) | $ | (8.10 | ) | $ | 3.97 | $ | (0.54 | ) | |||||||||
|
Commodity L/N Unleveraged Series
|
||||||||||||||||||||
|
Class D
|
$ | 0.00 | $ | 0.00 | $ | 6.90 | $ | 1.27 | ||||||||||||
|
Commodity Unleveraged Series
|
||||||||||||||||||||
|
Class D
|
$ | 0.00 | $ | 0.00 | $ | 0.00 | $ | 2.00 | ||||||||||||
|
Net Asset Value per Investors’ Interest, at the end of period
|
||||||||||||||||||||
|
Leveraged Series
|
||||||||||||||||||||
|
Class A
|
$ | 104.47 | $ | 83.39 | $ | 92.35 | $ | 90.73 | ||||||||||||
|
Class B
|
$ | 120.14 | $ | 96.28 | $ | 107.02 | $ | 105.53 | ||||||||||||
|
Class C
|
$ | 98.09 | $ | 78.64 | $ | 87.43 | $ | 86.24 | ||||||||||||
|
Class D
|
$ | 121.25 | $ | 97.40 | $ | 108.48 | $ | 107.20 | ||||||||||||
|
Unleveraged Series
|
||||||||||||||||||||
|
Class A
|
$ | 119.24 | $ | 110.65 | $ | 114.24 | $ | 113.28 | ||||||||||||
|
Class B
|
$ | 131.98 | $ | 122.78 | $ | 127.07 | $ | 126.32 | ||||||||||||
|
Class C
|
$ | 116.00 | $ | 107.90 | $ | 111.66 | $ | 110.99 | ||||||||||||
|
Class D
|
$ | 118.02 | $ | 109.92 | $ | 113.89 | $ | 113.35 | ||||||||||||
|
Commodity L/N Unleveraged Series
|
||||||||||||||||||||
|
Class D
|
$ | 0.00 | $ | 0.00 | $ | 106.90 | $ | 108.17 | ||||||||||||
|
Commodity Unleveraged Series
|
||||||||||||||||||||
|
Class D
|
$ | 0.00 | $ | 0.00 | $ | 0.00 | $ | 102.00 | ||||||||||||
32
Item 9. Changes in and Disagreements with Accountants and Financial Disclosure
There were no changes in or disagreements between any Series of the Trust and their auditors respecting matters of accounting or financial disclosure in the current year.
Item 9A. Controls and Procedures
(a) Evaluation of disclosure controls and procedures. As of the end of the period covered by this Annual Report, we carried out an evaluation of the effectiveness of the design and operation of our disclosure controls and procedures (as defined in the Securities Exchange Act of 1934 Rules 13a-15(e) and 15d-15(e)). We have concluded that our disclosure controls and procedures are effective to ensure that information required to be disclosed by us in the reports that we file or submit under the Exchange Act is recorded, processed, summarized and reported within the time periods specified in the rules and forms of the Securities and Exchange Commission and that such information is accumulated and communicated to our management to allow timely decisions regarding required disclosures. Based on such evaluation we have concluded these disclosure controls are effective as of December 31, 2010.
(b) Changes in internal control over financial reporting. There has been no change in the Trust and/or its Series' internal control over financial reporting that occurred in the fourth fiscal quarter that has materially affected, or is reasonably likely to materially affect, the Trust and/or its Series’ internal control over financial reporting.
(c) Management's Report on Internal Control over Financial Reporting. The management of the Trust and each Series is responsible for establishing and maintaining adequate internal control over financial reporting for the Trust and its Series as defined in Rule 13a-15(f) under the Securities Exchange Act of 1934. A company's internal control over financial reporting is a process designed to provide reasonable assurance regarding the reliability of financial reporting and the preparation of financial statements for external purposes in accordance with accounting principles generally accepted in the United States. A company's internal control over financial reporting includes policies and procedures that (1) pertain to the maintenance of records that in reasonable detail accurately and fairly reflect the transactions and dispositions of the assets of the Trust and/or its Series; (2) provide reasonable assurance that transactions are recorded as necessary to permit preparation of financial statements in accordance with accounting principles generally accepted in the United States, and that receipts and expenditures of the Trust and its Series are being made only in accordance with authorizations of management and directors of the Trust and its Series; and (3)provide reasonable assurance regarding prevention or timely detection of unauthorized acquisition, use or disposition of the Trust and/or its Series' assets that could have a material effect on the financial statements. Our internal control system is designed to provide reasonable assurance regarding the preparation and fair presentation of published financial statements. Because of its inherent limitations, internal control over financial reporting may not prevent or detect misstatements. Projections of any evaluation of effectiveness to future periods are subject to the risk that controls may become inadequate because of changes in conditions, or that the degree of compliance with the policies or procedures may deteriorate. This annual report does not include an attestation report of the Trust and its Series' registered public accounting firm regarding internal control over financial reporting. Management's report was not subject to attestation by the Trust and/or its Series' independent registered public accounting firm pursuant to temporary rules of the Securities and Exchange Commission that permit the Trust and/or its Series to provide only management's report in this annual report. The management of the Trust and its Series' assessed its internal control over financial reporting as of December 31, 2010 using the criteria set forth by the Committee of Sponsoring Organizations of the Treadway Commission (COSO). Management, based on their evaluation of the Trust and its Series' internal control over financial reporting (as defined in Securities Exchange Act Rule 13a-15(f)), have concluded that the Trust and it’s Series' internal control over financial reporting was effective as of December 31, 2010.
Item 9B. Other Information
Mount Lucas Management Corporation underwent a reorganization effective January 3, 2011, as a result of which Mount Lucas Management LP is now the successor Manager for the Registrant. The terms of the reorganization are set forth in the Form 8-K filed on January 25, 2011 (incorporated by reference).
Item 10. Directors, Executive Officers and Corporate Governance
The Trust has no directors or officers. The Manager manages and conducts the business of the Trust.
The principals of the Manager are Roger E. Alcaly, Paul R. DeRosa, Raymond E. Ix, Jr., James A. Mehling, John R. Oberkofler and Timothy J. Rudderow .
Roger E. Alcaly, age 69, became a principal and Director of the Manager when it merged with CA Partners, Inc., a company he formed with Messrs. Timothy Rudderow and Frank Vannerson in 1990 which engaged primarily in convertible arbitrage trading. Prior to helping form CA Partners, Mr. Alcaly was active in leveraged acquisitions, merger arbitrage and value-oriented equity investing, first as a partner of Kellner DiLeo & Co. and KD Equities, each of which engaged in risk-arbitrage trading, and then at Riverside Capital, a company he formed after leaving those firms in May 1987 which engaged in risk-arbitrage trading. Before joining Kellner DiLeo, Mr. Alcaly served as Assistant Director of the Council on Wage and Price Stability and as a Senior Economist at the Federal Reserve Bank of New York, and taught Economics at Columbia University. Mr. Alcaly holds a B.A. from Amherst College and a Ph.D. in Economics from Princeton University.
Paul R. DeRosa, age 69, became a principal and Director of the Manager when it merged with CA Partners, Inc., which he joined in January 1999. Mr. DeRosa began his career in the securities industry as the money market economist in Citibank's bond trading division. He later became the bank's chief proprietary bond trader and subsequently head of Citibank's financial derivative and capital markets businesses in North America. In 1986 Mr. DeRosa joined E.F. Hutton Co. as co-head of bond trading with particular responsibility for mortgage trading and finance. In 1989 he helped to establish Eastbridge Holdings Inc., a bond and currency trading company in New York, and served as President and CEO from June 1995 to June 1998. Mr. DeRosa holds a Ph.D. in Economics from Columbia University.
Raymond E. Ix, Jr., age 47, is a Senior Vice President and a Director of the Manager. Mr. Ix joined Mount Lucas in 1992 and is responsible for institutional marketing and client service. From 1989 to 1992, Mr. Ix was employed by Little Brook Corporation of New Jersey, a commodity trading advisor, where he was involved in implementing the firm's technical trading systems. Before joining Little Brook, Mr. Ix was the Fixed Income Administrative Manager at Delaware Management Company, a company which advised institutional and individual investors. Mr. Ix received a B.S. in accounting from Saint Joseph's University in 1986.
James A. Mehling, age 61, is a Vice President and Chief Operating Officer of the Manager. Before joining Mount Lucas in June 1999, Mr. Mehling had served as President and Chief Investment Officer of Monitor Capital Advisors, a company which managed institutional stock and bond portfolios and mutual funds, beginning in 1991. Mr. Mehling started his career in financial services with Merrill Lynch in 1976 and eventually managed a trading desk for Merrill Lynch Government Securities. He is a CFA charter holder and has served as a volunteer on the CFA examination grading committee. Mr. Mehling received a B.S. in Aviation Engineering from Western Michigan University in 1970.
John R. Oberkofler, age 51, is a Vice President and Director of Trading for the Manager since 1999. From 1986 to 1999, he was employed as Senior Trader by Little Brook Corporation of New Jersey. Mr. Oberkofler received a B.S. in Finance from Seton Hall University in 1982.
Timothy J. Rudderow, age 55, is President and a Director of the Manager, which he helped to establish in 1986. Prior to the mergers that took place in October 1999, Mr. Rudderow was also a principal of Little Brook Corporation of New Jersey, which he joined in 1983 as Director of Research and Development, and of CA Partners, Inc., a company he helped form in 1990. Prior to joining Little Brook, Mr. Rudderow was employed by Commodities Corporation, a company which was a commodity trading advisor, with responsibilities for the design and management of technical trading systems. Before joining Commodities Corporation, Mr. Rudderow taught Economics at Drexel University. Mr. Rudderow received a B.A. in Mathematics from Rutgers University in 1977 and an M.B.A. in Management Analysis from Drexel University in 1979.
Code of Ethics
The Trust does not have any officers; therefore, it has not adopted a code of ethics applicable to the Trust’s principal executive officer, principal financial officer, principal accounting officer and persons performing similar functions. The Manager is primarily responsible for the day to day administrative and operational aspects of the Trust’s business. The Manager has adopted a code of ethics that applies to its principal executive officer, principal financial officer, principal accounting officer and persons performing similar functions and a copy of such code is included in Exhibit 14.1.
Item 11. Executive Compensation
The Trust has no directors or executive officers. The Manager receives management and other fees from the Trust as described in Item 1 - Fees and Expenses.
Item 12. Security Ownership of Certain Beneficial Owners and Management
The Trust has no directors or officers. The Manager manages and conducts the business of the Trust. As of December 31, 2010, the Manager had an initial investment of $1,000 in each of the Leveraged Series (Class C), the Unleveraged Series (Class C), the Commodity L/S Unleveraged Series (Class D) and Commodity L/N Unleveraged Series (Class D).
Item 13. Certain Relationships and Related Transactions
The Manager manages and conducts the business of the Trust. The Manager receives management and other fees from the Trust as described in Item 1 - Fees and Expenses.
For the years ended December 31,2010, 2009 and 2008, the Manager received from the Series of the Trust:
|
Management Fees
|
2010
|
2009
|
2008
|
|||||||||
|
Leveraged Series
|
$ | 548,316 | $ | 720,477 | $ | 668,846 | ||||||
|
Unleveraged Series
|
270,068 | 414,080 | 446,769 | |||||||||
|
Commodity L/N Series
|
117,883 | 2,084 | - | |||||||||
|
Commodity L/S Series
|
52,012 | 6,588 | - | |||||||||
|
Total
|
$ | 988,279 | $ | 1,143,229 | $ | 1,115,615 | ||||||
|
Brokerage Fees
|
||||||||||||
|
Leveraged Series
|
$ | 466,283 | $ | 592,106 | $ | 579,038 | ||||||
|
Unleveraged Series
|
237,733 | 362,197 | 398,555 | |||||||||
|
Commodity L/N Series
|
94,306 | 1,667 | - | |||||||||
|
Commodity L/S Series
|
41,609 | 5,270 | - | |||||||||
|
Total
|
$ | 839,931 | $ | 961,240 | $ | 977,593 | ||||||
|
Organizational Fees
|
||||||||||||
|
Leveraged Series
|
$ | - | $ | 5,381 | $ | 5,108 | ||||||
|
Unleveraged Series
|
- | $ | 8,469 | $ | 3,515 | |||||||
|
Commodity L/N Series
|
- | - | - | |||||||||
|
Commodity L/S Series
|
- | - | - | |||||||||
|
Total
|
$ | - | $ | 13,850 | $ | 8,623 | ||||||
Item 14. Principal Accountant Fees and Services
Audit Fees. The aggregate fees billed to the Trust for the year ended December 31, 2010 by the independent registered public accounting firm, EisnerAmper LLP (“EisnerAmper”) for professional services rendered in connection with the audit of the Trust’s financial statements included in this Annual Report on Form 10-K, and for the review of the interim financial information included in the Trust’s 1st, 2nd, and 3rd Quarter Report on Form 10-Q, totaled approximately $167,000.
The aggregate fees billed to the Trust for the year ended December 31, 2009 by EisnerAmper for professional services rendered in connection with the audit of the Trust’s financial statements included in this Annual Report on Form 10-K, and for the review of the statements included in the Trust’s 1st, 2nd, and 3rd Quarter Report on Form 10-Q, totaled approximately $208,900.
Audit-Related Fees. There were no fees billed to the Trust by EisnerAmper for assurance and related services that are reasonably related to the performance of the audit and review of the Trust’s financial statements that are not already reported in the paragraph immediately above for the years 2010 and 2009 respectively.
Tax Fees. The aggregate fees billed to the Trust by Grant Thornton LLP (“GT”) for professional services rendered by GT for tax compliance totaled approximately $75,000 and $57,000 for the years 2010 and 2009, respectively. These services included review of the Trust’s domestic tax compliance information.
All Other Fees. There were no fees billed to the Trust by EisnerAmper for products and services other than as set forth above for the years 2010 and 2009.
Engagement of the Independent Registered Public Accounting Firm. During the year ended December 31, 2010, the Manager appointed EisnerAmper as the Trust’s auditors. The Manager considers provisions of the independence rules for both audit and non-audit services.
Item 15. Exhibits, Financial Statement Schedules
FINANCIAL STATEMENTS AND REPORT OF
INDEPENDENT REGISTERED PUBLIC
ACCOUNTING FIRM
MLM INDEX™ FUND AND ITS SERIES
December 31, 2010 and 2009
AFFIRMATION OF THE COMMODITY POOL OPERATOR
I affirm that, to the best of my knowledge and belief, the information contained in the attached financial statements of MLM Index™ Fund and its Series for the years ended December 31, 2010 and 2009 are accurate and complete.
| /s/ Timothy J. Rudderow | ||
| Timothy J. Rudderow | ||
| President | ||
| Mount Lucas Management Corporation | ||
| Manager | ||
| MLM Index™ Fund | ||
Table of Contents
|
Page
|
|
|
Report of Independent Registered Public Accounting Firm
|
F-4
|
|
Financial Statements
|
|
|
Unleveraged Series
|
F-5
|
|
Leveraged Series
|
F-13
|
|
Commodity L/N Unleveraged Series
|
F-21
|
|
Commodity L/N Unleveraged Series
|
F-28
|
|
Total Trust
|
F-35
|
|
Notes to Financial Statements
|
F-43
|
REPORT OF INDEPENDENT REGISTERED PUBLIC ACCOUNTING FIRM
To the Investors of
MLM IndexTM Fund
We have audited the accompanying statements of financial condition, including the condensed schedules of investments, of the MLM IndexTM Fund and each of its four series (MLM IndexTM Unleveraged Series, MLM IndexTM Leveraged Series, MLM Commodity L/N Index Unleveraged Series, MLM Commodity L/S Index Unleveraged Series,) (collectively the "Trust") as of December 31, 2010 and 2009, and the related statements of operations, changes in investors' interest, and cash flows and the financial highlights for each of the years in the three-year period ended December 31, 2010 (for the MLM Commodity L/N Index Unleveraged Series; for the year ended December 31, 2010 and the period from August 1, 2009 (inception) to December 31, 2009 and for the MLM Commodity L/S Index Unleveraged Series for the year ended December 31, 2010 and the period from December 1, 2009 (inception) to December 31, 2009). These financial statements and financial highlights are the responsibility of the Trust’s management. Our responsibility is to express an opinion on these financial statements and financial highlights based on our audits.
We conducted our audits in accordance with the standards of the Public Company Accounting Oversight Board (United States). Those standards require that we plan and perform the audit to obtain reasonable assurance about whether the financial statements and financial highlights are free of material misstatement. The Trust is not required to have, nor were we engaged to perform, an audit of the Trust’s internal control over financial reporting. Our audits included consideration of internal control over financial reporting as a basis for designing audit procedures that are appropriate in the circumstances, but not for the purpose of expressing an opinion on the effectiveness of the Trust’s internal control over financial reporting. Accordingly, we express no such opinion. An audit includes examining, on a test basis, evidence supporting the amounts and disclosures in the financial statements. An audit also includes assessing the accounting principles used and significant estimates made by management, as well as evaluating the overall financial statement presentation. We believe that our audits provide a reasonable basis for our opinion.
In our opinion, the financial statements and financial highlights referred to above present fairly, in all material respects, the financial conditions of the MLM IndexTM Fund, the MLM IndexTM Unleveraged Series, MLM IndexTM Leveraged Series, MLM Commodity L/N Index Unleveraged Series and MLM Commodity L/S Index Unleveraged Series at December 31, 2010 and 2009, and the results of its operations, changes in investors' interest, and cash flows and the financial highlights for each of the years in the three-year period ended December 31, 2010, or the included periods since inception as noted above, in conformity with accounting principles generally accepted in the United States of America.
/s/ EisnerAmper LLP
New York, New York
March 21, 2011
MLM INDEX™ FUND
STATEMENTS OF FINANCIAL CONDITION
MLM IndexTM Unleveraged Series
December 31,
|
ASSETS
|
2010
|
2009
|
||||||
|
Cash and cash equivalents
|
$ | 45,401,720 | $ | 56,122,787 | ||||
|
Due from broker
|
4,045,381 | 13,875,228 | ||||||
|
Net unrealized gain on open futures contracts, at fair value
|
1,516,918 | - | ||||||
|
Interest receivable
|
- | 3,641 | ||||||
|
Other assets
|
440 | - | ||||||
|
Total assets
|
$ | 50,964,459 | $ | 70,001,656 | ||||
|
LIABILITIES AND INVESTORS’ INTEREST
|
||||||||
|
Liabilities
|
||||||||
|
Redemptions payable
|
$ | 428,614 | $ | 23,149,576 | ||||
|
Net unrealized loss on open futures contracts, at fair value
|
- | 315,800 | ||||||
|
Brokerage commissions payable
|
19,861 | 24,319 | ||||||
|
Management fee payable
|
23,873 | 33,265 | ||||||
|
Subscriptions received in advance
|
11,622 | - | ||||||
|
Accrued expenses
|
21,900 | 43,005 | ||||||
|
Total liabilities
|
505,870 | 23,565,965 | ||||||
|
Investors’ interest
|
50,458,589 | 46,435,691 | ||||||
|
Total liabilities and investors’ interest
|
$ | 50,964,459 | $ | 70,001,656 | ||||
The accompanying notes are an integral part of these statements.
MLM INDEX™ FUND
CONDENSED SCHEDULE OF INVESTMENTS
MLM IndexTM Unleveraged Series
December 31, 2010
|
Description
|
Number of contracts
|
Unrealized gain (loss)
|
Percentage of investors’ interest
|
|||||||||
|
Futures*
|
||||||||||||
|
Long futures contracts
|
||||||||||||
|
Financial
|
224 | $ | 283,890 | 0.56 | % | |||||||
|
Commodity
|
252 | 1,545,069 | 3.06 | |||||||||
| 476 | 1,828,959 | 3.62 | ||||||||||
|
Short futures contracts
|
||||||||||||
|
Financial
|
99 | (188,711 | ) | (0.37 | ) | |||||||
|
Commodity
|
35 | (123,330 | ) | (0.24 | ) | |||||||
| 134 | (312,041 | ) | (0.61 | ) | ||||||||
|
Net unrealized gain on open futures contracts, at fair value
|
$ | 1,516,918 | 3.01 | % | ||||||||
* Derivatives are not designated as hedging instruments.
The accompanying notes are an integral part of this schedule.
MLM INDEX™ FUND
CONDENSED SCHEDULE OF INVESTMENTS
MLM IndexTM Unleveraged Series
December 31, 2009
|
Description
|
Number of contracts
|
Unrealized gain (loss)
|
Percentage of investors’ interest
|
|||||||||
|
Futures*
|
||||||||||||
|
Long futures contracts
|
||||||||||||
|
Financial
|
227 | $ | (558,425 | ) | (1.20 | )% | ||||||
|
Commodity
|
169 | 238,169 | 0.51 | |||||||||
| 396 | (320,256 | ) | (0.69 | ) | ||||||||
|
Short futures contracts
|
||||||||||||
|
Financial
|
21 | 29,962 | 0.06 | |||||||||
|
Commodity
|
89 | (25,506 | ) | (0.05 | ) | |||||||
| 110 | 4,456 | 0.01 | ||||||||||
|
Net unrealized loss on open futures contracts, at fair value
|
$ | (315,800 | ) | (0.68 | )% | |||||||
* Derivatives are not designated as hedging instruments.
The accompanying notes are an integral part of this schedule.
MLM INDEX™ FUND
STATEMENTS OF OPERATIONS
MLM IndexTM Unleveraged Series
Year ended December 31,
|
2010
|
2009
|
2008
|
||||||||||
|
Investment income
|
||||||||||||
|
Interest
|
$ | 44,746 | $ | 108,814 | $ | 1,974,332 | ||||||
|
Expenses
|
||||||||||||
|
Brokerage commissions
|
237,734 | 362,198 | 398,556 | |||||||||
|
Management fee
|
270,067 | 414,080 | 446,769 | |||||||||
|
Operating expenses
|
232,177 | 391,907 | 332,446 | |||||||||
|
Total expenses
|
739,978 | 1,168,185 | 1,177,771 | |||||||||
|
Net investment income (loss)
|
(695,232 | ) | (1,059,371 | ) | 796,561 | |||||||
|
REALIZED AND UNREALIZED GAIN (LOSS) ON INVESTMENTS
|
||||||||||||
|
Net realized gain (loss) on investments
|
(13,088 | ) | 324,223 | 7,795,635 | ||||||||
|
Net change in unrealized appreciation/depreciation on investments
|
1,843,174 | (2,556,563 | ) | 1,558,204 | ||||||||
|
Net realized and unrealized gain (loss) on investments
|
1,830,086 | (2,232,340 | ) | 9,353,839 | ||||||||
|
Net income (loss)
|
$ | 1,134,854 | $ | (3,291,711 | ) | $ | 10,150,400 | |||||
The accompanying notes are an integral part of these statements.
MLM INDEX™ FUND
STATEMENTS OF CHANGES IN INVESTORS’ INTEREST
MLM IndexTM Unleveraged Series
Year ended December 31, 2010
|
Unleveraged Series
|
||||||||||||||||||||
|
Total
|
||||||||||||||||||||
|
Class A
|
Class B
|
Class C
|
Class D
|
Unleveraged
|
||||||||||||||||
|
Shares
|
Shares
|
Shares
|
Shares
|
Series
|
||||||||||||||||
|
Investors’ interest at December 31, 2009
|
$ | 4,636,414 | $ | 9,124,592 | $ | 1,262 | $ | 32,673,423 | $ | 46,435,691 | ||||||||||
|
Subscriptions
|
25,000 | 618,189 |
-
|
13,944,876 | 14,588,065 | |||||||||||||||
|
Redemptions
|
(849,101 | ) | (3,716,909 | ) |
-
|
(7,330,954 | ) | (11,896,964 | ) | |||||||||||
|
Transfers
|
5,000 | 34,000 |
-
|
157,943 | 196,943 | |||||||||||||||
|
Net Income
|
12,957 | 108,199 | 19 | 1,013,679 | 1,134,854 | |||||||||||||||
|
Investors’ interest at December 31, 2010
|
$ | 3,830,270 | $ | 6,168,071 | $ | 1,281 | $ | 40,458,967 | $ | 50,458,589 | ||||||||||
|
Shares at December 31, 2009
|
40,930 | 72,234 | 11 | 288,259 | ||||||||||||||||
|
Subscriptions
|
227 | 4,909 |
-
|
124,587 | ||||||||||||||||
|
Redemptions
|
(7,576 | ) | (29,337 | ) |
-
|
(64,394 | ) | |||||||||||||
|
Transfers
|
44 | 268 |
-
|
1,401 | ||||||||||||||||
|
Shares at December 31, 2010
|
33,625 | 48,074 | 11 | 349,853 | ||||||||||||||||
|
Net asset value per share
|
||||||||||||||||||||
|
December 31, 2010
|
$ | 113.91 | $ | 128.31 | $ | 112.67 | $ | 115.65 | ||||||||||||
The accompanying notes are an integral part of these statements.
MLM INDEX™ FUND
STATEMENTS OF CHANGES IN INVESTORS’ INTEREST (CONTINUED)
MLM IndexTM Unleveraged Series
Year ended December 31, 2009
|
Unleveraged Series
|
||||||||||||||||||||
|
Total
|
||||||||||||||||||||
|
Class A
|
Class B
|
Class C
|
Class D
|
Unleveraged
|
||||||||||||||||
|
Shares
|
Shares
|
Shares
|
Shares
|
Series
|
||||||||||||||||
|
Investors’ interest at December 31, 2008
|
$ | 4,293,290 | $ | 12,404,908 | $ | 1,320 | $ | 67,514,995 | $ | 84,214,513 | ||||||||||
|
Subscriptions
|
597,123 | 1,096,633 | - | 3,440,000 | 5,133,756 | |||||||||||||||
|
Redemptions
|
(35,000 | ) | (3,916,119 | ) | - | (35,146,090 | ) | (39,097,209 | ) | |||||||||||
|
Transfers
|
29,000 | 1,655 | - | (536,934 | ) | (506,279 | ) | |||||||||||||
|
Other (selling commissions)
|
(11,895 | ) | (5,483 | ) | - | - | (17,379 | ) | ||||||||||||
|
Net Loss
|
(236,104 | ) | (457,002 | ) | (58 | ) | (2,598,548 | ) | (3,291,711 | ) | ||||||||||
|
Investors’ interest at December 31, 2009
|
$ | 4,636,414 | $ | 9,124,592 | $ | 1,262 | $ | 32,673,423 | $ | 46,435,691 | ||||||||||
|
Shares at December 31, 2008
|
35,898 | 93,951 | 11 | 572,449 | ||||||||||||||||
|
Subscriptions
|
5,096 | 8,603 | - | 30,278 | ||||||||||||||||
|
Redemptions
|
(318 | ) | (30,332 | ) | - | (309,583 | ) | |||||||||||||
|
Transfers
|
254 | 12 | - | (4,885 | ) | |||||||||||||||
|
Shares at December 31, 2009
|
40,930 | 72,234 | 11 | 288,259 | ||||||||||||||||
|
Net asset value per share
|
||||||||||||||||||||
|
December 31, 2009
|
$ | 113.28 | $ | 126.32 | $ | 110.99 | $ | 113.35 | ||||||||||||
The accompanying notes are an integral part of these statements.
MLM INDEX™ FUND
STATEMENTS OF CHANGES IN INVESTORS’ INTEREST (CONTINUED)
MLM IndexTM Unleveraged Series
Year ended December 31, 2008
|
Unleveraged Series
|
||||||||||||||||||||
|
Total
|
||||||||||||||||||||
|
Class A
|
Class B
|
Class C
|
Class D
|
Unleveraged
|
||||||||||||||||
|
Shares
|
Shares
|
Shares
|
Shares
|
Series
|
||||||||||||||||
|
Investors’ interest at December 31, 2007
|
$ | 4,770,141 | $ | 13,224,027 | $ | 1,168 | $ | 60,943,912 | $ | 78,939,248 | ||||||||||
|
Subscriptions
|
20,000 | 606,116 | - | 2,150,000 | 2,776,116 | |||||||||||||||
|
Redemptions
|
(953,309 | ) | (2,969,229 | ) | - | (3,714,826 | ) | (7,637,364 | ) | |||||||||||
|
Transfers
|
(51,471 | ) | 40,712 | - | - | (10,759 | ) | |||||||||||||
|
Other (selling commissions)
|
(100 | ) | (3,028 | ) | - | - | (3,128 | ) | ||||||||||||
|
Net income
|
508,029 | 1,506,310 | 152 | 8,135,909 | 10,150,400 | |||||||||||||||
|
Investors’ interest at December 31, 2008
|
$ | 4,293,290 | $ | 12,404,908 | $ | 1,320 | $ | 67,514,995 | $ | 84,214,513 | ||||||||||
|
Shares at December 31, 2007
|
44,626 | 113,169 | 11 | 586,472 | ||||||||||||||||
|
Subscriptions
|
180 | 4,956 | - | 19,844 | ||||||||||||||||
|
Redemptions
|
(8,458 | ) | (24,516 | ) | - | (33,867 | ) | |||||||||||||
|
Transfers
|
(450 | ) | 342 | - | - | |||||||||||||||
|
Shares at December 31, 2008
|
35,898 | 93,951 | 11 | 572,449 | ||||||||||||||||
|
Net asset value per share
|
||||||||||||||||||||
|
December 31, 2008
|
$ | 119.60 | $ | 132.04 | $ | 116.06 | $ | 117.94 | ||||||||||||
The accompanying notes are an integral part of these statements.
MLM INDEX™ FUND
STATEMENTS OF CASH FLOWS
MLM IndexTM Unleveraged Series
Year ended December 31,
|
2010
|
2009
|
2008
|
||||||||||
|
Cash flows from operating activities
|
||||||||||||
|
Net income (loss)
|
$ | 1,134,854 | $ | (3,291,711 | ) | $ | 10,150,400 | |||||
|
Adjustments to reconcile net income (loss) to net cash and cash equivalents provided by (used in) operating activities
|
||||||||||||
|
Net change in operating assets and liabilities
|
||||||||||||
|
Due from broker
|
9,829,847 | (264,521 | ) | (12,265,223 | ) | |||||||
|
Net unrealized gain on open futures contracts
|
(1,832,718 | ) | 2,549,149 | (1,408,259 | ) | |||||||
|
Interest receivable
|
3,641 | 43,135 | 50,318 | |||||||||
|
Other assets
|
(440 | ) | - | - | ||||||||
|
Brokerage commissions payable
|
(4,458 | ) | 10,685 | (20,714 | ) | |||||||
|
Management fee payable
|
(9,392 | ) | (4,958 | ) | 866 | |||||||
|
Accrued expenses
|
(21,105 | ) | (104,140 | ) | (81,604 | ) | ||||||
|
Net cash and cash equivalents provided by (used in) operating activities
|
9,100,229 | (1,062,361 | ) | (3,574,216 | ) | |||||||
|
Cash flows from financing activities
|
||||||||||||
|
Subscriptions received, net of selling commissions
|
14,796,630 | 4,627,477 | 2,772,988 | |||||||||
|
Redemptions paid
|
(34,617,926 | ) | (16,217,626 | ) | (8,032,973 | ) | ||||||
|
Net cash and cash equivalents provided by (used in) financing activities
|
(19,821,296 | ) | (11,590,149 | ) | (5,259,985 | ) | ||||||
|
Net increase (decrease) in cash and cash equivalents
|
(10,721,067 | ) | (12,652,510 | ) | (8,834,201 | ) | ||||||
|
Cash and cash equivalents at beginning of year
|
56,122,787 | 68,775,297 | 77,609,498 | |||||||||
|
Cash and cash equivalents at end of year
|
$ | 45,401,720 | $ | 56,122,787 | $ | 68,775,297 | ||||||
|
Supplemental disclosure of non-cash financing activities:
|
||||||||||||
|
Redemptions payable
|
$ | 428,614 | $ | 23,149,576 | $ | 252,614 | ||||||
The accompanying notes are an integral part of these statements.
MLM INDEX™ FUND
STATEMENTS OF FINANCIAL CONDITION
MLM IndexTM Leveraged Series
December 31,
|
ASSETS
|
2010
|
2009
|
||||||
|
Cash and cash equivalents
|
$ | 24,445,088 | $ | 27,107,971 | ||||
|
Due from broker
|
9,246,484 | 20,992,597 | ||||||
|
Net unrealized gain on open futures contracts, at fair value
|
3,156,243 | - | ||||||
|
Interest receivable
|
- | 1,773 | ||||||
|
Total assets
|
$ | 36,847,815 | $ | 48,102,341 | ||||
|
LIABILITIES AND INVESTORS’ INTEREST
|
||||||||
|
Liabilities
|
||||||||
|
Redemptions payable
|
$ | 714,354 | $ | 684,794 | ||||
|
Net unrealized loss on open futures contracts, at fair value
|
- | 976,564 | ||||||
|
Brokerage commissions payable
|
33,114 | 39,138 | ||||||
|
Management fee payable
|
40,502 | 59,315 | ||||||
|
Subscriptions received in advance
|
21,106 | - | ||||||
|
Accrued expenses
|
13,419 | 46,644 | ||||||
|
Total liabilities
|
822,495 | 1,806,455 | ||||||
|
Investors’ interest
|
36,025,320 | 46,295,886 | ||||||
|
Total liabilities and investors’ interest
|
$ | 36,847,815 | $ | 48,102,341 | ||||
The accompanying notes are an integral part of these statements.
MLM INDEX™ FUND
CONDENSED SCHEDULE OF INVESTMENTS
MLM IndexTM Leveraged Series
December 31, 2010
|
Description
|
Number of contracts
|
Unrealized gain (loss)
|
Percentage of investors’ interest
|
|||||||||
|
Futures*
|
||||||||||||
|
Long futures contracts
|
||||||||||||
|
Financial
|
372 | $ | 595,510 | 1.65 | % | |||||||
|
Commodity
|
416 | 3,183,564 | 8.84 | |||||||||
| 788 | 3,779,074 | 10.49 | ||||||||||
|
Short futures contracts
|
||||||||||||
|
Financial
|
167 | (367,351 | ) | (1.02 | ) | |||||||
|
Commodity
|
57 | (255,480 | ) | (0.71 | ) | |||||||
| 224 | (622,831 | ) | (1.73 | ) | ||||||||
|
Net unrealized gain on open futures contracts, at fair value
|
$ | 3,156,243 | 8.76 | % | ||||||||
* Derivatives are not designated as hedging instruments.
The accompanying notes are an integral part of this schedule.
MLM INDEX™ FUND
CONDENSED SCHEDULE OF INVESTMENTS
MLM IndexTM Leveraged Series
December 31, 2009
|
Description
|
Number of contracts
|
Unrealized gain (loss)
|
Percentage of investors’ interest
|
|||||||||
|
Futures*
|
||||||||||||
|
Long futures contracts
|
||||||||||||
|
Financial
|
673 | $ | (1,674,829 | ) | (3.62 | )% | ||||||
|
Commodity
|
506 | 678,651 | 1.47 | |||||||||
| 1,179 | (996,178 | ) | (2.15 | ) | ||||||||
|
Short futures contracts
|
||||||||||||
|
Financial
|
63 | 90,162 | 0.19 | |||||||||
|
Commodity
|
267 | (70,548 | ) | (0.15 | ) | |||||||
| 330 | 19,614 | 0.04 | ||||||||||
|
Net unrealized loss on open futures contracts, at fair value
|
$ | (976,564 | ) | (2.11 | )% | |||||||
* Derivatives are not designated as hedging instruments.
The accompanying notes are an integral part of this schedule.
MLM INDEX™ FUND
STATEMENTS OF OPERATIONS
MLM IndexTM Leveraged Series
Year ended December 31,
|
2010
|
2009
|
2008
|
||||||||||
|
Investment income
|
||||||||||||
|
Interest
|
$ | 24,329 | $ | 51,086 | $ | 949,382 | ||||||
|
Expenses
|
||||||||||||
|
Brokerage commissions
|
466,282 | 592,105 | 579,037 | |||||||||
|
Management fee
|
548,317 | 720,477 | 668,846 | |||||||||
|
Operating expenses
|
181,522 | 273,557 | 173,994 | |||||||||
|
Total expenses
|
1,196,121 | 1,586,139 | 1,421,877 | |||||||||
|
Net investment (loss)
|
(1,171,792 | ) | (1,535,053 | ) | (472,495 | ) | ||||||
|
REALIZED AND UNREALIZED GAIN (LOSS) ON INVESTMENTS
|
||||||||||||
|
Net realized gain (loss) on investments
|
(731,228 | ) | 198,011 | 11,308,833 | ||||||||
|
Net change in unrealized appreciation on investments
|
4,174,060 | (4,946,374 | ) | 2,930,402 | ||||||||
|
Net realized and unrealized gain (loss) on investments
|
3,442,832 | (4,748,363 | ) | 14,239,235 | ||||||||
|
Net income (loss)
|
$ | 2,271,040 | $ | (6,283,416 | ) | $ | 13,766,740 | |||||
The accompanying notes are an integral part of these statements.
MLM INDEX™ FUND
STATEMENTS OF CHANGES IN INVESTORS’ INTEREST
MLM IndexTM Leveraged Series
Year ended December 31, 2010
|
Leveraged Series
|
||||||||||||||||||||
|
Total
|
||||||||||||||||||||
|
Class A
|
Class B
|
Class C
|
Class D
|
Leveraged
|
||||||||||||||||
|
Shares
|
Shares
|
Shares
|
Shares
|
Series
|
||||||||||||||||
|
Investors’ interest at December 31, 2009
|
$ | 4,638,578 | $ | 11,469,894 | $ | 1,164 | $ | 30,186,250 | $ | 46,295,886 | ||||||||||
|
Subscriptions
|
19,000 | 548,888 |
-
|
410,000 | 977,888 | |||||||||||||||
|
Redemptions
|
(2,045,728 | ) | (3,059,167 | ) |
-
|
(8,217,656 | ) | (13,322,551 | ) | |||||||||||
|
Transfers
|
(5,000 | ) | (34,000 | ) |
-
|
(157,943 | ) | (196,943 | ) | |||||||||||
|
Net Income
|
97,693 | 636,870 | 74 | 1,536,403 | 2,271,040 | |||||||||||||||
|
Investors’ interest at December 31, 2010
|
$ | 2,704,543 | $ | 9,562,485 | $ | 1,238 | $ | 23,757,054 | $ | 36,025,320 | ||||||||||
|
Shares at December 31, 2009
|
51,127 | 108,685 | 14 | 281,580 | ||||||||||||||||
|
Subscriptions
|
218 | 5,244 |
-
|
3,834 | ||||||||||||||||
|
Redemptions
|
(22,823 | ) | (28,363 | ) |
-
|
(77,179 | ) | |||||||||||||
|
Transfers
|
(54 | ) | (316 | ) |
-
|
(1,496 | ) | |||||||||||||
|
Shares at December 31, 2010
|
28,468 | 85,250 | 14 | 206,739 | ||||||||||||||||
|
Net asset value per share
|
||||||||||||||||||||
|
December 31, 2010
|
$ | 95 | $ | 112.17 | $ | 91.75 | $ | 114.91 | ||||||||||||
The accompanying notes are an integral part of these statements.
MLM INDEX™ FUND
STATEMENTS OF CHANGES IN INVESTORS’ INTEREST (CONTINUED)
MLM IndexTM Leveraged Series
Year ended December 31, 2009
|
Leveraged Series
|
||||||||||||||||||||
|
Total
|
||||||||||||||||||||
|
Class A
|
Class B
|
Class C
|
Class D
|
Leveraged
|
||||||||||||||||
|
Shares
|
Shares
|
Shares
|
Shares
|
Series
|
||||||||||||||||
|
Investors’ interest at December 31, 2008
|
$ | 6,903,329 | $ | 13,796,085 | $ | 1,327 | $ | 31,281,480 | $ | 51,982,221 | ||||||||||
|
Subscriptions
|
90,000 | 990,903 | - | 5,960,000 | 7,040,903 | |||||||||||||||
|
Redemptions
|
(1,464,701 | ) | (1,623,951 | ) | - | (3,855,018 | ) | (6,943,670 | ) | |||||||||||
|
Transfers
|
(29,000 | ) | (1,655 | ) | - | 536,934 | 506,279 | |||||||||||||
|
Other (selling commissions)
|
(1,500 | ) | (4,931 | ) | - | - | (6,431 | ) | ||||||||||||
|
Net Loss
|
(859,550 | ) | (1,686,557 | ) | (163 | ) | (3,737,146 | ) | (6,283,416 | ) | ||||||||||
|
Investors’ interest at December 31, 2009
|
$ | 4,638,578 | $ | 11,469,894 | $ | 1,164 | $ | 30,186,250 | $ | 46,295,886 | ||||||||||
|
Shares at December 31, 2008
|
65,670 | 114,555 | 14 | 257,908 | ||||||||||||||||
|
Subscriptions
|
1,020 | 9,170 | - | 52,801 | ||||||||||||||||
|
Redemptions
|
(15,251 | ) | (15,029 | ) | - | (34,642 | ) | |||||||||||||
|
Transfers
|
(312 | ) | (11 | ) | - | 5,513 | ||||||||||||||
|
Shares at December 31, 2009
|
51,127 | 108,685 | 14 | 281,580 | ||||||||||||||||
|
Net asset value per share
|
||||||||||||||||||||
|
December 31, 2009
|
$ | 90.73 | $ | 105.53 | $ | 86.24 | $ | 107.20 | ||||||||||||
The accompanying notes are an integral part of these statements.
MLM INDEX™ FUND
STATEMENTS OF CHANGES IN INVESTORS’ INTEREST (CONTINUED)
MLM IndexTM Leveraged Series
Year ended December 31, 2008
|
Leveraged Series
|
||||||||||||||||||||
|
Total
|
||||||||||||||||||||
|
Class A
|
Class B
|
Class C
|
Class D
|
Leveraged
|
||||||||||||||||
|
Shares
|
Shares
|
Shares
|
Shares
|
Series
|
||||||||||||||||
|
Investors’ interest at December 31, 2007
|
$ | 7,227,407 | $ | 15,754,642 | $ | 981 | $ | 15,463,453 | $ | 38,446,483 | ||||||||||
|
Subscriptions
|
519,000 | 1,081,545 | - | 10,380,000 | 11,980,545 | |||||||||||||||
|
Redemptions
|
(2,860,296 | ) | (7,372,119 | ) | - | (1,984,397 | ) | (12,216,812 | ) | |||||||||||
|
Transfers
|
26,495 | (15,736 | ) | - | - | 10,759 | ||||||||||||||
|
Other (selling commissions)
|
(2,595 | ) | (2,899 | ) | - | - | (5,494 | ) | ||||||||||||
|
Net Income
|
1,993,318 | 4,350,652 | 346 | 7,422,424 | 13,766,740 | |||||||||||||||
|
Investors’ interest at December 31, 2008
|
$ | 6,903,329 | $ | 13,796,085 | $ | 1,327 | $ | 31,281,480 | $ | 51,982,221 | ||||||||||
|
Shares at December 31, 2007
|
91,630 | 176,908 | 14 | 173,842 | ||||||||||||||||
|
Subscriptions
|
6,077 | 11,297 | - | 103,628 | ||||||||||||||||
|
Redemptions
|
(32,301 | ) | (73,462 | ) | - | (19,562 | ) | |||||||||||||
|
Transfers
|
264 | (188 | ) | - | - | |||||||||||||||
|
Shares at December 31, 2008
|
65,670 | 114,555 | 14 | 257,908 | ||||||||||||||||
|
Net asset value per share
|
||||||||||||||||||||
|
December 31, 2008
|
$ | 105.12 | $ | 120.43 | $ | 98.31 | $ | 121.29 | ||||||||||||
The accompanying notes are an integral part of these statements.
MLM INDEX™ FUND
STATEMENTS OF CASH FLOWS
MLM IndexTM Leveraged Series
Year ended December 31,
|
2010
|
2009
|
2008
|
||||||||||
|
Cash flows from operating activities
|
||||||||||||
|
Net income (loss)
|
$ | 2,271,040 | $ | (6,283,416 | ) | $ | 13,766,740 | |||||
|
Adjustments to reconcile net income (loss) to net cash and cash equivalents provided by (used in)operating activities
|
||||||||||||
|
Net change in operating assets and liabilities
|
||||||||||||
|
Due from broker
|
11,746,113 | (48,501 | ) | (19,002,379 | ) | |||||||
|
Net unrealized gain on open futures contracts
|
(4,132,807 | ) | 4,933,691 | (3,034,788 | ) | |||||||
|
Interest receivable
|
1,773 | 16,729 | 35,522 | |||||||||
|
Other assets
|
- | 28 | 1,240 | |||||||||
|
Brokerage commissions payable
|
(6,024 | ) | (36,204 | ) | 39,043 | |||||||
|
Management fee payable
|
(18,813 | ) | (5,696 | ) | 13,775 | |||||||
|
Accrued expenses
|
(33,225 | ) | (146,575 | ) | (43,455 | ) | ||||||
|
Net cash and cash equivalents provided by (used in) operating activities
|
9,828,057 | (1,569,944 | ) | (8,224,302 | ) | |||||||
|
Cash flows from financing activities
|
||||||||||||
|
Subscriptions received, net of selling commissions
|
998,994 | 7,547,182 | 11,475,051 | |||||||||
|
Redemptions paid
|
(13,489,934 | ) | (8,893,789 | ) | (10,446,649 | ) | ||||||
|
Net cash and cash equivalents provided by (used in) financing activities
|
(12,490,940 | ) | (1,346,607 | ) | 1,028,402 | |||||||
|
Net increase (decrease) in cash and cash equivalents
|
(2,662,883 | ) | (2,916,551 | ) | (7,195,900 | ) | ||||||
|
Cash and cash equivalents at beginning of year
|
27,107,971 | 30,024,522 | 37,220,422 | |||||||||
|
Cash and cash equivalents at end of year
|
$ | 24,445,088 | $ | 27,107,971 | $ | 30,024,522 | ||||||
|
Supplemental disclosure of non-cash financing activities:
|
||||||||||||
|
Subscriptions recorded which were received in advance
|
$ | 0 | $ | - | $ | 500,000 | ||||||
|
Redemptions payable
|
$ | 714,354 | $ | 684,794 | $ | 2,628,482 | ||||||
The accompanying notes are an integral part of these statements.
MLM INDEX™ FUND
STATEMENTS OF FINANCIAL CONDITION
MLM Commodity L/N Index Unleveraged Series
December 31,
|
ASSETS
|
2010
|
2009
|
||||||
|
Cash and cash equivalents
|
$ | 39,805,018 | $ | 7,999,557 | ||||
|
Due from broker
|
3,678,857 | 504,578 | ||||||
|
Net unrealized gain on open futures contracts, at fair value
|
5,506,195 | 100,833 | ||||||
|
Interest receivable
|
1 | - | ||||||
|
Other assets
|
18 | - | ||||||
|
Total assets
|
$ | 48,990,089 | $ | 8,604,968 | ||||
|
LIABILITIES AND INVESTORS’ INTEREST
|
||||||||
|
Liabilities
|
||||||||
|
Brokerage commissions payable
|
$ | 14,711 | $ | 1,667 | ||||
|
Management fee payable
|
18,588 | 2,084 | ||||||
|
Accrued expenses
|
10,200 | - | ||||||
|
Total liabilities
|
43,499 | 3,751 | ||||||
|
Investors’ interest
|
48,946,590 | 8,601,217 | ||||||
|
Total liabilities and investors’ interest
|
$ | 48,990,089 | $ | 8,604,968 | ||||
The accompanying notes are an integral part of these statements.
MLM INDEX™ FUND
CONDENSED SCHEDULE OF INVESTMENTS
MLM Commodity L/N Index Unleveraged Series
December 31, 2010
|
Description
|
Number of contracts
|
Unrealized gain (loss)
|
Percentage of investors’ interest
|
|||||||||
|
Futures*
|
||||||||||||
|
Long futures contracts
|
||||||||||||
|
Commodity
|
753 | $ | 5,506,195 | 11.25 | % | |||||||
|
Net unrealized gain on open futures contracts, at fair value
|
$ | 5,506,195 | 11.25 | % | ||||||||
* Derivatives are not designated as hedging instruments.
The accompanying notes are an integral part of this schedule.
MLM INDEX™ FUND
CONDENSED SCHEDULE OF INVESTMENTS
MLM Commodity L/N Index Unleveraged Series
December 31, 2009
|
Description
|
Number of contracts
|
Unrealized gain (loss)
|
Percentage of investors’ interest
|
|||||||||
|
Futures*
|
||||||||||||
|
Long futures contracts
|
||||||||||||
|
Commodity
|
126 | $ | 100,833 | 1.17 | % | |||||||
|
Net unrealized gain on open futures contracts, at fair value
|
$ | 100,833 | 1.17 | % | ||||||||
* Derivatives are not designated as hedging instruments.
The accompanying notes are an integral part of this schedule.
MLM INDEX™ FUND
STATEMENTS OF OPERATIONS
MLM Commodity L/N Index Unleveraged Series
Year ended December 31,
|
2010
|
2009* | |||||||
|
Investment income
|
||||||||
|
Interest
|
$ | 13,054 | $ | - | ||||
|
Expenses
|
||||||||
|
Brokerage commissions
|
94,306 | 1,667 | ||||||
|
Management fee
|
117,883 | 2,084 | ||||||
|
Operating expenses
|
95,549 | 1,459 | ||||||
|
Total expenses
|
307,738 | 5,210 | ||||||
|
Net investment (loss)
|
(294,684 | ) | (5,210 | ) | ||||
|
REALIZED AND UNREALIZED GAIN (LOSS) ON INVESTMENTS
|
||||||||
|
Net realized gain on investments
|
631,617 | 4,594 | ||||||
|
Net change in unrealized appreciation/depreciation on investments
|
5,408,440 | 100,833 | ||||||
|
Net realized and unrealized gain on investments
|
6,040,057 | 105,427 | ||||||
|
Net income
|
$ | 5,745,373 | $ | 100,217 | ||||
* Period from December 1, 2009 (commencement of operations) to December 31, 2009
The accompanying notes are an integral part of these statements.
MLM INDEX™ FUND
STATEMENTS OF CHANGES IN INVESTORS’ INTEREST
MLM Commodity L/N Index Unleveraged Series
Year ended December 31, 2010
|
Commodity L/N
|
||||
|
Unleveraged
|
||||
|
Series
|
||||
|
Class D
|
||||
|
Shares
|
||||
|
Investors’ interest at December 31, 2009
|
$ | 8,601,217 | ||
|
Subscriptions
|
34,600,000 | |||
|
Redemptions
|
- | |||
|
Transfers
|
- | |||
|
Net income (loss)
|
5,745,373 | |||
|
Investors’ interest at December 31, 2010
|
$ | 48,946,590 | ||
|
Shares at December 31, 2009
|
84,322 | |||
|
Subscriptions
|
352,050 | |||
|
Redemptions
|
- | |||
|
Transfers
|
- | |||
|
Shares at December 31, 2010
|
436,372 | |||
|
Net asset value per share
|
||||
|
December 31, 2010
|
$ | 112.17 | ||
The accompanying notes are an integral part of these statements.
MLM INDEX™ FUND
STATEMENTS OF CHANGES IN INVESTORS’ INTEREST (CONTINUED)
MLM Commodity L/N Index Unleveraged Series
Period from December 1, 2009 (commencement of operations) to December 31, 2009
|
Commodity L/N
|
||||
|
Unleveraged
|
||||
|
Series
|
||||
|
Class D
|
||||
|
Shares
|
||||
|
Investors’ interest at December 31, 2008
|
- | |||
|
Subscriptions
|
8,501,000 | |||
|
Redemptions
|
- | |||
|
Transfers
|
- | |||
|
Other (selling commissions)
|
- | |||
|
Net income (loss)
|
100,217 | |||
|
Investors’ interest at December 31, 2009
|
$ | 8,601,217 | ||
|
Shares at December 31, 2008
|
- | |||
|
Subscriptions
|
84,322 | |||
|
Redemptions
|
- | |||
|
Transfers
|
- | |||
|
Shares at December 31, 2009
|
84,322 | |||
|
Net asset value per share
|
||||
|
December 31, 2009
|
$ | 102.00 | ||
The accompanying notes are an integral part of these statements.
MLM INDEX™ FUND
STATEMENTS OF CASH FLOWS
MLM Commodity L/N Index Unleveraged Series
Year ended December 31,
|
2010
|
2009* | |||||||
|
Cash flows from operating activities
|
||||||||
|
Net income (loss)
|
$ | 5,745,373 | $ | 100,217 | ||||
|
Adjustments to reconcile net income (loss) to net cash and cash equivalents provided by (used in)operating activities
|
||||||||
|
Net change in operating assets and liabilities
|
||||||||
|
Due from broker
|
(3,174,279 | ) | (504,578 | ) | ||||
|
Net unrealized gain on open futures contracts
|
(5,405,362 | ) | (100,833 | ) | ||||
|
Interest receivable
|
(1 | ) | - | |||||
|
Other assets
|
(18 | ) | - | |||||
|
Brokerage commissions payable
|
13,044 | 1,667 | ||||||
|
Management fee payable
|
16,504 | 2,084 | ||||||
|
Accrued expenses
|
10,200 | - | ||||||
|
Net cash and cash equivalents provided by (used in) operating activities
|
(2,794,539 | ) | (501,443 | ) | ||||
|
Cash flows from financing activities
|
||||||||
|
Subscriptions received, net of selling commissions
|
34,600,000 | 8,501,000 | ||||||
|
Net increase (decrease) in cash and cash equivalents
|
31,805,461 | 7,999,557 | ||||||
|
Cash and cash equivalents at beginning of year/period
|
7,999,557 | - | ||||||
|
Cash and cash equivalents at end of year/period
|
$ | 39,805,018 | $ | 7,999,557 | ||||
* Period from December 1, 2009 (commencement of operations) to December 31, 2009
The accompanying notes are an integral part of these statements.
MLM INDEX™ FUND
STATEMENTS OF FINANCIAL CONDITION
MLM Commodity L/S Index Unleveraged Series
December 31,
|
ASSETS
|
2010
|
2009
|
||||||
|
Cash and cash equivalents
|
$ | 10,576,394 | $ | 186,896 | ||||
|
Due from broker
|
1,822,731 | 3,004,023 | ||||||
|
Net unrealized gain on open futures contracts, at fair value
|
1,526,224 | 57,043 | ||||||
|
Other assets
|
39 | - | ||||||
|
Total assets
|
$ | 13,925,388 | $ | 3,247,962 | ||||
|
LIABILITIES AND INVESTORS’ INTEREST
|
||||||||
|
Liabilities
|
||||||||
|
Brokerage commissions payable
|
$ | 4,198 | $ | - | ||||
|
Management fee payable
|
5,306 | 1,334 | ||||||
|
Accrued expenses
|
3,600 | 468 | ||||||
|
Total liabilities
|
13,104 | 1,802 | ||||||
|
Investors’ interest
|
13,912,284 | 3,246,160 | ||||||
|
Total liabilities and investors’ interest
|
$ | 13,925,388 | $ | 3,247,962 | ||||
The accompanying notes are an integral part of these statements.
MLM INDEX™ FUND
CONDENSED SCHEDULE OF INVESTMENTS
MLM Commodity L/S Index Unleveraged Series
December 31, 2010
|
Description
|
Number of contracts
|
Unrealized gain (loss)
|
Percentage of investors’ interest
|
|||||||||
|
Futures*
|
||||||||||||
|
Long futures contracts
|
||||||||||||
|
Commodity
|
216 | $ | 1,658,684 | 11.92 | % | |||||||
|
Short futures contracts
|
||||||||||||
|
Commodity
|
30 | (132,460 | ) | (0.95 | ) | |||||||
|
Net unrealized gain on open futures contracts, at fair value
|
$ | 1,526,224 | 10.97 | % | ||||||||
* Derivatives are not designated as hedging instruments.
The accompanying notes are an integral part of this schedule.
MLM INDEX™ FUND
CONDENSED SCHEDULE OF INVESTMENTS
MLM Commodity L/S Index Unleveraged Series
December 31, 2009
|
Description
|
Number of contracts
|
Unrealized gain (loss)
|
Percentage of investors’ interest
|
|||||||||
|
Futures*
|
||||||||||||
|
Long futures contracts
|
||||||||||||
|
Commodity
|
47 | $ | 64,000 | 1.97 | % | |||||||
|
Short futures contracts
|
||||||||||||
|
Commodity
|
25 | (6,957 | ) | (0.21 | ) | |||||||
|
Net unrealized gain on open futures contracts, at fair value
|
$ | 57,043 | 1.76 | % | ||||||||
* Derivatives are not designated as hedging instruments.
The accompanying notes are an integral part of this schedule.
MLM INDEX™ FUND
STATEMENTS OF OPERATIONS
MLM Commodity L/S Index Unleveraged Series
Year ended December 31,
|
2010
|
2009* | |||||||
|
Investment income
|
||||||||
|
Interest
|
$ | 4,237 | $ | - | ||||
|
Expenses
|
||||||||
|
Brokerage commissions
|
41,609 | 5,270 | ||||||
|
Management fee
|
52,012 | 6,588 | ||||||
|
Operating expenses
|
42,085 | 5,574 | ||||||
|
Total expenses
|
135,706 | 17,432 | ||||||
|
Net investment (loss)
|
(131,469 | ) | (17,432 | ) | ||||
|
REALIZED AND UNREALIZED GAIN (LOSS) ON INVESTMENTS
|
||||||||
|
Net realized gain (loss) on investments
|
(1,172,228 | ) | 205,095 | |||||
|
Net change in unrealized appreciation/depreciation on investments
|
1,469,821 | 57,497 | ||||||
|
Net realized and unrealized gain) on investments
|
297,593 | 262,592 | ||||||
|
Net income
|
$ | 166,124 | $ | 245,160 | ||||
* Period from August 1, 2009 (commencement of operations) to December 31, 2009
The accompanying notes are an integral part of these statements.
MLM INDEX™ FUND
STATEMENTS OF CHANGES IN INVESTORS’ INTEREST
MLM Commodity L/S Index Unleveraged Series
Year ended December 31, 2010
|
Commodity L/S
|
||||
|
Unleveraged
|
||||
|
Series
|
||||
|
Class D
|
||||
|
Shares
|
||||
|
Investors’ interest at December 31, 2009
|
$ | 3,246,160 | ||
|
Subscriptions
|
10,500,000 | |||
|
Redemptions
|
- | |||
|
Transfers
|
- | |||
|
Net income (loss)
|
166,124 | |||
|
Investors’ interest at December 31, 2010
|
$ | 13,912,284 | ||
|
Shares at December 31, 2009
|
30,009 | |||
|
Subscriptions
|
93,622 | |||
|
Redemptions
|
- | |||
|
Transfers
|
- | |||
|
Shares at December 31, 2010
|
123,631 | |||
|
Net asset value per share
|
||||
|
December 31, 2010
|
$ | 112.53 | ||
The accompanying notes are an integral part of these statements.
MLM INDEX™ FUND
STATEMENTS OF CHANGES IN INVESTORS’ INTEREST (CONTINUED)
MLM Commodity L/S Index Unleveraged Series
Period from August 1, 2009 (commencement of operations) to December 31, 2009
|
Commodity L/S
|
||||
|
Unleveraged
|
||||
|
Series
|
||||
|
Class D
|
||||
|
Shares
|
||||
|
Investors’ interest at December 31, 2008
|
- | |||
|
Subscriptions
|
3,001,000 | |||
|
Redemptions
|
- | |||
|
Transfers
|
- | |||
|
Other (selling commissions)
|
- | |||
|
Net income (loss)
|
245,160 | |||
|
Investors’ interest at December 31, 2009
|
$ | 3,246,160 | ||
|
Shares at December 31, 2008
|
- | |||
|
Subscriptions
|
30,009 | |||
|
Redemptions
|
- | |||
|
Transfers
|
- | |||
|
Shares at December 31, 2009
|
30,009 | |||
|
Net asset value per share
|
||||
|
December 31, 2009
|
$ | 108.17 | ||
The accompanying notes are an integral part of these statements.
MLM INDEX™ FUND
STATEMENTS OF CASH FLOWS
MLM Commodity L/S Index Unleveraged Series
Year ended December 31,
|
2010
|
2009* | |||||||
|
Cash flows from operating activities
|
||||||||
|
Net income (loss)
|
$ | 166,124 | $ | 245,160 | ||||
|
Adjustments to reconcile net income (loss) to net cash and cash equivalents provided by (used in)operating activities
|
||||||||
|
Net change in operating assets and liabilities
|
||||||||
|
Due from broker
|
1,181,292 | (3,004,023 | ) | |||||
|
Net unrealized gain on open futures contracts
|
(1,469,181 | ) | (57,043 | ) | ||||
|
Other assets
|
(39 | ) | - | |||||
|
Brokerage commissions payable
|
4,198 | - | ||||||
|
Management fee payable
|
3,972 | 1,334 | ||||||
|
Accrued expenses
|
3,132 | 468 | ||||||
|
Net cash and cash equivalents provided by (used in) operating activities
|
(110,502 | ) | (2,814,104 | ) | ||||
|
Cash flows from financing activities
|
||||||||
|
Subscriptions received, net of selling commissions
|
10,500,000 | 3,001,000 | ||||||
|
Net increase (decrease) in cash and cash equivalents
|
10,389,498 | 186,896 | ||||||
|
Cash and cash equivalents at beginning of year/period
|
186,896 | - | ||||||
|
Cash and cash equivalents at end of year/period
|
$ | 10,576,394 | $ | 186,896 | ||||
* Period from August 1, 2009 (commencement of operations) to December 31, 2009
The accompanying notes are an integral part of these statements.
MLM INDEX™ FUND
STATEMENTS OF FINANCIAL CONDITION
Trust Total
December 31,
|
ASSETS
|
2010
|
2009
|
||||||
|
Cash and cash equivalents
|
$ | 120,228,220 | $ | 91,417,211 | ||||
|
Due from broker
|
18,793,453 | 38,376,426 | ||||||
|
Net unrealized gain on open futures contracts, at fair value
|
11,705,580 | 157,876 | ||||||
|
Interest receivable
|
1 | 5,414 | ||||||
|
Other assets
|
497 | - | ||||||
|
Total assets
|
$ | 150,727,751 | $ | 129,956,927 | ||||
|
LIABILITIES AND INVESTORS’ INTEREST
|
||||||||
|
Liabilities
|
||||||||
|
Redemptions payable
|
$ | 1,142,968 | $ | 23,834,370 | ||||
|
Net unrealized loss on open futures contracts, at fair value
|
- | 1,292,364 | ||||||
|
Brokerage commissions payable
|
71,884 | 65,124 | ||||||
|
Management fee payable
|
88,269 | 95,998 | ||||||
|
Subscriptions received in advance
|
32,728 | - | ||||||
|
Accrued expenses
|
49,119 | 90,117 | ||||||
|
Total liabilities
|
1,384,968 | 25,377,973 | ||||||
|
Investors’ interest
|
149,342,783 | 104,578,954 | ||||||
|
Total liabilities and investors’ interest
|
$ | 150,727,751 | $ | 129,799,051 | ||||
The accompanying notes are an integral part of these statements.
MLM INDEX™ FUND
CONDENSED SCHEDULE OF INVESTMENTS
Trust Total
December 31, 2010
|
Description
|
Number of contracts
|
Unrealized gain (loss)
|
Percentage of investors’ interest
|
|||||||||
|
Futures*
|
||||||||||||
|
Long futures contracts
|
||||||||||||
|
Financial
|
596 | $ | 879,400 | 0.59 | % | |||||||
|
Commodity
|
1,637 | 11,893,512 | 7.69 | |||||||||
| 2,233 | 12,772,912 | 8.55 | ||||||||||
|
Short futures contracts
|
||||||||||||
|
Financial
|
266 | (556,062 | ) | (0.37 | ) | |||||||
|
Commodity
|
123 | (511,270 | ) | (0.34 | ) | |||||||
| 389 | (1,067,332 | ) | (0.71 | ) | ||||||||
|
Net unrealized gain on open futures contracts, at fair value
|
$ | 11,705,580 | 7.84 | % | ||||||||
* Derivatives are not designated as hedging instruments.
The accompanying notes are an integral part of this schedule.
MLM INDEX™ FUND
CONDENSED SCHEDULE OF INVESTMENTS
Trust Total
December 31, 2009
|
Description
|
Number of contracts
|
Unrealized gain (loss)
|
Percentage of investors’ interest
|
|||||||||
|
Futures*
|
||||||||||||
|
Long futures contracts
|
||||||||||||
|
Financial
|
900 | $ | (2,233,254 | ) | (2.14 | )% | ||||||
|
Commodity
|
848 | 1,081,653 | 1.03 | |||||||||
| 1,748 | (1,151,601 | ) | (1.11 | ) | ||||||||
|
Short futures contracts
|
||||||||||||
|
Financial
|
84 | 120,124 | 0.11 | |||||||||
|
Commodity
|
381 | (103,011 | ) | (0.10 | ) | |||||||
| 465 | 17,113 | 0.01 | ||||||||||
|
Net unrealized loss on open futures contracts, at fair value
|
$ | (1,134,488 | ) | (1.10 | )% | |||||||
* Derivatives are not designated as hedging instruments.
The accompanying notes are an integral part of this schedule.
MLM INDEX™ FUND
STATEMENTS OF OPERATIONS
Trust Total
Year ended December 31,
|
2010
|
2009
|
2008
|
||||||||||
|
Investment income
|
||||||||||||
|
Interest
|
$ | 86,366 | $ | 159,900 | $ | 2,923,714 | ||||||
|
Expenses
|
||||||||||||
|
Brokerage commissions
|
839,931 | 961,240 | 977,593 | |||||||||
|
Management fee
|
988,279 | 1,143,229 | 1,115,615 | |||||||||
|
Operating expenses
|
551,333 | 672,497 | 506,440 | |||||||||
|
Total expenses
|
2,379,543 | 2,776,966 | 2,599,648 | |||||||||
|
Net investment income (loss)
|
(2,293,177 | ) | (2,617,066 | ) | 324,066 | |||||||
|
REALIZED AND UNREALIZED GAIN (LOSS) ON INVESTMENTS
|
||||||||||||
|
Net realized gain (loss) on investments
|
(1,284,927 | ) | 731,923 | 19,104,468 | ||||||||
|
Net change in unrealized appreciation/depreciation on investments
|
12,895,495 | (7,344,607 | ) | 4,488,606 | ||||||||
|
Net realized and unrealized gain (loss) on investments
|
11,610,568 | (6,612,684 | ) | 23,593,074 | ||||||||
|
Net income (loss)
|
$ | 9,317,391 | $ | (9,229,750 | ) | $ | 23,917,140 | |||||
The accompanying notes are an integral part of these statements.
MLM INDEX™ FUND
STATEMENTS OF CHANGES IN INVESTORS’ INTEREST
Trust Total
Year ended December 31, 2010
|
Total Investors’ Interest ($100 par value/share)
|
||||
|
Investors’ interest at December 31, 2009
|
$ | 104,578,954 | ||
|
Subscriptions
|
60,665,953 | |||
|
Redemptions
|
(25,219,515 | ) | ||
|
Transfers
|
- | |||
|
Net income (loss)
|
9,317,391 | |||
|
Investors’ interest at December 31, 2010
|
$ | 149,342,783 | ||
The accompanying notes are an integral part of these statements.
MLM INDEX™ FUND
STATEMENTS OF CHANGES IN INVESTORS’ INTEREST (CONTINUED)
Trust Total
Year ended December 31, 2009
|
Total Investors’ Interest ($100 par value/share)
|
||||
|
Investors’ interest at December 31, 2008
|
$ | 136,196,734 | ||
|
Subscriptions
|
23,676,659 | |||
|
Redemptions
|
(46,040,879 | ) | ||
|
Transfers
|
- | |||
|
Other (selling commissions)
|
(23,810 | ) | ||
|
Net income (loss)
|
(9,229,750 | ) | ||
|
Investors’ interest at December 31, 2009
|
$ | 104,578,954 | ||
The accompanying notes are an integral part of these statements.
MLM INDEX™ FUND
STATEMENTS OF CHANGES IN INVESTORS’ INTEREST (CONTINUED)
Trust Total
Year ended December 31, 2008
|
Total Investors’ Interest ($100 par value/share)
|
||||
|
Investors’ interest at December 31, 2007
|
$ | 117,385,731 | ||
|
Subscriptions
|
14,756,661 | |||
|
Redemptions
|
(19,854,176 | ) | ||
|
Transfers
|
- | |||
|
Other (selling commissions)
|
(8,622 | ) | ||
|
Net income
|
23,917,140 | |||
|
Investors’ interest at December 31, 2008
|
$ | 136,196,734 | ||
The accompanying notes are an integral part of these statements.
MLM INDEX™ FUND
STATEMENTS OF CASH FLOWS
Trust Total
Year ended December 31,
|
2010
|
2009
|
2008
|
||||||||||
|
Cash flows from operating activities
|
||||||||||||
|
Net income (loss)
|
$ | 9,317,391 | $ | (9,229,750 | ) | $ | 23,917,140 | |||||
|
Adjustments to reconcile net income (loss) to net cash and cash equivalents provided by (used in)operating activities
|
||||||||||||
|
Net change in operating assets and liabilities
|
||||||||||||
|
Due from broker
|
19,582,934 | (3,821,623 | ) | (31,267,602 | ) | |||||||
|
Net unrealized gain on open futures contracts
|
(12,840,089 | ) | 7,324,964 | (4,443,047 | ) | |||||||
|
Interest receivable
|
5,413 | 59,864 | 85,840 | |||||||||
|
Other assets
|
(497 | ) | 28 | 1,240 | ||||||||
|
Brokerage commissions payable
|
6,760 | (23,852 | ) | 18,329 | ||||||||
|
Management fee payable
|
(7,729 | ) | (7,236 | ) | 14,641 | |||||||
|
Accrued expenses
|
(40,998 | ) | (250,247 | ) | (125,059 | ) | ||||||
|
Net cash and cash equivalents provided by (used in) operating activities
|
16,023,245 | (5,947,852 | ) | (11,798,518 | ) | |||||||
|
Cash flows from financing activities
|
||||||||||||
|
Subscriptions received, net of selling commissions
|
60,698,681 | 23,676,659 | 14,248,039 | |||||||||
|
Redemptions paid
|
(47,910,917 | ) | (25,111,415 | ) | (18,479,622 | ) | ||||||
|
Net cash and cash equivalents provided by (used in) financing activities
|
12,787,764 | (1,434,756 | ) | (4,231,583 | ) | |||||||
|
Net increase (decrease) in cash and cash equivalents
|
28,811,009 | (7,382,608 | ) | (16,030,101 | ) | |||||||
|
Cash and cash equivalents at beginning of year
|
91,417,211 | 98,799,819 | 114,829,920 | |||||||||
|
Cash and cash equivalents at end of year
|
$ | 120,228,220 | $ | 91,417,211 | $ | 98,799,819 | ||||||
|
Supplemental disclosure of non-cash financing activities:
|
||||||||||||
|
Subscriptions recorded which were received in advance
|
$ | 32,728 |
$ ─
|
$ | 500,000 | |||||||
|
Redemptions payable
|
$ | 1,142,968 | $ | 23,834,370 | $ | 2,881,096 | ||||||
The accompanying notes are an integral part of these statements.
MLM INDEX™ FUND
NOTES TO FINANCIAL STATEMENTS
December 31, 2010
The following discussion of the notes to financial statements is applicable to both the MLM Index Fund and each of its Series (the MLM Index Unleveraged Series, the MLM Index Leveraged Series, the MLM Commodity L/N Index Unleveraged Series and the MLM Commodity L/S Index Unleveraged Series).
1. Organization
MLM Index™ Fund was formed under the Business Trust Statute of the State of Delaware as a business trust in December 1997 and commenced operations on January 4, 1999. The MLM Index™ Fund was organized for the primary purpose of seeking capital appreciation through the speculative trading of a diversified portfolio of futures contracts using the MLM Index™ Trading Program, which is based upon the MLM Index™ (the “Index”). The Index is a benchmark of the hypothetical returns available to a futures investor. The Index is comprised of a diverse portfolio of futures markets, including both financial and tangible markets.
At December 31, 2010, the MLM Index™ Fund is comprised of four series: the MLM Index™ Unleveraged Series (“Unleveraged Series”), the MLM Index™ Leveraged Series (“Leveraged Series”), the MLM Commodity L/N Index Unleveraged Series (“Commodity L/N Unleveraged Series”) and the MLM Commodity L/S Index Unleveraged Series (“Commodity L/S Unleveraged Series”). MLM Index™ Fund and its series are collectively referred to herein as the “Trust”.
Mount Lucas Management Corporation (the “Manager”) is the investment manager of the Trust and each Series and is responsible for the allocation of the Trust’s interest among a mix of trading strategies. The Manager is a registered investment advisor under the Investment Advisers Act of 1940, is registered as a commodity pool operator and a commodity trading advisor with the Commodity Futures Trading Commission and is a member of the National Futures Association.
2. Summary of Significant Accounting Policies
Basis of Presentation
The Trust is comprised of four series: the Unleveraged Series, which attempts to replicate the Index without leverage, the Leveraged Series, which attempts to replicate the Index at three times leverage, the MLM Commodity L/S Unleveraged Series which attempts to replicate the MLM Commodity Long/Short Index without leverage and the Commodity L/N Unleveraged Series which attempts to replicate the MLM Commodity Long/Neutral Index without leverage (collectively, the “Series”). The accompanying financial statements have been prepared in conformity with accounting principles generally accepted in the United States of America (US GAAP). The following is a summary of the significant accounting and reporting policies used in preparing the financial statements.
Use of Estimates
The preparation of the accompanying financial statements in conformity with accounting principles generally accepted in the United States of America requires management to make estimates and assumptions that affect the reported amounts of assets and liabilities and disclosure of contingent assets and liabilities at the date of the financial statements and the reported amounts of revenues and expenses during the reporting period. Actual results could differ from those estimates.
Cash and Cash Equivalents
Cash and cash equivalents consist of highly liquid financial instruments with maturities of three months or less, when purchased. Certain of each Series' cash at broker is restricted to meet margin requirements (see Note 5).
Due From Brokers
Each Series' trading activities utilize one broker located in the United States. Due from broker represents cash balances held, and amounts receivable or payable for transactions not settled at December 31, 2010 and 2009.
MLM INDEX™ FUND
NOTES TO FINANCIAL STATEMENTS (continued)
December 31, 2010
2. Summary of Significant Accounting Policies (continued)
Fair Value Measurements
Each Series has categorized its financial instruments, based on the priority of the inputs to the valuation technique, into a three-level fair value hierarchy. The fair value hierarchy gives the highest priority to quoted prices in active markets for identical assets or liabilities (Level 1) and the lowest priority to unobservable inputs (Level 3). If the inputs used to measure the financial instruments fall within different levels of the hierarchy, the categorization is based on the lowest level input that is significant to the fair value measurement of the instrument.
Financial assets and liabilities recorded on the statement of assets and liabilities are categorized based on the inputs to the valuation techniques as follows:
Level 1:
Financial assets and liabilities whose values are based on unadjusted quoted prices for identical assets or liabilities in an active market (examples include active exchange-traded equity securities, listed derivatives, most U.S. government and agency securities, and certain other sovereign government obligations).
Level 2:
Financial assets and liabilities whose values are based on the following:
|
|
a)
|
Quoted prices for similar assets or liabilities in active markets (for example, restricted stock);
|
|
|
b)
|
Quoted prices for identical or similar assets or liabilities in non-active markets (examples include corporate and municipal bonds, which trade infrequently);
|
|
|
c)
|
Pricing models whose inputs are observable for substantially the full term of the asset or liability (examples include most over-the-counter derivatives, including interest rate and currency swaps); and
|
|
|
d)
|
Pricing models whose inputs are derived principally from or corroborated by observable market data through correlation or other means for substantially the full term of the asset or liability (for example, certain mortgage loans).
|
Level 3:
Financial assets and liabilities whose values are based on prices or valuation techniques that require inputs that are both unobservable and significant to the overall fair value measurement. These inputs reflect management's own assumptions about the assumptions a market participant would use in pricing the asset or liability (examples include private equity investments, certain commercial mortgage whole loans and long-dated or complex derivatives, including certain foreign exchange options and long-dated options on gas and power).
As required by US GAAP, financial assets and liabilities are classified in their entirety based on the lowest level of input that is significant to the fair value measurement. As of December 31, 2010 and December 31, 2009, all of the derivative instruments held by the Trust are fair valued based on quoted prices in active markets (Level 1).
MLM INDEX™ FUND
NOTES TO FINANCIAL STATEMENTS (continued)
December 31, 2010
2. Summary of Significant Accounting Policies (continued)
Fair Value Measurements (continued)
Each Series' trading positions are valued at fair value and cash equivalents are carried at their net asset value per share including accrued interest, as applicable. All positions including the net unrealized appreciation or depreciation are included under the caption “net unrealized gain/(loss) on open futures contracts” on the statements of financial condition. Fair value is principally based on listed market prices or broker or dealer price quotations. The resulting change in unrealized profit or loss is reflected in net gain (loss) on change in unrealized appreciation/depreciation on investments on the statements of operations.
Investment Transactions and Investment Income
All securities transactions are recorded on a trade-date basis. Realized gain and loss are recorded using specific identification method. Interest income is recorded using the accrual basis of accounting.
Income Taxes
All of the Series of the Trust are classified for Federal income tax purposes as separate partnerships. Investors in each Series will reflect their proportionate share of realized profit or loss on their separate tax returns. Accordingly, no provisions for income taxes are required for the Trust or any Series.
All of the Series of the Trust recognized tax benefits or expenses of uncertain tax positions in the year, such determination is made when the positions were “more likely than not” to be sustained assuming examination by tax authorities. The Manager has reviewed all of the Series of the Trust’s tax positions for all open years (after December 31, 2006) and concluded that no provision for unrecognized tax benefits or expense is required in these financial statements. The Trust has elected an accounting policy to classify interest and penalties related to unrecognized tax benefits as interest or other expense. The 2007 through 2010 tax years generally remain subject to examination by U.S. federal and most state tax authorities.
Redemptions Payable
For purposes of both financial reporting and calculation of redemption value, Net Asset Value per unit is calculated by dividing Net Asset Value of each Series by the number of outstanding investors’ interests for that Series.
3. Cash and Cash Equivalents
The Trust’s cash and cash equivalents consisted of:
|
December 31, 2010
|
Unleveraged Series
|
Leveraged Series
|
Commodity L/N Unleveraged Series
|
Commodity L/S Unleveraged Series
|
Trust Total
|
|||||||||||||||
|
Overnight money markets
|
$ | 820,000 | $ | 231,000 | $ | 10,789,000 | $ | 570,000 | $ | 12,410,000 | ||||||||||
|
U.S. Government Agency Securities
|
44,554,919 | 24,181,209 | 28,996,480 | 9,998,786 | 107,731,394 | |||||||||||||||
|
Institutional money market accounts
|
25,603 | 30,967 | 18,420 | 6,005 | 80,995 | |||||||||||||||
|
Cash in checking accounts
|
1,198 | 1,912 | 1,118 | 1,603 | 5,831 | |||||||||||||||
|
Total
|
$ | 45,401,720 | $ | 24,445,088 | $ | 39,805,018 | $ | 10,576,394 | $ | 120,228,220 | ||||||||||
MLM INDEX™ FUND
NOTES TO FINANCIAL STATEMENTS (continued)
December 31, 2010
3. Cash and Cash Equivalents (continued)
|
December 31, 2009
|
Unleveraged Series
|
Leveraged Series
|
Commodity L/N Unleveraged Series
|
Commodity L/S Unleveraged Series
|
Trust Total
|
|||||||||||||||
|
Overnight money markets
|
$ | 1,818,000 | $ | - | $ | 7,998,000 | $ | 185,000 | $ | 10,001,000 | ||||||||||
|
U.S. Government Agency Securities
|
54,104,025 | 26,907,746 | - | - | 81,011,771 | |||||||||||||||
|
Cash in checking accounts
|
200,762 | 200,225 | 1,557 | 1,896 | 404,440 | |||||||||||||||
|
Total
|
$ | 56,122,787 | $ | 27,107,971 | $ | 7,999,557 | $ | 186,896 | $ | 91,417,211 | ||||||||||
4. Investors’ Interest
The Trust is comprised of four series: the Unleveraged Series, which attempts to replicate the Index without leverage, the Leveraged Series, which attempts to replicate the Index at three times leverage, the Commodity L/S Unleveraged Series which attempts to replicate the MLM Commodity Long/Short Index without leverage and the Commodity L/N Unleveraged Series which attempts to replicate the MLM Commodity Long/Neutral Index without leverage (collectively, the “Series”). The MLM Commodity L/S Index is a subset of the MLM Index and contains only the commodity futures contracts of the entire MLM Index. The MLM Commodity L/N Index contains the same commodity futures contracts, but does not have short positions when the MLM Index algorithm indicates a short position in a particular contract. Class A, Class B, Class C and Class D shares are sold by authorized selling agents appointed by the Manager to accredited investors at a price equal to each Class’s net asset value. Shares may be redeemed at net asset value as of the last day of any month upon at least ten business days’ written notice to the Manager. As of December 31, 2010 the Commodity L/S Leveraged Series and the Commodity L/N Leveraged Series have not commenced trading and have no assets. In addition, as of December 31, 2010, the Commodity L/S Unleveraged Series and the Commodity L/N Unleveraged Series have never had any investors in classes A, B or C.
The Manager allocates profits and losses among the investors of a Series based on the balance in each investor’s capital account.
The Class A and Class C shares are subject to a sales commission of 0% to 4% of the subscription amount, payable to the selling agent from the investor’s investment for each series. The amount of the sales commission will be determined by the selling agent.
MLM INDEX™ FUND
NOTES TO FINANCIAL STATEMENTS (continued)
December 31, 2010
5. Margin Requirements
The Trust had margin requirements as follows at December 31, 2010 and 2009:
|
2010
|
2009
|
|||||||
|
Leveraged Series
|
$ | 3,050,071 | $ | 4,002,756 | ||||
|
Unleveraged Series
|
1,907,683 | 1,345,252 | ||||||
|
Commodity L/N Unleveraged Series
|
2,904,759 | 400,160 | ||||||
|
Commodity L/S Unleveraged Series
|
866,708 | 166,420 | ||||||
|
Total
|
$ | 8,729,221 | $ | 5,914,588 | ||||
Each Series' margins requirements were satisfied by net unrealized profits and cash at the broker.
6. Management Fee and Other Fees and Expenses
Each Series pays the Manager a management fee and the introducing broker a brokerage fee as a percentage of net assets, as of the first day of each month at the annualized rates as follows:
|
Leveraged Series
|
||||||||||||||||||||||||
|
Brokerage fee
|
Management fee
|
Organizational fee
|
Operating expense
|
Selling expense
|
Total fees and commissions
|
|||||||||||||||||||
|
Class A
|
1.75 | % | 2.80 | % | N/A | * | 0.35 | % | 4.00 | % | 8.90 | % | ||||||||||||
|
Class B
|
1.75 | % | 1.30 | % | N/A | * | 0.35 | % | N/A | 3.40 | % | |||||||||||||
|
Class C
|
0.90 | % | 2.05 | % | N/A | 0.35 | % | 4.00 | % | 7.30 | % | |||||||||||||
|
Class D
|
0.90 | % | 1.30 | % | N/A | 0.35 | % | N/A | 2.55 | % | ||||||||||||||
*effective January 1, 2010
|
Unleveraged, Commodity L/S Unleveraged Series, and Commodity L/N Unleveraged Series
|
||||||||||||||||||||||||
|
Brokerage fee
|
Management fee
|
Organizational fee
|
Operating expense
|
Selling Expense
|
Total fees and commissions
|
|||||||||||||||||||
|
Class A
|
0.85 | % | 1.50 | % | 0.50 | % | 0.35 | % | 4.00 | % | 7.20 | % | ||||||||||||
|
Class B
|
0.85 | % | 0.50 | % | 0.50 | % | 0.35 | % | N/A | 2.20 | % | |||||||||||||
|
Class C
|
0.40 | % | 1.00 | % | N/A | 0.35 | % | 4.00 | % | 5.75 | % | |||||||||||||
|
Class D
|
0.40 | % | 0.50 | % | N/A | 0.35 | % | N/A | 1.25 | % | ||||||||||||||
Each Series pays 0.35% of average net assets for the Trust’s legal, accounting, auditing and other operating expenses and fees. The Trust also pays the cash manager and banking fees directly.
MLM INDEX™ FUND
NOTES TO FINANCIAL STATEMENTS (continued)
December 31, 2010
7. Derivative Financial Instruments
Derivatives are subject to various risks similar to non-derivative financial instruments including market, credit, liquidity and operational risk. The risks of derivatives should not be viewed in isolation but rather should be considered on an aggregate basis along with the Trust’s other trading-related activities.
Each Series purchases and sells futures in financial instruments and commodities. Each Series records its derivative activities on a mark-to-market basis with realized and unrealized gains (losses) recognized currently in the statements of operations and in due from brokers on the statements of financial condition.
The following tables reflect the fair value of each Series derivative financial instruments at December 31, 2010 and 2009:
|
2010
|
2009
|
|||||||||||||||
|
Unleveraged Series
|
Asset
|
Liability
|
Asset
|
Liability
|
||||||||||||
|
Financial futures
|
$ | 380,310 | $ | (285,131 | ) | $ | 46,862 | $ | (575,633 | ) | ||||||
|
Commodity futures
|
1,545,069 | (123,330 | ) | 354,371 | (141,400 | ) | ||||||||||
|
Total
|
$ | 1,925,379 | $ | (408,461 | ) | $ | 401,233 | $ | (717,033 | ) | ||||||
|
2010
|
2009
|
|||||||||||||||
|
Leveraged Series
|
Asset
|
Liability
|
Asset
|
Liability
|
||||||||||||
|
Financial futures
|
$ | 785,841 | $ | (557,681 | ) | $ | 140,242 | $ | (1,724,601 | ) | ||||||
|
Commodity futures
|
3,183,563 | (255,480 | ) | 1,039,501 | (431,706 | ) | ||||||||||
|
Total
|
$ | 3,969,404 | $ | (813,161 | ) | $ | 1,179,743 | $ | (2,156,307 | ) | ||||||
|
2010
|
2009
|
|||||||||||||||
|
Commodity L/S Unleveraged Series
|
Asset
|
Liability
|
Asset
|
Liability
|
||||||||||||
|
Commodity futures
|
$ | 1,658,684 | $ | (132,460 | ) | $ | 100,573 | $ | (43,530 | ) | ||||||
|
Total
|
$ | 1,658,684 | $ | (132,460 | ) | $ | 100,573 | $ | (43,530 | ) | ||||||
|
2010
|
2009
|
|||||||||||||||
|
Commodity L/N Unleveraged Series
|
Asset
|
Liability
|
Asset
|
Liability
|
||||||||||||
|
Commodity futures
|
$ | 5,506,195 | $ | - | $ | 131,873 | $ | (31,040 | ) | |||||||
|
Total
|
$ | 5,506,195 | $ | - | 131,873 | $ | (31,040 | ) | ||||||||
|
2010
|
2009
|
|||||||||||||||
|
Trust Total
|
Asset
|
Liability
|
Asset
|
Liability
|
||||||||||||
|
Financial futures
|
$ | 1,166,151 | $ | (842,812 | ) | $ | 187,104 | $ | (2,300,234 | ) | ||||||
|
Commodity futures
|
11,893,511 | (511,270 | ) | 1,626,318 | (647,676 | ) | ||||||||||
|
Total
|
$ | 13,059,662 | $ | (1,354,082 | ) | $ | 1,813,422 | $ | (2,947,910 | ) | ||||||
MLM INDEX™ FUND
NOTES TO FINANCIAL STATEMENTS (continued)
December 31, 2010
|
2010
|
2009
|
|||||||||||||||||||||||
|
Unleveraged Series
|
Realized
|
Unrealized
|
Total
|
Realized
|
Unrealized
|
Total
|
||||||||||||||||||
|
Financial futures
|
$ | 129,470 | $ | 623,642 | $ | 753,112 | $ | 421,442 | $ | (1,408,757 | ) | $ | (987,315 | ) | ||||||||||
|
Commodity futures
|
(169,211 | ) | 1,208,808 | 1,039,597 | (97,219 | ) | (1,140,121 | ) | (1,237,340 | ) | ||||||||||||||
|
Total
|
$ | (39,741 | ) | $ | 1,832,450 | $ | 1,792,709 | $ | 324,223 | $ | (2,548,878 | ) | $ | (2,224,655 | ) | |||||||||
|
2010
|
2009
|
|||||||||||||||||||||||
|
Leveraged Series
|
Realized
|
Unrealized
|
Total
|
Realized
|
Unrealized
|
Total
|
||||||||||||||||||
|
Financial futures
|
$ | 350,630 | $ | 1,812,827 | $ | 2,163,457 | $ | 1,142,207 | $ | (3,250,835 | ) | $ | (2,108,628 | ) | ||||||||||
|
Commodity futures
|
(1,135,721 | ) | 2,320,252 | 1,184,531 | (944,640 | ) | (1,682,127 | ) | (2,626,767 | ) | ||||||||||||||
|
Total
|
$ | (785,091 | ) | $ | 4,133,079 | $ | 3,347,988 | $ | 197,567 | $ | (4,932,962 | ) | $ | (4,735,395 | ) | |||||||||
|
2010
|
2009
|
|||||||||||||||||||||||
|
Commodity L/S Unleveraged Series
|
Realized
|
Unrealized
|
Total
|
Realized
|
Unrealized
|
Total
|
||||||||||||||||||
|
Commodity futures
|
$ | (1,172,228 | ) | $ | 1,469,181 | $ | 296,953 | $ | 4,594 | $ | 57,043 | $ | 61,637 | |||||||||||
|
Total
|
$ | (1,172,228 | ) | $ | 1,469,181 | $ | 296,953 | $ | 4,594 | $ | 57,043 | $ | 61,637 | |||||||||||
|
2010
|
2009
|
|||||||||||||||||||||||
|
Commodity L/N
|
Realized
|
Unrealized
|
Total
|
Realized
|
Unrealized
|
Total
|
||||||||||||||||||
|
Unleveraged Series Commodity futures
|
$ | 631,617 | $ | 5,405,362 | $ | 6,036,979 | $ | 205,095 | $ | 100,833 | $ | 305,928 | ||||||||||||
|
Total
|
$ | 631,617 | $ | 5,405,362 | $ | 6,036,979 | $ | 208,095 | $ | 100,833 | $ | 305,928 | ||||||||||||
|
2010
|
2009
|
|||||||||||||||||||||||
|
Trust Total
|
Realized
|
Unrealized
|
Total
|
Realized
|
Unrealized
|
Total
|
||||||||||||||||||
|
Financial futures
|
$ | 480,100 | $ | 2,436,469 | $ | 2,916,569 | $ | 1,563,649 | $ | (4,659,592 | ) | $ | (3,095,943 | ) | ||||||||||
|
Commodity futures
|
(1,845,543 | ) | 10,403,603 | 8,558,060 | (832,170 | ) | (2,665,372 | ) | (3,497,542 | ) | ||||||||||||||
|
Total
|
$ | (1,365,443 | ) | $ | 12,840,072 | $ | 11,474,629 | $ | 731,479 | $ | (7,324,964 | ) | $ | (6,593,485 | ) | |||||||||
MLM INDEX™ FUND
NOTES TO FINANCIAL STATEMENTS
December 31, 2010 and 2009
8. Financial Highlights
The following represents the per share operating performance ratios to average investors’ interest and other supplemental information for the year ended December 31, 2010:
|
Leveraged Series
|
Unleveraged Series
|
Commodity L/S Unleveraged Series
|
Commodity L/N Unleveraged Series
|
|||||||||||||||||||||||||||||||||||||
|
Class A
shares
|
Class B
shares
|
Class C
shares
|
Class D
shares
|
Class A
shares
|
Class B
shares
|
Class C
shares
|
Class D
shares
|
Class D
shares
|
Class D
shares
|
|||||||||||||||||||||||||||||||
|
Per share operating performance
|
||||||||||||||||||||||||||||||||||||||||
|
Net asset value per share, December 31, 2009
|
$ | 90.73 | $ | 105.53 | $ | 86.24 | $ | 107.20 | $ | 113.28 | $ | 126.32 | $ | 110.99 | $ | 113.35 | $ | 108.17 | $ | 102.00 | ||||||||||||||||||||
|
Income (loss) from investment operations
|
||||||||||||||||||||||||||||||||||||||||
|
Net investment income (loss)
|
(2.90 | ) | (1.81 | ) | (2.12 | ) | (1.84 | ) | (2.15 | ) | (1.15 | ) | (1.56 | ) | (1.03 | ) | (0.91 | ) | (0.84 | ) | ||||||||||||||||||||
|
Net realized and unrealized gain (loss) on investment transactions
|
7.17 | 8.45 | 7.63 | 9.55 | 2.78 | 3.14 | 3.24 | 3.33 | 5.27 | 11.01 | ||||||||||||||||||||||||||||||
|
Total from investment operations
|
4.27 | 6.64 | 5.51 | 7.71 | 0.63 | 1.99 | 1.68 | 2.30 | 4.36 | 10.17 | ||||||||||||||||||||||||||||||
|
Net asset value per share, December 31, 2010
|
$ | 95.00 | $ | 112.17 | $ | 91.75 | $ | 114.91 | $ | 113.91 | $ | 128.31 | $ | 112.67 | $ | 115.65 | $ | 112.53 | $ | 112.17 | ||||||||||||||||||||
|
Total return
|
4.71 | % | 6.29 | % | 6.39 | % | 7.19 | % | 0.56 | % | 1.57 | % | 1.52 | % | 2.03 | % | 4.03 | % | 9.96 | % | ||||||||||||||||||||
|
Ratio to average net assets
|
||||||||||||||||||||||||||||||||||||||||
|
Net investment income (loss)
|
(3.21 | )% | (1.71 | )% | (2.46 | )% | (1.71 | )% | (1.91 | )% | (0.91 | )% | (1.41 | )% | (0.91 | )% | (0.86 | )% | (0.85 | )% | ||||||||||||||||||||
|
Expenses
|
(3.27 | )% | (1.77 | )% | (2.52 | )% | (1.77 | )% | (2 | )% | (1 | )% | (1.51 | )% | (1.01 | )% | (0.90 | )% | (0.91 | )% | ||||||||||||||||||||
Total return is calculated as the change in the net asset value per share for the year. The per share operating performance and ratios are computed based upon the weighted-average shares outstanding and weighted-average investors’ interest, respectively, for each class, for the year ended December 31, 2010. An individual investor’s return may vary from the above based upon the timing of capital transactions.
MLM INDEX™ FUND
NOTES TO FINANCIAL STATEMENTS
December 31, 2010 and 2009
8. Financial Highlights (continued)
The following represents the per share operating performance ratios to average investors’ interest and other supplemental information for the year ended December 31, 2009, or if shorter, the period since inception:
|
Leveraged Series
|
Unleveraged Series
|
Commodity L/S
Unleveraged Series
|
Commodity
L/N Unleveraged Series
|
|||||||||||||||||||||||||||||||||||||
|
Class A
shares
|
Class B
shares
|
Class C
shares
|
Class D
shares
|
Class A
shares
|
Class B
shares
|
Class C
shares
|
Class D
shares
|
Class D
shares
|
Class D*
shares
|
|||||||||||||||||||||||||||||||
|
Per share operating performance
|
||||||||||||||||||||||||||||||||||||||||
|
Net asset value per share, December 31, 2008, or at inception
|
$ | 105.12 | $ | 120.43 | $ | 98.31 | $ | 121.29 | $ | 119.60 | $ | 132.04 | $ | 116.06 | $ | 117.94 | $ | 100.00 | $ | 100.00 | ||||||||||||||||||||
|
Income (loss) from investment operations
|
||||||||||||||||||||||||||||||||||||||||
|
Net investment income (loss)
|
(3.10 | ) | (1.93 | ) | (2.25 | ) | (1.96 | ) | (2.18 | ) | (1.14 | ) | (1.55 | ) | (1.01 | ) | (0.41 | ) | (0.07 | ) | ||||||||||||||||||||
|
Net realized and unrealized gain (loss) on investment transactions
|
(11.29 | ) | (12.97 | ) | (9.82 | ) | (12.13 | ) | (4.14 | ) | (4.58 | ) | (3.52 | ) | (3.58 | ) | 8.58 | 2.07 | ||||||||||||||||||||||
|
Total from investment operations
|
(14.39 | ) | (14.90 | ) | (12.07 | ) | (14.09 | ) | (6.32 | ) | (5.72 | ) | (5.07 | ) | (4.59 | ) | 8.17 | 2.00 | ||||||||||||||||||||||
|
Net asset value per share, December 31, 2009
|
$ | 90.73 | $ | 105.53 | $ | 86.24 | $ | 107.20 | $ | 113.28 | $ | 126.32 | $ | 110.99 | $ | 113.35 | $ | 108.17 | $ | 102.00 | ||||||||||||||||||||
|
Total return
|
(13.69 | )% | (12.37 | )% | (12.28 | )% | (11.61 | )% | (5.28 | )% | (4.33 | )% | (4.37 | )% | (3.89 | )% | 8.17 | % | 2.00 | % | ||||||||||||||||||||
|
Ratio to average net assets
|
||||||||||||||||||||||||||||||||||||||||
|
Net investment income (loss)
|
(3.25 | )% | (1.75 | )% | (2.51 | )% | (1.76 | )% | (1.88 | )% | (0.88 | )% | (1.38 | )% | (0.88 | )% | (0.39 | )% | (0.05 | )% | ||||||||||||||||||||
|
Expenses
|
(3.36 | )% | (1.81 | )% | (2.61 | )% | (1.86 | )% | (2.03 | )% | (1.03 | )% | (1.53 | )% | (1.03 | )% | (0.39 | )% | (0.05 | )% | ||||||||||||||||||||
Total return is calculated as the change in the net asset value per share for the year. The per share operating performance and ratios are computed based upon the weighted-average shares outstanding and weighted-average investors’ interest, respectively, for each class, for the year ended December 31, 2009, or if shorter, the period since inception. An individual investor’s return may vary from the above based upon the timing of capital transactions.
*Total return and ratios not annualized.
MLM INDEX™ FUND
NOTES TO FINANCIAL STATEMENTS
December 31, 2010 and 2009
10. Subsequent Events
From January 1, 2011 through March 14, 2011, the Trust had subscriptions of $103,283, $12,785,982, $25,019,824 and $2,000,000 for the Leveraged Series, Unleveraged Series, Commodity L/S Unleveraged Series and Commodity L/N Unleveraged Series respectively.
The Trust had redemptions of $482,111, and $25,282,177 for the Leveraged and Unleveraged Series respectively.
$24,639,940 of the redemptions in the Unleveraged Series and $24,639,940 of the additions in the Commodity L/S Unleveraged Series were the result of an investor exchanging interests in the Unleveraged Series for interests in the Commodity L/S Unleveraged Series.
F 52
(b) Exhibits
|
Exhibit Number
|
Item Description
|
|
|
3.1
|
Restated Certificate of Trust for MLM Index™ Trust, filed 1/14/98 (Filed as Exhibit 3.1 to the Registrant's Form 10-K and incorporated by reference herein.)
|
|
|
3.2
|
Amended and Restated Declaration of Trust and Trust Agreement of MLM Index™ Fund (Filed as Exhibit 3.2 to the Registrant's Form 10-K and incorporated by reference herein).
|
|
|
3.3
|
Amendment Nos. 1 to 6 the Amended and Restated Declaration of Trust and Trust Agreement of MLM Index™ Fund (Filed as Exhibit 3.3 to the Registrant's Form 10-K and incorporated by reference herein).
|
|
|
14.1
|
Code of Ethics (Filed as Exhibit 14.1 to the Registrant's Form 10-K and incorporated by reference herein)..
|
|
|
Certification of President of the Manager Pursuant to Rule 13A-15(e) and Rule 15D-15(e), of the Securities Exchange Act.
|
||
|
Certification of Vice President and Chief Operating Officer of the Manager Pursuant to Rule 13A-15(e) and Rule 15D-15(e), of the Securities Exchange Act.
|
||
|
Certification of President of the Manager Pursuant to 18 U.S.C. Section 1350, as adopted Pursuant to Section 906 of the Sarbanes-Oxley Act of 2002
|
||
|
Certification of Vice President and Chief Operating Officer of the Manager Pursuant to 18 U.S.C. Section 1350, as adopted Pursuant to Section 906 of the Sarbanes-Oxley Act of 2002
|
SIGNATURES
Pursuant to the requirements of Section 13 or 15(d) of the Securities Exchange Act of 1934, the MLM Index Fund , the MLM Index Unleveraged Series, the MLM Index Leveraged Series, the MLM Commodity L/N Index Unleveraged Series and the MLM Commodity L/S Index Unleveraged Series has duly caused this report to be signed on its behalf by the undersigned, thereunto duly authorized.
Date: March 22, 2011
MLM INDEX™ FUND
MLM INDEX UNLEVERAGED SERIES
MLM INDEX LEVERAGED SERIES
MLM COMMODITY L/N INDEX UNLEVERAGED SERIES
MLM COMMODITY L/S INDEX UNLEVERAGED SERIES
By: /s/ Timothy J. Rudderow
Timothy J. Rudderow, President
Mount Lucas Management Corporation
Manager
39