Attached files
| file | filename |
|---|---|
| 8-K - FORM 8-K - Discover Financial Services | d8k.htm |
 2011
Financial Community Briefing March 23, 2011
Exhibit 99.1 |
 2
Notice
The following slides are part of a presentation by Discover Financial Services (the
"Company") and are intended to be viewed as part of that
presentation. No representation is made that the information in these slides
is complete. The information provided herein may include certain
non-GAAP financial measures. The reconciliations of such
measures
to
the
comparable
GAAP
figures
are
included
in
the
Company’s
Annual
Report
on
Form
10-K
for the year ended November 30, 2010 and the Company’s Current Report on Form
8-K dated March 22, 2011, each of which are on file with the SEC and
available on the Company’s website at www.discoverfinancial.com. Certain reconciliations are also included at the end of this presentation.
The presentation contains forward-looking statements. You are cautioned not to
place undue reliance on forward-looking statements, which speak only as
of the date on which they are made, which reflect management’s
estimates, projections, expectations or beliefs at that time and which are subject to risks and
uncertainties that may cause actual results to differ materially. For a discussion
of certain risks and uncertainties
that
may
affect
the
future
results
of
the
Company,
please
see
"Special
Note
Regarding
Forward-
Looking
Statements,"
"Risk
Factors,"
"Business
–
Competition,"
"Business
–
Supervision
and
Regulation"
and
"Management’s Discussion and Analysis of Financial Condition and Results
of Operations" in the Company’s Annual Report on Form 10-K for
the year ended November 30, 2010, which is on file with the SEC.
Certain historical financial information about the Company that we have included in
this presentation has been derived from Morgan Stanley’s consolidated
financial statements and does not necessarily reflect what our financial
condition, results of operations or cash flows would have been had we operated as a separate,
stand-alone company during the periods presented.
We own or have rights to use the trademarks, trade names and service marks that we
use in conjunction with the
operation
of
our
business,
including,
but
not
limited
to:
Discover
®
,
PULSE
®
,
Cashback
Bonus
®
,
Discover
®
Network
and
Diners
Club
International
®
.
All
other
trademarks,
trade
names
and
service
marks
included
in
this
presentation are the property of their respective owners.
|
 3
Roger Hochschild
PRESIDENT & CHIEF OPERATING OFFICER
Carlos Minetti
PRESIDENT CONSUMER BANKING & OPERATIONS
Harit Talwar
PRESIDENT U.S. CARDS
Diane Offereins
PRESIDENT PAYMENT SERVICES
Exploiting the payments
opportunity
Diversifying into higher growth
asset classes
Driving profitable card growth
2010 Accomplishments &
2011 Priorities
Delivering shareholder value
through strong financial performance
Roy Guthrie
CHIEF FINANCIAL OFFICER
Q&A
Agenda
David Nelms
CHAIRMAN & CHIEF EXECUTIVE OFFICER
Using our Direct Banking & Payments
assets to deliver profitable growth |
 2011
Financial Community Briefing David Nelms
Chairman &
Chief Executive Officer
Using our Direct Banking and Payments assets to deliver profitable growth
CONSUMER
CONSUMER
DEPOSITS
DEPOSITS
DISCOVER
DISCOVER
CARD
CARD
CONSUMER
CONSUMER
LOANS
LOANS
PULSE
PULSE
DEBIT
DEBIT
NETWORK
NETWORK
DINERS
DINERS
CLUB
CLUB
INTERNATIONAL
INTERNATIONAL
DISCOVER
DISCOVER
NETWORK
NETWORK |
 5
Strong results in Direct Banking and Payments
•
Card business generating strong profitability
–
Credit trends provide flexibility to invest for growth
–
Expect modest Card receivable growth in 2H 2011
•
Have continued to diversify our portfolio with the acquisition of The
Student Loan Corporation
–
Other consumer lending receivables are now ~15% of total receivables
–
Leveraging unsecured lending and marketing capabilities to drive
more
rapid asset growth at attractive returns
•
Focused on increasing acceptance globally and exploiting opportunities
in debit and mobile
–
Targeting Payment Services long-term profit growth of 15-20% with 10%+
volume CAGR
•
We continue to generate excess capital and are one of the first financial
services companies to restore the dividend
–
Fully restored quarterly dividend to $0.06 |
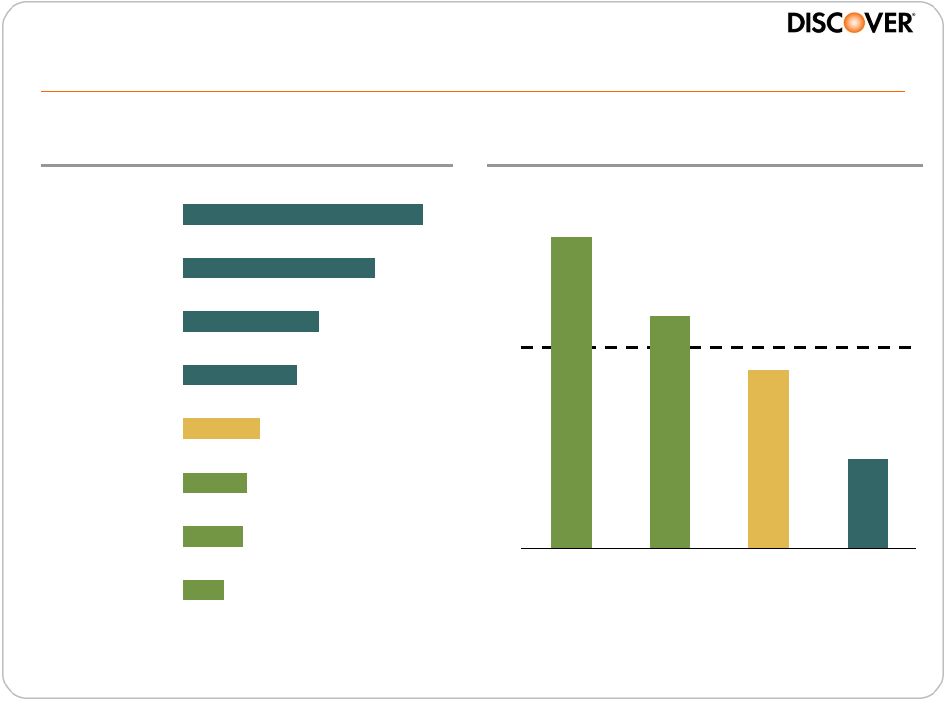
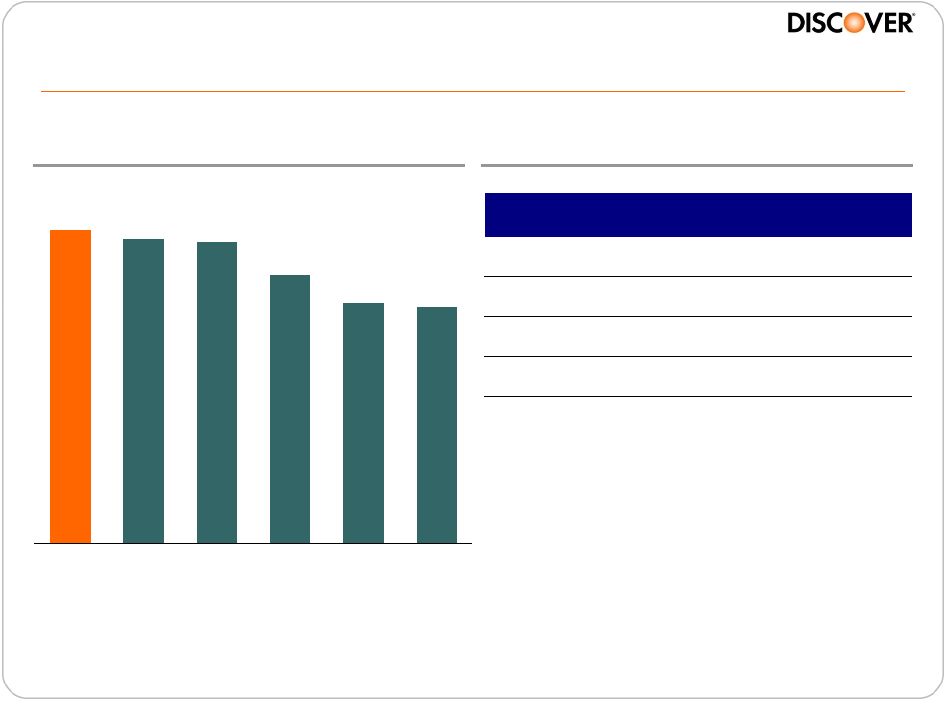
 6
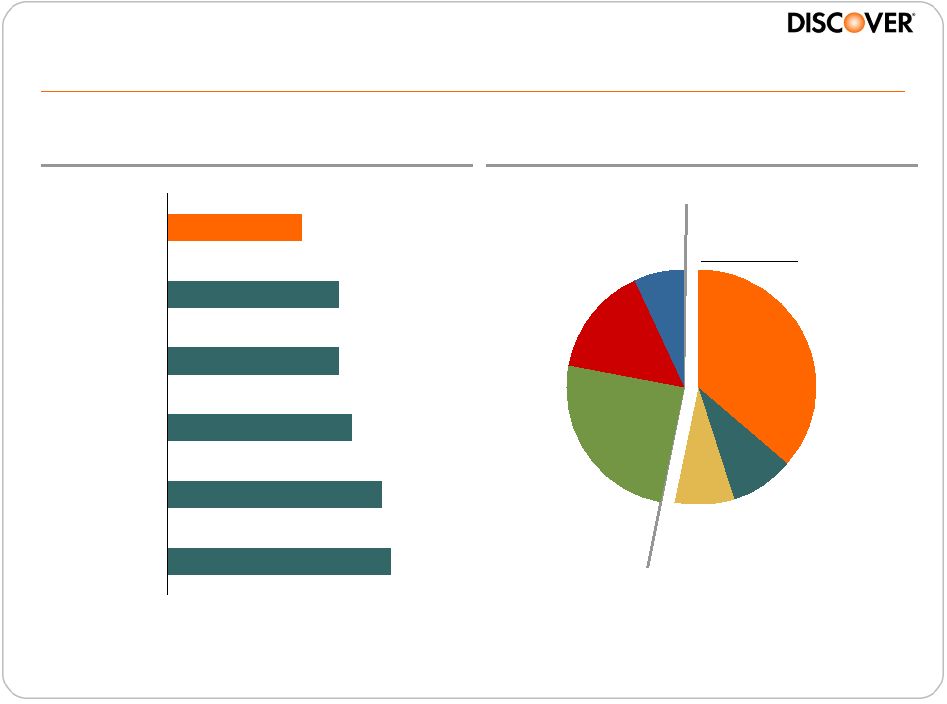
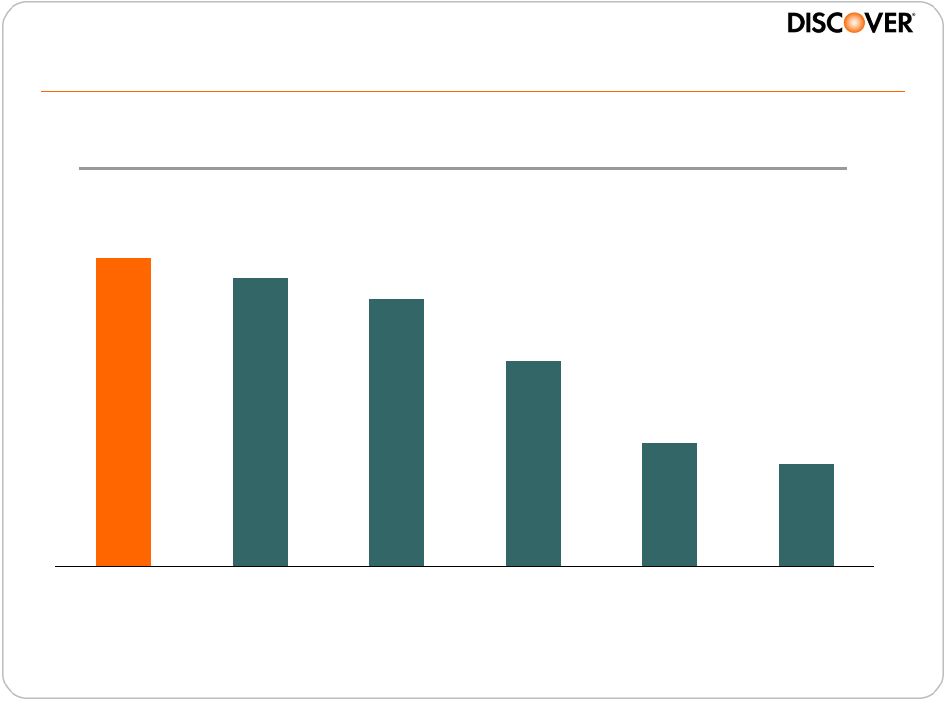
Preferred Banking Channel (%)
Source
American Bankers Association Survey 2010
95%
82%
76%
76%
59%
99%
Citi
BofA
Amex
JPMorgan
CapOne
DFS
2 Yr Avg. Risk Adjusted
Efficiency Ratio
(1)
(%)
Source
SNL, Regulatory Reports FY2010 & FY2009
Note(s)
1.
Non-interest expense divided by net revenue less provisions
2.
Excludes one-time special items per Bank of America presentation dated
3/9/11 Direct banking is efficient & aligns with consumer preference
(2)
Direct
Channels
Internet
36%
Mail
8%
Branch
25%
ATM
15%
NA
7%
Phone /
Mobile
9% |
 7
•
Discover Network
–
Growth in merchant acceptance
and partnerships
–
Mobile and alternative payment
opportunities
provide
longer-term potential
•
PULSE
–
Continue rapid volume and
profit growth
–
Regulatory changes may create
opportunity for share gain
•
Diners Club
–
Improve competitive position in
key markets
–
Drive growth from network deals
with JCB, BC Card, etc.
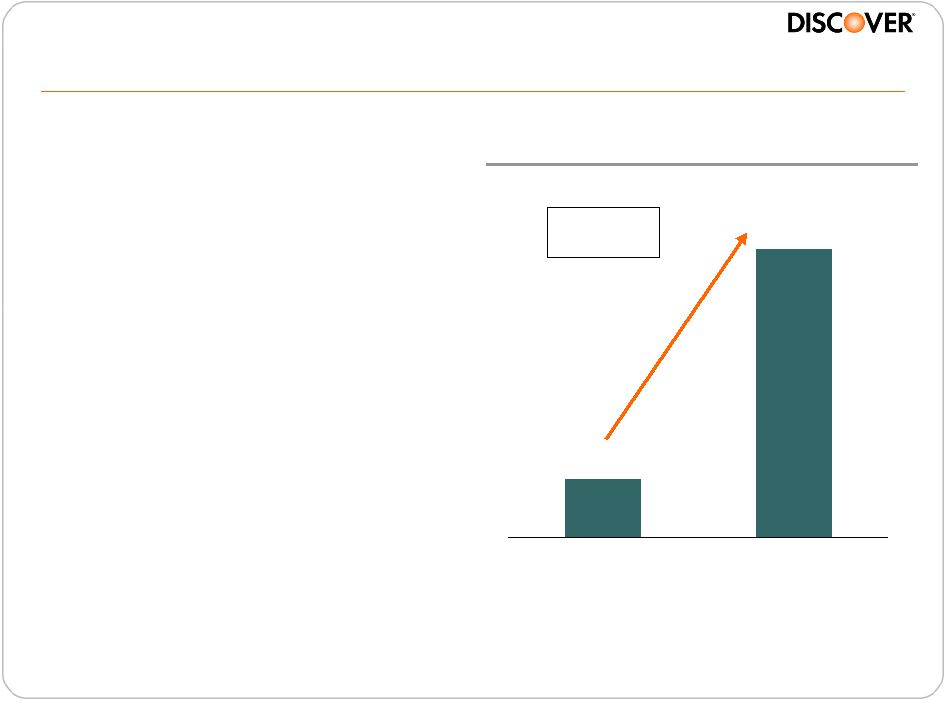
Unique payments assets are growing rapidly
$29
$141
2006
2010
Payment Services
Pre-Tax Profits (MM)
2006 –
2010
CAGR: 48% |
  8
Profitable long-term growth model
Asset Growth
EPS Growth /
Contribution
Card
2 - 4%
3 - 4%
Other Consumer Lending
20 - 25%
3 - 4%
Payments
NA
2%+/-
Organic Growth
5 - 6%
8 - 10%
Capital Management /
Acquisitions
0 - 4%
2 - 5%
Total Growth
5 - 10%
10 - 15%
Targets:
TCE / TA
(1)
~8%
ROE
15% +
Note(s)
1.
Defined as tangible common equity to tangible assets |
 2010
Accomplishments & 2011 Priorities Roger Hochschild
President &
Chief Operating Officer
CONSUMER
CONSUMER
DEPOSITS
DEPOSITS
DISCOVER
DISCOVER
CARD
CARD
CONSUMER
CONSUMER
LOANS
LOANS
PULSE
PULSE
DEBIT
DEBIT
NETWORK
NETWORK
DINERS
DINERS
CLUB
CLUB
INTERNATIONAL
INTERNATIONAL
DISCOVER
DISCOVER
NETWORK
NETWORK |
 10
•
Record year for Discover card sales volume
–
$92.5 billion with growth of 6% YOY
•
Announced acquisition of The Student Loan Corporation
–
~$4 billion in private student loans
(1)
•
Continued success in direct-to-consumer (DTC) deposit funding
–
64% increase in DTC deposits to $20Bn+
•
Increased merchant acceptance
–
8% increase in net active merchant outlets
•
Improved credit performance
–
185bps decrease in net charge-offs from 4Q09 to 4Q10
•
Strong year of profits
–
$765 million net income with ROE 15%+ for 2Q10 to 4Q10
•
Focused on capital / liquidity / funding
–
10% tangible common equity / tangible assets
(2)
2010 –
another year of significant accomplishments
Note(s)
1.
$3.1 billion after purchase accounting on 12/31/10
2.
See appendix for reconciliation
|
 11
Superior risk management drives credit outperformance
Note(s)
1.
Discover data based on calendar year; adjusted for FAS 166/167 for periods prior to
1Q10 2.
Includes JPM Chase (Card Services), Citi (Branded Card NA), American Express (U.S.
Card), Capital One (U.S. Card) and Bank of America (U.S. Card)
Credit Card
Net Charge-Off Rate (%)
4%
5%
6%
7%
8%
9%
10%
11%
1Q08
3Q08
1Q09
3Q09
1Q10
3Q10
Discover
Peer Avg
(1)
4Q10
•
Disciplined approach
–
Continuous investment in
analytics / data sources
–
Strong credit performance and
well positioned portfolio
•
Using card capabilities to drive
growth
–
Viable cross-sell opportunities
to existing card customers
–
Judgmental underwriting with
analysis of cash flows
(2) |
 12
2011 Performance Priorities
Card
•
Return to growth by gaining wallet
share and increasing new accounts
•
Expand merchant acceptance and
marketing partnerships to drive sales
Payments
•
Capture opportunities from
changing debit market
•
Leverage strategic partnerships to
build global network
Student & Personal Loans
•
Integrate SLC & build upon profitable
position in private student lending
•
Continue to generate strong returns
in personal loans and expand into
new categories
Savings
•
Leverage retail deposit channel to
provide liquidity and optimize
funding cost
•
Expand affinity business and suite
of banking products |
 Harit Talwar
President, U.S. Cards
Driving profitable card growth
CONSUMER
CONSUMER
DEPOSITS
DEPOSITS
DISCOVER
DISCOVER
CARD
CARD
CONSUMER
CONSUMER
LOANS
LOANS
PULSE
PULSE
DEBIT
DEBIT
NETWORK
NETWORK
DINERS
DINERS
CLUB
CLUB
INTERNATIONAL
INTERNATIONAL
DISCOVER
DISCOVER
NETWORK
NETWORK |
 14
Well positioned for profitable growth
•
Our business is positioned to generate a pre-tax ROA of 2.5%+ and an ROE
of 15%+ on a sustainable basis
•
Increasing usage and wallet share with existing customers, leveraging:
–
Brand leadership in Rewards, Service and Value
–
Unique partnerships with leading merchants
–
New programs and acceptance expansion
–
Increased brand presence
•
Strong growth in new accounts
•
Outperforming the industry over the last two years:
Discover
(1)
Peer Avg
(2)
Sales
2%
(11%)
Receivables
(9%)
(23%)
•
Continued momentum
–
1Q11: Sales 7% and receivables (3%)
Note(s)
1.
Calendar year; data prior to 2010 adjusted for FAS 166/167
2.
Includes AXP, BAC, C, COF, and JPM
Source
Internal data, public company filings and The Nilson Report (Nilson)
|
 15
Delivering robust revenue margin through the cycle
Restrictions on re-pricing / fees
Interest charge-offs
Pricing actions
Lower promotional receivables
–
–
+
+
Restrictions on re-pricing / fees
Higher promotional receivables
Spend margin
Interest charge-offs
–
–
+
+
Post CARD Act /
Economic Cycle
CARD Act /
Economic Cycle Impact |
 16
Note(s)
1.
Discover fiscal 2008
52%
66%
75%
27%
22%
10%
21%
12%
15%
Pre-CARD Act
1Q 11
Normalized
Promotional
Standard
Default / Cash
Modified the business model to reduce reliance
on promotional balances
(1) |
 17
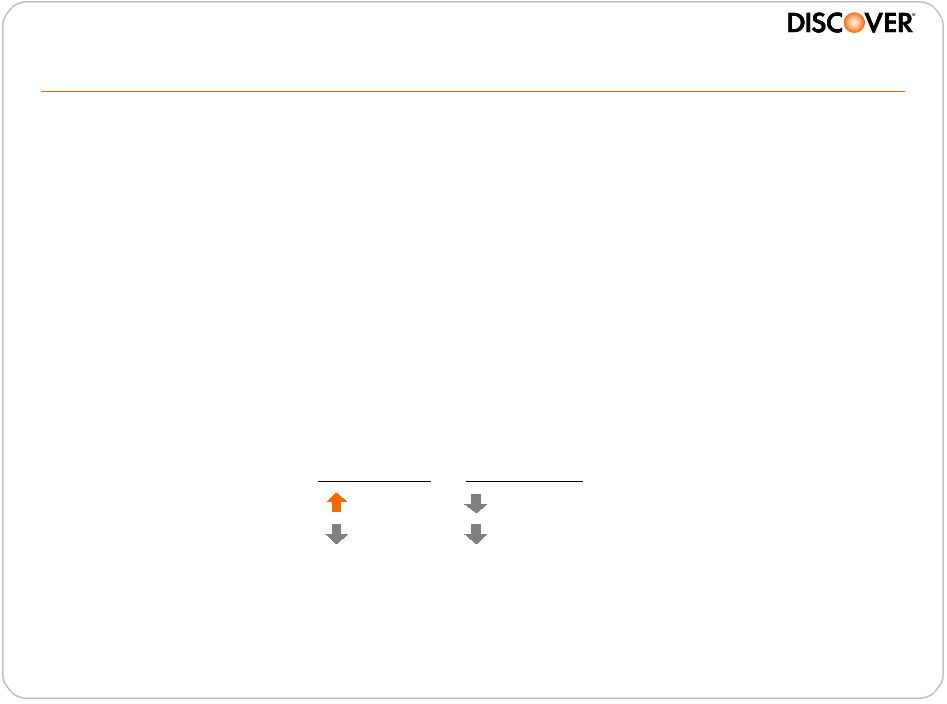
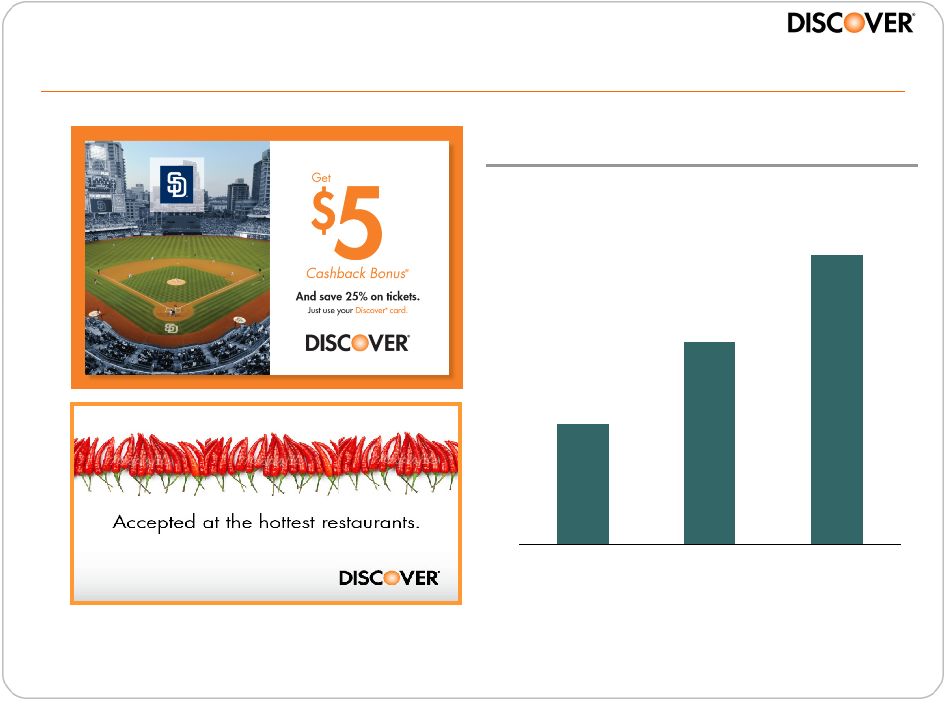
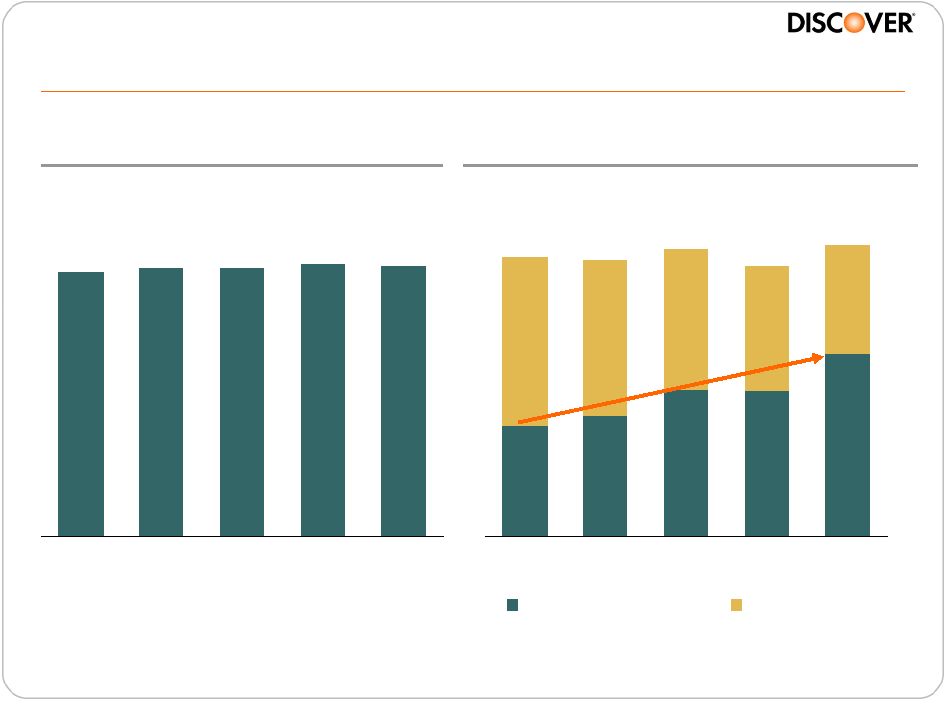
Attractive opportunity for growth with existing customers
Discover
Discover
Off-Us
Off-Us
On-Us
On-Us
Sales
Loans
Note(s)
Loans / Sales –
Credit bureau data and internal modeling
On-Us represents activity with Discover Card; Off-Us represents activity by
Discover Cardmembers with other competitors |
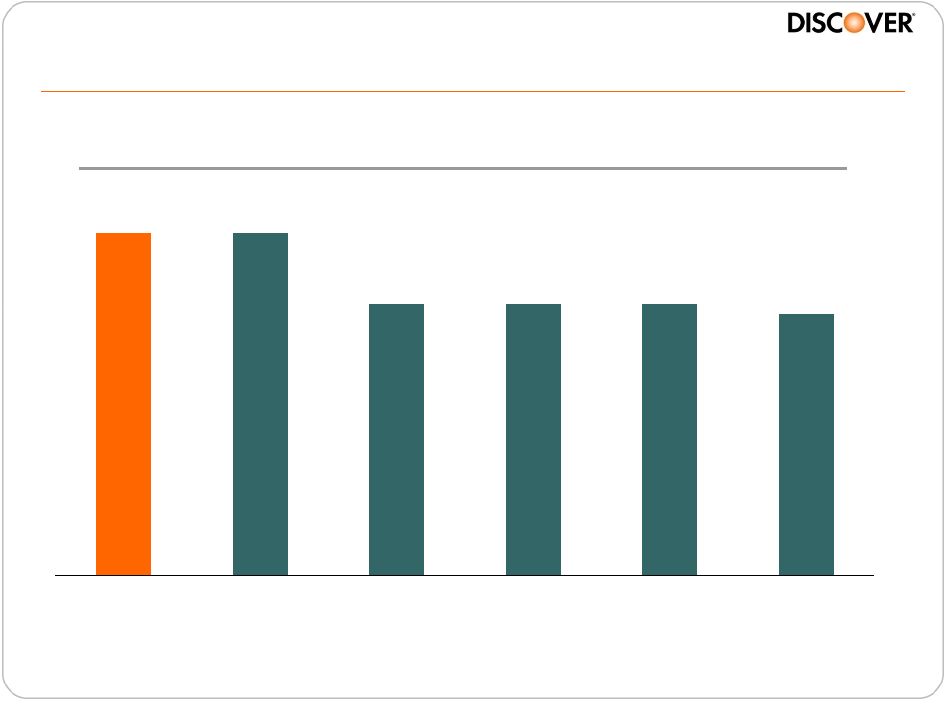 18
79%
79%
72%
72%
72%
71%
DFS
AXP
JPM
C
BAC
COF
Source
4Q 2010 Brand Tracker study, Millward Brown
Brand resonating strongly with customers
Recommend to a Friend
(1)
1.
% of survey participants who strongly / somewhat agree with the statement “I would recommend to a
friend”; among cardholders who say they use that brand’s card most often to make
purchases
Note(s) |
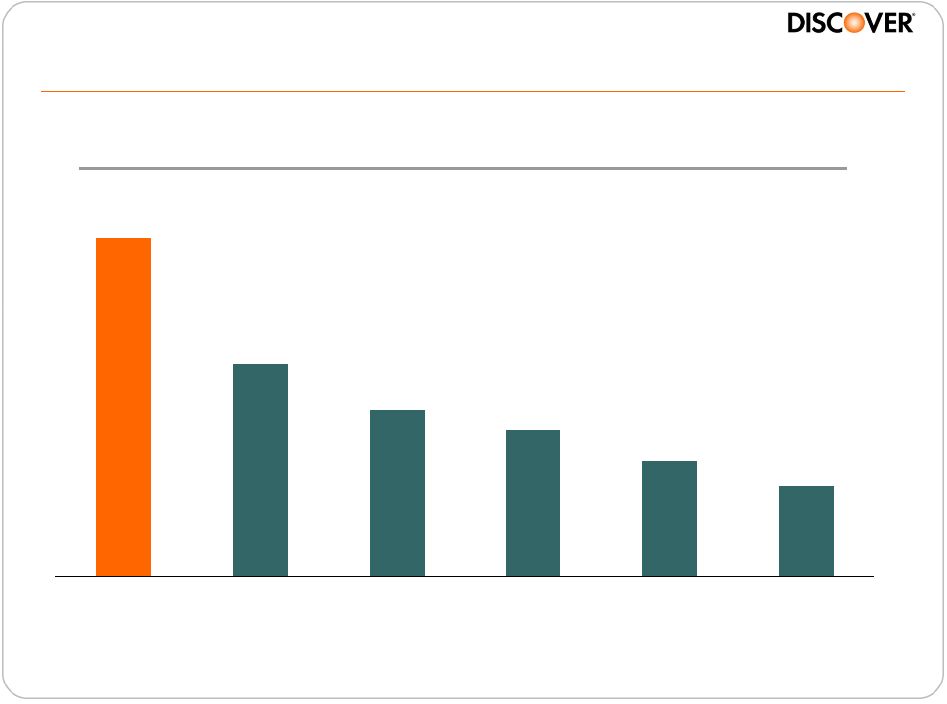 19
Sustained rewards leadership
67%
42%
33%
29%
23%
18%
DFS
JPM
AXP
C
COF
BAC
Best Cash Rewards
(1)
Source
4Q 2010 Brand Tracker study, Millward Brown
Note(s)
1.
% of unaided cardmembers who identify the brand with the statement “best cash
rewards”; among cardholders who say they use that brand’s card most often to make purchases |
 20
Rewards programs driving record levels of
customer engagement
14
18
23
2008
2009
2010
Enrollments (MM) |
 21
Merchant programs delivering value to customers
Note(s)
Internal data; Value to Customers reflects the extra rewards/discounts received by
customers from merchants on Discover offers 13%
Value to
Customers
Merchant Partners
$ 100MM
300+
24%
YOY |
 22
Acceptance and marketing programs driving usage and sales
Note(s)
1.
Estimation based upon previously non-accepting and accelerated sign-up of
new merchants
Sales Impact ($Bn)
(1)
$3.4
$2.4
$1.4
2008
2009
2010 |
 23
280MM+ opportunities to deliver great customer experience
J.D. Power
Customer Satisfaction Score
769
757
711
699
699
692
AXP
DFS
JPM
BAC
COF
C
Source
J.D. Power and Associates, 2010 Credit Card Satisfaction Study
33MM Conversations
250MM Interactions
Note(s)
Overall score is a composite of six weighted factors including interaction,
billing and payment process, credit card terms, rewards, benefits and
services, and problem resolution. Total possible score = 1000
|
 24
Strong analytics and risk management identifying
growth opportunities
Integrated account lifecycle
management
Investment in judgmental underwriting
Customer insight driving offers
Enhanced balance transfer
functionality
Control
Test
Control
Test
45%
30%
Customer Response Rate
Balance Transfer Volume
Case Study:
Balance Transfer Functionality
Note(s)
Control population mailed standard offer. Test population mailed alternative
offer. Test conducted in 3Q10. |
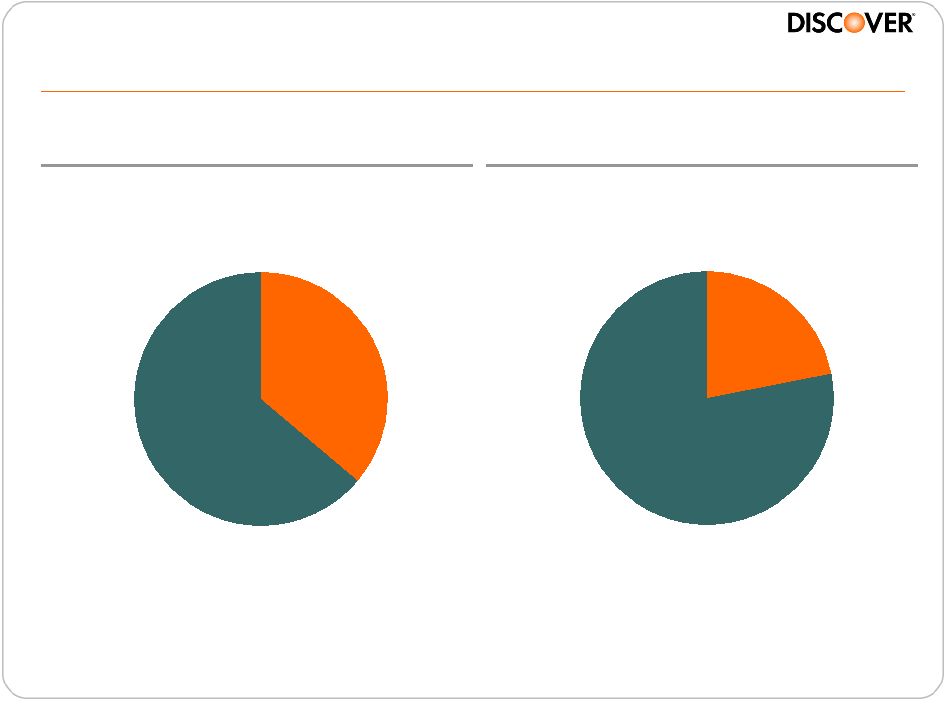
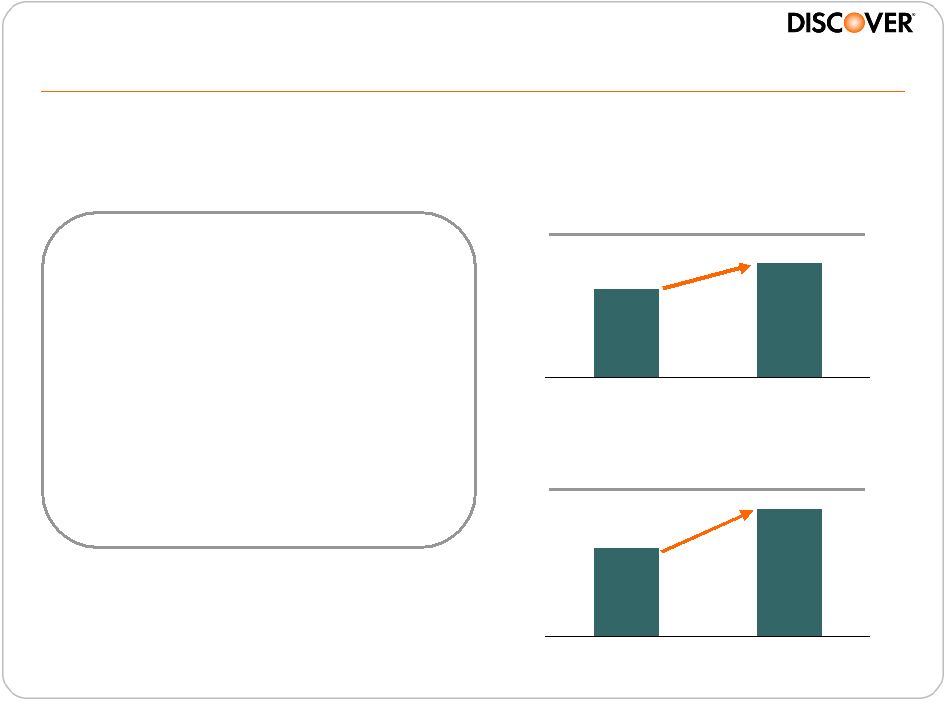
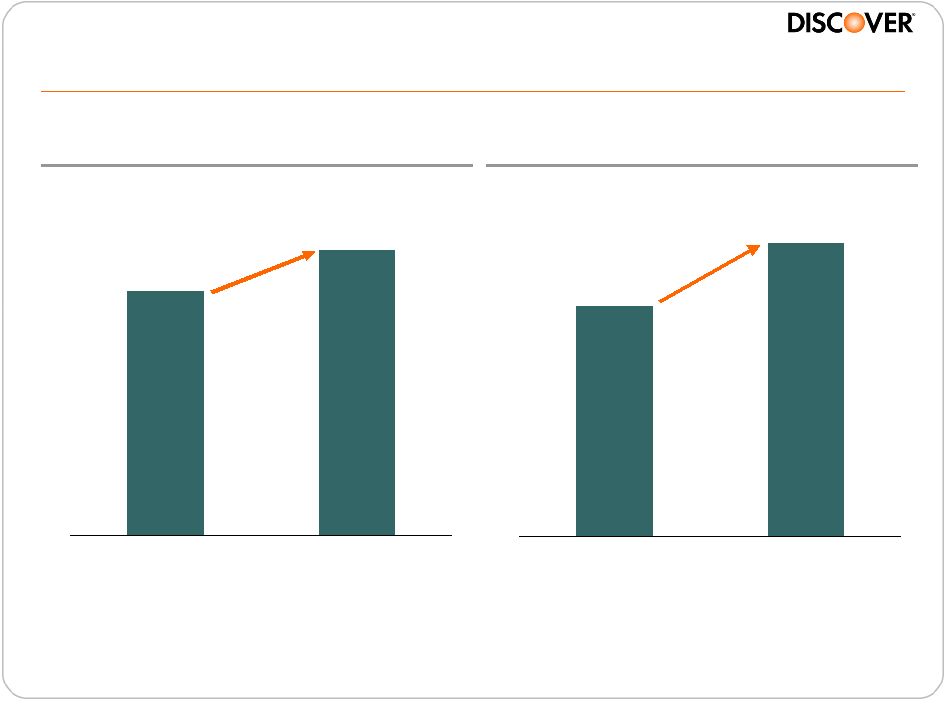 25
Increasing wallet share
2008
2010
2008
2010
Wallet Share
of Loans
Wallet Share
of Sales
16%
27%
Sources
Internal calendar year data and public company data
Note(s)
Wallet Share is the amount of customer loans / sales with Discover vs. other cards
in the wallet Share based upon credit bureau data and internal modeling
|
 Strong new account growth
24%
Spend per Account
Average FICO
New Accounts
25%
728
1Q11 YOY
Note(s)
1.
Based on the 2010 Brand Keys Customer Loyalty Engagement Index Report
(1)
26 |
 27
Note(s)
1.
Among general population; % of cardmembers who strongly / somewhat agree with the
statement “provides excellent overall value” Source
4Q 2010 Brand Tracker study, Millward Brown
35%
34%
33%
30%
26%
25%
DFS
JPM
AXP
COF
BAC
C
Establishing value leadership
Provides
Excellent
Overall
Value
(1) |
 28
Significantly increasing brand presence
Share of
Media Spend
(1)
Share of
Voice
(2)
Note(s)
1.
Share
of
Spend
=
Discover
media
spend
vs. AXP,
BAC,
C,
COF,
JPM,
V,
MA
2.
Share
of
Voice
=
Total
Discover
media
impressions
vs.
AXP,
BAC,
C,
COF,
JPM,
V,
MA
3.
Average of 2005-2009
6%
11%
Historical
2010
7%
20%
Historical
2010
(3)
(3)
Source
Nielsen |
 |
 |
 31
Well positioned for profitable growth
•
Our business is positioned to generate a pre-tax ROA of 2.5%+
and an ROE of 15%+ on a sustainable basis
•
Increasing usage and wallet share with existing customers
•
Strong growth in new accounts
•
Outperforming the industry in sales and receivables over the last
two years |
 Carlos Minetti
President, Consumer Banking &
Operations
Diversifying into higher growth asset classes
CONSUMER
CONSUMER
DEPOSITS
DEPOSITS
DISCOVER
DISCOVER
CARD
CARD
CONSUMER
CONSUMER
LOANS
LOANS
PULSE
PULSE
DEBIT
DEBIT
NETWORK
NETWORK
DINERS
DINERS
CLUB
CLUB
INTERNATIONAL
INTERNATIONAL
DISCOVER
DISCOVER
NETWORK
NETWORK |
 33
Achieved significant milestones in direct
banking expansion
•
Delivered a differentiated value proposition and extended reach of
Discover brand to become top 5 in:
–
Direct deposits
–
Personal loans
–
Student loans
•
Achieved scale and earned customer loyalty in deposits
•
Attained growth and profitability targets in personal loans
•
Acquired The Student Loan Corporation and became a leader in
student loans |
 34
Discover Direct Deposits |
 35
Discover has grown to become a leader in
direct deposits
Direct Deposits (Bn)
Direct
Deposit
Competitors
(Bn)
(1)
$20.6
$12.6
$6.1
$3.4
2007
2008
2009
2010
4Q10
Market
Share %
ING Bank, FSB
$77.7
29%
Charles Schwab Bank
$50.6
19%
USAA Federal Savings Bank
$35.6
13%
Ally Bank
$24.7
9%
Discover Bank
$20.6
8%
E*TRADE Bank
$15.6
6%
American Express Bank, FSB
$8.9
3%
Other
$35.1
13%
Total
$268.8
100%
Note(s)
1. Includes non-brokered, direct banks with fewer than 10 branches
2007 –
2010
CAGR: 82%
Source
Informa Research Services, SNL, internal data |
 36
Note(s)
1.
Balance percentages as of FYE2010
2.
Transaction expected to close mid-year, subject to regulatory approval
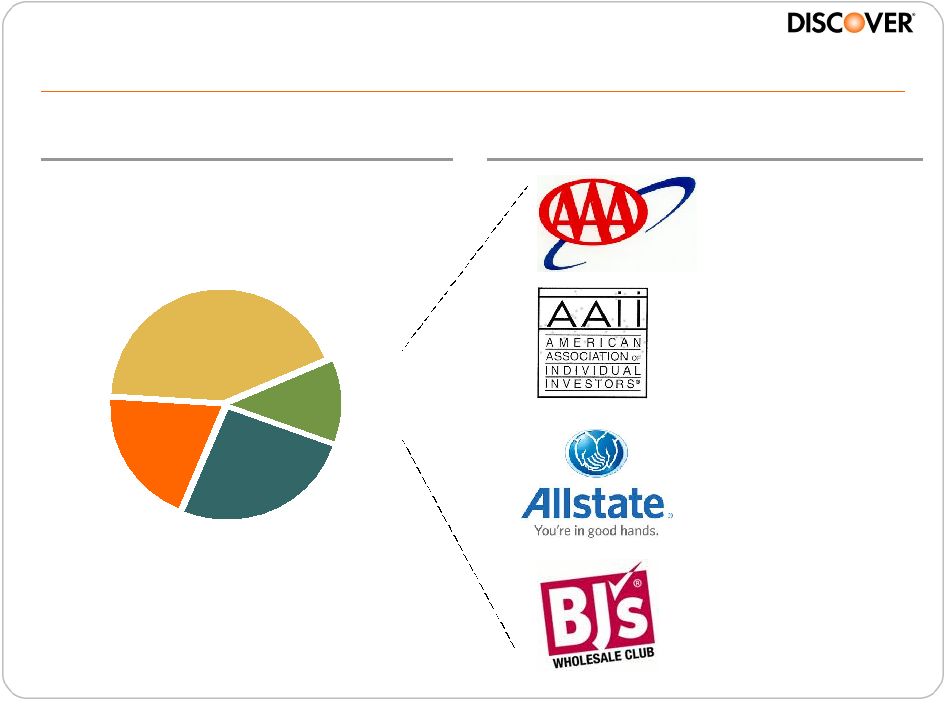
We have developed strong customer and
affinity relationships
•
Surpassed $2Bn in
deposits in 2010
•
Launched in May
2010
•
Announced in
February 2011
•
Acquiring ~ $1Bn
in deposits
(2)
•
Signed in March
2011
Depth
of
Relationships
(1)
Affinity Relationships
Single
Deposit
Account
Multiple
Deposit
Accounts
Deposit +
Card
Account
Deposit +
Affinity
Account
43%
12%
20%
25% |
 37
Our success comes from a focus on service
and value |
 38
Our value proposition resonates with consumers
$37K
$50K
$36K
CD Retention Rate
Money Market Balance Build
79%
77%
77%
77%
77%
4Q09
1Q10
2Q10
3Q10
4Q10
30%
Note(s)
1. Discover 2010 annual data
2. Representative
of
industry
over-the-cycle
experience,
2006
–
2010
-28%
Initial
Balance
After
1 Yr
Initial
Balance
After
1 Yr
Discover
(1)
Industry
(2)
$48K
Source
First Manhattan Consulting Group |
 39
Direct deposits has become a large and
attractive funding source
Relative Funding Costs
March 2011
Funding Sources
November 2010
Direct-to-
Consumer
(1)
Brokered CDs
(2)
ABS
Other
Internal
Benchmark
(1)
Direct-to-Consumer
30%
26%
40%
4%
Total: $52Bn
On-line
Savings
24-month
CD
5-year CD
0%
1%
2%
3%
Note(s)
1.
Obtained from consumers directly or through affinity relationships
2.
Obtained through third-party securities brokerage firms who offer our deposits
to their customers
Note(s)
1.
Internal analysis of Discover funding sources |
 40
Direct deposits is positioned to support firm-wide growth
•
Targeting deposit growth of 20-25% in 2011
–
Product expansion
–
Additional affinity relationships
•
Continue investment in infrastructure
•
Economics further improve in rising rate environment |
 41
Discover Personal Loans |
 42
Personal Loans poised for sustained growth
Personal Loans Receivables Growth ($Bn)
$0.2
$1.0
$1.4
$1.9
2007
2008
2009
2010
2008 –
2010
CAGR: 37% |
 43
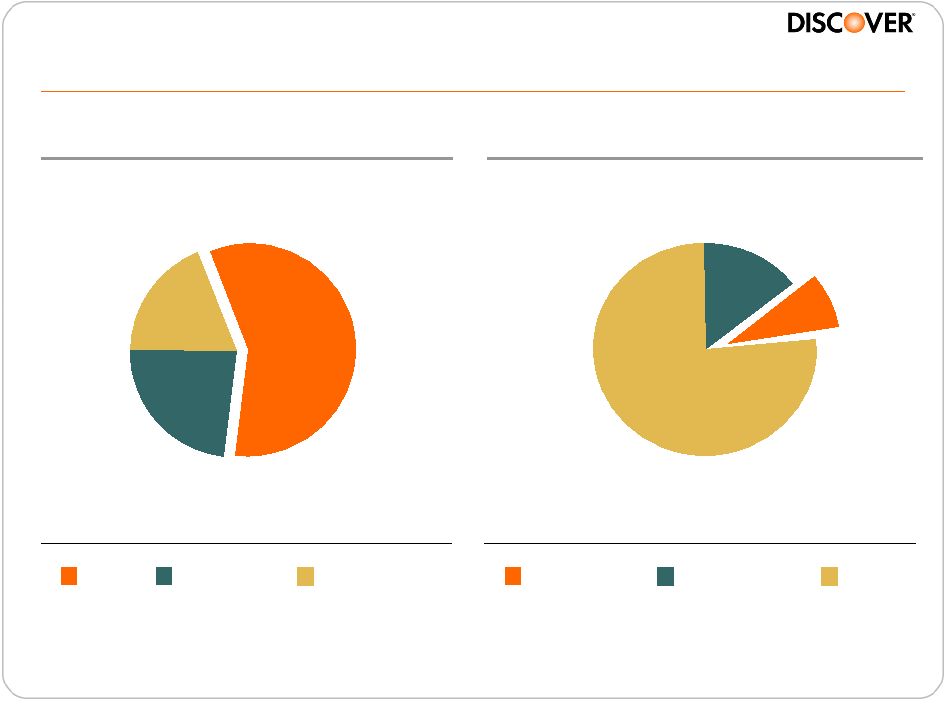
We have achieved leadership in the prime
credit segment
2010 Industry Originations ($Bn)
Market Position (Prime Only)
$12
$5
$4
Prime
Near Prime
Sub Prime
16%
8%
76%
Discover
5 Peers
(1)
Others
Note(s)
1. Includes: Citibank, Chase, Wells Fargo, Bank of America and Capital
One Total: $21Bn
Total: $12Bn
Source
Credit bureau data, Discover analysis
Source
Credit bureau data, Discover analysis |
 44
Consumer acceptance is driven by a
compelling value proposition
•
Competitive rates relative to substitutes
–
300bps –
400bps lower than existing debt
(1)
•
Financial control
–
Fixed single monthly payment
–
Paydown within set time frame
•
Customer experience
–
Consultative underwriting
–
Quick decision and funds disbursement
Note(s)
1.
Discover internal analysis |
 45
Disciplined underwriting is a key contributor to profitability
•
Custom credit and paydown
models –
40% lift compared to
generic models
•
Judgmental underwriting with
analysis of cash flows
•
Verification of income or
employment
•
Direct payment to creditors for
debt consolidation
Origination by Credit Score
Industry
Discover
0%
10%
20%
30%
40%
50%
501-
600
601-
700
701-
800
801-
900
901-
990
Source
Credit bureau data, Discover analysis of 2010 originations
|
 46
Our business model generates competitive
credit performance
Vintage Charge-Off Curves
60+ Past Due Rates (%)
Industry
Discover
0.0%
0.5%
1.0%
1.5%
2.0%
2.5%
2
4
6
8
10
12
14
16
Months on Book
Prime Peers
Discover
0.73%
1.37%
0.98%
3.45%
3.31%
3.54%
Q4-08
Q4-09
Q4-10
Source
Industry
-
credit
bureau
data;
Discover
–
internal
data
Source
Credit bureau data, Discover analysis |
 47
We are on track to deliver targeted returns
Net Interest Income
Loss Provision
Operating Expenses
Target ROA
9%
(4%)
(2%)
3%
Targeted Personal Loan Returns
(1)
Note(s)
1. Over life of loan |
 48
Personal loans is positioned for profitable growth
•
Targeting receivables growth of 20-25% in 2011 while maintaining
credit quality
•
Increase product awareness
•
Penetrate deeper into broad market population
•
Expand into pertinent segments
–
Smaller loan size
–
Shorter duration
•
Develop affinity partnerships |
 49
Discover Student Loans |
 50
Higher education is a good investment
Income
by
Education
Level
($000)
(1)
Unemployment
Rates
(1)
Note(s)
1.
Age 25 and over; based on highest degree obtained
National
Average 9%
14%
10%
8%
4%
No High
School
Diploma
Associate
or Some
College
Bachelor's
Degree or
Higher
High
School
Graduates
Sources
U.S. Census, Current Population Surveys 2008
Sources
U.S. Bureau of Labor Statistics, January 2011
Note(s)
1.
Based on highest degree obtained
21
31
33
40
59
71
100
125
Not a high school
graduate
High school
Some college
Associate's
Bachelor's
Master's
Doctorate
Professional |
 51
Enrollment and costs continue to increase
Average
Annual
College
Cost
(1)
($K)
Note(s)
1.
Average published tuition, fees, room and board in current dollars
Sources
College
Board,
Trends
in
College
Pricing
(2010);
National
Center
for
Education Statistics, Enrollment in Postsecondary Institutions
(‘07-’09) Total College Enrollment (MM)
$17.8
$18.8
$19.3
2007-2008
2008-2009
2009-2010
18.7
19.6
21.0
2007-2008
2008-2009
2009-2010
CAGR: 6%
CAGR: 4%
Sources
College
Board,
Trends
in
College
Pricing
(2010);
National
Center
for
Education Statistics, Enrollment in Postsecondary Institutions
(‘07-’09) |
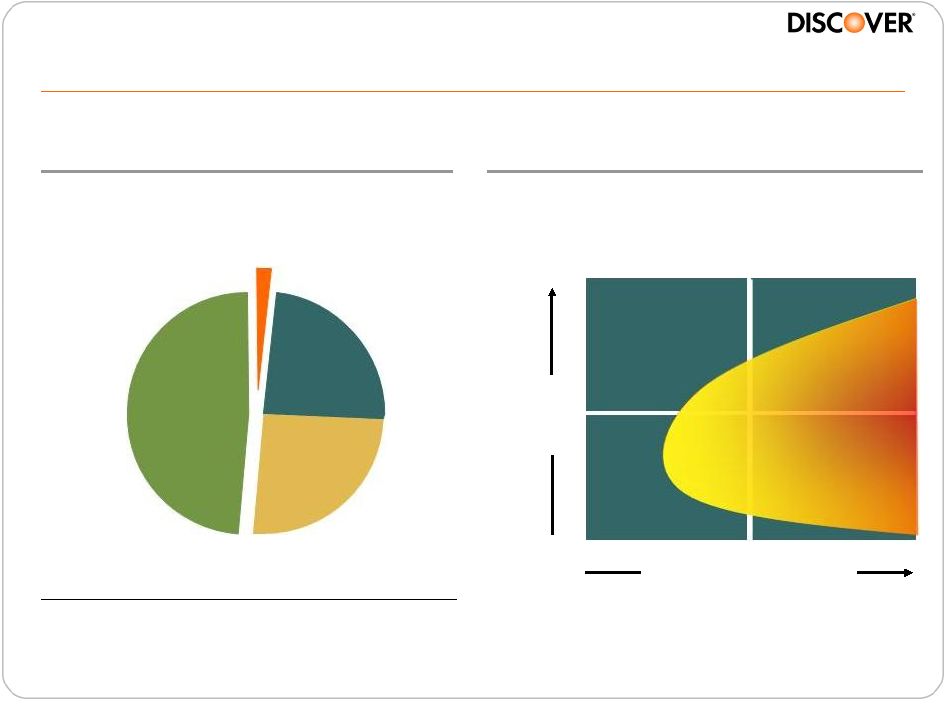 52
Private loans are an important source of
educational funding
Target Market for Private Loans
2010 Sources of Educational
Funding ($Bn)
Private
Loans
$8
Personal
Funds
$198
Grants
and Other
$103
Federal
Loans
$97
Total: $406Bn
Source
College Board, Trends in Student Aid (2010)
Cost of Attendance
Household
Income
Target Market |
 53
Private student loans are an attractive business
•
Students and parents need private loans to supplement other
sources of aid as education costs continue to rise
•
Private student loans have better features and consumer protections
than other types of unsecured loans
•
Student
loans
are
an
asset
with
long
duration
and
relatively
low
credit
losses
•
Top 5 lenders account for significant market share and benefit from
scale
•
Students are an upwardly mobile customer base |
 54
Our approach provides strong value to
students, parents and schools
Students & Parents
100% Solution
Private education loans for students
at 4-year colleges and graduate
schools, up to the cost of attendance
Simplicity
Easy application and repayment
processes and assistance as
customers enter repayment
Rewarding
2% Graduation Reward and periodic
extras
Schools
Reliable
Stable and consistent, providing
industry-leading service
Responsible
Responsible lending at every step of
the process
Flexible
Support for school processing
preferences |
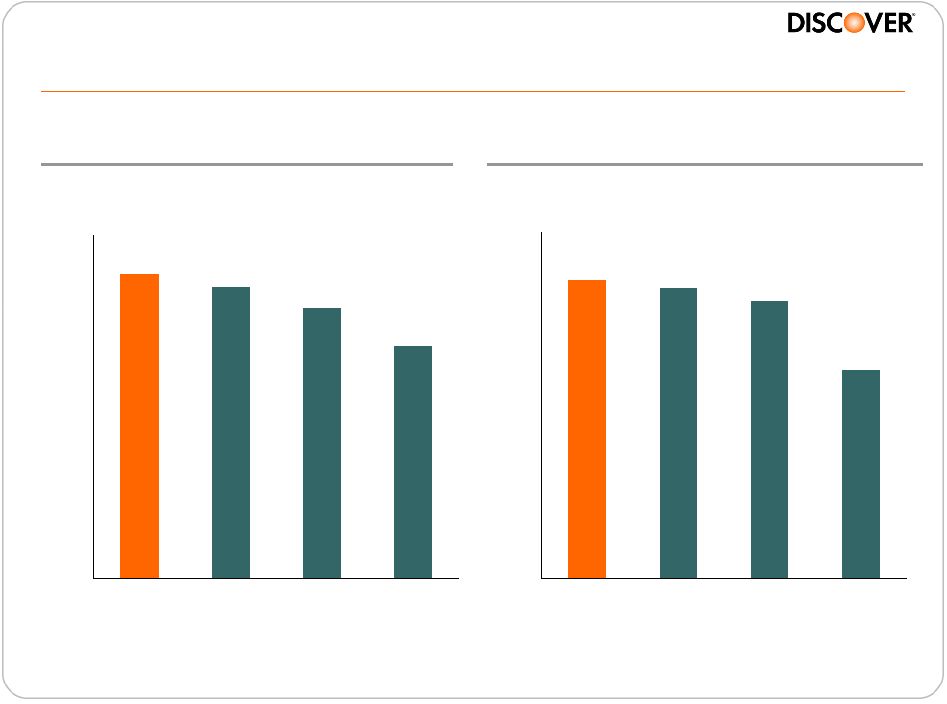 55
Compelling value proposition drives customer satisfaction
Recommend to a Friend
Satisfaction with Loan Provider
0%
10%
20%
30%
40%
50%
60%
70%
80%
Discover
Chase
Wells
Fargo
Sallie
Mae
0%
10%
20%
30%
40%
50%
60%
70%
80%
Discover
Chase
Wells
Fargo
Sallie
Mae
Source
Milward Brown 2011; based on Discover originated loans
Source
Milward Brown 2011; based on Discover originated loans
|
 56
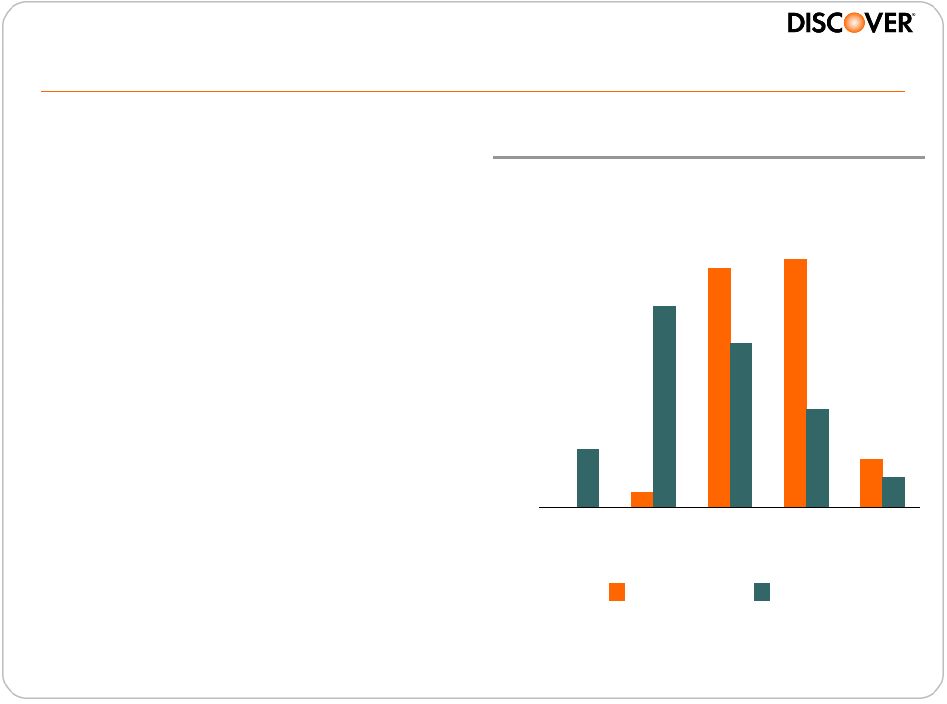
Disciplined underwriting is critical to profitability
Origination FICO Distribution
•
Proprietary underwriting /
scoring models
•
Only 4-year colleges and
graduate schools
•
High co-signer rate
•
School selection based on low
government default rates
•
100% school certified
•
100% disbursed through school
4%
11%
20%
25%
27%
13%
<
=690
720
750
780
810
>
810
Source
2010 Discover originations |
 57
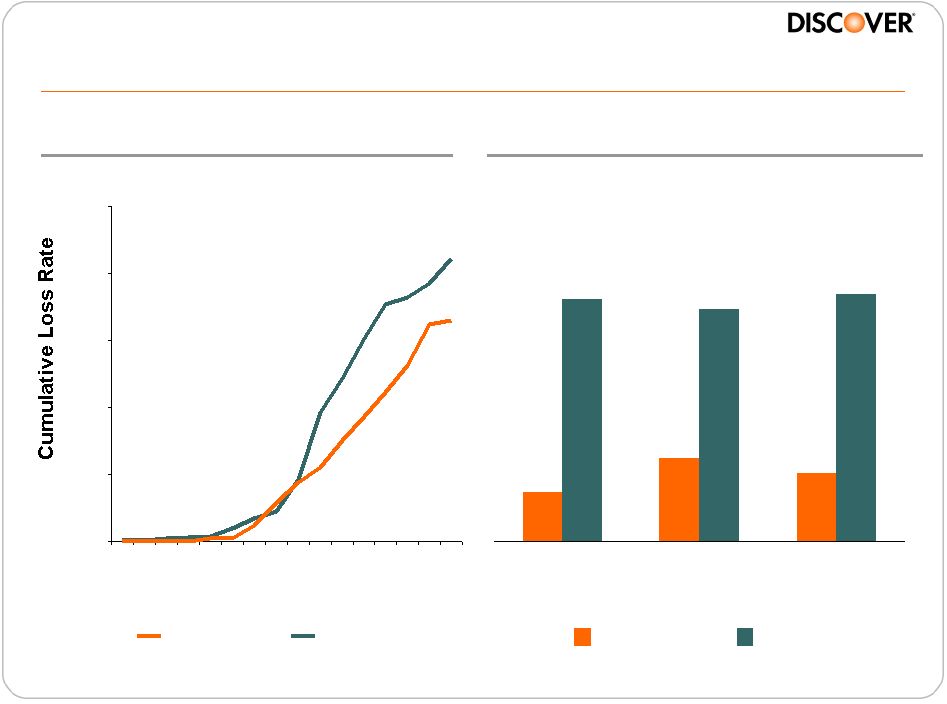
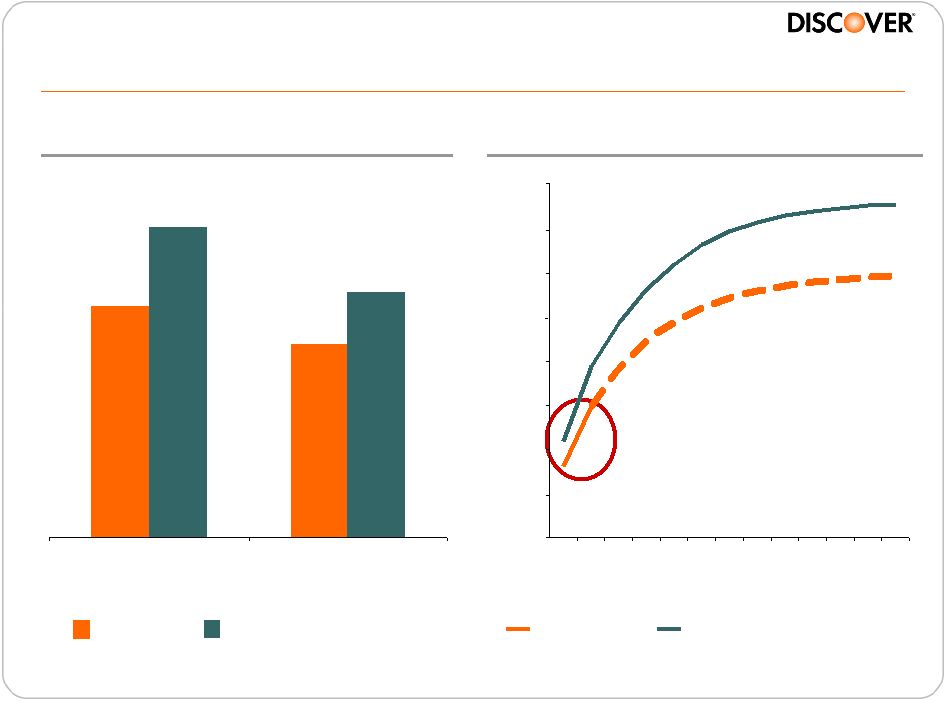
Early credit performance consistent with expectations
Cumulative Lifetime Loss Rate
Loss as % of Original Balance
0%
2%
4%
6%
8%
10%
12%
14%
16%
1
3
5
7
9
11
13
Years in Repayment
Sallie Mae Traditional
Discover
3.20%
2.68%
4.30%
3.40%
0-12
13-24
Months in Repayment
Sallie Mae Traditional
Discover
Source
Sallie Mae 4Q10 Investor Presentation, Discover analysis
Source
Sallie Mae 4Q10 Investor Presentation, Discover analysis
|
 58
We are on track to deliver targeted returns
Net Interest Income
Loss Provision
Operating Expenses
Target ROA
5%
(1%)
(1.5%)
2.5%
Targeted Student Loan Returns
(1)
Note(s)
1. Over life of loan |
 59
The Student Loan Corporation acquisition
strengthens Discover Student Loans
•
Diversifies Discover loan portfolio
at attractive returns
•
Enhances competitive position with
combined entity expected to be a
top 3 originator of private loans
•
Adds scale in servicing, capacity
and expertise
•
Increases product breadth to meet
a larger set of customer needs and
expands lifecycle marketing
opportunities
•
Complements network of school
relationships and online properties
•
Deepens proprietary underwriting
capabilities
2009-2010 Disbursements ($Bn)
DFS
$0.4
$0.6
SLC
$0.8
$2.0
$2.3
Sallie Mae
Wells
Fargo
Discover
Chase
$1.2
Source
Student
Lending
Analytics
(2010),
College
Board,
Trends
in
Student
Aid
(2010) |
 60
We acquired a seasoned portfolio with
attractive characteristics and scale
75%
Loans in repayment
74%
Loans with co-signer
724
Average FICO
83%
ABS funding
$4.2Bn
(1)
Total assets
The Student Loan Corporation
Note(s)
1. Represents book value as of 11/30/10 |
 Acquisition expanded penetration among target schools
SLC
350
Discover is on Preferred Lender List
at 1150 of 1350 Target Schools
Target Schools
Top
School
Penetration
(1)
200
•
83% of top 100 colleges
•
91% of top 50 Business schools
•
90% of top 50 Law schools
•
87% of top 50 Medical schools
Note(s)
1. Incorporates US News Rankings, 2010
DSL
250
550
61 |
 62
Leading online presence
www.wellsfargo.com
www.chasestudentloans.com
www.salliemae.com
www.studentloan.com
#14
#8
#2
#1
Google Unpaid Search Return Rankings
Keyword “Student Loan”
Source
www.google.com, March 2011 |
 63
Student loans is positioned for profitable future growth
•
Integration of The Student Loan Corporation is on track
•
Targeting net receivable growth of $1Bn+ in 2011
•
Strong pipeline of repeat business
•
Competitive product set with opportunities for expansion
•
Increased marketing to Card customer base and new affinity
partnerships |
 64
Consumer banking businesses have matured
and are well positioned for future expansion
•
Achieved robust growth in Consumer Lending and Deposits
-
~$21Bn in direct-to-consumer deposits
-
~$7Bn in consumer lending receivables
•
Extended the Discover Brand beyond credit cards
•
Attained profitability and established a solid foundation for growth
•
Capitalized on shifting market dynamics and consumer behaviors
|
 Exploiting the payments opportunity
Diane Offereins
President Payment Services
CONSUMER
CONSUMER
DEPOSITS
DEPOSITS
DISCOVER
DISCOVER
CARD
CARD
CONSUMER
CONSUMER
LOANS
LOANS
PULSE
PULSE
DEBIT
DEBIT
NETWORK
NETWORK
DINERS
DINERS
CLUB
CLUB
INTERNATIONAL
INTERNATIONAL
DISCOVER
DISCOVER
NETWORK
NETWORK |
 66
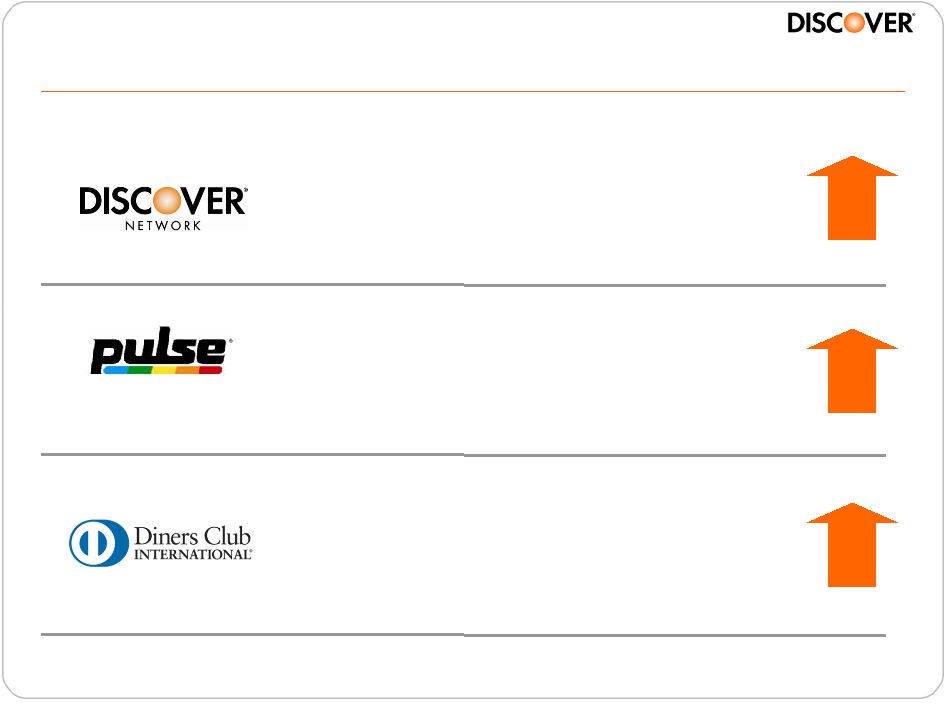
Delivering growth in all three payment networks
Domestic acceptance
network for Discover
proprietary cards and
partner issuers
•
$103Bn volume
•
30+ issuers
Domestic PIN debit
network with global ATM
acceptance
•
$118Bn volume
•
4,400+ issuers
•
783,000 ATMs
•
80+ countries
Global payments
network targeting
upscale customers,
frequent travelers and
corporate clients
•
$27Bn volume
•
80+ licensees
•
185 countries
and territories
Note(s)
Based on the trailing four quarters ending 4Q10
Volume
Change (YOY)
+6%
+6%
+8%
+8%
+4%
+4% |
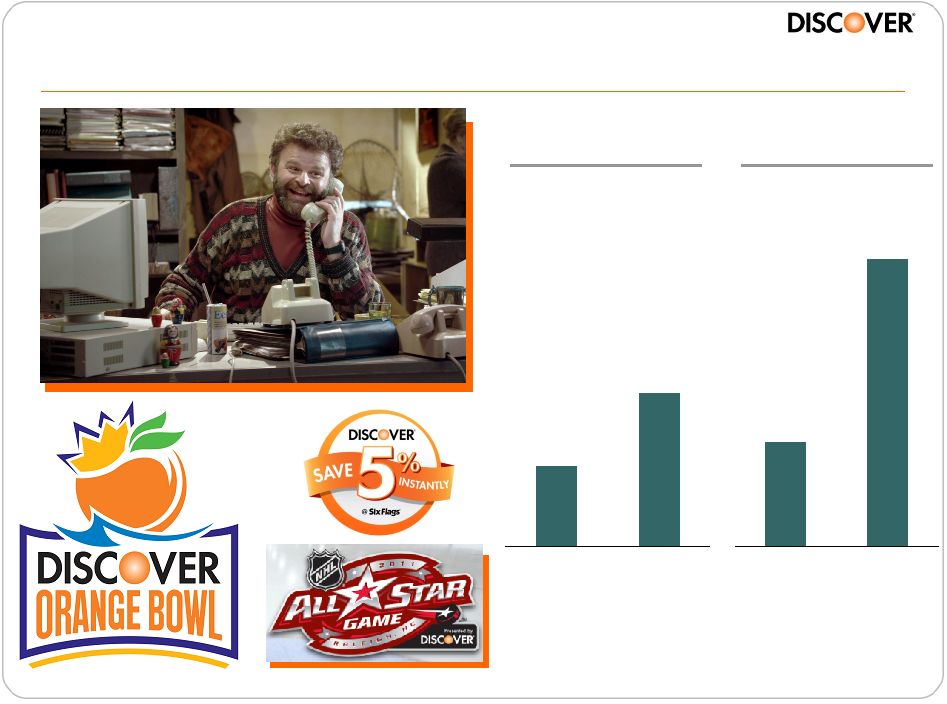
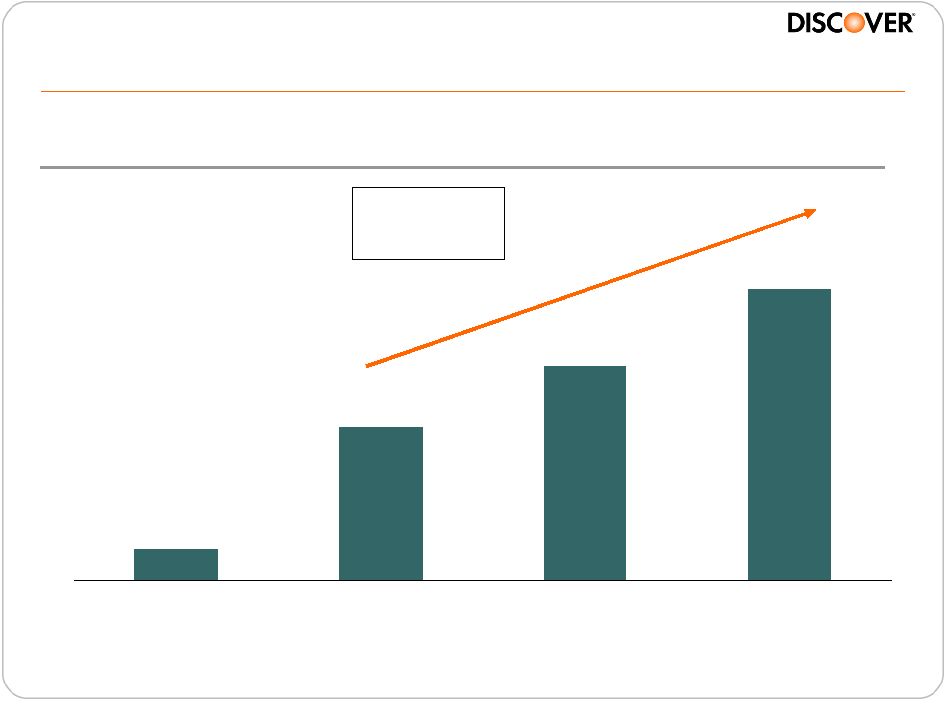
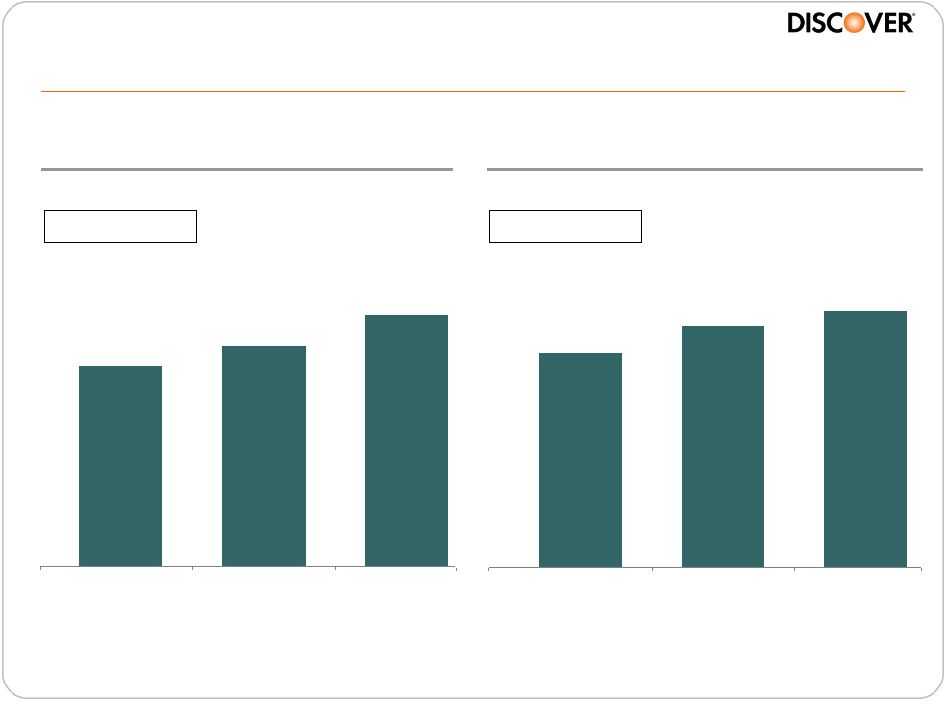
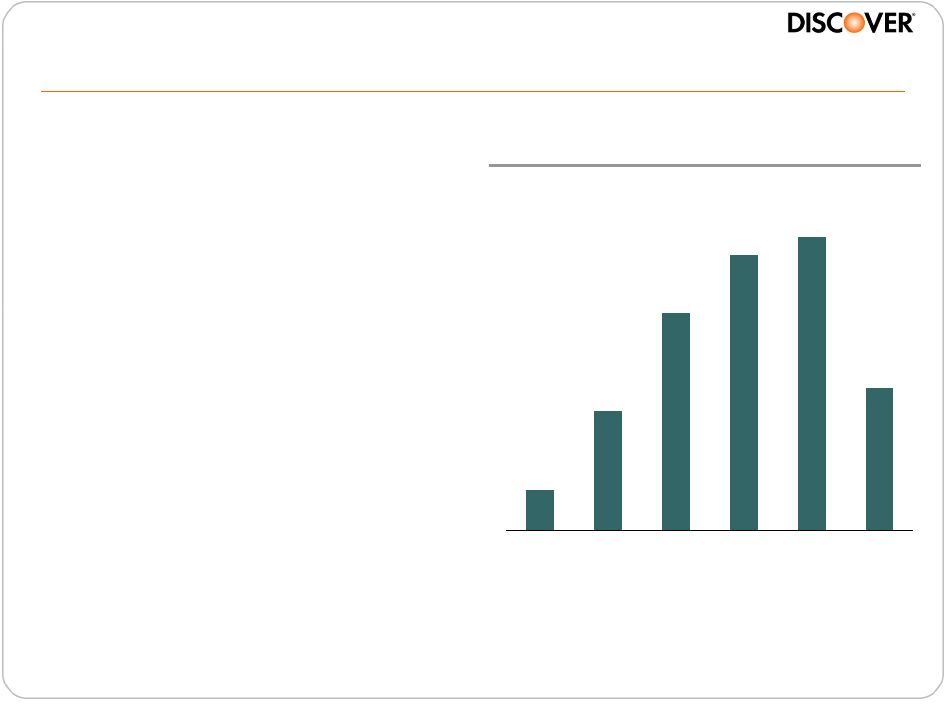
 67
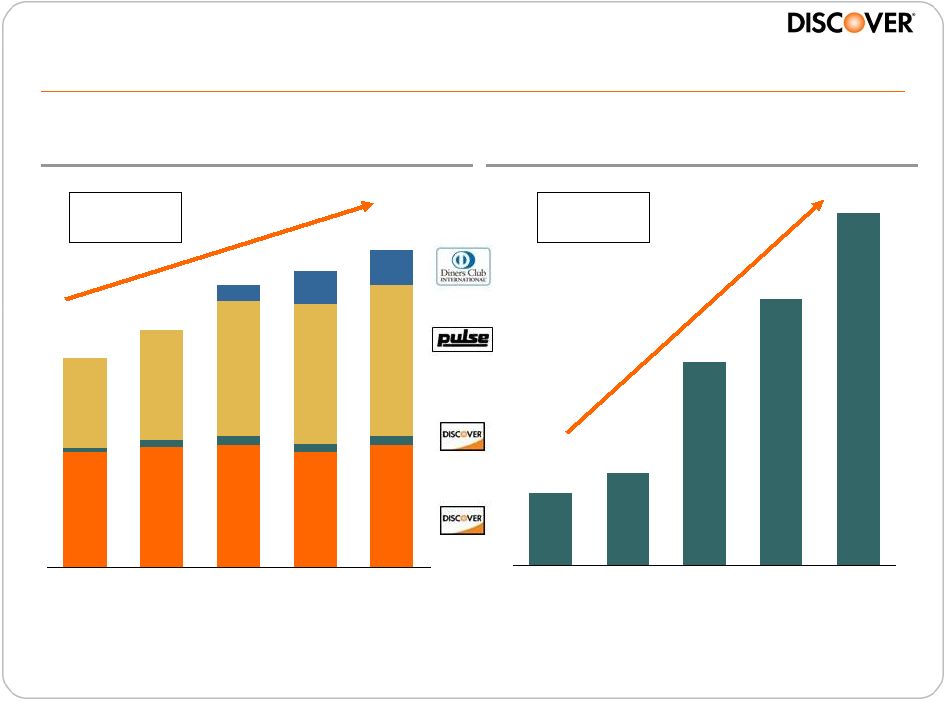
Momentum -
strong increase in volume and profits
$141
$107
$81
$37
$29
2006
2007
2008
2009
2010
91
96
70
86
106
109
118
13
$163
$186
$221
$232
$248
90
94
96
7
6
6
5
3
26
27
2006
2007
2008
2009
2010
Volume Growth (Bn)
Payment Services PBT (MM)
Partner
Issuance
Proprietary
2006 –
2010
CAGR: 48%
2006 –
2010
CAGR: 11% |
 68
Growth initiatives for 2011 and beyond
Primary efforts include
•
Increase acceptance and volume
–
U.S. efforts
–
Invest in global acceptance
–
Increase partner issuance volume
•
PULSE –
address regulatory disruptions
•
Continue to grow Diners Club
•
Increase global footprint through alliances
•
Focus on alternative payment solutions and innovative technologies
|
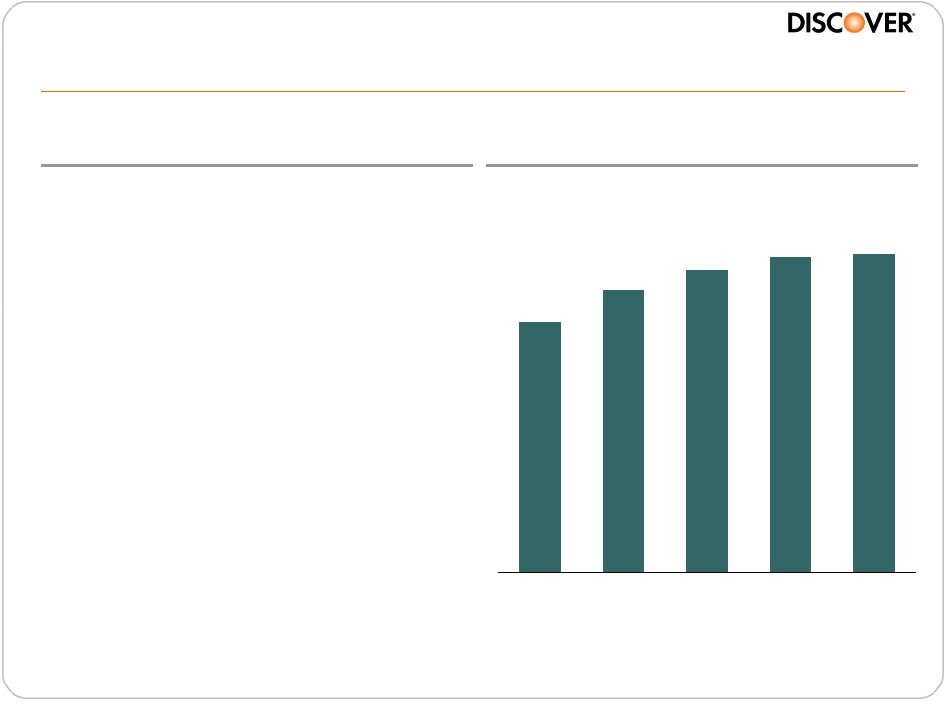 69
The last mile -
Discover acceptance in the U.S.
•
Accelerating growth of 30 day
active merchants
•
Increased volumes on the
Discover Network
•
Closing the gaps
–
Industry partners
–
High impact merchant focus
–
Awareness
•
Success with merchant partners
Domestic Focus
Merchant
Outlet
Coverage
(1)
Source
Internal data
76%
86%
92%
96%
97%
2006
2007
2008
2009
2010
Note(s)
1.
U.S. points of sale enabled for Discover acceptance per Discover internal analytic
study |
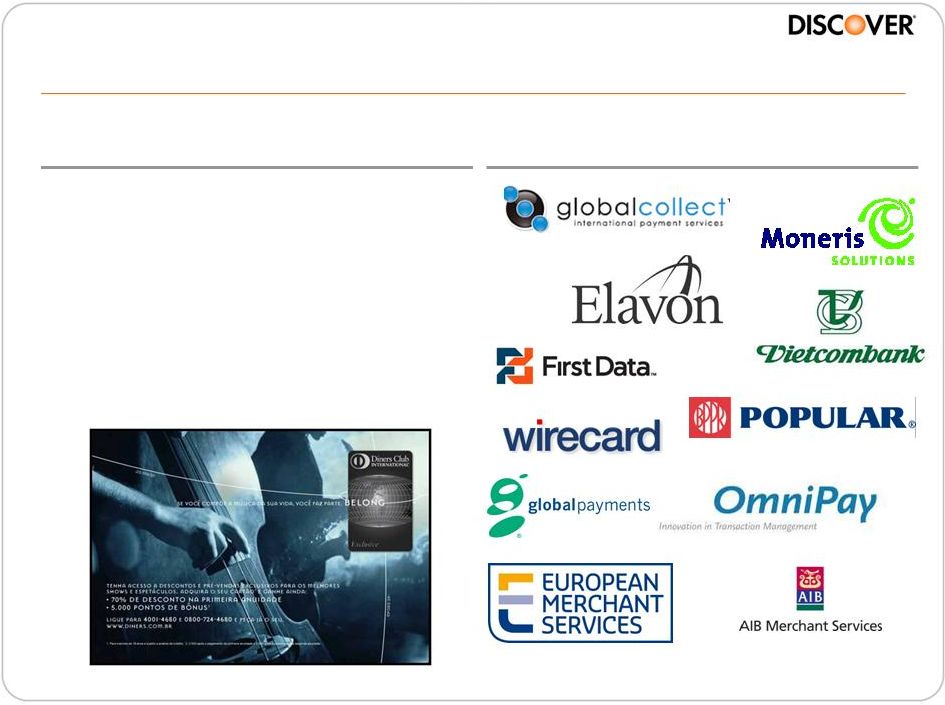 Building the future -
investing in global acceptance
•
Significant investments are being
made related to global acceptance
•
Utilizing hybrid acceptance model
for accelerated global growth
•
Implementation of multiple
partnerships with acquirers and
franchises
Global Focus
Global Merchant Acquirers
70 |
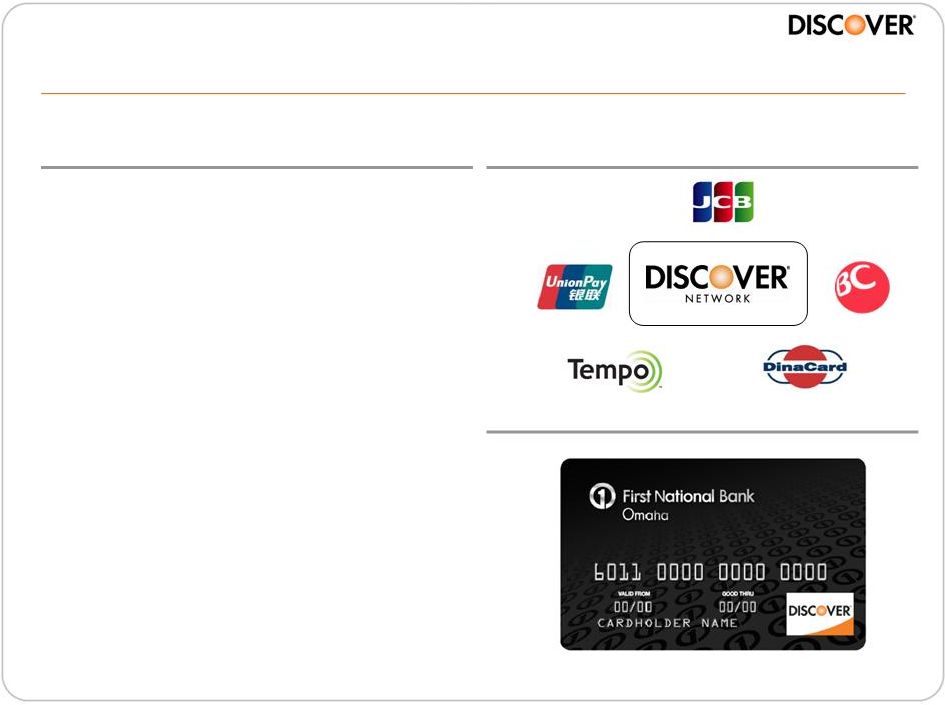 Cultivating partner volume on the networks
•
Volume growth driven by:
–
GE / Wal-Mart / Sam’s Club
–
HSBC
–
International agreements
•
New business pipeline continues
to grow
•
Prepaid strategy that is driven by
campus, incentive and
promotional cards leveraging our
unique network assets
•
Announced new relationship with
First National Bank of Omaha
Partner Issuance
Network-to-Network
71 |
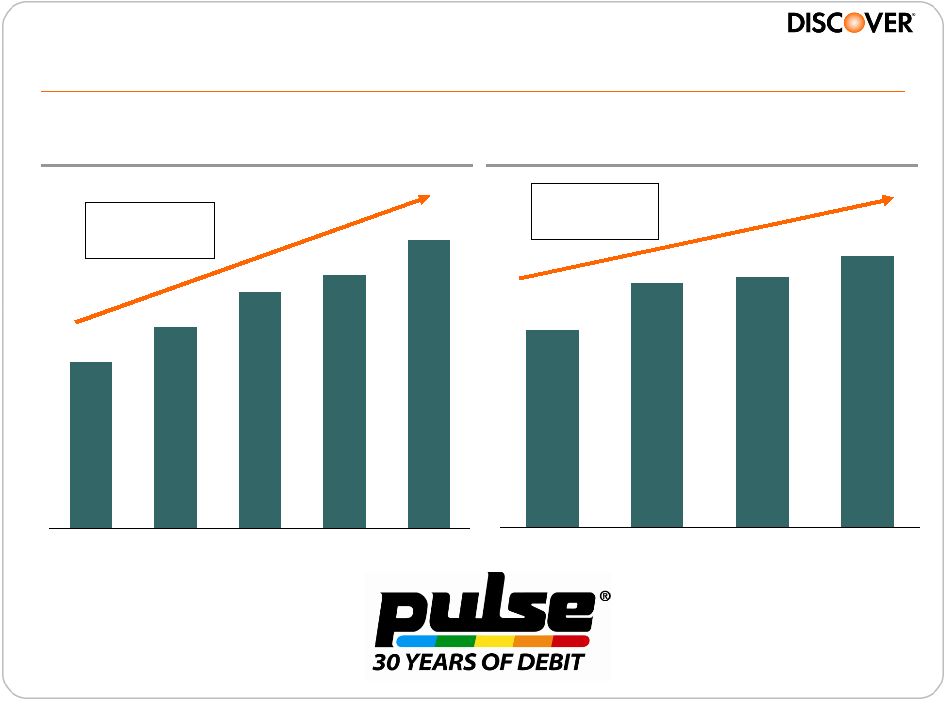 72
PULSE -
continued strong growth in 2010
3.3
2.9
2.7
2.3
1.9
2006
2007
2008
2009
2010
Transactions (Bn)
2006 –
2010
CAGR: 15%
Volume ($Bn)
$118
$109
$106
$86
2007
2008
2009
2010
2007 –
2010
CAGR: 11% |
 Implications of the Durbin amendment
•
Changes in network participation
requirements expected to result in
redistribution of PIN debit volume
•
PULSE positioned to on-board
issuers that need to add an
unaffiliated debit network
•
Increasing capacity to address
potential demand
73 |
 Strategic Initiatives
PULSE®
Internet PIN Debit
•
Continue to invest in leading
products and technology
•
Expand international and
domestic ATM acceptance
•
Support issuers in responding
to changing landscape
•
Continue to focus on cost
management and efficiency
initiatives
•
Implement the next generation
of world class infrastructure
•
Available network-wide
October 25, 2010
•
Delivers economic benefits to
both issuers and acquirers as
compared to signature debit
•
Secure payment method
•
Ease of use
PULSE –
seizing opportunities
74 |
 75
Diners Club –
on track to deliver long-term value
Strategic plans
•
Invest in product development efforts
•
Add franchises
•
Help franchises build stronger value propositions |
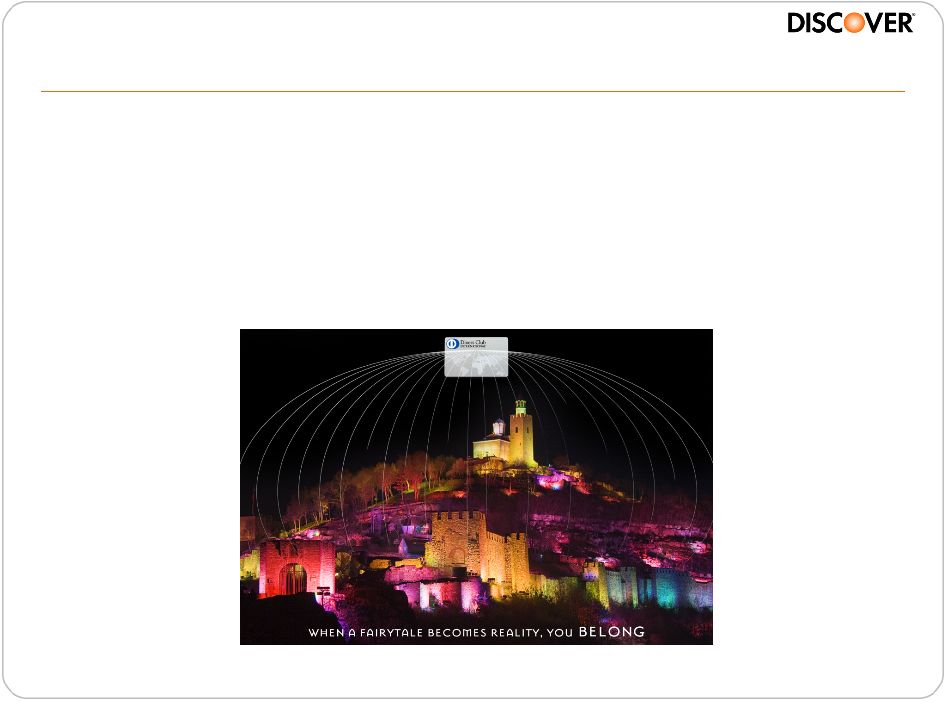 76
Building a global brand that feels exclusive
Strategic directions
•
Continuing to re-invigorate brand
•
Expand global advertising and extend growth incentives
•
BELONG campaign |
 Partnering in alternative payments and technology
•
Explosive growth in mobile devices has cultivated the
demand for innovative payment methods and services
•
Focus on new ways to facilitate credit, debit and
alternative transactions
•
Grow
consumer
base
beyond
the
“tech
forward”
crowd
77 |
 •
On the path of reinvention
•
Focusing on collaboration
•
Embracing innovation
•
Addressing a changing landscape
•
Seizing opportunities
A globally diversified payments business
2011 and Beyond
78 |
 Delivering shareholder value through strong
financial performance
Roy Guthrie
Chief Financial Officer
CONSUMER
CONSUMER
DEPOSITS
DEPOSITS
DISCOVER
DISCOVER
CARD
CARD
CONSUMER
CONSUMER
LOANS
LOANS
PULSE
PULSE
DEBIT
DEBIT
NETWORK
NETWORK
DINERS
DINERS
CLUB
CLUB
INTERNATIONAL
INTERNATIONAL
DISCOVER
DISCOVER
NETWORK
NETWORK |
 80
Financial performance
($ MM, except per share data)
1Q11
1Q10
Net Interest Income
$1,170
$1,145
$25
Other Operating Revenue
563
546
17
Total Revenue
$1,733
$1,691
$42
Net Charge-offs
$689
$1,082
($393)
Reserve Changes build/(release)
(271)
305
(576)
Provision for Loan Loss
$418
$1,387
($969)
Total Operating Expense
$595
$475
$120
Pretax Income
$720
($171)
$891
Net Income (Loss)
$465
($104)
$569
EPS
$0.84
($0.22)
$1.06
ROE
28%
-6%
NM
Total Average Receivables
$51,488
$51,555
($68)
Net Interest Margin
9.22%
9.01%
21bps
YOY
Change |
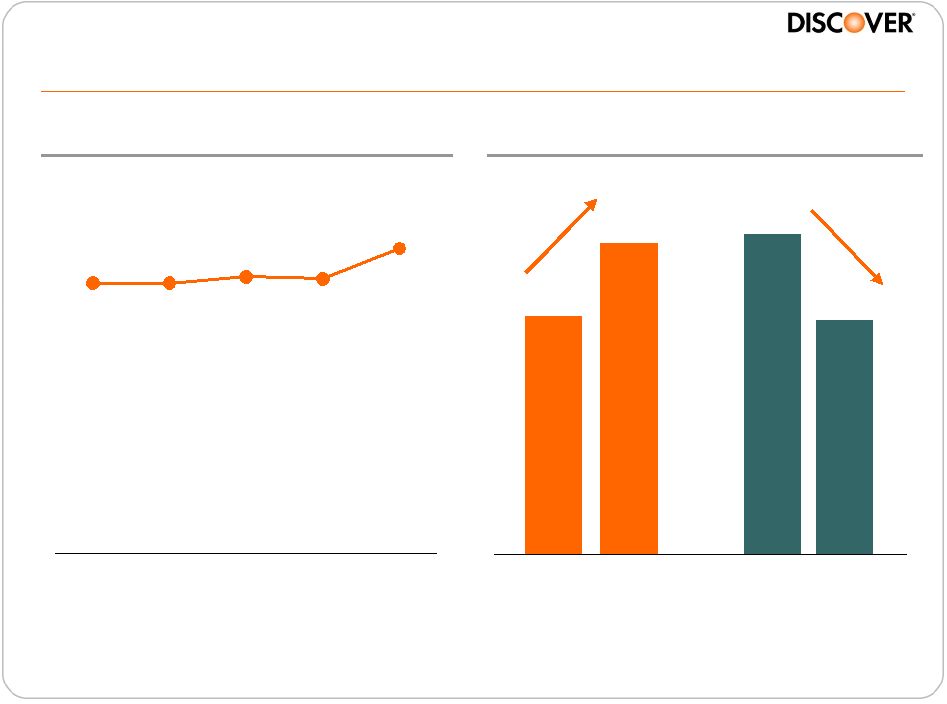
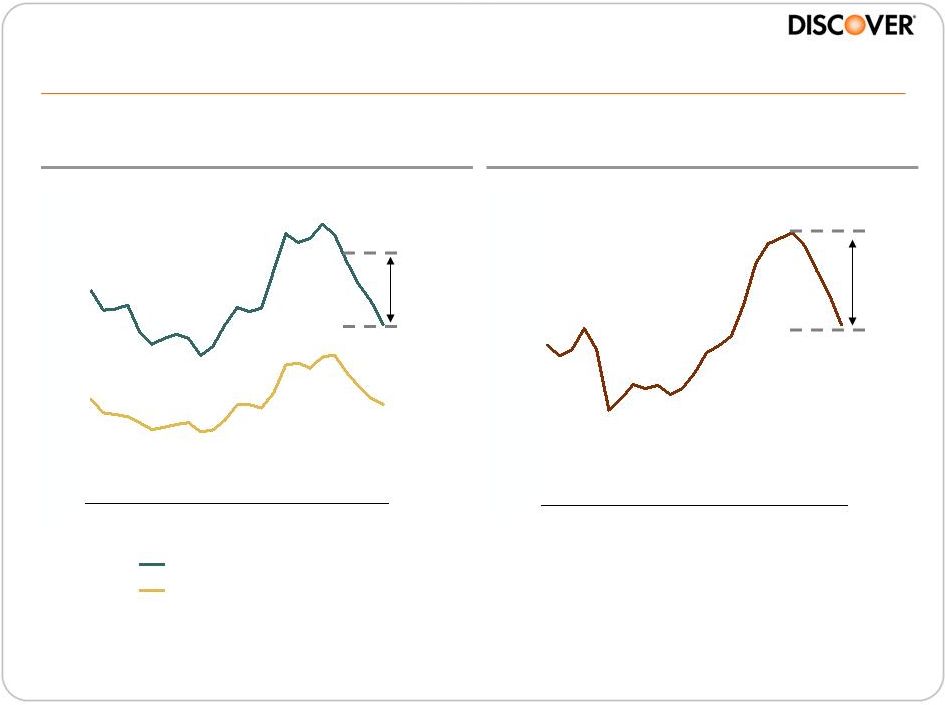
 81
Improving credit fundamentals with stable revenues…
Net
Interest
Margin
(%)
(1)
Revenues
(2)
Note(s)
1.
Defined as net interest income (annualized) divided by average total loans for the
period 2.
Defined as revenue before rewards expense less interest expense for Direct Banking
segment 3.
Defined as revenue before rewards expense less interest expense and charge-offs
for Direct Banking segment 9.2%
9.3%
9.2%
9.1%
9.0%
1Q10
2Q10
3Q10
4Q10
1Q11
900
797
689
$1,792
$1,769
$1,837
$1,730
710
768
938
933
1,173
1,001
1,082
$1,862
1Q10
2Q10
3Q10
4Q10
1Q11
Net Credit Revenue
Charge-offs
(3) |
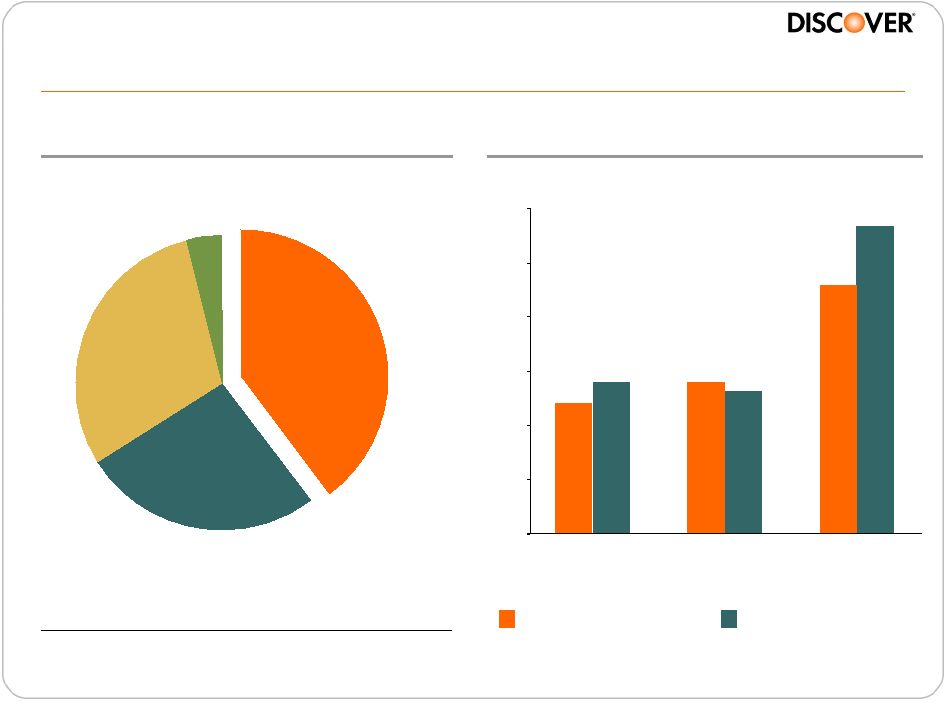
 82
…
partially offset by higher investment spending…
$413
$416
$435
$469
$459
1Q10
2Q10
3Q10
4Q10
1Q11
131
150
136
$252
$272
$325
$352
$342
167
174
194
202
206
98
85
1Q10
2Q10
3Q10
4Q10
1Q11
Rewards
Mkt & Bus. Development
Core
Operating
Expenses
(1)
Investment Spending
Note(s)
1.
Represents
total
company
“other
expenses”
excluding
marketing
and
business
development
2.
Excludes 1Q10 credit related to settlement
3.
Excludes one-time SLC transaction expenses
Source
Total Company
Source
Total Company
(2)
(3) |
 0%
2%
4%
6%
8%
10%
1Q05
3Q06
1Q08
3Q09
1Q11
…
with expectation for continued credit
improvement driving reserve releases
Credit Card
Delinquency Rates (%)
Credit Card Net
Charge-off Rate (%)
Note(s)
Data prior to 1Q10 have been adjusted for FAS 166/167
~$400MM
/ Quarter
$1.1Bn
Reserve
Releases
0%
1%
2%
3%
4%
5%
6%
1Q05
3Q06
1Q08
3Q09
1Q11
30+ Delinquency Rate
90+ Delinquency Rate
83 |
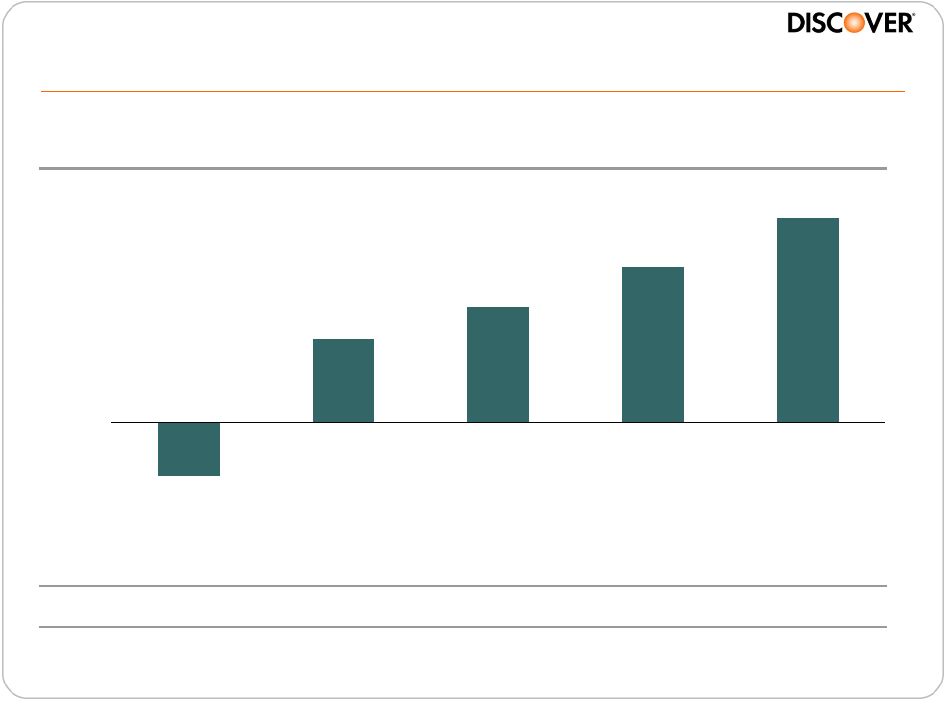 84
$459
$347
$258
$185
($122)
1Q10
2Q10
3Q10
4Q10
1Q11
Profits drive further improvement in balance sheet flexibility
Net Income to
Common Stockholders
Note(s)
1.
Defined as tangible common equity to tangible assets; see appendix for
reconciliation TCE
Ratio
(1)
8.1%
9.1%
9.5%
10.0%
10.2% |
 85
4Q10 Tier 1 Common Ratio
8.6%
8.8%
9.8%
11.0%
11.1%
11.4%
DFS
AXP
C
JPM
COF
BAC
Source
SNL, Regulatory Reports dated 12/31/10
Regulatory implications for capital
Pro
forma
Basel
III
Ratios
(1)
Ratios
Proposed
Minimum
DFS
Consolidated
(2)
Tier 1 Common
7.0%
10.8%
Tier 1 RBC
8.5%
10.8%
Total RBC
10.5%
14.1%
Tier 1 Leverage
(3)
3.0%
7.9%
Note(s)
1.
Preliminary view based on December 2010 Basel Committee guidance, subject to
change 2.
12/31/10
estimates
for
deferred
tax
assets
(DTA);
assumes
that
the
two
year
carryback
is
allowed
and
the
portion
of
DTA
realized
as
a
result
of
future
profitability
is
capped
at
10%
of
common
equity
3.
Assets include 10% of the $163Bn undrawn credit card lines
|
 86
$5.0
$1.4
1Q11
Illustrative Target
Excess Capital
Excess capital deployment
Tangible
Common
Equity
(1)
(Bn)
Note(s)
1.
See appendix for reconciliation
2.
Certain potential uses subject to regulatory approval
8%+/-
Target
Potential
Uses
of
Excess
Capital
(2)
•
Dividend actions
•
Organic growth
•
Acquisitions
•
Share repurchase |
 87
Summary
•
Stable
revenue
with
improving
credit
trends
is
driving
increased
net
credit revenues and reserve releases
•
These benefits will be partially offset by investment spending to drive
future growth
•
Resulting growth in earnings provides balance sheet flexibility
–
Dividend restored
–
Evaluating excess capital alternatives |
 2011
Financial Community Briefing Using our Direct Banking and Payments assets to
deliver profitable growth CONSUMER
CONSUMER
DEPOSITS
DEPOSITS
DISCOVER
DISCOVER
CARD
CARD
CONSUMER
CONSUMER
LOANS
LOANS
PULSE
PULSE
DEBIT
DEBIT
NETWORK
NETWORK
DINERS
DINERS
CLUB
CLUB
INTERNATIONAL
INTERNATIONAL
DISCOVER
DISCOVER
NETWORK
NETWORK |
 89
Appendix |
 90
Reconciliations
($MM)
2/28/10
5/31/10
8/31/10
11/30/10
12/31/10
2/28/11
Tangible Common Equity Ratio Calculation:
Total Common Equity (TCE)
5,854
6,038
6,111
6,457
6,565
6,899
Less: Goodwill and Intangibles
(449)
(448)
(446)
(444)
(448)
(449)
Tangible Common Equity
5,405
5,590
5,665
6,013
6,117
6,450
Total Assets
66,819
62,154
60,058
60,785
63,550
63,506
Less: Goodwill and Intangibles
(449)
(448)
(446)
(444)
(448)
(449)
Tangible Assets (TA)
66,370
61,706
59,612
60,341
63,102
63,057
TCE/TA Ratio
8.1%
9.1%
9.5%
10.0%
9.7%
10.2%
Note(s)
Tangible common equity ("TCE"), a non-GAAP financial measure,
represents common equity less goodwill and intangibles. A reconciliation of TCE
to
common
equity,
a
GAAP
financial
measure,
is
shown
above.
Other
financial
services
companies
may
also
use
TCE
and
definitions
may
vary,
so
we advise users of this information to exercise caution in comparing TCE of
different companies. TCE is included because management believes
that
common
equity
excluding
goodwill
and
intangibles
is
a
more
meaningful
valuation
to
investors
of
the
true
net
asset
value
of
the
company. |