Attached files
| file | filename |
|---|---|
| 8-K - 8-K - CF Industries Holdings, Inc. | a11-8432_18k.htm |
Exhibit 99.1
|
|
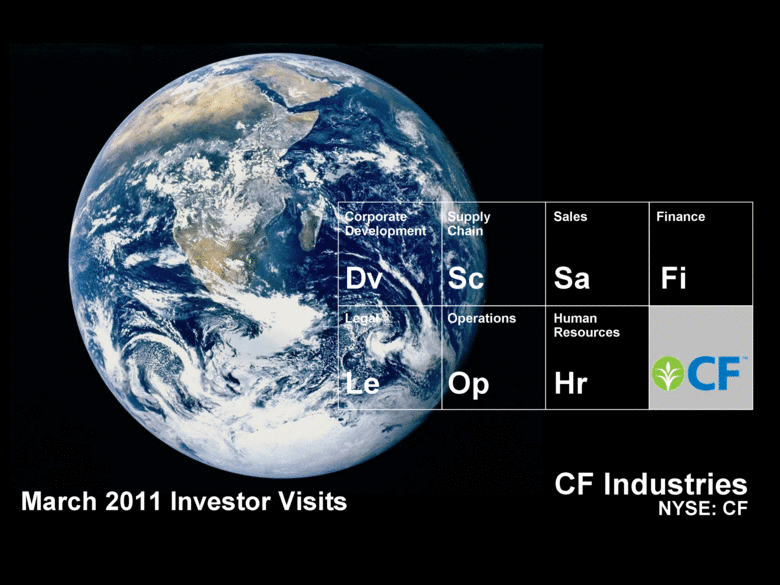
Corporate Development Supply Chain Sales Finance Legal Operations Human Resources Dv Sc Sa Fi Le Op Hr CF Industries NYSE: CF March 2011 Investor Visits |
|
|
Certain statements contained in this communication may constitute "forward-looking statements." All statements in this communication, other than those relating to historical information or current condition, are forward-looking statements. These forward-looking statements are subject to a number of risks and uncertainties, many of which are beyond our control, which could cause actual results to differ materially from such statements. Important factors that could cause actual results to differ materially from our expectations include, among others: the volatile cost of natural gas in the areas where our production facilities are principally located; the cyclical nature of our business and the agricultural sector; the global commodity nature of our fertilizer products, the impact of global supply and demand on our selling prices, and the intense global competition in the consolidating markets in which we operate; conditions in the U.S. agricultural industry; reliance on third party transportation providers; our ability to integrate the businesses of CF Industries and Terra promptly and effectively and to achieve the cost savings and synergies we anticipate from the Terra acquisition within the expected time frame or at all, and the potential for disruption from the Terra acquisition to make it more difficult for us to maintain relationships with customers, employees or suppliers; weather conditions; risks associated with expansion of our business, including unanticipated adverse consequences and the significant resources that could be required; potential liabilities and expenditures related to environmental and health and safety laws and regulations; our potential inability to obtain or maintain required permits and governmental approvals or to meet financial assurance requirements; future regulatory restrictions and requirements related to greenhouse gas emissions and climate change; our inability to predict seasonal demand for our products accurately; the impact of changing market conditions on our forward sales programs; risks involving derivatives and the effectiveness of our risk measurement and hedging activities; the reliance of our operations on a limited number of key facilities and the significant risks and hazards against which we may not be fully insured; risks associated with joint ventures; acts of terrorism and regulations to combat terrorism; difficulties in securing the supply and delivery of raw materials we use and increases in their costs; risks associated with international operations; the concentration of our sales with certain large customers; losses on our investments in securities; deterioration of global market and economic conditions; our substantial indebtedness and the limitations on our operations imposed by the terms of our indebtedness; our ability to comply with the covenants under our indebtedness and to make payments under such indebtedness when due; potential inability to refinance our indebtedness in connection with any change of control affecting us; and loss of key members of management and professional staff. Forward-looking statements are given only as of the date of this release and we disclaim any obligation to update or revise the forward-looking statements, whether as a result of new information, future events or otherwise, except as required by law. Safe Harbor Statement |
|
|
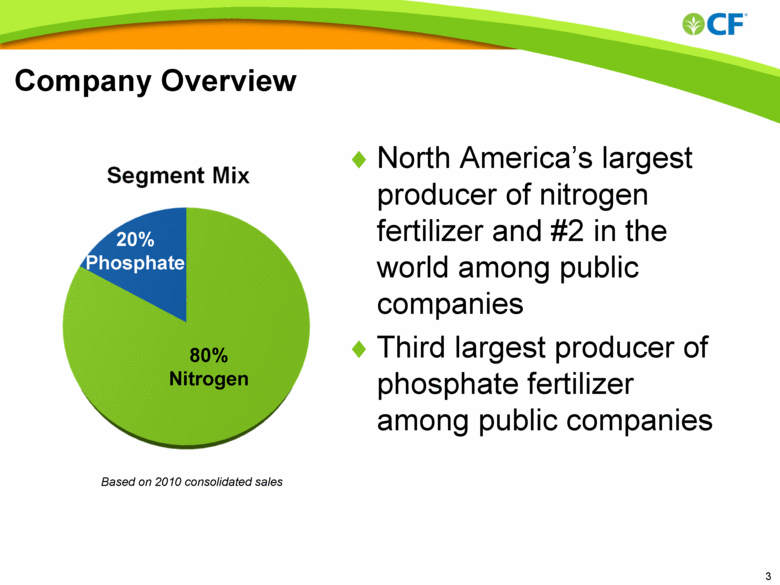
Company Overview North America’s largest producer of nitrogen fertilizer and #2 in the world among public companies Third largest producer of phosphate fertilizer among public companies 80% Nitrogen 20% Phosphate Based on 2010 consolidated sales |
|
|
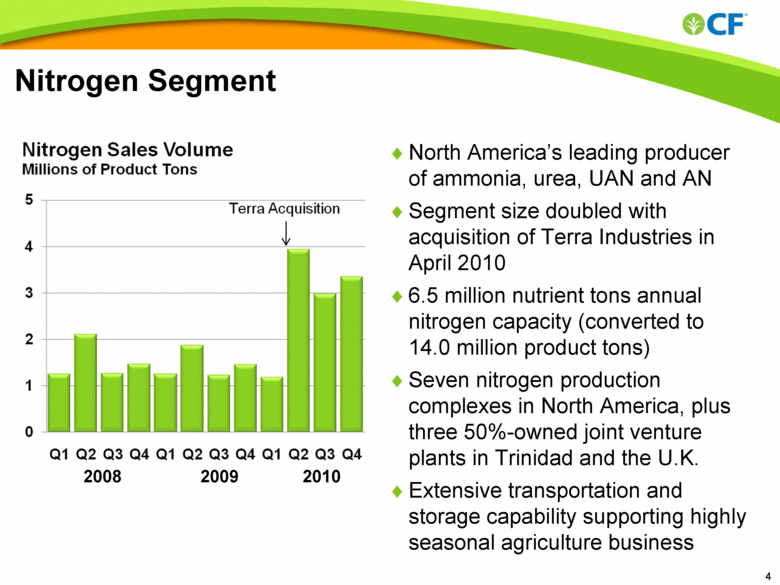
Nitrogen Segment North America’s leading producer of ammonia, urea, UAN and AN Segment size doubled with acquisition of Terra Industries in April 2010 6.5 million nutrient tons annual nitrogen capacity (converted to 14.0 million product tons) Seven nitrogen production complexes in North America, plus three 50%-owned joint venture plants in Trinidad and the U.K. Extensive transportation and storage capability supporting highly seasonal agriculture business 2008 2009 2010 Nitrogen Sales Volume Millions of Product Tons |
|
|
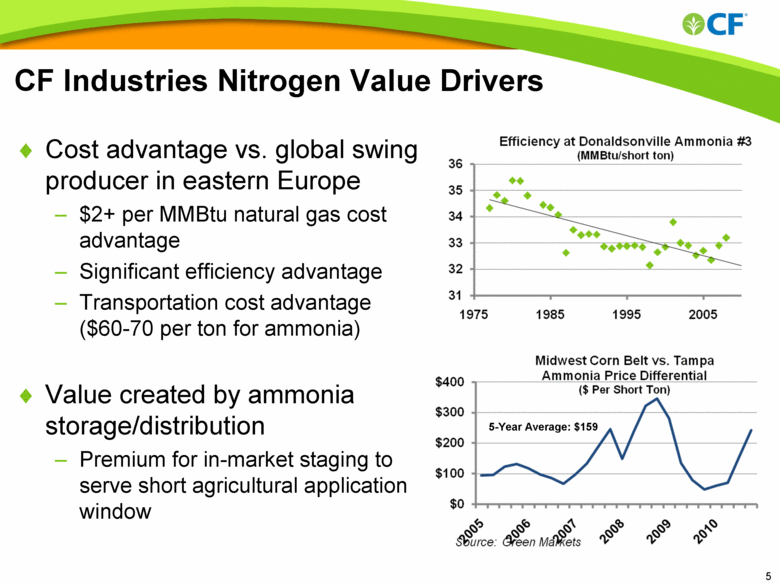
CF Industries Nitrogen Value Drivers Cost advantage vs. global swing producer in eastern Europe $2+ per MMBtu natural gas cost advantage Significant efficiency advantage Transportation cost advantage ($60-70 per ton for ammonia) Value created by ammonia storage/distribution Premium for in-market staging to serve short agricultural application window 5-Year Average: $159 Efficiency at Donaldsonville Ammonia #3 (MMBtu/short ton) Midwest Corn Belt vs. Tampa Ammonia Price Differential ($ Per Short Ton) |
|
|
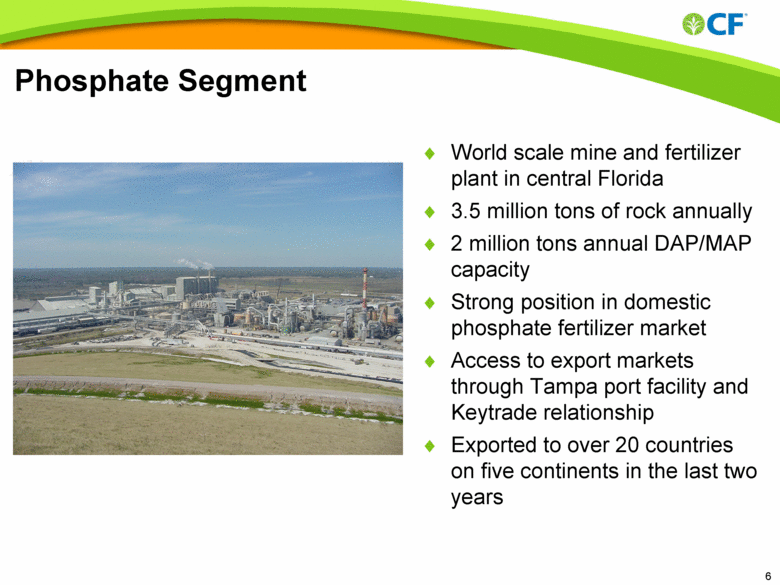
Phosphate Segment World scale mine and fertilizer plant in central Florida 3.5 million tons of rock annually 2 million tons annual DAP/MAP capacity Strong position in domestic phosphate fertilizer market Access to export markets through Tampa port facility and Keytrade relationship Exported to over 20 countries on five continents in the last two years |
|
|
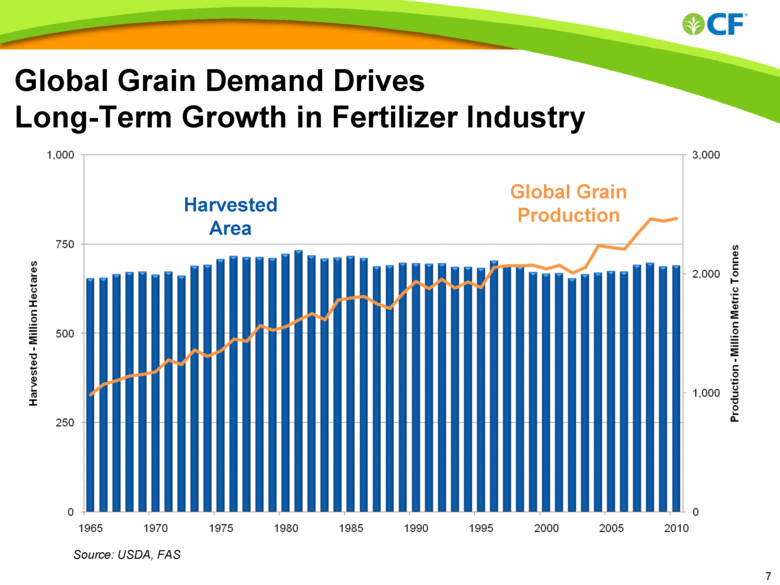
Global Grain Demand Drives Long-Term Growth in Fertilizer Industry Global Grain Production Source: USDA, FAS Harvested Area |
|
|
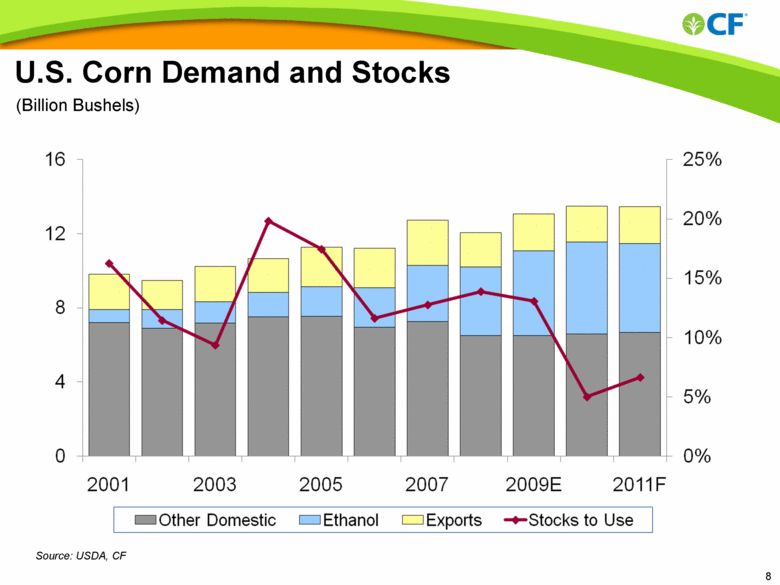
U.S. Corn Demand and Stocks (Billion Bushels) Source: USDA, CF |
|
|
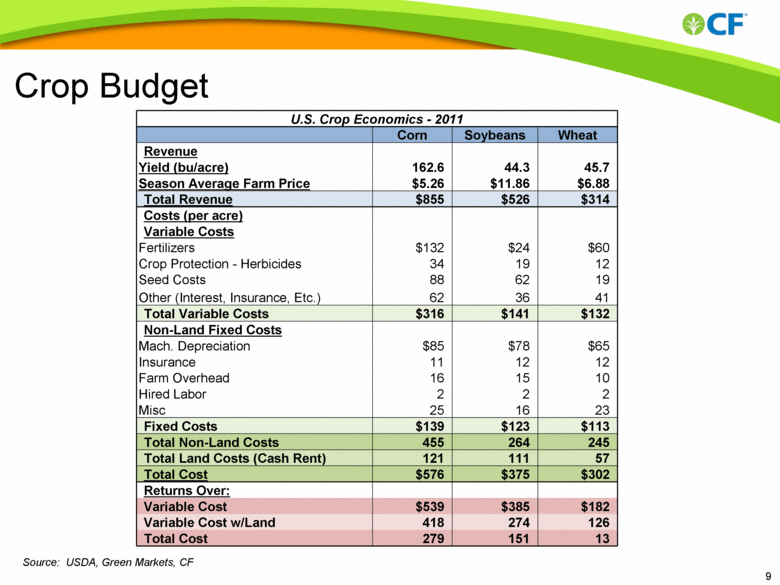
U.S. Crop Economics - 2011 Corn Soybeans Wheat Revenue Yield (bu/acre) 162.6 44.3 45.7 Season Average Farm Price $5.26 $11.86 $6.88 Total Revenue $855 $526 $314 Costs (per acre) Variable Costs Fertilizers $132 $24 $60 Crop Protection - Herbicides 34 19 12 Seed Costs 88 62 19 Other (Interest, Insurance, Etc.) 62 36 41 Total Variable Costs $316 $141 $132 Non-Land Fixed Costs Mach. Depreciation $85 $78 $65 Insurance 11 12 12 Farm Overhead 16 15 10 Hired Labor 2 2 2 Misc 25 16 23 Fixed Costs $139 $123 $113 Total Non-Land Costs 455 264 245 Total Land Costs (Cash Rent) 121 111 57 Total Cost $576 $375 $302 Returns Over: Variable Cost $539 $385 $182 Variable Cost w/Land 418 274 126 Total Cost 279 151 13 Source: USDA, Green Markets, CF Crop Budget |
|
|
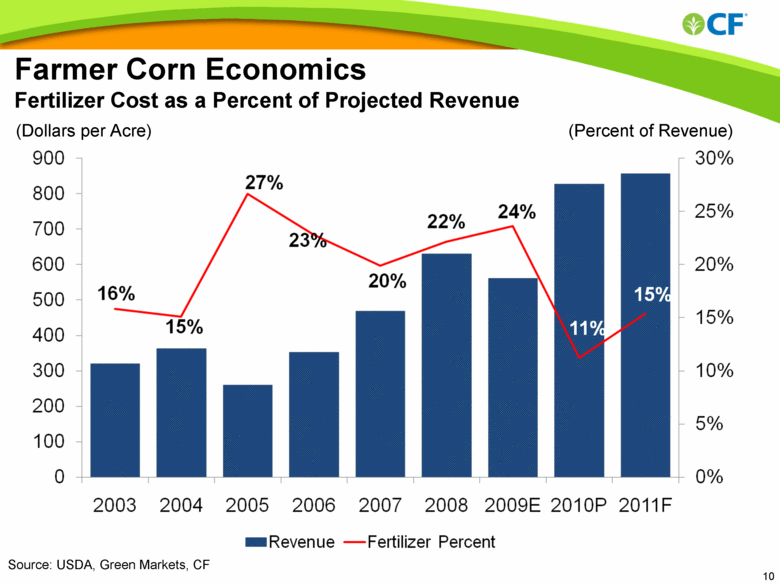
Source: USDA, Green Markets, CF Farmer Corn Economics Fertilizer Cost as a Percent of Projected Revenue (Dollars per Acre) (Percent of Revenue) |
|
|
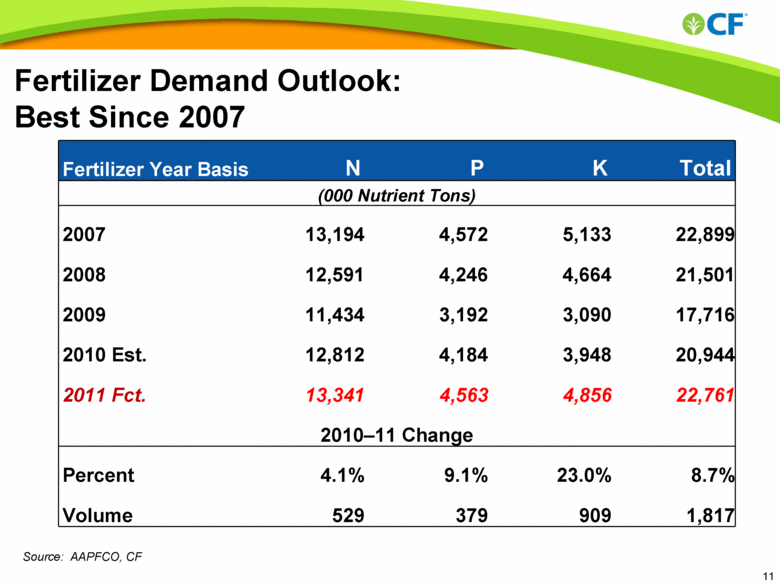
Source: AAPFCO, CF Fertilizer Demand Outlook: Best Since 2007 Fertilizer Year Basis N P K Total (000 Nutrient Tons) 2007 13,194 4,572 5,133 22,899 2008 12,591 4,246 4,664 21,501 2009 11,434 3,192 3,090 17,716 2010 Est. 12,812 4,184 3,948 20,944 2011 Fct. 13,341 4,563 4,856 22,761 2010–11 Change Percent 4.1% 9.1% 23.0% 8.7% Volume 529 379 909 1,817 |
|
|
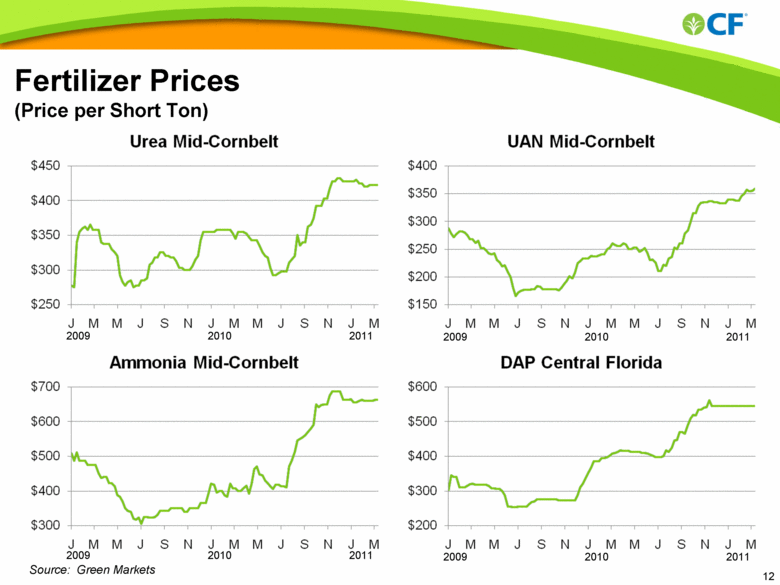
Fertilizer Prices (Price per Short Ton) Source: Green Markets 2009 2010 2011 2009 2010 2011 2009 2010 2011 2009 2010 2011 Urea Mid-Cornbelt UAN Mid-Cornbelt Ammonia Mid-Cornbelt DAP Central Florida |
|
|
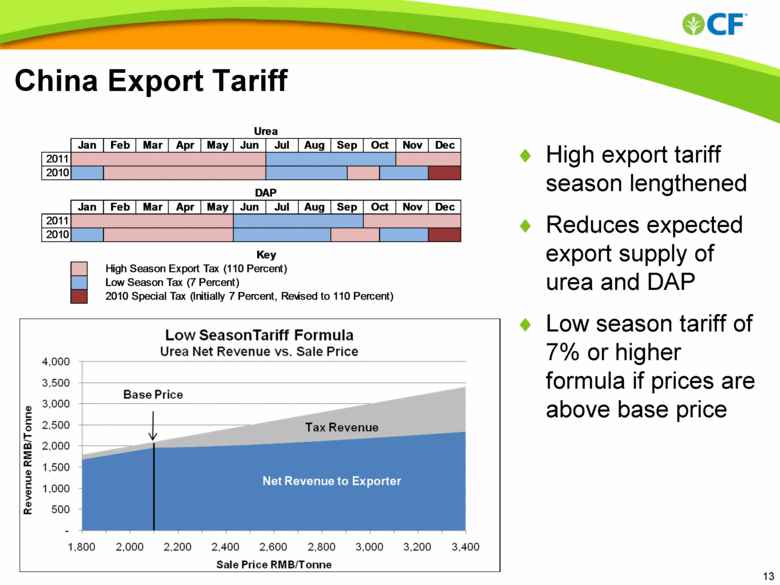
China Export Tariff High export tariff season lengthened Reduces expected export supply of urea and DAP Low season tariff of 7% or higher formula if prices are above base price 2011 2010 2011 2010 High Season Export Tax (110 Percent) Low Season Tax (7 Percent) 2010 Special Tax (Initially 7 Percent, Revised to 110 Percent) Urea DAP Key Jul Aug Sep Oct Nov Dec Jan Feb Mar Apr May Jun Jul Aug Sep Oct Nov Dec Jan Feb Mar Apr May Jun |
|
|
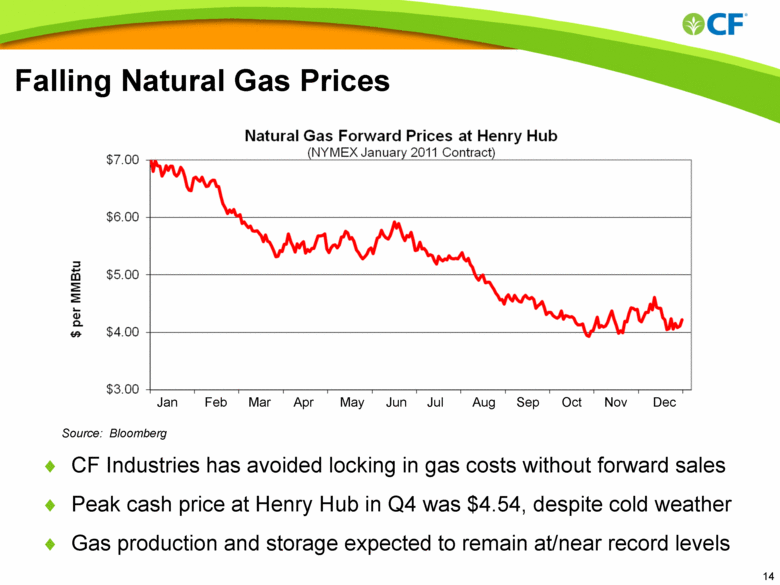
Falling Natural Gas Prices Jan Feb Mar Apr May Jun Jul Aug Sep Oct Nov Dec CF Industries has avoided locking in gas costs without forward sales Peak cash price at Henry Hub in Q4 was $4.54, despite cold weather Gas production and storage expected to remain at/near record levels Source: Bloomberg Natural Gas Forward Prices at Henry Hub (NYMEX January 2011 Contract) |
|
|
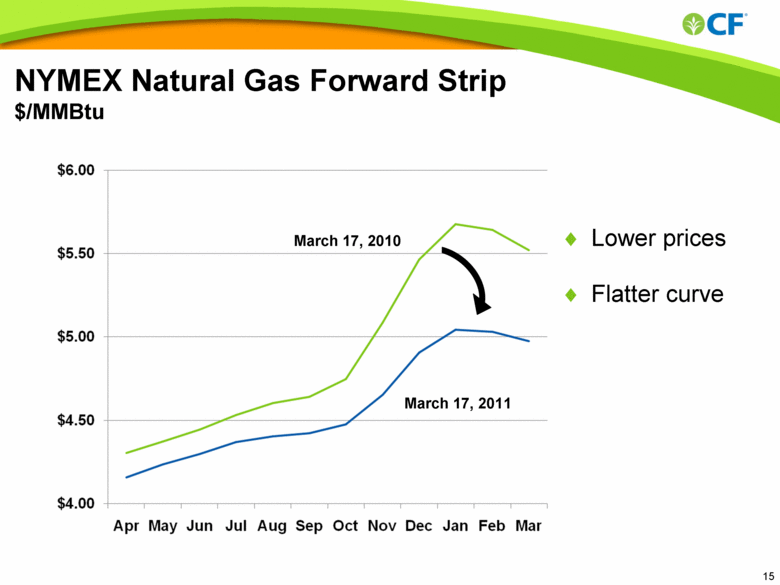
NYMEX Natural Gas Forward Strip $/MMBtu March 17, 2010 March 17, 2011 Lower prices Flatter curve |
|
|
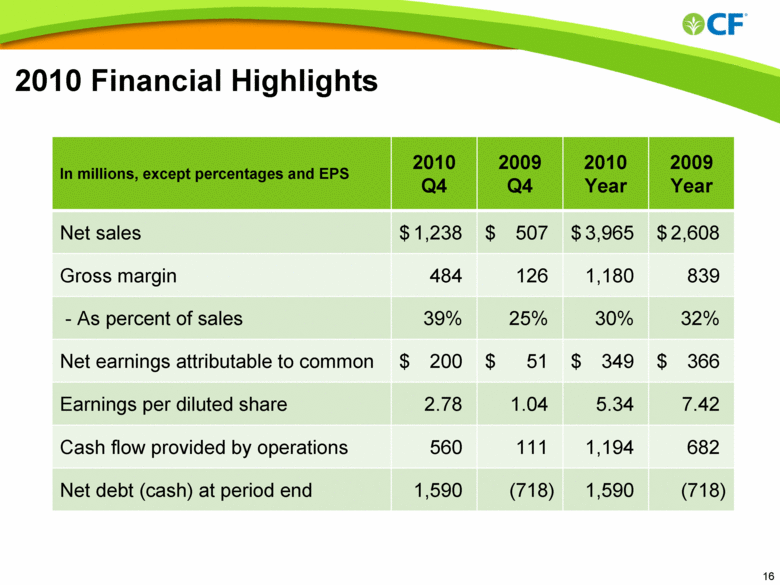
2010 Financial Highlights In millions, except percentages and EPS 2010 Q4 2009 Q4 2010 Year 2009 Year Net sales $ 1,238 $ 507 $ 3,965 $ 2,608 Gross margin 484 126 1,180 839 - As percent of sales 39% 25% 30% 32% Net earnings attributable to common $ 200 $ 51 $ 349 $ 366 Earnings per diluted share 2.78 1.04 5.34 7.42 Cash flow provided by operations 560 111 1,194 682 Net debt (cash) at period end 1,590 (718) 1,590 (718) |
|
|
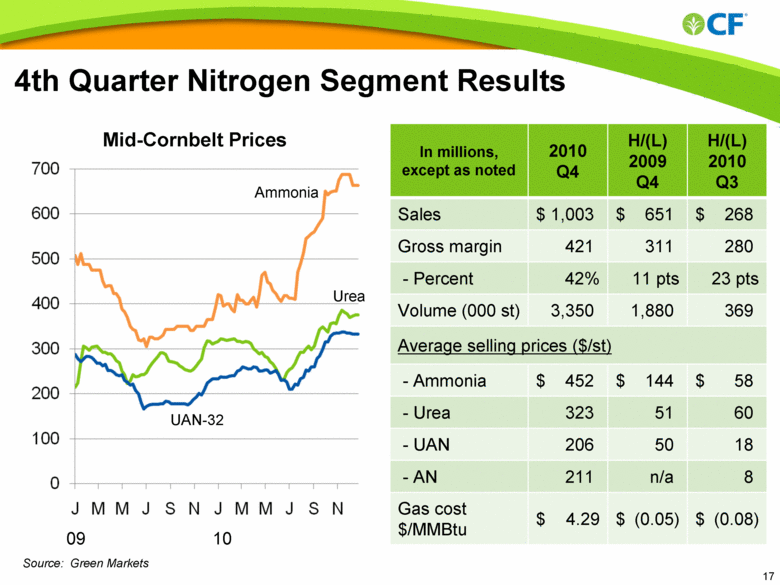
4th Quarter Nitrogen Segment Results Source: Green Markets 09 10 In millions, except as noted 2010 Q4 H/(L) 2009 Q4 H/(L) 2010 Q3 Sales $ 1,003 $ 651 $ 268 Gross margin 421 311 280 - Percent 42% 11 pts 23 pts Volume (000 st) 3,350 1,880 369 Average selling prices ($/st) - Ammonia $ 452 $ 144 $ 58 - Urea 323 51 60 - UAN 206 50 18 - AN 211 n/a 8 Gas cost $/MMBtu $ 4.29 $ (0.05) $ (0.08) Ammonia Urea UAN-32 Mid-Cornbelt Prices |
|
|
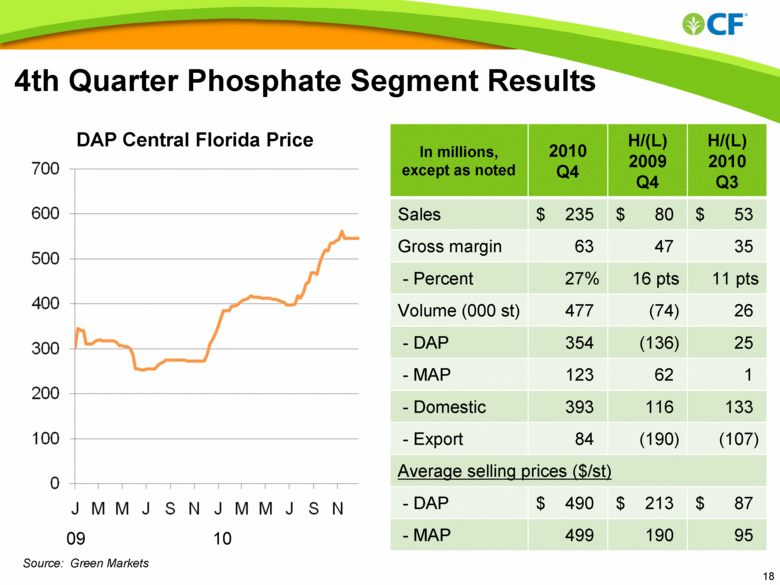
4th Quarter Phosphate Segment Results Source: Green Markets 09 10 In millions, except as noted 2010 Q4 H/(L) 2009 Q4 H/(L) 2010 Q3 Sales $ 235 $ 80 $ 53 Gross margin 63 47 35 - Percent 27% 16 pts 11 pts Volume (000 st) 477 (74) 26 - DAP 354 (136) 25 - MAP 123 62 1 - Domestic 393 116 133 - Export 84 (190) (107) Average selling prices ($/st) - DAP $ 490 $ 213 $ 87 - MAP 499 190 95 DAP Central Florida Price |
|
|
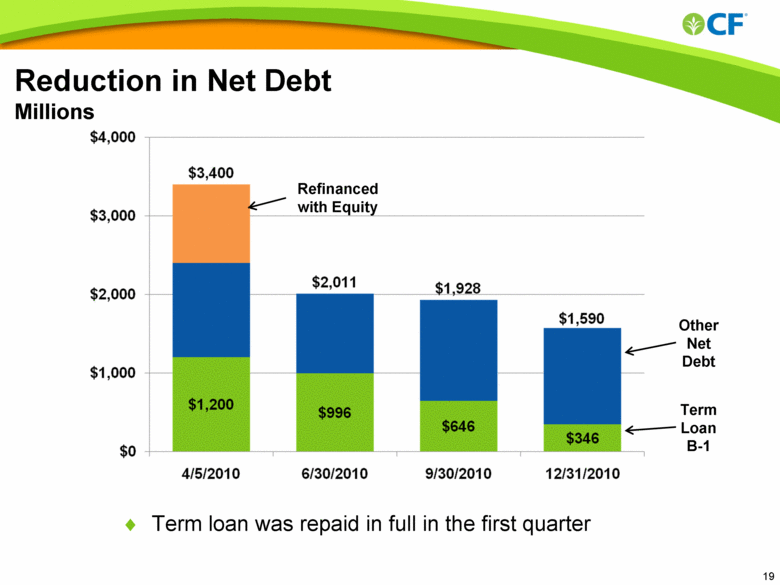
Reduction in Net Debt Millions Other Net Debt Term Loan B-1 Refinanced with Equity Term loan was repaid in full in the first quarter |
|
|
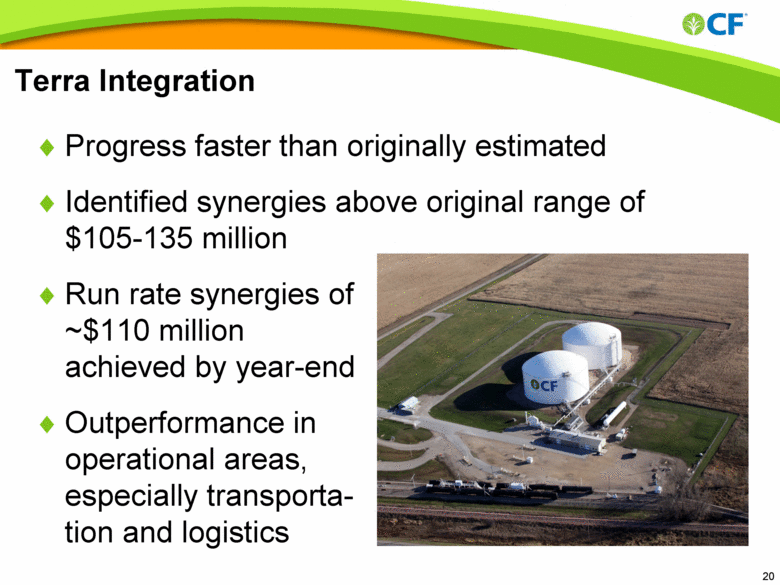
Terra Integration Progress faster than originally estimated Identified synergies above original range of $105-135 million Run rate synergies of ~$110 million achieved by year-end Outperformance in operational areas, especially transportation and logistics |
|
|
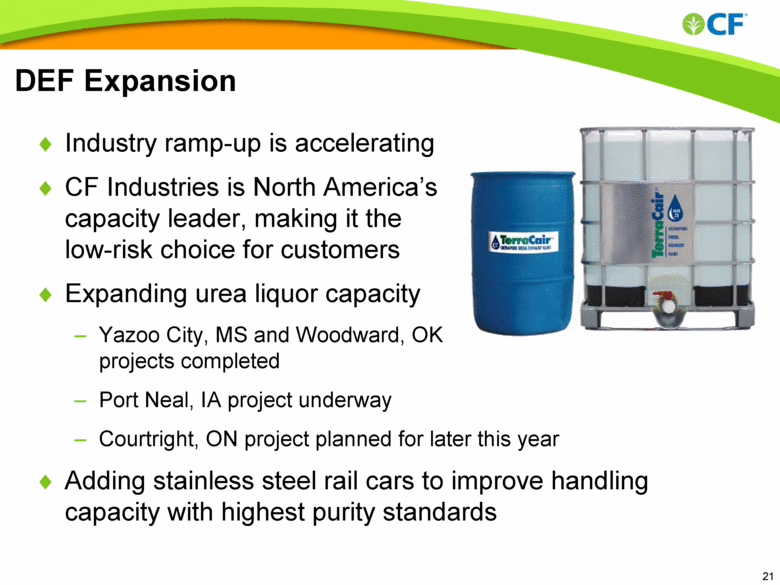
DEF Expansion Industry ramp-up is accelerating CF Industries is North America’s capacity leader, making it the low-risk choice for customers Expanding urea liquor capacity Yazoo City, MS and Woodward, OK projects completed Port Neal, IA project underway Courtright, ON project planned for later this year Adding stainless steel rail cars to improve handling capacity with highest purity standards |
|
|
2010 Accomplishments Acquired Terra, closing and completing financing in 45 days Demonstrated integration progress ahead of target Identified synergies beyond $105-$135 million target Accelerated achievement ($110 million run rate by year-end) Succeeded to make transition seamless to customers Delivered strong earnings and cash flow $1.2 billion operating-related cash flow in 2010 Accelerated debt repayment schedule Paid off $850 million of $1.2 billion term loan by year-end Made key investments in business New dragline, UAN expansion, DEF expansion, DF upgrades Launched a new product (MAP 10-50-0) and announced another |
|
|
Outlook/Summary High crop prices and farm profitability support strong plantings and fertilizer prices Tight supplies of UAN and phosphates Subdued natural gas costs Recent strong fertilizer prices not yet fully reflected in income statement High cash flow expected to continue Repaid term loan in full in Q1 |
|
|
For more information, please visit www.cfindustries.com |
|
|
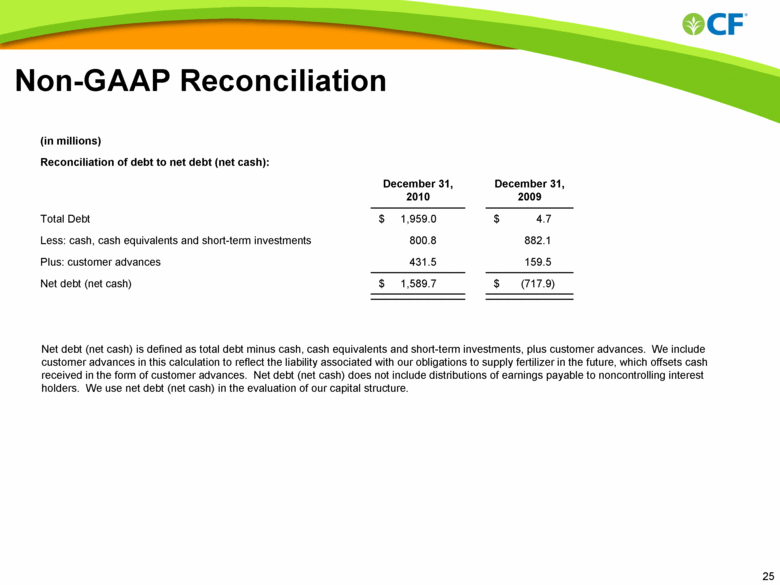
Non-GAAP Reconciliation (in millions) Reconciliation of debt to net debt (net cash): December 31, 2010 December 31, 2009 Total Debt $ 1,959.0 $ 4.7 Less: cash, cash equivalents and short-term investments 800.8 882.1 Plus: customer advances 431.5 159.5 Net debt (net cash) $ 1,589.7 $ (717.9) Net debt (net cash) is defined as total debt minus cash, cash equivalents and short-term investments, plus customer advances. We include customer advances in this calculation to reflect the liability associated with our obligations to supply fertilizer in the future, which offsets cash received in the form of customer advances. Net debt (net cash) does not include distributions of earnings payable to noncontrolling interest holders. We use net debt (net cash) in the evaluation of our capital structure. |