Attached files
| file | filename |
|---|---|
| 8-K - WILLIS GROUP HOLDINGS PUBLIC LIMITED COMPANY 8-K - WILLIS TOWERS WATSON PLC | a6652922.htm |
EXHIBIT 99.1

WILLIS GROUP HOLDINGS FACT BOOK For the quarter and year ended December 31, 2010
Willis snapshot Leading global insurance broker Broad range of professional insurance, reinsurance, risk management, financial and human resource consulting and actuarial services Global distribution capabilities to meet risk management needs of large multinational and middle market clients More than 400 offices in 120 countries, with approximately 17,000 employees 2010 total revenues $3.3 billion Strong sales culture and relentless focus on cost control Market capitalization $6.7 billion (as of March 17, 2011)

2010 review
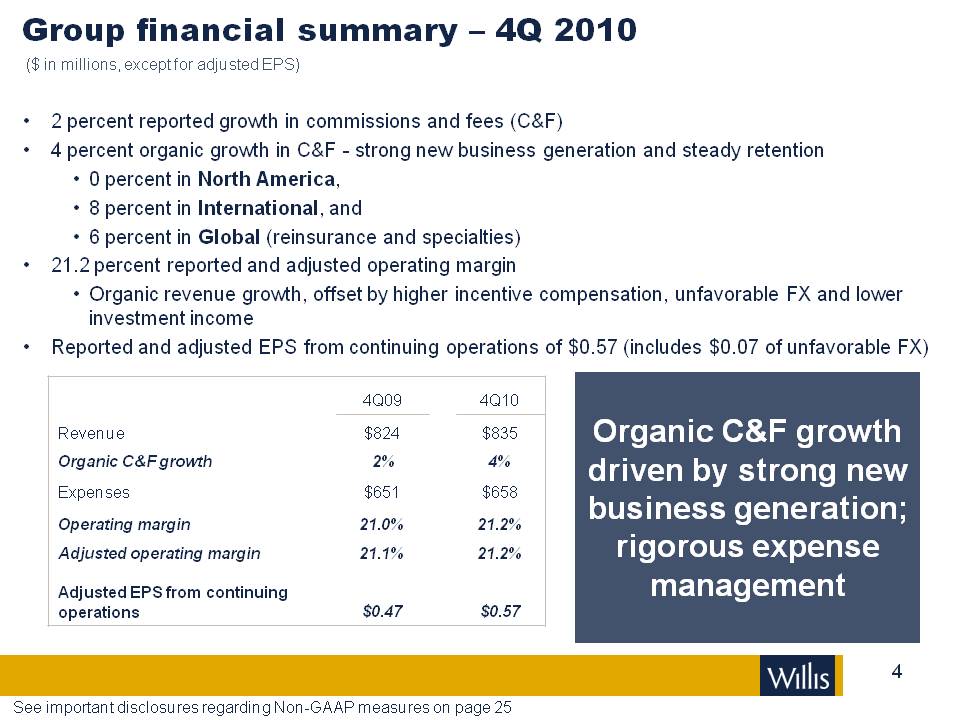
Group financial summary – 4Q 2010 2 percent reported growth in commissions and fees (C&F) 4 percent organic growth in C&F - strong new business generation and steady retention 0 percent in North America, 8 percent in International, and 6 percent in Global (reinsurance and specialties) 21.2 percent reported and adjusted operating margin Organic revenue growth, offset by higher incentive compensation, unfavorable FX and lower investment income Reported and adjusted EPS from continuing operations of $0.57 (includes $0.07 of unfavorable FX) See important disclosures regarding Non-GAAP measures on page 25 ($ in millions, except for adjusted EPS) Organic C&F growth driven by strong new business generation; rigorous expense management 4Q09 4Q10 Revenue $824 $835 Organic C&F growth 2% 4% Expenses $651 $658 Operating margin 21.0% 21.2% Adjusted operating margin 21.1% 21.2% Adjusted EPS from continuing operations $0.47 $0.57
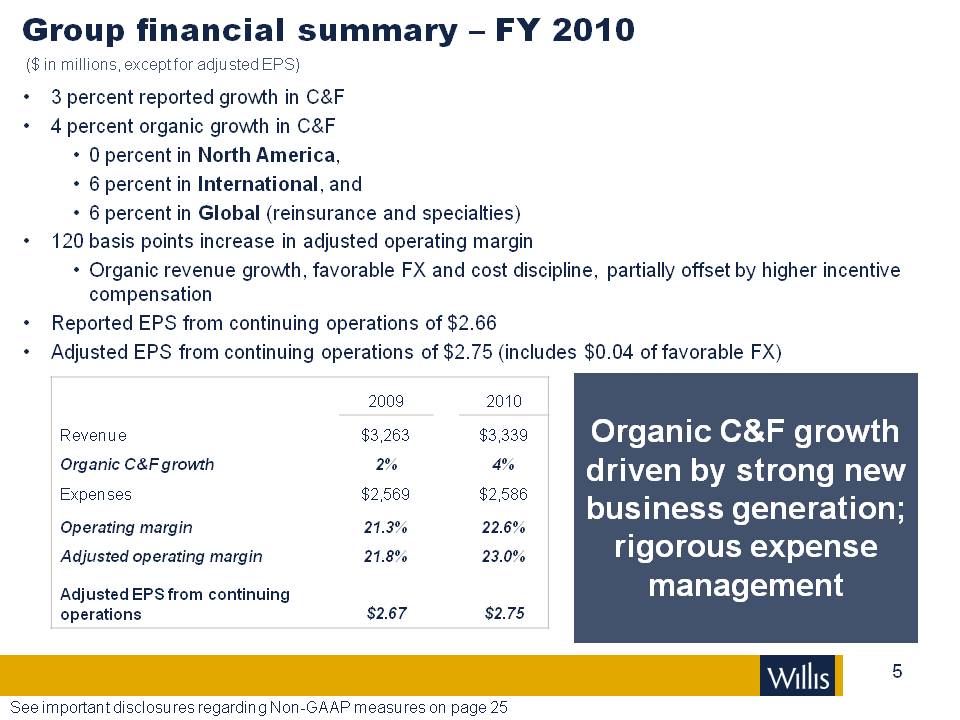
Group financial summary – FY 2010 3 percent reported growth in C&F4 percent organic growth in C&F 0 percent in North America, 6 percent in International, and 6 percent in Global (reinsurance and specialties) 120 basis points increase in adjusted operating margin Organic revenue growth, favorable FX and cost discipline, partially offset by higher incentive compensation Reported EPS from continuing operations of $2.66 Adjusted EPS from continuing operations of $2.75 (includes $0.04 of favorable FX) Organic C&F growth driven by strong new business generation; rigorous expense management ($ in millions, except for adjusted EPS) See important disclosures regarding Non-GAAP measures on page 25 2009 2010 Revenue $3,263 $3,339 Organic C&F growth 2% 4% Expenses $2,569 $2,586 Operating margin 21.3% 22.6% Adjusted operating margin 21.8% 23.0% Adjusted EPS from continuing operations $2.67 $2.75
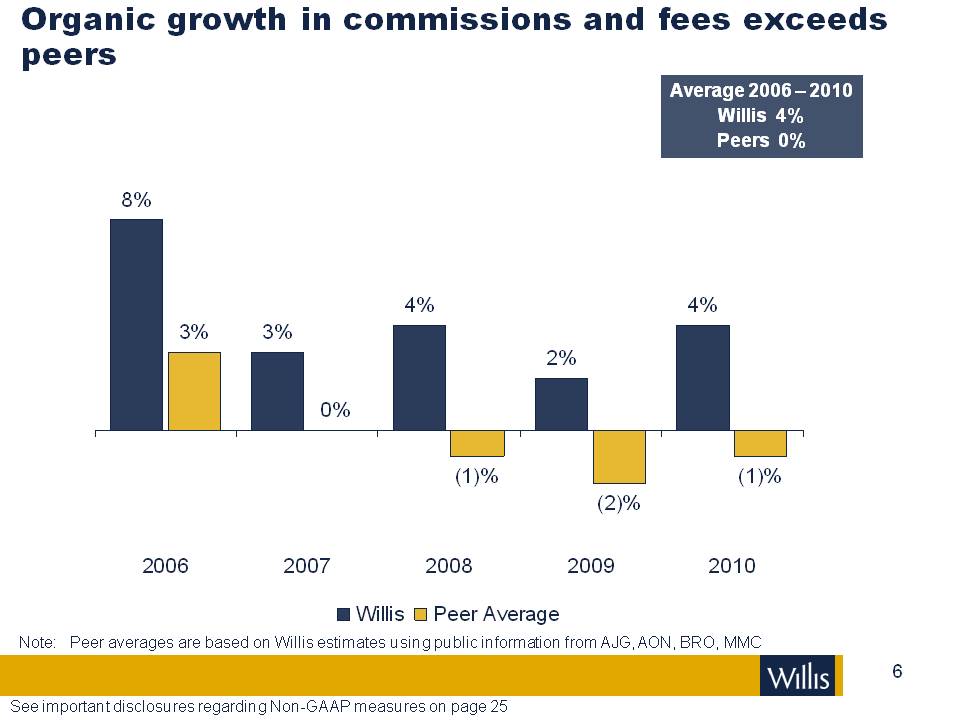
Organic growth in commissions and fees exceeds peers Average 2006 – 2010 Willis 4% Peers 0% Note: Peer averages are based on Willis estimates using public information from AJG, AON, BRO, MMC See important disclosures regarding Non-GAAP measures on page 25 8% 3% 0% 4% (1)% 2% (2)% 2006 2007 2008 2009 2010 Willis Peer Average
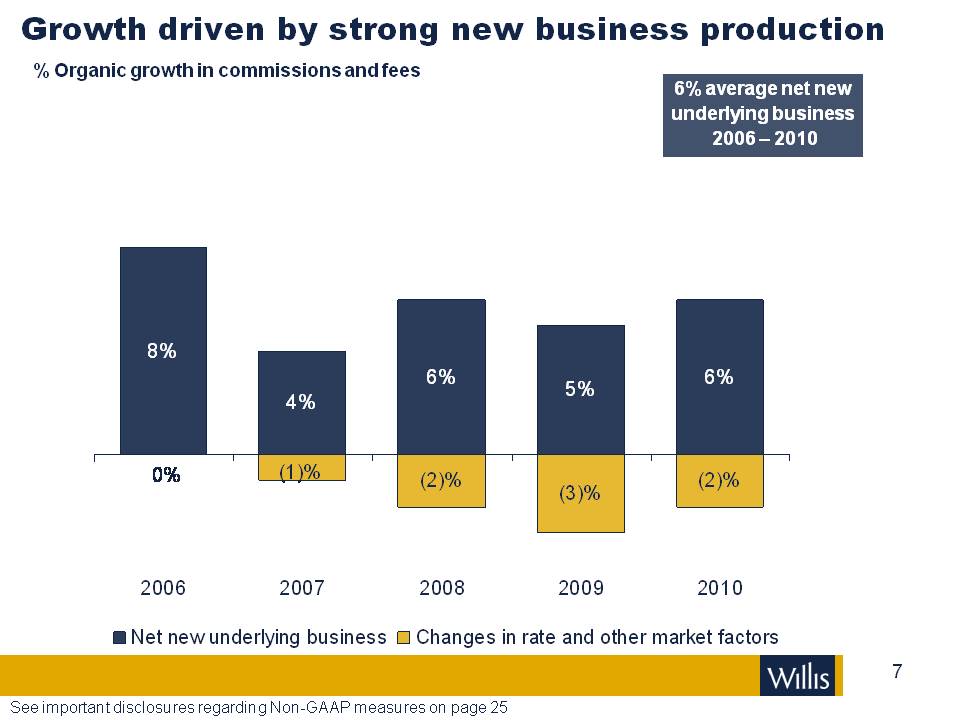
Growth driven by strong new business production % Organic growth in commissions and fees See important disclosures regarding Non-GAAP measures on page 25 6% average net new underlying business 2006 – 2010 Changes in rate and other market factors 8% 0% 4% (1)% 6% (2)% 5% (3)%
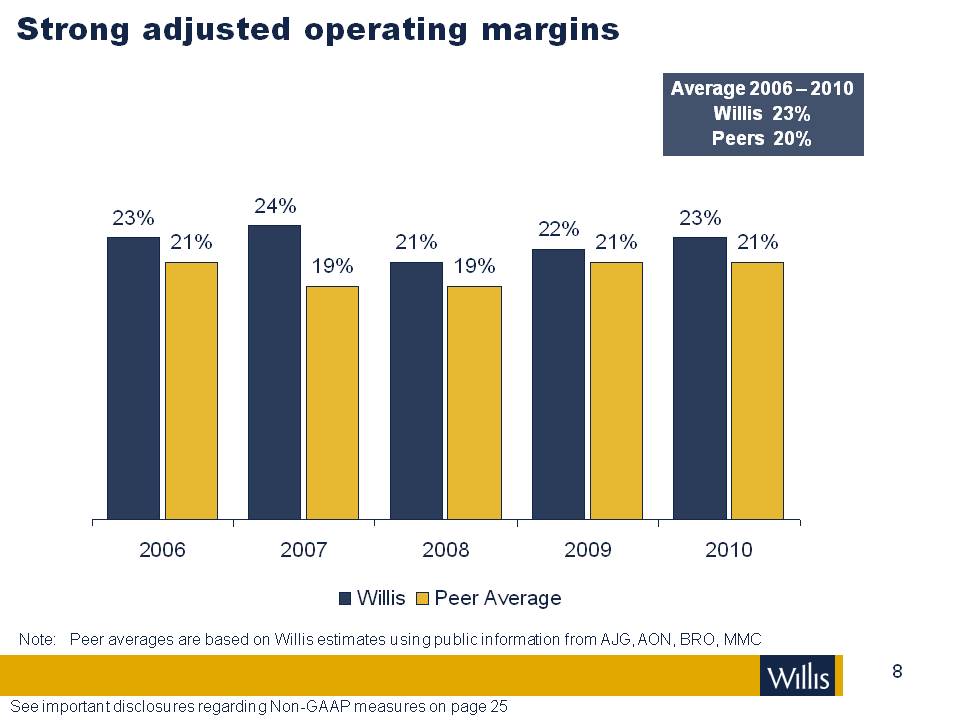
Strong adjusted operating margins Average 2006 – 2010 Willis 23% Peers 20% See important disclosures regarding Non-GAAP measures on page 25 Note: Peer averages are based on Willis estimates using public information from AJG, AON, BRO, MMC 23% 21% 24% 19% 22% 2006 2007 2008 2009 2010
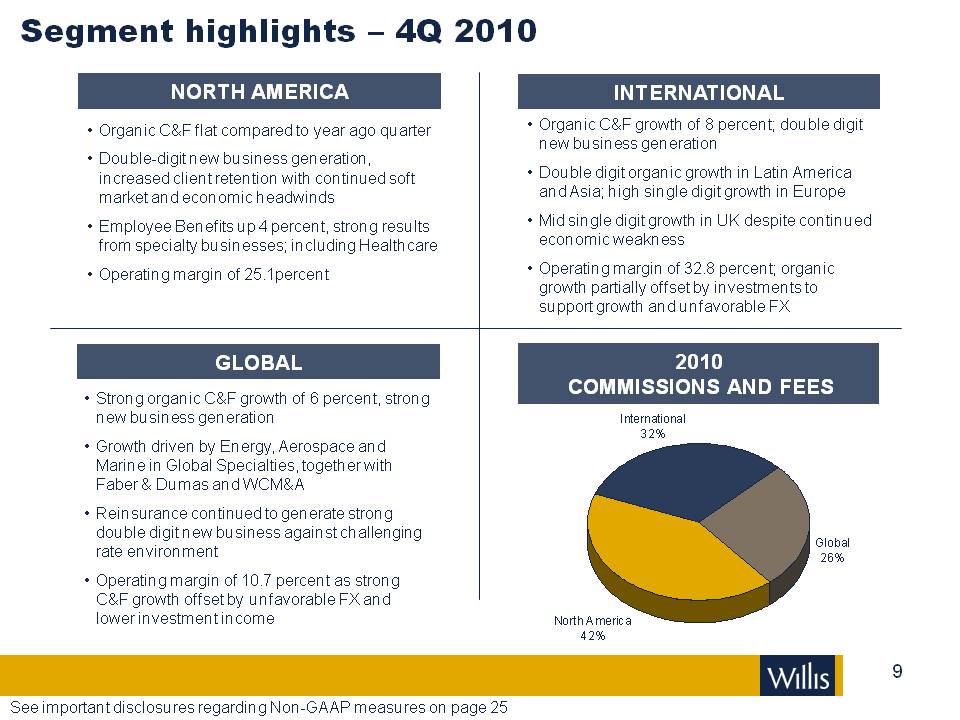
Segment highlights – 4Q 2010 NORTH AMERICA INTERNATIONAL Organic C&F flat compared to year ago quarter Double-digit new business generation, increased client retention with continued soft market and economic headwinds Employee Benefits up 4 percent, strong results from specialty businesses; including Healthcare Operating margin of 25.1 percent Organic C&F growth of 8 percent; double digit new business generation Double digit organic growth in Latin America and Asia; high single digit growth in Europe Mid single digit growth in UK despite continued economic weakness Operating margin of 32.8 percent; organic growth partially offset by investments to support growth and unfavorable FX GLOBAL Strong organic C&F growth of 6 percent, strong new business generation Growth driven by Energy, Aerospace and Marine in Global Specialties, together with Faber & Dumas and WCM&A Reinsurance continued to generate strong double digit new business against challenging rate environment Operating margin of 10.7 percent as strong C&F growth offset by unfavorable FX and lower investment income 2010 COMMISSIONS AND FEES See important disclosures regarding Non-GAAP measures on page 25 32% 26% 42%
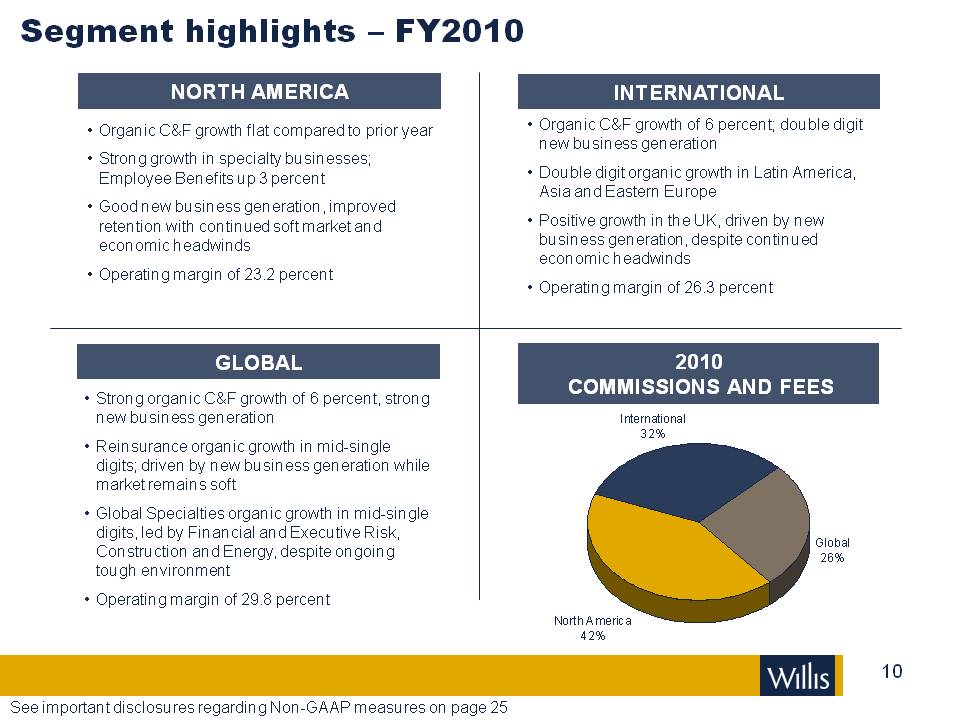
Segment highlights – FY2010 NORTH AMERICA INTERNATIONAL Organic C&F growth flat compared to prior year Strong growth in specialty businesses; Employee Benefits up 3 percent Good new business generation, improved retention with continued soft market and economic headwinds Operating margin of 23.2 percent Organic C&F growth of 6 percent; double digit new business generation Double digit organic growth in Latin America, Asia and Eastern EuropePositive growth in the UK, driven by new business generation, despite continued economic headwinds Operating margin of 26.3 percent GLOBAL Strong organic C&F growth of 6 percent, strong new business generation Reinsurance organic growth in mid-single digits; driven by new business generation while market remains soft Global Specialties organic growth in mid-single digits, led by Financial and Executive Risk, Construction and Energy, despite ongoing tough environment Operating margin of 29.8 percent 2010 COMMISSIONS AND FEES See important disclosures regarding Non-GAAP measures on page 25 42% 32% 26%
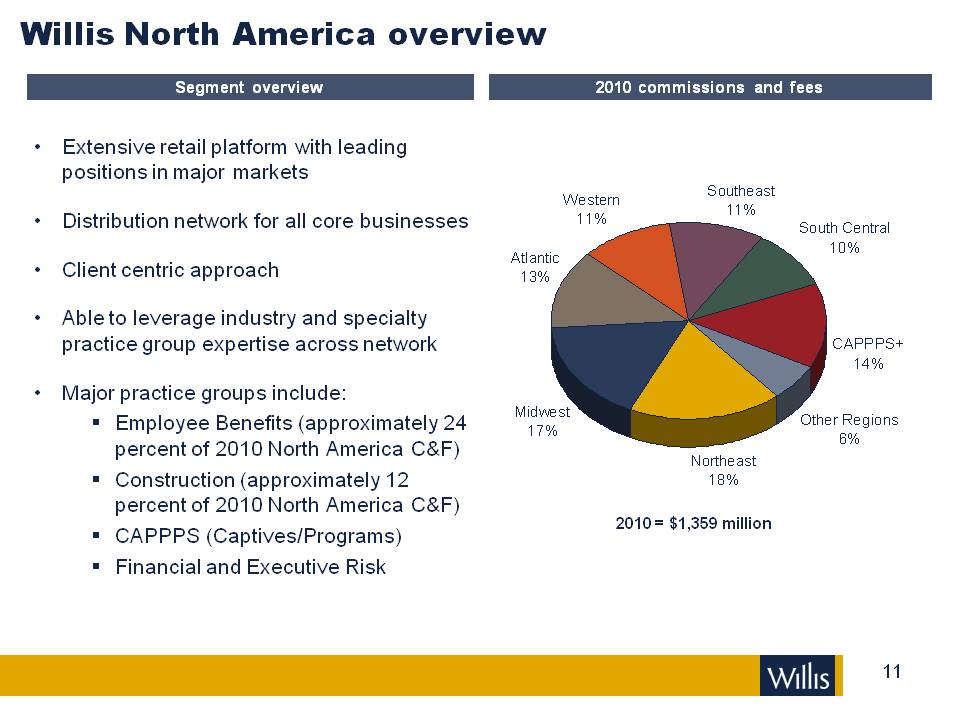
Willis North America overview Segment overview 2010 commissions and fees 2010 = $1,359 million Extensive retail platform with leading positions in major markets Distribution network for all core businesses Client centric approach Able to leverage industry and specialty practice group expertise across network Major practice groups include: Employee Benefits (approximately 24 percent of 2010 North America C&F) Construction (approximately 12 percent of 2010 North America C&F) CAPPPS (Captives/Programs) Financial and Executive Risk Western 11% Southeast 11% South Central 10% CAPPPS+ 14% Other Regions 6% Northeast 18% Midwest 17% Atlantic 13%
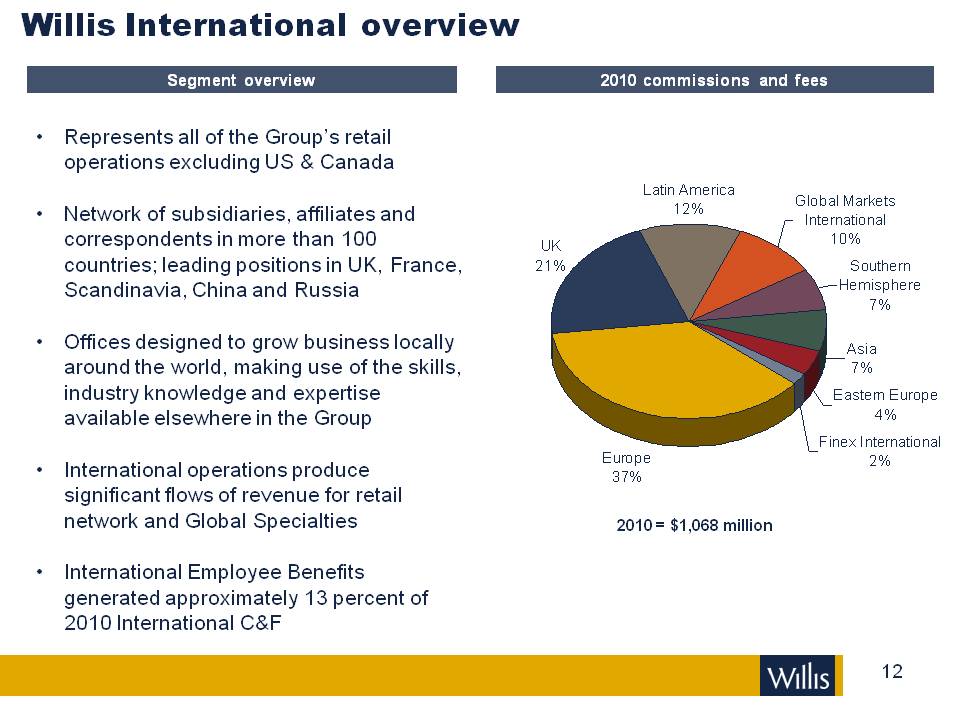
Segment overview 2010 commissions and fees Willis International overview Represents all of the Group’s retail operations excluding US & Canada Network of subsidiaries, affiliates and correspondents in more than 100 countries; leading positions in UK, France, Scandinavia, China and Russia Offices designed to grow business locally around the world, making use of the skills, industry knowledge and expertise available elsewhere in the Group International operations produce significant flows of revenue for retail network and Global Specialties International Employee Benefits generated approximately 13 percent of 2010 International C&F 2010 = $1,068 million UK 21% Latin America 12% Global Markets International 10% Southern Hemisphere 7% Asia 7% Eastern Europe 4% Finex International 2% Europe 37%
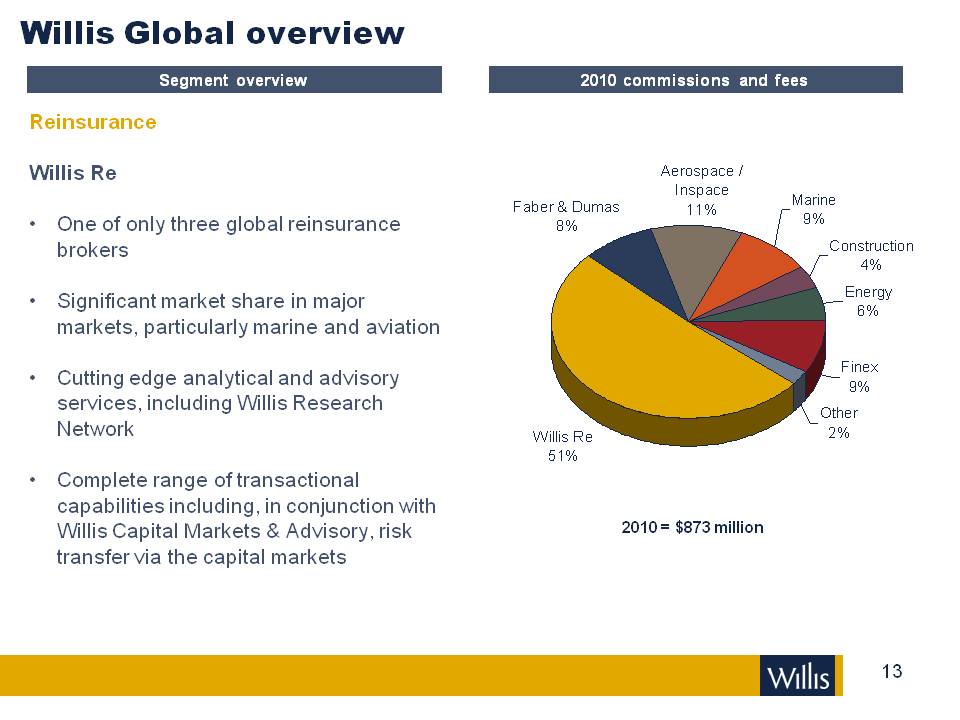
Segment overview 2010 commissions and fees 2010 = $873 million Willis Global overview Reinsurance Willis Re One of only three global reinsurance brokers Significant market share in major markets, particularly marine and aviation Cutting edge analytical and advisory services, including Willis Research Network Complete range of transactional capabilities including, in conjunction with Willis Capital Markets & Advisory, risk transfer via the capital markets Faber & Dumas 8% Aerospace Inspace 11% Marine 9% Construction 4% Energy 6% Finex 9% Other 2% Willis Re 51%
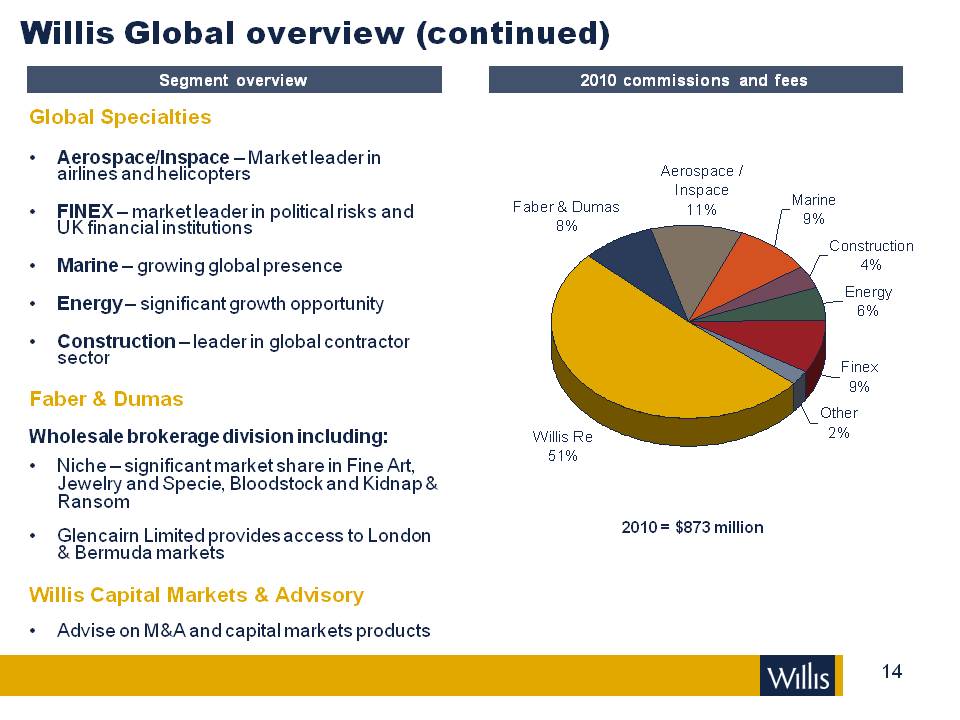
Segment overview 2010 commissions and fees Willis Global overview (continued) Global Specialties Aerospace/Inspace – Market leader in airlines and helicopters FINEX – market leader in political risks and UK financial institutions Marine – growing global presence Energy – significant growth opportunity Construction – leader in global contractor sector Faber & Dumas Wholesale brokerage division including: Niche – significant market share in Fine Art, Jewelry and Specie, Bloodstock and Kidnap & Ransom Glencairn Limited provides access to London & Bermuda markets Willis Capital Markets & Advisory Advise on M&A and capital markets products 2010 = $873 million Faber & Dumas 8% Aerospace Inspace 11% Marine 9% Construction 4% Energy 6% Finex 9% Other 2% Willis Re 51%
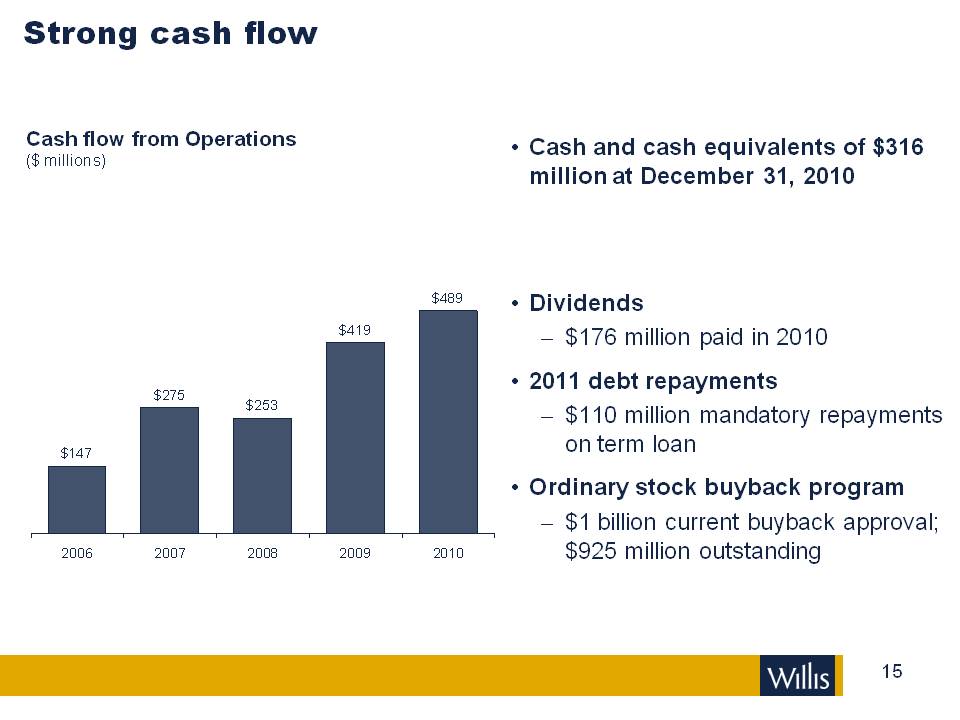
Cash flow from Operations ($ millions) Strong cash flow Cash and cash equivalents of $316 million at December 31, 2010 Dividends $176 million paid in 2010 2011 debt repayments $110 million mandatory repayments on term loan Ordinary stock buyback program $1 billion current buyback approval; $925 million outstanding 2006 2007 2008 2009 2010 $147 $275 $253 $419 $489
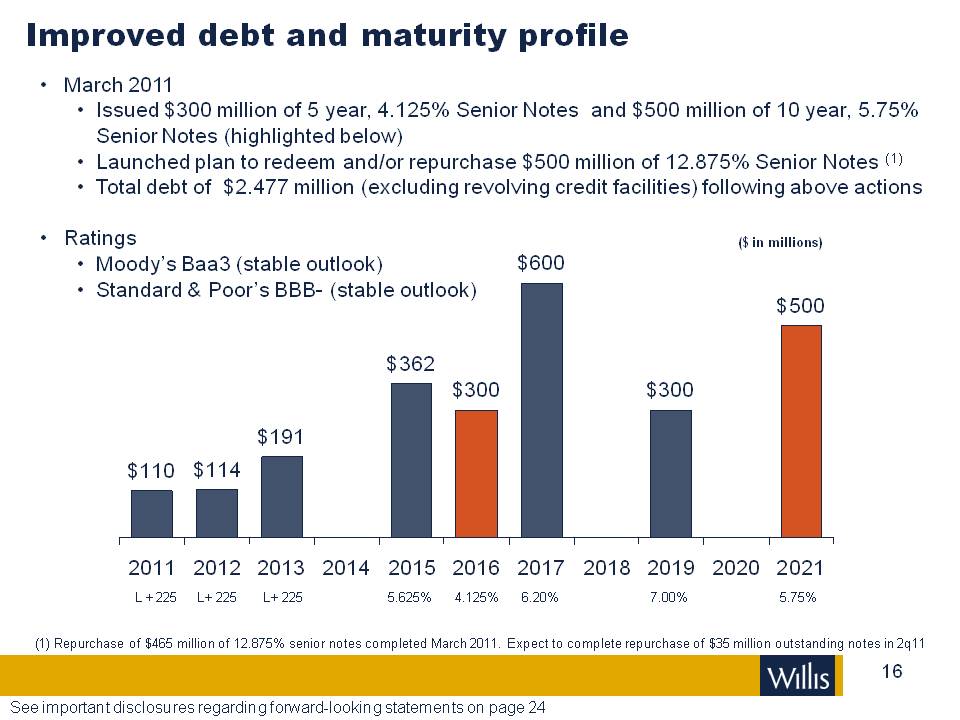
March 2011 Issued $300 million of 5 year, 4.125% Senior Notes and $500 million of 10 year, 5.75% Senior Notes (highlighted below) Launched plan to redeem and/or repurchase $500 million of 12.875% Senior Notes (1) Total debt of $2.477 million (excluding revolving credit facilities) following above actions Ratings Moody’s Baa3 (stable outlook) Standard & Poor’s BBB- (stable outlook) ($ in millions) Improved debt and maturity profile (1) Repurchase of $465 million of 12.875% senior notes completed March 2011. Expect to complete repurchase of $35 million outstanding notes in 2q11 L + 225 L+ 225 L+ 225 5.625% 4.125% 6.20% 7.00% 5.75% See important disclosures regarding forward-looking statements on page 24 2011 2012 2013 2014 2015 2016 2017 2018 2019 2020 2021 $110 $114 $191 $362 $300 $600 $500

Looking ahead
See important disclosures regarding forward-looking statements on page 24 We thoroughly understand our clients’ needs and their industries We develop client solutions with the best markets, price and terms We relentlessly deliver quality client service We get claims paid quickly WITH INTEGRITY The Willis Cause
Delivering the Willis Cause See important disclosures regarding forward-looking statements on page 24 Realigning our business model to further grow the Company and deliver the Willis Cause - our value proposition to clients – more consistently and efficiently. For example, current and targeted initiatives include: Focusing resources on client delivery Expansion of Global Solutions to grow in Global large account segment Launch of Sales 2.0, our industry focused middle market initiative Rollout of small commercial network franchise model Global placement organization to drive aggregation of facilities, optimization of commissions, technology and process Instituting target operating models in business units and corporate Recruiting talent to drive new business Improving client retention through relentless focus on metrics and process Reorienting our culture around Delivering the Willis Cause
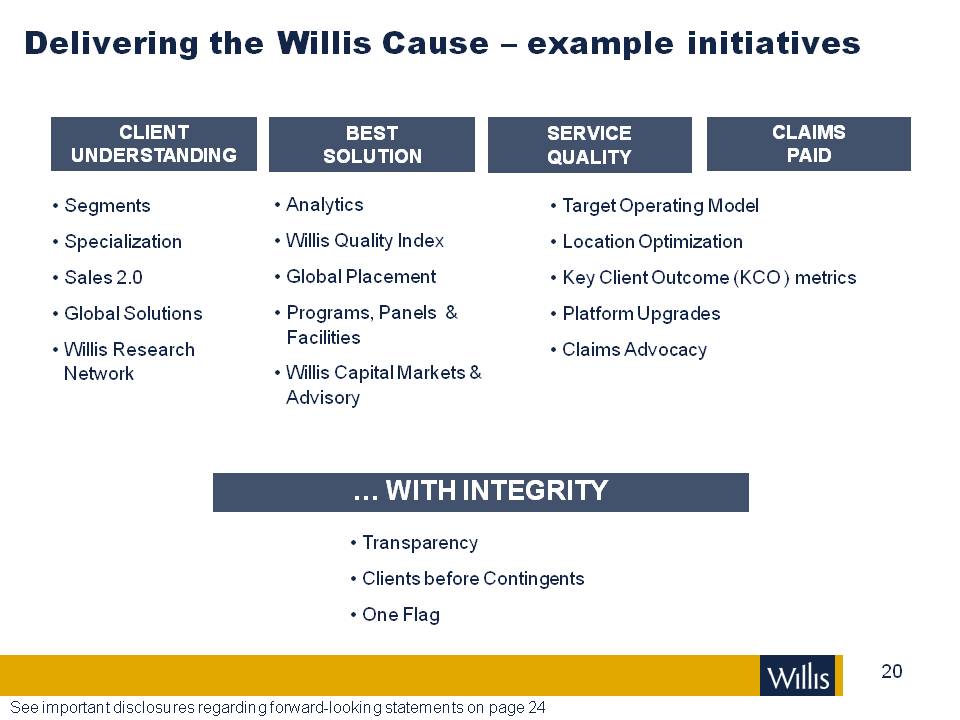
Delivering the Willis Cause – example initiatives CLIENT UNDERSTANDING SERVICE QUALITY CLAIMS PAID Segments Specialization Sales 2.0 Global Solutions Willis Research Network Analytics Willis Quality Index Global Placement Programs, Panels & Facilities Willis Capital Markets & Advisory Target Operating Model Location Optimization Key Client Outcome (KCO) metrics Platform Upgrades Claims Advocacy BEST SOLUTION See important disclosures regarding forward-looking statements on page 24 WITH INTEGRITY Transparency Clients before Contingents One Flag
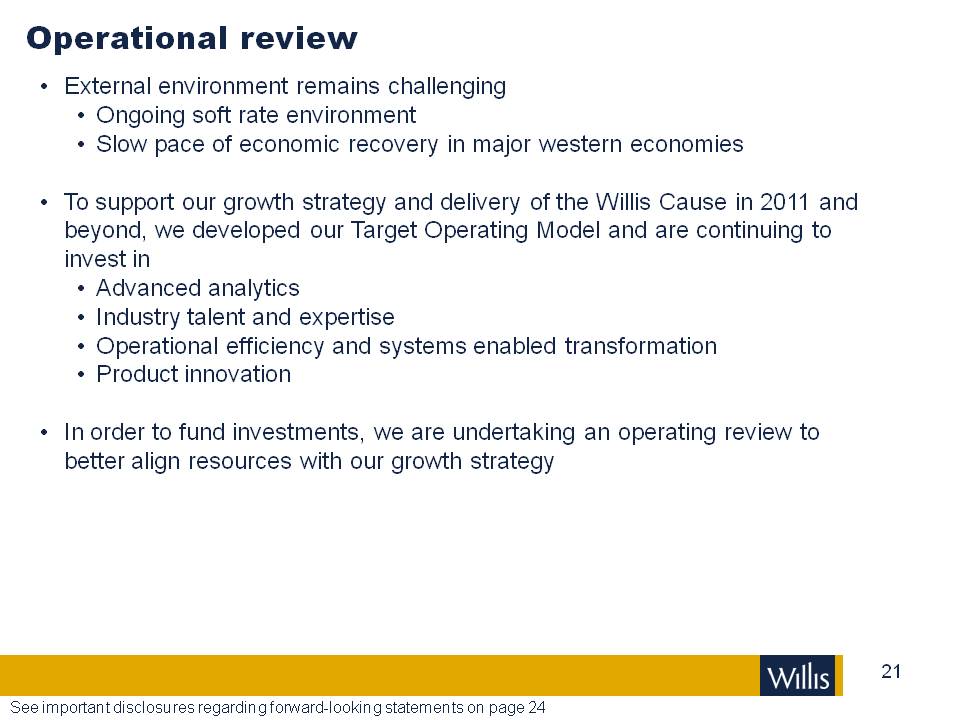
Operational review See important disclosures regarding forward-looking statements on page 24 External environment remains challenging Ongoing soft rate environment Slow pace of economic recovery in major western economies To support our growth strategy and delivery of the Willis Cause in 2011 and beyond, we developed our Target Operating Model and are continuing to invest in Advanced analytics Industry talent and expertise Operational efficiency and systems enabled transformation Product innovation In order to fund investments, we are undertaking an operating review to better align resources with our growth strategy
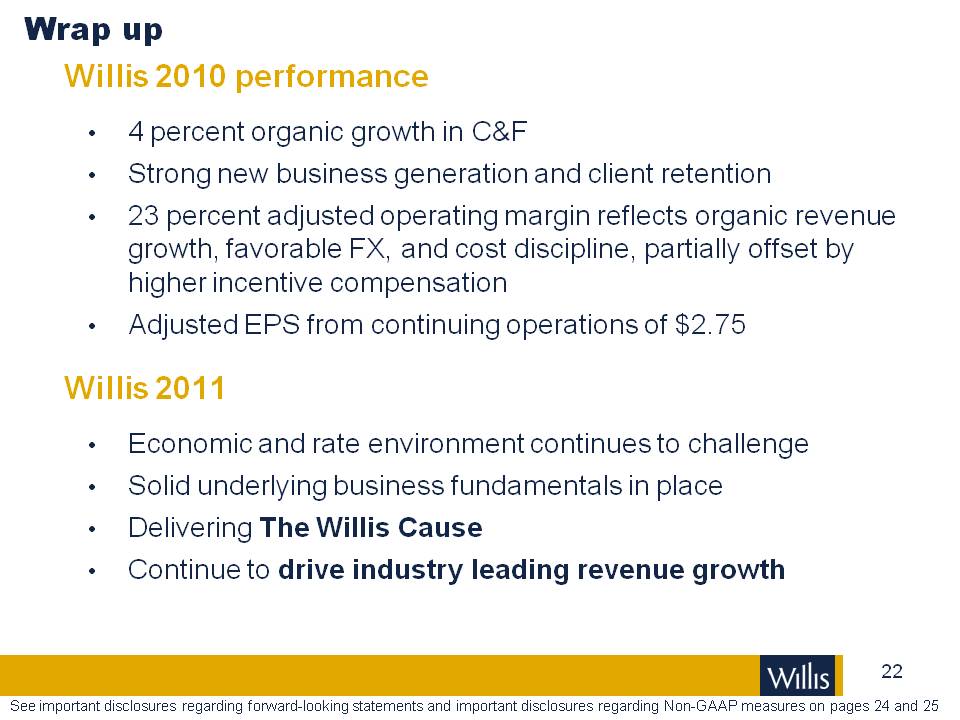
Wrap up Willis 2010 performance 4 percent organic growth in C&F Strong new business generation and client retention 23 percent adjusted operating margin reflects organic revenue growth, favorable FX, and cost discipline, partially offset by higher incentive compensation Adjusted EPS from continuing operations of $2.75 Willis 2011 Economic and rate environment continues to challenge Solid underlying business fundamentals in place Delivering The Willis Cause Continue to drive industry leading revenue growth See important disclosures regarding forward-looking statements and important disclosures regarding Non-GAAP measures on pages 24 and 25
Appendix
Important disclosures regarding forward-looking statements This presentation contains certain “forward-looking statements” within the meaning of Section 27A of the Securities Act of 1933, and Section 21E of the Securities Exchange Act of 1934, which are intended to be covered by the safe harbors created by those laws. These forward-looking statements include information about possible or assumed future results of our operations. All statements, other than statements of historical facts, included in this document that address activities, events or developments that we expect or anticipate may occur in the future, including such things as our outlook, future capital expenditures, growth in commissions and fees, business strategies, competitive strengths, goals, the benefits of new initiatives, growth of our business and operations, plans, and references to future successes are forward-looking statements. Also, when we use the words such as ‘anticipate’, ‘believe’, ‘estimate’, ‘expect’, ‘intend’, ‘plan’, ‘probably’, or similar expressions, we are making forward-looking statements.There are important uncertainties, events and factors that could cause our actual results or performance to differ materially from those in the forward-looking statements contained in this document, including the following: the impact of any regional, national or global political, economic, business, competitive, market, environmental and regulatory conditions on our global business operations; the impact of current financial market conditions on our results of operations and financial condition, including as a result of any insolvencies or other difficulties experienced by our clients, insurance companies or financial institutions; our ability to continue to manage our significant indebtedness; our ability to compete effectively in our industry; our ability to implement or realize anticipated benefits of the 2011 operational review, the Willis Cause or any other initiative we pursue; material changes in commercial property and casualty markets generally or the availability of insurance products or changes in premiums resulting from a catastrophic event, such as a hurricane, or otherwise; the volatility or declines in other insurance markets and the premiums on which our commissions are based, but which we do not control; our ability to retain key employees and clients and attract new business; the timing or ability to carry out share repurchases or take other steps to manage our capital and the limitations in our long-term debt agreements that may restrict our ability to take these actions; any fluctuations in exchange and interest rates that could affect expenses and revenue; rating agency actions that could inhibit ability to borrow funds or the pricing thereof; a significant decline in the value of investments that fund our pension plans or changes in our pension plan funding obligations; our ability to achieve the expected strategic benefits of transactions; changes in the tax or accounting treatment of our operations; any potential impact from the US healthcare reform legislation; the potential costs and difficulties in complying with a wide variety of foreign laws and regulations and any related changes, given the global scope of our operations; our involvements in and the results of any regulatory investigations, legal proceedings and other contingencies; risks associated with non-core operations including underwriting, advisory and reputational; our exposure to potential liabilities arising from errors and omissions and other potential claims against us; and the interruption or loss of our information processing systems or failure to maintain secure information systems.The foregoing list of factors is not exhaustive and new factors may emerge from time to time that could also affect actual performance and results. For additional information see also Part I, Item 1A “Risk Factors” included in Willis’ Form 10-K for the year ended December 31, 2010, and our subsequent filings with the Securities and Exchange Commission. Copies are available online at http://www.sec.gov or on request from the Company. Although we believe that the assumptions underlying our forward-looking statements are reasonable, any of these assumptions, and therefore also the forward-looking statements based on these assumptions, could themselves prove to be inaccurate. In light of the significant uncertainties inherent in the forward-looking statements included in this presentation, our inclusion of this information is not a representation or guarantee by us that our objectives and plans will be achieved. Our forward-looking statements speak only as of the date made and we will not update these forward-looking statements unless the securities laws require us to do so. In light of these risks, uncertainties and assumptions, the forward-looking events discussed in this presentation may not occur, and we caution you against unduly relying on these forward-looking statements.

This presentation contains references to "non-GAAP financial measures" as defined in Regulation G of SEC rules. We present these measures because we believe they are of interest to the investment community and they provide additional meaningful methods of evaluating certain aspects of the Company’s operating performance from period to period on a basis that may not be otherwise apparent on a generally accepted accounting principles (GAAP) basis. These financial measures should be viewed in addition to, not in lieu of, the Company’s condensed consolidated income statements and balance sheet as of the relevant date. Consistent with Regulation G, a description of such information is provided below and a reconciliation of certain of such items to GAAP information can be found in our periodic filings with the SEC. Our method of calculating these non-GAAP financial measures may differ from other companies and therefore comparability may be limited. Important disclosures regarding Non-GAAP measures Adjusted earnings per share from continuing operations (Adjusted EPS from continuing operations) is defined as adjusted net income from continuing operations per diluted share. Adjusted net income from continuing operations is defined as net income from continuing operations, excluding certain items as set out on pages 28 and 29.Adjusted operating income is defined as operating income, excluding certain items as set out on pages 26 and 27.Adjusted operating margin is defined as the percentage of adjusted operating income to total revenues.Organic commissions & fees growth excludes: (i) the impact of foreign currency translation; (ii) the first twelve months of net commission and fee revenues generated from acquisitions; (iii) the net commission and fee revenues related to operations disposed of in each period presented; (iv) in North America, legacy contingent commissions assumed as part of the HRH acquisition and that had not been converted into higher standard commission; and (v) investment income and other income from reported revenues, as set out on pages 30 and 31. Reconciliations to GAAP measures are provided for selected non-GAAP measures.
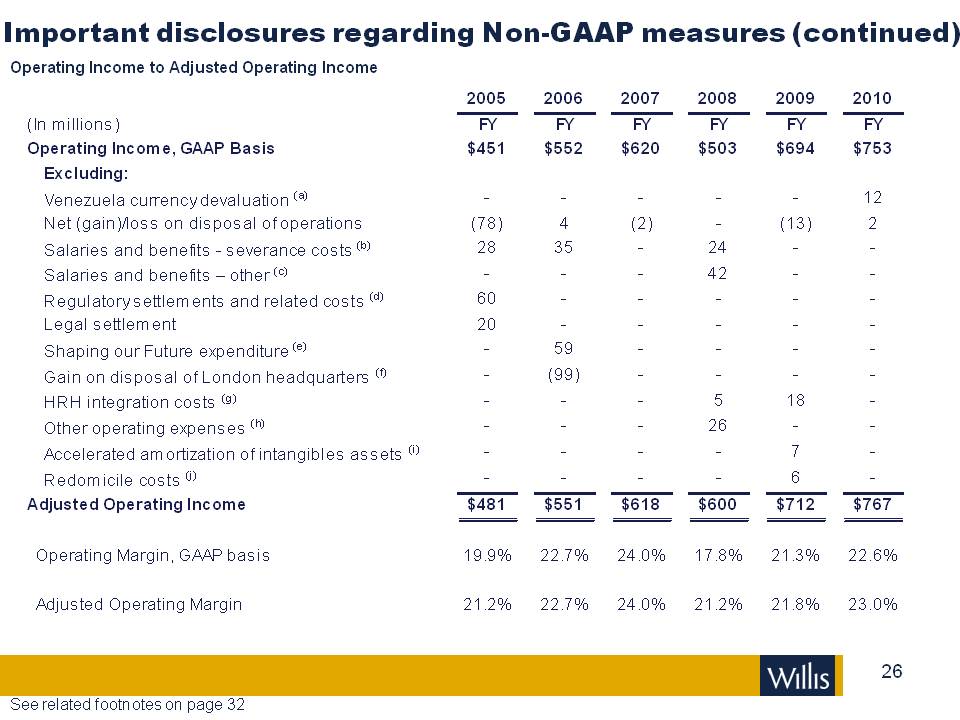
Important disclosures regarding Non-GAAP measures (continued) Operating Income to Adjusted Operating Income 2005 2006 2007 2008 2009 2010 (In millions) FY Operating Income, GAAP Basis $451 $552 $620 $503 $694 $753 Excluding: Venezuela currency devaluation (a) 12 Net (gain)/loss on disposal of operations (78) 4 (2) (13) 2 Salaries and benefits - severance costs (b) 28 35 24 Salaries and benefits – other (c) 42 Regulatory settlements and related costs (d) 60 Legal settlement 20 Shaping our Future expenditure (e) 59 Gain on disposal of London headquarters (f) (99) HRH integration costs (g) 5 18 Other operating expenses (h) 26 Accelerated amortization of intangibles assets (i) 7 Redomicile costs (j) 6 Adjusted Operating Income $481 $551 $618 $600 $712 $767 Operating Margin, GAAP basis 19.9% 22.7% 24.0% 17.8% 21.3% 22.6% Adjusted Operating Margin 21.2% 22.7% 24.0% 21.2% 21.8% 23.0% See related footnotes on page 32
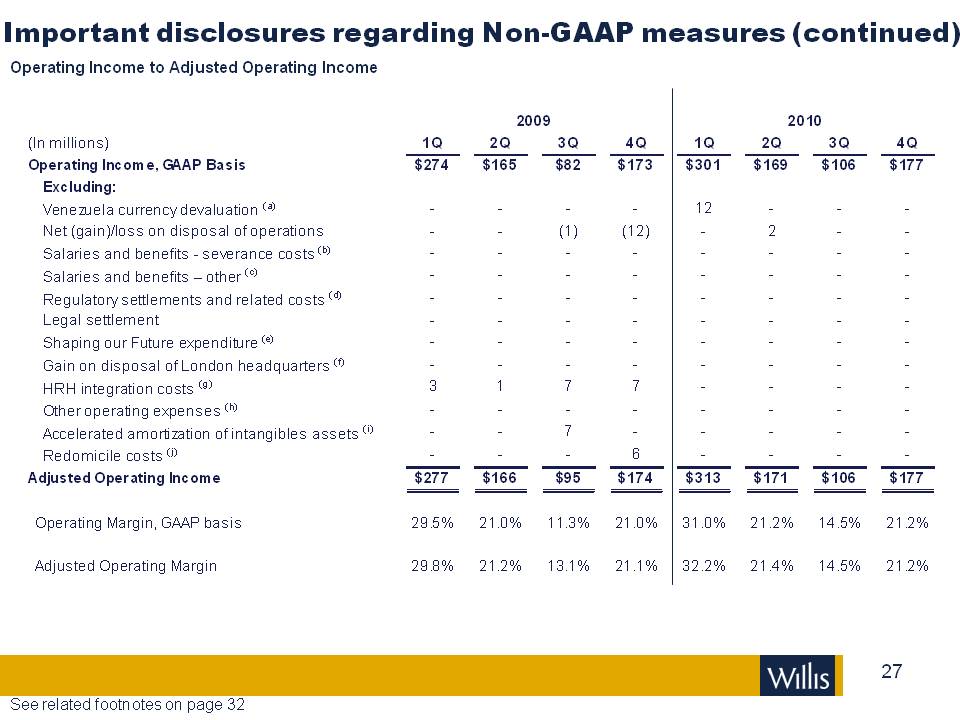
Important disclosures regarding Non GAAP measures (continued) Operating Income to Adjusted Operating Income 2009 2010 (In millions) 1Q 2Q 3Q 4Q 1Q 2Q 3Q 4Q Operating Income, GAAP Basis $274 $165 $82 $173 $301 $169 $106 $177 Excluding: Venezuela currency devaluation (a) 12 Net (gain)/loss on disposal of operations (1) (12) 2 Salaries and benefits severance costs (b) Salaries and benefits – other (c) Regulatory settlements and related costs (d) Legal settlement Shaping our Future expenditure (e) G f (f) Gain on disposal of London headquarters (f) HRH integration costs (g) 3 1 7 7 Other operating expenses (h) Accelerated amortization of intangibles assets (i) 7 Redomicile costs (j) 6 Adjusted Operating Income $277 $166 $95 $174 $313 $171 $106 $177 Operating Margin, GAAP basis 29.5% 21.0% 11.3% 21.0% 31.0% 21.2% 14.5% 21.2% Adjusted Operating Margin 29.8% 21.2% 13.1% 21.1% 32.2% 21.4% 14.5% 21.2% See related footnotes on page 32
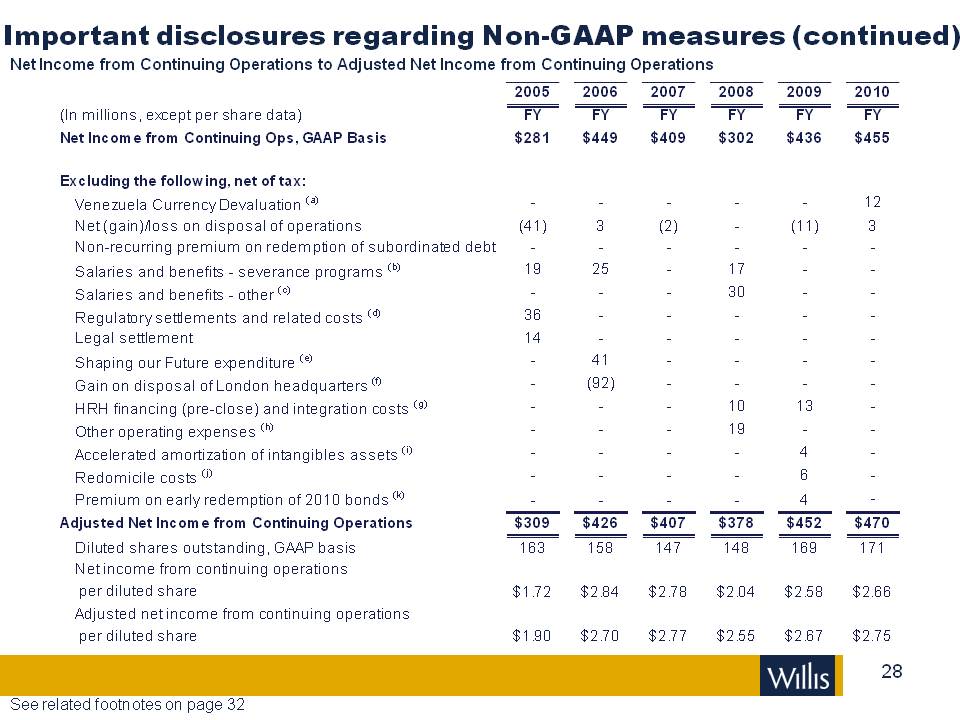
Important disclosures regarding NonGAAP measures (continued) Net Income from Continuing Operations to Adjusted Net Income from Continuing Operations (In millions, except per share data) Net Income from Continuing Ops, GAAP Basis 2005 2006 2007 2008 2009 2010 FY FY FY FY FY FY $281 $449 $409 $302 $436 $455 Excluding the following, net of tax: ) Venezuela Currency Devaluation (a 12 Net (gain)/loss on disposal of operations (41) 3 (2) (11) 3 Nonrecurring premium on redemption of subordinated debt ) Salaries and benefits severance programs (b 19 25 17 ) Salaries and benefits other (c 30 ) Regulatory settlements and related costs (d 36 Legal settlement 14 Shaping our Future expenditure (e) 41Gain on disposal of London headquarters (f) (92) Shaping our Future expenditure (e) 41 ) HRH financing (preclose) and integration costs (g10 13 ) Other operating expenses (h19 ) Accelerated amortization of intangibles assets (i4 Redomicile costs (j) 6 ) Premium on early redemption of 2010 bonds (k 4 Adjusted Net Income from Continuing Operations $309 $426 $407 $378 $452 $470 Diluted shares outstanding, GAAP basis 163 158 147 148 169 171 Net income from continuing operations per diluted share $1.72 $2.84 $2.78 $2.04 $2.58 $2.66 Adjusted net income from continuing operations per diluted share $1.90 $2.70 $2.77 $2.55 $2.67 $2.75 See related footnotes on page 32
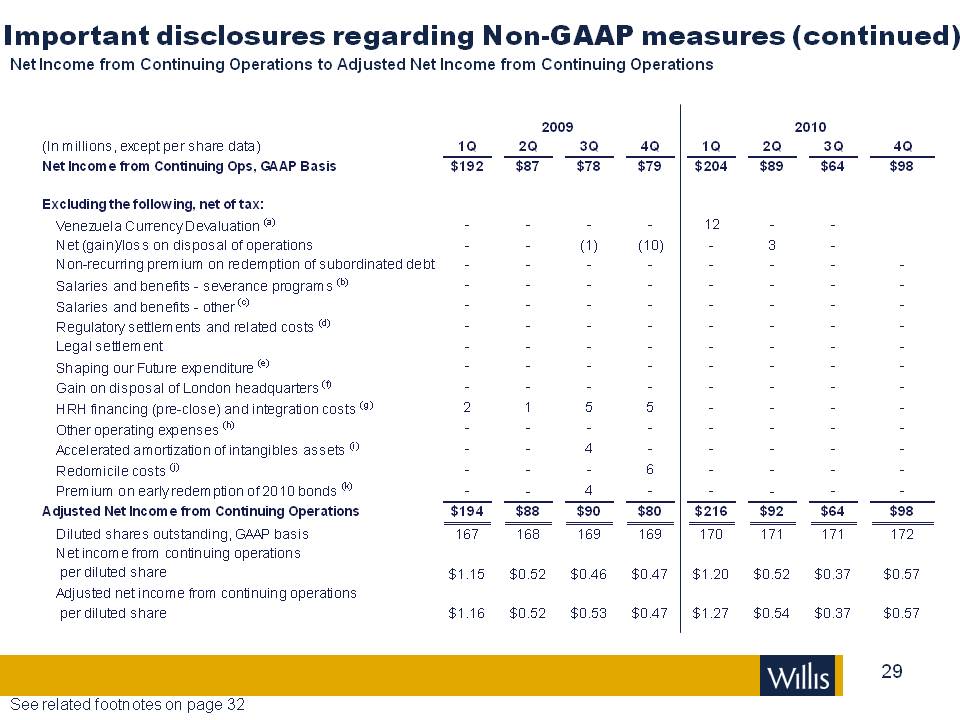
Important disclosures regarding Non GAAP measures (continued) Net Income from Continuing Operations to Adjusted Net Income from Continuing Operations 2009 2010 (In millions, except per share data) 1Q 2Q 3Q 4Q 1Q 2Q 3Q 4Q Net Income from Continuing Ops, GAAP Basis $192 $87 $78 $79 $204 $89 $64 $98 Excluding the following, net of tax: Venezuela Currency Devaluation (a) 12 Net (gain)/loss on disposal of operations (1) (10) 3 Non recurring premium on redemption of subordinated debt Salaries and benefits severance programs (b) Salaries and benefits other (c) Regulatory settlements and related costs (d) Legal settlement () Shaping our Future expenditure (e) Gain on disposal of London headquarters (f) HRH financing (pre close) and integration costs (g) 2 1 5 5 Other operating expenses (h) Accelerated amortization of intangibles assets (i) 4 Redomicile costs (j) 6 Premium on early redemption of 2010 bonds (k) 4 Adjusted Net Income from Continuing Operations $194 $88 $90 $80 $216 $92 $64 $98 Diluted shares outstanding, GAAP basis 167 168 169 169 170 171 171 172 Net income from continuing operations per diluted share $1.15 $0.52 $0.46 $0.47 $1.20 $0.37 $0.52 $0.57 Adjusted net income from continuing operations per diluted share $1.16 $0.52 $0.53 $0.47 $1.27 $0.54 $0.37 $0.57 See related footnotes on page 32
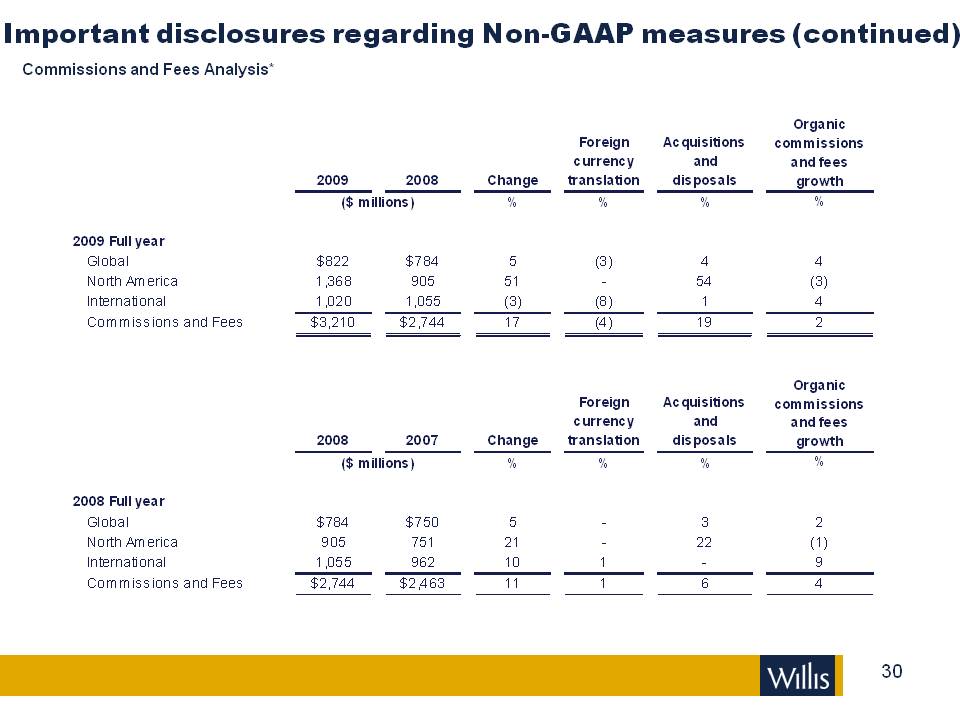
Important disclosures regarding Non-GAAP measures (continued) Commissions and Fees Analysis* Organic Foreign Acquisitions commissions currency and fees 2009 2008 Change translation disposals growth ($ millions) % % % % 2009 Full year Global $822 $784 5 (3) 4 4 North America 1,368 905 51 - 54 (3) International 1,020 1,055 (3) (8) 1 4 Commissions and Fees $3,210 $2,744 17 (4) 19 2 Organic Foreign Acquisitions commissions currency and fees 2008 2007 Change translation disposals growth ($ millions) % % % % 2008 Full year Global $784 $750 5 - 3 2 North America 905 751 21 - 22 (1) International 1,055 962 10 1 - 9 Commissions and Fees $2,744 $2,463 11 1 6 4
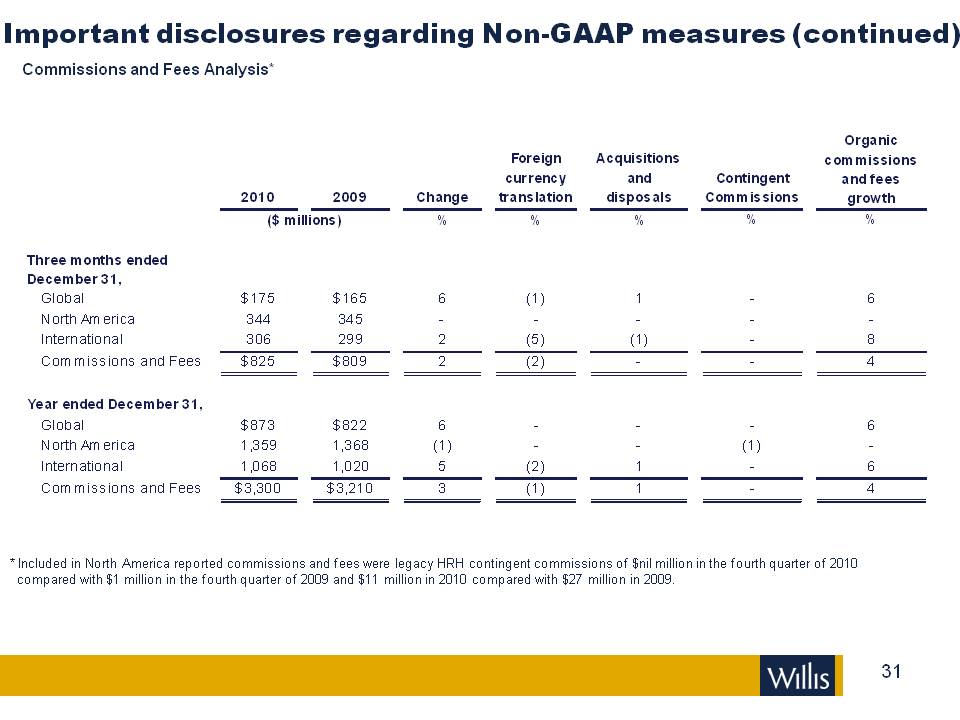
Commissions and Fees Analysis* Important disclosures regarding Non GAAP measures (continued) 2010 2009 Change Foreign currency translation Acquisitions and disposals Contingent Commissions Organic commissions and fees growth ($ millions) % Three months ended December 31, Global $175 $165 6 (1) 1 6 North America 344 345 International 306 299 2 (5) (1) 8 Commissions $825 $809 2 (2) 4 31 * Included in North America reported commissions and fees were legacy HRH contingent commissions of $nil million in the fourth quarter of 2010 compared with $1 million in the fourth quarter of 2009 and $11 million in 2010 compared with $27 million in 2009. and Fees Year ended December 31, Global $873 $822 6 6 North America 1,359 1,368 (1) (1) International 1,068 1,020 5 (2) 1 6 Commissions and Fees $3,300 $3,210 3 (1) 1 4 * Included in North America reported commissions and fees were legacy HRH contingent commissions of $nil million in the fourth quarter of 2010 compared with $1 million in the fourth quarter of 2009 and $11 million in 2010 compared with $27 million in 2009.
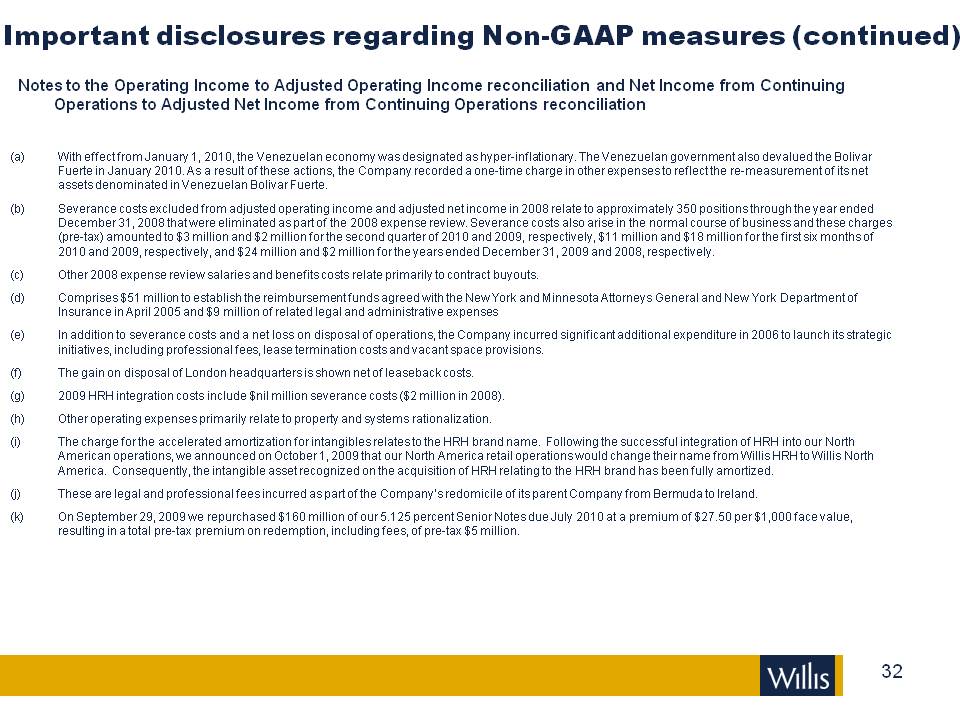
Important disclosures regarding Non-GAAP measures (continued) Notes to the Operating Income to Adjusted Operating Income reconciliation and Net Income from Continuing Operations to Adjusted Net Income from Continuing Operations reconciliation With effect from January 1, 2010, the Venezuelan economy was designated as hyper-inflationary. The Venezuelan government also devalued the Bolivar Fuerte in January 2010. As a result of these actions, the Company recorded a one-time charge in other expenses to reflect the re-measurement of its net assets denominated in Venezuelan Bolivar Fuerte.Severance costs excluded from adjusted operating income and adjusted net income in 2008 relate to approximately 350 positions through the year ended December 31, 2008 that were eliminated as part of the 2008 expense review. Severance costs also arise in the normal course of business and these charges (pre-tax) amounted to $3 million and $2 million for the second quarter of 2010 and 2009, respectively, $11 million and $18 million for the first six months of 2010 and 2009, respectively, and $24 million and $2 million for the years ended December 31, 2009 and 2008, respectively.Other 2008 expense review salaries and benefits costs relate primarily to contract buyouts.Comprises $51 million to establish the reimbursement funds agreed with the New York and Minnesota Attorneys General and New York Department of Insurance in April 2005 and $9 million of related legal and administrative expensesIn addition to severance costs and a net loss on disposal of operations, the Company incurred significant additional expenditure in 2006 to launch its strategic initiatives, including professional fees, lease termination costs and vacant space provisions.The gain on disposal of London headquarters is shown net of leaseback costs.2009 HRH integration costs include $nil million severance costs ($2 million in 2008).Other operating expenses primarily relate to property and systems rationalization.The charge for the accelerated amortization for intangibles relates to the HRH brand name. Following the successful integration of HRH into our North American operations, we announced on October 1, 2009 that our North America retail operations would change their name from Willis HRH to Willis North America. Consequently, the intangible asset recognized on the acquisition of HRH relating to the HRH brand has been fully amortized.These are legal and professional fees incurred as part of the Company’s redomicile of its parent Company from Bermuda to Ireland.On September 29, 2009 we repurchased $160 million of our 5.125 percent Senior Notes due July 2010 at a premium of $27.50 per $1,000 face value, resulting in a total pre-tax premium on redemption, including fees, of pre-tax $5 million.

WILLIS GROUP HOLDINGS FACT BOOK For the quarter and year ended December 31, 2010