Attached files
| file | filename |
|---|---|
| EX-21 - EX-21 - WILSHIRE BANCORP INC | a2202766zex-21.htm |
| EX-99.2 - EX-99.2 - WILSHIRE BANCORP INC | a2202766zex-99_2.htm |
| EX-23.1 - EX-23.1 - WILSHIRE BANCORP INC | a2202766zex-23_1.htm |
| EX-99.1 - EX-99.1 - WILSHIRE BANCORP INC | a2202766zex-99_1.htm |
| EX-31.2 - EX-31.2 - WILSHIRE BANCORP INC | a2202766zex-31_2.htm |
| EX-32.1 - EX-32.1 - WILSHIRE BANCORP INC | a2202766zex-32_1.htm |
| EX-31.1 - EX-31.1 - WILSHIRE BANCORP INC | a2202766zex-31_1.htm |
| EX-12.1 - EX-12.1 - WILSHIRE BANCORP INC | a2202766zex-12_1.htm |
| EX-10.38 - EX-10.38 - WILSHIRE BANCORP INC | a2202766zex-10_38.htm |
SECURITIES AND EXCHANGE COMMISSION
Washington, D.C. 20549
FORM 10-K
| (Mark One) | ||
ý |
Annual report pursuant to Section 13 or 15(d) of the Securities Exchange Act of 1934 |
|
For the fiscal year ended December 31, 2010. |
||
OR |
||
o |
Transition report pursuant to Section 13 or 15(d) of the Securities Exchange Act of 1934 |
|
For the transition period from to |
||
Commission File Number 000-50923
WILSHIRE BANCORP, INC.
(Exact name of registrant as specified in its charter)
| California State or other jurisdiction of incorporation or organization |
20-0711133 I.R.S. Employer Identification Number |
|
3200 Wilshire Blvd. Los Angeles, California Address of principal executive offices |
90010 Zip Code |
(213) 387-3200
Registrant's telephone number, including area code
Securities registered pursuant to Section 12(b) of the Act: Common Stock, no par value
Securities registered pursuant to Section 12(g) of the Act: None
Indicate by check mark if the registrant is a well-known seasoned issuer, as defined in Rule 405 of the Securities Act. Yes o No ý
Indicate by check mark if the registrant is not required to file reports pursuant to Section 13 or Section 15(d) of the Act. Yes o No ý
Indicate by check mark whether the registrant (1) has filed all reports required to be filed by Section 13 or 15(d) of the Securities Exchange Act of 1934 during the preceding 12 months (or for such shorter period that the registrant was required to file such reports), and (2) has been subject to such filing requirements for the past 90 days. Yes ý No o
Indicate by check mark if disclosure of delinquent filers pursuant to Item 405 of Regulation S-K (§232.405 of this chapter) is not contained herein, and will not be contained, to the best of registrant's knowledge, in definitive proxy or information statements incorporated by reference in Part III of this Form 10-K or any amendment to this Form 10-K. ý
Indicate by check mark whether the registrant is a large accelerated filer, an accelerated filer, a non-accelerated filer, or a smaller reporting company. See the definitions of "large accelerated filer," "accelerated filer" and "smaller reporting company" in Rule 12b-2 of the Exchange Act. (Check one):
| Large accelerated filer o | Accelerated filer ý | Non-accelerated filer o (Do not check if a smaller reporting company) |
Smaller reporting company o |
Indicate by check mark whether the registrant is a shell company (as defined in Rule 12b-2 of the Exchange Act). Yes o No ý
The aggregate market value of the voting common stock held by non-affiliates of the registrant as of June 30, 2010 was approximately $171.8 million (computed based on the closing sale price of the common stock at $8.75 per share as of such date). Shares of common stock held by each officer and director and each person owning more than ten percent of the outstanding common stock have been excluded in that such persons may be deemed to be affiliates. This determination of the affiliate status is not necessarily a conclusive determination for other purposes.
The number of shares of Common Stock of the registrant outstanding as of February 28, 2010 was 29,477,778.
DOCUMENTS INCORPORATED BY REFERENCE
Portions of the registrant's Proxy Statement relating to the registrant's 2010 Annual Meeting of Shareholders are incorporated by reference into Part III of this Annual Report on Form 10-K, where indicated.
2
CAUTIONARY STATEMENT REGARDING
FORWARD-LOOKING STATEMENTS AND INFORMATION
This Annual Report on Form 10-K, or the "Report," the other reports, statements, and information that we have previously filed or that we may subsequently file with the Securities and Exchange Commission ("SEC") and public announcements that we have previously made or may subsequently make include, incorporate by reference or may incorporate by reference certain statements that are "forward-looking statements" within the meaning of the Private Securities Litigation Reform Act of 1995 and are intended to enjoy the benefits of that act. The forward-looking statements included or incorporated by reference in this Form 10-K and those reports, statements, information and announcements address activities, events or developments that Wilshire Bancorp, Inc. (together with its subsidiaries hereinafter referred to as "the Company," "we," "us," "our" or "Wilshire Bancorp," unless the context requires otherwise) expects or anticipates will or may occur in the future. Any statements in this document about expectations, beliefs, plans, objectives, assumptions or future events or performance are not historical facts and are forward-looking statements. These statements are often, but not always, made through the use of words or phrases such as "may," "should," "could," "predict," "potential," "believe," "will likely result," "expect," "will continue," "anticipate," "seek," "estimate," "intend," "plan," "projection," "would" and "outlook," and similar expressions. Accordingly, these statements involve estimates, assumptions and uncertainties, which could cause actual results to differ materially from those expressed in them. Any forward-looking statements are qualified in their entirety by reference to the factors discussed throughout this document. It is important to note that our actual results may differ materially from those in such forward-looking statements due to fluctuations in interest rates, inflation, government regulations, economic conditions, customer disintermediation and competitive product and pricing pressures in the geographic and business areas in which we conduct operations, as well as the factors discussed elsewhere in this Report, including the discussion under the section entitled "Risk Factors."
The risk factors referred to in this Report could cause actual results or outcomes to differ materially from those expressed in any forward-looking statements made by us, and you should not place undue reliance on any such forward-looking statements. New factors emerge from time to time, and it is not possible for us to predict which will arise. In addition, we cannot assess the impact of each factor on our business or the extent to which any factor, or combination of factors, may cause actual results to differ materially from those contained in any forward-looking statements.
General
Wilshire Bancorp, Inc. is a bank holding company offering a broad range of financial products and services primarily through our main subsidiary, Wilshire State Bank, a California state-chartered commercial bank, which we sometimes refer to in this report as the "Bank." Our corporate headquarters and primary banking facilities are located at 3200 Wilshire Boulevard, Los Angeles, California 90010. In addition, the Bank has 24 full-service branch offices in Southern California, Texas, New Jersey, and the greater New York City metropolitan area. We also have 6 loan production offices, or "LPOs", utilized primarily for the origination of loans under our Small Business Administration, or "SBA", lending program in Colorado, Georgia, Texas (2 offices), New Jersey, and Virginia.
Wilshire State Bank is an insured bank up to the maximum limits authorized under the Federal Deposit Insurance Act, as amended, or the "FDIA." Like most state-chartered banks of our size in California, we are not a member of the Federal Reserve System, but we are a member of Federal Home Loan Bank of San Francisco, a congressionally chartered Federal Home Loan Bank. At
3
December 31, 2010, we had approximately $3.0 billion in assets, $2.3 billion in total loans, and $2.5 billion in deposits.
We operate a community bank focused on the general commercial banking business, with our primary market encompassing the multi-ethnic populations of Southern California, Dallas-Fort Worth, New Jersey, and the New York metropolitan area. Our client base reflects the ethnic diversity of these communities.
To address the needs of our multi-ethnic customers, we have many multilingual employees who are able to converse with our clientele in their native languages. We believe that the ability to speak the native language of our customers assists us in tailoring products and services for our customers' needs.
Available Information
We maintain an Internet website at www.wilshirebank.com. We post our filings with the SEC on the Investor Relations component of our website, where such filings are available free of charge, including our Annual Report on Form 10-K, our Quarterly Reports on Form 10-Q, our Current Reports on Form 8-K, our proxy and information statements, and any amendments to those reports or statements as soon as reasonably practicable after such reports are filed or furnished under the Securities Exchange Act of 1934, as amended, or Exchange Act. In addition to our SEC filings, our Code of Professional Conduct, and our Personal and Business Code of Conduct can be found on the Investor Relations page of our website. In addition, we post separately on our website all filings made by persons pursuant to Section 16 of the Exchange Act. You may also read and copy any materials we file with the SEC at the SEC's Public Reference Room at 100 F Street, N.E., Washington, D.C. 20549. You may obtain information on the operation of the Public Reference Room by calling the SEC at 1-800-SEC-0220. The SEC maintains an Internet site that contains reports, proxy and information statements, and other information regarding issuers that file electronically with the SEC at www.sec.gov.
Internal Investigation
We recently conducted an internal investigation with assistance of outside independent professional firms and the Company's internal audit department. The scope of the Company's internal investigation was extensive and included loan related activities and other matters involving improper activities of a certain loan officer. This loan officer is no longer with the Company. As a result of the investigation, management discovered a significant deficiency in the operating effectiveness of loan underwriting, approval and renewal processes for those loan originations and asset sales associated with the former loan officer. Specifically, these processes lacked effective supervision and oversight and the Company's operating efficiencies were hindered by the former chief executive officer and other management personnel. Our former chief executive officer resigned following the revelation of these activities to our board of directors. On February 18, 2011, we hired a new president and chief executive officer, Jae Whan Yoo.
In addition, the internal investigation concerning the improper activities of a former loan officer, lack of supervision and oversight by management, and the deficiencies in loan underwriting, approvals, renewals and asset sales resulted in a material adjustment of an increase in allowance for loan losses of $3.2 million and an $18.1 million increase in provision for loan losses which reduced net income of the Company by $10.3 million, net of tax within the 2010 annual consolidated financial statements following the Company's fourth quarter and year-end earnings release, dated January 24, 2011. The consolidated financial statements contained in this Annual Report on Form 10-K reflect such material adjustments.
Management determined that these control deficiencies, combined with the material adjustment to the Company's allowance for loan loss and related provision for loan losses, constitute a material weakness in the Company's internal control over financial reporting. As a result, management has
4
taken remedial measures to improve such deficiencies, including, among others, restructuring its lending department to shift the focus from marketing to credit quality control and enhancing its loan documentation and underwriting procedures. For more information regarding the material weakness and the Company's remedial actions, see "Item 9A. Management's Report on Internal Controls Over Financial Reporting."
Expansion
As part of our efforts to achieve stable and long-term profitability and respond to a changing economic environment in Southern California, we constantly evaluate a variety of options to augment our traditional focus by broadening the services and products we provide. Possible avenues of growth include more branch locations, expanded days and hours of operation, and new types of lending and deposit products. To date, we have not expanded into areas of brokerage or similar investment products and services but rather, we have concentrated primarily on the core businesses of accepting deposits, making loans, and extending credit.
Our expansion plans for 2011 are influenced by the changing conditions in the U.S. economy and the findings of our internal investigation. The rapid deterioration of the U.S. economy several years ago was triggered by the slowdown of the housing market and emergence of subprime and credit crisis in mid-2007. The failures of banks, mortgage lenders, insurance companies, and major financial institutions in 2008 further added pressure to the economy and started a trend of global recession. This "financial crisis" primarily reflects the significant and broad-based illiquidity in the residential real estate and credit markets. The domino effect of the U.S. financial crisis has now become a global problem, as many institutions worldwide are financially interlinked. Although there have been recent signs of economic improvement, many analysts predict the current financial crisis will extend into 2011 as well. In addition, our internal investigation revealed some deficiencies in our loan underwriting, origination and renewal processes. As a result, we are shifting our focus from marketing to improving our loan portfolio and credit quality control.
In 2011, we plan to closely monitor and review the loan production levels of our branches and LPOs. We expect to closely evaluate the need for the continued existence of our LPOs. Partially as a result of our internal investigation, we have taken remedial efforts to improve and enhance our loan origination and underwriting procedures, including the segregation of personnel and responsibilities related to loan sales from personnel and responsibilities related to loan underwriting processes. This separation resulted in a renewed focus for 2011 on the underwriting of loans. We will act with prudence in our lending practice and closely follow our improved underwriting policies and procedures in extending credit. Consistent with our focus of quality lending, we expect the level of lending activities to decrease relative to prior years, but we expect our loan portfolio quality to improve.
Business Segments
We operate in three primary business segments: Banking Operations, Trade Finance Services, and Small Business Administration Lending Services. We determine operating results of each segment based on an internal management system that allocates certain expenses to each segment. These segments are described in additional detail below:
Banking Operations ("Operations")—The Company raises funds from deposits and borrowings for loans and investments, and provides lending products, including commercial, consumer, and real estate loans to its customers.
Small Business Administration Lending Services—The SBA department mainly provides customers with access to the U.S. SBA guaranteed lending program.
5
Trade Finance Services—Our TFS primarily deals in letters of credit issued to customers whose businesses involve the international sale of goods. A letter of credit is an arrangement (usually expressed in letter form) whereby the Company, at the request of and in accordance with customers instructions, undertakes to reimburse or cause to reimburse a third party, provided that certain documents are presented in strict compliance with its terms and conditions. Simply put, a bank is pledging its credit on behalf of the customer. The Company's TFS offers the following types of letters of credit to customers:
- •
- Commercial—An undertaking by the issuing bank to pay for a commercial transaction.
- •
- Standby—An undertaking by the issuing bank to pay for the non-performance of an applicant.
- •
- Documentary Collections—A means of channeling payment for goods through a bank in order to facilitate passing of funds. The bank (banks) involved acts as a conduit through which the funds and documents are transferred between the buyer and seller of goods.
Our TFS services include the issuance and negotiation of letters of credit, as well as the handling of documentary collections. On the export side, we provide advising and negotiation of commercial letters of credit, and we transfer and issue back-to-back letters of credit. We also provide importers with trade finance lines of credit, which allow for issuance of commercial letters of credit and financing of documents received under such letters of credit, as well as documents received under documentary collections. Exporters are assisted through export lines of credit as well as through immediate financing of clean documents presented under export letters of credit.
Lending Activities
General
Our loan policies set forth the basic guidelines and procedures by which we conduct our lending operations. These policies address the types of loans available, underwriting and collateral requirements, loan terms, interest rate and yield considerations, compliance with laws and regulations, and our internal lending limits. Our Bank Board of Directors reviews and approves our loan policies on an annual basis. We supplement our own supervision of the loan underwriting and approval process with periodic loan audits by experienced external loan specialists who review credit quality, loan documentation, and compliance with laws and regulations. We engage in a full complement of lending activities, including:
- •
- commercial real estate and home mortgage lending,
- •
- commercial business lending and trade finance,
- •
- SBA lending, and
- •
- consumer loans, and
- •
- construction lending
Loan Procedures
Loan applications may be approved by the Director Loan Committee of our Bank Board of Directors, by our management, or lending officers to the extent of their lending authority. Our Bank Board of Directors authorizes our lending limits. The President and Chief Credit Officer of the Bank are responsible for evaluating the lending authority limits for individual credit officers and recommending lending limits for all other officers to the Bank Board of Directors for approval.
We grant individual lending authority to the President, Chief Credit Officer, and selected department managers of the Bank. Loans for which direct and indirect borrower liability exceeds an
6
individual's lending authority are referred to the Senior Loan Committee of the Bank (a four-member committee comprised of the President, Chief Lending Officer, Chief Credit Officer, and Senior Loan Officer) or our Bank Director Loan Committee.
At December 31, 2010, our authorized legal lending limit was $62.4 million for unsecured loans, plus an additional $41.6 million for specifically secured loans. Legal lending limits are calculated in conformance with California law, which prohibits a bank from lending to any one individual or entity or its related interests in an aggregate amount which exceeds 15% of shareholders' equity, plus the allowance for loan losses, and capital notes and debentures, on an unsecured basis, plus an additional 10% on a secured basis. The Bank's shareholders' equity plus allowance for loan losses, and capital notes and debentures at December 31, 2010 totaled $416.2 million.
We seek to mitigate the risks inherent in our loan portfolio by adhering to our underwriting policies. The review of each loan application includes analysis of the applicant's prior credit history, income level, cash flow and financial condition, analysis of tax returns, cash flow projections, the value of any collateral used to secure the loan, and also based upon reports of independent appraisers and audits of accounts receivable or inventory pledged as security. In the case of real estate loans over a specified amount, the review of the collateral value includes an appraisal report prepared by an independent Bank-approved appraiser. From time to time, we purchase participation interests in loans made by other financial institutions. These loans are generally subject to the same underwriting criteria and approval process as loans made directly by us.
Real Estate Loans and Home Mortgages
We offer commercial real estate loans to finance the acquisition of, or to refinance the existing mortgages on commercial properties, which include retail shopping centers, office buildings, industrial buildings, warehouses, hotels, automotive industry facilities, and apartment buildings. Our commercial real estate loans are typically collateralized by first or junior deeds of trust on specific commercial properties, and, when possible, subject to corporate or individual guarantees from financially capable parties. The properties collateralizing real estate loans are principally located in the markets where our retail branches are located. These locations include Southern California, Texas, New Jersey, and the greater New York City metropolitan area. However, we also provide commercial real estate loans through our LPOs. Real estate loans typically bear an interest rate that floats with our base rate, the prime rate, or another established index. We also offer fixed rate commercial mortgage loans with maturities that do not exceed 7 years. At December 31, 2010, real estate loans constituted approximately 85.3% of our loan portfolio.
Commercial real estate loans typically have 7-year maturities with up to 25-year amortization of principal and interest and loan-to-value ratios of 60-70% at origination of the appraised value or purchase price, whichever is lower. We usually impose a prepayment penalty during the period within three to five years of the date of the loan.
Construction loans are provided to build new structures, or to substantially improve the existing structure of commercial, residential, and income-producing properties. These loans generally have one to two year terms, with an option to extend the loan for additional periods to complete construction and to accommodate the lease-up period. We usually require a 20-30% equity capital investment by the developer and loan-to-value ratios of not more than 60-70% of the anticipated completion value.
Our total home mortgage loan portfolio outstanding at the end of 2010 and 2009 was $47.7 million and $41.3 million, respectively. Residential mortgage loans with unconventional terms such as interest only mortgages or option adjustable rate mortgages stood at $944,000 and $1.2 million, respectively, at December 31, 2010. These amounts include loans held temporarily for sale or refinancing. At December 31, 2009, these same loan categories were $1.9 million and $1.2 million, respectively.
7
We consider subprime mortgages to be loans secured by real property made to a borrower (or borrowers) with a diminished or impaired credit rating or with a limited credit history. We are focused on producing loans with only prime rated borrowers. As of result, our portfolio currently has no subprime exposure.
Our real estate portfolio is subject to certain risks, including:
- •
- a continued decline in the economies of our primary markets,
- •
- interest rate increases,
- •
- continued reduction in real estate values in our primary markets,
- •
- increased competition in pricing and loan structure, and
- •
- environmental risks, including natural disasters.
We strive to reduce the exposure to such risks by (a) reviewing each new loan request and renewal individually, (b) using a dual signature approval system for the approval of each loan request for loans over a certain dollar amount, (c) adherence to written loan policies, including, among other factors, minimum collateral requirements, maximum loan-to-value ratio requirements, cash flow requirements, and personal guarantees, (d) independent appraisals, (e) external independent credit review, and (f) conducting environmental reviews, where appropriate. We review each loan request on the basis of our ability to recover both principal and interest in view of the inherent risks.
Commercial Business Lending
We offer commercial business loans to sole proprietorships, partnerships, and corporations. These loans include business lines of credit and business term loans to finance operations, to provide working capital, or for specific purposes, such as to finance the purchase of assets, equipment, or inventory. Since a borrower's cash flow from operations is generally the primary source of repayment, our policies provide specific guidelines regarding required debt coverage and other important financial ratios.
Lines of credit are extended to businesses or individuals based on the financial strength and integrity of the borrower. These lines of credit are secured primarily by business assets such as accounts receivable or inventory, and have a maturity of one year or less. Such lines of credit bear an interest rate that floats with our base rate, the prime rate, or another established index.
Business term loans are typically made to finance the acquisition of fixed assets, refinance short-term debts, or to finance the purchase of businesses. Business term loans generally have terms from one to seven years. They may be collateralized by the assets being acquired or other available assets and bear interest rates, which either float with our base rate, prime rate, another established index, or is fixed for the term of the loan.
We also provide other banking services tailored to the small business market. We have focused recently on diversifying our loan portfolio, which has led to an increase in commercial business loans to small and medium-sized businesses.
Our portfolio of commercial loans is subject to certain risks, including:
- •
- continued decline in the economy in our primary markets,
- •
- interest rate increases, and
- •
- deterioration of a borrower's or guarantor's financial capabilities.
We attempt to reduce the exposure to such risks by (a) reviewing each new loan request and renewal individually, (b) relying heavily on our committee approval system where inputs from experienced committee members with different types and levels of lending experience are fully utilized,
8
(c) strict adherence to written loan policies, and (d) external independent credit review. In addition, loans based on short-term assets such as account receivables and inventories are monitored on a monthly or at a minimum, on a quarterly basis. In general, we receive and review financial statements of borrowing customers on an ongoing basis during the term of the relationship and respond to any deterioration noted.
Small Business Administration Lending Services
Small Business Administration, or SBA, lending is an important part of our business. Our SBA lending business places an emphasis on minority-owned businesses. Our SBA market area includes the geographic areas encompassed by our full-service banking offices in Southern California, Texas, New Jersey, and the New York City metropolitan area, as well as the multi-ethnic population areas surrounding our LPOs in other states. We are an SBA Preferred Lender nationwide, which permits us to approve SBA guaranteed loans in all our lending areas without further approval from the SBA. As an SBA Preferred Lender, we provide quicker and more efficient service to our clientele, enabling them to obtain SBA loans in order to acquire new businesses, expand existing businesses, and acquire locations in which to do business, without having to go through the time-consuming SBA approval process that would be necessary if a prospective SBA borrower were to utilize a lender that is not an SBA Preferred Lender.
SBA loans continue to remain an important component of our business. The net revenue from our SBA department represented 54.7% 8.9%, and 10.9% of our total net revenue for 2010, 2009 and 2008, respectively.
Although our participation in the SBA program is subject to the legislative power of Congress and the continued maintenance of our approved status by the SBA, we have no reason to believe that this program (and our participation therein) will not continue, particularly in view of the historic longevity of the SBA program nationally.
Consumer Loans
Consumer loans include personal loans, auto loans, and other loans typically made by banks to individual borrowers. The majority of consumer loans are concentrated personal line of credit and installment loans to individuals. Since the second half of 2008, we have not made any new auto loans to new customers. However, on occasion automobile loans are made to existing loan or deposit customers. Because consumer loans present a higher risk potential compared to our other loan products, especially given current economic conditions, we have reduced our efforts in consumer lending since 2007.
Our consumer loan production has historically been comparatively small, and has always represented less than 5% of our total loan portfolio. As of December 31, 2010, our consumer loan portfolio represented 0.7% of the loan portfolio, unchanged from December 31, 2009.
Our consumer loan portfolio is subject to certain risks, including:
- •
- general economic conditions of the markets we serve,
- •
- interest rate increases, and
- •
- consumer bankruptcy laws which allow consumers to discharge certain debts.
We attempt to reduce the exposure to such risks through (a) the direct approval of all consumer loans by reviewing each loan request and renewal individually, (b) using a dual signature system of approval, (c) strict adherence to written credit policies, and (d) utilizing external independent credit review.
9
Trade Finance Services
Our Trade Finance Department is part of our business and assists our import/export customers with their international business needs. The department primarily deals in letters of credit issued to customers whose businesses involve the international sale of goods. A letter of credit is an arrangement (usually expressed in letter form) whereby the Company, at the request of and in accordance with customers instructions, undertakes to reimburse or cause to reimburse a third party, provided that certain documents are presented in strict compliance with its terms and conditions. Simply put, a bank is pledging its credit on behalf of the customer. The Company's TFS offers the following types of letters of credit to customers:
- •
- Commercial—An undertaking by the issuing bank to pay for a commercial transaction.
- •
- Standby—An undertaking by the issuing bank to pay for the non-performance of applicant.
- •
- Documentary Collections—A means of channeling payment for goods through a bank in order to facilitate passing of funds. The bank (banks) involved acts as a conduit through which the funds and documents are transferred between the buyer and seller of goods.
Services offered by the Trade Finance Department include the issuance and negotiation of letters of credit, as well as the handling of documentary collections. On the export side, we provide advising and negotiation of commercial letters of credit, and we transfer and issue back-to-back letters of credit. We also provide importers with trade finance lines of credit, which allow for issuance of commercial letters of credit and financing of documents received under such letters of credit, as well as documents received under documentary collections. Exporters are assisted through export lines of credit as well as through immediate financing of clean documents presented under export letters of credit.
Most of our revenue from the Trade Finance Department consists of fee income from providing facilities to support import/export customers and interest income from extensions of credit. Our Trade Finance Department's fee income was $985 thousand, $1.2 million, and $1.2 million in 2010, 2009, and 2008, respectively.
Deposit Activities and Other Sources of Funds
Our primary sources of funds are deposits and loan repayments. Scheduled loan repayments are a relatively stable source of funds, whereas deposit inflows and outflows and unscheduled loan prepayments (which are influenced significantly by general interest rate levels, interest rates available on other investments, competition, economic conditions, and other factors) are less stable. Customer deposits remain a primary source of funds, but these balances may be influenced by adverse market changes in the industry. Other borrowings may be used:
- •
- on a short-term basis to compensate for reductions in deposit inflows to less than projected levels, and
- •
- on a longer-term basis to support expanded lending activities and to match the maturity of repricing intervals of assets.
We offer a variety of accounts for depositors which are designed to attract both short-term and long-term deposits. These accounts include certificates of deposit ("CDs"), regular savings accounts, money market accounts, checking and negotiable order of withdrawal ("NOW") accounts, installment savings accounts, and individual retirement accounts ("IRAs"). These accounts generally earn interest at rates established by management based on competitive market factors and management's desire to increase or decrease certain types or maturities of deposits. As needed, we augment these customer
10
deposits with brokered deposits. The more significant deposit accounts offered by us and other sources of funds are described below:
Certificates of Deposit
We offer several types of CDs with a maximum maturity of five years. The majority of our CDs have maturities of one to twelve months and typically pays simple interest credited monthly or at maturity.
Regular Savings Accounts
We offer savings accounts that allow for unlimited deposits and withdrawals, provided that depositors maintain a $100 minimum balance. Interest is compounded daily and credited quarterly.
Money Market Accounts
Money market accounts pay a variable interest rate that is tiered depending on the balance maintained in the account. Minimum opening balances vary. Interest is compounded daily and paid monthly.
Checking and NOW Account
Checking and NOW accounts are generally noninterest and interest bearing accounts, respectively, and may include service fees based on activity and balances. NOW accounts pay interest, but require a higher minimum balance to avoid service charges.
Federal Home Loan Bank Borrowings
To supplement our deposits as a source of funds for lending or investment, we borrow funds in the form of advances from the Federal Home Loan Bank of San Francisco. We may use Federal Home Loan Bank advances as part of our interest rate risk management, primarily to extend the duration of funding to match the longer term fixed rate loans held in the loan portfolio.
As a member of the Federal Home Loan Bank "FHLB" system, we are required to invest in Federal Home Loan Bank stock based on a predetermined formula. Federal Home Loan Bank stock is a restricted investment security that can only be sold to other Federal Home Loan Bank members or redeemed by the Federal Home Loan Bank. As of December 31, 2010, we owned $18.5 million in FHLB stock. As of December 31, 2009, FHLB stopped dividend payments on their stock. We believe that the FHLB stock is currently not impaired, as the par value of the investment can be recovered upon sale of the stock.
Advances from the Federal Home Loan Bank are secured by the Federal Home Loan Bank stock we own and a blanket lien on selected loans in our portfolio and may be also secured by other assets, mainly consisting of securities which are obligations of or guaranteed by the U.S. government. At December 31, 2010, our borrowing capacity with the Federal Home Loan Bank was approximately $604.4 million, with $135.0 million in borrowings outstanding, and $469.4 million in capacity remaining.
11
Internet Banking
We offer Internet banking, which allows our customers to access their deposit and loan accounts through the Internet. Customers are able to obtain transaction history and account information, transfer funds between accounts, make on-line bill payments, and open deposit accounts. We intend to improve and develop our Internet banking products and other delivery channels as the need arises and our resources permit.
Other Services
We also offer ATMs located at selected branch offices, customer access to an ATM network, and armored carrier services.
Marketing
Our marketing efforts rely principally upon local advertising and promotional activity and upon the personal contacts of our directors, officers, and shareholders to attract business and to acquaint potential customers with our products and personalized services. We emphasize a high degree of personalized client service in order to be able to satisfy each customer's banking needs. Our marketing approach emphasizes our strength as an independent, locally-managed state chartered bank in meeting the particular needs of consumers, professionals, and business customers in the community. Our management team continually evaluates all of our banking services with regard to their profitability and makes conclusions based on these evaluations on whether to continue or modify our business plan, where appropriate.
Competition
Regional Branch Competition
We currently operate 24 branch offices, 18 in California, 2 in Texas, 1 in New Jersey, and 3 in the greater New York City metropolitan area. We consider our Bank to be a community bank focused on the general commercial banking business, with our primary market encompassing the multi-ethnic population of the Los Angeles County area. Our full-service branch offices are located primarily in areas where a majority of the businesses are owned by immigrants or minority groups. Our client base reflects the ethnic diversity of these communities.
Our market has become increasingly competitive in recent years with respect to virtually all products and services that we offer. Although the general banking market is dominated by a relatively small number of major banks with numerous offices covering a wide geographic area, we compete in our niche market directly with smaller community banks which focus on Korean-American and other minority consumers and businesses.
We continue to experience a high level of competition within the ethnic banking market. In the greater Los Angeles metropolitan area, our primary competitors include twelve locally-owned and operated Korean-American banks. These banks have branches located in many of the same neighborhoods in which we operate, provide similar types of products and services, and use the same Korean language publications and media for their marketing purposes. Unlike many other Korean-ethnic community banks, we also focus a significant portion of our marketing efforts on non-Korean customers.
A less significant source of competition in our primary market includes branch offices of major national and international banks which maintain a limited bilingual staff for Korean-speaking or other language customers. Although these banks have not traditionally focused their marketing efforts on the minority customer base in our market, their competitive influence could increase should they choose to focus on this market in the future. Large commercial bank competitors have, among other advantages,
12
the ability to finance wide-ranging and effective advertising campaigns and to allocate their investment resources to areas of highest yield and demand. Many of the major banks operating in our market area offer certain services that we do not offer directly (but some of which we offer through correspondent institutions). By virtue of their greater total capitalization, such banks likely also have substantially higher lending limits than we do. In order to compete effectively, we provide quality, personalized service and fast, local decision making which we feel distinguishes us from many of our major bank competitors. For customers whose loan demands exceed our internal lending limit, we attempt to arrange for such loans on a participation basis with our correspondent banks. Similarly, we assist customers requiring services that we do not currently offer in obtaining such services from our correspondent banks.
Regional Loan Production Office Competition
We currently operate LPOs, in Aurora, Colorado (the Denver area); Atlanta, Georgia; Denver, Colorado; Dallas, Texas; Houston, Texas; and Annandale, Virginia. In most of our LPO locations, we are competing with local lenders as well as Los Angeles-based Korean-American community lenders operating out-of-state LPOs. We anticipate more competition from Korean-American community lenders in most of our LPO locations in the future. In anticipation of a continued slowing of the U.S. economy and a further decrease in real estate market activity and as a result of our internal investigations, we plan to maintain a balance of market coverage and operating costs. In 2011, we plan to grow our lending business cautiously with a focus on credit quality and safety.
Other Competitive Factors
In addition to other banks, our competitors include savings institutions, credit unions, and numerous non-banking institutions, such as finance companies, leasing companies, insurance companies, brokerage firms, and investment banking firms. In recent years, increased competition has also developed from specialized finance and non-finance companies that offer money market and mutual funds, wholesale finance, credit card, and other consumer finance services, including on-line banking services and personal finance software. Strong competition for deposit and loan products affects the rates of those products as well as the terms on which they are offered to customers.
The more general competitive trends in the industry include increased consolidation and competition. Strong competitors, other than financial institutions, have entered banking markets with focused products targeted at highly profitable customer segments. Many of these competitors are able to compete across geographic boundaries and provide customers increasing access to meaningful alternatives to banking services in nearly all significant products areas. Mergers between financial institutions have placed additional pressure on banks within the industry to streamline their operations, reduce expenses, and increase revenues to remain competitive. Competition has also intensified due to the federal and state interstate banking laws, which permit banking organizations to expand geographically.
Technological innovations have also resulted in increased competition in the financial services industry. Such innovations have, for example, made it possible for non-depository institutions to offer customers automated transfer payment services that were previously considered traditional banking products. In addition, many customers now expect a choice of several delivery systems and channels, including telephone, PDA or cellular phones, mail, home computer, ATMs, self-service branches, and/or in store branches. To some extent, such competition has had limited effect on us to date because many recent technological advancements do not yet have Korean or other language capabilities. However, as such technology becomes available, the competitive pressure to be at the forefront of such advancements will be significant.
13
The market for the origination of SBA loans, one of our primary revenue sources, is highly competitive. We compete with other small, mid-size and major banks which originate these loans in the geographic areas in which our full service branches are located, as well as in the areas where we maintain SBA LPOs. In addition, because these loans are largely broker-driven, we compete to a large extent with banks that originate SBA loans outside of our immediate geographic area. Furthermore, because these loans may be made out of LPOs specifically set up to make SBA loans rather than out of full service branches, the barriers to entry in this area, after approval of a bank as an SBA lender, are relatively low. In order to succeed in this highly competitive market, we actively market our SBA loans to minority-owned businesses. However, there can be no assurance that the resale market for SBA loans will grow, decline or maintain its current status.
Business Concentration
No individual or single group of related accounts is considered material in relation to our total assets or deposits, or in relation to our overall business. However, approximately 85.3% of our loan portfolio at December 31, 2010 consisted of real estate-related loans, including construction loans, mini-perm loans, residential mortgage loans, and commercial loans secured by real estate. Moreover, our business activities are currently focused primarily in Southern California, with the majority of our business concentrated in Los Angeles and Orange County. Consequently, our results of operations and financial condition are dependent upon the general trends in the Southern California economies and, in particular, the commercial real estate markets. In addition, the concentration of our operations in Southern California exposes us to greater risk than other banking companies with a wider geographic base in the event of catastrophes, such as earthquakes, fires, and floods in this region.
Employees
We had 392 full time equivalent employees (388 full-time employees and 17 part-time employees) as of December 31, 2010. None of our employees are currently represented by a union or covered by a collective bargaining agreement. Management believes that our employee relations are satisfactory.
Regulation and Supervision
The following is a summary description of the relevant laws, rules, and regulations governing banks and bank holding companies. The descriptions of, and references to, the statutes and regulations below are brief summaries and do not purport to be complete. The descriptions are qualified in their entirety by reference to the specific statutes and regulations discussed.
Generally, the supervision and regulation of bank holding companies and their subsidiaries are intended primarily for the protection of depositors, the deposit insurance funds of the FDIC and the banking system as a whole, and not for the protection of the bank holding company shareholders or creditors. The banking agencies have broad enforcement power over bank holding companies and banks, including the power to impose substantial fines and other penalties for violations of laws and regulations.
Various legislation is from time to time introduced in Congress and California's legislature, including proposals to overhaul the bank regulatory system, expand the powers of depository institutions, and limit the investments that depository institutions may make with insured funds. Such legislation may change applicable statutes and the operating environment in substantial and unpredictable ways. We cannot determine the ultimate effect that future legislation or implementing regulations would have upon our financial condition or upon our results of operations or the results of operations of any of our subsidiaries.
14
Wilshire Bancorp
Wilshire Bancorp is a bank holding company registered under the Bank Holding Company Act of 1956, or the Bank Holding Company Act, and is subject to supervision, regulation, and examination by the Board of Governors of the Federal Reserve System (the "Federal Reserve Board"). The Bank Holding Company Act and other federal laws subject bank holding companies to particular restrictions on the types of activities in which they may engage, and to a range of supervisory requirements and activities, including regulatory enforcement actions for violations of laws and regulations.
Regulatory Restrictions on Dividends; Source of Strength
We are regarded as a legal entity separate and distinct from our other subsidiaries. The principal source of our revenues will be dividends received from the Bank. Various federal and state statutory provisions limit the amount of dividends the Bank can pay to us without regulatory approval. It is the policy of the Federal Reserve Board that bank holding companies should pay cash dividends on common stock only out of income available over the past year and only if prospective earnings retention is consistent with the organization's expected future needs and financial condition. The policy provides that bank holding companies should not maintain a level of cash dividends that undermines the bank holding company's ability to serve as a source of strength to its banking subsidiaries.
Under Federal Reserve Board policy, a bank holding company is expected to act as a source of financial strength to each of its banking subsidiaries and commit resources to their support. The Dodd-Frank Act (as defined below) codified this policy as a statutory requirement. Such support may be required at times when, absent this Federal Reserve Board policy, a holding company may not be inclined to provide it. As discussed below, a bank holding company, in certain circumstances, could be required to guarantee the capital plan of an undercapitalized banking subsidiary.
In the event of a bank holding company's bankruptcy under Chapter 11 of the U.S. Bankruptcy Code, the trustee will be deemed to have assumed, and is required to cure immediately, any deficit under any commitment by the debtor holding company to any of the federal banking agencies to maintain the capital of an insured depository institution, and any claim for breach of such obligation will generally have priority over most other unsecured claims.
Pursuant to a Letter Agreement dated December 12, 2008 and a Securities Purchase Agreement—Standard Terms attached thereto (collectively, the "TARP Agreements"), we issued to the U.S. Treasury (i) 62,158 shares of the Company's Fixed Rate Cumulative Perpetual Preferred Stock, Series A, having a liquidation preference of $1,000 per share (the "Series A Preferred Stock") and (ii) a warrant to purchase initially 949,460 shares of our common stock, for an aggregate purchase price of $62,158,000. This resulted from our voluntary participation in the Capital Purchase Program of the U.S. Treasury's Troubled Asset Relief Program, or "TARP." The TARP Agreements place limits on, among other things, our ability to pay dividends on our common stock during the time that shares of our Series A Preferred Stock are outstanding. In addition, in connection with its TARP participation, the Federal Reserve Board may require the Company to defer its dividend payments on its Series A Preferred Stock and trust preferred securities. For more information on restrictions related to the Series A Preferred Stock, see the section of this report entitled, "Regulation and Supervision—The TARP Capital Purchase Program."
As a California corporation, Wilshire Bancorp is restricted under the California General Corporation Law ("CGCL") from paying dividends under certain conditions. The shareholders of Wilshire Bancorp will be entitled to receive dividends when and as declared by the Board of Directors, from funds legally available for the payment of dividends, as provided in the CGCL and, as mentioned above, consistent with Federal Reserve Board policy. The CGCL provides that a corporation may make a distribution to its shareholders if retained earnings immediately prior to the dividend payout, equals the amount of proposed distribution. In the event that sufficient retained earnings are not available for
15
the proposed distribution, a corporation may, nevertheless, make a distribution, if it meets both the "quantitative solvency" and the "liquidity" tests. In general, the quantitative solvency test requires that the sum of the assets of the corporation equal at least 11/4 times its liabilities. The liquidity test generally requires that a corporation have current assets at least equal to current liabilities, or, if the average of the earnings of the corporation before taxes on income and before interest expenses for the two preceding fiscal years was less than the average of the interest expense of the corporation for such fiscal years, then current assets must equal to at least 11/4 times current liabilities. In certain circumstances, Wilshire Bancorp may be required to obtain prior approval from the Federal Reserve Board to make capital distributions to its shareholders.
Activities "Closely Related" to Banking
The Bank Holding Company Act prohibits a bank holding company, with certain limited exceptions, from acquiring direct or indirect ownership or control of any voting shares of any company which is not a bank or from engaging in any activities other than those of banking, managing or controlling banks and certain other subsidiaries, or furnishing services to or performing services for its subsidiaries. One principal exception to these prohibitions allows the acquisition of interests in companies whose activities are found by the Federal Reserve Board, by order or regulation, to be so closely related to banking or managing or controlling banks, as to be a proper incident thereto. Some of the activities that have been determined by regulation to be closely related to banking are making or servicing loans, performing certain data processing services, acting as an investment or financial advisor to certain investment trusts and investment companies and providing securities brokerage services. Other activities approved by the Federal Reserve Board include consumer financial counseling, tax planning and tax preparation, futures and options advisory services, check guaranty services, collection agency and credit bureau services and personal property appraisals. In approving acquisitions by bank holding companies of companies engaged in banking-related activities, the Federal Reserve Board considers a number of factors, and weighs the expected benefits to the public (such as greater convenience and increased competition or gains in efficiency) against the risks of possible adverse effects (such as undue concentration of resources, decreased or unfair competition, conflicts of interest or unsound banking practices). The Federal Reserve Board is also empowered to differentiate between activities commenced de novo and activities commenced through acquisition of a going concern.
Gramm-Leach-Bliley Act; Financial Holding Companies
The Gramm-Leach-Bliley Financial Modernization Act, or GLBA, signed into law on November 12, 1999, revised and expanded the provisions of the Bank Holding Company Act by including a new section that permits a bank holding company to elect to become a financial holding company to engage in a full range of activities that are "financial in nature." The qualification requirements and the process for a bank holding company that elects to be treated as a financial holding company require that all of the subsidiary banks controlled by the bank holding company at the time of election to become a financial holding company must be and remain at all times "well-capitalized" and "well managed." We have not yet made an election to become a financial holding company, but we may do so at some time in the future.
GLBA specifically provides that the following activities have been determined to be "financial in nature":
- •
- lending, trust and other banking activities;
- •
- insurance activities;
- •
- financial or economic advisory services;
- •
- securitization of assets;
16
- •
- securities underwriting and dealing;
- •
- existing bank holding company domestic activities;
- •
- existing bank holding company foreign activities; and
- •
- merchant banking activities.
In addition, GLBA specifically gives the Federal Reserve Board the authority, by regulation or order, to expand the list of "financial" or "incidental" activities, but requires consultation with the U.S. Treasury Department, and gives the Federal Reserve Board authority to allow a financial holding company to engage in any activity that is "complementary" to a financial activity and does not "pose a substantial risk to the safety and soundness of depository institutions or the financial system generally."
Privacy Policies
Under GLBA, all financial institutions are required to adopt privacy policies, restrict the sharing of nonpublic customer data with nonaffiliated parties at the customer's request, and establish procedures and practices to protect customer data from unauthorized access. We have established policies and procedures to assure our compliance with all privacy provisions of GLBA.
Safe and Sound Banking Practices
Bank holding companies are not permitted to engage in unsafe and unsound banking practices. The Federal Reserve Board's Regulation Y, for example, generally requires a holding company to give the Federal Reserve Board prior notice of any redemption or repurchase of its own equity securities, if the consideration to be paid, together with the consideration paid for any repurchases or redemptions in the preceding year, is equal to 10% or more of the company's consolidated net worth. The Federal Reserve Board may oppose the transaction if it believes that the transaction would constitute an unsafe or unsound practice or would violate any law or regulation. Depending upon the circumstances, the Federal Reserve Board could take the position that paying a dividend would constitute an unsafe or unsound banking practice.
The Federal Reserve Board has broad authority to prohibit activities of bank holding companies and their nonbanking subsidiaries which represent unsafe and unsound banking practices or which constitute violations of laws or regulations, and can assess civil money penalties for certain activities conducted on a knowing and reckless basis, if those activities caused a substantial loss to a depository institution. The penalties can be as high as $1 million for each day the activity continues.
Annual Reporting; Examinations
We are required to file annual reports with the Federal Reserve Board, and such additional information as the Federal Reserve Board may require pursuant to the Bank Holding Company Act. The Federal Reserve Board may examine a bank holding company or any of its subsidiaries, and charge the company for the cost of such examination. Furthermore, the Bank is subjected to compliance examinations by the FDIC and the California Department of Financial Institutions, or "DFI", and the Company is subject to U.S. Treasury's examination as part of our agreement with the U.S. Treasury for receiving the TARP investment.
Capital Adequacy Requirements
The Federal Reserve Board has adopted a system using risk-based capital guidelines to evaluate the capital adequacy of certain large bank holding companies. Prior to March 30, 2006, these capital guidelines were applicable to all bank holding companies having $150 million or more in assets on a consolidated basis. However, effective March 30, 2006, the Federal Reserve Board amended the asset
17
size threshold to $500 million for purposes of determining whether a bank holding company is subject to the capital adequacy guidelines. We currently have consolidated assets in excess of $500 million, and are therefore subject to the Federal Reserve Board's capital adequacy guidelines.
Under the guidelines, specific categories of assets are assigned different risk weights, based generally on the perceived credit risk of the asset. These risk weights are multiplied by corresponding asset balances to determine a "risk-weighted" asset base. The guidelines require a minimum total risk-based capital ratio of 8.0% (of which at least 4.0% is required to consist of Tier 1 capital elements). Total capital is the sum of Tier 1 and Tier 2 capital. To be considered "well-capitalized," a bank holding company must maintain, on a consolidated basis, (i) a Tier 1 risk-based capital ratio of at least 6.0%, and (ii) a total risk-based capital ratio of 10.0% or greater. As of December 31, 2010, our Tier 1 risk-based capital ratio was 12.61% and our total risk-based capital ratio was 14.00%. Thus, we are considered "well-capitalized" for regulatory purposes.
In addition to the risk-based capital guidelines, the Federal Reserve Board uses a leverage ratio as an additional tool to evaluate the capital adequacy of bank holding companies. The leverage ratio is a company's Tier 1 capital divided by its average total consolidated assets. Certain highly-rated bank holding companies may maintain a minimum leverage ratio of 3.0%, but other bank holding companies are required to maintain a leverage ratio of at least 4.0%. To be considered well-capitalized, a bank holding company must maintain a leverage ratio of at least 5%. As of December 31, 2010, our leverage ratio was 9.18%.
The federal banking agencies' risk-based and leverage ratios are minimum supervisory ratios generally applicable to banking organizations that meet certain specified criteria. The federal bank regulatory agencies may set capital requirements for a particular banking organization that are higher than the minimum ratios when circumstances warrant. Federal Reserve Board guidelines also provide that banking organizations experiencing internal growth or making acquisitions will be expected to maintain strong capital positions, substantially above the minimum supervisory levels, without significant reliance on intangible assets.
Imposition of Liability for Undercapitalized Subsidiaries
Bank regulators are required to take "prompt corrective action" to resolve problems associated with insured depository institutions whose capital declines below certain levels. In the event an institution becomes "undercapitalized," it must submit a capital restoration plan. The capital restoration plan will not be accepted by the regulators unless each company having control of the undercapitalized institution guarantees the subsidiary's compliance with the capital restoration plan up to a certain specified amount. Any such guarantee from a depository institution's holding company is entitled to a priority of payment in bankruptcy.
The aggregate liability of the holding company of an undercapitalized bank is limited to the lesser of 5% of the institution's assets at the time it became undercapitalized or the amount necessary to cause the institution to be "adequately capitalized." The bank regulators have greater power in situations where an institution becomes "significantly" or "critically" undercapitalized or fails to submit a capital restoration plan. For example, a bank holding company controlling such an institution can be required to obtain prior Federal Reserve Board approval of proposed dividends, or might be required to consent to a consolidation or to divest itself of the troubled institution or other affiliates.
Acquisitions by Bank Holding Companies
The Bank Holding Company Act requires every bank holding company to obtain the prior approval of the Federal Reserve Board before it may acquire all or substantially all of the assets of any bank, or ownership or control of any voting shares of any bank, if after such acquisition it would own or control, directly or indirectly, more than 5% of the voting shares of such bank. In approving bank
18
acquisitions by bank holding companies, the Federal Reserve Board is required to consider the financial and managerial resources and future prospects of the bank holding company and the bank concerned, the convenience and needs of the communities to be served, and various competitive factors. On June 26, 2009 with regulatory approval, Wilshire acquired former Mirae Bank from the FDIC by purchasing substantially all of Mirae Bank's assets and assuming substantially all of Mirae Bank's deposits and certain liabilities.
Control Acquisitions
The Change in Bank Control Act prohibits a person or group of persons from acquiring "control" of a bank holding company unless the Federal Reserve Board has been notified and has not objected to the transaction. Under a rebuttable presumption established by the Federal Reserve Board, the acquisition of 10% or more of a class of voting stock of a bank holding company with a class of securities registered under Section 12 of the Exchange Act would, under the circumstances set forth in the presumption, constitute acquisition of control.
In addition, any company is required to obtain the approval of the Federal Reserve Board under the Bank Holding Company Act before acquiring 25% (5% in the case of an acquirer that is a bank holding company) or more of the outstanding common stock of the a bank holding company, or otherwise obtaining control or a "controlling influence" over a bank holding company.
Cross-guarantees
Under the Federal Deposit Insurance Act, or FDIA, a depository institution (which definition includes both banks and savings associations), the deposits of which are insured by the FDIC, can be held liable for any loss incurred by, or reasonably expected to be incurred by, the FDIC in connection with (i) the default of a commonly controlled FDIC-insured depository institution, or (ii) any assistance provided by the FDIC to any commonly controlled FDIC-insured depository institution "in danger of default." "Default" is defined generally as the appointment of a conservator or a receiver and "in danger of default" is defined generally as the existence of certain conditions indicating that default is likely to occur in the absence of regulatory assistance. In some circumstances (depending upon the amount of the loss or anticipated loss suffered by the FDIC), cross-guarantee liability may result in the ultimate failure or insolvency of one or more insured depository institutions in a holding company structure. Any obligation or liability owed by a subsidiary bank to its parent company is subordinated to the subsidiary bank's cross-guarantee liability with respect to commonly controlled insured depository institutions. The Bank is currently our only FDIC-insured depository institution subsidiary.
Because we are a legal entity separate and distinct from the Bank, our right to participate in the distribution of assets of any subsidiary upon the subsidiary's liquidation or reorganization will be subject to the prior claims of the subsidiary's creditors. In the event of a liquidation or other dissolution of the Bank, the claims of depositors and other general or subordinated creditors of the Bank would be entitled to a priority of payment over the claims of holders of any obligation of the Bank to its shareholders, including any depository institution holding company (such as Wilshire Bancorp) or any shareholder or creditor of such holding company.
FIRREA
The Financial Institutions Reform, Recovery and Enforcement Act of 1989, or FIRREA, includes various provisions that affect or may affect the Bank. Among other matters, FIRREA generally permits bank holding companies to acquire healthy thrifts as well as failed or failing thrifts. FIRREA removed certain cross-marketing prohibitions previously applicable to thrift and bank subsidiaries of a common holding company. Furthermore, a multi-bank holding company may now be required to indemnify the federal deposit insurance fund against losses it incurs with respect to such company's affiliated banks,
19
which in effect makes a bank holding company's equity investments in healthy bank subsidiaries available to the FDIC to assist such company's failing or failed bank subsidiaries.
FIRREA also expanded and increased civil and criminal penalties available for use by the appropriate regulatory agency against certain "institution-affiliated parties" primarily including (i) management, employees and agents of a financial institution, as well as (ii) independent contractors, such as attorneys and accountants and others who participate in the conduct of the financial institution's affairs and who caused or are likely to cause more than minimum financial loss to or a significant adverse effect on the institution, who knowingly or recklessly violate a law or regulation, breach a fiduciary duty or engage in unsafe or unsound practices. Such practices can include the failure of an institution to timely file required reports or the submission of inaccurate reports. Furthermore, FIRREA authorizes the appropriate banking agency to issue cease and desist orders that may, among other things, require affirmative action to correct any harm resulting from a violation or practice, including restitution, reimbursement, indemnifications or guarantees against loss. A financial institution may also be ordered to restrict its growth, dispose of certain assets or take other action as determined by the ordering agency to be appropriate.
USA PATRIOT Act
On October 26, 2001, The Uniting and Strengthening America by Providing Appropriate Tools Is Required to Intercept and Obstruct Terrorism Act or USA PATRIOT Act, a comprehensive anti-terrorism legislation was enacted. Title III of the USA PATRIOT Act requires financial institutions to help prevent, detect and prosecute international money laundering and the financing of terrorism. The effectiveness of a financial institution in combating money laundering activities is a factor to be considered in any application submitted by the financial institution under the Bank Merger Act, which applies to the Bank, or the Bank Holding Company Act, which applies to Wilshire Bancorp. We, and our subsidiaries, including the Bank, have adopted systems and procedures to comply with the USA PATRIOT Act and regulations adopted by the Secretary of the Treasury.
The Sarbanes-Oxley Act of 2002
On July 30, 2002, The Sarbanes-Oxley Act of 2002, or "Sarbanes-Oxley Act" was enacted. The Sarbanes-Oxley Act addresses accounting oversight and corporate governance matters relating to the operations of public companies. During 2003, the SEC issued a number of regulations under the directive of the Sarbanes-Oxley Act significantly increasing public company governance-related obligations and filing requirements, including:
- •
- the establishment of an independent public oversight of public company accounting firms by a board that will set auditing,
quality and ethical standards for and have investigative and disciplinary powers over such accounting firms,
- •
- the enhanced regulation of the independence, responsibilities and conduct of accounting firms which provide auditing
services to public companies,
- •
- the increase of penalties for fraud related crimes,
- •
- the enhanced disclosure, certification, and monitoring of financial statements, internal financial controls and the audit
process, and
- •
- the enhanced and accelerated reporting of corporate disclosures and internal governance.
Furthermore, in November 2003, in response to the directives of the Sarbanes-Oxley Act, NASDAQ adopted substantially expanded corporate governance criteria for the issuers of securities quoted on the NASDAQ Global Select Market (the market on which our common stock is listed for trading). The new NASDAQ rules govern, among other things, the enhancement and regulation of
20
corporate disclosure and internal governance of listed companies and of the authority, role and responsibilities of their boards of directors and, in particular, of "independent" members of such boards of directors, in the areas of nominations, corporate governance, compensation and the monitoring of the audit and internal financial control processes.
The TARP Capital Purchase Program
On October 3, 2008, President Bush signed into law the Emergency Economic Stabilization Act of 2008 (the "EESA") enacted by the U.S. Congress, which appropriated $700 billion for the purpose of restoring liquidity and stability in the U.S. financial system. On October 14, 2008, the U.S. Treasury established the TARP Capital Purchase Program under the authority granted by the EESA. Under the Troubled Asset Relief Program's ("TARP"), Capital Purchase Program, the U.S. Treasury made $250 billion of capital available to U.S. financial institutions in the form of senior preferred stock investments. In connection with its purchase of preferred stock, the U.S. Treasury will receive a warrant entitling the U.S. Treasury to buy the participating institution's common stock with a market price equal to 15% of the preferred stock.
As a result of EESA, there have been numerous actions by the Federal Reserve Board, the U.S. Congress, the U.S. Treasury, the FDIC, the SEC and others to further the economic and banking industry stabilization efforts under the EESA. It remains unclear at this time what further legislative and regulatory measures will be implemented under the EESA that affect us.
Pursuant to the TARP Agreements dated December 12, 2008, we issued to the U.S. Treasury (i) 62,158 shares of the Series A Preferred Stock, and (ii) a warrant to purchase initially 949,460 shares of our common stock, for an aggregate purchase price of $62,158,000. Both the Series A Preferred Stock and the Warrant will be accounted for as components of Tier 1 capital.
On February 17, 2009, President Obama signed into law the American Recovery and Reinvestment Act of 2009 (the "ARRA") enacted by the U.S. Congress. The ARRA, among other things, imposed certain new executive compensation and corporate expenditure limits on all current and future recipients of funds under the TARP Capital Purchase Program, including Wilshire, as long as any obligation arising from the financial assistance provided to the recipient under the TARP Capital Purchase Program remains outstanding, excluding any period during which the U.S. Treasury holds only warrants to purchase common stock of a TARP participation (the "Covered Period").
The current terms of participation in the TARP Capital Purchase Program include the following:
- •
- we were required to file with the SEC a registration statement under the Securities Act of 1933 (the "Securities Act")
registering for resale the Series A Preferred Stock and the related warrant;
- •
- as long as shares of the Series A Preferred Stock remain outstanding, unless all accrued and unpaid dividends for
all past dividend periods on the Series A Preferred Stock are fully paid, we will not be permitted to declare or pay dividends on any shares of our common stock, any junior preferred shares or,
generally, any preferred shares ranking pari passu with the Series A Preferred Stock (other than in the case of pari passu preferred shares, dividends on a pro rata basis with the
Series A Preferred Stock), nor will we be permitted to repurchase or redeem any of our common stock or preferred stock other than the Series A Preferred Stock;
- •
- until the Series A Preferred Stock has been transferred or redeemed in whole, until December 12, 2011, the U.S. Treasury's approval is required for any increase in dividends on our common stock or any share repurchases other than repurchases of the Series A Preferred Stock, repurchases of junior preferred shares, or repurchases of common stock in connection with the administration of any employee benefit plan in the ordinary course of business and consistent with past practice;
21
- •
- we must comply with the U. S. Treasury's standards for executive compensation and corporate governance while the
U. S. Treasury holds the securities issued by us. Such standards apply to our Senior Executive Officers (as defined in the ARRA) as well as other employees. The current standards include the
following:
- •
- incentive compensation for Senior Executive Officers must not encourage unnecessary and excessive risks that threaten the
value of the financial institution;
- •
- any bonus or incentive compensation paid (or under a legally binding obligation to pay) to a Senior Executive Officer or
any of our next 20 most highly-compensated employees based on statements of earnings, gains or other criteria that are later proven to be materially inaccurate must be subject to recovery,
or "clawback", by Wilshire;
- •
- we are prohibited from paying or accruing any bonus, retention award or incentive compensation with respect to our five
most highly-compensated employees or such higher number as the Secretary of the U.S. Treasury may determine is in the public interest, except for grants of restricted stock that do
not fully vest during the Covered Period and do not have a value which exceeds one-third of an employee's total annual compensation;
- •
- severance payments to a Senior Executive Officer and the five next most highly-compensated employees,
generally referred to as "golden parachute" payments, are prohibited, except for payments for services performed or benefits accrued;
- •
- compensation plans that encourage manipulation of reported earnings are prohibited;
- •
- the U.S. Treasury may retroactively review bonuses, retention awards and other compensation previously paid to a
Senior Executive Officer or any of our 20 next most highly-compensated employees that the U.S. Treasury finds to be inconsistent with the purposes of TARP or otherwise contrary to
the public interest;
- •
- our Board of Directors must establish a company-wide policy regarding excessive or luxury expenditures;
- •
- proxy statements for our annual shareholder meetings must permit a nonbinding "say on pay" shareholder vote on the
compensation of executives;
- •
- executive compensation in excess of $500,000 for each Senior Executive Officer must not be deducted for federal income tax
purposes; and
- •
- we must comply with the executive compensation reporting and recordkeeping requirements established by the U.S. Treasury.
The ARRA permits TARP recipients, subject to consultation with the appropriate federal banking agency, to repay to the U.S. Treasury any financial assistance received under the TARP Capital Purchase Program without penalty, delay or the need to raise additional replacement capital. The U.S. Treasury is to promulgate regulations to implement the procedures under which a TARP participant may repay any assistance received. As of the date of this Report, the U.S. Treasury had not yet issued such regulations.
Detailed information regarding the Series A Preferred Stock and the related warrant can be found in Notes 12 and 13 of the Notes to the Consolidated Financial Statements.
Dodd-Frank Act
On July 21, 2010, the Dodd-Frank Wall Street Reform and Consumer Protection Act (the "Dodd-Frank Act") was signed into law. The Dodd-Frank Act will likely result in dramatic changes across the financial regulatory system, some of which become effective immediately and some of which
22
will not become effective until various future dates. Implementation of the Dodd-Frank Act will require many new rules to be made by various federal regulatory agencies over the next several years. Uncertainty remains until final rulemaking is complete as to the ultimate impact of the Dodd-Frank Act, which could have a material adverse impact either on the financial services industry as a whole or on the Bank's business, results of operations, and financial condition. Provisions in the legislation that affect deposit insurance assessments, payment of interest on demand deposits, and interchange fees could increase the costs associated with deposits and place limitations on certain revenues those deposits may generate. The Dodd-Frank Act includes provisions that, among other things, will:
- •
- Centralize responsibility for consumer financial protection by creating a new agency, the Bureau of Consumer Financial
Protection ("CFPB"), responsible for implementing, examining, and enforcing compliance with federal consumer financial laws. In addition, the Dodd-Frank Act permits states to adopt
consumer protection laws and regulations that are stricter than those regulations promulgated by the CFPB.
- •
- Create the Financial Stability Oversight Council that will recommend to the Federal Reserve Board increasingly strict
rules for capital, leverage, liquidity, risk management and other requirements as companies grow in size and complexity.
- •
- Provide mortgage reform provisions regarding a customer's ability to repay, restricting variable-rate lending
by requiring that the ability to repay variable-rate loans be determined by using the maximum rate that will apply during the first five years of a variable-rate loan term, and
making more loans subject to provisions for higher cost loans, new disclosures, and certain other revisions.
- •
- Change the assessment base for federal deposit insurance from the amount of insured deposits to consolidated assets less
tangible capital, eliminate the ceiling on the size of the DIF, and increase the floor on the size of the DIF, which generally will require an increase in the level of assessments for institutions
with assets in excess of $10 billion.
- •
- Make permanent the $250 thousand limit for federal deposit insurance and provide unlimited federal deposit
insurance until January 1, 2013, for noninterest-bearing demand transaction accounts at all insured depository institutions.
- •
- Restrict the preemption of state law by federal law and disallow subsidiaries and affiliates of national banks, such as
the Bank, from availing themselves of such preemption.
- •
- Require the Office of the Comptroller of the Currency (the "OCC") to seek to make its capital requirements for national
banks, such as the Bank, countercyclical so that capital requirements increase in times of economic expansion and decrease in times of economic contraction.
- •
- Require financial holding companies, such as the Company, to be well capitalized and well managed as of July 21,
2011. Bank holding companies and banks must also be both well capitalized and well managed in order to acquire banks located outside their home state.
- •
- Mandate certain corporate governance and executive compensation matters be implemented, including (i) an advisory
vote on executive compensation by a public company's stockholders; (ii) enhancement of independence requirements for compensation committee members; (iii) adoption of
incentive-based compensation clawback policies for executive officers; and (iv) adoption of proxy access rules allowing stockholders of publicly traded companies to nominate
candidates for election as a director and have those nominees included in a company's proxy materials.
- •
- Repeal the federal prohibitions on the payment of interest on demand deposits, thereby permitting depository institutions to pay interest on business transactions accounts.
23
- •
- Amend the Electronic Fund Transfer Act to, among other things, give the Federal Reserve the authority to establish rules regarding interchange fees charged for electronic debit transactions by payment card issuers having assets over $10 billion and to enforce a new statutory requirement that such fees be reasonable and proportional to the actual cost of a transaction to the issuer.
Many aspects of the Dodd-Frank Act are subject to rulemaking and will take effect over several years, making it difficult to anticipate the overall financial impact on the Company, its customers or the financial industry more generally. Some of the rules that have been proposed and, in some cases, adopted to comply with the Dodd-Frank Act's mandates are discussed below.
Wilshire State Bank
Wilshire State Bank is subject to extensive regulation and examination by the California Department of Financial Institutions, or the DFI, and the FDIC, which insures its deposits to the maximum extent permitted by law, and is subject to certain Federal Reserve Board regulations of transactions with its affiliates. The federal and state laws and regulations which are applicable to the Bank regulate, among other things, the scope of its business, its investments, its reserves against deposits, the timing of the availability of deposited funds and the nature and amount of and collateral for certain loans. In addition to the impact of such regulations, commercial banks are affected significantly by the actions of the Federal Reserve Board as it attempts to control the money supply and credit availability in order to influence the economy.
Transactions with Affiliates
There are various statutory and regulatory limitations, including those set forth in sections 23A and 23B of the Federal Reserve Act and the related Federal Reserve Regulation W, governing the extent to which the Bank will be able to purchase assets from or securities of or otherwise finance or transfer funds to us or our nonbanking affiliates. Among other restrictions, such transactions between the Bank and any one affiliate (including the Company) generally will be limited to 10% of the Bank's capital and surplus, and transactions between the Bank and all affiliates will be limited to 20% of the Bank's capital and surplus. Furthermore, loans and extensions of credit are required to be secured in specified amounts and are required to be on terms and conditions consistent with safe and sound banking practices.
In addition, any transaction by a bank with an affiliate and any sale of assets or provision of services to an affiliate generally must be on terms that are substantially the same, or at least as favorable, to the bank as those prevailing at the time for comparable transactions with nonaffiliated companies.
Loans to Insiders
Sections 22(g) and (h) of the Federal Reserve Act and its implementing regulation, Regulation O, place restrictions on loans by a bank to executive officers, directors, and principal shareholders. Under Section 22(h), loans to a director, an executive officer and to a greater than 10% shareholder of a bank and certain of their related interests, or insiders, and insiders of affiliates, may not exceed, together with all other outstanding loans to such person and related interests, the bank's loans-to-one-borrower limit (generally equal to 15% of the institution's unimpaired capital and surplus). Section 22(h) also requires that loans to insiders and to insiders of affiliates be made on terms substantially the same as offered in comparable transactions to other persons, unless the loans are made pursuant to a benefit or compensation program that (i) is widely available to employees of the bank, and (ii) does not give preference to insiders over other employees of the bank. Section 22(h) also requires prior Board of Directors approval for certain loans, and the aggregate amount of extensions of credit by a bank to all
24
insiders cannot exceed the institution's unimpaired capital and surplus. Furthermore, Section 22(g) places additional restrictions on loans to executive officers.
The Dodd-Frank Act generally enhances the restrictions on transactions with affiliates under Sections 23A and 23B of the Federal Reserve Act, including an expansion of the definition of "covered transactions" and an increase in the amount of time for which collateral requirements regarding covered credit transactions must be satisfied. Insider transaction limitations are expanded through the strengthening of loan restrictions to insiders and the expansion of the types of transactions subject to the various limits, including derivatives transactions, repurchase agreements, reverse repurchase agreements and securities lending or borrowing transactions. Restrictions are also placed on certain asset sales to and from an insider to an institution, including requirements that such sales be on market terms and, in certain circumstances, approved by the institution's board of directors.
Dividends
The ability of the Bank to pay dividends on its common stock is restricted by the California Financial Code, the FDIA and FDIC regulations. In general terms, California law provides that the Bank may declare a cash dividend out of net profits up to the lesser of retained earnings or net income for the last three fiscal years (less any distributions made to shareholders during such period), or, with the prior written approval of the Commissioner of Department of Financial Institutions, in an amount not exceeding the greatest of:
- •
- retained earnings,
- •
- net income for the prior fiscal year, or
- •
- net income for the current fiscal year.
The Bank's ability to pay any cash dividends will depend not only upon its earnings during a specified period, but also on its meeting certain capital requirements. The FDIA and FDIC regulations restrict the payment of dividends when a bank is undercapitalized, when a bank has failed to pay insurance assessments, or when there are safety and soundness concerns regarding a bank.
The payment of dividends by the Bank may also be affected by other regulatory requirements and policies, such as maintenance of adequate capital. If, in the opinion of the regulatory authority, a depository institution under its jurisdiction is engaged in, or is about to engage in, an unsafe or unsound practice (that, depending on the financial condition of the depository institution, could include the payment of dividends), such authority may require, after notice and hearing, that such depository institution cease and desist from such practice. The Federal Reserve Board has issued a policy statement providing that insured banks and bank holding companies should generally pay dividends only out of operating earnings for the current and preceding two years. In addition, all insured depository institutions are subject to the capital-based limitations required by the Federal Deposit Insurance Corporation Improvement Act of 1991.
The FDIC Improvement Act
The Federal Deposit Insurance Corporation Improvement Act of 1991, or FDICIA, made a number of reforms addressing the safety and soundness of the deposit insurance system, supervision of domestic and foreign depository institutions, and improvement of accounting standards. This statute also limited deposit insurance coverage, implemented changes in consumer protection laws and provided for least costly resolution and prompt regulatory action with regard to troubled institutions.
FDICIA requires every bank with total assets in excess of $1 billion to have an annual independent audit made of the bank's financial statements by a certified public accountant to verify that the
25
financial statements of the bank are presented in accordance with generally accepted accounting principles and comply with such other disclosure requirements as prescribed by the FDIC.
FDICIA also divides banks into five different categories, depending on their level of capital. Under regulations adopted by the FDIC, a bank is deemed to be "well-capitalized" if it has a total Risk-Based Capital Ratio of 10.00% or more, a Tier 1 Capital Ratio of 6.00% or more and a Leverage Ratio of 5.00% or more, and the bank is not subject to an order or capital directive to meet and maintain a certain capital level. Under such regulations, a bank is deemed to be "adequately capitalized" if it has a total Risk-Based Capital Ratio of 8.00% or more, a Tier 1 Capital Ratio of 4.00% or more and a Leverage Ratio of 4.00% or more (unless it receives the highest composite rating at its most recent examination and is not experiencing or anticipating significant growth, in which instance it must maintain a Leverage Ratio of 3.00% or more). Under such regulations, a bank is deemed to be "undercapitalized" if it has a total Risk-Based Capital Ratio of less than 8.00%, a Tier 1 Capital Ratio of less than 4.00% or a Leverage Ratio of less than 4.00%. Under such regulations, a bank is deemed to be "significantly undercapitalized" if it has a total Risk-Based Capital Ratio of less than 6.00%, a Tier 1 Capital Ratio of less than 3.00% and a Leverage Ratio of less than 3.00%. Under such regulations, a bank is deemed to be "critically undercapitalized" if it has a Leverage Ratio of less than or equal to 2.00%. In addition, the FDIC has the ability to downgrade a bank's classification (but not to "critically undercapitalized") based on other considerations even if the bank meets the capital guidelines. According to these guidelines the Bank was classified as "well-capitalized" as of December 31, 2010.
In addition, FDICIA also places certain restrictions on activities of banks depending on their level of capital. If a bank is classified as undercapitalized, the bank is required to submit a capital restoration plan to the federal banking regulators. Pursuant to FDICIA, an undercapitalized bank is prohibited from increasing its assets, engaging in a new line of business, acquiring any interest in any company or insured depository institution, or opening or acquiring a new branch office, except under certain circumstances, including the acceptance by the federal banking regulators of a capital restoration plan for the bank.
Furthermore, if a bank is classified as undercapitalized, the federal banking regulators may take certain actions to correct the capital position of the bank; if a bank is classified as significantly undercapitalized or critically undercapitalized, the federal banking regulators would be required to take one or more prompt corrective actions. These actions would include, among other things, requiring: sales of new securities to bolster capital, improvements in management, limits on interest rates paid, prohibitions on transactions with affiliates, termination of certain risky activities and restrictions on compensation paid to executive officers. If a bank is classified as critically undercapitalized, FDICIA requires the bank to be placed into conservatorship or receivership within 90 days, unless the federal banking regulators determines that other action would better achieve the purposes of FDICIA regarding prompt corrective action with respect to undercapitalized banks.
The capital classification of a bank affects the frequency of examinations of the bank and impacts the ability of the bank to engage in certain activities and affects the deposit insurance premiums paid by such bank. Under FDICIA, the federal banking regulators are required to conduct a full-scope, on-site examination of every bank at least once every 12 months. There is an exception to this rule, however, that provides that banks (i) with assets of less than $100 million, (ii) are categorized as "well-capitalized," (iii) were found to be well managed and its composite rating was outstanding, and (iv) have not been subject to a change in control during the last 12 months, need only be examined once every 18 months.
26
Brokered Deposits
Under FDICIA, banks may be restricted in their ability to accept brokered deposits, depending on their capital classification. "Well-capitalized" banks are permitted to accept brokered deposits, but all banks that are not well-capitalized are not permitted to accept such deposits. The FDIC may, on a case-by-case basis, permit banks that are adequately capitalized to accept brokered deposits if the FDIC determines that acceptance of such deposits would not constitute an unsafe or unsound banking practice with respect to the bank. The Bank is currently well-capitalized and therefore is not subject to any limitations with respect to its brokered deposits.
Federal Limitations on Activities and Investments
The equity investments and activities as a principal of FDIC-insured state-chartered banks, such as the Bank, are generally limited to those that are permissible for national banks. Under regulations dealing with equity investments, an insured state bank generally may not directly or indirectly acquire or retain any equity investment of a type, or in an amount, that is not permissible for a national bank.
FDIC Deposit Insurance Assessments
Banks must pay assessments to the FDIC for federal deposit insurance protection. The FDIC has adopted a risk-based assessment system as required by FDICIA. Under this system, FDIC-insured depository institutions pay insurance premiums at rates based on their risk classification. Institutions assigned to higher risk classifications (that is, institutions that pose a higher risk of loss to the deposit insurance fund) pay assessments at higher rates than institutions that pose a lower risk. An institution's risk classification is assigned based on its capital levels and the level of supervisory concern the institution poses to the regulators. In addition, the FDIC can impose special assessments in certain instances. The FDIC may terminate its insurance of deposits if it finds that the institution has engaged in unsafe and unsound practices, is in an unsafe or unsound condition to continue operations, or has violated any applicable law, regulation, rule, order, or condition imposed by the FDIC. The Bank's deposit insurance assessments may increase or decrease depending on the risk assessment classification to which it are assigned by the FDIC. Any increase in insurance assessments could have an adverse effect on the Bank's earnings.
In November 2008, the U.S. Treasury, in consultation with the President and upon the recommendation of the Boards of the FDIC and the Federal Reserve Board, invoked the systemic risk exception of the FDIC Improvement Act of 1991. This action provided the FDIC with flexibility to provide a 100 percent guarantee for newly-issued senior unsecured debt and noninterest bearing transaction at FDIC insured institutions, which is generally regarded as the Temporary Liquidity Guarantee Program ("TLGP"). Under the TLGP, all newly issued senior unsecured debt issued by eligible entities on or before June 30, 2009 are 100 percent guaranteed for three years beyond that date, even if the liability has not matured. In October 2009, the TLGP was extended for another six months to April 30, 2010. The Company did not issue any debt under the TLGP.
Funds in noninterest-bearing transaction deposit accounts held by FDIC-insured banks are 100 percent insured. All other FDIC-insured depository accounts are insured up to $250,000 per owner The Dodd-Frank Act made permanent the $250,000 limit for federal deposit insurance and provides unlimited federal deposit insurance until January 1, 2013 for noninterest-bearing demand transaction accounts at all insured depository institutions.
In October 2010, the FDIC adopted a new Restoration Plan for the DIF to ensure that the fund reserve ratio reaches 1.35% by September 30, 2020, as required by the Dodd-Frank Act. Under the Restoration Plan, the FDIC did not institute the uniform three-basis point increase in assessment rates scheduled to take place on January 1, 2011 and maintained the current schedule of assessment rates for all depository institutions. At least semi-annually, the FDIC will update its loss and income projections
27
for the DIF and, if needed, will increase or decrease assessment rates, following notice-and-comment rulemaking, if required.
As required by the Dodd-Frank Act, the FDIC also revised the deposit insurance assessment system, effective April 1, 2011, to base assessments on the average total consolidated assets of insured depository institutions during the assessment period, less the average tangible equity of the institution during the assessment period. Currently, only deposits are included in determining the premium paid by an institution. This base assessment change necessitated that the FDIC adjust the assessment rates to ensure that the revenue collected under the new assessment system, will approximately equal that under the existing assessment system.
Community Reinvestment Act
Under the Community Reinvestment Act, or CRA, as implemented by the Congress in 1977, a financial institution has a continuing and affirmative obligation, consistent with its safe and sound operation, to help meet the credit needs of its entire community, including low and moderate income neighborhoods. CRA does not establish specific lending requirements or programs for financial institutions nor does it limit an institution's discretion to develop the types of products and services that it believes are best suited to its particular community, consistent with CRA. CRA requires federal examiners, in connection with the examination of a financial institution, to assess the institution's record of meeting the credit needs of its community and to take such record into account in its evaluation of certain applications by such institution. CRA also requires all institutions to make public disclosure of their CRA ratings. The Bank has a Compliance Committee, which oversees the planning of products and services offered to the community, especially those aimed to serve low and moderate income communities. The FDIC rated the Bank as "outstanding" in meeting community credit needs under CRA at its most recent examination for CRA performance.
Consumer Laws and Regulations
In addition to the laws and regulations discussed herein, the Bank is also subject to certain consumer laws and regulations that are designed to protect consumers in transactions with banks. While the list set forth herein is not exhaustive, these laws and regulations include the Truth in Lending Act, the Truth in Savings Act, the Electronic Funds Transfer Act, the Expedited Funds Availability Act, the Equal Credit Opportunity Act, the Fair Housing Act, the Real Estate Settlement and Procedures Act, the Fair Credit Reporting Act and the Federal Trade Commission Act, among others. These laws and regulations mandate certain disclosure requirements and regulate the manner in which financial institutions must deal with customers when taking deposits or making loans to such customers. The Bank must comply with the applicable provisions of these consumer protection laws and regulations as part of its ongoing customer relations.
Permissible Activities and Subsidiaries
California law permits state chartered commercial banks to engage in any activity permissible for national banks. Therefore, the Bank may form subsidiaries to engage in the many so-called "closely related to banking" or "non-banking" activities commonly conducted by national banks in operating subsidiaries, and further, pursuant to GLBA, the Bank may conduct certain "financial activities in a subsidiary to the same extent as may a national bank, provided the Bank is and remains "well-capitalized," "well-managed" and in satisfactory compliance with CRA. Presently, the Bank does not have any financial subsidiaries.
In September 2007, the U.S. Securities and Exchange Commission, or SEC, and the Federal Reserve Board finalized joint rules required by the Financial Services Regulatory Relief Act of 2006 to implement exceptions provided in the GLBA for securities activities that banks may conduct without
28
registering with the SEC as a securities broker or moving such activities to a broker-dealer affiliate. The Federal Reserve Board's final Regulation R provides exceptions for networking arrangements with third party broker-dealers and authorities, including sweep accounts to money market funds, and with related trust, fiduciary, custodial and safekeeping needs. The final rules, which were effective starting in 2009, are not expected to have a material effect on the Bank as it does not have any securities activities.
Interstate Branching
Under current law, California state banks are permitted to establish branch offices throughout California with prior regulatory approval. In addition, with prior regulatory approval, banks are permitted to acquire branches of existing banks located in California. Finally, California state banks generally may branch across state lines by merging with banks in other states if allowed by the applicable states' laws. With limited exceptions, California law currently permits branching across state lines through interstate mergers resulting in the acquisition of a whole California bank that has been in existence for at least five years. The Bank currently has branches located in the States of California, Texas, New Jersey and New York. Under the Federal Deposit Insurance Act, states may "opt-in" and allow out-of-state banks to branch into their state by establishing a new start-up branch in the state. California law currently prohibits de novo branching into the state of California. However, under the Dodd-Frank Act, branching requirements have been relaxed so that state banks have the ability to establish branches in any state if that state would permit the establishment of the branch by a state bank chartered in that state.
Federal Home Loan Bank System
The Federal Home Loan Bank system, or the "FHLB", of which the Bank is a member, consists of 12 regional FHLBs governed and regulated by the Federal Housing Finance Board, or the FHFB. The FHLBs serve as reserve or credit facilities for member institutions within their assigned regions. They are funded primarily from proceeds derived from the sale of consolidated obligations of the FHLB system. They make loans (i.e., advances) to members in accordance with policies and procedures established by the FHLB and the boards of directors of each regional FHLB.
As a system member, the Bank is entitled to borrow from the FHLB of San Francisco, or FHLB-SF, and is required to own capital stock in the FHLB-SF in an amount equal to the greater of 1% of the membership asset value, not exceeding $25 million, or 4.7% of outstanding FHLB-SF advance borrowings. The Bank is in compliance with the stock ownership rules described above with respect to such advances, commitments and letters of credit and home mortgage loans and similar obligations. All loans, advances and other extensions of credit made by the FHLB-SF to the Bank are secured by a portion of the Bank's mortgage loan portfolio, certain other investments and the capital stock of the FHLB-SF held by the Bank.
Mortgage Banking Operations
The Bank is subject to the rules and regulations of FNMA with respect to originating, processing, selling and servicing mortgage loans and the issuance and sale of mortgage-backed securities. Those rules and regulations, among other things, prohibit discrimination and establish underwriting guidelines which include provisions for inspections and appraisals, require credit reports on prospective borrowers and fix maximum loan amounts. Mortgage origination activities are subject to, among others, the Equal Credit Opportunity Act, Federal Truth-in-Lending Act and the Real Estate Settlement Procedures Act, and the regulations promulgated there-under which, among other things, prohibit discrimination and require the disclosure of certain basic information to mortgagors concerning credit terms and settlement costs. The Bank is also subject to regulation by the California DFI, with respect to, among other things, the establishment of maximum origination fees on certain types of mortgage loan
29
products. Wilshire State Bank is an approved Housing and Urban Development or ("HUD") lender or mortgagee and as such we must report to the Department of Housing and Urban Development. On an annual basis we are required to report our annual, audited financial and non-financial information necessary for HUD to evaluate compliance with the Fair Housing Act or ("FHA") requirements.
Future Legislation and Economic Policy
We cannot predict what other legislation or economic and monetary policies of the various regulatory authorities might be enacted or adopted or what other regulations might be adopted or the effects thereof. Future legislation and policies and the effects thereof might have a significant influence on overall growth and distribution of loans, investments and deposits and affect interest rates charged on loans or paid from time and savings deposits. Such legislation and policies have had a significant effect on the operating results of commercial banks in the past and are expected to continue.
Capital Requirements
Holding Company and Bank. At December 31, 2010, the Company's and the Bank's capital ratios exceed the minimum percentage requirements for "well capitalized" institutions. See Note 17 and Item 7 "Management's Discussion and Analysis of Financial Condition and Results of Operations—Capital Resources and Capital Adequacy Requirements" for further information regarding the regulatory capital guidelines as well as the Company's and the Bank's actual capitalization as of December 31, 2010.
The federal banking agencies have adopted risk-based minimum capital guidelines for bank holding companies and banks which are intended to provide a measure of capital that reflects the degree of risk associated with a banking organization's operations for both transactions reported on the balance sheet as assets and transactions which are recorded as off-balance sheet items. The risk-based capital ratio is determined by classifying assets and certain off-balance sheet financial instruments into weighted categories, with higher levels of capital being required for those categories perceived as representing greater risk. Under the capital guidelines, a banking organization's total capital is divided into three tiers. The first, "Tier I capital" includes common equity and trust-preferred securities subject to certain criteria and quantitative limits. The second, "Tier II capital" includes hybrid capital instruments, other qualifying debt instruments, a limited amount of the allowance for loan and lease losses, and a limited amount of unrealized holding gains on equity securities. Lastly, "Tier III capital" consists of qualifying unsecured debt. The sum of Tier II and Tier III capital may not exceed the amount of Tier I capital. The risk-based capital guidelines require a minimum ratio of qualifying total capital to risk-weighted assets of 8.00% and a minimum ratio of Tier I capital to risk-weighted assets of 4.00%.
An institution's risk-based capital, leverage capital, and tangible capital ratios together determine the institution's capital classification. An institution is treated as well capitalized if its total capital to risk-weighted assets ratio is 10.00% or more; its core capital to risk-weighted assets ratio is 6.00% or more; and its core capital to adjusted average assets ratio is 5.00% or more. In addition to the risk-based guidelines, the federal bank regulatory agencies require banking organizations to maintain a minimum amount of Tier I capital to total assets, referred to as the leverage ratio. For a banking organization rated "well-capitalized," the minimum leverage ratio of Tier I capital to total assets must be 3.00%.
30
The current risk-based capital guidelines are based upon the 1988 capital accord of the International Basel Committee on Banking Supervision. A new international accord, referred to as Basel II, which emphasizes internal assessment of credit, market and operational risk; supervisory assessment and market discipline in determining minimum capital requirements, currently becomes mandatory for large international banks outside the U.S. in 2008, is optional for others, and must be complied with in a "parallel run" for two years along with the existing Basel I standards. In July 2009, the expanded Basel Committee issued a final measure to enhance the three elements of the Basel II framework, strengthening the rules governing trading book capital issued in 1996. The measure includes enhancements to the Basel II structure and revises the market-risk framework and guidelines for calculating capital figures. The U.S. banking agencies have indicated, however, that they will retain the minimum leverage requirement for all U.S. banks.
In December 2010 and January 2011, the Basel Committee published the final texts of reforms on capital and liquidity, which is referred to as "Basel III." Although Basel III is intended to be implemented by participating countries for large, internationally active banks, its provisions are likely to be considered by United States banking regulators in developing new regulations applicable to other banks in the United States. Basel III will require bank holding companies and their bank subsidiaries to maintain substantially more capital, with a greater emphasis on common equity. The implementation of the Basel III final framework will commence January 1, 2013. On that date, banking institutions will be required to meet the following minimum capital ratios: (i) 3.5% Common Equity Tier 1 (generally consisting of common shares and retained earnings) to risk-weighted assets; (ii) 4.5% Tier 1 capital to risk-weighted assets; and (iii) 8.0% Total capital to risk-weighted assets.
When fully phased-in on January 1, 2019, and if implemented by the U.S. banking agencies, Basel III will require banks to maintain:
- •
- a minimum ratio of Common Equity Tier 1 to risk-weighted assets of at least 4.5%, plus a 2.5% "capital
conservation buffer,"
- •
- a minimum ratio of Tier 1 capital to risk-weighted assets of at least 6.0%, plus the capital
conservation buffer,
- •
- a minimum ratio of Total capital to risk-weighted assets of at least 8.0%, plus the capital conservation
buffer, and
- •
- a minimum leverage ratio of 3%, calculated as the ratio of Tier 1 capital to balance sheet exposures plus certain off-balance sheet exposures.
Basel III also includes the following significant provisions:
- •
- An additional countercyclical capital buffer to be imposed by applicable national banking regulators periodically at their
discretion, with advance notice.
- •
- Restrictions on capital distributions and discretionary bonuses applicable when capital ratios fall within the buffer
zone.
- •
- Deduction from common equity of deferred tax assets that depend on future profitability to be realized.
- •
- For capital instruments issued on or after January 13, 2013 (other than common equity), a loss-absorbency requirement that the instrument must be written off or converted to common equity if a triggering event occurs, either pursuant to applicable law or at the direction of the banking regulator. A triggering event is an event that would cause the banking organization to become nonviable without the write-off or conversion, or without an injection of capital from the public sector.
31
Since the Basel III framework is not self-executing, the rules and standards promulgated under Basel III require that the U.S. federal banking regulators adopt them prior to becoming effective in the U.S. Although U.S. federal banking regulators have expressed support for Basel III, the timing and scope of its implementation, as well as any potential modifications or adjustments that may result during the implementation process, are not yet known.
In addition to Basel III, the Dodd-Frank Act requires or permits the federal banking agencies to adopt regulations affecting banking institutions' capital requirements in a number of respects, including potentially more stringent capital requirements for systemically important financial institutions. The Dodd-Frank Act requires the Federal Reserve Board, the OCC and the FDIC to adopt regulations imposing a continuing "floor" of the Basel I-based capital requirements in cases where the Basel II-based capital requirements and any changes in capital regulations resulting from Basel III otherwise would permit lower requirements. In December 2010, the Federal Reserve Board, the OCC and the FDIC issued a joint notice of proposed rulemaking that would implement this requirement.
The Federal Deposit Insurance Act ("FDIA") gives the federal banking agencies the additional broad authority to take "prompt corrective action" to resolve the problems of insured depository institutions that fall within any undercapitalized category, including requiring the submission of an acceptable capital restoration plan. The federal banking agencies have also adopted non-capital safety and soundness standards to assist examiners in identifying and addressing potential safety and soundness concerns before capital becomes impaired. The guidelines set forth operational and managerial standards relating to: (i) internal controls, information systems and internal audit systems, (ii) loan documentation, (iii) credit underwriting, (iv) asset quality and growth, (v) earnings, (vi) risk management, and (vii) compensation and benefits.
The risks described below could materially and adversely affect our business, financial conditions and results of operations. You should carefully consider the following risk factors and all other information contained in this Report. In addition, the trading price of our common stock could decline due to any of the events described in these risks.
If we fail to maintain an effective system of internal and disclosure controls, we may not be able to accurately report our financial results or prevent fraud. As a result, current and potential shareholders could lose confidence in our financial reporting, which would harm our business and the trading price of our securities.
Effective internal control over financial reporting and disclosure controls and procedures are necessary for us to provide reliable financial reports and effectively prevent fraud and to operate successfully as a public company. If we cannot provide reliable financial reports or prevent fraud, our reputation and operating results would be harmed. We continually review and analyze our internal control over financial reporting for Sarbanes-Oxley Section 404 compliance. As part of that process we discovered and disclosed material weaknesses and significant deficiencies in our internal control. Material weakness is a deficiency, or combination of deficiencies, in internal control over financial reporting, such that there is a reasonable possibility that a material misstatement of the company's annual or interim financial statements will not be prevented or detected in a timely basis. Significant deficiency is a deficiency or combination of deficiencies, in internal control over financial reporting that is less severe than material weakness, yet important enough to merit attention by those responsible for the oversight of the Company's financial reporting.
As a result of weaknesses that may be identified in our internal control, we may also identify certain deficiencies in some of our disclosure controls and procedures that we believe require remediation. If we discover weaknesses, we will make efforts to improve our internal and disclosure
32
control. However, there is no assurance that we will be successful. Any failure to maintain effective controls or timely effect any necessary improvement of our internal and disclosure controls could harm operating results or cause us to fail to meet our reporting obligations, which could affect our ability to remain listed with The NASDAQ Global Select Market. Ineffective internal and disclosure controls could also cause investors to lose confidence in our reported financial information, which would likely have a negative effect on the trading price of our securities.
If a significant number of clients fail to perform under their loans, our business, profitability, and financial condition would be adversely affected.
As a lender, one of the largest risks we face is the possibility that a significant number of our client borrowers will fail to pay their loans when due. If borrower defaults cause losses in excess of our allowance for loan losses, it could have an adverse effect on our business, profitability, and financial condition. We have established an evaluation process designed to determine the adequacy of the allowance for loan losses. Although this evaluation process uses historical and other objective information, the classification of loans and the establishment of loan losses are dependent to a great extent on our experience and judgment. Although we believe that our allowance for loan losses is at a level adequate to absorb any inherent losses in our loan portfolio, we cannot assure you that we will not further increase the allowance for loan losses or that regulators will not require us to increase this allowance.
Increases in the level of non-performing loans could adversely affect our business, profitability, and financial condition.
Increase in non-performing loans could have an adverse effect on our earnings as a result of related increases in our provisions for loan losses, charge-offs, and other losses related to non-performing loans. The increase in non-performing loans and resulting decline in earnings could deplete our capital, leaving the Company undercapitalized. As a result of downturns in the economy in recent years and a material weakness discovered in our internal controls over financial reporting for the year ended December 31, 2010, our non-performing loans have increased from $15.6 million at the end of 2008, to $70.8 million at the end of 2009, and to $71.2 million at the end of 2010. Delinquent loans, or loans still accruing but past due by 30 days or more, totaled $34.5 million at December 31, 2010, representing a decrease of $6.2 million, or 15.2%, from December 31, 2009. In 2010 management took proactive actions to reduce non-performing and other problem assets through the sale of commercial real estate loans. However, while the sale of problems loans effectively improves the credit quality of the loan portfolio, losses associated with sale of loans at a discount can result in increased charge-offs and provision for loan losses and thereby reduces earnings and capital. In 2010, approximately 49.1% of total charge-offs were related to the sale of commercial real estate loans.
Increases in our allowance for loan losses could materially affect our earnings adversely.
Like all financial institutions, we maintain an allowance for loan losses to provide for loan defaults and non-performance. Our allowance for loan losses is based on prior experience, as well as an evaluation of the risks in the current portfolio. However, actual loan losses could increase significantly as the result of changes in economic, operating and other conditions, including changes in interest rates, which are generally beyond our control. In addition, actual loan losses could increase significantly as a result of deficiencies in our internal controls over financial reporting. Thus, such losses could exceed our current allowance estimates. Either of these occurrences could materially affect our earnings adversely.
In addition, the FDIC and the DFI, as an integral part of their respective supervisory functions, periodically review our allowance for loan losses. Such regulatory agencies may require us to increase our provision for losses on loans and loan commitments or to recognize further loan charge-offs, based
33
upon judgments different from those of management. Any increase in our allowance required by the FDIC or the DFI could adversely affect us.
Banking organizations are subject to interest rate risk and variations in interest rates may negatively affect our financial performance.
A major portion of our net income comes from our interest rate spread, which is the difference between the interest rates paid by us on interest-bearing liabilities, such as deposits and other borrowings, and the interest rates we receive on interest-earning assets, such as loans we extend to our clients and securities held in our investment portfolio. Net interest spreads are affected by the difference between the maturities and repricing characteristics of interest earning assets and interest bearing liabilities. In addition, loan volume and yields are affected by market interest rates on loans, and rising interest rates generally are associated with a lower volume of loan originations.
In 2008, Federal Reserve Board reduced the federal funds rate seven times. As of January 1, 2008, the federal funds rate was 4.25%. By December 11, 2008, the federal funds rate had been reduced to current rate of 0.00% to 0.25%. The series of reductions in the federal funds rate during 2008 effectively lowered our average interest rate for 2008 and 2009.
Because of the declining national economy and continued financial crisis, the credit markets are lacking liquidity. While the federal funds rate and other short-term market interest rates decreased substantially, the intermediate and long-term market interest rates, which are used by many banking organizations to guide loan pricing, have not decreased proportionately. This has led to a "steepening" of the market yield curve with short-term rates considerably lower than long-term notes. We cannot assure you that we will be able to minimize our interest rate risk. In addition, while a decrease in the general level of interest rates may improve the ability of certain borrowers with variable rate loans to pay the interest on and principal of their obligations, it reduces our interest income, and may lead to an increase in competition among banks for deposits. Accordingly, changes in levels of market interest rates could materially and adversely affect our net interest spread, net interest margin and our overall profitability.
Liquidity risk could impair our ability to fund operations, meet our obligations as they become due and jeopardize our financial condition.
Liquidity is essential to our business. Liquidity risk is the potential that the Bank will be unable to meet its obligations as they come due because of an inability to liquidate assets or obtain adequate funding. An inability to raise funds through deposits, borrowings, the sale of loans and other sources could have a substantial negative effect on our liquidity. Our access to funding sources in amounts adequate to finance our activities or on terms which are acceptable to us could be impaired by factors that affect us specifically or the financial services industry or economy in general. Factors that could detrimentally impact our access to liquidity sources include a decrease in the level of our business activity as a result of a downturn in the markets in which our loans are concentrated or adverse regulatory actions against us. Market conditions or other events could also negatively affect the level or cost of funding, affecting our ongoing ability to accommodate liability maturities and deposit withdrawals, meet contractual obligations, and fund asset growth and new business transactions at a reasonable cost, in a timely manner and without adverse consequences. Although management has implemented strategies to maintain sufficient and diverse sources of funding to accommodate planned as well as unanticipated changes in assets and liabilities under both normal and adverse conditions, any substantial, unexpected and/or prolonged change in the level or cost of liquidity could have a material adverse effect on our financial condition and results of operations.
34
The profitability of Wilshire Bancorp is dependent on the profitability of the Bank.
Because Wilshire Bancorp's principal activity is to act as the holding company of the Bank, the profitability of Wilshire Bancorp is largely dependent on the profitability of the Bank. The Bank operates in an extremely competitive banking environment, competing with a number of banks and other financial institutions which possess greater financial resources than those available to the Bank, in addition to other independent banks. In addition, the banking business is affected by general economic and political conditions, both domestic and international, and by government monetary and fiscal policies. Conditions such as inflation, recession, unemployment, high interest rates, short money supply, scarce natural resources, international terrorism and other disorders as well as other factors beyond the control of the Bank may adversely affect its profitability. Banks are also subject to extensive governmental supervision, regulation and control, and future legislation and government policy could adversely affect the banking industry and the operations of the Bank.
Wilshire Bancorp relies heavily on the payment of dividends from the Bank.
The Bank is the only source of significant income for Wilshire Bancorp. Accordingly, the ability of Wilshire Bancorp to meet its debt service requirements and to pay dividends depends on the ability of the Bank to pay dividends to it. However, the Bank is subject to regulations limiting the amount of dividends that it may pay to Wilshire Bancorp. For example, any payment of dividends by the Bank is subject to the FDIC's capital adequacy guidelines. All banks and bank holding companies are required to maintain a minimum ratio of qualifying total capital to total risk-weighted assets of 8.00%, at least one-half of which must be in the form of Tier 1 capital, and a ratio of Tier 1 capital to average adjusted assets of 4.00%. If (i) the FDIC increases any of these required ratios; (ii) the total of risk-weighted assets of the Bank increases significantly; and/or (iii) the Bank's income decreases significantly, the Bank's Board of Directors may decide or be required to retain a greater portion of the Bank's earnings to achieve and maintain the required capital or asset ratios. This will reduce the amount of funds available for the payment of dividends by the Bank to Wilshire Bancorp. Further, in some cases, the FDIC could take the position that it has the power to prohibit the Bank from paying dividends if, in its view, such payments would constitute unsafe or unsound banking practices. In addition, whether dividends are paid and their frequency and amount will depend on the financial condition and performance, and the discretion of the Board of Directors of the Bank. The foregoing restrictions on dividends paid by the Bank may limit Wilshire Bancorp's ability to obtain funds from such dividends for its cash needs, including funds for payment of its debt service requirements and operating expenses and for payment of cash dividends to Wilshire Bancorp's shareholders. The amount of dividends the Bank could pay to Wilshire Bancorp as of December 31, 2010 without prior regulatory approval, which is limited by statute to the sum of undivided profits for the current year plus net profits for the preceding two years (less any distributions made to shareholders during such periods), was -$7.3 million, and therefore no dividends can be paid without regulatory approval.
The holders of recently issued debentures and Series A Preferred Stock have rights that are senior to those of our common shareholders.
In December 2002, the Bank issued an aggregate of $10 million of Junior Subordinated Debentures, at times referred to in this Report as the 2002 Junior Subordinated Debentures or the 2002 debentures. In addition, in the past three years, Wilshire Bancorp, as a wholly-owned subsidiary of the Bank in 2003 and as a parent company of the Bank in 2005 and 2007, issued an aggregate of $77,321,000 of Junior Subordinated Debentures as part of the issuance of $75,000,000 in trust preferred securities by statutory trusts wholly-owned by Wilshire Bancorp. The purpose of these transactions was to raise additional capital. These Junior Subordinated Debentures are senior in liquidation rights to our outstanding shares of common stock and our Series A Preferred Stock. The terms of these Junior Subordinated Debentures also restrict our ability to pay dividends on our common stock at any time we
35
are in default under, or with respect to the Junior Subordinated Debentures issued in 2003, 2005 or 2007, have exercised our right to defer interest payments under the indentures governing these Junior Subordinated Debentures. As a result, in the event of our bankruptcy, dissolution or liquidation, the holder of these Junior Subordinated Debentures must be paid in full before any liquidating distributions may be made to the holders of our common and preferred stock. If we default under the terms of these Junior Subordinated Debentures or utilize our right to defer interest payments on the Junior Subordinated Debentures issued in 2003, 2005 or 2007, no dividends may be paid to holders of our common and preferred stock for so long as we remain in default or have deferred amounts remaining unpaid.
On December 12, 2008, the Company issued $62,158,000 in Series A Preferred Stock and a warrant to the U.S. Treasury as part of the U.S. Treasury's Capital Purchase Program or "CPP". This $62.2 million investment from the U.S. Treasury, which is commonly referred to as Troubled Assets Relief Program ("TARP") investment, was part of the government strategy to counter the ongoing financial crisis and the possible prolonged economic downturn. The TARP investment was made to us in exchange for our 62,158 shares of our Series A Preferred Stock and a warrant to purchase initially 949,460 shares of our common stock. The preferred shareholder, the U.S. Treasury, has preference with respect to dividends and liquidation over our common shareholders. Similar to the Junior Subordinated Debentures, if we default the payment of dividends on our Series A Preferred Stock, no dividends may be paid to holders of our common stock for so long as we remain in default or have deferred amounts remaining unpaid.
Because we are substantially dependent on dividends from the Bank in order to make the periodic payments due under the terms of the Junior Subordinated Debentures issued in 2003, 2005 and 2007, and the terms of the Series A Preferred Stock issued in 2008, in the event that the Bank is unable to pay dividends to Wilshire Bancorp for any significant period of time, then we may be unable to pay the amounts due to the holders of these Junior Subordinated Debentures and the U.S. Treasury. Currently, the Bank is unable to pay dividends to the Company without prior regulatory approval. If such approval is withheld, then the Company may not have sufficient funds with which to pay the amounts due to the holders of the Junior Subordinated Debentures and the U.S. Treasury.
Our failure to meet the challenges of successfully integrating the acquired Mirae Bank could potentially harm the operations of our combined organization.
Our failure to meet the challenges involved in successfully integrating the acquired Mirae assets with ours or otherwise to realize any of the anticipated benefits of the acquisition could harm the results of operations of our combined organization. The integration of the business of two banks can be a complex, time-consuming and expensive process that, without proper planning and implementation, could disrupt our business. The challenges involved in this integration include the following:
- •
- Demonstrating to the customers of Mirae Bank and the customers of Wilshire State Bank that the acquisition will not result
in adverse changes in client service standards or business focus and helping customers conduct business easily with the combined banks;
- •
- Consolidating and rationalizing corporate information technology and administrative infrastructures;
- •
- Coordinating sales and marketing efforts and strategies to effectively communicate the capabilities of the combined
organization, especially to former Mirae Bank customers;
- •
- Persuading employees that the business cultures of Wilshire State Bank and the former Mirae Bank are compatible, maintaining employee morale and retaining key employees; and
36
Income that we recognized and continue to recognize in connection with our 2009 FDIC-assisted Mirae Bank acquisition may be non-recurring or finite in duration.
On June 26, 2009, we acquired the banking operations of Mirae Bank from the FDIC. Through the acquisition, we acquired approximately $395.6 million of assets and assumed $374.0 million of liabilities. The Mirae Bank acquisition was accounted for under the purchase method of accounting and we recorded a bargain purchase gain totaling $21.7 million as a result of the acquisition. This gain was included as a component of noninterest income on our statement of income for 2009. The amount of the gain was equal to the amount by which the fair value of assets purchased exceeded the fair value of liabilities. The bargain purchase gain resulting from the acquisition was a one-time, extraordinary gain that is not expected to be repeated in future periods.
In addition, the loans that we acquired from Mirae Bank were acquired at a $54.9 million discount. This discount is amortized and accreted to interest income on a monthly basis. However, as these loans are paid-off, charged-off, sold, or transferred to non-accrual status, the income from the discount accretion is reduced. As the acquired loans are removed from our books, the related discount will no longer be available for accretion into income. During 2009, accretion of $6.7 million on loans purchased at a discount was recorded as interest income. During the first six months of 2010, accretion of $2.5 million was recorded as interest income. As of December 31, 2010, the balance of the carrying value of our discount on loans was $13.6 million, which has decreased by $17.3 million from its carrying value of $30.9 million as of December 31, 2009 and by $41.3 million from its initial value of $54.9 million. We expect the continued reduction of discount accretion recorded as interest income in future quarters.
Our decisions regarding the fair value of assets acquired, including the FDIC loss sharing assets, could be different than initially estimated which could materially and adversely affect our business, financial condition, results of operations, and future prospects.
We acquired significant portfolios of loans in the Mirae Bank acquisition. Although these loans were marked down to their estimated fair value, there is no assurance that the acquired loans will not suffer further deterioration in value resulting in additional charge-offs. The fluctuations in national, regional and local economic conditions, including those related to local residential, commercial real estate and construction markets, may increase the level of charge-offs in the loan portfolio that we acquired from Mirae Bank and correspondingly reduce our net income. These fluctuations are not predictable, cannot be controlled and may have a material adverse impact on our operations and financial condition, even if other favorable events occur.
Although we have entered into loss sharing agreements with the FDIC which provide that a significant portion of losses related to the assets acquired from Mirae Bank will be borne by the FDIC, we are not protected for all losses resulting from charge-offs with respect to those assets. Additionally, the loss sharing agreements have limited terms. Therefore, any charge-off of related losses that we experience after the term of the loss sharing agreements will not be reimbursed by the FDIC and will negatively impact our net income.
Our ability to obtain reimbursement under the loss sharing agreement on covered assets depends on our compliance with the terms of the loss sharing agreement.
The Company must certify to the FDIC on a quarterly basis our compliance with the terms of the FDIC loss sharing agreement as a prerequisite to obtaining reimbursement from the FDIC for realized losses on covered assets. The required terms of the agreement are extensive and failure to comply with any of the guidelines could result in a specific asset or group of assets permanently losing their loss sharing coverage. As of June 30, 2009, $235.6 million, or 6.86%, of the Company's assets were covered
37
by the FDIC loss sharing agreement. No assurances can be given that we will manage the covered assets in such a way as to always maintain loss share coverage on all such assets.
Adverse changes in domestic or global economic conditions, especially in California, could have a material adverse effect on our business, growth, and profitability.
If economic conditions worsen in the domestic or global economy, especially in California, our business, growth and profitability are likely to be materially adversely affected. A substantial number of our clients are geographically concentrated in California, and adverse economic conditions in California, particularly in the Los Angeles area, could harm the businesses of a disproportionate number of our clients. To the extent that our clients' underlying businesses are harmed, they are more likely to default on their loans. We can provide no assurance that conditions in the California economy and in the economies of other areas where we operate will not deteriorate further in the future and that such deterioration will not adversely affect us.
Continuing negative developments in the financial industry and U.S. and global credit markets may affect our operations and results.
Negative developments in the U.S. financial market, its real estate section, and the securitization markets for the mortgage loans have resulted in uncertainty in the overall economy both domestically and globally. Commercial as well as consumer loan portfolio performances have deteriorated at many institutions and the competition for deposits and quality loans has increased significantly. In addition, the values of real estate collateral supporting many commercial loans and home mortgages have substantially declined and may continue to further decline. Bank and bank holding company stock prices generally have been negatively affected as has the ability of banks and bank holding companies to raise capital or borrow in the debt markets compared to recent years. 2009 was a record year for bankruptcies and bank failures. As a result, there is a potential for new federal or state laws and regulations regarding lending and funding practices and liquidity standards, and bank regulatory agencies are expected to be very aggressive in responding to concerns and trends identified in examinations, including the expected issuance of many formal enforcement orders. Negative developments in the financial industry and the impact of new legislation in response to those developments could negatively affect our operations by restricting our business operations, including our ability to originate or sell loans, and adversely affect our financial performance.
The effect of the U.S. Government's response to the financial crisis remains uncertain.
In response to the turmoil in the financial services sector and the severe recession in the broader economy, the U.S. Government has taken legislative and other action intended to restore financial stability and economic growth. On October 3, 2008, then President Bush signed into law the Emergency Economic Stabilization Act of 2008 (the "EESA"). Among other things, the EESA established the Troubled Asset Relief Program, or TARP. Under TARP, the United States Treasury Department (the "Treasury Department") was given the authority, among other things, to purchase up to $700 billion of mortgages, mortgage-backed securities and certain other financial instruments from financial institutions and others for the purpose of stabilizing and providing liquidity to the U.S. financial markets. On October 14, 2008, the Treasury Department announced a program under EESA pursuant to which it would make senior preferred stock investments in qualifying financial institutions (the "TARP Capital Purchase Program"). On February 17, 2009, President Obama signed into law the American Recovery and Reinvestment Act of 2009 (the "ARRA"). The ARRA contained, among other things, a further package of economic stimulus measures and amendments to EESA's restrictions on compensation of executives of financial institutions and others participating in the TARP. In addition to legislation, the Federal Reserve Board eased short-term interest rates and implemented a series of emergency programs to furnish liquidity to the financial markets and credit to various participants in
38
those markets. The FDIC created a program to guarantee, on specified conditions, certain indebtedness and noninterest-bearing transaction accounts of participating insured depository institutions for limited periods. After permitting some of its emergency programs to lapse during the first half of the year, in November, 2010, the Federal Reserve Board implemented a further program of quantitative easing involving the purchase of an additional $600 billion of longer-term Treasury securities by the end of the second quarter of 2011. In addition, on December 17, 2010, President Obama signed the Tax Relief, Unemployment Insurance Reauthorization, and Job Creation Act of 2010 (the "2010 Tax Relief Act") which is intended to stimulate the economy. Among other things, the 2010 Tax Relief Act contained two-year extensions of the Bush era tax cuts and of Alternative Minimum Tax relief, a two-percentage point reduction in employee-paid payroll taxes and self-employment tax for 2011, new incentives for investment in machinery and equipment, estate tax relief, and a significant number of tax breaks for individuals and businesses.
In addition, on July 21, 2010, President Obama signed the Dodd-Frank Act, the most comprehensive reform of the regulation of the financial services industry since the Great Depression of the 1930's. Among many other things, the Dodd-Frank Act provides for increased supervision of financial institutions by regulatory agencies, more stringent capital requirements for financial institutions, major changes to deposit insurance assessments by the FDIC, heightened regulation of hedging and derivatives activities, a greater focus on consumer protection issues, in part through the formation of a new Consumer Finance Protection Bureau having powers formerly split among different regulatory agencies, extensive changes to the regulation of mortgage lending, imposition of limits on interchange transaction and network fees for electronic debit transactions, repeal of the existing prohibition on payment of interest on demand deposits, the effective winding up of additional expenditures of funds under the TARP, and the imposition of a "sunset date" of December 31, 2012 on expenditures under the ARRA. Many of the Dodd-Frank Act provisions have delayed effective dates that have not yet occurred, while others require implementing regulations of Federal agencies that have not yet been adopted. There can be no assurance as to the actual impact of the EESA, the ARRA, the 2010 Tax Relief Act, the Dodd-Frank Act and their respective implementing regulations, the programs of the government agencies, or any further legislation or regulations, on the financial markets or the broader economy. A failure to stabilize the financial markets, and a continuation or worsening of the current financial market conditions, could materially and adversely affect our business, financial condition, results of operations, access to credit or the trading price of our common stock.
Our operations may require us to raise additional capital in the future, but that capital may not be available or may not be on terms acceptable to us when it is needed.
We are required by federal regulatory authorities to maintain adequate levels of capital to support our operations. While we believe our existing capital resources at the Bank are sufficient to satisfy the Bank's capital requirements for the foreseeable future and will be sufficient to offset any problem assets. However, should our asset quality erode and require significant additional provision, resulting in consistent net operating losses at the Bank, our capital levels will decline and we will need to raise capital to support the Bank. In addition, we are subject to separate capital requirements and needs at the holding company. While we are in compliance with capital requirements at the holding company, there may be reasons in the future why we would determine to increase our capital levels at the holding company. Our ability to raise additional capital, if needed, will depend on conditions in the capital markets at that time, which are outside our control, and on our financial performance. Accordingly, we cannot be certain of our ability to raise additional capital if needed or on terms acceptable to us. If we cannot raise additional capital when needed, our ability to operate in substantially the same manner as we have before, including the payment of dividends at the bank and holding company levels, could be materially impaired.
39
Maintaining or increasing our market share depends on market acceptance and regulatory approval of new products and services.
Our success depends, in part, upon our ability to adapt our products and services to evolving industry standards and consumer demand. There is increasing pressure on financial services companies to provide products and services at lower prices. In addition, the widespread adoption of new technologies, including Internet-based services, could require us to make substantial expenditures to modify or adapt our existing products or services. A failure to achieve market acceptance of any new products we introduce, or a failure to introduce products that the market may demand, could have an adverse effect on our business, profitability, or growth prospects.
Significant reliance on loans secured by real estate may increase our vulnerability to downturns in the California real estate market and other variables impacting the value of real estate.
At December 31, 2010, approximately 85.3% of our loans were secured by real estate, a substantial portion of which consist of loans secured by real estate in California. Conditions in the California real estate market historically have influenced the level of our non-performing assets. A real estate recession in Southern California could adversely affect our results of operations. In addition, California has experienced, on occasion, significant natural disasters, including earthquakes, brush fires and flooding attributed to the weather phenomenon known as "El Nino." In addition to these catastrophes, California has experienced a moderate decline in housing prices beginning in late 2006. The decline in housing prices subsequently developed into the current financial crisis, characterized by the further decline in the real estate market in many parts of the country, including California, starting in the second half of 2007, and the failures of many financial institutions in 2008 and 2009. The availability of insurance to compensate for losses resulting from such crises is limited. The occurrence of one or more of such crises could impair the value of the collateral for our real estate secured loans and adversely affect us.
If we fail to retain our key employees, our growth and profitability could be adversely affected.
Our future success depends in large part upon the continuing contributions of our key management personnel. If we lose the services of one or more key employees within a short period of time, we could be adversely affected. Our future success is also dependent upon our continuing ability to attract and retain highly qualified personnel. Competition for such employees among financial institutions in California is intense. Our inability to attract and retain additional key personnel could adversely affect us. In November 2007, our former Executive Vice President and Chief Financial Officer, resigned. Following his resignation, we engaged his replacement in April 2008. In addition, our Senior Vice President and Controller, was promoted to Senior Vice President and Deputy Chief Financial Officer in conjunction with the appointment of our new Chief Financial Officer. Furthermore, effective January 1, 2008, our former President and Chief Executive Officer retired. However, in connection with his retirement, we have entered into a consulting agreement providing for his continued service as an advisor for the Bank until May 2009. Following the retirement of our former Chief Executive Officer, we promoted our previous Executive Vice President and Chief Lending Officer to the position of President and Chief Executive Officer; and our prior Executive Vice President and SBA Manager, was promoted to Chief Lending Officer. The Company's Chief Marketing Officer was terminated in December 2010, and the position remains open. Effective February 18, 2011 our President and Chief Executive Officer resigned after which a new President and Chief Executive Officer was immediately appointed the position on the same day. In March of 2011, the Chief Lending Officer also resigned and his position still remained open.
For as long as we have shares of Series A Preferred Stock outstanding in connection with the U.S. Treasury's voluntary TARP Capital Purchase Program, we will be subject to the limitations on compensation included in EESA and ARRA. These restrictions may make it more difficult for us to
40
retain certain of our key officers and employees because competitors who are not subject to the same restrictions may be able to offer more competitive salaries and/or benefits to these individuals. More information about the compensation limitations of EESA and AARA can be found in the section entitled "Supervision and Regulation—TARP Capital Purchase Program" in Item 1 of this Report.
We may be unable to manage future growth.
We may encounter problems in managing our future growth. Our total assets at December 31, 2010, 2009, and 2008 were $2.97 billion, $3.44 billion, and $2.45 billion, respectively, representing a decrease of $465.5 million or 13.6% in 2010, and an increase of $986.0 million, or 40.24% in 2009. No assurance can be provided that we will be able to identify a suitable acquisition target or consummate any such acquisition. Further, our ability to manage growth will depend primarily on our ability to attract and retain qualified personnel, monitor operations, maintain earnings, and control costs. We currently do not intend to consider additional "de novo" branches and LPOs or to investigate opportunities to acquire or combine with other financial institutions that would complement our existing business, as such opportunities may arise and be consistent with our deliberate expansion strategy. Any failure by us to accomplish these goals could risk interruptions in our business plans and could also adversely affect current operations.
Our expenses will increase as a result of increases in FDIC insurance premiums.
The FDIC imposes an assessment against institutions for deposit insurance. This assessment is based on the risk category of the institution. Federal law requires that the designated reserve ratio for the deposit insurance fund be established by the FDIC at a 1.15% of estimated insured deposits. If this reserve ratio drops below 1.15%, the FDIC must, within 90 days, establish and implement a plan to restore the designated reserve ratio to 1.15% of estimated insured deposits within five years (absent extraordinary circumstances). Recent bank failures coupled with deteriorating economic conditions have significantly reduced the deposit insurance fund's reserve ratio. As a result of this reduced reserve ratio, on October 7, 2008, the FDIC adopted a restoration plan that would restore the reserve ratios to its required level of 1.15% over a seven-year period. There have also been increases in FDIC assessments resulting from its recently announced Temporary Liquidity Guaranty Program. If the economy continues to decline, the FDIC premiums may continue to increase in the future. Continued increases in FDIC insurance premiums m have an adverse effect on our earnings depleting capital reserves.
We could be liable for breaches of security in our online banking services. Fear of security breaches could limit the growth of our online services.
We offer various Internet-based services to our clients, including online banking services. The secure transmission of confidential information over the Internet is essential to maintain our clients' confidence in our online services. Advances in computer capabilities, new discoveries or other developments could result in a compromise or breach of the technology we use to protect client transaction data. Although we have developed systems and processes that are designed to prevent security breaches and periodically test our security, failure to mitigate breaches of security could adversely affect our ability to offer and grow our online services and could harm our business.
People generally are concerned with security and privacy on the Internet and any publicized security problems could inhibit the growth of the Internet as a means of conducting commercial transactions. Our ability to provide financial services over the Internet would be severely impeded if clients became unwilling to transmit confidential information online. As a result, our operations and financial condition could be adversely affected.
41
Our directors and executive officers beneficially own a significant portion of our outstanding common stock.
As of February 26, 2011, our directors and executive officers, together with their respective affiliates, beneficially owned approximately 33% of our outstanding voting common stock (not including vested option shares). As a result, such shareholders may have the ability to significantly influence the outcome of corporate actions requiring shareholder approval, including the election of directors and the approval of significant corporate transactions, such as a merger or sale of all or substantially all of our assets. We can provide no assurance that the investment objectives of such shareholders will be the same as our other shareholders.
The market for our common stock is limited, and potentially subject to volatile changes in price.
The market price of our common stock may be subject to significant fluctuation in response to numerous factors, including variations in our annual or quarterly financial results or those of our competitors, changes by financial research analysts in their evaluation of our financial results or those of our competitors, or our failure or that of our competitors to meet such estimates, conditions in the economy in general or the banking industry in particular, or unfavorable publicity affecting us or the banking industry. In addition, the equity markets have, on occasion, experienced significant price and volume fluctuations that have affected the market prices for many companies' securities and have been unrelated to the operating performance of those companies. In addition, the sale by any of our large shareholders of a significant portion of that shareholder's holdings could have a material adverse effect on the market price of our common stock. Further, the issuance or registration by us of any significant amount of additional shares of our common stock will have the effect of increasing the number of outstanding shares or, in the case of registrations, the number of shares of our common stock that are freely tradable; any such increase may cause the market price of our common stock to decline or fluctuate significantly. Any such fluctuations may adversely affect the prevailing market price of the common stock.
We may experience impairment on goodwill.
In light of the overall instability of the economy, the continued volatility in the financial markets, the downward pressure on bank stock prices and expectations of financial performance for the banking industry, including the Company, our estimates of goodwill fair value may be subject to change or adjustment and we may determine that impairment charges are necessary. Estimates of fair value are determined based on a complex model using cash flows and company comparisons. If management's estimates of future cash flows are inaccurate, the fair value determined could be inaccurate and impairment may not be recognized in a timely manner. If the Company's market capitalization falls below book value, we will update our valuation analysis to determine whether goodwill is impaired. No assurance can be given that goodwill will not be written down in future periods.
We may experience a valuation allowance on deferred tax assets.
At December 31, 2010, the Company had a total of $46.4 million in deferred tax assets, $33.6 million in Federal deferred tax assets, and $12.8 million in State deferred tax assets. In light of the net loss experienced in 2010, there may be a chance that some or all of the deferred tax assets will not be realized in the future. The realization of the deferred tax assets is dependent upon whether there will be sufficient future taxable income to realize the deferred tax assets within the carryback or carryforward period available under tax laws. If at any time, all or a portion of the deferred tax assets are not expected to be realized, a valuation allowance is required to reduce the deferred tax asset balance and reduce net income. No assurance can be given that the Company will not record a valuation allowance in future periods.
42
We face substantial competition in our primary market area.
We conduct our banking operations primarily in Southern California. Increased competition in our market may result in reduced loans and deposits. Ultimately, we may not be able to compete successfully against current and future competitors. Many competitors offer the same banking services that we offer in our service area. These competitors include national banks, regional banks and other community banks. We also face competition from many other types of financial institutions, including without limitation, savings and loan institutions, finance companies, brokerage firms, insurance companies, credit unions, mortgage banks and other financial intermediaries. In particular, our competitors include several major financial companies whose greater resources may afford them a marketplace advantage by enabling them to maintain numerous banking locations and mount extensive promotional and advertising campaigns. Additionally, banks and other financial institutions with larger capitalization and financial intermediaries not subject to bank regulatory restrictions have larger lending limits and are thereby able to serve the credit needs of larger customers. Areas of competition include interest rates for loans and deposits, efforts to obtain deposits, and range and quality of products and services provided, including new technology-driven products and services. Technological innovation continues to contribute to greater competition in domestic and international financial services markets as technological advances enable more companies to provide financial services. We also face competition from out-of-state financial intermediaries that have opened low-end production offices or that solicit deposits in our market areas. If we are unable to attract and retain banking customers, we may be unable to continue our loan growth and level of deposits and our results of operations and financial condition may otherwise be adversely affected.
Anti-takeover provisions of our charter documents may have the effect of delaying or preventing changes in control or management.
Certain provisions in our Articles of Incorporation and Bylaws could discourage unsolicited takeover proposals not approved by the Board of Directors in which shareholders could receive a premium for their shares, thereby potentially limiting the opportunity for our shareholders to dispose of their shares at the higher price generally available in takeover attempts or that may be available under a merger proposal or may have the effect of permitting our current management, including the current Board of Directors, to retain its position, and place it in a better position to resist changes that shareholders may wish to make if they are dissatisfied with the conduct of our business. The anti-takeover measures included in our Articles of Incorporation and Bylaws, include, without limitation, the following:
- •
- the elimination of cumulative voting,
- •
- the adoption of a classified Board of Directors,
- •
- super-majority shareholder voting requirements to modify certain provisions of the Articles of Incorporation
and Bylaws, and
- •
- restrictions on certain "business combinations" with third parties who may acquire our securities outside of an action taken by us.
We are subject to significant government regulation and legislation that increases the cost of doing business and inhibits our ability to compete.
We are subject to extensive state and federal regulation, supervision and legislation, all of which is subject to material change from time to time. These laws and regulations increase the cost of doing business and have an adverse impact on our ability to compete efficiently with other financial service providers that are not similarly regulated. Changes in regulatory policies or procedures could result in management's determining that a higher provision for loan losses would be necessary and could cause
43
higher loan charge-offs, thus adversely affecting our net earnings. There can be no assurance that future regulation or legislation will not impose additional requirements and restrictions on us in a manner that could adversely affect our results of operations, cash flows, financial condition and prospects.
As a participant in the TARP Capital Purchase Program, we have agreed to various requirements and restrictions imposed by the U.S. Treasury on all participants, which included a provision that the U. S. Treasury could change the terms of participation at any time. Further information regarding the current requirements and restrictions imposed on TARP participants can be found under the caption "Regulation and Supervision—The TARP Capital Purchase Program" in Item 1 of this Report.
We are subject to various regulatory requirements, expect to be subject to a memorandum of understanding and may be subject to future additional regulatory restrictions and enforcement actions.
Under federal and state laws and regulations pertaining to the safety and soundness of insured depository institutions, the California DFI and the Federal Reserve Board, and separately the FDIC as insurer of the Bank's deposits, have authority to compel or restrict certain actions if the Bank's capital should fall below adequate capital standards as a result of operating losses, or if its regulators otherwise determine that it has insufficient capital or is otherwise operating in an unsafe and unsound manner. Among other matters, the corrective actions may include, but are not limited to, requiring us or the Bank to enter into informal or formal enforcement orders, including memoranda of understanding, written agreements, supervisory letters, commitment letters, and consent or cease and desist orders to take corrective action and refrain from unsafe and unsound practices; removing officers and directors and assessing civil monetary penalties; terminating the Bank's FDIC insurance; requiring us to enter into a strategic transaction, whether by merger or otherwise; and taking possession of and closing and liquidating either or both of the Banks.
In light of the current challenging operating environment, along with our elevated level of non-performing assets, delinquencies, and adversely classified assets and our recent operating results, we are subject to increased regulatory scrutiny as well as increased FDIC premiums as a result of the potential risk of loss in our loan portfolio. Following the regulators' most recent examination of the Bank in 2010 and the Federal Reserve examination of the Company during 2010 as well, we and the Bank expect to become subject to a Memorandum of Understanding (MOU) with the California DFI and the FDIC. We expect that, under the MOU, the Bank will be required, among other things, to develop and implement plans to reduce commercial real estate concentrations; to improve asset quality and reduce classified assets; to improve profitability; and to increase Tier 1 leverage capital above what is currently required of the Bank. In addition, we expect to be required to retain management and directors acceptable to the California DFI and the FDIC. Lastly, it is expected that the Bank will not be able to pay cash dividends to the Company without prior approval from the FDIC and California DFI. No assurance can be given that our current management and directors are acceptable to the California DFI or the FDIC, that we will be able to retain or engage management and directors who are acceptable to the California DFI or the FDIC or that we will be able to meet the requirements of the memoranda in a timely manner.
If we are unable to meet the requirements of the expected memoranda from the Washington DFI and the FDIC in a timely manner, we could become subject to additional supervisory action, including a consent order. If our banking supervisors were to take such additional supervisory action, we could, among other things, become subject to significant restrictions on our ability to develop any new business, as well as restrictions on our existing business, and we could be required to raise additional capital, dispose of certain assets and liabilities within a prescribed period of time, or both. In addition, the FDIC has the power to deem the Bank to be only "adequately capitalized" even though its capital ratios meet the well capitalized standard. In such event, the Bank would be prohibited from using brokered deposits, which have been a source of funds for us in recent years, and rates on deposits
44
would be limited to market rates determined by the FDIC, potentially adversely affecting our liquidity. The terms of any such corrective action could have a material negative effect on our business, our financial condition and the value of our common stock. Additionally, there can be no assurance that we will not be subject to further supervisory action or regulatory proceedings.
We could be negatively impacted by downturns in the South Korean economy.
Many of our customers are locally based Korean-Americans who also conduct business in South Korea. Although we conduct most of our business with locally-based customers and rely on domestically located assets to collateralize our loans and credit arrangements, we have historically had some exposure to the economy of South Korea in connection with certain portions of our loans and credit transactions with Korean banks. Such exposure has consisted of:
- •
- discounts of acceptances created by banks in South Korea,
- •
- advances made against clean documents presented under sight letters of credit issued by banks in South Korea,
- •
- advances made against clean documents held for later presentation under letters of credit issued by banks in South Korea,
and
- •
- extensions of credit to borrowers in the U.S. secured by letters of credit issued by banks in South Korea.
We generally enter into any such loan or credit arrangements, in excess of $200,000 and of longer than 120 days, only with the largest of the Korean banks and spread other lesser or shorter term loan or credit arrangements among a variety of medium-sized Korean banks.
As a result of the economic crisis in South Korea in the mid-1990's, management has continued to closely monitor our exposure to the South Korean economy and the activities of Korean banks with which we conduct business. To date, we have not experienced any significant loss attributable to our exposure to South Korea. Nevertheless, there can be no assurance that our efforts to minimize exposure to downturns in the South Korean economy will be successful in the future, and another significant downturn in the South Korean economy could possibly result in significant credit losses for us.
In addition, due to our customer base being largely made up of Korean-Americans, our deposit base could significantly decrease as a result of deterioration in the Korean economy. For example, some of our customers' businesses may rely on funds from South Korea. Further, our customers may temporarily withdraw deposits in order to transfer funds and benefit from gains on foreign exchange and interest rates, and/or to support their relatives in South Korea during downturns in the Korean economy. A significant decrease in our deposits could also have a material adverse effect on our financial condition and results of operations.
Additional shares of our common stock issued in the future could have a dilutive effect.
Shares of our common stock eligible for future issuance and sale could have a dilutive effect on the market for our stock. Our Articles of Incorporation authorizes the issuance of 80,000,000 shares of common stock. As of February 28, 2011, there were approximately 29,477,778 shares of our common stock issued and outstanding, 1,091,800 shares of our authorized but unissued shares of common stock are reserved for issuance under the Wilshire Bancorp, Inc. 2008 Stock Option Plan, or the "2008 Stock Option Plan," 949,460 shares of our authorized but unissued shares of common stock are reserved for issuance upon exercise of the warrant that we issued to the U.S. Treasury in connection with our participation in the TARP Capital Purchase Program, plus an additional 203,680 shares of our common stock are reserved for issuance to the holders of stock options previously granted and still outstanding
45
under the Wilshire State Bank 1997 Stock Option Plan, or the "1997 Stock Option Plan." Thus, approximately 48,119,536 shares of our common stock remain authorized (not reserved for stock options and are available for future issuance and sale) at the discretion of our Board of Directors.
Shares of our preferred stock previously issued and preferred stock issued in the future could have dilutive and other effects.
On December 12, 2008, we received $62,158,000 from the U.S. Treasury as part of the federal government's Capital Purchase Program. In exchange for the federal funding, we issued 62,158 shares of Series A Preferred Stock, each with a stated liquidation amount of $1,000 per share, to the U.S. Treasury. As of February 28, 2011, there were of 62,158 shares of our Series A Preferred Stock that were issued and outstanding.
Shares of our preferred stock eligible for future issuance and sale also could have a dilutive effect on the market for the shares of our common stock, especially because of the fact that the preferred shares would have seniority with respect to our common stock. In addition to 80,000,000 shares of common stock, our Articles of Incorporation authorize the issuance of 5,000,000 shares of preferred stock. As of December 31, 2010, the total number of shares of authorized but unissued preferred stock was 4,937,842. The Board of Directors could authorize the issuance of such preferred shares at any time in the future. If such shares of preferred stock are made convertible into shares of common stock, there could be a dilutive effect on the shares of common stock then outstanding. In addition, shares of preferred stock may be provided a preference over holders of common stock upon our liquidation or with respect to the payment of dividends, in respect of voting rights or in the redemption of our capital stock. The rights, preferences, privileges and restrictions applicable to any series of preferred stock may be determined by resolution of our Board of Directors without the need for shareholder approval.
Item 1B. Unresolved Staff Comments
None.
46
Our primary banking facilities (corporate headquarters and various lending offices) are located at 3200 Wilshire Boulevard, Los Angeles, California and consists of approximately 45,952 square feet as of the date of this report. This lease expires March 31, 2015, but we have an option to extend the lease for two consecutive five-year periods. The combined monthly rents for this lease is currently $55,725.
We have 24 full-service branch banking offices in Southern California, Texas, New Jersey, and New York. We also lease 6 separate LPOs in Aurora, Colorado (the Denver area); Atlanta, Georgia; Dallas, Texas; Houston, Texas; Fort Lee, New Jersey; and Annandale, Virginia. Information about the properties associated with each of our banking facilities is set forth in the table below:
Property
|
Ownership Status | Square Feet |
Purchase Price |
Monthly Rent* |
Use | Lease Expiration |
|||||||||
|---|---|---|---|---|---|---|---|---|---|---|---|---|---|---|---|
| Wilshire Office | Leased | 7,426 | N/A | $ | 10,768 | Branch Office | March 2015 | ||||||||
| 3200 Wilshire Blvd. Suite 103 | [w/right to extend for two | ||||||||||||||
| Los Angeles, CA | consecutive 5-year periods] | ||||||||||||||
| |
|||||||||||||||
| Rowland Heights Office | Leased | 2,860 | N/A | $ | 8,729 | Branch Office | May 2011 | ||||||||
| 19765 E. Colima Road | [w/right to extend for two | ||||||||||||||
| Rowland Heights, CA | consecutive 5-year periods] | ||||||||||||||
| |
|||||||||||||||
| Western Office | Leased | 4,950 | N/A | $ | 25,165 | Branch Office | June 2015 | ||||||||
| 841 South Western Ave. | [w/right to extend for one | ||||||||||||||
| Los Angeles, CA | 5-year period] | ||||||||||||||
| |
|||||||||||||||
| Olympic Office | Leased | 9,247 | N/A | $ | 13,871 | Branch Office | August 2019 | ||||||||
| 2140 West Olympic Blvd. | [w/right to extend for two | ||||||||||||||
| Los Angeles, CA | 5-year period] | ||||||||||||||
| |
|||||||||||||||
| Valley Office | Leased | 7,350 | N/A | $ | 11,760 | Branch Office | October 2017 | ||||||||
| 8401 Reseda Blvd. | [w/right to extend for two | ||||||||||||||
| Northridge, CA | consecutive 5-year periods] | ||||||||||||||
| |
|||||||||||||||
| Van Nuys | Leased | 1,150 | N/A | $ | 2,243 | Branch Office | March 2015 | ||||||||
| 9700 Woodman Ave., # A-6 | [w/right to extend for two | ||||||||||||||
| Arleta, CA | consecutive 5-year periods] | ||||||||||||||
| |
|||||||||||||||
| Downtown Office | Leased | 5,500 | N/A | $ | 15,400 | Branch Office | June 2019 | ||||||||
| 401 East 11th St. Suite 207-211 | [w/right to extend for two | ||||||||||||||
| Los Angeles, CA | 5-year period] | ||||||||||||||
| |
|||||||||||||||
| Cerrito Office | Leased | 5,702 | N/A | $ | 9,000 | Branch Office | January 2017 | ||||||||
| 17500 Carmenita Road | [w/right to extend for two | ||||||||||||||
| Cerritos, CA | 5-year period] | ||||||||||||||
| |
|||||||||||||||
| Gardena Office | Leased | 4,150 | N/A | $ | 11,509 | Branch Office | November 2010 | ||||||||
| 15435 South Western Ave. St. 100 | [w/right to extend for two | ||||||||||||||
| Gardena, CA | consecutive 5-year periods] | ||||||||||||||
| |
|||||||||||||||
| Rancho Cucamonga Office | Leased | 3,000 | N/A | $ | 5,850 | Branch Office | November 2015 | ||||||||
| 8045 Archibald Ave. | [w/right to extend for two | ||||||||||||||
| Rancho Cucamonga, CA | consecutive 5-year periods] | ||||||||||||||
| |
|||||||||||||||
| City Center Office | Leased | 3,538 | N/A | $ | 17,690 | Branch Office | February 2012 | ||||||||
| 3500 West 6th Street #201 | [w/right to extend for three | ||||||||||||||
| Los Angeles, CA | consecutive 5-year periods] | ||||||||||||||
| |
|||||||||||||||
| Irvine Office | Leased | 1,960 | N/A | $ | 10,450 | Branch Office | June 2013 | ||||||||
| 14451 Red Hill Ave. | [w/right to extend for one | ||||||||||||||
| Tustin, CA | 5-year period] | ||||||||||||||
| |
|||||||||||||||
| Mid-Wilshire Office | Leased | 3,382 | N/A | $ | 11,136 | Branch Office | December 2012 | ||||||||
| 3832 Wilshire Blvd. | |||||||||||||||
| Los Angeles, CA | |||||||||||||||
| |
|||||||||||||||
47
Property
|
Ownership Status | Square Feet |
Purchase Price |
Monthly Rent* |
Use | Lease Expiration |
|||||||||
|---|---|---|---|---|---|---|---|---|---|---|---|---|---|---|---|
| Fashion Town Office | Leased | 3,208 | N/A | $ | 6,163 | Branch Office | March 2014 | ||||||||
| 1300 S. San Pedro Street | [w/right to extend for two | ||||||||||||||
| Los Angeles, CA | consecutive 5-year periods] | ||||||||||||||
| |
|||||||||||||||
| Fullerton Office | Leased | 1,440 | N/A | $ | 4,579 | Branch Office | July 2011 | ||||||||
| 5254 Beach Blvd. | [w/right to extend for two | ||||||||||||||
| Buena Park, CA | consecutive 5-year periods] | ||||||||||||||
| |
|||||||||||||||
| Huntington Park Office | Purchased | 4,350 | $ | 710,000 | N/A | Branch Office | N/A | ||||||||
| 6350 Pacific Blvd. | in 2000 | ||||||||||||||
| Huntington Park, CA | |||||||||||||||
| |
|||||||||||||||
| Torrance Office | Leased | 2,360 | N/A | $ | 7,309 | Branch office | June 2019 | ||||||||
| 2390 Crenshaw Blvd. #D | [w/right to extend for two | ||||||||||||||
| Torrance, CA | consecutive 5-year periods] | ||||||||||||||
| |
|||||||||||||||
| Garden Grove Office | Purchased | 2,549 | $ | 1,535,500 | N/A | Branch Office | N/A | ||||||||
| 9672 Garden Grove Blvd. | in 2005 | ||||||||||||||
| Garden Grove, CA | |||||||||||||||
| |
|||||||||||||||
| Manhattan Office | Leased | 7,544 | N/A | $ | 31,900 | Branch Office | September 2019 | ||||||||
| 308 Fifth Ave. | [w/right to extend for one | ||||||||||||||
| New York, NY | consecutive 5-year periods] | ||||||||||||||
| |
|||||||||||||||
| Bayside Office | Leased | 2,445 | N/A | $ | 14,061 | Branch Office | April 2012 | ||||||||
| 210-16 Northern Blvd. | [w/right to extend for three | ||||||||||||||
| Bayside, NY | consecutive 5-year periods] | ||||||||||||||
| |
|||||||||||||||
| Flushing Office | Leased | 2,300 | N/A | $ | 13,792 | Branch Office | December 2018 | ||||||||
| 150-24 Northern Blvd. | [w/right to extend for two | ||||||||||||||
| Flushing, NY | consecutive 5-year periods] | ||||||||||||||
| |
|||||||||||||||
| Fort Lee Office | Leased | 2,264 | N/A | $ | 10,793 | Branch Office | May 2017 | ||||||||
| 215 Main Street | [w/right to extend for one | ||||||||||||||
| Fort Lee, NJ | 5-year period] | ||||||||||||||
| |
|||||||||||||||
| Dallas Office | Purchased | 7,000 | $ | 1,325,000 | N/A | Branch | N/A | ||||||||
| 2237 Royal Lane | in 2003 | Office & LPO | |||||||||||||
| Dallas, Texas | Office | ||||||||||||||
| |
|||||||||||||||
| Denver Office | Leased | 1,135 | N/A | $ | 1,561 | LPO Office | September 2011 | ||||||||
| 2821 S. Parker Road #415 | [w/right to extend for one | ||||||||||||||
| Aurora, CO | 3-year period] | ||||||||||||||
| |
|||||||||||||||
| Atlanta Office | Leased | 924 | N/A | $ | 1,800 | LPO Office | December 2011 | ||||||||
| 4864 Jimmy Carter Blvd., #202 | [w/right to extend for | ||||||||||||||
| Norcross, GA | one 1-year period] | ||||||||||||||
| |
|||||||||||||||
| Houston Office | Leased | 1,096 | N/A | $ | 2,192 | LPO Office | March 2011 | ||||||||
| 9801 Westheimer #801 | [w/right to extend for one | ||||||||||||||
| Houston, TX | 3-year period] | ||||||||||||||
| |
|||||||||||||||
| Fort Worth Office | Purchased | 3,500 | $ | 1,100,000 | N/A | Branch Office | N/A | ||||||||
| 7553 Boulevard 26 | |||||||||||||||
| N. Richland Hills, TX | |||||||||||||||
| |
|||||||||||||||
| Annandale Office | Leased | 1,150 | N/A | $ | 2,106 | LPO Office | May 2012 | ||||||||
| 7535 Little River Turnpike #310A | |||||||||||||||
| Annandale, VA | |||||||||||||||
- *
- Monthly rent is based on figures at December 31, 2010
Management has determined that all of our premises are adequate for our present and anticipated level of business.
48
From time to time, we are a party to claims and legal proceedings arising in the ordinary course of business. Our management evaluates our exposure to these claims and proceedings individually and in the aggregate and provides for potential losses on such litigation if the amount of the loss is estimatable and the loss is probable.
No loss contingency has been recorded in any period presented in the financial statements because such losses are either not probable or reasonably estimable (or both) at the present time. Such matters are subject to many uncertainties and their ultimate outcomes are not predictable with assurance. Consequently, management is unable to estimate a range of potential loss, if any, related to these matters. At this time, management has not concluded whether the final resolution of any of these matters will have a material adverse effect upon the financial statements.
Item 5. Market for Registrant's Common Equity, Related Shareholder Matters, and Issuer Purchases of Equity Securities
Trading History
Wilshire Bancorp's common stock is listed for trading on the NASDAQ Global Select Market under the symbol "WIBC."
The information in the following table sets forth, for the quarters indicated, the high and low closing sale prices for the common stock as reported on the NASDAQ Global Select Market:
| |
Closing Sale Price | |||||||
|---|---|---|---|---|---|---|---|---|
| |
High | Low | ||||||
Year Ended December 31, 2010 |
||||||||
First Quarter |
$ | 11.83 | $ | 7.85 | ||||
Second Quarter |
$ | 11.64 | $ | 8.75 | ||||
Third Quarter |
$ | 8.55 | $ | 6.07 | ||||
Fourth Quarter |
$ | 7.85 | $ | 6.46 | ||||
Year Ended December 31, 2009 |
||||||||
First Quarter |
$ | 8.99 | $ | 3.34 | ||||
Second Quarter |
$ | 6.56 | $ | 3.95 | ||||
Third Quarter |
$ | 9.43 | $ | 5.75 | ||||
Fourth Quarter |
$ | 8.50 | $ | 6.42 | ||||
On February 28, 2011, the closing sale price for the common stock was $6.61, as reported on the NASDAQ Global Select Market.
Shareholders
As of February 28, 2011, there were 148 shareholders of record of our common stock (not including the number of persons or entities holding stock in nominee or street name through various brokerage firms).
Dividends
As a California corporation, we are restricted under the California General Corporation Law, or CGCL, from paying dividends under certain conditions. Our shareholders are entitled to receive
49
dividends when and as declared by our Board of Directors, out of funds legally available for the payment of dividends, as provided in the CGCL. The CGCL provides that a corporation may make a distribution to its shareholders if retained earnings immediately prior to the dividend payout at least equal the amount of proposed distribution. In the event that sufficient retained earnings are not available for the proposed distribution, a corporation may, nevertheless, make a distribution, if it meets both the "quantitative solvency" and the "liquidity" tests. In general, the quantitative solvency test requires that the sum of the assets of the corporation equal at least 11/4 times its liabilities. The liquidity test generally requires that a corporation have current assets at least equal to current liabilities, or, if the average of the earnings of the corporation before taxes on income and before interest expenses for the two preceding fiscal years was less than the average of the interest expense of the corporation for such fiscal years, then current assets must be equal to at least 11/4 times current liabilities. In certain circumstances, we may be required to obtain the prior approval of the Federal Reserve Board to make capital distributions to our shareholders.
It has been our general practice to retain earnings for the purpose of increasing capital to support growth, and no cash dividends were paid to shareholders prior to 2005. However, we began paying a cash dividend to our common shareholders beginning in the first quarter of 2005. In light of recent increased credit cost associated with the increase in non-performing loans, the Board of Directors approved a temporary suspension of our common stock dividend after the first quarter of 2010. While we currently pay cash dividends to the holders of our Series A Preferred Stock pursuant to our agreements under the TARP Capital Purchase Program, all dividends are subject to the discretion of our Board of Directors and will depend on a number of factors, including future earnings, financial condition, cash needs and general business conditions. It is also possible that the Federal Reserve Board may require us to defer dividend payments on our Series A Preferred Stock and trust preferred securities. Any dividend to our common shareholders must also comply with the restrictions in our outstanding Junior Subordinated Debentures and our Series A Preferred Stock described earlier in this Report, as well as applicable bank regulations.
The following table shows cash dividends to our common shareholders declared by Wilshire Bancorp the two years ended December 31, 2010:
Declaration Date
|
Payable Date | Record Date | Amount | |||
|---|---|---|---|---|---|---|
February 23, 2009 |
April 15, 2009 | March 31, 2009 | $0.05 per share | |||
May 28, 2009 |
July 15, 2009 | June 30, 2009 | $0.05 per share | |||
August 28, 2009 |
October 15, 2009 | September 30, 2009 | $0.05 per share | |||
November 23, 2009 |
January 15, 2010 | December 31, 2009 | $0.05 per share | |||
February 23, 2010 |
April 15, 2010 | March 31, 2010 | $0.05 per share |
The following table shows cash dividends to US Treasury for our preferred stocks for the two years ended December 31, 2010:
Date Paid
|
Period | Rate | Amount Paid | ||||||
|---|---|---|---|---|---|---|---|---|---|
February 16, 2009 |
Dec 12, 2008 - Feb 15, 2009 | 5.00 | % | $ | 543,883 | ||||
May 15, 2009 |
Feb 16, 2009 - May 15, 2009 | 5.00 | % | $ | 776,975 | ||||
August 17, 2009 |
May 16, 2009 - Aug 15, 2009 | 5.00 | % | $ | 776,975 | ||||
November 16, 2009 |
Aug 16, 2009 - Nov 15, 2009 | 5.00 | % | $ | 776,975 | ||||
February 16, 2010 |
Nov 16, 2009 - Feb 15, 2010 | 5.00 | % | $ | 776,975 | ||||
May 15, 2010 |
Feb 16, 2010 - May 15, 2010 | 5.00 | % | $ | 776,975 | ||||
August 17, 2010 |
May 16, 2010 - Aug 15, 2010 | 5.00 | % | $ | 776,975 | ||||
November 16, 2010 |
Aug 16, 2010 - Nov 15, 2010 | 5.00 | % | $ | 776,975 | ||||
Our ability to pay cash dividends in the future will depend in large part on the ability of the Bank to pay dividends on its capital stock to us. The ability of the Bank to pay dividends on its common
50
stock is restricted by the California Financial Code, the FDIA, and FDIC regulations. In general terms, California law provides that the Bank may declare a cash dividend out of net profits up to the lesser of retained earnings or net income for the last three fiscal years (less any distributions made to shareholders during such period), or, with the prior written approval of the Commissioner of Department of Financial Institutions, in an amount not exceeding the greatest of:
- •
- retained earnings,
- •
- net income for the prior fiscal year, or
- •
- net income for the current fiscal year.
The Bank's ability to pay any cash dividends will depend not only upon our earnings during a specified period, but also on our meeting certain capital requirements. The FDIA and FDIC regulations restrict the payment of dividends when a bank is undercapitalized, when a bank has failed to pay insurance assessments, or when there are safety and soundness concerns regarding a bank. The payment of dividends by the Bank may also be affected by other regulatory requirements and policies, such as maintenance of adequate capital. If, in the opinion of the regulatory authority, a depository institution under its jurisdiction is engaged in, or is about to engage in, an unsafe or unsound practice (which, depending on the financial condition of the depository institution, could include the payment of dividends), such authority may require, after notice and hearing, that such depository institution cease and desist from such practice. Currently, the Bank is unable to pay dividends to the holding company with prior regulatory approval.
Securities Authorized for Issuance under Equity Compensation Plans
In June 2008, we established the 2008 Stock Option Plan that provides for the issuance of restricted stock and options to purchase up to 2,933,200 shares of our authorized but unissued common stock to employees, directors, and consultants. Exercise prices for options may not be less than the fair market value at the date of grant. Compensation expense for awards is recorded over the vesting period. Under the 2008 Stock Option Plan, there were stock options outstanding to purchase 1,098,800 shares of our common stock as of December 31, 2010.
During 1997, the Bank established the 1997 Stock Option Plan, which provided for the issuance of up to 6,499,800 shares of the Company's authorized but unissued common stock to managerial employees and directors. Due to the expiration of the plan in February 2007, no additional options may be granted under the 1997 Stock Option Plan. Accordingly, no shares of our common stock remain available for future issuance under the 1997 Stock Option Plan. Nonetheless, there are 203,680 shares of our common stock reserved for issuance to the holders of stock options previously granted and still outstanding under the 1997 Stock Option Plan. The following table summarizes information as of December 31, 2010 relating to the number of securities to be issued upon the exercise of the outstanding options under the 1997 Plan and the 2008 Plan and their weighted-average exercise price.
| |
Number of Securities to be Issued Upon Exercise of Outstanding Options, Warrants, and Rights |
Weighted-Average Exercise Price of Outstanding Options, Warrants, and Rights |
Number of Securities Available for Future Issuance Under Equity Compensation Plans (excluding securities reflected in column (a)) |
|||||||
|---|---|---|---|---|---|---|---|---|---|---|
| |
(a) |
(b) |
(c) |
|||||||
Equity Compensation Plans Approved by Security Holders |
2,302,121 | $ | 9.63 | 1,773,919 | ||||||
Equity Compensation Plans Not Approved by Security Holders |
— | — | — | |||||||
Total Equity Compensation Plans |
2,302,121 | $ | 9.63 | 1,773,919 | ||||||
51
Future grants of stock options under the 2008 plan may be subject to the limitations of EESA for as long as shares of our Series A Preferred Stock are outstanding. EESA prohibits us from accruing any bonus, retention award, or incentive compensation to at least the five most highly compensated employees of the Company (or such higher number of employees as the U.S. Treasury may determine). Although the interpretation of what specifically constitutes "incentive compensation" is not clear, it is likely that we will not be able to grant additional stock options to at least our five most highly compensated employees during the time that we have shares of Series A Preferred Stock outstanding.
Performance Graph
The following graph compares the yearly percentage change in cumulative total shareholders' return on our common stock with the cumulative total return of (i) of the NASDAQ market index; (ii) all banks and bank holding companies listed on NASDAQ; and (iii) the SNL Western Bank Index, comprised of banks and bank holding companies located in California, Oregon, Washington, Montana, Hawaii, Nevada, and Alaska. Both the $1 Billion - $5 Billion Asset-Size Bank Index and the SNL Western Bank Index were compiled by SNL Securities LP of Charlottesville, Virginia. The graph assumes an initial investment of $100 and reinvestment of dividends. The graph is not necessarily indicative of future price performance.
WILSHIRE BANCORP—TOTAL RETURN PERFORMANCE
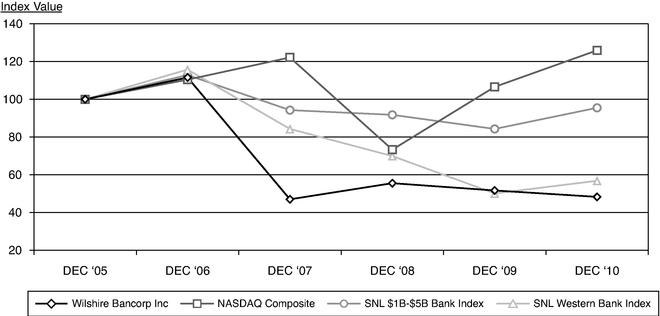
| |
12/31/05 | 12/31/06 | 12/31/07 | 12/31/08 | 12/31/09 | 12/31/10 | |||||||||||||
|---|---|---|---|---|---|---|---|---|---|---|---|---|---|---|---|---|---|---|---|
Wilshire Bancorp Inc |
$ | 100.00 | $ | 111.54 | $ | 47.00 | $ | 55.54 | $ | 51.68 | $ | 48.29 | |||||||
NASDAQ© Composite |
100.00 | 110.39 | 122.15 | 73.32 | 106.57 | 125.91 | |||||||||||||
SNL© $1B - $5B Bank Index |
100.00 | 115.72 | 84.29 | 69.91 | 50.11 | 56.81 | |||||||||||||
SNL© Western Bank Index |
100.00 | 112.83 | 94.25 | 91.76 | 84.27 | 95.48 | |||||||||||||
Source: SNL Financial LC, Charlottesville, VA
Recent Sales of Unregistered Securities; Use of Proceeds From Registered Securities
In December 2008, we issued 62,158 shares of newly designated Series A Preferred Stock, each with a stated liquidation amount of $1,000 per share, and an attached warrant exercisable initially for 949,460 shares of our common stock, with an exercise price of $9.82 per share, to the U.S. Treasury in
52
exchange for the U.S. Treasury's $62.2 million investment in the TARP Capital Purchase Program. In issuing these shares, we relied upon the exemption from registration set forth in Section 4(2) of the Securities Act and the applicable Regulation D provisions promulgated thereunder.
Issuer Purchase of Equity Securities
In July 2007, our Board of Directors authorized a stock repurchase program, under which up to $10 million outstanding common shares in the open market can be repurchased by Wilshire Bancorp for a period of twelve months ending on July 31, 2008. Under the plan, we repurchased a total of 127,425 shares at an average price of $9.91. All of these shares were repurchased during 2007. During 2008, there were no repurchases under the program. This program completed its term and expired on July 31, 2008.
Item 6. Selected Financial Data
The following table presents selected historical financial information as of and for each of the years in the five years ended December 31, 2010. The selected historical financial information is derived from our audited consolidated financial statements and should be read in conjunction with our financial statements and the notes thereto which appear elsewhere in this Annual Report and "Management's Discussion and Analysis of Financial Condition and Results of Operation" in Item 7 below:
| |
As of and For the Years Ended December 31, | |||||||||||||||||
|---|---|---|---|---|---|---|---|---|---|---|---|---|---|---|---|---|---|---|
(Dollars in Thousands)
|
2010 | 2009 | 2008 | 2007 | 2006 | |||||||||||||
Summary Statement of Operations Data: |
||||||||||||||||||
Interest income |
$ | 156,420 | $ | 158,354 | $ | 148,633 | $ | 157,636 | $ | 141,400 | ||||||||
Interest expense |
42,704 | 58,891 | 66,014 | 76,286 | 64,823 | |||||||||||||
Net interest income before provision for losses on loans and loan commitments |
113,716 | 99,463 | 82,619 | 81,350 | 76,577 | |||||||||||||
Provision for losses on loans and loan commitments |
150,800 | 68,600 | 12,110 | 14,980 | 6,000 | |||||||||||||
Noninterest income |
35,912 | 57,316 | 20,646 | 22,584 | 26,400 | |||||||||||||
Noninterest expenses |
67,376 | 57,369 | 48,400 | 44,839 | 41,232 | |||||||||||||
(Loss) income before income taxes |
(68,548 | ) | 30,810 | 42,755 | 44,115 | 55,745 | ||||||||||||
Income taxes (benefit) provision |
(33,790 | ) | 10,686 | 16,282 | 17,309 | 21,803 | ||||||||||||
Preferred stock cash dividend and accretion of preferred stock |
3,626 | 3,620 | 155 | — | — | |||||||||||||
Net (loss) income available to common shareholders |
(38,384 | ) | 16,504 | 26,318 | 26,806 | 33,942 | ||||||||||||
Per Common Share Data: |
||||||||||||||||||
Net (loss) income available to common shareholders: |
||||||||||||||||||
Basic |
$ | (1.30 | ) | $ | 0.56 | $ | 0.90 | $ | 0.91 | $ | 1.17 | |||||||
Diluted |
$ | (1.30 | ) | $ | 0.56 | $ | 0.90 | $ | 0.91 | $ | 1.16 | |||||||
Book value per common share |
$ | 5.72 | $ | 7.01 | $ | 6.65 | $ | 5.87 | $ | 5.12 | ||||||||
Weighted average common shares outstanding: |
||||||||||||||||||
Basic |
29,486,351 | 29,420,291 | 29,368,762 | 29,339,454 | 28,986,217 | |||||||||||||
Diluted |
29,486,351 | 29,429,299 | 29,407,388 | 29,449,211 | 29,330,732 | |||||||||||||
Year-end common shares outstanding |
29,477,638 | 29,483,307 | 29,413,757 | 29,253,311 | 29,197,420 | |||||||||||||
53
| |
As of and For the Years Ended December 31, | ||||||||||||||||
|---|---|---|---|---|---|---|---|---|---|---|---|---|---|---|---|---|---|
(Dollars in Thousands)
|
2010 | 2009 | 2008 | 2007 | 2006 | ||||||||||||
Summary Statement of Financial Condition Data (Year End): |
|||||||||||||||||
Total loans, net of unearned income(1) |
$ | 2,326,624 | $ | 2,427,441 | $ | 2,051,528 | $ | 1,809,050 | $ | 1,560,539 | |||||||
Allowance for loan losses |
110,953 | 62,130 | 29,437 | 21,579 | 18,654 | ||||||||||||
Other real estate owned |
14,983 | 3,797 | 2,663 | 133 | 138 | ||||||||||||
Total assets |
2,970,525 | 3,435,997 | 2,450,011 | 2,196,705 | 2,008,484 | ||||||||||||
Total deposits |
2,460,940 | 2,828,215 | 1,812,601 | 1,763,071 | 1,751,973 | ||||||||||||
Federal Home Loan Bank advances(2) |
135,000 | 232,000 | 260,000 | 150,000 | 20,000 | ||||||||||||
Junior subordinated debentures |
87,321 | 87,321 | 87,321 | 87,321 | 61,547 | ||||||||||||
Total shareholders' equity |
229,162 | 266,136 | 255,060 | 171,786 | 149,635 | ||||||||||||
Performance ratios: |
|||||||||||||||||
Return on average total equity(3) |
-12.69 | % | 7.42 | % | 14.14 | % | 16.33 | % | 25.51 | % | |||||||
Return on average common equity(4) |
-17.96 | % | 7.80 | % | 14.30 | % | 16.33 | % | 25.51 | % | |||||||
Return on average assets(5) |
-1.04 | % | 0.67 | % | 1.14 | % | 1.31 | % | 1.85 | % | |||||||
Net interest margin(6) |
3.76 | % | 3.60 | % | 3.81 | % | 4.28 | % | 4.51 | % | |||||||
Efficiency ratio(7) |
45.03 | % | 36.59 | % | 46.87 | % | 43.14 | % | 40.04 | % | |||||||
Net loans to total deposits at year end |
90.03 | % | 83.63 | % | 111.56 | % | 101.38 | % | 88.01 | % | |||||||
Common dividend payout ratio |
-3.84 | % | 35.65 | % | 22.34 | % | 21.98 | % | 17.09 | % | |||||||
Capital ratios: |
|||||||||||||||||
Average common shareholders' equity to average total assets |
6.39 | % | 7.08 | % | 7.89 | % | 8.01 | % | 7.26 | % | |||||||
Tier 1 capital to quarter-to-date average total assets |
9.18 | % | 9.77 | % | 13.25 | % | 10.36 | % | 9.79 | % | |||||||
Tier 1 capital to total risk-weighted assets |
12.61 | % | 14.37 | % | 15.36 | % | 11.83 | % | 11.81 | % | |||||||
Total capital to total risk-weighted assets |
14.00 | % | 15.81 | % | 17.09 | % | 14.58 | % | 13.63 | % | |||||||
Asset quality ratios: |
|||||||||||||||||
Nonperforming loans to total loans(8) |
3.06 | % | 2.92 | % | 0.76 | % | 0.59 | % | 0.44 | % | |||||||
Nonperforming assets(9) to total loans and other real estate owned |
3.68 | % | 3.07 | % | 0.89 | % | 0.60 | % | 0.45 | % | |||||||
Net charge-offs to average total loans |
4.33 | % | 1.73 | % | 0.26 | % | 0.66 | % | 0.06 | % | |||||||
Allowance for loan losses to total loans at year end |
4.77 | % | 2.56 | % | 1.43 | % | 1.19 | % | 1.20 | % | |||||||
Allowance for loan losses to nonperforming loans |
155.76 | % | 87.78 | % | 189.27 | % | 203.55 | % | 272.38 | % | |||||||
- (1)
- Total
loans is the sum of loans receivable and loans held for sale and is reported at their outstanding principal balances, net of any
unearned income (unamortized deferred fees and costs).
- (2)
- At
December 31, 2010 our borrowing capacity with the Federal Home Loan Bank was $604.4 million, with $469.4 million
capacity remaining.
- (3)
- Net
income divided by average total shareholders' equity.
- (4)
- Net
income available to common shareholders divided by average common shareholders' equity.
- (5)
- Net
income divided by average total assets.
- (6)
- Represents
net interest income as a percentage of average interest-earning assets.
- (7)
- Represents
the ratio of noninterest expense to the sum of net interest income before provision for losses on loans and loan commitments and
total noninterest income.
- (8)
- Nonperforming
loans consist of nonaccrual loans, loans past due 90 days or more, and restructured loans.
- (9)
- Nonperforming assets consist of nonperforming loans (see footnote no. 8 above), and other real estate owned.
54
Item 7. Management's Discussion and Analysis of Financial Condition and Results of Operations
This discussion presents management's analysis of our results of operations and financial condition as of and for each of the years in the three-year period ended December 31, 2010. The discussion should be read in conjunction with our financial statements and the notes related thereto which appear elsewhere in this Report.
Executive Overview
Introduction
Wilshire Bancorp, Inc. succeeded to the business and operations of Wilshire State Bank (the "Bank") upon consummation of the reorganization of the Bank into a holding company structure, effective as of August 25, 2004. Prior to the completion of the reorganization, the Bank was subject to the information, reporting, and proxy statement requirements of the Exchange Act, pursuant to the regulations of its primary regulator, the FDIC. Accordingly, the Bank filed annual and quarterly reports, proxy statements, and other information with the FDIC. Pursuant to Rule 12g-3 of the Exchange Act, the Company has succeeded to the reporting obligations of the Bank and the reporting obligations of the Bank to the FDIC have terminated. Filings by the Company under the Exchange Act, like this Form 10-K, are to be made with the SEC. Note that while we refer generally to the Company throughout this filing, all references to the Company prior to August 26, 2004, except where otherwise indicated, are to the Bank.
We operate a community bank in the general commercial banking business, with our primary market encompassing the multi-ethnic population of the Los Angeles metropolitan area. Our full-service offices are located primarily in areas where a majority of the businesses are owned by Korean-speaking immigrants, with many of the remaining businesses owned by Hispanic and other minority groups.
On June 26, 2009, we acquired the banking operations of Mirae Bank from the FDIC, who had been named receiver of the institution. We acquired approximately $395.6 million in assets and assumed $374.0 million in liabilities. This included $285.7 million in loans, and $293.4 million in deposits in addition to five branch offices. The integration of former Mirae was successfully completed in the third quarter of 2009, during which 4 out of the 5 branches were merged as a result of their close proximity to our existing office locations. Even with the branch mergers, the retention rate for former Mirae deposit customers remained high.
Over the past several years, our network of branches and LPOs has expanded geographically. We currently maintain twenty-three branch offices and five LPOs. We believe that our market coverage complements our multi-ethnic small business focus. We intend to be cautious about our growth strategy in future years regarding opening of additional branches and LPOs. We expect to continue implementing our growth strategy using strategic planning and market analysis, as our needs and resources permit.
In December 2008, we issued 62,158 shares of newly designated Series A Preferred Stock, each with a stated liquidation amount of $1,000 per share, and an attached warrant exercisable initially for 949,460 shares of our common stock, with an exercise price of $9.82 per share, to the U.S. Treasury in exchange for the U.S. Treasury's $62.2 million investment in the TARP Capital Purchase Program. This additional capital infusion from the United States government further strengthened our capital ratios, allowing us to continue to assist the financial markets with much needed liquidity via careful lending to qualified borrowers.
As evidenced by our past several years of operations, we have experienced significant balance sheet growth. We have implemented a strategy of building our core banking foundation by focusing on
55
commercial loans and business transaction accounts. Management believes that this strategy has created recurring revenue streams, diversified our product portfolio, and enhanced our shareholders' value.
At December 31, 2010, we had approximately $2.97 billion in assets, $2.33 billion in total loans, and $2.46 billion in deposits. We also have expanded and diversified our business geographically by focusing on the continued development of the East Coast market.
2010 Key Performance Indicators
We believe the following were key indicators of our operations during 2010:
- •
- Our total assets decreased to $2.97 billion at the end of 2010, or a decrease of 13.5% from $3.44 billion at
the end of 2009.
- •
- Our total deposits decreased to $2.46 billion at the end of 2010, or a decrease of 13.0% from $2.83 billion
at the end of 2009.
- •
- Our total loans decreased to $2.33 billion at the end of 2010, or a decrease of 4.2% from $2.43 billion at
the end of 2009.
- •
- Total net interest income before provision for loan losses increased to $113.7 million in 2010, or an increase of
14.3% from $99.5 million in 2009. The increase in net interest income was a result of decrease in deposit, FHLB advances, and other borrowing expenses.
- •
- Provision for loan losses was increased from $66.8 million at December 31, 2009 to $150.8 million at
December 31, 2010, an increase of $82.2 million or 119.8%.12.
- •
- Total noninterest income decreased to $35.9 million in 2010, a decrease of 37.3% from $57.3 million in 2009.
A large portion of the decrease is attributable to a gain of $21.7 million as a result of the Mirae Bank acquisition that was recorded to noninterest income in 2009. Not including the gain from
the acquisition, noninterest income increased by 0.8%.
- •
- Total noninterest expense increased to $67.4 million in 2010 or 17.4% from $57.4 million in 2009. The increase is mainly due to an increase in legal fees, and expense related to OREO and low income housing tax credit investments.
Net income available for common shareholders for 2010 decreased to a loss of $38.4 million or $1.30 per basic and diluted common share, compared with net income of $16.5 million, or $0.56 per basic and diluted common share in 2009. The decrease in net income is primarily attributable to higher than expected provisions for losses on loans and loan commitments in 2010. Compared to 2009, provisions increased by $82.2 million to $150.8 million in 2010. The increase in provisions for losses on loans and loan commitments is a result of credit quality issues and management's actions to address these credit concerns as quickly as possible through note sales, charge-offs, modifications, and resolutions with customers.
2011 Outlook
Although the economic indicators point towards modest growth and economic expansion in 2011, we will continue to take a cautious approach on our outlook for 2011. As a result of downturns in the commercial and residential real estate market, asset quality on CRE loans contributed to our higher delinquency and non-accrual rates in 2010. We expect this trend to continue in 2011. Consequently, management has begun acquiring updated appraisals on CRE loan collateral and stress testing CRE loans during 2010. We believe the commercial real estate market may face increased deterioration, although not at the level experienced in 2009 and 2010.
In addition, the internal investigation conducted by the Company revealed some deficiencies in the Company's loan underwriting, origination and renewal procedures. As a result, the Company is, among
56
other things, implementing enhanced underwriting policies and shifting its focus from marketing and growth to credit quality control.
Critical Accounting Policies
The discussion and analysis of our financial condition and results of operations is based upon our financial statements, and has been prepared in accordance with accounting principles generally accepted in the United States of America. The preparation of these financial statements requires management to make estimates and judgments that affect the reported amounts of assets and liabilities, revenues and expenses, and related disclosures of contingent assets and liabilities at the date of our financial statements. Actual results may differ from these estimates under different assumptions or conditions.
Various elements of our accounting policies, by their nature, are inherently subject to estimation techniques, valuation assumptions, and other subjective assessments. In particular, we have identified several accounting policies that, due to judgments, estimates, and assumptions inherent in those policies are critical to an understanding of our consolidated financial statements. These policies relate to the classification and valuation of investment securities, the methodologies that determine our allowance for loan losses, the treatment of non-accrual loans, the valuation of properties acquired through foreclosure, the valuation of retained interests and mortgage servicing assets related to the sales of SBA loans, and the treatment and valuation of stock-based compensation and business combination. In each area, we have identified the variables most important in the estimation process. We have used the best information available to make the estimates necessary to value the related assets and liabilities. Actual performance that differs from our estimates and future changes in the key variables could change future valuation and impact net income.
Investment Securities
Our investment policy seeks to provide and maintain liquidity, and to produce favorable returns on investments without incurring unnecessary interest rate or credit risk, while complementing our lending activities. Our investment securities portfolio is subject to interest rate risk. Fluctuations in interest rates may cause actual prepayments to vary from the estimated prepayments over the life of a security. This may result in adjustments to the amortization of premiums or accretion of discounts related to these instruments, consequently changing the net yield on such securities. Reinvestment risk is also associated with the cash flows from such securities. The unrealized gain/loss on such securities may also be adversely impacted by changes in interest rates.
Under ASC 320-10, formerly (SFAS No. 115, Accounting for Certain Investments in Debt and Equity Securities), investment securities that management has the positive intent and ability to hold to maturity are classified as "held-to-maturity" and recorded at amortized cost. Securities not classified as held-to-maturity or trading, with readily determinable fair values, are classified as "available-for-sale" and recorded at fair value. Purchase premiums and discounts are recognized in interest income using the interest method over the estimated lives of the securities.
The classification and accounting for investment securities are discussed in detail in Notes 1 and 4 of the footnotes to the consolidated financial statements presented elsewhere in this report Under ASC 320-10, investment securities generally must be classified as held-to-maturity, available-for-sale, or trading. The appropriate classification is based partially on our ability to hold the securities to maturity and largely on management's intentions with respect to either holding or selling the securities. The classification of investment securities is significant since it directly impacts the accounting for unrealized gains and losses on securities. Unrealized gains and losses on trading securities flow directly through earnings during the periods in which they arise. Investment securities that are classified as held-to-maturity are recorded at amortized cost. Unrealized gains and losses on available-for-sale
57
securities are recorded as a separate component of shareholders' equity (accumulated other comprehensive income or loss) and do not affect earnings until realized or are deemed to be other-than-temporarily impaired. The fair values of investment securities are generally determined by reference to market prices obtained from an independent external pricing service provider. In obtaining such valuation information from third parties, we have evaluated the methodologies used to develop the resulting fair values. We perform an analysis on the broker quotes received from third parties to ensure that the prices represent a reasonable estimate of the fair value. The procedures include, but are not limited to, initial and on-going review of third party pricing methodologies, review of pricing trends, and monitoring of trading volumes. We ensure whether prices received from independent brokers represent a reasonable estimate of fair value through the use of internal and external cash flow models developed based on spreads, and when available, market indices. As a result of this analysis, if we determine there is a more appropriate fair value based upon the available market data, the price received from the third party is adjusted accordingly. Prices from third party pricing services are often unavailable for securities that are rarely traded or are traded only in privately negotiated transactions.
We are obligated to assess, at each reporting date, whether there is an other than temporary impairment to our investment securities. Impairments related to credit issued must be recognized in current earnings rather than in other comprehensive income. The determination of other-than-temporary impairment is a subjective process involving assessment of valuation and changes in such valuations resulting from deteriorating credit worthiness. We examine all individual securities that are in an unrealized loss position at each reporting date for other-than-temporary impairment. Specific investment-related factors we examine to assess impairment include the nature of the investment, severity and duration of the loss, the probability that we will be unable to collect all amounts due, and analysis of the issuers of the securities and whether there has been any cause for default on the securities and any change in the rating of the securities by the various rating agencies. Additionally, we evaluate whether the creditworthiness of the issuer calls the realization of contractual cash flows into question. We reexamine the financial resources, intent, and the overall ability of the Company to hold the securities until their fair values recover. Management does not believe that there are any investment securities, other than those identified in the current and previous periods, which are deemed to be other-than-temporarily impaired as of December 31, 2010. Investment securities are discussed in more detail in Note 1 and 4 of our footnotes to the consolidated financial statements presented later in this report.
As required under Financial Accounting Standards Board ("FASB") ASC 320-10 which was previously Emerging Issues Task Force ("EITF") 99-20, Recognition of Interest Income and Impairment on Purchased and Retained Beneficial Interest in Securitized Financial Assets, and EITF 99-20-1, Amendments to the Impairment Guidance of EITF Issue No. 99-20, we consider all available information relevant to the collectability of the security, including information about past events, current conditions, and reasonable and supportable forecasts, when developing the estimate of future cash flows and making its other-than-temporary impairment assessment for our portfolio of residual securities and pooled trust preferred securities. We consider factors such as remaining payment terms of the security, prepayment speeds, the financial condition of the issuer(s), expected defaults, and the value of any underlying collateral.
As of December 31, 2010 and December 31, 2009, no investment securities were determined to have any other-than-temporary impairment. The unrealized losses on our government sponsored enterprises ("GSE") bonds, collateralized mortgage obligations ("CMOs"), and mortgage-backed securities ("MBS") are attributable to both changes in interest rates and a repricing risk in the market. All GSE bonds, GSE CMO, and GSE MBS securities are backed by U.S. Government Sponsored and Federal Agencies and therefore rated "AAA." We have no exposure to the "Subprime Market" in the form of Asset Backed Securities ("ABS") and Collateralized Debt Obligations ("CDOs") that had previously been rated "AAA" but have since been downgraded to below investment grade. We have the
58
intent and ability to hold the securities in an unrealized loss position at December 31, 2010 and 2009 until the market value recovers or the securities mature.
Municipal bonds and corporate bonds are evaluated by reviewing the creditworthiness of the issuer and general market conditions. The unrealized losses on our investment in municipal and corporate securities were primarily attributable to both changes in interest rates and a repricing risk in the market. We do not intend to sell the municipal bonds and it is more likely than not that we will be required to sell the securities before recovery of the amortized cost basis as of December 31, 2010. With regard to the Company's investment in debt securities available-for-sale or held-to-maturity, no events have occurred and no facts have been discovered with respect to such investment that would indicate an other-than-temporary impairment of the investment's value.
Small Business Administration Loans
Certain SBA loans that may be sold prior to maturity have been designated as held for sale at origination and are recorded at the lower of cost or market value, determined on an aggregate basis. A valuation allowance is established if the market value of such loans is lower than their cost, and operations are charged or credited for valuation adjustments. When we sell a loan, we usually sell the guaranteed portion of the loan and retain the non-guaranteed portion. We receive sales proceeds from: (i) the guaranteed principal of the loan, (ii) the deferred premium for the difference between the book value of the retained portion and the fair value allocated to the retained portion, and (iii) the loan excess servicing fee ("ESF"). At the time of sale, the deferred premium, which is amortized over the remaining life of the loan as an adjustment to yield, is recorded for the difference between the book value and the fair value allocated to the retained portion. The sales gain is recognized from the difference between the proceeds and the book value allocated to the sold portion.
We allocate the book value of the related loans among three portions on the basis of their relative fair value: (i) the sold portion, (ii) the retained portion, and (iii) the ESF. We estimate the fair value of each portion based on the following. The amount received for the sale represents the fair value of the sold portion. The fair value of the retained portion is computed by discounting its future cash flows over the estimated life of the loan. We calculate the fair value of the ESF for the loan from the cash in-flow of the net servicing fee over the estimated life of the loan, discounted at an above average discount rate and a range of constant prepayment rates of the related loans.
We capitalize the fair value allocated to ESF in two categories: (i) intangible servicing assets (the contracted servicing fee less normal servicing costs), and (ii) interest-only strip, or "I/O strip," receivables (excess of ESF over the contracted servicing fee). The servicing asset is recorded based on the present value of the contractually specified servicing fee, net of servicing cost, over the estimated life of the loan, with an average discount rate and a range of constant prepayment rates of the related loans. Prior to December 31, 2006, the servicing asset was amortized in proportion to and over the period of estimated servicing income. For purposes of measuring impairment, the servicing assets are stratified by collateral types. Management periodically evaluates the fair value of servicing assets for impairment. A valuation allowance is recorded when the fair value is below the carrying amount and a recovery of the valuation allowance is recorded when its fair value exceeds the carrying amount. However, a reversal may not exceed the original valuation allowance recorded. On January 1, 2007, we adopted ASC 860-50 (formerly SFAS No. 156, Accounting for Servicing of Financial Assets), and selected a fair value measurement method to measure our servicing assets and liabilities and recognized a onetime increase in their fair value of $80,000, net of tax effects. Any subsequent increase or decrease in fair value of servicing assets and liabilities is to be included in our current earnings in the statement of operations. An interest-only strip is recorded based on the present value of the excess of future interest income, over the contractually specified servicing fee, calculated using the same assumptions as noted above. Interest-only strips are accounted for at their estimated fair values, with unrealized gains recorded as an adjustment in accumulated other comprehensive income in shareholders' equity. If the
59
estimated fair value is less than its carrying value, the loss is considered as other-than-temporary impairment and it is charged to the current earnings.
Allowance for Loan Losses
Accounting for the allowance for loan losses involves significant judgment and assumptions by management and is based on historical data and management's view of the current economic environment. At least on a quarterly basis, our management reviews the methodology and adequacy of the allowance for loan losses and reports its assessment to the Board of Directors for its review and approval.
We base our allowance for loan losses on an estimate of probable losses in our loan portfolio. Our methodology for assessing loan loss allowances is intended to reduce the differences between estimated and actual losses and involves a detailed analysis of our loan portfolio in three phases:
- •
- the specific review of individual loans in accordance with ASC 310-10 (formerly Statement of Financial
Accounting Standards (SFAS) No.114, Accounting by Creditors for Impairment of a Loan),
- •
- the segmenting and reviewing of loan pools with similar characteristics in accordance with ASC 450-10
(SFAS No. 5, Accounting for Contingencies), and
- •
- our judgmental estimate based on various qualitative factors.
The first phase of our allowance analysis involves the specific review of individual loans to identify and measure impairment. At this phase, we evaluate each loan except for homogeneous loans, such as automobile loans and home mortgages. Specific risk-rated loans are deemed impaired with respect to all amounts, including principal and interest, which will likely not be collected in accordance with the contractual terms of the related loan agreement. Impairment for commercial and real estate loans is measured either based on the present value of the loan's expected future cash flows or, if collection on the loan is collateral dependent, the estimated fair value of the collateral, less selling and holding costs.
The second phase involves segmenting the remainder of the risk-rated loan portfolio into groups or pools of loans, together with loans with similar characteristics for evaluation in accordance with ASC 450-10. We perform loss migration analysis and calculate the loss migration ratio for each loan pool based on its historical net losses and benchmark it against the levels of other peer banks.
In the third phase, we consider relevant internal and external factors that may affect the collectability of a loan portfolio and each group of loan pools. As a general rule, the factors listed below will be considered to have no impact to our loss migration analysis. However, if information exists to warrant adjustment to the loss migration ratios, the changes will be made in accordance with the established parameters and supported by narrative and/or statistical analysis. We use a credit risk matrix to determine the impact to the loss migration analysis. This matrix enables management to adjust the general allocation based on the loss migration ratio. The factors currently considered are, but are not limited to: concentration of credit, delinquency trend, nature and volume of loan trend, non-accrual and problem loan trends, loss and recovery trend, quality loan review, lending and management staff, lending policies and procedures, and external factors such as changes in legal and regulatory requirements, on the level of estimated credit losses in the current portfolio. For all factors, the extent of the adjustment will be commensurate with the severity of the conditions that concern each factor. The evaluation of the inherent loss with respect to these factors is subject to a higher degree of uncertainty because they are not identified with specific problem credits or portfolio components.
Central to our credit risk management and our assessment of appropriate loss allowance is our loan risk rating system. Under this system, the originating credit officer assigns borrowers an initial risk rating based on a thorough analysis of each borrower's financial capacity in conjunction with industry
60
and economic trends. Approvals are made based upon the amount of inherent credit risk specific to the transaction and are reviewed for appropriateness by senior line and credit administration personnel. Credits are monitored by line and credit administration personnel for deterioration in a borrower's financial condition which may impact the ability of the borrower to perform under the contract. Although management has allocated a portion of the allowance to specific loans, specific loan pools, including off-balance sheet credit exposures which are reported separately as part of other liabilities, the adequacy of the allowance is considered in its entirety.
Non-Accrual Loan Policy
Interest on loans is credited to income as earned and is accrued only if deemed collectible. Accrual of interest is discontinued when a loan is over 90 days delinquent unless management believes the loan is adequately collateralized and in the process of collection. Generally, payments received on nonaccrual loans are recorded as principal reductions. Interest income is recognized after all principal has been repaid or an improvement in the condition of the loan has occurred that would warrant resumption of interest accruals.
Held For Sale Loans
Pursuant to ASC 310-10 a long lived asset to be sold is classified as held for sale when all of the following criteria are met;
- a.
- Management
has authority to approve and commit to selling the asset
- b.
- The
asset is immediately available for sale
- c.
- A
plan to sell has been completed including actively locating buyers
- d.
- The
sale probable within 1 year and is expected to qualify as a sale
- e.
- The
asset is actively being marketed for sale at a reasonably price
- f.
- The plan to sell indicates it is unlikely that significant change to the plan will be made or the plan will be withdrawn.
If the Company has the intention to sell a note and if all of the criteria above are met, then the loan is be categorized as held for sale as of the date the decision is made. Once classified as "held for sale", the loan is measured at the lower of its carrying amount or fair value. Provisions and reserves are recorded to reflect a decline in fair value if the fair value is less than the loan carrying amount. Any subsequence decline or increase in fair value for held for sale loans are accounted for as an increase or decrease in valuation allowance for held for sale loans which directly affects earnings. When a classified as held for sale, the discount or premium is not amortized, but interest and expenses related to the note continue to be accrued. Loans transferred to held for sale continue to be recorded the same past due and nonaccrual treatment as other loans, if necessary.
Once a loan has been sold, the difference between the purchase price and the fair value is measured against net income as a gain or loss on sale of loans.
Valuation of Other Real Estate Owned
Other real estate owned ("OREO"), which represents real estate acquired through foreclosure, or deed in lieu of foreclosure in satisfaction of commercial and real estate loans, is carried at the estimated fair value less the selling costs of the real estate. The fair value of the property is based upon a current appraisal. The difference between the fair value of the real estate collateral and the loan balance at the time of transfer is recorded as a loan charge-off if fair value is lower than the loan balance. Subsequent to foreclosure, management periodically performs valuations and the OREO
61
property is carried at the lower of carrying value or fair value, less cost to sell. The determination of a property's estimated fair value incorporates (i) revenues projected to be realized from disposal of the property, (ii) construction and renovation costs, (iii) marketing and transaction costs, and (iv) holding costs (e.g., property taxes, insurance and homeowners' association dues). Any subsequent declines in the fair value of the OREO property after the date of transfer are recorded through a write-down of the asset. Any subsequent operating expenses or income, reduction in estimated fair values, and gains or losses on disposition of such properties are charged or credited to current operations.
Goodwill and Intangible Assets
We recognized goodwill and intangible assets in connection with the acquisition of Liberty Bank of New York, and from the Mirae Bank acquisition. As of December 31, 2010 goodwill stood unchanged from the previous year at $6.7 million, all of which is related to the Liberty Bank acquisition located in the East Coast. $1.6 million and $1.3 million, respectively, in core deposits intangibles were recorded as a result of the Liberty Bank and Mirae Bank acquisition. Core deposit intangibles had cost bases of $838,000 and $808,000 related to the Liberty Bank and Mirae Bank transaction, respectively.
In accordance with ASC 350-20 (previously SFAS No. 142, Goodwill and Other Intangible Assets), goodwill is no longer amortized, but rather is subject to impairment testing at least annually. Our impairment analysis of goodwill is calculated in accordance with ASC 820 using a combination of the "Market Approach" and "Income Approach." We tested goodwill for impairment as of December 31, 2010 and found no impairment adjustment was needed as the fair value calculation significantly exceeds the carry value of equity.
Income Taxes
We accounted for income taxes under the asset and liability method, which requires the recognition of deferred tax assets and liabilities for the expected future tax consequences of events that have been included in the financial statements. Under this method, deferred tax assets and liabilities are determined based on the differences between the financial statements and tax basis of assets and liabilities using enacted tax rates in effect for the year in which the differences are expected to reverse. The effect of a change in tax rates on deferred tax rates on deferred tax assets and liabilities is recognized in income in the period that includes the enacted date.
We record net deferred tax assets to the extent we believe these assets will more likely than not be realized. In assessing the realizability of deferred tax assets, management considers whether it is more likely than not that some portion or all of the deferred tax assets will not be realized. Realization is dependent on generating sufficient taxable income prior to expiration of the loss carry-forwards. Although realization is not assured, management believes it is more likely than not that all of the deferred tax asset will be realized. The amount of the deferred tax asset considered realizable, however, could be reduced in the near term if estimates of future taxable income during the carry-forward period are reduced. A valuation allowance against deferred tax assets at the balance-sheet date is not considered necessary, because it is more likely than not the deferred tax asset will be fully realized. Our effective tax rates were often lower than the statutory rates. This was mainly due to state tax benefits derived from doing business in an enterprise zone and tax preferential treatment for our ownership of bank-owned life insurance and low income housing tax credit funds.
In 2007, we adopted the provision of FASB ASC 740-10-25 (formerly Financial Interpretation No. ("FIN") 48), Accounting for Uncertainty in Income Taxes, which clarifies the accounting for uncertainty in income taxes recognized in the financial statements in accordance with SFAS No. 109, which is now codification reference 740-10, Income Taxes. ASC 740-10-25 provides that a tax benefit from an uncertain tax position may be recognized when it is more likely than not that the position will be sustained upon examination, including resolutions of any related appeals or litigation processes, based
62
on the technical merits. A tax position is recognized as a benefit only if it is "more likely than not" that the tax position would be sustained in a tax examination, with a tax examination being presumed to occur. The amount recognized is the largest amount of tax benefit that is greater than 50% likely of being realized on examination. For tax positions not meeting the "more likely than not" test, no tax benefit is recorded. The Company recognized an increase in the liability for unrecognized tax benefit of $259,000 and related interest of $18,000 in 2010. As of December 31, 2010, the total unrecognized tax benefit that would affect the effective rate if recognized was $427,000, and related interest was $30,000.
SBA Guaranteed Loan Sales
In December 2009, FASB issued Accounting Standards Update "ASU" 2009-16 Accounting for Transfers of Financial Assets, to codify FASB 166. Statement 166 is revision to Statement No. 140 Accounting for Transfers and Servicing of Financial Assets and Extinguishments of Liabilities. Codified at ASC 860-20, the guidance requires more information about transfer of financial assets, including securitization transactions and where companies have continuing exposure to the risks related to transferred financial assets. The statement is to improve the relevance, representational faithfulness, and comparability of the information that a reporting entity provides in its financial statements about a transfer of financial assets; the effects of a transfer on its financial position, financial performance and cash flows, and a transferor's continuing involvement, if any, in transferred financial assets.
As of January 1, 2010 (implementation date), the guidance has changed the Company's categorization of SBA guaranteed portions of loans sold to third parties purchasers. Due to the following recourse provisions, sales accounting will not be applied to these transactions:
- 1.
- If
borrower makes the first three payments required by the note after the warranty date (the date the agreement is settled by the Bank and Registered Holder
through FTA) in which they are due and the payments are the full amounts required by the note, the Bank has no liability to refund the premium.
- 2.
- If
the borrower prepays the loan for any reason within the 90 days of the warranty date, the Bank must refund any premium received.
- 3.
- If the Bank fails to make the first three monthly payments due after the warranty date and the borrower enters uncured default within 275 calendar days from the warranty date, the Bank shall refund any premium received. Borrower payments must be received by the Bank in the month in which they are due and must be full payments as defined in the Borrower's note.
If a transfer of a portion of a loan does not meet the participation definition, the transfer is treated as a secured borrowing with a pledge of collateral. Prior to the issuance of this statement, SBA guaranteed portions sold to third parties were treated as loans before and after the sale of the loan as sales accounting treatment was applied. However under the new guidance, we now classify SBA guaranteed portions of loans as secured borrowings. As a result of the new guidance, the recognition of gain on sale of SBA guaranteed loans will be delayed by at least 90 days until the recourse provision expires, and during that period, the loan balances will be grossed-up and payment received will be accounted for as secured borrowings.
Starting February 15, 2011 all guaranteed portions of SBA loans sold will not have any warranty or recourse periods. The Small Business Administration made changes to the sale of guaranteed portions of SBA loans that effectively removes any recourse provision thereby immediately qualifying any loans sold after February 15, 2011 as a sales transaction. Loans sold after January 1, 2010 and before February 15, 2011 will still not be treated as a sales transaction until all recourse provisions expire, until which the sold loans will continue to be accounted for as secured borrowings.
63
Net Interest Income and Net Interest Margin
Our primary source of revenue is net interest income, which is the difference between interest and fees derived from earning assets and interest paid on liabilities obtained to fund those assets. Our net interest income is affected by changes in the level and mix of interest-earning assets and interest-bearing liabilities, referred to as volume changes. Our net interest income is also affected by changes in the yields earned on assets and rates paid on liabilities, referred to as rate changes. Interest rates charged on our loans are affected principally by the demand for such loans, the supply of money available for lending purposes, and competitive factors. Those factors are, in turn, affected by general economic conditions and other factors beyond our control, such as federal economic policies, the general supply of money in the economy, legislative tax policies, the governmental budgetary matters, and the actions of the Federal Reserve Board.
Our average net loans were $2.36 billion in 2010, as compared with $2.22 billion in 2009 and $1.93 billion in 2008, representing increases of 6.2% in 2010 and 14.8% 2009, respectively, from each of the prior annual periods. Average interest-earning assets were $3.06 billion in 2010, as compared with $2.78 billion in 2009 and $2.17 billion in 2008, representing increases of 9.8% and 28.0% in 2010 and 2009, respectively, from each of the prior annual periods. Our average interest-bearing deposits also increased by 21.3% to $2.38 billion in 2010, as compared with $1.96 billion in 2009, after increasing 35.7% in 2009 from $1.44 billion in 2008. Together with other borrowings (see "Financial Condition—Deposits and Other Sources of Funds" below), average interest-bearing liabilities increased by 10.5% to $2.61 billion in 2010, as compared with $2.36 billion in 2009, after increasing by 29.7% in 2009 from $1.82 billion in 2008.
The Federal Reserve Board's rate decrease in 2008 resulted in a decline in our average yield on interest-earning assets to 5.72% in 2009 from 6.84% in 2008. Since the last rate reduction on December 16, 2008, the current federal funds rate has been 0.00% to 0.25%, an unprecedentedly low level and has remained without change throughout 2009 and 2010. In addition, loan interest income reversals due to non-accrual loans has increased in 2010, therefore the average yield on interest-earning assets again decreased to 5.16% in 2010. During the same time periods, the rates for deposits in our local markets remained competitive, which required us to closely monitor our cost of funds so that it would be in line with our yield on assets. Total interest income declined 1.2% in 2010 to $156.4 million, down from $158.4 million in 2009 which was an increase of 6.5% from $148.6 million in 2008. Interest expense meanwhile has continued to decline, decreasing 27.5% to $42.7 million in 2010, as compared with $58.9 million in 2009 which was a decrease of 10.8% from $66.0 million in 2008.
The combined result of our growth particularly in core deposits, and careful monitoring efforts with respect to cost of funds resulted in an increase in our net interest income. Net interest income before provision for losses on loan and loan commitments increased 14.3%, or $14.3 million, to $113.7 million in 2010, following an increase of 20.4%, or $16.8 million in 2009 to $99.5 million from $82.6 million in 2008. As a result of our lowered cost of funds in 2010, our net interest spread increased from 3.21% in 2008 to 3.22% in 2009 and to 3.52% in 2010. Net interest margin increased to 3.76% in 2010 from 3.60% in 2009 but was down from 3.81% in 2008.
64
The following table sets forth, for the periods indicated, our average balances of assets, liabilities and shareholders' equity, in addition to the major components of net interest income and net interest margin:
Distribution, Yield, and Rate Analysis of Net Income
(Dollars in Thousands)
| |
For the Years Ended December 31, | |||||||||||||||||||||||||||||
|---|---|---|---|---|---|---|---|---|---|---|---|---|---|---|---|---|---|---|---|---|---|---|---|---|---|---|---|---|---|---|
| |
2010 | 2009 | 2008 | |||||||||||||||||||||||||||
| |
Average Balance | Interest Income/ Expense |
Average Rate/ Yield |
Average Balance |
Interest Income/ Expense |
Average Rate/ Yield |
Average Balance |
Interest Income/ Expense |
Average Rate/ Yield |
|||||||||||||||||||||
Assets: |
||||||||||||||||||||||||||||||
Earning assets: |
||||||||||||||||||||||||||||||
Net loans(1) |
$ | 2,358,149 | $ | 140,028 | 5.94 | % | $ | 2,219,675 | $ | 139,295 | 6.28 | % | $ | 1,933,048 | $ | 137,630 | 7.12 | % | ||||||||||||
Securities of government sponsored enterprises |
484,974 | 12,928 | 2.67 | % | 393,419 | 15,029 | 3.82 | % | 212,126 | 10,035 | 4.73 | % | ||||||||||||||||||
Other investment securities(2) |
43,025 | 1,798 | 6.79 | % | 35,786 | 1,544 | 6.29 | % | 15,355 | 714 | 5.70 | % | ||||||||||||||||||
Federal funds sold |
169,461 | 1,666 | 0.98 | % | 133,811 | 2,486 | 1.86 | % | 13,262 | 254 | 1.91 | % | ||||||||||||||||||
Total interest-earning assets |
3,055,609 | 156,420 | 5.16 | % | 2,782,691 | 158,354 | 5.72 | % | 2,173,791 | 148,633 | 6.84 | % | ||||||||||||||||||
Total noninterest-earning assets |
287,803 | 204,674 | 157,238 | |||||||||||||||||||||||||||
Total assets |
$ | 3,343,412 | $ | 2,987,365 | $ | 2,331,029 | ||||||||||||||||||||||||
Liabilities and Shareholders' Equity: |
||||||||||||||||||||||||||||||
Interest-bearing liabilities: |
||||||||||||||||||||||||||||||
Money market deposits |
$ | 880,618 | 11,755 | 1.33 | % | $ | 584,054 | 13,842 | 2.37 | % | $ | 402,323 | 13,147 | 3.27 | % | |||||||||||||||
Super NOW deposits |
22,104 | 97 | 0.44 | % | 20,546 | 177 | 0.86 | % | 21,290 | 286 | 1.34 | % | ||||||||||||||||||
Savings deposits |
77,484 | 2,380 | 3.07 | % | 55,639 | 1,932 | 3.47 | % | 38,250 | 1,297 | 3.39 | % | ||||||||||||||||||
Time deposits of $100,000 or more |
745,139 | 10,370 | 1.39 | % | 944,012 | 23,145 | 2.45 | % | 797,404 | 29,840 | 3.74 | % | ||||||||||||||||||
Other time deposits |
654,099 | 12,495 | 1.91 | % | 357,590 | 9,594 | 2.68 | % | 186,639 | 7,342 | 3.93 | % | ||||||||||||||||||
FHLB borrowings and other borrowings |
142,759 | 3,124 | 2.19 | % | 312,009 | 7,073 | 2.27 | % | 287,566 | 9,287 | 3.23 | % | ||||||||||||||||||
Junior subordinated debenture |
87,321 | 2,483 | 2.84 | % | 87,321 | 3,128 | 3.58 | % | 87,321 | 4,815 | 5,51 | % | ||||||||||||||||||
Total interest-bearing liabilities |
2,609,524 | 42,704 | 1.64 | % | 2,361,171 | 58,891 | 2.50 | % | 1,820,793 | 66,014 | 3.63 | % | ||||||||||||||||||
Noninterest-bearing liabilities: |
||||||||||||||||||||||||||||||
Noninterest-bearing deposits |
427,388 | 333,568 | 298,163 | |||||||||||||||||||||||||||
Other liabilities |
32,605 | 21,429 | 24,833 | |||||||||||||||||||||||||||
Total noninterest-bearing liabilities |
459,993 | 354,997 | 322,996 | |||||||||||||||||||||||||||
Shareholders' equity |
273,895 | 271,197 | 187,240 | |||||||||||||||||||||||||||
Total liabilities and shareholders' equity |
$ | 3,343,412 | $ | 2,987,365 | $ | 2,331,029 | ||||||||||||||||||||||||
Net interest income |
$ | 113,716 | $ | 99,463 | $ | 82,619 | ||||||||||||||||||||||||
Net interest spread(3) |
3.52 | % | 3.22 | % | 3.21 | % | ||||||||||||||||||||||||
Net interest margin(4) |
3.76 | % | 3.60 | % | 3.81 | % | ||||||||||||||||||||||||
- (1)
- Net
loan fees have been included in the calculation of interest income. Net loan fees were approximately $2.83 million,
$2.69 million, and $4.16 million for the years ended December 31, 2010, 2009, and 2008, respectively. Loans are net of the allowance for loan losses, deferred fees, unearned
income, and related direct costs, but include loans placed on non-accrual status.
- (2)
- Represents
tax equivalent yields, non-tax equivalent yields for 2010, 2009, and 2008 were 4.18%, 4.32%, and 4.65%, respectively.
- (3)
- Represents
the average rate earned on interest-earning assets less the average rate paid on interest-bearing liabilities.
- (4)
- Represents net interest income as a percentage of average interest-earning assets.
The following table sets forth, for the periods indicated, the dollar amount of changes in interest earned and paid for interest-earning assets and interest-bearing liabilities and the amount of change attributable to changes in average daily balances (volume) or changes in average daily interest rates (rate). All yields were calculated without the consideration of tax effects, if any, and the variances
65
attributable to both the volume and rate changes have been allocated to volume and rate changes in proportion to the relationship of the absolute dollar amount of the changes in each:
Rate/Volume Analysis of Net Interest Income
(Dollars in Thousands)
| |
For the Year Ended December 31, 2010 vs. 2009 Increases (Decreases) Due to Change In |
For the Year Ended December 31, 2009 vs. 2008 Increases (Decreases) Due to Change In |
||||||||||||||||||
|---|---|---|---|---|---|---|---|---|---|---|---|---|---|---|---|---|---|---|---|---|
| |
Volume | Rate | Total | Volume | Rate | Total | ||||||||||||||
Interest income: |
||||||||||||||||||||
Net loans(1) |
$ | 2,418 | $ | (1,685 | ) | $ | 733 | $ | 19,062 | $ | (17,397 | ) | $ | 1,665 | ||||||
Securities of government sponsored enterprises |
74 | (2,175 | ) | (2,101 | ) | 7,229 | (2,235 | ) | 4,994 | |||||||||||
Other Investment securities |
182 | 72 | 254 | 885 | (55 | ) | 830 | |||||||||||||
Federal funds sold |
(84 | ) | (736 | ) | (820 | ) | 2,240 | (8 | ) | 2,232 | ||||||||||
Total interest income |
2,590 | (4,524 | ) | (1,934 | ) | 29,416 | (19,695 | ) | 9,721 | |||||||||||
Interest expense: |
||||||||||||||||||||
Money market deposits |
503 | (2,590 | ) | (2,087 | ) | 4,924 | (4,229 | ) | 695 | |||||||||||
Super NOW deposits |
(5 | ) | (75 | ) | (80 | ) | (10 | ) | (99 | ) | (109 | ) | ||||||||
Savings deposits |
432 | 16 | 448 | 602 | 33 | 635 | ||||||||||||||
Time deposit of $100,000 or more |
(4,188 | ) | (8,587 | ) | (12,775 | ) | 4,829 | (11,524 | ) | (6,695 | ) | |||||||||
Other time deposits |
3,177 | (276 | ) | 2,901 | 5,138 | (2,886 | ) | 2,252 | ||||||||||||
FHLB borrowings and other borrowings |
(3,704 | ) | (245 | ) | (3,949 | ) | 737 | (2,951 | ) | (2,214 | ) | |||||||||
Junior subordinated debenture |
— | (645 | ) | (645 | ) | — | (1,687 | ) | (1,687 | ) | ||||||||||
Total interest expense |
(3,785 | ) | (12,402 | ) | (16,187 | ) | 16,220 | (23,343 | ) | (7,123 | ) | |||||||||
Change in net interest income |
$ | 6,375 | $ | 7,878 | $ | 14,253 | $ | 13,196 | $ | 3,648 | $ | 16,884 | ||||||||
- (1)
- Net loan fees have been included in the calculation of interest income. Net loan fees were $2.83 million, $2.69 million, and $4.16 million for the years ended December 31, 2010, 2009, and 2008, respectively. Loans are net of the allowance for loan losses, deferred fees, unearned income, and related direct costs, but include those placed on non-accrual status.
Provision for Loan Losses and Provision for Loan Commitments
In anticipation of credit risks inherent in our lending business and the recent ongoing financial crisis, we set aside allowances through charges to earnings. Such charges were made not only for our outstanding loan portfolio, but also for off-balance sheet items, such as commitments to extend credits or letters of credit. The charges made for our outstanding loan portfolio were credited to allowance for loan losses, whereas charges for off-balance sheet items were credited to the reserve for off-balance sheet items, which are presented as a component of other liabilities.
Although we have enhanced our stringent loan underwriting standards and proactive credit follow-up procedures, we experienced a substantial increase of the provision for loan losses because of a weak economy, the continued decline in the real estate market, and increases in loan defaults and foreclosures. Due to aggressive resolution of problem loans through reserves and charge-offs in 2010, our provision for loan losses increased 119.8% to $150.8 million in 2010 from $68.6 million in 2009. Approximately $11.0 million of the increase in provision for loan losses in 2010 was a result of an investigation in 2011 regarding misconduct by a loan officer in addition to a lack of supervision and
66
internal controls. The remaining increases in our provisions were primarily due to an increase of non-performing loans (see "Nonperforming Assets" below for further discussion).
Total charge-offs in 2010 totaled $109.2 million in 2010 compared to $36.7 million in 2009, and increase of $66.1 million. The increase in charge-offs from 2009 to 2010 is largely attributable to note sale transactions, in which discount portions of loan sold were charged-off. The $150.8 million provision in 2010 was net of provision of $2.0 million to the reserve for loan commitments, while the $68.6 million and $12.1 million in provisions in 2009 and 2008 included $1.3 million in provisions for loan commitments and $755,000 in recoveries for loan commitments, respectively. The procedures for monitoring the adequacy of the allowance for loan losses, as well as detailed information concerning the allowance itself, are described in the section entitled "Allowance for Loan Losses and Loan Commitments" below.
Noninterest Income
Total noninterest income decreased to $35.9 million in 2010, as compared with $57.3 million and $20.6 million in 2009 and 2008, respectively. Noninterest income was 1.1% of average assets in 2010, a decrease from 1.9% in 2009 but an increase from 0.9% in 2008. We currently earn noninterest income from various sources, including an income stream provided by bank owned life insurance, or BOLI, in the form of an increase in cash surrender value.
The following table sets forth the various components of our noninterest income for the periods indicated:
Noninterest Income
(Dollars in Thousands)
For the Years Ended December 31,
|
2010 | 2009 | 2008 | |||||||||||||||||
|---|---|---|---|---|---|---|---|---|---|---|---|---|---|---|---|---|---|---|---|---|
| |
(Amount) | (%) | (Amount) | (%) | (Amount) | (%) | ||||||||||||||
Gain from acquisition of Mirae Bank |
$ | — | 0.0 | % | $ | 21,679 | 37.8 | % | $ | — | 0.0 | % | ||||||||
Service charges on deposit accounts |
12,545 | 34.9 | % | 12,738 | 22.2 | % | 11,964 | 58.0 | % | |||||||||||
Gain on sale of securities |
8,782 | 24.5 | % | 11,158 | 19.5 | % | 3 | 0.0 | % | |||||||||||
Gain on sale of loans |
6,261 | 17.4 | % | 3,694 | 6.4 | % | 2,186 | 10.6 | % | |||||||||||
Loan-related servicing fees |
4,163 | 11.6 | % | 3,703 | 6.5 | % | 3,174 | 15.4 | % | |||||||||||
Other income |
4,161 | 11.6 | % | 4,344 | 7.6 | % | 3,319 | 16.0 | % | |||||||||||
Total |
$ | 35,912 | 100.0 | % | $ | 57,316 | 100.0 | % | $ | 20,646 | 100.0 | % | ||||||||
Average assets |
$ | 3,343,412 | $ | 2,987,365 | $ | 2,331,029 | ||||||||||||||
Noninterest income as a % of average assets |
1.1 | % | 1.9 | % | 0.9 | % | ||||||||||||||
Our largest source of noninterest income in 2009 was the gain relating to the acquisition of Mirae Bank, which represented 37.8% of total noninterest income. There were no gains on acquisition recorded in 2010 or 2008. The $21.7 million acquisition gain was recorded as a bargain purchase gain which resulted from the difference between the total fair value of assets acquired in the amount of $395.6 million, less $373.9 million in fair value of liabilities acquired from the second quarter acquisition of Mirae Bank.
Our services charges on deposits accounted for 34.9% of total noninterest income, which was the largest portion of noninterest income in 2010 and decreased to $12.5 million in 2010, as compared with $12.7 million and $12.0 million in 2009 and 2008, respectively. The decrease in services charges on deposits in 2010 was primarily due to deposit declines in 2010, specifically a decline in non-sufficient
67
funds fees. We constantly review service charge rates to maximize service charge income while maintaining a competitive edge in our markets.
Our liquidity position continued to remain strong in 2009 and 2010 as a result of strong deposit growth particularly core deposits in the past. This, in addition to slower loan demand allowed us to profit from gains on the sale of securities. Gains from security sales totaled $8.8 million in 2010, our second largest source of noninterest income at 24.5% of total noninterest income. The $8.8 million in securities gains in 2010 was down from $11.2 million in 2009 but a large increased from 2008 gain on sale of securities which totaled $3,000. The market value of securities have increased in 2009 and 2010 in contrast to what we experience in 2007 and 2008 due to decreased volatility in markets, changes in the yield curve, and contraction of interest rates spreads on securities owned by the Bank.
Gain on sale of loans, representing approximately 17.4% of our total noninterest income in 2010 was our next largest source of noninterest income. Gain on sale of loans increased from $2.2 million in 2008 to $3.7 million in 2009 and again increased to $6.3 million in 2010. This noninterest income is derived primarily from the sale of the guaranteed portion of SBA loans. We sell the guaranteed portion of SBA loans in the secondary market for government securities and retain the associated servicing rights. Due to the weakened economy and ongoing financial crisis, our SBA loan production levels decreased to $51.5 million in 2009 as compared with $63.3 million in 2008. However, production levels increased in 2010 to $121.4 million which contributed to the increase in gain on sale of loans. Gains from the sale of guaranteed portions of SBA loans were $5.7 million at the end of 2010 and $3.9 million at 2009, and $2.2 million for 2008. There were no gains from unguaranteed portions sold from 2008 to 2010. The sale of mortgage loans resulted in gains totaling $19,000 in 2008, $35,000 in 2009, and $530,000 in 2010. Although there were not losses on sale of loans in 2008 or 2010, we recorded a loss on sale of loans totaling $206,000 in 2009.
Our fourth largest source of noninterest income was loan-related servicing fees, which represented approximately 11.6% of our total noninterest income. This fee income consists of trade-financing fees and servicing fees on SBA loans sold. With the expansion of our trade-financing activities and the growth of our servicing loan portfolio, fee income has generally increased. In 2010, loan-related servicing fees increased to $4.2 million, as compared with $3.7 million in 2009 and $3.2 million in 2008. The servicing fee income on sold loans is credited when we collect the monthly payments on the sold loans we are servicing and charged by the monthly amortization of servicing rights and interest only, or I/O strips that we originally capitalized upon sale of the related loans. Such servicing rights and I/O strips are also charged against the loan service fee income account when the sold loans are paid off.
Income on other earning assets represents dividend income from FHLB stock ownership and the increase in the cash surrender value of BOLI. These accounted for $830,000, $833,000, and $1.2 million in 2010, 2009, and 2008, respectively. Other income represented income from miscellaneous sources, such as loan referral fees, SBA loan packaging fees, gain on sale of investment securities and excess of insurance proceeds over carrying value of an insured loss that generally increases as our business grows. Other income decreased to $3.3 million in 2010, as compared with $3.5 million in 2009, and $2.1 million in 2008.
Noninterest Expense
Total noninterest expense increased to $67.4 million in 2010 from $57.4 million in 2009 which previously increased from $48.4 million in 2008. The increases in 2008 and 2009 were primarily attributable to the increased FDIC and state assessments, and increase in premises expense related to opening of new branches, as well increases stemming from balance sheet growth. In 2010, noninterest expenses were increased due to increased legal fees and loss on sale of OREO both related to the increase in problem loans in addition to increased salaries and wages. Due to continuing efforts to minimize operating expenses during our expansion, we were able to maintain noninterest expenses as a
68
percentage of average assets at 2.0% in 2010, compared with 1.9% in 2009 and 2.1% in 2008. The efficiency ratio at December 31, 2010 was 45.03%, an increase from 36.6% for 2009, but decreased from 46.9% in 2008. The efficiency ratio for 2009 includes a gain on purchase of Mirae Bank in noninterest income totaling $21.7 million. Without including the purchase gain in 2009, the efficiency ratio was 42.5%.
The following table sets forth a summary of noninterest expenses for the periods indicated:
Noninterest Expense
(Dollars in Thousands)
For the Years Ended December 31,
|
2010 | 2009 | 2008 | |||||||||||||||||
|---|---|---|---|---|---|---|---|---|---|---|---|---|---|---|---|---|---|---|---|---|
| |
(Amount) | (%) | (Amount) | (%) | (Amount) | (%) | ||||||||||||||
Salaries and employee benefits |
$ | 29,074 | 43.2 | % | $ | 26,498 | 46.2 | % | $ | 26,517 | 54.8 | % | ||||||||
Occupancy and equipment |
7,984 | 11.8 | % | 7,456 | 13.0 | % | 6,128 | 12.7 | % | |||||||||||
Professional fees |
5,009 | 7.5 | % | 2,337 | 4.1 | % | 1,840 | 3.8 | % | |||||||||||
Deposit insurance premium |
4,523 | 6.7 | % | 4,780 | 8.3 | % | 1,285 | 2.7 | % | |||||||||||
Data processing |
2,721 | 4.0 | % | 3,969 | 6.9 | % | 3,111 | 6.4 | % | |||||||||||
Loss on investment in low income housing tax credit |
2,282 | 3.4 | % | — | 0.0 | % | — | 0.0 | % | |||||||||||
Loss on sale of OREO |
2,097 | 3.1 | % | 312 | 0.5 | % | — | 0.0 | % | |||||||||||
Advertising and promotional |
1,382 | 2.1 | % | 1,143 | 2.0 | % | 1,016 | 2.1 | % | |||||||||||
Outsourced service for customers |
1,028 | 1.5 | % | 1,135 | 2.0 | % | 1,556 | 3.2 | % | |||||||||||
Office supplies |
876 | 1.3 | % | 783 | 1.4 | % | 729 | 1.5 | % | |||||||||||
Post-retirement benefit costs |
628 | 0.9 | % | 870 | 1.5 | % | 144 | 0.3 | % | |||||||||||
Directors' fees |
570 | 0.9 | % | 395 | 0.7 | % | 431 | 0.9 | % | |||||||||||
Other |
9,202 | 13.6 | % | 7,691 | 13.4 | % | 5,643 | 11.6 | % | |||||||||||
Total |
$ | 67,376 | 100.0 | % | $ | 57,369 | 100.0 | % | $ | 48,400 | 100.0 | % | ||||||||
Average assets |
$ | 3,343,412 | $ | 2,987,365 | $ | 2,331,029 | ||||||||||||||
Noninterest expense as a % of average assets |
2.0 | % | 1.9 | % | 2.1 | % | ||||||||||||||
Salaries and employee benefits historically represented more than half of our total noninterest expense and generally increases as our branch network and business volume expands. However, in 2009, salaries and benefits accounted for only 46.2% of total noninterest expense and decreased further to 43.2% in 2010. Additional staffing was necessitated by our new office and branch openings, business growth, and the acquisition of Mirae Bank in 2009 and 2010 However, by 2010 we successfully controlled and maintained our total number of employees through effective allocation of our human resources. The number of full-time equivalent employees decreased to 392 at the end of 2010, as compared with 400 and 348 in 2009 and 2008, respectively. Even with decrease in employees in 2010, salaries and employee benefits increased to $29.1 million for 2010, as compared with $26.5 million for both 2009 and 2008, representing an increase of 9.7% in 2010. Compared to 2008, salaries and benefits decreased 0.1% in 2009. Assets per employee stood at $7.6 million for 2010, a decrease from $8.6 million in 2009 but increased from 7.0 million in assets per employee at the end of 2008.
Occupancy and equipment expenses represent approximately 11.8% of total noninterest expenses and totaled $8.0 million in 2010, $7.5 million in 2009, and $6.1 million in 2008. The increases totaled 7.1% and 21.7% in 2010 and 2009, respectively, over each of the prior year periods. These increases were attributable to the expansion of our office network and the additional office space and lease expenses for our new California and New York branch offices opened in 2009 and 2010.
69
Professional fees generally increase as we grow and we expect these expenditures continue to be significant, as we address the enhanced SEC and NASDAQ corporate governance requirements and the local regulation of the states into which we expand our business operations. Professional fees were $5.0 million, $2.3 million, and $1.8 million, or 7.5%, 4.1%, and 3.8% of total noninterest expense, in 2010, 2009 and 2008, respectively. Professional fees increased by $2.7 million from 2009 to 2010 as a result of an increase in legal fees totaling $3.0 million. Approximately $970,000 of that increase was due to an investigation regarding misconduct by a former employee of the Bank. Legal fees were increased as a result of credit issues and use of legal professionals in the resolution and sales of non-performing loans. The $497,000 increase in 2009 was attributable to the $258,000 increase in accounting, audit fees and an increase of $170,000 in legal fees related to loan collection, property foreclosure and repossession, and various other legal consultations, and a $68,000 increase in fees related to consulting, system test, and various accounting and auditing services.
Deposit insurance premium expenses represent the Financing Corporation (FICO) and FDIC insurance premium assessments. In 2010, these expenses decreased to $4.5 million from $4.8 million in 2009 and $1.3 million in 2008. The increase in FDIC insurance assessment in 2009 was primarily a result of the temporary increase in FDIC insurance coverage from $100,000 to $250,000 starting May 2009. This increased the insured deposit amount thereby increasing assessment fees associated with covered deposits. The FDIC also levied a special assessment starting June 2009 amounting to 5 basis points. Deposit insurance premiums decreased $256,000 in 2010 compared to 2009 due to the decrease in deposits for the same period.
Data processing expenses decreased 31.4% to $2.7 million in 2010 compared to $4.0 million in 2009, and decreased 12.9% from $3.1 million in 2008. The increase in data processing in 2009 corresponded to the growth of our business as a result of the acquisition of Mirae Bank. One-time costs associated with the acquisition were expensed in 2009 as well. Data processing fees were decreased in 2010 due to the absence of further one-time costs in addition to the streamlining of Mirae Bank data.
Loss on investment in low income housing tax credit ("LIHTC") investments, representing 3.4% of total noninterest expenses, totaled $2.3 million in 2010, compared with no related expense in 2009 and 2008. The Company uses equity method when accounting for partnership interest. The loss is related to current period losses allocated from the equity method in 2010.
Loss on the sale of other real estate owned or "OREO" increased from $312,000 in 2009 to $2.1 million or 3.1% of noninterest expense in 2010, an increase of 572.1%. There were no losses recorded related to the sale of OREO in 2008. The increase in loss of sale of OREO was a result of an increase in problem loans that were converted to OREO in 2010. This increase and the cost associated with the sale of OREO resulted in an increase of $1.8 million in 2010, when compared to 2009.
Advertising and promotional expenses increased to $1.4 million in 2010 from $1.1 million in 2009, which previously increased from $1.0 million in 2008, representing 2.1%, 2.0%, and 2.1% of total noninterest expenses in 2010, 2009 and 2008, respectively. These expenses represent marketing activities, such as media advertisements and promotional gifts for customers of newly opened offices, especially in the new areas such as the east coast market in New York and New Jersey. The expenses have remained fairly steady with no large fluctuations from 2008 to 2010.
Outsourced service costs for customers are payments made to third parties who provide services that were traditionally provided by banks to their customers, such as armored car services or bookkeeping services, and are recouped from the earnings credits earned by the respective depositors on their balances maintained with us. Due mainly to the increase in service activities and the increase in depositors demanding such services, our outsourced service costs generally rise in proportion with our business growth. Nonetheless, with our successful cost control measures, these expenses decreased to $1.0 million in 2010, as compared with $1.1 million in 2009 and $1.6 million in 2008.
70
Other expense such as post-retirement benefit costs, office supplies, and director fees individually all were under $1.0 million and together totaled $2.1 million, $2.0 million, and $1.3 million for 2010, 2009, and 2008, respectively. All other noninterest expense, increased by $1.5 million, or 19.6%, to $9.2 million in 2010 from $7.7 million in 2009. During 2009 other noninterest expense increased $2.0 million or 36.3% from $5.6 million in 2008. A portion of the increase represents a normal growth in association with the growth of our business activities and was in line with our expectation. However, approximately $900,000 was expensed in 2009 as a result of operational losses at our branches and in 2010 other loan expenses totaled $860,000, an increase of $780,000 from 2009.
As a result of our cost control efforts, noninterest expense increased less rapidly at 17.4% in 2010 compared to 18.5% in 2009. Our successful expansion into the New York/New Jersey market in the previous years has paved the groundwork for our further expansion into the East Coast in 2009 and beyond. Although management anticipates that noninterest expense will continue to increase as we continue to grow, we remain committed to cost-control and operational efficiency, and we expect to keep these increases to a minimum relative to our rate of growth.
Provision for Income Taxes
For the year ended December 31, 2010, we had an income tax benefit $33.8 million on pretax net loss of $68.5 million, representing an effective tax rate of 49.3%, as compared with a provision for income taxes of $10.7 million on pretax net income of $30.8 million, representing an effective tax rate of 34.7% for 2009, and a provision of $16.3 million on pretax net income of $42.8 million, representing an effective tax rate of 38.1% for 2008.
The effective tax rate decreased from 2008 to 2009, due primarily to an increase in low income housing tax credit funds, and lower taxable income. Our 2009 lower effective tax rates and 2010 higher income tax benefit rates compared to statutory rates were mainly due to state tax benefits derived from doing business in an enterprise zone and tax preferential treatment for our ownership of BOLI and low income housing tax credit funds (see "Other Earning Assets" for further discussion). Generally, income tax expense is the sum of two components: current tax expense and deferred tax expense (benefit). Current tax expense is calculated by applying the current tax rate to taxable income. Deferred tax expense is recorded as deferred tax assets (liabilities) change from year to year. Deferred income tax assets and liabilities represent the tax effects, based on current tax law, of future deductible or taxable amounts attributable to events that have been recognized in our financial statements. Because we traditionally recognize substantially more expenses in our financial statements than we have been allowed to deduct for taxes, we generally have a net deferred tax asset.
At December 31, 2010, 2009, and 2008, we had net deferred tax assets of $46.4 million, $18.7 million, and $12.1 million, respectively. In assessing the realizability of deferred tax assets, management considers whether it is more likely than not that some portion or all of the deferred tax assets will not be realized. Realization is dependent on generating sufficient taxable income prior to expiration of the loss carry-forwards. Although realization is not assured, management believes it is more likely than not that all of the deferred tax asset will be realized. The amount of the deferred tax asset considered realizable, however, could be reduced in the near term if estimates of future taxable income during the carry-forward period are reduced. A valuation allowance against deferred tax assets at the balance-sheet date is not considered necessary, because it is more likely than not the deferred tax asset will be fully realized.
On January 1, 2007, we adopted the provisions of ASC 740-10 (formerly FIN 48, Accounting for Uncertainty in Income Taxes). As a result of applying the provisions of ASC 740-10, we recognized an increase in the liability for unrecognized tax benefit of $191,000 and no related interest. As of December 31, 2010, the total unrecognized tax benefit that would affect the effective rate if recognized was $427,000. The adjustment was solely related to the state exposure from California Enterprise Zone net interest deductions. We do not expect the unrecognized tax benefits to change significantly over the next 12 months.
71
As of the December 31, 2010, the total accrued interest related to uncertain tax positions was $12,000. We accounted for interest related to uncertain tax positions as part of our provision for federal and state income taxes. Accrued interest was included as part of our net deferred tax asset in the consolidated financial statements.
We file United States federal and state income tax returns in jurisdictions with varying statues of limitations. The 2007 through 2010 tax years generally remain subject to examination by federal and most state tax authorities. Examinations for the 2005 and 2006 tax years under the California Franchise Tax Board were completed as of December 31, 2009, but we are still under examination by the New York State Department of Taxation and Finance for the same period. Examinations for the 2007 and 2008 tax years under the California Franchise Tax Board are ongoing as well. We believe that we have adequately provided or paid for income tax issues not yet resolved with federal, state and foreign tax authorities. Based upon consideration of all relevant facts and circumstances, we do not expect the examination results will have a material impact on our consolidated financial statement as of December 31, 2010.
Investment Portfolio
Investments are one of our major sources of interest income and are acquired in accordance with a comprehensively written investment policy addressing strategies, categories, and levels of allowable investments. This investment policy is reviewed at least annually by the Board of Directors. Management of our investment portfolio is set in accordance with strategies developed and overseen by our Asset/Liability Committee. Investment balances, including cash equivalents and interest-bearing deposits in other financial institutions, are subject to change over time based on our asset/liability funding needs and interest rate risk management objectives. Our liquidity levels take into consideration anticipated future cash flows and all available sources of credits and is maintained a level management believes is appropriate to assure future flexibility in meeting anticipated funding needs.
Cash Equivalents and Interest-bearing Deposits in other Financial Institutions
We sell federal funds, purchase securities under agreements to resell and high-quality money market instruments, and deposit interest-bearing accounts in other financial institutions to help meet liquidity requirements and provide temporary holdings until the funds can be otherwise deployed or invested. As of December 31, 2010, 2009, and 2008, we had $130.0 million, $80.0 million, and $30.0 million, respectively, in overnight and term federal funds sold. We did not have any interest bearing deposits in other financial institutions as of December 31, 2010, 2009, or 2008.
Investment Securities
Management of our investment securities portfolio focuses on providing an adequate level of liquidity and establishing a balanced interest rate-sensitive position, while earning an adequate level of investment income without taking undue risks. As of December 31, 2010, our investment portfolio was primarily comprised of United States government agency securities, accounting for 88.5% of the entire investment portfolio. Our U.S. government agency securities holdings are all "prime/conforming" mortgage backed securities, or MBS, and collateralized mortgage obligations, or CMOs, guaranteed by FNMA, FHLMC, or GNMA. GNMAs are considered equivalent to U.S. Treasury securities, as they are backed by the full faith and credit of the U.S. government. Currently, there are no subprime mortgages in our investment portfolio. Besides the U.S. government agency securities, we also have a 0.6% investment in corporate debt and 10.9% in municipal debt securities. Among this 11.5% of our investment portfolio that was not comprised of U.S. government securities, 90.2%, or $32.8 million carry the top two highest "Investment Grade" rating of "Aaa/AAA" or "Aa/AA", while 6.0%, or
72
$2.2 million, carry an intermediate "Investment Grade" rating of at least "Baa1/BBB+" or above, and 3.8%, or $1.4 million, is unrated. Our investment portfolio does not contain any government sponsored enterprises, or GSE, preferred securities or any distressed corporate securities that had required other-than-temporary-impairment charges as of December 31, 2010. In accordance with ASC 320-10-65-1 (Recognition and Presentation of Other-Than-Temporary Impairments), an other than temporary impairment ("OTTI") is recognized if the fair value of a debt security is lower than the amortized cost and the debt security will be sold, it is more likely than not, that it will be required to sell the security before recovering the amortized cost, or if it is expected that not all of the amortized cost will be recovered. Credit related declines in the fair value of debt securities below their amortized cost that are deemed to be other than temporary are reflected in earnings as realized losses in the consolidated statements of operations. Declines related to factors aside from credit issues are reflected in other comprehensive income, net of taxes.
We classified our investment securities as "held-to-maturity" or "available-for-sale" pursuant to ASC 320-10 (SFAS No. 115). We adopted ASC 820-10 (SFAS No. 157) and ASC 470-20 (SFAS No. 159) effective January 1, 2008, and we adopted ASC 820-10-35 (FASB Staff Position ("FSP") SFAS No. 157-3) effective October 10, 2008. Pursuant to the fair value election option of ASC 470-20, we have chosen to continue classifying our existing instruments of investment securities as "held-to-maturity" or "available-for-sale" under ASC 320-10. Investment securities that we intend to hold until maturity are classified as held to maturity securities, and all other investment securities are classified as available-for-sale. The carrying values of available-for-sale investment securities are adjusted for unrealized gains and losses as a valuation allowance and any gain or loss is reported on an after-tax basis as a component of other comprehensive income. Credit related declines in the fair value of held-to-maturity and available-for-sale securities below their cost that are deemed to be other than temporary are reflected in earnings as realized losses, and there were no such other-than-temporary-impairment in 2010. The fair market values of our held-to-maturity and available-for-sale securities were respectively $89,000 and $316.6 million as of December 31, 2010.
73
The following table summarizes the book value and market value and distribution of our investment securities as of the dates indicated:
Investment Securities Portfolio
(Dollars in Thousands)
| |
As of December 31, 2010 | As of December 31, 2009 | As of December 31, 2008 | |||||||||||||||||
|---|---|---|---|---|---|---|---|---|---|---|---|---|---|---|---|---|---|---|---|---|
| |
Amortized Cost |
Market Value |
Amortized Cost |
Market Value |
Amortized Cost |
Market Value |
||||||||||||||
Held to Maturity: |
||||||||||||||||||||
Securities of government sponsored enterprises |
$ | — | $ | — | $ | — | $ | — | $ | — | $ | — | ||||||||
Collateralized mortgage obligations |
85 | 89 | 109 | 109 | 139 | 135 | ||||||||||||||
Municipal bonds |
— | — | — | — | — | — | ||||||||||||||
Total held-to-maturity securities |
$ | 85 | $ | 89 | $ | 109 | $ | 109 | $ | 139 | $ | 135 | ||||||||
Available for Sale: |
||||||||||||||||||||
Securities of government sponsored enterprises |
$ | 35,953 | $ | 36,220 | $ | 156,879 | $ | 155,382 | $ | 25,952 | $ | 26,187 | ||||||||
Mortgage backed securities |
18,129 | 18,907 | 131,617 | 131,711 | 124,549 | 125,513 | ||||||||||||||
Collateralized mortgage obligations |
222,778 | 225,114 | 318,531 | 319,554 | 62,557 | 63,303 | ||||||||||||||
Corporate securities |
2,000 | 2,021 | 2,000 | 2,017 | 7,048 | 6,953 | ||||||||||||||
Municipal bonds |
34,779 | 34,360 | 42,068 | 42,654 | 7,323 | 7,180 | ||||||||||||||
Total available-for-sale securities |
$ | 313,639 | $ | 316,622 | $ | 651,095 | $ | 651,318 | $ | 227,429 | $ | 229,136 | ||||||||
The following table summarizes the maturity and repricing schedule of our investment securities at their carrying values and their weighted average yields at December 31, 2010:
Investment Maturities and Repricing Schedule
(Dollars in Thousands)
| |
Within One Year |
After One But Within Five Years |
After Five But Within Ten Years |
After Ten years | Total | |||||||||||||||||||||||||||
|---|---|---|---|---|---|---|---|---|---|---|---|---|---|---|---|---|---|---|---|---|---|---|---|---|---|---|---|---|---|---|---|---|
| |
Amount | Yield | Amount | Yield | Amount | Yield | Amount | Yield | Amount | Yield | ||||||||||||||||||||||
Held to Maturity: |
||||||||||||||||||||||||||||||||
Collateralized mortgage obligations |
$ | — | — | $ | 89 | 3.99 | % | $ | — | — | $ | — | — | $ | 89 | 3.99 | % | |||||||||||||||
Available-for-sale: |
||||||||||||||||||||||||||||||||
Securities of government sponsored enterprises |
— | — | — | — | 36,220 | 4.32 | % | — | — | 36,220 | 4.32 | % | ||||||||||||||||||||
Mortgage backed securities |
6,315 | 2.36 | % | 48 | 5.53 | % | 2,052 | 4.45 | % | 10,492 | 5.57 | % | 18,907 | 4.37 | % | |||||||||||||||||
Collateralized mortgage obligations |
308 | 4.43 | % | 223,044 | 3.14 | % | 102 | 4.51 | % | 1,660 | 5.48 | % | 225,114 | 3.16 | % | |||||||||||||||||
Corporate securities |
— | — | 2,021 | 5.97 | % | — | — | — | — | 2,021 | 5.97 | % | ||||||||||||||||||||
Municipal bonds |
127 | 2.98 | % | 1,150 | 3.68 | % | 5,929 | 4.11 | % | 27,154 | 4.43 | % | 34,360 | 4.34 | % | |||||||||||||||||
Total investment securities |
$ | 6,750 | 2.46 | % | 226,263 | 3.17 | % | 44,303 | 4.30 | % | 39,306 | 4.78 | % | 316,622 | 3.51 | % | ||||||||||||||||
Our investment securities holdings decreased by $334.7 million, or 51.4%, to $316.7 million at December 31, 2010, compared to holdings of $651.4 million at December 31, 2009. Holdings at December 31, 2008 were $229.3 million. Total investment securities as a percentage of total assets were 10.7% and 19.0% at December 31, 2010 and 2009, respectively, compared to 9.4% at December 31, 2008. As of December 31, 2010, investment securities having a carrying value of $226.7 million were pledged to secure certain deposits.
74
As of December 31, 2010, held-to-maturity ("HTM") securities, which are carried at their amortized costs, decreased from $109,000 in 2009 to $85,000 in 2010. The $24,000 HTM securities reduction in 2010 was due to pay-downs in principal. Available-for-sale securities, which are stated at their fair market values, decreased to $316.6 million at December 31, 2010 from $651.3 million and $229.1 million at December 31, 2009 and 2008, respectively. The $334.7 million decrease in 2010 represented $337.5 million net purchases and $2.8 million unrealized gain. Meanwhile, the $422.2 million increase in 2009 represented $423.6 million net purchases, which includes $55.4 million received as a result of the acquisition of Mirae Bank, and $1.4 million unrealized gain.. These increases reflect a strategy of improving our levels of liquidity using available-for-sale securities, in addition to immediately available funds which are maintained mainly in the form of overnight investments. The large decrease in 2010 was a result of increased liquidity that resulted from the inflow of core deposits.
The following tables show our investments' gross unrealized losses and fair value, aggregated by investment category and length of time that individual securities have been in a continuous unrealized loss position, at December 31, 2010 and 2009, respectively:
As of December 31, 2010
| |
Less than 12 months | 12 months or longer | Total | ||||||||||||||||
|---|---|---|---|---|---|---|---|---|---|---|---|---|---|---|---|---|---|---|---|
Description of Securities (AFS)(1)
|
Fair Value | Gross Unrealized Losses |
Fair Value | Gross Unrealized Losses |
Fair Value | Gross Unrealized Losses |
|||||||||||||
| |
(Dollars in Thousands) |
||||||||||||||||||
Securities of government sponsored enterprises |
$ | — | $ | — | $ | — | $ | — | $ | — | $ | — | |||||||
Collateralized mortgage obligations |
27,650 | (117 | ) | — | — | 27,650 | (117 | ) | |||||||||||
Mortgage-backed securities |
— | — | — | — | — | — | |||||||||||||
Corporate securities |
— | — | — | — | — | — | |||||||||||||
Municipal bonds |
20,281 | (448 | ) | 1,450 | (264 | ) | 21,731 | (712 | ) | ||||||||||
|
$ | 47,931 | $ | (565 | ) | $ | 1,450 | $ | (264 | ) | $ | 49,381 | $ | (829 | ) | ||||
As of December 31, 2009
| |
Less than 12 months | 12 months or longer | Total | ||||||||||||||||
|---|---|---|---|---|---|---|---|---|---|---|---|---|---|---|---|---|---|---|---|
Description of Securities (AFS)
|
Fair Value | Gross Unrealized Losses |
Fair Value | Gross Unrealized Losses |
Fair Value | Gross Unrealized Losses |
|||||||||||||
| |
(Dollars in Thousands) |
||||||||||||||||||
Securities of government sponsored enterprises |
$ | 110,296 | $ | (1,600 | ) | $ | — | $ | — | $ | 110,296 | $ | (1,600 | ) | |||||
Collateralized mortgage obligations |
145,622 | (975 | ) | — | — | 145,622 | (975 | ) | |||||||||||
Mortgage-backed securities |
85,313 | (726 | ) | — | — | 85,313 | (726 | ) | |||||||||||
Corporate securities |
— | — | — | — | — | — | |||||||||||||
Municipal bonds |
8,783 | (505 | ) | — | — | 18,783 | (505 | ) | |||||||||||
|
$ | 360,014 | $ | (3,806 | ) | $ | — | $ | — | $ | 360,014 | $ | (3,806 | ) | |||||
- (1)
- There were no held to maturity securities with losses as of December 31, 2010 or December 31, 2009.
As of December 31, 2010, the total unrealized losses less than 12 months old were $565,000 and unrealized losses more than 12 months old totaled $264,000. The aggregate related fair value of investments with unrealized losses less than 12 months old was $47.9 million at December 31, 2010 and the aggregate fair value of investments with unrealized losses more than 12 months old was
75
$1.5 million. As of December 31, 2009, the total unrealized losses less than 12 months old were $3.8 million, and there were no unrealized losses more than 12 months old. The aggregate related fair value of investments with unrealized losses less than 12 months old was $360.0 million at December 31, 2009.
Declines in the fair value of held-to-maturity and available-for-sale securities below their cost that are deemed to be other than temporary are reflected in earnings as realized losses. In estimating other-than-temporary impairment losses, we consider, among other things, (i) the length of time and the extent to which the fair value has been less than cost, (ii) the financial condition and near-term prospects of the issuer, and (iii) our intent and ability to retain our investment in the issuer for a period of time sufficient to allow for any anticipated recovery in fair value.
We performed detailed evaluation of the investment portfolio in assessing individual positions that have market values that have declined below cost. In assessing whether there was other-than-temporary impairment, we considered in a disciplined manner:
- •
- Whether or not all contractual cash flows due on a security will be collected; and
- •
- Our positive intent and ability to hold the debt security until recovery in fair value or maturity
A number of factors are considered in the analysis, including but not limited to:
- •
- Issuer's credit rating;
- •
- Likelihood of the issuer's default or bankruptcy;
- •
- Collateral underlying the security;
- •
- Industry in which the issuer operates;
- •
- Nature of the investment;
- •
- Severity and duration of the decline in fair value; and
- •
- Analysis of the average life and effective maturity of the security.
We do not believe that any individual unrealized loss as of December 31, 2010 represented an other-than-temporary impairment. The unrealized losses on our GSE bonds, GSE CMOs, and GSE MBS were attributable to both changes in interest rate (U.S. Treasury curve) and a repricing of risk (spreads widening against risk-fee rate) in the market. We do not own any non-agency MBS or CMO. All GSE bonds, GSE CMO, and GSE MBS securities are backed by U.S. Government Sponsored and Federal Agencies and therefore rated "Aaa/AAA." We have no exposure to the "Subprime Market" in the form of Asset Backed Securities, or ABS, and Collateralized Debt Obligations, or CDOs, that had previously been rated "Aaa/AAA" but have since been downgraded to below investment grade. We have the intent and ability to hold the securities in an unrealized loss position at December 31, 2010 until the market value recovers or the securities mature.
Municipal bonds and corporate bonds are evaluated by reviewing the credit-worthiness of the issuer and general market conditions. The unrealized losses on our investment in municipal and corporate securities were primarily attributable to both changes in interest rates and a repricing of risk in the market. We have the intent and ability to hold the securities in an unrealized loss position at December 31, 2010 until the market value recovers or the securities mature.
Loan Portfolio
Total loans are the sum of loans receivable and loans held for sale and reported at their outstanding principal balances net of any unearned income which is unamortized deferred fees and costs and premiums and discounts. Total loans net of unearned income decreased by $100.8 million, or
76
4.2%, to $2.33 billion at December 31, 2010 from $2.43 billion at December 31, 2009. Total loans net of unearned income totaled $2.05 billion, $1.81 billion, and $1.56 billion at December 31, 2008, 2007 and 2006, respectively. Total loans net of unearned income as a percentage of total assets were 78.3%, 70.6%, 83.7%, 82.4%, and 77.7% for 2010, 2009, 2008, 2007, and 2006, respectively.
In the ordinary course of our business, we originate and service our own loans. For held for sale loans that we choose to sell in the secondary market, we sell them with representations and warranties generally consistent with industry practices, but without recourse. The exception was with SBA loans, and it was our practice to resell these loans in the secondary market for the guaranteed portion with 90-day recourse. However, beginning March 2011, the recourse provision for SBA guaranteed portions sold was removed and no longer a standard for these transactions. Accordingly, we do not retain a significant amount of the credit risk exposure on the loans sold. And, for all loans we originate and carry, we have not had any subprime loans in our portfolio.
Real estate secured loans consist primarily of commercial real estate loans and are extended to finance the purchase and/or improvement of commercial real estate and/or businesses. The properties may either be user owned or for investment purposes. Our loan policy adheres to the real estate loan guidelines set forth by the FDIC. The policy provides guidelines including, among other things, fair review of appraisal value, limitation on loan-to-value ratio, and minimum cash flow requirements to service debt. Loans secured by real estate equaled $1.91 billion, $1.98 billion, $1.60 billion, $1.39 billion, and $1.18 billion as of December 31, 2010, 2009, 2008, 2007, and 2006, respectively. Real estate secured loans as a percentage of total loans were 82.25%, 81.40%, 77.8%, 76.6%, and 75.8% at December 31, 2010, 2009, 2008, 2007, and 2006, respectively. Most of loans that are held for sale are transferred to the secondary market, but we retain a portion on our books as portfolio loans. This secondary market has become less active compared to the prior years as a result of the general
The decline in the real estate market has caused a few key purchasers in the market to have experienced financial difficulties due to the ongoing credit crisis. Our total home mortgage loan portfolio outstanding at the end of 2010 and 2009 were $47.7 million and $41.3 million, respectively, and represented only a small fraction of our total loan portfolio at 2.1% in 2010 and 1.7% in 2009. We have deemed the effect of this segment of our portfolio on our credit risk profile to be immaterial. Residential mortgage loans with unconventional terms such as interest only mortgages and option adjustable rate mortgages at December 31, 2010 were $1.2 million and $944,000, respectively, inclusive of loans held temporarily for sale or refinancing. As of December 31, 2009 the same figures were $1.9 million and $1.2 million, respectively.
Commercial and industrial loans include revolving lines of credit, as well as term business loans. Commercial and industrial loans were $325.6 million, $386.0 million, $387.8 million, $330.1 million, and $278.2 million at the end of 2010, 2009, 2008, 2007, and 2006, respectively. Commercial and industrial loans were 14.0%, 15.9%, 18.9%, 18.2%, and 17.8% as a percentage of total loans at the end of 2010, 2009, 2008, 2007, and 2006, respectively. In the current economic environment, we exercise more due diligence in acquiring new loans, in particular loans with no collateral. The result was a decrease in commercial and industrial loan in 2010, which amounted to $60.3 million or 15.6% and $1.8 million or 0.5% during 2009.
Consumer loans have historically represented less than 5% of our total loan portfolio. The majority of consumer loans are concentrated in personal lines of credits. As consumer loans present a higher risk potential compared to our other loan products, especially given current economic conditions, we have reduced our effort in consumer lending since 2007. Accordingly, as of December 31, 2010, the balance of consumer loans was down by $1.6 million to $15.7 million, as compared with $17.3 million, $23.7 million, $33.6 million, and $53.1 million at the end of 2009, 2008, 2007, and 2006, respectively. Consumer loans as a percentage of total loans have historically been minimal (currently less than 1%).
77
Our loan terms vary according to loan type. Commercial term loans have typical maturities of three to five years and are extended to finance the purchase of business Construction loans are generally extended as a temporary financing vehicle only, and also historically represented less than 5% of our total loan portfolio. In response to the current real estate market, we have applied stricter loan underwriting policy when making loans in this category. However, construction loans increased to $71.6 million as of December 31, 2010, as compared with $48.4 million, $43.2 million, $59.4 million, and $46.3 million at the end of 2009, 2008, 2007, and 2006, respectively.
Our loan terms vary according to loan type. Commercial term loans have typical maturities of three to five years and are extended to finance the purchase of business entities, business equipment, and leasehold improvements, or to provide permanent working capital. SBA-guaranteed loans usually have longer maturities (8 to 25 years). We generally limit real estate loan maturities to five to eight years. Lines of credit, in general, are extended on an annual basis to businesses that need temporary working capital and/or import/export financing. We generally seek diversification in our loan portfolio, and our borrowers are diverse as to industry, location, and their current and target markets.
The FDIC placed Mirae Bank under receivership upon Mirae Bank's closure by the California Department of Financial Institutions at the close of business on June 26, 2009. We purchased substantially all of Mirae's assets and assumed all of Mirae's deposits and certain other liabilities. Further, we entered into a loss sharing agreement with the FDIC in connection with the Mirae acquisition. Under the loss sharing agreement, the FDIC will share in the losses on assets covered under the agreement, which generally include loans acquired from Mirae and foreclosed loan collateral existing at June 26, 2009 (referred to collectively as "covered assets"). With respect to losses of up to $83.0 million on the covered assets, the FDIC has agreed to reimburse us for 80 percent of the losses. On losses exceeding $83.0 million, the FDIC has agreed to reimburse us for 95 percent of the losses. The loss sharing agreements are subject to our compliance with servicing procedures and satisfying certain other conditions specified in the agreements with the FDIC. The term for the FDIC's loss sharing on single family loans is ten years, and the term for loss sharing on non-single family loans is five years with respect to losses and eight years with respect to loss recoveries. As a result of the loss sharing agreement with the FDIC, the Company has recorded an indemnification asset from the FDIC based on the estimated value of the indemnification agreement of $40.2 million at June 26, 2009. The total fair value of loans acquired from Mirae Bank totaled $285.7 million at June 26, 2009.
The loans in the portfolio that we purchased in the Mirae Bank acquisition are covered by the FDIC loss-share agreement and such loans are referred to herein as "covered loans." All loans other
78
than the covered loans are referred to herein as "non-covered loans." A summary of covered and non-covered loans is presented in the table below:
Covered & Non-Covered Loans
| |
(Dollars in Thousands) | ||||||||
|---|---|---|---|---|---|---|---|---|---|
| |
December 31, 2010 | December 31, 2009 | |||||||
Non-covered loans: |
|||||||||
Construction |
$ | 72,258 | $ | 48,371 | |||||
Real estate secured |
1,757,328 | 1,783,638 | |||||||
Commercial and industrial |
276,739 | 325,034 | |||||||
Consumer |
15,574 | 16,626 | |||||||
Total loans |
2,121,899 | 2,173,669 | |||||||
Unearned Income |
(4,765 | ) | (5,311 | ) | |||||
Gross loans, net of unearned income |
2,117,134 | 2,168,358 | |||||||
Allowance for losses on loans |
(108,467 | ) | (61,377 | ) | |||||
Net loans |
$ | 2,008,667 | $ | 2,106,981 | |||||
Covered loans: |
|||||||||
Construction |
$ | — | $ | — | |||||
Real estate secured |
159,699 | 196,066 | |||||||
Commercial and industrial |
49,680 | 62,409 | |||||||
Consumer |
111 | 608 | |||||||
Total loans |
$ | 209,490 | $ | 259,083 | |||||
Allowance for losses on loans |
(2,486 | ) | (753 | ) | |||||
Net loans |
$ | 207,004 | $ | 258,330 | |||||
Total loans: |
|||||||||
Construction |
$ | 72,258 | $ | 48,371 | |||||
Real estate secured |
1,917,027 | 1,979,704 | |||||||
Commercial and industrial |
326,419 | 387,443 | |||||||
Consumer |
15,685 | 17,234 | |||||||
Total loans |
2,331,389 | 2,432,752 | |||||||
Unearned Income |
(4,765 | ) | (5,311 | ) | |||||
Gross loans, net of unearned income |
2,326,624 | 2,427,441 | |||||||
Allowance for losses on loans |
(110,953 | ) | (62,130 | ) | |||||
Net loans |
$ | 2,215,671 | $ | 2,365,311 | |||||
In accordance with ASC 310-30 (formerly AICPA Statement of Position "SOP 03-3", Accounting for Certain Loans or Debt Securities Acquired in a Transfer), the covered loans were divided into "SOP 03-3 Loans" and "Non-SOP 03-3 Loans", of which SOP 03-3 loans are loans with evidence of deterioration of credit quality and that it was probable, at the time of acquisition, that the Bank will be unable to collect all contractually required payments receivable. In contrast, Non-SOP 03-3 loans are all other covered loans that do not qualify as SOP 03-3 loans. In addition, the covered loans are further categorized into four different loan pools by loan type: construction, commercial & industrial, real
79
estate secured, and consumer. The covered loans at the acquisition date of June 26, 2009 are presented in the following table:
(Dollars in Thousands)
|
SOP 03-3 Loans | Non SOP 03-3 Loans |
Total Covered Loans | |||||||
|---|---|---|---|---|---|---|---|---|---|---|
Construction |
$ | 494 | $ | — | $ | 494 | ||||
Real estate secured |
28,245 | 176,941 | 205,186 | |||||||
Commercial and industrial |
4,458 | 74,639 | 79,097 | |||||||
Consumer |
115 | 793 | 908 | |||||||
|
$ | 33,312 | $ | 252,373 | $ | 285,685 | ||||
The following table represents the carry value of SOP 03-3 and non SOP 03-3 loans acquired from Mirae Bank at December 31, 2010 and 2009:
(Dollars in Thousands)
|
December 31, 2010 | December 31, 2009 | |||||
|---|---|---|---|---|---|---|---|
Non SOP 03-3 loans |
$ | 203,701 | $ | 248,204 | |||
SOP 03-3 loans |
5,789 | 10,879 | |||||
Total outstanding balance |
209,490 | 259,083 | |||||
Allowance related to these loans |
2,486 | 753 | |||||
Carrying amount, net of allowance |
$ | 207,004 | $ | 258,330 | |||
The following table represents the current balance of SOP 03-3 acquired from Mirae Bank for which it was probable at the time of the acquisition that all of the contractually required payments would not be collected:
(Dollars in Thousands)
|
December 31, 2010 | December 31, 2009 | ||||||
|---|---|---|---|---|---|---|---|---|
Breakdown of SOP 03-3 Loans |
||||||||
Real Estate loans |
$ | 5,064 | $ | 6,881 | ||||
Commercial loans |
$ | 725 | $ | 3,998 | ||||
Loan acquired from the acquisition of Mirae Bank were discounted. Accretion of $4.0 million and $6.7 million on loans purchased at discount of $54.9 million were recorded as interest income for the year ending December 31, 2010 and December 31, 2009, respectively, as follows:
(Dollars in Thousands)
|
December 31, 2010 | December 31, 2009 | |||||
|---|---|---|---|---|---|---|---|
Beginning balance of discount on loans |
$ | 30,846 | $ | 54,964 | |||
Discount accretion income recognized |
(4,000 | ) | (6,714 | ) | |||
Disposals related to charge-offs |
(11,356 | ) | (15,829 | ) | |||
Disposals related to loan sales |
(1,933 | ) | (1,575 | ) | |||
Carrying amount, net of allowance |
$ | 13,557 | $ | 30,846 | |||
80
The following table sets forth the amount of total loans net of unearned income and the percentage distributions in each category, as of the dates indicated:
Distribution of Loans and Percentage Composition of Loan Portfolio
(Dollars in Thousands)
| |
Amount Outstanding as of December 31, | ||||||||||||||||
|---|---|---|---|---|---|---|---|---|---|---|---|---|---|---|---|---|---|
| |
2010 | 2009 | 2008 | 2007 | 2006 | ||||||||||||
Construction |
$ | 71,596 | $ | 48,371 | $ | 43,180 | $ | 59,443 | $ | 46,285 | |||||||
Real estate secured |
1,913,723 | 1,975,826 | 1,596,927 | 1,385,986 | 1,183,030 | ||||||||||||
Commercial and industrial |
325,634 | 385,958 | 387,752 | 330,052 | 278,165 | ||||||||||||
Consumer |
15,671 | 17,286 | 23,669 | 33,569 | 53,059 | ||||||||||||
Total loans, net of unearned income |
$ | 2,326,624 | $ | 2,427,441 | $ | 2,051,528 | $ | 1,809,050 | $ | 1,560,539 | |||||||
Participation loans sold and serviced by the Company |
$ | 463,889 | $ | 432,591 | $ | 314,988 | $ | 338,166 | $ | 336,652 | |||||||
Construction |
3.1 | % | 2.0 | % | 2.1 | % | 3.3 | % | 3.0 | % | |||||||
Real estate secured |
82.2 | % | 81.4 | % | 77.8 | % | 76.6 | % | 75.8 | % | |||||||
Commercial and industrial |
14.0 | % | 15.9 | % | 18.9 | % | 18.2 | % | 17.8 | % | |||||||
Consumer |
0.7 | % | 0.7 | % | 1.2 | % | 1.9 | % | 3.4 | % | |||||||
Total loans, net of unearned income |
100.0 | % | 100.0 | % | 100.0 | % | 10 0.0 | % | 100.0 | % | |||||||
The following table shows the contractual maturity distribution and repricing intervals of the outstanding loans in our portfolio as of December 31, 2010. In addition, the table shows the distribution of such loans between those with variable or floating interest rates and those with fixed or predetermined interest rates. The amounts on the table below are the gross loan balances at December 31, 2010 before netting unearned income totaling $4.8 million:
Loan Maturities and Repricing Schedule
(Dollars in Thousands)
| |
At December 31, 2010 | |||||||||||||
|---|---|---|---|---|---|---|---|---|---|---|---|---|---|---|
| |
Within One Year |
After One But Within Five Years |
After Five Years |
Total | ||||||||||
Construction |
$ | 72,258 | $ | — | $ | — | $ | 72,258 | ||||||
Real estate secured |
1,239,503 | 656,510 | 21,014 | 1,917,027 | ||||||||||
Commercial and industrial |
320,638 | 5,781 | — | 326,419 | ||||||||||
Consumer |
14,855 | 830 | — | 15,685 | ||||||||||
Total loans |
$ | 1,647,254 | $ | 663,121 | $ | 21,014 | $ | 2,331,389 | ||||||
Loans with variable (floating) interest rates |
$ | 1,310,666 | $ | — | $ | — | $ | 1,310,666 | ||||||
Loans with predetermined (fixed) interest rates |
$ | 336,588 | $ | 663,121 | $ | 21,014 | $ | 1,020,723 | ||||||
The majority of the properties that we take as collateral are located in Southern California. The loans generated by our loan production offices, which are located outside of our main geographical market, are generally collateralized by property in close proximity to those offices. We employ strict guidelines regarding the use of collateral located in less familiar market areas. Since a major real estate recession during the first part of the previous decade, property values in Southern California and around the country have generally increased in the last 10-year span from 1996 to 2006. Since late
81
2006, we have started to see below-trend growth in gross domestic product ("GDP") and a gradual decline of the real estate market in Southern California and many other areas in the country. The financial crisis worsened during the second half of 2008 and the first half of 2009 and we observed further decline in the real estate market across the nation through 2010. Nonetheless, as of year-end 2010, 82.3% of our loans are secured by first mortgages on various types of real estate. We expect to see the decline in real estate values to continue into the first half of 2011, so with the current economic conditions, no assurance can be given that property values will not decline further in 2011.
Nonperforming Assets
Nonperforming assets, or NPAs, consist of nonperforming loans, or NPLs, restructured loans, and other NPAs. NPLs are reported at their outstanding balances, net of any portion guaranteed by SBA, and consist of loans on non-accrual status and loans 90 days or more past due and still accruing interest. Restructured loans are loans of which the terms of repayment have been renegotiated, resulting in a reduction or deferral of interest or principal. Other NPAs consist of properties, mainly other real estate owned, or OREO, and repossessed vehicles, acquired by foreclosure or similar means that management intends to offer for sale. The treatment of nonperforming status for held for sale loans is the same for as other loans and are accounted for at the lower of cost or fair value.
Our continued emphasis on asset quality control enabled us to maintain a relatively low level of NPLs prior to 2007. However, the general economic condition of the U.S. as well as the local economies in which we do business have shown a gradual decline as the housing sector and GDP growth continued to show weakness in 2008 and 2009. The effect of the unfavorable economy environment on the strength of our borrowers' credit and financial status combined with deficiencies in our internal controls over financial reporting relating to loan originations caused, and our NPLs, net of SBA guaranteed portion, increased to $71.2 million at the end of 2010, as compared with $70.8 million, $15.6 million, $10.6 million, and $6.8 million at the end of 2009, 2008, 2007, and 2006, respectively. At December 31, 2010, the NPLs as a percentage of total loans was 3.06%, increased from 2.92%, 0.76%, 0.59%, and 0.44%, in 2009, 2008, 2007, and 2006, respectively.
As of December 31, 2010, we had $15.0 million as other NPAs, which comprised of eighteen OREOs, with fifteen of those foreclosed in 2010. We have listed these properties for sale or are directly selling these properties as of December 31, 2010. Among these eighteen OREOs, we have recorded $1.8 million in provisions for twelve of properties. Of the seven OREO's sold in year 2010, the Bank recorded a loss of $2.1 million. At December 31, 2009, we had $3.8 million as other NPAs, which was comprised of fifteen OREOs, with nine of those foreclosed in 2009. We have listed the properties for sale as of December 31, 2009. Among those fifteen OREOs, we have recorded $408,000 provision for five of them. Of the seven OREO's sold in year 2009, bank recorded a gain of $453,000. At December 31, 2008, we had $2.7 million as other NPAs, which was comprised of eight OREOs, with seven of those foreclosed in 2008. We have listed the properties for sale as of December 31, 2008. Among those eight OREOs, we have recorded $123,000 provision for one of them, with a total value of $446,000. The OREO was subsequently sold in February 2009 for a small gain of $7,000. At the end of 2007, the majority of our OREO was attributable to a single OREO valued at $133,000, which was foreclosed in the fourth quarter of 2007. At the end of 2006, we had a different OREO, which was subsequently sold in January 2007 at a small loss. Together with OREO and repossessed vehicles, our ratio of NPAs as a percentage of total loans and other nonperforming assets equaled 3.68%, 2.17%, 0.74%, 0.60%, and 0.45% as of December 31, 2010, 2009, 2008, 2007, and 2006, respectively.
Management believes that the reserve provided for NPAs, together with the tangible collateral, were adequate as of December 31, 2010. See "Allowance for Loan Losses and Loan Commitments" below for further discussion.
82
The following tables provide information with respect to the components of our NPAs as of the dates indicated (the figures in the table are net of the portion guaranteed by SBA, with the total amounts adjusted and reconciled for the SBA guaranteed portion for the gross NPAs):
Non-performing Assets
(Dollars in Thousands)
| |
At December 31, | ||||||||||||||||||
|---|---|---|---|---|---|---|---|---|---|---|---|---|---|---|---|---|---|---|---|
| |
2010 | 2009 | 2008 | 2007 | 2006 | ||||||||||||||
Nonaccrual loans:(1) |
|||||||||||||||||||
Construction |
$ | — | $ | — | $ | — | $ | — | $ | — | |||||||||
Real estate secured |
67,576 | 63,571 | 9,334 | 8,154 | 2,530 | ||||||||||||||
Commercial and industrial |
3,629 | 5,805 | 5,874 | 1,986 | 2,342 | ||||||||||||||
Consumer |
27 | 70 | 131 | 154 | 930 | ||||||||||||||
Total |
71,232 | 69,446 | 15,339 | 10,294 | 5,802 | ||||||||||||||
Loans 90 days or more past due and still accruing: |
|||||||||||||||||||
Real estate secured |
— | 1,317 | — | 117 | 208 | ||||||||||||||
Commercial and industrial |
— | — | 213 | 4 | 839 | ||||||||||||||
Consumer |
— | 19 | — | 187 | — | ||||||||||||||
Total |
— | 1,336 | 213 | 308 | 1,047 | ||||||||||||||
Total nonperforming loans(2) |
71,232 | 70,782 | 15,552 | 10,602 | 6,849 | ||||||||||||||
Repossessed vehicles |
— | — | — | 50 | 95 | ||||||||||||||
Other real estate owned |
14,983 | 3,797 | 2,663 | 133 | 138 | ||||||||||||||
Total nonperforming assets, net of SBA guarantee |
86,215 | 74,579 | 18,215 | 10,785 | 7,082 | ||||||||||||||
Guaranteed portion of nonperforming SBA loans |
34,687 | 18,514 | 7,158 | 4,424 | 4,266 | ||||||||||||||
Total gross nonperforming assets |
$ | 120,902 | $ | 93,093 | $ | 25,373 | $ | 15,209 | $ | 11,348 | |||||||||
Performing troubled debt restructurings |
$ | 48,746 | $ | 64,612 | $ | 2,161 | $ | — | $ | — | |||||||||
Total loans |
$ | 2,326,624 | $ | 2,427,441 | $ | 2,051,529 | $ | 1,809,050 | $ | 1,560,539 | |||||||||
Nonperforming loans as a percentage of total loans |
3.06 | % | 2.92 | % | 0.76 | % | 0.59 | % | 0.44 | % | |||||||||
Nonperforming assets, net of SBA guarantee, as a percentage of total loans and other nonperforming assets |
3.68 | % | 3.07 | % | 0.89 | % | 0.60 | % | 0.45 | % | |||||||||
Allowance for loan losses as a percentage of nonperforming loans |
155.76 | % | 87.78 | % | 189.27 | % | 203.55 | % | 272.38 | % | |||||||||
- (1)
- During
the fiscal year ended December 31, 2010, no interest income related to these loans was included in net income. Additional
interest income of approximately $9.6 million would have been recorded during the year ended December 31, 2010, if these loans had been paid in accordance with their original terms and
had been outstanding throughout the fiscal year ended December 31, 2010 or, if not outstanding throughout the fiscal year ended December 31, 2010, since origination.
- (2)
- During the fiscal year ended December 31, 2010, no interest income related to this loan was included in net income. Additional interest income would be negligible during the year ended December 31, 2010, if this loan had been paid in accordance with its original term and had been outstanding throughout the fiscal year ended December 31, 2010.
83
Allowance for Loan Losses and Loan Commitments
Based on the credit risk inherent in our lending business, we set aside allowances through charges to earnings. Such charges were not only made for the outstanding loan portfolio, but also for off-balance sheet loan commitments, such as commitments to extend credit or letters of credit. Charges made for the outstanding loan portfolio were credited to the allowance for loan losses, whereas charges related to loan commitments were credited to the reserve for loan commitments, which is presented as a component of other liabilities. The provision for losses on loans and loan commitments is discussed in the section entitled "Provision for Loan Losses and Provision for Loan Commitments" above.
The allowance for loan losses is made up of 2 components, specific valuation allowance or "SVA" (allowance on impaired loans that are individually evaluated) and general valuation allowance or "GVA" (loans that are evaluated as pools based on historical experience and also qualitative adjustments which are used to estimate losses not captured by historical experience). Historical loss experience used to calculate GVA may not accurately capture true credit losses and trends and therefore management performed a review of the historical loss rates used in GVA as well as the qualitative adjustment "QA" methodology due to the increased significance of QA when estimating losses in the current economic environment.
To establish an adequate allowance, we must be able to recognize when loans have become a problem. A risk grade of either pass, special mention, substandard, or doubtful, is assigned to every loan in the loan portfolio, with the exception of Home Mortgage Loans and Automobile Loans, i.e. Homogeneous Loan. The following is a brief description of the loan classification or risk grade used in our allowance calculation:
Pass Loans—Loan is not past due more than 30 days with no credit deterioration. The financial condition of the borrower is sound as well as the status of any collateral. Loans secured by cash (principal and interest) also fall within this classification.
Special Mention—Loans where there is evidence to suggest there is credit weakness with the potential for deterioration or loans with the potential to deteriorate with market conditions.
Substandard—Loans were credit weakness exists and past due at greater than 89 days. Source of repayment has been compromised and the potential for future losses or charge-offs exist.
Doubtful—Loans in which the collection of debt is unlikely and the possibility of a loss is high but not remote.
We currently use a migration analysis to determine allowance for loan losses and use software program to produce historical loss rates used in GVA estimations. A QA matrix is also used to estimate losses not captured by historical experience. For impaired loans, or SVA allowance, we evaluates loans on an individual basis to determine impairment in accordance with general accepted accounting principles or "GAAP". All these components are added together for a final allowance for loan losses figure on a quarterly basis.
Net charge-offs in 2010 increased to $105.6 million compared to $35.5 million in 2009. Nonetheless, the net charge-offs in 2010 were much higher compared to the previous years due to the large amount of note sales transactions in 2010 and the discovery of a material weakness in our internal controls related to loan originations and underwriting, in addition to the weak business climate adversely impacted the financial condition of a number of our clients. The net charge-offs in 2010 were comprised of $89.9 million of real estate secured net loan charge-offs, $15.6 million of commercial and industrial loans net charge-offs, and $123,000 of consumer loan net charge-offs. The $105.6 million in net charge-offs represents 4.33% of average total loans in 2010, as compared with 1.57%, 0.26%, 0.66%, and 0.13%, in 2009 2008, 2007, and 2006, respectively.
84
In order to keep pace with the increase of NPLs and the size of our loan portfolio, we increased our allowance for loan losses by 78.6%, or $48.8 million, to $111.0 million at December 31, 2010, as compared with $62.1 million at December 31, 2009. Before that, allowances were $29.4 million, $21.6 million, and $18.7 million, at December 31, 2008, 2007, and 2006, respectively. With the continued increase of the allowance for loan losses and loan commitments in recent years, we were able to maintain the adequate ratio of allowance for loan losses to total loans at 4.77%, 2.56%, 1.43%, 1.19%, and 1.20% at the end of 2010, 2009, 2008, 2007, and 2006, respectively.
Although management believes our allowance at December 31, 2010 was adequate to absorb losses from any known and inherent risks in the portfolio, no assurance can be given that economic conditions which adversely affect our service areas or other variables will not result in further increased losses in the loan portfolio in the future.
Information on impaired loans is listed in the following table for December 31, 2010 and December 31, 2009:
| |
At December 31, | |||||||
|---|---|---|---|---|---|---|---|---|
(Dollars in Thousands)
|
2010 | 2009 | ||||||
With Specific Reserves |
||||||||
Without Charge-Offs |
$ | 77,076 | $ | 80,758 | ||||
With Charge-Offs |
50,008 | 6,064 | ||||||
Without Specific Reserves |
||||||||
Without Charge-Offs |
19,692 | 70,248 | ||||||
With Charge-Offs |
60,225 | 28,362 | ||||||
Allowance on Impaired Loans |
(14,031 | ) | (13,925 | ) | ||||
Impaired Loans Net of Allowance |
$ | 192,970 | $ | 171,507 | ||||
Average Impaired Loans |
$ | 211,711 | $ | 186,076 | ||||
- *
- Impaired loans at December 31, 2010 and December 31, 2009 had SBA guarantee portion and discount on acquired loans totaling $87.0 million and $60.6 million, respectively.
85
The table below summarizes, for the years indicated, loan balances at the end of each period, the daily averages during the period, changes in the allowance for loan losses and loan commitments arising from loans charged off, recoveries on loans previously charged off, additions to the allowance and certain ratios related to the allowance for loan losses and loan commitments:
Allowance for Loan Losses and Loan Commitments
(Dollars in Thousands)
| |
2010 | 2009 | 2008 | 2007 | 2006 | ||||||||||||
|---|---|---|---|---|---|---|---|---|---|---|---|---|---|---|---|---|---|
Balances: |
|||||||||||||||||
Allowance for loan losses: |
|||||||||||||||||
Balances at beginning of year |
$ | 62,130 | $ | 29,437 | $ | 21,579 | $ | 18,654 | $ | 13,999 | |||||||
Actual charge-offs: |
|||||||||||||||||
Real estate secured |
90,976 | 11,231 | 1,070 | 785 | 138 | ||||||||||||
Commercial and industrial |
17,986 | 24,820 | 5,174 | 8,752 | 883 | ||||||||||||
Consumer |
267 | 692 | 903 | 1,734 | 1,141 | ||||||||||||
Total charge-offs |
109,229 | 36,743 | 7,147 | 11,271 | 2,162 | ||||||||||||
Recoveries on loans previously charged off |
|||||||||||||||||
Real estate secured |
1,073 | — | — | — | 146 | ||||||||||||
Commercial and industrial |
2,393 | 1,112 | 1,927 | 119 | 148 | ||||||||||||
Consumer |
144 | 140 | 213 | 204 | 26 | ||||||||||||
Total recoveries |
3,610 | 1,252 | 2,140 | 323 | 320 | ||||||||||||
Net loan charge-offs |
105,619 | 35,491 | 5,007 | 10,948 | 1,842 | ||||||||||||
FDIC Indemnification |
5,053 | 856 | — | — | — | ||||||||||||
Provision for losses on loan and loan commitments |
149,389 | 67,328 | 12,865 | 13,873 | 6,497 | ||||||||||||
Balances at end of year |
$ | 110,953 | $ | 62,130 | $ | 29,437 | $ | 21,579 | $ | 18,654 | |||||||
Allowance for loan commitments: |
|||||||||||||||||
Balances at beginning of year |
$ | 2,515 | $ | 1,243 | $ | 1,998 | $ | 891 | $ | 779 | |||||||
Provision for losses (recapture) on loan commitments |
1,411 | 1,272 | (755 | ) | 1,107 | 112 | |||||||||||
Balance at end of year |
$ | 3,926 | $ | 2,515 | $ | 1,243 | $ | 1,998 | $ | 891 | |||||||
Ratios: |
|||||||||||||||||
Net loan charge-offs to average total loans |
4.33 | % | 1.57 | % | 0.26 | % | 0.66 | % | 0.13 | % | |||||||
Allowance for loan losses to total loans at end of year |
4.77 | % | 2.56 | % | 1.43 | % | 1.19 | % | 1.20 | % | |||||||
Net loan charge-offs to allowance for loan losses at end of year |
95.19 | % | 57.12 | % | 17.01 | % | 50.73 | % | 9.88 | % | |||||||
Net loan charge-offs to provision for losses on loans and loan commitments |
23.54 | % | 51.74 | % | 41.35 | % | 73.08 | % | 30.70 | % | |||||||
86
Impairment balances with specific reserve and those without specific reserves as of December 31, 2010 and December 31, 2009 are listed in the following table by loan type:
| |
December 31, 2010 | |||||||||||
|---|---|---|---|---|---|---|---|---|---|---|---|---|
(Dollars In Thousands)
|
Unpaid Principal Balance* |
Related Allowance |
Average Balance |
|||||||||
With Specific Reserves |
||||||||||||
Commercial Real Estate |
||||||||||||
Gas Station |
$ | 9,985 | $ | 1,112 | $ | 9,985 | ||||||
Carwash |
20,580 | 2,197 | 20,626 | |||||||||
Hotel/Motel |
16,669 | 323 | 18,295 | |||||||||
Land |
2,211 | 433 | 2,212 | |||||||||
Other |
33,713 | 909 | 33,499 | |||||||||
Residential Real Estate |
2,773 | 142 | 2,777 | |||||||||
Construction |
— | — | — | |||||||||
SBA Real Estate |
21,687 | 590 | 21,766 | |||||||||
SBA Commercial |
10,379 | 2,115 | 10,663 | |||||||||
Commercial |
9,087 | 6,210 | 9,472 | |||||||||
Consumer/Other |
— | — | — | |||||||||
Total With Related Allowance |
127,084 | 14,031 | 129,295 | |||||||||
Without Specific Reserves |
||||||||||||
Commercial Real Estate |
||||||||||||
Gas Station |
8,942 | — | 8,961 | |||||||||
Carwash |
6,119 | — | 6,123 | |||||||||
Hotel/Motel |
2,441 | — | 2,443 | |||||||||
Land |
16,066 | — | 16,066 | |||||||||
Other |
23,148 | — | 24,451 | |||||||||
Residential Real Estate |
4,790 | — | 4,816 | |||||||||
Construction |
— | — | — | |||||||||
SBA Real Estate |
17,260 | — | 18,181 | |||||||||
SBA Commercial |
651 | — | 871 | |||||||||
Commercial |
500 | — | 503 | |||||||||
Consumer/Other |
— | — | — | |||||||||
Total Without Related Allowance |
79,917 | — | 82,415 | |||||||||
Total |
$ | 207,001 | $ | 14,031 | $ | 211,710 | ||||||
- *
- Recorded investment adjustment is deemed not material in this presentation
87
| |
December 31, 2009 | |||||||||||
|---|---|---|---|---|---|---|---|---|---|---|---|---|
(Dollars In Thousands)
|
Unpaid Principal Balance |
Related Allowance |
Average Balance |
|||||||||
With Specific Reserves |
||||||||||||
Commercial Real Estate |
||||||||||||
Gas Station |
$ | 3,964 | $ | 33 | $ | 3,970 | ||||||
Carwash |
13,030 | 3,078 | 13,039 | |||||||||
Hotel/Motel |
7,104 | 472 | 7,126 | |||||||||
Land |
— | — | — | |||||||||
Other |
36,233 | 5,699 | 36,255 | |||||||||
Residential Real Estate |
503 | 155 | 506 | |||||||||
Construction |
— | — | — | |||||||||
SBA Real Estate |
19,317 | 1,625 | 19,357 | |||||||||
SBA Commercial |
4,077 | 901 | 4,137 | |||||||||
Commercial |
2,594 | 1,963 | 2,469 | |||||||||
Consumer/Other |
— | — | — | |||||||||
Total With Related Allowance |
86,822 | 13,926 | 86,859 | |||||||||
Without Specific Reserves |
||||||||||||
Commercial Real Estate |
||||||||||||
Gas Station |
13,056 | — | 13,061 | |||||||||
Carwash |
1,633 | — | 1,633 | |||||||||
Hotel/Motel |
20,228 | — | 20,244 | |||||||||
Land |
8,193 | — | 8,452 | |||||||||
Other |
31,546 | — | 31,573 | |||||||||
Residential Real Estate |
6,578 | — | 7,054 | |||||||||
Construction |
— | — | — | |||||||||
SBA Real Estate |
12,251 | — | 12,297 | |||||||||
SBA Commercial |
3,217 | — | 3,223 | |||||||||
Commercial |
1,908 | — | 1,681 | |||||||||
Consumer/Other |
— | — | — | |||||||||
Total Without Related Allowance |
98,610 | — | 99,218 | |||||||||
Total |
$ | 185,432 | $ | 13,926 | $ | 186,076 | ||||||
- *
- Recorded investment adjustment is deemed not material in this presentation
88
Delinquent loans by days past due as of December 31, 2010 and December 31, 2009 are presented in the following table by loan type:
| |
December 31, 2010 | ||||||||||||||
|---|---|---|---|---|---|---|---|---|---|---|---|---|---|---|---|
(Dollars In Thousands)
|
30 - 59 Days Past Due |
60 - 89 Days Past Due |
Greater Than 90 Days Past Due |
Total Past Due | |||||||||||
Commercial Real Estate |
|||||||||||||||
Gas Station |
$ | 5,237 | $ | 4,730 | $ | 5,275 | $ | 15,242 | |||||||
Carwash |
4,535 | 1,344 | 2,919 | 8,799 | |||||||||||
Hotel/Motel |
5,819 | 2,564 | 1,625 | 10,008 | |||||||||||
Land |
281 | 573 | 9,948 | 10,802 | |||||||||||
Other |
3,044 | 6,114 | 15,446 | 24,604 | |||||||||||
Residential Real Estate |
602 | 3,446 | 3,542 | 7,590 | |||||||||||
Construction |
— | — | — | — | |||||||||||
SBA Real Estate |
1,808 | 1,807 | 1,744 | 5,358 | |||||||||||
SBA Commercial |
1,188 | 716 | 25 | 1,929 | |||||||||||
Commercial |
937 | 932 | 2,106 | 3,975 | |||||||||||
Consumer/Other |
41 | 5 | 27 | 72 | |||||||||||
Total |
$ | 23,491 | $ | 22,231 | $ | 42,657 | $ | 88,379 | |||||||
Non-Accrual Loans Listed Above |
$ | 3,596 | $ | 7,658 | $ | 42,656 | $ | 53,910 | |||||||
| |
December 31, 2009 | ||||||||||||||
|---|---|---|---|---|---|---|---|---|---|---|---|---|---|---|---|
(Dollars In Thousands)
|
30 - 59 Days Past Due |
60 - 89 Days Past Due |
Greater Than 90 Days Past Due |
Total Past Due | |||||||||||
Commercial Real Estate |
|||||||||||||||
Gas Station |
$ | 5,036 | $ | 1,226 | $ | 7,368 | $ | 13,631 | |||||||
Carwash |
7,338 | 4,687 | 5,030 | 17,055 | |||||||||||
Hotel/Motel |
3,156 | 1,263 | 4,791 | 9,210 | |||||||||||
Land |
355 | — | 7,848 | 8,203 | |||||||||||
Other |
9,722 | 2,620 | 18,656 | 30,998 | |||||||||||
Residential Real Estate |
3,839 | — | 2,795 | 6,634 | |||||||||||
Construction |
— | — | — | — | |||||||||||
SBA Real Estate |
936 | 2,621 | 3,497 | 7,055 | |||||||||||
SBA Commercial |
1,085 | 476 | 863 | 2,423 | |||||||||||
Commercial |
2,384 | 2,099 | 3,234 | 7,715 | |||||||||||
Consumer/Other |
135 | 54 | 66 | 256 | |||||||||||
Total |
$ | 33,986 | $ | 15,046 | $ | 54,148 | $ | 103,180 | |||||||
Non-Accrual Loans Listed Above |
$ | 5,463 | $ | 4,265 | $ | 52,811 | $ | 62,539 | |||||||
- *
- Balances are net of SBA guaranteed portions.
89
Loans with classification of special mention, substandard, and doubtful at December 31, 2010 and December 31, 2009 are presented in the following table by loan type:
| |
December 31, 2010 | |||||||||||||
|---|---|---|---|---|---|---|---|---|---|---|---|---|---|---|
(Dollars In Thousands)
|
Special Mention | Substandard | Doubtful | Total | ||||||||||
Commercial Real Estate |
||||||||||||||
Gas Station |
$ | 12,952 | $ | 21,591 | $ | 531 | $ | 35,074 | ||||||
Carwash |
6,618 | 27,925 | 802 | 35,345 | ||||||||||
Hotel/Motel |
33,001 | 50,716 | 0 | 83,717 | ||||||||||
Land |
6,035 | 7,605 | 4,888 | 18,528 | ||||||||||
Other |
38,067 | 82,549 | 7,140 | 127,756 | ||||||||||
Residential Real Estate |
904 | 6,988 | — | 7,892 | ||||||||||
Construction |
— | 20,597 | — | 20,597 | ||||||||||
SBA Real Estate |
2,830 | 9,431 | 244 | 12,505 | ||||||||||
SBA Commercial |
2,530 | 3,210 | 374 | 6,114 | ||||||||||
Commercial |
11,517 | 16,476 | 221 | 28,214 | ||||||||||
Consumer/Other |
4,107 | 31 | 27 | 4,165 | ||||||||||
Total |
$ | 118,561 | $ | 247,119 | $ | 14,227 | $ | 379,907 | ||||||
| |
December 31, 2009 | |||||||||||||
|---|---|---|---|---|---|---|---|---|---|---|---|---|---|---|
| |
Special Mention | Substandard | Doubtful | Total | ||||||||||
Commercial Real Estate |
||||||||||||||
Gas Station |
$ | 24,748 | $ | 26,066 | $ | 531 | $ | 51,345 | ||||||
Carwash |
29,017 | 11,808 | — | 40,825 | ||||||||||
Hotel/Motel |
37,735 | 54,655 | 552 | 92,942 | ||||||||||
Land |
1,663 | 23,319 | — | 24,982 | ||||||||||
Other |
93,418 | 129,104 | 937 | 223,459 | ||||||||||
Residential Real Estate |
503 | 6,381 | — | 6,884 | ||||||||||
Construction |
5,421 | — | — | 5,421 | ||||||||||
SBA Real Estate |
3,508 | 13,777 | 1,630 | 18,915 | ||||||||||
SBA Commercial |
3,516 | 2,727 | 368 | 6,611 | ||||||||||
Commercial |
21,096 | 21,890 | 48 | 43,034 | ||||||||||
Consumer/Other |
482 | 616 | 103 | 1,201 | ||||||||||
Total |
$ | 221,107 | $ | 290,343 | $ | 4,169 | $ | 515,619 | ||||||
- *
- Balances are net of SBA guaranteed portions
90
The table below summarizes, for the periods indicated, the balance of the allowance for loan losses and the percentage of such balance for each type of loan as of the dates indicated:
Distribution and Percentage Composition of Allowance for Loan Losses
| |
Amount Outstanding as of December 31, | ||||||||||||||||
|---|---|---|---|---|---|---|---|---|---|---|---|---|---|---|---|---|---|
| |
2010 | 2009 | 2008 | 2007 | 2006 | ||||||||||||
| |
(Dollars in Thousands) |
||||||||||||||||
Applicable to: |
|||||||||||||||||
Construction |
$ | 7,262 | $ | 411 | $ | 190 | $ | 557 | $ | 352 | |||||||
Real estate secured |
79,441 | 34,458 | 11,628 | 13,445 | 9,933 | ||||||||||||
Commercial and industrial |
24,069 | 27,059 | 17,209 | 7,023 | 7,164 | ||||||||||||
Consumer |
181 | 202 | 410 | 554 | 1,205 | ||||||||||||
Total Allowance |
$ | 110,953 | $ | 62,130 | $ | 29,437 | $ | 21,579 | $ | 18,654 | |||||||
Construction |
6.55 | % | 0.66 | % | 0.65 | % | 2.58 | % | 1.89 | % | |||||||
Real estate secured |
71.60 | % | 55.46 | % | 39.50 | % | 62.30 | % | 53.24 | % | |||||||
Commercial and industrial |
21.69 | % | 43.55 | % | 58.46 | % | 32.55 | % | 38.41 | % | |||||||
Consumer |
0.16 | % | 0.33 | % | 1.39 | % | 2.57 | % | 6.46 | % | |||||||
Total Allowance |
100.00 | % | 100.00 | % | 100.00 | % | 100.00 | % | 100.00 | % | |||||||
The following tables table is breakdown of the allowance for loan losses at December 31, 2010 by loan type:
| |
Commercial Real Estate Loans | |
|
|
|
|
|
|
|||||||||||||||||||||||||||||
|---|---|---|---|---|---|---|---|---|---|---|---|---|---|---|---|---|---|---|---|---|---|---|---|---|---|---|---|---|---|---|---|---|---|---|---|---|---|
| |
Residential Real Estate | |
SBA Real Estate |
|
|
|
|
||||||||||||||||||||||||||||||
(Dollars In Thousands)
|
Gas Station | Carwash | Hotel/Motel | Land | Other | Construction | SBA Commercial | Commercial | Consumer/ Other | Total | |||||||||||||||||||||||||||
Balances at beginning of year |
$ | 2,109 | $ | 3,835 | $ | 4,631 | $ | 1,202 | $ | 18,329 | $ | 806 | $ | 411 | $ | 3,535 | $ | 5,425 | $ | 21,615 | $ | 232 | $ | 62,130 | |||||||||||||
Total Charge-Off |
4,363 | 6,585 | 18,473 | 11,045 | 44,968 | 1,829 | 401 | 3,314 | 2,902 | 15,080 | 266 | 109,226 | |||||||||||||||||||||||||
Total recoveries |
82 | — | 11 | — | 200 | 45 | 5 | 719 | 421 | 1,981 | 143 | 3,607 | |||||||||||||||||||||||||
FDIC Indemnification |
432 | 529 | 130 | — | (79 | ) | — | — | 373 | 290 | 3,313 | 65 | 5,053 | ||||||||||||||||||||||||
Provision For Loan Losses |
5,673 | 8,440 | 32,784 | 12,481 | 66,305 | 3,594 | 7,247 | 618 | 2,116 | 10,124 | 7 | 149,389 | |||||||||||||||||||||||||
Balance At December 31st |
$ | 3,933 | $ | 6,219 | $ | 19,083 | $ | 2,638 | $ | 39,787 | $ | 2,616 | $ | 7,262 | $ | 1,931 | $ | 5,350 | $ | 21,953 | $ | 181 | $ | 110,953 | |||||||||||||
The table below presents the breakdown of allowance by specific valuation and general valuation allowance at December 31, 2010:
| |
Commercial Real Estate Loans | |
|
|
|
|
|
|
|||||||||||||||||||||||||||||
|---|---|---|---|---|---|---|---|---|---|---|---|---|---|---|---|---|---|---|---|---|---|---|---|---|---|---|---|---|---|---|---|---|---|---|---|---|---|
| |
Residential Real Estate | |
SBA Real Estate |
|
|
|
|
||||||||||||||||||||||||||||||
(Dollars In Thousands)
|
Gas Station | Carwash | Hotel/Motel | Land | Other | Construction | SBA Commercial | Commercial | Consumer/ Other | Total | |||||||||||||||||||||||||||
Impaired Loans |
$ | 18,927 | $ | 26,699 | $ | 19,109 | $ | 18,277 | $ | 56,862 | $ | 7,563 | — | $ | 38,947 | $ | 11,030 | $ | 9,587 | — | $ | 207,001 | |||||||||||||||
Specific Allowance |
$ | 1,112 | $ | 2,197 | $ | 323 | $ | 433 | $ | 909 | $ | 142 | — | $ | 590 | $ | 2,115 | $ | 6,210 | — | $ | 14,031 | |||||||||||||||
Loss Coverage Ratio |
5.88 | % | 8.23 | % | 1.69 | % | 2.37 | % | 1.60 | % | 1.88 | % | 0.00 | % | 1.51 | % | 19.17 | % | 64.78 | % | 0.00 | % | 6.78 | % | |||||||||||||
Non-Impaired Loans |
$ | 85,384 | $ | 63,457 | $ | 209,907 | $ | 25,320 | $ | 1,108,027 | $ | 78,256 | $ | 72,258 | $ | 63,768 | $ | 28,042 | $ | 207,797 | $ | 7,227 | $ | 1,949,443 | |||||||||||||
General Valuation Allowance |
$ | 2,820 | $ | 4,022 | $ | 18,760 | $ | 2,205 | $ | 38,881 | $ | 2,474 | $ | 7,262 | $ | 1,341 | $ | 3,235 | $ | 15,741 | $ | 181 | $ | 96,922 | |||||||||||||
Loss Coverage Ratio |
3.30 | % | 6.34 | % | 8.94 | % | 8.71 | % | 3.51 | % | 3.16 | % | 0.00 | % | 2.10 | % | 11.54 | % | 7.58 | % | 0.00 | % | 4.97 | % | |||||||||||||
Total Loans |
$ | 104,311 | $ | 90,156 | $ | 229,016 | $ | 43,597 | $ | 1,164,889 | $ | 85,819 | $ | 72,258 | $ | 102,715 | $ | 39,072 | $ | 217,384 | $ | 7,227 | $ | 2,156,444 | |||||||||||||
Total Allowance For Loan Losses |
$ | 3,932 | $ | 6,219 | $ | 19,083 | $ | 2,638 | $ | 39,790 | $ | 2,616 | $ | 7,262 | $ | 1,931 | $ | 5,350 | $ | 21,951 | $ | 181 | $ | 110,953 | |||||||||||||
Loss Coverage Ratio |
3.77 | % | 6.90 | % | 8.33 | % | 6.05 | % | 3.42 | % | 3.05 | % | 0.00 | % | 1.88 | % | 13.69 | % | 10.10 | % | 0.00 | % | 5.15 | % | |||||||||||||
A restructuring of a debt constitutes a troubled debt restructuring ("TDR") if the Company for economic or legal reasons related to the borrower's financial difficulties grants a concession to the borrower that it would not otherwise consider. Restructured loans typically present an elevated level of credit risk as the borrowers are not able to perform according to the original contractual terms. Loans that are reported as TDRs are considered impaired and measured for impairment. At December 31,
91
2010 and 2009, all of our TDR were performing based on their modified terms. The following table summarizes TDR balances for December 31, 2010 and 2009:
(Dollars in Thousands)
|
2010 | 2009 | ||||||
|---|---|---|---|---|---|---|---|---|
Construction |
$ | — | $ | — | ||||
Real Estate Secured |
43,302 | 63,589 | ||||||
Commercial & Industrial |
5,444 | 1,023 | ||||||
Consumer |
— | — | ||||||
TOTAL PERFORMING TDRS |
$ | 48,746 | $ | 39,761 | ||||
Contractual Obligations
The following table represents our aggregate contractual obligations (principal and interest) to make future payments as of December 31, 2010:
(Dollars in Thousands)
|
One Year or Less |
Over One Year To Three Years |
Over Three Years To Five Years |
Over Five Years |
Indeterminate Maturity |
Total | |||||||||||||
|---|---|---|---|---|---|---|---|---|---|---|---|---|---|---|---|---|---|---|---|
FHLB borrowings |
$ | 136,924 | $ | — | $ | — | $ | — | $ | — | $ | 136,924 | |||||||
Junior subordinated debentures(1) |
376 | 10,709 | — | 77,321 | — | 88,406 | |||||||||||||
Operating leases |
3,600 | 6,208 | 5,008 | 5,122 | — | 19,938 | |||||||||||||
Unrecognized tax benefit |
— | — | — | — | 657 | 657 | |||||||||||||
Time deposits |
1,126,860 | 103,012 | 19 | — | — | 1,229,891 | |||||||||||||
Total |
$ | 1,267,760 | $ | 119,929 | $ | 5,027 | $ | 82,443 | $ | 657 | $ | 1,475,816 | |||||||
- (1)
- See detailed disclosure of junior subordinated debentures, including interest rates, in the following subsection "Junior Subordinated Debenture; Trust Preferred Securities."
Off-Balance Sheet Arrangements
During the ordinary course of business, we provide various forms of credit lines to meet the financing needs of our customers. These commitments, which represent a credit risk to us, are not represented in any form on our balance sheets.
As of December 31, 2010, 2009, and 2008, we had commitments to extend credit of $257.8 million, $238.2 million, and $153.4 million, respectively. Obligations under standby letters of credit were $15.8 million, $13.1 million, and $12.7 million for 2010, 2009, and 2008, respectively, and the obligations under commercial letters of credit were $5.4 million, $10.2 million, and $15.1 million, respectively, for the same periods.
The effect on our revenues, expenses, cash flows and liquidity from the unused portion of the commitments to provide credit cannot be reasonably predicted because there is no guarantee that the lines of credit will be used.
In the normal course of business, we are involved in various legal claims. We have reviewed all legal claims against us with counsel and have taken into consideration the views of counsel as to the outcome of the claims. In our opinion, the final disposition of all such claims will not have a material adverse effect on our financial position and results of operations.
The Company has invested in certain limited partnerships that were formed to develop and operate apartment complexes designed as high-quality affordable housing for lower income tenants throughout the United States. As of December 31, 2010, the Company had eleven investments, with a net carrying value of $16.3 million. Commitments to fund investments in affordable housing
92
partnerships totaled $12.0 million at December 31, 2010 with the last of the commitments ending in 2015.
Other Earning Assets
For various business purposes, we make investments in earning assets other than the interest-earning assets discussed above. Before 2003, the only other earning assets held by us were insignificant amounts of Federal Home Loan Bank stock and the cash surrender value of the BOLI.
In an effort to provide additional benefits aimed at retaining key employees, while generating a tax-exempt noninterest income stream, we purchased $10.5 million and $3.0 million in BOLI during 2003 and 2005, respectively, from insurance carriers rated AA or above. In 2008 and 2009, we purchased $532,000 and $96,000 more in BOLI from the same insurance carriers. We are the owner and the primary beneficiary of the life insurance policies and recognize the increase of the cash surrender value of the policies as tax-exempt other income.
In 2003, we also invested in several low-income housing tax credit funds ("LIHTCF") to promote our participation in CRA activities. We committed to invest, over two to three years, a total of $3 million to two different LIHTCF—$1 million in Apollo California Tax Credit Fund XXII, LP, and $2 million in Hudson Housing Los Angeles Revitalization Fund, LP. In 2006, in order to promote our CRA activities in each of the assessment areas in Dallas, New York, and Los Angeles, we also committed to invest additional $1 million, $2 million, and $3 million in WNC Institutional Tax Credit Fund XXI, WNC Institutional Tax Credit Fund X New York Series 7, and WNC Institutional Tax Credit Fund X California Series 6, respectively. We then made $4 million additional commitment to invest in Hudson Housing Los Angeles Revitalization Fund IV LP in 2007. We receive the returns on these investments, over the fifteen years following the said two to three-year investment periods in the form of tax credits and tax deductions. In 2008, we committed to invest $3 million in WNC Institutional Tax Credit Fund X New York Series 9 in order to promote our CRA activities in the assessment area in New York and $3 million in WNC Institutional Tax Credit Fund 26 in order to promote our CRA activities in the assessment area in Dallas. In 2009, we committed to invest $5 million in NHT 28 Tax Credit Fund and $5 million in Enterprise Green Communities West Fund in order to promote our CRA activities in the assessment area in Los Angeles, California. In 2010, we committed to invest $4.9 million Milan Town Homes in order to promote our CRA activities in the assessment area of Los Angeles, California.
As collateral for our FHLB borrowings, we are required by FHLB to invest in FHLB stock. In 2010, our total investment in FHLB stock was reduced by $2.3 million. We received no stock dividends from FHLB but dividends were received in the form of cash from our FHLB stock holdings amounting to $43,000 in 2009. Therefore, the total asset value of the FHLB stock increased $3.3 million to $20.9 million as of year-end 2009 from $17.5 million in the prior year.
The balances of other earning assets as of December 31, 2010 and December 31, 2009 were as follows:
(Dollars in Thousands)
|
Balance as of December 31, 2010 |
Balance as of December 31, 2009 |
|||||
|---|---|---|---|---|---|---|---|
Type |
|||||||
BOLI |
$ | 18,662 | $ | 18,037 | |||
LIHTCF |
28,186 | 13,732 | |||||
Federal Home Loan Bank Stock |
18,531 | 20,850 | |||||
93
Deposits and Other Sources of Funds
Deposits
Deposits are our primary source of funds. Total deposits at December 31, 2010, 2009, and 2008 were $2.5 billion, $2.8 billion, and $1.81 billion, respectively, representing a decrease of $367.3 million, or 13.0%, in 2010, and an increase of $1.1 billion, or 56.0%, in 2009 from the previous year. The average deposits for the years ended December 31, 2010, 2009, and 2008 were $2.8 billion, $2.3 billion, and $1.74 billion, respectively. The average total deposit balances increased 22.3% or $511.4 million in 2010 and 31.6% or $551.3 million in 2009.
The increase in deposits in 2009 and 2010 is a result of the acquisition of Mirae Bank, the inflow of deposits from peer institutions, and the due to our expansion in the East Coast region of our operations. Deposits acquired from Mirae Bank totaled $293.4 million at the time of the acquisition in June 2009. As a result of the acquisition, we experienced a large inflow of deposits due to customers' perception of our financial strength. However, during the third and fourth quarter of 2010 we used our liquidity to reduce higher costing non-core deposits letting them mature and not renewing at high rates and focused on increasing non-interest bearing demand deposits. This reduced overall deposits, but the effect has not yet been fully realized in averaged deposits for 2010.
After 2004, our niche market depositor's preference in time deposits bearing relatively high interest rates decreased the level of deposits in transactional accounts and we increased our reliance on time deposits to fund our loan growth. Due to our efforts in controlling the growth of expensive time deposits, the percentage of the average time deposits divided by average total deposits decreased to 49.9% in 2010 from 56.7% in 2009 and 56.4% for 2008. The slight increase from 2008 to 2009 is due to growth in time deposits less than $100,000, which are considered as core deposits. This trend was evident again in 2010 with jumbo time deposits (time deposits with balances of $100,000 or greater) continuing to decrease while other time deposits increased. We will continue to promote our core-deposit campaign in order to achieve the assigned core deposit goals and to reduce our level of time deposit reliance going forward.
The average rate paid on time deposits in denominations of $100,000 or more decreased to 1.39% in 2010 as compared with 2.45% in 2009, which previously decreased from 3.27% in 2008. Please see "Net Interest Income and Net Interest Margin" for further discussions.
The following tables summarize the distribution of average daily deposits and the average daily rates paid for the years indicated:
| |
For the Years Ended December 31, | ||||||||||||||||||
|---|---|---|---|---|---|---|---|---|---|---|---|---|---|---|---|---|---|---|---|
| |
2010 | 2009 | 2008 | ||||||||||||||||
| |
Average Balance | Average Rate | Average Balance | Average Rate | Average Balance | Average Rate | |||||||||||||
| |
(Dollars in Thousands) |
||||||||||||||||||
Demand, noninterest-bearing |
$ | 427,388 | — | $ | 333,568 | — | $ | 298,163 | — | ||||||||||
Money market |
880,618 | 1.33 | % | 584,054 | 2.37 | % | 402,323 | 3.27 | % | ||||||||||
Super NOW |
22,104 | 0.44 | % | 20,546 | 0.86 | % | 21,290 | 1.34 | % | ||||||||||
Savings |
77,484 | 3.07 | % | 55,639 | 3.47 | % | 38,250 | 3.39 | % | ||||||||||
Time certificates of deposit in denominations of $100,000 or more |
745,139 | 1.39 | % | 944,012 | 2.45 | % | 797,404 | 3.74 | % | ||||||||||
Other time deposits |
1.91 | % | 357,590 | 2.68 | % | 186,639 | 3.93 | % | |||||||||||
Total deposits |
$ | 2,806,832 | 1.32 | % | $ | 2,295,409 | 2.12 | % | $ | 1,744,069 | 2.98 | % | |||||||
94
The scheduled maturities of our time deposits in denominations of $100,000 or greater at December 31, 2010 are, as follows:
Maturities of Time Deposits of $100,000 or More, at December 31, 2010
Three months or less |
$ | 312,256 | |||
Over three months through six months |
130,382 | ||||
Over six months through twelve months |
181,169 | ||||
Over twelve months |
75,878 | ||||
Total |
$ | 699,685 | |||
Because our client base is comprised primarily of commercial and industrial accounts, individual account balances are generally higher than those of consumer-oriented banks. A number of clients' carry deposit balances that were more than 1% of our total deposits, but at December 31, 2010, 2009, and 2008, the California State Treasury was the only depositor whose deposit balance was more than 3% of our total deposits.
In addition to our regular customer base, we also accept brokered deposits on a selective basis at reasonable interest rates to augment deposit growth. During 2010, the ongoing financial crisis and stiff competition for customer deposits among banks within the markets where we do business has slightly driven up interest rates on various deposit products. As a result, broker deposits have been lower in cost, as compared with other time deposits. With our continued strength in liquidity, we were able to decrease these deposits to $7.1 million at December 31, 2010 from $24.0 million and $147.9 million, at December 31, 2009 and 2008, respectively, in order to improve our net interest margin and to limit our reliance on high interest rate time deposits. All of the brokered deposits will mature within one year.
FHLB Borrowings
Although deposits are the primary source of funds for our lending and investment activities and for general business purposes, we may obtain advances from the FHLB as an alternative to retail deposit funds. We have historically utilized borrowings from FHLB in order to take advantage of the flexibility and comparatively low cost. Due to the ongoing financial crisis and stiff competition for customer deposits among banks in our market, we have occasionally used FHLB borrowings as an alternative to fund our growing loan portfolio. See "Liquidity Management" below for the details on the FHLB borrowings program.
The following table is a summary of FHLB borrowings for fiscal years 2010 and 2009:
(Dollars in Thousands)
|
2010 | 2009 | |||||
|---|---|---|---|---|---|---|---|
Balance at year-end |
$ | 135,000 | $ | 232,000 | |||
Average balance during the year |
$ | 125,214 | $ | 310,982 | |||
Maximum amount outstanding at any month-end |
$ | 142,000 | $ | 387,000 | |||
Average interest rate during the year |
2.49 | % | 2.27 | % | |||
Average interest rate at year-end |
2.03 | % | 2.22 | % | |||
TARP Preferred Stock
On December 12, 2008, we issued to the U.S. Treasury 62,158 shares of Series A Preferred Stock and a warrant to purchase initially 949,460 shares of our common stock, for an aggregate purchase price of $62,158,000. The warrant has an exercise price of $9.82 per share. The $62.2 million of Series A Preferred Stock qualifies as Tier 1 capital and carries an initial 5% coupon for the first
95
5 years, which will adjust to 9% thereafter. Dividends are cumulative, computed on the basis of a 360-day year or 30-day months, and payable quarterly in arrears on the 15th day of February, May, August and November of each year. We are permitted, subject to consultation with the appropriate federal banking agency, to repay to the U.S. Treasury any financial assistance received under the TARP Capital Purchase Program without penalty, delay or the need to raise additional replacement capital. The U.S. Treasury is to promulgate regulations to implement the procedures under which a TARP participant may repay any assistance received. As of the date of this Report, the U.S. Treasury had not yet issued such regulations.
Junior Subordinated Debentures; Trust Preferred Securities
In December 2002, the Bank issued $10 million of the 2002 Junior Subordinated Debentures. Subsequently, the Company, as a wholly-owned subsidiary in 2003 and as a parent company of the Bank in 2005 and 2007, issued a total of $77,321,000 of Junior Subordinated Debentures in connection with a $75,000,000 trust preferred securities issuance by statutory trusts wholly-owned by the Company.
2002 Bank Level Junior Subordinated Debenture. In December 2002, the Bank issued a $10 million Junior Subordinated Debenture (the "2002 debenture"). The interest rate payable on the 2002 debenture was 4.57% at December 31, 2008, which rate adjusts quarterly to the three-month LIBOR plus 3.10%. The 2002 debenture will mature on December 26, 2012. Interest on the 2002 debenture is payable quarterly and no scheduled payments of principal are due prior to maturity. The entire $10 million debenture, in whole or in part, was callable upon the Bank's option on any March 26, June 26, September 26 or December 26 on or after December 26, 2007 (the "Redemption Date") pursuant to Section 10.1 of the Debenture agreement. Depending on the level of interest rate difference and our level of fund sources, we may decide to exercise and call the debenture in 2010.
The 2002 debenture is treated as Tier 2 capital for Bank regulatory capital purposes. Likewise, on a consolidated basis, the 2002 debenture also is treated as Tier 2 capital for holding company level capital purposes under current Federal Reserve Board capital guidelines.
2003 Junior Subordinated Debenture; Trust Preferred Securities Issuance. In December 2003, Wilshire Bancorp was formed as a wholly-owned subsidiary of the Bank, in order to raise additional capital funds through the issuance of trust preferred securities. Prior to the completion of the August 2004 bank holding company reorganization, Wilshire Bancorp organized its wholly owned subsidiary, Wilshire Statutory Trust I, which issued $15 million in trust preferred securities. Wilshire Bancorp then purchased all of the common interest in the Wilshire Statutory Trust I ($464,000) and issued the 2003 Junior Subordinated Debenture (the "2003 debenture") in the amount of approximately $15.5 million to the Wilshire Statutory Trust I with terms substantially similar to the 2003 trust preferred securities in exchange for the proceeds from the issuance of the Wilshire Statutory Trust I's 2003 trust preferred securities and common securities. Wilshire Bancorp subsequently deposited the proceeds from the 2003 debenture in a depository account at the Bank and infused $14.5 million as additional equity capital to the Bank immediately following the holding company reorganization. The rate of interest on the 2003 debenture and related trust preferred securities was 4.72% at December 31, 2008, which adjusts quarterly to the three-month LIBOR plus 2.85%. The 2003 debenture and related trust preferred securities will mature on December 17, 2033. The interest on both the 2003 debenture and related trust preferred securities is payable quarterly and no scheduled payments of principal are due prior to maturity. The entire $15 million trust preferred securities, in whole or in part, was callable upon the Company's option on any March 17, June 17, September 17 or December 17 on or after December 17, 2008 (the "Redemption Date") pursuant to Section 10.1 of the trust preferred securities agreement. Depending on the level of discount rate difference and our level of fund sources, we may decide to exercise and call the trust preferred securities in 2010.
96
March 2005 Junior Subordinated Debenture; Trust Preferred Securities Issuance. In March 2005, Wilshire Bancorp organized its wholly owned subsidiary, Wilshire Statutory Trust II, which issued $20 million in trust preferred securities. Wilshire Bancorp then purchased all of the common interest in the Wilshire Statutory Trust II ($619,000) and issued the 2005 Junior Subordinated Debenture (the "March 2005 debenture") in the amount of $20.6 million to the Wilshire Statutory Trust II with terms substantially similar to the March 2005 trust preferred securities in exchange for the proceeds from the issuance of the Wilshire Statutory Trust II's March 2005 trust preferred securities and common securities. Wilshire Bancorp subsequently deposited the proceeds from the March 2005 debenture in a depository account at the Bank and infused $14 million as additional equity capital to the Bank. The rate of interest on the March 2005 debenture and related trust preferred securities was 3.66% at December 31, 2008, which adjusts quarterly to the three-month LIBOR plus 1.79%. The March 2005 debenture and related trust preferred securities will mature on March 17, 2035. The interest on both the March 2005 debenture and related trust preferred securities are payable quarterly and no scheduled payments of principal are due prior to maturity. Wilshire Bancorp may redeem the March 2005 debenture (and in turn the trust preferred securities) in whole or in part at par prior to maturity on or after March 17, 2010.
September 2005 Junior Subordinated Debenture; Trust Preferred Securities Issuance. In September 2005, Wilshire Bancorp organized its wholly owned subsidiary, Wilshire Statutory Trust III, which issued $15 million in trust preferred securities. Wilshire Bancorp then purchased all of the common interest in the Wilshire Statutory Trust III and issued its Junior Subordinated Debt Securities (the "September 2005 debenture") in the amount of $15.5 million to the Wilshire Statutory Trust III with terms substantially similar to the September 2005 trust preferred securities and common securities. Wilshire Bancorp subsequently deposited the proceeds from the September 2005 debenture in a depository account at the Bank. Until September 15, 2010, the securities will be fixed at a 6.07% annual interest rate, thereafter converting to a floating rate of three-month LIBOR plus 1.40%, resetting quarterly. The September 2005 debenture and related trust preferred securities will mature on September 15, 2035. The interest on both the September 2005 debenture and related trust preferred securities are payable quarterly and no scheduled payments of principal are due prior to maturity. Wilshire Bancorp may redeem the September 2005 debenture (and in turn the trust preferred securities) in whole or in part at par prior to maturity on or after September 15, 2010.
July 2007 Junior Subordinated Debenture; Trust Preferred Securities Issuance. In July 2007, Wilshire Bancorp organized its wholly owned subsidiary, Wilshire Statutory Trust IV, which issued $25 million in trust preferred securities. Wilshire Bancorp then purchased all of the common interest in the Wilshire Statutory Trust IV ($774,000) and issued the 2007 Junior Subordinated Debenture (the "July 2007 debenture") in the amount of $25.8 million to the Wilshire Statutory Trust IV with terms substantially similar to the July 2007 trust preferred securities in exchange for the proceeds from the issuance of the Wilshire Statutory Trust IV's July 2007 trust preferred securities and common securities. Wilshire Bancorp subsequently deposited the proceeds from the July 2007 debenture in a depository account at the Bank. The rate of interest on the July 2007 debenture and related trust preferred securities was 3.38% at December 31, 2008, which adjusts quarterly to the three-month LIBOR plus 1.38%. The July 2007 debenture and related trust preferred securities will mature on September 15, 2037. The interest on both the July 2007 debenture and related trust preferred securities are payable quarterly and no scheduled payments of principal are due prior to maturity. Wilshire Bancorp may redeem the July 2007 debenture (and in turn the trust preferred securities) in whole or in part at par prior to maturity on or after September 15, 2012.
Payments of distributions on the trust preferred securities and payments on redemption of the trust preferred securities are guaranteed by Wilshire Bancorp. The junior subordinated debentures are senior to our shares of common stock and Series A Preferred Stock. As a result, in the event of our bankruptcy, dissolution or liquidation, the holder of the junior subordinated debentures must be
97
satisfied before any distributions can be made to the holders of our common stock or Series A Preferred Stock. We have the right to defer distributions on the junior subordinated debentures and related trust preferred securities for up to five years, during which time no dividends may be paid to holders of our common stock.
On March 1, 2005, the Federal Reserve Board adopted a final rule that allows continued inclusion of trust preferred securities in the Tier 1 capital of bank holding companies, subject to stricter quantitative limits. Under the final rule, bank holding companies may include trust preferred securities in Tier 1 capital in an amount (together with other restricted core capital elements) equal to 25% of the sum of core capital elements (including restricted core capital elements) net of goodwill less any associated deferred tax liability. Amounts in excess of these limits will generally be included in Tier 2 capital. For purposes of this rule, restricted core capital elements are generally to be comprised of qualifying cumulative perpetual preferred stock and related surplus, minority interest related to qualifying cumulative perpetual preferred stock directly issued by a consolidated U.S. depository institution or foreign bank subsidiary, minority interest related to qualifying common stock or qualifying cumulative perpetual preferred stock directly issued by a consolidated subsidiary that is neither a U.S. depository institution or a foreign bank and qualifying trust preferred securities.
The final rule provides a transition period for bank holding companies to come into compliance with the new required capital restrictions. Accordingly, while the final rule became effective on April 11, 2005, for practical purposes, bank holding companies will have until March 31, 2011 (an extension of the previous effective date of March 31, 2009 as a result of continued economic pressures) to come into compliance with the final rule's capital restrictions due to the transition period. Therefore all Bank Holding Companies may include cumulative, perpetual preferred stock and trust preferred securities in Tier 1 capital up to the 25% of total core capital.
In extending the transition period to 2009, the Federal Reserve noted that the extended period will provide bank holding companies with existing trust preferred securities with call features after the first five years an opportunity to restructure their capital elements in order to conform to the limitations of the final rule. Under the final rule, as of December 31, 2010, Wilshire Bancorp categorized all $75.0 million trust preferred securities as Tier 1 capital.
Asset/Liability Management
Management seeks to ascertain optimum and stable utilization of available assets and liabilities as a vehicle to attain our overall business plans and objectives. In this regard, management focuses on measurement and control of liquidity risk, interest rate risk and market risk, capital adequacy, operation risk and credit risk. See "Risk Factors" for further discussion on these risks. Information concerning interest rate risk management is set forth under "Item 7A—Quantitative and Qualitative Disclosures about Market Risk."
Liquidity Management
Liquidity management involves our ability to meet cash flow requirements arising from fluctuations in deposit levels and demands of daily operations, which include funding of securities purchases, providing for customers' credit needs and ongoing repayment of borrowings. Maintenance of adequate liquidity requires that sufficient resources be available at all time to meet our cash flow requirements. Liquidity in a banking institution is required primarily to provide for deposit withdrawals and the credit needs of its customers and to take advantage of investment opportunities as they arise. Liquidity management involves our ability to convert assets into cash or cash equivalents without incurring significant loss, and to raise cash or maintain funds without incurring excessive additional cost. Our liquidity is actively managed on a daily basis and reviewed periodically by the Asset/Liability Committee
98
and the Board of Directors. This process is intended to ensure the maintenance of sufficient funds to meet the needs of the Company, including adequate cash flow for off-balance sheet instruments.
Our primary sources of liquidity are derived from financing activities which include the acceptance of customer and brokered deposits, federal funds facilities, repurchase agreement facilities, advances from the FHLB of San Francisco, and issuance of long-term debt. These funding sources are augmented by payments of principal and interest on loans, the routine liquidation of securities from the available-for-sale portfolio and securitizations of loans. In addition, government programs, such as FDIC's TLGP, may influence deposit behavior. Primary use of funds include withdrawal of and interest payments on deposits, originations and purchases of loans, purchases of investment securities, and payment of operating expenses.
During the years ended December 31, 2010, 2009, and 2008, we experienced net cash outflows from operating activities of $12.7 million and net cash inflows of $617,000, and $25.9 million, respectively. In 2010, net cash used by operating activities was primarily attributable to the subtraction of $202.8 million "origination of loan held for sale," and the addition of $132.1 million "proceeds from sale of loans held for sale" and $150.8 million "provision for losses on loans and loan commitments." Other assets were also increased $43.4 million and the Company recorded a net loss of $34.8 million, both factors contributing to outflow of cash for operating activities. Similarly in 2009 and 2008, the net cash provided by operating activities were primarily attributable to the net income earned during the immediately preceding years and also to the originations and proceeds of loans held for sale.
Net cash inflows from investing activities totaled $422.4 million in 2010, while 2009 and 2008 experienced net cash outflows of $458.4 million and $251.2 million, respectively. During 2009 and 2008 net cash out-flows were primarily related to the net increases in loans receivables and the purchase of investment securities available for sale for those years. However, in 2010, proceeds from investment pay-downs, maturities, calls, and sales along with proceeds from the sale of other loans were the largest contributors to the cash provided by investing activities. Largest cash in-flows for 2009 and 2008 were attributed to securities, cash from matured and sold securities.Net cash outflows from financing activities totaled $447.2 million in 2010 and cash inflows from financing activities were $596.0 million and $230.3 million 2009 and 2008, respectively. The net cash used by financing activities in 2010 was primarily due to the decrease in deposits, which totaled $367.3 million. In 2009 however, net cash provided by financing activities was primarily due to the increase in deposits totaling $722.2 million. 2008 cash provided by financing activities is attributable to the increase in FHLB borrowings, issuance of preferred stock, and also an increase in deposits.
Net cash outflows from financing activities totaled $447.2 million in 2010 and cash inflows from financing activities were $596.0 million and $230.3 million 2009 and 2008, respectively. The net cash used by financing activities in 2010 was primarily due to the decrease in deposits, which totaled $367.3 million. In 2009 however, net cash provided by financing activities was primarily due to the increase in deposits totaling $722.2 million. 2008 cash provided by financing activities is attributable to the increase in FHLB borrowings, issuance of preferred stock, and also an increase in deposits.
For purpose of having liquid cash available for emergencies, we maintain a portion of our funds in cash and cash equivalents, deposits in other financial institutions and loans and securities available for sale. Our liquid assets at December 31, 2010, 2009, and 2008 totaled approximately $532.3 million, $923.3 million, and $345.1 million, respectively. Our liquidity level measured as the percentage of liquid assets to total assets was 17.9%, 26.9%, and 14.1% at December 31, 2010, 2009, and 2008, respectively. The decrease in liquid assets in 2010 is a result of management's planned reduction of high cost deposits in the third and fourth quarter funded by the proceeds from cash and cash equivalents and proceeds from investment securities pay-downs, maturities, calls, and sales.
As a secondary source of liquidity, we have available a combination of borrowing sources comprised of the Federal Reserve Bank's discount window, FHLB advances, federal funds lines with
99
various corresponding banks, and several master repurchase agreements with major brokerage companies. Among all these sources, we prefer advances from the FHLB to supplement our supply of lendable funds and to meet deposit withdrawal requirements. Advances from the FHLB are typically secured by our mortgage loans and stock issued by the FHLB. Advances are made pursuant to several different programs. Each credit program has its own interest rate and range of maturities. Depending on the program, limitations on the amount of advances are based either on a fixed percentage of an institution's net worth or on the FHLB's assessment of the institution's creditworthiness. While this fund provides flexibility and reasonable cost, we limit our use to 50% of our borrowing capacity, as such borrowing does not qualify as core funds.
As of December 31, 2010, our borrowing capacity from the FHLB was about $604.4 million and the outstanding balance was $135.0 million, or approximately 22.35% of our borrowing capacity. As of December 31, 2010, we also maintained a guideline to purchase up to a combined $60 million in federal funds through lines with three correspondent banks. Borrowing capacity at the FRB Discount Window stood at $28.0 million, with $22.8 million in securities pledged at December 31, 2010. It is management's belief that our liquidity is sufficient to meet the Company's short-term and long-term cash flow needs as they arise.
Capital Resources and Capital Adequacy Requirements
Historically, our primary source of capital has been internally generated operating income through retained earnings. In order to ensure adequate levels of capital, we conduct ongoing assessments of projected sources and uses of capital in conjunction with projected increases in assets and level of risks. We have considered, and we will continue to consider, additional sources of capital as the need arises, whether through the issuance of additional equity, debt or hybrid securities. When the U.S. Treasury made TARP funds available to financial institutions in October 2008, our Board of Directors decided to take advantage of this opportunity and increased our capital by participating in the program. In December 2008, we received a TARP investment from the U.S. Treasury in the amount of $62.2 million.
We are subject to various regulatory capital requirements administered by federal banking agencies. Under capital adequacy guidelines and the regulatory framework for prompt corrective action, we must meet specific capital guidelines that rely on quantitative measures of our assets, liabilities and certain off-balance-sheet items as calculated under regulatory accounting practices. Failure to meet minimum capital requirements can trigger regulatory actions under the prompt corrective action rules that could have a material adverse effect on our financial condition and operations. Prompt corrective action may include regulatory enforcement actions that restrict dividend payments, require the adoption of remedial measures to increase capital, terminate FDIC deposit insurance, and mandate the appointment of a conservator or receiver in severe cases. In addition, failure to maintain a well-capitalized status may adversely affect the evaluation of regulatory applications for specific transactions and activities, including acquisitions, continuation and expansion of existing activities, and commencement of new activities, and could adversely affect our business relationships with our existing and prospective clients. The aforementioned regulatory consequences for failing to maintain adequate ratios of Tier 1 and Tier 2 capital could have a material adverse effect on our financial condition and results of operations. Our capital amounts and classification are also subject to qualitative judgments by regulators about components, risk weightings, and other factors. See Part I, Item 1 "Description of Business—Regulation and Supervision—Capital Adequacy Requirements" in this Annual Report on Form 10-K for additional information regarding regulatory capital requirements.
100
As of December 31, 2010, we were qualified as a "well capitalized institution" under the regulatory framework for prompt corrective action. The following table presents the regulatory standards for well-capitalized institutions, compared to our capital ratios as of the dates specified for Wilshire Bancorp, Inc. and Wilshire State Bank:
| |
|
|
Actual ratios for the Company as of: | |||||||||||||
|---|---|---|---|---|---|---|---|---|---|---|---|---|---|---|---|---|
| |
Regulatory Adequately- Capitalized Standards |
Regulatory Well- Capitalized Standards |
||||||||||||||
Wilshire Bancorp, Inc.
|
December 31, 2010 | December 31, 2009 | December 31, 2008 | |||||||||||||
Total capital to risk-weighted assets |
8 | % | 10 | % | 14.00 | % | 15.81 | % | 17.09 | % | ||||||
Tier I capital to risk-weighted assets |
4 | % | 6 | % | 12.61 | % | 14.37 | % | 15.36 | % | ||||||
Tier I capital to average assets |
4 | % | 5 | % | 9.18 | % | 9.77 | % | 13.25 | % | ||||||
| |
|
|
Actual ratios for the Bank as of: | |||||||||||||
|---|---|---|---|---|---|---|---|---|---|---|---|---|---|---|---|---|
| |
Regulatory Adequately- Capitalized Standards |
Regulatory Well- Capitalized Standards |
||||||||||||||
Wilshire State Bank
|
December 31, 2010 | December 31, 2009 | December 31, 2008 | |||||||||||||
Total capital to risk-weighted assets |
8 | % | 10 | % | 13.72 | % | 15.73 | % | 13.59 | % | ||||||
Tier I capital to risk-weighted assets |
4 | % | 6 | % | 12.34 | % | 14.29 | % | 11.86 | % | ||||||
Tier I capital to average assets |
4 | % | 5 | % | 8.98 | % | 9.71 | % | 10.24 | % | ||||||
At December 31, 2010, total shareholders' equity decreased by $37.0 million, after declaring cash dividends of $4.6 million ($1.5 million to common shareholders and $3.1 million to preferred shareholders), to $229.2 million from $266.1 million at December 31, 2009. The capital decline was a result of a net loss in operating income in 2010. In 2009 total shareholders' equity increased by $11.1 million, after declaring cash dividends of $8.8 million ($5.9 million to common shareholders and $2.9 million to preferred shareholders), to $266.1 million from $255.1 million at December 31, 2008.
As of both December 31, 2010 and 2009, we considered the Junior Subordinated Debentures of $87.3 million, which consists of $10.0 million issued by the Bank and $77.3 million issued by the Company in connection with the issuance of $75.0 million trust preferred securities for the regulatory capital ratio computation purposes. At December 31, 2008, as the result of issuance of the Series A Preferred Stock in December 2008, the portion qualified for Tier 1 capital increased to $134.4 million ($59.4 million TARP preferred stock and $75.0 million trust preferred securities), decreasing the portion for Tier 2 capital to $10.0 million. For the Bank level, only the $10.0 million debenture issued by the Bank in 2002 is treated as Tier 2 capital. See "Deposits and Other Sources of Funds" for further discussion regarding the capital treatment of subordinated debentures and the trust preferred securities.
Recent Accounting Pronouncements
In January 2010, FASB issued Accounting Standards Update 2010-06, "Improving Disclosures about Fair Value Measurements." ASU 2010-06 will require reporting entities to make new disclosures about (a) amounts and reasons for significant transfers in and out of Level 1 and Level 2 fair value measurements, (b) Input and valuation techniques used to measure fair value for both recurring and nonrecurring fair value measurements that fall in either Level 2 or Level 3 and (c) information on purchases, sales, issuances and settlements in the roll forward of activity in Level 3 fair value measures. The new and revised disclosures are effective for interim and annual reporting periods beginning after December 15, 2009 except for disclosures about purchases, sales, issuances and settlements in the roll
101
forward of activity in Level 3 fair value measures, which are effective for fiscal years beginning after December 15, 2010. The adoption of ASU 2010-06 effective for reporting periods after December 15, 2009 did not have a material impact on the consolidated financial statements. The adoption of this standard did not have a material impact on the consolidated financial statement.
In April 2010, FASB issued ASU 2010-18 "Effect of a Loan Modification When the Loan is Part of a Pool that is Accounted for as a Single Asset," which is effective for modifications of loans accounted for within pools under Subtopic 310-30 occurring in the first interim or annual period ending after July 15, 2010. Under the amendments, modifications of loans that are accounted for within a pool do not result in the removal of those loans from the pool even if the modification of those loans would otherwise be considered a troubled debt restructuring. An entity will continue to be required to consider whether the pool of assets in which the loan is included is impaired if expected cash flows for the pool change. The adoption of this standard did not have a material impact on the consolidated financial statement.
In July 2010, FASB issued ASU 2010-20 "Disclosures about the Credit Quality of Financing Receivables and the Allowance for Credit Losses" to improve disclosures about the credit quality of financing receivables and the allowance for credit losses. Companies will be required to provide more information about the credit quality of their financing receivables in the disclosures to financial statements, such as aging information and credit quality indicators. Both new and existing disclosures must be disaggregated by portfolio segment or class. The disaggregation of information is based on how a company develops its allowance for credit losses and how it manages its credit exposure. Required disclosures as of the end of a reporting period are effective for periods ending on or after December 15, 2010, while required disclosures about activity that occurs during a reporting period are effective for periods beginning on or after December 15, 2010. The adoption of this standard did not have a material impact on the consolidated financial statement.
FASB ASU 2010-20, "Receivable (Topic 310), Disclosures about the Credit Quality of Financing Receivables and the Allowance for Credit Losses"—ASU 2010-20 requires new and enhanced disclosures about the credit quality of an entity's financing receivables and its allowance for credit losses. The new and amended disclosure requirements focus on such areas as nonaccrual and past due financing receivables, allowance for credit losses related to financing receivables, impaired loans, credit quality information and modifications. The ASU requires an entity to disaggregate new and existing disclosures based on how it develops its allowance for credit losses and how it manages credit exposures. For public entities, the disclosures as of the end of a reporting period are effective for interim and annual reporting periods ending on or after December 15, 2010. The disclosures about activity that occurs during a reporting period are effective for interim and annual reporting periods beginning on or after December 15, 2010. See Note 5 in our footnotes to the Consolidated Financial Statements.
Newly Issued But Not Yet Effective Accounting Pronouncements
FASB ASU 2010-28, "Intangibles—Goodwill and Other (Topic 350), When to Perform Step 2 of the Goodwill Impairment Test for Reporting Units with Zero or Negative Carrying Amounts"—ASU 2010-28 affects all entities that have recognized goodwill and have one or more reporting units whose carrying amount for purposes of performing Step 1 of the goodwill impairment test is zero or negative. ASU 2010-28 modifies Step 1 so that for those reporting units, an entity is required to perform Step 2 of the goodwill impairment test if it is more likely than not that a goodwill impairment exists. In determining whether it is more likely than not that a goodwill impairment exists, an entity should consider whether there are any adverse qualitative factors indicating that an impairment may exist. The qualitative factors are consistent with existing guidance, which requires that goodwill of a reporting unit be tested for impairment between annual tests if an event occurs or circumstances change that would more likely than not reduce the fair value of a reporting unit below its carrying amount. For public entities, this guidance is effective for fiscal years, and interim periods within those years, beginning
102
after December 15, 2010. Adoption of ASU 2010-28 is not expected to have a significant impact on our consolidated financial statements.
Impact of Inflation; Seasonality
Inflation primarily impacts us through its effect on interest rates. Our primary source of income is net interest income, which is affected by changes in interest rates. We attempt to limit the impact of inflation on our net interest margin through management of rate-sensitive assets and liabilities and the analysis of interest rate sensitivity. The effect of inflation on premises and equipment as well as noninterest expenses has not been significant for the periods covered in this report. Our business is generally not seasonal.
Item 7A. Quantitative and Qualitative Disclosures about Market Risk
Market risk is the risk of loss from adverse changes in market prices and rates. Our market risk arises primarily from interest rate risk inherent in lending, investing and deposit taking activities. We evaluate market risk pursuant to policies reviewed and approved annually by our Board of Directors. The Board delegates responsibility for market risk management to the Asset & Liability Management ("ALM") Committee, which reports monthly to the Board on activities related to market risk management. As part of the management of our market risk, our ALM committee may direct changes in the mix of assets and liabilities. To that end, we actively monitor and manage interest rate risk exposures.
Interest rate risk management involves development, analysis, implementation and monitoring of earnings to provide stable earnings and capital levels during periods of changing interest rates. In the management of interest rate risk, we utilize monthly gap analysis and quarterly simulation modeling to determine the sensitivity of net interest income and economic value of equity. These techniques are complementary and are used together to provide a more accurate measurement of interest rate risk.
Gap analysis measures the repricing mismatches between assets and liabilities. The interest rate sensitivity gap is determined by subtracting the amount of liabilities from the amount of assets that reprice in a particular time interval. If repricing assets exceed repricing liabilities in any given time period, we would be deemed to be "asset-sensitive" for that period. Conversely, if repricing liabilities exceed repricing assets, we would be deemed to be "liability-sensitive" for that period.
We usually seek to maintain a balanced position over the period of one year to ensure net interest margin stability in times of volatile interest rates. This is accomplished by maintaining a similar level of interest-earning assets and interest-paying liabilities available to be repriced within one year.
The change in net interest income may not always follow the general expectations of an "asset-sensitive" or a "liability-sensitive" balance sheet during periods of changing interest rates. This possibility results from interest rates changing by differing increments and at different time intervals for each type of interest-sensitive asset and liability. The interest rate sensitivity gaps reported in the tables arise when assets are funded with liabilities having different repricing intervals. Because these gaps are actively managed and change daily as adjustments are made in interest rate views and market outlook, positions at the end of any period may not reflect our interest rate sensitivity in subsequent periods. We attempt to balance longer-term economic views against prospects for short-term interest rate changes.
Although the interest rate sensitivity gap is a useful measurement and contributes to effective asset and liability management, it is difficult to predict the effect of changing interest rates based solely on that measure. As a result, the ALM committee also regularly uses simulation modeling as a tool to measure the sensitivity of earnings and net portfolio value ("NPV") to interest rate changes. The NPV is defined as the net present value of an institution's existing assets, liabilities and off-balance sheet
103
instruments. The simulation model captures all assets, liabilities and off-balance sheet financial instruments and accounts for significant variables that are believed to be affected by interest rates. These include prepayment speeds on loans, cash flows of loans and deposits, principal amortization, call options on securities, balance sheet growth assumptions and changes in rate relationships as various rate indices react differently to market rates.
Although the simulation measures the volatility of net interest income and net portfolio value under immediate increase or decrease of market interest rate scenarios in 100 basis point increments, our main concern is the negative effect of a reasonably-possible worst scenario. The ALM policy prescribes that for the worst possible rate decreasing scenario the possible reduction of net interest income and NPV should not exceed 20% of the base net interest income and 25% of the base NPV, respectively.
In general, based upon our current mix of deposits, loans and investments, decrease in interest rates would result the increase of net interest margin and NPV. Increase in interest rates would be expected to have opposite effect. However, given in the record low interest rate environment, further decrease in interest rate will result in net interest margin as shown in our simulation measures below.
Management believes that the assumptions used to evaluate the vulnerability of our operations to changes in interest rates approximate actual experience and considers them reasonable; however, the interest rate sensitivity of our assets and liabilities and the estimated effects of changes in interest rates on our net interest income and NPV could vary substantially if different assumptions were used or actual experience differs from the historical experience on which they are based.
The following table sets forth the interest rate sensitivity of our interest-earning assets and interest-bearing liabilities as of December 31, 2010 using the interest rate sensitivity gap ratio. For purposes of the following table, an asset or liability is considered rate-sensitive within a specified period when it can be repriced or matures within its contractual terms. Actual payment patterns may differ from contractual payment patterns.
104
Interest Rate Sensitivity Analysis
| |
At December 31, 2010 | |||||||||||||||||
|---|---|---|---|---|---|---|---|---|---|---|---|---|---|---|---|---|---|---|
| |
Amounts Subject to Repricing Within | |||||||||||||||||
| |
0-3 months | 3-12 months | 1-5 years | After 5 years | Total | |||||||||||||
| |
(Dollars in Thousands) |
|||||||||||||||||
Interest-earning assets: |
||||||||||||||||||
Gross loans |
$ | 1,434,262 | $ | 212,992 | $ | 663,121 | $ | 21,014 | $ | 2,331,389 | ||||||||
Investment securities |
840 | 5,995 | 226,263 | 83,609 | 319,707 | |||||||||||||
Federal funds sold and cash equivalents |
130,005 | — | — | — | 130,005 | |||||||||||||
Interest-earning deposits |
— | — | — | — | — | |||||||||||||
Total |
$ | 1,565,107 | $ | 218,987 | $ | 889,384 | $ | 104,623 | $ | 2,778,101 | ||||||||
Interest-bearing liabilities: |
||||||||||||||||||
Savings deposits |
$ | 83,205 | $ | — | $ | — | $ | — | $ | 83,205 | ||||||||
Time deposits of $100,000 or more |
312,257 | 311,550 | 75,878 | — | 699,685 | |||||||||||||
Other time deposits |
217,269 | 275,625 | 25,694 | — | 518,588 | |||||||||||||
Other interest-bearing deposits |
692,395 | — | — | — | 692,395 | |||||||||||||
FHLB Advances |
88,011 | 70,000 | — | — | 158,011 | |||||||||||||
Junior Subordinated Debenture |
87,321 | — | — | — | 87,321 | |||||||||||||
Total |
$ | 1,480,458 | $ | 657,175 | $ | 101,572 | $ | — | $ | 2,239,205 | ||||||||
Interest rate sensitivity gap |
$ | 84,649 | $ | (438,188 | ) | $ | 787,812 | $ | 104,623 | $ | 538,896 | |||||||
Cumulative interest rate sensitivity gap |
84,649 | (353,539 | ) | 434,273 | 538,896 | |||||||||||||
Cumulative interest rate sensitivity gap ratio (based on total assets) |
-2.85 | % | -11.90 | % | 14.62 | % | 18.14 | % | ||||||||||
The following table sets forth our estimated net interest income over a twelve months period and NPV based on the indicated changes in market interest rates as of December 31, 2010.
| Change (in Basis Points) |
Net Interest Income (Next Twelve Months) |
% Change | NPV | % Change | ||||||||||
|---|---|---|---|---|---|---|---|---|---|---|---|---|---|---|
| +200 | $ | 122,039 | -2.80 | % | $ | 325,265 | -5.13 | % | ||||||
| +100 | 122,181 | -2.69 | % | 336,192 | -1.95 | % | ||||||||
| 0 | 125,560 | — | 342,861 | — | ||||||||||
| -100 | 128,311 | 2.19 | % | 320,249 | -6.60 | % | ||||||||
| -200 | 125,932 | 0.30 | % | 292,667 | -14.64 | % | ||||||||
Our strategies in protecting both net interest income and economic value of equity from significant movements in interest rates involve restructuring our investment portfolio and using FHLB advances. Although our policy also permits us to purchase rate caps and floors and interest rate swaps, we are not currently engaged in any of those types of transactions.
Item 8. Financial Statements and Supplementary Data
The information required by this item is included in Part IV, Item 15(a)(1) and are presented beginning on Page F-1.
105
Item 9. Changes in and Disagreements with Accountants on Accounting and Financial Disclosure
Not applicable.
Item 9A. Controls and Procedures
Evaluation of Disclosure Controls and Procedures
As of December 31, 2010, we have evaluated, under the supervision and with the participation of our management, including our chief executive officer and chief financial officer, the effectiveness of the design and operation of our "disclosure controls and procedures," as such term is defined under Exchange Act Rules 13a-15(e) and 15d-15(e).
Based on this evaluation, our chief executive officer and chief financial officer have concluded that the Company's disclosure controls and procedures were not effective, because of the material weakness described below, to enable us to provide that information required to be disclosed by us in reports filed or submitted under the Securities Exchange Act of 1934, as amended (the "Exchange Act") is recorded, processed, summarized and reported within the time periods specified in the rules and forms of the SEC, and to ensure that the information required to be disclosed in the reports that we file or submit under the Exchange Act is accumulated and communicated to our management, including our chief executive officer and chief financial officer, as appropriate to allow timely decisions regarding required disclosure.
Management's Annual Report on Internal Control over Financial Reporting
Our management is responsible for establishing and maintaining an adequate system of internal control over financial reporting as defined in Rules 13a-15(f) and 15d-15(f) under the Exchange Act. Our internal control over financial reporting is designed to provide reasonable assurance regarding the reliability of financial reporting and the preparation of financial statements for external purposes in accordance with accounting principles generally accepted in the United States of America. Our internal control over financial reporting includes those policies and procedures that:
- •
- pertain to the maintenance of records that, in reasonable detail, accurately and fairly reflect our transactions and
dispositions of our assets;
- •
- provide reasonable assurance that our transactions are recorded as necessary to permit preparation of our financial
statements in accordance with accounting principles generally accepted in the United States of America, and that our receipts and expenditures are being made only in accordance with authorizations of
our management and our directors; and
- •
- provide reasonable assurance regarding prevention or timely detection of unauthorized acquisition, use, or disposition of our assets that could have a material effect on the financial statements.
Because of its inherent limitations, a system of internal control over financial reporting can provide only reasonable assurance and may not prevent or detect misstatements. Also, projections of any evaluation of effectiveness as to future periods are subject to risk that controls may become inadequate because of changes in conditions, or that the degree of compliance with the policies or procedures may deteriorate. Further, because of changes in conditions, effectiveness of internal controls over financial reporting may vary over time. Our system contains self-monitoring mechanisms, and actions are taken to correct deficiencies as they are identified.
Our management and audit committee conducted an evaluation of the effectiveness of the system of internal control over financial reporting as of December 31, 2010 using the criteria set forth by the Committee of Sponsoring Organizations of the Treadway Commission in Internal Control—Integrated Framework. A material weakness is a control deficiency, or combination of control deficiencies, in
106
internal control over financial reporting, such that there is a reasonable possibility that a material misstatement of the annual or interim financial statements will not be prevented or detected on a timely basis. Based on our assessment, we believe that, as of December 31, 2010, the Company's internal control over financial reporting was not effective based on those criteria because management identified the following material weakness:
Deficiencies in Loan Underwriting, Approval, Renewal, and Sales Controls and Lack of Effective Supervision and Oversight by Management Over Loan Approval Process: The Company recently conducted an internal investigation with the assistance of outside independent professional firms and its internal audit department. The scope of the Company's internal investigation was extensive and included loan related activities and other matters involving improper activities of a loan officer. This loan officer is no longer with the Company. As a result of the internal investigation, management discovered a deficiency in the operating effectiveness of procedures and documentation related to loan underwriting, approval, renewal, and sales processes associated with the former loan officer. Additionally, these processes lacked effective supervision and oversight by the former chief executive officer and other lending management personnel. Our former chief executive officer resigned following the revelation of these activities to our board of directors and was replaced by our present chief executive officer.
Provision for Loan Losses: The internal investigation conducted by the Company concerning the improper activities of the loan officer, the lack of supervision and oversight by management, and the deficiencies in loan underwriting, approvals, renewals, and sales resulted in a material adjustment within the 2010 annual consolidated financial statements subsequent to the Company's fourth quarter and year-end earnings release. This material adjustment which resulted in additional charge-offs of $13.6 million, consisted of an approximate $3.2 million increase in the allowance for loan loss and related provision for loan losses totaling $18.1 million, which reduced the net income of the Company by $10.3 million, net of tax benefit, or $0.35 per basic and diluted share for the year ended December 31, 2010. In addition, there was an increase in the classification of nonperforming loans of $6.6 million. The consolidated financial statements contained in this Annual Report on Form 10-K reflect such material adjustments.
Management determined that these significant control deficiencies, combined with the material adjustment to the Company's allowance for loan loss and related provision for loan losses, constitute a material weakness in the Company's internal control over financial reporting.
This annual report contains an attestation report of our independent registered public accounting firm regarding internal control over financial reporting pursuant to the rules of the SEC.
Remediation Efforts in 2011
Promptly following the identification of the material weakness as described above in management's annual report on internal control over financial reporting, management, with the oversight of the audit committee began taking steps to remediate the material weakness. As part of these steps:
- •
- management reviewed the material weakness with our audit committee and senior management;
- •
- management engaged an independent third party loan review firm, which evaluated the adequacy of our allowance for loan
losses and charge-offs pertaining to those loans generated by the former loan officer, the appropriateness of credit grades, and the levels of nonaccrual loans and writedowns; and
- •
- management began taking action designed to strengthen corporate oversight of loan origination, internal loan function,
underwriting and renewal processes by:
- •
- our board of directors hired a new chief executive officer on February 18, 2011;
107
- •
- management restructured our lending department by segregating personnel and responsibilities relating to the loan sales
from personnel and responsibilities relating to loan underwriting processes, including (1) the creation and employment of a new position which we refer to as the Deputy Chief Credit Officer and
who will be responsible for closely monitoring the problem assets and credit risk management of the Company, and (2) the termination of the position of Chief Lending
Officer—Marketing Division due to the Company shifting focus from marketing to credit quality control; and
- •
- management, with the approval of the audit committee, created and adopted a loan sale policy, which sets forth guidelines relating to (i) the selection of notes to be made available for sale, (ii) purchaser qualifications, (iii) methods of accounting, and (iv) reporting requirements.
In addition to the steps management has taken, management intends to continue its remediation efforts by:
- •
- continuing to review and monitor the material weakness and the effectiveness of our remedial actions with our audit
committee and senior management; and
- •
- strengthening corporate oversight of loan origination, internal loan function, underwriting and renewal processes
by:
- •
- enhancing our loan documentation and underwriting procedures;
- •
- improving and increasing the frequency of our loan appraisal and review process including its independence;
- •
- reinforcing our loan review and classification policies and procedures, in part, by continuing to engage a third party
loan review firm to assist in our loan evaluations; and
- •
- continuing to develop and improve our management oversight and loan approval process as our ongoing remediation efforts are pursued.
Management believes that these changes will contribute significantly to the remediation of the material weakness in internal control over financial reporting that was in existence as of December 31, 2010. Additional changes will be implemented as determined necessary.
Although the company's remediation efforts are well underway and are expected to be completed in the near future, the Company's weaknesses will not be considered remediated until new internal controls are operational for a period of time and are tested, and management and concludes that these controls are operating effectively.
Changes in Internal Control over Financial Reporting
Because of the material weakness as previously described, there was a change in our internal controls over financial reporting during the year ended December 31, 2010 that materially affected, or are reasonably likely to materially affect, our internal controls over financial reporting.
108
REPORT OF INDEPENDENT REGISTERED PUBLIC ACCOUNTING FIRM
To
the Board of Directors and Shareholders of
Wilshire Bancorp, Inc.
Los Angeles, California
We have audited Wilshire Bancorp, Inc. and subsidiaries' (the "Company") internal control over financial reporting as of December 31, 2010, based on criteria established in Internal Control—Integrated Framework issued by the Committee of Sponsoring Organizations of the Treadway Commission. The Company's management is responsible for maintaining effective internal control over financial reporting and for its assessment of the effectiveness of internal control over financial reporting, included in the accompanying Management's Annual Report on Internal Control over Financial Reporting. Our responsibility is to express an opinion on the Company's internal control over financial reporting based on our audit.
We conducted our audit in accordance with the standards of the Public Company Accounting Oversight Board (United States). Those standards require that we plan and perform the audit to obtain reasonable assurance about whether effective internal control over financial reporting was maintained in all material respects. Our audit included obtaining an understanding of internal control over financial reporting, assessing the risk that a material weakness exists, testing and evaluating the design and operating effectiveness of internal control based on the assessed risk, and performing such other procedures as we considered necessary in the circumstances. We believe that our audit provides a reasonable basis for our opinion.
A company's internal control over financial reporting is a process designed by, or under the supervision of, the company's principal executive and principal financial officers, or persons performing similar functions, and effected by the company's board of directors, management, and other personnel to provide reasonable assurance regarding the reliability of financial reporting and the preparation of financial statements for external purposes in accordance with generally accepted accounting principles. A company's internal control over financial reporting includes those policies and procedures that (1) pertain to the maintenance of records that, in reasonable detail, accurately and fairly reflect the transactions and dispositions of the assets of the company; (2) provide reasonable assurance that transactions are recorded as necessary to permit preparation of financial statements in accordance with generally accepted accounting principles, and that receipts and expenditures of the company are being made only in accordance with authorizations of management and directors of the company; and (3) provide reasonable assurance regarding prevention or timely detection of unauthorized acquisition, use, or disposition of the company's assets that could have a material effect on the financial statements.
Because of the inherent limitations of internal control over financial reporting, including the possibility of collusion or improper management override of controls, material misstatements due to error or fraud may not be prevented or detected on a timely basis. Also, projections of any evaluation of the effectiveness of the internal control over financial reporting to future periods are subject to the risk that the controls may become inadequate because of changes in conditions, or that the degree of compliance with the policies or procedures may deteriorate.
A material weakness is a deficiency, or a combination of deficiencies, in internal control over financial reporting, such that there is a reasonable possibility that a material misstatement of the company's financial statements will not be prevented or detected and corrected on a timely basis. The following material weakness has been identified and included in the accompanying Management's Annual Report on Internal Control Over Financial Reporting. Deficiencies in the operating effectiveness of loan underwriting, approval, renewal and loan sale controls and lack of effective supervision and oversight by management personnel resulted in a material weakness in internal controls over financial reporting. This material weakness was considered in determining the nature, timing, and extent of audit tests applied in our audit of the consolidated financial statements as of and for the year
109
ended December 31, 2010, of the Company and this report does not affect our report on such financial statements.
In our opinion, because of the effect of the material weakness described above on the achievement of the objectives of the control criteria, the Company has not maintained effective internal control over financial reporting as of December 31, 2010, based on the criteria established in Internal Control—Integrated Framework issued by the Committee of Sponsoring Organizations of the Treadway Commission.
We have also audited, in accordance with the standards of the Public Company Accounting Oversight Board (United States), the consolidated financial as of and for the year ended December 31, 2010, of the Company and our report dated March 16, 2011 expressed an unqualified opinion on those financial statements.
/s/ DELOITTE & TOUCHE LLP
Los
Angeles, California
March 16, 2011
110
On March 11, 2011, the employment of Sung Soo Han, as Executive Vice President and Chief Lending Officer of Wilshire Bancorp, Inc. was terminated effective that date.
Item 10. Directors and Executive Officers of the Registrant
Information required by this item is incorporated herein by reference to the Company's proxy statement (Schedule 14A) for its 2011 Annual Meeting of Shareholders, which will be filed with the SEC not later than 120 days after December 31, 2010.
Item 11. Executive Compensation
Information required by this item is incorporated herein by reference to the Company's proxy statement (Schedule 14A) for its 2011 Annual Meeting of Shareholders, which will be filed with the SEC not later than 120 days after December 31, 2010.
Item 12. Security Ownership of Certain Beneficial Owners, and Management and Related Shareholder Matters
Information required by this item is incorporated herein by reference to the Company's proxy statement (Schedule 14A) for its 2011 Annual Meeting of Shareholders, which will be filed with the SEC not later than 120 days after December 31, 2010.
Item 13. Certain Relationships and Related Transactions and Director Independence
Information required by this item is incorporated herein by reference to the Company's proxy statement (Schedule 14A) for its 2011 Annual Meeting of Shareholders, which will be filed with the SEC not later than 120 days after December 31, 2010.
Item 14. Principal Accounting Fees and Services
Information required by this item is incorporated herein by reference to the Company's proxy statement (Schedule 14A) for its 2011 Annual Meeting of Shareholders, which will be filed with the SEC not later than 120 days after December 31, 2010.
111
Item 15. Exhibits, Financial Statement Schedules
- (a)
- List
of documents filed as part of this report
- (1)
- Financial Statements
The following financial statements of Wilshire Bancorp, Inc. are filed as a part of this Form 10-K on the pages indicated:
- (2)
- Financial Statement Schedules
Schedules to the financial statements are omitted because the required information is not applicable or the information is presented in the Company's financial statements or related notes.
- (3)
- Exhibits
Exhibit Table
| Reference Number |
Item | ||
|---|---|---|---|
| 3.1 | Articles of Incorporation, as amended and restated(1) | ||
| 3.2 | Second Amended and Restated Bylaws of Wilshire Bancorp, Inc. effective December 12, 2008(2) | ||
| 3.3 | Certificate of Determination of Fixed Rate Cumulative Perpetual Preferred Stock, Series A(2) | ||
| 4.1 | Specimen of Common Stock Certificate(3) | ||
| 4.2 | Indenture of Subordinated Debentures dated as of September 19, 2002(15) | ||
| 4.3 | Indenture by and between Wilshire Bancorp, Inc. and U.S. Bank National Association dated as of December 17, 2003(3) | ||
| 4.4 | Amended and Restated Declaration of Trust by and among Wilshire Bancorp, Inc., U.S. Bank National Association, Soo Bong Min and Brian E. Cho dated as of December 17, 2003(4) | ||
| 4.5 | Guaranty Agreement by and between Wilshire Bancorp, Inc. and U.S. Bank National Association dated as of December 17, 2003(4) | ||
| 4.6 | Indenture by and between Wilshire Bancorp, Inc. and Wilmington Trust Company dated as of March 17, 2005(4) | ||
| 4.7 | Amended and Restated Declaration of Trust by and among Wilshire Bancorp, Inc., Wilmington Trust Company, Soo Bong Min, Brian E. Cho and Elaine Jeon dated as of March 17, 2005(4) | ||
| 4.8 | Guaranty Agreement by and between Wilshire Bancorp, Inc. and Wilmington Trust Company dated as of March 17, 2005(4) | ||
| 4.9 | Indenture by and between Wilshire Bancorp, Inc. and Wilmington Trust Company dated as of September 15, 2005(4) | ||
112
| Reference Number |
Item | ||
|---|---|---|---|
| 4.10 | Amended and Restated Declaration of Trust by and among Wilshire Bancorp, Inc., Wilmington Trust Company, Brian E. Cho and Elaine Jeon dated as of September 15, 2005(4) | ||
| 4.11 | Guaranty Agreement by and between Wilshire Bancorp, Inc. and Wilmington Trust Company dated as of September 15, 2005(4) | ||
| 4.12 | Indenture by and between Wilshire Bancorp, Inc. and LaSalle Bank National Association dated as of July 10, 2007.(5) | ||
| 4.13 | Amended and Restated Declaration of Trust by and among LaSalle National Trust Delaware, LaSalle Bank National Association, Wilshire Bancorp, Inc., Soo Bong Min and Brian E. Cho dated as of July 10, 2007.(5) | ||
| 4.14 | Guarantee Agreement by and between Wilshire Bancorp, Inc. and LaSalle Bank National Association dated as of July 10, 2007.(5) | ||
| 4.15 | Form of Certificate for the Series A Preferred Stock(2) | ||
| 4.16 | Warrant to Purchase Common Stock(2) | ||
| 10.1 | Lease dated September 1, 1996 between the Company and Wilmont, Inc. (Main Office—1st floor)(6) | ||
| 10.2 | Lease dated May 1, 1990 between the Company and Western Properties Co., Ltd. (Western Branch)(6) | ||
| 10.3 | Lease dated February 3, 1997 between the Company and Benlin Properties (Downtown Branch)(6) | ||
| 10.4 | Sublease dated June 20, 1997 between the Company and Property Development Assoc. (Cerritos Branch)(6) | ||
| 10.5 | 1997 Stock Option Plan of Wilshire Bancorp, Inc.(6),(12) | ||
| 10.6 | Addendum to Downtown Branch Lease, dated February 3, 1997 between the Company and Benlin Properties (Downtown Branch)(7) | ||
| 10.7 | Lease dated October 26, 1998 between the Company and Union Square Limited Partnership. (Seattle Business Lending Office)(7) | ||
| 10.8 | Lease dated March 18, 1999 between the Company and BGK Texas Property Management, Inc. (Dallas Business Lending Office)(8) | ||
| 10.9 | Lease dated February 4, 2000 between the Company and Wilmont, Inc. (Commercial Loan Center and Corporate headquarter—14th floor)(9) | ||
| 10.10 | Lease dated September 1, 2000 between the Company and Joseph Hanasab (Gardena Office)(10) | ||
| 10.11 | Lease dated January 8, 2001 between the Company and UNT Atia Co. II, a California general partnership (Rowland Heights Office)(9) | ||
| 10.12 | Sublease dated March 13, 2002 between the Company and Assi Food International, Inc. (Garden Grove Office)(11) | ||
| 10.13 | Lease dated October 3, 2002 between the Company and Terok Management, Inc. (Mid-Wilshire Office)(11) | ||
| 10.14 | Survivor income plan and exhibit thereto (Split dollar agreement)(10),(12) | ||
| 10.15 | Stock Purchase Agreement by and between Wilshire State Bank and Texas Bank dated January 29, 2004(15) | ||
| 10.16 | Consulting Agreement with Soo Bong Min dated December 19, 2007(12),(13) | ||
| 10.17 | Letter Agreement, dated as of December 12, 2008, including the Securities Purchase Agreement—Standard Terms incorporated by reference therein, between the Company and the United States Department of the Treasury(2) | ||
| 10.18 | Additional Letter Agreement, dated as of December 12, 2008, between the Company and the United States Department of the Treasury(2) | ||
| 10.19 | Form of Letter Agreement, executed by each of Joanne Kim, Alex Ko, Sung Soo Han, Seung Hoon Kang, and David Kim(2) | ||
113
| Reference Number |
Item | ||
|---|---|---|---|
| 10.20 | Form of Waiver, executed by each of Joanne Kim, Alex Ko, Sung Soon Han, Seung Hoon Kang, and David Kim(2) | ||
| 10.21 | Purchase and Assumption Agreement among Federal Deposit Insurance Corporation, Receiver of Mirae Bank, Federal Deposit Insurance Corporation and Wilshire State Bank, dated as of June 26, 2009(16) | ||
| 10.22 | 2008 Stock Option Plan of Wilshire Bancorp, Inc.(12),(14) | ||
| 10.23 | Lease dated July 31, 2009 between the Company and AYM Investment LLC, Laurel-Crest Group LLC, and Synchronicity LLC. (Downtown Branch)(21) | ||
| 10.24 | Lease dated January 21, 2010 between the Company and System II LLC. (Cerritos Branch)(21) | ||
| 10.25 | Addendum to Fashion Town Branch Lease, dated May 31, 2009 between the Company and San Pedro Properties LP. (Fashion Town Branch)(21) | ||
| 10.26 | Lease dated July 28, 2009 between the Company and New Hampshire Apartments, Inc. (Torrance Branch)(21) | ||
| 10.27 | Lease dated August 12, 2009 between the Company and Kam Hing Realty-NYC LLC. (Manhattan Branch)(21) | ||
| 10.28 | Addendum to Denver LPO Lease, dated August 11, 2008 between the Company and RMC/Pavillion Towers, LLC. (Denver, CO LPO(21)) | ||
| 10.29 | Lease dated December 15, 2009 between the Company and NDI Development. (Atlanta, GA LPO)(21) | ||
| 10.30 | Addendum to Denver LPO Lease, dated March 31, 2008 between the Company and YPI 9801 Westheimer, LLC. (Houston, TX LPO)(21) | ||
| 10.31 | Addendum to Annandale, VA LPO Lease, dated February 25, 2010 between the Company and Young H. Lim and Injoo Baik. (Annandale, VA LPO)(21) | ||
| 10.32 | Lease dated November 19, 2009 between the Company and Regency Centers, LP. (Van Nuys Branch)(21) | ||
| 10.33 | Lease dated September 2, 2008 between the Company and Roosevelt Avenue Corp. (Flushing, NY Branch)(21) | ||
| 10.34 | Lease dated July 31, 2009 between the Company and 2140 Lake, LLC c/o Jamison Services Inc. (Olympic Branch)(21) | ||
| 10.35 | Employment Agreement by and between the Bank and Jae Whan Yoo, effective February 18, 2011(18) | ||
| 10.36 | Form of Restricted Stock Agreement(19) | ||
| 10.37 | Wilshire Bancorp, Inc. 2008 Stock Incentive Plan(20) | ||
| 10.38 | Lease dated November 10, 2010 between the Company and LACOLA, INC. (Gardena, CA Branch) | ||
| 11 | Statement Regarding Computation of Net Earnings per Share(17) | ||
| 12.1 | Statement regarding computation of ratios of earnings to fixed charges | ||
| 21 | Subsidiaries of the Registrant | ||
| 23.1 | Consent of Independent Registered Public Accounting Firm | ||
| 31.1 | Certification of Chief Executive Officer pursuant to Section 302 of the Sarbanes-Oxley Act of 2002 | ||
| 31.2 | Certification of Chief Financial Officer pursuant to Section 302 of the Sarbanes-Oxley Act of 2002 | ||
| 32.1 | Certifications of Chief Executive Officer and Chief Financial Officer Pursuant to 18 U.S.C. Section 1350, as Adopted Pursuant to Section 906 of the Sarbanes-Oxley Act of 2002 | ||
| 99.1 | Certification Pursuant to Section 111(B)(4) of the Emergency Economic Stabilization Act of 2008, as amended (Principal Executive Officer) | ||
114
| Reference Number |
Item | ||
|---|---|---|---|
| 99.2 | Certification Pursuant to Section 111(B)(4) of the Emergency Economic Stabilization Act of 2008, as amended (Principal Financial Officer) | ||
- (1)
- Incorporated
by reference to the Exhibits in the Registration Statement on Form S-4, as filed with the SEC on
June 15, 2004.
- (2)
- Incorporated
by reference to the Exhibits in the Company's Form 8-K, as filed with the SEC on December 17, 2008.
- (3)
- Incorporated
by reference to the Exhibits in the Registration Statement on Form S-4, as filed with the SEC on
April 1, 2004.
- (4)
- Incorporated
by reference to the Exhibits to the Company's Form 10-K, as filed with the SEC on March 16, 2007.
- (5)
- Incorporated
by reference to the Exhibits to the Company's Form 10-Q, as filed with the SEC on November 9, 2007.
- (6)
- Incorporated
by reference to the Exhibits to the Company's Form 10-SB Registration Statement, as filed with the FDIC on
August 7, 1998.
- (7)
- Incorporated
by reference to the Exhibits to the Company's Form 10-KSB, as filed with the FDIC on March 30, 1999.
- (8)
- Incorporated
by reference to the Exhibits to the Company's Form 10-KSB, as filed with the FDIC on April 5, 2000.
- (9)
- Incorporated
by reference to the Exhibits to the Company's Form 10-KSB, as filed with the FDIC on March 29, 2001.
- (10)
- Incorporated
by reference to the Exhibits to the Company's Form 10-Q, as filed with the FDIC on August 20, 2003.
- (11)
- Incorporated
by reference to the Exhibits to the Company's Form 10-K, as filed with the FDIC on March 31, 2004.
- (12)
- Indicates
compensation or compensatory plan, contract, or arrangement.
- (13)
- Incorporated
by reference to the Exhibits to the Company's Form 8-K, as filed with the SEC on December 20, 2007.
- (14)
- Incorporated
by reference to the Exhibits to the Company's Form S-8, as filed with the SEC on July 18, 2008.
- (15)
- Incorporated
by reference to the Exhibits to the Company's Form 10-K, as filed with the SEC on March 12, 2009.
- (16)
- Incorporated
by reference to the Exhibits to the Company's Form 8-K, as filed with the SEC on June 26, 2009.
- (17)
- The
information required by this Exhibit is incorporated by reference from Note [19] of the Company's Financial
Statements included herein.
- (18)
- Incorporated
by reference to the Exhibit in the Company's Form 8-K, as filed with the SEC on February 24, 2011.
- (19)
- Incorporated
by reference to the Exhibit in the Company's Form 8-K, as filed with the SEC on December 3, 2009.
- (20)
- Incorporated
by reference to the Appendix in the Company's Definitive Proxy Statement on Schedule 14A, as filed with the SEC on
May 8, 2008.
- (21)
- Incorporated by reference to the Exhibits to the Company's Form 10-K, as filed with the SEC on March 15, 2010.
115
Pursuant to the requirements of Section 13 or 15(d) of the Securities Act of 1934, the registrant has duly caused this Amendment to be signed on its behalf by the undersigned, thereunto duly authorized.
| Date: March 16, 2011 | WILSHIRE BANCORP, INC. a California corporation |
|||
By: |
/s/ ALEX KO Alex Ko Chief Financial Officer |
|||
Pursuant to the requirements of the Securities Exchange Act of 1934, this Report has been signed below by the following persons on behalf of the Registrant and in the capacities and on the dates indicated.
Signature
|
Title
|
Date
|
||
|---|---|---|---|---|
| /s/ STEVEN KOH Steven Koh |
Chairman and Director | March 16, 2011 | ||
/s/ JAE WHAN YOO Jae Whan Yoo |
President and Chief Executive Officer (Principal Executive Officer) |
March 16, 2011 |
||
/s/ LAWRENCE JEON Lawrence Jeon |
Director |
March 16, 2011 |
||
/s/ KYU-HYUN KIM Kyu-Hyun Kim |
Director |
March 16, 2011 |
||
/s/ RICHARD Y. LIM Richard Y. Lim |
Director |
March 16, 2011 |
||
/s/ FRED F. MAUTNER Fred F. Mautner |
Director |
March 16, 2011 |
||
/s/ YOUNG H. PAK Young H. Pak |
Director |
March 16, 2011 |
116
Signature
|
Title
|
Date
|
||
|---|---|---|---|---|
| /s/ HARRY SIAFARIS Harry Siafaris |
Director | March 16, 2011 | ||
/s/ DONALD BYUN Donald Byun |
Director |
March 16, 2011 |
||
/s/ ALEX KO Alex Ko |
Chief Financial Officer (Principal Financial Officer and Principal Accounting Officer) |
March 16, 2011 |
117
Wilshire Bancorp, Inc.
Financial Statements as of December 31, 2010
and 2009 and for Each of the Three Years in the
Period Ended December 31, 2010 and
Report of Independent Registered Public
Accounting Firm
REPORT OF INDEPENDENT REGISTERED PUBLIC ACCOUNTING FIRM
To
the Board of Directors and Shareholders of
Wilshire Bancorp, Inc.
Los Angeles, California
We have audited the accompanying consolidated statements of financial condition of Wilshire Bancorp, Inc. and subsidiaries (the "Company") as of December 31, 2010 and 2009, and the related consolidated statements of operations, stockholders' equity, and cash flows for each of the three years in the period ended December 31, 2010. These financial statements are the responsibility of the Company's management. Our responsibility is to express an opinion on these financial statements based on our audits.
We conducted our audits in accordance with the standards of the Public Company Accounting Oversight Board (United States). Those standards require that we plan and perform the audit to obtain reasonable assurance about whether the financial statements are free of material misstatement. An audit includes examining, on a test basis, evidence supporting the amounts and disclosures in the financial statements. An audit also includes assessing the accounting principles used and significant estimates made by management, as well as evaluating the overall financial statement presentation. We believe that our audits provide a reasonable basis for our opinion.
In our opinion, such consolidated financial statements present fairly, in all material respects, the financial position of Wilshire Bancorp, Inc. and subsidiaries as of December 31, 2010 and 2009, and the results of their operations and their cash flows for each of the three years in the period ended December 31, 2010, in conformity with accounting principles generally accepted in the United States of America.
We have also audited, in accordance with the standards of the Public Company Accounting Oversight Board (United States), the Company's internal control over financial reporting as of December 31, 2010, based on the criteria established in Internal Control—Integrated Framework issued by the Committee of Sponsoring Organizations of the Treadway Commission and our report dated March 16, 2011 expressed an adverse opinion on the Company's internal control over financial reporting because of a material weakness.
/s/ Deloitte & Touche LLP
Los
Angeles, California
March 16, 2011
F-1
WILSHIRE BANCORP, INC.
CONSOLIDATED STATEMENTS OF FINANCIAL CONDITION (DOLLARS IN THOUSANDS)
| |
December 31, 2010 | December 31, 2009 | |||||||||
|---|---|---|---|---|---|---|---|---|---|---|---|
ASSETS |
|||||||||||
Cash and due from banks |
$ | 68,530 | $ | 155,753 | |||||||
Federal funds sold and other cash equivalents |
130,005 | 80,004 | |||||||||
Cash and cash equivalents |
198,535 | 235,757 | |||||||||
Securities available for sale, at fair value (amortized cost of $313,639 and $651,095 at December 31, 2010 and December 31, 2009, respectively) |
316,622 |
651,318 |
|||||||||
Securities held to maturity, at amortized cost (fair value of $89 and $109 at December 31, 2010 and December 31, 2009, respectively) |
85 | 109 | |||||||||
Loans receivable, net of allowance for loan losses of $110,953 and $62,130 at December 31, 2010 and December 31, 2009, respectively |
2,198,574 | 2,329,078 | |||||||||
Loans held for sale—at the lower of cost or market |
17,098 | 36,233 | |||||||||
Federal home loan bank stock, at cost |
18,531 | 20,850 | |||||||||
Other real estate owned |
14,983 | 3,797 | |||||||||
Due from customers on acceptances |
368 | 945 | |||||||||
Cash surrender value of bank owned life insurance |
18,662 | 18,037 | |||||||||
Investment in affordable housing partnerships |
28,186 | 13,732 | |||||||||
Bank premises and equipment |
13,330 | 12,660 | |||||||||
Accrued interest receivable |
10,581 | 15,266 | |||||||||
Deferred income taxes |
46,357 | 18,684 | |||||||||
Servicing assets |
7,331 | 6,898 | |||||||||
Goodwill |
6,675 | 6,675 | |||||||||
Core deposits intangibles |
1,645 | 2,013 | |||||||||
FDIC loss share indemnification |
28,199 | 33,775 | |||||||||
Other assets |
44,763 | 30,170 | |||||||||
TOTAL |
$ | 2,970,525 | $ | 3,435,997 | |||||||
LIABILITIES AND SHAREHOLDERS' EQUITY |
|||||||||||
LIABILITIES: |
|||||||||||
Deposits: |
|||||||||||
Noninterest bearing |
$ | 467,067 | $ | 385,188 | |||||||
Interest bearing: |
|||||||||||
Savings |
83,205 | 71,601 | |||||||||
Money market and NOW accounts |
692,395 | 932,063 | |||||||||
Time deposits of $100,000 or more |
699,685 | 795,679 | |||||||||
Other time deposits |
518,588 | 643,684 | |||||||||
Total deposits |
2,460,940 | 2,828,215 | |||||||||
Federal Home Loan Bank borrowings and other borrowings |
158,011 |
232,000 |
|||||||||
Junior subordinated debentures |
87,321 | 87,321 | |||||||||
Accrued interest payable |
4,092 | 5,865 | |||||||||
Acceptances outstanding |
368 | 945 | |||||||||
Other liabilities |
30,631 | 15,515 | |||||||||
Total liabilities |
2,741,363 | 3,169,861 | |||||||||
SHAREHOLDERS' EQUITY: |
|||||||||||
Preferred stock, $1,000 par value—authorized, 5,000,000 shares; issued and outstanding, 62,158 shares at December 31, 2010 and December 31, 2009, respectively |
60,450 | 59,931 | |||||||||
Common stock, no par value—authorized, 80,000,000 shares; issued and outstanding, 29,477,638 and 29,483,307 shares at December 31, 2010 and December 31, 2009, respectively |
55,601 | 54,918 | |||||||||
Accumulated other comprehensive income, net of tax |
2,012 | 326 | |||||||||
Retained earnings |
111,099 | 150,961 | |||||||||
Total shareholders' equity |
229,162 | 266,136 | |||||||||
TOTAL |
$ | 2,970,525 | $ | 3,435,997 | |||||||
See accompanying notes to consolidated financial statements.
F-2
WILSHIRE BANCORP, INC.
CONSOLIDATED STATEMENTS OF OPERATIONS
(DOLLARS IN THOUSANDS, EXCEPT PER SHARE DATA)
| |
For Each of the Three Years in the Period Ended December 31, 2010 |
|||||||||||
|---|---|---|---|---|---|---|---|---|---|---|---|---|
| |
2010 | 2009 | 2008 | |||||||||
INTEREST INCOME: |
||||||||||||
Interest and fees on loans |
$ | 140,028 | $ | 139,295 | $ | 137,630 | ||||||
Interest on investment securities |
14,726 | 16,573 | 10,749 | |||||||||
Interest on federal funds sold |
1,666 | 2,486 | 254 | |||||||||
Total interest income |
156,420 | 158,354 | 148,633 | |||||||||
INTEREST EXPENSE: |
||||||||||||
Interest on deposits |
37,096 | 48,690 | 51,912 | |||||||||
Interest on FHLB advances and other borrowings |
3,124 | 7,073 | 9,287 | |||||||||
Interest on junior subordinated debentures |
2,484 | 3,128 | 4,815 | |||||||||
Total interest expense |
42,704 | 58,891 | 66,014 | |||||||||
NET INTEREST INCOME BEFORE PROVISION FOR LOAN LOSSES AND LOAN COMMITMENTS |
113,716 | 99,463 | 82,619 | |||||||||
PROVISION FOR LOAN LOSSES AND LOAN COMMITMENTS |
150,800 | 68,600 | 12,110 | |||||||||
NET INTEREST (LOSS) INCOME AFTER PROVISION FOR LOAN LOSSES AND LOAN COMMITMENTS |
(37,084 | ) | 30,863 | 70,509 | ||||||||
NON-INTEREST INCOME: |
||||||||||||
Service charges on deposit accounts |
12,545 | 12,738 | 11,964 | |||||||||
Gain on sale of loans |
6,261 | 3,694 | 2,186 | |||||||||
Gain on sale of securities |
8,782 | 11,158 | — | |||||||||
Loan-related and other servicing fees |
4,163 | 3,703 | 3,174 | |||||||||
Gain from acquisition of Mirae Bank |
— | 21,679 | — | |||||||||
Other income |
4,161 | 4,344 | 3,322 | |||||||||
Total noninterest income |
35,912 | 57,316 | 20,646 | |||||||||
NON-INTEREST EXPENSES: |
||||||||||||
Salaries and employee benefits |
29,074 | 26,498 | 26,517 | |||||||||
Occupancy and equipment |
7,984 | 7,456 | 6,128 | |||||||||
Deposit insurance premiums |
4,523 | 4,780 | 1,285 | |||||||||
Data processing |
2,721 | 3,969 | 3,111 | |||||||||
Professional fees |
5,009 | 2,337 | 1,840 | |||||||||
Other operating |
18,065 | 12,329 | 9,519 | |||||||||
Total noninterest expenses |
67,376 | 57,369 | 48,400 | |||||||||
(LOSS) INCOME BEFORE INCOME TAXES |
(68,548 | ) | 30,810 | 42,755 | ||||||||
INCOME TAX (BENEFIT) PROVISION |
(33,790 | ) | 10,686 | 16,282 | ||||||||
NET (LOSS) INCOME |
(34,758 | ) | 20,124 | 26,473 | ||||||||
Preferred stock cash dividend and accretion of preferred stock |
3,626 | 3,620 | 155 | |||||||||
NET (LOSS) INCOME AVAILABLE TO COMMON SHAREHOLDERS |
$ | (38,384 | ) | $ | 16,504 | $ | 26,318 | |||||
PER COMMON SHARE INFORMATION |
||||||||||||
Basic |
$ | (1.30 | ) | $ | 0.56 | $ | 0.90 | |||||
Diluted |
$ | (1.30 | ) | $ | 0.56 | $ | 0.90 | |||||
WEIGHTED-AVERAGE COMMON SHARES OUTSTANDING: |
||||||||||||
Basic |
29,486,351 | 29,420,291 | 29,368,762 | |||||||||
Diluted |
29,486,351 | 29,429,299 | 29,407,388 | |||||||||
See accompanying notes to consolidated financial statements.
F-3
WILSHIRE BANCORP, INC.
CONSOLIDATED STATEMENTS OF SHAREHOLDERS' EQUITY
(DOLLARS IN THOUSANDS)
| |
|
Common Stock | |
|
|
|||||||||||||||||||
|---|---|---|---|---|---|---|---|---|---|---|---|---|---|---|---|---|---|---|---|---|---|---|---|---|
| |
|
Accumulated Other Comprehensive Income (Loss) |
|
|
||||||||||||||||||||
| |
Preferred Stock |
Numbers of Shares |
Amount | Retained Earnings |
Total Shareholders' Equity |
|||||||||||||||||||
BALANCE—January 1, 2008 |
$ | — | 29,253,311 | $ | 49,633 | $ | 375 | $ | 121,778 | $ | 171,786 | |||||||||||||
Stock options exercised |
160,446 | 470 | 470 | |||||||||||||||||||||
Cash dividend declared or accrued |
||||||||||||||||||||||||
Common stock |
(5,880 | ) | (5,880 | ) | ||||||||||||||||||||
Preferred stock |
(155 | ) | (155 | ) | ||||||||||||||||||||
Share-based compensation expense |
1,139 | 1,139 | ||||||||||||||||||||||
Tax benefit from stock options exercised |
57 | 57 | ||||||||||||||||||||||
Issuance of preferred stock—62,158 shares |
59,419 | 59,419 | ||||||||||||||||||||||
Accretion of discount on preferred stock |
24 | 24 | ||||||||||||||||||||||
Issuance of stock warrants—949,460 shares |
2,739 | 2,739 | ||||||||||||||||||||||
Cumulative impact of change in accounting for bank owned life insurance (net of tax) |
(1,876 | ) | (1,876 | ) | ||||||||||||||||||||
Comprehensive income: |
— | |||||||||||||||||||||||
Net income |
26,473 | 26,473 | ||||||||||||||||||||||
Other comprehensive income: |
||||||||||||||||||||||||
Change in unrealized gain on interest-only strips (net of tax) |
61 | 61 | ||||||||||||||||||||||
Change in unrealized gain on securities available for sale (net of tax) |
803 | 803 | ||||||||||||||||||||||
Comprehensive income |
27,337 | |||||||||||||||||||||||
BALANCE—December 31, 2008 |
$ | 59,443 | 29,413,757 | $ | 54,038 | $ | 1,239 | $ | 140,340 | $ | 255,060 | |||||||||||||
Stock options exercised |
1,900 | 5 | 5 | |||||||||||||||||||||
Restricted stock granted |
67,650 | 25 | 25 | |||||||||||||||||||||
Cash dividend declared or accrued |
||||||||||||||||||||||||
Common stock |
(5,883 | ) | (5,883 | ) | ||||||||||||||||||||
Preferred Stock |
(3,108 | ) | (3,108 | ) | ||||||||||||||||||||
Share-based compensation expense |
850 | 850 | ||||||||||||||||||||||
Accretion of discount on preferred stock |
488 | (512 | ) | (24 | ) | |||||||||||||||||||
Comprehensive income: |
||||||||||||||||||||||||
Net income |
20,124 | 20,124 | ||||||||||||||||||||||
Other comprehensive income (loss): |
||||||||||||||||||||||||
Change in unrealized gain on interest-only strips (net of tax) |
51 | 51 | ||||||||||||||||||||||
Change in unrealized loss on securities available for sale (net of tax) |
(964 | ) | (964 | ) | ||||||||||||||||||||
Comprehensive income |
19,211 | |||||||||||||||||||||||
BALANCE—December 31, 2009 |
$ | 59,931 | 29,483,307 | $ | 54,918 | $ | 326 | $ | 150,961 | $ | 266,136 | |||||||||||||
Stock options exercised |
11,800 | 98 | 98 | |||||||||||||||||||||
Restricted stock forfeited |
(18,192 | ) | (37 | ) | (37 | ) | ||||||||||||||||||
Cash dividend declared or accrued |
||||||||||||||||||||||||
Common stock |
723 | (6 | ) | (1,472 | ) | (1,478 | ) | |||||||||||||||||
Preferred Stock |
(3,113 | ) | (3,108 | ) | ||||||||||||||||||||
Share-based compensation expense |
626 | 626 | ||||||||||||||||||||||
Tax benefit from stock options exercised |
2 | 2 | ||||||||||||||||||||||
Accretion of discount on preferred stock |
519 | (519 | ) | — | ||||||||||||||||||||
Comprehensive income: |
||||||||||||||||||||||||
Net income |
(34,758 | ) | (34,758 | ) | ||||||||||||||||||||
Other comprehensive income (loss): |
||||||||||||||||||||||||
Change in unrealized gain on interest-only strips (net of tax) |
(16 | ) | (16 | ) | ||||||||||||||||||||
Change in unrealized loss on securities available for sale (net of tax) |
1,703 | 1,703 | ||||||||||||||||||||||
Comprehensive income |
(33,072 | ) | ||||||||||||||||||||||
BALANCE—December 31, 2010 |
$ | 60,450 | 29,477,638 | $ | 55,601 | $ | 2,013 | $ | 111,099 | $ | 229,162 | |||||||||||||
(Continued)
See accompanying notes to consolidated financial statements.
F-4
WILSHIRE BANCORP, INC.
CONSOLIDATED STATEMENTS OF CHANGES IN SHAREHOLDERS' EQUITY
(DOLLARS IN THOUSANDS)
| |
For Each of the Three Years in the Period Ended December 31, |
||||||||||
|---|---|---|---|---|---|---|---|---|---|---|---|
| |
2010 | 2009 | 2008 | ||||||||
DISCLOSURE OF RECLASSIFICATION AMOUNTS WITHIN ACCUMULATED OTHER COMPREHENSIVE INCOME: |
|||||||||||
Unrealized (losses) gains on securities available for sale arising during year |
$ | 2,939 | $ | (1,484 | ) | $ | 1,384 | ||||
Less income tax (benefit) expense |
1,236 | (520 | ) | 581 | |||||||
Net unrealized (losses) gains on securities available for sale |
$ | 1,703 | $ | (964 | ) | $ | 803 | ||||
Net unrealized gains on interest-only strips arising during period |
$ | (28 | ) | $ | 84 | $ | 105 | ||||
Less income tax expense |
(12 | ) | 33 | 44 | |||||||
Net unrealized gains on interest-only strips |
$ | (16 | ) | $ | 51 | $ | 61 | ||||
(Concluded)
See accompanying notes to consolidated financial statements.
F-5
WILSHIRE BANCORP, INC.
CONSOLIDATED STATEMENTS OF CASH FLOWS
(DOLLARS IN THOUSANDS)
| |
For each of the Three Years in the Period Ended December 31, 2010 | ||||||||||||
|---|---|---|---|---|---|---|---|---|---|---|---|---|---|
| |
2010 | 2009 | 2008 | ||||||||||
CASH FLOWS FROM OPERATING ACTIVITIES: |
|||||||||||||
Net (loss) income |
$ | (34,758 | ) | $ | 20,124 | $ | 26,473 | ||||||
Adjustments to reconcile net income to net cash |
|||||||||||||
Used in operating activities: |
|||||||||||||
Amortization of investment securities |
6,307 | 4,138 | 1,088 | ||||||||||
Depreciation of Bank premises and equipment |
2,129 | 2,112 | 1,809 | ||||||||||
Accretion of discount on acquired loans |
(4,000 | ) | (8,312 | ) | — | ||||||||
Amortization of core deposit intangibles |
368 | 605 | 298 | ||||||||||
Amortization of investments in affordable housing partnerships |
— | 1,289 | 809 | ||||||||||
Provision for losses on loans and loan commitments |
150,800 | 68,600 | 12,110 | ||||||||||
Provision for other real estate owned losses |
1,358 | 435 | 123 | ||||||||||
Deferred tax benefit |
(28,716 | ) | (6,146 | ) | (3,525 | ) | |||||||
Loss on disposition of bank premises and equipment |
20 | 17 | 158 | ||||||||||
Gain from acquisition of Mirae Bank |
— | (21,679 | ) | — | |||||||||
Net realized gain on sale of loans held for sale |
(6,261 | ) | (3,694 | ) | (2,186 | ) | |||||||
Proceeds from sale of loans held for sale |
132,106 | 66,232 | 51,681 | ||||||||||
Origination of loans held for sale |
(202,802 | ) | (80,139 | ) | (60,009 | ) | |||||||
Net realized gain on sale of available for sale securities |
(8,782 | ) | (11,158 | ) | (3 | ) | |||||||
Change in unrealized appreciation on servicing assets |
795 | 830 | 877 | ||||||||||
Net realized loss (gain) on sale of other real estate owned |
2,073 | (416 | ) | (17 | ) | ||||||||
Share-based compensation expense |
583 | 875 | 1,139 | ||||||||||
Change in cash surrender value of life insurance |
(626 | ) | (546 | ) | (634 | ) | |||||||
Servicing assets capitalized |
(1 ,228 | ) | (995 | ) | (766 | ) | |||||||
Tax benefit from exercise of stock options |
— | — | (57 | ) | |||||||||
Decrease (increase) in accrued interest receivable |
4,685 | (3,797 | ) | 87 | |||||||||
(Increase) decrease in other assets |
(43,415 | ) | (25,274 | ) | 649 | ||||||||
Dividends of Federal Home Loan Bank stock |
— | — | (616 | ) | |||||||||
Decrease in accrued interest payable |
(1,774 | ) | (4,045 | ) | (3,483 | ) | |||||||
Increase (Decrease) in other liabilities |
19,367 | 1,561 | (77 | ) | |||||||||
Net cash (used in) provided by operating activities |
(12,712 | ) | 617 | 25,928 | |||||||||
CASH FLOWS FROM INVESTING ACTIVITIES: |
|||||||||||||
Proceeds from principal repayment, matured or called securities held to maturity |
24 | 29 | 7,245 | ||||||||||
Purchase of securities available for sale |
(553,054 | ) | (866,880 | ) | (117,851 | ) | |||||||
Proceeds from principal repayments, matured, called, or sold securities available for sale |
892,985 | 505,605 | 113,270 | ||||||||||
Net increase in loans receivable |
(78,047 | ) | (121,041 | ) | (240,482 | ) | |||||||
Payment of FDIC loss share indemnification |
14,525 | 7,737 | — | ||||||||||
Proceeds from sale of other loans |
130,313 | 16,824 | — | ||||||||||
Proceeds from sale of other real estate owned |
16,647 | 2,946 | 875 | ||||||||||
Proceeds from sale of repossessed vehicles |
— | — | 28 | ||||||||||
Purchases of investments in affordable housing partnerships |
(4,780 | ) | (6,002 | ) | (3,606 | ) | |||||||
Purchases of bank premises and equipment |
(829 | ) | (3,234 | ) | (1,964 | ) | |||||||
Loss on investments in affordable housing partnership |
2,282 | — | — | ||||||||||
Redemption (purchases) of Federal Home Loan Bank stock |
2,319 | — | (8,225 | ) | |||||||||
Purchases of bank owned life insurance |
— | (96 | ) | (532 | ) | ||||||||
Proceeds from disposition of Bank equipment |
— | — | 3 | ||||||||||
Net cash and cash equivalents acquired from acquisition of Mirae Bank |
— | 5,724 | — | ||||||||||
Net cash provided (used in) by investing activities |
422,384 | (458,388 | ) | (251,239 | ) | ||||||||
(Continued)
See accompanying notes to consolidated financial statements.
F-6
WILSHIRE BANCORP, INC.
CONSOLIDATED STATEMENTS OF CASH FLOWS
(DOLLARS IN THOUSANDS)
| |
For each of the Three Years in the Period Ended December 31, 2010 |
|||||||||||
|---|---|---|---|---|---|---|---|---|---|---|---|---|
| |
2010 | 2009 | 2008 | |||||||||
CASH FLOWS FROM FINANCING ACTIVITIES: |
||||||||||||
Proceeds from exercise of stock options |
$ | 98 | $ | 5 | $ | 470 | ||||||
Payment of cash dividend on common stock |
(2,949 | ) | (5,883 | ) | (5,872 | ) | ||||||
Payment of cash dividend on preferred stock |
(3,108 | ) | (2,875 | ) | — | |||||||
Increase in Federal Home Loan Bank borrowings and other borrowings |
113,496 | 295,000 | 694,000 | |||||||||
Decrease in Federal Home Loan Bank borrowings and other borrowings |
(187,485 | ) | (412,500 | ) | (570,000 | ) | ||||||
Tax benefit from exercise of stock options |
2 | — | 57 | |||||||||
Net (decrease) increase in deposits |
(367,275 | ) | 722,240 | 49,530 | ||||||||
Cash proceed from issuance of preferred stock |
— | — | 62,158 | |||||||||
Net cash (used) provided by financing activities |
(447,221 | ) | 595,987 | 230,343 | ||||||||
NET (DECREASE) INCREASE IN CASH AND CASH EQUIVALENTS |
(37,222 | ) | 138,216 | 5,032 | ||||||||
CASH AND CASH EQUIVALENTS—Beginning of year |
235,757 | 97,541 | 92,509 | |||||||||
CASH AND CASH EQUIVALENTS—End of year |
$ | 198,535 | $ | 235,757 | $ | 97,541 | ||||||
SUPPLEMENTAL DISCLOSURES OF CASH FLOW INFORMATION: |
||||||||||||
Interest paid |
$ | 44,477 | $ | 59,983 | $ | 69,498 | ||||||
Income taxes paid |
$ | 16,509 | $ | 21,105 | $ | 19,429 | ||||||
SUPPLEMENTAL SCHEDULE OF NONCASH INVESTING AND FINANCING ACTIVITIES: |
||||||||||||
Real estate acquired through foreclosures |
$ | 29,191 | $ | 6,428 | $ | 3,510 | ||||||
Note financing for OREO sales |
$ | — | $ | 2,924 | $ | — | ||||||
Note financing for sale of other loans |
$ | 90,054 | $ | 24,857 | $ | — | ||||||
Net assets acquired from Mirae Bank (see Note 2) |
$ | — | $ | 21,679 | $ | — | ||||||
Other assets transferred to Bank premises and equipment |
$ | 1,990 | $ | 290 | $ | 312 | ||||||
Common stock cash dividend declared, but not paid |
$ | — | $ | 1,471 | $ | 1,471 | ||||||
Preferred stock cash dividend declared, but not paid |
$ | 388 | $ | 388 | $ | 155 | ||||||
(Concluded)
See accompanying notes to consolidated financial statements.
F-7
WILSHIRE BANCORP, INC.
NOTES TO CONSOLIDATED FINANCIAL STATEMENTS
FOR EACH OF THE THREE YEARS IN THE PERIOD ENDED DECEMBER 31, 2010
1. SUMMARY OF SIGNIFICANT ACCOUNTING POLICIES
Wilshire Bancorp, Inc. (the "Company" or "We") succeeded to the business and operations of Wilshire State Bank, a California state-chartered commercial bank (the "Bank"), upon consummation of the reorganization of the Bank into a holding company structure, effective as of August 25, 2004. Wilshire State Bank was incorporated under the laws of the State of California on May 20, 1980 and commenced operations on December 30, 1980. The Company was incorporated in December 2003 as a wholly owned subsidiary of the Bank for the purpose of facilitating the issuance of trust preferred securities for the Bank and eventually serving as the holding company of the Bank. The Bank's shareholders approved reorganization into a holding company structure at a meeting held on August 25, 2004. As a result of the reorganization, shareholders of the Bank are now shareholders of the Company and the Bank is a direct subsidiary of the Company. The Bank's primary source of revenue is from providing financing for business working capital, commercial real estate, and trade activities, and its investment portfolio. The accounting and reporting policies of the Bank are in accordance with accounting principles generally accepted in the United States of America and conform to general practices in the banking industry.
Principles of Consolidation—The consolidated financial statements include the accounts of the Company and its subsidiaries. Inter-company transactions and accounts have been eliminated in consolidation.
Cash and Cash Equivalents—Cash and cash equivalents include cash and due from banks, term and overnight federal funds sold, and securities purchased under agreements to resell, all of which have original maturities of less than 90 days. As of December 31, 2010, $68.5 million of cash and cash equivalents was from cash and due from banks, while $130.0 million was term federal funds sold.
Investment Securities—Investments are classified into three categories and accounted for as follows:
- (i)
- Securities
that the Company has the positive intent and ability to hold to maturity are classified as "held to maturity" and reported at amortized cost;
- (ii)
- Securities
that are bought and held principally for the purpose of selling them in the near future are classified as "trading securities" and reported at
fair value. The Company had no trading securities at December 31, 2010 and 2009. Unrealized gains and losses are recognized in noninterest income; and
- (iii)
- Securities not classified as held to maturity or trading securities are classified as "available for sale" and reported at fair value. Unrealized gains and losses are reported, net of taxes, as a separate component of accumulated other comprehensive income (loss) in shareholders' equity.
Accreted discounts and amortized premiums on investment securities are included in interest income using the effective interest method, and unrealized and realized gains or losses related to holding or selling securities are calculated using the specific-identification method.
In accordance with ASC 320-10-65-1 (Recognition and Presentation of Other-Than-Temporary Impairments), an other than temporary impairment ("OTTI") is recognized if the fair value of a debt security is lower than the amortized cost and the debt security will be sold, it is more likely than not, that it will be required to sell the security before recovering the amortized cost, or if it is expected that
F-8
WILSHIRE BANCORP, INC.
NOTES TO CONSOLIDATED FINANCIAL STATEMENTS (Continued)
FOR EACH OF THE THREE YEARS IN THE PERIOD ENDED DECEMBER 31, 2010
1. SUMMARY OF SIGNIFICANT ACCOUNTING POLICIES (Continued)
not all of the amortized cost will be recovered. Credit related declines in the fair value of debt securities below their amortized cost that are deemed to be other than temporary are reflected in earnings as realized losses in the consolidated statements of operations. Declines related to factors aside from credit issues are reflected in other comprehensive income, net of taxes. The Company did not record any other than temporary impairments on investment securities in 2010, 2009, and 2008. The accounting treatment for interest-only strips (I/O strips) are like debt securities; impairment charges reduces the cost basis of the I/O strips and reduce earnings.
Investment in available-for-sale securities is recorded at fair value pursuant to ASC 320-10 (SFAS No. 115, Accounting for Certain Investments in Debt and Equity Securities). Fair value measurement is based upon quoted prices for similar assets, if available. If quoted prices are not available, fair values are measured using matrix pricing models, or other model-based valuation techniques requiring observable inputs other than quoted prices such as yield curves, prepayment speeds, and default rates. The securities available for sale include federal agency securities, mortgage-backed securities, collateralized mortgage obligations, municipal bonds and corporate debt securities. Our existing investment available-for-sale security holdings as of December 31, 2010 are measured
Loans—Loans that management has the intent and ability to hold for the foreseeable future or until maturity or pay-off generally are reported at their outstanding unpaid principal balances adjusted for charge-offs, the allowance for loan losses, and any deferred fees or costs on originated loans.
Interest on loans is credited to income as earned and is accrued only if deemed collectible. Accrual of interest is generally discontinued when a loan is over 90 days delinquent unless management believes principal and interest on the loan is recoverable. Generally, payments received on nonaccrual loans are recorded as principal reductions. Interest income is recognized after all principal has been repaid or an improvement in the condition of the loan has occurred that would warrant resumption of interest accruals.
- (i)
- Loans Held for Sale
- (ii)
- Servicing Assets & Interest Only Strips
Certain loans that may be sold prior to maturity have been designated as held for sale at origination and are recorded at the lower of cost or market value. A valuation allowance is established if the market value of such loans is lower than their cost, and operations are charged or credited for valuation adjustments. The premium on the pro-rata principal of Small Business Administration or "SBA" loans sold is recognized as gain on sale of loans not at the time of the sale, but once any recourse provision expire. The remaining portion of the premium related to the unsold principal of SBA loans, is presented as unearned income in as discussed in Note 5, is deferred and amortized over the remaining life of the loan as an adjustment to yield.
Upon sales of SBA guaranteed loans, the Company receives a fee for servicing the loans. A servicing asset is recorded based on the present value of the contractually specified servicing fee, net of servicing cost, over the estimated life of the loan, with an average discount rate and a range of constant prepayment rates of the related loans. For purposes of measuring impairment, the servicing assets are stratified by collateral types. On January 1, 2007, the
F-9
WILSHIRE BANCORP, INC.
NOTES TO CONSOLIDATED FINANCIAL STATEMENTS (Continued)
FOR EACH OF THE THREE YEARS IN THE PERIOD ENDED DECEMBER 31, 2010
1. SUMMARY OF SIGNIFICANT ACCOUNTING POLICIES (Continued)
- (iii)
- Acquired Loans
Company adopted ASC 860-50 (formerly Statement of Financial Accounting Standards ("SFAS") No. 156—Accounting for Servicing of Financial Assets). Any subsequent increase or decrease in fair value of servicing assets and liabilities is to be included with loan related servicing income on our current earnings in the statement of operations.
An interest-only strips is recorded based on the present value of the excess of future interest income, generally amounts in excess of 1.00%, over the contractually specified servicing fee, calculated using the same assumptions as noted above. I/O strips are accounted for at their estimated fair value, with unrealized gains recorded as an adjustment in accumulated other comprehensive income in shareholders' equity. If the estimated fair value is less than its carrying value, the loss is considered an other-than-temporary impairment and it is charged to the current earnings. I/O strips are amortized over the remaining life of the loan as an adjustment to yield and monitored for impairment.
In accordance with ASC 805 (formerly FAS 141R Business Combinations), all acquired loans are recorded at fair value as of the date of an acquisition. The loans in the portfolio that the Company acquired from the Mirae Bank acquisition are covered by the FDIC loss-sharing agreement and such loans are referred to herein as "covered loans." All loans other than the covered loans are referred to herein as "non-covered loans." Covered loans acquired from Mirae Bank with evidence of credit deterioration with the probability that all contractually required payments will not be collected, are accounted for in accordance with ASC 310-30 (formerly AICPA Statement of Position SOP 03-3, Accounting for Certain Loans or Debt Securities Acquired in a Transfer) and are hereby referred to as "SOP 03-3 loans". In contrast, "Non-SOP 03-3" loans are all other covered loans that do not qualify as SOP 03-3 loans.
For Non-SOP 03-3 loans, the Company applies the effective interest income method for the discount accretion. The fair value of SOP 03-3 loans however, is recorded at the time of acquisition with expected credit losses factored in and incurred over the life of the loan. The Company estimates the amount and timing of expected cash flows for each purchased loan or pool of loans, and the expected cash flows in excess of amount paid is recorded as interest income over the remaining life of the loan. Over the life of the loan, expected cash flows continue to be estimated. If the present value of expected cash flows is less than the carrying amount, a loss is recorded. However, if the present value of expected cash flows is greater than the carrying amount, it is recognized as part of future interest income.
Covered loans, or loan covered under the loss sharing agreements with the FDIC in connection with the acquisition of Mirae Bank are reported in relation to the expected cash flows reimbursements from the FDIC. Interest income is accrued daily based on the outstanding principal balances and as the expected cash flows decreases, provision for loan losses is recorded and the estimated FDIC reimbursement is increased.
Nonrefundable fees, net of incremental costs, associated with the origination or acquisition of loans are deferred and recognized as an adjustment of the loan yield over the life of the loans using the interest method. Other loan fees and charges, representing service costs for the prepayment of
F-10
WILSHIRE BANCORP, INC.
NOTES TO CONSOLIDATED FINANCIAL STATEMENTS (Continued)
FOR EACH OF THE THREE YEARS IN THE PERIOD ENDED DECEMBER 31, 2010
1. SUMMARY OF SIGNIFICANT ACCOUNTING POLICIES (Continued)
loans, for delinquent payments, or for miscellaneous loan services, are recorded as income when collected.
Allowance for Loan Losses—Accounting for the allowance for loan losses involves significant judgment and assumptions by management and is based on historical data and estimation of probable losses inherent in the loan portfolio. The Company's methodology for assessing loan loss allowances is intended to reduce the differences between estimated and actual losses and involves a detailed analysis of the loan portfolio in three phases:
- •
- the specific review of individual loans in accordance with ASC 310-10 (SFAS No. 114, Accounting by Creditors for Impairment of a Loan),
- •
- the segmenting of loan pools with similar characteristics and utilizing historical losses on these pools in accordance
with ASC 450-10 (SFAS No. 5, Accounting for Contingencies), and
- •
- a judgmental estimate based on various qualitative factors.
During the third quarter of 2010, the Company enhanced the overall allowance for loan losses methodology. The key enhancements to our allowance methodology involved changes to our general valuation allowance calculation. As a result of changes to our loan portfolio since the initial implementation of our allowance for loan losses methodology, enhancements were made to the migration model and qualitative adjustment calculation to better reflect the current environment and risk in the loan portfolio. The enhancements to our historical loss rate calculation included a change in our analysis period from five to three years. In addition, our qualitative adjustment matrix was enhanced to include updated risk factors and an enhanced systematic calculation.
The first phase of our allowance analysis involves the specific review of individual loans to identify and measure impairment. At this phase, each loan is evaluated except for some homogeneous loans, such as automobile loans and overdraft loans. Specific risk-rated loans are deemed impaired with respect to all amounts, including principal and interest, which will likely not be collected in accordance with the contractual terms of the related loan agreement. Impairment for commercial and real estate loans is measured either based on the present value of the loan's expected future cash flows or, if collection on the loan is collateral dependent, the estimated fair value of the collateral less selling costs.
The second phase involves segmenting the remainder of the risk-rated loan portfolio into groups or pools of loans, together with loans with similar characteristics and loan grades for evaluation in accordance with ASC 450-10. Loss migration analysis is performed to calculate the loss migration ratio for each loan pool based on its historical net losses and benchmark it against the levels of other peer banks. Historical data from the previous 12 quarters is used with more weighting emphasis on recent quarters.
In the third phase, we consider relevant internal and external factors that may affect the collectability of the loan portfolio and each group of loan pools. As a general rule, the factors listed below will be considered to have insignificant impact to our loss migration analysis. However, if there exists information to warrant adjustment to the loss migration ratios, the changes will be made in accordance with the established parameters and supported by narrative and/or statistical analysis. A credit risk matrix is used to evaluate the presence, severity, and trends of each of the qualitative factors. The factors currently considered are, but are not limited to: concentration of credit,
F-11
WILSHIRE BANCORP, INC.
NOTES TO CONSOLIDATED FINANCIAL STATEMENTS (Continued)
FOR EACH OF THE THREE YEARS IN THE PERIOD ENDED DECEMBER 31, 2010
1. SUMMARY OF SIGNIFICANT ACCOUNTING POLICIES (Continued)
delinquency trend, nature and volume of loan trend, non-accrual and problem loan trends, loss and recovery trend, quality loan review and lending policies and procedures, economic conditions, and external factors such as changes in legal and regulatory requirements, on the level of estimated credit losses in the current portfolio. For all factors, the extent of the adjustment will be commensurate with the severity of the conditions that concern each factor.
Bank Premises and Equipment—Bank premises and equipment are stated at cost less accumulated depreciation and amortization. Depreciation on building, furniture, fixtures, and equipment is computed on the straight-line method over the estimated useful lives of the related assets, which range from 3 to 30 years. Leasehold improvements are capitalized and amortized on the straight-line method over the term of the lease or the estimated useful lives of the improvements, whichever is shorter.
Other Real Estate Owned—Other real estate owned, which represents real estate acquired through foreclosure in satisfaction of commercial and real estate loans, is stated at fair value less estimated selling costs of the real estate. Loan balances in excess of the fair value of the real estate acquired at the date of acquisition are charged to the allowance for loan losses.
Covered Other Real Estate Owned, or OREO covered under the loss sharing agreements with the FDIC in connection with the acquisition of Mirae Bank are reported in relation to the expected cash flows reimbursements from the FDIC. Once covered loan collateral becomes other real estate owned, the OREO is booked at the fair market value less selling cost. Decrease in fair values on covered OREOs results in a reduction of the carrying value and increases the estimated reimbursement amount from the FDIC.
Any subsequent operating expenses or income, reduction in estimated fair values, and gains or losses on disposition of such properties are recorded in current operations.
Impairment of Long-Lived Assets—The Company reviews its long-lived assets for impairment annually or when events or circumstances indicate that the carrying amount of these assets may not be recoverable. An asset is considered impaired when the expected undiscounted cash flows over the remaining useful life are less than the net book value. When impairment is indicated for an asset, the amount of impairment loss is the excess of the net book value over its fair value.
Federal Home Loan Bank ("FHLB") Stock—The Bank is a member of the FHLB system. Members are required to own a certain amount of stock based on the level of borrowings and other factors, and may invest in additional amounts. FHLB stock is carried at cost, classified as a restricted security, and both cash and stock dividends are reported as income. An impairment analysis of FHLB Stock is performed annually or when events or circumstances indicate possibility of impairment.
Bank Owned Life Insurance ("BOLI") Obligation —ASC 715-60-35 (formerly Emerging Issue Task Force ("EITF") 06-4) Accounting for Deferred Compensation and Postretirement Benefit Aspects of Endorsement Split-Dollar Life Insurance Arrangements) requires an employer to recognize obligations associated with endorsement split-dollar life insurance arrangements that extend into the participant's post-employment benefit cost for the continuing life insurance or based on the future death benefit depending on the contractual terms of the underlying agreement. ASC 715-60-35 is effective beginning the entity's first fiscal year after December 15, 2007. The Company adopted ASC 715-60-35 on
F-12
WILSHIRE BANCORP, INC.
NOTES TO CONSOLIDATED FINANCIAL STATEMENTS (Continued)
FOR EACH OF THE THREE YEARS IN THE PERIOD ENDED DECEMBER 31, 2010
1. SUMMARY OF SIGNIFICANT ACCOUNTING POLICIES (Continued)
January 1, 2008 using the latter option, i.e., based on the future death benefit. Upon this adoption, the Company recognized increases in the liability for unrecognized post-retirement obligations of $806,000 and $1,070,000 for directors and officers, respectively, as a cumulative adjustment to the year's beginning equity. During 2010 and 2009, the increase in BOLI expense and liability related to the adoption of ASC 715-60-35 was $628,000 and $870,000, respectively, which was included as part of the other expenses and other liabilities balances in the consolidated financial statements.
Affordable Housing Investment Partnerships—The Company has invested in limited partnerships formed to develop and operate affordable housing units for lower income tenants throughout the states of California, Texas, and New York. The investments were accounted for using the equity method of accounting. If the partnerships cease to qualify during the compliance period, the credits may be denied for any period in which the projects are not in compliance and a portion of the credits previously taken is subject to recapture with interest. Such investments are recorded in other assets in the accompanying consolidated statements of financial condition.
Goodwill—The Company recognized goodwill in connection with the acquisition of Liberty Bank of New York. In accordance with ASC 350-20 (SFAS No. 142—Goodwill and Other Intangible Assets), goodwill is no longer amortized, but rather subject to impairment testing at least annually. The Company tested goodwill for impairment as of December 31, 2010. There was no impairment in recorded goodwill as of December 31, 2010 (see Note 15).
FDIC Indemnification Asset—With the acquisition of Mirae Bank, The Bank entered into a loss-sharing agreement with the FDIC for amounts receivable under the agreement. The Company accounted for the receivable balances under the loss-sharing agreement as an FDIC Indemnification asset in accordance with ASC 805 (formerly FAS 141R Business Combinations). The FDIC indemnification is accounted for and calculated by adding the present value of all the cash flows that the Company expected to collect from the FDIC on the date of the acquisition as stated in the loss-sharing agreement. As expected and actual cash flows increase and decreased from what was expected at the time of acquisition, the FDIC indemnification will decrease and increase, respectively. When covered loans are paid-off and sold, the FDIC indemnification asset is reduced and is offset with interest income. Covered loans that become impaired, increases the indemnification assets.
Income Taxes—The Company accounted for income taxes under the asset and liability method, which requires the recognition of deferred tax assets and liabilities for the expected future tax consequences of events that have been included in the financial statements. Under this method, deferred tax assets and liabilities are determined based on the differences between the financial statements and tax basis of assets and liabilities using enacted tax rates in effect for the year in which the differences are expected to reverse. The effect of a change in tax rates on deferred tax rates for deferred tax assets and liabilities is recognized in income in the period that includes the enacted date.
The Company records net deferred tax assets to the extent it believes these assets will more likely than not be realized. In assessing the realizability of deferred tax assets, management considers whether it is more likely than not that some portion or all of the deferred tax assets will not be realized. Realization is dependent on generating sufficient taxable income prior to expiration of the loss carry-forwards. Although realization is not assured, management believes it is more likely than not that all of the deferred tax asset will be realized. The amount of the deferred tax asset considered realizable,
F-13
WILSHIRE BANCORP, INC.
NOTES TO CONSOLIDATED FINANCIAL STATEMENTS (Continued)
FOR EACH OF THE THREE YEARS IN THE PERIOD ENDED DECEMBER 31, 2010
1. SUMMARY OF SIGNIFICANT ACCOUNTING POLICIES (Continued)
however, could be reduced in the near term if estimates of future taxable income during the carry-forward period are reduced. A valuation allowance against deferred tax assets at the balance-sheet date is not considered necessary, because it is more likely than not the deferred tax asset will be fully realized.
In 2007, the Company adopted the provision of ASC 740-10-25 (formerly Financial Interpretation No. ("FIN") 48, Accounting for Uncertainty in Income Taxes), which clarifies the accounting for uncertainty in income taxes recognized in the financial statements in accordance with 740-10 (SFAS No. 109, Accounting for Income Taxes). ASC 740-10-25 provides that a tax benefit from an uncertain tax position may be recognized when it is more likely than not that the position will be sustained upon examination, including resolutions of any related appeals or litigation processes, based on the technical merits. A tax position is recognized as a benefit only if it is "more likely than not" that the tax position would be sustained in a tax examination, with a tax examination being presumed to occur. The amount recognized is the largest amount of tax benefit that is greater than 50% likely of being realized on examination. For tax positions not meeting the "more likely than not" test, no tax benefit is recorded. The Company recognized an increase in the liability for unrecognized tax benefit of $259,000 and related interest of $18,000 in 2010. As of December 31, 2010, the total unrecognized tax benefit was $657,000, and related interest was $46,000.
Earnings per Share—Basic earnings per share ("EPS") exclude dilution and are computed by dividing earnings available to common shareholders by the weighted-average number of common shares outstanding for the period. Diluted EPS reflects the potential dilution that could occur if securities or other contracts to issue common stock were exercised or converted into common stock or resulted in the issuance of common stock that would then share in the earnings of the Company.
Comprehensive Income—Comprehensive income consists of net income and other comprehensive income. Other comprehensive income includes unrealized gains and losses on I/O strips and securities available for sale. The accumulated change in other comprehensive income, net of tax, was recognized as a separate component of equity.
Dividend Restrictions—Banking regulations require maintaining certain capital levels and may limit the dividends paid by the bank to the Company or by the Company to shareholders. In addition, as part of the TARP agreement, the Company is limited to declare or pay or set apart for dividend payments on any common shares or shares of any other series of preferred stock rankings prior to fully fulfilling the dividend payment requirement of the TARP.
Stock-Based Compensation—The Company issued stock-based compensation to certain employees, officers, and directors. The Company accounted for stock-based compensation in accordance with ASC 718-10 (SFAS 123R, Share-Based Payment, for stock based compensation). The Company follows the modified prospective method, which requires application of ASC 718-10 to new awards and to awards modified, repurchased or cancelled after the required effective date. Accordingly, prior period amounts have not been restated. The compensation cost of that portion of awards is based on the grant-date fair value of those awards.
Use of Estimates in the Preparation of Financial Statements—The preparation of financial statements in conformity with accounting principles generally accepted in the United States of America requires
F-14
WILSHIRE BANCORP, INC.
NOTES TO CONSOLIDATED FINANCIAL STATEMENTS (Continued)
FOR EACH OF THE THREE YEARS IN THE PERIOD ENDED DECEMBER 31, 2010
1. SUMMARY OF SIGNIFICANT ACCOUNTING POLICIES (Continued)
management to make estimates and assumptions that affect the reported amounts of assets and liabilities and disclosure of contingent assets and liabilities at the date of the financial statements and the reported amounts of revenues and expenses during the reporting period. The most significant of these involves the allowance for loan losses as discussed above, estimates of fair values for purchased loans as discussed above and in Note 2, fair value for investments and impaired loans as discussed in Note 3. Actual results could differ from those estimates.
Recent Accounting Pronouncements
In January 2010, FASB issued Accounting Standards Update 2010-06, "Improving Disclosures about Fair Value Measurements." ASU 2010-06 will require reporting entities to make new disclosures about (a) amounts and reasons for significant transfers in and out of Level 1 and Level 2 fair value measurements, (b) Input and valuation techniques used to measure fair value for both recurring and nonrecurring fair value measurements that fall in either Level 2 or Level 3 and (c) information on purchases, sales, issuances and settlements in the roll forward of activity in Level 3 fair value measures. The new and revised disclosures are effective for interim and annual reporting periods beginning after December 15, 2009 except for disclosures about purchases, sales, issuances and settlements in the roll forward of activity in Level 3 fair value measures, which are effective for fiscal years beginning after December 15, 2010. The adoption of ASU 2010-06 effective for reporting periods after December 15, 2009 did not have a material impact on the consolidated financial statements. The adoption of this standard did not have a material impact on the consolidated financial statement.
In February 2010, the FASB issued ASU 2010-09, and amendment of ASC 855 (formerly Statement No. 165, Subsequent Events). ASC 855 was issued to establish general standards of accounting for and disclosure of events that occur after the balance sheet date but before the financial statements are issued or are available to be issued. ASC Topic 2010-09 amends ASC 855 by adding the "SEC filer", and "revised financial statements" to the ASC Master Glossary while removing the definition of "public entity" from the glossary. The amendment also exempts SEC filers from disclosing the date through which subsequent events have been evaluated and require SEC files and conduit debt obligors to evaluate subsequent events through the date the financial statements are issued. ASU 2010-09 is effective as of the issue date for financial statements that are issued, available to be issued, or revised. The adoption of this standard did not have a material impact on the consolidated financial statement.
In April 2010, FASB issued ASU 2010-18 "Effect of a Loan Modification When the Loan is Part of a Pool that is Accounted for as a Single Asset," which is effective for modifications of loans accounted for within pools under Subtopic 310-30 occurring in the first interim or annual period ending after July 15, 2010. Under the amendments, modifications of loans that are accounted for within a pool do not result in the removal of those loans from the pool even if the modification of those loans would otherwise be considered a troubled debt restructuring. An entity will continue to be required to consider whether the pool of assets in which the loan is included is impaired if expected cash flows for the pool change. The adoption of this standard did not have a material impact on the consolidated financial statement.
In July 2010, FASB issued ASU 2010-20 "Disclosures about the Credit Quality of Financing Receivables and the Allowance for Credit Losses" to improve disclosures about the credit quality of financing receivables and the allowance for credit losses. Companies will be required to provide more
F-15
WILSHIRE BANCORP, INC.
NOTES TO CONSOLIDATED FINANCIAL STATEMENTS (Continued)
FOR EACH OF THE THREE YEARS IN THE PERIOD ENDED DECEMBER 31, 2010
1. SUMMARY OF SIGNIFICANT ACCOUNTING POLICIES (Continued)
information about the credit quality of their financing receivables in the disclosures to financial statements, such as aging information and credit quality indicators. Both new and existing disclosures must be disaggregated by portfolio segment or class. The disaggregation of information is based on how a company develops its allowance for credit losses and how it manages its credit exposure. Required disclosures as of the end of a reporting period are effective for periods ending on or after December 15, 2010, while required disclosures about activity that occurs during a reporting period are effective for periods beginning on or after December 15, 2010. The adoption of this standard did not have a material impact on the consolidated financial statement.
FASB ASU 2010-20, "Receivable (Topic 310), Disclosures about the Credit Quality of Financing Receivables and the Allowance for Credit Losses"—ASU 2010-20 requires new and enhanced disclosures about the credit quality of an entity's financing receivables and its allowance for credit losses. The new and amended disclosure requirements focus on such areas as nonaccrual and past due financing receivables, allowance for credit losses related to financing receivables, impaired loans, credit quality information and modifications. The ASU requires an entity to disaggregate new and existing disclosures based on how it develops its allowance for credit losses and how it manages credit exposures. For public entities, the disclosures as of the end of a reporting period are effective for interim and annual reporting periods ending on or after December 15, 2010. The disclosures about activity that occurs during a reporting period are effective for interim and annual reporting periods beginning on or after December 15, 2010. See Note 5 in our footnotes to the Consolidated Financial Statements.
Newly Issued But Not Yet Effective Accounting Pronouncements
FASB ASU 2010-28, "Intangibles—Goodwill and Other (Topic 350), When to Perform Step 2 of the Goodwill Impairment Test for Reporting Units with Zero or Negative Carrying Amounts"—ASU 2010-28 affects all entities that have recognized goodwill and have one or more reporting units whose carrying amount for purposes of performing Step 1 of the goodwill impairment test is zero or negative. ASU 2010-28 modifies Step 1 so that for those reporting units, an entity is required to perform Step 2 of the goodwill impairment test if it is more likely than not that a goodwill impairment exists. In determining whether it is more likely than not that goodwill impairment exists, an entity should consider whether there are any adverse qualitative factors indicating that an impairment may exist. The qualitative factors are consistent with existing guidance, which requires that goodwill of a reporting unit be tested for impairment between annual tests if an event occurs or circumstances change that would more likely than not reduce the fair value of a reporting unit below its carrying amount. For public entities, this guidance is effective for fiscal years, and interim periods within those years, beginning after December 15, 2010. Adoption of ASU 2010-28 is not expected to have a significant impact on our consolidated financial statements.
2. FEDERALLY ASSISTED ACQUISITION OF MIRAE BANK
The FDIC placed Mirae under receivership upon Mirae's closure by the California Department of Financial Institutions ("DFI") at the close of business on June 26, 2009. The Bank purchased substantially all of Mirae's assets and assumed all of Mirae's deposits and certain other liabilities. Further, the Company entered into a loss sharing agreement with the FDIC in connection with the Mirae acquisition. Under the loss sharing agreement, the FDIC will share in the losses on assets
F-16
WILSHIRE BANCORP, INC.
NOTES TO CONSOLIDATED FINANCIAL STATEMENTS (Continued)
FOR EACH OF THE THREE YEARS IN THE PERIOD ENDED DECEMBER 31, 2010
2. FEDERALLY ASSISTED ACQUISITION OF MIRAE BANK (Continued)
covered under the agreement, which generally include loans acquired from Mirae and foreclosed loan collateral existing at June 26, 2009 (referred to collectively as "covered assets"). With respect to losses of up to $83.0 million on the covered assets, the FDIC has agreed to reimburse us for 80 percent of the losses. On losses exceeding $83.0 million, the FDIC has agreed to reimburse us for 95 percent of the losses. The loss sharing agreements are subject to our compliance with servicing procedures and satisfying certain other conditions specified in the agreements with the FDIC. The term for the FDIC's loss sharing on single family loans is ten years, and the term for loss sharing on non-single family loans is five years with respect to losses and eight years with respect to loss recoveries. As a result of the loss sharing agreement with the FDIC, the Company has recorded an indemnification asset from the FDIC based on the estimated value of the indemnification agreement of $40.2 million at June 26, 2009.
The Mirae acquisition was accounted for under the purchase method of accounting in accordance with FASB ASC 805. The statement of net assets and assumed liabilities were recorded at their respective acquisition date fair values, and identifiable intangible assets were recorded at fair value. Fair values are preliminary and are subject to refinements for up to one year after the closing date of an acquisition as information relative to closing date fair values becomes available. A "bargain purchase gain" totaling $21.7 million resulted from the acquisition and is included as a component of noninterest income on the statement of income. The amount of gain is equal to the amount by which the fair value of assets purchased exceeded the fair value of liabilities assumed as no consideration was paid to purchase Mirae Bank.
F-17
WILSHIRE BANCORP, INC.
NOTES TO CONSOLIDATED FINANCIAL STATEMENTS (Continued)
FOR EACH OF THE THREE YEARS IN THE PERIOD ENDED DECEMBER 31, 2010
2. FEDERALLY ASSISTED ACQUISITION OF MIRAE BANK (Continued)
The estimated fair value of the assets purchased and liabilities assumed are presented in the following table:
Statement of Net Assets Acquired
(Dollars in Thousands)
| |
At June 26, 2009 | ||||||
|---|---|---|---|---|---|---|---|
Assets |
|||||||
Cash and cash equivalents |
$ | 5,724 | |||||
Securities |
55,371 | ||||||
Loans |
285,685 | ||||||
Core deposit intangible |
1,330 | ||||||
FDIC loss-sharing receivable |
40,235 | ||||||
Other assets |
7,301 | ||||||
Total assets |
395,646 | ||||||
Liabilities |
|||||||
Deposits |
293,375 | ||||||
FHLB borrowings |
75,500 | ||||||
Other liabilities |
5,092 | ||||||
Total liabilities |
373,967 | ||||||
Net assets acquired |
$ | 21,679 | |||||
Mirae Bank's net assets acquired before fair valuation adjustments |
$ |
36,928 |
|||||
Adjustments to reflect assets acquired and liabilities assumed at fair value: |
|||||||
Loans, net |
(54,964 | ) | |||||
Securities |
(1,829 | ) | |||||
FDIC loss share indemnification |
40,235 | ||||||
Core deposit intangible |
1,330 | ||||||
Deposits |
(375 | ) | |||||
Servicing rights |
354 | ||||||
Bargain purchase gain |
$ | 21,679 | |||||
As of June 26, 2009, the Company recorded an FDIC indemnification asset of $40.2 million, consisting of the present value of the amounts the Company expects to receive from the FDIC under the shared-loss agreement. From June 26, 2009 through December 31, 2009, the Company recorded an additional $4.4 million due to charge-offs and impairment of loans. During 2010 the recorded additional indemnification due to charge-offs and impairment of loans totaled $11.9 million. As a result covered loan sales and pay-offs the indemnification asset was reduced by $3.1 million in 2009 and by $2.0 million in 2010. Additional indemnification due to loans transferred to OREO resulted in increase of indemnification assets by $858 thousand in 2010 and $0 in 2000. In November 2009, the Company received its first payment from FDIC, in the amount of $7.7 million. Additional payments received in
F-18
WILSHIRE BANCORP, INC.
NOTES TO CONSOLIDATED FINANCIAL STATEMENTS (Continued)
FOR EACH OF THE THREE YEARS IN THE PERIOD ENDED DECEMBER 31, 2010
2. FEDERALLY ASSISTED ACQUISITION OF MIRAE BANK (Continued)
2010 totaled $16.4 million, which consisted of $14.5 million in loss share indemnification payments and $1.9 million in expense reimbursements. As of December 31, 2010 and 2009, the recorded FDIC indemnification asset was $28.2 million and $33.8 million, respectively.
The table below reflects the FDIC indemnification assets from the date of the acquisition to December 31, 2009 and January 1, 2010 to December 31, 2010:
FDIC Indemnification Asset
(Dollars in Thousands)
| |
2010 | 2009 | |||||
|---|---|---|---|---|---|---|---|
Beginning balance |
$ | 33,775 | $ | 40,235 | |||
Additions resulting from charge-offs or impairment |
11,928 | 4,356 | |||||
Additions resulting from loans transfer to OREO |
858 | — | |||||
Payments received from the FDIC |
(14,525 | ) | (7,725 | ) | |||
Reimbursement of expense from the FDIC |
(1,833 | ) | — | ||||
Write-downs resulting from loans sold or paid-off |
(2,004 | ) | (3,091 | ) | |||
Ending balance at December 31, |
$ | 28,199 | $ | 33,775 | |||
Mirae Bank prior to the acquisition on June 26, 2009 was not a public traded company and therefore did not file any quarterly reports with the SEC. It was determined that Mirae Bank's financial information for years prior to the acquisition was unreliable. In accordance with ASC 805, proforma requirement were considered, however, due to the lack of information it was deemed impractical to provide the information required as the Company was unable to substantiate any of the significant assumptions of management prior to the acquisition.
3. FAIR VALUE OPTION AND MEASUREMENT FOR FINANCIAL ASSETS AND LIABILITIES
In September 2006, the FASB issued ASC 820 "Fair Value Measurement and Disclosure" (formerly SFAS No. 157, Fair Value Measurements), which provides a definition of fair value, establishes a framework for measuring fair value, and requires expanded disclosures about fair value measurements. ASC 820 defines fair value as the price that would be received to sell an asset or paid to transfer a liability in an arm's length transaction between market participants in the markets where the Company conducts business. ASC 820 clarifies that fair value should be based on the assumptions market participants would use when pricing an asset or liability and establishes a fair value hierarchy that prioritizes the information used to develop those assumptions. The fair value hierarchy gives the highest priority to quoted prices available in active markets and the lowest priority to data lacking transparency.
The fair value inputs of the instruments are classified and disclosed in one of the following categories pursuant to ASC 820:
Level 1—Unadjusted quoted prices in active markets for identical assets or liabilities that the reporting entity has the ability to access at the measurement date. The quoted price shall not be adjusted for the blockage factor (i.e., size of the position relative to trading volume).
F-19
WILSHIRE BANCORP, INC.
NOTES TO CONSOLIDATED FINANCIAL STATEMENTS (Continued)
FOR EACH OF THE THREE YEARS IN THE PERIOD ENDED DECEMBER 31, 2010
3. FAIR VALUE OPTION AND MEASUREMENT FOR FINANCIAL ASSETS AND LIABILITIES (Continued)
Level 2—Pricing inputs are inputs other than quoted prices included within Level 1 that are observable for the asset or liability, either directly or indirectly. Fair value is determined through the use of models or other valuation methodologies, including the use of pricing matrices. If the asset or liability has a specified (contractual) term, a Level 2 input must be observable for substantially the full term of the asset or liability.
Level 3—Pricing inputs are inputs unobservable for the asset or liability. Unobservable inputs shall be used to measure fair value to the extent that observable inputs are not available, thereby allowing for situations in which there is little, if any, market activity for the asset or liability at the measurement date. The inputs into the determination of fair value require significant management judgment or estimation.
In certain cases, the inputs used to measure fair value may fall into different levels of the fair value hierarchy. In such cases, an investment's level within the fair value hierarchy is based on the lowest level of input that is significant to the fair value measurement. Our assessment of the significance of a particular input to the fair value measurement in its entirety requires judgment and considers factors specific to the investment.
The Company adopted ASC 820-10 (SFAS No. 157) as of January 1, 2008 and ASC 820-10-35 (FSP SFAS No.157-3) as of October 10, 2008. It used the following methods and assumptions in estimating our fair value disclosure for financial instruments. Financial assets and liabilities recorded at fair value on a recurring and non-recurring basis are listed as follows:
Securities available for sale—Investment in available-for-sale securities is recorded at fair value pursuant to ASC 320-10 (SFAS No. 115, Accounting for Certain Investments in Debt and Equity Securities). Fair value measurement is based upon quoted prices for similar assets, if available. If quoted prices are not available, fair values are measured using matrix pricing models, or other model-based valuation techniques requiring observable inputs other than quoted prices such as yield curves, prepayment speeds, and default rates. The securities available for sale include federal agency securities, mortgage-backed securities, collateralized mortgage obligations, municipal bonds and corporate debt securities. Our existing investment available-for-sale security holdings as of December 31, 2010 are measured using matrix pricing models in lieu of direct price quotes and recorded based on Level 2 measurement inputs.
Collateral dependent impaired loans—A loan is considered to be impaired when it is probable that all of the principal and interest due under the original underwriting terms of the loan may not be collected. Fair value of collateral dependent loans is measured based on the fair value of the underlying collateral. The fair value is determined by management in part through the use of appraisals or by actual selling prices for loans that are under contract to sell. It is the Company's policy to update appraisals on all collateral dependent impaired loans every six months or less.
We obtain appraisals for all loans that have been identified by management as non-performing or potentially non-performing at month-end following such identification. Thereafter, the Company's Credit Administrator Clerk monitors all of our collateral dependent impaired loans and other non-performing loans on a monthly basis to ensure that updated appraisals are ordered and received at least every six months. Once an appraisal is received, if there is a difference between
F-20
WILSHIRE BANCORP, INC.
NOTES TO CONSOLIDATED FINANCIAL STATEMENTS (Continued)
FOR EACH OF THE THREE YEARS IN THE PERIOD ENDED DECEMBER 31, 2010
3. FAIR VALUE OPTION AND MEASUREMENT FOR FINANCIAL ASSETS AND LIABILITIES (Continued)
the updated appraisal value and the balance of the loan, we will either record a special valuation allowance for that difference, or we will charge-off the difference in accordance with our loan policy. We do not charge-off or make special allowances for only a portion of the difference between the appraisal value and the balance of the loan.
For any loan that has already been partially charged-off, there will be no change in the classification of that loan unless it satisfies our policy guidelines for returning a non-performing loan to a performing loan. The Company records impairments on all nonaccrual loans and trouble debt restructured loans based on the valuation methods above with the exception of automobile loans. Automobile loans are assessed based on a homogenous pool of loans and the Company has established specific reserves which is a component of the allowance for loan losses. The Company records impaired loans as non-recurring with Level 3 measurement inputs.
Other real estate owned ("OREO")—Other real estate owned or ("OREO"), consists principally of properties acquired through foreclosures. The fair values of OREOs are recorded at the lower of carrying value of the loan or estimated fair value at the time of foreclosure less selling costs. Fair values are derived from third party appraisals less selling costs and written offers that have been accepted. Management periodically performs valuations on OREO properties for fair valuation. Any subsequent declines in the fair value of the OREO property after the date of transfer are recorded as a write-down of the asset. However, in accordance with ASC 820-10, the following fair value disclosures for financial instruments, OREOs are recorded at fair value are presented based on appraised values and are not adjusted for selling costs.
Servicing assets and interest-only strips—Small Business Administration ("SBA") loan servicing assets and interest-only strips represent the value associated with servicing SBA loans sold. The value is determined through a discounted cash flow analysis which uses discount rates, prepayment speeds and delinquency rate assumptions as inputs. All of these assumptions require a significant degree of management judgment. The fair market valuation is performed on a quarterly basis for servicing assets while I/O strips are measures at the lower of cost or fair value. The Company classifies SBA loan servicing assets and interest-only strips as recurring with Level 3 measurement inputs.
Servicing liabilities—SBA loan servicing liabilities represent the value associated with servicing SBA loans sold. The value is determined through a discounted cash flow analysis which uses discount rates, prepayment speeds and delinquency rate assumptions as inputs. All of these assumptions require a significant degree of management judgment. The fair market valuation is performed on a quarterly basis. The Company classifies SBA loan servicing liabilities as recurring with Level 3 measurement inputs.
F-21
WILSHIRE BANCORP, INC.
NOTES TO CONSOLIDATED FINANCIAL STATEMENTS (Continued)
FOR EACH OF THE THREE YEARS IN THE PERIOD ENDED DECEMBER 31, 2010
3. FAIR VALUE OPTION AND MEASUREMENT FOR FINANCIAL ASSETS AND LIABILITIES (Continued)
The tables below summarize the valuation of our investments measured on a recurring basis by the above ASC 820-10 fair value hierarchy levels as of December 31, 2010 and December 31, 2009:
Assets Measured at Fair Value on a Recurring Basis
(Dollars in Thousands)
| |
As of December 31, 2010 | ||||||||||||||
|---|---|---|---|---|---|---|---|---|---|---|---|---|---|---|---|
| |
|
Fair Value Measurements Using: | |||||||||||||
| |
Total Fair Value |
Quoted Prices in Active Markets (Level 1) |
Significant Other Observable Inputs (Level 2) |
Significant Unobservable Inputs (Level 3) |
|||||||||||
Investments |
|||||||||||||||
Securities of government sponsored enterprises |
$ | 36,220 | $ | — | $ | 36,220 | $ | — | |||||||
Mortgage backed securities |
18,907 | — | 18,907 | — | |||||||||||
Collateralized mortgage obligations |
225,114 | — | 225,114 | — | |||||||||||
Corporate securities |
2,021 | — | 2,021 | — | |||||||||||
Municipal bonds |
34,360 | — | 34,360 | — | |||||||||||
Servicing assets |
7,331 | — | — | 7,331 | |||||||||||
Interest-only strips |
615 | — | — | 615 | |||||||||||
Servicing liabilities |
(393 | ) | — | — | (393 | ) | |||||||||
| |
As of December 31, 2009 | ||||||||||||||
|---|---|---|---|---|---|---|---|---|---|---|---|---|---|---|---|
| |
|
Fair Value Measurements Using: | |||||||||||||
| |
Total Fair Value |
Quoted Prices in Active Markets (Level 1) |
Significant Other Observable Inputs (Level 2) |
Significant Unobservable Inputs (Level 3) |
|||||||||||
Investments |
|||||||||||||||
Securities of government sponsored enterprises |
$ | 155,382 | $ | — | $ | 155,382 | $ | — | |||||||
Mortgage backed securities |
131,711 | — | 131,711 | — | |||||||||||
Collateralized mortgage obligations |
319,554 | — | 319,554 | — | |||||||||||
Corporate securities |
2,017 | — | 2,017 | — | |||||||||||
Municipal bonds |
42,654 | — | 42,654 | — | |||||||||||
Servicing assets |
6,898 | — | — | 6,898 | |||||||||||
Interest-only strips |
724 | — | — | 724 | |||||||||||
Servicing liabilities |
(407 | ) | — | — | (407 | ) | |||||||||
Financial instruments measured at fair value on a recurring basis, which were part of the asset balances that were deemed to have Level 3 fair value inputs when determining valuation, are identified
F-22
WILSHIRE BANCORP, INC.
NOTES TO CONSOLIDATED FINANCIAL STATEMENTS (Continued)
FOR EACH OF THE THREE YEARS IN THE PERIOD ENDED DECEMBER 31, 2010
3. FAIR VALUE OPTION AND MEASUREMENT FOR FINANCIAL ASSETS AND LIABILITIES (Continued)
in the table below by asset category with a summary of changes in fair value for the year ended December 31, 2010 and December 31, 2009:
December 31, 2010
(Dollars in Thousands)
|
At January 1, 2010 |
Net Realized Gains (Losses) in Net (Loss) Income* |
Net Unrealized Gains (Losses) in Other Comprehensive Income |
Net Purchases, Sales and Settlements |
Transfers In/out of Level 3 |
At December 31, 2010 |
Net Cumulative Unrealized Losses |
|||||||||||||||
|---|---|---|---|---|---|---|---|---|---|---|---|---|---|---|---|---|---|---|---|---|---|---|
Servicing assets |
$ | 6,898 | $ | 406 | $ | — | $ | 27 | $ | — | $ | 7,331 | $ | — | ||||||||
Interest-only strips |
724 | (79 | ) | (30 | ) | — | — | 615 | (284 | ) | ||||||||||||
Servicing liabilities |
(407 | ) | 14 | — | — | — | (393 | ) | — | |||||||||||||
December 31, 2010
(Dollars in Thousands)
|
At January 1, 2010 |
Net Realized Gains (Losses) in Net (Loss) Income* |
Net Unrealized Gains (Losses) in Other Comprehensive Income |
Net Purchases, Sales and Settlements |
Transfers In/out of Level 3 |
At December 31, 2010 |
Net Cumulative Unrealized Losses |
|||||||||||||||
|---|---|---|---|---|---|---|---|---|---|---|---|---|---|---|---|---|---|---|---|---|---|---|
Servicing assets |
$ | 4,838 | $ | (565 | ) | $ | — | $ | 2,625 | $ | — | $ | 6,898 | $ | — | |||||||
Interest-only strips |
632 | (109 | ) | 85 | 116 | — | 724 | 300 | ||||||||||||||
Servicing liabilities |
(328 | ) | 55 | — | (134 | ) | — | (407 | ) | — | ||||||||||||
The following tables present the aggregated balance of assets measured at estimated fair value on a non-recurring basis at December 31, 2010 and December 31, 2009, and the total losses resulting from these fair value adjustments for the twelve month ended December 31, 2010 and December 31, 2009:
Assets Measured at Fair Value on a Non-Recurring Basis
(Dollars in Thousands)
| |
December 31, 2010 | |
||||||||||||||
|---|---|---|---|---|---|---|---|---|---|---|---|---|---|---|---|---|
| |
Total Losses | |||||||||||||||
| |
Level 1 | Level 2 | Level 3 | Total | ||||||||||||
Collateral dependent impaired loans |
$ | — | $ | — | $ | 110,879 | $ | 110,879 | $ | 5,706 | ||||||
OREO |
— | — | 19,955 | 19,955 | 1,766 | |||||||||||
Total |
$ | — | $ | — | $ | 130,834 | $ | 130,834 | $ | 7,472 | ||||||
F-23
WILSHIRE BANCORP, INC.
NOTES TO CONSOLIDATED FINANCIAL STATEMENTS (Continued)
FOR EACH OF THE THREE YEARS IN THE PERIOD ENDED DECEMBER 31, 2010
3. FAIR VALUE OPTION AND MEASUREMENT FOR FINANCIAL ASSETS AND LIABILITIES (Continued)
| |
December 31, 2009 | |
||||||||||||||
|---|---|---|---|---|---|---|---|---|---|---|---|---|---|---|---|---|
| |
Total Losses | |||||||||||||||
| |
Level 1 | Level 2 | Level 3 | Total | ||||||||||||
Collateral dependent impaired loans |
$ | — | $ | — | $ | 128,764 | $ | 128,764 | $ | 10,250 | ||||||
OREO |
— | — | 4,031 | 4,031 | 435 | |||||||||||
Total |
$ | — | $ | — | $ | 132,795 | $ | 132,795 | $ | 10,685 | ||||||
4. INVESTMENT SECURITIES
The following is a summary of the investment securities at December 31:
2010 (Dollars in Thousands) |
Amortized Cost | Gross Unrealized Gain | Gross Unrealized Loss | Estimated Fair Value | ||||||||||
|---|---|---|---|---|---|---|---|---|---|---|---|---|---|---|
Available for sale: |
||||||||||||||
Securities of government sponsored enterprises |
$ | 35,953 | $ | 267 | $ | — | $ | 36,220 | ||||||
Mortgage-backed securities |
18,129 | 778 | — | 18,907 | ||||||||||
Collateralized mortgage obligations |
222,778 | 2,453 | 117 | 225,114 | ||||||||||
Corporate security |
2,000 | 21 | — | 2,021 | ||||||||||
Municipal bonds |
34,779 | 293 | 712 | 34,360 | ||||||||||
Total |
$ | 313,639 | $ | 3,812 | $ | 829 | $ | 316,622 | ||||||
Held to maturity: |
||||||||||||||
Collateralized mortgage obligations |
$ | 85 | $ | 4 | $ | — | $ | 89 | ||||||
Total |
$ | 85 | $ | 4 | $ | — | $ | 89 | ||||||
2009 (Dollars in Thousands) |
Amortized Cost | Gross Unrealized Gain | Gross Unrealized Loss | Estimated Fair Value | ||||||||||
|---|---|---|---|---|---|---|---|---|---|---|---|---|---|---|
Available for sale: |
||||||||||||||
Securities of government sponsored enterprises |
$ | 156,879 | $ | 103 | $ | 1,600 | $ | 155,382 | ||||||
Mortgage-backed securities |
131,617 | 820 | 726 | 131,711 | ||||||||||
Collateralized mortgage obligations |
318,531 | 1,998 | 975 | 319,554 | ||||||||||
Corporate securities |
2,000 | 17 | — | 2,017 | ||||||||||
Municipal bonds |
42,068 | 1,091 | 505 | 42,654 | ||||||||||
Total |
$ | 651,095 | $ | 4,029 | $ | 3,806 | $ | 651,318 | ||||||
Held to maturity: |
||||||||||||||
Collateralized mortgage obligations |
$ | 109 | $ | — | $ | — | $ | 109 | ||||||
Total |
$ | 109 | $ | — | $ | — | $ | 109 | ||||||
As of December 31, 2010, held-to-maturity securities, which are carried at their amortized costs, decreased to $85,000 from $109,000 at December 31, 2009. Available-for-sale securities, which are
F-24
WILSHIRE BANCORP, INC.
NOTES TO CONSOLIDATED FINANCIAL STATEMENTS (Continued)
FOR EACH OF THE THREE YEARS IN THE PERIOD ENDED DECEMBER 31, 2010
4. INVESTMENT SECURITIES (Continued)
stated at their fair market values, decreased to $316.6 million at December 31, 2010 from $651.3 million at December 31, 2009. The $334.7 million decrease in 2010 is mainly due reduction in high cost deposits which was supplemented by the proceeds from investment maturities, calls, and sales transactions. The Company had $337.5 million net purchases in 2010 and $423.6 million in net purchases in 2009. Unrealized gain recorded in 2010 was $2.8 million and unrealized loss recorded in 2009 was $1.5 million, respectively. In 2010, the net purchases total includes $553.1 million in securities purchases and paydowns, maturities, and called securities of $890.6 million. These increases reflect a strategy of improving our levels of liquidity using available-for-sale securities, in addition to immediately available funds which are maintained mainly in the form of overnight investments.
Accrued interest receivable on investment securities totaled $1.9 million and $3.5 million at December 31, 2010 and 2009, respectively.
The following tables show investments' gross unrealized losses and fair value, aggregated by investment category and length of time that individual securities have been in a continuous unrealized loss position, at December 31, 2010 and 2009:
| |
Less than 12 months | 12 months or longer | Total | ||||||||||||||||
|---|---|---|---|---|---|---|---|---|---|---|---|---|---|---|---|---|---|---|---|
As of December 31, 2010 (Dollars in Thousands) Description of Securities (AFS)(1) |
Fair Value | Gross Unrealized Losses | Fair Value | Gross Unrealized Losses | Fair Value | Gross Unrealized Losses | |||||||||||||
Securities of government sponsored enterprises |
$ | — | $ | — | $ | — | $ | — | $ | — | $ | — | |||||||
Collateralized mortgage obligations |
27,650 | (117 | ) | — | — | 27,650 | (117 | ) | |||||||||||
Mortgage-backed securities |
— | — | — | — | — | — | |||||||||||||
Corporate securities |
— | — | — | — | — | — | |||||||||||||
Municipal bonds |
20,281 | (448 | ) | 1,450 | (264 | ) | 21,731 | (712 | ) | ||||||||||
|
$ | 47,931 | $ | (565 | ) | $ | 1,450 | $ | (264 | ) | $ | 49,381 | $ | (829 | ) | ||||
| |
Less than 12 months | 12 months or longer | Total | ||||||||||||||||
|---|---|---|---|---|---|---|---|---|---|---|---|---|---|---|---|---|---|---|---|
As of December 31, 2010 (Dollars in Thousands) Description of Securities (AFS) |
Fair Value | Gross Unrealized Losses | Fair Value | Gross Unrealized Losses | Fair Value | Gross Unrealized Losses | |||||||||||||
Securities of government sponsored enterprises |
$ | 110,296 | $ | (1,600 | ) | $ | — | $ | — | $ | 110,296 | $ | (1,600 | ) | |||||
Collateralized mortgage obligations |
145,622 | (975 | ) | — | — | 145,622 | (975 | ) | |||||||||||
Mortgage-backed securities |
85,313 | (726 | ) | — | — | 85,313 | (726 | ) | |||||||||||
Corporate securities |
— | — | — | — | — | — | |||||||||||||
Municipal bonds |
8,783 | (505 | ) | — | — | 18,783 | (505 | ) | |||||||||||
|
$ | 360,014 | $ | (3,806 | ) | $ | — | $ | — | $ | 360,014 | $ | (3,806 | ) | |||||
- (1)
- There were no held to maturity securities with losses as of December 31, 2010 or December 31, 2009.
F-25
WILSHIRE BANCORP, INC.
NOTES TO CONSOLIDATED FINANCIAL STATEMENTS (Continued)
FOR EACH OF THE THREE YEARS IN THE PERIOD ENDED DECEMBER 31, 2010
4. INVESTMENT SECURITIES (Continued)
Credit related declines in the fair value of held-to-maturity and available-for-sale securities below their cost that are deemed to be other than temporary are reflected in earnings as realized losses in the consolidated statements of operations and declines related to all other factors are reflected in other comprehensive income, net of taxes. In estimating other-than-temporary impairment losses, the Company considers, among other things, (i) the length of time and the extent to which the fair value has been less than cost, (ii) the financial condition and near-term prospects of the issuer, and (iii) our intent and ability to retain our investment in the issuer for a period of time sufficient to allow for any anticipated recovery in fair value.
The Company performs an evaluation of the investment portfolio in assessing individual positions that have market values that have declined below cost. In assessing whether there is other-than-temporary impairment, the Company considers:
- •
- Whether or not all contractual cash flows due on a security will be collected
- •
- The Company's positive intent and ability to hold the debt security until recovery in fair value or maturity
A number of factors are considered in the analysis, including but not limited to:
- •
- Issuer's credit rating
- •
- Likelihood of the issuer's default or bankruptcy
- •
- Collateral underlying the security
- •
- Industry in which the issuer operates
- •
- Nature of the investment
- •
- Severity and duration of the decline in fair value
- •
- Analysis of the average life and effective maturity of the security
The Company does not believe that any individual unrealized loss as of December 31, 2010 represents an other than temporary impairment. An other than temporary impairment ("OTTI") is recognized if the fair value of a debt security is lower than the amortized cost and the debt security will be sold, it is more likely than not, that it will be required to sell the security before recovering the amortized cost, or if it is expected that not all of the amortized cost will be recovered. Credit related declines in the fair value of debt securities below their amortized cost that are deemed to be other than temporary are reflected in earnings as realized losses in the consolidated statements of operations. Declines related to factors aside from credit issues are reflected in other comprehensive income, net of taxes.
The unrealized losses on our government sponsored enterprises ("GSE") bonds, collateralized mortgage obligations ("CMOs"), and mortgage-backed securities ("MBS") are primarily attributable to both changes in interest rate (U.S. Treasury curve) and a repricing of risk (spreads widening against risk-fee rate) in the market. All GSE bonds, GSE CMO, and GSE MBS securities are backed by U.S. Government Sponsored and Federal Agencies and therefore rated "AAA." The Company has no exposure to the "Subprime Market" in the form of Asset Backed Securities ("ABS") and Collateralized
F-26
WILSHIRE BANCORP, INC.
NOTES TO CONSOLIDATED FINANCIAL STATEMENTS (Continued)
FOR EACH OF THE THREE YEARS IN THE PERIOD ENDED DECEMBER 31, 2010
4. INVESTMENT SECURITIES (Continued)
Debt Obligations ("CDOs") that had previously been rated "AAA" but has since been downgraded to below investment grade. The Subprime market is made up of Subprime mortgages or loans that do not meet Fannie Mae or Freddie Mac underwriting standards. Subprime loans inherently have more associated risk due to the inferior credit quality of the borrower. The Company has the intent and ability to hold the securities in an unrealized loss position at December 31, 2010 and 2009 until the market value recovers or the securities mature.
Municipal bonds and corporate bonds are evaluated by reviewing the credit-worthiness of the issuer and general market conditions. The unrealized losses on our investment in municipal and corporate securities were primarily attributable to both changes in interest rates and a repricing risk in the market. The Company has the intent and ability to hold the securities in an unrealized loss position at December 31, 2010 and 2009 until the market value recovers or the securities mature.
The amortized cost and estimated fair value of investment securities at December 31, 2010, by contractual maturity, are shown below:
| |
2010 | 2009 | ||||||||||||
|---|---|---|---|---|---|---|---|---|---|---|---|---|---|---|
(Dollars in Thousands)
|
Amortized Cost |
Estimated Fair Value |
Amortized Cost |
Estimated Fair Value |
||||||||||
Available for sale: |
||||||||||||||
Due in one year or less |
$ | 295 | $ | 300 | $ | 31,071 | $ | 31,792 | ||||||
Due after one year through five years |
3,132 | 3,220 | 263,203 | 263,820 | ||||||||||
Due after five years through ten years |
43,809 | 44,303 | 148,220 | 147,120 | ||||||||||
Due after ten years |
266,403 | 268,799 | 208,601 | 208,586 | ||||||||||
Total |
$ | 313,639 | $ | 316,622 | $ | 651,095 | $ | 651,318 | ||||||
Held to maturity: |
||||||||||||||
Due in one year or less |
$ | — | $ | — | $ | — | $ | — | ||||||
Due after one year through five years |
— | — | — | — | ||||||||||
Due after five years through ten years |
— | — | — | — | ||||||||||
Due after ten years |
85 | 89 | 109 | 109 | ||||||||||
Total |
$ | 85 | $ | 89 | $ | 109 | $ | 109 | ||||||
Securities with amortized cost of approximately $308.7 million and $629.5 million were pledged to secure public deposits and for other purposes as required or permitted by law at December 31, 2010 and 2009, respectively.
F-27
WILSHIRE BANCORP, INC.
NOTES TO CONSOLIDATED FINANCIAL STATEMENTS (Continued)
FOR EACH OF THE THREE YEARS IN THE PERIOD ENDED DECEMBER 31, 2010
5. LOANS RECEIVABLE, LOANS HELD FOR SALE, AND ALLOWANCE FOR LOAN LOSSES
The following is a summary of loans as of December 31:
| |
2010 | 2009 | |||||||||||
|---|---|---|---|---|---|---|---|---|---|---|---|---|---|
(Dollars in Thousands)
|
Loans Held for Sale |
Loans Receivable |
Loans Held for Sale |
Loans Receivable |
|||||||||
Commercial loans |
$ | 1,007 | $ | 325,412 | $ | 1,240 | $ | 386,203 | |||||
Real estate loans |
16,091 | 1,973,194 | 34,993 | 1,993,082 | |||||||||
Installment loans |
— | 15,685 | — | 17,234 | |||||||||
|
17,098 | 2,314,291 | 36,233 | 2,396,519 | |||||||||
Allowance for loan losses |
— | (110,953 | ) | — | (62,130 | ) | |||||||
Deferred loan fees |
— | (494 | ) | — | (744 | ) | |||||||
Unearned income |
— | (4,271 | ) | — | (4,567 | ) | |||||||
Net loans |
$ | 17,098 | $ | 2,198,574 | $ | 36,233 | $ | 2,329,078 | |||||
At December 31, 2010, 2009, and 2008, the Company serviced loans sold to unaffiliated parties in the amounts of $463.9 million, $432.6 million, and $315.0 million, respectively.
The maturity or repricing distribution of the loan portfolio as of December 31, 2010 is as follows:
(Dollars in Thousands)
|
Loans Held for Sale |
Loans Receivable |
Total Loans | |||||||
|---|---|---|---|---|---|---|---|---|---|---|
Less than one year |
$ | 14,573 | $ | 1,632,681 | $ | 1,647,254 | ||||
One to five years |
1,540 | 661,581 | 663,121 | |||||||
After five years |
985 | 20,029 | 21,014 | |||||||
Total gross loans |
$ | 17,098 | $ | 2,314,291 | $ | 2,331,389 | ||||
The rate composition of the loan portfolio as of December 31, 2010 is as follows:
(Dollars in Thousands)
|
Loans Held for Sale |
Loans Receivable |
Total Loans | |||||||
|---|---|---|---|---|---|---|---|---|---|---|
Fixed rate loans |
$ | 2,525 | $ | 1,020,723 | $ | 1,023,248 | ||||
Variable rate loans |
14,573 | 1,293,568 | 1308,141 | |||||||
Total gross loans |
$ | 17,098 | $ | 2,314,291 | $ | 2,331,389 | ||||
The amounts on the tables above are the gross loan balance at December 31, 2010 before netting deferred loan fees and unearned income totaling $4.8 million.
As of June 26, 2009, the Company has acquired Mirae Bank through the FDIC. Upon acquiring certain assets and liabilities, the Company entered into loss sharing agreements with the FDIC where the FDIC will share in losses on assets covered under the agreements. With respect to losses of up to $83.0 million on the covered assets, the FDIC has agreed to reimburse us for 80 percent of the losses. On losses exceeding $83.0 million, the FDIC has agreed to reimburse us for 95 percent of the losses. The term for the FDIC's loss sharing on single family loans is ten years, and the term for loss sharing on non-single family loans is five years for losses and eight years for loss recoveries. As of
F-28
WILSHIRE BANCORP, INC.
NOTES TO CONSOLIDATED FINANCIAL STATEMENTS (Continued)
FOR EACH OF THE THREE YEARS IN THE PERIOD ENDED DECEMBER 31, 2010
5. LOANS RECEIVABLE, LOANS HELD FOR SALE, AND ALLOWANCE FOR LOAN LOSSES (Continued)
December 31, 2010, the balance of loans which are subject to the single family loss sharing agreement was $1.3 million and the balance of loans which are subject to the non-single family loss sharing agreement was $208.2 million. As of December 31, 2010, the balance of loans which are subject to the single family loss sharing agreement was $1.3 million and the balance of loans which are subject to the non-single family loss sharing agreement was $208.2 million. For those purchased loans, the Company increased the net allowance for loan losses by $1.7 million and $753,000 during 2010 and 2009, respectively.
The carrying amount of those loans as of December 31 is as follows:
(Dollars in Thousands)
|
2010 | 2009 | |||||
|---|---|---|---|---|---|---|---|
Non SOP 03-3 Loans |
$ | 203,701 | $ | 248,204 | |||
SOP 03-3 Loans |
5,789 | 10,879 | |||||
Outstanding balance |
$ | 209,490 | $ | 259,083 | |||
Carrying value, net of allowance for loan losses |
$ | 207,004 | $ | 258,330 | |||
SOP 03-3 loans are purchased loans for which it was probable at acquisition that all contractually required payments would not be collected. Following is the summary of SOP 03-3 loans as of December 31:
(Dollars in Thousands)
|
2010 | 2009 | |||||
|---|---|---|---|---|---|---|---|
Breakdown of SOP 03-03 loans: |
|||||||
Real estate loans |
$ | 5,064 | $ | 6,881 | |||
Commercial loans |
$ | 725 | $ | 3,998 | |||
Loans acquired from Mirae Bank were purchased at a discount. Accretion of $6.7 million on loans purchased at discount of $54.9 million was recorded as interest income in 2009 and $4.0 million in accretion income was recorded in 2010.
The Company evaluates credit risks associated with the commitments to extend credit and letters of credit at the same time it evaluates credit risk associated with the loan portfolio. However, the allowances necessary for the commitments are reported separately in other liabilities in the accompanying statements of financial condition and are not part of the allowance for loan losses as presented above.
F-29
WILSHIRE BANCORP, INC.
NOTES TO CONSOLIDATED FINANCIAL STATEMENTS (Continued)
FOR EACH OF THE THREE YEARS IN THE PERIOD ENDED DECEMBER 31, 2010
5. LOANS RECEIVABLE, LOANS HELD FOR SALE, AND ALLOWANCE FOR LOAN LOSSES (Continued)
The activity in the allowance for loan losses was as follows for the years ended December 31:
(Dollars in Thousands)
|
2010 | 2009 | 2008 | |||||||
|---|---|---|---|---|---|---|---|---|---|---|
Balance—beginning of year |
$ | 62,130 | $ | 29,437 | $ | 21,579 | ||||
Provision for loan losses |
148,800 | 67,328 | 12,865 | |||||||
FDIC receivable |
5,053 | 856 | — | |||||||
Loans charged-off |
(109,229 | ) | (36,743 | ) | (7,147 | ) | ||||
Recoveries of charge-offs |
3,610 | 1,252 | 2,140 | |||||||
Transferred from off balance sheet item |
589 | — | — | |||||||
Balance—end of year |
$ | 110,953 | $ | 62,130 | $ | 29,437 | ||||
The activity in liabilities for losses on loan commitments was as follows for the years ended December 31:
(Dollars in Thousands)
|
2010 | 2009 | 2008 | |||||||
|---|---|---|---|---|---|---|---|---|---|---|
Balance—beginning of year |
$ | 2,515 | $ | 1,243 | $ | 1,998 | ||||
Provision (benefit) for losses on loan commitments |
2,000 | 1,272 | (755 | ) | ||||||
Transferred to on-balance sheet loan loss provision |
(589 | ) | — | — | ||||||
Balance—end of year |
$ | 3,926 | $ | 2,515 | $ | 1,243 | ||||
The following tables table is breakdown of the allowance for loan losses at December 31, 2010 by loan type:
| |
Commercial Real Estate Loans | |
|
|
|
|
|
|
|||||||||||||||||||||||||||||
|---|---|---|---|---|---|---|---|---|---|---|---|---|---|---|---|---|---|---|---|---|---|---|---|---|---|---|---|---|---|---|---|---|---|---|---|---|---|
(Dollars In Thousands)
|
Gas Station |
Carwash | Hotel/ Motel |
Land | Other | Residential Real Estate |
Construction | SBA Real Estate |
SBA Commercial |
Commercial | Consumer/ Other |
Total | |||||||||||||||||||||||||
Balances at beginning of year |
$ | 2,109 | $ | 3,835 | $ | 4,631 | $ | 1,202 | $ | 18,329 | $ | 806 | $ | 411 | $ | 3,535 | $ | 5,425 | $ | 21,615 | $ | 232 | $ | 62,130 | |||||||||||||
Total Charge-Off |
4,363 | 6,585 | 18,473 | 11,045 | 44,971 | 1,829 | 401 | 3,314 | 2,902 | 15,080 | 266 | 109,229 | |||||||||||||||||||||||||
Total recoveries |
82 | — | 11 | — | 203 | 45 | 5 | 719 | 421 | 1,981 | 143 | 3,610 | |||||||||||||||||||||||||
FDIC Indemnification |
432 | 529 | 130 | — | (79 | ) | — | — | 373 | 290 | 3,313 | 65 | 5,053 | ||||||||||||||||||||||||
Provision For Loan Losses |
5,673 | 8,440 | 32,784 | 12,481 | 66,305 | 3,594 | 7,247 | 618 | 2,116 | 10,124 | 7 | 149,389 | |||||||||||||||||||||||||
Balance At December 31st |
$ | 3,933 | $ | 6,219 | $ | 19,083 | $ | 2,638 | $ | 39,787 | $ | 2,616 | $ | 7,262 | $ | 1,931 | $ | 5,350 | $ | 21,953 | $ | 181 | $ | 110,953 | |||||||||||||
| |
Commercial Real Estate Loans | |
|
|
|
|
|
|
||||||||||||||||||||||||||||||
|---|---|---|---|---|---|---|---|---|---|---|---|---|---|---|---|---|---|---|---|---|---|---|---|---|---|---|---|---|---|---|---|---|---|---|---|---|---|---|
(Dollars In Thousands)
|
Gas Station |
Carwash | Hotel/ Motel |
Land | Other | Residential Real Estate |
Construction | SBA Real Estate |
SBA Commercial |
Commercial | Consumer/ Other |
Total | ||||||||||||||||||||||||||
Impaired Loans |
$ | 18,927 | $ | 26,699 | $ | 19,109 | $ | 18,277 | $ | 56,862 | $ | 7,563 | — | $ | 38,947 | $ | 11,030 | $ | 9,587 | — | $ | 207,001 | ||||||||||||||||
Specific Allowance |
$ | 1,112 | $ | 2,197 | $ | 323 | $ | 433 | $ | 909 | $ | 142 | — | $ | 590 | $ | 2,115 | $ | 6,210 | — | $ | 14,031 | ||||||||||||||||
Non-Impaired Loans |
$ | 85,384 | $ | 63,457 | $ | 209,907 | $ | 25,320 | $ | 1,108,027 | $ | 78,256 | $ | 72,258 | $ | 63,768 | $ | 28,042 | $ | 207,797 | $ | 7,227 | $ | 1,949,443 | ||||||||||||||
General Valuation Allowance |
$ | 2,820 | $ | 4,022 | $ | 18,760 | $ | 2,205 | $ | 38,881 | $ | 2,474 | $ | 7,262 | $ | 1,341 | $ | 3,235 | $ | 15,741 | $ | 181 | $ | 96,922 | ||||||||||||||
Total Loans |
$ | 104,311 | $ | 90,156 | $ | 229,016 | $ | 43,597 | $ | 1,164,889 | $ | 85,819 | $ | 72,258 | $ | 102,715 | $ | 39,072 | $ | 217,384 | $ | 7,227 | $ | 2,156,444 | ||||||||||||||
Total Allowance For Loan Losses |
$ | 3,932 | $ | 6,219 | $ | 19,083 | $ | 2,638 | $ | 39,790 | $ | 2,616 | $ | 7,262 | $ | 1,931 | $ | 5,350 | $ | 21,951 | $ | 181 | $ | 110,953 | ||||||||||||||
F-30
WILSHIRE BANCORP, INC.
NOTES TO CONSOLIDATED FINANCIAL STATEMENTS (Continued)
FOR EACH OF THE THREE YEARS IN THE PERIOD ENDED DECEMBER 31, 2010
5. LOANS RECEIVABLE, LOANS HELD FOR SALE, AND ALLOWANCE FOR LOAN LOSSES (Continued)
The following is a summary of impaired loans with and without specific reserves as of December 31, 2010 and 2009:
| |
At December 31, | |||||||
|---|---|---|---|---|---|---|---|---|
(Dollars in Thousands)
|
2010 | 2009 | ||||||
With Specific Reserves |
||||||||
Without Charge-Offs |
$ | 77,076 | $ | 80,758 | ||||
With Charge-Offs |
50,008 | 6,064 | ||||||
Without Specific Reserves |
||||||||
Without Charge-Offs |
19,692 | 70,248 | ||||||
With Charge-Offs |
60,225 | 28,362 | ||||||
Allowance on Impaired Loans |
(14,031 | ) | (13,925 | ) | ||||
Impaired Loans Net of Allowance |
$ | 192,970 | $ | 171,507 | ||||
Average Impaired Loans |
$ | 211,711 | $ | 186,076 | ||||
- *
- Impaired loans at December 31, 2010 and December 31, 2009 had SBA guarantee portion and discount on acquired loans totaling $87.0 million and $60.6 million, respectively.
F-31
WILSHIRE BANCORP, INC.
NOTES TO CONSOLIDATED FINANCIAL STATEMENTS (Continued)
FOR EACH OF THE THREE YEARS IN THE PERIOD ENDED DECEMBER 31, 2010
5. LOANS RECEIVABLE, LOANS HELD FOR SALE, AND ALLOWANCE FOR LOAN LOSSES (Continued)
Impairment balances with specific reserve and those without specific reserves as of December 31, 2010 and December 31, 2009 are listed in the following table by loan type:
| |
December 31, 2010 | |||||||||||
|---|---|---|---|---|---|---|---|---|---|---|---|---|
(Dollars In Thousands)
|
Unpaid Principal Balance* |
Related Allowance |
Average Balance |
|||||||||
With Specific Reserves |
||||||||||||
Commercial Real Estate |
||||||||||||
Gas Station |
$ | 9,985 | $ | 1,112 | $ | 9,985 | ||||||
Carwash |
20,580 | 2,197 | 20,626 | |||||||||
Hotel/Motel |
16,669 | 323 | 18,295 | |||||||||
Land |
2,211 | 433 | 2,212 | |||||||||
Other |
33,713 | 909 | 33,499 | |||||||||
Residential Real Estate |
2,773 | 142 | 2,777 | |||||||||
Construction |
— | — | — | |||||||||
SBA Real Estate |
21,687 | 590 | 21,766 | |||||||||
SBA Commercial |
10,379 | 2,115 | 10,663 | |||||||||
Commercial |
9,087 | 6,210 | 9,472 | |||||||||
Consumer/Other |
— | — | — | |||||||||
Total With Related Allowance |
127,084 | 14,031 | 129,295 | |||||||||
Without Specific Reserves |
||||||||||||
Commercial Real Estate |
||||||||||||
Gas Station |
8,942 | — | 8,961 | |||||||||
Carwash |
6,119 | — | 6,123 | |||||||||
Hotel/Motel |
2,441 | — | 2,443 | |||||||||
Land |
16,066 | — | 16,066 | |||||||||
Other |
23,148 | — | 24,451 | |||||||||
Residential Real Estate |
4,790 | — | 4,816 | |||||||||
Construction |
— | — | — | |||||||||
SBA Real Estate |
17,260 | — | 18,181 | |||||||||
SBA Commercial |
651 | — | 871 | |||||||||
Commercial |
500 | — | 503 | |||||||||
Consumer/Other |
— | — | — | |||||||||
Total Without Related Allowance |
79,917 | — | 82,415 | |||||||||
Total |
$ | 207,001 | $ | 14,031 | $ | 211,710 | ||||||
- *
- Recorded investment adjustment is deemed not material in this presentation.
F-32
WILSHIRE BANCORP, INC.
NOTES TO CONSOLIDATED FINANCIAL STATEMENTS (Continued)
FOR EACH OF THE THREE YEARS IN THE PERIOD ENDED DECEMBER 31, 2010
5. LOANS RECEIVABLE, LOANS HELD FOR SALE, AND ALLOWANCE FOR LOAN LOSSES (Continued)
| |
December 31, 2009 | |||||||||||
|---|---|---|---|---|---|---|---|---|---|---|---|---|
(Dollars In Thousands)
|
Unpaid Principal Balance |
Related Allowance |
Average Balance |
|||||||||
With Specific Reserves |
||||||||||||
Commercial Real Estate |
||||||||||||
Gas Station |
$ | 3,964 | $ | 33 | $ | 3,970 | ||||||
Carwash |
13,030 | 3,078 | 13,039 | |||||||||
Hotel/Motel |
7,104 | 472 | 7,126 | |||||||||
Land |
— | — | — | |||||||||
Other |
36,233 | 5,699 | 36,255 | |||||||||
Residential Real Estate |
503 | 155 | 506 | |||||||||
Construction |
— | — | — | |||||||||
SBA Real Estate |
19,317 | 1,625 | 19,357 | |||||||||
SBA Commercial |
4,077 | 901 | 4,137 | |||||||||
Commercial |
2,594 | 1,963 | 2,469 | |||||||||
Consumer/Other |
— | — | — | |||||||||
Total With Related Allowance |
86,822 | 13,926 | 86,859 | |||||||||
Without Specific Reserves |
||||||||||||
Commercial Real Estate |
||||||||||||
Gas Station |
13,056 | — | 13,061 | |||||||||
Carwash |
1,633 | — | 1,633 | |||||||||
Hotel/Motel |
20,228 | — | 20,244 | |||||||||
Land |
8,193 | — | 8,452 | |||||||||
Other |
31,546 | — | 31,573 | |||||||||
Residential Real Estate |
6,578 | — | 7,054 | |||||||||
Construction |
— | — | — | |||||||||
SBA Real Estate |
12,251 | — | 12,297 | |||||||||
SBA Commercial |
3,217 | — | 3,223 | |||||||||
Commercial |
1,908 | — | 1,681 | |||||||||
Consumer/Other |
— | — | — | |||||||||
Total Without Related Allowance |
98,610 | — | 99,218 | |||||||||
Total |
$ | 185,432 | $ | 13,926 | $ | 186,076 | ||||||
- *
- Recorded investment adjustment is deemed not material in this presentation.
The average recorded investment in impaired loans during the years ended December 31, 2010 and 2009 was $211.7 million and $186.1 million, respectively. Interest income recognized from the impaired loans in 2009 was $5.8 million.
At December 31, 2010, the Company had loans on non-accrual status of $71.2 million, net of SBA guaranteed portions, as compared with $69.4 million at December 31, 2009. Troubled debt restructuring
F-33
WILSHIRE BANCORP, INC.
NOTES TO CONSOLIDATED FINANCIAL STATEMENTS (Continued)
FOR EACH OF THE THREE YEARS IN THE PERIOD ENDED DECEMBER 31, 2010
5. LOANS RECEIVABLE, LOANS HELD FOR SALE, AND ALLOWANCE FOR LOAN LOSSES (Continued)
("TDR") at December 31, 2010 totaled $48.7 million, an increase of $8.9 million from $39.8 at December 31, 2009. At December 31, 2010 and 2009, all of our TDR were performing based on their modified terms.
The following table summarizes TDR balances for December 31, 2010 and 2009:
(Dollars in Thousands)
|
2010 | 2009 | ||||||
|---|---|---|---|---|---|---|---|---|
Construction |
$ | — | $ | — | ||||
Real Estate Secured |
43,302 | 63,589 | ||||||
Commercial & Industrial |
5,444 | 1,023 | ||||||
Consumer |
— | — | ||||||
TOTAL PERFORMING TDRS |
$ | 48,746 | $ | 39,761 | ||||
The following table provides information on non-accrual loans and loan past due over 90 days and still accruing:
| |
December 31, 2010 | |||||||||||
|---|---|---|---|---|---|---|---|---|---|---|---|---|
| |
Non-Accrual Loans |
Past Due 90 Days Or More, Still Accruing |
Total Non-Performing Loans |
|||||||||
Commercial Real Estate |
||||||||||||
Gas Station |
$ | 5,275 | $ | — | $ | 5,275 | ||||||
Carwash |
9,863 | — | 9,863 | |||||||||
Hotel/Motel |
5,856 | — | 5,856 | |||||||||
Land |
12,212 | — | 12,212 | |||||||||
Other |
25,087 | — | 25,087 | |||||||||
Residential Real Estate |
6,582 | — | 6,582 | |||||||||
Construction |
— | — | — | |||||||||
SBA Real Estate |
2,701 | — | 2,701 | |||||||||
SBA Commercial |
940 | — | 940 | |||||||||
Commercial |
2,689 | — | 2,689 | |||||||||
Consumer/Other |
27 | — | 27 | |||||||||
Total |
$ | 71,232 | $ | — | $ | 71,232 | ||||||
F-34
WILSHIRE BANCORP, INC.
NOTES TO CONSOLIDATED FINANCIAL STATEMENTS (Continued)
FOR EACH OF THE THREE YEARS IN THE PERIOD ENDED DECEMBER 31, 2010
5. LOANS RECEIVABLE, LOANS HELD FOR SALE, AND ALLOWANCE FOR LOAN LOSSES (Continued)