Attached files
| file | filename |
|---|---|
| 8-K - FORM 8-K - Santander Holdings USA, Inc. | w82026e8vk.htm |
| Santander Holdings USA, Inc. Presentation to Investors March 15, 2011 |
| 2 Disclaimer Banco Santander, S.A. ("Santander"), Santander Holdings USA, Inc. ("SHUSA"), Sovereign Bank ("Sovereign"), and Santander Consumer USA, Inc. ("SCUSA") caution that this presentation contains forward-looking statements within the meaning of the U.S. Private Securities Litigation Reform Act of 1995. These forward-looking statements are found in various places throughout this presentation and include, without limitation, statements concerning our future business development and economic performance. While these forward-looking statements represent our judgment and future expectations concerning the development of our business, a number of risks, uncertainties, and other important factors could cause actual developments and results to different materially from our expectations. These factors include, but are not limited to: (1) general market, macro-economic, governmental, and regulatory trends; (2) movements in local and international securities markets, currency exchange rates, and interest rates; (3) competitive pressures; (4) technological developments; and (5) changes in the financial position or credit worthiness of our customers, obligors, and counterparties. The risk factors and other key factors that we have indicated in our past and future filings and reports, including our Annual Report on Form 10-K for the year ended December 31, 2010 and other filings and reports with the Securities and Exchange Commission of the United States of America (the "SEC"), could adversely affect our business and financial performance. Other unknown and unpredictable factors could cause actual results to differ materially from those in the forward-looking statements. The information contained in this presentation is not complete. It is subject to, and must be read in conjunction with, all other publicly available information, including reports filed with or furnished to the SEC, press releases, and other relevant information. Because this information is intended only to assist investors, it does not constitute investment advice or an offer to invest or to provide management services. It is subject to correction, completion, and amendment without notice. It is not our intention to state, indicate, or imply in any manner that current or past results are indicative of future results or expectations. As with all investments, there are associated risks, and you could lose money investing. Prior to making any investment, a prospective investor should consult with its own investment, accounting, legal, and tax advisers to evaluate independently the risks, consequences, and suitability of that investment. The information in this presentation is not intended to constitute "research" as that term is defined by applicable regulations. Nothing in this presentation constitutes investment, legal, accounting, or tax advice, or a representation that any investment or strategy is suitable or appropriate to your individual circumstances, or otherwise constitutes a personal recommendation to you. Recipients of this presentation should obtain advice based on their own individual circumstances from their own tax, financial, legal, and other advisers before making an investment decision, and only make such decisions on the basis of the investor's own objectives, experience, and resources. In making this presentation available, Santander, SHUSA, Sovereign, and SCUSA give no advice and make no recommendation to buy, sell, or otherwise deal in shares or other securities of Santander, SHUSA, Sovereign, or SCUSA, or in any other securities or investments whatsoever. No offering of Securities shall be made in the United States except pursuant to registration under the U.S. Securities Act of 1933, as amended, or an exemption therefrom. Nothing contained in this presentation is intended to constitute an invitation or inducement to engage in investment activity for the purposes of the prohibition on financial promotion in the U.K. Financial Services and Markets Act 2000. In this presentation, we will sometimes refer to certain non-GAAP figures or financial ratios to help illustrate certain concepts. These ratios, each of which is defined in this document, include Pre-Tax Pre-Provision Income, the Tangible Common Equity to Tangible Assets Ratio, and the Texas Ratio[1]. This information supplements our results as reported in accordance with GAAP and should not be viewed in isolation from, or as a substitute for, our GAAP results. We believe that this additional information and the reconciliations we provide may be useful to investors, analysts, regulators and others as they evaluate the impact of these respective items on our results for the periods presented due to the extent to which the items are not indicative of our ongoing operations. Where applicable, we provide GAAP reconciliations for such additional information. Note: Nothing in this presentation should be construed as a profit forecast. Past performance should not be taken as an indication or guarantee of future performance, and no representation or warranty, express or implied, is made regarding performance. Information, opinions, and estimates contained in this presentation reflect a judgment at its original date of publication by Santander, SHUSA, Sovereign, and SCUSA and are subject to change without notice. Santander, SHUSA, Sovereign, and SCUSA have no obligation to update, modify, or amend this presentation or to otherwise notify a recipient thereof in the event tat any information, opinion, or estimate set forth herein changes or subsequently becomes inaccurate. This presentation is provided for information purposes only. |
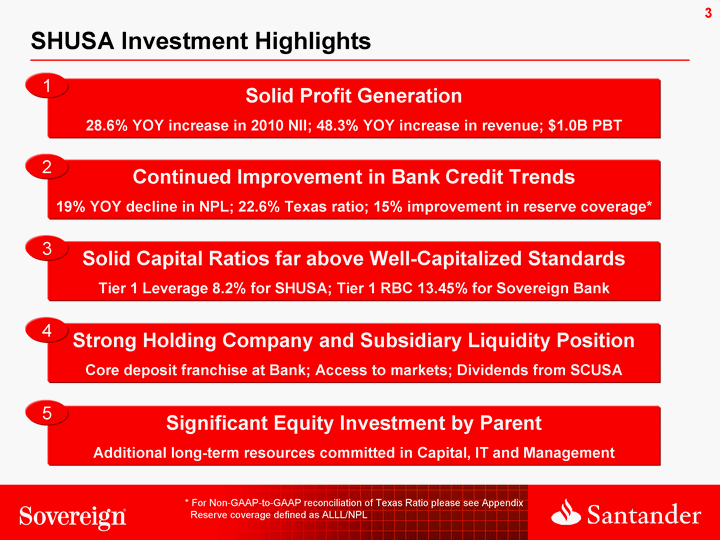
| 3 SHUSA Investment Highlights Solid Profit Generation 28.6% YOY increase in 2010 NII; 48.3% YOY increase in revenue; $1.0B PBT 1 Solid Capital Ratios far above Well-Capitalized Standards Tier 1 Leverage 8.2% for SHUSA; Tier 1 RBC 13.45% for Sovereign Bank 3 Continued Improvement in Bank Credit Trends 19% YOY decline in NPL; 22.6% Texas ratio; 15% improvement in reserve coverage* 2 Strong Holding Company and Subsidiary Liquidity Position Core deposit franchise at Bank; Access to markets; Dividends from SCUSA 4 Significant Equity Investment by Parent Additional long-term resources committed in Capital, IT and Management 5 * For Non-GAAP-to-GAAP reconciliation of Texas Ratio please see Appendix Reserve coverage defined as ALLL/NPL |
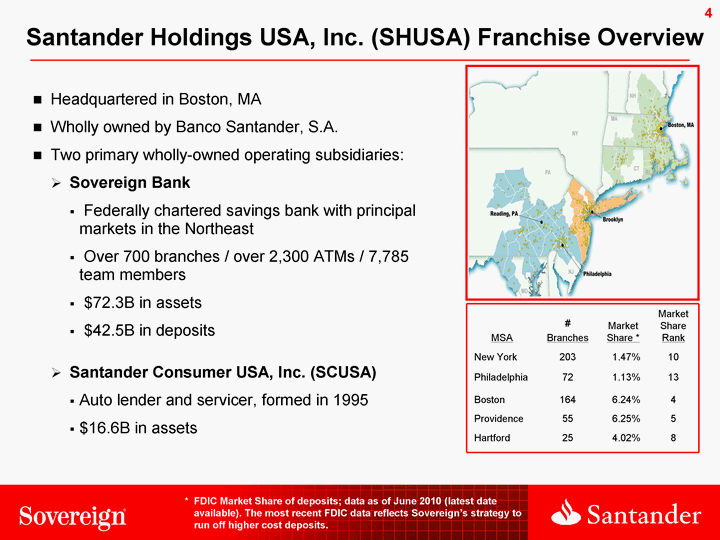
| 4 Santander Holdings USA, Inc. (SHUSA) Franchise Overview MSA # Branches Market Share * Market Share Rank New York 203 1.47% 10 Philadelphia 72 1.13% 13 Boston 164 6.24% 4 Providence 55 6.25% 5 Hartford 25 4.02% 8 * FDIC Market Share of deposits; data as of June 2010 (latest date available). The most recent FDIC data reflects Sovereign's strategy to run off higher cost deposits. Headquartered in Boston, MA Wholly owned by Banco Santander, S.A. Two primary wholly-owned operating subsidiaries: Sovereign Bank Federally chartered savings bank with principal markets in the Northeast Over 700 branches / over 2,300 ATMs / 7,785 team members $72.3B in assets $42.5B in deposits Santander Consumer USA, Inc. (SCUSA) Auto lender and servicer, formed in 1995 $16.6B in assets |

| 5 Investments C&I CRE Resi Multifamily HE Other Loans Other Assets Intang East 13.6 10.3 10.7 13.9 6.7 5.1 2.4 6.3 3.6 Santander Holdings USA, Inc. Structure Santander Holdings USA, Inc. $89.7B Assets Sovereign Bank* $72.3B Assets Investments $13.6B Investments Loans Other East 0.4 15 1.1 Other $1.1B Investments $0.4B Auto Loans $15.9B GW & Intang $3.7B Other $6.3B ** * Bank balances as reported in Dec 2010 TFR; Loan balances net of allowance ** Includes $1.7B DTA and $1.4B BOLI Other Loans $2.4B SCUSA and others $17.4B Assets Home Equity $5.1B Multi-Family $6.7B Residential Mortgage $13.5B CRE $10.7B C&I $10.3B |
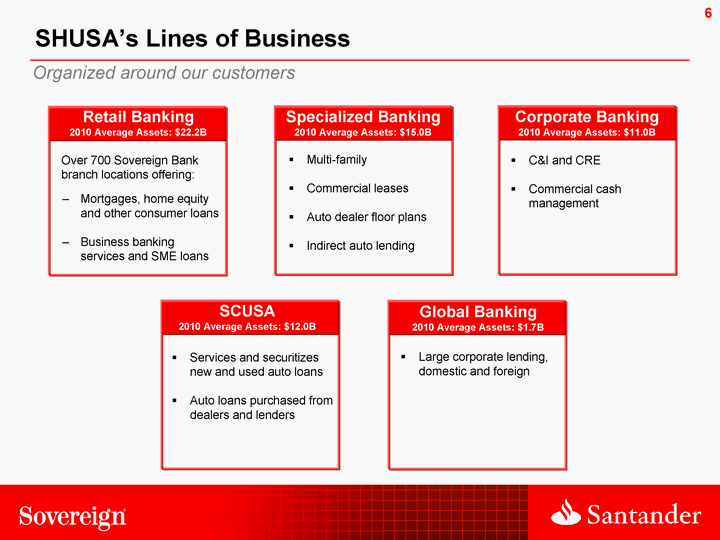
| 6 SHUSA's Lines of Business Organized around our customers 6 Retail Banking 2010 Average Assets: $22.2B Specialized Banking 2010 Average Assets: $15.0B Corporate Banking 2010 Average Assets: $11.0B SCUSA 2010 Average Assets: $12.0B Global Banking 2010 Average Assets: $1.7B Over 700 Sovereign Bank branch locations offering: Multi-family Commercial leases Auto dealer floor plans Indirect auto lending Mortgages, home equity and other consumer loans Business banking services and SME loans C&I and CRE Commercial cash management Services and securitizes new and used auto loans Auto loans purchased from dealers and lenders Large corporate lending, domestic and foreign |

| 7 Profitability 3 Lines of Business Review Efficiency 4 5 Risk Model 1 From Q1 2009 to Q4 2010 Capital 2 Since Santander acquired Sovereign, SHUSA's management team has transformed the company: Significant Initiatives and Achievements Established an independent risk management function and added key personnel. Significant equity investment by Parent. $3.3B in common stock and sub debt since Q1 2009. Focus on expanding NIM while reducing risk profile. NII $3.4B FY 2010 vs. $1.9B FY 2008. Identified run-off portfolios, specialized business and contributed SCUSA and its successful servicing platform. Continued to invest in IT and risk infrastructure while reducing expenses. Efficiency ratio of 37% in Q4 2010 vs 55% in Q1 2009. Deposit Franchise Significant improvement in core deposit mix and growth. 6 * Efficiency ratio = G&A expenses / (NII + Fees & other income) |
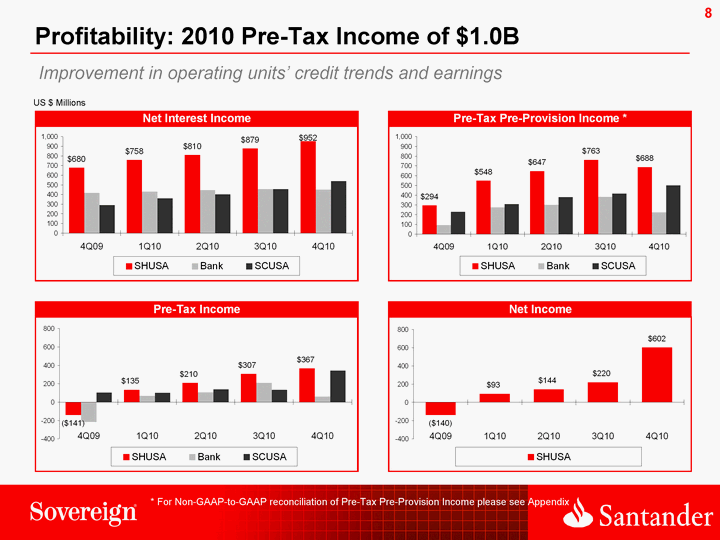
| Profitability: 2010 Pre-Tax Income of $1.0B Improvement in operating units' credit trends and earnings US $ Millions * For Non-GAAP-to-GAAP reconciliation of Pre-Tax Pre-Provision Income please see Appendix |
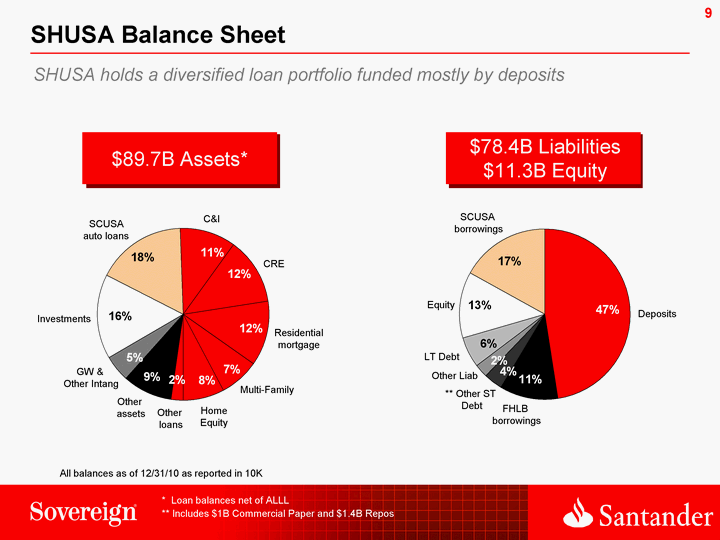
| SHUSA Balance Sheet * Loan balances net of ALLL ** Includes $1B Commercial Paper and $1.4B Repos Investments SCUSA C&I CRE Resi MultiFam HE Other loans Other Assets GW & Intang East 13986 15032 9419 10983 10856 6551 6802 2118 8382 4313 Investments SCUSA auto loans C&I CRE Residential mortgage Other loans Other assets GW & Other Intang Deposits FHLB Other ST Other Liab LT Equity SCUSA East 42673 9849 3312 2088 5393 11261 15077 Deposits SCUSA borrowings LT Debt Equity Other Liab Home Equity Multi-Family FHLB borrowings ** Other ST Debt $89.7B Assets* $78.4B Liabilities $11.3B Equity SHUSA holds a diversified loan portfolio funded mostly by deposits All balances as of 12/31/10 as reported in 10K |
| AGENDA SHUSA Investment Highlights Sovereign Bank Credit Overview SCUSA Credit Overview Capital and Liquidity Appendix |
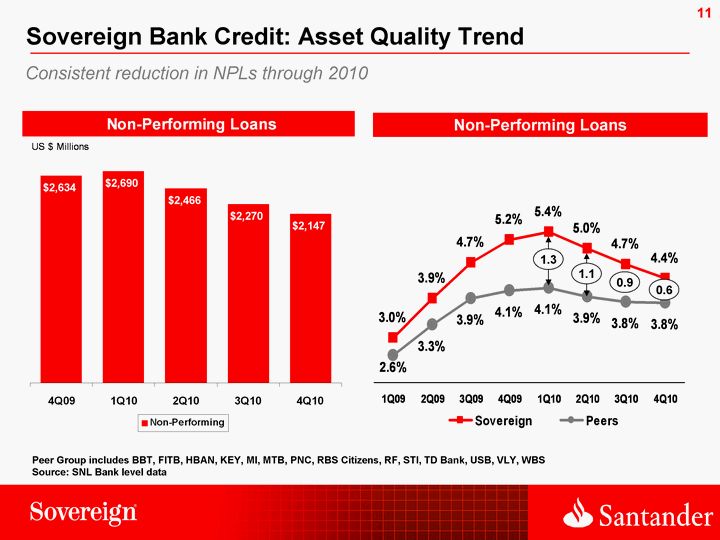
| Sovereign Bank Credit: Asset Quality Trend Consistent reduction in NPLs through 2010 Non-Performing Loans Peer Group includes BBT, FITB, HBAN, KEY, MI, MTB, PNC, RBS Citizens, RF, STI, TD Bank, USB, VLY, WBS Source: SNL Bank level data 1Q09 2Q09 3Q09 4Q09 1Q10 2Q10 3Q10 4Q10 Sovereign 0.03 0.039 0.047 0.0522 0.054 0.0502 0.0466 0.0435 Peers 0.0262 0.0331 0.0389 0.0407 0.0414 0.0393 0.0381 0.038 1.3 1.1 0.9 0.6 |
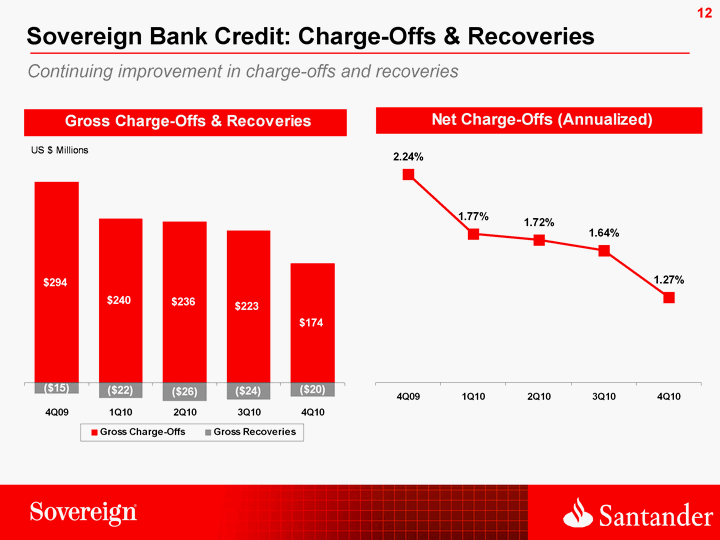
| Sovereign Bank Credit: Charge-Offs & Recoveries Continuing improvement in charge-offs and recoveries |
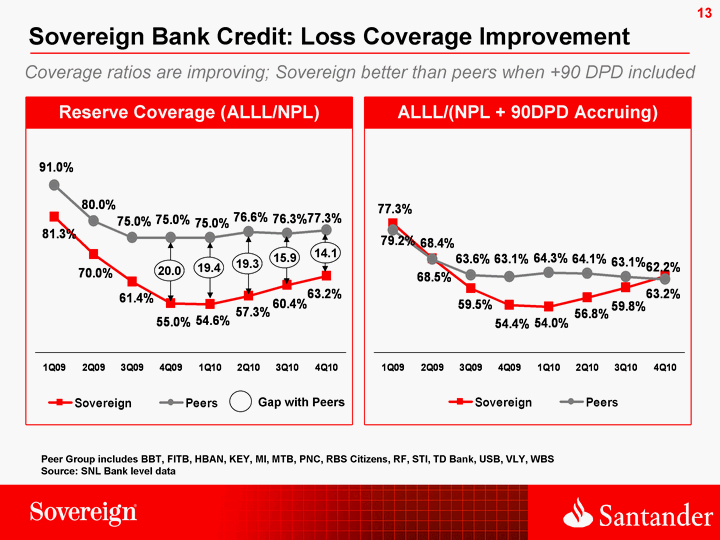
| Coverage ratios are improving; Sovereign better than peers when +90 DPD included Reserve Coverage (ALLL/NPL) 1Q09 2Q09 3Q09 4Q09 1Q10 2Q10 3Q10 4Q10 Sovereign 0.813 0.7 0.614 0.55 0.546 0.573 0.604 0.632 Peers 0.91 0.8 0.75 0.75 0.75 0.766 0.763 0.773 Gap with Peers 20.0 19.4 19.3 15.9 14.1 Sovereign Bank Credit: Loss Coverage Improvement Peer Group includes BBT, FITB, HBAN, KEY, MI, MTB, PNC, RBS Citizens, RF, STI, TD Bank, USB, VLY, WBS Source: SNL Bank level data ALLL/(NPL + 90DPD Accruing) 1Q09 2Q09 3Q09 4Q09 1Q10 2Q10 3Q10 4Q10 Sovereign 0.792 0.685 0.595 0.544 0.54 0.568 0.598 0.632 Peers 0.773 0.684 0.636 0.631 0.643 0.641 0.631 0.622 |

| Sovereign Bank Credit: Loss Coverage Improvement (cont.) Ample reserves and capital coverage * Texas Ratio = Nonperforming Assets / (Tangible Common Equity + ALLL) For Non-GAAP-to-GAAP reconciliation of the Texas Ratio please see Appendix Peer Group includes BBT, FITB, HBAN, KEY, MI, MTB, PNC, RBS Citizens, RF, STI, TD Bank, USB, VLY, WBS Source: SNL bank-level data |

| Sovereign Bank Credit: NPL Ratio Trend by Asset Class NPL ratios have stabilized in Real Estate and Non-Real Estate US $ Billions Mortgage and Home Equity Other Consumer Commercial Real Estate Other Commercial * Outstandings NPL to Total Loans Net Charge-Offs * Asset Classification based on TFR; Other Commercial includes Multi-Family |
| AGENDA SHUSA Investment Highlights Sovereign Bank Credit Overview SCUSA Credit Overview Capital and Liquidity Appendix |
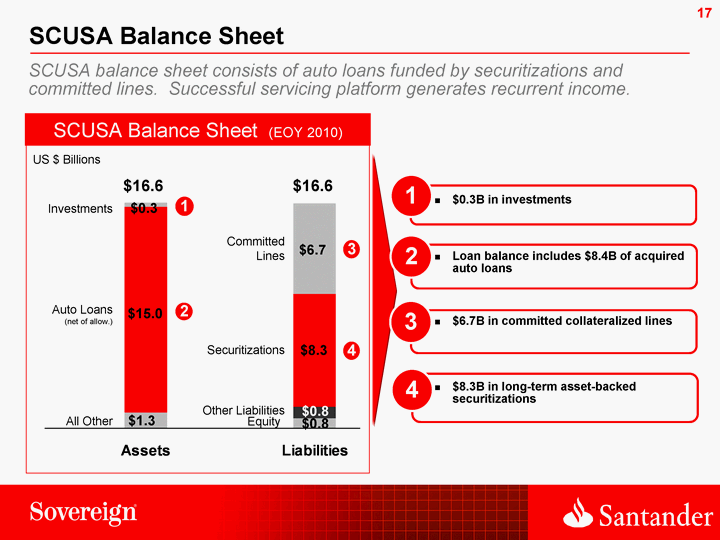
| SCUSA Balance Sheet Liabilities Pasivo Equity 0.8 334 Deposits 305 Sovereign Borrowings Borrowings 0.8 144 Other Liabilities 8.3 6.7 Assets All Other 1.2 Auto Loans 15 Cash 0.3 US $ Billions $16.6 $16.6 1 3 2 SCUSA Balance Sheet (EOY 2010) Investments Equity Auto Loans (net of allow.) $0.3B in investments 3 2 $6.7B in committed collateralized lines Loan balance includes $8.4B of acquired auto loans 4 $8.3B in long-term asset-backed securitizations Committed Lines Other Liabilities SCUSA balance sheet consists of auto loans funded by securitizations and committed lines. Successful servicing platform generates recurrent income. 1 Securitizations All Other 4 $0.3 $15.0 $1.3 $8.3 $0.8 $6.7 $0.8 |
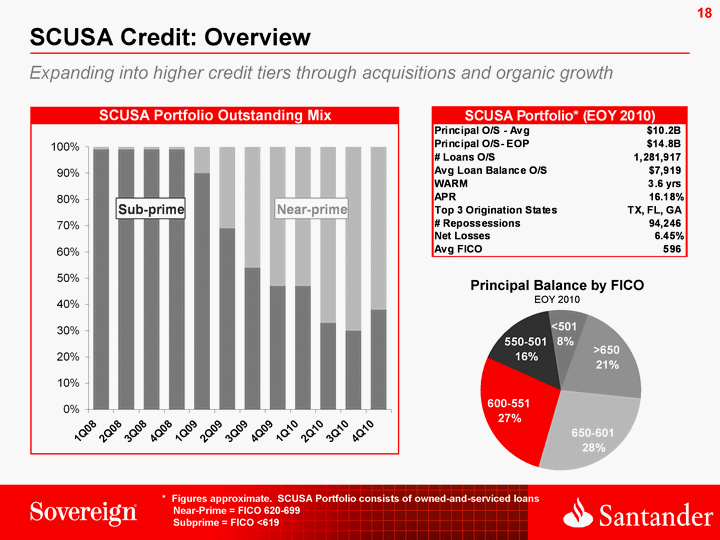
| SCUSA Credit: Overview Expanding into higher credit tiers through acquisitions and organic growth * Figures approximate. SCUSA Portfolio consists of owned-and-serviced loans Near-Prime = FICO 620-699 Subprime = FICO <619 Principal Balance by FICO EOY 2010 SCUSA Portfolio * |
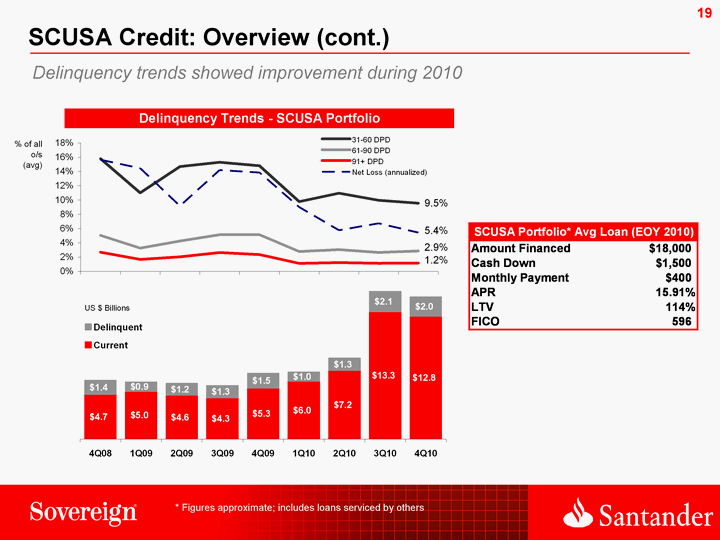
| SCUSA Credit: Overview (cont.) Delinquency trends showed improvement during 2010 * Figures approximate; includes loans serviced by others |
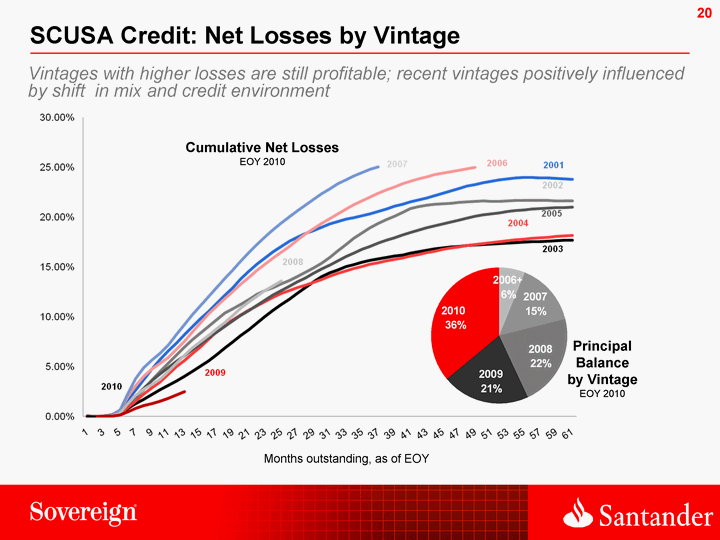
| SCUSA Credit: Net Losses by Vintage Cumulative Net Losses EOY 2010 Vintages with higher losses are still profitable; recent vintages positively influenced by shift in mix and credit environment Months outstanding, as of EOY Principal Balance by Vintage EOY 2010 |
| AGENDA SHUSA Investment Highlights Sovereign Bank Credit Overview SCUSA Credit Overview Capital and Liquidity Appendix |
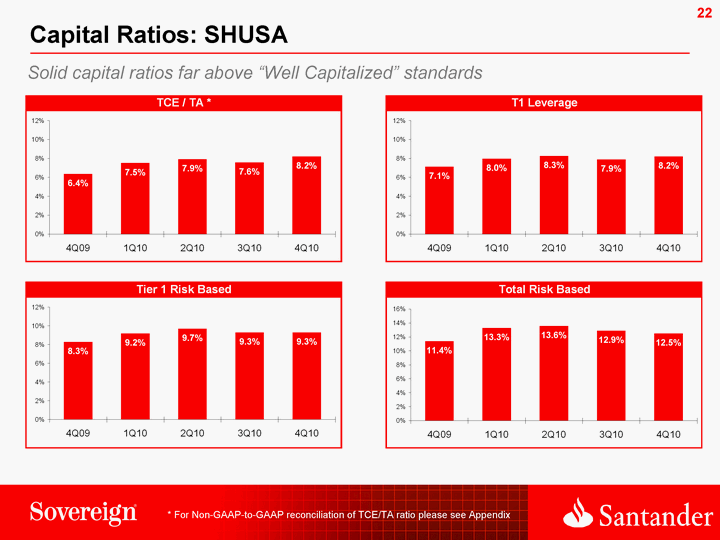
| Capital Ratios: SHUSA Solid capital ratios far above "Well Capitalized" standards * For Non-GAAP-to-GAAP reconciliation of TCE/TA ratio please see Appendix |
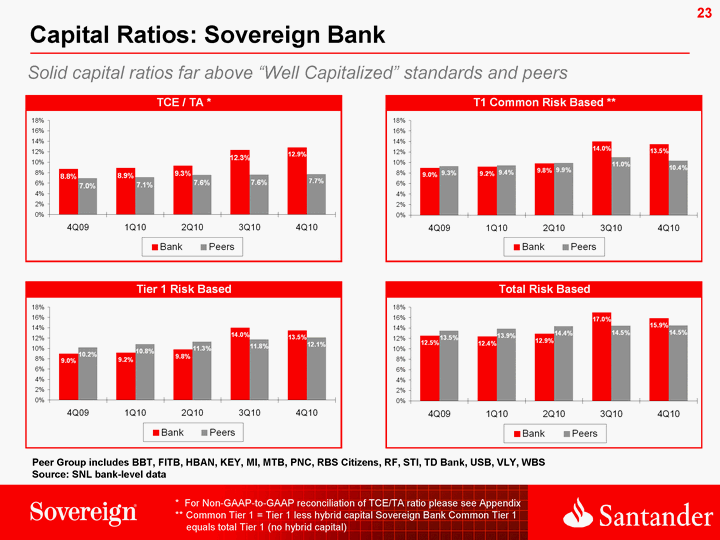
| Capital Ratios: Sovereign Bank Solid capital ratios far above "Well Capitalized" standards and peers * For Non-GAAP-to-GAAP reconciliation of TCE/TA ratio please see Appendix ** Common Tier 1 = Tier 1 less hybrid capital Sovereign Bank Common Tier 1 equals total Tier 1 (no hybrid capital) Peer Group includes BBT, FITB, HBAN, KEY, MI, MTB, PNC, RBS Citizens, RF, STI, TD Bank, USB, VLY, WBS Source: SNL bank-level data |

| Liquidity Highlights: Diversified Funding Base Sovereign Bank: Significant improvement in deposit franchise through growth in lower cost retail deposits and reduction in wholesale funding SCUSA: 6 securitizations in 2010 for ~$8B and ample room in committed lines Significant Improvement in Deposit Composition Positive Deposit Growth Rate Trends |
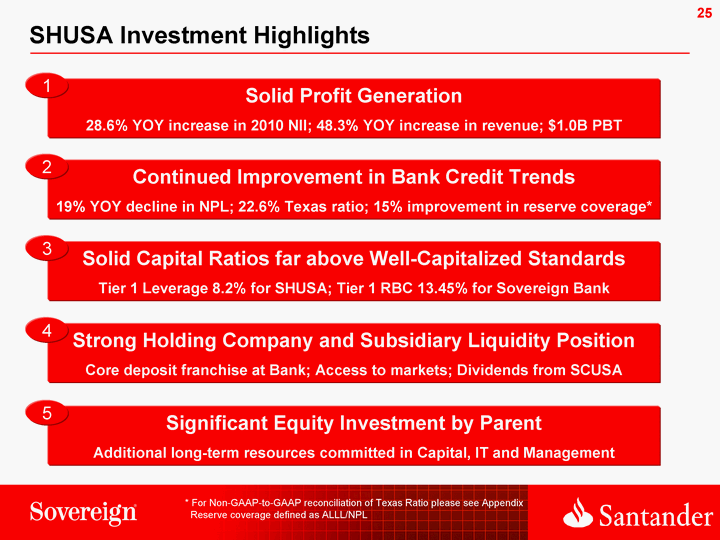
| 25 SHUSA Investment Highlights Solid Profit Generation 28.6% YOY increase in 2010 NII; 48.3% YOY increase in revenue; $1.0B PBT 1 Solid Capital Ratios far above Well-Capitalized Standards Tier 1 Leverage 8.2% for SHUSA; Tier 1 RBC 13.45% for Sovereign Bank 3 Continued Improvement in Bank Credit Trends 19% YOY decline in NPL; 22.6% Texas ratio; 15% improvement in reserve coverage* 2 Strong Holding Company and Subsidiary Liquidity Position Core deposit franchise at Bank; Access to markets; Dividends from SCUSA 4 Significant Equity Investment by Parent Additional long-term resources committed in Capital, IT and Management 5 * For Non-GAAP-to-GAAP reconciliation of Texas Ratio please see Appendix Reserve coverage defined as ALLL/NPL |

| Appendix |

| 27 SHUSA Management Jorge Moran CEO and US Country Head More than 18 years of experience in a variety of roles within Santander CFO of Sovereign Bank since 2009 CFO of Banco Santander Chile from 2006 to 2009 Risk and Controlling Director for Santander Consumer Finance from 2003 to 2006 Guillermo Sabater CFO Sovereign CEO and US Country Head Member of Santander Executive Committee since 2002 Head of Santander Global Insurance from 2006 to 2010 Abbey National Chief Operating Officer and Board of Director from 2005 to 2008 Head of Santander Asset Management from 2002 to 2005 Ken Goldman Chief Accounting Officer Chief Accounting Officer of Sovereign and Santander Holdings USA 20 years of financial services experience Certified public accountant with Big Four public accounting experience and senior financial management positions in publicly traded companies |
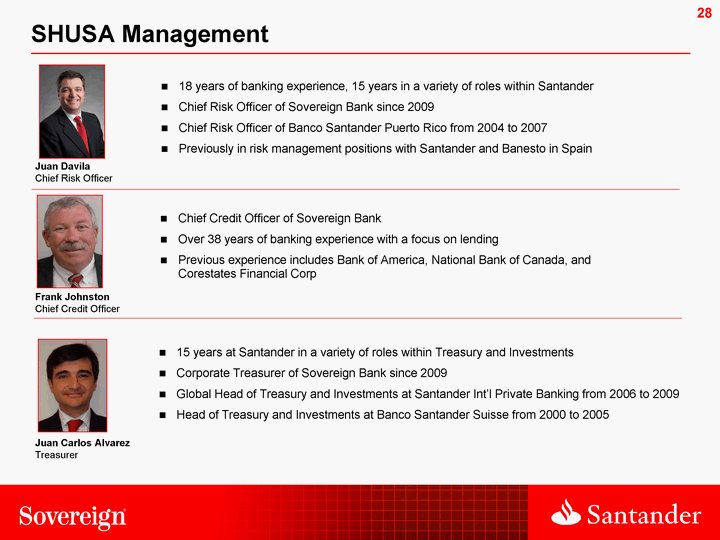
| 28 SHUSA Management Frank Johnston Chief Credit Officer Chief Credit Officer of Sovereign Bank Over 38 years of banking experience with a focus on lending Previous experience includes Bank of America, National Bank of Canada, and Corestates Financial Corp Juan Davila Chief Risk Officer 18 years of banking experience, 15 years in a variety of roles within Santander Chief Risk Officer of Sovereign Bank since 2009 Chief Risk Officer of Banco Santander Puerto Rico from 2004 to 2007 Previously in risk management positions with Santander and Banesto in Spain Juan Carlos Alvarez Treasurer 15 years at Santander in a variety of roles within Treasury and Investments Corporate Treasurer of Sovereign Bank since 2009 Global Head of Treasury and Investments at Santander Int'l Private Banking from 2006 to 2009 Head of Treasury and Investments at Banco Santander Suisse from 2000 to 2005 |
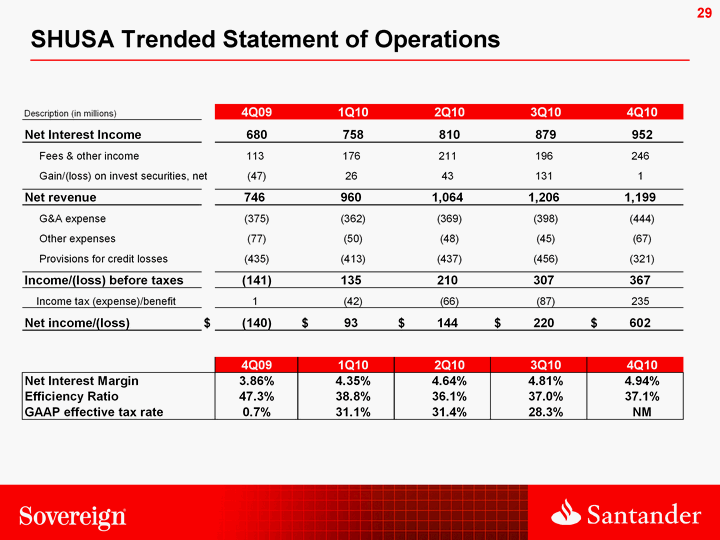
| 29 SHUSA Trended Statement of Operations |
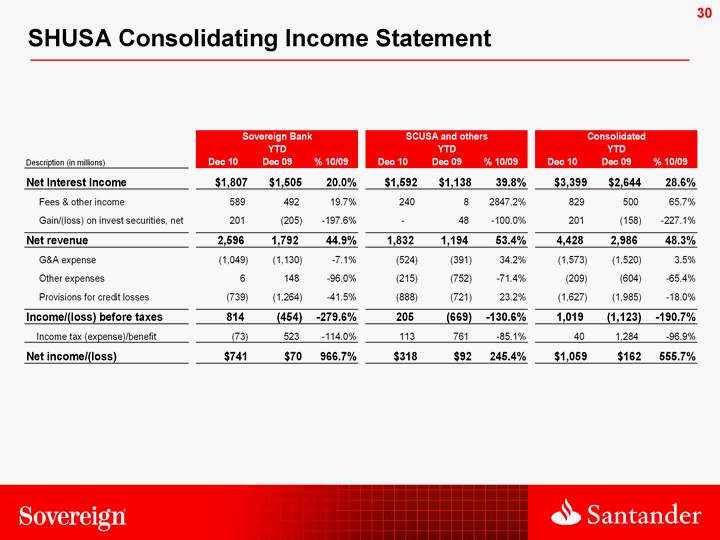
| 30 SHUSA Consolidating Income Statement |
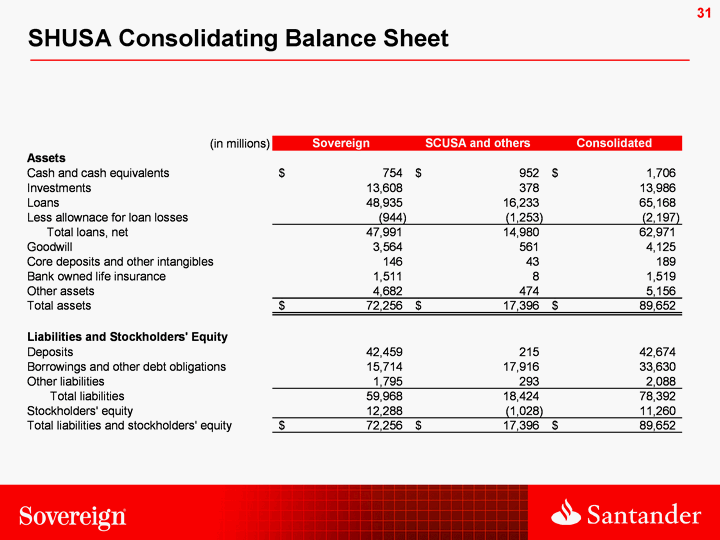
| 31 SHUSA Consolidating Balance Sheet |

| SHUSA Debt Profile 2011 2012 2014 2016 2018 2020 ... 2034 2036 Perp 968 250 750 800 625 200 250 Sr Debt (TLGP) $250 SubDebt To Parent $750 PIERS (Conv Trust Pref) $800 Trust Pref $625 Pref Stock $200 (US $ Millions) Year Comm'l Paper $968 NY Line $250 Debt Maturity by Funding Type (as of Dec 31, 2010) Note: all amounts are notional |
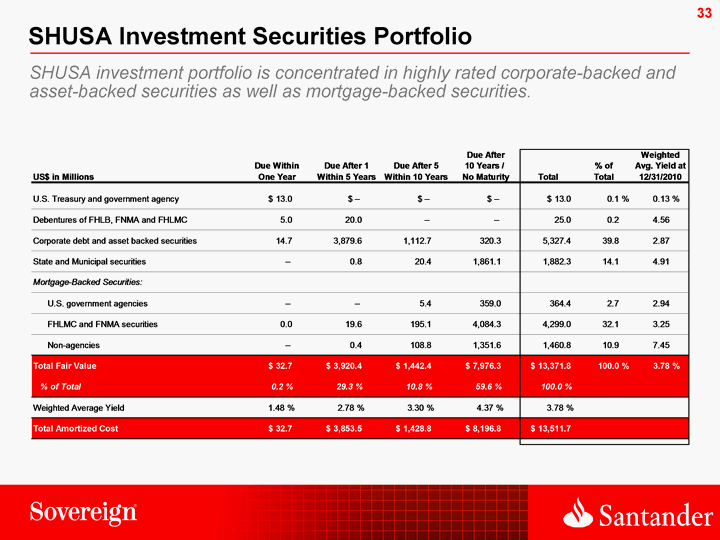
| SHUSA Investment Securities Portfolio SHUSA investment portfolio is concentrated in highly rated corporate-backed and asset-backed securities as well as mortgage-backed securities. |
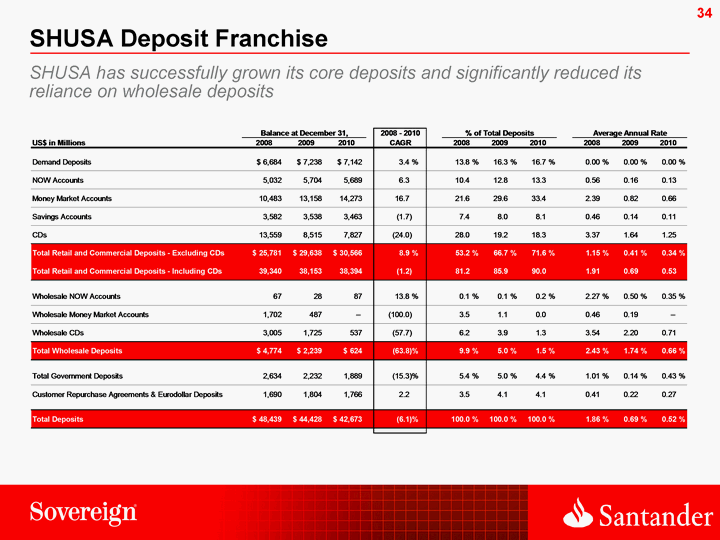
| SHUSA Deposit Franchise SHUSA has successfully grown its core deposits and significantly reduced its reliance on wholesale deposits |
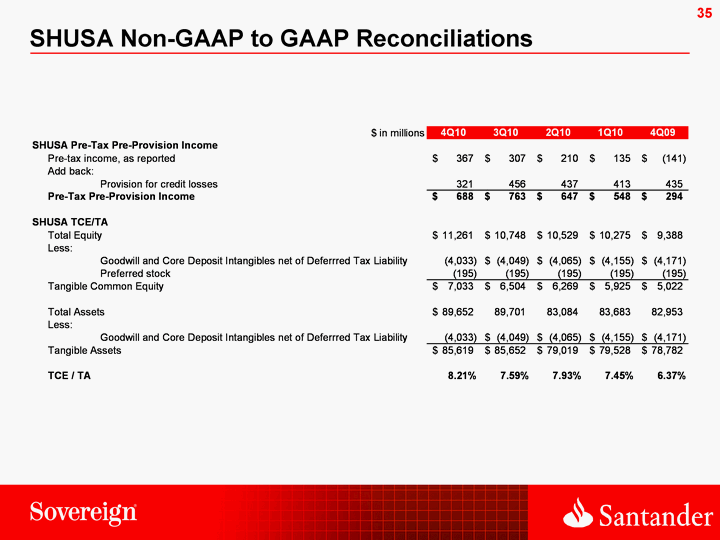
| SHUSA Non-GAAP to GAAP Reconciliations |
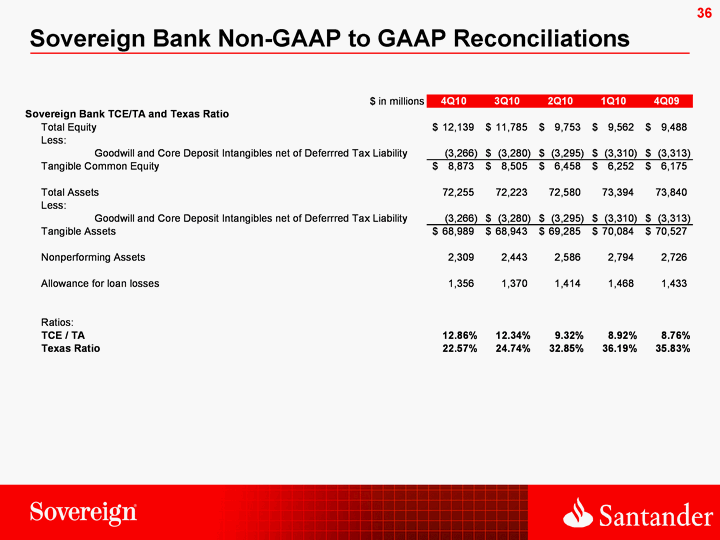
| Sovereign Bank Non-GAAP to GAAP Reconciliations |