Attached files
Table of Contents
UNITED STATES
SECURITIES AND EXCHANGE COMMISSION
WASHINGTON, D.C. 20549
FORM 10-K
ANNUAL REPORT PURSUANT TO SECTION 13 OR 15(d) OF THE
SECURITIES EXCHANGE ACT OF 1934
For fiscal year ended December 31, 2010
Commission File Number: 001-33123
SOLTA MEDICAL, INC.
(Exact name of registrant as specified in its charter)
| Delaware | 68-0373593 | |
| (State or other jurisdiction of incorporation or organization) |
(I.R.S. Employer Identification No.) |
25881 Industrial Boulevard,
Hayward, California 94545
(510) 782-2286
(Address, including zip code, and telephone number, including area code, of registrant’s principal executive offices)
Securities registered pursuant to Section 12(b) of the Act:
| Title of Each Class |
Name of Each Exchange on Which Registered | |
| Common Stock, $0.001 par value per share | The NASDAQ Stock Market, Inc. |
Securities Registered Pursuant to Section 12(g) of the Act: None
Indicate by check mark if the registrant is a well-known seasoned issuer, as defined in Rule 405 of the Securities Act. Yes ¨ No x
Indicate by check mark if the registrant is not required to file reports pursuant to Section 13 or Section 15(d) of the Act. Yes ¨ No x
Indicate by check mark whether the registrant (1) has filed all reports required to be filed by Section 13 or 15(d) of the Securities Exchange Act of 1934 during the preceding 12 months (or for such shorter period than the registrant was required to file such reports), and (2) has been subject to such filing requirements for the past 90 days. Yes x No ¨
Indicate by check mark whether the registrant has submitted electronically and posted on its corporate Web site, if any, every Interactive Data File required to be submitted and posted pursuant to Rule 405 of Regulation S-T (§ 232.405 of this chapter) during the preceding 12 months (or for such shorter period that the registrant was required to submit and post such files). Yes ¨ No ¨
Indicate by check mark if disclosure of delinquent filers pursuant to Item 405 of Regulation S-K is not contained herein, and will not be contained, to the best of the registrant’s knowledge, in definitive proxy or information statements incorporated by reference in Part III of this Form 10-K or any amendment to this Form 10-K. ¨
Indicate by check mark whether the registrant is a large accelerated filer, an accelerated filer, a non-accelerated filer, or a smaller reporting company. See definition of “accelerated filer and large accelerated filer” in Rule 12b-2 of the Exchange Act (check one):
Large accelerated filer ¨ Accelerated filer ¨ Non-accelerated filer ¨ Smaller reporting company x
Indicate by check mark whether registrant is a shell company (as defined in Rule 12b-2 of the Exchange Act). Yes ¨ No x
The aggregate market value of the registrant’s common stock, held by non-affiliates of the registrant as of June 30, 2010 (which is the last business day of registrant’s most recently completed second fiscal quarter) based upon the closing price of such stock on the NASDAQ Global Market on that date, was approximately $69.7 million. For purposes of this disclosure, shares of common stock held by entities and individuals who own 5% or more of the outstanding common stock and shares of common stock held by each officer and director have been excluded in that such persons may be deemed to be “affiliates” as that term is defined under the Rules and Regulations of the Securities Exchange Act of 1934. This determination of affiliate status is not necessarily conclusive.
The number of shares of Registrant’s common stock issued and outstanding as of February 28, 2011 was 60,139,364.
DOCUMENTS INCORPORATED BY REFERENCE
Part III incorporates by reference certain information from the registrant’s definitive proxy statement for the 2010 Annual Meeting of Stockholders.
Table of Contents
ANNUAL REPORT ON FORM 10-K
INDEX
| Page | ||||||
| PART I | ||||||
| ITEM 1. | 1 | |||||
| ITEM 1A. | 28 | |||||
| ITEM 1B. | 45 | |||||
| ITEM 2. | 45 | |||||
| ITEM 3. | 45 | |||||
| ITEM 4. | 46 | |||||
| PART II | ||||||
| ITEM 5. | Market for Registrant’s Common Equity, Related Stockholder Matters, and Issuer Purchases of Equity Securities | 47 | ||||
| ITEM 6. | 49 | |||||
| ITEM 7. | Management’s Discussion and Analysis of Financial Condition and Results of Operations | 51 | ||||
| ITEM 7A. | 68 | |||||
| ITEM 8. | 69 | |||||
| ITEM 9. | Changes in and Disagreements with Accountants on Accounting and Financial Disclosure | 109 | ||||
| ITEM 9A. | 109 | |||||
| ITEM 9B. | 110 | |||||
| PART III | ||||||
| ITEM 10. | Directors, Executive Officers of the Registrant and Corporate Governance |
111 | ||||
| ITEM 11. | 111 | |||||
| ITEM 12. | Security Ownership of Certain Beneficial Owners and Management and Related Stockholder Matters | 111 | ||||
| ITEM 13. | Certain Relationships and Related Transactions, and Director Independence |
111 | ||||
| ITEM 14. | 111 | |||||
| PART IV | ||||||
| ITEM 15. | 112 | |||||
i
Table of Contents
| Item 1. | Business |
Overview
We design, develop, manufacture and market professional and consumer energy-based medical device systems for aesthetic applications. Our professional systems are marketed under the brand names Fraxel®, Thermage® and Isolaz® and are FDA-cleared for dermatological procedures in the following applications:
| • | Skin Tightening. The Thermage NXT™ and CPT™ systems offer non-invasive treatment options for skin tightening and contouring, body shaping, and improvement in the appearance of cellulite. |
| • | Skin Rejuvenation. The Fraxel re:fine, Fraxel re:store, and Fraxel re:store Dual systems offer treatments for skin conditions such as fine lines and pigmentation. In addition, the Fraxel re:store system offers treatments for acne and surgical scars, deeper lines and wrinkles, and actinic keratoses. |
| • | Skin Resurfacing. The Fraxel re:pair system is for dermatological procedures requiring ablation, coagulation and resurfacing of soft tissue as well as for rhytides, pigmentation and vascular dyschromia. |
| • | Acne. Isolaz is the only technology that combines vacuum with broadband light indicated for the treatment of inflammatory acne, comedonal acne, and mild to moderate inflammatory acne. |
Each of our professional systems consists of one or more handpieces, a console that incorporates a graphical user interface, an energy source and electronics, and a disposable treatment tip. We market our systems and treatment tips in the United States to physician practices primarily through a direct sales force and internationally in over 100 countries through both a network of distributors and direct sales force. Our customers consist primarily of dermatologists and plastic surgeons and our expanded customer base includes other specialties such as general and family practitioners, gynecologists, ophthalmologists and others. As of December 31, 2010, we had a global installed base of over 7,000 systems.
In addition to our professional systems, we have also recently begun to manufacture and market a consumer energy-based system under the brand name CLARO™. The CLARO™ personal care acne treatment system an intense pulse light (“IPL”) acne treatment system that has FDA over-the-counter clearance for the treatment of mild-to-moderate inflammatory acne. It is a device that uses a combination of both heat and light to clear acne in 24-to-48 hours. Distribution of the CLARO is through prestige retail and associated retailer’s web sites and our own web site and is currently only available in the United States.
1
Table of Contents
The Structure of Skin and Connective Tissue
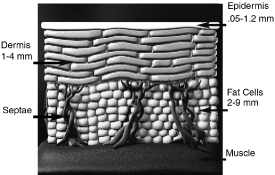
The skin is comprised of the epidermis, dermis and the hypodermis, or subcutaneous fat layer. The top two layers of skin, the epidermis and dermis, together are known as the cutis and on most areas of the body are approximately two to three millimeters thick. The dermis contains blood vessels, hair follicles and other skin components. The deepest layer of the skin, the hypodermis, contains 50% of the body’s fat cells. The hypodermis also contains collagen strands, or fibrous septae, that connect the dermis to the underlying bone and muscle. Collagen has been shown to be a very flexible and stretchable protein with high tensile strength. The following diagram illustrates the basic anatomy of the skin:
Electromagnetic radiation, specifically light and heat, applied to the different layers of the skin can have an effect on the skin’s appearance. Many factors, such as advancing age, smoking, and exposure to damaging environmental factors such as the sun, can result in undesirable hair growth, enlargement or swelling of blood vessels, deterioration of collagen that enables formation of wrinkles and sagging tissue, and uneven pigmentation or sun spots. Devices such as aesthetic lasers have been designed to generate light waves to deliver heat through the epidermis, into the dermis, for removal of hair, vein treatment and other aesthetic applications. Gels, coolants and other means are used to protect the epidermis from burning during this process. Delivery of heat below the dermis, into the subcutaneous fat layer, has been accomplished using other forms of energy for aesthetic effect.
Light and heat can also be used to treat acne, one of the most prevalent skin diseases today. Acne is the result of a skin infection. Acne Vulgaris, the most common form of acne, is caused when hair follicles in the skin become plugged, usually due to hormonal changes. The condition is most common during adolescence but can occur at any age. Hormonal changes increase oil production (sebum) which conspires with dead skin cells to plug pores The sebaceous (oil) glands continue to produce more oil in the plugged pore and the area becomes a perfect breeding ground for acne. Once the pore is plugged, a common skin bacterium, P. Acnes begins to proliferate and produce porphyrins, which cause even more swelling. The infection then causes pimples and other permanent scars if not properly treated. The bacteria that causes acne, p. acnes, is particularly susceptible to certain wavelengths of blue and red light. Additionally, heat can also destroy these bacteria. Both our Isolaz and CLARO devices use light and heat to treat acne.
2
Table of Contents
The Market for Aesthetic Procedures to Treat the Skin
The American Society for Aesthetic Plastic Surgery reports that in 2009, total expenditures for aesthetic procedures in the U.S. were almost $10.5 billion. From 1997 to 2009 the total number of aesthetic procedures increased from approximately 2.1 million to just under 10 million procedures, representing approximately a 14% compounded annual growth rate. Non-surgical aesthetic procedures were primarily responsible for the overall increase, rising from approximately 1.1 million to approximately 8.5 million procedures over the same period, representing approximately a 19% compounded annual growth rate. We believe there are several factors that have contributed to this historical growth of non-invasive and minimally-invasive aesthetic procedures, including:
| • | Aging of the U.S. Population. The “baby boomer” demographic segment, defined by the U.S. Census as those Americans born between 1946 and 1964, represented nearly 30% of the U.S. population in 2006. Baby boomers control approximately $2 trillion in spending power and 50% of all discretionary income. The size and wealth of this aging segment and its desire to retain a youthful appearance have driven the growth for aesthetic procedures. |
| • | Emergence of Non-Traditional Practitioners. The traditional providers of aesthetic procedures include dermatologists and plastic surgeons. In 2007, there were approximately 17,000 physicians within the specialties of dermatology and plastic surgery according to the American Board of Medical Specialties. Manufacturers of aesthetic systems have placed an increasingly important focus on sales to other physician groups including approximately 72,000 family practitioners, 40,000 obstetricians and gynecologists, and 39,000 general surgeons. Additionally, physician directed medi-spas and non-medical day spas have entered the aesthetics market. |
| • | Broader Range of and Accessibility to Safe and Effective Treatments. Technological developments have made non-invasive treatment alternatives increasingly safe and effective. These technological developments have also reduced the required treatment and recovery time from invasive surgical procedures, which in turn have led to greater patient demand. These factors, along with the easy-to-use and low-cost nature of these products, have attracted both traditional and non-traditional practitioners to aesthetic procedures. |
| • | Market Shift Towards Less Invasive Procedures. Market trends confirm that patients are moving away from invasive procedures towards minimally-invasive or non-invasive treatments. Notably, the American Society for Aesthetic Plastic Surgery reports that from 1997 to 2009 the total number of laser skin resurfacing procedures increased from approximately 154,000 to 510,000 procedures, representing a 10% compounded annual growth rate, and the total number of Botox injection procedures increased from 650,000 to 2.5 million injections over the same period, representing a 12% compounded annual growth rate. |
| • | Changing Practitioner Economics. Managed care and government payor reimbursement restrictions in the United States, and similar payment-related constraints outside the United States, are motivating practitioners to establish or expand their elective aesthetic practices with procedures that are paid for directly by patients. We expect this trend to continue as physicians look for ways to expand their practices. |
| • | Increasing Acceptance of Aesthetic Procedures. Mass-market television shows like Extreme Makeover, The Doctors and 10 Years Younger reflect the mainstream acceptance of aesthetic procedures. Additionally, features in many popular television and print media have the effect of widely advertising the aesthetic procedures undertaken by celebrities, enhancing the glamour associated with and demand for self-improving treatments. |
3
Table of Contents
Similar market trends also exist outside the United States, where demand for non-invasive and minimally-invasive aesthetic procedures has also experienced strong growth. Manufacturers of these aesthetic devices typically derive one-third to one-half of their revenue from international sales.
Aesthetic Procedures for Skin and Their Limitations
Many medical treatments are available to treat wrinkles, rejuvenate the skin and give a patient a more youthful appearance. The most popular treatments include invasive surgical procedures, minimally-invasive needle injections and a variety of other procedures, many of which are energy-based.
Surgical Procedures
Of the various aesthetic alternatives for reducing wrinkles and rejuvenating appearance, invasive surgical procedures, such as cosmetic eyelid surgery, tummy tucks and facelifts, can create the most pronounced and long-lasting changes in appearance. They are performed by plastic surgeons with the patient under anesthesia. Compared to alternative treatments, however, invasive surgical procedures are expensive, costing thousands of dollars, and can involve weeks of post-surgical recovery and time away from work. They carry risk of infection, adverse reactions to anesthesia and hematoma, or accumulation of blood under the skin that may require removal.
Injections
Popular alternatives for temporarily improving appearance and reducing wrinkles include toxins, such as Botox, and soft tissue fillers, such as Restylane and Juvederm, that are injected into the skin. These injections are typically administered by dermatologists at a cost of several hundred dollars. In most instances, they involve little or no restricted recovery time for the patients. The effects of these procedures are temporary, however, and require repeat treatment, with Botox lasting from three to four months and injectable fillers typically lasting from three to six months.
Chemical Peels and Microdermabrasion
Chemical peels use acidic solutions to peel away the epidermis and microdermabrasion generally utilizes small sand crystals to resurface the skin. These techniques can lead to stinging, redness, irritation and scabbing, and more severe complications such as changes in skin color. In addition, patients undergoing these treatments are often required to avoid sun exposure for several months following a procedure.
Laser and Light-based Procedures
Lasers and light based skin rejuvenation procedures typically involve the process of damaging the patient's skin in a controlled manner in order to induce the skin's natural wound-healing process. The objective is to stimulate the growth of new skin, resulting in a more youthful appearance.
One approach to skin resurfacing, referred to as a bulk ablative approach, is to completely remove one or more layers of the skin in the treatment area. This procedure is often limited to patients with light skin and is rarely used off the face. Bulk CO2 laser treatments are one example of this approach. Bulk CO2 laser procedures and other bulk ablative procedures can be effective in rejuvenating the skin, however they often expose patients to substantial pain, long healing times and substantial risk of complications. Bulk ablative procedures can cause bleeding and oozing following a treatment, resulting in significant wound care and associated downtime for the patient. Adverse side effects may include infection, scarring and other possible complications such as hypopigmentation, which is a permanent or long-lasting whitening of the skin. Bulk ablative procedures are typically performed by experienced plastic surgeons and dermatologists and the number of these bulk ablative procedures performed annually has declined in recent years.
4
Table of Contents
A second approach to skin rejuvenation is a bulk non-ablative approach which stimulates the skin's natural wound healing process by mildly damaging collagen in the dermis without breaking or removing one or more layers of the skin. Intense pulsed light treatments are one example of this approach. Intense pulsed light procedures and other bulk non-ablative procedures treat many of the same skin conditions as bulk ablative approaches and are associated with shorter patient downtime and are less invasive. Nevertheless, intense pulse light and other bulk non-ablative approaches commonly have drawbacks such as:
| • | Limited effectiveness. Bulk non-ablative procedures are typically less effective than bulk ablative procedures and many bulk non-ablative procedures are not typically used on areas other than the face or on patients with darker skin colors. |
| • | Adverse side effects. Possible side effects associated with bulk non-ablative procedures include temporary bruising, localized darkening and scarring of the skin as a result of the indiscriminate bulk nature of the treatment and other factors. |
| • | Inconsistent results. Bulk non-ablative procedures have a narrow therapeutic window because an appropriate treatment setting that produces results for one patient may have a risk of scarring for another while settings that are consistently safe for all patients often result in minimal or no improvement. |
Acne Treatment Procedures
Acne is a common skin condition that is most prevalent during adolescence, but can affect persons of all ages. There are a variety of acne treatments available today ranging from over-the-counter medications, prescription medications and energy-based treatments.
| • | Over-the-Counter Medications. When confronted with acne, consumers usually turn to washes and lotions to treat their acne at home. These products generally contain benzoyl peroxide or salicylic acid and can be effective for treating very mild cases of acne and occasional breakouts. Leading products in this category include Pro Active® and Clearasil®. When these treatments prove ineffective consumers usually turn to a physician for more aggressive treatment. |
| • | Prescription Medications. Prescription medications used to treat acne include a variety of antibiotics, retinoids and higher concentrations of some over the counter medications. Usually, these are systemic treatments intended to provide long-term acne clearance. Prescription medications can carry side-effects. Isotretinoin, for example is very effective at treating acne, but has been linked to birth defects and psychological problems. Other prescription medications can also have undesired side effects, both short and long-term. |
| • | Energy-based treatments. IPL and lasers are new options for treating acne. Using light to treat acne is gaining acceptance because of minimal side effects. It can be used on most skin types and it is effective without the need for medications or special washers and cleaners. |
| • | Other Treatment Options. In addition, to the foregoing, acne can be treated with chemical peels and microdermabrasion. |
The Solta Medical Solution
Our four branded systems; Fraxel, Thermage, Isolaz and CLARO are aesthetic treatment systems. Fraxel systems provide treatment alternatives for skin rejuvenation and resurfacing and our Thermage systems provide non-invasive skin tightening, contouring and cellulite reduction treatments. Our acne treatment systems, Isolaz and CLARO, provide both professional and consumer treatment options that are complementary to each other.
5
Table of Contents
Fraxel
A new class of skin rejuvenation therapy, first introduced and commercialized by us, is referred to as “fractional” resurfacing. Fractional resurfacing creates thousands of microscopic treatment zones per square centimeter in the skin to stimulate repair and rejuvenation in the tissue by inducing the skin's natural wound-healing response. At the same time, fractional resurfacing spares a significant portion of the tissue in the treatment area, and stimulates the spared tissue around each microscopic treatment zone to rejuvenate and resurface the skin. We believe fractional resurfacing overcomes the safety shortfalls associated with bulk ablative procedures and the efficacy and safety limitations associated with bulk non-ablative approaches by fundamentally changing the method of treatment.
We believe our Fraxel laser systems afford a new class of skin rejuvenation therapy that provides patients with effective, consistent results without significant downtime and risk of complications. We currently market four Fraxel products: The re:store, re:store Dual, re:fine and re:pair. The Fraxel re:store, re:store Dual and re:fine laser platforms non-ablatively treat a range of applications that include wrinkles and fine lines, pigmentation, sun damage, uneven skin texture and melasma. In addition, the Fraxel re:store DUAL system features two lasers, the first application of the 1927 Thulium wavelength in aesthetics and the 1550 nm gold standard laser for non-ablative fractional resurfacing. The Fraxel re:store platform is optimized for treating more severe conditions, such as acne and surgical scars, deeper lines and wrinkles, and actinic keratoses. The Fraxel re:pair laser system, our ablative fractional resurfacing system, treats the above conditions as well as skin laxity and vascular dyschromia. This system has already received the United States Food and Drug Administration (“FDA”) 510(k) clearance for indications requiring ablation, coagulation and resurfacing of soft tissue.
Our Fraxel systems provide a number of benefits for physicians and patients seeking to provide or receive skin rejuvenation and resurfacing treatments:
| • | Effective Treatments. Our Fraxel laser systems generate and deliver precise wavelengths of energy that create deep microscopic lesions to target specific skin conditions. Our technology also incorporates precise dosage control, which automatically adjusts the amount, pattern, depth and location of energy delivered into the skin to optimize treatment results and enable consistent results from patient to patient. |
| • | Ease of Use. The motion control technology within our Fraxel laser systems enables practitioners to deliver Fraxel laser treatments by performing a simple painting motion on the patient’s skin. The motion control technology automatically delivers a consistent level and pattern of energy by compensating for how rapidly the practitioner moves the handpiece, enabling the practitioner to provide a more uniform post-treatment appearance and a reduced treatment time. |
| • | Broad Applications. We offer Fraxel laser systems that can treat multiple skin conditions on all skin colors, and can be used on all skin surfaces, while other laser technologies are often confined to facial applications. Our Fraxel laser systems have gained FDA 510(k) clearance for the treatment of multiple skin conditions and we are continually evaluating additional opportunities. |
| • | Enhanced Safety. Technologies contained in our Fraxel laser systems improve the safety profiles of our systems. One example is our Integrated Optical Tracking System which reduces the risk of operator error, including deactivating the laser if it is not in motion on the skin. The fact that our consumable treatment tips can be removed and disinfected further enhances the safety of the Fraxel re:store and Fraxel re:fine laser systems. |
| • | System Reliability. Our Fraxel re:store and re:fine laser systems incorporate advanced fiber laser technology that eliminates the need for optical alignment or adjustments within the laser source. These Fraxel laser systems require minimal regular maintenance and have a reduced total cost of ownership. |
6
Table of Contents
Thermage
Our Thermage systems consist of a radiofrequency (“RF”) generator with cooling capability, through the delivery of a coolant to protect the outer layer of the skin from over-heating, and a handpiece that, in conjunction with a treatment tip, regulates epidermis cooling and monitors treatment data. Our system includes a variety of single-use, disposable treatment tips that attach to the handpiece and are selected by physicians based on the procedure to be performed and the size of the area to be treated. The Thermage procedure is typically performed in a medical office setting by, or under the supervision of, trained and qualified physicians, including not only plastic surgeons and dermatologists, but also physicians who do not traditionally perform cosmetic procedures, such as general and family practitioners, obstetricians and gynecologists, and general and vascular surgeons.
Our Thermage systems provide the following benefits for physicians and patients seeking to provide or receive skin tightening, contouring and cellulite reduction treatments:
| • | Controlled Heating of Collagen. Collagen is found in the dermis and in fibrous septae strands in the subcutaneous fat layers of the skin. As we age, our skin loses collagen and the collagen that remains stretches, creating loose, saggy skin. Because RF energy delivery depends on tissue resistance and not on optical light absorption, it can penetrate to a much greater depth than conventional lasers down to the subcutaneous fat layer of the skin. Our monopolar RF heating technology has two mechanisms of action that impact collagen, an initial response and a secondary response. The initial response is an immediate collagen contraction, a dermal contraction for tightening and a fibrous septae contraction in the subcutaneous fat layer for contouring. A secondary wound healing response results in collagen deposition and remodeling, resulting in a continual tightening improvement over time. This tissue tightening effect of the Thermage procedure is demonstrated not only by our clinical experience but corroborated with independently published affiliated scientific data. This body of data provides potential physician customers with objective evidence that they can evaluate when considering a purchase of our system. |
| • | Non-Invasive, Non-Ablative Alternative to Surgery. The Thermage procedure is non-invasive, involving no surgery or injections, and offers an alternative to surgery at a lower price with little or no downtime from patients’ normal routines. It is also a non-ablative procedure that causes minimal temporary surface tissue damage. If desired, the Thermage procedure can be used in a complementary fashion in conjunction with invasive therapies such as liposuction, facelift and thread implants, as well as injectable fillers and other minimally-invasive and non-invasive aesthetic procedures. |
| • | Single Procedure Treatment. The Thermage procedure is normally performed in a medical office setting as a single treatment that takes from 20 minutes to an hour and a half, depending on the treatment area. Studies have shown clinical effect from a Thermage procedure that is both immediate and that can improve over a time period of six months following treatment. In addition, Thermage procedures have been used effectively on all skin types and tones and on various areas of the body. |
| • | Compelling Physician Economics. We believe the Thermage system provides a compelling return on investment for physicians. Thermage systems typically require relatively lower capital costs than competing laser and RF systems, while providing higher average procedure fees than those of our competitors. We continue to design new treatment tips to address new applications. |
| • | Ease of Use. The Thermage NXT™ and CPT™ systems incorporate a straightforward user interface that allows a trained physician to easily perform procedures across various parts of the body. Different treatment sites may use different tips, each of which is pre-customized by size, |
7
Table of Contents
| pulse counts, pulse durations and heating profile to the intended procedure. The system provides real-time feedback and can be adjusted during the procedure as needed. The handpieces are designed with a small profile for accurate placement during treatment, comfort and ease of use. |
| • | Comfort Pulse Technology. The Thermage CPT™ system leverages proprietary Comfort Pulse Technology™ to greatly improve patient comfort during treatment. This proprietary technology combines vibration and a unique energy delivery mechanism to improve the overall patient treatment experience while maintaining the same tightening and firming results that physicians and patients have come to expect from Thermage treatments. |
Isolaz
Our Isolaz systems, which we acquired through our acquisition of Aesthera Corporation in February 2010, integrate vacuum and broadband light to deliver effective acne treatment. This unique combination cleanses deep pores by using a vacuum to help loosen and extract blockage and excessive oil from deep inside the pores. It kills acne-producing bacteria with the blue light component of a broadband light while the heat generated from the rest of the spectrum shocks the oil generating glands and reduce inflammation and redness. Isolaz disposable single patient tips are specific to different skin types. Special filters are also used to make the treatment safe for different skin types. The tips come also in different sizes accordingly to the area to be treated. Isolaz is typically performed in medical settings by or under the supervision of qualified physicians.
Our Isolaz systems provide the following benefits to patients and physicians:
| • | Life Changing Procedure. Although acne is not a life threatening disease, it deeply affects not only the appearance of the sufferer but can have profound effect on the self esteem, confidence and overall personality. Isolaz offers an effective solution for acne patients without affecting their normal life and routine. |
| • | Effective, proven and safe. Isolaz provides an effective treatment of most acne conditions and is also safe to use on virtually all skin types. The treatment is practically painless and allows the patients to return to their normal activities immediately after the procedure. |
| • | Profitable. Isolaz treatments are affordable for patients and provide a source of income for a physician’s practice. Isolaz can also be combined with other therapies already used in a physician’s medical practice such as topical or oral medication to provide faster, more effective and durable results. |
CLARO
CLARO is a hand-held battery operated IPL device that is designed for use by consumers. The CLARO is intended for the treatment of individual pimples and acne lesions. Our CLARO system utilizes a filtered Zenon flash lamp to produce the light wavelengths and heat that destroy the bacteria that causes acne. The flash lamp produces the light in multiple flashes during its 6-second treatment cycle. The CLARO was designed for ease of use, simplicity and with integrated safety features that allow consumers to use it with no special training. We acquired the CLARO system through our acquisition of CLRS Technology Corporation in October 2010.
8
Table of Contents
Solta Medical’s Products
The following table provides information regarding Solta Medical’s products:
| Thermage NXT (1) |
Thermage CPT |
Fraxel re:store (2) |
Fraxel re:store |
Fraxel re:fine |
Fraxel re:pair |
Isolaz (3) |
CLARO | |||||||||
| Commercial Launch Date |
January 2007 | August 2009 | September 2006 | September 2009 | June 2007 | November 2007 | February 2007 | October 2009 | ||||||||
| Modality |
Non-ablative | Non-ablative | Non-ablative | Non-ablative | Non-ablative | Ablative | Non-ablative | Non-ablative | ||||||||
| Energy Source |
Monopolar Radio-frequency |
Monopolar Radio- |
Erbium Glass Fiber Laser |
Erbium and Thulium Glass Fiber Laser |
Raman-shifted Fiber Laser |
CO2 Laser | Photo pneumatic (vacuum and broadband light) | IPL – Intense Pulsed Light | ||||||||
| Wavelength |
N/A | N/A | 1550 nm | 1550 nm and 1927 nm | 1410 nm | 10600 nm | 400 – 1200 nm | 400-1100 nm | ||||||||
| Indications: |
||||||||||||||||
| Cellulite Reduction |
X | |||||||||||||||
| Eyelid Wrinkles |
X | X | ||||||||||||||
| Periorbital Wrinkles |
X | X | X | X | X | |||||||||||
| Melasma |
X | X | X | |||||||||||||
| Resurfacing |
X | X | X | X | ||||||||||||
| Pigmentation |
X | X | X | X | ||||||||||||
| Surgical/Acne Scars |
X | X | X | |||||||||||||
| Actinic Keratoses |
X | X | ||||||||||||||
| Wrinkles and Rhytides |
X | X | X | |||||||||||||
| Vascular Dyschromia |
X | |||||||||||||||
| Pustular Acne |
X | |||||||||||||||
| Comedonal Acne |
X | |||||||||||||||
| Inflamatory Acne (mild to moderate) |
X | X | ||||||||||||||
| Acne vulgaris |
X | |||||||||||||||
| Typical Patient Treatments |
1 | 1 | 1 – 4 | 3 – 4 | 5 – 6 | 1 – 2 | 4 – 6 | 2 per pimple | ||||||||
| Consumable Treatment Tip |
Yes | Yes | Yes | Yes | Yes | Yes | Yes | N/A | ||||||||
| Approximate Tip Life |
One treatment (face/body part) |
One treatment (face/body |
3 – 5 full face treatments |
3 – 5 full face treatments |
5 – 6 full face treatments |
1 – 2 full face treatments |
6 full face treatments |
N/A, unit is designed to last approx. 900 treatments | ||||||||
| Treatment Length |
20 – 90 minutes |
20 – 90 minutes |
20 – 30 minutes |
20 – 30 minutes |
20 – 30 minutes |
20 – 30 minutes |
20 – 30 minutes |
6 seconds | ||||||||
| (1) | System updated from previous system launched in 2002 |
| (2) | System updated from previous system launched in 2004 |
| (3) | System updated from previous system launched in 2004 |
9
Table of Contents
Fraxel re:store DUAL System
Launched in September 2009, the Fraxel re:store Dual system provides superior results for large body areas during a single treatment. Prior to the non-ablative Fraxel re:store Dual system, laser skin resurfacing procedures were largely limited to the face. The Fraxel re:store Dual provides two wavelengths, a 1550 nm wavelength and a 1927 nm wavelength, for clearance of pigmentation, actinic keratosis (pre-cancerous lesions), acne scars, skin texture and tone and melasma. The system offers a better safety profile than ablative fractional laser devices treatment speed that is 25% faster than its predecessor, and cooling built into the handpiece that allows for single operator use.
Fraxel re:store System
Our Fraxel re:store system was launched in September 2006 as an improved next generation product to our first system launched in September 2004 and offers a fractional non-ablative treatment utilizing a fiber laser. We believe the Fraxel re:store system provides an effective solution for skin conditions such as wrinkles, acne scars, skin texture and tone, and pigmentation, including melasma. This system can be operated at a wide range of treatment levels offering the clinician the versatility to treat both superficial and deep conditions based on the patient’s needs and preferences. Our targeted customer base for the Fraxel re:store and re:store Dual systems are physicians who have experience with aesthetic lasers or otherwise have practices performing various aesthetic treatments.
Fraxel re:fine System
Our Fraxel re:fine system, which we launched in June 2007, offers a fractional non-ablative treatment utilizing a fiber laser. The Fraxel re:fine system provides an effective, low discomfort treatment solution in a compact design. The Fraxel re:fine system is for physician practices that want to provide treatment for skin tone and texture, pigmentation and fine lines rather than the broader range of conditions treated by the Fraxel re:store system. Our target customer for the Fraxel re:fine system is a physician practice that is expanding into aesthetics or has a younger patient base primarily interested in preventative or lighter treatments.
Fraxel re:pair System
Our Fraxel re:pair system offers a fractional ablative treatment utilizing a CO2 laser. We believe our Fraxel re:pair system produces similar effectiveness to traditional bulk ablative treatments, with less downtime and risks. The system also penetrates deeper into the skin than bulk ablative treatments, which may provide additional skin tightening. The Fraxel re:pair system delivers a new type of treatment we call fractional deep dermal ablation, for FDDA treatment. The Fraxel re:pair system has received FDA 510(k) clearance for dermatological procedures requiring ablation, coagulation and resurfacing of soft tissue. Our targeted customer base for the Fraxel re:pair system is physician practices that have significant experience in working with aesthetic lasers and are seeking effective but safer ablative procedures with less downtime than those currently offered in the market.
Fraxel Treatment Tips
Our Fraxel laser systems use proprietary consumable treatment tips. To perform a treatment, the physician attaches to the handpiece a treatment tip, which is designed to ensure the treatment is delivered consistently, safely and effectively. After approximately three to five treatments with the Fraxel re:store and re:store Dual laser systems, approximately five to six treatments with the Fraxel re:fine laser system and one or two treatments with the Fraxel re:pair laser system, the consumable tip is depleted of its useful life and must be replaced.
10
Table of Contents
Fraxel Laser Systems Components
Our Fraxel laser systems are comprised of a laser system and a delivery system, including the control console and handpiece. These components generate the laser energy, create individual fractional laser beams and deliver the treatment to the patient according to our optimized treatment parameters.
| • | Fraxel re:store, Fraxel re:store Dual and Fraxel re:fine lasers. Our Fraxel re:store, Fraxel re:store Dual and Fraxel re:fine system consoles each contain a fiber laser which generates laser pulses at 1550 nm, 1550 nm and 1927 nm, and 1410 nm wavelengths, respectively. These wavelengths were specifically chosen to target water in the skin and to optimize the treatment results of each system. The fiber laser technology is specifically designed to produce a high quality beam of energy that maintains its wavelength accuracy to within a few nanometers. The fiber laser is also highly efficient, with low power requirements that can be provided by a standard wall outlet, and without the need for water cooling. Furthermore, the fiber laser is durable and robust with a long life span, and it is easy to set up and maintain, with no service requirement or need for optical alignments or adjustments. |
| • | Fraxel re:pair lasers. Our Fraxel re:pair laser system utilizes an air-cooled CO2 laser at 10600 nm. The specific water absorption characteristics of this wavelength in the skin enable the laser to ablate the tissue immediately, creating a needle-like crater and thin zones of coagulation into the dermis. The treatment is made up of deep microscopic ablated zones surrounded by undamaged tissue, rather than a thin, general ablation of the entire surface as typically achieved with traditional CO2 lasers. By utilizing this fractional deep dermal ablation treatment, we believe treatments with the CO2 laser can be optimized for safety and shorter patient downtime. |
| • | Control Console and Graphical User Interface. Our Fraxel laser systems feature a touch screen graphical user interface that allows the practitioner to select the energy level, treatment level and number of passes. In addition, each system has a dosage feedback system that enables the physician to accurately monitor the total energy delivered to the treatment area by utilizing measurement information obtained from our Intelligent Optical Tracking System. The console also features a simulation mode for training and patient demonstration. |
| • | Handpiece. The laser energy is delivered to our Fraxel laser handpieces, which incorporate our high speed scanner and our Intelligent Optical Tracking System. An additional feature in the Fraxel re:store and Fraxel re:fine handpieces is an automated spot size control system. This system delivers optimum lesion penetration at each energy setting and minimizes bulk heating and discomfort. The Fraxel re:store Dual now features integrated cooling through a Zimmer chiller designed into the system. This allows for a single operator to perform the treatment. |
| • | Treatment Tips. Our Fraxel laser systems use consumable treatment tips that attach to the handpiece. We offer large and small tip solutions enabling the physician to treat all areas of the body effectively. The Fraxel re:pair tips are designed to support evacuation of tissue debris from the treatment field and are intended to eliminate any risk of biohazard, due to the ablative nature of the treatment. Each treatment tip contains a proprietary internal EPROM, or programmable memory chip, which stores treatment parameters and safety limits in order to optimize performance and safety in the selected treatment. |
11
Table of Contents
Thermage NXT and CPT Systems
Our Thermage NXT and CPT system use our patented method of delivering monopolar RF energy for heating collagen.
| • | Monopolar Radiofrequency. Monopolar RF delivery uses two electrodes, with one active electrode being held in the device handpiece by the physician and the second, a passive return electrode, typically attached to the patient’s back. Monopolar delivery allows for precise administration of energy because the electrical current is concentrated where the active electrode touches the body and disperses quickly as it travels towards the return electrode. The monopolar RF process is distinct from bipolar RF-based technology, which is superficial in depth, relying on current passing through tissue located between two probes placed close together on the surface of the skin. We believe that monopolar technology delivers energy effectively to a greater tissue depth than bipolar technology. |
| • | The Treatment Tip Capacitive Coupling Mechanism of Action for Collagen Heating. The single-use treatment tip device contains our patented technology that uses monopolar RF energy as a controlled tissue heating source through the use of a non-conducting material, known as a dielectric. Capacitive coupling is the use of the dielectric to create an electric field in the area where our treatment tip touches the body. The electric field induces a current within the surrounding tissue, resulting in volumetric heating of the tissue due to the tissue’s natural resistance to electrical current flow. The heating depth is based upon the size and geometry of the treatment tip and can be controlled from a few hundred microns to several millimeters in depth, depending upon the particular treatment tip selected for various treatment areas. Collagen is a more efficient conductor of electricity than fat tissue and therefore acts as a pathway for the electric current. To achieve this deep heating with simultaneous surface cooling, the surface of the treatment tip transmits RF energy to the skin while serving as a dynamic contact cooling membrane for the cryogen spray. The contact membrane continually monitors skin surface temperature to help protect the epidermis. |
| • | Comfort and Safety. Since the initial launch of our original Thermage system in 2002, we have monitored and revised our procedure guidelines to safely and effectively deliver RF energy and cryogen cooling to the treatment site with minimal discomfort to the patient. An energy-based aesthetic treatment, if not used according to the manufacturer’s protocol, has the potential to cause patient discomfort, irritation or surface tissue burning. We have designed our system to minimize the risk of these types of occurrences through stringent built-in safety precautions in addition to extensive user training. Our system regulates a combination of inputs to precisely and uniformly distribute RF energy over the treatment site, including temperature and pressure sensors on the treatment tip and pre-programmed power levels and times for specific treatments. |
Thermage NXT and CPT System Components
Our Thermage NXT and CPT systems include three major components: the RF generator, the reusable handpiece and a single-use treatment tip, as well as several consumable accessories. Physicians attach a single-use treatment tip to the handpiece, which is connected to the RF generator. The RF generator authenticates the treatment tip and programs the system for the desired treatment without physician intervention.
| • | Radiofrequency Generator. The RF generator produces a 6.78 megahertz signal and is simple and efficient to operate. Controls are within easy reach, and important user information is clearly displayed on the built-in display, including energy delivered, tissue impedance, duration and feedback on procedure technique. Cooling is achieved through the delivery of a coolant that cools and helps to protect the epidermal surface during a Thermage procedure. |
12
Table of Contents
| • | Handpiece. The reusable handpiece holds the treatment tip in place for the treatment and processes information about skin temperature and contact, treatment force against the skin, cooling system function and other important data. A precision control valve within the handpiece meters the delivery of the coolant. In addition, the CPT hand piece has the ability to vibrate the treatment tip at 3 levels to provide greater comfort forth patient. |
| • | Single-use Treatment Tips. The treatment tip is available in four sizes with several configurations of pulse counts, pulse durations and three heating profiles for efficient implementation of treatment guidelines, based on the size and nature of the treatment area. Physicians currently can order sterile treatment tips in sizes of 0.25 cm2, 1.5 cm2, 3.0 cm2 and 16.0 cm2 on the NXT platform and tips in sizes of 0.25 cm2, 3.0 cm2 and 16.0 cm2 on the CPT platform. The CPT tips provide more uniform heating through a tip frame that has been added to the surface of the electrode. Each treatment tip contains a proprietary internal EPROM, or programmable memory chip, which stores treatment parameters and safety limits in order to optimize performance and safety in the selected treatment. To enhance procedural safety, we have also programmed the EPROM for single-use treatments. Using the same treatment tip to perform multiple treatments could result in injury, as a result of the eventual breakdown of the treatment tip’s electrode dielectric membrane. Therefore, the EPROM ensures that the treatment tip is not reused following a particular procedure. |
Our NXT and CPT systems also include other consumable components in addition to treatment tips. The systems house a canister of coolant that can be used for an average of three to six procedures, depending on the total skin surface area treated and the treatment tip used. Each patient procedure also requires a return pad, which is typically adhered to the patient’s lower back to allow a path of travel for the RF current through the body and back to the generator. We also sell proprietary coupling fluid, an electrically conductive viscous liquid that helps ensure electrical and thermal contact with the treatment tip.
Isolaz Systems
Our Isolaz systems use a unique combination of vacuum and broadband light to deliver effective acne treatment.
| • | Vacuum. Gentle, user adjustable vacuum is responsible for effective pore cleansing which directly extracts debris, sebum and material that clog the pores and, in addition, expose the acne producing bacteria to the intense light. The vacuum levels can be manually adjusted to provide a comfortable treatment to the patient without compromising effectiveness. The vacuum level is also automatically adjusted by the system according to the size of the disposable tip used and can also be manually adjusted. |
| • | Broadband Light. Isolaz uses intense broadband light between 400 and 1200nm. This broadband light is generated by a discharge flash lamp providing intense, effective and targeted treatment for acne. The blue spectrum of the light, 400 to 500nm approximately, has been proven to be the most effective at killing acne-causing bacteria by interacting with bio-products the bacteria creates. The rest of the spectrum, 500 to 1200nm produces deep heat that shock the sebaceous glands while reducing inflammation and redness producing an almost immediate effect on the overall appearance of the skin. The intensity, duration and repetition of the light is adjustable by the operator. |
| • | Disposable Tips. Isolaz uses disposable single-patient tips in different sizes and for different skin types. Unfiltered tips, allowing the broadband light in its full to be delivered, are recommended for lighter skin types, types I to IV in the Fitzpatrick scale. Darker skin types, types IV to VI in the same scale, are more sensitive to lower spectrum light and recommended for filtered tips which cut the low frequencies of the broadband light. |
13
Table of Contents
| • | Profusion. Isolaz also offer a unique topical delivery method by the use of a specially designed treatment called Profusion. In this modality the system uses only the vacuum component and a specially designed tip with single-use sponge cartridges. During a Profusion treatment, a topical solution is applied to the skin. When the tip is applied the skin is stretched by the vacuum and put into close contact with the sponge in the cartridge which pushes the topical deeper into the skin, enhancing the absorption of the topical. |
Isolaz System Components
Our Isolaz system comprises two main elements: a console with an integrated handpiece and disposable single-patient tips. A cart and other accessories are also part of the system.
| • | System console with handpiece. The console integrates the components responsible for the vacuum generation unit, the electric power for the lamp and the touch screen display. The handpiece is ergonomically designed and permanently attached to the console, where the flash lamp is housed and where the disposable single-patient tips are connected for the treatment. The user interface display consists of a touch screen where all the parameters for the treatment can be adjusted by the operator. |
| • | Disposable single-patient tips. The Isolaz disposable tips come in different sizes, small, medium and large for use in different areas of the body such as nose, face and back respectively or for targeted treatment areas. The tips are classified in two groups accordingly to the skin type they are more appropriate for: unfiltered tips for lighter skin types that allow the pass of the full spectrum of the broadband light and filtered tips for darker skin types that cut off the lower spectrum of the light. The flash lamp is also replaceable and has a life span of 35,000 flashes. |
Other components of the system are the system cart, designed with a modern and user-friendly approach, allows for a comfortable access to the system controls and handpiece and mobility. Provider goggles, patient eye covers and tip cooling spray are other accessories available with the system.
CLARO
The CLARO device uses clinically proven IPL to clear acne. CLARO is a FDA IPL cleared for over-the-counter sale. It is intended for spot treatment of mild to moderate inflammatory acne “pimples”, including pustular acne. The life expectance of a CLARO unit is approximately 900 treatments and at the end of its life-cycle the unit must be replaced by the consumer.
Business Strategy
Our goal is to become a leading provider of energy-based medical devices for aesthetic applications by:
| • | Broadening our Physician Customer Base. We intend to continue penetrating the traditional aesthetic practitioner specialties, which include dermatologists and plastic surgeons. We are also seeking to increase our penetration in non-core physician specialties and physician-directed medi-spas with track records of safe and successful aesthetic treatments. Additionally, we continue to devote substantial resources to increasing our market penetration and strengthening our physician relationships in international markets. |
| • | Optimizing Customer Base through Cross-selling. In 2009, when we merged together Reliant and Thermage, we saw a strong cross-selling opportunity between the two portfolios as our installed bases had only a 10% overlap. Our sales force continued to take advantage of this opportunity, along with a similar cross-selling opportunity arising from our acquisition of Aesthera Corporation, during 2010. |
14
Table of Contents
| • | Driving Treatment Tip Usage. Unlike most traditional energy-based medical device businesses, which rely solely on the sale of new capital equipment to generate revenue, our disposable treatment tip business model enables us to maintain a continuous relationship with our customer base. We work collaboratively with our customer base to increase treatment tip usage by expanding clinical applications and augmenting and facilitating the marketing efforts of our physician customers. We believe that our customers’ interests are closely aligned with our own, and we monitor the market to foster continued procedure growth for our customers and treatment tip sales for us. With marketing programs such as the Diamond Rewards Program and our international Partner Plan, our sales force works with physician customers to help develop profitable Thermage, Fraxel and Isolaz businesses within their practice. |
| • | Developing New and Improving Current Applications. Our current product portfolio allows us to offer products that meet a broad range of physician, practitioner and patient needs. By continuing to invest in research and development, we intend to expand our product offerings even further by improving our current products and commercializing products that address new clinical treatment applications. |
| • | Seeking Growth Opportunities via Complementary Products, Technologies or Businesses. We intend to continue pursuing opportunities to expand our core business by identifying opportunities to further complement our existing array of products for the aesthetics market with synergistic technologies and/or applications. |
| • | Expanding our International Presence. We believe the size of the international market is comparable to the U.S. market, and we are focused on increasing our market penetration overseas and building global brand-recognition. We intend to continue adding sales representatives and support staff to increase direct sales and strengthen physician relationships in international markets. |
| • | Becoming a Leader in Personal Care Devices. We believe that there is significant and untapped growth potential in the market for consumer-use aesthetic devices. In October 2010 we acquired CLRS Technology Corporation, the developer of the CLARO acne device in order to position ourselves to become a leader in this market. |
Sales and Marketing
Professional Systems
We sell our Thermage, Fraxel and Isolaz systems to physicians in the United States primarily through a direct sales force of trained sales consultants. As of December 31, 2010, we had a U.S. direct sales force team, including area sales directors, area sales representatives and clinical specialists, managed by the Vice President of Sales. Our U.S. sales organization is divided into two groups, with half of the sales force focusing on existing customers to sell treatment tips, upgrades, accessory sales and training, and the remainder focusing on securing and broadening our new customer base. Outside of the United States, we primarily sell our Thermage, Fraxel and Isolaz systems to physicians in over 100 countries through independent distributors. In select countries such as Canada, Australia, Hong Kong, Japan, Germany, France, Spain, Portugal and the United Kingdom, we also have direct sales organizations.
United States Sales
Our strategy to increase sales in the United States is to:
| • | remove obstacles for purchase, including treatment discomfort, time of treatment, efficacy and cost, and increase the variety of applications we offer; |
15
Table of Contents
| • | continue to position the Thermage, Fraxel and Isolaz procedures as attractive alternatives to other aesthetic treatments for skin tightening, skin rejuvenation, skin resurfacing and body shaping; |
| • | work closely with our physician customers to increase product usage and enhance the marketing of Thermage, Fraxel and Isolaz procedures in their practices; |
| • | invest in consumer public relations; and |
| • | expand our sales efforts to reach physicians outside of the traditional specialties for aesthetic procedures. |
Further, we actively engage in promotional opportunities through participation in industry tradeshows, clinical workshops and company-sponsored conferences with expert panelists, as well as through trade journals, brochures and our website. We actively seek opportunities to obtain positive media exposure, and have been highlighted on such national broadcasts as The Doctors, Dr. Oz, Good Morning America, Oprah, Rachel Ray, and The Today Show, as well as numerous local news programs.
| • | Consultative Sales Process. Through our consultative sales process, we form strong relationships with our customers through frequent interactions. Beyond performing initial system installation and on-site training and certification, which can occur within two weeks of a physician’s purchase decision, our sales consultants provide consultation to physicians on how to integrate our systems into their practices and market procedures to their patients. Our sales consultants’ compensation structure emphasizes consumable sales and customer service over capital equipment sales, although our sales force also has incentives to generate new accounts through system sales. We require our sales consultants to invest substantial time in training and servicing our physician customers, and therefore we discourage sales to physicians who do not show the potential to drive aesthetic procedure volume. |
| • | Physician Training and Certification. We provide comprehensive training and education to each physician upon delivery of the Thermage, Fraxel and Isolaz systems. We require this initial training to assist physicians in safely and effectively performing these procedures. The majority of physicians operating our installed base of systems have pursued and met the training criteria that we establish. To signify their achievement, we award a certificate of training to these physicians and identify them within the physician locator on our website. We do not list physicians within our physician locator unless they have met these training requirements. |
| • | Diamond Rewards Program. This is an industry-exclusive customer loyalty program available to Solta Medical customers in the United States. The program allows physicians to lock-in preferred pricing for Thermage and Fraxel treatment tips along with other preferred customer benefits to help physicians grow their practices and increase practice profitability. |
| • | Direct-to-Consumer Marketing (“DTC”). We have historically invested in consumer programs designed to build brand awareness and recognition, demonstrate our commitment to supporting our physician customers and distributors and increase demand for Thermage and Fraxel procedures. We have consumer websites targeted to consumers interested in learning more about Thermage, Fraxel, Isolaz and CLARO treatments and include information on our underlying technology and potential treatment outcomes, as well as short films and listings of local physicians who offer Thermage, Fraxel and Isolaz procedures. We have observed our website traffic increase significantly following national television appearances and their periodic re-broadcasts and following our DTC efforts. Due to women’s interest in anti-aging treatments and procedures, our current DTC efforts are focused on public relations where we utilize public relations outreach, |
16
Table of Contents
| such as desk-side briefings and pitching of new product press releases, to consumer health and beauty publications. This effort generates billions of gross impressions and has generated a high awareness of the Thermage, Fraxel and Isolaz brands among this key target demographic. |
International Sales
As of December 31, 2010, we had an international sales team including regional managing directors, regional sales representatives and clinical specialists managed by the Vice President of Sales. We support our independent distributors who market our Thermage, Fraxel and Isolaz systems in over 100 countries. We require our distributors to provide customer training, to invest in equipment and marketing, and to attend certain exhibitions and industry meetings. The percentage of our revenue from customers located outside North America was approximately 55%, 53% and 48% in 2010, 2009 and 2008, respectively.
Our strategy to grow sales outside the United States is to:
| • | increase penetration of Thermage, Fraxel and Isolaz systems in international markets in which our systems are currently sold; |
| • | increase utilization of our systems through increased treatment tips and consumable sales; |
| • | sell direct into select international markets; and |
| • | expand our marketing efforts to support direct sales into select international markets. |
Competition
Our industry is subject to intense competition. We compete directly against professional laser and light-based skin rejuvenation products and procedures offered by companies such as Alma Laser, Cutera, Cynosure, Lumenis, Lutronic, Palomar Medical Technologies, Sciton, and Syneron Medical. Our consumer device competes against companies that offer laser, LED and other light-based devices for skin rejuvenation and acne treatment such as Clarisonic, Palomar Medical Technologies, Syneron Medical Technologies, Tria Beauty and Zeno.
In addition, we compete against existing and emerging treatment alternatives such as cosmetic surgery, chemical peels, microdermabrasion, Botox, dermal fillers, collagen injections and both prescription and OTC acne medications. Some of these alternative procedures require a lower initial capital investment by a practitioner, some of these procedures may not require the purchase of a consumable treatment tip to perform a procedure and in the area of acne, consumers have a wide variety of treatment choices. Some of our competitors are also publicly-traded companies and others have longer operating histories than we do. Many of them may enjoy several competitive advantages, including:
| • | greater name recognition; |
| • | more extensive intellectual property protection; |
| • | established relationships with practitioners and other health care professionals; |
| • | established domestic and international distribution networks; |
| • | broader product lines and existing treatment systems, and the ability to offer rebates or bundle products to offer higher discounts or incentives; |
17
Table of Contents
| • | greater experience in conducting research and development, manufacturing, clinical trials, obtaining regulatory approval for products and marketing approved products; and |
| • | greater financial resources for product development, sales and marketing and patent litigation. |
Competition among providers of laser and other light-based devices for the aesthetic market is characterized by intensive sales and marketing activities. There are few barriers to entry that would prevent new entrants or existing competitors from developing products that could compete with ours. There are many companies, both public and private, that are developing devices that use light-based, radiofrequency-based and alternative technologies. Additional competitors may enter the market and we are likely to compete with new companies in the future. To compete effectively, we have to spend significantly on sales and marketing activities and differentiate our products on the basis of performance, brand name, reputation and price. We have encountered and expect to continue to encounter potential customers who, due to existing relationships with our competitors, are committed to, or prefer the products offered by these competitors.
Research and Development
The focus of our research and development team is to provide technological innovation and associated intellectual property that expands the value proposition of our Thermage, Fraxel, Isolaz and CLARO brand technologies and product platforms. We work closely with medical thought leaders and physician entrepreneurs to understand unmet needs and emerging applications in aesthetic medicine. We focus our efforts on improving the utility of existing products as well as developing new technology platforms for emerging aesthetic applications. We have a fully-staffed, co-located aesthetic clinic and an on-site biomedical laboratory that we believer promotes the rapid conversion of concepts into products. Our primary ongoing investments are in skin tightening, non-ablative and minimally ablative skin resurfacing, body shaping and contouring. We are committed to a recurring revenue business model and our research and development team is focused on a product portfolio with both disposable/consumable and capital equipment products. Current research and development activities address both the professional and consumer markets and are focused on:
| • | developing new laser wavelengths, laser delivery systems and new treatment indications; |
| • | improving the efficacy and predictability of monopolar RF treatment and developing new energy delivery technologies for the future; |
| • | developing algorithms, technology and devices for on-board skin diagnostics, precision dosage control and patient comfort management; and |
| • | improving and developing state of the art security systems to ensure the safety and efficacy of our systems. These security systems also maintain integrity of our long-term recurring revenue in the form of tips, hand pieces and other consumables. |
As of December 31, 2010, we had a staff of 48 technical professionals focused on product development projects and the clinical, biomedical and regulatory support of these projects. We use off-site animal testing facilities and our fully equipped, on-site biomedical lab for the early development and evaluation of product concepts and for providing support to scientific and clinical studies conducted by our co-located clinic and by off-site investigators and institutions. We use transmission electron microscopy on biopsied tissue samples to corroborate that our products induce the denaturing of collagen that leads to immediate tissue tightening. We have developed histology techniques to investigate the depth of heat in tissue and the wound healing process that we believe is responsible for long-term improvement and tightening of tissue. Our staff of laser tissue interaction specialists has amassed over 50,000 histological images in the quantification of treatment parameters. We have also created three-dimensional computer models to study tissue treatment with our products. In addition, we have
18
Table of Contents
also formed strategic relationships with outside contractors for assistance on specialized projects, and we work closely with experts in the medical community to supplement our internal research and development resources. Research and development expenses for 2010, 2009 and 2008 were $16.3 million, $16.2 million and $9.5 million, respectively. The advanced research and development team includes physicists and biomedical systems engineers who create the prototype devices that enable the biomedical engineering team to explore the skin science. The biomedical engineering team is led by RF and laser tissue interaction specialists who model the laser tissue interactions, and create the databases that are utilized for the design of treatment systems. The product engineering team consists of experienced program managers, optical engineers, mechanical engineers, electrical engineers and embedded machine control software engineers who have the responsibility for design of ergonomic, reliable products, for documentation of those products, release to manufacturing and long-term design support.
We entered into an agreement with Philips Consumer Lifestyle B.V. (“Philips”) in March 2008 to develop and commercialize a home-use, laser-based device for skin rejuvenation. We believe this represents a significant opportunity to bring laser-based devices directly to consumers. Under the agreement, Philips made quarterly payments to us for research and development related to the device. Under the terms of this arrangement, Philips made advance quarterly payments for the costs incurred in performing activities under the arrangement. As of December 31, 2010, all payments have been collected on the agreement. Philips may terminate the agreement at any time if it chooses not to proceed with commercialization of the device. Upon commercialization of the device, Philips will pay us a percentage of net sales of the device and related products. As long as certain technology transfer payments are paid to us, the agreement is exclusive with respect to the right of Philips to manufacture, distribute, sell and commercialize the device and the related products. After termination of the agreement and/or termination of the exclusivity period as described above, we are prohibited from directly or indirectly manufacturing, selling, distributing and commercializing any laser-based devices for home-use by consumers that are similar to the device developed under this agreement. This program, by its nature, is generating component and system level cost reduction opportunities for our future professional products, as well.
Patents and Proprietary Technology
We rely on a combination of patent, copyright, trademark and trade secret laws and confidentiality and invention assignment agreements to protect our intellectual property rights. As of December 31, 2010, we had 89 issued U.S. patents, 70 pending U.S. patent applications, 52 issued foreign patents and 56 pending foreign patent applications, some of which foreign applications preserve an opportunity to pursue patent rights in multiple countries. The issued U.S. patents have expiration dates between 2011 and 2029. Expiration may occur earlier under certain circumstances, such as if we do not continue to pay maintenance fees to the United States Patent and Trademark Office. Not all of our patents and patent applications are related to our current or future product lines, and some of our patents have been licensed to third parties. The pending foreign applications relate to similar underlying technological claims to the U.S. patents and/or patent applications. We intend to file for additional patents to strengthen our intellectual property rights.
Our patent applications may not result in issued patents, and we cannot assure you that any patents that issue will protect our intellectual property rights. Third parties may challenge any patents issued to us as invalid, may independently develop similar or competing technology or may design around any of our patents. We cannot be certain that the steps we have taken will prevent the misappropriation of our intellectual property, particularly in foreign countries where the laws may not protect our proprietary rights in these foreign countries as fully as in the United States.
As a result of a settlement of litigation reached in June 2005, we and Syneron have granted each other a non-exclusive paid-up license under the patents asserted in the lawsuit and related patents under the parties’ control. We excluded from this license any rights to utilize monopolar RF technologies and capacitive electrical
19
Table of Contents
coupling, which we believe in combination allow the Thermage procedure to create a reverse thermal gradient and deep, near uniform, volumetric heating to achieve tissue tightening effects. Syneron excluded from its license any patents related to its proprietary Electro-Optical Synergy technology. Both parties admitted the validity of all patents in the litigation, but neither admitted any wrongdoing or liability.
We advised Alma Lasers Ltd. and Alma Lasers, Inc (together “Alma”) as early as February 2006 that Alma’s Accent product infringed numerous Thermage patents. On April 26, 2007 Alma filed a lawsuit against us in the United States District Court for the District of Delaware requesting a declaratory judgment that Alma’s Accent product does not infringe our patents and that our patents are invalid.
On June 20, 2007, we filed patent infringement counterclaims against Alma in the United States District Court for the District of Delaware asserting that that Alma’s AccentXL and Harmony systems infringe ten of our U.S. patents. The counterclaims were amended on December 10, 2007 to include a claim of infringement of an eleventh patent. In addition to damages and attorney fees, we are asking the Court to enjoin Alma from further infringement. During May, June and July 2008, Alma filed with the United States Patent and Trademark Office requests that all of the 11 patents asserted by us be reexamined. The United States Patent and Trademark Office has made rejections of some claims in each of these 11 patents. We believe the United States Patent and Trademark Office will reaffirm the validity of our patents. Some of the patents in reexamination have been reaffirmed, while others remain under rejection. As a result of a settlement reached on May 10, 2010, the Company and Alma granted each other a covenant not to sue under the patents asserted in the lawsuit and related patents. In addition, Alma paid the Company a non-returnable one-time amount of $2,250,000 in connection with this settlement. External legal fees incurred during year ended December 31, 2010 in connection with the settlement amounted to approximately $37,000. In connection with this settlement, the Company has recorded a net gain of approximately $2,213,000 in operating expenses during the year ended December 31, 2010. We do not believe the final disposition of these reexaminations will have a material adverse effect on our financial statements and future cash flows.
Through the acquisition of Reliant in December 2008, we acquired an exclusive, royalty bearing, worldwide license, with the right to sub-license, with Massachusetts General Hospital (“MGH”) to patent applications relating to some of the technology used in the Fraxel laser systems. The license, ongoing royalty obligations and all rights thereunder terminated on December 31, 2010, provided however that MGH has granted a non-assert provision that applies to all of our products in the professional marketplace.
On November 10, 2008, we entered into agreements with Palomar Medical Technologies and Massachusetts General Hospital to create the Fractional Technology Open Patent Program (“FTOPP”). The FTOPP was designed to provide third parties the opportunity to license technology related to fractional light-based treatments in the professional field. Subject to certain conditions, we agreed to license patents that are included in the FTOPP on a non-discriminatory basis to such third parties. The FTOPP agreements require that the royalties from FTOPP licensees be allocated amongst the three parties.
The FTOPP comprises six patent families, including 11 issued and pending U.S. patents and applications, along with foreign counterparts. Included in the FTOPP are: U.S. patent numbers 6,632,219 and 6,059,820 and patent application number 11/250,139 (the “Tankovich-Baranov” patent family named for inventors Dr. Nikolai Tankovich and Dr. Eugene Baranov); U.S. patent application number 10/542,390 (the “1678” patent family licensed by us from MGH); and U.S. patent application number 10/367,582 (the “582” patent family). Included in the FTOPP from Palomar Medical Technologies are: U.S. patent number 6,997,923 and patent application number 11/235,697 (the “923” patent family); and U.S. patent number 6,723,090 and patent application number 11/408,272 (the “Fiber Laser” patent family). Also included in the FTOPP from Massachusetts General Hospital is U.S. patent number 7,331,953 and patent application number 11/931,232 (the “953” patent family).
20
Table of Contents
In conjunction with the FTOPP, we and Palomar Medical Technologies entered into a cross-license agreement by which we have licensed certain patents to each other and have granted covenants not to sue with respect to each other’s existing products and technologies.
In addition, we have notified certain competitors of our belief that they may be infringing or may need a license under one or more of our issued patents. These notices may result in other patent litigation in the future. Patent litigation is very expensive and could divert management’s attention from our core business. Patent litigation could also result in our patents being held invalid or narrowly construed. We have in the past and may in the future offer certain of our intellectual property rights for license to our competitors. As of December 31, 2010, we have not entered into any such licenses with our competitors other than our licenses with Syneron and Palomar. We granted Edward Knowlton, one of our founders and inventor of our original patents, an exclusive license under the original Thermage patents and related patents for certain non-cosmetic applications. We also granted Relay Technologies, Inc. an exclusive license under the Reliant intellectual property for certain non-cosmetic applications, as part of the merger transaction between Reliant and us.
Solta Medical has several registered trademarks and service marks. “Thermage,” “Thermage CPT,” “Thermage NXT,” “Fraxel” and “Isolaz” are registered trademarks in the United States and several foreign countries. As of December 31, 2010, we have 408 pending and registered trademark filings worldwide, some of which apply to multiple countries, providing coverage in 60 countries. We intend to file for additional trademarks to strengthen our trademark rights, but we cannot be certain that our trademark applications will issue or that our trademarks will be enforceable.
As part of our acquisition of CLRS Technology Corp, we granted Allergia, Inc., a company owned by the original CLRS shareholders, a royalty free license to use the underlying CLARO technology in certain medical applications outside of the field of aesthetics. We also have a right of first refusal to purchase any non-aesthetic medical technologies developed by Allergia, Inc. that are based on the CLARO technology platform.
All employees and technical consultants are required to execute confidentiality agreements in connection with their employment and consulting relationships with us. We also require them to agree to disclose and assign to us all inventions conceived or made in connection with the employment or consulting relationship. We cannot provide any assurance that employees and consultants will abide by the confidentiality or invention assignment terms of their agreements. Despite measures taken to protect our intellectual property, unauthorized parties may copy aspects of our products or obtain and use information that we regard as proprietary.
Clinical Research
We are co-located with an aesthetic clinic managed by an independent plastic surgeon medical director. The aesthetic clinic is funded and administratively managed by the Company. The staff of the clinic performs Thermage, Fraxel and Isolaz procedures, participates in clinical studies and assists in research into new therapies using our systems. These studies provide us with immediate feedback on treatment parameters and treatment protocols which enable us to develop and improve the safety and efficacy of our aesthetic treatment systems. The clinic also conducts on-site clinical studies in support of obtaining additional regulatory clearances, applications development and photographic documentation. The clinic also offers us a hands-on observation and training center for potential physician and nurse customers or for those interested in advanced training in treatment protocols and system parameters to achieve optimal outcomes.
Manufacturing
Our manufacturing involves the combined utilization of our internal manufacturing resources and expertise, approved suppliers and contract manufacturers. Our internal manufacturing activities include the assembly, testing and packaging of Thermage, Fraxel and Isolaz branded treatment tips and accessories, as well
21
Table of Contents
as the final integration, system testing and packaging of Thermage and Fraxel systems. We outsource the manufacture of components, subassemblies and certain finished products that are produced to our specifications and shipped to our facility for final assembly or inspection, testing and certification. Finished product is stored at and distributed primarily from out Hayward facility. A small percentage of our finished product is distributed from warehouses in the Netherlands and Australia. Quality control, risk management, efficiency and the ability to respond quickly to changing requirements are the primary goals of our manufacturing operations.
We have arrangements with our suppliers that allow us to adjust the delivery quantities of components, subassemblies and finished products, as well as delivery schedules, to match our changing requirements. The forecasts we use are based on historical trends, current utilization patterns and sales forecasts of future demand. Lead times for components, subassemblies and finished products may vary significantly depending on the size of the order, specific supplier requirements and current market demand for the components and subassemblies. Most of our suppliers have no contractual obligations to supply us with, and we are not contractually obligated to purchase from them, the components used in our devices.
We obtain programmable memory chips for our treatment tips and certain critical components of our systems, handpieces and accessories from single suppliers, for which we attempt to mitigate risks through inventory management and purchase order commitments. Other products and components come from single suppliers, but alternate suppliers have been qualified or, we believe, can be readily identified and qualified. In addition, the availability of cryogen for our Thermage brand cooling module and Isolaz brand Tip Spray, which we can source from multiple suppliers, may fluctuate due to changes in the global supply of this material. To date, we have not experienced material delays in obtaining any of our components, subassemblies or finished products, nor has the ready supply of finished product to our customers been adversely affected.
Our consumer product the CLARO is entirely manufactured using approved suppliers and contract manufacturers under our supervision.
We are required to manufacture our products in compliance with the FDA’s Quality System Regulation, or QSR. The QSR covers the methods and documentation of the design, testing, control, manufacturing, labeling, quality assurance, packaging, storage and shipping of our products. We maintain quality assurance and quality management certifications to enable us to market our products in the member states of the European Union, the European Free Trade Association and countries which have entered into Mutual Recognition Agreements with the European Union. These certifications include EN ISO 9001:2000 and CAN/CSA ISO 13485:2003 and are also required to maintain our product registration in a number of other foreign markets such as Canada.
We use small quantities of common cleaning products in our manufacturing operations, which are lawfully disposed of through a normal waste management program. We do not forecast any material costs due to compliance with environmental laws or regulations.
Services and Support
We strive to provide highly responsive service and support for our Thermage, Fraxel and Isolaz systems, treatment tips and consumable products.
Our treatment tips and consumables are shipped from finished goods inventory typically on the day of the order. All treatment tips are identified with lot numbers and date codes that indicate the expiration date of the product and are fully warranted until the date of expiration. We maintain a staff of customer service personnel in our Hayward, California facility that is available by phone to our customers to answer questions regarding the use of our products. In the United States our direct sales force provides on-site support and training to our customers in the use of Thermage, Fraxel and Isolaz systems.
22
Table of Contents
The CLARO consumer device is shipped from finished goods inventory at our Hayward, California facility or from our third party order fulfillment service provider. Orders for our national retail accounts are taken through an EDI system and all other sales through phone, fax, email or from our myclaro.com website. In the future we may utilize a third-party fulfillment service to warehouse and ship orders. We utilize our staff of customer service personnel in Hayward to take orders, answer consumer questions and authorize product returns. The CLARO sales team provides on-site support and training to national retailers. Training for other retailers is provided by phone or video conference. Each CLARO unit has a 30-day no question asked return policy, although national retailers have different return policies that are pursuant to our vendor agreements with these retailers.
In the United States, our Thermage, Fraxel and Isolaz systems and accessory products are shipped to a customer’s site for initial installation and training by one of our direct sales consultants. Our direct sales force, our customer service personnel and our product service staff provide post-installation support and service. All of our systems come with a one year factory warranty. We also offer extended service contracts to our customers at various prices which are effective after the factory warranty expires. If a customer’s system is not covered by the factory warranty or an extended service contract, we charge the customer for time and materials to perform any repairs on the system. In the event of a failure of a system, our product support department arranges for the repair of that system in a way that minimizes disruption at the customer site. Resolution may involve shipment of “loaner” equipment to the customer for its use while the customer owned equipment is returned for repair at the Hayward facility, or dispatching a Solta Service Engineer or a certified third-party service partner to perform repair of the equipment at the customer site. Our goal in most cases is to have the customer up and running within two working days. All systems and components are serialized or lot tracked, and device history records are maintained that track service history and configuration. In markets outside of the United States, our products are serviced and supported through our independent distributors or, in our directly supported international markets, by our field service personnel and/or third party service providers.
Government Regulation
Our Thermage, Fraxel, Isolaz and CLARO systems are medical devices and are subject to extensive and rigorous regulation by the U.S. Food and Drug Administration (“FDA”), as well as other federal and state regulatory bodies in the United States and laws and regulations of foreign authorities in other countries. FDA regulations govern the following activities that we perform, or that are performed on our behalf, to ensure that medical products distributed domestically or exported internationally are safe and effective for their intended uses:
| • | product design and development; |
| • | product testing; |
| • | product manufacturing; |
| • | product safety; |
| • | product labeling; |
| • | product storage; |
| • | recordkeeping; |
| • | premarket clearance or approval; |
| • | advertising and promotion; |
23
Table of Contents
| • | production; and |
| • | product sales and distribution. |
FDA’s Premarket Clearance and Approval Requirements
Unless an exemption applies, each medical device we wish to commercially distribute in the United States will require either prior 510(k) clearance or premarket approval from the FDA. The FDA classifies medical devices into one of three classes. Devices deemed to pose lower risks are placed in either class I or II, which requires the manufacturer to submit to the FDA a premarket notification requesting clearance to commercially distribute the device. This process is generally known as 510(k) clearance. Some low risk devices are exempted from this requirement. Devices deemed by the FDA to pose the greatest risk, such as life-sustaining, life-supporting or implantable devices, or devices deemed not substantially equivalent to a previously cleared 510(k) device, are placed in class III, requiring premarket approval. All of our current products are class II devices.
510(k) Clearance Pathway
When a 510(k) clearance is required, we must submit a premarket notification to the FDA demonstrating that our proposed device is substantially equivalent to a previously cleared and legally marketed 510(k) device or a device that was in commercial distribution before May 28, 1976 for which the FDA has not yet called for the submission of premarket approval applications (“PMA”). By regulation, the FDA is required to clear or deny a 510(k) premarket notification within 90 days of submission of the application. As a practical matter, clearance often takes significantly longer. The FDA may require further information, including clinical data, to make a determination regarding substantial equivalence. If the FDA determines that the device, or its intended use, is not substantially equivalent to a previously cleared device or use, the FDA will place the device, or the particular use, into class III, requiring premarket approval.
Radiofrequency devices used for aesthetic procedures, such as wrinkle reduction, are generally regulated as Class II medical devices and are qualified for clearance under 510(k) procedures. We have received 18 510(k) clearances for the Thermage system for multiple indications. We received FDA clearance to market our Thermage system for the treatment of periorbital wrinkles and rhytides in November 2002 and for treatment of facial wrinkles and rhytides in June 2004. In December 2005, we received FDA clearance to market our Thermage system for full body treatment of wrinkles. In October 2006, we received FDA clearance to market the Thermage system, for the temporary improvement in the appearance of cellulite. In June 2007, we received clearance to market our Thermage system for treatment of wrinkles and rhytides for the upper and lower eyelids. In June 2009, we received FDA clearance to market our latest Thermage system and handpiece configuration for wrinkles, rhytides and for the temporary improvement in the appearance of cellulite.
Laser devices used for aesthetic procedures, such as skin resurfacing, are also generally regulated as Class II medical devices, requiring 510(k) clearance. The FDA has granted 15 510(k) clearances for four Fraxel devices relating to multiple indications for use. We received FDA clearance to market our first generation Fraxel SR750 system for coagulation of soft tissue in November 2003 and subsequently for treatment of periorbital wrinkles (June 2004), pigmented lesions (June 2004), melasma (March 2005), skin resurfacing procedures (July 2005) and acne and surgical scars (March 2006). In March 2006, we received FDA clearance to market our Fraxel re:store system for soft tissue coagulation and for treatment of periorbital wrinkles, pigmented lesions, melasma and skin resurfacing. We subsequently received FDA clearance for the Fraxel re:store for treatment of acne and surgical scars in January 2007 and for actinic keratoses in May 2007. In April 2007, we received FDA clearance to market the Fraxel re:fine system for soft tissue coagulation and for treatment of periorbital wrinkles, pigmented lesions, melasma, skin resurfacing, acne scars and surgical scars. The Fraxel re:pair system was cleared for ablation, coagulation and resurfacing of soft tissue in April 2007 and for treatment of wrinkles,
24
Table of Contents
pigmentation, textural irregularities and vascular dyschromia in November 2007. We received FDA clearance for two additional Fraxel re:pair handpieces in July 2008, which deliver ablative and incisional treatments for surgical applications. We received FDA clearance for the Fraxel re:store DUAL Laser System in October 2009, which offer the 1550nm and 1927nm wavelengths. As of January 2011 the 1927 nm laser from the DUAL System became available as a stand-alone laser product.
We have two IPL products: Isolaz (prescription use) and CLARO (consumer use). Both are regulated as Class II medical devices. Prior to our acquisition of Aesthera Corporation, it had already obtained 510(k) clearance and CE Marking for Isolaz. Prior to our acquisition of CLRS Technology Corporation, it had obtained 510(k) clearance for CLARO; first for prescription use, followed by over-the-counter 510(k) clearance in April 2010 for the treatment of individual pimples in persons with mild to moderate inflammatory acne.
Premarket Approval Pathway
A PMA must be submitted to the FDA if the device cannot be cleared through the 510(k) process. A PMA must be supported by extensive data, including but not limited to, technical, preclinical, clinical, manufacturing and labeling, to demonstrate to the FDA’s satisfaction the safety and effectiveness of the device.
Upon submission, the FDA determines if the PMA application is sufficiently complete to permit a substantive review, and, if so, the application is accepted for filing. The FDA then commences an in-depth review of the PMA application, which typically takes one to three years, but may last longer. An advisory panel of experts from outside the FDA is typically convened to review and evaluate the PMA applications and provide recommendations to the FDA as to the approval of the device. As part of the PMA review, the FDA will typically inspect the manufacturer’s facilities for compliance with Quality System Regulation, or QSR, requirements, which impose specific testing, control, documentation and other quality assurance procedures.
To date, no device that we have developed has required premarket approval, nor do any of the devices currently in development require premarket approval.
Product Modifications
After a device receives 510(k) clearance, any product modification that could significantly affect its safety or effectiveness, or that would constitute a major change in its intended use, requires a new 510(k) clearance or could require a PMA approval. The FDA requires each manufacturer to make this determination initially, but the FDA can review any decision and disagree with a manufacturer’s determination not to file a new 510(k) or PMA. If the FDA disagrees with our determination, the FDA may retroactively require us to seek 510(k) clearance or premarket approval. The FDA could also require us to cease marketing and distribution and/or recall the modified device until 510(k) clearance or premarket approval is obtained. Also, in these circumstances, we may be subject to significant regulatory fines or penalties. We have modified aspects of our Thermage, Fraxel, Isolaz and CLARO systems and accessories since receiving regulatory clearance, and we have made additional 510(k) filings when we deem it necessary. Decisions and rationale not to file a 510(k) for device modifications are documented.
Clinical Trials
Clinical trials are almost always required to support an FDA premarket application and are sometimes required for 510(k) clearance. In the United States, these trials generally require submission of an application for an Investigational Device Exemption (“IDE”), to the FDA. The IDE application must be supported by appropriate data, such as animal and laboratory testing results, showing that it is safe to test the device in humans and that the testing protocol is scientifically sound. The IDE must be approved in advance by the FDA for a
25
Table of Contents
specific number of patients unless the product is deemed a non-significant risk device eligible for more abbreviated IDE requirements. Clinical trials for significant risk devices may not begin until the IDE application is approved by the FDA and the appropriate institutional review boards, (“IRB”), at the clinical trial sites.
Our clinical trials must be conducted under the oversight of an IRB at the relevant clinical trial sites and in accordance with FDA regulations, including but not limited to those relating to good clinical practices. We are also required to obtain patients’ informed consent in compliance with both FDA requirements and state and federal privacy regulations. We, the FDA or the IRB at each site at which a clinical trial is being performed may suspend a clinical trial at any time for various reasons, including a belief that the risks to study subjects outweigh the benefits. Even if a trial is completed, the results of clinical testing may not demonstrate the safety and efficacy of the device, may be equivocal, or may otherwise not be sufficient to obtain clearance or approval of the product. Similarly, in Europe, clinical studies must be approved by the local ethics committee and in some cases, including studies with high-risk devices, by the Ministry of Health in the applicable country.
Pervasive and Continuing Regulation
After a device is placed on the market, numerous regulatory requirements continue to apply. These include:
| • | Quality System Regulations (“QSR”) which require manufacturers, including third-party manufacturers, to follow stringent design, testing, control, documentation and other quality assurance procedures during all aspects of the manufacturing process; |
| • | labeling regulations and FDA prohibitions against the promotion of products for uncleared, unapproved or “off-label” uses; |
| • | medical device reporting regulations, which require that manufacturers report to the FDA if their device may have caused or contributed to a death or serious injury or malfunctioned in a way that would likely cause or contribute to a death or serious injury if the malfunction were to recur; and |
| • | post-market surveillance regulations, which apply when necessary to protect the public health or to provide additional safety and effectiveness data for the device. |
The FDA has broad post-market and regulatory enforcement powers. We and our repair subcontractor are subject to unannounced inspections by the FDA and the Food and Drug Branch of the California Department of Health Services, or CDHS, to determine compliance with the QSR and other regulations. In the past, our facility has been inspected, and observations were noted. The FDA and CDHS have accepted our responses to these observations, and we believe that we are in substantial compliance with the QSRs. The most recent FDA establishment inspection of the Solta Medical facility occurred during the first quarter of 2010.
Failure to comply with applicable regulatory requirements can result in enforcement action by the FDA, which may include any of the following sanctions:
| • | warning letters, fines, injunctions, consent decrees and civil penalties; |
| • | repair, replacement, refunds, recall or seizure of our products; |
| • | operating restrictions, partial suspension or total shutdown of production; |
| • | refusing our requests for 510(k) clearance or premarket approval of new products or new intended uses; |
26
Table of Contents
| • | withdrawing 510(k) clearance or premarket approvals that are already granted; and |
| • | criminal prosecution. |
If any of these events were to occur, they could have a material adverse effect on our business.
We are also subject to a wide range of federal, state and local laws and regulations, including those related to the environment, health and safety, land use and quality assurance. We believe that compliance with these laws and regulations as currently in effect will not have a material adverse effect on our capital expenditures, earnings and competitive and financial position.
International
Sales of our products outside the United States are subject to foreign regulatory requirements that vary widely from country to country. In addition, exports of medical devices from the United States are regulated by the FDA, Complying with international regulatory requirements can be an expensive and time-consuming process and approval is not certain. The time required to obtain registrations or approvals, if required by other countries, may be longer than that required for FDA clearance, and requirements for such registrations or approvals may significantly differ from FDA requirements. We may be unable to obtain or maintain registrations or approvals in other countries. We may also incur significant costs in attempting to obtain and in maintaining foreign regulatory approvals. If we experience delays in receiving necessary registrations or approvals to market our products outside the United States, or if we fail to receive those registrations or approvals, we may be unable to market our products or enhancements in international markets effectively, or at all, which could have a material adverse effect on our business and growth strategy.
Employees
As of December 31, 2010, we had 287 employees and full-time equivalent consultants, with 133 in sales and marketing, 16 in technical services, 44 in manufacturing operations, 48 in research and development including clinical, regulatory and certain quality functions, and 46 in general and administrative. We believe that our future success will depend in part on our continued ability to attract, hire and retain qualified personnel. None of our employees is represented by a labor union, and we believe our employee relations are good.
Available Information
You may find on our website at http://www.solta.com electronic copies of our annual report on Form 10-K, quarterly reports on Form 10-Q, current reports on Form 8-K, and amendments to those reports filed or furnished pursuant to Section 13(a) or 15(d) of the Securities Exchange Act of 1934. Such filings are placed on our website as soon as reasonably possible after they are filed with the SEC. Our most recent charter for our Audit and Compensation Committees and our Code of Ethics are available on our website as well. In the event that we grant a waiver under our Code of Ethics to any of our officers or directors we will publish it on our website.
You can read our SEC filings over the Internet at the SEC’s web site at www.sec.gov. You may also read and copy any document we file with the SEC at its public reference facilities at 100 F Street, N.E., Room 1580, Washington, D.C. 20549. You may also obtain copies of the documents at prescribed rates by writing to the Public Reference Section of the SEC at 100 F Street, N.E., Room 1580, Washington, D.C. 20549. Please call the SEC at (202) 551-8090 or (800) 732-0330 for further information on the operation of the public reference facilities.
27
Table of Contents
| Item 1A. | Risk Factors |
Risks Related to Our Business
We are in a difficult economic period, and the uncertainty in the economy has reduced and may continue to reduce patient demand for our products; if there is not sufficient patient demand for our product’s procedures, practitioner demand for these systems could drop, resulting in unfavorable operating results.
Recent distress in the financial markets has had an adverse impact on our business. The aesthetic industry in which we operate is particularly vulnerable to economic trends. The decision to undergo a procedure from one our systems is driven by consumer demand. Most procedures performed using our systems are elective procedures, the cost of which must be borne by the patient, and are not reimbursable through government or private health insurance. In times of economic uncertainty or recession, individuals often reduce the amount of money that they spend on discretionary items, including aesthetic procedures. The general economic difficulties being experienced by our customers and the lack of availability of consumer credit for some of our customers are adversely affecting the market in which we operate.
If the current situation continues or deteriorates further, our business would be negatively impacted and our financial performance would be materially harmed in the event that any of the above factors discourage patients from seeking our product’s procedures.
We are totally dependent upon the success of our systems, which have a limited commercial history. If our products fail to achieve sufficient market acceptance, our business will suffer.
We expect that sales of our systems, including our treatment tips, will account for substantially all of our revenue for the foreseeable future. We expect to continue to expand our line of systems and treatment tips. This may not occur when expected, or at all, which would negatively affect our anticipated revenue. Our systems may not significantly penetrate current or new markets. If demand for our systems does not increase as we anticipate, or declines, our business, financial condition and results of operations will be harmed.
Our financial results may fluctuate unpredictably, making it difficult to forecast future performance.
Our limited operating history makes it difficult for us to predict future performance. Historically, the demand for our systems has varied from quarter to quarter. A number of factors, over which we have limited or no control, may contribute to fluctuations in our financial results, such as:
| • | delays in receipt of anticipated purchase orders; |
| • | seasonal variations in patient demand for aesthetic procedures; |
| • | the impact of general economic conditions on the demand for aesthetic procedures; |
| • | performance of our independent distributors; |
| • | the lack of credit available to physicians to finance capital equipment purchases; |
| • | positive or negative media coverage of our products or products of our competitors or our industry; |
| • | our ability to obtain further regulatory clearances or approvals; |
| • | delays in, or failure of, product and component deliveries by our subcontractors and suppliers; |
28
Table of Contents
| • | changes in the length of the sales process; |
| • | the costs of litigation claims or adverse outcomes from legal proceedings; |
| • | customer response to the introduction of new product offerings; |
| • | fluctuations in foreign currency; and |
| • | excess or obsolete inventory charges. |
Our success depends on growing physician adoption of our systems and continued use of our treatment tips.
Our target physician customers typically already own one or more aesthetic device products. Our ability to grow our business and convince physicians to purchase our systems and products depends on the success of our clinical and sales and marketing efforts. Our business model involves both a capital equipment purchase of our systems and continued purchases by our customers of our treatment tips. This may be a novel business model for many potential customers who may be used to competing products that are either exclusively capital equipment, such as many laser-based systems, or that are exclusively single-use products, such as Botox or dermal fillers. In addition, the lack of credit available to physicians to finance the purchase of systems may also impact the adoption of these systems. We must be able to demonstrate that the cost of our systems and the revenue that the physician can derive from performing procedures using our product are compelling when compared to the cost and revenue associated with alternative products. When marketing to plastic surgeons, we must also, in some cases, overcome a bias against non-invasive or minimally invasive aesthetic procedures. If we are unable to increase physician adoption of our systems and use of our treatment tips, our financial performance will be adversely affected.
We may not be able to achieve or sustain profitability even if we are able to generate significant revenue.
We incurred a loss of $2.0 million and $11.2 million for the years ended December 31, 2010 and 2009, respectively. In the past, we have expanded our business and increased our expenses in order to grow revenue. We will have to increase our revenue while effectively managing our expenses in order to achieve sustained profitability. Our failure to achieve or sustain profitability could negatively impact the market price of our common stock.
We are subject to fluctuations in the exchange rate of the U.S. dollar and foreign currencies.
As a result of recent fluctuations in currency markets, our products priced in U.S. dollars may be more expensive relative to products of our foreign competitors, which could result in lower revenue and profit margins. We do not actively hedge our exposure to currency rate fluctuations. While we transact business primarily in U.S. dollars, and a significant proportion of our revenue is denominated in U.S. dollars, a growing proportion of our revenue and costs is denominated in other currencies, such as the Australian Dollar, Euro, Japanese Yen, and British Pound Sterling. In addition, the functional currency of the Company’s foreign subsidiaries is the U.S. dollar. As a result, our financial performance could be adversely affected by changes in the exchange rates of these currencies to the U.S. Dollar
We may not be successful in selling and marketing our new products.
The commercial success of the products and technologies we develop will depend upon the acceptance of these products by physicians and their patients. It is difficult for us to predict how successful recently introduced products and procedures, including the Thermage CPT system and Fraxel re:store Dual system, or
29
Table of Contents
products we are currently developing, will be over the long term. If the products we develop do not gain market acceptance, our revenues and operating results will suffer. In addition, we expect to face significant competition, in some cases from companies that are more established, market more widely known products and have greater resources than we do. We may not be able to differentiate our new products sufficiently from our competitors’ products to achieve significant market penetration. As a result of these factors, we may incur significant sales and marketing expenses for our new products without achieving commercial success, which could harm our business and our competitive position.
In addition, as new or enhanced products are introduced, we must successfully manage the transition from older products in order to minimize disruption in customers’ ordering patterns, avoid excessive levels of older product inventories, and ensure that enough supplies of new products can be delivered to meet customer demand.
The failure of our systems to meet patient expectations or the occurrence of unpleasant side effects from our product’s procedures could impair our financial performance.
Our future success depends upon patients having a positive experience with our product’s procedures in order to increase physician demand for our products, as a result of both individual patients’ repeat business and as a result of word-of-mouth referrals. We believe that patients may be dissatisfied with our product’s procedures if they find them to be too painful. Furthermore, patients may experience temporary swelling or reddening of the skin as a procedural side effect. In rare instances, patients may receive burns, blisters, skin discoloration or skin depressions. Experiencing excessive pain or any of these side effects or adverse events could discourage a patient from having one of our product’s procedures or discourage a patient from having additional procedures or referring our product’s procedures to others. In order to generate repeat and referral business, we also believe that patients must be satisfied with the effectiveness of the procedures. Results obtained from our product’s procedure are subjective and may be subtle. A product treatment may produce results that may not meet patients’ expectations. If patients are not satisfied with the procedure or feel that it is too expensive for the results obtained, our reputation and future sales will suffer.
The conditions of our secured term loan contain certain financial covenants with respect to our performance and other covenants that restrict our activities. If we are unable to comply with these covenants, we would have to negotiate an amendment to the loan agreement or the lender could accelerate the repayment of our indebtedness.
Our secured term loan contains certain financial covenants which require us to maintain a certain liquidity ratios and specified levels of EBITDA (as defined in the loan agreement) each fiscal quarter. We are also subject to restrictive covenants, including among others covenants that restrict our ability to incur additional indebtedness, to dispose of assets, to effect certain corporate transactions, including specified mergers or acquisitions, and to pay dividends. The loan agreement generally provides for customary events of default, including among others non-payment defaults, covenant defaults, and a default in the event a material adverse change occurs. There is no assurance that we will be able to comply with our financial covenants. Upon the occurrence of an event of default under the term loan, the lender will be entitled to acceleration of all obligations under the loan agreement and an obligation to repay all obligations in full and such event of default could result in an increase to the applicable interest rate of 5.00%. Any acceleration in the repayment of our indebtedness could adversely affect our business and financial condition.
We may face problems with our acquisition of Aesthera Corporation and CLRS Technology Corporation.
On February 26, 2010, we completed our acquisition of Aesthera Corporation, or Aesthera, a developer, manufacturer and marketer of light-based aesthetic treatment systems and on October 15, 2010 we completed our acquisition of CLRS Technology Corporation, or CLRS, a developer, manufacturer and marketer of a personal care light-based aesthetic system.
30
Table of Contents
We cannot be certain that these acquisitions will be successful or that we will realize the anticipated benefits of the acquisition. In particular, we may not be able to realize the strategic and operational benefits and objectives we had anticipated, including, greater revenue and market opportunities, maintaining industry leadership and consistent profitability. In addition, the demand for our combined product offerings may fluctuate and we may face increased competition into the markets for our products. Any of these factors and the following factors, as well as the inability to realize the long-term anticipated efficiencies and synergies of the acquisition of Aesthera and CLRS, may have a material adverse effect on our business, operating results and financial condition. These factors may include:
| • | the potential disruption of the combined company’s ongoing business and diversion of management resources; |
| • | the possibility that the business cultures are not compatible; |
| • | the difficulty of incorporating acquired products, technology and rights into the combined company’s products and services; |
| • | unanticipated expenses related to integration of operations; |
| • | the possibility that we are unsuccessful in marketing directly to consumers, which is the market targeted by CLRS; |
| • | the impairment of relationships with employees and customers as a result of any integration of new personnel; |
| • | potential unknown liabilities associated with the acquired business and technology; |
| • | potential periodic impairment of goodwill and intangible assets acquired; and |
| • | potential inability to retain, integrate and motivate key personnel. |
Any acquisitions that we make could disrupt our business and harm our financial condition.
Our growth strategy includes evaluation of potential strategic acquisitions of complementary businesses, products or technologies. We may also consider joint ventures and other collaborative projects. We have incurred integration costs related to the acquisition of Reliant. We may incur similar expenses in future periods as we complete our integration plan in connection with our acquisition of Aesthera Corporation and CLRS Technology Corporation, as well as expenses associated with evaluation of other potential strategic transactions. Such expenditures could negatively impact our financial performance in future periods.
We may not be able to successfully integrate the combined business, products or technologies. In addition, the integration of such acquisition and management of any collaborative project may divert management’s time and resources from our core business and disrupt our operations. If we decide to expand our product offerings, we may spend time and money on projects that do not increase our revenue. Any cash acquisition we pursue would diminish funds available to us for other uses, and any stock acquisition would dilute our stockholders’ ownership. While we from time to time evaluate potential collaborative projects and acquisitions of businesses, products and technologies, and anticipate continuing to make these evaluations, we have no present understandings, commitments or agreements with respect to any other acquisitions or collaborative projects.
31
Table of Contents
We may fail to effectively build and manage our sales force or to market and distribute our products.
We rely on a direct sales force to sell our products in the United States and in certain international regions. As the Company grows, we expect to grow or realign our sales organization to meet our anticipated sales objectives. There are significant risks involved in building and managing our sales organization, including risks related to our ability to:
| • | hire qualified individuals as needed; |
| • | provide adequate training for the effective sale of our products; and |
| • | retain and motivate our sales employees. |
In addition, sales to non-traditional practitioners of aesthetic procedures are a key element of our growth strategy. However, our sales force historically has sold primarily to dermatologists and plastic surgeons. Also, our systems compete with products that are well-established in the market. Accordingly, it is difficult for us to predict how well our sales force will perform. Our failure to adequately address these risks could have a material adverse effect on our ability to sell our products, causing our revenue to be lower than expected and harming our results of operations.
We may be required to raise additional capital and/or debt financing on unfavorable terms.
Our future liquidity requirements may increase beyond currently expected levels if we fail to achieve sustained profitability or if unanticipated expenses or other uses of cash arise. In order to meet our liquidity needs, we may be required to seek additional equity and/or debt financing. Additional financing may not be available on a timely basis on terms acceptable to us, or at all, particularly in the short-term due to the current credit and equity market funding environments. The availability of financing will depend, in part, on market conditions, and the outlook for our company. Any future equity financing would result in substantial dilution to our stockholders. If we raise additional funds by issuing debt, we may be subject to limitations on our operations, through debt covenants or other restrictions. If adequate funds are not available, we may have to delay development of new products or reduce marketing, customer support or other resources devoted to our products. In addition, if we are unable to obtain financing as needed, we may come into breach of our outstanding loan covenants. Any of these factors could harm our business and financial condition.
We may be involved in intellectual property litigation, which could be costly and time consuming, and may impact our future business and financial performance.
Litigation related to infringement and other intellectual property claims, with or without merit, is unpredictable, can be expensive and time-consuming and could divert management’s attention from our core business. If we lose this kind of litigation, a court could require us to pay substantial damages, and prohibit us from using technologies essential to our products, any of which would have a material adverse effect on our business, results of operations and financial condition. We do not know whether necessary licenses would be available to us on satisfactory terms, or whether we could redesign our products or processes to avoid infringement.
Our industry has been characterized by frequent intellectual property litigation. Our competitors or other patent holders may assert that our products and the methods we employ are covered by their patents. If our products or methods are found to infringe, we could be prevented from marketing them. In addition, we do not know whether our competitors or potential competitors have applied for, or will apply for or obtain, patents that will prevent, limit or interfere with our ability to make, use, sell, import or export our products. Competing products may also appear in other countries in which our patent coverage might not exist or be as strong. If we lose a foreign patent lawsuit, we could be prevented from marketing our products in one or more countries.
32
Table of Contents
In addition, we may hereafter become involved in litigation to protect our trademark rights associated with our company name or the names used with our products. Names used with our products and procedures may be claimed to infringe names held by others or to be ineligible for proprietary protection. If we have to change the name of our company or products, we may experience a loss in goodwill associated with our brand name, customer confusion and a loss of sales.
We are involved in litigation relating to our acquisition of Reliant Technologies, Inc., which could be costly and time consuming.
On December 21, 2009, a complaint was filed in the Santa Clara County Superior Court by three former stockholders of Reliant Technologies, Inc. against Reliant and certain former officers and directors of Reliant in connection with our acquisition of Reliant, which closed on December 23, 2008. The complaint purports to be brought on behalf of the former common stockholders of Reliant. As a result of the acquisition, a successor entity to Reliant, Reliant Technologies, LLC, became our wholly-owned subsidiary. Eric Stang and Leonard DeBenedictis are among the defendants named in the complaint. Mr. Stang is a member of our board of directors, and Mr. DeBenedictis is a former member of our board of directors and our former Chief Technology Officer. The principal claim, among others, is that Reliant violated the California Corporations Code by failing to obtain the vote from a majority of holders of Reliant’s common stock prior to the consummation of the acquisition. The complaint also purports to challenge disclosures made by Reliant in connection with its entry into the acquisition and that the defendants failed to maximize the value of Reliant for the benefits of Reliant’s common stockholders. We believe that this suit is without merit, and we intend to vigorously defend it. Although we do not expect that the final disposition of this litigation will have a material adverse effect on our financial results, we may have to devote certain personnel and resources to resolve this litigation.
Intellectual property rights may not provide adequate protection for our products, which may permit third parties to compete against us more effectively.
We rely on a combination of patent, copyright, trademark and trade secret laws and confidentiality and invention assignment agreements to protect our intellectual property rights. As of December 31, 2010, we had 89 issued U.S. patents, 70 pending U.S. patent applications, 52 issued foreign patents and 56 pending foreign patent applications, some of which foreign applications preserve an opportunity to pursue patent rights in multiple countries. Some of our system components are not, and in the future may not be, protected by patents. Additionally, our patent applications may not issue as patents or, if issued, may not issue in a form that will be advantageous to us. Any patents we obtain may be challenged, invalidated or legally circumvented by third parties. Consequently, competitors could market products and use manufacturing processes that are substantially similar to, or superior to, ours. We may not be able to prevent the unauthorized disclosure or use of our technical knowledge or other trade secrets by consultants, vendors, former employees or current employees, despite the existence generally of confidentiality agreements and other contractual restrictions. Monitoring unauthorized uses and disclosures of our intellectual property is difficult, and we do not know whether the steps we have taken to protect our intellectual property will be effective. Moreover, we do not have patent rights in all foreign countries in which a market may exist, and where we have applied for foreign patent rights, the laws of many foreign countries will not protect our intellectual property rights to the same extent as the laws of the United States.
In addition, competitors could purchase our systems and attempt to replicate some or all of the competitive advantages we derive from our development efforts, willfully infringe our intellectual property rights, design around our protected technology or develop their own competitive technologies that fall outside of our intellectual property rights. If our intellectual property is not adequately protected so as to protect our market against competitors’ products and methods, our competitive position could be adversely affected, as could our business.
33
Table of Contents
Performing clinical studies on, and collecting data from our product’s procedures is inherently subjective, and we have limited data regarding the efficacy of our systems. If future data is not positive or consistent with our prior experience, rates of physician adoption will likely be harmed.
We believe that in order to significantly grow our business, we will need to conduct future clinical studies of the effectiveness of our systems. Clinical studies of aesthetic treatments are subject to a number of limitations. First, these studies do not involve well-established objective standards for measuring the effectiveness of treatment. Subjective, before and after, evaluation of the extent of change in the patient’s appearance, performed by a medical professional or by the patient, is the most common method of evaluating effectiveness. A clinical study may conclude that a treatment is effective even if the change in appearance is subtle and not long-lasting. Second, as with other non-invasive or minimally invasive energy-based devices, the effect of our product’s procedures vary from patient to patient and can be influenced by a number of factors, including the area of the body being treated, the age and skin laxity of the patient and operator technique.
We have not conducted any head-to-head clinical studies that compare results from treatment with our systems to surgery or treatment with other aesthetic devices. Without head-to-head studies against competing alternative treatments, which we have no current plans to conduct, potential customers may not find clinical studies of our technology sufficiently compelling to purchase our systems. If we decide to pursue additional studies in the future, they could be expensive and time consuming, and the data collected may not produce favorable or compelling results. If the results of such studies do not meet physicians’ expectations, our systems may not become widely adopted, physicians may recommend alternative treatments for their patients, and our business may be harmed.
To successfully market and sell our systems internationally, we must address many issues with which we have limited experience.
Sales outside of North America accounted for 55%, 53% and 48% of our revenue for the years ended December 31, 2010, 2009 and 2008. We believe that a significant portion of our business will continue to come from international sales through increased penetration in countries where we currently sell our products, combined with expansion into new international markets. However, international sales are subject to a number of risks, including:
| • | difficulties in staffing and managing our international operations; |
| • | difficulties in penetrating markets in which our competitors’ products are more established; |
| • | reduced or no protection for intellectual property rights in some countries; |
| • | export restrictions, trade regulations and foreign tax laws; |
| • | regulation of the sale of the hydroflurocarbon used with our ThermaCool system; |
| • | fluctuating foreign currency exchange rates; |
| • | foreign certification and regulatory clearance or approval requirements; |
| • | difficulties in developing effective marketing campaigns for unfamiliar, foreign countries; |
| • | dependence on third-party distributors in some territories; |
| • | customs clearance and shipping delays; |
34
Table of Contents
| • | political and economic instability; |
| • | preference for locally produced products; |
| • | business interruption resulting from transitioning to direct sales from international distributors in certain international regions; and |
| • | difficulties in getting distributors to relinquish regulatory documentation. |
If one or more of these risks were realized, it could require us to dedicate significant resources to remedy the situation, and if we are unable to find a solution, our revenue may decline.
To market and sell our products internationally, we depend on distributors, and they may not be successful.
We currently depend primarily on third-party distributors to sell and service our products internationally and to train our international customers, and if these distributors terminate their relationships with us or under-perform we may be unable to maintain or increase our level of international revenue. We will also need to engage additional international distributors to grow our business and expand the territories in which we sell our systems. Distributors may not commit the necessary resources to market, sell and service our products to the level of our expectations. If current or future distributors do not perform adequately, or if we are unable to engage distributors in particular geographic areas, our revenue from international operations will be adversely affected. In addition, from time to time, legal disputes arise when we wish to discontinue a distributor relationship in a given territory or otherwise feel a distributor is not performing adequately. Such disputes have led to legal proceedings that are costly to litigate and that could result in outcomes that are not favorable to us.
New legislation regarding healthcare reform may affect our revenue and financial condition.
The U.S. government has recently enacted healthcare reform and is currently considering and may in the future consider healthcare policies and proposals intended to curb rising costs, including those that could significantly affect both private and public reimbursement for healthcare services. State and local governments, as well as a number of foreign governments, are also considering or have adopted similar types of policies. Such policies and proposals include changes that would change the dynamics of the health care industry, including having the federal or one or more state governments assume a larger role in the health care system such as competing with private health insurers, imposing new taxes on health insurers, or restructuring of the Medicare or Medicaid programs. We are unable to predict the ongoing uncertainty about these matters and the effect they will have on the purchasing decisions of our customers.
We compete against companies that have more established products, longer operating histories and greater resources, which may prevent us from achieving significant market penetration or increased operating results.
The aesthetics market is highly competitive and dynamic, and is marked by rapid and substantial technological development and product innovations. Demand for our products could be diminished by equivalent or superior products and technologies offered by competitors. Specifically, our products compete against a variety of offerings in the aesthetics market, including laser and other light-based medical devices, pharmaceutical products such as Botox, filler injections, chemical peels, microdermabrasion, liposuction, cosmetic surgical procedures and less invasive surgical solutions such as implanted sutures. Our closest competitors are makers of laser and other light-based devices, which include companies such as Alma Lasers, Cutera, Cynosure, Lumenis, Lutronic, Palomar Medical Technologies, Sciton and Syneron Medical.
35
Table of Contents
Competition in the aesthetics market could result in price-cutting, reduced profit margins and loss of market share, any of which would harm our business, financial condition and results of operations. Our ability to compete effectively depends upon our ability to distinguish our company and our products from our competitors and their products, and on such factors as:
| • | safety and effectiveness; |
| • | product pricing; |
| • | success of our marketing initiatives; |
| • | compelling clinical data; |
| • | intellectual property protection; |
| • | quality of customer support; and |
| • | development of successful distribution channels, both domestically and internationally. |
Some of our competitors have more established products and customer relationships than we do, which could inhibit our market penetration efforts. For example, we have encountered, and expect to continue to encounter, situations where, due to pre-existing relationships, potential customers decided to purchase additional products from our competitors. Potential customers also may need to recoup the cost of expensive products that they have already purchased from our competitors and thus may decide not to purchase our products, or to delay such purchase. If we are unable to achieve continued market penetration, we will be unable to compete effectively and our business will be harmed.
In addition, some of our current and potential competitors have significantly greater financial, research and development, manufacturing, and sales and marketing resources than we have. Our competitors could utilize their greater financial resources to acquire other companies to gain enhanced name recognition and market share, as well as new technologies or products that could effectively compete with our existing product line. Given the relatively few competitors currently in the market, any business combination could exacerbate any existing competitive pressures, which could harm our business.
Competition among providers of devices for the aesthetics market is characterized by rapid innovation, and we must continuously develop new products or our revenue may decline.
While we attempt to protect our products through patents and other intellectual property rights, there are few barriers to entry that would prevent new entrants or existing competitors from developing products that compete directly with ours. As we continue to create market demand for non-surgical, non-invasive or minimally invasive treatments, competitors will enter the market with other products making similar or superior claims. We expect that any competitive advantage we may enjoy from our current and future innovations may diminish over time, as companies successfully respond to our, or create their own, innovations. Consequently, we believe that we will have to continuously innovate and improve our products and technology to compete successfully. If we are unable to innovate successfully, our systems could become obsolete and our revenue will decline as our customers purchase competing products.
Our products may have undetected and unforeseen design flaws, and may experience failures particularly when first introduced, or at any time during their lifecycle. Any product recall as a result of flaws or failures could result in the loss of or delays in market acceptance of our products and adversely affect our business and reputation. Correcting defects can be time consuming. Any significant returns or warranty claims could result in significant additional costs to us and could adversely affect our results of operations.
36
Table of Contents
Negative publicity regarding our Thermage, Fraxel, Isolaz or future procedures could harm demand, which would adversely affect sales and our financial performance.
We have in the past experienced, and expect that in the future we will experience, negative media exposure. Such publicity may present negative individual physician or patient experience regarding the safety or effectiveness of our procedures. Competitors could attempt to use such publicity to harm our reputation and disrupt current or potential future customer relationships. While, to date, we have not observed a material impact on our quarterly financial results of operations from negative publicity, future results could be negatively impacted. Additionally, while we believe that obtaining positive publicity is important to our success, and it is an important component of our marketing efforts, we have also not observed a material impact on our quarterly financial results of operations from positive publicity.
Our reputation and competitive position may be harmed not only by negative media exposure, but also by other publicly-available information suggesting that our procedures are not safe. For example, we file reports with the FDA that are publicly available on the FDA’s website if our product may have caused or contributed to a serious injury or malfunctioned in a way that would likely cause or contribute to a serious injury if it were to recur. Competitors may attempt to harm our reputation by pointing to isolated injuries that have been reported or publicized, or by claiming that their product is superior because they have not filed as many reports with the FDA. Such negative publicity and competitor behavior could harm our reputation and our future sales.
Our manufacturing operations and those of our key manufacturing subcontractors are dependent upon third-party suppliers, making us vulnerable to supply shortages and price fluctuations, which could harm our business.
Several components and materials that comprise our products are currently manufactured by a single supplier or a limited number of suppliers. In many of these cases, we have not yet qualified alternate suppliers and rely upon purchase orders, rather than long-term supply agreements. A supply interruption or an increase in demand beyond our current suppliers’ capabilities could harm our ability to manufacture our products until new sources of supply are identified and qualified. Our reliance on these suppliers subjects us to a number of risks that could harm our business, including:
| • | interruption of supply resulting from modifications to or discontinuation of a supplier’s operations; |
| • | delays in product shipments resulting from uncorrected defects, reliability issues or a supplier’s variation in a component; |
| • | a lack of long-term supply arrangements for key components with our suppliers; |
| • | inability to obtain adequate supply in a timely manner, or to obtain adequate supply on commercially reasonable terms; |
| • | difficulty locating and qualifying alternative suppliers for our components in a timely manner; |
| • | production delays related to the evaluation and testing of products from alternative suppliers, and corresponding regulatory qualifications; |
| • | delay in delivery due to our suppliers prioritizing other customer orders over ours; |
| • | damage to our brand reputation caused by defective components produced by our suppliers; |
| • | increased cost of our warranty program due to product repair or replacement based upon defects in components produced by our suppliers; and |
| • | fluctuation in delivery by our suppliers due to changes in demand from us or their other customers. |
37
Table of Contents
Any interruption in the supply of components or materials, or our inability to obtain substitute components or materials from alternate sources at acceptable prices in a timely manner, could impair our ability to meet the demand of our customers, which would have an adverse effect on our business.
If, in the future, we decide to perform additional manufacturing functions internally that we currently outsource, our business could be harmed by our limited manufacturing experience and related capabilities.
We currently perform certain value-added and proprietary manufacturing processes internally at our principal facility, and we outsource the manufacture of components, subassemblies and certain finished products to a limited number of third parties. For financial or operational purposes, we may elect to perform additional component or system manufacturing functions internally. In that event, we may face a number of challenges beyond those that we currently address in our internal assembly, inspection, testing and certification activities. Implementing complex or specialized manufacturing processes could lead to difficulties in producing sufficient quantities of manufactured items that meet our quality standards and that comply with applicable regulatory requirements in a timely and cost-effective manner. In addition, if we experience these types of internal manufacturing difficulties, it may be expensive and time consuming to engage a new or previous subcontractor or supplier to fulfill our replacement manufacturing needs. The occurrence of any of these events could harm our business.
Problems in our manufacturing processes, or those of our manufacturing subcontractors, that lead to an actual or possible malfunction in our products, may require us to recall products from customers and could disrupt our operations. Our results of operations, our reputation and market acceptance of our products could be harmed if we encounter difficulties in manufacturing that result in a recall or patient injury, and delays in our ability to fill customer orders.
We outsource the repair of key elements of some products to sole-source service subcontractors.
We outsource the repair of certain key elements of our systems to sole source contract service providers. If the operations of those service subcontractors are interrupted, we may be limited in our ability to repair equipment. Our service subcontractors are dependent on trained technical labor to effectively repair our products. In addition, our service subcontractors may be operating as medical device manufacturers and as such are required to demonstrate and maintain compliance with the FDA’s Quality System Regulation, or QSR. If our service subcontractors fail to comply with the FDA’s QSR, repair operations could be affected and our ability to repair certain systems may be impaired.
We may not be able to develop an alternative cooling system that will be in compliance with changing environmental regulations in a timely or cost-effective manner.
The cooling capability of our Thermage and Isolaz systems relies upon a hydroflurocarbon, or HFC, called R134a, to protect the outer layer of the skin from over-heating while our device delivers RF energy to the subcutaneous tissue. New environmental regulations phasing out certain HFCs over the next decade have been adopted or are under consideration in a number of countries, and recent European Union directives require the phase-out of certain HFCs. We have also put in place a solution for the European Union import restrictions. If we are unable to develop an alternative cooling system for our device which is not dependent on R134a in a timely or cost-effective manner, our Thermage and Isolaz systems may not be in compliance with environmental regulations, which could result in fines, civil penalties and the inability to sell our products in certain major international markets.
38
Table of Contents
We forecast sales to determine requirements for components and materials used in our systems, and if our forecasts are incorrect, we may experience delays in shipments or increased inventory costs.
We keep limited materials, components and finished product on hand. To manage our manufacturing operations with our suppliers, we forecast anticipated product orders and material requirements to predict our inventory needs up to six months in advance and enter into purchase orders on the basis of these requirements. Our limited historical experience may not provide us with enough data to accurately predict future demand. If our business expands, our demand for components and materials would increase and our suppliers may be unable to meet our demand. If we overestimate our component and material requirements, we will have excess inventory, which would increase our expenses. If we underestimate our component and material requirements, we may have inadequate inventory, which could interrupt, delay or prevent delivery of systems to our customers. Any of these occurrences would negatively affect our financial performance and the level of satisfaction our customers have with our business.
Even though we require training for users of our systems and do not sell our systems to non-physicians, there exists a potential for misuse, which could harm our reputation and our business.
While we only sell our products to licensed physicians who have met our training requirements, federal regulations allow us to sell our systems to “licensed practitioners.” The definition of “licensed practitioners” varies from state to state. As a result, our systems may be operated by licensed practitioners with varying levels of training, and in many states by non-physicians, including physician assistants, registered nurses and nurse practitioners. Thus, in some states, the definition of “licensed practitioner” may result in the legal use of our products by non-physicians. Outside the United States, our independent distributors sell in many jurisdictions that do not require specific qualifications or training for purchasers or operators of products. We do not supervise the procedures performed with our systems, nor can we be assured that direct physician supervision of our equipment occurs according to our recommendations. We, and our distributors, require purchasers of our products to undergo an initial training session as a condition of purchase, but do not require ongoing training. In addition, we prohibit the sale of our systems to companies that rent our systems to third parties without our approval, but cannot prevent an otherwise qualified physician from contracting with a rental company in violation of their purchase agreement with us. The use of our systems by non-physicians, as well as noncompliance with the operating guidelines set forth in our training programs, may result in product misuse and adverse treatment outcomes, which could harm our reputation and expose us to costly product liability litigation.
Product liability suits could be brought against us due to defective design, labeling, material or workmanship, or misuse of our products, and could result in expensive and time-consuming litigation, payment of substantial damages and an increase in our insurance rates.
If our products are defectively designed, manufactured or labeled, contain defective components or are misused, we may become subject to substantial and costly litigation by our customers or their patients. For example, as described under "Legal Proceedings," one such litigation matter is currently pending. Misusing our products or failing to adhere to operating guidelines could cause significant skin damage and underlying tissue damage. In addition, if our operating guidelines or product design are found to be inadequate, we may be subject to liability. We have been, continue to be and may, in the future, be involved in litigation related to the use of our products. Product liability claims could divert management’s attention from our core business, be expensive to defend and result in sizable damage awards against us. We may not have sufficient insurance coverage for all future claims. We may not be able to obtain insurance in amounts or scope sufficient to provide us with adequate coverage against all potential liabilities. Any product liability claim brought against us, with or without merit, could increase our product liability insurance rates or prevent us from securing continuing coverage, could harm our reputation in the industry and reduce product sales. Product liability claims in excess of our insurance coverage would be paid out of cash reserves, harming our financial condition and reducing our operating results.
39
Table of Contents
After-market modifications to our treatment tips by third parties and the development of counterfeit treatment tips could reduce our sales, expose us to product liability litigation and dilute our brand quality.
Third parties have introduced adulterated after-market modifications to our treatment tips which have enabled re-use of our treatment tips in multiple procedures. Because our treatment tips are designed to withstand a finite number of firings, modifications intended to increase the number of firings could result in patient injuries caused by the use of worn-out or damaged treatment tips. In addition, third parties may seek to develop counterfeit treatment tips that are compatible with our systems and available to practitioners at lower prices than our own. If security features incorporated into the design of our systems are unable to prevent after-market modifications to our treatment tips or the introduction of counterfeit treatment tips, we could be subject to reduced treatment tip sales, product liability lawsuits resulting from the use of damaged or defective goods and damage to our reputation for providing a quality product.
We depend on skilled and experienced personnel to operate our business effectively. If we are unable to recruit, hire and retain these employees, our ability to manage and expand our business will be harmed, which would impair our future revenue and profitability.
Our success largely depends on the skills, experience and efforts of our officers and other key employees. Many of our officers and key employees do not have employment contracts with us and can terminate their employment at any time. The loss of any of our senior management team members could weaken our management expertise and harm our business.
Our ability to retain our skilled labor force and our success in attracting and hiring new skilled employees will be a critical factor in determining whether we will be successful in the future. We may not be able to meet our future hiring needs or retain existing personnel. We will face particularly significant challenges and risks in hiring, training, managing and retaining engineering and sales and marketing employees, as well as independent distributors, most of whom are geographically dispersed and must be trained in the use and benefits of our products. Failure to attract and retain personnel, particularly technical and sales and marketing personnel, would materially harm our ability to compete effectively and grow our business.
Risks Related to Regulatory Matters
If we fail to obtain and maintain necessary FDA clearances for our systems and indications, if clearances for future products and indications are delayed, not issued or rescinded or if there are federal or state level regulatory changes, our commercial operations would be harmed.
Our systems are medical devices that are subject to extensive regulation in the United States by the FDA for manufacturing, labeling, sale, promotion, distribution and shipping. Before a new medical device, or a new use of or claim for an existing product, can be marketed in the United States, it must first receive either 510(k) clearance or premarket approval from the FDA, unless an exemption applies. Either process can be expensive and lengthy. The FDA’s 510(k) clearance process usually takes from three to 12 months, but it can take significantly longer. The process of obtaining premarket approval is much more costly and uncertain than the 510(k) clearance process, and it generally takes from one to three years, or even longer, from the time the application is filed with the FDA.
Medical devices may be marketed only for the indications for which they are approved or cleared. We have obtained 510(k) clearance for various indications for our Thermage and Fraxel systems. In addition, 510(k) clearance has been obtained for various indications of our recently acquired Isolaz systems. However, our clearances can be revoked if safety or effectiveness problems develop. We are also subject to Medical Device Reporting regulations, which require us to report to the FDA if our product causes or contributes to a death or serious injury, or malfunctions in a way that would likely cause or contribute to a death or serious injury if the
40
Table of Contents
malfunction were to recur. Our products are also subject to state regulations which are, in many instances, in flux. Changes in state regulations may impede sales. For example, federal regulations allow our systems to be sold to, or on the order of, “licensed practitioners,” as determined on a state-by-state basis. As a result, in some states, non-physicians may legally purchase and operate our systems. However, a state could change its regulations at any time, disallowing sales to particular types of end users. We cannot predict the impact or effect of future legislation or regulations at the federal or state levels.
The FDA and state authorities have broad enforcement powers. Our failure to comply with applicable regulatory requirements could result in enforcement action by the FDA or state agencies, which may include any of the following sanctions:
| • | warning letters, fines, injunctions, consent decrees and civil penalties; |
| • | repair, replacement, refunds, recall or seizure of our product; |
| • | operating restrictions or partial suspension or total shutdown of production; |
| • | refusing our requests for 510(k) clearance or premarket approval of new products, new intended uses or modifications to our existing products; |
| • | withdrawing 510(k) clearance or premarket approvals that have already been granted; and |
| • | criminal prosecution. |
If any of these events were to occur, our business could be harmed.
If we modify our FDA-cleared devices, we may need to seek and obtain new clearances, which, if not granted, would prevent us from selling our modified product or require us to redesign our product.
Any modification to an FDA-cleared device that would significantly affect its safety or effectiveness or that would constitute a major change in its intended use would require a new 510(k) clearance or possibly a premarket approval. We may not be able to obtain additional 510(k) clearances or premarket approvals for new products or for modifications to, or additional indications for, our existing products in a timely fashion, or at all. Delays in obtaining future clearances would adversely affect our ability to introduce new or enhanced products in a timely manner, which in turn would harm our revenue and potential future profitability. We have made modifications to our devices in the past and may make additional modifications in the future that we believe do not or will not require additional clearances or approvals. If the FDA disagrees, and requires new clearances or approvals for the modifications, we may be required to recall and to stop marketing the modified devices, which could harm our operating results and require us to redesign our product.
If we or our repair subcontractors fail to comply with the FDA’s Quality System Regulation, our business would suffer.
We and our repair subcontractors are required to demonstrate and maintain compliance with the FDA’s Quality System Regulation, or QSR. The QSR is a complex regulatory scheme that covers the methods and documentation of the design, testing, control, manufacturing, labeling, quality assurance, packaging, storage and shipping of our product. The FDA enforces the QSR through periodic unannounced inspections. We have been, and anticipate in the future being, subject to such inspections. Our failure, or the failure of our repair subcontractors, to take satisfactory corrective action in response to an adverse QSR inspection could result in enforcement actions, including a public warning letter, a shutdown of our manufacturing operations, a recall of our products, civil or criminal penalties or other sanctions, which would cause our sales and business to suffer.
41
Table of Contents
We may be unable to obtain or maintain international regulatory certifications or approvals for our current or future products and indications, which could harm our business.
To support the marketing of our products outside the United States, we must comply with and be certified to the ISO 13485: 2003-2007 Quality System Standard. Failure to adequately maintain our ISO 13485: 2003-2007 certifications may adversely impact or prevent the marketing of our products internationally. In markets where we sell through distributors, we primarily rely upon distributors to obtain all regulatory licenses, registrations and approvals required in countries outside of the United States, and these distributors may be unable to obtain or maintain such licenses, registrations and approvals. Our distributors may also incur significant costs in attempting to obtain and in maintaining regulatory licenses, registrations and approvals, which could increase the difficulty of attracting and retaining qualified distributors. If our distributors experience delays in receiving necessary licenses, registrations or approvals to market our products outside the United States, or if they fail to receive those licenses, registrations or approvals, we may be unable to market our products or enhancements in international markets effectively, or at all.
Risks Related to Our Internal Control over Financial Reporting
While we believe we currently have adequate internal control over financial reporting, we are required to assess our internal control over financial reporting on an annual basis and any future adverse results from such assessment could result in a loss of investor confidence in our financial reports and have an adverse effect on our stock.
Pursuant to the Sarbanes-Oxley Act of 2002 and the rules and regulations promulgated by the SEC, we are required to maintain disclosure controls and procedures and adequate internal control over financial reporting. Under such requirements we must furnish in our Form 10-K a report by our management regarding the effectiveness of our internal control over financial reporting. The report includes, among other things, an assessment of the effectiveness of our internal control over financial reporting as of the end of our fiscal year, including a statement as to whether or not our internal control over financial reporting is effective. This assessment must include disclosure of any material weaknesses in our internal control over financial reporting identified by management. While we currently believe our internal control over financial reporting is effective, the effectiveness of our internal controls in future periods is subject to the risk that our controls may become inadequate because of changes in conditions. The effectiveness of our controls and procedures may in the future be limited by a variety of factors, including:
| • | faulty human judgment and simple errors, omissions or mistakes; |
| • | fraudulent action of an individual or collusion of two or more people; |
| • | inappropriate management override of procedures; and |
| • | the possibility that any enhancements to controls and procedures may still not be adequate to assure timely and accurate financial information. |
If we are unable to assert that our internal control over financial reporting is effective in any future period, or if and when applicable, our auditors are unable to express an opinion on the effectiveness of our internal controls, or conclude that our internal controls are ineffective, or if we fail to maintain adequate and effective internal control over financial reporting, we could lose investor confidence in the accuracy and completeness of our financial reports, which could have an adverse effect on our stock price.
42
Table of Contents
Risks Related to Our Common Stock
If our public guidance or our future operating performance does not meet investor expectations, our stock price could decline.
We provide guidance to the investing community regarding our anticipated future operating performance. Our business typically has a short sales cycle, so that we do not have significant backlog of orders at the start of a quarter, and our ability to sell our products successfully is subject to many uncertainties, as discussed in the foregoing risk factors. In light of these factors, and the uncertainty as a result of the general economic situation, it is difficult for us to estimate with accuracy our future results. Our expectations regarding these results will be subject to numerous risks and uncertainties that could make actual results differ materially from those anticipated. If our actual results do not meet our public guidance or our guidance or actual results do not meet the expectations of third-party financial analysts, our stock price could decline significantly.
We expect that the price of our common stock will fluctuate substantially.
The market price of our common stock is likely to be highly volatile and may fluctuate substantially due to many factors, including:
| • | volume and timing of sales of our products; |
| • | the introduction of new products or product enhancements by us or our competitors; |
| • | disputes or other developments with respect to our intellectual property rights or the intellectual property rights of others; |
| • | our ability to develop, obtain regulatory clearance or approval for and market new and enhanced products on a timely basis; |
| • | product liability claims or other litigation; |
| • | quarterly variations in our or our competitors’ results of operations; |
| • | sales of large blocks of our common stock, including sales by our executive officers and directors; |
| • | developments in our industry; |
| • | media exposure of our products or products of our competitors; |
| • | changes in governmental regulations or in the status of our regulatory approvals or applications; |
| • | changes in earnings estimates or recommendations by securities analysts; and |
| • | general market conditions and other factors, including factors unrelated to our operating performance or the operating performance of our competitors. |
These and other factors may make the price of our stock volatile and subject to unexpected fluctuation.
43
Table of Contents
A sale of a substantial number of shares of our common stock may cause the price of our common stock to decline.
If our stockholders sell substantial amounts of our common stock in the public market, for example, liquidation of shares held by our principal stockholders, including shares issued upon the exercise of outstanding options, the market price of our common stock could decline. These sales also might make it more difficult for us to sell equity or equity-related securities in the future at a time and price that we deem reasonable or appropriate.
Our directors, officers and principal stockholders have significant voting power and may take actions that may not be in the best interests of our other stockholders.
Our officers, directors and principal stockholders, some holding more than 5% of our common stock, collectively control approximately 36% of our outstanding common stock. As a result, these stockholders, if they act together, will be able to significantly influence the management and affairs of our company and most matters requiring stockholder approval, including the election of directors and approval of significant corporate transactions. This concentration of ownership may have the effect of delaying or preventing a change in control and might adversely affect the market price of our common stock. This concentration of ownership may not be in the best interests of our other stockholders.
Anti-takeover provisions in our Amended and Restated Certificate of Incorporation and Bylaws, and Delaware law, contain provisions that could discourage a takeover.
Our certificate of incorporation and bylaws, and Delaware law, contain provisions that might enable our management to resist a takeover, and might make it more difficult for an investor to acquire a substantial block of our common stock. These provisions include:
| • | a classified board of directors; |
| • | advance notice requirements to stockholders for matters to be brought at stockholder meetings; |
| • | a supermajority stockholder vote requirement for amending certain provisions of our Amended and Restated Certificate of Incorporation and Bylaws; |
| • | limitations on stockholder actions by written consent; and |
| • | the right to issue preferred stock without stockholder approval, which could be used to dilute the stock ownership of a potential hostile acquirer. |
These provisions might discourage, delay or prevent a change in control of our company or a change in our management. The existence of these provisions could adversely affect the voting power of holders of common stock and limit the price that investors might be willing to pay in the future for shares of our common stock.
We have a large number of authorized but unissued shares of stock, which could negatively impact a potential investor if they purchased our common stock.
Our certificate of incorporation provides for 100,000,000 shares of authorized common stock, of which more than one-third of the shares are available for future issuance, and 10,000,000 shares of authorized preferred stock, all of which are available for future issuance. The issuance of additional shares of common stock may have a dilutive effect on earnings per share and relative voting power. We could use the shares of common stock that
44
Table of Contents
are available for future issuance in dilutive equity financing transactions, or to oppose a hostile takeover attempt or delay or prevent changes in control or changes in or removal of management, including transactions that are favored by a majority of the stockholders or in which the stockholders might otherwise receive a premium for their shares over then-current market prices or benefit in some other manner.
Our board of directors will be authorized, without further stockholder approval, to issue up to 10,000,000 shares of preferred stock with such rights, preferences and privileges as our board may determine. These rights, preferences and privileges may include dividend rights, conversion rights, voting rights and liquidation rights that may be greater than the rights of our common stock. As a result, the rights of holders of our common stock will be subject to, and could be adversely affected by, the rights of holders of any preferred stock that may be issued in the future.
We have not paid dividends in the past and do not expect to pay dividends in the future, and any return on investment may be limited to the value of our stock.
We have never paid cash dividends on our common stock and do not anticipate paying cash dividends on our common stock in the foreseeable future. The payment of dividends on our common stock will depend on our earnings, financial condition and other business and economic factors affecting us at such time as our board of directors may consider relevant. If we do not pay dividends, our stock may be less valuable because a return on your investment will only occur if our stock price appreciates.
| Item 1B. | Unresolved Staff Comments |
None.
| Item 2. | Properties |
Our corporate headquarters currently occupies a 88,000 square foot facility in Hayward, California, under a lease that expires in March 2013, with an option to extend for an additional three years. Worldwide, we lease facilities that expire at various times ranging from 2011 to 2013. One of our primary international facilities is in Japan under a lease that ends in October 2013, with an option to extend for an additional two years. We believe our facilities are adequate for our current and future needs for at least the next 12 months.
| Item 3. | Legal Proceedings |
We advised Alma as early as February 2006 that its Accent product infringed numerous Thermage patents. On April 26, 2007, Alma filed a lawsuit against us in the United States District Court for the District of Delaware requesting declaratory judgment that Alma’s Accent product does not infringe Thermage’s patents and that Thermage’s patents are invalid. On June 20, 2007, we filed patent infringement counterclaims against Alma in the United States District Court for the District of Delaware asserting that Alma’s Accent and Harmony systems infringe ten of our U.S. patents. The counterclaims were amended on December 10, 2007 to include a claim of infringement of an eleventh patent. In addition to damages and attorney fees, we asked the Court to enjoin Alma from further infringement. During May, June and July 2008, Alma filed with the United States Patent and Trademark Office requests that all of the eleven patents asserted by us be reexamined. The United States Patent and Trademark Office has made rejections of some claims in each of these 11 patents. Some of the patents in reexamination have been reaffirmed, while others remain under rejection. As a result of a settlement reached on May 10, 2010, we and Alma granted each other a covenant not to sue under the patents asserted in the lawsuit and related patents In addition, Alma paid us a non-returnable one-time amount of $2.3 million in connection with this settlement. External legal fees incurred during the year ended December 31, 2010 in connection with the settlement amounted to $37,000. In connection with this settlement, we have recorded a net gain of $2.2 million in operating expenses during the year ended December 31, 2010.
45
Table of Contents
On December 21, 2009, a complaint was filed in the Santa Clara County Superior Court by three former stockholders of Reliant against Reliant and certain former officers and directors of Reliant in connection with our acquisition of Reliant, which closed on December 23, 2008. The complaint purports to be brought on behalf of the former common stockholders of Reliant. As a result of the acquisition, a successor entity to Reliant, Reliant Technologies, LLC, became our wholly-owned subsidiary. One member of the Company’s Board of Directors and the Company’s former Chief Technology Officer and former member of the Company’s Board of Directors are among the defendants named in the complaint. The principal claim, among others, is that Reliant violated the California Corporations Code by failing to obtain the vote from a majority of holders of Reliant’s common stock prior to the consummation of the acquisition. The complaint also purports to challenge disclosures made by Reliant in connection with its entry into the acquisition and alleges that the defendants failed to maximize the value of Reliant for the benefits of Reliant’s common stockholders. On August 2, 2010, defendants filed a motion to dismiss or stay the entire action based on a mandatory forum selection clause in the merger agreement which requires that claims related to the merger be litigated in Delaware. On September 28, 2010, the Court granted the defendants’ motion to dismiss or stay, and stayed the action indefinitely. To date, the plaintiffs have not filed a complaint against the defendants in Delaware. We believe that this suit is without merit, and we intend to vigorously defend it. Although we do not expect that the final disposition of this litigation will have a material adverse effect on our financial results, we expect to devote certain personnel and resources to resolve this litigation.
On December 4, 2009, Aesthera was served with a class action complaint filed in the United States District Court for the District of Connecticut alleging that Aesthera caused unsolicited fax advertisements to be sent to the plaintiffs in violation of the Telephone Consumer Protection Act, or TCPA, and Connecticut state law. The complaint purports to be filed on behalf of a class, and it alleges that Aesthera caused unsolicited fax advertisements to be sent from August 1, 2006 through the present. Plaintiffs seek statutory damages under the TCPA and Connecticut state law, attorneys’ fees and costs of the action, and an injunction to prevent any future violations. In May 2010, we reached an agreement in principle to settle the matter on a class-wide basis by consenting to certification of a settlement class to receive payment out of a settlement fund. On November 5, 2010, the plaintiffs filed an unopposed motion for certification of a settlement class and for preliminary approval of the parties’ settlement. Discovery in this action has been stayed since May 6, 2010, and on December 9, 2010, the Court extended that stay until March 9, 2011 so as to permit itself “an opportunity to review and rule upon plaintiffs’ pending motion.” The Court has not yet taken any action on that unopposed motion. If the process does not result in approval of a settlement, then we anticipate that the parties will engage in discovery and that Aesthera will vigorously oppose certification of a class. We believe that we have meritorious defenses in this action and intend to defend the action vigorously if the proposed settlement is not approved by the Court. We do not believe the final disposition of this action will have a material adverse effect on our financial statements and future cash flows.
In January 2008, a product design complaint was filed against the Company in Federal District Court in Maryland. The individual plaintiff seeks monetary damages, a portion of which we believe are within our insurance limits, as well as attorney’s fees and costs of the action. Discovery in the matter is essentially complete and the trial date has been set for September 2011. We do not believe the final disposition of this action will have a material adverse effect on our operating results, financial condition or future cash flows. We believe that we have meritorious defenses in this action and intend to continue to defend the action vigorously.
In addition, from time to time, we are subject to legal proceedings and claims with respect to such matters as patents, intellectual property rights, product liability claims and contractual disputes with distributors, suppliers and others, arising out of the normal course of business. Litigating claims of these types, whether or not ultimately determined in our favor or settled by us, is costly and diverts the efforts of management and other personnel from normal business operations. The results of legal proceedings cannot be predicted with certainty. Should we fail to prevail in any of these legal matters or should several of these legal matters be resolved against us in the same reporting period, the operating results of a particular reporting period could be materially adversely affected.
| Item 4. | Removed and Reserved |
46
Table of Contents
| Item 5. | Market for Registrant’s Common Equity, Related Stockholder Matters, and Issuer Purchases of Equity Securities |
Stock Exchange Listing
Our common stock trades on the Nasdaq Global Market under the symbol “SLTM”. On February 28, 2011, the closing sale price of our common stock was $3.13 per share.
Common Stockholders
As of February 28, 2011, there were approximately 146 stockholders of record of our common stock, one of whom was CEDE & Co, a large clearing house that holds shares in its name for banks, brokers and institutions, in order to expedite the sale and transfer of stock. Since many stockholders’ shares are listed under their brokerage firm’s name, we believe the actual number of stockholders is approximately 4,024.
Stock Prices
The following table sets forth quarterly high and low closing sales prices of our common stock for the indicated periods:
| High | Low | |||||||
| Year Ended December 31, 2009 |
||||||||
| First Quarter |
$ | 1.56 | $ | 0.64 | ||||
| Second Quarter |
1.67 | 0.60 | ||||||
| Third Quarter |
2.27 | 1.27 | ||||||
| Fourth Quarter |
2.72 | 1.88 | ||||||
| Year Ended December 31, 2010 |
||||||||
| First Quarter |
$ | 2.25 | $ | 1.75 | ||||
| Second Quarter |
2.69 | 1.91 | ||||||
| Third Quarter |
2.00 | 1.52 | ||||||
| Fourth Quarter |
3.05 | 1.97 | ||||||
Dividend Policy
We have never paid a cash dividend and have no present intention to pay cash dividends in the foreseeable future. The board of directors currently intends to retain any future earnings for use in our business. Pursuant to our loan agreement with Silicon Valley Bank, we are prohibited from making any cash payments for dividends or purchasing or redeeming any of our equity securities, returning any capital to any holder of our equity securities.
Securities Authorized for Issuance Under Equity Compensation Plans
The information required by this Item regarding equity compensation plans is incorporated by reference to the information set forth in PART III Item 12 of this Annual Report on Form 10-K.
47
Table of Contents
Stock Performance Graph
The following graph compares the cumulative total stockholder return on our common stock with the cumulative total return of the Nasdaq Composite Index and the Nasdaq Medical Equipment Index for the period beginning on November 10, 2006, our first day of trading after our initial public offering, and ending on December 31, 2010.
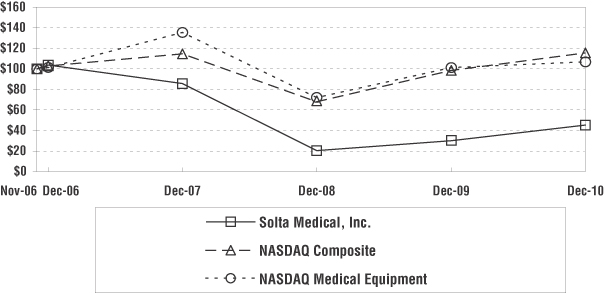
| The graph assumes that $100 was invested on November 10, 2006 in our common stock, or on October 31, 2006 in the Nasdaq Composite Index and the Nasdaq Medical Equipment Index, and that all dividends were reinvested. No dividends have been declared or paid on our common stock. Stock performance shown in the above chart for the common stock is historical and should not be considered indicative of future price performance. This graph was prepared by Research Data Group, Inc. |
48
Table of Contents
| Item 6. | Selected Financial Data |
The following table presents certain financial data for each of the last five fiscal years. You should read the 2010 through 2008 financial information together with the information under “Management’s Discussion and Analysis of Financial Condition and Results of Operations” and our financial statements and related notes included in this Form 10-K.
Consolidated Statement of Operations Data
| Years Ended December 31, | ||||||||||||||||||||
| (in thousands of dollars, except share and per share |
2010 (1) | 2009 | 2008 (2) | 2007 | 2006 | |||||||||||||||
| Net revenue |
$ | 110,932 | $ | 98,818 | $ | 56,681 | $ | 63,101 | $ | 54,320 | ||||||||||
| Cost of revenue |
41,400 | 40,565 | 15,066 | 15,976 | 15,259 | |||||||||||||||
| Gross margin |
69,532 | 58,253 | 41,615 | 47,125 | 39,061 | |||||||||||||||
| Operating expenses |
||||||||||||||||||||
| Sales and marketing |
42,665 | 38,931 | 27,001 | 26,195 | 24,071 | |||||||||||||||
| Research and development |
16,324 | 16,246 | 9,502 | 9,099 | 9,639 | |||||||||||||||
| General and administrative |
14,627 | 14,659 | 13,662 | 11,300 | 9,973 | |||||||||||||||
| Acquired in-process research and development |
— | — | 9,060 | — | — | |||||||||||||||
| Litigation settlement gain |
(2,213 | ) | — | — | — | — | ||||||||||||||
| Total operating expenses |
71,403 | 69,836 | 59,225 | 46,594 | 43,683 | |||||||||||||||
| Income (loss) from operations |
(1,871 | ) | (11,583 | ) | (17,610 | ) | 531 | (4,622 | ) | |||||||||||
| Interest and other income |
371 | 462 | 2,334 | 2,520 | 768 | |||||||||||||||
| Interest, warrants and other expenses |
(298 | ) | (394 | ) | (15 | ) | — | (55 | ) | |||||||||||
| Loss on investments |
— | 224 | (1,088 | ) | — | — | ||||||||||||||
| Income (loss) before income taxes |
(1,798 | ) | (11,291 | ) | (16,379 | ) | 3,051 | (3,909 | ) | |||||||||||
| Provision (benefit) for income taxes |
222 | (99 | ) | 14 | 271 | — | ||||||||||||||
| Net income (loss) |
$ | (2,020 | ) | $ | (11,192 | ) | $ | (16,393 | ) | $ | 2,780 | $ | (3,909 | ) | ||||||
| Net income (loss) per share — basic and diluted: |
||||||||||||||||||||
| Net income (loss) per share — basic |
$ | (0.03 | ) | $ | (0.23 | ) | $ | (0.67 | ) | $ | 0.12 | $ | (0.60 | ) | ||||||
| Net income (loss) per share — diluted |
$ | (0.03 | ) | $ | (0.23 | ) | $ | (0.67 | ) | $ | 0.11 | $ | (0.60 | ) | ||||||
| Weighted average shares outstanding used in calculating net income (loss) per common share: |
||||||||||||||||||||
| Basic |
58,908,611 | 47,848,258 | 24,506,673 | 23,241,031 | 6,561,648 | |||||||||||||||
| Diluted |
58,908,611 | 47,848,258 | 24,506,673 | 24,884,458 | 6,561,648 | |||||||||||||||
| (1) | Includes the effect of the acquisition of Aesthera Corporation on February 26, 2010 and the results of operations of Aesthera Corporation from February 26, 2010 to December 31, 2010, and the effect of the acquisition of CLRS Technology Corporation on October 15, 2010 and the results of operations of CLRS Technology Corporation from October 15, 2010 to December 31, 2010. |
| (2) | Includes the effect of the acquisition of Reliant Technologies, Inc. on December 23, 2008 and the results of operations of Reliant Technologies, Inc from December 23, 2008 to December 31, 2008. |
49
Table of Contents
Consolidated Balance Sheet Data
| As of December 31, | ||||||||||||||||||||
| (in thousands of dollars) |
2010 | 2009 | 2008 | 2007 | 2006 | |||||||||||||||
| Cash and cash equivalents |
$ | 36,898 | $ | 14,744 | $ | 7,556 | $ | 13,650 | $ | 45,915 | ||||||||||
| Marketable investments |
— | — | 17,870 | 38,707 | — | |||||||||||||||
| Working capital |
33,994 | 14,462 | 13,864 | 55,834 | 46,153 | |||||||||||||||
| Total assets |
158,545 | 136,149 | 149,168 | 68,727 | 59,875 | |||||||||||||||
| Short and long-term borrowings |
9,626 | 11,058 | 12,399 | — | — | |||||||||||||||
| Preferred stock warrant liability |
— | — | — | — | — | |||||||||||||||
| Redeemable convertible preferred stock |
— | — | — | — | — | |||||||||||||||
| Total stockholders’ equity (deficit ) |
$ | 122,144 | $ | 100,237 | $ | 107,824 | $ | 58,118 | $ | 49,121 | ||||||||||
50
Table of Contents
| Item 7. | Management’s Discussion and Analysis of Financial Condition and Results of Operations |
The following discussion should be read in conjunction with the attached financial statements and notes thereto. This Annual Report on Form 10-K, including the following sections, contains forward-looking statements within the meaning of the federal securities laws. These statements include, but are not limited to, introduction of new procedures and associated treatment tips in the future; sales organization growth; growth in international sales and expansion into new international markets; and our belief that our cash and cash equivalents, along with our credit facility will satisfy our anticipated cash requirements. These statements are subject to risks and uncertainties that could cause actual results and events to differ materially from those expressed or implied by such forward-looking statements. For a detailed discussion of these risks and uncertainties, see “Risk Factors” section in Item 1A of this Annual Report on Form 10-K. We caution the reader not to place undue reliance of these forward-looking statements, which reflect management’s analysis only as of the date of this Form 10-K. We undertake no obligation to update forward-looking statements, which reflect events or circumstances occurring after the date of this Form 10-K.
Overview
We design, develop, manufacture and market aesthetic energy devices to address a range of skin issues brought on by the effects of aging, environmental factors or hormonal changes. Our patented and FDA-cleared systems use radiofrequency, or RF, energy to heat and shrink collagen and tighten tissue while simultaneously cooling and protecting the surface of the skin.
Laser devices used for aesthetic procedures, such as skin resurfacing, are generally regulated as Class II medical devices, requiring 510(k) clearance. The FDA has granted fourteen 510(k) clearances for four Fraxel devices relating to multiple indications for use.
The acquisition of Aesthera Corporation (“Aesthera”) has added intense pulsed light, which we sometimes refer to as “IPL”, devices to our product portfolio. In April 2005, Aesthera received FDA clearance to market its first IPL system for the treatment of benign vascular and pigmented lesions, and permanent hair reduction. In September 2006, the Aesthera PPx System received FDA clearance for the treatment of benign vascular and pigmented lesions, permanent hair reduction, and the additional indication of treatment of mild to moderate acne. The Isolaz system received FDA clearance in January 2009 for the treatment of benign vascular and pigmented lesions, permanent hair reduction, and mild to moderate acne.
The acquisition of CLRS Technology Corporation (“CLRS”) also added an IPL personal care acne treatment system. In April 2010, the CLARO product was the first IPL acne treatment system to secure FDA over-the-counter clearance for the treatment of mild-to-moderate inflammatory acne.
As of December 31, 2010, we had a global installed base of over 7,000 systems.
Net revenue for the year ended December 31, 2010 increased 12% or $12.1 million, to $110.9 million, from $98.8 million in 2009, mainly from higher tip revenue, an increase in upgrade and net system sales and the $5.0 million contribution from Aesthera products under the Isolaz brand name, partially offset by a decrease in handpeice sales. Our business continued to be impacted by the weakness in global economic conditions and tightening of the credit markets, which resulted in a slowdown in customer purchase decisions. As our procedures are generally elective, the slowing economy reduced demand for our procedures. The tight credit markets limited the ability of some of our customers to obtain financing for the purchase of our products. In response to the continuing difficulties in the economy, we have implemented a number of initiatives in response to the tight worldwide credit market, including expanding our partner program to include Fraxel consumables as well as offering incentives to doctors who become Fraxel, Thermage and Isolaz customers.
51
Table of Contents
Acquisition of CLRS Technology Corporation
On October 15, 2010, we acquired 100% of the common stock of CLRS Technology Corporation (“CLRS”), a privately held company for consideration consisting of the payment of approximately $1.0 million of debt at the closing of the acquisition.
In connection with this transaction, the Company entered into a contingent consideration arrangement which may require payments if certain milestones related to revenue from the sale of CLRS products and operating income of CLRS are achieved during 2011. The fair value of the contingent consideration recognized on the acquisition date of $0.9 million was estimated by applying a probability weighted discounted cash-flow approach. Key assumptions include (i) a discount rate of 2.1% and 25.6% percent and (ii) probability of milestone achievement ranging from 0%-10%. As of December 31, 2010 the fair value of the contingent consideration had not changed.
As a result of the acquisition, the Company has expanded its product offerings by providing a consumer based treatment of acne to its customers through a retail channel.
Of the total original purchase price of $1.9 million, $1.1 million was allocated to amortizable intangible assets, which are being amortized using a straight-line method over their respective estimated useful lives of four to six years. The valuation of identified intangible assets acquired was based on management’s estimates, currently available information and reasonable and supportable assumptions. The allocation was based on the fair value of these assets determined using the income approach and the cost method approach. The income approach uses a discounted cash flow model. The Company calculated the present value of the expected future cash flows attributable to the acquired intangibles using a 25.6% discount rate. With respect to intangible assets, there are several methods available under the income approach to quantify fair value. The Company used the following methods to quantify fair value of the acquired intangibles at the acquisition date. The excess earnings method was used for customer relationships and the relief from royalties method was used for the trade name intangibles with a royalty rate of 0.3%. The Company used the cost method approach to quantify the fair value of the product technology intangible, by using cumulative inflation rates ranging from 0% to 5.5%.
The Company allocated the residual value of $0.8 million to goodwill. Goodwill arising from the acquisition is attributable to the workforce of the acquired business and the significant synergies expected to arise. Goodwill is not expected to be deductible for tax purposes.
For the period from October 15, 2010 to December 31, 2010, revenue from the sales of CLRS products was approximately $15,000. Net income associated with CLRS products and operations cannot be determined given the integration of CLRS operations within the Company.
Reliable information to provide pro forma financial disclosure on the CLRS acquisition is currently unavailable and impracticable to prepare at this time. Therefore, such pro forma financial information has not been included herein.
Acquisition of Aesthera Corporation
On February 26, 2010, we acquired 100% of the common stock of Aesthera Corporation, a privately held company for consideration including $0.5 million in cash and $4.8 million of shares of our common stock. The number of shares of our common stock issued of 2,435,897 was determined based on the volume-weighted average closing market price of $1.95 per share during the five trading days preceding the acquisition date.
In connection with this transaction, we entered into a contingent consideration arrangement which may require payments ranging from $0 to $10.75 million in shares of our common stock if certain revenue milestones are achieved related to the sale of Aesthera products and if certain acquired Aesthera receivables are collected.
52
Table of Contents
The fair value of the contingent consideration recognized on the acquisition date of $0.3 million was estimated by applying a probability weighted discounted cash-flow approach. Key assumptions include (i) a discount rate of 4.05% percent and (ii) probability of milestone achievement ranging from 0%-50%.
As of December 31, 2010 the fair value of the contingent consideration has been reduced to $0 to reflect our updated assessment of the probabilities assigned to achieving the revenue milestones and accordingly a $280 gain was recognized in general and administrative expense in our condensed consolidated statement of operations during the year ended December 31, 2010, respectively.
As a result of the acquisition, we have expanded our product offerings by providing treatment of acne to its customers through our direct sales and distribution network worldwide.
Our condensed consolidated financial statements include the results of operations of Aesthera from the date of acquisition through December 31, 2010.
Of the total original purchase price of $5.5 million, $3.7 million was allocated to amortizable intangible assets, which are being amortized using a straight-line method over their respective estimated useful lives of five to six years. The valuation of identified intangible assets acquired was based on management’s estimates, currently available information and reasonable and supportable assumptions. The allocation was based on the fair value of these assets determined using the income approach. The income approach uses a discounted cash flow model. We calculated the present value of the expected future cash flows attributable to the acquired intangibles using an 18% to 19% discount rate. With respect to intangible assets, there are several methods available under the income approach to quantify fair value. We used the following methods to quantify fair value of the acquired intangibles at the acquisition date. The excess earnings method was used for product technology and customer relationships. The relief from royalties method was used for the trade name intangibles with a royalty rate of 1%.
We allocated the residual value of $1.4 million to goodwill at February 26, 2010. Goodwill arising from the acquisition is attributable to the workforce of the acquired business and the significant synergies expected to arise after. Goodwill is not expected to be deductible for tax purposes.
Acquisition of Reliant Technologies, Inc.
On December 23, 2008, we acquired 100% of the common stock of Reliant for $25 million in cash and 23.6 million shares of Solta Medical common stock and assumption of $9.4 million of debt, including a $5 million note payable to Thermage. This acquisition expands the market presence of the Company. Complementary product offerings allow us to cross-sell a more complete product line to physicians and their patients through one of the largest direct U.S. sales forces in the industry and an expansive international distribution network. The acquisition resulted in a combined company with two strong brand names and one of the largest direct U.S. sales forces in the industry. Following the acquisition, we changed our name to Solta Medical, Inc.
The acquisition purchase price totaled a combined $25 million cash paid, $61.4 million for 23.6 million shares issued at the $2.60 share price on the date of announcement, $181,000 fair value of assumed warrants and approximately $4.1 million in direct transaction costs.
We recorded an estimate for costs to terminate some activities associated with the Reliant operations. The restructuring accrual of approximately $3.0 million at December 31, 2008 was principally related to the termination of 45 Reliant employees of approximately $1.8 million and restructuring of facilities of $1.2 million.
53
Table of Contents
The valuation of identified intangible assets acquired was based on management’s estimates, currently available information and reasonable and supportable assumptions. The allocation was based on the fair value of these assets determined using the income approach. The income approach, using a discounted cash flow model, was used to determine the estimated fair values of the acquired intangible assets. The Company calculated the present value of the expected future cash flows attributable to the acquired intangibles using an 18% to 22% discount rate. With respect to intangible assets, there are several methods available under the income approach to quantify fair value. Under this approach the Company used the following methods to quantify fair value of the acquired intangibles at the acquisition date. The excess earnings method was used for the following four intangible assets: product technology, customer relationships, royalties intangible and product development contract. The relief from royalties method was used for the core technology and Fraxel trade name intangibles with a royalty rate of 5% and 1%, respectively. The lost profits method (also referred to as the “with and without method”) was used for the non-compete agreement with a probability of competition rate of 10%. The Company utilized third-party market data (i.e. license agreements) to derive valuation assumptions used to fair value certain intangible assets, such as the Fraxel trade name and core technology.
Of the total original purchase price of approximately $90.6 million, approximately $41.1 million was allocated to amortizable intangible assets. Approximately $37.2 million of the amortizable intangible assets are being amortized using a straight-line method over their respective estimated useful lives of two to 12 years.
In conjunction with the acquisition of Reliant, we recorded an expense of approximately $9.1 million for acquired in-process research and development (“IPR&D”) during the quarter and year ended December 31, 2008, because feasibility of the acquired technology had not been established and no alternative future use exists. The IPR&D is related to the development of three new products. The three significant IPR&D projects at date of acquisition were as follows: Project A – a next generation dual wave-length Fraxel re:store system; Project B – a body shaping product; and Project C – a rejuvenation product for the professional market being developed in a collaborative partnership. At the date of acquisition, it was estimated that Project A would be completed in 2009, Project B would be completed in 2010 and Project C would be completed in 2011. Project A was completed in September 2009 and FDA clearance was received in October 2009. Project B is currently in clinical investigations and Project C is pending regulatory approval.
We used the income approach (excess earnings method) to determine the estimated fair values of the acquired IPR&D, which uses a discounted cash flow model, based on estimates of successful product development and commercialization to estimate future net cash flows resulting from projected revenues and related costs. These estimates take into account the stages of completion and the risks surrounding successful development and commercialization of the underlying product candidates. We calculated the present value of the expected future cash flows attributable to the in-process technology using a 21% to 23% discount rate for the related projects. The after tax cash flows are calculated by applying cost, expense, income tax and contributory asset charge assumptions to the IPR&D revenue streams.
The major risks and uncertainties associated with the timely and successful completion of these IPR&D projects include delays caused by legal actions brought by our competitors and the timing of the receipt of necessary regulatory approvals. No assurances can be given that the underlying assumptions used to prepare the discounted cash flow analysis will not change or the timely completion of each project to commercial success will occur. For these and other reasons, actual results may vary significantly from estimated results.
We allocated the residual value of approximately $48.2 million to goodwill at December 23, 2008, and adjusted this amount to $47.3 million during the year ended December 31, 2009 for adjustments to the valuation of inventory acquired, accrued restructuring, prepaid expenses, and adjustments of the acquisition consideration for a shortfall in Reliant’s closing working capital.
Goodwill represents the excess of the purchase price over the fair value of the net tangible and intangible assets acquired. Goodwill is not amortized, but is tested for impairment on an annual basis or when
54
Table of Contents
events and circumstances indicate that the carrying amount of goodwill may not be recoverable. The factors that contributed to a premium on the purchase price that resulted in the recognition of goodwill were:
| • | The expansion of our recurring revenue model allowing for increased treatment tip usage as well as expanding clinical applications for our physician customers. |
| • | Access to an expanded base of industry knowledge and expertise. |
| • | Opportunity to complement our existing products for the aesthetic market with a synergistic technology and new clinical treatment applications. |
| • | Expansion of our global presence thereby increasing our market penetration. |
The Company performed a goodwill impairment test at the end of 2010 and as a result, no goodwill impairment was identified through December 31, 2010. The test was based on our single operating segment and reporting unit structure.
Significant Business Trends
We derive revenue primarily from the sale of systems, treatment tips and consumables. For the years ended December 31, 2010, 2009 and 2008 we derived 51%, 48% and 73% respectively, of our revenue from treatment tips and consumable sales, and 42%, 43% and 24% respectively, of our revenue from system sales. The balance of our revenue is derived from service, research and development and shipping. In the third quarter of 2009, we launched two new systems, the Thermage CPT and Fraxel re:store Dual.
With the acquisition of Reliant and Aesthera, during 2010 we have seen sales of treatment tips and consumables increase as a percentage of our revenue versus system sales, and revenue derived from sales of products and services within North America decreased as a percentage of our total revenue.
We market our products in North America to physicians, primarily dermatologists and plastic surgeons, through a direct sales force and internationally through a network of independent distributors and our direct sales force in certain countries. In the years ended December 31, 2010, 2009 and 2008, we derived 45%, 47% and 52%, respectively, of our revenue from sales of our products and services within North America, and 55%, 53% and 48%, respectively, of our total sales outside of North America. We believe that a significant portion of our business will continue to come from international sales through increased penetration in countries where we currently sell our products, combined with expansion into new international markets. The percentages of our revenue by region are presented in the table below:
| Years Ended December 31, | ||||||||||||
| 2010 | 2009 | 2008 | ||||||||||
| North America |
45 | % | 47 | % | 52 | % | ||||||
| Asia Pacific |
31 | % | 25 | % | 24 | % | ||||||
| Europe/Middle East |
19 | % | 23 | % | 14 | % | ||||||
| Rest of the world |
5 | % | 5 | % | 10 | % | ||||||
| Total net revenue |
100 | % | 100 | % | 100 | % | ||||||
We continue to believe our bifurcated sales force will serve us well. With the acquisition of Reliant and Aesthera, we have one of the largest North American direct sales forces in the industry, with about half of the sales force focusing on existing customers and sales of treatment tips, upgrades and training, and the remainder focusing on securing new accounts.
55
Table of Contents
Future operating results are difficult to predict accurately. We anticipate that our quarterly results of operations may fluctuate for the foreseeable future due to several factors, including prevailing economic conditions and our customers’ access to credit, the timing of introduction and the degree of acceptance of future product offerings, unanticipated interruptions and expenses related to our manufacturing operations, and the performance of our direct sales force and international distributors. The tight credit markets limited the ability of some of our customers to obtain financing for the purchase of our products. We have implemented a number of initiatives in response to the tight worldwide credit market, including expanding our partner program to include Fraxel consumables as well as offering incentives to doctors who become Fraxel, Thermage and Isolaz customers.
As new or enhanced products are introduced, we must successfully manage the transition from older products in order to minimize disruption in customers’ ordering patterns, avoid excessive levels of older product inventories, and ensure that enough supplies of new products can be delivered to meet customer demand.
Significant Industry Factors
Our business is subject to the impact of economic conditions on the growth of the industry and to our ability to continue to develop new products, applications and innovative technologies, obtain and maintain regulatory clearances for our products, protect our proprietary technology, and successfully market and distribute our products. Our industry is characterized by seasonally lower demand during the third calendar quarter of the year, when both physicians and prospective patients take summer vacations. Additionally, our industry is highly competitive and our success depends on our ability to compete successfully. Our business is sensitive to a number of factors that influence the levels of consumer spending, including political and economic conditions such as recessionary environments, the level of disposable consumer income, consumer debt, interest rates and consumer confidence. Declines in consumer spending on aesthetic procedures could have an adverse effect on our operating results. A detailed discussion of these and other factors that impact our business is provided in the “Risk Factors” section in this Annual Report on Form 10-K.
Critical Accounting Policies and Estimates
Our discussion and analysis of our financial condition and results of operations is based upon our financial statements, which have been prepared in accordance with accounting principles generally accepted in the United States. The preparation of financial statements requires management to make estimates and judgments that affect the reported amounts of assets and liabilities, revenue and expenses, and disclosures at the date of the financial statements. On a periodic basis, we evaluate our estimates, including those described below. We use authoritative pronouncements, historical experience and other assumptions as the basis for making estimates. Actual results could differ from those estimates.
We believe that the following critical accounting policies are affected by our more significant judgments and estimates used in the preparation of our financial statements.
Revenue Recognition
Product revenue is recognized when delivery has occurred, persuasive evidence of an arrangement exists, the price is fixed or determinable, and collectability is reasonably assured. Delivery is deemed to have occurred when title and risk and rewards of ownership have transferred to the customer and remaining obligations are considered perfunctory. For most of our product sales, transfer of title and risk and rewards of ownership occurs when product is shipped. Revenue is recorded net of customer and distributor discounts and rebates. Revenue from the sale of extended service contracts for products beyond their warranty term is recognized on a straight-line basis over the period of the applicable extended contract. We also earn service revenue from customers outside of their warranty term or extended service contracts. Such service revenue is recognized as the services are provided.
56
Table of Contents
Our system sales in the United States have post-sale obligations of installation and training, as applicable. These obligations are fulfilled after product shipment. When we have objective and reliable evidence of fair value of the undelivered elements, we defer revenue attributable to the post-shipment obligations and recognize such revenue when the obligation is fulfilled. Otherwise, we will defer all revenue until all elements are delivered or objective and reliable evidence of fair value has been determined for all undelivered elements.
We sell to end-users in the United States and to distributors and end-users outside of the United States. Sales to end-users and distributors do not include return rights. We typically recognize revenues upon shipment for sales to our independent third party distributors as we have no continuing obligations subsequent to shipment, other than replacement parts warranty coverage. The distributors are responsible for all marketing, sales, installation, training and warranty services for our products. Also, our distributors are responsible for obtaining regulatory clearances and approvals outside of the United States. While the regulatory approval process varies greatly by country and we may assist the distributor in the regulatory approval process, the responsibility belongs to the distributor. We do not provide price protection or stock rotation rights to any of our distributors. In addition, our distributor agreements do not allow the distributors to return or exchange products and the distributors are obligated to pay us for the sale regardless of whether the distributors are able to resell the product. For sales transactions in which collectability is not reasonably assured, we recognize revenue upon receipt of cash payment.
Allowance for Doubtful Accounts
Accounts receivable are typically unsecured and derived from revenues earned from customers. We maintain an allowance for doubtful accounts for estimated losses resulting from the inability of our customers to make required payments. We estimate appropriate allowances based upon any specific customer collection issues, our history of losses, economic conditions and age of customer balances. Our assessment of the ability of our customers to pay generally includes direct contact with the customer, a review of their financial status, as well as consideration of their payment history with us.
Warranty Reserve
We provide for the estimated cost of product warranties at the time revenue is recognized. As we sell new products to our customers, we must exercise considerable judgment in estimating the expected failure rates. Should actual product failure rates, material usage or service delivery costs differ from our estimates, revisions to the estimated warranty liability would be required. We offered a three year warranty for Thermage systems sold in the United States, one year for Fraxel systems sold worldwide and a one year replacement parts warranty for systems sold to distributors outside of the United States through December 31, 2008. Beginning in January 1, 2009, we offered a one year warranty period for systems sold worldwide. We also provide a warranty for our consumable products.
Inventory Valuation
We state our inventories at the lower of cost or market value, cost being determined on a standard cost basis (which approximates actual cost on a first-in, first-out basis) and market value being determined as the lower of replacement cost or net realizable value. Standard costs are monitored on a monthly basis and updated quarterly and as necessary to reflect changes in raw material costs and labor and overhead rates. Inventory reserves are established when conditions indicate that the selling price could be less than cost due to physical deterioration, usage, obsolescence, reductions in estimated future demand and reductions in selling prices. Inventory reserves are charged to cost of revenue and establish a lower cost basis for the inventory. We balance the need to maintain strategic inventory levels with the risk of obsolescence due to changing technology and customer demand levels. Unfavorable changes in market conditions may result in a need for additional inventory reserves that could adversely impact our gross margins. Conversely, favorable changes in demand could result in higher gross margins.
57
Table of Contents
Impairment of Goodwill
Goodwill represents the excess of the purchase price over the fair value of the net tangible and intangible assets acquired. Our goodwill is not amortized but is tested for impairment on an annual basis or when events and circumstances indicate that the carrying amount of goodwill may not be recoverable. This impairment review involves a two-step process as follows:
Step 1 — We compare its fair value to its carrying value including goodwill. If the carrying value including goodwill exceeds its fair value, we move on to step 2. If the fair value exceeds the carrying value, no further work is performed and no impairment charge is necessary. To date, the fair value of the Company has exceeded the carrying value and thus no goodwill impairment change has been recorded.
Step 2 — We perform an allocation of the fair value to its identifiable tangible and intangible assets (other than goodwill) and liabilities. This allows us to derive an implied fair value of goodwill. We then compares the implied fair value of goodwill to the carrying value of goodwill. If the carrying amount of goodwill is greater than the implied fair value of goodwill, an impairment change would be recognized for the excess.
We test goodwill for impairment at least annually or more frequently if events or changes in circumstances indicate that this asset may be impaired. The goodwill test is based on our single operating segment and reporting unit structure. No goodwill impairment was identified through December 31, 2010.
Impairment of Long-Lived Assets
We review long-lived assets, including property and equipment and finite lived intangibles, for impairment whenever events or changes in business circumstances indicate that the carrying amount of the assets may not be fully recoverable. An impairment loss would be recognized when estimated undiscounted future cash flows expected to result from the use of the asset and its eventual disposition is less than its carrying amount. Impairment, if any, is measured as the amount by which the carrying amount of a long-lived asset exceeds its fair value.
Litigation and Claims
From time to time, we are involved in litigation relating to claims arising from the ordinary course of business. We routinely assess the likelihood of any adverse judgments or outcomes related to legal matters and claims, as well as ranges of probable losses. A determination of the amount of the reserves required, if any, for these contingencies is made after thoughtful analysis of each known issue and an analysis of historical experience. We do not believe the final disposition of these matters will have a material adverse effect on the financial statements and future cash flows of the Company. Also, we do not record gain contingencies.
Income Taxes
We make certain estimates and judgments in determining income tax expense for financial statement purposes. These estimates and judgments occur in the calculation of tax credits, benefits and deductions, such as tax benefits from our non-U.S. operations and in the calculation of certain tax assets and liabilities, which arise from differences in the timing of revenue and expense for tax and financial statement purposes.
We record a valuation allowance to reduce our deferred tax assets to an amount that more-likely-than-not will be realized. While we have considered future taxable income and ongoing prudent and feasible tax planning strategies in assessing the need for the valuation allowance, in the event we were to determine that we would be able to realize our deferred tax assets in the future in excess of our net recorded amount, an adjustment to the allowance for the deferred tax asset would increase income in the period such determination was made.
58
Table of Contents
Likewise, should we determine that we would not be able to realize all or part of our net deferred tax asset in the future, an adjustment to the valuation allowance for the deferred tax asset would be charged to income in the period such determination was made.
We believe we have provided adequate reserves for uncertain tax positions for anticipated audit adjustments by U.S. federal, state and local, as well as foreign tax authorities based on our estimate of whether, and the extent to which, additional taxes, interest and penalties may be due. If events occur which indicate payment of these amounts is unnecessary, the reversal of the liabilities would result in tax benefits being recognized in the period when we determine the accrued liabilities are no longer warranted. If our estimate of tax liabilities proves to be less than the ultimate assessment, a further charge to expense would result.
Valuation of Share-Based Awards
Share-based compensation expense is measured at the grant date based on the value of the award and is recognized as expense over the vesting period. Determining the fair value of option awards at the grant date requires judgment, including estimating the expected term of stock options, the expected volatility of our stock, expected forfeitures and expected dividends. The computation of the expected volatility assumption used in the Black-Scholes option pricing model for option grants incorporates our historical volatility and volatility of similar public entities in the aesthetics market due to a lack of historical information regarding the volatility of our stock price. When establishing the expected term assumption, we review annual historical employee exercise behavior of option grants with similar vesting periods. In addition, judgment is also required in estimating the amount of share-based awards that are expected to be forfeited. If actual forfeitures differ significantly from these estimates, share-based compensation expense and our results of operations could be materially affected.
Results of Operations
Years Ended December 31, 2010 and December 31, 2009
Net Revenue. Revenue is derived from the sales of systems, treatment tips and other consumables, and service and other revenue. Net revenue was $110.9 million for the year ended December 31, 2010, an increase of $12.1 million, or 12%, compared to $98.8 million for the year ended December 31, 2009. This increase was primarily due to the contributions from the sales of Isolaz products and services of $5.0 million, an increase in tips and consumable sales and an increase in system sales and system upgrades, partially offset by a decline in other revenue and handpiece sales. System sales for the year ended December 31, 2010 was $46.4 million, an increase of $3.8 million, or 9%, compared to $42.5 million for the same period in 2009. Sales of treatment tips and other consumables was $56.6 million, an increase of $9.3 million, or 20%, compared to $47.3 million for the same period in 2009.
Cost of Revenue. Our cost of revenue consists primarily of material, labor and manufacturing overhead expenses. Gross margin was 63% of revenue for the year ended December 31, 2010, compared with 59% of revenue for the same period in 2009. The increase in gross margin as a percent of revenue for the year ended December 31, 2010 when compared to the prior year was primarily due to a higher proportion of higher-margin tip sales, lower manufacturing period costs as a percentage of higher sales volumes and a decrease in purchase price related adjustment to cost of sales that resulted from the acquisition of Reliant in December 2008, partially offset by a higher proportion of lower margin system upgrade sales and an increase in amortization expense from intangibles acquired in the Aesthera and CLRS acquisitions.
Sales and Marketing. Sales and marketing expenses consist primarily of personnel costs and costs related to customer-attended workshops and trade shows and advertising, as well as marketing and customer service expenses. Sales and marketing expenses in the year ended December 31, 2010 was $42.7 million, an increase of $3.7 million, or 10%, compared to $38.9 million for the same period in 2009. The increase was
59
Table of Contents
primarily attributable to increased headcount and related personnel and travel and entertainment expenses of $2.8 million from the acquisition of Aesthera and CLRS, an increase of $0.4 million in discretionary marketing expenses, an increase of $0.2 million in supplies, telecommunication, depreciation and allocated information technology and facility expenses, and $0.3 million of amortization of intangibles acquired in the Aesthera and CLRS acquisitions.
Research and Development. Research and development expenses consist primarily of personnel costs, clinical and regulatory costs, material costs and regulatory and quality assurance costs not directly related to the manufacturing of our products. Research and development expenses in the year ended December 31, 2010 was $16.3 million, an increase of $0.1 million, or 0.5%, compared to $16.2 million for the same period in 2009. Compared to the same period of 2009, professional services increased by $1.1 million, partially offset by a decrease of $0.4 million in employee payroll and related expenses and a decrease of $0.6 million in clinical studies and other R&D project costs.
General and Administrative. General and administrative expenses consist primarily of personnel costs, legal and accounting fees, human resources costs and other general operating expenses. General and administrative expenses in the year ended December 31, 2010 was $14.6 million, a decrease of $0.1 million, or 0.2%, compared with $14.7 million for the same period in 2009. The decrease from the prior year period was due to a decrease of $0.7 million in professional services, primarily due to a decrease in outside accounting and legal fees, a decrease of $0.2 million in business insurance and a decrease of $0.2 million in bad debt expense, partially offset by an increase of $0.3 million in employee payroll and related expenses and an increase of $0.9 million in acquisition related expense resulting from the acquisition of Aesthera and CLRS during 2010.
Litigation Settlement. In May 2010, we reached an agreement with Alma that settled patent-related claims of the parties against each other. Under this agreement, the parties granted each other a covenant not to sue under the patents in the suit and related patents. We received a one-time payment of $2.3 million and incurred external legal expenses of $37,000 for the year ended December 31, 2010. This resulted in a net litigation settlement gain of $2.2 million in our statement of operations for the year ended December 31, 2010.
Interest and Other Income. Interest and other income consist primarily of interest income generated from our cash, cash equivalents and marketable investments. Interest and other income decreased $0.1 million, or 20%, from $0.5 million for the year ended December 31, 2009 to $0.4 million for the same period in 2010, due to lower interest income from lower average investment balances since all the Company’s marketable securities matured in 2009, partially offset by increased foreign exchange gains during the period due to currency fluctuations
Interest and Other Expense. Interest and other expense consist primarily of interest expense resulting from borrowings on the margin account, line of credit and term loans. Interest and other expenses were $0.3 million and $0.4 million in the years ended December 31, 2010 and 2009, respectively. The decrease is primarily due to lower debt balances in 2010.
Gain (Loss) on Investments. During the year ended December 31, 2009, we realized $0.2 million in gains on investments that had either been sold or matured in our portfolio during 2009. We had no investments in 2010.
Provision (benefit) for Income Taxes. There was an income tax provision of $0.2 million and a tax benefit of $0.1 million for the years ended December 31, 2010 and 2009, respectively. The provision for income taxes for year ended December 31, 2010 primarily represented additions to AMT taxes and additions to reserves for uncertain tax positions. The benefit for income taxes for the year ended December 31, 2009 primarily represented refunds of income taxes, partially offset by additions to reserves for uncertain tax positions. We did not recognize any tax benefits in relation to the loss before income taxes for the year ended December 31, 2010 as we maintained a full valuation allowance for deferred taxes.
60
Table of Contents
Years Ended December 31, 2009 and December 31, 2008
Net Revenue. Net revenue was $98.8 million for the year ended December 31, 2009, an increase of $42.1 million, or 74%, compared to $56.7 million for the year ended December 31, 2008. This increase is primarily due to the contribution from Fraxel sales in 2009 resulting from the Reliant acquisition in December 2008. System sales for the year ended December 31, 2009 was $42.5 million, an increase of $29.0 million, or 213%, compared to $13.6 million for the same period in 2008. Sales of treatment tips and other consumables was $47.3 million, an increase of $5.9 million, or 14%, compared to $41.4 million for the same period in 2008. These increases were due to the contributions from Fraxel sales resulting from the Reliant acquisition and an increase in Thermage system upgrades during 2009, partially offset by a decrease in Thermage tip revenue.
Cost of Revenue. Gross margin was 59% of revenue for the year ended December 31, 2009, compared with 73% of revenue for the same period in 2008. The decrease in gross margin as a percent of revenue for the year ended December 31, 2009 was primarily due to a $2.9 million fair value adjustment to cost of sales resulting from sales of inventory assumed in the Reliant acquisition, $2.8 million of amortization expense from intangible assets from the Reliant acquisition, a higher proportion of lower-margin system and system upgrade sales than higher-margin tip sales primarily resulting from the Reliant acquisition, unfavorable overhead absorption due to lower than planned production volume, and downward sales-pricing pressure caused by the continuing difficulties in the economy,
Sales and Marketing. Sales and marketing expenses in the year ended December 31, 2009 was $38.9 million, an increase of $11.9 million, or 44%, compared to $27.0 million for the same period in 2008. The increase was primarily attributable to increased headcount and related personnel and travel and entertainment expenses of $5.7 million from the Reliant acquisition, an increase of $3.3 million in discretionary marketing expenses, an increase of $1.4 million in professional services, an increase of $0.8 million in supplies, telecommunication, depreciation and allocated information technology and facility expenses, and $0.7 million of amortization of intangibles acquired in the Reliant acquisition.
Research and Development. Research and development expenses in the year ended December 31, 2009 was $16.2 million, an increase of $6.7 million, or 71%, compared to $9.5 million for the same period in 2008. Compared to the same period of 2008, employee payroll and related expenses increased $2.8 million which was primarily attributable to the Reliant acquisition, clinical studies and other R&D project costs increased $1.4 million, professional services increased by $1.2 million, allocated information technology and facility expenses, and depreciation and amortization expenses were higher by $1.3 million, including $0.6 million of amortization of intangibles acquired from the Reliant acquisition.
General and Administrative. General and administrative expenses in the year ended December 31, 2009 was $14.7 million, an increase of $1.0 million, or 7%, compared with $13.7 million for the same period in 2008. The increase from the prior year period was due to an increase of $1.5 million in employee payroll and related expenses, and an increase of $0.9 million in professional fees primarily due to increased outside accounting, tax and legal fees; partially offset by $1.4 million in merger related expenses incurred in 2008. During the first quarter of 2008, we reached an advanced stage of negotiations with a potential acquisition target and had performed significant due diligence on the project before negotiations were terminated. The $1.0 million in outside advisory fees incurred in the first quarter of 2008 in pursuing this acquisition did not recur in 2009.
Interest and Other Income. Interest and other income consist primarily of interest income generated from our cash, cash equivalents and marketable investments. Interest and other income decreased $1.9 million, or 80%, from $2.3 million for the year ended December 31, 2008 to $0.5 million for the same period in 2009, due to lower average cash and investment balances following our use of cash in the Reliant acquisition.
61
Table of Contents
Interest and Other Expense. Interest and other expense consist primarily of interest expense resulting from borrowings on the margin account, line of credit and term loan during 2009, none of which existed in 2008. Interest and other expenses were $394,000 and $15,000 in the years ended December 31, 2009 and 2008, respectively.
Gain (Loss) on Investments. During the year ended December 31, 2009, we realized $0.2 million in gains on investments that had either been sold or matured in our portfolio during the 2009. During 2008, we deemed certain declines in the fair market value of our “available-for-sale” marketable securities to be other than temporary and as a result, recorded a $1.1 million loss in the year ended December 31, 2008. Of the $1.1 million loss recorded during the year, approximately $0.9 million was related to a single security in our investment portfolio.
Provision (benefit) for Income Taxes. There was an income tax provision of $14,000 and a tax benefit of $99,000 for the years ended December 31, 2008 and 2009, respectively. The provision for income taxes for the year ended December 31, 2008 primarily represented additions to AMT taxes and additions to reserves for uncertain tax positions, while the benefit for income taxes for the year ended December 31, 2009 primarily represented refunds of income taxes, partially offset by additions to reserves for uncertain tax positions. We did not recognize any tax benefits in relation to the loss before income taxes for the year ended December 31, 2009 as we maintained a full valuation allowance for deferred taxes.
Stock-Based Compensation
For the years ended December 31, 2010 and 2009 and 2008, employee and non-employee stock-based compensation expense were allocated as follows (in thousands):
| Years Ended December 31, | ||||||||||||
| 2010 | 2009 | 2008 | ||||||||||
| Cost of revenue |
$ | 270 | $ | 241 | $ | 190 | ||||||
| Sales and marketing |
741 | 1,244 | 1,449 | |||||||||
| Research and development |
303 | 273 | 385 | |||||||||
| General and administrative |
1,188 | 1,486 | 1,655 | |||||||||
| Total stock-based compensation expense |
$ | 2,502 | $ | 3,244 | $ | 3,679 | ||||||
At December 31, 2010, the total compensation cost related to stock-based awards granted or modified to employees and directors but not yet recognized was approximately $3.4 million, net of estimated forfeitures. We will amortize this cost on a straight-line basis over the remaining weighted average period of approximately 4.2 years.
Stock-based compensation expense related to stock options granted to non-employees is recognized on a straight-line basis. The options generally vest ratably over four years. The values attributable to these options are amortized over the service period and the unvested portion of these options is remeasured as the services are provided and the options are earned. The stock-based compensation expense will fluctuate as the deemed fair value of the common stock fluctuates. In connection with the grant of stock options to non-employees, we recorded stock-based compensation expense of $98,000, $1,000 and $6,000 for the years ended December 31, 2010 and 2009 and 2008, respectively.
62
Table of Contents
Reconciliation of GAAP to Non-GAAP Financial Measures
The following presentation includes non-GAAP measures. Our non-GAAP measures are not meant to be considered in isolation or as a substitute for comparable GAAP measures. For a detailed explanation of the adjustments made to comparable GAAP measures, the reasons why management uses these measures, the usefulness of these matters and the material limitation of these measures, see items (1) – (7) below.
| Years Ended December 31, | ||||||||||||
| (in thousands of dollars, except share and per share data) |
2010 | 2009 | 2008 | |||||||||
| GAAP Gross margin |
$ | 69,532 | $ | 58,253 | $ | 41,615 | ||||||
| GAAP gross margin as % of sales |
63 | % | 59 | % | 73 | % | ||||||
| Non-GAAP adjustments to gross margin: |
||||||||||||
| GAAP Gross margin |
$ | 69,532 | $ | 58,253 | $ | 41,615 | ||||||
| Amortization and other non-cash acquisition related charges (1) |
3,825 | 5,757 | 196 | |||||||||
| Stock-based compensation (4) |
270 | 241 | 190 | |||||||||
| Non-GAAP gross margin |
$ | 73,627 | $ | 64,251 | $ | 42,001 | ||||||
| Non-GAAP gross margin as % of sales |
66 | % | 65 | % | 74 | % | ||||||
| GAAP loss from operations |
$ | (1,871 | ) | $ | (11,583 | ) | $ | (17,610 | ) | |||
| Non-GAAP adjustments to net loss from operations: |
||||||||||||
| Acquired in-process research and development (6) |
— | — | 9,060 | |||||||||
| Amortization and other non-cash acquisition related charges (1) |
5,157 | 7,077 | 290 | |||||||||
| Severance expenses (2) |
55 | 118 | 977 | |||||||||
| Acquisition-related expenses (3) |
1,087 | — | 1,487 | |||||||||
| Stock-based compensation (4) |
2,502 | 3,244 | 3,680 | |||||||||
| Non-GAAP income (loss) from operations |
$ | 6,930 | $ | (1,144 | ) | $ | (2,116 | ) | ||||
| Depreciation expenses (5) |
2,926 | 2,708 | 1,405 | |||||||||
| Non-GAAP EBITDA |
$ | 9,856 | $ | 1,564 | $ | (711 | ) | |||||
| GAAP net loss |
$ | (2,020 | ) | $ | (11,192 | ) | $ | (16,393 | ) | |||
| Non-GAAP adjustments to net loss: |
||||||||||||
| Acquired in-process research and development (6) |
— | — | 9,060 | |||||||||
| Amortization and other non-cash acquisition related charges (1) |
5,157 | 7,077 | 290 | |||||||||
| Severance expenses (2) |
55 | 118 | 977 | |||||||||
| Acquisition-related expenses (3) |
1,087 | — | 1,487 | |||||||||
| Loss on investments (7) |
— | — | 1,088 | |||||||||
| Stock-based compensation (4) |
2,502 | 3,244 | 3,680 | |||||||||
| Non-GAAP net income (loss) |
$ | 6,781 | $ | (753 | ) | $ | 189 | |||||
| GAAP basic net loss per share |
$ | (0.03 | ) | $ | (0.23 | ) | $ | (0.67 | ) | |||
| Non-GAAP adjustments to basic loss per share: |
||||||||||||
| Acquired in-process research and development (6) |
— | — | $ | 0.37 | ||||||||
| Amortization and other non-cash acquisition related charges (1) |
$ | 0.09 | $ | 0.15 | $ | 0.01 | ||||||
| Severance expenses (2) |
$ | 0.00 | $ | 0.00 | $ | 0.04 | ||||||
| Acquisition-related expenses (3) |
$ | 0.02 | — | $ | 0.06 | |||||||
| Loss on investments (7) |
— | — | $ | 0.05 | ||||||||
| Stock-based compensation (4) |
$ | 0.04 | $ | 0.07 | $ | 0.15 | ||||||
| Non-GAAP basic net income (loss) per share |
$ | 0.12 | $ | (0.02 | ) | $ | 0.01 | |||||
| Non-GAAP diluted net income (loss) per share |
$ | 0.11 | $ | (0.02 | ) | $ | 0.01 | |||||
| GAAP weighted average shares outstanding used in calculating basic net loss per share |
58,908,611 | 47,848,258 | 24,506,673 | |||||||||
| GAAP weighted average shares outstanding used in calculating diluted net loss per share |
58,908,611 | 47,848,258 | 24,506,673 | |||||||||
| Adjustments for dilutive potential common stock |
2,056,496 | — | 1,044,290 | |||||||||
| Weighted average shares outstanding used in calculating non-GAAP diluted net income (loss) per share |
60,965,107 | 47,848,258 | 25,550,963 | |||||||||
63
Table of Contents
The Non-GAAP financial measures are non-GAAP gross margin, non-GAAP gross margin as a % of sales, non-GAAP operating income, non-GAAP adjusted EBITDA, non-GAAP net income and non-GAAP net income per share, which adjust for the following items: in-process R&D, amortization of acquired intangibles and other non-cash acquisition-related charges, severance expenses, acquisition-related expenses, loss on investments and stock-based compensation expense. We believe that the presentation of these non-GAAP financial measures is useful for investors, and as such measures are used by our management, for the reasons associated with each of the adjusting items as described below:
| (1) | Amortization and other non-cash acquisition-related charges are non-cash charges, such as amortization of acquired intangibles, that can be impacted by the timing and magnitude of our acquisitions. We consider our operating results without these charges when evaluating our ongoing performance and/or predicting our earnings trends, and therefore exclude such charges when presenting non-GAAP financial measures. We believe the assessment of our operations excluding these costs is relevant to our assessment of internal operations and comparisons to the performance of other companies in our industry. |
| (2) | Severance expenses include acquisition related severance expenses and are disregarded by our management when evaluating and predicting earnings trends because these charges are unique to specific acquisitions, and are therefore excluded by us when presenting non-GAAP financial measures. |
| (3) | Acquisition-related costs include direct costs of the acquisition and expenses related to acquisition integration activities. Examples of costs directly related to an acquisition include transaction fees, due diligence costs and certain legal costs related to acquired litigation. These expenses vary significantly in size and amount and are disregarded by our management when evaluating and predicting earnings trends because these charges are unique to specific acquisitions, and are therefore excluded by us when presenting non-GAAP financial measures. |
| (4) | Stock-based compensation expense consist of expense relating to stock-based awards issued to employees, outside directors and non employees including stock options, restricted stock units, restricted stock units with performance-based vesting and our Employee Stock Purchase Plan. Because of varying available valuation methodologies, subjective assumptions and the variety of award types, we believe that the exclusion of stock-based compensation expense allows for more accurate comparisons of our operating results to our peer companies, and for a more accurate comparison of our financial results to previous periods. In addition, we believe it is useful to investors to understand the specific impact of stock-based compensation expenses on our operating results. |
| (5) | Depreciation expense includes depreciation and amortization of leasehold improvements, furniture and fixtures, machinery and equipment, software and computers and equipment. Our management excludes this charge from operating income (loss) to compute non-GAAP earnings before income taxes, depreciation and amortization. |
| (6) | Acquired in-process research and development constitute non-cash charges that vary significantly in size and amount depending on the business combination and, therefore, are disregarded by our management when evaluating our ongoing performance and/or predicting our earnings trends. We believe it is useful to investors to understand the specific impact of these charges on our operating results. |
| (7) | Loss on investments relate to the sale and maturity of our marketable securities. These losses or gains can vary significantly in size and amount. Our management excludes these losses or gains when evaluating our ongoing performance and/or predicting our earnings trends, and therefore excludes these items when presenting non-GAAP financial measures. |
Liquidity and Capital Resources
On December 31, 2010, we had working capital of $34.0 million, which included $36.9 million of cash and cash equivalents.
In January 2010, we entered into securities purchase agreements in connection with a private placement of our securities to certain institutional and other accredited investors pursuant to which we agreed to sell and issue (i) an aggregate of 8,529,704 newly issued shares of our common stock, and (ii) warrants to purchase an
64
Table of Contents
aggregate of 4,264,852 shares of our common stock. The sale of securities resulted in aggregate gross proceeds of approximately $17.2 million. The net proceeds, after deducting offering expenses were approximately $15.8 million.
In March 2009, we entered into a Loan and Security Agreement (the “Loan Agreement”) with Silicon Valley Bank (“Lender”) for a $6.0 million secured revolving loan facility and a $3.0 million secured term loan. We drew down $3.8 million on the revolving loan facility and $3.0 million as a term loan in March 2009, and repaid the revolving loan in full in April 2009. On June 30, 2009, we entered into an amendment to the Loan Agreement which provides for an increase of the secured revolving loan facility to $8.0 million and an additional $1.0 million secured term loan. On March 31, 2010, we entered into a third amendment to the Loan Agreement which provides for an increase of the commitment under the loan facility by adding a $10.0 million secured term loan facility, amended certain financial covenants and extended the term of the existing revolving loan facility. On October 15, 2010, we entered into a fourth amendment to the Loan Agreement, which authorized us to consummate the acquisition of CLRS Technology Corporation on October 15, 2010. Borrowings under the original revolving loan facility accrue interest at prime plus 1.00% per annum, subject to a minimum of 5.00% per annum. Borrowings under the secured term loan facility accrue interest at a per annum rate equal or greater of (i) 4.44% or (ii) the three-year U.S. treasury note yield on the funding date plus 3.00. Interest on borrowings under the revolving loan facility is payable monthly. The secured term loans are payable in 33 equal monthly payments of principal and interest. The Loan Agreement contains certain financial covenants requiring us to maintain a minimum liquidity ratio and minimum EBITDA. We were in compliance with these covenants as of December 31, 2010. At December 31, 2010, $8.0 million was outstanding on the revolving loan facility and $1.6 million was outstanding on the secured term loan. We repaid all funds drawn from the revolving loan facility in January 2011.
In connection with the Loan and Security Agreement, our subsidiary, Reliant Technologies, LLC (“Reliant LLC”), entered into an Unconditional Guaranty, dated as of March 9, 2009 (the “Guaranty”), in favor of Lender, pursuant to which Reliant LLC guaranteed all of our obligations under the Loan Agreement, and a Security Agreement, dated as of March 9, 2009, with Lender, pursuant to which Reliant LLC granted a security interest in substantially all of its personal property to collateralize its obligations under the Guaranty.
In the fourth quarter of 2008, in anticipation of the acquisition of Reliant Technologies, Inc., we drew down on funds from a margin account with JP Morgan Chase, collateralized by our marketable investments. Pursuant to the terms of credit offered by JP Morgan Chase, we may borrow up to 75% of the market value of our investment account at an interest rate of the 30-day Libor rate plus 100 basis points. We had no marketable securities as of December 31, 2010, and accordingly, the margin account had a zero balance as of that date.
Our future capital requirements depend on a number of factors, including the rate of market acceptance of our current and future products, the resources we devote to developing and supporting our products, and continued progress of our research and development of new products.
We expect to increase capital expenditures consistent with our anticipated growth in manufacturing, infrastructure and personnel. We also may increase our capital expenditures as we expand our product lines or invest to address new markets.
We believe that our current cash and cash equivalent balances and cash generated from operations, along with our existing credit facilities, will meet our anticipated cash needs for working capital and capital expenditures for at least the next 12 months. Our future liquidity requirements may increase beyond currently expected levels if we fail to maintain compliance with covenants in our bank loan agreements or if unanticipated expenses or other uses of our cash arise. In order to meet our future liquidity needs, we may seek additional equity and/or debt financing. Such additional financing may not be available on a timely basis on terms acceptable to us, or at all, particularly in the short-term due to the current credit and equity market funding environments. Any future equity financing would result in dilution to our stockholders. The availability of financing or merger opportunities will depend, in part, on market conditions, and the outlook for our company.
65
Table of Contents
Contractual Obligations
The following table discloses aggregate information about our contractual obligations and the periods in which payments are due as of December 31, 2010 (in thousands):
| Payments Due by Period | ||||||||||||
| Total | Less than 1 Year | 1-3 Years | ||||||||||
| Term loans |
$ | 1,626 | $ | 1,528 | $ | 98 | ||||||
| Operating leases |
2,851 | 1,226 | 1,625 | |||||||||
| Purchase commitments |
7,699 | 7,699 | — | |||||||||
| Total contractual obligations |
$ | 12,176 | $ | 10,453 | $ | 1,723 | ||||||
Cash Flows for the Years Ended December 31, 2010, December 31, 2009 and December 31, 2008
Net Cash Provided by (Used in) Operating Activities. Net cash provided by operating activities was $10.2 million in the year ended December 31, 2010, compared to net cash of $6.8 million used in operating activities in the prior year ended December 31, 2009. Net cash used in operating activities was $1.9 million for the year ended December 31, 2008. During the year ended December 31, 2010, cash was provided by a $3.0 million decrease in inventory, primarily due to higher sales during the period and tighter management of inventory purchases, a $0.6 million decrease in accounts receivable, due to successful collection efforts at the end of the period, and $9.2 million net cash provided from net loss after adjusting for non-cash items. These were partially offset by cash used due to a $1.1 million increase in prepaid expenses and other current assets and a $1.1 million decrease in deferred revenue. During the year ended December 31, 2009, cash was used to fund an increase of $7.6 million in accounts receivable that was primarily due to increased revenue and a higher percentage of sales late in the period, a decrease of $2.5 million in accrued and other liabilities, a $1.4 million decrease in accounts payable, and a $0.7 million increase in prepaid expenses and other current assets. These were partially offset by cash used due to a decrease of $3.7 million in accrued restructuring, $2.9 million of cash provided by a decrease in inventory and $0.2 million net cash provided from net loss after adjusting for non-cash items. The decrease in inventory during 2009 was primarily due to sales during the period supplemented by tighter management of inventory purchases. During 2008, cash used for changes in assets and liabilities of $1.8 million was primarily from use of cash from a decrease in accrued and other liabilities of $5.3 million, increase in prepaid expenses and other current assets of $1.7 million and increase in inventories of $0.8 million. This use of cash was partially offset by cash provided from an increase in accrued restructuring of $3.5 million, a decrease in accounts receivable of $1.9 million and an increase in accounts payable of $0.6 million. The decrease in accrued and other liabilities was due to lower payroll and related expenses. The increase in accrued restructuring is primarily due to the termination of employees and restructuring of facilities related to the Reliant acquisition. The increase in prepaid expenses and other current assets was primarily due to an increase of prepaid income taxes and deferred tax assets and an increase in prepayment related to inventory purchases and other prepayments. The increase in inventories was primarily due to lower than anticipated sales in the fourth quarter of 2008. Lower accounts receivable balance was primarily due to a decrease in sales during the fourth quarter of 2008.
Net Cash Used in Investing Activities. Net cash used in investing activities was $3.3 million for the year ended December 31, 2010. Net cash provided by investing activities was $15.0 million and net cash used in investing activities was $13.1 million for the years ended December 31, 2009 and December 31, 2008, respectively. During 2010, net cash of $2.0 million was used for payments to acquire property and equipment and $1.2 million was used for the acquisition of Aesthera Corporation and CLRS, net of cash received. Our investing activities in 2009 consisted principally of sales and maturities related to our marketable securities of $18.0 million, partially offset by the purchases of property and equipment of $1.8 million and transaction cost payments, net of escrow settlement relating to the Reliant acquisition of $1.1 million. On December 23, 2008, we acquired Reliant Technologies, Inc. We used $25.4 million in cash to acquire the company and to pay transaction
66
Table of Contents
costs associated with the acquisition. We provided $5.0 million of debt financing to Reliant prior to the acquisition in accordance with the merger agreement, and also made net payments of $0.5 million of expenses on behalf of Reliant prior to the acquisition. Additionally, capital expenditure in 2008 was $1.6 million, an amount higher than prior years, primarily due to preparation of our facilities for the relocation of Reliant operations from their Mountain View headquarters to our Hayward facilities at the beginning of January 2009, as well as capital expenditures in IT equipment and software to facilitate the integration of the two companies. We used the proceeds from sale of marketable investments to partially fund our acquisition of Reliant.
Net Cash Provided by Financing Activities. Net cash provided by financing activities was $15.2 million for the year ended December 31, 2010. Net cash used in financing activities was $1.0 million and net cash provided by financing activities was $8.8 million for the years ended December 31, 2009 and 2008, respectively. During 2010, we completed a private placement of units consisting of our common stock and warrants to purchase our common stock which resulted in net proceeds of $15.8 million in cash and we also received $1.0 million in proceeds from exercise of stock options and participation in our Employee Stock Purchase Plan, offset by net payments of $1.4 million on our term and revolving loans and $0.1 million to settle tax obligations on behalf of our employees for the issuance of restricted stock units. During 2009, we made net borrowings of $11.1 million in term loans and under the line of credit from Silicon Valley Bank, and repaid $12.4 million on the margin account maintained with JP Morgan Chase related to our marketable investments. In addition there were proceeds from exercise of stock options and employee stock purchase of $0.4 million. In 2008, in addition to proceeds from exercise of stock options and employee stock purchase plans, cash was also provided by proceeds from a margin account collateralized by our marketable investments. We used cash to pay off several Reliant notes payable subsequent to the acquisition.
Off-Balance Sheet Arrangements
We do not have any relationships with unconsolidated entities or financial partnerships, such as entities often referred to as structured finance or special purpose entities, which would have been established for the purpose of facilitating off-balance sheet arrangements or other contractually narrow or limited purposes. In addition, we do not have any undisclosed borrowings or debt, and we have not entered into any synthetic leases. We are, therefore, not materially exposed to any financing, liquidity, market or credit risk that could arise if we engaged in such relationships.
Recent Accounting Pronouncements
In October 2009, the FASB issued Accounting Standards Update (“ASU”), 2009-13, Revenue Recognition (“Topic 605”): Multiple Deliverable Revenue Arrangements — A Consensus of the FASB Emerging Issues Task Force. This update provides application guidance on whether multiple deliverables exist, how the deliverables should be separated and how the consideration should be allocated to one or more units of accounting. This update establishes a selling price hierarchy for determining the selling price of a deliverable used to allocate revenue. The selling price used for each deliverable will be based on vendor-specific objective evidence, if available, third-party evidence if vendor-specific objective evidence is not available, or estimated selling price if neither vendor-specific or third-party evidence is available. We will be required to apply this guidance prospectively for revenue arrangements entered into or materially modified after January 1, 2011; however, earlier application is permitted. Our adoption of Topic 605 on January 1, 2011 will not have a material impact on our financial position, results of operations or cash flows.
In January 2010, the FASB issued ASU, 2010-06, Fair Value Measurement and Disclosures (“Topic 820”), which relates to the disclosure requirements for fair value measurements and provides clarification for existing disclosures requirements. More specifically, this update will require (a) an entity to disclose separately the amounts of significant transfers in and out of Levels 1 and 2 fair value measurements and to describe the reasons for the transfers; and (b) information about purchases, sales, issuances and settlements to be presented
67
Table of Contents
separately (i.e. present the activity on a gross basis rather than net) in the reconciliation for fair value measurements using significant unobservable inputs (Level 3 inputs). This guidance clarifies existing disclosure requirements for the level of disaggregation used for classes of assets and liabilities measured at fair value and requires disclosures about the valuation techniques and inputs used to measure fair value for both recurring and nonrecurring fair value measurements using Level 2 and Level 3 inputs. The new disclosures and clarifications of existing disclosure are effective for fiscal years beginning after December 15, 2009, except for the disclosure requirements related to purchases, sales, issuances and settlements in the rollforward activity of Level 3 fair value measurements. Our adoption of Topic 820 on January 1, 2010 did not have a material impact on our financial position, results of operations or cash flows.
| Item 7A. | Quantitative and Qualitative Disclosures about Market Risk |
Foreign Currency Risk
Currently, most of our sales and purchases are denominated in U.S. dollars though the amount of foreign-currency denominated revenue and expenses has been growing due to the expansion of our direct sales to end-users in foreign countries. Future fluctuations in the value of the U.S. dollar may affect the price competitiveness of our products as well as cause variability in our revenue, expenses, interest and other income (expense). We do not believe, however, that we currently have significant direct foreign currency exchange rate risk and have not hedged exposures denominated in foreign currencies.
Interest Rate Risk
Changes in interest rates will impact our interest sensitive credit agreement and accordingly may impact interest expense. We have determined that if interest rates were to instantaneously increase (decrease) by 100 basis points, there would be no material impact to interest expense over a year period.
68
Table of Contents
| Item 8. | Financial Statements and Supplementary Data |
SOLTA MEDICAL, INC.
ANNUAL REPORT ON FORM 10-K
INDEX TO CONSOLIDATED FINANCIAL STATEMENTS
| Page | ||||
| Report of Deloitte & Touche, LLP, Independent Registered Public Accounting Firm |
70 | |||
| Report of PricewaterhouseCoopers, LLP, Independent Registered Public Accounting Firm |
71 | |||
| 72 | ||||
| 73 | ||||
| 74 | ||||
| 75 | ||||
| 76 | ||||
The following Financial Statement Schedule of the Registrant for the years ended December 31, 2009, 2008 and 2007 is filed as part of this Report as required to be included in Item 8 and should be read in conjunction with the Consolidated Financial Statements of the Registrant:
| Page | ||||
| 109 | ||||
All other required schedules are omitted because of the absence of conditions under which they are required or because the required information is given in the Consolidated Financial Statements or the Notes thereto.
69
Table of Contents
REPORT OF INDEPENDENT REGISTERED PUBLIC ACCOUNTING FIRM
To the Board of Directors and Stockholders of
Solta Medical, Inc.
We have audited the accompanying consolidated balance sheets of Solta Medical, Inc. and subsidiaries (the "Company") as of December 31, 2010 and 2009, and the related consolidated statements of operations, stockholders’ equity, and cash flows for the years then ended. Our audits also included the consolidated financial statement schedule listed in the Index at Item 15(a)2. These financial statements and financial statement schedule are the responsibility of the Company's management. Our responsibility is to express an opinion on these financial statements and the financial statement schedule based on our audits.
We conducted our audits in accordance with the standards of the Public Company Accounting Oversight Board (United States). Those standards require that we plan and perform the audit to obtain reasonable assurance about whether the financial statements are free of material misstatement. The Company is not required to have, nor were we engaged to perform, an audit of its internal control over financial reporting. Our audits included consideration of internal control over financial reporting as a basis for designing audit procedures that are appropriate in the circumstances, but not for the purpose of expressing an opinion on the effectiveness of the Company's internal control over financial reporting. Accordingly, we express no such opinion. An audit also includes examining, on a test basis, evidence supporting the amounts and disclosures in the financial statements, assessing the accounting principles used and significant estimates made by management, as well as evaluating the overall financial statement presentation. We believe that our audits provide a reasonable basis for our opinion.
In our opinion, such consolidated financial statements present fairly, in all material respects, the financial position of Solta Medical, Inc. and subsidiaries as of December 31, 2010 and 2009 and the results of their operations and their cash flows for the years then ended in conformity with accounting principles generally accepted in the United States of America. Also, in our opinion, such financial statement schedule, when considered in relation to the basic consolidated financial statements taken as a whole, present fairly in all material respects the information set forth therein.
/s/ DELOITTE & TOUCHE LLP
San Francisco, California
March 16, 2011
70
Table of Contents
REPORT OF INDEPENDENT REGISTERED PUBLIC ACCOUNTING FIRM
To the Board of Directors and Stockholders of
Solta Medical, Inc.
In our opinion, the consolidated statements of operations, of stockholders' equity and of cash flows for the year ended December 31, 2008 present fairly, in all material respects, the results of operations and cash flows of Solta Medical, Inc. and its subsidiaries for the year ended December 31, 2008 in conformity with accounting principles generally accepted in the United States of America. In addition, in our opinion, the financial statement schedule for the year ended December 31, 2008 presents fairly, in all material respects, the information set forth therein when read in conjunction with the related consolidated financial statements. These financial statements and financial statement schedule are the responsibility of the Company's management. Our responsibility is to express an opinion on these financial statements and financial statement schedule based on our audit. We conducted our audit of these statements in accordance with the standards of the Public Company Accounting Oversight Board (United States). Those standards require that we plan and perform the audit to obtain reasonable assurance about whether the financial statements are free of material misstatement. An audit includes examining, on a test basis, evidence supporting the amounts and disclosures in the financial statements, assessing the accounting principles used and significant estimates made by management, and evaluating the overall financial statement presentation. We believe that our audit provides a reasonable basis for our opinion.
/s/ PricewaterhouseCoopers LLP
San Jose, California
March 30, 2009
71
Table of Contents
CONSOLIDATED BALANCE SHEETS
| December 31, | ||||||||
| (in thousands of dollars, except share and per share data) |
2010 | 2009 | ||||||
| ASSETS | ||||||||
| Current assets: |
||||||||
| Cash and cash equivalents |
$ | 36,898 | $ | 14,744 | ||||
| Accounts receivable, net of allowance for doubtful accounts in 2010 and 2009 of $394 and $397, respectively |
12,426 | 12,381 | ||||||
| Inventories |
10,549 | 14,117 | ||||||
| Prepaid expenses and other current assets |
5,906 | 4,748 | ||||||
| Total current assets |
65,779 | 45,990 | ||||||
| Property and equipment, net |
6,227 | 5,613 | ||||||
| Purchased intangible assets, net |
36,809 | 36,799 | ||||||
| Goodwill |
49,481 | 47,289 | ||||||
| Other assets |
249 | 458 | ||||||
| Total assets |
$ | 158,545 | $ | 136,149 | ||||
| LIABILITIES AND STOCKHOLDERS’ EQUITY | ||||||||
| Liabilities: |
||||||||
| Accounts payable |
$ | 6,358 | $ | 6,065 | ||||
| Accrued liabilities |
12,030 | 10,961 | ||||||
| Accrued restructuring |
— | 7 | ||||||
| Current portion of deferred revenue |
3,428 | 4,534 | ||||||
| Short-term borrowings |
9,528 | 9,432 | ||||||
| Customer deposits |
441 | 529 | ||||||
| Total current liabilities |
31,785 | 31,528 | ||||||
| Deferred revenue, net of current portion |
969 | 612 | ||||||
| Term loan, net of current portion |
98 | 1,626 | ||||||
| Non-current tax liabilities |
3,372 | 1,862 | ||||||
| Other liabilities |
177 | 284 | ||||||
| Total liabilities |
36,401 | 35,912 | ||||||
| Commitments and contingencies (Note 7) |
||||||||
| Stockholders’ equity: |
||||||||
| Preferred stock, $0.001 par value: |
||||||||
| Authorized: 10,000,000 shares at December 31, 2010 and 2009 |
||||||||
| Issued and outstanding: none at December 31, 2010 and 2009 |
— | — | ||||||
| Common stock, $0.001 par value: |
||||||||
| Authorized: 100,000,000 shares at December 31, 2010 and 2009 |
||||||||
| Issued and outstanding: 59,728,410 and 48,077,028 shares at December 31, 2010 and 2009, respectively |
60 | 48 | ||||||
| Additional paid-in capital |
193,198 | 169,283 | ||||||
| Deferred stock-based compensation |
— | — | ||||||
| Accumulated deficit |
(71,114 | ) | (69,094 | ) | ||||
| Total stockholders’ equity |
122,144 | 100,237 | ||||||
| Total liabilities and stockholders’ equity |
$ | 158,545 | $ | 136,149 | ||||
The accompanying notes are an integral part of these consolidated financial statements.
72
Table of Contents
CONSOLIDATED STATEMENTS OF OPERATIONS
| Years Ended December 31, | ||||||||||||
| (in thousands of dollars, except share and per share data) |
2010 | 2009 | 2008 | |||||||||
| Net revenue |
$ | 110,932 | $ | 98,818 | $ | 56,681 | ||||||
| Cost of revenue |
41,400 | 40,565 | 15,066 | |||||||||
| Gross margin |
69,532 | 58,253 | 41,615 | |||||||||
| Operating expenses |
||||||||||||
| Sales and marketing |
42,665 | 38,931 | 27,001 | |||||||||
| Research and development |
16,324 | 16,246 | 9,502 | |||||||||
| General and administrative |
14,627 | 14,659 | 13,662 | |||||||||
| Acquired in-process research and development |
— | — | 9,060 | |||||||||
| Litigation settlement gain |
(2,213 | ) | — | — | ||||||||
| Total operating expenses |
71,403 | 69,836 | 59,225 | |||||||||
| Loss from operations |
(1,871 | ) | (11,583 | ) | (17,610 | ) | ||||||
| Interest and other income |
371 | 462 | 2,334 | |||||||||
| Interest and other expenses |
(298 | ) | (394 | ) | (15 | ) | ||||||
| Gain (loss) on investments |
— | 224 | (1,088 | ) | ||||||||
| Loss before income taxes |
(1,798 | ) | (11,291 | ) | (16,379 | ) | ||||||
| Provision (benefit) for income taxes |
222 | (99 | ) | 14 | ||||||||
| Net loss |
$ | (2,020 | ) | $ | (11,192 | ) | $ | (16,393 | ) | |||
| Net loss per share — basic and diluted |
$ | (0.03 | ) | $ | (0.23 | ) | $ | (0.67 | ) | |||
| Weighted average shares outstanding used in calculating net loss per common share: |
||||||||||||
| Basic and diluted |
58,908,611 | 47,848,258 | 24,506,673 | |||||||||
The accompanying notes are an integral part of these consolidated financial statements.
73
Table of Contents
CONSOLIDATED STATEMENTS OF STOCKHOLDERS’ EQUITY
| Common Stock | Additional Paid-In Capital |
Deferred Stock-Based Compensation |
Notes Receivable from Stockholders |
Accumulated Deficit |
Accumulated Other Comprehensive Income (Loss) |
Total Stockholders' Equity |
||||||||||||||||||||||||||
| (in thousands of dollars, except share amounts) |
Shares | Amount | ||||||||||||||||||||||||||||||
| Balances, December 31, 2007 |
23,605,415 | $ | 24 | $ | 99,588 | $ | (4 | ) | — | $ | (41,509 | ) | $ | 19 | $ | 58,118 | ||||||||||||||||
| Issuance of common stock for Reliant acquisition, net of issuance costs |
23,599,762 | 24 | 61,383 | — | — | — | — | 61,407 | ||||||||||||||||||||||||
| Assumption of warrants upon Reliant acquisition |
— | — | 181 | — | — | — | — | 181 | ||||||||||||||||||||||||
| Exercise of stock options |
391,551 | — | 536 | — | — | — | — | 536 | ||||||||||||||||||||||||
| Amortization of deferred stock-based employee compensation |
— | — | — | 2 | — | — | — | 2 | ||||||||||||||||||||||||
| Issuance of common stock in settlement of restricted stock units, |
5,005 | — | — | — | — | — | — | — | ||||||||||||||||||||||||
| Issuance of common stock under employee stock purchase plan |
157,090 | — | 323 | — | — | — | — | 323 | ||||||||||||||||||||||||
| Employee stock-based compensation expense, net of estimated forfeitures |
— | — | 3,663 | — | — | — | — | 3,663 | ||||||||||||||||||||||||
| Nonemployee stock compensation expense |
— | — | 6 | — | — | — | — | 6 | ||||||||||||||||||||||||
| Components of comprehensive loss: |
||||||||||||||||||||||||||||||||
| Net loss |
— | — | — | — | — | (16,393 | ) | — | (16,393 | ) | ||||||||||||||||||||||
| Other comprehensive loss |
— | — | — | — | — | — | (19 | ) | (19 | ) | ||||||||||||||||||||||
| Total comprehensive loss |
(16,412 | ) | ||||||||||||||||||||||||||||||
| Balances, December 31, 2008 |
47,758,823 | 48 | 165,680 | (2 | ) | — | (57,902 | ) | — | 107,824 | ||||||||||||||||||||||
| Exercise of stock options |
78,497 | — | 115 | — | — | — | — | 115 | ||||||||||||||||||||||||
| Amortization of deferred stock-based employee compensation |
— | — | — | 2 | — | — | — | 2 | ||||||||||||||||||||||||
| Issuance of common stock under employee stock purchase plan |
239,708 | — | 246 | — | — | — | — | 246 | ||||||||||||||||||||||||
| Employee stock-based compensation expense, net of estimated forfeitures |
— | — | 3,241 | — | — | — | — | 3,241 | ||||||||||||||||||||||||
| Nonemployee stock compensation expense |
— | — | 1 | — | — | — | — | 1 | ||||||||||||||||||||||||
| Net loss |
— | — | — | — | — | (11,192 | ) | — | (11,192 | ) | ||||||||||||||||||||||
| Balances, December 31, 2009 |
48,077,028 | 48 | 169,283 | — | — | (69,094 | ) | — | 100,237 | |||||||||||||||||||||||
| Issuance of common stock for Aesthera acquisition, net of issuance costs |
2,435,897 | 2 | 4,748 | — | — | — | — | 4,750 | ||||||||||||||||||||||||
| Issuance of common stock in private placement, net of issuance costs |
8,529,704 | 9 | 12,096 | — | — | — | — | 12,105 | ||||||||||||||||||||||||
| Fair value of warrants issued in private placement, net of issuance costs |
— | — | 3,690 | — | — | — | — | 3,690 | ||||||||||||||||||||||||
| Exercise of stock options |
349,653 | 1 | 580 | — | — | — | — | 581 | ||||||||||||||||||||||||
| Issuance of common stock in settlement of restricted stock units, |
108,611 | — | — | — | — | — | — | — | ||||||||||||||||||||||||
| Issuance of common stock under employee stock purchase plan |
227,517 | — | 437 | — | — | — | — | 437 | ||||||||||||||||||||||||
| Employee stock-based compensation expense, net of estimated forfeitures |
— | — | 2,264 | — | — | — | — | 2,264 | ||||||||||||||||||||||||
| Nonemployee stock compensation expense |
— | — | 98 | — | — | — | — | 98 | ||||||||||||||||||||||||
| Tax benefit from exercise of stock options |
— | — | 2 | — | — | — | — | 2 | ||||||||||||||||||||||||
| Net loss |
— | — | — | — | — | (2,020 | ) | — | (2,020 | ) | ||||||||||||||||||||||
| Balances, December 31, 2010 |
59,728,410 | $ | 60 | $ | 193,198 | $ | — | $ | — | $ | (71,114 | ) | $ | — | $ | 122,144 | ||||||||||||||||
The accompanying notes are an integral part of these consolidated financial statements.
74
Table of Contents
CONSOLIDATED STATEMENTS OF CASH FLOWS
| Years Ended December 31, | ||||||||||||
| (in thousands of dollars) |
2010 | 2009 | 2008 | |||||||||
| Cash flows from operating activities |
||||||||||||
| Net income (loss) |
$ | (2,020 | ) | $ | (11,192 | ) | $ | (16,393 | ) | |||
| Adjustments to reconcile net loss to net cash provided by (used in) operating activities: |
||||||||||||
| Depreciation and amortization |
7,717 | 6,909 | 1,496 | |||||||||
| Amortization of premium on marketable investments |
— | 106 | 275 | |||||||||
| Realized loss (gain) on marketable securities |
— | (224 | ) | 1,088 | ||||||||
| Write-off of acquired in-process research and development |
— | — | 9,060 | |||||||||
| Loss on disposal of property, plant and equipment |
137 | 57 | 376 | |||||||||
| Stock-based compensation |
2,502 | 3,244 | 3,679 | |||||||||
| Tax expense from stock option exercises |
2 | — | — | |||||||||
| Provision for doubtful accounts |
110 | 362 | 135 | |||||||||
| Provision for excess and obsolete inventory |
737 | 961 | 233 | |||||||||
| Change in assets and liabilities: |
||||||||||||
| Accounts receivable |
600 | (7,624 | ) | 1,904 | ||||||||
| Inventories |
3,045 | 2,852 | (789 | ) | ||||||||
| Prepaid expenses and other current assets |
(1,072 | ) | (703 | ) | (1,717 | ) | ||||||
| Other assets |
244 | (211 | ) | 10 | ||||||||
| Accounts payable |
(118 | ) | (1,432 | ) | 587 | |||||||
| Accrued and other liabilities |
(486 | ) | 2,476 | (5,293 | ) | |||||||
| Accrued restructuring |
(7 | ) | (3,691 | ) | 3,549 | |||||||
| Deferred revenue |
(1,051 | ) | 800 | (80 | ) | |||||||
| Customer deposits |
(88 | ) | 241 | (24 | ) | |||||||
| Deferred rent |
(50 | ) | 224 | 53 | ||||||||
| Net cash provided by (used in) operating activities |
10,202 | (6,845 | ) | (1,851 | ) | |||||||
| Cash flows from investing activities |
||||||||||||
| Acquisition of property and equipment |
(2,018 | ) | (1,832 | ) | (1,582 | ) | ||||||
| Payments for acquisitions, net of cash acquired and escrow settlement |
(1,243 | ) | (1,139 | ) | (25,388 | ) | ||||||
| Pre-acquisition debt financing provided to Reliant |
— | — | (5,000 | ) | ||||||||
| Pre-acquisition payment of expenses on behalf of Reliant, net |
— | — | (548 | ) | ||||||||
| Purchase of marketable investments |
— | — | (8,567 | ) | ||||||||
| Proceeds from sale of marketable investments |
— | 17,990 | 28,022 | |||||||||
| Net cash provided by (used in) investing activities |
(3,261 | ) | 15,019 | (13,063 | ) | |||||||
| Cash flows from financing activities |
||||||||||||
| Repayment of equipment leases |
(29 | ) | (6 | ) | (1 | ) | ||||||
| Repayment of loan agreement borrowings |
(33,431 | ) | (15,917 | ) | (4,437 | ) | ||||||
| Repayment of short-term margin account borrowings |
— | (12,399 | ) | (2,201 | ) | |||||||
| Proceeds from exercise of stock options |
581 | 115 | 536 | |||||||||
| Proceeds from employee stock purchase plan |
437 | 246 | 323 | |||||||||
| Proceeds from loan agreement borrowings |
32,000 | 26,975 | 14,600 | |||||||||
| Proceeds from equity financing |
17,230 | — | — | |||||||||
| Payment of equity financing issuance costs |
(1,435 | ) | — | — | ||||||||
| Cash settlement of vested restricted stock units |
(140 | ) | — | — | ||||||||
| Net cash provided (used) by financing activities |
15,213 | (986 | ) | 8,820 | ||||||||
| Net increase (decrease) in cash and cash equivalents |
22,154 | 7,188 | (6,094 | ) | ||||||||
| Cash and cash equivalents at beginning of year |
14,744 | 7,556 | 13,650 | |||||||||
| Cash and cash equivalents at end of year |
$ | 36,898 | $ | 14,744 | $ | 7,556 | ||||||
| Supplemental disclosure of cash flow information |
||||||||||||
| Cash paid for interest |
$ | 191 | $ | 294 | $ | 15 | ||||||
| Cash paid for taxes |
140 | 277 | 87 | |||||||||
| Supplemental disclosure of non-cash investing and financing activities |
||||||||||||
| Issuance of common stock for acquisition |
4,750 | — | 61,407 | |||||||||
| Issuance of warrants in connection with equity financing |
3,690 | — | — | |||||||||
| Assumption of warrants to purchase common stock upon acquisition |
— | — | 181 | |||||||||
| Interest on note receivable |
— | — | 335 | |||||||||
| Accounts payable and accrued liabilities related to property and equipment purchases |
179 | 109 | 584 | |||||||||
| Contingent consideration accrued in connection with CLRS acquisition |
878 | — | — | |||||||||
| Issuance of common stock for vested restricted stock units |
359 | — | — | |||||||||
The accompanying notes are an integral part of these consolidated financial statements.
75
Table of Contents
NOTES TO CONSOLIDATED FINANCIAL STATEMENTS
(In thousands of dollars, except share and per share amounts)
NOTE 1 — THE COMPANY
Background
Solta Medical, Inc. (the “Company”) develops, manufactures, and markets aesthetic energy devices to address a range of skin issues brought on by the effects of aging, environmental factors or hormonal changes. The Company was incorporated in California on January 11, 1996 as Thermage, Inc. and reincorporated in Delaware on September 10, 2001. The Company commercially launched its first products in October 2002. Following the acquisition of Reliant Technologies, Inc. on December 23, 2008 (see note 3), the Company changed its name to Solta Medical, Inc.
NOTE 2 — SUMMARY OF SIGNIFICANT ACCOUNTING POLICIES
Principles of Consolidation
The accompanying consolidated financial statements include the accounts of the Company and its subsidiaries, which are wholly owned. All intercompany balances and transactions have been eliminated. During 2010, the Company established various international subsidiaries in several countries and the functional currency of these foreign subsidiaries is the U.S. dollar
Use of Estimates
The preparation of the accompanying financial statements in conformity with accounting principles generally accepted in the United States requires management to make certain estimates and assumptions that affect the reported amounts of assets and liabilities and disclosure of contingent assets and liabilities at the date of the financial statements and the reported amounts of revenues and expenses during the reporting period. Actual results could differ from those estimates.
Cash and Cash Equivalents and Marketable Investments
The Company considers all highly liquid investments with an original maturity of three months or less at the time of purchase to be cash equivalents.
Marketable investments are securities with maturities greater than ninety days but less than twelve months at the time of purchase. They are classified as current assets because they are available for use in the Company’s operations in the next twelve months. Marketable investments primarily consist of corporate debt securities and certificates of deposits and are classified as “available-for-sale” securities and therefore are carried at fair value.
Realized gains and losses on marketable investments are included in earnings and are determined using the specific identification method. Unrealized holding gains and losses on marketable investments classified as available-for-sale are excluded from earnings and reported in accumulated other comprehensive income, net of related tax effects, unless the unrealized holding losses are deemed to be other than temporary, in which case they are realized and included in earnings. The amortized cost of debt securities is adjusted for amortization of premium and accretion of discounts to maturity. Such amortization and accretion is included in interest income.
76
Table of Contents
Solta Medical, Inc.
NOTES TO CONSOLIDATED FINANCIAL STATEMENTS — (Continued)
(In thousands of dollars, except share and per share amounts)
Determining whether the decline in fair value of marketable investments is other than temporary requires management judgment based on the specific facts and circumstances of each investment. For investments in debt securities, these judgments primarily consider: the financial condition and liquidity of the issuer, the issuer’s credit rating, and any specific events that may cause management to believe that the debt securities will not mature and be paid in full; and the Company’s ability and intent to hold the investment to maturity.
Fair Value of Financial Instruments
Carrying amounts of the Company’s financial instruments, including cash and cash equivalents, accounts receivable, accounts payable and accrued liabilities, approximate their fair values due to their short maturities. Marketable investments are also carried at fair value. Based on the borrowing rates available to the Company for loans with similar terms, the carrying value of the borrowings approximates their fair value. The carrying amounts of other assets and liabilities approximate their fair values based upon their nature and size.
Fair value is a market-based measurement that is determined based on assumptions that market participants would use in pricing an asset or liability. A fair value hierarchy prioritizes the inputs used in measuring fair value as follows: (Level 1) observable inputs such as quoted prices in active markets; (Level 2) inputs other than the quoted prices in active markets that are observable either directly or indirectly; and (Level 3) unobservable inputs in which there is little or no market data, which requires the Company to develop its own assumptions. This hierarchy requires the Company to use observable market data, when available, and to minimize the use of unobservable inputs when determining fair value.
Concentration of Credit Risk and Other Risks and Uncertainties
Financial instruments that potentially subject the Company to concentrations of risk consist principally of cash and cash equivalents and accounts receivable. The Company’s cash and cash equivalents are primarily invested in deposits, certificates of deposit and money market accounts with two major banking institutions in the United States. Deposits in these institutions may exceed the amount of insurance provided on such deposits, if any. Management believes that these financial institutions are financially sound and, accordingly, minimal credit risk exists. The Company has not experienced any losses on its deposits of cash and cash equivalents.
Concentration of credit risk with respect to trade accounts receivable is considered to be limited due to the diversity of the Company’s customer base and geographic sales areas. The Company performs ongoing credit evaluations of its customers and maintains reserves for potential credit losses.
One customer accounted for 11% of accounts receivable as of December 31, 2010 and another customer accounted for approximately 16% of accounts receivable as of December 31, 2009. No customers accounted for more than 10% of net revenues for the years ended December 31, 2010, 2009 and 2008. The Company’s customer base is shifting toward more direct and international customers which may increase the Company’s credit risk profile.
The Company is subject to risks common to companies in the medical device industry including, but not limited to, new technological innovations, dependence on key personnel, dependence on key suppliers, protection of proprietary technology, product liability and compliance with government regulations. To achieve sustained profitable operations, the Company must successfully design, develop, manufacture and market its products. There can be no assurance that current products will continue to be accepted in the marketplace. Nor can there be
77
Table of Contents
Solta Medical, Inc.
NOTES TO CONSOLIDATED FINANCIAL STATEMENTS — (Continued)
(In thousands of dollars, except share and per share amounts)
any assurance that any future products can be developed or manufactured at an acceptable cost and with appropriate performance characteristics, or that such products will be successfully marketed, if at all. These factors could have a material adverse effect on the Company’s future financial results, financial position and cash flows.
Future products developed by the Company may require clearances from the U.S. Food and Drug Administration or other international regulatory agencies prior to commercial sales. There can be no assurance that the Company’s products will continue to meet the necessary regulatory requirements. If the Company was denied such clearances or such clearances were delayed, it may have a materially adverse impact on the Company.
Accounts Receivable
Accounts receivable are typically unsecured and derived from revenues earned from customers. The Company performs ongoing credit evaluations of its customers and maintains an allowance for doubtful accounts for estimated losses resulting from the inability of our customers to make required payments. We estimate appropriate allowances based upon any specific customer collection issues, our history of losses, economic conditions and age of customer balances. Our assessment of the ability of our customers to pay generally includes direct contact with the customer, a review of their financial status, as well as consideration of their payment history with us.
Segment Information
The Company operates in one business segment, which encompasses the developing, manufacturing and marketing of aesthetic energy devices. Management uses one measurement of profitability and does not segregate its business for internal reporting. All long-lived assets are maintained in the United States. The Chief Operating Decision Maker is the Chairman, President and Chief Executive Officer of the Company.
The following table summarizes net revenue by product:
| Years Ended December 31, | ||||||||||||
| 2010 | 2009 | 2008 | ||||||||||
| Systems |
$ | 46,364 | $ | 42,539 | $ | 13,573 | ||||||
| Tips and other consumables |
56,608 | 47,293 | 41,402 | |||||||||
| Net revenue from products |
102,972 | 89,832 | 54,975 | |||||||||
| Services and other |
7,960 | 8,986 | 1,706 | |||||||||
| Total net revenue |
$ | 110,932 | $ | 98,818 | $ | 56,681 | ||||||
The following table summarizes net revenue by geographic region (based on the ship to address on the invoice):
| Years Ended December 31, | ||||||||||||
| 2010 | 2009 | 2008 | ||||||||||
| North America |
$ | 50,307 | $ | 46,417 | $ | 29,741 | ||||||
| Asia Pacific |
34,116 | 24,680 | 13,444 | |||||||||
| Europe/Middle East |
20,727 | 23,020 | 8,026 | |||||||||
| Rest of the world |
5,782 | 4,701 | 5,470 | |||||||||
| Total net revenue |
$ | 110,932 | $ | 98,818 | $ | 56,681 | ||||||
78
Table of Contents
Solta Medical, Inc.
NOTES TO CONSOLIDATED FINANCIAL STATEMENTS — (Continued)
(In thousands of dollars, except share and per share amounts)
Inventories
Inventory is stated at the lower of cost or market, cost being determined on a standard cost basis (which approximates actual cost on a first-in, first-out basis) and market being determined as the lower of replacement cost or net realizable value. Lower of cost or market is evaluated by considering obsolescence, excessive levels of inventory, deterioration and other factors.
Property and Equipment
Property and equipment are stated at cost and depreciated on a straight-line basis over the estimated useful lives of the related assets, which is five to seven years for furniture and fixtures, three to five years for machinery and equipment, and three years for software and computers and equipment. Amortization of leasehold improvements is computed using the straight-line method over the shorter of the remaining lease term or the estimated useful life of the related assets, typically five years. Upon sale or retirement of assets, the costs and related accumulated depreciation and amortization are removed from the balance sheet and the resulting gain or loss is reflected in operations. Maintenance and repairs are charged to operations as incurred.
Goodwill
Goodwill represents the excess of the purchase price over the fair value of the net tangible and intangible assets acquired. The Company’s goodwill is not amortized but is tested for impairment on an annual basis or when events and circumstances indicate that the carrying amount of goodwill may not be recoverable. This impairment review involves a two-step process as follows:
Step 1 — The Company compares its fair value to its carrying value including goodwill. If the carrying value including goodwill exceeds its fair value, the Company moves on to step 2. If the fair value exceeds the carrying value, no further work is performed and no impairment charge is necessary. To date, the fair value of the Company has exceeded the carrying value and thus no goodwill impairment change has been recorded.
Step 2 — The Company performs an allocation of the fair value to its identifiable tangible and intangible assets (other than goodwill) and liabilities. This allows the Company to derive an implied fair value of goodwill. The Company then compares the implied fair value of goodwill to the carrying value of goodwill. If the carrying amount of goodwill is greater than the implied fair value of goodwill, an impairment change would be recognized for the excess.
No goodwill impairment was identified through December 31, 2010.
Valuation of Long-Lived Assets and Purchased Intangible Assets
The Company reviews long-lived assets, including property and equipment and finite lived intangibles, for impairment whenever events or changes in business circumstances indicate that the carrying amount of the assets may not be fully recoverable. An impairment loss would be recognized when estimated undiscounted future cash flows expected to result from the use of the asset and its eventual disposition is less than its carrying amount. Impairment, if any, is measured as the amount by which the carrying amount of a long-lived asset exceeds its fair value. Through December 31, 2010, there have been no such impairments.
Acquired intangible assets with finite lives are amortized using the straight-line method over their useful lives ranging from two to twelve years. If the acquired intangible asset is not currently generating revenue, amortization is deferred until the acquired intangible asset begins to generate revenue.
79
Table of Contents
Solta Medical, Inc.
NOTES TO CONSOLIDATED FINANCIAL STATEMENTS — (Continued)
(In thousands of dollars, except share and per share amounts)
Revenue Recognition
Product revenue is recognized when delivery has occurred, persuasive evidence of an arrangement exists, the price is fixed or determinable and collectability is reasonably assured. Delivery is deemed to have occurred when title and risks and rewards of ownership have transferred to the customer and remaining obligations are considered perfunctory. For most of the Company’s product sales, transfer of title and risks and rewards of ownership occurs when product is shipped. Revenue is recorded net of customer and distributor discounts and rebates. For sales transactions in which collectability is not reasonably assured, the Company recognizes revenue upon receipt of cash payment.
The Company’s system sales in the United States have post-sale obligations of installation and training, as applicable. These obligations are fulfilled after product shipment. When the Company has objective and reliable evidence of fair value of the undelivered elements, it defers revenue attributable to the post-shipment obligations and recognizes such revenue when the obligation is fulfilled. Otherwise, the Company will defer all revenue until all elements are delivered or objective and reliable evidence of fair value has been determined for all undelivered elements.
The Company sells to end-users in the United States and to distributors and end-users outside of the United States. Sales to end-users and distributors do not include return rights. The Company typically recognizes revenues upon shipment for sales through independent, third party distributors as the Company has no continuing obligations subsequent to shipment, other than replacement parts warranty coverage. The distributors are responsible for all marketing, sales, installation, training and warranty services for the Company’s products. Also, our distributors are responsible for obtaining regulatory clearances and approvals outside of the United States. While the regulatory approval process varies greatly by country and the Company may assist the distributor in the regulatory approval process, the responsibility belongs to the distributor. The Company does not provide price protection or stock rotation rights to any of its distributors. In addition, the Company’s distributor agreements do not allow the distributor to return or exchange products and the distributor is obligated to pay the Company for the sale regardless of whether the distributor is able to resell the product.
The Company also offers customers extended warranty service contracts. Revenue from the sale of extended service contracts is recognized on a straight-line basis over the period of the applicable extended contract. The Company also earns service revenue from customers outside of their warranty term or extended service contracts. Such service revenue is recognized as the services are provided.
In conjunction with the Reliant acquisition, the Company assumed an agreement with an external party to collaborate regarding the joint development and the worldwide commercialization of devices and accessories that incorporate Fraxel technology. Under the terms of this arrangement, the external party will make advance quarterly payments for the costs incurred in performing activities under the arrangement. As of December 31, 2010, all payments have been received on this agreement.
Warranty Obligations
The Company offers either a one or three year warranty for systems sold in the United States and a one year replacement parts warranty for systems sold to distributors outside of the United States. The Company also provides a warranty for its consumable products. The Company provides for the estimated cost to repair or replace products under warranty at the time of sale in its warranty reserves. The costs are recorded in cost of revenue.
80
Table of Contents
Solta Medical, Inc.
NOTES TO CONSOLIDATED FINANCIAL STATEMENTS — (Continued)
(In thousands of dollars, except share and per share amounts)
Shipping and Handling Costs
Shipping and handling costs charged to customers are included in net revenue and the associated expense is included in cost of revenue in the statements of operations.
Research and Development Expenditures
Costs related to research, design and development of products are charged to research and development expense as incurred.
Advertising Costs
Advertising costs are included in sales and marketing expenses and are expensed as incurred. Advertising costs were $397, $420 and $490 for the years ended December 31, 2010, 2009 and 2008, respectively.
Stock-Based Compensation
The Company recognizes stock-based compensation expense, using a fair-value based method, for costs related to all share-based payments including stock options. The Company estimates the fair value of share-based payment awards on the date of grant using an option-pricing model.
Equity instruments issued to non-employees are recorded at their fair value on the measurement date and are subject to periodic adjustment as the underlying equity instruments vest. Non-employee stock-based compensation charges are amortized over the vesting period, on a straight-line basis.
Income Taxes
Deferred tax assets and liabilities are determined based on the differences between the financial reporting and tax bases of assets and liabilities, measured at tax rates that will be in effect when the differences are expected to reverse. Valuation allowances are established when necessary to reduce deferred tax assets to the amounts expected to be realized.
Foreign Currency Translation
The functional currency of the Company’s foreign subsidiaries is the U.S. dollar. Translation adjustments resulting from remeasuring the foreign currency denominated financial statements of the subsidiaries into U.S. dollars are included in the Company’s consolidated statements of operations. Translation gains and losses have not been significant to date.
Comprehensive Income (Loss)
Comprehensive income (loss) generally represents all changes in stockholders’ equity except those resulting from investments, contributions by, or distributions to stockholders. The Company’s unrealized gain (loss) on marketable investments, net of related taxes, represents the only component of comprehensive income (loss) that is excluded from net income (loss).
81
Table of Contents
Solta Medical, Inc.
NOTES TO CONSOLIDATED FINANCIAL STATEMENTS — (Continued)
(In thousands of dollars, except share and per share amounts)
Net Loss Per Common Share
Basic net loss per share is computed by dividing the net loss for the period by the weighted average number of common shares outstanding during the period.
Diluted net loss per share attributed to common shares is computed by dividing the net loss attributable to common shares for the period by the weighted average number of common and potential common shares outstanding during the period, if the effect of each class of potential common shares is dilutive. Potential common shares include common stock subject to repurchase rights and shares of common stock issuable upon the exercise of stock options and warrants and shares of common stock issuable under the Employee Stock Purchase Plan and restricted stock units. The dilutive effect of potential common shares is reflected in diluted net loss per share by application of the treasury stock method, which includes consideration of stock-based compensation.
Diluted net loss per share is the same as basic net loss per share for all periods presented because any potential dilutive common shares were anti-dilutive. Such potentially dilutive shares are excluded from the computation of diluted nest loss per share when the effect would be to reduce net loss per share Therefore, in periods when a loss is reported, the calculation of basic and diluted loss per share results in the same value.
| Years Ended December 31, | ||||||||||||
| 2010 | 2009 | 2008 | ||||||||||
| Historical net income (loss) per share: |
||||||||||||
| Numerator: |
||||||||||||
| Net loss |
$ | (2,020 | ) | $ | (11,192 | ) | $ | (16,393 | ) | |||
| Denominator: |
||||||||||||
| Weighted-average common shares outstanding |
58,908,611 | 47,848,258 | 24,506,673 | |||||||||
| Basic and diluted net loss per share |
$ | (0.03 | ) | $ | (0.23 | ) | $ | (0.67 | ) | |||
The following outstanding options, warrants, common stock issuable under the Employee Stock Purchase Plan and restricted stock units were excluded from the computation of diluted net loss per common share for the periods presented because including them would have had an antidilutive effect:
| Years Ended December 31, | ||||||||||||
| 2010 | 2009 | 2008 | ||||||||||
| Options to purchase common stock |
7,237,334 | 6,763,252 | 5,174,124 | |||||||||
| Common stock subject to repurchase |
— | — | — | |||||||||
| Common stock warrants |
4,581,179 | 316,327 | 344,105 | |||||||||
| Restricted stock units |
807,928 | 132,108 | 170,652 | |||||||||
| Common stock issuable under Employee Stock Purchase Plan |
113,455 | — | 89,628 | |||||||||
Recent Accounting Pronouncements
In October 2009, the FASB issued Accounting Standards Update (“ASU”), 2009-13, Revenue Recognition (“Topic 605”): Multiple Deliverable Revenue Arrangements – A Consensus of the FASB Emerging Issues Task Force. This update provides application guidance on whether multiple deliverables exist, how the deliverables should be separated and how the consideration should be allocated to one or more units of accounting. This update establishes a selling price hierarchy for determining the selling price of a deliverable
82
Table of Contents
Solta Medical, Inc.
NOTES TO CONSOLIDATED FINANCIAL STATEMENTS — (Continued)
(In thousands of dollars, except share and per share amounts)
used to allocate revenue. The selling price used for each deliverable will be based on vendor-specific objective evidence, if available, third-party evidence if vendor-specific objective evidence is not available, or estimated selling price if neither vendor-specific or third-party evidence is available. We will be required to apply this guidance prospectively for revenue arrangements entered into or materially modified after January 1, 2011; however, earlier application is permitted. The Company’s adoption of Topic 605 on January 1, 2011 will not have a material impact on our financial position, results of operations or cash flows.
In January 2010, the FASB issued ASU, 2010-06, Fair Value Measurement and Disclosures (“Topic 820”), which relates to the disclosure requirements for fair value measurements and provides clarification for existing disclosures requirements. More specifically, this update will require (a) an entity to disclose separately the amounts of significant transfers in and out of Levels 1 and 2 fair value measurements and to describe the reasons for the transfers; and (b) information about purchases, sales, issuances and settlements to be presented separately (i.e. present the activity on a gross basis rather than net) in the reconciliation for fair value measurements using significant unobservable inputs (Level 3 inputs). This guidance clarifies existing disclosure requirements for the level of disaggregation used for classes of assets and liabilities measured at fair value and requires disclosures about the valuation techniques and inputs used to measure fair value for both recurring and nonrecurring fair value measurements using Level 2 and Level 3 inputs. The new disclosures and clarifications of existing disclosure are effective for fiscal years beginning after December 15, 2009, except for the disclosure requirements related to purchases, sales, issuances and settlements in the rollforward activity of Level 3 fair value measurements. The Company’s adoption of Topic 820 on January 1, 2010 did not have a material impact on our financial position, results of operations or cash flows.
NOTE 3 — ACQUISITIONS
Reliant Technologies, Inc.
On December 23, 2008, the Company acquired 100% of the common stock of Reliant Technologies, Inc. (“Reliant”), a privately held medical device company, for $25,000 in cash, 23.6 million shares of Solta Medical common stock and assumption of $9,438 of debt, including a $5,000 note payable to the Company. This acquisition expands the market presence of the Company. Complementary product offerings allow the Company to cross-sell a more complete product line to physician and their patients through one of the largest direct U.S. sales forces in the industry and an expansive international distribution network.
The Company’s consolidated financial statements include the results of operations of Reliant from the date of acquisition through December 31, 2010. The purchase price is the total of $25,000 cash paid, $61,407 for 23.6 million shares issued at the $2.60 average closing share price over the period two days before to two days after the merger announcement date, $181 fair value of assumed warrants and $4,051 in direct transaction costs. During the year ended December 31, 2009, the Company reached an agreement and received from escrow approximately $1,200 for an adjustment of the acquisition consideration from a shortfall in Reliant’s closing working capital compared to the amount stipulated in the merger.
83
Table of Contents
Solta Medical, Inc.
NOTES TO CONSOLIDATED FINANCIAL STATEMENTS — (Continued)
(In thousands of dollars, except share and per share amounts)
The original purchase price allocation adjustments primarily relate to adjustments to residual goodwill for changes in the valuation of inventory acquired, accrued restructuring, prepaid expenses, and an adjustment of the acquisition consideration for a shortfall in Reliant’s closing working capital. The following summarizes the purchase price allocation for the Reliant acquisition, adjusted through December 31, 2009:
| Cash |
$ | 1,281 | ||
| Accounts receivable |
2,349 | |||
| Inventory |
11,262 | |||
| Prepaid expenses and other assets |
789 | |||
| Property and equipment |
3,103 | |||
| Intangible assets: |
— | |||
| Fraxel trade name |
3,580 | |||
| Customer relationships |
4,810 | |||
| Non-compete agreement |
500 | |||
| Core technology |
18,420 | |||
| Product technology |
9,270 | |||
| Product development contract |
620 | |||
| Future royalties contract |
3,890 | |||
| In-process research and development |
9,060 | |||
| Goodwill |
47,289 | |||
| Total assets acquired |
116,223 | |||
| Liabilities assumed: |
||||
| Accounts payable |
6,182 | |||
| Accrued liabilities |
5,517 | |||
| Accrued restructuring |
3,116 | |||
| Other liabilities |
294 | |||
| Deferred revenue |
2,281 | |||
| Notes payable (including a $5,000 note payable owed to Thermage) |
9,438 | |||
| Total liabilities acquired |
26,828 | |||
| Net acquired assets |
$ | 89,395 | ||
The Company recorded an estimate for costs to terminate certain activities associated with the Reliant operations. The original restructuring accrual of $2,967 as of December 31, 2008 was principally related to the termination of 45 Reliant employees for $1,797 and restructuring of facilities of $1,170. As a result of payments and adjustment made during 2009 and 2010, the restructuring accrual was $0 at December 31, 2010.
The valuation of identified intangible assets acquired was based on management’s estimates, currently available information and reasonable and supportable assumptions. The allocation was based on the fair value of these assets determined using the income approach. The income approach, using a discounted cash flow model, was used to determine the estimated fair values of the acquired intangible assets. The Company calculated the present value of the expected future cash flows attributable to the acquired intangibles using an 18% to 22% discount rate. With respect to intangible assets, there are several methods available under the income approach to quantify fair value. Under this approach the Company used the following methods to determine fair value of the acquired intangibles at the acquisition date. The excess earnings method was used for the following four intangible assets: product technology, customer relationships, royalties intangible and product development contract. The relief from royalties method was used for the core technology and Fraxel trade name intangibles
84
Table of Contents
Solta Medical, Inc.
NOTES TO CONSOLIDATED FINANCIAL STATEMENTS — (Continued)
(In thousands of dollars, except share and per share amounts)
with a royalty rate of 5% and 1%, respectively. The lost profits method (also referred to as the “with and without method”) was used for the non-compete agreement with a probability of competition rate of 10%. The Company utilized third-party market data (i.e. license agreements) to derive valuation assumptions used to fair value certain intangible assets, such as the Fraxel trade name and core technology.
Of the total original purchase price of $90,639, $41,090 was allocated to amortizable intangible assets. $37,200 of the amortizable intangible assets are being amortized using a straight-line method over their respective estimated useful lives of two to 12 years. The royalties intangible asset will be amortized using a straight-line method over its estimated useful life of 10 years once royalty revenues commence. During the quarter ended September 30, 2009, the Company reached an agreement and received from escrow approximately $1,200 related to an adjustment of the acquisition consideration due to a shortfall in Reliant’s closing working capital. As a result the original purchase price was reduced to $89,395.
In conjunction with the acquisition of Reliant, the Company recorded an expense of $9,060 for acquired in-process research and development (IPR&D) during the quarter and year ended December 31, 2008 because feasibility of the acquired technology had not been established and no alternative future use exists. The IPR&D expense was included in operating expenses in the consolidated statement of operations for the year ended December 31, 2008.
The IPR&D is related to the development of three new products. The three significant IPR&D projects at date of acquisition were as follows: Project A – a next generation dual wave-length Fraxel re:store system; Project B – a body shaping product; and Project C – a resurfacing product for the professional market being developed in a collaborative partnership. At the date of acquisition, it was estimated that Project A would be completed in 2009, Project B would be completed in 2010 and Project C would be completed in 2011. Project A was completed in September 2009 and FDA clearance was received in October 2009. Project B is in clinical investigations and Project C is pending regulatory approval.
The Company used the income approach (excess earnings method) to determine the estimated fair values of the acquired IPR&D, which uses a discounted cash flow model, based on estimates of successful product development and commercialization to estimate future net cash flows resulting from projected revenues and related costs. These estimates take into account the stages of completion and the risks surrounding successful development and commercialization of the underlying product candidates. The Company calculated the present value of the expected future cash flows attributable to the in-process technology using a 21% to 23% discount rate for the related projects. The after tax cash flows are calculated by applying cost, expense, income tax and contributory asset charge assumptions to the IPR&D revenue streams.
The major risks and uncertainties associated with the timely and successful completion of these IPR&D projects includes development and technological difficulties, delays caused by legal actions brought by the Company’s competitors and the timing of the receipt of necessary regulatory approvals. No assurances can be given that the underlying assumptions used to prepare the discounted cash flow analysis will not change or the timely completion of each project to commercial success will occur. For these reasons, actual results may vary significantly from estimated results.
The Company allocated the residual value of $48,158 to goodwill at December 23, 2008, and adjusted this amount to $47,289 during the year ended December 31, 2009 for adjustments to the acquisition consideration from a shortfall in Reliant’s closing working capital and adjustments to the valuation of inventory acquired, accrued restructuring and prepaid expenses.
85
Table of Contents
Solta Medical, Inc.
NOTES TO CONSOLIDATED FINANCIAL STATEMENTS — (Continued)
(In thousands of dollars, except share and per share amounts)
Goodwill represents the excess of the purchase price over the fair value of the net tangible and intangible assets acquired. Goodwill is not amortized, but is tested for impairment on an annual basis or when events and circumstances indicate that the carrying amount of goodwill may not be recoverable. The factors that contributed to a premium in the purchase price and the resulting recognition of goodwill were:
| • | The expansion of the Company’s recurring revenue model allowing for increased treatment tip usage as well as expanding clinical applications for our physician customers. |
| • | Access to an expanded base of industry knowledge and expertise. |
| • | Opportunity to complement our existing products for the aesthetic market with a synergistic technology and new clinical treatment applications. |
| • | Expansion of our global presence thereby increasing our market penetration. |
Pro forma financial information (unaudited)
The unaudited financial information in the table below summarizes the combined results of operations of the Company and Reliant on a pro forma basis, as though the companies had been combined as of the beginning of each of the periods presented. The pro forma financial information is presented for informational purposes only and is not indicative of the results of operations that would have been achieved if the Reliant acquisition had taken place at the beginning of each of the periods presented.
The pro forma financial information for all periods presented includes the business combination accounting effect on the amortization charges from acquired intangible assets, adjustments to certain acquired assets and liabilities and acquisition costs reflected in the Company’s and Reliant’s historical statements of income for periods prior to the acquisition, and the related tax effects.
The unaudited pro forma financial information for the year ended December 31, 2008 combines the historical results for the Company for that year, with the historical results for Reliant as a separate entity, for the year ended December 31, 2008.
| Year ended December 31, 2008 |
||||
| Net revenue |
$ | 127,761 | ||
| Net loss |
$ | (24,142 | ) | |
| Net loss per share — basic |
$ | (0.99 | ) | |
| Net loss per share — diluted |
$ | (0.99 | ) | |
Aesthera Corporation
On February 26, 2010, the Company acquired 100% of the common stock of Aesthera Corporation (“Aesthera”), a privately held company for consideration including $501 in cash and $4,750 of shares of the Company’s common stock. The number of shares of the Company’s common stock issued of 2,435,897 was determined based on the volume-weighted average closing market price of $1.95 per share of the Company’s common stock during the five trading days preceding the acquisition date.
86
Table of Contents
Solta Medical, Inc.
NOTES TO CONSOLIDATED FINANCIAL STATEMENTS — (Continued)
(In thousands of dollars, except share and per share amounts)
In connection with this transaction, the Company entered into a contingent consideration arrangement which potentially required payments ranging from $0 to $10,750 in shares of the Company’s common stock if certain revenue milestones are achieved related to the sale of Aesthera products and if certain acquired Aesthera receivables are collected. The fair value of the contingent consideration recognized on the acquisition date of $280 was estimated by applying a probability weighted discounted cash-flow approach. Key assumptions include (i) a discount rate of 4.05% percent and (ii) probability of milestone achievement ranging from 0%-50%.
As of December 31, 2010 the fair value of the contingent consideration has been reduced to $0 to reflect the Company’s updated assessment of the probabilities assigned to achieving the revenue milestones and accordingly a $280 gain was recognized in general and administrative expense in the Company’s condensed consolidated statement of operations during the year ended December 31, 2010, respectively.
As a result of the acquisition, the Company has expanded its product offerings by providing treatment of acne to its customers through the Company’s direct sales and distribution network worldwide.
The Company’s condensed consolidated financial statements include the results of operations of Aesthera from the date of acquisition through December 31, 2010.
The following summarizes the preliminary purchase price allocation of the Aesthera acquisition:
| Cash |
$ | 269 | ||
| Accounts receivable |
791 | |||
| Inventory |
1,613 | |||
| Prepaid expenses and other assets |
85 | |||
| Property and equipment |
108 | |||
| Intangible assets: |
||||
| Isolaz trade name |
300 | |||
| Customer relationships |
1,300 | |||
| Core technology |
2,100 | |||
| Goodwill |
1,421 | |||
| Other long term assets |
35 | |||
| Total assets acquired |
8,022 | |||
| Liabilities assumed: |
||||
| Accounts payable |
422 | |||
| Accrued liabilities |
1,525 | |||
| Deferred revenue |
302 | |||
| Other liabilities |
242 | |||
| Total liabilities acquired |
2,491 | |||
| Net acquired assets |
$ | 5,531 | ||
Of the total original purchase price of $5,531, $3,700 was allocated to amortizable intangible assets, which are being amortized using a straight-line method over their respective estimated useful lives of five to six years. The valuation of identified intangible assets acquired was based on management’s estimates, currently available information and reasonable and supportable assumptions. The allocation was based on the fair value of these assets determined using the income approach. The income approach uses a discounted cash flow model. The Company calculated the present value of the expected future cash flows attributable to the acquired intangibles using an 18% to 19% discount rate. With respect to intangible assets, there are several methods
87
Table of Contents
Solta Medical, Inc.
NOTES TO CONSOLIDATED FINANCIAL STATEMENTS — (Continued)
(In thousands of dollars, except share and per share amounts)
available under the income approach to quantify fair value. The Company used the following methods to quantify fair value of the acquired intangibles at the acquisition date. The excess earnings method was used for product technology and customer relationships. The relief from royalties method was used for the trade name intangibles with a royalty rate of 1%.
The Company allocated the residual value of $1,421 to goodwill. Goodwill arising from the acquisition is attributable to the workforce of the acquired business and the significant synergies expected to arise. Goodwill is not expected to be deductible for tax purposes.
For the period from February 26 to December 31, 2010, revenue from the sales of Aesthera products was $4,973. Net income associated with Aesthera products and operations cannot be determined given the integration of Aesthera operations within the Company.
Reliable information to provide pro forma financial disclosure on the Aesthera acquisition is currently unavailable and impracticable to prepare at this time. Therefore, such pro forma financial information has not been included herein.
CLRS Technology Corporation
On October 15, 2010, the Company acquired 100% of the common stock of CLRS Technology Corporation (“CLRS”), a privately held company for consideration consisting of the payment of approximately $1,021 of debt at the closing of the acquisition.
In connection with this transaction, the Company entered into a contingent consideration arrangement which may require additional payments if certain milestones related to revenue related from the sale of CLRS products and operating income of CLRS are achieved during 2011. The fair value of the contingent consideration recognized on the acquisition date of $878 was estimated by applying a probability weighted discounted cash-flow approach. Key assumptions include (i) discount rate of 2.1% and 25.6% percent and (ii) probability of milestone achievement ranging from 0%-10%. As of December 31, 2010 the fair value of the contingent consideration had not changed.
As a result of the acquisition, the Company has expanded its product offerings by providing a consumer based treatment of acne to its customers through several retail channels.
The Company’s condensed consolidated financial statements include the results of operations of CLRS from the date of acquisition through December 31, 2010.
88
Table of Contents
Solta Medical, Inc.
NOTES TO CONSOLIDATED FINANCIAL STATEMENTS — (Continued)
(In thousands of dollars, except share and per share amounts)
The following summarizes the preliminary purchase price allocation of the CLRS acquisition:
| Cash |
$ | 10 | ||
| Inventory |
50 | |||
| Property and equipment |
32 | |||
| Intangible assets: |
||||
| CLARO trade name |
100 | |||
| Customer relationships |
200 | |||
| Core/Developed Technology |
800 | |||
| Goodwill |
774 | |||
| Total assets acquired |
1,966 | |||
| Liabilities assumed: |
||||
| Accounts payable |
3 | |||
| Accrued liabilities |
64 | |||
| Total liabilities acquired |
67 | |||
| Net acquired assets |
$ | 1,899 | ||
Of the total original purchase price of $1,899, $1,100 was allocated to amortizable intangible assets, which are being amortized using a straight-line method over their respective estimated useful lives of four to six years. The valuation of identified intangible assets acquired was based on management’s estimates, currently available information and reasonable and supportable assumptions. The allocation was based on the fair value of these assets determined using the income approach and the cost method approach. The income approach uses a discounted cash flow model. The Company calculated the present value of the expected future cash flows attributable to the acquired intangibles using a 25.6% discount rate. With respect to intangible assets, there are several methods available under the income approach to quantify fair value. The Company used the following methods to quantify fair value of the acquired intangibles at the acquisition date. The excess earnings method was used for customer relationships and the relief from royalties method was used for the trade name intangibles with a royalty rate of 0.3%. The Company used the cost method approach to quantify the fair value of the product technology intangible, by using cumulative inflation rates ranging from 0% to 5.5%.
The Company allocated the residual value of $774 to goodwill. Goodwill arising from the acquisition is attributable to the workforce of the acquired business and the significant synergies expected to arise. Goodwill is not expected to be deductible for tax purposes.
For the period from October 15, 2010 to December 31, 2010, revenue from the sales of CLRS products was $15. Net income associated with CLRS products and operations cannot be determined given the integration of CLRS operations within the Company.
Reliable information to provide pro forma financial disclosure on the CLRS acquisition is currently unavailable and impracticable to prepare at this time. Therefore, such pro forma financial information has not been included herein.
During the year ended December 31, 2010, the Company incurred an aggregate $1,087 in acquisition-related costs related to the acquisitions of Aesthera and CLRS. These expenses are included in general and administrative expenses in the Company’s condensed consolidated statement of operations for the twelve months ended December 31, 2010.
89
Table of Contents
Solta Medical, Inc.
NOTES TO CONSOLIDATED FINANCIAL STATEMENTS — (Continued)
(In thousands of dollars, except share and per share amounts)
NOTE 4 — BALANCE SHEET DETAIL
Cash and Cash Equivalents
On a recurring basis, the Company measures its cash equivalents at fair value. Fair value is a market-based measurement that is determined based on assumptions that market participants would use in pricing an asset or liability. A fair value hierarchy prioritizes the inputs used in measuring fair value as follows: (Level 1) observable inputs such as quoted prices in active markets; (Level 2) inputs other than the quoted prices in active markets that are observable either directly or indirectly; and (Level 3) unobservable inputs in which there is little or no market data, which requires the Company to develop its own assumptions. This hierarchy requires the Company to use observable market data, when available, and to minimize the use of unobservable inputs when determining fair value.
The Company’s cash equivalents are classified within Level 1 of the fair value hierarchy because they are valued using quoted market prices for identical assets that the Company has the ability to assess at the measurement date. The Company’s cash equivalents, which are money market funds that mature in three months or less, are classified as such at December 31, 2010 and December 31, 2009.
Inventories, Net
Inventories, net consist of the following:
| December 31, | ||||||||
| 2010 | 2009 | |||||||
| Raw materials |
$ | 4,458 | $ | 4,705 | ||||
| Work-in-process |
494 | 556 | ||||||
| Finished goods |
5,597 | 8,856 | ||||||
| $ | 10,549 | $ | 14,117 | |||||
Property and Equipment, Net
Property and equipment, net consists of the following:
| December 31, | ||||||||
| 2010 | 2009 | |||||||
| Leasehold improvements |
$ | 2,984 | $ | 2,908 | ||||
| Furniture and fixtures |
1,371 | 1,258 | ||||||
| Machinery and equipment |
9,501 | 6,689 | ||||||
| Software |
1,789 | 1,516 | ||||||
| Computers and equipment |
1,727 | 2,304 | ||||||
| 17,372 | 14,675 | |||||||
| Less: Accumulated depreciation and amortization |
(11,145 | ) | (9,062 | ) | ||||
| $ | 6,227 | $ | 5,613 | |||||
Depreciation and amortization expense related to property and equipment was $2,926, $2,708 and $1,405 for the years ended December 31, 2010, 2009 and 2008, respectively.
90
Table of Contents
Solta Medical, Inc.
NOTES TO CONSOLIDATED FINANCIAL STATEMENTS — (Continued)
(In thousands of dollars, except share and per share amounts)
Intangible Assets
The Company’s intangible assets were acquired in connection with the acquisition of Reliant Technologies, Inc. on December 23, 2008, Aesthera Corporation on February 26, 2010 and CLRS Technology Corporation on October 15, 2010. The carrying amount and accumulated amortization expense of the acquired intangible assets at December 31, 2010 and 2009 were as follows:
| December 31, 2010 |
Estimated Useful Life |
Gross Carrying Value |
Accumulated Amortization |
Net Carrying Value |
||||||||||||
| Intangible assets amortized to cost of revenue: |
||||||||||||||||
| Core technology |
6 -12 years | $ | 21,320 | ($ | 3,423 | ) | $ | 17,897 | ||||||||
| Product technology |
7 years | 9,270 | (2,678 | ) | 6,592 | |||||||||||
| Future royalties contract |
10 years | 3,890 | — | 3,890 | ||||||||||||
| 34,480 | (6,101 | ) | 28,379 | |||||||||||||
| Intangible assets amortized to operating expenses: |
||||||||||||||||
| Product development contract |
1.9 years | 620 | (669 | ) | — | |||||||||||
| Non-compete agreement |
2 years | 500 | (505 | ) | — | |||||||||||
| Trade name |
6 -10 years | 3,980 | (769 | ) | 3,211 | |||||||||||
| Customer relationships |
4 -12 years | 6,310 | (1,091 | ) | 5,219 | |||||||||||
| 11,410 | (3,034 | ) | 8,430 | |||||||||||||
| Total intangible assets |
$ | 45,890 | ($ | 9,135 | ) | $ | 36,809 | |||||||||
| December 31, 2009 |
Estimated Useful Life |
Gross Carrying Value |
Accumulated Amortization |
Net Carrying Value |
||||||||||||
| Intangible assets amortized to cost of revenue: |
||||||||||||||||
| Core technology |
12 years | $ | 18,420 | ($ | 1,569 | ) | $ | 16,851 | ||||||||
| Product technology |
7 years | 9,270 | (1,353 | ) | 7,917 | |||||||||||
| Future royalties contract |
10 years | 3,890 | — | 3,890 | ||||||||||||
| 31,580 | (2,922 | ) | 28,658 | |||||||||||||
| Intangible assets amortized to operating expenses: |
||||||||||||||||
| Product development contract |
1.9 years | 620 | (338 | ) | 282 | |||||||||||
| Non-compete agreement |
2 years | 500 | (255 | ) | 245 | |||||||||||
| Fraxel trade name |
10 years | 3,580 | (366 | ) | 3,214 | |||||||||||
| Customer relationships |
12 years | 4,810 | (410 | ) | 4,400 | |||||||||||
| 9,510 | (1,369 | ) | 8,141 | |||||||||||||
| Total intangible assets |
$ | 41,090 | ($ | 4,291 | ) | $ | 36,799 | |||||||||
The Company has included amortization of acquired intangible assets directly attributable to revenue-generating activities in cost of revenue. The Company has included amortization of acquired intangible assets not directly related to revenue-generating activities in operating expenses. During the years ended December 31, 2010 and 2009, the Company recorded amortization expense in the amount of $3,179 and $2,860 to cost of revenue and $1,612 and $1,340 to operating expenses, respectively.
The Company has recorded an acquired intangible asset related to a future royalties contract that has not yet begun to generate revenue. The Company has deferred the amortization of the acquired intangible asset related to the future royalties contract until the asset begins to generate revenue.
91
Table of Contents
Solta Medical, Inc.
NOTES TO CONSOLIDATED FINANCIAL STATEMENTS — (Continued)
(In thousands of dollars, except share and per share amounts)
As of December 31, 2010, the total expected future amortization related to intangible assets, is as follows:
| Amortization included in Cost of Revenue |
Amortization included in Operating Expense |
Total Amortization Expense |
||||||||||
| 2011 |
3,343 | 1,136 | 4,479 | |||||||||
| 2012 |
3,343 | 1,136 | 4,479 | |||||||||
| 2013 |
3,343 | 1,136 | 4,479 | |||||||||
| 2014 |
3,343 | 1,125 | 4,468 | |||||||||
| 2015 and thereafter |
15,007 | 3,897 | 18,904 | |||||||||
| $ | 28,379 | $ | 8,430 | $ | 36,809 | |||||||
Goodwill
The changes in the carrying amount of goodwill are as follows:
| Years Ended December 31, | ||||||||
| 2010 | 2009 | |||||||
| Balance at beginning of period |
$ | 47,289 | $ | 48,158 | ||||
| Addition from acquisition |
2,192 | — | ||||||
| Valuation adjustments |
— | 375 | ||||||
| Settlement from escrow account |
— | (1,244 | ) | |||||
| Balance at end of period |
$ | 49,481 | $ | 47,289 | ||||
Accrued Liabilities
Accrued liabilities consist of the following:
| December 31, | ||||||||
| 2010 | 2009 | |||||||
| Payroll and related expenses |
$ | 4,436 | $ | 3,794 | ||||
| Royalties payable |
355 | 1,277 | ||||||
| Warranty |
1,525 | 1,163 | ||||||
| Professional fees |
510 | 939 | ||||||
| Accrued purchases |
397 | 674 | ||||||
| Other |
4,807 | 3,121 | ||||||
| $ | 12,030 | $ | 10,968 | |||||
92
Table of Contents
Solta Medical, Inc.
NOTES TO CONSOLIDATED FINANCIAL STATEMENTS — (Continued)
(In thousands of dollars, except share and per share amounts)
NOTE 5 — WARRANTY AND SERVICE CONTRACTS
Standard Warranty
The Company accrues for the estimated cost to repair or replace products under warranty at the time of sale. A summary of standard warranty accrual activity is shown below:
| Years Ended December 31, | ||||||||
| 2010 | 2009 | |||||||
| Balance at beginning of period |
$ | 1,163 | $ | 1,217 | ||||
| Additions from acquisition |
240 | — | ||||||
| Accruals for warranties issued during the period |
2,772 | 1,287 | ||||||
| Accruals related to pre-existing warranties |
||||||||
| Settlements made during the period |
(2,650 | ) | (1,341 | ) | ||||
| Balance at end of period |
$ | 1,525 | $ | 1,163 | ||||
Extended Warranty Contracts
The Company sells extended warranty contracts to its customers. At the time of sale, the Company defers the amounts billed for such service contracts. Deferred service contract revenue, included as deferred revenue on the balance sheet, is recognized on a straight-line basis over the period of the applicable extended warranty contract. A summary of extended warranty contract activity is shown below:
| Years Ended December 31, | ||||||||
| 2010 | 2009 | |||||||
| Balance at beginning of period |
$ | 2,440 | $ | 2,603 | ||||
| Additions from acquisition |
302 | — | ||||||
| Payments received |
3,990 | 3,238 | ||||||
| Revenue recognized |
(3,927 | ) | (3,401 | ) | ||||
| Balance at end of period |
$ | 2,805 | $ | 2,440 | ||||
The Company incurred costs of $927, $509 and $402 under extended warranty contracts during the years ended December 31, 2010, 2009 and 2008, respectively.
NOTE 6 — CREDIT FACILITY
The Company entered into a Loan and Security Agreement (the “Loan Agreement”) with Silicon Valley Bank (the “Lender”) on March 9, 2009 with a subsequent amendment on March 27, 2009, providing for a $6,000 secured revolving loan facility, with availability to be subject to a borrowing base formula, and a $3,000 secured term loan. On June 30, 2009, the Company entered into a second amendment to the Loan Agreement which provided for an increase of the secured revolving loan facility to $8,000 and an additional $1,000 secured term loan. On March 31, 2010, the Company entered into a third amendment to the Loan Agreement which provided for an increase of the commitment under the loan facility by adding a $10 million secured term loan facility, amended the financial covenants, which includes changes to the liquidity ratio, minimum EBITDA covenant and
93
Table of Contents
Solta Medical, Inc.
NOTES TO CONSOLIDATED FINANCIAL STATEMENTS — (Continued)
(In thousands of dollars, except share and per share amounts)
removal of the tangible net worth covenant, and extended the maturity date of the existing revolving loan facility from March 9, 2011 to March 8, 2012. On October 15, 2010, the Company entered into a fourth amendment to the Loan Agreement, which authorized the Company to consummate the acquisition of CLRS (see note 3). Other terms of the Loan Agreement remain unchanged. At December 31, 2010, $8,000 was outstanding on the revolving loan facility and $1,626 was outstanding on the secured term loan.
Borrowings under the original revolving loan facility accrue interest at a per annum rate equal to the Lender’s prime rate as in effect from time to time plus 1.00%, subject to a minimum per annum rate of 5.00%. Interest on borrowings under the revolving loan facility is payable monthly. The Company may borrow, repay and reborrow funds under the revolving loan facility until March 8, 2012, at which time it matures and all outstanding amounts under this facility must be repaid. In the event the Company elects to terminate the revolving loan facility on or before the maturity date, the Company is required to pay a fee in the amount of $60.
Borrowings under the secured term loan facility accrue interest at a per annum rate equal or greater of (i) 4.44% or (ii) the three-year U.S. treasury note yield on the funding date plus 3.00%. Term loans under such facility may be borrowed until March 31, 2011 and such loans must be repaid in 33 equal monthly payments of principal and interest, but no later than December 31, 2013. The Company may prepay all but not less than all amounts loaned under such facility and in connection with such prepayment, the Company is required to pay a fee equal to 2.00% of the principal amount prepaid. On the earlier of the maturity date or the date the term loan facility is prepaid, the Company is required to make a final payment equal to 3.5% of the aggregate principal amount of all loans made under such facility.
Aggregate annual principal payments due under the above term loans at December 31, 2010 are as follows:
| Year Ending December 31, |
||||
| 2011 |
$ | 1,528 | ||
| 2012 |
98 | |||
| 1,626 | ||||
| Less: Current portion |
(1,528 | ) | ||
| Noncurrent portion |
$ | 98 | ||
All obligations under the Loan Agreement are secured by substantially all of the personal property of the Company.
In connection with the Loan Agreement, the Company’s subsidiary, Reliant Technologies, LLC (“Reliant LLC”), entered into an Unconditional Guaranty, dated as of March 9, 2009 (the “Guaranty”), in favor of Lender, pursuant to which Reliant LLC guaranteed all of the obligations of the Company under the Loan Agreement, and a Security Agreement, dated as of March 9, 2009, with Lender, pursuant to which Reliant LLC granted a security interest in substantially all of its personal property to collateralize its obligations under the Guaranty.
The Loan Agreement contains restrictions that include, among others, restrictions that limit the Company’s and its subsidiaries’ ability to dispose of assets, enter into mergers or acquisitions, incur indebtedness, incur liens, pay dividends or make distributions on the Company’s capital stock, make investments or loans, and enter into certain affiliate transactions, in each case subject to customary exceptions for a credit facility of this size and type. As of December 31, 2010, the Loan Agreement contains financial covenants
94
Table of Contents
Solta Medical, Inc.
NOTES TO CONSOLIDATED FINANCIAL STATEMENTS — (Continued)
(In thousands of dollars, except share and per share amounts)
requiring the Company to maintain a minimum liquidity ratio and minimum EBITDA. The Company was in compliance with these covenants as of December 31, 2010. The Company repaid all funds drawn from the revolving loan facility in January 2011.
NOTE 7 — COMMITMENTS AND CONTINGENCIES
Facility Lease Commitments
The Company leases its operating facilities under noncancelable operating leases, which expire at various times ranging from 2011 to 2013. The Company’s operating leases typically include renewal periods, which are at its option. Under the terms of these leases, the Company is responsible for its share of taxes, insurance and common area maintenance costs. Rent expense for the years ended December 31, 2010, 2009 and 2008 was $1,679, $1,428 and $1,344, respectively. A description of significant operating leases are as follows:
| Lease Expiration | Renewal Option | |||
| Corporate Headquarters, Hayward, California |
March 2013 | 3-year renewal | ||
| Tokyo, Japan |
October 2013 | 2-year renewal |
Future minimum lease payments under the Company’s noncancelable operating leases at December 31, 2010 are as follows:
| Years Ending December 31, |
||||
| 2011 |
$ | 1,226 | ||
| 2012 |
1,219 | |||
| 2013 |
406 | |||
| $ | 2,851 | |||
Purchase Commitments
The Company has noncancelable purchase commitments at December 31, 2010. These commitments include purchase obligations to contract manufacturers and suppliers for $7,699 which are all payable in 2011.
Contingencies
From time to time, the Company is involved in litigation relating to claims arising from the ordinary course of business. The Company routinely assesses the likelihood of any adverse judgments or outcomes related to legal matters and claims, as well as ranges of probable losses. A determination of the amount of the reserves required, if any, for these contingencies is made after analysis of each known issue and an analysis of historical experience. Management does not believe the final disposition of any existing litigation matters will have a material adverse effect on the financial statements and future cash flows of the Company. Also, the Company does not record gain contingencies.
On December 21, 2009, a complaint was filed in the Santa Clara County Superior Court by three former stockholders of Reliant against Reliant and certain former officers and directors of Reliant in connection with our acquisition of Reliant, which closed on December 23, 2008. The complaint purports to be brought on behalf of
95
Table of Contents
Solta Medical, Inc.
NOTES TO CONSOLIDATED FINANCIAL STATEMENTS — (Continued)
(In thousands of dollars, except share and per share amounts)
the former common stockholders of Reliant. As a result of the acquisition, a successor entity to Reliant, Reliant Technologies, LLC, became our wholly-owned subsidiary. One member of the Company’s Board of Directors and the Company’s former Chief Technology Officer and former member of the Company’s Board of Directors are among the defendants named in the complaint. The principal claim, among others, is that Reliant violated the California Corporations Code by failing to obtain the vote from a majority of holders of Reliant’s common stock prior to the consummation of the acquisition. The complaint also purports to challenge disclosures made by Reliant in connection with its entry into the acquisition and alleges that the defendants failed to maximize the value of Reliant for the benefits of Reliant’s common stockholders. On August 2, 2010, defendants filed a motion to dismiss or stay the entire action based on a mandatory forum selection clause in the merger agreement which requires that claims related to the merger be litigated in Delaware. On September 28, 2010, the Court granted the defendants’ motion to dismiss or stay, and stayed the action indefinitely. To date, the plaintiffs have not filed a complaint against the defendants in Delaware. We believe that this suit is without merit, and we intend to vigorously defend it. Although we do not expect that the final disposition of this litigation will have a material adverse effect on our financial results, we expect to devote certain personnel and resources to resolve this litigation.
On December 4, 2009, Aesthera was served with a class action complaint filed in the United States District Court for the District of Connecticut alleging that Aesthera caused unsolicited fax advertisements to be sent to the plaintiffs in violation of the Telephone Consumer Protection Act, or TCPA, and Connecticut state law. The complaint purports to be filed on behalf of a class, and it alleges that Aesthera caused unsolicited fax advertisements to be sent from August 1, 2006 through the present. Plaintiffs seek statutory damages under the TCPA and Connecticut state law, attorneys’ fees and costs of the action, and an injunction to prevent any future violations. In May 2010, the Company reached an agreement in principle to settle the matter by consenting to certification of a settlement class to receive payment out of a settlement fund. The Court stayed discovery until November 1, 2010 so that preliminary agreement of a class settlement could be submitted and a fairness hearing held to determine whether final approval of the settlement would be appropriate. The Company anticipates that the motion to certify a class for settlement purposes will be filed in early November, and that a fairness hearing will be held in the first quarter of 2011. If the process does not result in approval of a settlement, then we anticipate that the parties will engage in discovery and that Aesthera will vigorously oppose certification of a class. We do not believe the final disposition of this action will have a material adverse effect on our financial statements and future cash flows. We believe that we have meritorious defenses in this action and intend to defend the action vigorously if the proposed settlement is not approved by the Court.
In January 2008, a product design complaint was filed against the Company in Federal District Court in Maryland. The individual seeks monetary damages, a portion of which we believe are within our insurance limits, as well as attorney’s fees and costs of the action. Discovery in the matter is essentially complete and the trial date has been set for September 2011. We do not believe the final disposition of this action will have a material adverse effect on our operating results, financial condition or future cash flows. We believe that we have meritorious defenses in this action and intend to continue to defend the action vigorously.
Indemnifications
In the normal course of business, the Company enters into contracts and agreements that contain a variety of representations and warranties and provide for general indemnifications. The Company’s exposure under these agreements is unknown because it involves claims that may be made against the Company in the future, but have not yet been made. To date, the Company has not paid any claims or been required to defend any action related to its indemnification obligations. However, the Company may record charges in the future as a result of these indemnification obligations.
96
Table of Contents
Solta Medical, Inc.
NOTES TO CONSOLIDATED FINANCIAL STATEMENTS — (Continued)
(In thousands of dollars, except share and per share amounts)
In accordance with its certificate of incorporation, bylaws and individual indemnification agreements, the Company has indemnification obligations to its officers and directors and certain key employees for certain events or occurrences, subject to certain limits, while they are serving at the Company’s request in such a capacity. There have been no claims to date and the Company has a director and officer insurance policy that may enable it to recover a portion of any amount paid for future claims.
NOTE 8 — STOCKHOLDER’S EQUITY
Convertible Preferred Stock
The Company’s Board of Directors has authorized 10,000,000 shares of convertible preferred stock, $0.001 par value, issuable in series. At December 31, 2010 and 2009, there were no shares issued or outstanding.
Common Stock
The Company’s amended and restated certificate of incorporation authorizes the Company to issue 100,000,000 shares of $0.001 par value common stock. At December 31, 2010 there were 59,728,410 share of common stock outstanding. Common stockholders are entitled to dividends as and when declared by the board of directors subject to the prior rights of the preferred stockholders.
On January 7, 2010, the Company entered into securities purchase agreements in connection with a private placement of its securities to certain institutional and other accredited investors pursuant to which the Company agreed to sell and issue (i) an aggregate of 8,529,704 newly issued shares of its common stock and (ii) warrants to purchase an aggregate of 4,264,852 shares of common stock. This sale of securities resulted in aggregate gross proceeds of approximately $17,230. The net proceeds, after deducting offering expenses, were approximately $15,795. The common stock and warrants were sold in units consisting of one share of common stock and a warrant to purchase one-half of a share of common stock for an aggregate purchase price of $2.02 per unit which was equal to the closing price of the Company’s common stock on the NASDAQ Global Market on January 6, 2010.
2006 Employee Stock Purchase Plan
On August 2, 2006, the board of directors adopted the 2006 Employee Stock Purchase Plan (“ESPP”). A total of 250,000 shares of common stock were reserved for issuance pursuant to the 2006 Employee Stock Purchase Plan. The 2006 Employee Stock Purchase Plan was approved by the Company’s stockholders on August 4, 2006. The 2006 Employee Stock Purchase Plan became effective upon the closing of the Company’s initial public offering. Under the 2006 Employee Stock Purchase Plan, eligible employees are permitted to purchase common stock through payroll deduction at a price of 85% of the lower market value as of the beginning or the end of the six-month offering period. Shares of common stock will be increased on the first day of each fiscal year, commencing in 2007, by an amount equal to the lower of: (i) 900,000 shares; (ii) 2.0% of the outstanding shares of the Company’s common stock on the first day of the fiscal year; or (iii) such other amount as may be determined by the board of directors. Each offering period starts on the first trading day on or after May 15 and November 15 of each year. The Company issued 227,517, 239,708 and 157,090 shares of common stock under this plan during the years ended December 31, 2010, 2009 and 2008, respectively. At December 31, 2010, 1,579,917 shares remained available for future issuance. In addition, on January 1, 2010, the Company added 900,000 shares to the Plan.
97
Table of Contents
Solta Medical, Inc.
NOTES TO CONSOLIDATED FINANCIAL STATEMENTS — (Continued)
(In thousands of dollars, except share and per share amounts)
2006 Equity Incentive Plan and 1997 Stock Option Plan
In 1997, the Company adopted the 1997 Stock Option Plan. The Plan provides for the granting of stock options to employees and consultants of the Company. Options granted under the Plan may be either incentive stock options or nonqualified stock options. Incentive stock options (“ISO”) may be granted only to Company employees (including officers and directors who are also employees). Nonqualified stock options (“NSO”) may be granted to Company employees and consultants. The Company has reserved 5,940,000 shares of common stock for issuance under the Plan.
On August 2, 2006, the board of directors adopted the 2006 Equity Incentive Plan. A total of 2,750,000 shares of common stock were reserved for issuance pursuant to the 2006 Equity Incentive Plan. In addition, the shares reserved for issuance under the 2006 Equity Incentive Plan included shares reserved but unissued under the Company’s 1997 Stock Option Plan as the result of termination of options or the repurchase of shares. The 2006 Equity Incentive Plan was approved by the Company’s stockholders on August 4, 2006.
Shares of common stock approved under the 2006 Equity Incentive Plan will be increased on the first day of each fiscal year, commencing in 2007, by an amount equal to the lower of: (i) 1,800,000 shares; (ii) 3.5% of the outstanding shares of the Company’s common stock on the last day of the immediately preceding fiscal year; or (iii) such other amount as may be determined by the board of directors. On January 1, 2010, the Company added 1,800,000 shares to the 2006 Equity Incentive Plan.
Options under the 1997 Stock Option Plan and 2006 Equity Incentive Plan may be granted for periods of up to ten years and at prices no less than 85% of the estimated fair value of the shares on the date of grant as determined by the board of directors, provided, however, that (i) the exercise price of an ISO and NSO shall not be less than 100% and 85% of the estimated fair value of the shares on the date of grant, respectively, and (ii) the exercise price of an ISO and NSO granted to a 10% stockholder shall not be less than 110% of the estimated fair value of the shares on the date of grant, respectively. Options granted generally vest over four years.
During the year ended December 31, 2008, under the 2006 Equity Incentive Plan, the board of directors approved the issuance of 170,652 shares of restricted stock units to certain employees. The value of the restricted stock award was based on the closing stock market price on the date of award. These restricted stock units vested over 13 months.
There were no restricted stock units approved or issued during the year ended December 31, 2009.
During the year ended December 31, 2010, the board of directors approved the issuance of 918,950 shares of restricted stock units to certain employees under the 2006 Equity Incentive Plan. The value of the restricted stock awards was based on the closing stock market price on the award date. Out of the total restricted stock units granted in 2010, 731,000 of the awards would be subject to vesting over three years if such units are earned by the achievement of certain corporate performance-based milestones. As of December 31, 2010, these milestones were not achieved. As a result, stock based compensation expense was not recognized for these awards in the year ended December 31, 2010. The remaining 187,950 restricted stock units granted in 2010 vest over three years.
In addition, the Company also awarded 7,500 shares of restricted stock units to a non-employee during the year ended December 31, 2010. The value attributable to these units was amortized on a straight line basis over the three month service period and the unvested portion of these units were revalued on June 15, 2010 based on the closing stock market price on June 15, 2010. The Company believes that the fair value of the units is more reliably measurable than the fair value of the services received.
98
Table of Contents
Solta Medical, Inc.
NOTES TO CONSOLIDATED FINANCIAL STATEMENTS — (Continued)
(In thousands of dollars, except share and per share amounts)
Activity for the year end December 31, 2010 under the 1997 Stock Option Plan and 2006 Equity Incentive Plan is summarized as follows:
| Options Outstanding | ||||||||||||
| Shares Available for Grant |
Number of Options |
Weighted Average Exercise Price |
||||||||||
| Balance, December 31, 2009 |
1,466,844 | 6,763,252 | $ | 2.85 | ||||||||
| Additional shares reserved |
1,682,695 | — | — | |||||||||
| Options granted |
(2,024,950 | ) | 2,024,950 | 1.97 | ||||||||
| Restricted stock units granted |
(948,050 | ) | — | — | ||||||||
| Options exercised |
— | (349,653 | ) | 1.66 | ||||||||
| Options repurchased or cancelled |
1,201,215 | (1,201,215 | ) | 3.19 | ||||||||
| Restricted stock units cancelled |
202,163 | — | — | |||||||||
| Balance, December 31, 2010 |
1,579,917 | 7,237,334 | $ | 2.61 | ||||||||
Information regarding stock options outstanding at December 31, 2010 is summarized as follows:
| Number of Options |
Weighted Average Exercise Price |
Weighted Average Contractual Terms (Years) |
Aggregate Intrinsic Value |
|||||||||||||
| As of December 31, 2010 |
||||||||||||||||
| Options outstanding |
7,237,334 | $ | 2.61 | 7.17 | $ | 8,058 | ||||||||||
| Options vested and expected to vest |
6,934,446 | 2.63 | 7.10 | 7,671 | ||||||||||||
| Options vested |
4,295,655 | 3.05 | 6.20 | 4,327 | ||||||||||||
The following table summarizes additional information regarding outstanding and exercisable stock options at December 31, 2010:
| Options Outstanding | Options Exercisable | |||||||||||||||||||
| Range of Exercise Prices |
Number of Shares Outstanding |
Weighted Average Remaining Life (Years) |
Weighted Average Exercise Price |
Number of Shares Exercisable |
Weighted Average Exercise Price |
|||||||||||||||
| $0.45 - $0.70 |
108,281 | 3.16 | $ | 0.56 | 102,374 | $ | 0.56 | |||||||||||||
| $1.00 - $1.00 |
1,514,669 | 8.09 | $ | 1.00 | 698,964 | $ | 1.00 | |||||||||||||
| $1.10 - $1.88 |
853,132 | 6.09 | $ | 1.41 | 592,159 | $ | 1.38 | |||||||||||||
| $1.90 - $1.90 |
1,094,469 | 4.46 | $ | 1.90 | 1,054,469 | $ | 1.90 | |||||||||||||
| $1.91 - $1.91 |
1,312,458 | 8.96 | $ | 1.91 | 269,580 | $ | 1.91 | |||||||||||||
| $1.98 - $4.22 |
1,092,619 | 8.22 | $ | 2.82 | 525,475 | $ | 3.19 | |||||||||||||
| $4.30 - $11.00 |
1,261,706 | 6.67 | $ | 6.66 | 1,052,634 | $ | 6.97 | |||||||||||||
| $0.45 - $11.00 |
7,237,334 | 7.16 | $ | 2.61 | 4,295,655 | $ | 3.05 | |||||||||||||
Included in the above tables are non-employee stock options granted during the year ended December 31, 2008 for 7,500 shares of common stock. There were no non-employee stock options granted during December 31, 2010 or 2009. The Company had non-employee stock options outstanding for 444,958, 5,000 and 12,500 shares of common stock, respectively, at December 31, 2010, 2009 and 2008, at weighted
99
Table of Contents
Solta Medical, Inc.
NOTES TO CONSOLIDATED FINANCIAL STATEMENTS — (Continued)
(In thousands of dollars, except share and per share amounts)
average exercise prices of $1.77, $0.45 and $2.76 per share, respectively. The non-employee options outstanding have a weighted average remaining contractual term of 7.88 and 2.24 years and an aggregate intrinsic value of $568 and $8 at December 31, 2010 and 2009, respectively.
The number of outstanding options vested and exercisable at December 31, 2010 was 4,295,655 options with a weighted average exercise price of $3.05 per share.
Information regarding common stock warrants outstanding at December 31, 2010 is summarized as follows:
| Number of Shares |
Average Exercise Price |
Remaining Contractual Terms (Years) |
||||||||||
| As of December 31, 2010 |
4,581,179 | $ | 4.38 | 2.25 | ||||||||
The Company assumed 316,327 of warrants to purchase common stock in the Company upon the acquisition of Reliant. The fair value of these warrants on the acquisition date was $181, determined using the Company’s stock price on December 23, 2008 of $1.49 and was calculated using a Black-Scholes valuation model with the following assumptions as of the acquisition date: remaining contractual life ranging from 3.66 years to 6.87 years, risk-free interest rate of 1.13% to 1.81%, expected volatility of 56% to 59% and no dividend yield.
On January 7, 2010, the Company entered into securities purchase agreements in connection with a private placement of its securities to sell and issue (i) an aggregate of 8,529,704 newly issued shares of its common stock and (ii) warrants to purchase an aggregate of 4,264,852 shares of common stock. The common stock and warrants were sold in units consisting of one share of common stock and a warrant to purchase one-half of a share of common stock for an aggregate purchase price of $2.02 per unit which was equal to the closing price of the Company’s common stock on the NASDAQ Global Market on January 6, 2010. The warrants have an exercise price of $2.121 per share, which represents a 5% premium over the closing price of the Company’s common stock on the NASDAQ Global Market on January 6, 2010. The holders have the right to net exercise any outstanding warrants for shares of the Company's common stock. The warrants are exercisable commencing on the six-month anniversary of the closing of the sale of securities and will expire five and a half years from the date of issuance.
The fair value of the warrants at the issuance date was estimated using the Black-Scholes model using the following assumptions: dividend yield of 0%, risk-free interest rate of 2.57%, expected volatility of 65.5%, and contractual life of 5.5 years. The estimated fair value of the warrants was $3,690 on the date of issuance and was recorded as additional paid-in capital within stockholder’s equity.
Stock Option Repricing in 2006
During March 2006, the Company repriced certain stock option awards held by 116 of its employees. Under the terms of this repricing, the Company repriced employee stock options having an exercise price of $2.00 or above to an exercise price of $1.90 per share. Other than the exercise price, all other terms of the repriced options, such as vesting and contractual life, remained the same. In consideration for the repricing of eligible stock option awards, the employees who were previously granted certain stock option awards on February 2, 2005 were also required to return these awards for cancellation. As a result of this repricing, the Company repriced options to purchase 447,565 shares and options to purchase 1,523,035 unvested shares having
100
Table of Contents
Solta Medical, Inc.
NOTES TO CONSOLIDATED FINANCIAL STATEMENTS — (Continued)
(In thousands of dollars, except share and per share amounts)
a weighted average original exercise price of $4.18 and $4.10, respectively. Such options were repriced at a new exercise price of $1.90 per share. As a result of this repricing, the Company also cancelled 35,216 outstanding employee options with an original exercise price of $4.00 that were granted on February 2, 2005. The Company has accounted for the repricing and cancellation transactions as a modification and recorded any net incremental fair value related to vested awards as compensation expense on the date of modification. The Company will record the incremental fair value related to the unvested awards, together with unamortized stock-based compensation expense associated with the unvested awards, over the remaining requisite service period of the option holders. In connection with the repriced options, the Company recorded stock compensation expense of $0, $496 and $1,116 in the years ended December 31, 2010, 2009 and 2008, respectively.
Deferred Stock-based Compensation
During the years ended December 31, 2006 and 2005, the Company issued stock options to certain employees with exercise prices below the fair market value of the Company’s common stock at the date of grant, determined with hindsight. This deferred stock based compensation is amortized to expense on a straight-line basis over the period during which the Company’s options vest, generally four years. Amortization of deferred stock-based compensation was $0, $2 and $2 during the years ended December 31, 2010, 2009 and 2008, respectively.
The Company granted stock options to employees with exercise prices below estimated fair market value, determined with hindsight, on the date of grant as follows:
| Grants Made During Quarter Ended |
Number of Options Granted |
Weighted Average Exercise Price Per Share |
Weighted Average Fair Value Per Share |
Weighted Average Intrinsic Value Per Share |
||||||||||||
| March 31, 2006 |
2,139,184 | $ | 1.90 | $ | 10.64 | $ | 8.74 | |||||||||
| June 30, 2006 |
237,500 | 3.00 | 11.48 | 8.48 | ||||||||||||
| September 30, 2006 |
139,350 | 11.00 | 11.93 | 0.93 | ||||||||||||
| December 31, 2006 |
92,352 | 10.08 | 10.71 | 0.63 | ||||||||||||
In connection with the repricing of stock options during the year ended December 31, 2006, the Company eliminated its remaining deferred stock-based compensation amounts of $3,344 related to modified stock options.
101
Table of Contents
Solta Medical, Inc.
NOTES TO CONSOLIDATED FINANCIAL STATEMENTS — (Continued)
(In thousands of dollars, except share and per share amounts)
Valuation of Options Granted to Non-employees
During the year ended December 31, 2008, the Company issued options to non-employees. The Company did not issue any options to non-employees during the years ended December 31, 2010 and 2009. These options generally vest ratably over four years. The values attributable to these options are amortized on a straight line basis over the service period and the unvested portion of these options was remeasured at each vesting date. The Company believes that the fair value of the stock options is more reliably measurable than the fair value of the services received. The value of the stock options granted were revalued at each reporting date using the Black-Scholes option pricing model using the following assumptions:
| Years Ended December 31, | ||||||||||||
| 2010 | 2009 | 2008 | ||||||||||
| Dividend yield |
— | — | — | |||||||||
| Risk-free interest rate |
— | — | 1.52 | % | ||||||||
| Expected volatility |
— | — | 53 | % | ||||||||
| Contractual life (years) |
— | — | 10 | |||||||||
The weighted average estimate grant date fair values of the non-employee stock options was $2.74 per share for the year ended December 31, 2008.
The stock-based compensation expense will fluctuate as the deemed fair value of the common stock fluctuates. In connection with the grant of stock options to non-employees, the Company recorded stock-based compensation expense of $98, $1 and $6 for the years ended December 31, 2010, 2009 and 2008, respectively.
Valuation of Awards Granted to Employees
The Company estimated the fair value of each option award on the date of grant using the Black-Scholes option-pricing model using the assumptions noted in the following table. Due to a lack of historical information regarding the volatility of the Company’s own stock price, expected volatility is based on an average of the historical and implied volatility of a peer group of publicly traded entities in the aesthetics market. The expected term of options gave consideration to historical exercises, the vesting term of the Company’s options, the cancellation history of the Company’s options and the options’ contractual term of ten years. The risk-free rate for the expected term of the option is based on the U.S. Treasury Constant Maturity rate as of the date of grant. The assumptions used to value options granted during the years ended December 31, 2010, 2009 and 2008 were as follows:
| Years Ended December 31, | ||||||||||||
| 2010 | 2009 | 2008 | ||||||||||
| Dividend yield |
— | — | — | |||||||||
| Risk-free interest rate |
2.14 | % | 2.09 | % | 2.30 | % | ||||||
| Expected volatility |
66 | % | 59 | % | 54 | % | ||||||
| Expected term (years) |
5.00 | 4.58 | 4.23 | |||||||||
102
Table of Contents
Solta Medical, Inc.
NOTES TO CONSOLIDATED FINANCIAL STATEMENTS — (Continued)
(In thousands of dollars, except share and per share amounts)
The assumptions used to value ESPP shares during the years ended December 31, 2010, 2009 and 2008 were as follows:
| Years Ended December 31, | ||||||||||||
| 2010 | 2009 | 2008 | ||||||||||
| Dividend yield |
— | — | — | |||||||||
| Risk-free interest rate |
0.20 | % | 1.44 | % | 2.17 | % | ||||||
| Expected volatility |
68 | % | 72 | % | 52 | % | ||||||
| Expected term (years) |
0.50 | 0.50 | 0.50 | |||||||||
Total employee stock-based compensation expenses recorded during the years ended December 31, 2010, 2009 and 2008 were as follows:
| Years Ended December 31, | ||||||||||||
| 2010 | 2009 | 2008 | ||||||||||
| Employee stock-based compensation expense: |
||||||||||||
| Employee stock-based compensation expense |
$ | 2,120 | $ | 2,877 | $ | 3,447 | ||||||
| Employee stock purchase plan |
191 | 135 | 165 | |||||||||
| Restricted stock units |
93 | 229 | 59 | |||||||||
| Total stock-based compensation expense |
$ | 2,404 | $ | 3,241 | $ | 3,671 | ||||||
During the years ended December 31, 2010, 2009 and 2008, the Company granted stock options to purchase an aggregate of 2,024,950, 2,410,480 and 2,741,600 shares of common stock with an estimated weighted-average grant-date fair value of $1.11, $0.61 and $1.40 per share, respectively. The total fair value of options that vested during the years ended December 31, 2010, 2009 and 2008 was $2,201, $3,204 and $5,276, respectively. The total intrinsic value of options exercised during the years ended December 31, 2010, 2009 and 2008 was $160, $48 and $735, respectively. Net cash proceeds from the exercise of stock options were $579, $115 and $536 for the years ended December 31, 2010, 2009 and 2008, respectively.
Employee stock-based compensation expense recognized in the years ended December 31, 2010, 2009 and 2008 was $2,487, $3,241 and $3,671, respectively. The expense was calculated based on awards ultimately expected to vest and has been reduced for estimated forfeitures. Forfeitures are estimated at the time of grant and revised, if necessary, in subsequent periods if actual forfeitures differ from those estimates.
At December 31, 20010 and 2009, the Company had $3,370 and $4,295, respectively, of total unrecognized compensation expense, net of estimated forfeitures, related to stock options that will be recognized over a remaining weighted-average period of 4.2 and 3.4 years, respectively.
At December 31, 2010 and 2009, the unrecognized compensation cost related to ESPP shares was $56 and $95, respectively, which will be recognized using the straight-line attribution method over 0.4 years. The weighted average estimated fair values of each stock issuance under the ESPP for the years ended December 31, 2010, 2009 and 2008 was $0.78, $0.63 and $0.91 per share, respectively.
At December 31, 2010 and 2009, the unrecognized compensation cost related to restricted stock unit awards was $191 and $19, respectively, which will be recognized using the straight-line attribution method over 2.16 and 0.06 years. The weighted average estimated fair values of each restricted stock unit issuance for the years ended December 31, 2010 and 2009 was $2.12 and $1.49 per share, respectively. There were no restricted stock units approved or issued during the year ended December 31, 2009.
103
Table of Contents
Solta Medical, Inc.
NOTES TO CONSOLIDATED FINANCIAL STATEMENTS — (Continued)
(In thousands of dollars, except share and per share amounts)
Stock-based compensation expense recorded related to options granted to employees and non-employees, Employee Stock Purchase Plan, restricted stock unit awards and amortization of deferred stock based compensation was allocated to cost of revenue, sales and marketing, research and development and general and administrative expense as follows:
| Years Ended December 31, | ||||||||||||
| 2010 | 2009 | 2008 | ||||||||||
| Cost of revenue |
$ | 270 | $ | 241 | $ | 190 | ||||||
| Sales and marketing |
741 | 1,244 | 1,449 | |||||||||
| Research and development |
303 | 273 | 385 | |||||||||
| General and administrative |
1,188 | 1,486 | 1,655 | |||||||||
| Total stock-based compensation expense |
$ | 2,502 | $ | 3,244 | $ | 3,679 | ||||||
NOTE 9 — COMPREHENSIVE LOSS
Comprehensive loss generally represents all changes in stockholders’ equity except those resulting from investments or contributions by stockholders. The Company’s unrealized gain on marketable investments represents the only component of other comprehensive loss that is excluded from net loss. The changes in components of comprehensive loss for the periods presented are as follows:
| Years Ended December 31, | ||||||||||||
| 2009 | 2009 | 2008 | ||||||||||
| Net loss |
$ | (2,020 | ) | $ | (11,192 | ) | $ | (16,393 | ) | |||
| Unrealized loss on marketable investments, net of tax |
— | — | (19 | ) | ||||||||
| Comprehensive loss |
$ | (2,020 | ) | $ | (11,192 | ) | $ | (16,412 | ) | |||
NOTE 10 — INCOME TAXES
The components of loss before income taxes are as follows:
| Years Ended December 31, | ||||||||||||
| 2010 | 2009 | 2008 | ||||||||||
| Loss subject to domestic income taxes only |
($ | 1,693 | ) | ($ | 11,275 | ) | ($ | 16,378 | ) | |||
| Loss subject to foreign income taxes only |
(105 | ) | (16 | ) | (1 | ) | ||||||
| ($ | 1,798 | ) | ($ | 11,291 | ) | ($ | 16,379 | ) | ||||
The components of the provision for income taxes are as follows:
| Years Ended December 31, | ||||||||||||
| 2010 | 2009 | 2008 | ||||||||||
| Current: |
||||||||||||
| Federal |
$ | 114 | ($ | 233 | ) | ($ | 15 | ) | ||||
| State |
76 | 119 | 29 | |||||||||
| Foreign |
32 | 15 | — | |||||||||
| Total provision (benefit) for income taxes |
$ | 222 | ($ | 99 | ) | $ | 14 | |||||
104
Table of Contents
Solta Medical, Inc.
NOTES TO CONSOLIDATED FINANCIAL STATEMENTS — (Continued)
(In thousands of dollars, except share and per share amounts)
The Company’s deferred tax assets and liabilities consist of the following:
| December 31, | ||||||||
| 2010 | 2009 | |||||||
| Net operating loss carryforwards |
$ | 37,247 | $ | 38,551 | ||||
| Research and development and alternative minimum tax credits |
2,910 | 3,131 | ||||||
| Depreciation |
752 | 402 | ||||||
| Deferred revenue |
582 | 835 | ||||||
| Other |
6,872 | 4,367 | ||||||
| Total deferred tax assets |
48,363 | 47,286 | ||||||
| Intangible assets |
(13,629 | ) | (13,760 | ) | ||||
| 34,734 | 33,526 | |||||||
| Less: valuation allowance |
(34,734 | ) | (33,526 | ) | ||||
| Net deferred tax asset |
$ | — | $ | — | ||||
The differences between the U.S. federal statutory income tax rate and the Company’s effective tax rate are as follows:
| Years Ended December 31, | ||||||||||||
| 2010 | 2009 | 2008 | ||||||||||
| Tax at federal statutory rate |
(34.00 | )% | (34.00 | )% | (34.00 | )% | ||||||
| State, net of federal benefit |
3.18 | % | 0.96 | % | 0.21 | % | ||||||
| Foreign taxes |
3.78 | % | ||||||||||
| Meals and entertainment |
7.72 | % | 1.31 | % | 0.64 | % | ||||||
| Acquired In-Process R&D |
— | — | 18.80 | % | ||||||||
| Other |
(0.07 | )% | 0.22 | % | 0.08 | % | ||||||
| NOL Carryback |
2.11 | % | (1.85 | )% | — | |||||||
| Benefit for research and development credit |
0.00 | % | (0.84 | )% | (0.44 | )% | ||||||
| Stock-based compensation |
28.19 | % | 7.23 | % | 6.30 | % | ||||||
| Transaction costs |
20.56 | % | ||||||||||
| Tax reserves |
4.30 | % | 0.61 | % | 0.18 | % | ||||||
| Change in valuation allowance |
(23.27 | )% | 25.48 | % | 8.40 | % | ||||||
| Provision for taxes |
12.50 | % | (0.88 | )% | 0.17 | % | ||||||
Based upon the weight of available evidence, which includes the Company’s historical operating performance, lack of taxable income and the accumulated deficit, the Company provided a full valuation allowance against its net deferred tax asset at December 31, 2010 and 2009. The valuation allowance increased by $1,208, increased by $2,175 and increased by $17,666 during the years ended December 31, 2010, 2009 and 2008, respectively.
As of December 31, 2010, the Company had net operating loss carryforwards of approximately $113,500 and $85,100 for federal and state tax purposes, respectively. If not utilized, these carryforwards will begin to expire in 2022 for federal and in 2014 for state purposes.
105
Table of Contents
Solta Medical, Inc.
NOTES TO CONSOLIDATED FINANCIAL STATEMENTS — (Continued)
(In thousands of dollars, except share and per share amounts)
As of December 31, 2010, the Company had research and development credit carryforwards of approximately $4,200 and $3,800 for federal and state income tax purposes, respectively. If not utilized, the federal carryforward will expire in various amounts beginning in 2020. The California tax credit can be carried forward indefinitely.
Utilization of the net operating loss and tax credit carryforwards may be subject to an annual limitation due to the ownership percentage change limitations provided by Section 382 of the Internal Revenue Code and similar state provisions. The annual limitation may result in the expiration of the net operation losses before utilization.
Uncertain Tax Positions
On January 1, 2007, the Company adopted the provisions of ASC paragraph 740-10-15-2A, Income Taxes. The provision specifies how tax benefits for uncertain tax positions are to be recognized, measured, and de-recognized in financial statements; requires certain disclosures of uncertain tax matters; specifies how reserves for uncertain tax position should be classified on the balance sheet; and provides transition and interim-period guidance, among other provisions.
A reconciliation of the January 1, 2008 through December 31, 2010 amount of unrecognized tax benefits is as follows:
| Beginning balance at January 1, 2008 |
$ | 1,010 | ||
| Increases (decreases) of unrecognized tax benefits taken in prior years |
1,106 | |||
| Increases (decreases of unrecognized tax benefits related to current year |
553 | |||
| Increases (decreases) of unrecognized tax benefits related to settlements |
(28 | ) | ||
| Beginning balance at December 31, 2008 |
2,641 | |||
| Increases (decreases) of unrecognized tax benefits taken in prior years |
(49 | ) | ||
| Increases (decreases of unrecognized tax benefits related to current year |
277 | |||
| Ending balance at December 31, 2009 |
2,869 | |||
| Increases (decreases) of unrecognized tax benefits taken in prior years |
(185 | ) | ||
| Increases (decreases of unrecognized tax benefits related to current year |
163 | |||
| Ending balance at December 31, 2010 |
$ | 2,847 | ||
At December 31, 2010, the Company had $2,847 of unrecognized tax benefits, of which, $337 would affect the Company’s effective tax rate, if recognized. The Company does not anticipate a significant change to the total amount of unrecognized tax benefits within the next twelve months.
The Company records interest and penalties related to unrecognized tax benefits in income tax expense. As of December 31, 2010, the Company had approximately $51 accrued for estimated interest related to uncertain tax positions. For the 12 months ended December 31, 2010, the Company recorded estimated interest of $17. Penalties are immaterial at December 31, 2010.
The Company’s is subject to taxation in the U.S. and various states, for which tax years 2006 through 2010 remain subject to examinations by the major tax jurisdictions as of December 31, 2010. The Company may from time to time be assessed interest or penalties by major tax jurisdictions, although there have been no such
106
Table of Contents
Solta Medical, Inc.
NOTES TO CONSOLIDATED FINANCIAL STATEMENTS — (Continued)
(In thousands of dollars, except share and per share amounts)
assessments historically with material impact to its financial results. In the event it receives an assessment for interest and/or penalties, such an assessment would be classified in the consolidated financial statements as income tax expense.
Management’s intent is to indefinitely reinvest undistributed earnings of $43 from its foreign subsidiaries. Accordingly no provision for Federal and state income taxes has been provided thereon. Upon distribution of these earnings in the form of dividends or otherwise, the Company will be subject to United States income taxes.
NOTE 11 — LICENSE AGREEMENT
Through the acquisition of Reliant in December 2008, the Company had an exclusive, royalty bearing, worldwide license, with the right to sub-license, with Massachusetts General Hospital (“MGH”) to patent applications relating to some of the technology used in the Fraxel laser systems. This license, ongoing royalty obligations and all rights thereunder terminated on December 31, 2010, provided however that MGH has granted a non-assert provision that applies to all of our products in the professional marketplace.
NOTE 12 — LITIGATION SETTLEMENT GAIN
The Company advised Alma Lasers, Ltd. and Alma Lasers, Inc. (together “Alma”) in February 2006 that Alma’s Accent product infringed numerous patents owned by the Company. On April 26, 2007, Alma filed a lawsuit against the Company in the United States District Court for the District of Delaware requesting declaratory judgment that Alma’s Accent product does not infringe the Company’s patents and that the Company’s patents are invalid. On June 20, 2007, the Company filed patent infringement counterclaims against Alma in the United States District Court for the District of Delaware asserting that Alma’s Accent and Harmony systems infringe ten of the Company’s U.S. patents. The counterclaims were amended on December 10, 2007 to include a claim of infringement of an eleventh patent. In addition to damages and attorney fees, the Company asked the Court to enjoin Alma from further infringement. During May, June and July 2008, Alma filed with the United States Patent and Trademark Office requests that all of the eleven patents asserted by the Company be reexamined. The United States Patent and Trademark Office has made rejections of some claims in each of these 11 patents. Some of the patents in reexamination have been reaffirmed, while others remain under rejection. As a result of a settlement reached on May 10, 2010, the Company and Alma granted each other a covenant not to sue under the patents asserted in the lawsuit and related patents. In addition, Alma paid the Company a non-returnable one-time amount of $2,250 in connection with this settlement. External legal fees incurred during the year ended December 31, 2010 in connection with the settlement was $37. In connection with this settlement, the Company has recorded a net gain of $2,213 in operating expenses during year ended December 31, 2010.
NOTE 13 — EMPLOYEE BENEFIT PLAN
The Company sponsors a 401(k) defined contribution plan covering all employees. Contributions made by the Company are determined annually by the board of directors. The Company made no contributions under this plan for the years ended December 31, 2010, 2009 and 2008.
NOTE 14 — RELATED PARTY TRANSACTIONS
During the years ended December 31, 2010, 2009 and 2008, the Company paid $75 each year to a member of its board of directors under the terms of a consulting agreement.
107
Table of Contents
Solta Medical, Inc.
NOTES TO CONSOLIDATED FINANCIAL STATEMENTS — (Continued)
(In thousands of dollars, except share and per share amounts)
During 2008 prior to the acquisition of Reliant, the Company provided $5,000 of debt financing to Reliant at an interest rate of 15% per annum, and also made net payments of $548 of expenses on behalf of Reliant.
NOTE 15 — SUPPLEMENTARY DATA — QUARTERLY FINANCIAL DATA (UNAUDITED)
The following table presents certain unaudited consolidated quarterly financial information for each of the eight quarters ended December 31, 2010:
| Quarters Ended | ||||||||||||||||||||||||||||||||
| Dec. 31, 2010 |
Sep. 30, 2010 |
Jun. 30, 2010 |
Mar. 31, 2010 |
Dec. 31, 2009 |
Sep. 30, 2009 |
Jun. 30, 2009 |
Mar. 31, 2009 |
|||||||||||||||||||||||||
| Net revenue |
$ | 30,066 | $ | 24,851 | $ | 30,080 | $ | 25,935 | $ | 28,403 | $ | 17,753 | $ | 27,417 | $ | 25,245 | ||||||||||||||||
| Gross margin |
$ | 18,276 | $ | 15,741 | $ | 18,722 | $ | 16,793 | $ | 17,433 | $ | 10,442 | $ | 16,640 | $ | 13,738 | ||||||||||||||||
| Net income (loss) |
$ | (190 | ) | $ | (1,406 | ) | $ | 1,509 | $ | (1,933 | ) | $ | (256 | ) | $ | (6,246 | ) | $ | 85 | $ | (4,775 | ) | ||||||||||
| Basic income (loss) per share |
($ | 0.00 | ) | ($ | 0.02 | ) | $ | 0.03 | ($ | 0.03 | ) | ($ | 0.01 | ) | ($ | 0.13 | ) | $ | 0.00 | ($ | 0.10 | ) | ||||||||||
| Diluted income (loss) per share |
($ | 0.00 | ) | ($ | 0.02 | ) | $ | 0.02 | ($ | 0.03 | ) | ($ | 0.01 | ) | ($ | 0.13 | ) | $ | 0.00 | ($ | 0.10 | ) | ||||||||||
108
Table of Contents
SOLTA MEDICAL, INC.
VALUATION AND QUALIFYING ACCOUNTS
(in thousands)
For the years ended December 31, 2010, 2009 and 2008
| Balance at Beginning of Period |
Additions Charged to Expense |
Write-offs, Recoveries and Adjustments |
Balance at End of Period |
|||||||||||||
| Allowance for doubtful accounts receivable |
||||||||||||||||
| Year ended December 31, 2008 |
$ | 82 | $ | 201 | $ | 66 | $ | 217 | ||||||||
| Year ended December 31, 2009 |
$ | 217 | $ | 362 | $ | 182 | $ | 397 | ||||||||
| Year ended December 31, 2010 |
$ | 397 | $ | 110 | $ | 113 | $ | 394 | ||||||||
| Valuation allowance for deferred tax assets |
||||||||||||||||
| Year ended December 31, 2008 |
$ | 13,685 | $ | 17,666 | $ | — | $ | 31,351 | ||||||||
| Year ended December 31, 2009 |
$ | 31,351 | $ | 2,175 | $ | — | $ | 33,526 | ||||||||
| Year ended December 31, 2010 |
$ | 33,526 | $ | 1,208 | $ | — | $ | 34,734 | ||||||||
| Item 9. | Changes in and Disagreements with Accountants on Accounting and Financial Disclosure |
None
| Item 9A. | Controls and Procedures |
Evaluation of Disclosure Controls and Procedures. Our management evaluated, with the participation of our Chief Executive Officer and our Chief Financial Officer, the effectiveness of our disclosure controls and procedures (as defined in Rule 13a-15(e) of the Exchange Act of 1934, as amended) as of the end of the period covered by this Annual Report on Form 10-K. Based on this evaluation, our Chief Executive Officer and our Chief Financial Officer have concluded that our disclosure controls and procedures were effective as of December 31, 2010 to ensure that information we are required to disclose in reports that we file or submit under the Securities Exchange Act of 1934 is recorded, processed, summarized and reported within the time periods specified in Securities and Exchange Commission rules and forms, and that such information is accumulated and communicated to management as appropriate to allow for timely decisions regarding required disclosure.
MANAGEMENT’S REPORT ON INTERNAL CONTROL OVER FINANCIAL REPORTING
Our management is responsible for establishing and maintaining adequate internal control over financial reporting as defined in Rule 13a-15(f) and 15d-15(f) under the Securities Exchange Act of 1934, as amended. Our internal control over financial reporting is designed to provide reasonable assurance regarding the reliability of financial reporting and the preparation of financial statements for external purposes in accordance with generally accepted accounting principles. Because of its inherent limitations, internal control over financial reporting may not prevent or detect misstatements. Also, projections of any evaluation of effectiveness to future periods are subject to the risk that controls may become inadequate because of changes in conditions, or that the degree of compliance with policies or procedures my deteriorate.
To evaluate the effectiveness of internal control over financial reporting, management used the criteria set forth in Internal Control-Integrated Framework, issue by the Committee of Sponsoring Organizations of the Treadway Commission. Based on its assessment using those criteria, management has concluded that we maintained effective internal control over financial reporting as of December 31, 2010.
109
Table of Contents
This annual report does not include an attestation report of the Company’s registered public accounting firm regarding internal control over financial reporting. Management’s report was not subject to attestation by the Company’s registered public accounting firm pursuant to temporary rules of the Securities and Exchange Commission that permit the Company to provide only management’s report in this annual report.
| Item 9B. | Other Information |
None
110
Table of Contents
Certain information required by Part III is omitted from this Annual Report on Form 10-K because the Company will file a Definitive Proxy Statement with the Securities and Exchange Commission within 120 days after the end of our year ended December 31, 2010.
| Item 10. | Directors, Executive Officers of the Registrant and Corporate Governance Matters |
The Information required by this item is incorporated herein by reference to the Proxy Statement.
| Item 11. | Executive Compensation |
The Information required by this item is incorporated herein by reference to the Proxy Statement.
| Item 12. | Security Ownership of Certain Beneficial Owners and Management and Related Stockholder Matters |
The Information required by this item is incorporated herein by reference to the Proxy Statement.
| Item 13. | Certain Relationships and Related Transactions, and Director Independence |
The Information required by this item is incorporated herein by reference to the Proxy Statement.
| Item 14. | Principal Accounting Fees and Services |
The Information required by this item is incorporated herein by reference to the Proxy Statement.
111
Table of Contents
| Item 15. | Exhibits and Financial Statement Schedules |
| (a)(1) | The financial statements required by Item 15(a) are filed in Item 8 of this Annual Report on Form 10-K. |
| (2) | The financial statement schedules required by Item 15(a) are filed in Item 8 of this Annual Report on Form 10-K. |
| (3) | Exhibits |
| Exhibit Number |
Description | |
| 2.14 | Agreement and Plan of Merger and Reorganization dated as of July 7, 2008 by and among the Registrant, Relay Acquisition Company, LLC and Reliant Technologies, Inc. | |
| 2.212 | Agreement and Plan of Merger dated as of February 22, 2010 by and among Solta Medical, Inc., Apollo ATC Merger Corp., Aesthera Corporation and Dana Mead as Holder Representative. | |
| 3.11 | Amended and Restated Certificate of Incorporation of the Registrant as currently in effect. | |
| 3.26 | Certificate of Ownership and Merger of Solta Medical, Inc. dated as of January 12, 2009. | |
| 3.31 | Bylaws of the Registrant as currently in effect. | |
| 4.11 | Specimen Common Stock certificate of the Registrant. | |
| 4.21 | Amended and Restated Investor Rights Agreement dated March 12, 2002 by and among the Registrant and certain stockholders. | |
| 4.312 | Form of Registration Rights Agreement dated January 2010 by and among the Registrant and certain shareholders. | |
| 4.413 | Registration Rights Agreement by and among Solta Medical, Inc. and certain investors, dated as of January 8, 2010. | |
| 4.513 | Form of Warrant to Purchase Common Stock. | |
| 4.612 | Registration Rights Agreement by and among Solta Medical, Inc. and certain investors, dated as of February 22, 2010. | |
| 4.712 | Lock-Up Agreement by and among Solta Medical, Inc. and certain investors, dated February 22, 2010. | |
| 10.11 | Form of Indemnification Agreement for directors and executive officers. | |
| 10.21 | 1997 Stock Option Plan. | |
| 10.31 | 2006 Equity Incentive Plan. | |
| 10.41 | 2006 Employee Stock Purchase Plan. | |
| 10.51 | Sublease Agreement dated September 7, 2004 by and between the Registrant and iAnywhere Solutions, Inc. for office space located at 25881 and 25901 Industrial Boulevard, Hayward, California and exhibits thereto. | |
| 10.61 | Development and Supply Agreement dated October 1, 1997 by and between the Registrant and Stellartech Research Corporation and the amendments thereto. | |
| 10.71 | Service Agreement dated January 14, 2003 by and between the Registrant and Stellartech Research Corporation. | |
| 10.81 | Patent License and Settlement Agreement dated June 3, 2005 by and between the Registrant and Syneron. | |
| 10.91 | Restated and Amended Consulting Agreement dated July 30, 1998 by and between the Registrant and Edward W. Knowlton, M.D. and the amendments thereto. | |
| 10.101 | Restated and Amended Intellectual Property Assignment and License Agreement dated July 30, 1998 by and between the Registrant and Edward W. Knowlton, M.D. | |
| 10.111 | Employment Agreement dated January 7, 2005 by and between the Registrant and Stephen J. Fanning. | |
| 10.121 | Severance Benefit Plan effective as of February 1, 2005. | |
| 10.132 | Form of Notice of Grant for, and Terms and Conditions of, Restricted Stock Units under the 2006 Equity Incentive Plan. |
112
Table of Contents
| Exhibit Number |
Description | |
| 10.142 | Form of Notice of Grant for, and Terms and Conditions of, Restricted Stock under the 2006 Equity Incentive Plan. | |
| 10.152 | Form of Notice of Grant for, and Terms and Conditions of, Stock Options under the 2006 Equity Incentive Plan. | |
| 10.163 | Employment Agreement dated November 5, 2007 by and between the Registrant and John F. Glenn. | |
| 10.175 | Form of Change of Control and Severance Agreement for Chief Executive Officer. | |
| 10.185 | Form of Change of Control and Severance Agreement for Chief Financial Officer and Chief Operating Officer. | |
| 10.195 | Form of Change of Control and Severance Agreement for Vice Presidents. | |
| 10.209 | Customer Agreement between the Registrant and Bear Stearns, a division of J.P. Morgan Chase originally dated as of June 5, 2007. | |
| 10.217 | Loan and Security Agreement, dated as of March 9, 2009, by and between Registrant and Silicon Valley Bank. | |
| 10.227 | Unconditional Guaranty, dated as of March 9, 2009, by Reliant Technologies, LLC in favor of Silicon Valley Bank. | |
| 10.237 | Security Agreement, dated as of March 9, 2009, by and between Reliant Technologies LLC and Silicon Valley Bank. | |
| 10.248 | First Amendment to Loan and Security Agreement between Registrant and Silicon Valley Bank dated March 30, 2009. | |
| 10.2510 | Second Amendment to Loan and Security Agreement between Registrant and Silicon Valley Bank dated June 30, 2009. | |
| 10.2613 | Form of Securities Purchase Agreement dated as of January 7, 2010. | |
| 10.2714 | Third Amendment to Loan and Security Agreement between Solta Medical, Inc. and Silicon Valley Bank dated March 31, 2010. | |
| 10.2815* | Amendment to Non-Competition and Non-Solicitation Agreement, Change of Control and Severance Agreement and Letter Agreement; Release of Claims, dated as of September 15, 2010 by and between Leonard C. DeBenedictis and the Company, and the Non-Competition and Non-Solicitation Agreement, dated as of July 6, 2008 by and between Leonard C. DeBenedictis and the Company. | |
| 10.29 | Fourth Amendment to Loan and Security Agreement between Solta Medical, Inc. and Silicon Valley Bank dated October 15, 2010. | |
| 21.1 | List of Subsidiaries. | |
| 22.116 | Published Report regarding matters submitted to vote of security holders. | |
| 23.1 | Consent of PricewaterhouseCoopers LLP, Independent Registered Public Accounting Firm. | |
| 23.2 | Consent of Deloitte & Touche LLC, Independent Registered Public Accounting Firm. | |
| 24.1 | Power of Attorney (see page 92). | |
| 31.1 | Certification of Chief Executive Officer under Securities Exchange Act Rule 13a-14(a). | |
| 31.2 | Certification of Chief Financial Officer under Securities Exchange Act Rule 13a-14(a). | |
| 32.1 | Certifications of Chief Executive Officer and Chief Financial Officer pursuant to 18 U.S.C. 1350 and Securities Exchange Act Rule 13a-14(b). |
| * | Portions of this exhibit have been omitted pending a determination by the Securities and Exchange Commission as to whether these portions should be granted confidential treatment. |
| 1 | Incorporated by reference from our Registration Statement on Form S-1 (Registration No. 333-136501), which was declared effective on November 9, 2006. |
| 2 | Incorporated by reference from our Current Report on Form 8-K dated February 13, 2007. |
113
Table of Contents
| 3 | Incorporated by reference from our Current Report on Form 8-K dated January 4, 2008. |
| 4 | Incorporated by reference from our Current Report on Form 8-K/A dated July 11, 2008. |
| 5 | Incorporated by reference from our Quarterly Report on Form 10-Q for the quarter ended June 30, 2008. |
| 6 | Incorporated by reference from our Current Report on Form 8-K dated January 12, 2009. |
| 7 | Incorporated by reference from our Current Report on Form 8-K dated March 9, 2009. |
| 8 | Incorporated by reference from our Current Report on Form 8-K dated March 25, 2009. |
| 9 | Incorporated by reference from our Annual Report on Form 10-K dated March 31, 2009. |
| 10 | Incorporated by reference from our Current Report on Form 8-K dated June 30, 2009. |
| 11 | Incorporated by reference from our Current Report on Form 8-K dated January 7, 2010. |
| 12 | Incorporated by reference from our Registration Statement on Form S-3 (Registration No. 333-165618) filed with the Securities and Exchange Commission on March 22, 2010, as amended. |
| 13 | Incorporated by reference from our Current Report on Form 8-K filed with the Securities and Exchange Commission on January 8, 2010. |
| 14 | Incorporated by reference from our Current Report on Form 8-K filed with the Securities and Exchange Commission on April 5, 2010. |
| 15 | Incorporated by reference from our Quarterly Report on Form 10Q dated November 3, 2010. |
| 16 | Incorporated by reference from our Current Report on Form 8-K dated June 3, 2010. |
114
Table of Contents
SIGNATURES
Pursuant to the requirements of the Securities Exchange Act of 1934, the registrant has duly caused this Registration Statement to be signed on its behalf by the undersigned, thereunto duly authorized, in the city of Hayward, State of California, on the 16th day of March 2011.
| SOLTA MEDICAL, INC. | ||
| By: |
/s/ STEPHEN J. FANNING | |
| Stephen J. Fanning President and Chief Executive Officer | ||
POWER OF ATTORNEY
KNOW ALL MEN AND WOMEN BY THESE PRESENTS, that each person whose signature appears below constitutes and appoints Stephen J. Fanning and John F. Glenn, his attorney-in-fact, for him or her in any and all capacities, to sign any amendments to this Annual Report on Form 10-K, and to file the same, with exhibits thereto and other documents in connection therewith, with the U.S. Securities and Exchange Commission, hereby ratifying and confirming all that said attorney-in-fact, or his substitute, may do or cause to be done by virtue thereof.
Pursuant to the requirements of the Securities Exchange Act of 1934, this report has been signed below by the following persons on behalf of the registrant and in the capacities and on the dates indicated.
| Signature |
Title |
Date | ||
| /s/ STEPHEN J. FANNING Stephen J. Fanning |
President, Chief Executive Officer and Director (Principal Executive Officer) |
March 16, 2011 | ||
| /s/ JOHN F. GLENN John F. Glenn |
Chief Financial Officer (Principal Accounting Officer) |
March 16, 2011 | ||
| /s/ HAROLD L. COVERT Harold L. Covert |
Director |
March 16, 2011 | ||
| /s/ EDWARD W. KNOWLTON, MD Edward W. Knowlton, MD |
Director |
March 16, 2011 | ||
| /s/ CATHY L. MCCARTHY Cathy L. McCarthy |
Director |
March 16, 2011 | ||
| /s/ MARK M. SIECZKAREK Mark M. Sieczkarek |
Director |
March 16, 2011 | ||
| /s/ ERIC B. STANG Eric B. Stang |
Director |
March 16, 2011 | ||
| /s/ LINDA GRAEBNER Linda Graebner |
Director |
March 16, 2011 | ||
115