Attached files
| file | filename |
|---|---|
| EX-31.2 - EXHIBIT 31.2 - PROCERA NETWORKS, INC. | ex31_2.htm |
| EX-23.1 - EXHIBIT 23.1 - PROCERA NETWORKS, INC. | ex23_1.htm |
| EX-10.17 - EXHIBIT 10.17 - PROCERA NETWORKS, INC. | ex10_17.htm |
| EX-32.1 - EXHIBIT 32.1 - PROCERA NETWORKS, INC. | ex32_1.htm |
| EX-31.1 - EXHIBIT 31.1 - PROCERA NETWORKS, INC. | ex31_1.htm |
UNITED STATES SECURITIES AND EXCHANGE COMMISSION
Washington, D.C. 20549
FORM 10-K
(Mark One)
|
þ
|
ANNUAL REPORT PURSUANT TO SECTION 13 OR 15(d) OF THE SECURITIES EXCHANGE ACT OF 1934
|
For the fiscal year ended December 31, 2010
|
o
|
TRANSITION REPORT PURSUANT TO SECTION 13 OR 15(d) OF THE SECURITIES EXCHANGE ACT OF 1934
|
For the transition period from to.
Commission file 001-33691
PROCERA NETWORKS, INC.
(Exact name of registrant as specified in its charter)
|
Nevada
|
33-0974674
|
|
|
(State of incorporation)
|
(I.R.S. Employer Identification No.)
|
|
|
|
|
|
|
100C Cooper Court
|
95032
|
|
|
Los Gatos, California
|
(Zip Code)
|
|
|
(Address of principal executive offices)
|
|
Registrant’s telephone number, including area code: (408) 890-7100
Securities registered pursuant to Section 12(b) of the Act
|
Title of Each Class
|
Name of Each Exchange on Which Registered
|
|
|
Common Stock par value $0.001 per share
|
NYSE Amex Equities
|
Securities registered pursuant to Section 12(g) of the Act:
None
Indicate by check mark if the registrant is a well-known seasoned issuer, as defined in Rule 405 of the Securities Act. Yes o No þ
Indicate by check mark if the registrant is not required to file reports pursuant to Section 13 or Section 15(d) of the Act. Yes o No þ
Indicate by check mark whether the registrant: (1) has filed all reports required to be filed by Section 13 or 15(d) of the Securities Exchange Act of 1934 during the preceding 12 months (or for such shorter period that the registrant was required to file such reports), and (2) has been subject to such filing requirements for the past 90 days. Yes þ No o
Indicate by check mark whether the registrant has submitted electronically and posted on its corporate Web site, if any, every Interactive Data File required to be submitted and posted pursuant to Rule 405 of Regulation S-T during the preceding 12 months (or for such shorter period that the registrant was required to submit and post such files). Yes o No o
Indicate by check mark if disclosure of delinquent filers pursuant to Item 405 of Regulation S-K is not contained herein, and will not be contained, to the best of the registrant’s knowledge, in definitive proxy or information statements incorporated by reference in Part III of this Form 10-K or any amendment to this Form 10-K. o
1
Indicate by check mark whether the registrant is a large accelerated filer, an accelerated filer, a non-accelerated filer, or a smaller reporting company. See the definitions of “large accelerated filer,” “accelerated filer” and “smaller reporting company” in Rule12b-2 of the Exchange Act. (Check one):
|
Large accelerated filer o
|
Accelerated filer þ
|
|
|
Non-accelerated filer o
(Do not check if a smaller reporting company)
|
Smaller reporting o
|
Indicate by check mark whether the registrant is a shell company (as defined in Rule 12b-2 of the Exchange Act). Yes o No þ
The aggregate market value of the voting stock held by non-affiliates of the registrant on June 30, 2010, based upon the closing price of common stock on such date as reported on the NYSE Amex Equities, was approximately $50,345,817. Shares of voting stock held by directors, officers and stockholders or stockholder groups whose beneficial ownership exceeds 5% of the registrant’s common stock outstanding have been excluded in that such persons may be deemed to be affiliates. The number of shares owned by stockholders whose beneficial ownership exceeds 5% was determined based upon information supplied by such persons and upon Schedules 13D and 13G, if any, filed with the Securities and Exchange Commission. This assumption regarding affiliate status is not necessarily a conclusive determination for other purposes.
The number of shares of common stock outstanding as of March 10, 2011 was 11,351,978.
DOCUMENTS INCORPORATED BY REFERENCE
Portions of the registrant’s definitive Proxy Statement for its 2011 Annual Stockholders’ Meeting are incorporated by reference into Part III of this Annual Report on Form 10-K, to be filed within 120 days of the registrant’s fiscal year ended December 31, 2010.
2
PROCERA NETWORKS, INC.
Form 10-K
ANNUAL REPORT
TABLE OF CONTENTS
|
4
|
||||
|
|
Item 1.
|
|
4
|
|
|
|
Item 1A.
|
|
14
|
|
|
|
Item 1B.
|
|
24
|
|
|
|
Item 2.
|
|
24
|
|
|
|
Item 3.
|
|
25
|
|
|
|
Item 4.
|
|
25
|
|
|
26
|
||||
|
|
Item 5.
|
|
26
|
|
|
|
Item 6.
|
|
28
|
|
|
|
Item 7.
|
|
29
|
|
|
|
Item 7A.
|
|
39
|
|
|
|
Item 8.
|
|
40
|
|
|
|
Item 9.
|
|
65
|
|
|
|
Item 9A.
|
|
65
|
|
|
|
Item 9B.
|
|
66
|
|
|
67
|
||||
|
|
Item 10.
|
|
67
|
|
|
|
Item 11.
|
|
67
|
|
|
|
Item 12.
|
|
67
|
|
|
|
Item 13.
|
|
67
|
|
|
|
Item 14.
|
|
67
|
|
|
68
|
||||
|
|
Item 15.
|
|
68
|
|
|
|
71
|
|||
|
|
73
|
|||
|
Exhibit 10.17
|
||||
|
|
Exhibit 23.1
|
|
||
|
|
Exhibit 31.1
|
|
||
|
|
Exhibit 31.2
|
|
||
|
|
Exhibit 32.1
|
|
||
In addition to historical information, this Annual Report on Form 10-K contains forward-looking statements regarding our strategy, financial performance and revenue sources that involve a number of risks and uncertainties, including those discussed under the title “RISK FACTORS” in Item 1A. Forward-looking statements in this report include, but are not limited to, those relating to our potential for future revenues, revenue growth and profitability; markets for our products; our ability to continue to innovate and obtain patent protection; operating expense targets; liquidity; new product development; the possibility of acquiring (and our ability to consummate any acquisition of) complementary businesses, products, services and technologies; the geographical dispersion of our sales; expected tax rates; our international expansion plans; and our development of relationships with providers of leading Internet technologies.
While these forward-looking statements represent our current judgment on the future direction of our business, such statements are subject to many risks and uncertainties which could cause actual results to differ materially from any future performance suggested in this Annual Report due to a number of factors, including, without limitation, our ability to produce and commercialize new product introductions, particularly our acceleration-related technologies; our ability to successfully compete in an increasingly competitive market; the perceived need for our products; our ability to convince potential customers of the value of our products; the costs of competitive solutions; our reliance on third party contract manufacturers; continued capital spending by prospective customers and macro-economic conditions. Readers are cautioned not to place undue reliance on the forward-looking statements, which speak only as of the date of this Annual Report. We undertake no obligation to publicly release any revisions to forward-looking statements to reflect events or circumstances arising after the date of this document, except as required by law. See “RISK FACTORS” appearing in Item 1A. Investors may access our filings with the Securities and Exchange Commission, including our annual reports on Form 10-K, our quarterly reports on Form 10-Q, our current reports on Form 8-K and amendments to such reports on our website, free of charge, at www.proceranetworks.com, but the information on our website does not constitute part of this Annual Report.
Throughout this Annual Report on Form 10-K, we refer to Procera Networks, Inc., a Nevada corporation, as “Procera” or the “Company” and, together with its consolidated subsidiaries, as “we,” “our” and “us,” unless otherwise indicated. Any reference to “Netintact” refers to our wholly owned subsidiaries, Netintact, AB, a Swedish corporation and Netintact, PTY, an Australian corporation.
|
Business
|
We are a leading provider of Intelligent Policy Enforcement, or IPE, solutions that enable mobile and broadband network operators and entities managing private networks including higher education institutions, businesses and government entities (collectively referred to as network operators) to gain enhanced visibility into, and control of, their networks. Our solutions provide granular network intelligence to enable network operators to improve the quality and longevity of their networks, better monetize their network infrastructure investments, control security hazards and create and deploy new services for their users. The intelligence we provide about users and their usage enables qualified business decisions. Our network operator customers include mobile service providers, broadband service providers, cable multiple system operators, or MSOs, Internet Service Providers, or ISPs, educational institutions, enterprises and government agencies.
Our IPE products are part of the high-growth market for mobile packet and broadband core products. The market for IPE products is expected to grow from $249 million in 2009 to $1.5 billion in 2014 according to Infonetics Research, a compound annual growth rate (“CAGR”) of 44%. Our bundled products deliver a solution that is a key element of the mobile packet and broadband core ecosystems. Our solutions are often integrated with additional elements in the mobile packet and broadband core including Policy Management and Charging functions and are compliant with the widely adopted 3rd Generation Partnership Program, or 3GPP, standard. In order to respond to rapidly increasing demand for network capacity due to increasing subscribers and usage, network operators are seeking higher degrees of intelligence, optimization, network management, service creation and delivery in order to differentiate their offerings and deliver a high Quality of Experience, or QoE, to their subscribers. We believe the need to create more intelligent and innovative mobile and broadband networks will continue to drive demand for our products.
Our products are marketed under the PacketLogic brand name. We have a broad spectrum of products delivering IPE at the access, edge and core layers of the network. Our products are designed to offer maximum flexibility to our customers and enable differentiated services and revenue-enhancing applications, all while delivering a high Quality of Service, or QoS for subscribers.
We were founded in 2002 and became a public company in October 2003 following our merger with Zowcom, Inc., a publicly-traded Nevada corporation. In 2006, we completed acquisitions of the Netintact entities. Our Company is headquartered in Los Gatos, California with regional headquarters in Varberg, Sweden and Singapore. We sell our products through our direct sales force, resellers, distributors and systems integrators in the Americas, Asia Pacific and Europe.
Industry Background
Network traffic has risen sharply in recent years as a result of the advent of ubiquitous broadband Internet Protocol, or IP, and mobile networks covering an increasing portion of the world’s population, the proliferation of sophisticated edge devices including smartphones, tablets and laptops and the rise in connections, communications, social networking and data-intensive applications. We refer to this new era of hyper-connectivity as the New Digital Lifestyle. According to the Cisco Visual Networking Index, the sum of all forms of global IP traffic reached 20,396 petabytes, or PB, per month as of 2010 and is expected to grow to 63,904 PB per month in 2014, a CAGR of 33%.
Mobile data networks are an essential tool in the New Digital Lifestyle for streaming video, social networking and collaboration. Consumers are accessing content from multiple mobile broadband connections. Social networking, applications and entertainment content live in the cloud and without quality access to the Internet, the New Digital Lifestyle is disrupted. As networks advance in capabilities with faster, high-capacity networks, new advanced devices and applications will spur more competition for bandwidth. This results in greater network congestion, causing network operators to balance subscriber demand for network bandwidth with the cost of building additional capacity. In addition, network providers must be able to adapt to evolving user behavior by rapidly introducing new services and business models to keep pace with demand. IPE enables mobile and broadband network operators to provide unprecedented levels of personalization, service optimization, network assurance and rapid service creation to monetize network investments. A critical element for network operators to keep pace with demand and cope with evolving user behavior is to gain as much insight as possible into network activity.
3GPP Policy Ecosystem
Within 3GPP, a framework has been defined for Policy Management and Policy Enforcement:
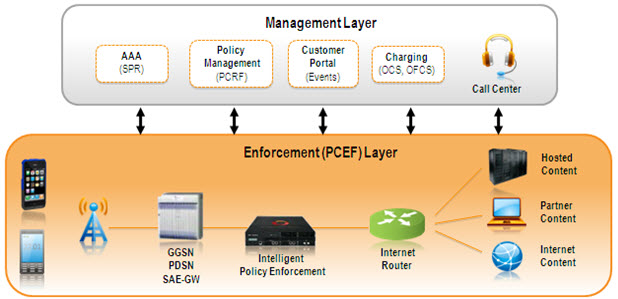
With the policy framework established by 3GPP, a management layer and an enforcement layer were created to control user behavior and network provisioning. The Policy and Charging Rules Function, or PCRF, was established as the policy decision point that establishes the policies that are applied to subscribers and mobile data traffic on the network. The management layer on the network has specifically defined protocols for interacting with the network layer to translate the policy decisions into policy enforcement.
The policy enforcement layer on the network is designed to enforce policies as instructed by the policy management layer. However, different devices on the network have different levels of visibility and intelligence, translating to different capabilities for enforcing policies. More intelligent network elements can implement more sophisticated policies. Sophisticated policies go far beyond simple byte counters or session timers that are used today and can include subscriber, location, device and application awareness. Awareness gives a powerful advantage in the policy enforcement and billing ecosystem in that policy enforcement “instructions” for highly aware network elements can be much simpler than for “un-aware” enforcement points. A contrasting example of this scenario would be if a PCRF is informed of congestion on a specific location, an intelligent policy enforcement point could be passed an instruction to “prioritize real-time applications at Site A”, where an un-aware enforcement point would need to pass a number of new rules that might match specific devices and flows using access control lists, or a much less sophisticated congestion management policy that might make all users equally unhappy. The signaling load on the network will be considerably lower on an intelligent network than on an unaware network, as intelligent systems have a greater awareness of location, devices and applications for each active subscriber on the network.
IPE enables mobile and broadband network operators to provide exceptional levels of personalization, service optimization, network assurance and rapid creation of business models to monetize network investments. IPE uses Deep Packet Inspection, or DPI, technology as the core technology to gain awareness of subscribers, location, devices and applications. This awareness can then be used with the 3GPP policy ecosystem to deliver superior collection of services and applications to mobile and broadband networks. Features of IPE include:
Business Intelligence – Monitors application and usage trends in order to offer more compelling service packages to subscribers in a timely fashion. The ability to innovate applications and service bundles includes creating new services targeted to specific consumer groups, age groups or application users with fast time to market with minimal cost.
Network Optimization – Ensures that network resources are used most effectively throughout the network, including high touch services for high usage subscribers and formatted for specific device types. Included in network optimization is the ability to manage network congestion by understanding the root cause for the congestion and effectively resolving it to deliver higher QoE to subscribers without excessive capital expenditures.
Network Protection – Reacts quickly to network threats and attacks to minimize subscriber impact and QoE, as well as protects network integrity.
Bill Shock Prevention – Prevents user churn due to excessive roaming charges, data usage or distributed denial of service attacks that can inflate a subscriber’s bill.
Industry Growth Catalysts
According to Infonetics Research, the market for IPE products is expected to grow from $249 million in 2009 to $1.5 billion in 2014, a CAGR of 44%. The increasing necessity for Policy Management and IPE will be spurred by growing subscriber demand for mobile content and applications, coupled with the network operators’ need to control usage, cost and create new personalized services. Growth will be aided in part by:
Increase in global broadband users – Broadband connectivity has become ubiquitous, particularly as developing markets continue to gain broadband access. According to reports by Gartner and International Data Corporation, or IDC, the total number of broadband users, both mobile and fixed broadband, is expected to increase from 498 million at the end of 2010 to approximately 1.1 billion by 2014, a CAGR of 23%. This is primarily driven by the growth in mobile broadband users, expected to grow at a CAGR of 143% to 487 million connections. This increase in the number of broadband users is placing significant stress on bandwidth capacity. Operators need to implement new tiered service plans and business models that utilize Policy Management and IPE solutions in order to effectively manage their user growth and sustain a high level of QoS.
Device penetration – Mobile network operators have made significant investments in new technology to increase network performance and alleviate bandwidth congestion. At the same time, new mobile devices, including smartphones and tablets, are being introduced to take advantage of higher capacity 3G and LTE networks. IDC forecasts that smartphone shipments will increase from 293 million in 2010 to 702 million in 2014, a CAGR of 24%. Over the same period, Gartner predicts that tablets will increase from 21 million in 2010 to 208 million in 2014, a CAGR of 78%. Unlike legacy devices, new smartphones and tablets are designed to take advantage of data-intensive services, like video and gaming, which will deplete available capacity. Mobile network operators need to adopt Policy Management and IPE solutions that provide more sophisticated network control and include subscriber, location, device and application awareness.
Competitive pressure across network operators – The competition among network operators continues to increase as they battle for the latest generation of broadband users and seek to capture new revenue opportunities. It is incumbent upon network operators to simultaneously upgrade their networks and improve user QoS and QoE to grow their subscriber base. Operators who adapt best to the evolving requirements of their users with more flexible business models and service plans will be well positioned to attract and retain subscribers. In order to do so, operators will need to integrate Policy Management and IPE solutions into their existing network infrastructure.
Industry Challenges
The industry is also faced with a number of challenges as an increasing amount of bandwidth is necessary to run increasingly sophisticated and data-intense applications. These network operator challenges include:
De-coupling of usage and revenue – Over the last few years, network capacity and service speeds have increased along with progressively sophisticated edge devices connected to the network such as smartphones, tablets and laptops, resulting in a tremendous surge of network traffic. A large catalyst of this surge is the ease of capture, ingestion and delivery of video, coupled with emerging business models for video publishing. In addition, new business models and the increasing popularity of applications have turned mobile handsets into mobile entertainment devices. However, this surge in traffic has not been accompanied by a similar rise in revenue in large part due to unlimited usage subscriptions and application models that have circumvented the carrier billing system, excluding the service providers’ revenue participation.
Multiple devices per user – As the New Digital Lifestyle becomes more pervasive, users in developed markets are increasingly adopting sophisticated devices. In addition to smartphones, a typical user can have multiple devices connected to the network, including tablets, e-readers, netbooks, laptops, televisions, gaming devices, digital music players, cameras and more. This incremental device population is increasing traffic on the network, often without associated revenue.
New data-intensive applications – The advent of smartphones and tablets has enabled an ecosystem of applications that are increasing in popularity among users. Many of these applications are free to download and use, but are very data-intensive. Social networking applications in particular result in constant subscriber connectivity and frequent information synchronization, which translates to higher session counts per user.
Limited service differentiation – Mobile and broadband network operators have been limited in their ability to view and identify network traffic, which has therefore limited their ability to appropriately charge and differentiate themselves by offering advanced services.
Our Technology
The foundational element of our IPE solutions is our Datastream Recognition Definition Language, or DRDL, DPI technology. DRDL facilitates a broad range of criteria to properly identify the application of each individual datastream. The identification relies on bidirectional information including header information, protocol, actual payload and other distinguishing characteristics of an application. This allows DRDL to properly identify even encrypted applications.
The standard-syntax language of DRDL enables rapid development of new signatures. The DRDL database currently consists of approximately 2,000 signatures. DRDL interconnects control and data sessions of protocols like File Transfer Protocol (“FTP”). During the identification process DRDL aggregates detailed traffic properties like Multipurpose Internet Mail Extensions (“MIME”)-type, filename, chat channel and Session Initiation Protocol (“SIP”) caller ID. A unique and integral feature of DRDL is the classification function. Connection flags classify the traffic based on its behavior. Typical classifications are “interactive”, “streaming”, “random-looking” and “bulky”. This enables operators to set preferences on unidentifiable traffic or when they need to be application agnostic.
Our technology has several advantages that we extend to our mobile and broadband network operator customers, including:
Service Flexibility – Our DRDL technology allows for a high degree of service flexibility. Our Subscriber Model is highly configurable to meet the varying needs of our customer base. We also enable our customers to provide mass personalization for their subscriber base, creating and delivering services based on individual customer needs and behaviors. Lastly, we allow our customers to provide tiered service levels based on usage or by application.
Granular Accuracy – We also have deep visibility into our customers’ networks, providing visibility to a subscriber level to determine location and device usage to enable a high degree of personalization and customer service. It also allows our customers to enforce policies on their network.
Performance & Scalability – Our DRDL technology is extremely robust and has industry-leading performance that supports millions of subscribers and tens of thousands of transactions per second.
Real-Time Analytics – All of our analytics are delivered in real-time, providing up-to-the-second visibility to our customers of subscriber location, behavior and activity. This allows our customers to deliver a high degree of QoS to their subscribers and manage network capacity. Our technology delivers detailed business intelligence and reports, and has deep application visibility.
Our Products & Solutions
We deliver IPE solutions for network operators, leveraging our industry-leading DRDL DPI technology. We believe our family of PacketLogic solutions is one of the engines that can drive the New Digital Lifestyle. Our solutions empower broadband providers with the ability to support more subscribers and services on their network with high performing and highly-scalable IPE systems. Our IPE solutions support deep levels of awareness and a broad universe of applications, enabling richer services to be offered to consumers. Our analytics provide highly relevant business intelligence reports that enable broadband and mobile operators to better understand consumer trends and rapidly respond to the dynamic application landscape.
Product Lines
Our IPE solutions are powered by our three main product lines:
PacketLogic Subscriber Manager (PSM) – Our PSM solution integrates PacketLogic with subscriber, charging and policy management systems. This integration enables IPE and the creation of innovative services based on user, location and device awareness. Personalized services can be created to attract new customers, minimize churn and increase average revenue per user through value-add services. Location awareness permits mobile operators to resolve or avoid congestion, enhancing the user-experience and minimizing capital expenses. It can also control roaming costs through automatic policy enforcement to comply with governmental regulations.
PacketLogic Intelligence Center (PIC) – Our PIC enables visualization of the application and subscriber intelligence gathered by our PacketLogic systems. Leveraging the subscriber and location awareness provided by the PSM and the application intelligence provided by our real-time enforcement platform, the PIC is able to present a wealth of information to the network operator based on the behavior of their network. The intelligence can be presented in a multi-dimensional format, with per user, application, location and device views available for business intelligence and planning. The PIC gives network managers access to relevant network traffic intelligence that facilitates network optimization, creation of appealing services and protection against malicious behavior.
PacketLogic Real-Time Enforcement Platform (PRE) – Our PRE solution utilizes multiple hardware platforms that run the same operating software. Each of the platforms offers consistent and enriched features through our PacketLogic software. The PacketLogic hardware platforms offer a range of configurations from the entry-level 200 Mbps PL5600 to the 2 Gbps PL7720. The PL8720 is a 2 rack unit with up to 15Gbps throughput, and the PL8820 is a 2RU unit with up to 30Gbps throughput. At the top of the line is the high-end PL10000 series with capacity up to 120 Gbps and 10 million subscribers per system. It consists of a modular AdvancedTCA chassis solution in two sizes – PL10005 5RU and PL10014 12RU.
Product Features
Our IPE solutions provide a deep visualization of network traffic and subscriber behavior that enables our customers to provide high QoS to their subscribers, both by maintaining network integrity and performance, as well as deploying new services demanded by their subscribers and creating additional revenue opportunities. Our product features include the following:
Awareness – Enabling the New Digital Lifestyle requires superior awareness of subscribers’ characteristics and behaviors to ensure that a high level of QoE is delivered. These characteristics and behaviors include subscriber location, device and application usage. Our solutions provide a high level of visibility through our DRDL traffic classification engine and the interaction with our PSM, which delivers comprehensive subscriber, location and device awareness.
Analysis – Mobile and broadband network operators require detailed reporting of subscriber behavior and evolving consumer trends. Our PIC ensures that mobile and broadband network operators understand what applications are most prevalent among their user base, where those applications are utilized most frequently and how changes in service plans affect network congestion. PIC delivers succinct, digestible and customizable reports that drive profitable services and efficient network management.
Control – Through our IPE solution we provide alternative service creation and congestion management for mobile and broadband network operators. Our solutions are designed for maximum implementation flexibility, and can be customized for each deployment to fit the business, financial and regulatory needs of each network operator.
Product Benefits
Our solutions provide many benefits to our broadband and mobile customers.
Superior Accuracy – Our proprietary DRDL software solution allows us to provide our customers with a high degree of application identification accuracy and the flexibility to regularly update our software to keep up with the rapid introduction of new applications.
Higher Scalability – Our family of products is scalable from a few hundred megabits to 120 gigabits of traffic per second, up to 10 million subscribers and up to 120 million simultaneous data flows, which is critical to service providers as they upgrade to LTE (enabling higher bandwidth mobile phone networks), FTTX (high bandwidth fiber to the home or neighborhood used by telecom broadband network providers) and DOCSIS 3.0 (a high bandwidth broadband cable standard) technologies in the access network.
Platform Flexibility – Our products are deployable in many locations in the network and leverage off-the-shelf hardware. Our products can rapidly leverage advances in computing technology which we believe to be a better solution than those that are dependent upon specific network silicon processors or hardware platforms.
Global Services
Our products and solutions are supported by our Global Services team that provides a suite of services that include both pre- and post-sales technical support to our direct field sales organization, channel partners and customers; professional services for planning, implementation and deployment; customer services for support post-deployment; training for our customers to maximize use of our IPE products and solutions; and consulting services to assist in all service phases from initial planning and evaluation to onsite testing and operation. Customers also have access to the technical support team via a web-based partner portal, email and interactive chat forum. Issues are logged and tracked using a computerized tracking system that provides automatic levels of escalation and quick visibility into problems by our Research and Development organization. This tracking system also provides input to our development team for new feature requests from our worldwide customer base.
Limitations of Alternative Solutions
We believe that first-generation IPE products have significant deficiencies, perhaps the greatest of which is their limited ability to accurately identify traffic types and applications. Because the first-generation IPE products provide limited visibility into traffic flows, they provide a limited ability to manage network traffic. First-generation IPE products were a good start at introducing network operators to the value of network visibility, and introduced the opportunity to provide some level of differentiated services. As applications have become more complex and increasingly web-based, differentiating between applications has become more challenging to products that have limited application signatures used to identify network traffic and less sophisticated application identification mechanisms.
Growth Strategy
Our goal is to become the leading provider of IPE solutions to mobile and broadband network operators on a global scale. We believe our PacketLogic solutions position us to capture an increasing share of the growing IPE market. We plan to achieve our strategic growth objectives through the following efforts:
Expand our technology advantage – Our technology was designed with the ability to rapidly identify new application signatures, and thereby adapt to a dynamic IP network environment across multiple hardware platforms. We are further developing our products and solutions based on feedback from our customers and industry experts as well as our ongoing research and development of technology, products and solutions that we believe will add value to our customers. We intend to build upon our innovations, continue to release leading-edge products with state-of-the-art capabilities and regularly release new solution features and performance upgrades.
Expand our customer footprint with leading mobile and broadband network operators – Our PacketLogic product line provides us with a solution that can address the network needs of leading mobile and broadband network operators. We have built a team with deep network operator experience, both from a technology perspective and from selling into network operators. We have experienced significant traction in the network operator space, and these achievements have provided us with improved access to potential customers and valuable references, which we believe will continue to enhance our sales growth effort. In addition, we intend to increase our indirect distribution channel. We intend to utilize existing value added reseller partners and to add new partners to increase our ability to address geographic regions and a greater quantity of customers.
Pursue new partnerships – We intend to establish partnerships with complementary mobile packet core ecosystem vendors to increase the value we can provide and gain additional access to leading mobile and broadband network operators. We intend to provide broader solutions by bundling our products with complementary products and technologies from other solution providers. The flexibility of our software platform has the potential to efficiently integrate with complementary solutions and thereby deliver greater benefits to our customers and enhance our ability to compete against competitors whose solutions are more hardware constrained.
Maximize opportunities with existing customers by increasing our share within their network footprint – We seek to increase our market share within our existing customers’ networks by expanding our product footprint within these networks. Typically, our first order from a new network operator represents a small portion of their total network as measured by either a single product function or by geography. We believe we can successfully sell additional solutions to our existing customers following their initial purchase as they realize the benefits of our products and seek to extend their IPE capabilities throughout their networks. In addition, many service providers operate dual networks (i.e., mobile and broadband) and in these instances, we believe there are opportunities for us to offer our solutions for each network. We have many captive mobile and broadband network operators that are well positioned to increase service creation and network performance. We believe we are well positioned to experience tremendous growth with these customers as they build out their capabilities and infrastructure.
Customers
We sell our products and solutions directly and indirectly to our end-customers. As of December 31, 2010, we had over 600 customers throughout North America, Europe and Asia. Our customers are mobile and broadband network operators. Broadband network operators include MSOs, telecommunications companies, ISPs and private network operators. Our customers either serve subscriber customers or operate private networks such as a university campus, or enterprise or government agency networks.
Our current customers and anticipated future customers include the following:
Mobile Network Operators – Mobile network operators are constrained by the bandwidth of their wireless signals and infrastructure. Additional upgrades in bandwidth and network infrastructure are immediately consumed by new applications and devices that place greater stress on the network. Managing network traffic and broadband usage more intelligently can greatly improve QoS and QoE for subscribers and save significant resources for operators.
MSOs – MSOs are constrained by the bandwidth of their network and the varying number of users connecting to any given loop in the network. Controlling network traffic by application type can greatly improve the quality of the experience of the average subscriber.
Fixed-Line Telecommunications Network Operators – Fixed-line telecommunications network operators use fiber infrastructure or digital subscriber lines to offer broadband services to end customers. Many fixed-line telecommunications network operators also operate mobile networks and provide either bundled service to end customers or mobile and broadband service on a stand-alone basis. These service bundles are increasingly including video services as networks increase in capacity and capabilities. Adding intelligence to their networks can help them offer differentiated services.
ISPs – ISPs generally lease, rather than own, access infrastructure. They compete by attempting to offer the best of breed Internet service. ISPs' greatest competitive advantages are brand and customer relationships. IPE solutions can improve the performance of ISPs by making the use of their bandwidth more efficient and by allowing them to offer best of breed quality.
Education, Business and Government Entities – Universities generally provide Internet access to students, faculty and employees. Universities are particularly vulnerable to low QoS for legitimate educational purposes because students frequently make extensive use of high-bandwidth applications such as peer-to-peer services. Businesses and government entities rely on large and complex networks for communication infrastructure. They typically rely on service providers for Internet access and interconnectivity, and can use IPE to optimize the use of their expensive network resources, prioritize business critical applications and limit leisure or unauthorized use of expensive network resources.
We are currently not dependent on any single customer. For the years ended December 31, 2010 and 2009, revenue from one customer (Cox Communications, Inc.) represented 11% and 44% of net revenues, respectively, with no other single customer accounting for more than 10% of net revenues. For the year ended December 31, 2008, revenue from two customers represented 16% and 10% of net revenues, respectively, with no other single customer accounting for more than 10% of net revenues.
Foreign Operations
Sales made to customers located outside the United States as a percentage of total net revenues were 41%, 38% and 82% for the years ended December 31, 2010, 2009 and 2008, respectively. Revenues derived from foreign sales generally are subject to additional risks such as fluctuations in exchange rates, tariffs, the imposition of other trade barriers, and potential currency restrictions. To date, however, the Company has experienced no notable burden from such risks. Further information regarding our foreign operations, as required by Item 101(d) of Regulation S-K, can be found in the Consolidated Financial Statements and related notes herein.
Partners
We have established critical technology, distribution and business partnerships to further promote our brand and suite of solutions for network operators. We believe our partnerships provide an immediate opportunity to extend our capabilities into adjacent, complimentary points within the mobile packet core and broadband core. For example, we recently announced a joint solution with one of our key technology partners that provides integrated policy management and PCRF functionality on top of our IPE platform.
Competition
The market for our products and services is highly competitive as mobile and broadband network operators seek to manage the rapid growth of data on both broadband and mobile networks. Our primary competitors include:
|
|
·
|
Allot Communications Ltd.;
|
|
|
·
|
Arbor Networks (acquired by Tektronix);
|
|
|
·
|
Blue Coat Systems;
|
|
|
·
|
Cisco Systems, Inc.;
|
|
|
·
|
Cloudshield Technologies (acquired by SAIC); and
|
|
|
·
|
Sandvine Corporation.
|
We also face competition from vendors supplying platform products with some limited IPE functionality, such as switches & routers, session border controllers and VoIP switches. In addition, we face competition from large integrators that package third-party IPE solutions into their products, including Alcatel-Lucent, Ericsson, Huawei Technologies Company and Nokia Siemens. It is possible that these companies will develop their own IPE solutions or strategically acquire existing IPE vendors in the future.
Most of our competitors are larger and have greater access to capital than we do. Nevertheless, we do not believe there is an entrenched dominant supplier in our market. We believe that our technological advantages provide an opportunity for us to capture increased market share and benefit from the expected growth in the IPE market. Given the lack of an established leader and the potential growth in the market, we expect competition to intensify.
Our primary method of differentiation from our competition is our IPE DRDL technology, which we believe to be a superior solution that enables service providers advanced identification of network traffic. However, we also believe we effectively compete with respect to price and service. Our products now address service provider requirements ranging from four megabit (edge applications) to the 120 gigabit per second market (core applications).
Sales and Marketing
We use a combination of direct sales and channel partnerships to sell our products and services. As of December 31, 2010, we had 20 employees in Sales and channel partners worldwide, including one of the largest original equipment manufacturers globally. We also engage a worldwide network of value added resellers to reach particular geographic regions and markets.
Our marketing organization is focused on building our brand awareness, managing channel marketing efforts and supporting our sales force in additional capacities. As of December 31, 2010, we had 4 marketing professionals globally.
Research and Development
We have built a team of skilled software programmers who continue to develop enhancements to our PacketLogic modules and proprietary DRDL processing software engine. We have enhanced our products with features and functionality to address the needs of mobile and broadband network operators, as well as to provide new functionality for network protection and subscriber management. As of December 31, 2010 we had 25 employees in research and development. Substantially all of our research and development is performed by our employees in Sweden. Our research and development costs were $3.3 million, $2.6 million and $3.3 million for the years ended December 31, 2010, 2009 and 2008, respectively.
Intellectual Property
Our intellectual property is central to our competitive position and our future success will depend on our continued ability to protect our core technologies. We believe that our DRDL signature compiler, and the inherent complexity of our software-based PacketLogic solution, makes it difficult to copy or replicate our features. We rely primarily on trademark law, trade secret protection and contractual rights to protect our intellectual property in our proprietary software. To help ensure this protection, we include proprietary information and confidentiality provisions in our agreements with customers, third parties and employees.
Manufacturing
We outsource the manufacturing of our hardware and software to a select group of contract manufacturing partners. We have negotiated minimum production quantities and lead times in our contracts to prevent supply shortages. We or our manufacturing partners will then load our proprietary software for specific orders, final testing and fulfillment. We believe that our manufacturing process allows us to focus on development of our PacketLogic software solution, reduce manufacturing costs and more quickly adjust to changes in demand. We have not historically experienced any production capacity shortages and do not foresee a need to alter our manufacturing process in the future.
We source completed hardware boards and chassis included in our products from leading industry suppliers, including Continuous Computing Corporation, Advantech Technologies Inc, and Lanner Electronics, Inc. All of the hardware used in our products is comprised of standard off-the-shelf components which are less susceptible to supply shortages and significant lead times. We believe our reliance on standard hardware components facilitates quicker time to market, rapid design cycles and the ability to take advantage of the latest semiconductor industry advances.
Employees
As of December 31, 2010, we had 63 full-time employees and 7 full-time independent contractors, including 7 operations and technical support employees, 25 research and development employees, 24 sales and marketing employees and 7 employees in general and administrative. As of December 31, 2010, our headcount was 22 employees in the United States, 37 employees in Sweden, and 4 employees in Australia, Singapore and Korea.
Our Executive Officers and Significant Employees
Set forth below are the name, age, position(s), and a description of the business experience of each of our executive officers and significant employees as of March 10, 2011:
|
Name
|
Age
|
|
Position(s)
|
Employee Since
|
|
James F. Brear
|
45
|
|
President, Chief Executive Officer and Director (Principal Executive Officer)
|
2008
|
|
Charles Constanti
|
47
|
|
Vice President and Chief Financial Officer (Principal Financial & Accounting Officer)
|
2009
|
|
Alexander Hдvang
|
32
|
|
Chief Technical Officer
|
2006
|
|
Paul Gracie
|
50
|
|
Vice President, Sales-Europe, Middle East & Africa (EMEA)
|
2009
|
|
Jon Lindйn
|
36
|
|
Vice President, Marketing
|
2008
|
|
David Ahee
|
44
|
|
Vice President, Sales-Americas
|
2009
|
|
Benjamin Teh
|
37
|
Vice President, Sales-Asia Pacific & China (APAC)
|
2010
|
James F. Brear joined us as our President, Chief Executive Officer and a member of our Board of Directors in February 2008. Mr. Brear is an industry veteran with more than 20 years of experience in the networking industry, most recently as Vice President of Worldwide Sales and Support for Bivio Networks, a maker of deep packet inspection platform technology, from July 2006 to January 2008. From September 2004 to July 2006, Mr. Brear was Vice President of Worldwide Sales for Tasman Networks, a maker of converged WAN solutions for enterprise branch offices and service providers for managed WAN services. From April 2004 to July 2004, Mr. Brear served as Vice President of Sales at Foundry Networks, a provider of switching, routing, security and application traffic management solutions. Earlier in his career, Mr. Brear was the Vice President of Worldwide Sales for Force10 Networks from March 2002 to April 2004, during which time the company grew from a pre-revenue start-up to the industry leader in switch routers for high performance Gigabit and 10 Gigabit Ethernet. In addition, he spent five years with Cisco Systems from July 1997 to March 2002 where he held senior management positions in Europe and North America with responsibility for delivering more than $750 million in annual revenues selling into the world's largest service providers. Previously, Mr. Brear held a variety of sales management positions at both IBM and Sprint Communications. He holds a Bachelor of Arts degree from the University of California at Berkeley.
Charles Constanti joined us as our Chief Financial Officer in May 2009 and has over 25 years of public company financial experience. Most recently, Mr. Constanti was the vice president and CFO of Netopia, Inc., a telecommunications equipment and software company, from April 2005 until its acquisition in February 2007 by Motorola, Inc., where he held a senior finance position until May 2009. From May 2001 to April 2005, Mr. Constanti was the vice president and corporate controller of Quantum Corporation, for which he earlier served in different accounting and finance positions since January 1997. Previously, Mr. Constanti held various finance positions at BankAmerica Corporation and was an auditor for PricewaterhouseCoopers. Mr. Constanti is a certified public accountant. He earned a B.S., magna cum laude, in Accounting from Binghamton University.
Alexander Haväng has been our Chief Technology Officer since August 2006 when we acquired Netintact AB. Mr. Haväng was a founder of Netintact AB, which was formed in August 2000. Mr. Haväng is responsible for our strategic technology direction. Mr. Haväng is widely known and a respected authority in the open source community, and is the lead architect for PacketLogic. Earlier in his career, Mr. Haväng was one of the chief architects for the open source streaming server software Icecast, along with the secure file transfer protocol GSTP. Mr. Haväng studied computer science at the Linköping University in Sweden.
Paul Gracie joined us in September 2009 as our Vice President of Sales in EMEA and has over 20 years of senior-level sales and management experience in the IT industry. Most recently, Mr. Gracie was the Vice President of Sales at Fortinet Inc. Previously, Mr. Gracie served as Vice President of EMEA sales for Bivio Networks supplying Open Source DPI appliances to leading EMEA information security solutions vendors. He was also Vice President of EMEA at Silver Peak Systems and Redline Networks. Mr. Gracie’s career in IT began with Case Communications; he later joined Bay Networks, a leading routing and switching vendor, which was acquired by Nortel Networks. Following this, he became the top European sales performer at ArrowPoint Communications, which was subsequently acquired by Cisco Systems.
Jon Lindén has been our Vice President of Marketing since January 2008. Mr. Lindén joined us in August 2006 as part of the acquisition of Netintact AB, a company he joined in 2001. Mr. Lindén has a background in sales and business development with experience in managing networking products throughout their lifecycle. Prior to joining Netintact, Mr. Lindén was the Chief Executive Officer of the venture-funded company TheSchoolbook.com from 1999 to 2001, and managed sales and marketing at a content management software company from 1998 to 1999. He was project manager at the Swedish Trade Council in Chicago from 1997 to 1998.
David Ahee joined us in January 2009 as our Vice President of Sales in the Americas and has over 20 years of sales and sales management experience in working with mobile, fixed, and cable operators worldwide, as well as large enterprises and OEMs/channels on a global basis. Most recently, Mr. Ahee served as Vice President of Worldwide Sales for Aylus Networks. Previously, Mr. Ahee served as Vice President of Worldwide Sales and Business Development at Auspice, prior to its acquisition by Arris. Mr. Ahee managed Sales at ThinkEngine Networks where he played a key role in the acquisition of the company by Cognitronics. Mr. Ahee served as Vice President of Worldwide Sales at Nexsi Systems, and as Vice President of North American Sales for Unisphere Networks (now part of Juniper Networks), where he grew revenues from zero to $60 million. Earlier, Mr. Ahee was with Ascend Communications, Newbridge Networks, and ROLM. Mr. Ahee holds a B.S. in Marketing with high honors from Wayne State University.
Benjamin Teh joined us in April 2010 as Vice President of Sales for the Asia Pacific and China (“APAC”) region. Mr. Teh has over 15 years of sales management experience in the computer networking industry, with experience in building sales teams, developing channel partner relationships, and growing revenue within the APAC region. Prior to joining Procera, Mr. Teh served as Regional Sales Director for Fortinet for over six years, supplying advanced network security products to telecommunication companies, education, financial institutions and regional enterprises. As one of the first employees for Fortinet in APAC, Mr. Teh created a strong brand and developed a channel program in the region. Previously, Mr. Teh served as Regional Sales Director at a business security pioneer, Watchguard Technologies, where he built up a sales presence in the APAC region by establishing high sales volume accounts. Mr. Teh holds a Bachelor of Science degree from La Trobe University in Melbourne, Australia.
Available information
Our annual reports on Form 10-K, our quarterly reports on Form 10-Q and our current reports on Form 8-K, and all amendments to those reports, filed or furnished pursuant to Section 13(a) or 15(d) of the Securities Exchange Act of 1934, as amended, are available free of charge on our website at www.proceranetworks.com as soon as reasonably practicable after we file such reports with the Securities and Exchange Commission (the “SEC”).
The SEC also maintains a website containing reports, proxy and information statements, annual filings and other relevant information available free of charge to the public at www.sec.gov.
|
Risk Factors
|
You should carefully consider the risks described below, together with all of the other information included in this Annual Report on Form 10-K, in considering our business and prospects. Set forth below and elsewhere in this report and in other documents we file with the SEC are descriptions of the risks and uncertainties that could cause our actual results to differ materially from the results contemplated by the forward-looking statements contained in this report. Additional risks and uncertainties not presently known to us or that we currently deem immaterial also may impair our business operations. Each of these risk factors could adversely affect our business, operating results and financial condition, as well as adversely affect the value of an investment in our common stock.
Risks Related to Our Business
We expect to incur losses in future periods.
For the years ended December 31, 2010, 2009 and 2008, we incurred losses from operations of approximately $2.7 million, $6.2 million and $15.0 million, respectively. We expect to continue to incur losses from operations in future periods. Any profitability we may achieve in the future may not be indicative of sustained profitability. Any losses incurred in the future may result primarily from increased costs related to continued investments in sales and marketing, product development and administrative expenses. If our revenue growth does not occur or is slower than anticipated or our operating expenses exceed expectations, our losses will be greater. We may never achieve profitability.
Our PacketLogic family of products is our only product line. All of our current revenues and a significant portion of our future growth depend on our ability to continue its commercialization.
All of our current revenues and much of our anticipated future growth depend on the development, introduction and market acceptance of new and enhanced products in our PacketLogic product line that address additional market requirements in a timely and cost-effective manner. In the past, we have experienced delays in product development and such delays may occur in the future. We do not currently have plans or resources to develop additional product lines, and as a result, our future growth will largely be determined by market acceptance of our PacketLogic product line.
If additional customers do not adopt, purchase and deploy our PacketLogic products, our revenues will not grow and may decline. In addition, when we announce new products or product enhancements that have the potential to replace or shorten the life cycle of our existing products, customers may defer purchasing our existing products. These actions could harm our operating results by unexpectedly decreasing sales and exposing us to greater risk of product obsolescence.
We need to increase the functionality of our products and offer additional features in order to be competitive.
The market in which we operate is highly competitive and unless we continue to enhance the functionality of our products and add additional features, our competitive position may deteriorate and the average selling prices for our products may decrease over time. Such a decrease could result from the introduction of competing products and from the standardization of DPI technology. To counter this trend, we endeavor to enhance our products by offering higher system speeds and additional features, such as additional protection functionality, supporting additional applications and enhanced reporting tools. We may also need to reduce our per unit manufacturing costs at a rate equal to or faster than the rate at which selling prices decline. If we are unable to reduce these costs or to offer increased functionally and features, our results of operations and financial condition may be adversely affected.
If our products contain undetected software or hardware errors or performance deficiencies, we could incur significant unexpected expenses, experience purchase order cancellations and lose sales.
Network products frequently contain undetected software or hardware errors, failures or bugs when new products or new versions or updates of existing products are first released to the marketplace. Because we frequently introduce new versions and updates to our product line, previously unaddressed errors in the accuracy or reliability of our products, or issues with their performance, may arise. We expect that such errors or performance deficiencies will be found from time to time in the future in new or existing products, including the components incorporated therein, after the commencement of commercial shipments. These problems may have a material adverse effect on our business by requiring us to incur significant warranty repair costs and support related replacement costs, diverting the attention of our engineering personnel from new product development efforts, delaying the recognition of revenue and causing significant customer relations problems.
In addition, if our products are not accepted by customers due to software or hardware defects or performance deficiencies, orders contingent upon acceptance may be cancelled, which could result in lost sales opportunities. In this circumstance, or if warranty returns exceed the amount we have accrued for defect returns based on our historical experience, our results of operations and financial condition may be adversely affected.
Our products must properly interface with products from other vendors. As a result, when problems occur in a computer or communications network, it may be difficult to identify the sources of these problems. The occurrence of hardware and software errors, whether or not caused by our products, could result in the delay or loss of market acceptance of our products and any necessary revisions may cause us to incur significant expenses. The occurrence of any such problems would likely have a material adverse effect on our results of operations and financial condition.
We may need to raise further capital, which could dilute or otherwise adversely affect your interest in our company.
We believe that our existing cash, cash equivalents and short term investments, along with the cash that we expect to generate from operations and any required debt financing that management currently believes is available, will be sufficient to meet our anticipated cash needs for working capital and capital expenditures for the next twelve months.
However, a number of factors may negatively impact our level of cash availability and working capital requirements, including, without limitation:
|
|
●
|
lower than anticipated revenues;
|
|
|
●
|
higher than expected cost of goods sold or operating expenses; or
|
|
|
●
|
the inability of our customers to pay for the goods and services ordered.
|
We believe that current general economic conditions and the recent global credit market crisis have created a significantly more difficult environment for obtaining both equity and debt financing. If additional funds are raised through the issuance of equity or convertible debt securities, the percentage ownership of our stockholders will be reduced, stockholders may experience additional dilution and such securities may have rights, preferences and privileges senior to those of our common stock. There can be no assurance that additional financing will be available on terms favorable to us or at all, especially in light of the current economic environment. If adequate funds are not available on acceptable terms, we may not be able to fund expansion, take advantage of unanticipated growth or acquisition opportunities, develop or enhance services or products or respond to competitive pressures. In addition, we may be required to defer or cancel product development programs, lay-off employees and/or take other steps to reduce our operating expenses. Our inability to raise additional financing or the terms of any financing we do raise could have a material adverse effect on our business, results of operations and financial condition.
We have a limited operating history on which to evaluate our company.
The products we sell today are derived primarily from the acquisition of the Netintact companies in 2006. While we have the experience of Netintact operations on a stand-alone basis, we are continuing to determine how to operate most effectively on a combined basis. We have not developed sufficient experience to estimate the scope of the business opportunities that may be achieved from our combined operations.
Furthermore, we have only recently launched many of our products and services on a worldwide basis. Therefore, investors should consider the risks and uncertainties frequently encountered by companies in new and rapidly evolving markets, which include the following:
|
|
●
|
successfully introducing new products and entering new markets;
|
|
|
●
|
successfully servicing and upgrading new products once introduced;
|
|
|
●
|
increasing brand recognition;
|
|
|
●
|
developing strategic relationships and alliances;
|
|
|
●
|
managing expanding operations and sales channels;
|
|
|
●
|
successfully responding to competition; and
|
|
|
●
|
attracting, retaining and motivating qualified personnel.
|
If we are unable to address these risks and uncertainties, our results of operations and financial condition may be adversely affected.
Competition for experienced and skilled personnel is intense and our inability to attract and retain qualified personnel could significantly damage our business.
Our future performance will depend to a significant extent on the ability of our management to operate effectively, both individually and as a group. We are dependent on our ability to attract, retain and motivate high caliber key personnel. We have recently hired new employees and our plans to expand in all areas will require experienced personnel to augment our current staff. We expect to recruit experienced professionals in such areas as software and hardware development, sales, technical support, product marketing and management. We currently plan to expand our indirect channel partner program and we need to attract qualified business partners to broaden these sales channels. Economic conditions may result in significant competition for qualified personnel and we may not be able to attract and retain such personnel. Our business may suffer if we encounter material delays in hiring additional personnel.
Our performance is substantially dependent on the continued services and on the performance of our executive officers and other key employees, including our Chief Executive Officer, James Brear, and our Chief Technical Officer, Alexander Haväng. Mr. Brear joined the Company and became our Chief Executive Officer in February 2008. The loss of the services of any of our executive officers or other key employees could materially and adversely affect our business. We believe we will need to attract, retain and motivate talented management and other highly skilled employees in order to execute on our business plan. We may be unable to retain our key employees or attract, assimilate and retain other highly qualified employees in the future. Competitors and others have in the past, and may in the future, attempt to recruit our employees. In California, where we are headquartered, non-competition agreements with employees generally are unenforceable. As a result, if an employee based in California leaves the Company for any reason, he or she will generally be able to begin employment with one of our competitors or otherwise to compete immediately against us.
We currently do not have key person insurance in place. If we lose one of our key officers, we must attract, hire, and retain an equally competent person to take his or her place. There is no assurance that we would be able to find such an employee in a timely fashion. If we fail to recruit an equally qualified replacement or incur a significant delay, our business plans may slow down. We could fail to implement our strategy or lose sales and marketing and development momentum.
Failure to expand our sales teams or educate them about technologies and our product families may harm our operating results.
The sale of our products requires a multi-faceted approach directed at several levels within a prospective customer’s organization. We may not be able to increase net revenue unless we expand our sales teams to address all of the customer requirements necessary to sell our products. We expect to continue hiring in sales and marketing, but there can be no assurance that personnel additions will have a positive effect on our business.
We cannot assure you that we will be able to successfully integrate new employees into the Company or to educate current and future employees with regard to rapidly evolving technologies and our product families. Failure to do so may hurt our revenue growth and operating results.
Increased customer demands on our technical support services may adversely affect our relationships with our customers and our financial results.
We offer technical support services with our products. We may be unable to respond quickly enough to accommodate short-term increases in customer demand for support services. We also may be unable to modify the format of our support services to compete with changes in support services offered by our competitors. Further customer demand for these services, without corresponding revenues, could increase costs and adversely affect our operating results. If we experience financial difficulties, do not maintain sufficiently skilled workers and resources to satisfy our contracts, or otherwise fail to perform at a sufficient level under these contracts, the level of support services to our customers may be significantly disrupted, which could materially harm our relationships with these customers and our results of operations.
We must continue to develop and increase the productivity of our indirect distribution channels to increase net revenue and improve our operating results.
A key focus of our distribution strategy is developing and increasing the productivity of our indirect distribution channels through resellers and distributors. If we fail to develop and cultivate relationships with significant resellers, or if these resellers are not able to execute on their sales efforts, sales of our products may decrease and our operating results could suffer. Many of our resellers also sell products from other vendors that compete with our products. We cannot assure you that we will be able to enter into additional reseller and/or distribution agreements or that we will be able to manage our product sales channels. Our failure to do any of these could limit our ability to grow or sustain revenue. In addition, our operating results will likely fluctuate significantly depending on the timing and amount of orders from our resellers. We cannot assure you that our resellers and/or distributors will continue to market or sell our products effectively or continue to devote the resources necessary to provide us with effective sales, marketing and technical support. Such failure would negatively affect revenue and our potential to achieve profitability.
We may be unable to compete effectively with competitors which are substantially larger and more established and have greater resources.
In our rapidly evolving and highly competitive market, we compete on the price as well as the performance of our products. We expect competition to remain intense in the future. Increased competition could result in reduced prices and gross margins for our products and could require increased spending by us on research and development, sales and marketing and customer support, any of which could have a negative financial impact on our business. We compete with Allot Communications, Arbor Networks, Blue Coat Systems, Brocade Communications Systems, Cloudshield Technologies, Cisco Systems, Ericsson, Huawei Technologies Company, Juniper Networks, and Sandvine Corporation, as well as other companies which sell products incorporating competing technologies. In addition, our products and technology compete with other types of products that offer monitoring capabilities, such as probes and related software. We also face indirect competition from companies that offer broadband service providers increased bandwidth and infrastructure upgrades that increase the capacity of their networks, which may lessen or delay the need for bandwidth management solutions.
Most of our competitors are substantially larger than we are and have significantly greater name recognition and financial, sales and marketing, technical, manufacturing and other resources and more established distribution channels than we do. In addition, some potential customers have in the past advised us that we were not able to compete for their business due to concerns about our financial condition. While we have attempted to address balance sheet concerns with our recent financing activities, it is possible that a potential customer could raise similar concerns in the future. Our competitors may be able to respond more rapidly to new or emerging technologies and changes in customer requirements or devote greater resources to the development, promotion and sale of their products than we can. Furthermore, prospective customers often have expressed greater confidence in the product offerings of our competitors. Some of our competitors may make acquisitions or establish strategic relationships that may increase their ability to rapidly gain market share by addressing the needs of our prospective customers. Competitors may enter our existing or future markets with solutions that may be less expensive, provide higher performance or provide additional features than our solutions. Given the opportunities in the bandwidth management solutions market, we also expect that other companies may enter with alternative products and technologies, which could reduce the sales or market acceptance of our products and services, perpetuate intense price competition or make our products obsolete. If any technology that is competing with ours is or becomes more reliable, higher performing, less expensive or has other advantages over our technology, then the demand for our products and services would decrease, which would harm our business.
A substantial portion of our revenues may be dependent on a small number of Tier 1 service providers that purchase in large quantities. If we are unable to maintain or replace our relationships with these customers, our revenues may fluctuate and our growth may be limited.
Since 2008, when we first established customer relations with Tier 1 service providers, a significant portion of our revenues has come from a limited number of customers. There can be no guarantee that we will be able to sustain our revenue levels from these customers because their capacity requirements have become or will become fulfilled. For this reason, we do not expect that any single customer will generally remain a significant customer from year to year, and we will need to attract new customers in order to sustain our revenues. In the years ended December 31, 2010 and 2009, revenue from one customer represented 11% and 44% of net revenues, respectively, with no other single customer accounting for more than 10% of net revenue. For the year ended December 31, 2008, revenue from two other customers represented 16% and 10% of net revenues, respectively, with no other single customer accounting for more than 10% of net revenue. The proportion of our revenues derived from a limited number of customers may be even higher in any future year or quarter. If we cannot maintain or replace the customers that purchase large amounts of our products, or if they do not purchase products at the levels or at the times that we anticipate, our ability to maintain or grow our revenues will be adversely affected.
If we are unable to effectively manage our anticipated growth, we may experience operating inefficiencies and have difficulty meeting demand for our products.
We seek to manage our growth so as not to exceed our available capital resources. If our customer base and market grow rapidly, we would need to expand to meet this demand. This expansion could place a significant strain on our management, products and support operations, sales and marketing personnel and other resources, which could harm our business.
If demand for our products and services grows rapidly, we may experience difficulties meeting the demand. For example, the installation and use of our products requires customer training. If we are unable to provide adequate training and support for our products, the implementation process will be longer and customer satisfaction may be lower. In addition, we may not be able to exploit fully the growing market for our products and services. We cannot assure you that our systems, procedures or controls will be adequate to support the anticipated growth in our operations. The failure to meet the challenges presented by rapid customer and market expansion could cause us to miss sales opportunities and otherwise have a negative impact on our sales and profitability.
We may not be able to install management information and control systems in an efficient and timely manner, and our current or planned personnel, systems, procedures and controls may not be adequate to support our future operations.
Unstable market and economic conditions may have serious adverse consequences on our business.
Our general business strategy may be adversely affected by the current volatile global business environment and continued unpredictable and unstable market conditions. If financial markets continue to experience volatility or deterioration, it may make any debt or equity financing that we require more difficult, more costly, and more dilutive. In addition, a renewed or deeper economic downturn may result in reduced demand for our products, or adversely impact our customers’ ability to pay for our products, which would harm our operating results. There is also a risk that one or more of our current service providers, manufacturers and other partners may not survive in the current economic environment, which would directly affect our ability to attain our operating goals on schedule and on budget. Failure to secure any necessary financing in a timely manner and on favorable terms could have a material adverse effect on our results of operations and financial condition.
We have limited ability to protect our intellectual property and defend against claims which may adversely affect our ability to compete.
We rely primarily on patents, trade secrets, contractual rights and trademark law to protect our intellectual property rights in our PacketLogic product line. We cannot assure you that the actions we have taken will adequately protect our intellectual property rights or that other parties will not independently develop similar or competing products that do not infringe on our patents. We enter into confidentiality or license agreements with our employees, consultants and corporate partners, and take appropriate measures to control access to and distribution of our software, documentation and other proprietary information. Despite our efforts to protect our proprietary rights, unauthorized parties may attempt to copy or otherwise misappropriate or use our products or technology.
In an effort to protect our unpatented proprietary technology, processes and know-how, we require our employees, consultants, collaborators and advisors to execute confidentiality agreements. These agreements, however, may not provide us with adequate protection against improper use or disclosure of confidential information. These agreements may be breached, and we may not become aware of, or have adequate remedies in the event of, any such breach. In addition, in some situations, these agreements may conflict with, or be subject to, the rights of third parties with whom our employees, consultants, collaborators or advisors have previous employment or consulting relationships. Furthermore, others may independently develop substantially equivalent proprietary information and techniques or otherwise gain access to our trade secrets.
Our industry is characterized by the existence of a large number of patents and frequent claims and related litigation regarding patent and other intellectual property rights. If we are found to infringe on the proprietary rights of others, or if we agree to settle any such claims, we could be compelled to pay damages or royalties and either obtain a license to those intellectual property rights or alter our products so that they no longer infringe upon such proprietary rights. Any license could be very expensive to obtain or may not be available at all. Similarly, changing our products or processes to avoid any claims of infringement may be costly or impractical. Litigation resulting from claims that we are infringing the proprietary rights of others could result in substantial costs and a diversion of resources, and could have a material adverse effect on our results of operations and financial condition.
We rely on a small number of contract manufacturers to build our hardware products. If we are unable to have our products manufactured quickly enough to keep up with demand or we experience manufacturing quality problems, our operating results could be harmed.
If the demand for our products grows, we will need to increase our capacity for material purchases, production, testing and quality control functions. Any disruptions in product flow could limit our revenue growth and adversely affect our competitive position and reputation, and result in additional costs or cancellation of orders under agreements with our customers.
While our PacketLogic products are software based, we rely on independent contract manufacturers to manufacture the hardware components on which are products are installed and operate. In certain circumstances, these contract manufacturers also provide logistics services, which may include loading our software products onto the hardware platforms, testing and inspecting the products, and then shipping them directly to our customers. If these contract manufacturers are unable to meet our demand, or fail to provide such logistics services as we may request in a timely manner, we may experience delays in product shipments. Other performance problems with contract manufacturers may arise in the future, such as inferior quality, insufficient quantity of products, or the interruption or discontinuance of operations of a manufacturer, any of which could have a material adverse effect on our business and operating results.
We do not know whether we will effectively manage our contract manufacturers or that these manufacturers will meet our future requirements for timely delivery of product components of sufficient quality and quantity. If one or more of our contract manufacturers were to experience financial difficulties or decide not to continue its business relationship with us, we would need to identify other contract manufacturers to perform these services, and there could be product delivery delays while we seek to establish and implement the new relationship. We also plan to introduce new products and product enhancements, which will require that we rapidly achieve volume production by coordinating our efforts with those of our suppliers and contract manufacturers. Any delays in meeting customer demand or quality problems resulting from the inability of our contract manufacturers to provide us with adequate supplies of high-quality product components, including problems relating to logistic services, could result in lost or reduced future sales to key customers and could have a material adverse effect on our sales and results of operations.
As part of our cost management efforts, we endeavor to lower per unit product costs from our contract manufacturers by means of volume efficiencies and the utilization of manufacturing sites in lower-cost geographies. However, we cannot be certain when or if such cost reductions will occur. The failure to obtain such cost reductions would adversely affect our gross margins and operating results.
If our suppliers fail to adequately supply us with certain original equipment manufacturer, or OEM, sourced components, our product sales may suffer.
Reliance upon OEMs, as well as industry supply conditions, generally involves several additional risks, including the possibility of a shortage of components and reduced control over delivery schedules (which can adversely affect our distribution schedules), and increases in component costs (which can adversely affect our profitability). Most of our hardware products, or the components of our hardware components, are based on industry standards and are therefore available from multiple manufacturers. If our supplier were to fail to deliver, alternative suppliers should be available, although qualification of the alternative manufacturers and establishment of reliable suppliers could result in delays and a possible loss of sales, which could affect operating results adversely. However, in some specific cases we have single-sourced components, because alternative sources are not currently available. If these components were not available for a period of time, we could experience product supply interruptions, delays or inefficiencies, which could have a material adverse effect on our results of operations and financial condition.
Sales of our products to large broadband service providers often involve a lengthy sales cycle, which may cause our revenues to fluctuate from period to period and could result in us expending significant resources without making any sales.
Our sales cycles often are lengthy, because our prospective customers undertake significant testing to assess the performance of our products within their networks. As a result, we may invest significant time from initial contact with a customer before that end-customer decides to purchase and incorporate our products in its network. We may also expend significant resources attempting to persuade large broadband service providers to incorporate our products into their networks without any measure of success. Even after deciding to purchase our products, initial network deployment and acceptance testing of our products by a large broadband service provider may last several years. Carriers, especially in North America, often require that products they purchase meet Network Equipment Building System, or NEBS, certification requirements, which relate the reliability of telecommunications equipment. While our PacketLogic products and future products are and are expected to be designed to meet NEBS certification requirements, they may fail to do so.
Due to our lengthy sales cycle, particularly to larger customers, and our revenue recognition practices, we expect our revenue may fluctuate significantly from period to period. In pursuing sales opportunities with larger enterprises, we expect that we will make fewer sales to larger entities, but that the magnitude of individual sales will be greater. We may report substantial revenue growth in the period that we recognize the revenue from a large sale, which may not be repeated in an immediately subsequent period. Because our revenues may fluctuate materially from period to period, the price of our common stock may decline. In addition, even after we have received commitments from a customer to purchase our products, in accordance with our revenue recognition practices we may not be able to recognize and report the revenue from that purchase for months or years after the time of purchase. As a result, there could be significant delays in our receipt and recognition of revenue following sales orders for our products.
In addition, if a competitor succeeds in convincing a large broadband service provider to adopt that competitor’s product, it may be difficult for us to displace the competitor at a later time because of the cost, time, effort and perceived risk to network stability involved in changing solutions. As a result, we may incur significant sales and marketing expenses without generating any sales.
Our operating results could be adversely affected by product sales occurring outside the United States and fluctuations in the value of the United States Dollar against foreign currencies.
A significant percentage of PacketLogic sales are generated outside of the United States. PacketLogic sales and operating expenses denominated in foreign currencies could affect our operating results as foreign currency exchange rates fluctuate. Changes in exchange rates between these foreign currencies and the U.S. Dollar will affect the recorded levels of our assets and liabilities because we translate foreign net sales, costs of goods, assets and liabilities into U.S. Dollars for presentation in our financial statements. The primary foreign currencies for which we have exchange rate fluctuation exposure are the European Union Euro, the Swedish Krona and the Australian Dollar. If our revenues continue to grow, we could be exposed to exchange rate fluctuations in other currencies. Exchange rates between these currencies and U.S. Dollars have fluctuated significantly in recent years and may do so in the future. Hedging foreign currencies can be difficult. We cannot predict the impact of future exchange rate fluctuations on our operating results. We currently do not hedge our foreign currency risk.
Legislative actions, higher insurance costs and new accounting pronouncements are likely to impact our future financial position and results of operations.
Legislative and regulatory changes and future accounting pronouncements and regulatory changes have, and will continue to have, an impact on our future financial position and results of operations. In addition, insurance costs, including health and workers’ compensation insurance premiums, have been increasing on an historical basis and are likely to continue to increase in the future. Recent and future pronouncements related to the accounting treatment of executive compensation and employee stock options may also impact operating results. These and other potential changes could materially increase the expenses we report under generally accepted accounting principles, and adversely affect our operating results.
Our internal controls may be insufficient to ensure timely and reliable financial information.
Effective internal controls over financial reporting are necessary for us to provide reliable financial reports and effectively prevent fraud. A company’s internal control over financial reporting is a process designed to provide reasonable assurance regarding the reliability of financial reporting and the preparation of financial statements for external purposes in accordance with US Generally Accepted Accounting Principles (“GAAP”). A company’s internal control over financial reporting includes those policies and procedures that:
|
|
●
|
pertain to the maintenance of records that, in reasonable detail, accurately and fairly reflect the transactions and dispositions of the assets of the company;
|
|
|
●
|
provide reasonable assurance that transactions are recorded as necessary to permit preparation of financial statements in accordance with GAAP, and that receipts and expenditures of the company are being made only in accordance with authorizations of management and directors of the company; and
|
|
|
●
|
provide reasonable assurance regarding prevention or timely detection of unauthorized acquisition, use, or disposition of the company’s assets that could have a material effect on the financial statements.
|
A material weakness is a control deficiency, or combination of control deficiencies, that results in more than a remote likelihood that a material misstatement of the annual or interim financial statements will not be prevented or detected.
For the years ended December 31, 2010, 2009 and 2008, we did not identify any material weaknesses in our internal controls.
Under the supervision of our Audit Committee, we are continuing the process of identifying and implementing corrective actions where required to improve the design and effectiveness of our internal control over financial reporting, including the enhancement of systems and procedures. We have a small accounting staff and limited resources and expect that we will continue to be subject to the risk of additional material weaknesses and significant deficiencies.
Even after corrective actions are implemented, the effectiveness of our controls and procedures may be limited by a variety of risks including:
|
|
●
|
faulty human judgment and simple errors, omissions or mistakes;
|
|
|
●
|
collusion of two or more people;
|
|
|
●
|
inappropriate management override of procedures; and
|
|
|
●
|
the risk that enhanced controls and procedures may still not be adequate to assure timely and reliable financial information.
|
If we fail to have effective internal controls and procedures for financial reporting in place, we could be unable to provide timely and reliable financial information. Additionally, if we fail to have effective internal controls and procedures for financial reporting in place, it could adversely affect our ability to comply with financial reporting requirements under certain government contracts.
Accounting charges may cause fluctuations in our annual and quarterly financial results which could negatively impact the market price of our common stock.
Our financial results may be materially affected by non-cash and other accounting charges. Such accounting charges may include:
|
|
●
|
amortization of intangible assets, including acquired product rights;
|
|
|
●
|
impairment of goodwill;
|
|
|
●
|
stock-based compensation expense; and
|
|
|
●
|
impairment of long-lived assets.
|
The foregoing types of accounting charges may also be incurred in connection with or as a result of business acquisitions. The price of our common stock could decline to the extent that our financial results are materially affected by the foregoing accounting charges. Our effective tax rate may increase, which could increase our income tax expense and reduce our net income. Our effective tax rate could be adversely affected by several factors, many of which are outside of our control, including:
|
|
●
|
changes in the relative proportions of revenues and income before taxes in the various jurisdictions in which we operate that have differing statutory tax rates;
|
|
|
●
|
changing tax laws, regulations and interpretations in multiple jurisdictions in which we operate, as well as the requirements of certain tax rulings;
|
|
|
●
|
changes in accounting and tax treatment of stock-based compensation;
|
|
|
●
|
the tax effects of purchase accounting for acquisitions and restructuring charges that may cause fluctuations between reporting periods; and
|
|
|
●
|
tax assessments, or any related tax interest or penalties, which could significantly affect our income tax expense for the period in which the settlements take place.
|
The price of our common stock could decline if our financial results are materially affected by the foregoing.
Our headquarters are located in Northern California where disasters may occur that could disrupt our operations and harm our business.
Our corporate headquarters is located in Silicon Valley in Northern California. Historically, this region has been vulnerable to natural disasters and other risks, such as earthquakes, which at times have disrupted the local economy and posed physical risks to us and our local suppliers. In addition, terrorist acts or acts of war targeted at the United States, and specifically Silicon Valley, could cause damage or disruption to us, our employees, facilities, partners, suppliers, distributors and resellers, and customers, which could have a material adverse effect on our operations and financial results. Although we currently have significant redundant capacity in Sweden in the event of a natural disaster or other catastrophic event in Silicon Valley, our business could nonetheless suffer. Our operations in Sweden are subject to disruption by extreme winter weather.
Acquisitions may disrupt or otherwise have a negative impact on our business.
We may seek to acquire or make investments in complementary businesses, products, services or technologies on an opportunistic basis when we believe they will assist us in executing our business strategy. Growth through acquisitions has been a viable strategy used by other network control and management technology companies. We acquired the Netintact entities in 2006. Any future acquisitions could distract our management and employees and increase our expenses.
Following any acquisition, the integration of the acquired business, product, service or technology is complex, time consuming and expensive, and may disrupt our business. These challenges include the timely and efficient execution of a number of post-transaction integration activities, including:
|
|
●
|
integrating the operations and technologies of the two companies;
|
|
|
●
|
retaining and assimilating the key personnel of each company;
|
|
|
●
|
retaining existing customers of both companies and attracting additional customers;
|
|
|
●
|
leveraging our existing sales channels to sell new products into new markets;
|
|
|
●
|
developing an appropriate sales and marketing organization and sales channels to sell new products into new markets;
|
|
|
●
|
retaining strategic partners of each company and attracting new strategic partners; and
|
|
|
●
|
implementing and maintaining uniform standards, internal controls, processes, procedures, policies and information systems.
|
The process of integrating operations and technology could cause an interruption of, or loss of momentum in, our business and the loss of key personnel. The diversion of management’s attention and any delays or difficulties encountered in connection with an acquisition and the integration of our operations and technology could have an adverse effect on our business, results of operations or financial condition. Furthermore, the execution of these post-transaction integration activities will involve considerable risks and may not come to pass as we envision. The inability to integrate the operations, technology and personnel of an acquired business with ours, or any significant delay in achieving integration, could have a material adverse effect on results of operations and financial condition and, as a result, on the market price of our common stock.
Furthermore, if we were to issue equity securities to pay for any future acquisitions, the issuance of such equity securities would have a dilutive effect on our existing shareholders.
Risks Related to Our Industry
Demand for our products depends, in part, on the rate of adoption of bandwidth-intensive broadband applications, such as peer-to-peer, and latency-sensitive applications, such as voice-over-Internet protocol, or VoIP, Internet video and online video gaming applications.
Our products are used by broadband service providers and enterprises to provide awareness, control and protection of Internet traffic by examining and identifying packets of data as they pass an inspection point in the network, particularly bandwidth-intensive applications that cause congestion in broadband networks and impact the quality of experience of users. In addition to the general increase in applications delivered over broadband networks that require large amounts of bandwidth, such as peer-to-peer applications, demand for our products is driven particularly by the growth in applications which are highly sensitive to network delays and therefore require efficient network management. These applications include VoIP, Internet video and online video gaming applications. If the rapid growth in adoption of VoIP and in the popularity of Internet video and online video gaming applications does not continue, the demand for our products may not grow as anticipated, which could have a material adverse effect on our results of operations and financial condition.
If the bandwidth management solutions market fails to grow, our business will be adversely affected.
We believe that the market for bandwidth management solutions is in an early stage of development. We cannot accurately predict the future size of the market, the products needed to address the market, the optimal distribution strategy, or the competitive environment that will develop. In order for us to execute our strategy, our potential customers must recognize the value of more sophisticated bandwidth management solutions, decide to invest in the management of their networks and the performance of important business software applications and, in particular, adopt our bandwidth management solutions. The growth of the bandwidth management solutions market also depends upon a number of factors, including the availability of inexpensive bandwidth, especially in international markets, and the growth of wide area networks. The failure of the market to rapidly grow would adversely affect our sales and sales prospects, which could have a material adverse effect on our results of operations and financial condition and cause a decline in the price of our common stock.
The market for our products in the network provider market is still emerging and our growth may be harmed if carriers do not adopt DPI solutions.
The market for DPI technology is still emerging and the majority of our customers to date have been small and midsize broadband service providers and universities. We believe that the Tier 1 carriers, as well as cable and mobile operators, present a significant market opportunity and are an important element of our long term strategy, but they are still in the early stages of adopting and evaluating the benefits and applications of DPI technology. Carriers may decide that full visibility into their networks or highly granular control over content based applications is not critical to their business. They may also determine that certain applications, such as VoIP or Internet video, can be adequately prioritized in their networks by using router and switch infrastructure products without the use of DPI technology. They may also, in some instances, face regulatory constraints that could change the characteristics of the markets. Carriers may also seek an embedded DPI solution in capital equipment devices such as routers rather than the stand-alone solution offered by us. Furthermore, widespread adoption of our products by carriers will require that they migrate to a new business model based on offering subscriber and application-based tiered services. If carriers decide not to adopt DPI technology, our market opportunity would be reduced and our growth rate may be harmed, which could have a material adverse effect on our results of operations and financial condition.
The network equipment market is subject to rapid technological progress and to compete we must continually introduce new products or upgrades that achieve broad market acceptance.
The network equipment market is characterized by rapid technological progress, frequent new product introductions, changes in customer requirements and evolving industry standards. If we do not regularly introduce new products or upgrades in this dynamic environment, our product lines will become obsolete. Developments in routers and routing software could also significantly reduce demand for our products. Alternative technologies could achieve widespread market acceptance and displace the technology on which we have based our product architecture. We cannot assure you that our technological approach will achieve broad market acceptance or that other technology or devices will not supplant our products and technology.
Our products must comply with evolving industry standards and complex government regulations or else our products may not be widely accepted, which may prevent us from growing our net revenue or achieving profitability.
The market for network equipment products is characterized by the need to support new standards as they emerge, evolve and achieve acceptance. We will not be competitive unless we continually introduce new products and product enhancements that meet these emerging standards. We may not be able to effectively address the compatibility and interoperability issues that arise as a result of technological changes and evolving industry standards. Our products must be compliant with various United States federal government requirements and regulations and standards defined by agencies such as the Federal Communications Commission, in addition to standards established by governmental authorities in various foreign countries and recommendations of the International Telecommunication Union. If we do not comply with existing or evolving industry standards or if we fail to obtain timely domestic or foreign regulatory approvals or certificates, we will not be able to sell our products where these standards or regulations apply, which may prevent us from sustaining our net revenue or achieving profitability.
Recently proposed regulatory actions may result in reduced capital spending by broadband service providers, which could adversely impact our opportunities for continued revenue growth.
The Federal Communications Commission (the “FCC”) has been considering different proposals for prohibiting or limiting broadband service providers from providing data prioritization services to their customers. These proposals are referred to generally as relating to "net neutrality". The FCC originally considered proposals that would require broadband service providers to treat all Internet content equally in all circumstances and to prohibit them from providing any data prioritization services. The FCC currently is considering the "Third Way" proposal that would include adopting a rule prohibiting any practice under which Internet access service is provided on unreasonably discriminatory terms and which could result in broad authority to regulate broadband service. It is very uncertain what rules, if any, may be adopted by the FCC regarding net neutrality. In the event that the FCC asserts broad regulatory authority, it is likely that there may be legislative and/or legal challenges to the FCC’s regulatory authority, and while the issue remains unresolved, broadband service providers may lessen their capital investments in their networks. In such a circumstance, we may have fewer opportunities to sell our products to both current and prospective customers, and our opportunity for continued revenue growth could be adversely impacted. If our revenue growth slows or our revenues decrease, our results of operations and our financial condition also may be adversely impacted.
Risks Related to Ownership of Our Common Stock
Our common stock price is likely to continue to be highly volatile.
The market price of our common stock is likely to continue to be highly volatile. The market for small cap and micro cap technology companies, including us, has been particularly volatile in recent years. Because our stock is thinly traded, investors may not be able to resell their shares of our common stock following periods of volatility. We cannot assure you that our stock will trade at the same levels of other stocks in our industry or that in general, stocks in our industry will sustain their current market prices. Factors that could cause such volatility may include, among other things:
|
|
●
|
actual or anticipated fluctuations in our quarterly operating results;
|
|
|
●
|
announcements of technology innovations by our competitors;
|
|
|
●
|
changes in financial estimates by securities analysts;
|
|
|
●
|
conditions or trends in the network control and management industry;
|
|
|
●
|
changes in the market valuations of other such industry related companies;
|
|
|
●
|
the acceptance by institutional investors of our stock;
|
|
|
●
|
rumors, announcements or press articles regarding our operations, management, organization, financial condition or financial statements;
|
|
|
●
|
the gain or loss of a significant customer; or
|
|
|
●
|
the stock market in general, and the market prices of stocks of technology companies, in particular, have experienced extreme price volatility that has adversely affected, and may continue to adversely affect, the market price of our common stock for reasons unrelated to our business or operating results.
|
Holders of our common stock may be diluted in the future.
We are authorized to issue up to 32,500,000 shares of common stock and 15,000,000 shares of preferred stock. Our Board of Directors has the authority, without seeking stockholder approval, to issue additional shares of common stock and/or preferred stock in the future for such consideration as our Board of Directors may consider sufficient. In addition, we recently effected, at the discretion of our board of directors and upon stockholder approval, a reverse stock split of our common stock which had the effect of proportionately increasing the number of authorized but unissued shares available for future issuance. The issuance of additional common stock and/or preferred stock in the future will reduce the proportionate ownership and voting power of our common stock held by existing stockholders. At December 31, 2010, there were 11,314,965 shares of our common stock outstanding, outstanding warrants to purchase 409,462 shares of our common stock, and outstanding stock options to purchase 975,153 shares of our common stock. At December 31, 2010, we had an authorized reserve of 266,975 shares of common stock which we may grant as stock options or other equity awards pursuant to our existing stock option plans. These share figures reflect the 1-for-10 reverse stock split that became effective February 4, 2011.
Any future issuances of our common stock would dilute the relative ownership interest of our current stockholders, and could also cause the trading price of our common stock to decline.
Shares eligible for future sale by our current stockholders may adversely affect our stock price.
Sales of substantial amounts of common stock, including shares issued upon the exercise of outstanding options and warrants, could adversely affect the prevailing market price of our common stock and could impair our ability to raise capital at that time through the sale of our securities.
Sales of a substantial number of shares of common stock could adversely affect the market price of our common stock and could impair our ability to raise capital through the sale of additional equity securities. If, and to the extent, outstanding options or warrants are exercised, current stockholders will experience dilution to their holdings. In addition, shares issuable upon exercise of our outstanding warrants and stock options may be immediately sold pursuant to an effective registration statement. If a warrant or option holder exercises a warrant or an option at an exercise price that is less than the prevailing market value of our common stock, the holder may be motivated to immediately sell the resulting shares to realize an immediate gain, which could cause the trading price of our common stock to decline.
In March 2010 we sold 1,800,000 shares in a registered direct offering, all of which shares are immediately saleable. Sales of large volumes of our stock, including those shares described above, could cause the trading price of our common stock to decline.
Nevada law and our articles of incorporation and bylaws contain provisions that may discourage, delay or prevent a change in our management team that our stockholders may consider favorable or otherwise have the potential to impact our stockholders’ ability to control our company.
Nevada law and our articles of incorporation and bylaws contain provisions that may have the effect of preserving our current management or may impact our stockholders’ ability to control our company, such as:
|
|
●
|
authorizing the issuance of “blank check” preferred stock without any need for action by stockholders;
|
|
|
●
|
eliminating the ability of stockholders to call special meetings of stockholders;
|
|
|
●
|
restricting the ability of stockholders to take action by written consent; and
|
|
|
●
|
establishing advance notice requirements for nominations for election to the Board of Directors or for proposing matters that can be acted on by stockholders at stockholder meetings.
|
These provisions could allow our Board of Directors to affect your rights as a stockholder since our Board of Directors can make it more difficult for common stockholders to replace members of the Board. Because our Board of Directors is responsible for appointing the members of our management team, these provisions could in turn affect any attempt to replace our current management team. In addition, the issuance of preferred stock could make it more difficult for a third party to acquire us and may impact the rights of common stockholders. All of the foregoing could adversely impact the price of our common stock and your rights as a stockholder.
We do not pay and do not expect to pay cash dividends on our common stock.
We have not paid any cash dividends. We do not anticipate paying cash dividends on our common stock in the foreseeable future, and we cannot assure an investor that funds will be legally available to pay dividends, or that, even if the funds are legally available, the dividends will be paid.
|
Unresolved Staff Comments
|
None.
|
Properties
|
Our corporate headquarters are located in Los Gatos, California, where we lease 11,772 square feet of office space housing administrative, sales and marketing, logistics and support functions. Our European headquarters are located in Sweden, where we lease office space in Varberg and Malmo totaling 9,677 square feet. These facilities are used primarily for research and development, sales and marketing and support. We also lease 592 square feet of office space in Melbourne, Australia which is used for sales and support.
On February 28, 2011, we entered into a new lease agreement for office space in Fremont, California, totaling 8,305 square feet. We expect to move our Corporate headquarters into the new facilities in April, 2011.
We believe that our facilities are adequate for our needs and that additional suitable space will be available on acceptable terms.
|
Legal Proceedings
|
None
|
(Removed and Reserved)
|
|
Market for Registrant’s Common Equity, Related Stockholder Matters and Issuer Purchases of Equity Securities
|
Our common stock is listed on the NYSE Amex Equities, formerly known as the American Stock Exchange, under the symbol “PKT”. The following table sets forth, for the periods indicated, the high and low intraday prices per share of our common stock as reported by the NYSE Amex Equities. These prices reflect the 1-for-10 reverse stock split effected on February 4, 2011.
|
|
|
Common Stock
|
|
|||||||||||||
|
|
|
2010
|
|
|
2009
|
|
||||||||||
|
|
|
High
|
|
|
Low
|
|
|
High
|
|
|
Low
|
|
||||
|
|
|
|
|
|
|
|
|
|
|
|
|
|
|
|
|
|
|
First Quarter
|
|
$
|
6.50
|
|
|
$
|
3.90
|
|
|
$
|
9.60
|
|
|
$
|
5.00
|
|
|
Second Quarter
|
|
|
7.60
|
|
|
|
2.70
|
|
|
|
10.80
|
|
|
|
5.50
|
|
|
Third Quarter
|
|
|
6.50
|
|
|
|
4.00
|
|
|
|
8.30
|
|
|
|
5.10
|
|
|
Fourth Quarter
|
|
|
6.90
|
|
|
|
4.40
|
|
|
|
6.30
|
|
|
|
4.00
|
|
On March 10, 2011, the closing price of our common stock was $9.84.
Dividend Policy
Procera has not declared or paid any cash dividends on its common stock or other securities and does not anticipate paying any cash dividends in the foreseeable future. Any future determination to pay cash dividends will be at the discretion of the Board of Directors and will be dependent upon Procera’s financial condition, results of operations, capital requirements and such other factors as the Board of Directors deems relevant.
Recent Sales of Unregistered Securities
None.
Issuer Purchases of Equity Securities
None.
Stockholders
There were 81 stockholders of record of our common stock as of March 10, 2011.
Performance Graph
The graph below compares the cumulative total return to security holders of our common shares with the comparable cumulative return of the NYSE Amex Composite Index and a peer group index, the NYSE Arca Networking Index. The graph assumes the investment of $100 on December 31, 2005 and the reinvestment of all dividends, if any. Points on the graph represent the performance as of the last business day of each of the fiscal years indicated.
The information under the heading “Performance Graph” shall not be deemed filed for purposes of Section 18 of the Securities Exchange Act of 1934, as amended, or incorporated by reference in any filing under the Securities Act of 1933, as amended, or the Securities Exchange Act of 1934, as amended.
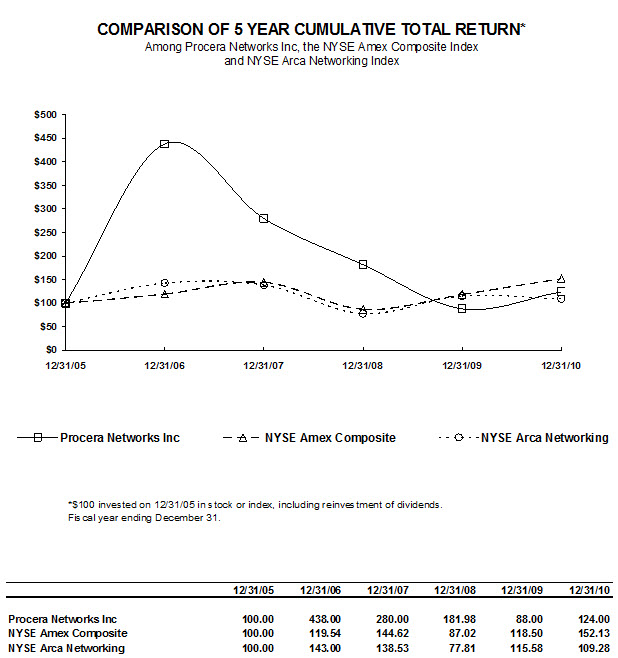
|
Selected Financial Data
|
The following selected financial information has been derived from our audited consolidated financial statements. The information set forth below is not necessarily indicative of results of future operations and should be read in conjunction with Item 7, “Management’s Discussion and Analysis of Financial Condition and Results of Operations” and the Consolidated Financial Statements and notes thereto included in Item 8 of this Annual Report on Form 10-K in order to fully understand factors that may affect the comparability of the information presented below.
|
|
|
Fiscal Year Ended December 31,
|
|
|||||||||||||||||
|
|
|
2010 (1)
|
|
|
2009
|
|
|
2008
|
|
|
2007
|
|
|
2006 (2)
|
|
|||||
|
|
|
(in thousands, except per share data)
|
|
|||||||||||||||||
|
STATEMENT OF OPERATIONS DATA:
|
|
|
|
|
|
|
|
|
|
|
|
|
|
|
|
|
|
|
|
|
|
Net sales
|
|
$
|
20,323
|
|
|
$
|
20,129
|
|
|
$
|
11,524
|
|
|
$
|
6,673
|
|
|
$
|
1,914
|
|
|
Gross profit
|
|
$
|
11,510
|
|
|
$
|
8,184
|
|
|
$
|
4,214
|
|
|
$
|
2,293
|
|
|
$
|
591
|
|
|
Total operating expenses
|
|
$
|
14,247
|
|
|
$
|
14,421
|
|
|
$
|
19,198
|
|
|
$
|
15,899
|
|
|
$
|
8,354
|
|
|
Loss from operations
|
|
$
|
(2,737
|
)
|
|
$
|
(6,237
|
)
|
|
$
|
(14,984
|
)
|
|
$
|
(13,606
|
)
|
|
$
|
(7,763
|
)
|
|
Net loss
|
|
$
|
(2,894
|
)
|
|
$
|
(7,384
|
)
|
|
$
|
(13,902
|
)
|
|
$
|
(12,481
|
)
|
|
$
|
(7,503
|
)
|
|
Net loss per share, basic and diluted (3)
|
|
$
|
(0.27
|
)
|
|
$
|
(0.82
|
)
|
|
$
|
(1.76
|
)
|
|
$
|
(1.74
|
)
|
|
$
|
(1.48
|
)
|
|
|
|
|
|
|
|
|
|
|
|
|
|
|
|
|
|
|
|
|
|
|
|
BALANCE SHEET DATA:
|
|
|
|
|
|
|
|
|
|
|
|
|
|
|
|
|
|
|
|
|
|
Cash and cash equivalents
|
|
$
|
7,876
|
|
|
$
|
3,192
|
|
|
$
|
1,721
|
|
|
$
|
5,865
|
|
|
$
|
5,214
|
|
|
Working capital
|
|
$
|
12,607
|
|
|
$
|
7,314
|
|
|
$
|
5,273
|
|
|
$
|
6,291
|
|
|
$
|
5,571
|
|
|
Total assets
|
|
$
|
24,517
|
|
|
$
|
16,323
|
|
|
$
|
15,991
|
|
|
$
|
17,412
|
|
|
$
|
18,148
|
|
|
Deferred revenue
|
|
$
|
4,437
|
|
|
$
|
2,103
|
|
|
$
|
1,313
|
|
|
$
|
958
|
|
|
$
|
383
|
|
|
Long-term liabilities
|
|
$
|
705
|
|
|
$
|
452
|
|
|
$
|
759
|
|
|
$
|
1,805
|
|
|
$
|
2,866
|
|
|
Total stockholders’ equity
|
|
$
|
13,754
|
|
|
$
|
8,515
|
|
|
$
|
9,059
|
|
|
$
|
12,373
|
|
|
$
|
13,934
|
|
|
(1)
|
On March 4, 2010, we closed a registered placement of our common stock primarily to institutional investors. We sold 1.8 million shares of our common stock at an offering price of $4.00 per share for a total gross sales price of $7.2 million, and received net proceeds of approximately $6.5 million after deducting the placement agent’s commission and legal and other offering costs. These share figures reflect the 1-for-10 reverse stock split that was effective February 4, 2011.
|
|
(2)
|
On August 18, 2006, we acquired Netintact, AB, a Swedish software company, and 51% of the outstanding shares of Netintact PTY, an Australian company that distributed Netintact AB’s products in Australia and Asia. On September 29, 2006, we acquired the remaining 49% of the outstanding shares of Netintact PTY. The results of operations for Netintact AB and Netintact PTY have been included in our consolidated financial statements subsequent to their acquisitions. In conjunction with these acquisitions, we recorded amortization of acquired intangible assets of $2.5 million, $3.7 million, $3.7 million and $1.2 million during fiscal years 2009, 2008, 2007 and 2006, respectively.
|
|
(3)
|
Per share figures reflect the 1-for-10 reverse stock split retroactively applied to all periods presented.
|
|
Management’s Discussion and Analysis of Financial Condition and Results of Operations
|
The following Management’s Discussion and Analysis of Financial Condition and Results of Operations contains forward-looking statements that involve risks and uncertainties. We use words such as “may,” “will,” “expect,” “anticipate,” “estimate,” “intend,” “plan,” “predict,” “potential,” “believe,” “should” and similar expressions to identify forward-looking statements. These statements appearing throughout our Annual Report are statements regarding our intent, belief, or current expectations, primarily regarding our operations. You should not place undue reliance on these forward-looking statements, which apply only as of the date of this Annual Report. Our actual results could differ materially from those anticipated in these forward-looking statements for many reasons, including those set forth under “Business,” “Risk Factors” and elsewhere in this Annual Report.
Overview
We are a leading provider of evolved network traffic awareness, analysis and control solutions based on Deep Packet Inspection (DPI) technology for a broad range of broadband service providers worldwide. Our products offer network operators: network traffic identification, control and service management.
We have more than 600 customers who have installed over 1,300 of our systems in total. Our customers include cable multi-system operators, mobile service providers, telecommunications companies, universities and other entities.
Our products are marketed under the PacketLogic™ brand name. We have multiple products, performing at speeds from 2 megabits per second up to 120 gigabits per second, which are designed to address a broad market spectrum of customers.
Our PacketLogic family of products offers:
|
|
●
|
Accuracy. Our proprietary DRDL software solution allows us to provide our customers with a high degree of application identification accuracy and the flexibility to regularly update the software to keep up with the rapid introduction of new Internet applications;
|
|
|
●
|
Scalability. Our family of products is scalable from several megabits to 120 gigabits of traffic per second, up to 10 million subscribers and up to 120 million simultaneous data flows, which is critical to service providers as they upgrade to DOCSIS 3.0 (a high bandwidth broadband cable standard), FTTX (high bandwidth fiber to the home or neighborhood used by telecom broadband network providers) and LTE (enabling higher bandwidth mobile phone networks) technologies in the access network; and
|
|
|
●
|
Platform Flexibility. Our products are deployable in many locations in a network and use non-proprietary hardware, and can rapidly leverage advances in computing technology which we believe to be a better solution than those which are dependent on specific network silicon processors or hardware platforms.
|
We face competition from suppliers of standalone DPI products including Allot Communications, Arbor Networks, Blue Coat Systems, Brocade Communications Systems, Cisco Systems, Ericsson, Huawei Technologies Company, Juniper Networks, and Sandvine Corporation. Some of our competitors also supply platform products with different degrees of DPI functionality, such as switch/routers, routers, session border controllers and VoIP switches.
Most of our competitors are larger and more established enterprises with substantially greater financial and other resources. Some competitors may be willing to reduce prices and accept lower profit margins in order to compete with us. As a result of such competition, we could lose market share and sales, or be forced to reduce our prices to meet competition. However, we do not believe there is a dominant supplier in our market. Based on our belief in the superiority of our technology, we believe that we have an opportunity to capture meaningful market share and benefit from what we believe will be growth in the DPI market.
We were incorporated in 2002, and in October 2003, we merged with Zowcom, Inc., a publicly-traded Nevada corporation. We acquired Netintact AB, a Swedish corporation, and Netintact PTY, an Australian company, in 2006.
Following the acquisitions of Netintact AB and Netintact PTY, our core products and business changed substantially to focus on DPI solutions. PacketLogic, the flagship product and technology of Netintact, now is the Company’s principal product offering. We sell our products through our direct sales force, resellers, distributors and systems integrators in the Americas, Asia Pacific and Europe.
Critical Accounting Policies
Our discussion and analysis of our financial condition and results of operations are based upon financial statements which have been prepared in accordance with Generally Accepted Accounting Principles in the United States. The preparation of these financial statements requires us to make estimates and judgments that affect the reported amounts of assets, liabilities, revenue and expenses and related disclosure of contingent assets and liabilities. On an ongoing basis, we evaluate these estimates. We base our estimates on historical experience and on assumptions that are believed to be reasonable. These estimates and assumptions provide a basis for making judgments about the carrying values of assets and liabilities that are not readily apparent from other sources. Actual results may differ from these estimates under different assumptions or conditions, and these differences may be material. Our significant accounting policies are summarized in Note 2 of our Notes to Financial Statements.
In accordance with Securities and Exchange Commission guidance, those material accounting policies that we believe are the most critical to an investor’s understanding of our financial results and condition are discussed below.
Revenue Recognition
Our most common sale involves the integration of our software and a hardware appliance. The software is essential to the functionality of the product. We account for this revenue in accordance with Financial Accounting Standards Board Accounting Standards Codification, or ASC, 905-605 for all transactions involving software. We recognize product revenue when all of the following have occurred: (1) we have entered into a legally binding arrangement with a customer resulting in the existence of persuasive evidence of an arrangement; (2) delivery has occurred, evidenced when product title transfers to the customer; (3) customer payment is deemed fixed or determinable and free of contingencies and significant uncertainties; and (4) collection is probable.
Our product revenue consists of revenue from sales of our appliances and software licenses. Product sales include a perpetual license to our software. Shipping charges billed to customers are included in product revenue and the related shipping costs are included in cost of product revenue. Virtually all of our sales include post-contract support (“PCS”) services categorized as support revenue which consist of software updates and customer support. Software updates provide customers access to a constantly growing library of electronic Internet traffic identifiers (signatures) and rights to non-specific software product upgrades, maintenance releases and patches released during the term of the support period. Support includes Internet access to technical content, telephone and Internet access to technical support personnel and hardware support.
Receipt of a customer purchase order is the primary method of determining persuasive evidence of an arrangement exists.
Delivery generally occurs when a product is delivered to a common carrier F.O.B. shipping point. However, product revenue based on channel partner purchase orders is recorded based on sell-through to the end user customers until such time as we have established significant experience with the channel partner’s ability to complete the sales process. Additionally, when we introduce new products for which there is no historical evidence of acceptance history, revenue is recognized on the basis of end-user acceptance until such history has been established.
Since our customer orders contain multiple items such as hardware, software, and services which are delivered at varying times, we determine whether the delivered items can be considered separate units of accounting as prescribed under ASC 605-25. ASC 605-25 states that delivered items should be considered separate units of accounting if delivered items have value to the customer on a standalone basis, there is objective and reliable evidence of the fair value of undelivered items, and if delivery of undelivered items is probable and substantially in our control.
We use the residual method to recognize revenue when a product agreement includes one or more elements to be delivered at a future date and vendor specific objective evidence, or VSOE, of the fair value of all undelivered elements exists. Through December 31, 2010, in virtually all of our contracts, the only element that remained undelivered at the time of product delivery was PCS services. We determine VSOE for PCS based on the rate charged to customers based upon renewal pricing for PCS. Each contract or purchase order that we enter into includes a stated rate for PCS. The renewal rate is generally equal to the stated rate in the original contract. We have a history of such renewals, the vast majority of which are at the stated renewal rate on a customer by customer basis. Under the residual method, the fair value of the undelivered elements is deferred and the remaining portion of the contract fee is recognized as product revenue. If evidence of the fair value of one or more undelivered elements does not exist, all revenue is generally deferred and recognized when delivery of those elements occurs or when fair value can be established. When the undelivered element for which we do not have a fair value is PCS, revenue for the entire arrangement is recognized ratably over the support period. Revenue related to these arrangements is included in support revenue in the accompanying consolidated statements of operations. VSOE of fair value for elements of an arrangement is based upon the normal pricing and discounting practices for those services when sold separately and for support and updates is additionally measured by the renewal rate offered to the customer.
Our fees are typically considered to be fixed or determinable at the inception of an arrangement, generally based on specific products and quantities to be delivered. Substantially all of our contracts do not include rights of return or acceptance provisions. To the extent that our agreements contain such terms, we recognize revenue once the acceptance provisions or right of return lapses. Payment terms to customers generally range from net 30 to 90 days. In the event payment terms are provided that differ from our standard business practices, the fees are deemed to not be fixed or determinable and revenue is recognized when the payments become due, provided the remaining criteria for revenue recognition have been met.
We assess the ability to collect from our customers based on a number of factors, including credit worthiness of the customer and past transaction history of the customer. If the customer is not deemed credit worthy, we defer all revenue from the arrangement until payment is received and all other revenue recognition criteria have been met.
Valuation of Long-Lived Assets and Goodwill
We review our long-lived assets including property and equipment and purchased intangible for impairment whenever events or changes in circumstances indicate that the carrying amount may not be recoverable. Such events or circumstances that could trigger an impairment review include a significant disposal of a portion of such assets, an adverse change in the market involving the business employing the related asset, a significant decrease in the benefits realized from an acquired business, difficulties or delays in integrating the business or a significant change in the operations of an acquired business.
An impairment test involves a comparison of undiscounted cash flows from the use of the asset to the carrying value of the asset. Measurement of an impairment loss is based on the amount that the carrying value of the asset exceeds its fair value. No impairment losses were incurred in the periods presented.
As a result of the acquisition of Netintact AB and Netintact PTY in 2006, we have goodwill of $960,209 on our consolidated balance sheet as of December 31, 2010. This goodwill was measured as the excess of the cost of the acquisition over the amount assigned to tangible and identifiable intangible assets acquired less liabilities assumed. We review our goodwill for impairment annually during the fourth quarter of the year or more frequently if an event or circumstance indicates that an impairment loss has occurred. The identification and measurement of goodwill impairment involves the estimation of fair value at a reporting unit level. We operate in one segment, which is considered to be the sole reporting unit and therefore, we tested our goodwill at the enterprise level.
Goodwill impairment is determined using a two-step process. The first step of the goodwill impairment test is used to identify potential impairment by comparing the fair value of a reporting unit with its carrying amount, including goodwill. If the fair value of a reporting unit exceeds its carrying amount, goodwill of the reporting unit is considered not impaired and the second step of the impairment test is unnecessary. If the carrying amount of a reporting unit exceeds its fair value, the second step of the goodwill impairment test is performed to measure the amount of impairment loss, if any.
The second step of the goodwill impairment test compares the implied fair value of the reporting unit’s goodwill with the carrying amount of that goodwill. If the carrying amount of the reporting unit’s goodwill exceeds the implied fair value of that goodwill, an impairment loss is recognized in an amount equal to that excess. The implied fair value of goodwill is determined in the same manner as the amount of goodwill recognized in a business combination. That is, the fair value of the reporting unit is allocated to all of the assets and liabilities of that unit (including any unrecognized intangible assets) as if the reporting unit had been acquired in a business combination and the fair value of the reporting unit was the purchase price paid to acquire the reporting unit.
As of December 31, 2010, we completed the first step of our annual impairment test which did not indicate impairment. Therefore, the second step of the impairment test was not necessary.
Allowance for Doubtful Accounts
The allowance for doubtful accounts reduces trade receivables to the amount that is ultimately believed to be collectible. When evaluating the adequacy of the allowance for doubtful accounts, we consider factors such as historical experience, credit quality, age of the accounts receivable balances, geographic or country-specific risks and economic conditions that may affect a customer’s ability to pay. The allowance for doubtful accounts is reviewed regularly and adjusted if necessary based on our assessment of a customer’s ability to pay.
Stock-Based Compensation
We apply the provisions of ASC 718 which requires the measurement and recognition of compensation expense for all share-based payment awards made to employees and non-employee directors based on estimated fair values. Under the fair value recognition provisions of this statement, our stock-based compensation cost is measured at the grant date based on the fair value of the award and is recognized as expense on a straight-line basis over the requisite service period, which is the vesting period. We elected the modified-prospective adoption method, under which prior periods are not restated for comparative purposes. The valuation provisions of ASC 718 apply to new grants, to unvested grants that were outstanding as of the effective date and to all outstanding awards subsequently modified. Estimated compensation for unvested grants that were outstanding as of the effective date will be recognized over the remaining service period using the compensation cost previously estimated for the ASC 718 pro forma disclosures.
We calculate the fair value of stock options using the Black-Scholes option-pricing model. The determination of the fair value of stock-based payment awards using an option-pricing model is affected by our stock price as well as assumptions regarding a number of complex and subjective variables. These variables include our expected stock price volatility over the term of the awards, actual and projected employee stock option exercise behaviors, risk-free interest rate and expected dividends.
We estimate the expected volatility of our common stock-based on its historical volatility over a period equivalent to the expected term of the option. We estimate the expected term of stock options using historical exercise data. We use the exact number of days between the grant and the exercise dates to calculate a weighted average of the holding periods for all awards (i.e., the average interval between the grant and exercise or post-vesting cancellation dates) adjusted as appropriate. We determine the risk-free interest rate for a period equivalent to the expected term of the option by extrapolating from the U.S. Treasury yield curve in effect at the time of the grant. We have never paid cash dividends and do not anticipate paying cash dividends in the foreseeable future. We estimate forfeitures based on our historical experience.
Accounting for Income Taxes
We record a tax provision for the anticipated tax consequences of the reported results of operations. In accordance with ASC 740, the provision for income taxes is computed using the asset and liability method, under which deferred tax assets and liabilities are recognized for the expected future tax consequences of temporary differences between the financial reporting and tax bases of assets and liabilities, and for the operating losses and tax credit carryforwards. Deferred tax assets and liabilities are measured using the currently enacted tax rates that apply to taxable income in effect for the years in which those assets are expected to be realized or settled. We record a valuation allowance to reduce deferred tax assets to the amount that is believed more likely than not to be realized. Management believes that sufficient uncertainty exists regarding the future realization of deferred tax assets and, accordingly, a full valuation allowance has been provided against net deferred tax assets. Tax expense has taken into account any change in the valuation allowance for deferred tax assets where the realization of various deferred tax assets is subject to uncertainty.
Recent Accounting Pronouncements
See Note 3 of the Notes to Consolidated Financial Statements for a full description of recent accounting pronouncements including expected dates of adoption and estimated effects, if any, on our consolidated financial statements.
Results of Operations
Revenue
|
|
|
Year Ended
|
|
|
Year Ended
|
|
||||||||||||||||||||||||||
|
|
|
December 31
|
|
|
December 31
|
|
||||||||||||||||||||||||||
|
|
|
2010
|
|
|
2009
|
|
|
Increase (Decrease)
|
|
|
2009
|
|
|
2008
|
|
|
Increase (Decrease)
|
|
||||||||||||||
|
|
|
($ in thousands)
|
|
|
|
|
|
($ in thousands)
|
|
|
|
|
||||||||||||||||||||
|
|
|
|
|
|
|
|
|
|
|
|
|
|
|
|
|
|
|
|
|
|
|
|
|
|
||||||||
|
Net product revenue
|
|
$
|
15,825
|
|
|
$
|
17,009
|
|
|
$
|
(1,184
|
)
|
|
|
-7
|
%
|
|
$
|
17,009
|
|
|
$
|
9,871
|
|
|
$
|
7,138
|
|
|
|
72
|
%
|
|
Net support revenue
|
|
|
4,498
|
|
|
|
3,119
|
|
|
|
1,379
|
|
|
|
44
|
%
|
|
|
3,119
|
|
|
|
1,653
|
|
|
|
1,466
|
|
|
|
89
|
%
|
|
Total revenue
|
|
$
|
20,323
|
|
|
$
|
20,129
|
|
|
$
|
194
|
|
|
|
1
|
%
|
|
$
|
20,129
|
|
|
$
|
11,524
|
|
|
$
|
8,605
|
|
|
|
75
|
%
|
Our revenue is derived from two sources: product revenue, which includes sales of our hardware appliances bundled with software licenses, and service revenue, which includes revenue from support and services.
Total revenue in 2010 was $20.3 million, an increase of 1% compared with 2009, which reflected a 7% decrease in product revenue and a 44% increase in support revenue.
Product revenue was 78% and 84% of our total revenue in 2010 and 2009, respectively. Product revenue decreased by 7% in 2010 and increased by 72% in 2009. The decrease in product revenue in 2010 reflected lesser order amounts and a mix shift toward the mid-range PL 8000 series product in 2010, as compared with 2009. Sales to one customer accounted for 44% of sales in 2009 and sales to this same customer accounted for 11% of sales in 2010. While the quantity of new customer wins in 2010 exceeded the quantity of new customer wins in 2009, the purchase order amounts in 2010 were less than the purchase order amounts in 2009. The impact of the lesser purchase order amounts was partially offset by follow-on orders from existing customers. The increase in product sales in 2009 reflected increased sales volume of our high-end PL10000 series product, including the sales to the one customer that accounted for 44% of sales in 2009. A majority of our sales in 2010 and 2009 were to large communications carriers and most of the increase in our revenue in 2009 was from sales to large communications carriers, primarily sales to cable multi-system operators and mobile service providers.
Service revenue consists primarily of software maintenance and customer support revenue. Maintenance and customer support revenue is recognized over the support period. The typical support term is twelve months. Service revenue increased by 44% and 89% in 2010 and 2009, respectively, as a result of continued product sales and resulting expansion of our customer base as well as support renewals.
Sales to customers located in the United States as a percentage of total revenues were 59% and 62% for the years ended December 31, 2010 and 2009, respectively. The increase in sales to international customers reflects an increase in customer wins in Europe in 2010, whereas sales to two customers located in the United States accounted for a majority of the sales increase in 2010.
Based on the market credibility that has resulted from the customer wins that we achieved in 2010 and 2009 and the expected increase in demand for the type of products and solutions that we provide to broadband networks because of the expected increase in broadband traffic, particularly at mobile service providers, we believe that our revenue will grow in 2011.
Cost of Sales
Cost of sales includes: (i) direct labor and material costs for products sold, (ii) costs expected to be incurred for warranty, and (iii) adjustments to inventory values, including the write-down of slow moving or obsolete inventory.
The following table presents the breakdown of cost of sales by category:
|
|
|
Year Ended
|
|
|
Year Ended
|
|
||||||||||||||||||||||||||
|
|
|
December 31
|
|
|
December 31
|
|
||||||||||||||||||||||||||
|
|
|
2010
|
|
|
2009
|
|
|
Increase (Decrease)
|
|
|
2009
|
|
|
2008
|
|
|
Increase (Decrease)
|
|
||||||||||||||
|
|
|
($ in thousands)
|
|
|
|
|
|
($ in thousands)
|
|
|
|
|
||||||||||||||||||||
|
|
|
|
|
|
|
|
|
|
|
|
|
|
|
|
|
|
|
|
|
|
|
|
|
|
||||||||
|
Materials and per-use licenses
|
|
$
|
6,759
|
|
|
$
|
7,768
|
|
|
$
|
(1,009
|
)
|
|
|
|
|
$
|
7,768
|
|
|
$
|
3,857
|
|
|
$
|
3,911
|
|
|
|
|
||
|
Percent of net product revenue
|
|
|
43
|
%
|
|
|
46
|
%
|
|
|
|
|
|
|
-3
|
%
|
|
46
|
%
|
|
39
|
%
|
|
|
|
|
|
|
7
|
%
|
||
|
Applied labor and overhead
|
|
|
1,080
|
|
|
|
1,585
|
|
|
|
(505
|
)
|
|
|
|
|
|
1,585
|
|
|
877
|
|
|
|
708
|
|
|
|
|
|
||
|
Percent of net product revenue
|
|
|
7
|
%
|
|
|
9
|
%
|
|
|
|
|
|
|
-2
|
%
|
|
9
|
%
|
|
9
|
%
|
|
|
|
|
|
|
0
|
%
|
||
|
Other indirect costs
|
|
|
474
|
|
|
|
1,060
|
|
|
|
(586
|
)
|
|
|
|
|
|
1,060
|
|
|
523
|
|
|
|
537
|
|
|
|
|
|
||
|
Percent of net product revenue
|
|
|
3
|
%
|
|
|
6
|
%
|
|
|
|
|
|
|
-3
|
%
|
|
6
|
%
|
|
5
|
%
|
|
|
|
|
|
|
1
|
%
|
||
|
Product Costs
|
|
|
8,313
|
|
|
|
10,413
|
|
|
|
(2,100
|
)
|
|
|
|
|
|
10,413
|
|
|
5,257
|
|
|
|
5,156
|
|
|
|
|
|
||
|
Percent of net product revenue
|
|
|
53
|
%
|
|
|
61
|
%
|
|
|
|
|
|
|
-8
|
%
|
|
61
|
%
|
|
53
|
%
|
|
|
|
|
|
|
8
|
%
|
||
|
|
|
|
|
|
|
|
|
|
|
|
|
|
|
|
|
|
|
|
|
|
|
|
|
|
|
|
|
|
|
|
||
|
Support costs
|
|
|
500
|
|
|
|
515
|
|
|
|
(15
|
)
|
|
|
|
|
|
515
|
|
|
527
|
|
|
|
(12
|
)
|
|
|
|
|
||
|
Percent of net support revenue
|
|
|
11
|
%
|
|
|
16
|
%
|
|
|
|
|
|
|
-5
|
%
|
|
16
|
%
|
|
32
|
%
|
|
|
|
|
|
|
-16
|
%
|
||
|
|
|
|
|
|
|
|
|
|
|
|
|
|
|
|
|
|
|
|
|
|
|
|
|
|
|
|
|
|
|
|
||
|
Amortization of acquired assets
|
|
|
---
|
|
|
|
1,017
|
|
|
|
(1,017
|
)
|
|
|
|
|
|
1,017
|
|
|
1,526
|
|
|
|
(509
|
)
|
|
|
|
|
||
|
Percent of net total revenue
|
|
|
0
|
%
|
|
|
5
|
%
|
|
|
|
|
|
|
-5
|
%
|
|
5
|
%
|
|
13
|
%
|
|
|
|
|
|
|
-8
|
%
|
||
|
Total costs of sales
|
|
$
|
8,813
|
|
|
$
|
11,945
|
|
|
$
|
(3,132
|
)
|
|
|
|
|
|
11,945
|
|
|
7,310
|
|
|
$
|
4,635
|
|
|
|
|
|
||
|
Percent of net total revenue
|
|
|
43
|
%
|
|
|
59
|
%
|
|
|
|
|
|
|
-16
|
%
|
|
59
|
%
|
|
63
|
%
|
|
|
|
|
|
|
-4
|
%
|
||
2010 compared to 2009. Total cost of sales decreased by $3,132,000 in 2010 compared to 2009, and decreased as a percentage of revenue by 16 percentage points. The decrease in cost of sales in 2010 reflected lower material costs and the lack of acquisition-related intangible asset amortization in 2010 because the corresponding intangible assets became fully amortized in 2009. Total cost of sales in 2009 included $1,017,000 of acquisition-related intangible asset amortization. The remaining decrease in cost of sales primarily resulted from lower material and related costs, reflecting a sales mix shift toward the lower-cost, mid-range PL 8000 series product that was introduced in mid-2010. The PL 8000 series product is an appliance type product, which is less expensive and requires less materials and overhead to produce as compared with the high-end PL10000 series product that comprised a majority of sales in 2009. The decrease in cost of sales as a percentage of revenue also reflected flat costs for support while support revenue increased.
2009 compared to 2008. Total cost of sales increased by $4,635,000 in 2009 compared to 2008, but decreased as a percentage of revenue by 4 percentage points. The increase in cost of sales reflected higher material costs, primarily the cost of hardware equipment associated with increased product revenue. The decrease in cost of sales as a percentage of revenue reflected flat costs for support related to higher support revenue as well as lower acquisition related intangibles asset amortization costs. Acquisition related intangible amortization expense recorded to cost of sales in 2009 and 2008 decreased by $509,000. Our acquisition intangibles became fully amortized in the third quarter of 2009.
Gross Profit
|
|
|
Year Ended
|
|
|
Year Ended
|
|
||||||||||||||||||||||||||
|
|
|
December 31
|
|
|
December 31
|
|
||||||||||||||||||||||||||
|
|
|
2010
|
|
|
2009
|
|
|
Increase (Decrease)
|
|
|
2009
|
|
|
2008
|
|
|
Increase (Decrease)
|
|
||||||||||||||
|
|
|
($ in thousands)
|
|
|
|
|
|
($ in thousands)
|
|
|
|
|
||||||||||||||||||||
|
|
|
|
|
|
|
|
|
|
|
|
|
|
|
|
|
|
|
|
|
|
|
|
|
|
||||||||
|
Gross profit
|
|
$
|
11,510
|
|
|
$
|
8,184
|
|
|
$
|
3,326
|
|
|
|
41
|
%
|
|
$
|
8,184
|
|
|
$
|
4,214
|
|
|
$
|
3,970
|
|
|
|
94
|
%
|
|
Percent of total net revenue
|
|
|
57
|
%
|
|
|
41
|
%
|
|
|
|
|
|
|
|
|
|
|
41
|
%
|
|
|
37
|
%
|
|
|
|
|
|
|
|
|
2010 compared to 2009. Our gross profit margin rate for 2010 increased by 16 percentage points to 57% from 41% in 2009. This improvement resulted from an increase in margins related to greater support sales because support sales increased while related support costs remained flat; the margin impact of having fully amortized acquisition-related intangible assets in 2009; and higher margins on product sales. Gross profit in 2009 was impacted by $1,017,000 of acquisition-related intangible asset amortization, or 5 percentage points. Of the remaining 11 percentage point increase in the gross margin rate in 2010, 7 percentage points resulted from the increase in support sales and the remaining 4 percentage point increase resulted from improved margin on product sales.
2009 compared to 2008. Our gross profit margin for 2009 increased by 4 percentage points to 41% from 37% in 2008. This increase resulted from an increase in margins related to an increase in support sales and margins because support sales increased while related support costs remained flat, as well as the margin benefit of a decrease in amortization costs of acquisition related intangible assets to $1,017,000 in 2009 from $1,526,000 in 2008, while total revenue increased. Our acquisition intangibles became fully amortized in the third quarter of 2009. The margin improvements associated with support sales and intangible amortization was partially offset by an increase in material costs as a percentage of revenue.
Operating Expenses
|
|
Year Ended
|
|
|
Year Ended
|
|
|||||||||||||||||||||||||||
|
|
|
December 31
|
|
|
December 31
|
|
||||||||||||||||||||||||||
|
|
|
2010
|
|
|
2009
|
|
|
Increase (Decrease)
|
|
|
2009
|
|
|
2008
|
|
|
Increase (Decrease)
|
|
||||||||||||||
|
|
|
($ in thousands)
|
|
|
|
|
|
($ in thousands)
|
|
|
|
|
||||||||||||||||||||
|
|
|
|
|
|
|
|
|
|
|
|
|
|
|
|
|
|
|
|
|
|
|
|
|
|
||||||||
|
Research and development
|
|
$
|
3,305
|
|
|
$
|
2,608
|
|
|
$
|
697
|
|
|
27
|
%
|
|
$
|
2,608
|
|
|
$
|
3,338
|
|
|
$
|
(730
|
)
|
|
|
-22
|
%
|
|
|
Sales and marketing
|
|
|
6,855
|
|
|
|
6,821
|
|
|
|
34
|
|
|
0
|
%
|
|
|
6,821
|
|
|
|
8,864
|
|
|
|
(2,043
|
)
|
|
|
-23
|
%
|
|
|
General and administrative
|
|
|
4,087
|
|
|
|
4,993
|
|
|
|
(906
|
)
|
|
|
-18
|
%
|
|
|
4,993
|
|
|
|
6,996
|
|
|
|
(2,003
|
)
|
|
|
-29
|
%
|
|
Total
|
|
$
|
14,247
|
|
|
$
|
14,421
|
|
|
$
|
(174
|
)
|
|
|
-1
|
%
|
|
$
|
14,421
|
|
|
$
|
19,198
|
|
|
$
|
4,777
|
)
|
|
|
-25
|
%
|
Research and Development
Research and development expenses include costs associated with personnel focused on the development or improvement of our products, prototype materials, initial product certifications and equipment costs. Research and development costs include sustaining efforts for products already released and development costs associated with planned new products.
|
|
|
Year Ended
|
|
|
Year Ended
|
|
||||||||||||||||||||||||||
|
|
|
December 31
|
|
|
December 31
|
|
||||||||||||||||||||||||||
|
|
|
2010
|
|
|
2009
|
|
|
Increase (Decrease)
|
|
|
2009
|
|
|
2008
|
|
|
Increase (Decrease)
|
|
||||||||||||||
|
|
|
($ in thousands)
|
|
|
|
|
|
($ in thousands)
|
|
|
|
|||||||||||||||||||||
|
|
|
|
|
|
|
|
|
|
|
|
|
|
|
|
|
|
|
|
|
|
|
|
|
|
||||||||
|
Research and development
|
|
$
|
3,305
|
|
|
$
|
2,608
|
|
|
$
|
697
|
|
|
27
|
%
|
|
$
|
2,608
|
|
|
$
|
3,338
|
|
|
$
|
(730
|
)
|
|
|
-22
|
%
|
|
|
|
|
|
|
|
|
|
|
|
|
|
|
|
|
|
|
|
|
|
|
|
|
|
|
|
|
|
|
|
|
|
|
|
|
As a percentage of net revenue
|
|
|
16
|
%
|
|
|
13
|
%
|
|
|
|
|
|
|
|
|
|
|
13
|
%
|
|
|
29
|
%
|
|
|
|
|
|
|
|
|
2010 compared to 2009. Research and development expenses for 2010 increased by $696,799 compared to 2009 as a result of increased hires of research and development personnel and the corresponding additional employee compensation costs. The purpose of the new hires is to expand upon our core product features and functionality to support new sales and achieve follow-on sales to our current customers.
2009 compared to 2008. Research and development expenses for 2009 decreased by $730,509 compared to 2008 as a result of reduced research and development headcount and employee compensation costs, and decreased stock-based compensation costs. The reduced headcount related to the outsourcing of hardware development in the United States while retaining software development in Sweden. Stock-based compensation recorded to research and development expense in 2009 and 2008 was $33,002 and $251,543, respectively, a decrease of $318,541.
Sales and Marketing
Sales and marketing expenses primarily include personnel costs, sales commissions and marketing expenses, such as trade shows, channel development and literature.
|
|
|
Year Ended
|
|
|
Year Ended
|
|
||||||||||||||||||||||||||
|
|
|
December 31
|
|
|
December 31
|
|
||||||||||||||||||||||||||
|
|
|
2010
|
|
|
2009
|
|
|
Increase (Decrease)
|
|
|
2009
|
|
|
2008
|
|
|
Increase (Decrease)
|
|
||||||||||||||
|
|
|
($ in thousands)
|
|
|
|
|
|
($ in thousands)
|
|
|
|
|
||||||||||||||||||||
|
|
|
|
|
|
|
|
|
|
|
|
|
|
|
|
|
|
|
|
|
|
|
|
|
|
||||||||
|
Sales and marketing
|
|
$
|
6,855
|
|
|
$
|
6,821
|
|
|
$
|
34
|
|
|
0
|
%
|
|
$
|
6,821
|
|
|
$
|
8,864
|
|
|
$
|
(2,043
|
)
|
|
|
-23
|
%
|
|
|
|
|
|
|
|
|
|
|
|
|
|
|
|
|
|
|
|
|
|
|
|
|
|
|
|
|
|
|
|
|
|
|
|
|
As a percentage of net revenue
|
|
|
34
|
%
|
|
|
34
|
%
|
|
|
|
|
|
|
|
|
|
|
34
|
%
|
|
|
77
|
%
|
|
|
|
|
|
|
|
|
2010 compared to 2009. Sales and marketing expenses for 2010 were flat compared to 2009, reflecting increased contractor costs and headcount and related employee compensation costs, offset by the impact of having fully amortized acquisition-related intangibles assets in 2009. Acquisition-related intangible amortization expense recorded to sales and marketing expense in 2009 was $964,405. Stock-based compensation recorded to sales and marketing expense in 2010 and 2009 was $321,003 and $254,967, respectively, an increase of $66,036.
2009 compared to 2008. Sales and marketing expenses for 2009 decreased by $2,042,968 compared to 2008, reflecting reduced headcount and related employee compensation costs, decreases in acquisition-related intangibles amortization expense and reductions in discretionary marketing spending, such as expenses related to trade shows, and a decrease in stock-based compensation costs. Acquisition-related intangible amortization expense recorded to sales and marketing expense in 2009 and 2008 was $964,405 and $1,439,000, respectively, a decrease of $474,595. Our acquisition intangibles became fully amortized in the third quarter of 2009. Stock-based compensation recorded to sales and marketing expense in 2009 and 2008 was $254,967 and $410,701, respectively, a decrease of $155,734.
General and Administrative
General and administrative expenses consist primarily of personnel and facilities costs related to our executive and finance functions, service fees for paid professional services and amortization of intangible assets. Professional services include costs for legal, independent auditors and investor relations.
|
|
|
Year Ended
|
|
|
Year Ended
|
|
||||||||||||||||||||||||||
|
|
|
December 31
|
|
|
December 31
|
|
||||||||||||||||||||||||||
|
|
|
2010
|
|
|
2009
|
|
|
Increase (Decrease)
|
|
|
2009
|
|
|
2008
|
|
|
Increase (Decrease)
|
|
||||||||||||||
|
|
|
($ in thousands)
|
|
|
|
|
|
($ in thousands)
|
|
|
|
|
||||||||||||||||||||
|
|
|
|
|
|
|
|
|
|
|
|
|
|
|
|
|
|
|
|
|
|
|
|
|
|
||||||||
|
General and administrative
|
|
$
|
4,087
|
|
|
$
|
4,993
|
|
|
$
|
(906
|
)
|
|
|
-18
|
%
|
|
$
|
4,993
|
|
|
$
|
6,996
|
|
|
$
|
(2,003
|
)
|
|
|
-29
|
%
|
|
|
|
|
|
|
|
|
|
|
|
|
|
|
|
|
|
|
|
|
|
|
|
|
|
|
|
|
|
|
|
|
|
|
|
As a percentage of net revenue
|
|
|
20
|
%
|
|
|
25
|
%
|
|
|
|
|
|
|
|
|
|
|
25
|
%
|
|
|
61
|
%
|
|
|
|
|
|
|
|
|
2010 compared to 2009. General and administrative expenses for 2010 decreased by $905,630 compared to 2009, reflecting the impact of having fully amortized acquisition-related intangibles assets in 2009, reduced headcount and related employee compensation costs due to reductions that took effect in the second quarter of 2009, as well as decreases in investor relations costs that took effect in the second half of 2009. Acquisition-related intangible amortization expense recorded to general and administrative expense in 2009 was $496,835. Our acquisition intangibles became fully amortized in the third quarter of 2009. Stock-based compensation recorded to general and administrative expense in 2010 and 2009 was $970,262 and $798,229, respectively, an increase of $172,033.
2009 compared to 2008. General and administrative expenses for 2009 decreased by $2,003,613 compared to 2008, reflecting reduced headcount and related employee compensation costs, as well as decreases in investor relations costs, acquisition-related intangibles amortization expense and stock-based compensation costs. Acquisition-related intangible amortization expense recorded to general and administrative expense in 2009 and 2008 was $496,835 and $741,333, respectively, a decrease of $244,498. Our acquisition intangibles became fully amortized in the third quarter of 2009. Stock-based compensation recorded to general and administrative expense in 2009 and 2008 was $798,229 and $984,589, respectively, a decrease of $186,360.
Interest and Other Expense
|
|
|
Year Ended
|
|
|
Year Ended
|
|
||||||||||||||||||||||||||
|
|
|
December 31
|
|
|
December 31
|
|
||||||||||||||||||||||||||
|
|
|
2010
|
|
|
2009
|
|
|
Increase (Decrease)
|
|
|
2009
|
|
|
2008
|
|
|
Increase (Decrease)
|
|
||||||||||||||
|
|
($ in thousands)
|
|
|
|
|
|
($ in thousands)
|
|
|
|
|
|||||||||||||||||||||
|
|
|
|
|
|
|
|
|
|
|
|
|
|
|
|
|
|
|
|
|
|
|
|
|
|
||||||||
|
Interest income
|
|
$
|
18
|
|
|
|
4
|
|
|
$
|
14
|
|
|
350
|
%
|
|
$
|
4
|
|
|
$
|
87
|
|
|
$
|
(83
|
)
|
|
|
-95
|
%
|
|
|
Interest expense
|
|
|
(165
|
)
|
|
|
(1,843
|
)
|
|
|
(1,678
|
)
|
|
|
-91
|
%
|
|
|
(1,843
|
)
|
|
|
(47
|
)
|
|
|
(1,796
|
)
|
|
|
3,812
|
%
|
|
Total interest and other income (expense), net
|
|
$
|
(147
|
)
|
|
$
|
(1,839
|
)
|
|
$
|
(1,692
|
)
|
|
|
-92
|
%
|
|
$
|
(1,839
|
)
|
|
$
|
40
|
|
|
$
|
(1,879
|
)
|
|
|
-4,698
|
%
|
Interest expense in the year ended December 31, 2010 reflected interest charged on balances outstanding on our line of credit, and amortization of fees associated with the line of credit. Interest expense in the year ended December 31, 2009 included $1,664,756 of interest expense related to the conversion option embedded in the convertible promissory notes that were issued and then converted into 471,305 shares of common stock in the quarter ended June 30, 2009. This interest expense was calculated based on the intrinsic value of the embedded option on the date that each convertible promissory note was executed. The intrinsic value was based on the difference between the $4.00 embedded option exercise price and the approximately $7.50 average price of our common stock on the issuance date of the promissory notes. The calculated interest (or discount) is amortized over the life of the promissory notes. Therefore, because the notes were converted to common stock in the same quarter that they were issued, all of the interest related to the embedded option was recorded (or fully amortized) during the quarter ended June 30, 2009.
Provision for Income Taxes
|
|
|
Year Ended
|
|
|
Year Ended
|
|
||||||||||||||||||||||||||
|
|
|
December 31
|
|
|
December 31
|
|
||||||||||||||||||||||||||
|
|
|
2010
|
|
|
2009
|
|
|
Increase (Decrease)
|
|
|
2009
|
|
|
2008
|
|
|
Increase (Decrease)
|
|
||||||||||||||
|
|
|
($ in thousands)
|
|
|
|
|
|
($ in thousands)
|
|
|
|
|
||||||||||||||||||||
|
|
|
|
|
|
|
|
|
|
|
|
|
|
|
|
|
|
|
|
|
|
|
|
|
|
||||||||
|
Income tax provision (benefit)
|
|
$
|
10
|
|
|
$
|
(691
|
)
|
|
$
|
701
|
|
|
-101
|
%
|
|
$
|
691
|
|
|
$
|
1,042
|
|
|
$
|
(351
|
)
|
|
|
-34
|
%
|
|
We are subject to taxation primarily in the U.S., Sweden, and Australia, as well as in a number of states, including California. The income tax provision for the year ended December 31, 2010 primarily relates to state taxes. During 2009 and 2008, we recorded a tax benefit primarily from the amortization of deferred tax liabilities associated with purchased intangible assets, which was fully amortized during 2009. We have established a valuation allowance for substantially all of our deferred tax assets. We calculated the valuation allowance in accordance with the provisions of ASC 740, which requires that a valuation allowance be established or maintained when it is “more likely than not” that all or a portion of deferred tax assets will not be realized. We will continue to reserve for substantially all net deferred tax assets until there is sufficient evidence to warrant reversal.
Liquidity and Capital Resources
Cash and Cash Equivalents and Investments
The following table summarizes the changes in our cash balance for the periods indicated:
|
|
|
Year Ended
|
|
|||||||||
|
|
|
December 31,
|
|
|||||||||
|
|
|
2010
|
|
2009 |
|
2008 |
|
|||||
|
|
|
(in thousands)
|
|
|||||||||
|
|
|
|
|
|
|
|
|
|
|
|
||
|
|
|
|
|
|
|
|
|
|
|
|
||
|
Net cash used in operating activities
|
|
$
|
(54
|
)
|
|
$
|
(4,136
|
)
|
|
$
|
(12,247
|
)
|
|
Net cash used in investing activities
|
|
|
(714
|
)
|
|
|
(83
|
)
|
|
|
(774
|
)
|
|
Net cash provided by financing activities
|
|
|
5,876
|
|
|
|
5,567
|
|
|
|
8,868
|
|
|
Effect of exchange rate changes on cash and cash equivalents
|
|
|
(424
|
)
|
|
|
122
|
|
|
|
(10
|
)
|
|
Net increase (decrease) in cash and cash equivalents
|
|
$
|
4,684
|
|
|
$
|
1,471
|
|
$
|
(4,143
|
)
|
|
In 2010, we used $54,000 of cash in operating activities, which was approximately $4.1 million less than the $4.1 million use of cash in operating activities in 2009. This reduction in the use of cash in operating activities resulted from a $1.3 million lower net loss, excluding non-cash operating expenses, because of a higher gross margin in 2010, offset by net cash provided by assets and liabilities during the year. In comparison, in 2009, the net loss, excluding non-cash operating expenses, used $1.9 million of cash and net cash of $2.2 million was used by assets and liabilities during the year.
During 2010, the primary uses of cash in operating activities were our $2.9 million net loss, partially offset by $2.3 million of non-cash operating expenses that was further offset by cash provided by the $2.2 million increase in deferred revenue and the $925,438 increase in accounts payable, partially offset by cash used in the $2.1 million increase in accounts receivable, and the $832,800 increase in inventory. The increase in cash used in investing activities in 2010 primarily reflected purchase of testing equipment used in our product research and development. Net cash provided by financing activities in 2010 included proceeds from the issuance of common stock of $6.5 million, offset by the repayment of $500,000 of notes and the net $198,356 repayment of the borrowings against our line of credit.
During 2009, the primary uses of cash in operating activities were our $7.4 million net loss, $3.4 million increase in accounts receivable, $1.5 million decrease in accounts payable, partially offset by cash provided by a $1.6 million reduction in inventories and the non-cash costs of amortization, depreciation, imputed interest and stock-based compensation. The reduction in cash used in investing activities reflected a reduction in the purchase of equipment. Net cash provided by financing activities in 2009 included proceeds from the issuance of common stock of $3.5 million, a $1.9 million borrowing against our line of credit, $500,000 of notes issued (partially offset by loan repayments of $550,000) and proceeds from stock option exercises of $134,800.
During 2008, we used $12.2 million of cash in operating activities. The primary uses of cash in operating activities was our $13.9 million net loss in 2008, $4.2 million increase in accounts receivable, $2.2 million increase in inventories, partially offset by a $1.5 million increase in accounts payable and the non-cash costs of amortization, depreciation, and stock-based compensation. The net cash used in investing activities reflected the purchase of equipment for operations. The net cash provided by financing activities in 2008 included proceeds from the issuance of common stock of $5.8 million, $2.2 million from the exercise of warrants, $550,000 of notes issued and proceeds from stock option exercises of $348,791.
On December 10, 2009, we entered into a two-year loan and security agreement for a secured credit facility of $2.0 million for short-term working capital purposes with Silicon Valley Bank. At December 31, 2010 and 2009, we had $1.7 million and $1.9 million outstanding, respectively, under our credit facility with Silicon Valley Bank. Borrowings under this facility bear interest at the prime rate plus 1%, but not less than 5% on an annual basis. If our cash balance falls below $2,000,000, outstanding borrowings will bear an additional interest charge of 0.6875% per month or 8.25% per annum.
Based on our current cash balance and anticipated cash flow from operations, we believe that our working capital will be sufficient to meet the cash needs of our business for at least the next twelve months. Our future capital requirements will depend on many factors, including our rate of growth, the expansion of our sales and marketing activities, development of additional channel partners and sales territories, the infrastructure costs associated with supporting a growing business and greater installed base of customers, introduction of new products, enhancement of existing products, and the continued acceptance of our products. We may also enter into arrangements that require investment such as complementary businesses, service expansion, technology partnerships or acquisitions.
Off-Balance Sheet Arrangements
As of December 31, 2010, we had no off-balance sheet items as described by Item 303(a)(4) of Regulation S-K. We have not entered into any transactions with unconsolidated entities whereby we have financial guarantees, subordinated retained interests, derivative instruments or other contingent arrangements that expose us to material continuing risks, contingent liabilities, or any other obligations under a variable interest in an unconsolidated entity that provides us with financing, liquidity, market risk or credit risk support.
Contractual Obligations
The following table summarizes the contractual obligations that we were reasonably likely to incur as of December 31, 2010 and the effect that such obligations are expected to have on our liquidity and cash flows in future periods.
|
|
|
Payments Due by Period
|
|
|||||||||||||||||
|
Contractual Obligations
|
|
Total
|
|
|
< 1 Year
|
|
|
1-3 Years
|
|
|
3-5 Years
|
|
|
> 5 Years
|
|
|||||
|
Operating leases
|
|
$
|
535,447
|
|
|
$
|
268,543
|
|
|
$
|
249,414
|
|
|
$
|
17,490
|
|
|
$
|
-
|
|
|
Unconditional purchase obligations
|
|
|
1,362,251
|
|
|
|
1,362,251
|
|
|
|
|
|
|
|
|
|
|
|
|
|
|
Total
|
|
$
|
1,897,698
|
|
|
$
|
1,630,794
|
|
|
$
|
249,414
|
|
|
$
|
17,490
|
|
|
$
|
-
|
|
On February 28, 2011, we entered into a new lease agreement for office space in Fremont, California. The term of the lease is from April 1, 2011 through June 30, 2013 with a one year renewal option. Rent payments due over the initial term of the lease are $124,575.
We use third-party contract manufacturers to assemble and test our hardware products. In order to reduce manufacturing lead-times and ensure an adequate supply of inventories, our agreements with some of these manufacturers allow them to procure long lead-time component inventory based on rolling production forecasts provided by us. We may be contractually obligated to purchase long lead-time component inventory procured by certain manufacturers in accordance with our forecasts. In addition, we issue purchase orders to our third-party manufacturers that may not be cancelable at any time. As of December 31, 2010, we had open non-cancelable purchase orders amounting to approximately $0.9 million with our third-party contract manufacturers.
|
Quantitative and Qualitative Disclosures about Market Risk
|
Foreign Currency Risk
Our sales contracts are denominated predominantly in U.S. Dollars, Swedish Krona, Australian Dollars and the Euro. We incur operating expenses in U.S. Dollars, Swedish Krona and Australian Dollars. Therefore, we are subject to fluctuations in these foreign currency exchange rates. However, to date, exchange rate fluctuations have had minimal impact on our operating results and cash flows, and we have not used derivative instruments to hedge our foreign currency exposures.
Interest Rate Sensitivity
We had unrestricted cash totaling approximately $7.9 million at December 31, 2010. The unrestricted cash is held for working capital purposes. All of our cash is currently held in demand deposit and savings accounts. Therefore, we do not believe that we have any material exposure to changes in the fair market value as a result of changes in interest rates. We do not enter into investments for trading or speculative purposes.
At December 31, 2010, we had $1.7 million outstanding under our credit facility with Silicon Valley Bank. Borrowings under this facility bear interest at the prime rate plus 1%, but not less than 5% on an annual basis. If our cash balance falls below $2,000,000, outstanding borrowings will bear an additional interest charge of 0.6875% per month or 8.25% per annum.
|
Financial Statements and Supplementary Data
|
INDEX TO CONSOLIDATED FINANCIAL STATEMENTS
|
|
Page
|
|
|
|
|
41
|
|
|
43
|
|
|
44
|
|
|
45
|
|
|
46
|
|
|
47
|
To the Board of Directors and Stockholders
Procera Networks, Inc.
Los Gatos, California
We have audited the accompanying consolidated balance sheets of Procera Networks, Inc. (“Procera”) as of December 31, 2010 and 2009, and the related consolidated statements of operations, changes in stockholders’ equity and comprehensive loss and cash flows for the fiscal years ended December 31, 2010, 2009 and 2008. These consolidated financial statements are the responsibility of the Company’s management. Our responsibility is to express an opinion on these consolidated financial statements based on our audits.
We conducted our audits in accordance with the standards of the Public Company Accounting Oversight Board (United States). Those standards require that we plan and perform the audit to obtain reasonable assurance about whether the financial statement is free of material misstatement. An audit includes examining, on a test basis, evidence supporting the amounts and disclosures in the financial statement. An audit also includes assessing the accounting principles used and significant estimates made by management, as well as evaluating the overall financial statement presentation. We believe that our audits provide a reasonable basis for our opinion.
In our opinion, the consolidated financial statements referred to above present fairly, in all material respects, the financial position of Procera Networks, Inc. as of December 31, 2010 and 2009, and the results of its operations and its cash flows for each of the years in the three-year period ended December 31, 2010, in conformity with U.S. generally accepted accounting principles.
We also have audited, in accordance with the standards of the Public Company Accounting Oversight Board (United States), Procera Networks, Inc.’s internal control over financial reporting as of December 31, 2010, based on criteria established in Internal Control — Integrated Framework issued by the Committee of Sponsoring Organizations of the Treadway Commission (COSO), and our report dated March 15, 2011 expressed an unqualified opinion on the effectiveness of the Company’s internal control over financial reporting.
/s/ PMB Helin Donovan, LLP
PMB Helin Donovan, LLP
San Francisco, California
March 15, 2011
REPORT OF INDEPENDENT REGISTERED PUBLIC ACCOUNTING FIRM ON
INTERNAL CONTROL OVER FINANCIAL REPORTING
The Board of Directors and Stockholders
Procera Networks, Inc.:
We have audited Procera Networks, Inc.’s internal control over financial reporting as of December 31, 2010 based on criteria established in Internal Control — Integrated Framework issued by the Committee of Sponsoring Organizations of the Treadway Commission (COSO). Procera Networks, Inc.’s management is responsible for maintaining effective internal control over financial reporting and for its assessment of the effectiveness of internal control over financial reporting, included in the accompanying Management’s Report on Internal Control over Financial Reporting as of December 31, 2010. Our responsibility is to express an opinion on the Company’s internal control over financial reporting based on our audit.
We conducted our audit in accordance with the standards of the Public Company Accounting Oversight Board (United States). Those standards require that we plan and perform the audit to obtain reasonable assurance about whether effective internal control over financial reporting was maintained in all material respects. Our audit included obtaining an understanding of internal control over financial reporting, assessing the risk that a material weakness exists, and testing and evaluating the design and operating effectiveness of internal control based on the assessed risk. Our audit also included performing such other procedures as we considered necessary in the circumstances. We believe that our audit provides a reasonable basis for our opinion.
A company’s internal control over financial reporting is a process designed by, or under the supervision of, the entity’s principal executive and principal financial officers, or persons performing similar functions, and effected by the entity’s board of directors, management, and other personnel to provide reasonable assurance regarding the reliability of financial reporting and the preparation of financial statements for external purposes in accordance with generally accepted accounting principles. A company’s internal control over financial reporting includes those policies and procedures that (1) pertain to the maintenance of records that, in reasonable detail, accurately and fairly reflect the transactions and dispositions of the assets of the company; (2) provide reasonable assurance that transactions are recorded as necessary to permit preparation of financial statements in accordance with generally accepted accounting principles, and that receipts and expenditures of the company are being made only in accordance with authorizations of management and directors of the company; and (3) provide reasonable assurance regarding prevention or timely detection of unauthorized acquisition, use, or disposition of the company’s assets that could have a material effect on the financial statements.
Because of its inherent limitations, internal control over financial reporting may not prevent or detect misstatements. Also, projections of any evaluation of effectiveness to future periods are subject to the risk that controls may become inadequate because of changes in conditions, or that the degree of compliance with the policies or procedures may deteriorate.
In our opinion, Procera Networks, Inc. maintained, in all material respects, effective internal control over financial reporting as of December 31, 2010, based on criteria established in Internal Control — Integrated Framework issued by the Committee of Sponsoring Organizations of the Treadway Commission (COSO).
We also have audited, in accordance with the standards of the Public Company Accounting Oversight Board (United States), the consolidated balance sheets of Procera Networks, Inc. as of December 31, 2010 and 2009 and the related consolidated statements of operations, changes in stockholders’ equity and comprehensive loss, and cash flows for each of the years in the three-year period ended December 31, 2010, and our report dated March 15, 2011 expressed an unqualified opinion on those consolidated financial statements.
PMB Helin Donovan, LLP
San Francisco, California
March 15, 2011
PROCERA NETWORKS, INC.
|
|
|
December 31,
|
|
|||||
|
|
|
2010
|
|
|
2009
|
|
||
|
|
|
|
|
|
|
|
||
|
ASSETS
|
|
|
|
|
|
|
||
|
Current assets:
|
|
|
|
|
|
|
||
|
Cash and cash equivalents
|
|
$
|
7,875,798
|
|
|
$
|
3,191,896
|
|
|
Accounts receivable, net of allowance of $321,823 and $281,140 at December 31, 2010 and 2009, respectively
|
|
|
11,407,220
|
|
|
|
8,908,620
|
|
|
Inventories, net
|
|
|
2,549,695
|
|
|
|
1,877,264
|
|
|
Prepaid expenses and other
|
|
|
831,737
|
|
|
|
692,007
|
|
|
Total current assets
|
|
|
22,664,450
|
|
|
|
14,669,787
|
|
|
|
|
|
|
|
|
|
|
|
|
Property and equipment, net
|
|
|
873,173
|
|
|
|
589,717
|
|
|
Goodwill
|
|
|
960,209
|
|
|
|
960,209
|
|
|
Other non-current assets
|
|
|
19,150
|
|
|
|
103,307
|
|
|
Total assets
|
|
$
|
24,516,982
|
|
|
$
|
16,323,020
|
|
|
|
|
|
|
|
|
|
|
|
|
LIABILITIES AND STOCKHOLDERS' EQUITY
|
|
|
|
|
|
|
|
|
|
Current liabilities:
|
|
|
|
|
|
|
|
|
|
Line of credit
|
|
$
|
1,718,732
|
|
|
$
|
1,917,088
|
|
|
Accounts payable
|
|
|
1,943,799
|
|
|
|
1,003,225
|
|
|
Deferred revenue
|
|
|
3,732,756
|
|
|
|
1,680,581
|
|
|
Accrued liabilities
|
|
|
2,662,564
|
|
|
|
2,255,039
|
|
|
Notes payable
|
|
|
---
|
|
|
|
500,000
|
|
|
Total current liabilities
|
|
|
10,057,851
|
|
|
|
7,355,933
|
|
|
|
|
|
|
|
|
|
|
|
|
Non-current liabilities:
|
|
|
|
|
|
|
|
|
|
Deferred revenue
|
704,735
|
422,479
|
||||||
|
Deferred rent
|
|
|
---
|
|
|
|
29,371
|
|
|
Total liabilities
|
|
|
10,762,586
|
|
|
|
7,807,783
|
|
|
|
|
|
|
|
|
|
|
|
|
Commitments and contingencies (Note 8)
|
|
|
---
|
|
|
|
---
|
|
|
|
|
|
|
|
|
|
|
|
|
Stockholders' equity:
|
|
|
|
|
|
|
|
|
|
Preferred stock, $0.001 par value; 15,000,000 shares authorized: none issued and outstanding
|
|
|
---
|
|
|
|
---
|
|
|
Common stock, $0.001 par value; 32,500,000 shares authorized; 11,314,965 and 9,408,224 shares issued and outstanding at December 31, 2010 and 2009, respectively
|
|
|
11,315
|
|
|
|
9,408
|
|
|
Additional paid-in capital
|
|
|
76,093,272
|
|
|
|
67,898,878
|
|
|
Accumulated other comprehensive loss
|
|
|
(331,883
|
)
|
|
|
(268,449
|
)
|
|
Accumulated deficit
|
|
|
(62,018,308
|
)
|
|
|
(59,124,600
|
)
|
|
Total stockholders' equity
|
|
|
13,754,396
|
|
|
|
8,515,237
|
|
|
Total liabilities and stockholders' equity
|
|
$
|
24,516,982
|
|
|
$
|
16,323,020
|
|
The accompanying notes are an integral part of these consolidated financial statements
CONSOLIDATED STATEMENTS OF OPERATIONS
|
|
|
Year Ended December 31,
|
|
|||||||||
|
|
|
2010
|
|
|
2009
|
|
|
2008
|
|
|||
|
|
|
|
|
|
|
|
|
|
|
|||
|
Sales:
|
|
|
|
|
|
|
|
|
|
|||
|
Product sales
|
|
$
|
15,824,947
|
|
|
$
|
17,009,423
|
|
|
$
|
9,871,185
|
|
|
Support sales
|
|
|
4,498,285
|
|
|
|
3,119,421
|
|
|
|
1,652,769
|
|
|
Total net sales
|
|
|
20,323,232
|
|
|
|
20,128,844
|
|
|
|
11,523,954
|
|
|
Cost of sales:
|
|
|
|
|
|
|
|
|
|
|
|
|
|
Product cost of sales
|
|
|
8,312,770
|
|
|
|
11,430,349
|
|
|
|
6,782,877
|
|
|
Support cost of sales
|
|
|
500,275
|
|
|
|
514,503
|
|
|
|
526,966
|
|
|
Total cost of sales
|
|
|
8,813,045
|
|
|
|
11,944,852
|
|
|
|
7,309,843
|
|
|
|
|
|
|
|
|
|
|
|
|
|
|
|
|
Gross profit
|
|
|
11,510,187
|
|
|
|
8,183,992
|
|
|
|
4,214,111
|
|
|
|
|
|
|
|
|
|
|
|
|
|
|
|
|
Operating expenses:
|
|
|
|
|
|
|
|
|
|
|
|
|
|
Research and development
|
|
|
3,304,650
|
|
|
|
2,607,851
|
|
|
|
3,338,360
|
|
|
Sales and marketing
|
|
|
6,855,203
|
|
|
|
6,820,543
|
|
|
|
8,863,511
|
|
|
General and administrative
|
|
|
4,086,908
|
|
|
|
4,992,538
|
|
|
|
6,996,151
|
|
|
Total operating expenses
|
|
|
14,246,761
|
|
|
|
14,420,932
|
|
|
|
19,198,022
|
|
|
|
|
|
|
|
|
|
|
|
|
|
|
|
|
Loss from operations
|
|
|
(2,736,574
|
)
|
|
|
(6,236,940
|
)
|
|
|
(14,983,911
|
)
|
|
|
|
|
|
|
|
|
|
|
|
|
|
|
|
Other income (expense):
|
|
|
|
|
|
|
|
|
|
|
|
|
|
Interest and other income
|
|
|
17,588
|
|
|
|
4,167
|
|
|
|
86,642
|
|
|
Interest and other expense
|
|
|
(164,993
|
)
|
|
|
(1,842,957
|
)
|
|
|
(47,105
|
|
|
Total other income (expense)
|
|
|
(147,405
|
)
|
|
|
(1,838,790
|
)
|
|
|
39,537
|
|
|
|
|
|
|
|
|
|
|
|
|
|
|
|
|
Loss before income taxes
|
|
|
(2,883,979
|
)
|
|
|
(8,075,730
|
)
|
|
|
(14,944,374
|
)
|
|
Income tax provision (benefit)
|
|
|
9,729
|
|
|
|
(691,450
|
)
|
|
|
(1,042,269
|
)
|
|
Net loss
|
|
$
|
(2,893,708
|
)
|
|
$
|
(7,384,280
|
)
|
|
$
|
(13,902,105
|
)
|
|
|
|
|
|
|
|
|
|
|
|
|
|
|
|
Net loss per share - basic and diluted
|
|
$
|
(0.27
|
)
|
|
$
|
(0.82
|
)
|
|
$
|
(1.76
|
)
|
|
Shares used in computing net loss per share-basic and diluted
|
|
|
10,898,228
|
|
|
|
8,988,587
|
|
|
|
7,914,447
|
|
The accompanying notes are an integral part of these consolidated financial statements
CONSOLIDATED STATEMENTS OF CHANGES IN STOCKHOLDERS’ EQUITY AND COMPREHENSIVE LOSS
|
|
|
Common Stock
|
|
|
Additional Paid-In
|
|
|
Accumulated Other Comprehensive Income
|
|
|
Accumulated
|
|
|
Total Stockholders’
|
|
|||||||||
|
|
Shares
|
|
|
Amount
|
|
|
Capital
|
|
|
(Loss)
|
|
|
Deficit
|
|
|
Equity
|
|
|||||||
|
Balances at December 31, 2007
|
|
|
7,598,874
|
|
|
$
|
7,599
|
|
|
$
|
50,127,030
|
|
|
$
|
76,861
|
|
|
$
|
(37,838,215
|
)
|
|
$
|
12,373,275
|
|
|
Net loss
|
|
|
|
|
|
|
|
|
|
|
|
|
|
|
|
|
|
|
(13,902,105
|
)
|
|
|
(13,902,105
|
)
|
|
Foreign currency translation adjustments
|
|
|
|
|
|
|
|
|
|
|
|
|
|
|
(504,968
|
)
|
|
|
|
|
|
|
(504,968
|
|
|
Comprehensive loss
|
|
|
|
|
|
|
|
|
|
|
|
|
|
|
|
|
|
|
|
|
|
|
(14,407,073
|
)
|
|
Exercise of stock options and warrants
|
|
|
265,950
|
|
|
|
266
|
|
|
|
2,523,097
|
|
|
|
|
|
|
|
|
|
|
|
2,523,363
|
|
|
Stock-based compensation
|
|
|
|
|
|
|
|
|
|
|
1,697,903
|
|
|
|
|
|
|
|
|
|
|
|
1,697,903
|
|
|
Issuance of common stock in private placement, net of issuance costs
|
|
|
524,466
|
|
|
|
524
|
|
|
|
5,828,025
|
|
|
|
|
|
|
|
|
|
|
|
5,828,549
|
|
|
Issuance of common stock to service vendors
|
|
|
52,509
|
|
|
|
53
|
|
|
|
735,947
|
|
|
|
|
|
|
|
|
|
|
|
736,000
|
|
|
Issuance of warrants to service vendors
|
|
|
|
|
|
|
|
|
306,484
|
|
|
|
|
|
|
|
|
|
|
|
306,484
|
|||
|
Balances at December 31, 2008
|
|
|
8,441,799
|
|
|
|
8,442
|
|
|
|
61,218,486
|
|
|
|
(428,107
|
)
|
|
|
(51,740,320
|
)
|
|
|
9,058,501
|
|
|
Net loss
|
|
|
|
|
|
|
|
|
|
|
|
|
|
|
|
|
|
|
(7,384,280
|
)
|
|
|
(7,384,280
|
)
|
|
Foreign currency translation adjustments
|
|
|
|
|
|
|
|
|
|
|
|
|
|
|
159,658
|
|
|
|
|
|
|
|
159,658
|
)
|
|
Comprehensive loss
|
|
|
|
|
|
|
|
|
|
|
|
|
|
|
|
|
|
|
|
|
|
|
(7,224,622
|
)
|
|
Exercise of stock options
|
|
|
21,500
|
|
|
|
21
|
|
|
|
134,779
|
|
|
|
|
|
|
|
|
|
|
|
134,800
|
|
|
Exercise of warrants
|
14,870
|
|
|
|
15
|
|
|
|
(15
|
)
|
|
|
|
|
|
|
|
|
|
|
-
|
|||
|
Other
|
|
|
|
|
|
|
|
|
28,815
|
|
|
|
|
|
|
|
|
|
|
|
28,815
|
|||
|
Issuance of warrants in connection with line of credit
|
|
|
|
|
|
|
|
|
166,302
|
|
|
|
|
|
|
|
|
|
|
|
166,302
|
|||
|
Stock-based compensation
|
|
|
|
|
|
|
|
|
|
|
1,156,957
|
|
|
|
|
|
|
|
|
|
|
|
1,156,957
|
|
|
Issuance of common stock in private placement, net of issuance costs
|
|
|
458,750
|
|
|
|
459
|
|
|
|
1,644,036
|
|
|
|
|
|
|
|
|
|
|
|
1,644,495
|
|
|
Conversion of convertible promissory notes into common stock, net of issuance costs
|
|
|
471,305
|
|
|
|
471
|
|
|
|
3,549,518
|
|
|
|
|
|
|
|
|
|
|
|
3,549,989
|
|
|
Balances at December 31, 2009
|
|
|
9,408,224
|
|
|
9,408
|
|
|
67,898,878
|
|
|
(268,449
|
)
|
|
(59,124,600
|
)
|
|
8,515,237
|
|
|||||
|
Net loss
|
|
|
|
|
|
|
|
|
|
|
|
|
|
|
|
|
|
|
(2,893,708
|
)
|
|
|
(2,893,708
|
)
|
|
Foreign currency translation adjustments
|
|
|
|
|
|
|
|
|
|
|
|
|
|
|
(63,434
|
)
|
|
|
|
|
|
|
(63,434
|
)
|
|
Comprehensive loss
|
|
|
|
|
|
|
|
|
|
|
|
|
|
|
|
|
|
|
|
|
|
|
(2,957,142
|
)
|
|
Exercise of stock options
|
|
|
50,000
|
|
|
|
50
|
|
|
|
310,866
|
|
|
|
|
|
|
|
|
|
|
|
310,916
|
|
|
Non-cash rescission of shares
|
|
|
(3,259
|
)
|
|
|
(3
|
)
|
|
|
3
|
|
|
|
|
|
|
|
|
|
|
|
-
|
|
|
Stock-based compensation
|
|
|
|
|
|
|
|
|
|
|
1,414,182
|
|
|
|
|
|
|
|
|
|
|
|
1,414,182
|
|
|
Issuance of registered placement of common stock, net of issuance costs
|
|
|
1,800,000
|
|
|
|
1,800
|
|
|
|
6,469,403
|
|
|
|
|
|
|
|
|
|
|
|
6,471,203
|
|
|
Issuance of restricted stock
|
|
|
60,000
|
|
|
|
60
|
|
|
|
(60
|
)
|
|
|
|
|
|
|
|
|
|
|
-
|
|
|
Balances at December 31, 2010
|
|
|
11,314,965
|
|
|
$
|
11,315
|
|
|
$
|
76,093,272
|
|
|
$
|
(331,883
|
)
|
|
$
|
(62,018,308
|
)
|
|
$
|
13,754,396
|
|
The accompanying notes are an integral part of these consolidated financial statements
PROCERA NETWORKS, INC.
|
|
|
Year Ended December 31,
|
|
|||||||||
|
|
|
|
|
|
|
|
|
|
|
|||
|
|
|
2010
|
|
|
2009
|
|
|
2008
|
|
|||
|
|
|
|
|
|
|
|
|
|
|
|||
|
Cash flows from operating activities:
|
|
|
|
|
|
|
|
|
|
|||
|
Net loss
|
|
$
|
(2,893,707
|
)
|
|
$
|
(7,384,280
|
)
|
|
$
|
(13,902,105
|
)
|
|
Adjustments to reconcile net loss to net cash used in operating activities:
|
|
|
|
|
|
|
|
|
|
|
|
|
|
Common stock issued for services rendered
|
|
|
-
|
|
|
|
-
|
|
|
|
736,000
|
|
|
Compensation related to stock-based awards
|
|
|
1,414,182
|
|
|
|
1,156,957
|
|
|
|
1,697,902
|
|
|
Interest expense related to conversion option embedded in convertible notes
|
|
|
-
|
|
|
|
1,664,756
|
|
|
|
-
|
|
|
Fair value of warrants issued to non-employees
|
|
|
-
|
|
|
|
-
|
|
|
|
306,484
|
|
|
Depreciation
|
|
|
476,938
|
|
|
|
485,598
|
|
|
|
313,617
|
|
|
Provision for bad debts
|
|
|
33,861
|
|
|
|
30,408
|
|
|
|
24,227
|
|
|
Provision for excess and obsolete inventory
|
|
|
338,778
|
|
|
|
271,562
|
|
|
(59,636
|
)
|
|
|
Amortization of intangibles
|
|
|
-
|
|
|
|
2,478,573
|
|
|
|
3,706,333
|
|
|
Deferred income taxes
|
|
|
-
|
|
|
(695,239
|
)
|
|
|
(1,039,616
|
)
|
|
|
Loss on retirement of property and equipment
|
|
|
-
|
|
|
|
60,655
|
|
|
|
-
|
|
|
Changes in assets and liabilities:
|
|
|
|
|
|
|
|
|
|
|
|
|
|
Accounts receivable
|
|
|
(2,137,681
|
)
|
|
|
(3,416,738
|
)
|
|
|
(4,232,448
|
)
|
|
Inventories
|
|
|
(832,800
|
)
|
|
|
1,574,311
|
|
|
(2,190,297
|
)
|
|
|
Prepaid expenses and other current assets
|
|
|
189,767
|
|
|
|
283,056
|
|
|
(340,504
|
)
|
|
|
Accounts payable
|
|
|
925,438
|
|
|
(1,508,738
|
)
|
|
|
1,836,272
|
|
|
|
Accrued liabilities and deferred rent
|
|
|
280,506
|
|
|
|
256,800
|
|
|
|
431,954
|
|
|
Deferred revenue
|
|
|
2,151,184
|
|
|
|
606,691
|
|
|
|
464,628
|
|
|
Net cash used in operating activities
|
|
|
(53,534
|
)
|
|
|
(4,135,628
|
)
|
|
|
(12,247,189
|
)
|
|
|
|
|
|
|
|
|
|
|
|
|
|
|
|
Cash flows from investing activities:
|
|
|
|
|
|
|
|
|
|
|
|
|
|
Purchase of property and equipment
|
|
|
(714,293
|
)
|
|
|
(83,254
|
)
|
|
|
(773,823
|
)
|
|
Net cash used in investing activities
|
|
|
(714,293
|
)
|
|
|
(83,254
|
)
|
|
|
(773,823
|
)
|
|
|
|
|
|
|
|
|
|
|
|
|
|
|
|
Cash flows from financing activities:
|
|
|
|
|
|
|
|
|
|
|
|
|
|
Proceeds from issuance of common stock
|
|
|
6,471,203
|
|
|
|
1,644,495
|
|
|
|
5,828,549
|
|
|
Proceeds from issuance of bridge note
|
-
|
1,893,732
|
-
|
|||||||||
|
Proceeds from exercise of warrants
|
|
|
-
|
|
|
|
-
|
|
|
|
2,175,572
|
|
|
Proceeds from exercise of stock options
|
|
|
102,916
|
|
|
|
163,615
|
|
|
|
347,791
|
|
|
Proceeds from issuance of notes payable
|
|
|
-
|
|
|
|
500,000
|
|
|
|
550,000
|
|
|
Proceeds from line of credit
|
|
|
2,741,118
|
|
|
|
1,917,089
|
|
|
|
-
|
|
|
Payments on notes payable
|
|
|
(500,000
|
)
|
|
|
(550,000
|
)
|
|
|
-
|
|
|
Repayments on line of credit
|
(2,939,474
|
)
|
-
|
-
|
||||||||
|
Principal payments on capital leases
|
|
|
-
|
|
|
(1,682
|
)
|
|
|
(34,221
|
)
|
|
|
Net cash provided by financing activities
|
|
|
5,875,763
|
|
|
|
5,567,249
|
|
|
|
8,867,691
|
|
|
|
|
|
|
|
|
|
|
|
|
|
|
|
|
Effect of exchange rates on cash and cash equivalents
|
|
|
(424,034
|
)
|
|
|
122,304
|
|
|
|
9,898
|
|
|
|
|
|
|
|
|
|
|
|
|
|
|
|
|
Net increase (decrease) in cash and cash equivalents
|
|
|
4,683,902
|
|
|
|
1,470,671
|
|
|
(4,143,423
|
)
|
|
|
|
|
|
|
|
|
|
|
|
|
|
|
|
|
Cash and cash equivalents, beginning of period
|
|
|
3,191,896
|
|
|
|
1,721,225
|
|
|
|
5,864,648
|
|
|
|
|
|
|
|
|
|
|
|
|
|
|
|
|
Cash and cash equivalents, end of period
|
|
$
|
7,875,798
|
|
|
$
|
3,191,896
|
|
|
$
|
1,721,225
|
|
|
|
|
|
|
|
|
|
|
|
|
|
|
|
|
SUPLEMENTAL CASH FLOW INFORMATION:
|
|
|
|
|
|
|
|
|
|
|
|
|
|
Cash paid for income taxes
|
|
$
|
9,979
|
|
|
$
|
1,889
|
|
|
$
|
41,084
|
|
|
Cash paid for interest
|
|
$
|
88,233
|
|
|
$
|
131,255
|
|
|
$
|
30,055
|
|
|
Conversion of bridge note to common stock
|
|
$
|
-
|
|
|
$
|
1,860,000
|
|
|
$
|
-
|
|
| Receivable for option exercise | $ | 208,000 | $ | - | $ | - | ||||||
The accompanying notes are an integral part of these consolidated financial statements
PROCERA NETWORKS INC.
|
1.
|
Description of Business
|
Procera Networks, Inc. ("Procera" or the "Company") is a leading provider of Intelligent Policy Enforcement, or IPE, solutions based on Deep Packet Inspection technology, that enable mobile and broadband network operators and entities managing private networks including higher education institutions, businesses and government entities (collectively referred to as network operators) to gain enhanced visibility into, and control of, their networks; and to create and deploy new services for their end user subscribers. The Company sells its products through its direct sales force, resellers, distributors and system integrators in the Americas, Asia Pacific and Europe.
Procera was incorporated in 2002 and trades on the NYSE Amex Equities under the trading symbol “PKT”.
|
2.
|
Summary of Significant Accounting Policies
|
Basis of Presentation
The consolidated financial statements include the accounts of Procera and its wholly owned subsidiaries, Netintact AB and Netintact PTY. All significant intercompany balances and transactions have been eliminated. We have prepared the accompanying consolidated financial statements in accordance with accounting principles generally accepted in the United States of America and pursuant to the rules and regulations of the Securities and Exchange Commission (“SEC”).
Reverse Stock Split
Effective February 4, 2011, Procera implemented a 1-for-10 reverse split of its common stock and reduced the number of authorized shares of common stock from 130,000,000 to 32,500,000 shares, as previously authorized and approved by the Company’s stockholders at the June 14, 2010 annual meeting. The Company’s common stock began trading on the NYSE Amex Equities on a post-split basis on February 7, 2011. As a result, the Company’s issued and outstanding common stock was reduced from approximately 113 million to approximately 11.3 million shares. Fractional shares resulting from the split were rounded down to the next whole number, and the Company paid cash in lieu of any fractional shares to the holders of fractional shares of common stock. The par value of the common stock was not affected by the reverse stock split and remained at $0.001 per share. Consequently, the aggregate par value of the issued common stock was reduced by reclassifying the par value amount of the eliminated shares of common stock to “Additional paid-in capital” in the Company’s Consolidated Balance Sheets. The reverse split also effected a reduction in the number of shares of common stock issuable upon the exercise of stock options, restricted stock and warrants under the Company's equity incentive plan. All shares and per share amounts, including all common stock equivalents (stock options, restricted stock and warrants) in the Consolidated Financial Statements and Notes to the Consolidated Financial Statements, have been retroactively adjusted, for all periods presented to reflect the reverse stock split.
Reclassifications
Certain previously reported amounts have been reclassified to conform to the current presentation. These reclassifications had no effect on total net sales, net income or stockholders’ equity.
Use of Estimates
The preparation of consolidated financial statements in conformity with US generally accepted accounting principles requires management to make estimates and judgments that affect the reported amounts of assets, liabilities, revenues and expenses and related disclosures of contingent assets and liabilities. Actual results could differ from those estimates. The accounting estimates that require management’s most significant and subjective judgments include the recognition of revenue and allowance for doubtful accounts, assessment of the recoverability of long-lived assets and goodwill, valuation and recognition of stock-based compensation and accounting for income taxes.
Fair Value of Financial Instruments
The carrying amounts of certain of the Company’s financial instruments including cash and cash equivalents, accounts receivable, line of credit, accounts payable, accrued liabilities, notes payable and capital leases approximate fair value due to their short maturities.
Concentration of Risk
The financial instruments utilized by the Company that potentially subject the Company to a concentration of credit risk consist of cash and cash equivalents and accounts receivable. Cash and cash equivalents are deposited in demand and money market accounts in major financial institutions in the United States, Sweden and Australia. The Company has established guidelines to limit its exposure to credit risk by placing its deposits with high credit quality financial institutions and placing investments with maturities that maintain safety and liquidity within the Company's liquidity needs. Accounts at financial institutions are guaranteed by the Federal Deposit Insurance Corporation (FDIC) up to certain limits. At times, the Company’s deposits or investments may exceed federally insured limits. At December 31, 2010, and December 31, 2009, the Company had approximately $7.6 million and $2.9 million, respectively, at financial institutions in excess of FDIC insured limits. The Company has not experienced any losses in such accounts.
The Company’s sales are currently not concentrated with any single customer and the Company sells to a geographically diverse base of customers. For the year ended December 31, 2010, revenue from one customer represented 11% of net revenues. At December 31, 2010, two customers represented 23% and 11%, respectively, of total accounts receivable, and 51% of accounts receivable were due from customers outside of the United States (see Note 13). The Company maintains an allowance for uncollectible accounts receivable based upon expected collectability of all accounts receivable. The Company performs ongoing credit evaluations of certain customers’ financial condition and generally requires no collateral from its customers.
The Company is dependent on a limited number of third-party contract manufacturers and other suppliers for its hardware equipment. The Company is dependent on the ability of these suppliers to provide products on a timely basis and on favorable pricing terms. The loss of certain principal suppliers or a significant reduction in product availability from principal suppliers could have a material adverse effect on the Company. The Company believes that its relationships with its suppliers are satisfactory; and, the Company has not historically experienced inadequate supply issues from its contract manufacturer or other parts suppliers.
Cash and Cash Equivalents
The Company considers all highly liquid investments with original or remaining maturities of three months or less to be cash equivalents.
Allowance for Doubtful Accounts
The Company maintains an allowance for doubtful accounts for estimated losses resulting from the inability of its customers to make required payments. The Company considers factors such as historical experience, credit quality, age of the accounts receivable balances, geographic or country-specific risks and economic conditions that may affect a customer’s ability to pay. The allowance for doubtful accounts is reviewed regularly and adjusted if necessary based on management’s assessment of a customer’s ability to pay.
Inventory and Related Reserves
Inventories consist primarily of finished goods and are stated at the lower of cost (on a first-in, first-out basis) or market. The Company records inventory write-downs for excess and obsolete inventories based on historical usage and forecasted demand, as well as determining what inventory, if any, is not saleable. Factors which could cause its forecasted demand to prove inaccurate include the Company’s reliance on indirect sales channels and the variability of its sales cycle; the potential of announcements of new products or enhancements to replace or shorten the life cycle of current products, or cause customers to defer their purchases; loss of sales due to product shortages; and the potential of new or alternative technologies achieving widespread market acceptance and thereby rendering the Company’s existing products obsolete. If future demand or market conditions are less favorable than projections, additional inventory write-downs may be required and would be reflected in cost of sales in the period the revision is made.
Capitalization of Internal Use Software:
Certain costs associated with internal-use software are capitalized in accordance with ASC 350-40. Capitalized software costs are amortized on a straight-line basis over the estimated useful life. Unamortized capitalized software costs were not material at December 31, 2010 and 2009, respectively.
Property and Equipment
Property and equipment are stated at cost, less accumulated depreciation and amortization. Depreciation is calculated using the straight-line method over the estimated useful lives of the assets. Leasehold improvements are amortized using the straight-line method over the estimated useful lives of the improvements or the term of the lease, whichever is shorter. Whenever assets are retired or otherwise disposed of, the cost and related accumulated depreciation are removed from the accounts, and any resulting gain or loss is recognized in income for the period. The cost of maintenance and repairs is expensed as incurred; significant improvements are capitalized.
The estimated service lives of property and equipment are principally as follows:
|
Leasehold improvements
|
Lesser of useful life or lease term
|
|
Machinery, office and computer equipment
|
2–5 years
|
|
Computer software
|
3 years
|
|
Transportation vehicles
|
3–5 years
|
Goodwill
Goodwill has been measured as the excess of the cost of acquisition over the amount assigned to tangible and identifiable intangible assets acquired less liabilities assumed. The Company reviews goodwill for impairment annually during the fourth quarter of the year or more frequently if an event or circumstance indicates that an impairment loss has occurred. The identification and measurement of goodwill impairment involves the estimation of fair value at the Company’s reporting unit level. The Company operates in one segment, which is considered to be the sole reporting unit and therefore, goodwill was tested at the enterprise level.
Goodwill impairment is determined using a two-step process. The first step of the goodwill impairment test is used to identify potential impairment by comparing the fair value of a reporting unit with its carrying amount, including goodwill. If the fair value of a reporting unit exceeds its carrying amount, goodwill of the reporting unit is considered not impaired and the second step of the impairment test is unnecessary. If the carrying amount of a reporting unit exceeds its fair value, the second step of the goodwill impairment test is performed to measure the amount of impairment loss, if any.
The second step of the goodwill impairment test compares the implied fair value of the reporting unit’s goodwill with the carrying amount of that goodwill. If the carrying amount of the reporting unit’s goodwill exceeds the implied fair value of that goodwill, an impairment loss is recognized in an amount equal to that excess. The implied fair value of goodwill is determined in the same manner as the amount of goodwill recognized in a business combination. That is, the fair value of the reporting unit is allocated to all of the assets and liabilities of that unit (including any unrecognized intangible assets) as if the reporting unit had been acquired in a business combination and the fair value of the reporting unit was the purchase price paid to acquire the reporting unit.
As of December 31, 2010, the Company completed the first step of its annual impairment test which did not indicate impairment. Therefore, the second step of the impairment test was not necessary.
Accounting for long-lived assets
The Company reviews its long-lived assets including property and equipment and purchased intangible assets for impairment whenever events or changes in circumstances indicate that the carrying amount may not be recoverable. Examples of such events could include a significant disposal of a portion of such assets, an adverse change in the market involving the business employing the related asset, a significant decrease in the benefits realized from an acquired business, difficulties or delays in integrating the business or a significant change in the operations of an acquired business.
An impairment test involves a comparison of undiscounted cash flows from the use of the asset to the carrying value of the asset. Measurement of an impairment loss is based on the amount that the carrying value of the asset exceeds its fair value. No impairment losses were incurred in the periods presented.
Purchased intangible assets are amortized on a straight line basis over their estimated useful lives as follows:
|
Product Software
|
3 years
|
|
Management information software
|
3 years
|
|
Customer base
|
3 years
|
Amortization expense relating to purchased intangible assets was $2,478,574 and $3,706,333 for the years ended December 31, 2009 and 2008, respectively. Because the Company’s purchased intangible assets were fully amortized during 2009, no amortization expense was incurred during 2010.
Product Warranty Reserves
The Company warrants its products against material defects for a specific period of time, generally twelve months against material defects. The Company provides for the estimated future costs of warranty obligations in cost of sales when the related revenue is recognized. The accrued warranty costs represent the best estimate at the time of sale of the total costs that the Company expects to incur to repair or replace product parts, which fail while still under warranty. The amount of accrued estimated warranty costs are primarily based on current information on repair costs. The Company periodically reviews the accrued balances and updates the historical warranty cost trends.
Commitments and Contingencies
Certain conditions may exist on the date the financial statements are issued, which may result in a loss to the Company but which will only be resolved when one or more future events occur or fail to occur. The Company’s management and its legal counsel assess such contingent liabilities, and such assessment inherently involves an exercise of judgment. In assessing loss contingencies related to legal proceedings that are pending against the Company or unasserted claims that may result in such proceedings, the Company’s legal counsel evaluates the perceived merits of any legal proceedings or unasserted claims as well as the perceived merits of the amount of relief sought or expected to be sought therein.
If the assessment of a contingency indicates that it is probable that a material loss has been incurred and the amount of the liability can be estimated, then the estimated liability would be accrued in the Company’s financial statements. If the assessment indicates that a potentially material loss contingency is not probable, but is reasonably possible, or is probable but cannot be estimated, then the nature of the contingent liability, together with an estimate of the range of possible loss if determinable and material, would be disclosed.
Loss contingencies considered remote are generally not disclosed unless they involve guarantees, in which case the nature of the guarantee would be disclosed.
Convertible Debentures
The Company separates conversion features embedded in convertible notes from their host instruments and accounts for them as free standing derivative financial instruments. The Company records the intrinsic value of such conversion options in conventional notes as a discount to convertible notes, based upon the difference between the fair value of the underlying common stock at the commitment date of the note transaction and the effective conversion price embedded in the note. Debt discounts under these arrangements are amortized over the term of the related debt to their earliest date of redemption.
Stock and Warrants Issued to Third Parties
If none of the Company’s stock or warrant agreements with third parties have a disincentive for nonperformance, the Company records a charge for the fair value of the stock and the portion of the warrants earned from the point in time when vesting of the stock or warrants becomes probable.
Warrant Valuation and Beneficial Conversion Feature
The Company calculates the fair value of warrants issued with debt using the Black-Scholes valuation method. The total proceeds received in the sale of debt and related warrants is allocated among these financial instruments based on their relative fair values. The debt discount arising from assigning a portion of the total proceeds to the warrants issued is recognized as interest expense from the date of issuance to the earlier of the maturity date of the debt or the conversion dates using the effective yield method. Additionally, when issuing convertible debt, including convertible debt issued with detachable warrants, the Company tests for the existence of a beneficial conversion feature. The Company records the amount of any beneficial conversion feature (“BCF”), calculated in accordance with these accounting standards, whenever it issues convertible debt that has conversion features at fixed rates that are in the money using the effective per share conversion price when issued. The calculated amount of the BCF is accounted for as a contribution to additional paid-in capital and as a debt discount that is recognized as interest expense from the date of issuance to the earlier of the maturity date of the debt or the conversion dates using the effective yield method. The maximum amount of BCF that can be recognized is limited to the amount that will reduce the net carrying amount of the debt to zero.
Derivatives
A derivative is an instrument whose value is “derived” from an underlying instrument or index such as a future, forward, swap, option contract, or other financial instrument with similar characteristics, including certain derivative instruments embedded in other contracts (“Embedded Derivatives”) and for hedging activities. As a matter of policy, the Company does not invest in separable financial derivatives or engage in hedging transactions. However, complex transactions that the Company entered into in order to originally finance its operations, and the subsequent financing transactions, involved financial instruments containing certain features that have resulted in the instruments being deemed derivatives or containing embedded derivatives. The Company may engage in other similar complex debt transactions in the future, but not with the intention to enter into derivative instruments. Derivatives and Embedded Derivatives, if applicable, are measured at fair value and marked to market through earnings, as codified in ASC 815-15. However, such new and/or complex instruments may have immature or limited markets. As a result, the pricing models used for valuation often incorporate significant estimates and assumptions, which may impact the level of precision in the financial statements.
Stock-Based Compensation
The Company accounts for all share-based payment transactions using a fair-value based measurement method. . The Company calculates stock option-based compensation by estimating the fair value of each option as of its date of grant using the Black-Scholes option pricing model. The fair value of restricted stock grants is calculated based upon the closing stock price of the Company’s Common Stock on the date of the grant. These amounts are expensed over the respective vesting periods of each award using the straight-line attribution method. Compensation expense is recognized only for those awards that are expected to vest, and as such, amounts have been reduced by estimated forfeitures. The Company has historically issued stock options and vested and nonvested stock grants to employees and outside directors whose only condition for vesting has been continued employment or service during the related vesting or restriction period.
Revenue Recognition
The Company’s most common sale involves the integration of software and a hardware appliance. The software is essential to the functionality of the product. The Company accounts for this revenue in accordance with ASC 905-605 for all transactions involving software. The Company recognizes product revenue when all of the following have occurred: (1) the Company has entered into a legally binding arrangement with a customer resulting in the existence of persuasive evidence of an arrangement; (2) delivery has occurred, evidenced when product title transfers to the customer; (3) customer payment is deemed fixed or determinable and free of contingencies and significant uncertainties; and (4) collection is probable.
Product revenue consists of revenue from sales of appliances and software licenses. Product sales include a perpetual license to the Company’s software. Shipping charges billed to customers are included in product revenue and the related shipping costs are included in cost of product revenue. Virtually all sales include post-contract support (PCS) services (included in support revenue) which consist of software updates and customer support. Software updates provide customers access to a constantly growing library of electronic internet traffic identifiers (signatures) and rights to non-specific software product upgrades, maintenance releases and patches released during the term of the support period. Support includes internet access to technical content, telephone and internet access to technical support personnel and hardware support.
Receipt of a customer purchase order is the primary method of determining that persuasive evidence of an arrangement exists.
Delivery generally occurs when a product is delivered to a common carrier F.O.B. shipping point. However, product revenue based on channel partner purchase orders are recorded based on sell-through to the end user customers until such time as the Company has established significant experience with the channel partner’s ability to complete the sales process. Additionally, when the Company introduces new products for which there is no historical evidence of acceptance history, revenue is recognized on the basis of end-user acceptance until such history has been established.
Since customer orders contain multiple items such as hardware, software, and services which are delivered at varying times, the Company determines whether the delivered items can be considered separate units of accounting. Delivered items are considered separate units of accounting if delivered items have value to the customer on a standalone basis, there is objective and reliable evidence of the fair value of undelivered items, and if delivery of undelivered items is probable and substantially in the Company’s control.
In these circumstances, Procera allocates revenue to each separate element based on its vendor specific objective evidence of fair value (“VSOE”). VSOE of fair value for elements of an arrangement is based upon the normal pricing and discounting practices for those services when sold separately and for support and updates is additionally measured by the renewal rate offered to the customer. Through December 31, 2010, in virtually all of the Company’s contracts, the only elements that remained undelivered at the time of product delivery were PCS services. The Company determines VSOE for PCS based on the rate charged to customers based upon renewal pricing for PCS. Each contract or purchase order entered into includes a stated rate for PCS. The renewal rate is generally equal to the stated rate in the original contract. The Company has a history of such renewals, the vast majority of which are at the stated renewal rate on a customer by customer basis.
When the Company is able to establish VSOE for all elements of the sales order it separates the deferred items accordingly. Revenue is recognized on the deferred items using either the completed-performance or proportional-performance method depending on the terms of the service agreement. When the amount of services to be performed in a series of acts is so significant in relation to the entire service contract, that performance is deemed not to have occurred until the final act is completed or when there are acceptance provisions based on customer-specified objectives. Under these conditions, the Company uses the completed-performance method of revenue recognition which is measured by the customer’s acceptance. The Company uses the proportional-performance method of deferred revenue recognition when a service contract specifies activities to be performed by the Company and those acts have been repeatedly demonstrated to be within its core competency. Under this scenario, PCS revenue is recognized ratably over the life of the contract. The majority of service revenue is recognized under the proportional-performance method using the straight line method with the revenue being earned over the life of the contract. A small portion of service revenue is derived from providing training on products and the Company uses the completed-contract method to recognize such revenue. If evidence of the fair value of one or more undelivered elements does not exist, all revenue is generally deferred and recognized when delivery of those elements occurs or when fair value can be established. When the undelivered element for which the Company does not have fair value is PCS, revenue for the entire arrangement is deferred and recognized ratably over the support period.
In certain contracts, billing terms are agreed upon based on performance milestones such as the execution of measurement test, a partial delivery or the completion of a specified service. Payments received before the unconditional acceptance of a specific set of deliverables are recorded as deferred revenue until the conditional acceptance has been waived.
Fees are typically considered to be fixed or determinable at the inception of an arrangement, generally based on specific products and quantities to be delivered. Substantially all of the Company’s contracts do not include rights of return or acceptance provisions. To the extent that agreements contain such terms, the Company recognizes revenue once the acceptance provisions or right of return lapses. Payment terms to customers generally range from net 30 to 90 days. In the event payment terms are provided that differ from the Company’s standard business practices, the fees are deemed to not be fixed or determinable and revenue is recognized when the payments become due, provided the remaining criteria for revenue recognition have been met.
Procera assesses the ability to collect from its customers based on a number of factors, including credit worthiness of the customer and past transaction history of the customer. If the customer is not deemed credit worthy, the Company defers all revenue from the arrangement until payment is received and all other revenue recognition criteria have been met.
Deferred Revenue
The Company’s most common sale includes a perpetual license for software, a hardware appliance along with post contract support and unspecified updates. Where the VSOE of the future deliverable is identifiable, that revenue is initially included in deferred revenue and recognized ratably over the term of the agreement on a straight-line basis. If the VSOE of the future deliverable is not identifiable, the total revenue is deferred and recognized over the term of the agreement.
Income Taxes
The Company accounts for income taxes under an asset and liability approach. This process involves calculating the temporary and permanent differences between the carrying amounts of the assets and liabilities for financial reporting purposes and the amounts used for income tax purposes. The temporary differences result in deferred tax assets and liabilities, which are recorded on the Company’s consolidated balance sheets. The Company must assess the likelihood that its deferred tax assets will be recovered from future taxable income and, to the extent the Company believes that recovery is not likely, the Company must establish a valuation allowance. Changes in the Company’s valuation allowance in a period are recorded through the income tax provision on the consolidated statements of operations. The impact of an uncertain income tax position on the income tax return is recognized at the largest amount that is more-likely-than-not to be sustained upon audit by the relevant taxing authority. An uncertain income tax position will not be recognized if it has less than a 50% likelihood of being sustained.
Shipping and Handling Costs
The Company includes shipping and handling costs associated with inbound and outbound freight in costs of goods sold.
Research and Development
Research and development expenses include internal and external costs. Internal costs include salaries and employment related expenses, prototype materials, initial product certifications, equipment costs and allocated facility costs. External expenses consist of costs associated with outsourced software development activities.
Development costs incurred in the research and development of new products, other than software, and enhancements to existing products are expensed as incurred. Costs for the development of new software products and enhancements to existing products are expensed as incurred until technological feasibility has been established, at which time any additional development costs would be capitalized. To date, the Company's software has been available for general release shortly after being determined to be technologically feasible, which the Company defines as a working prototype. Accordingly, those costs have not been material.
Advertising Costs
Advertising expenses consist primarily of costs incurred in the design, development, and printing of Company literature and marketing materials. Advertising costs are expensed as incurred. Advertising expenses were not significant for the years ended December 31, 2010, 2009 and 2008.
Comprehensive Income (Loss)
Comprehensive income (loss) consists of net income and other gains and losses affecting stockholders’ equity that, under generally accepted accounting principles are excluded from net income. For the Company, such items consist entirely of foreign currency translation gains and losses. Comprehensive income (loss) is displayed in the accompanying consolidated statements of stockholders’ equity, and accumulated other comprehensive income (loss) is presented in the accompanying consolidated balance sheets.
Foreign Operations
The accompanying balance sheets contain certain recorded Company assets in two foreign countries - Sweden and Australia. Although these countries are considered economically stable and the Company has experienced no notable burden from foreign exchange transactions, export duties, or government regulations, it is always possible that unanticipated events in foreign countries could disrupt the Company’s operations.
Foreign Currency Translation
The functional currency of the Company’s foreign subsidiaries in Sweden and Australia is the local currency (Swedish Kroner and Australian Dollar). The revenue and expenses of such subsidiaries have been translated into U.S. dollars at average exchange rates prevailing during the period. Assets and liabilities have been translated at the rates of exchange on the balance-sheet date. The resulting cumulative translation adjustments are reported in accumulated other comprehensive income (loss), a separate component of stockholders' equity in the accompanying consolidated balance sheets.
Business Segments
The Company operates in one reportable operating segment. Management uses one measurement of profitability and does not segregate its business for internal reporting (see Note 13).
|
3.
|
Recent Accounting Pronouncements
|
In October 2009, the Financial Accounting Standards Board (“FASB”) issued Accounting Standards Update (“ASU”) 2009-13, “Multiple-Deliverable Revenue Arrangements—a consensus of the FASB Emerging Issues Task Force” (“ASU 2009-13”). It updates the existing multiple-element revenue arrangements guidance currently included under Accounting Standards Codification (“ASC”) 605-25, which originated primarily from the guidance in Emerging Issues Task Force Issue No. 00-21, “Revenue Arrangements with Multiple Deliverables”. The revised guidance primarily provides two significant changes: 1) eliminates the need for objective and reliable evidence of the fair value for the undelivered element in order for a delivered item to be treated as a separate unit of accounting, and 2) eliminates the residual method to allocate the arrangement consideration. In addition, the guidance also expands the disclosure requirements for revenue recognition. ASU 2009-13 will be effective for the first annual reporting period beginning on or after June 15, 2010, with early adoption permitted provided that the revised guidance is retroactively applied to the beginning of the year of adoption. The Company is currently assessing the future impact of this new accounting update on its consolidated financial statements.
In October 2009, the FASB issued ASU 2009-14, “Certain Revenue Arrangements that Include Software Elements—a consensus of the FASB Emerging Issues Task Force” (“ASU 2009-14”). ASU 2009-14 amends the scope of pre-existing software revenue guidance by removing from the guidance non-software components of tangible products and certain software components of tangible products. ASU 2009-14 will be effective for the first annual reporting period beginning on or after June 15, 2010, with early adoption permitted provided that the revised guidance is retroactively applied to the beginning of the year of adoption. The Company is currently assessing the future impact of this new accounting update on its consolidated financial statements.
In January 2010, the FASB issued ASU 2010-06 (“ASU 2010-06”), Fair Value Measurements and Disclosures (Topic 820) – Improving Disclosures about Fair Value Measurements. ASU 2010-06 requires an entity to disclose separately the amounts of significant transfers in and out of Level I and II fair value measurements, and describe the reasons for the transfers. It also requires additional disclosures regarding purchases, sales, issuances and settlements of Level III measurements. ASU 2010-06 is effective for interim and annual periods beginning after December 15, 2009, except for the additional disclosure of Level III measurements, which is effective for fiscal years beginning after December 15, 2010. The adoption of the provisions of ASU 2010-06 did not have a significant impact on the Company’s consolidated financial statements or related footnotes.
In April 2010, the FASB issued ASU 2010-17, which establishes authoritative guidance permitting use of the milestone method of revenue recognition for research or development arrangements that contain payment provisions or consideration contingent on the achievement of specified events. This guidance is effective for milestones achieved in fiscal years beginning on or after June 15, 2010 and allows for either prospective or retrospective application, with early adoption permitted. The Company is currently evaluating the impact that adoption of this guidance will have on its consolidated financial statements.
Other recent accounting pronouncements issued by the FASB, the American Institute of Certified Public Accountants, and the SEC did not or are not believed by management to have a material impact on the Company's consolidated financial statements.
|
4.
|
Balance Sheet Details
|
Inventory
Inventories are stated at the lower of cost, which approximates actual costs on a first in, first out basis, or market. Inventories at December 31, 2010 and 2009 consisted of the following:
|
|
|
December 31,
|
|
|||||
|
|
|
2010
|
|
|
2009
|
|
||
|
Finished goods
|
|
$
|
2,429,846
|
|
|
$
|
1,824,052
|
|
|
Raw Materials
|
|
|
119,849
|
|
|
|
53,212
|
|
|
Inventories, net
|
|
$
|
2,549,695
|
|
|
$
|
1,877,264
|
|
Because the Company in 2009 began to obtain inventory in a form that requires minimal modification by the Company, it has only a minimal amount of raw materials and no work-in-process inventory.
Property and equipment
The following is a summary of property and equipment as of December 31, 2010 and 2009:
|
|
|
December 31,
|
|
|||||
|
|
|
2010
|
|
|
2009
|
|
||
|
|
|
|
|
|
|
|
||
|
Machinery and equipment
|
|
$
|
1,939,092
|
|
|
$
|
1,249,160
|
|
|
Office furniture and equipment
|
|
|
57,483
|
|
|
|
53,187
|
|
|
Computer equipment
|
|
|
302,775
|
|
|
|
277,186
|
|
|
Software
|
|
|
19,724
|
|
|
|
19,724
|
|
|
Accumulated depreciation
|
|
|
(1,445,901
|
)
|
|
|
(1,009,540
|
)
|
|
Property and equipment, net
|
|
$
|
873,173
|
|
|
$
|
589,717
|
|
Depreciation expense for the years ended December 31, 2010, 2009 and 2008 was $476,938, $485,598 and $313,617, respectively.
Accrued Liabilities
Accrued liabilities at December 31, 2010 and 2009 consisted of the following:
|
|
|
December 31,
|
|
|||||
|
|
|
2010
|
|
|
2009
|
|
||
|
|
|
|
|
|
|
|
||
|
Payroll and related
|
|
$
|
973,970
|
|
|
$
|
1,188,777
|
|
|
Audit and legal services
|
|
|
92,946
|
|
|
|
65,850
|
|
|
Sales, VAT, income taxes
|
|
|
175,462
|
|
|
|
72,839
|
|
|
Sales commissions
|
|
|
461,407
|
|
|
|
323,508
|
|
|
Warranty
|
|
|
530,758
|
|
|
|
333,662
|
|
|
Other
|
|
|
428,021
|
|
|
|
270,403
|
|
|
Total accrued liabilities
|
|
$
|
2,662,564
|
|
|
$
|
2,255,039
|
|
Warranty Reserve
Changes in the warranty reserve during the years ended December 31, 2010 and 2009 were as follows:
|
|
|
December 31,
|
|
|||||
|
|
|
2010
|
|
|
2009
|
|
||
|
Warranty accrual, beginning of period
|
|
$
|
333,662
|
|
|
$
|
129,763
|
|
|
Provision for current period sales
|
|
|
245,148
|
|
|
|
227,907
|
|
|
Deductions for warranty claims processed during the period
|
|
|
(48,052
|
)
|
|
|
(24,008
|
)
|
|
Warranty accrual, end of period
|
|
$
|
530,758
|
|
|
$
|
333,662
|
|
|
5.
|
Line of Credit
|
On December 10, 2009, the Company entered into a two-year loan and security agreement for a secured line of credit facility (“Secured Credit Facility”) for short-term working capital purposes with Silicon Valley Bank. The Secured Credit Facility provides borrowings of up to $2.0 million through December 10, 2011. Borrowings under the facility bear interest at the prime rate plus 1%, but not less than 5% per annum. If the Company’s cash balance falls below $2,000,000, outstanding borrowings will bear an additional interest charge of 0.6875% per month, or 8.25% per annum. Under the terms of the Secured Credit Facility, the Company will pay Silicon Valley Bank a $17,000 fee in each of the two years of the agreement and will pay a minimum monthly interest charge of $3,000 per month. The Company also issued a warrant to Silicon Valley Bank for the purchase of 50,000 shares of the Company’s common stock with an exercise price of $4.00 per share and a fair value of $166,302, which is being amortized to interest expense over the two-year term of the Secured Credit Facility. The Secured Credit Facility is secured by substantially all of the Company’s assets. The terms of the Secured Credit Facility include financial covenants requiring minimum quarterly revenue and restrictions on the Company’s ability to incur certain additional indebtedness, pay dividends, create or permit liens on assets or engage in mergers, consolidations or dispositions. At December 31, 2010, the Company had $1.7 million outstanding on its Secured Credit Facility.
|
6.
|
Notes Payable
|
In April 2009, the Company received loan proceeds totaling $500,000 through a private placement of nonconvertible debt. Such nonconvertible debt bore interest at 10% per annum, which interest was due and payable on a quarterly basis. The nonconvertible debt was repaid in full by the Company during the quarter ended March 31, 2010.
In August 2008, the Company received loan proceeds totaling $550,000 from an individual and a financial institution and issued promissory notes in that amount. These notes bore interest at a rate of 10% per annum. The Company repaid these notes during 2009.
|
7.
|
Related Party Transactions
|
On July 19, 2010, the Company entered into a Master OEM Purchase and Sales Agreement with GENBAND US LLC and GENBAND Ireland Ltd. (collectively, “GENBAND”) pursuant to which GENBAND may purchase any of the Company’s existing software and hardware products, as well as procure licenses and services related to such products from Procera. In conjunction with this agreement, the Board of Directors appointed Charles D. Vogt, President and Chief Executive Officer of GENBAND, as a director of the Company.
During the year ended December 31, 2010, the Company recognized revenue of approximately $1.5 million on sales to GENBAND. At December 31, 2010, the Company had accounts receivable of approximately $1.2 million from GENBAND.
|
8.
|
Commitments and Contingencies
|
Legal
The Company is periodically involved in legal actions and claims that arise as a result of events that occur in the normal course of operations. The Company is not currently aware of any legal proceedings or claims that the Company believes will have, individually or in the aggregate, a material adverse effect on the Company’s financial position or results of operations.
Operating Leases
The Company leases its operating and office facilities for various terms under long-term, non-cancelable operating lease agreements. The leases expire at various dates through 2013 and provide for renewal options ranging from month-to-month to 5 year terms. In the normal course of business, it is expected that these leases will be renewed or replaced by leases on other properties. The leases provide for increases in future minimum annual rental payments based on defined increases which are generally meant to correlate with the Consumer Price Index, subject to certain minimum increases. Also, the agreements generally require the Company to pay executory costs (real estate taxes, insurance and repairs).
As of December 31, 2010, future minimum lease payments due under operating leases are as follows:
|
Years ending December 31,
|
|
|
|
|
|
2011
|
|
$
|
248,942
|
|
|
2012
|
|
|
141,687
|
|
|
2013
|
|
|
35,422
|
|
|
Total minimum lease payments
|
|
$
|
426,051
|
|
Rent expense for operating leases was $351,678, $441,666 and $480,355 in 2010, 2009 and 2008, respectively.
On February 28, 2011, the Company entered into a new lease agreement for office space in Fremont, California. The term of the lease is from April 1, 2011 through June 30, 2013 with a one year renewal option. Rent payments due over the initial term of the lease are $124,575.
|
9.
|
Guarantees
|
Indemnification Agreements
The Company enters into standard indemnification arrangements with certain of its business partners and customers in the ordinary course of business. Pursuant to these arrangements, the Company indemnifies, holds harmless, and agrees to reimburse the indemnified parties for losses suffered or incurred by the indemnified party, generally business partners or customers, in connection with any U.S. patent, or any copyright or other intellectual property infringement claim by any third party with respect to the Company’s products. The term of these indemnification agreements is generally perpetual anytime after the execution of the agreement. The maximum potential amount of future payments the Company could be required to make under these agreements is unlimited. The Company has never incurred costs to defend lawsuits or settle claims related to these indemnification agreements. As a result, the Company believes the estimated fair value of these agreements is minimal.
The Company has entered into indemnification agreements with its directors and officers that may require the Company to indemnify its directors and officers against liabilities that may arise by reason of their status or service as directors or officers, other than liabilities arising from willful misconduct of a culpable nature; to advance their expenses incurred as a result of any proceeding against them as to which they could be indemnified; and to obtain directors’ and officers’ insurance if available on reasonable terms, which the Company currently has in place.
|
10.
|
Stockholders’ Equity
|
Preferred Stock
The Company is authorized to issue up to 15,000,000 shares of Preferred Stock, par value $0.001 per share. As of December 31, 2010 and 2009 no shares of preferred stock were issued and outstanding.
Common Stock Transactions
The Company is authorized to issue up to 32,500,000 shares of common stock, par value $0.001 per share. As of December 31, 2010 there were 11,314,965 shares of Common Stock issued and outstanding.
On March 4, 2010, the Company closed a registered placement of its common stock primarily to institutional investors. The offering price of the Company’s common stock was $4.00 per share. The Company sold 1.8 million shares of common stock at a gross sales price of $7.2 million, and received net proceeds of approximately $6.5 million after deducting the placement agent’s commission and legal and other offering costs. The placement agent also received a warrant to purchase 18,000 shares of the Company’s common stock at an exercise price of $4.00 per share which expires on March 4, 2013. The warrant had an estimated fair value of $44,547 calculated using the Black-Scholes option pricing model.
In December 2010, a former employee exercised stock options to purchase 40,000 shares of common stock for $208,000 for which payment was received in January 2011. This amount is recorded in prepaid expenses and other in the consolidated balance sheets at December 31, 2010.
Private Placement of Common Stock and Convertible Promissory Notes and Promissory Notes
On May 4, 2009, the Company entered into subscription agreements (“the Subscription Agreements”) with certain institutional and accredited individual investors, pursuant to which the Company closed a private placement (the “Private Placement”) of the Company’s common stock, convertible promissory notes and promissory notes. The Private Placement included the sale of 458,750 shares of the Company’s restricted common stock at $4.00 per share on June 3, 2009 for total proceeds of $1,835,000. The Private Placement also included the issuance of convertible promissory notes in the aggregate principal amount of $1,860,000. The convertible promissory notes bore interest at a 10% per annum interest rate and included a clause whereby these promissory notes would be automatically converted into shares of common stock at a conversion price of $4.00 per share upon the conclusion of the sale of restricted common stock. On June 3, 2009, the Company automatically converted these convertible promissory notes into 471,308 shares of restricted common stock. The Private Placement also included the issuance of $500,000 of nonconvertible debt (see Note 6).
The completion of the Private Placement resulted in the Company realizing net proceeds of $3.5 million from the sale of common stock and issuance of 10% convertible promissory notes. In consideration for services rendered by the placement agents in the Private Placement, the Company issued three-year warrants to the placement agents to purchase 20,888 shares of the Company’s Common Stock at an exercise price of $4.00 per share (“the Placement Agent Warrants”). The Placement Agent Warrants had an estimated fair value of $92,438 calculated using the Black-Scholes option pricing model. The Company also incurred direct financing fees of approximately $190,000, which were paid to the placement agent for management fees and expenses, and other direct transactional expenses.
Convertible Promissory Notes
The 10% convertible note agreements issued for a total principal amount of $1,860,000 were converted into common stock of the Company on June 3, 2009. On the issuance date, the Company recognized the value of the embedded beneficial conversion feature of $1,664,756 as additional paid-in capital and an equivalent debt discount. This debt discount is recorded as interest expense in the year ended December 31, 2009.
On September 16, 2008, the Company closed a private placement sale of 524,466 shares of its common stock at prices of $11.00 and $11.70 per share to 66 institutional and other accredited investors and received cash proceeds of $5,828,549, net of financing expenses of $18,900. In addition, placement agent warrants to purchase 1,775 shares (fair value of $7,184) were issued to the placement agents as compensation for their services. Mr. Thomas Saponas, a director of the Company, invested $1 million in this private placement at a price of $11.70 per share.
Warrants
At December 31, 2010, warrants to purchase 409,462 shares of common stock were outstanding. The following table sets forth the key terms of these outstanding warrants.
|
Date of Grant
|
Underlying Security
|
|
Shares Outstanding
|
|
Vesting of Grant
|
Expiration Date
|
|
Weighted Average Exercise Price
|
|
Reason for Grant of Warrants
|
|||||||
|
Feb-06
|
Common Stock
|
|
|
103,888
|
|
Immediate
|
Feb-11
|
|
$
|
4.00
|
|
Raising capital
|
|||||
|
Aug-06
|
Common Stock
|
|
|
56,912
|
|
Immediate
|
Aug-11
|
|
$
|
6.00
|
|
Acquisition of Company
|
|||||
|
Nov-06
|
Common Stock
|
|
|
138,000
|
|
Immediate
|
Nov-11
|
|
$
|
15.00
|
|
Raising capital
|
|||||
|
Jul-07
|
Common Stock
|
|
|
19,999
|
Immediate
|
Jul-12
|
|
$
|
20.00
|
|
Raising capital
|
||||||
|
Sep-08
|
Common Stock
|
|
|
1,775
|
(1)
|
Immediate
|
Sep-11
|
|
$
|
17.50
|
|
Raising capital
|
|||||
|
June-09
|
Common Stock
|
|
|
20,888
|
(2)
|
Immediate
|
Jun-12
|
|
$
|
4.00
|
|
Raising capital
|
|||||
|
Dec-09
|
Common Stock
|
|
|
50,000
|
(3)
|
Immediate
|
Dec-16
|
|
$
|
4.00
|
|
Credit Facility
|
|||||
|
Mar-10
|
Common Stock
|
|
|
18,000
|
(4)
|
Immediate
|
Mar-13
|
|
$
|
4.00
|
|
Raising capital
|
|||||
|
|
|
|
|
409,462
|
|
|
|
|
|
|
|
|
|||||
(Footnotes correspond to the warrant table above)
In conjunction with the closing of a private placement sale of common stock on September 19, 2008, the Company issued 1,775 warrants to purchase common stock with a fair value of $7,184 to placement agents as compensation for their services. The warrant quantity was approximately 5% of the shares purchased from the Company with a strike price of $17.50, equivalent to the price stockholders paid. (1)
In conjunction with the closing of a private placement sale of common stock on June 3, 2009, the Company issued 20,888 warrants to purchase common stock with a fair value of $92,438 to placement agents as compensation for their services. (2)
On December 10, 2009, the Company entered into a two-year loan and security agreement for a Secured Credit Facility for short-term working capital purposes with Silicon Valley Bank. In conjunction with this agreement, the Company issued a warrant to Silicon Valley Bank for the purchase of 50,000 shares of the Company’s common stock with a fair value of $166,302. (3)
On March 4, 2010, the Company closed a registered placement of its common stock primarily to institutional investors. In conjunction with the offering, the Company issued a warrant to the placement agent to purchase 18,000 shares of the Company’s common stock with a fair value of $44,547. (4)
The exhibit below defines the outstanding warrants as of December 31, 2010 by exercise price and the average contractual life before expiration.
|
Exercise Price
|
|
|
Number Outstanding
|
|
|
Weighted Average Remaining Contractual Life (Years)
|
|
|
Number Exercisable
|
|
||||
|
$
|
4.00
|
|
|
|
192,776
|
|
|
|
1.99
|
|
|
|
192,776
|
|
|
|
6.00
|
|
|
|
56,912
|
|
|
|
0.63
|
|
|
|
56,912
|
|
|
10.00
|
36,000
|
0.92
|
36,000
|
|||||||||||
|
|
15.00
|
|
|
|
102,000
|
|
|
|
0.92
|
|
|
|
102,000
|
|
|
|
17.50
|
|
|
|
1,775
|
|
|
|
0.71
|
|
|
|
1,775
|
|
|
|
20.00
|
|
|
|
19,999
|
|
|
|
1.55
|
|
|
|
19,999
|
|
|
|
|
|
|
|
|
|
|
|
|
|
|
|
|
|
|
$
|
8.39
|
|
|
|
409,462
|
|
|
|
1.41
|
|
|
|
409,462
|
|
Stock Option Plans
In August 2003, October 2004 and October 2007, the Company’s board of directors and, subsequently, its stockholders, adopted the 2003 Stock Option Plan, 2004 Stock Option Plan and 2007 Equity Incentive Plan, respectively (collectively referred to as the “Plan”). The Plan was amended in December 2009 to increase the number of shares reserved for issuance to 1,438,952. The purpose of the Plan is to enable the Company to offer stock-based incentives to employees, directors and consultants with the objective of aligning those individuals’ interests with those of stockholders. The Plan authorizes the grant of options and other equity incentives to purchase shares of the Company’s common stock to employees, directors and consultants. Under the Plan, the Company may grant incentive stock options within the meaning of Section 422 of the Internal Revenue Code of 1986, as amended, and non-qualified stock options. Incentive stock options may only be granted to our employees.
As of December 31, 2010, 266,975 shares were available for future grant under the Plan. The options under the Plan vest over varying lengths of time pursuant to various option agreements that the Company has entered into with the grantees of such options. The Plan is administered by the board of directors. Subject to the provisions of the Plan, the board of directors has authority to determine the employees, directors and consultants who are to be awarded options and the terms of such awards, including the number of shares subject to such option, the fair market value of the common stock subject to options, the exercise price per share and other terms.
Incentive stock options must have an exercise price equal to at least 100% of the fair market value of a share on the date of the award and generally cannot have a duration of more than 10 years. If the grant is to a stockholder holding more than 10% of the Company’s voting stock, the exercise price must be at least 110% of the fair market value on the date of grant. Options generally vest over a period of three to five years. Stock option exercises are settled with newly issued common shares approved by stockholders for inclusion under the Plan. Awards are set forth in written agreements between the Company and the respective option holders. Awards under the Plan may not be made after the tenth anniversary of the date of adoption of each respective stock option plan but awards granted before that date may extend beyond that date.
Optionee’s have no rights as stockholders with respect to shares subject to the option prior to the exercise thereof. An option becomes exercisable at such time and for such amounts as determined by the board of directors. An optionee may exercise a part of the option from the date that part first becomes exercisable until the option expires. The purchase price for shares to be issued to an employee upon his exercise of an option is determined by the board of directors on the date the option is granted. The Plan provides for adjustment as to the number and kinds of shares covered by the outstanding options and the option price therefore to give effect to any stock dividend, stock split, stock combination or other reorganization.
Stock Option Plan Activity
Stock Options
The following table summarizes the Company’s stock option activity for the year ended December 31, 2010:
|
|
|
Number of Options
|
|
|
Weighted Average Exercise Price
|
|
|
Weighted Average Remaining Contractual Life (in years)
|
|
Aggregate Intrinsic Value
|
|
|||||
|
|
|
|
|
|
|
|
|
|
|
|
|
|||||
|
Outstanding at December 31, 2009
|
|
|
908,076
|
|
|
$
|
9.92
|
|
|
|
|
|
|
|||
|
Granted
|
|
|
234,037
|
|
|
$
|
4.98
|
|
|
|
|
|
|
|||
|
Exercised
|
|
|
(50,000
|
)
|
|
$
|
5.20
|
|
|
|
|
|
|
|||
|
Cancelled
|
|
|
(116,960
|
)
|
|
$
|
10.82
|
|
|
|
|
|
|
|||
|
Outstanding at December 31, 2010
|
|
|
975,153
|
|
|
$
|
8.93
|
|
|
|
7.44
|
|
|
$
|
503,568
|
|
|
|
|
|
|
|
|
|
|
|
|
|
|
|
|
|
|
|
|
Vested and expected to vest at December 31, 2010
|
|
|
932,455
|
|
|
$
|
9.04
|
|
|
|
7.37
|
|
|
$
|
470,230
|
|
|
|
|
|
|
|
|
|
|
|
|
|
|
|
|
|
|
|
|
Exercisable at December 31, 2010
|
|
|
572,248
|
|
|
$
|
9.93
|
|
|
|
6.69
|
|
|
$
|
241,798
|
|
The total intrinsic value of options exercised during the years ended December 31, 2010, 2009 and 2008 was $50,790, $70,200 and $330,596, respectively.
The Company settles employee stock option exercises with newly issued common shares approved by stockholders for inclusion in its stock option plans.
Restricted Stock
The following is a summary of the Company’s restricted stock award activity the year ended December 31, 2010:
|
|
|
Number of Shares
|
|
|
Weighted Average Grant Date Fair Value
|
|
||
|
Non-vested at December 31, 2009
|
|
|
-
|
|
|
$
|
-
|
|
|
Granted
|
|
|
60,000
|
|
|
$
|
5.30
|
|
|
Non-vested at December 31, 2010
|
|
|
60,000
|
|
|
$
|
5.30
|
|
No restricted stock awards vested during the year ended December 31, 2010.
Stock-Based Compensation
Stock-based employee compensation expense recognized pursuant to the Company’s stock option plans on the accompanying consolidated statements of operations is as follows:
|
|
|
Year Ended December 31,
|
|
|||||||||
|
|
|
2010
|
|
|
2009
|
|
|
2008
|
|
|||
|
|
|
|
|
|
|
|
|
|
|
|||
|
Cost of goods sold
|
|
$
|
88,469
|
|
|
$
|
70,759
|
|
|
$
|
51,069
|
|
|
Research and development
|
|
|
34,448
|
|
|
|
33,002
|
|
|
|
251,543
|
|
|
Sales and marketing
|
|
|
321,003
|
|
|
|
254,967
|
|
|
|
410,701
|
|
|
General and administrative
|
|
|
970,262
|
|
|
|
798,229
|
|
|
|
984,589
|
|
|
Total stock-based compensation expense
|
|
$
|
1,414,182
|
|
|
$
|
1,156,957
|
|
|
$
|
1,697,902
|
|
No income tax benefits were recognized in the years ended December 31, 2010, 2009 and 2008 due to the Company’s continuing losses. No stock-based compensation has been capitalized in inventory due to the immateriality of such amounts.
As of December 31, 2010, total unrecognized compensation cost related to unvested stock options was $1,771,863, net of estimated forfeitures, which is expected to be recognized over an estimated weighted average amortization period of 2.16 years, and total unrecognized compensation cost related to non-vested restricted stock awards was $241,212, net of estimated forfeitures, which is expected to be recognized over an estimated weighted average amortization period of 2.93 years.
Valuation Assumptions
The fair value of each option grant is estimated on the date of grant using the Black-Scholes option valuation model. The fair value of each restricted stock grant is calculated based upon the closing stock price of the Company’s Common Stock on the date of the grant. The expense for stock-based awards is recognized over the requisite service period using the straight-line attribution approach.
The following assumptions were used in determining the fair value of stock options granted during the years ended December 31, 2010, 2009 and 2008:
|
|
|
Year Ended December 31,
|
||||||||||
|
|
|
2010
|
|
|
2009
|
|
|
2008
|
|
|||
|
Expected term (in years)
|
|
|
4.63 - 4.68
|
Yrs
|
|
|
4.15 - 4.61
|
yrs
|
|
|
4.08 - 4.44
|
yrs
|
|
Expected volatility
|
|
|
88 – 96
|
%
|
|
|
97 - 99
|
%
|
|
|
98 - 99
|
%
|
|
Risk-free interest rate
|
|
|
1.38 - 2.28
|
%
|
|
|
1.55 - 2.26
|
%
|
|
|
1.68 - 2.88
|
%
|
|
Dividend yield
|
|
|
-
|
%
|
|
|
-
|
%
|
|
|
-
|
%
|
The weighted average grant date fair value of options granted during the years ended December 31, 2010, 2009 and 2008 was $3.05, $4.40 and $9.05, respectively.
The Company calculated the expected term of stock options granted using historical exercise data. The Company used the exact number of days between the grant and the exercise dates to calculate a weighted average of the holding periods for all awards (i.e., the average interval between the grant and exercise or post-vesting cancellation dates) adjusted as appropriate. Expected volatilities were estimated using the historical share price performance over a period equivalent to the expected term of the option. The risk-free interest rate for a period equivalent to the expected term of the option was extrapolated from the U.S. Treasury yield curve in effect at the time of the grant. The Company has never paid cash dividends and does not anticipate paying cash dividends in the foreseeable future.
|
11.
|
Income Taxes
|
The components of income and loss before income taxes are as follows:
|
|
|
December 31,
|
|
|
December 31,
|
|
|
December 31,
|
|
|||
|
|
|
2010
|
|
|
2009
|
|
|
2008
|
|
|||
|
Domestic
|
|
$
|
(1,012,686
|
)
|
|
$
|
(6,767,263
|
)
|
|
$
|
(12,830,273
|
)
|
|
Foreign
|
|
|
(1,871,293
|
)
|
|
|
(1,308,467
|
)
|
|
|
(2,114,101
|
)
|
|
Loss before income taxes
|
|
$
|
(2,883,979
|
)
|
|
$
|
(8,075,730
|
)
|
|
$
|
(14,944,374
|
)
|
The Company’s provision for income taxes consists of the following:
|
|
|
December 31,
|
|
|
December 31,
|
|
|
December 31,
|
|
|||
|
|
|
2010
|
|
|
2009
|
|
|
2008
|
|
|||
|
Current income taxes:
|
|
|
|
|
|
|
|
|
|
|||
|
Federal/state
|
|
$
|
9,729
|
|
|
$
|
3,785
|
|
$
|
(869
|
)
|
|
|
Foreign
|
|
|
-
|
|
|
|
-
|
|
|
|
-
|
|
|
Total current income taxes
|
|
|
9,729
|
|
|
|
3,785
|
|
|
(869
|
)
|
|
|
|
|
|
|
|
|
|
|
|
|
|
|
|
|
Deferred income taxes:
|
|
|
|
|
|
|
|
|
|
|
|
|
|
Federal/state
|
|
|
-
|
|
|
|
-
|
|
|
|
-
|
|
|
Foreign
|
|
|
-
|
|
|
(695,235
|
)
|
|
|
(1,041,400
|
)
|
|
|
Total deferred income taxes
|
|
|
-
|
|
|
(695,235
|
)
|
|
|
(1,041,400
|
)
|
|
|
|
|
|
|
|
|
|
|
|
|
|
|
|
|
Provision for income taxes
|
|
$
|
9,729
|
|
$
|
(691,450
|
)
|
|
$
|
(1,042,269
|
)
|
|
Deferred income taxes reflect the net tax effects of net operating loss and tax credit carryovers and temporary differences between the carrying amounts of assets and liabilities for financial reporting purposes and the amounts used for income tax purposes. Significant components of the Company’s deferred tax assets are as follows:
|
|
|
Year Ended
|
|
|||||
|
|
|
December 31, 2010
|
|
|
December 31, 2009
|
|
||
|
Deferred tax assets:
|
|
|
|
|
|
|
||
|
Federal, state and foreign net operating losses
|
|
$
|
14,194,426
|
|
|
$
|
12,586,955
|
|
|
Research credits
|
|
|
453,544
|
|
|
|
546,108
|
|
|
Other
|
|
|
2,008,873
|
|
|
|
1,926,177
|
|
|
Valuation allowance
|
|
|
(16,656,843
|
)
|
|
|
(15,059,240
|
)
|
|
Total deferred tax assets
|
|
|
—
|
|
|
|
—
|
|
Reconciliation between the tax provision computed at the Federal statutory income tax rate of 34% and the Company’s actual effective income tax provision is as follows:
|
|
|
Year Ended
|
|
|||||||||
|
|
|
December 31,
|
|
|
December 31,
|
|
|
December 31,
|
|
|||
|
|
|
2010
|
|
|
2009
|
|
|
2008
|
|
|||
|
Computed at statutory rate
|
|
$
|
(980,553
|
)
|
|
$
|
(2,745,748
|
)
|
|
$
|
(5,081,088
|
)
|
|
Research & development credits
|
|
|
(18,432
|
)
|
|
|
(45,865
|
)
|
|
|
(122,213
|
)
|
|
State income taxes
|
|
|
(4,507
|
)
|
|
|
(62,735
|
)
|
|
|
(258,206
|
)
|
|
Stock compensation – ISO
|
|
|
38,391
|
|
|
|
362,503
|
|
|
|
684,894
|
|
|
Loss not benefited
|
|
|
960,888
|
|
|
|
1,790,681
|
|
|
|
3,724,634
|
|
|
Foreign tax
|
|
|
–
|
|
|
|
–
|
|
|
|
–
|
|
|
Other
|
|
|
13,942
|
|
|
|
9,714
|
|
|
|
9,710
|
|
|
Total
|
|
$
|
9,729
|
|
$
|
(691,450
|
)
|
|
|
(1,042,269
|
)
|
|
Realization of deferred tax assets is dependent upon future earnings, if any, the timing and amount of which are uncertain. Accordingly, the net deferred tax assets have been fully offset by a valuation allowance. The valuation allowance increased by $1,597,603 and by $423,045 for the fiscal years ended December 31, 2010 and 2009, respectively.
As of December 31, 2010, the Company had net operating loss carryforwards for federal income tax purposes of approximately $31,904,920 which will begin to expire in 2020. The Company also has state net operating loss carryforwards of approximately $25,825,161 which will begin to expire in 2011. The net operating loss carryforwards include $90,690 which relates to stock option deductions that will be recognized through additional paid in capital when utilized. As such, these deductions are not reflected in deferred tax assets. The Company also has foreign net operating loss carryforwards of $7,239,072 which have no expiration. The Company also has federal and California research and development tax credits of $341,817 and $392,503, respectively. The federal research credits will begin to expire in 2021 while the California research credits have no expiration date.
Utilization of the Company’s net operating loss may be subject to substantial annual limitation due to the ownership change limitations provided by the Internal Revenue Code and similar state provisions. Such an annual limitation could result in the expiration of the net operating loss before utilization.
The Company files income tax returns in the U.S., various state jurisdictions and in the countries of Australia and Sweden. As of December 31, 2010, the federal returns for the years ended 2007 through the current period and most state returns for the years ended 2006 through the current period are still open to examination. In addition, all of the net operating losses and research and development credit carryforwards that may be used in future years are still subject to adjustment. The Company's Australian and Swedish income tax returns for the years ended 2005 and 2004, respectively, through the current period are still open to examination.
The following table summarizes the activity related to our unrecognized tax benefits:
|
Balance at January 1, 2010
|
|
$
|
236,794
|
|
|
Increase related to current year tax position
|
|
|
4,608
|
|
|
Decrease related to tax positions of prior years
|
|
|
(3,064
|
)
|
|
Balance at December 31, 2010
|
|
$
|
238,338
|
|
A total of $204,975 of the unrecognized tax benefits would affect our effective tax rate. The Company currently has a full valuation allowance against its U.S. net deferred tax assets which would impact the timing of the effective tax rate benefit should any of these uncertain tax positions be favorably settled in the future.
We recognize interest and penalties related to uncertain tax positions in income tax expense. As of December 31, 2010, we have no accrued interest or penalties related to uncertain tax positions. The company does not anticipate that total unrecognized tax benefits will significantly change due to the settlement of audits and the expiration of statute of limitations prior to December 31, 2011.
|
12.
|
Earnings (Loss) Per Share
|
Basic earnings (loss) per share is computed by dividing net loss by the weighted average number of common shares outstanding for the period. Diluted earnings per share reflects the potential dilution that could occur from common shares issuable upon the exercise of outstanding stock options or warrants and the vesting of restricted stock awards, which are reflected in diluted earnings per share by application of the treasury stock method. Under the treasury stock method, the amount that the employee must pay for exercising stock options or warrants, the amount of stock-based compensation cost for future services that the Company has not yet recognized, and the amount of tax benefit that would be recorded in additional paid-in capital upon exercise are assumed to be used to repurchase shares.
The following table is a reconciliation of the numerator (net loss) and the denominator (number of shares) used in the basic and diluted earnings per share calculations and sets forth potential shares of common stock that are not included in the diluted net loss per share calculation because their effect is antidilutive:
|
|
|
December 31,
|
|
|
December 31,
|
|
|
December 31,
|
|
|||
|
|
|
2010
|
|
|
2009
|
|
|
2008
|
|
|||
|
Numerator – Basic and diluted
|
|
$
|
(2,893,708
|
)
|
|
$
|
(7,384,280
|
)
|
|
$
|
(13,902,105
|
)
|
|
Denominator – basic and diluted:
|
|
|
|
|
|
|
|
|
|
|
|
|
|
Weighted average common shares outstanding
|
|
|
10,898,228
|
|
|
|
8,988,587
|
|
|
|
7,914,447
|
|
|
Total
|
|
|
10,898,228
|
|
|
|
8,988,587
|
|
|
|
7,914,447
|
|
|
Net loss per share – basic and diluted
|
|
$
|
(0.27
|
)
|
|
$
|
(0.82
|
)
|
|
$
|
(1.76
|
)
|
|
|
|
|
|
|
|
|
|
|
|
|
|
|
|
Antidilutive securities:
|
|
|
|
|
|
|
|
|
|
|
|
|
|
Options and restricted stock
|
|
|
1,035,153
|
|
|
|
908,076
|
|
|
|
798,829
|
|
|
Warrants
|
|
|
409,462
|
|
|
|
416,004
|
|
|
|
430,243
|
|
|
Total antidilutive securities
|
|
|
1,444,615
|
|
|
|
1,324,080
|
|
|
|
1,229,072
|
|
|
13.
|
Segment Information and Revenue by Geographic Region
|
The Company operates in one segment, using one measure of profitability to manage its business. Sales for geographic regions were based upon the customer’s location. The location of long-lived assets is based on the physical location of the Company’s regional offices. The following are summaries of sales and long-lived assets by geographic region:
|
|
|
Year Ended
|
|
|||||||||
|
|
|
December 31,
|
|
|||||||||
|
|
|
2010
|
|
|
2009
|
|
|
2008
|
|
|||
|
Net sales:
|
|
|
|
|
|
|
|
|
|
|||
|
United States
|
|
$
|
11,974,587
|
|
|
$
|
12,670,676
|
|
|
$
|
2,546,252
|
|
|
Asia Pacific and China
|
|
|
3,537,172
|
|
|
|
3,689,879
|
|
|
|
3,177,111
|
|
|
Europe, Middle East and Africa
|
|
|
4,811,473
|
|
|
|
3,768,289
|
|
|
|
5,800,591
|
|
|
Total
|
|
$
|
20,323,232
|
|
|
$
|
20,128,844
|
|
|
$
|
11,523,954
|
|
|
|
|
December 31,
|
|
|
December 31,
|
|
||
|
|
|
2010
|
|
|
2009
|
|
||
|
Long-lived assets:
|
|
|
|
|
|
|
||
|
United States
|
|
$
|
416,791
|
|
|
$
|
501,317
|
|
|
Europe
|
|
|
458,580
|
|
|
|
167,535
|
|
|
Australia
|
|
|
16,952
|
|
|
|
24,172
|
|
|
Total
|
|
$
|
892,323
|
|
|
$
|
693,024
|
|
Sales made to customers located outside the United States as a percentage of total net revenues were 41%, 38% and 82% for the years ended December 31, 2010, 2009 and 2008, respectively.
For the years ended December 31, 2010 and 2009, revenue from one customer (Cox Communications, Inc.) represented 11% and 44%, of net revenues, respectively, with no other single customer accounting for more than 10% of net revenues. For the year ended December 31, 2008, revenue from two customers represented 16% and 10% of net revenues, respectively, with no other single customer accounting for more than 10% of net revenues.
At December 31, 2010, accounts receivable from two customers represented 23% and 11%, respectively, of total accounts receivable with no other single customer accounting for more than 10% of the accounts receivable balance. At December 31, 2009, accounts receivable from two customers represented 55% and 14%, respectively, of total accounts receivable with no other single customer accounting for more than 10% of the accounts receivable balance. At December 31, 2010 and 2009, approximately 51% and 27%, respectively, of the Company’s total accounts receivable were due from customers outside the United States.
|
14.
|
Subsequent Events
|
Effective February 4, 2011, Procera implemented a 1-for-10 reverse split of its common stock and reduced the number of authorized shares of common stock from 130,000,000 to 32,500,000 shares, as previously authorized and approved by the Company’s stockholders at the June 14, 2010 annual meeting. The Company’s common stock began trading on the NYSE Amex Equities on a post-split basis on February 7, 2011. As a result, the Company’s issued and outstanding common stock was reduced from approximately 113 million to approximately 11.3 million shares. Fractional shares resulting from the split were rounded down to the next whole number, and the Company paid cash in lieu of any fractional shares to the holders of fractional shares of common stock. The par value of the common stock was not affected by the reverse stock split and remained at $0.001 per share. Consequently, the aggregate par value of the issued common stock was reduced by reclassifying the par value amount of the eliminated shares of common stock to “Additional paid-in capital” in the Company’s Consolidated Balance Sheets. The reverse split also effected a reduction in the number of shares of common stock issuable upon the exercise of stock options, restricted stock and warrants under the Company's equity incentive plan. All shares and per share amounts, including all common stock equivalents (stock options, restricted stock and warrants) in the Consolidated Financial Statements and Notes to the Consolidated Financial Statements, have been retroactively adjusted, for all periods presented to reflect the reverse stock split.
On February 28, 2011, the Company entered into a new lease agreement for office space in Fremont, California, totaling 8,305 square feet. The Company expects to move its Corporate headquarters into the new facilities in April, 2011. The term of the lease is from April 1, 2011 through June 30, 2013 with a one year renewal option. Rent payments due over the initial term of the lease are $124,575.
Supplemental Quarterly Financial Data (unaudited)
The following is a summary of quarterly results of operations for the years ended December 31, 2010 and 2009:
|
|
|
March 31
|
|
|
June 30
|
|
|
September 30
|
|
|
December 31
|
|
||||
|
|
|
2010
|
|
|
2010
|
|
|
2010
|
|
|
2010
|
|
||||
|
|
|
In thousands, except per share data
|
|
|||||||||||||
|
|
|
|
|
|
|
|
|
|
|
|
|
|
||||
|
Net sales
|
|
$
|
3,294
|
|
|
$
|
4,777
|
|
|
$
|
4,735
|
|
|
$
|
7,518
|
|
|
Gross profit
|
|
$
|
1,714
|
|
|
$
|
2,720
|
|
|
$
|
2,712
|
|
|
$
|
4,364
|
|
|
Net income (loss)
|
|
$
|
(1,515
|
)
|
|
$
|
(822
|
)
|
|
$
|
(739
|
)
|
|
$
|
182
|
|
|
Basic and diluted net income (loss) per share
|
|
$
|
(0.15
|
)
|
|
$
|
(0.07
|
)
|
|
$
|
(0.07
|
)
|
|
$
|
0.02
|
|
|
|
|
March 31
|
|
|
June 30
|
|
|
September 30
|
|
|
December 31
|
|
||||
|
|
|
2009
|
|
|
2009
|
|
|
2009
|
|
|
2009
|
|
||||
|
|
|
In thousands, except per share data
|
|
|||||||||||||
|
|
|
|
|
|
|
|
|
|
|
|
|
|
||||
|
Net sales
|
|
$
|
2,947
|
|
|
$
|
3,234
|
|
|
$
|
4,583
|
|
|
$
|
9,364
|
|
|
Gross profit
|
|
$
|
1,159
|
|
|
$
|
878
|
|
|
$
|
1,488
|
|
|
$
|
4,659
|
|
|
Net income (loss)
|
|
$
|
(2,334
|
)
|
|
$
|
(4,333
|
)
|
|
$
|
(1,595
|
)
|
|
$
|
877
|
|
|
Basic and diluted net income (loss) per share
|
|
$
|
(0.28
|
)
|
|
$
|
(0.50
|
)
|
|
$
|
(0.17
|
)
|
|
$
|
0.09
|
|
|
Changes In and Disagreements With Accountants on Accounting and Financial Disclosure
|
None
|
Controls and Procedures
|
Evaluation of Disclosure Controls and Procedures
We have adopted and maintain disclosure controls and procedures that are designed to ensure that information required to be disclosed in our reports under the Securities Exchange Act of 1934, as amended, is recorded, processed, summarized and reported within the time periods specified in the SEC’s rules and forms and that such information is accumulated and communicated to our management, including our Chief Executive Officer and Chief Financial Officer, as appropriate, to allow for timely decisions regarding required disclosure. In designing and evaluating the disclosure controls and procedures, management recognizes that controls and procedures, no matter how well designed and operated, cannot provide absolute assurance of achieving the desired control objectives.
As required by Rule 13a-15(b), under the Securities Exchange Act of 1934, as amended, we carried out an evaluation, under the supervision and with the participation of management, including our Chief Executive Officer and Chief Financial Officer, of the effectiveness of the design and operation of our disclosure controls and procedures as of the end of the period covered by this report. Based on the foregoing, our Chief Executive Officer and Chief Financial Officer concluded that our disclosure controls and procedures are effective.
Management’s Report on Internal Control over Financial Reporting
We prepared the consolidated financial statements and other information in our Annual Report in accordance with accounting principles generally accepted in the United States of America and we are responsible for their accuracy. The financial statements necessarily include amounts that are based on our best estimates and judgments. In meeting our responsibility, we rely on internal accounting and related control systems. The internal control systems are designed to ensure that transactions are properly authorized and recorded in our financial records and to safeguard our assets from material loss or misuse. Such assurance cannot be absolute because of inherent limitations in any internal control system.
Our management is responsible for establishing and maintaining adequate internal control over financial reporting as defined in Rule 13a-15(f) of the Securities Exchange Act of 1934, as amended.
Because of inherent limitations, internal control over financial reporting may not prevent or detect misstatements. Also, projections of any evaluation of effectiveness to future periods are subject to the risk that controls may become inadequate because of changes in conditions, or that the degree of compliance with the policies or procedures may deteriorate.
In connection with the preparation of our annual financial statements, under the supervision and with the participation of our management, including our Chief Executive Officer and Chief Financial Officer, we completed an assessment of the effectiveness of our internal control over financial reporting as of December 31, 2010. The assessment was based upon the framework described in the “Integrated Control-Integrated Framework” issued by the Committee of Sponsoring Organizations of the Treadway Commission (“COSO”). Our assessment included an evaluation of the design of internal control over financial reporting and testing of the operational effectiveness of internal control over financial reporting. We have reviewed the results of the assessment with the Audit Committee of our Board of Directors.
Based on our assessment under the criteria set forth in COSO, management has concluded that, as of December 31, 2010, we maintained effective internal control over financial reporting.
The effectiveness of our internal control over financial reporting as of December 31, 2010 has been audited by PMB Helin Donovan LLP, an independent registered public accounting firm, as stated in their report which appears herein.
Changes in Internal Control over Financial Reporting
There was no change in our internal control over financial reporting during the period ended December 31, 2010, that has materially affected, or is reasonably likely to materially affect, our internal control over financial reporting.
|
Other Information
|
None.
|
Directors, Executive Officers and Corporate Governance
|
The information required by this item concerning our directors is incorporated by reference to the information set forth in the section titled “Election of Directors” in our Proxy Statement. The information required by this item related to the executive officers can be found in the section captioned "Executive Officers of the Registrant" under Part I, "Item 1. Business" of this Annual Report on Form 10-K, and is also incorporated herein by reference.
|
Executive Compensation
|
The information required by this item regarding executive compensation is incorporated by reference to the information set forth in the sections titled “Executive Compensation” in our Proxy Statement.
|
Security Ownership of Certain Beneficial Owners and Management and Related Stockholder Matters
|
The information required by this item regarding security ownership of certain beneficial owners and management is incorporated by reference to the information set forth in the section titled “Security Ownership of Certain Beneficial Owners and Management and Related Stockholder Matters” in our Proxy Statement.
|
Certain Relationships and Related Transactions, and Director Independence
|
The information required by this item regarding certain relationships and related transactions is incorporated by reference to the information set forth in the section titled “Certain Relationships and Related Transactions” in our Proxy Statement.
|
Principal Accounting Fees and Services
|
The information required by this item regarding principal accounting fees and services is incorporated by reference to the information set forth in the section titled “Principal Accounting Fees and Services” in our Proxy Statement.
|
Exhibits, Financial Statement Schedules
|
|
|
(a)
|
Financial Statements
|
The financial statements filed as part of this report are listed on the index to financial statements on page 40.
|
|
(b)
|
Financial Statement Schedules
|
PROCERA NETWORKS, INC.
SCHEDULE II: VALUATION AND QUALIFYING ACCOUNTS
|
|
Balance at Beginning of Year
|
|
|
Additions Charged to Expense or Other Accounts
|
|
|
Deductions
|
|
|
Balance at End of Year
|
|
|||||
|
Allowance for doubtful accounts:
|
|
|
|
|
|
|
|
|
|
|
|
|
||||
|
Year ended December 31, 2010
|
|
$
|
281,140
|
|
|
$
|
62,231
|
|
$
|
(21,548
|
)
|
|
$
|
321,823
|
|
|
|
Year ended December 31, 2009
|
|
|
182,760
|
|
|
|
98,380
|
|
|
|
-
|
|
|
281,140
|
|
|
|
Year ended December 31, 2008
|
|
|
241,062
|
|
|
|
24,247
|
|
|
|
(82,549
|
)
|
|
|
182,760
|
|
All other schedules have been omitted because the required information is not present or not present in the amounts sufficient to require submission of the schedule or because the information required is included in the consolidated financial statements or notes thereto.
|
(c)
|
Exhibits
|
The following exhibits are incorporated by reference or filed herewith.
|
2.1* Agreement and Plan of Merger by and between Zowcom, Inc. and the Company, dated June 24, 2003, included as Exhibit A to our Preliminary Proxy Statement on Schedule 14A filed on August 25, 2003 and incorporated herein by reference.
|
|
2.2* First Amended and Restated Stock Exchange Agreement and Plan of Reorganization, dated August 18, 2006 by and between the Company and the Sellers of Netintact, included as Exhibit 2.1 to our form 8-K filed on August 31, 2006 and incorporated herein by reference.
|
|
2.3* Form of Closing Date Warrant Agreement, dated August 18, 2006, included as Exhibit 2.2 to our form 8-K filed on August 31, 2006 and incorporated herein by reference.
|
|
2.4* Form of Incentive Warrant Agreement, dated August 18, 2006, included as Exhibit 2.3 to our form 8-K filed on August 31, 2006 and incorporated herein by reference.
|
|
2.5* Lockup Agreement dated August 18, 2006, included as Exhibit 2.4 to our form 8-K filed on August 31, 2006 and incorporated herein by reference.
|
|
2.6* Voting Agreement dated August 18, 2006, included as Exhibit 2.5 to our form 8-K filed on August 31, 2006 and incorporated herein by reference.
|
|
2.7* Form of Escrow Agreement, included as Exhibit 2.6 to our form 8-K filed on August 31, 2006 and incorporated herein by reference.
|
|
2.8* First Amendment to the First Amended and Restated Stock Exchange Agreement and Plan of Reorganization by and between the Company and the Sellers of Netintact dated November 2006, included as Exhibit 2.8 to our form 10-KSB filed on April 16, 2007 and incorporated herein by reference.
|
|
3.1* Articles of Incorporation, included as Exhibit 3.1 to our form SB-2 filed on February 11, 2002 and incorporated herein by reference.
|
|
3.2* Certificate of Amendment to Articles of Incorporation, included as Exhibit 99.1 to our form 8-K filed on October 13, 2005 and incorporated herein by reference.
|
|
3.3* Certificate of Amendment to Articles of Incorporation, included as Exhibit 3.3 to our form 10-Q filed on May 12, 2008 and incorporated herein by reference.
|
|
3.4* Certificate of Amendment to Articles of Incorporation, included as Exhibit 3.1 to our form 8-K filed on February 4, 2011 and incorporated herein by reference.
|
|
3.45* Amended and Restated Bylaws, adopted on August 4, 2010, included as Exhibit 3.4 to our form 10-Q filed on August 9, 2010 and incorporated herein by reference.
|
|
4.1*Form of Subscription Agreement for July 2007 offering, included as Exhibit 10.1 to our form 8-K filed on July 19, 2007 and incorporated herein by reference.
|
|
4.2*Form of Registration Rights Agreement for July 2007 offering, included as Exhibit 10.2 to our form 8-K filed on July 19, 2007 and incorporated herein by reference.
|
|
4.3* Form of Warrant Agreement for July 2007 offering, included as Exhibit 4.3 to our form SB-2 filed on October 5, 2007 and incorporated herein by reference.
|
|
4.4* Form of Subscription Agreement for November 2006 offering, included as Exhibit 2.1 to our form 8-K filed on December 6, 2006 and incorporated herein by reference
|
|
4.5* Form of Registration Rights Agreement for November 2006 offering, included as Exhibit 2.3 to our form 8-K filed on December 6, 2006 and incorporated herein by reference.
|
|
4.6*Form of Warrant Agreement for November 2006 offering, included as Exhibit 2.2 to our form 8-K filed on December 6, 2006 and incorporated herein by reference.
|
|
4.7* Form of Subscription Agreement for February 2006 offering, included as Exhibit 10.1 to our form 8-K filed on March 1, 2006 and incorporated herein by reference.
|
|
4.8* Form of Amendment to Stock Subscription Agreement for February 2006 offering, included as Exhibit 10.2 to our form 8-K filed on March 1, 2006 and incorporated herein by reference.
|
|
4.9* Form of Registration Rights Agreement for February 2006 offering, included as Exhibit 10.4 to our form 8-K filed on March 1, 2006 and incorporated herein by reference.
|
|
4.10* Form of Subscription Agreement for December 2004 offering, included as Exhibit 10.1 to our form 8-K filed on January 4, 2005 and incorporated herein by reference.
|
|
4.11* Form of Registration Rights Agreement for December 2004 offering, included as Exhibit 10.2 to our form 8-K filed on January 4, 2005 and incorporated herein by reference.
|
|
4.12 * Form of Warrant Agreement for December 2004 offering included as Exhibit 10.3 to our current report form 8-K filed on January 4, 2005 and incorporated herein by reference.
|
|
4.13* Form of Warrant Agreement for December 2004 offering, included as Exhibit 10.4 to our form 8-K filed on January 4, 2005 and incorporated herein by reference.
|
|
4.14* Form of Subscription Agreement for June 2003 offering, included as Exhibit 4.13 to our form SB-2 filed on October 5, 2007 and incorporated herein by reference.
|
|
4.15* Form of Registration Rights Agreement for June 2003 offering included as Exhibit 4.14 to our form SB-2 filed on October 5, 2007 and incorporated herein by reference.
|
|
4.16*Form of Warrant Agreement for June 2003 offering, included as Exhibit 4.15 to our form SB-2 filed on October 5, 2007 and incorporated herein by reference.
|
|
4.17*Form of Subscription Agreement for September 2008 offering, included as Exhibit 10.1 to our form 8-K filed on August 29, 2008 and incorporated herein by reference.
|
|
4.18*Amendment No. 1 to Subscription Agreement by and between the Company and Thomas A. Saponas, entered into as of September 12, 2008, included as Exhibit 10.2 to our form 8-K/A filed on September 17, 2008 and incorporated herein by reference.
|
|
4.19* Form of Subscription Agreement for May 2009 offering, included as Exhibit 10.1 to our form 8-K filed on May 8, 2009 and incorporated herein by reference.
|
|
4.20* Form of Note Purchase Agreement for May 2009 offering, included as Exhibit 10.2 to our form 8-K filed on May 8, 2009 and incorporated herein by reference.
|
|
4.21* Form of Note Purchase Agreement for May 2009 offering, included as Exhibit 10.3 to our form 8-K filed on May 8, 2009 and incorporated herein by reference.
|
|
4.22* Warrant to Silicon Valley Bank, dated December 10, 2009, included as Exhibit 4.1 to our form 8-K/A filed on February 11, 2010 and incorporated herein by reference.
|
|
4.23* Form of Subscription Agreement for March 2010 offering, included as Exhibit 1.2 to our form 8-K filed on March 2, 2010 and incorporated herein by reference.
|
|
4.24* Form of Warrant for March 2010 offering, included as Exhibit 4.1 to our form 8-K filed on March 2, 2010 and incorporated herein by reference.
|
|
10.1* 2003 Stock Option Plan, included as Exhibit 10.1 to our form SB-2 filed on January 8, 2004 and incorporated herein by reference.
|
|
10.2* Amended 2004 Stock Option Plan, included as Exhibit 99.3 to our form 8-K filed on October 13, 2005 and incorporated herein by reference.
|
|
10.3* Lease Agreement by and between the Company and Vasona Business Park, dated as of May 1, 2005, included as Exhibit 10.3 to our form SB-2 filed on October 5, 2007 and incorporated herein by reference.
|
|
10.4 *Lease Extension by and between the Company and Vasona Business Park dated November 20, 2007 included as Exhibit 10.8 to our form 10-K filed on April 2, 2008, as amended, and incorporated herein by reference.
|
|
10.5*2007 Equity Incentive Plan included as Exhibit 10.1 to our form 10-Q filed on May 12, 2008 and incorporated herein by reference.
|
|
10.6*Executive Employment Agreement for James F. Brear dated as of February 11, 2008 included as Exhibit 10.2 to our form 10-Q filed on May 12, 2008 and incorporated herein by reference.
|
|
10.7* Executive Employment Agreement for Charles Constanti, dated as of April 27, 2009, included as Exhibit 10.1 to our form 8-K filed on April 30, 2009 and incorporated herein by reference.
|
|
10.8* Amendment to Lease by and between the Company and Vasona Business Park, dated April 30, 2009, included as Exhibit 10.5 to our form 10-Q filed on August 12, 2009 and incorporated herein by reference.
|
|
10.9* Form of Indemnity Agreement, included as Exhibit 10.6 to our form 10-Q filed on August 12, 2009 and incorporated herein by reference.
|
|
10.10* Summary of Agreement with Continuous Computing Corporation dated April 13, 2009, included as Exhibit 10.7 to our form 10-Q filed on August 12, 2009 and incorporated herein by reference.
|
|
10.11* Loan and Security Agreement by and between the Company and Silicon Valley Bank, dated December 10, 2009, included as Exhibit 10.1 to our form 8-K/A filed on February 11, 2010 and incorporated herein by reference.
|
|
10.12* Second Amendment to Lease by and between the Company and Vasona Business Park, dated April 1, 2010, included as Exhibit 10.1 to our form 10-Q filed on August 9, 2010 and incorporated herein by reference.
|
|
10.13* † Master OEM Purchase and Sales Agreement among the Company, GENBAND US LLC and GENBAND Ireland Ltd., effective July 19, 2010, included as Exhibit 10.1 to our form 10-Q filed on November 9, 2010 and incorporated herein by reference.
|
|
10.14* Letter Agreement by and between the Company and GENBAND US LLC, dated July 19, 2010, included as Exhibit 10.2 to our form 10-Q filed on November 9, 2010 and incorporated herein by reference.
|
|
10.15* Waiver and First Amendment to Loan and Security Agreement by and between the Company and Silicon Valley Bank, dated May 7, 2010, included as Exhibit 10.3 to our form 10-Q filed on November 9, 2010 and incorporated herein by reference.
|
|
10.16* Second Amendment to Loan and Security Agreement by and between the Company and Silicon Valley Bank, dated September 2, 2010, included as Exhibit 10.4 to our form 10-Q filed on November 9, 2010 and incorporated herein by reference.
|
|
10.17† Amendment No. 1 to Master OEM Purchase and Sales Agreement among the Company, GENBAND US LLC and GENBAND Ireland Ltd., dated November 19, 2010.
|
|
21.1* List of Subsidiaries included as Exhibit 21.1 to our form SB-2 filed on October 5, 2007 and incorporated herein by reference.
|
|
23.1 Consent of Registered Public Accounting Firm – PMB Helin Donovan, LLP.
|
|
24.1 Power of Attorney (included on signature page hereto).
|
|
31.1 Certification of Principal Executive Officer pursuant to Rule 13a-14(a) and 15d-14(a) of the Securities Exchange Act of 1934, as adopted pursuant to Section 302 of the Sarbanes-Oxley Act of 2002.
|
|
31.2 Certification of Principal Financial Officer pursuant to Rule 13a-14(a) and 15d-14(a) of the Securities Exchange Act of 1934, as adopted pursuant to Section 302 of the Sarbanes-Oxley Act of 2002.
|
|
32.1 Certification of Principal Executive Officer and Principal Financial Officer pursuant to 18 U.S.C. Section 1350, as adopted pursuant to Section 906 of the Sarbanes-Oxley Act of 2002.
|
* Previously filed
† Confidential treatment requested.
Pursuant to the requirements of Section 13 or 15(d) of the Securities Exchange Act of 1934, as amended, the Registrant has duly caused this Annual Report on Form 10-K to be signed on its behalf by the undersigned, thereunto duly authorized, in the City of Los Gatos, State of California, on this 15th day of March 2011.
|
|
Procera Networks, Inc.
|
|
|
|
|
|
|
Date: March 15, 2011
|
By:
|
/s/ James Brear
|
|
|
|
James Brear
|
|
|
|
President and Chief Executive Officer
|
|
|
|
|
|
Date: March 15, 2011
|
By:
|
/s/ Charles Constanti
|
|
|
|
Charles Constanti
|
|
|
|
Chief Financial Officer
|
POWER OF ATTORNEY
KNOW ALL PERSONS BY THESE PRESENTS, that each person whose signature appears below hereby constitutes and appoints, jointly and severally, James Brear and Charles Constanti, and each of them acting individually, as his attorney-in-fact, each with full power of substitution and resubstitution, for him or her in any and all capacities, to sign any and all amendments to this Annual Report on Form 10-K (including post-effective amendments), and to file the same, with exhibits thereto and other documents in connection therewith, with the Securities and Exchange Commission, granting unto said attorneys-in-fact full power and authority to do and perform each and every act and thing requisite and necessary to be done in connection therewith as fully to all intents and purposes as he might or could do in person, hereby ratifying and confirming all that said attorneys-in-fact, or their substitute or substitutes, may lawfully do or cause to be done by virtue hereof.
Pursuant to the requirements of the Securities Exchange Act of 1934, this Report has been signed below by the following persons on behalf of the Registrant and in the capacities and on the dates indicated.
|
Name
|
|
Title
|
|
Date
|
|
|
||||
|
/s/ James Brear
|
|
President and Chief Executive Officer
|
|
March 15, 2011
|
|
James Brear
|
|
(Principal Executive Officer) and Director
|
|
|
|
|
|
|
|
|
|
/s/ Charles Constanti
|
|
Chief Financial Officer
|
|
March 15, 2011
|
|
Charles Constanti
|
|
(Principal Accounting and Financial Officer)
|
|
|
|
|
|
|
|
|
|
/s/ Thomas Saponas
|
|
Director
|
|
March 15, 2011
|
|
Thomas Saponas
|
|
|
|
|
|
|
|
|
|
|
|
/s/ Scott McClendon
|
|
Director
|
|
March 15, 2011
|
|
Scott McClendon
|
|
|
|
|
|
|
|
|
|
|
|
/s/ Mary Losty
|
|
Director
|
|
March 15, 2011
|
|
Mary Losty
|
|
|
|
|
|
|
|
|
|
|
|
/s/ Staffan Hillberg
|
|
Director
|
|
March 15, 2011
|
|
Staffan Hillberg
|
|
|
|
|
|
|
|
|
|
|
|
/s/ Paul Stich
|
|
Director
|
|
March 15, 2011
|
|
Paul Stich
|
|
|
|
|
|
/s/ Charles Vogt
|
|
Director
|
|
March 15, 2011
|
|
Charles Vogt
|
|
|
|
|
|
/s/ William Slavin
|
|
Director
|
|
March 15, 2011
|
|
William Slavin
|
|
|
|
|
|
2.1* Agreement and Plan of Merger by and between Zowcom, Inc. and the Company, dated June 24, 2003, included as Exhibit A to our Preliminary Proxy Statement on Schedule 14A filed on August 25, 2003 and incorporated herein by reference.
|
|
2.2* First Amended and Restated Stock Exchange Agreement and Plan of Reorganization dated August 18, 2006 by and between the Company and the Sellers of Netintact, included as Exhibit 2.1 to our form 8-K filed on August 31, 2006 and incorporated herein by reference.
|
|
2.3* Form of Closing Date Warrant Agreement, dated August 18, 2006, included as Exhibit 2.2 to our form 8-K filed on August 31, 2006 and incorporated herein by reference.
|
|
2.4* Form of Incentive Warrant Agreement, dated August 18, 2006, included as Exhibit 2.3 to our form 8-K filed on August 31, 2006 and incorporated herein by reference.
|
|
2.5* Lockup Agreement, dated August 18, 2006, included as Exhibit 2.4 to our form 8-K filed on August 31, 2006 and incorporated herein by reference.
|
|
2.6* Voting Agreement, dated August 18, 2006, included as Exhibit 2.5 to our form 8-K filed on August 31, 2006 and incorporated herein by reference.
|
|
2.7* Form of Escrow Agreement, included as Exhibit 2.6 to our form 8-K filed on August 31, 2006 and incorporated herein by reference.
|
|
2.8* First Amendment to the First Amended and Restated Stock Exchange Agreement and Plan of Reorganization by and between the Company and the Sellers of Netintact, dated November 2006, included as Exhibit 2.8 to our form 10-KSB filed on April 16, 2007 and incorporated herein by reference.
|
|
3.1* Articles of Incorporation, included as Exhibit 3.1 to our form SB-2 filed on February 11, 2002 and incorporated herein by reference.
|
|
3.2* Certificate of Amendment to Articles of Incorporation, included as Exhibit 99.1 to our form 8-K filed on October 13, 2005 and incorporated herein by reference.
|
|
3.3* Certificate of Amendment to Articles of Incorporation, included as Exhibit 3.3 to our form 10-Q filed on May 12, 2008 and incorporated herein by reference.
|
|
3.4* Certificate of Amendment to Articles of Incorporation, included as Exhibit 3.1 to our form 8-K filed on February 4, 2011 and incorporated herein by reference.
|
|
3.45* Amended and Restated Bylaws, adopted on August 4, 2010, included as Exhibit 3.4 to our form 10-Q filed on August 9, 2010 and incorporated herein by reference.
|
|
4.1*Form of Subscription Agreement for July 2007 offering, included as Exhibit 10.1 to our form 8-K filed on July 19, 2007 and incorporated herein by reference.
|
|
4.2*Form of Registration Rights Agreement for July 2007 offering included as Exhibit 10.2 to our form 8-K filed on July 19, 2007 and incorporated herein by reference.
|
|
4.3* Form of Warrant Agreement for July 2007 offering, included as Exhibit 4.3 to our form SB-2 filed on October 5, 2007 and incorporated herein by reference.
|
|
4.4* Form of Subscription Agreement for November 2006 offering, included as Exhibit 2.1 to our form 8-K filed on December 6, 2006 and incorporated herein by reference
|
|
4.5* Form of Registration Rights Agreement for November 2006 offering, included as Exhibit 2.3 to our form 8-K filed on December 6, 2006 and incorporated herein by reference.
|
|
4.6*Form of Warrant Agreement for November 2006 offering, included as Exhibit 2.2 to our form 8-K filed on December 6, 2006 and incorporated herein by reference.
|
|
4.7* Form of Subscription Agreement for February 2006 offering, included as Exhibit 10.1 to our form 8-K filed on March 1, 2006 and incorporated herein by reference.
|
|
4.8* Form of Amendment to Stock Subscription Agreement for February 2006 offering, included as Exhibit 10.2 to our form 8-K filed on March 1, 2006 and incorporated herein by reference.
|
|
4.9* Form of Registration Rights Agreement for February 2006 offering, included as Exhibit 10.4 to our form 8-K filed on March 1, 2006 and incorporated herein by reference.
|
|
4.10* Form of Subscription Agreement for December 2004 offering, included as Exhibit 10.1 to our form 8-K filed on January 4, 2005 and incorporated herein by reference.
|
|
4.11* Form of Registration Rights Agreement for December 2004 offering, included as Exhibit 10.2 to our form 8-K filed on January 4, 2005 and incorporated herein by reference.
|
|
4.12 * Form of Warrant Agreement for December 2004 offering, included as Exhibit 10.3 to our current report form 8-K filed on January 4, 2005 and incorporated herein by reference.
|
|
4.13* Form of Warrant Agreement for December 2004 offering, included as Exhibit 10.4 to our form 8-K filed on January 4, 2005 and incorporated herein by reference.
|
|
4.14* Form of Subscription Agreement for June 2003 offering, included as Exhibit 4.13 to our form SB-2 filed on October 5, 2007 and incorporated herein by reference.
|
|
4.15* Form of Registration Rights Agreement for June 2003 offering, included as Exhibit 4.14 to our form SB-2 filed on October 5, 2007 and incorporated herein by reference.
|
|
4.16*Form of Warrant Agreement for June 2003 offering, included as Exhibit 4.15 to our form SB-2 filed on October 5, 2007 and incorporated herein by reference.
|
|
4.17*Form of Subscription Agreement for September 2008 offering, included as Exhibit 10.1 to our form 8-K filed on August 29, 2008 and incorporated herein by reference.
|
|
4.18*Amendment No. 1 to Subscription Agreement by and between the Company and Thomas A. Saponas, entered into as of September 12, 2008, included as Exhibit 10.2 to our form 8-K/A filed on September 17, 2008 and incorporated herein by reference.
|
|
4.19* Form of Subscription Agreement for May 2009 offering, included as Exhibit 10.1 to our form 8-K filed on May 8, 2009 and incorporated herein by reference.
|
|
4.20* Form of Note Purchase Agreement for May 2009 offering, included as Exhibit 10.2 to our form 8-K filed on May 8, 2009 and incorporated herein by reference.
|
|
4.21* Form of Note Purchase Agreement for May 2009 offering, included as Exhibit 10.3 to our form 8-K filed on May 8, 2009 and incorporated herein by reference.
|
|
4.22* Warrant to Silicon Valley Bank, dated December 10, 2009, included as Exhibit 4.1 to our form 8-K/A filed on February 11, 2010 and incorporated herein by reference.
|
|
4.23* Form of Subscription Agreement for March 2010 offering, included as Exhibit 1.2 to our form 8-K filed on March 2, 2010 and incorporated herein by reference.
|
|
4.24* Form of Warrant for March 2010 offering, included as Exhibit 4.1 to our form 8-K filed on March 2, 2010 and incorporated herein by reference.
|
|
10.1* 2003 Stock Option Plan, included as Exhibit 10.1 to our form SB-2 filed on January 8, 2004 and incorporated herein by reference.
|
|
10.2* Amended 2004 Stock Option Plan, included as Exhibit 99.3 to our form 8-K filed on October 13, 2005 and incorporated herein by reference.
|
|
10.3* Lease Agreement by and between the Company and Vasona Business Park, dated as of May 1, 2005, included as Exhibit 10.3 to our form SB-2 filed on October 5, 2007 and incorporated herein by reference.
|
|
10.4 *Lease Extension by and between the Company and Vasona Business Park, dated November 20, 2007, included as Exhibit 10.8 to our form 10-K filed on April 2, 2008, as amended, and incorporated herein by reference.
|
|
10.5*2007 Equity Incentive Plan, included as Exhibit 10.1 to our form 10-Q filed on May 12, 2008 and incorporated herein by reference.
|
|
10.6*Executive Employment Agreement for James F. Brear, dated as of February 11, 2008, included as Exhibit 10.2 to our form 10-Q filed on May 12, 2008 and incorporated herein by reference.
|
|
10.7* Executive Employment Agreement for Charles Constanti, dated as of April 27, 2009, included as Exhibit 10.1 to our form 8-K filed on April 30, 2009 and incorporated herein by reference.
|
|
10.8* Amendment to Lease by and between the Company and Vasona Business Park, dated April 30, 2009, included as Exhibit 10.5 to our form 10-Q filed on August 12, 2009 and incorporated herein by reference.
|
|
10.9* Form of Indemnity Agreement, included as Exhibit 10.6 to our form 10-Q filed on August 12, 2009 and incorporated herein by reference.
|
|
10.10* Summary of Agreement with Continuous Computing Corporation dated April 13, 2009, included as Exhibit 10.7 to our form 10-Q filed on August 12, 2009 and incorporated herein by reference.
|
|
10.11* Loan and Security Agreement by and between the Company and Silicon Valley Bank, dated December 10, 2009, included as Exhibit 10.1 to our form 8-K/A filed on February 11, 2010 and incorporated herein by reference.
|
|
10.12* Second Amendment to Lease by and between the Company and Vasona Business Park, dated April 1, 2010, included as Exhibit 10.1 to our form 10-Q filed on August 9, 2010 and incorporated herein by reference.
|
|
10.13* †Master OEM Purchase and Sales Agreement among the Company, GENBAND US LLC and GENBAND Ireland Ltd., effective July 19, 2010, included as Exhibit 10.1 to our form 10-Q filed on November 9, 2010 and incorporated herein by reference.
|
|
10.14* Letter Agreement by and between the Company and GENBAND US LLC, dated July 19, 2010, included as Exhibit 10.2 to our form 10-Q filed on November 9, 2010 and incorporated herein by reference.
|
|
10.15* Waiver and First Amendment to Loan and Security Agreement by and between the Company and Silicon Valley Bank, dated May 7, 2010, included as Exhibit 10.3 to our form 10-Q filed on November 9, 2010 and incorporated herein by reference.
|
|
10.16* Second Amendment to Loan and Security Agreement by and between the Company and Silicon Valley Bank, dated September 2, 2010, included as Exhibit 10.4 to our form 10-Q filed on November 9, 2010 and incorporated herein by reference.
|
|
21.1* List of Subsidiaries included as Exhibit 21.1 to our form SB-2 filed on October 5, 2007 and incorporated herein by reference.
|
|
24.1 Power of Attorney (included on signature page hereto).
|
* Previously filed
† Confidential treatment requested.
75