Attached files
| file | filename |
|---|---|
| EX-32.1 - EXHIBIT 32.1 - MISSION WEST PROPERTIES INC | exh32_1.htm |
| EX-31.1 - EXHIBIT 31.1 - MISSION WEST PROPERTIES INC | exh31_1.htm |
| EX-31.2 - EXHIBIT 31.2 - MISSION WEST PROPERTIES INC | exh31_2.htm |
| EX-31.3 - EXHIBIT 31.3 - MISSION WEST PROPERTIES INC | exh31_3.htm |
| EX-23.1 - EXHIBIT 23.1 - MISSION WEST PROPERTIES INC | exh23_1.htm |
UNITED STATES
SECURITIES AND EXCHANGE COMMISSION
Washington, D.C. 20549
FORM 10-K
(Mark One)
x ANNUAL REPORT PURSUANT TO SECTION 13 OR 15(d) OF THE
SECURITIES EXCHANGE ACT OF 1934
For Fiscal Year Ended: December 31, 2010
OR
o TRANSITION REPORT PURSUANT TO SECTION 13 OR 15(d) OF
THE SECURITIES EXCHANGE ACT OF 1934
For the transition period from______________ to______________
Commission File No. 1-8383
MISSION WEST PROPERTIES, INC.
(Exact name of registrant as specified in its charter)
|
Maryland
|
95-2635431
|
|
|
(State or other jurisdiction of incorporation or organization)
|
(I.R.S. Employer Identification No.)
|
|
|
10050 Bandley Drive, Cupertino, CA
|
95014
|
|
|
(Address of principal executive offices)
|
(Zip Code)
|
Registrant’s telephone number, including area code: (408) 725-0700
_______________
Securities Registered Pursuant to Section 12(b) of the Act:
|
Title of each class
|
|
Name of each exchange on which registered
|
|
Common Stock, $.001 par value per share
|
The Nasdaq Stock Market LLC
|
Securities Registered Pursuant to Section 12(g) of the Act: NONE
Indicate by check mark if the Registrant is a well-known seasoned issuer, as defined in Rule 405 of the Securities Act. Yes o No x
Indicate by check mark if the Registrant is not required to file reports pursuant to Section 13 or Section 15(d) of the Exchange Act. Yes o No x
Indicate by check mark whether the Registrant (1) has filed all reports required to be filed by Section 13 or 15(d) of the Securities Exchange Act of 1934 during the preceding 12 months (or for such shorter period that the Registrant was required to file such reports), and (2) has been subject to such filing requirements for the past 90 days. Yes x No o
Indicate by check mark whether the registrant has submitted electronically and posted on its corporate Web site, if any, every Interactive Data File required to be submitted and posted pursuant to Rule 405 of Regulation S-T (§232.405 of this chapter) during the preceding 12 months (or for such shorter period that the registrant was required to submit and post such files). Yes o No o
Indicate by check mark if disclosure of delinquent filers pursuant to Item 405 of Regulation S-K is not contained herein, and will not be contained, to the best of Registrant’s knowledge, in definitive proxy or information statements incorporated by reference in Part III of this Form 10-K or any amendment to this Form 10-K. x
Indicate by check mark whether the Registrant is a large accelerated filer, an accelerated filer, or a non-accelerated filer. See definition of “accelerated filer and large accelerated filer” in Rule 12b-2 of the Exchange Act.
Large accelerated filer o Accelerated filer x Non-accelerated filer o Smaller reporting company o
Indicate by check mark whether the Registrant is a shell company (as defined in Rule 12b-2 of the Exchange Act). Yes o No x
As of June 30, 2010, the aggregate market value of the Registrant’s common stock held by non-affiliates of the registrant was $133,769,443 based on the closing price as reported on the NASDAQ Stock Market LLC.
Indicate the number of shares outstanding of each of the Registrant’s classes of common stock, as of the latest practicable date.
|
Class
|
Outstanding at February 28, 2011
|
|
|
Common Stock, $.001 par value per share
|
22,370,770 shares
|
DOCUMENTS INCORPORATED BY REFERENCE
Portions of the Registrant’s Proxy Statement in connection with the Registrant’s 2011 Annual Meeting of Stockholders to be held May 26, 2011 are incorporated by reference into Part III of this Form 10-K. The Registrant intends to file its proxy statement within 120 days after its fiscal year end.
FORWARD LOOKING INFORMATION
This annual report contains forward-looking statements within the meaning of the federal securities laws. We intend such forward-looking statements to be covered by the safe harbor provisions for forward-looking statements contained in the Private Securities Litigation Reform Act of 1995, and are including this statement for purposes of complying with these safe harbor provisions. Forward-looking statements include our discussions of “Quantitative and Qualitative Disclosures about Market Risks” in Item 7A below. Forward-looking statements, which are based on certain assumptions and describe future plans, strategies and expectations of us, are generally identifiable by use of the words “believe,” “expect,” “intend,” “anticipate,” “estimate,” “project” or similar expressions. Our ability to predict results or the actual effect of future plans or strategies is inherently uncertain. Factors which could have a material adverse effect on the operations and future prospects or would cause actual results in the future to differ materially from any of our forward-looking statements of the Company include, but are not limited to, changes in: the credit markets and the overall availability and cost of credit, economic conditions generally and the real estate market specifically, legislative or regulatory provisions affecting the Company (including changes to laws governing the taxation of Real Estate Investment Trusts (“REITs”)), availability of capital, interest rates, competition, supply of and demand for office and industrial properties in our current and proposed market areas, tenant defaults and bankruptcies, and general accounting principles, policies and guidelines applicable to REITs. In addition, the actual timing of development, construction, and leasing on the projects that the Company believes it may acquire in the future is unknown presently. These risks and uncertainties, together with the other risks described from time to time in our reports and documents filed with the Securities and Exchange Commission, should be considered in evaluating forward-looking statements and undue reliance should not be placed on such statements (see Item 1A, “Risk Factors”).
i
MISSION WEST PROPERTIES, INC.
2010 FORM 10-K ANNUAL REPORT
Table of Contents
|
PART I
|
Page No.
|
|
|
Item 1.
|
Business
|
1
|
|
Item 1A.
|
Risk Factors
|
8
|
|
Item 1B.
|
Unresolved Staff Comments
|
14
|
|
Item 2.
|
Properties
|
15
|
|
Item 3.
|
Legal Proceedings
|
20
|
|
Item 4.
|
Removed and Reserved
|
20
|
|
PART II
|
||
|
Item 5.
|
Market for the Registrant’s Common Equity, Related Stockholder Matters and Issuer Purchases of Equity Securities
|
21
|
|
Item 6.
|
Selected Financial Data
|
23
|
|
Item 7.
|
Management’s Discussion and Analysis of Financial Condition and Results of Operations
|
25
|
|
Item 7A.
|
Quantitative and Qualitative Disclosures About Market Risk
|
42
|
|
Item 8.
|
Financial Statements and Supplementary Data
|
43
|
|
Item 9.
|
Changes in and Disagreements with Accountants on Accounting and Financial Disclosure
|
79
|
|
Item 9A.
|
Controls and Procedures
|
79
|
|
Item 9B.
|
Other Information
|
79
|
|
PART III
|
||
|
Item 10.
|
Directors, Executive Officers and Corporate Governance
|
80
|
|
Item 11.
|
Executive Compensation
|
80
|
|
Item 12.
|
Security Ownership of Certain Beneficial Owners and Management and Related Stockholder Matters
|
80
|
|
Item 13.
|
Certain Relationships and Related Transactions, and Director Independence
|
80
|
|
Item 14.
|
Principal Accountant Fees and Services
|
80
|
|
PART IV
|
||
|
Item 15.
|
Exhibits and Financial Statement Schedules
|
81
|
|
Signatures
|
82
|
|
|
Rule 13a-14(a) Certifications
|
||
|
Section 1350 Certifications
|
ii
PART I
Item 1. Business
Organization and General Business Description
Mission West Properties, Inc. (the “Company”) acquires, markets, leases, and manages research and development (“R&D”) properties, primarily located in the Silicon Valley portion of the San Francisco Bay Area. As of December 31, 2010, we owned and managed 111 properties totaling approximately 8.0 million rentable square feet of R&D properties through four limited partnerships, or operating partnerships, for which we are the sole general partner. R&D property is designed for research and development and office uses and, in some cases, includes space for light manufacturing operations with loading docks. We believe that we have one of the largest portfolios of R&D properties in the Silicon Valley. There are two tenants who individually lease in excess of 300,000 rentable square feet from us: Microsoft Corporation and Apple, Inc. For federal income tax purposes we have operated as a self-managed, self-administered and fully integrated Real Estate Investment Trust (“REIT”) since fiscal 1999.
Prior to July 1, 1998, most of our properties were under the ownership or control of Carl E. Berg, his brother Clyde J. Berg, certain members of their respective immediate families, and certain entities in which Carl E. Berg and/or Clyde J. Berg held controlling or other ownership interests, including Berg & Berg Developers, Berg & Berg Enterprises, Inc. and Berg & Berg Enterprises, LLC (the “Berg Group”). We acquired these properties as of July 1, 1998 by becoming the general partner of each of the four operating partnerships in an UPREIT transaction. At that time, we also acquired ten properties comprising approximately 560,000 rentable square feet from entities controlled by third parties in which the Berg Group members were significant owners.
Through various property acquisition agreements with the Berg Group and subject to the approval of the Independent Directors Committee of the board of directors, we have the right to purchase, on pre-negotiated terms, R&D and other types of office and light industrial properties that the Berg Group develops in the future. With in-house development, architectural and construction personnel, the Berg Group continues to focus on a full range of land acquisition, development and construction activities for R&D properties, often build-to-suit, to meet the demands of Silicon Valley information technology companies. As the developer, the Berg Group takes on the risks of purchasing the land, obtaining regulatory approvals and permits and financing construction. Since September 1998, we have acquired approximately 3,386,000 additional rentable square feet of R&D properties from the Berg Group under these agreements.
Our executive offices are located at 10050 Bandley Drive, Cupertino, California 95014, and our telephone number is (408) 725-0700. Our website is located at http://www.missionwest.com. You can access on our website, free of charge, our annual reports on Form 10-K, quarterly reports on Form 10-Q, current reports on Form 8-K and amendments to those reports filed or furnished pursuant to Section 13(a) or 15(d) of the Exchange Act of 1934, as amended, as soon as reasonably practicable after such material is electronically filed with, or furnished to, the Securities and Exchange Commission (the “SEC”). A copy of these filings is available to all interested parties upon written request to “Investor Relations” at our corporate offices.
We file annual, quarterly and special reports, proxy statements and other information with the SEC. You may read and copy any document we file with the SEC at the SEC’s Public Reference Room at 100 F Street, N.W., Washington, D.C. 20549. You may obtain information about the operation of the SEC’s Public Reference Room by calling the SEC at 1-800-SEC-0330. The SEC also maintains a website that contains reports, proxy and information statements, and other information regarding registrants that file electronically with the SEC (http://www.sec.gov).
Our Relationship with the Berg Group
Through a series of transactions occurring between May 1997 and December 1998, we became the vehicle for substantially all of the Silicon Valley R&D property operating activities of the Berg Group. We are the general partner pursuant to the partnership agreements of the operating partnerships and, along with members of the Berg Group and other individuals, are party to an acquisition agreement dated as of May 14, 1998 and amended, as of July 1, 1998 and as of June 28, 1999, and an exchange rights agreement. Each agreement defines the material rights and obligations among us, the Berg Group members, and other parties to those agreements. Among other things, these agreements give us rights to:
|
·
|
control the operating partnerships; and
|
|
●
|
acquire R&D, office and industrial properties identified by the Berg Group in California, Oregon and Washington, subject to approval of the Independent Directors Committee of the board of directors.
|
-1-
Under these agreements, our charter and our bylaws, the Berg Group has the right to:
|
·
|
designate two of five nominees for director to be elected by our stockholders, subject to the Berg Group’s maintenance of certain ownership interests;
|
|
·
|
participate in our securities offerings;
|
|
·
|
exchange their operating partnership interests (“O.P. Units”) for shares of our common stock;
|
|
·
|
vote on major transactions, subject to maintenance of certain ownership thresholds; and
|
|
·
|
prevent us from selling properties when the sale will have adverse tax consequences to the Berg Group members.
|
To comply with REIT requirements that restrict the percentage of the total value of our stock that may be owned by five or fewer individuals to 50% or less, our charter generally prohibits the direct or indirect ownership of more than 9% of our common stock by any stockholder. This limit excludes the Berg Group, which has an aggregate ownership limit of 20%. Currently, the Berg Group members collectively own approximately 9.0% of the outstanding shares of our common stock.
Carl E. Berg, the Company’s Chairman of the Board of Directors and Chief Executive Officer and the controlling member of the Berg Group, has been engaged in the development and long-term ownership of Silicon Valley real estate for almost 40 years. In 1969, Mr. Berg foresaw the rising demand for efficient, multi-purpose facilities for the rapidly growing information technology industry in the Silicon Valley. Since 1972, in addition to his real estate activities, Mr. Berg also has been actively involved in venture capital investments in many information technology companies in the Silicon Valley, including such companies as Amdahl Corporation, Sun Microsystems, Inc., and Integrated Device Technologies, Inc. He serves on the board of directors of numerous electronics and energy technology companies. These activities have helped Mr. Berg develop a detailed understanding of the real estate requirements of technology companies, acquire valuable market information and increase his name recognition within the venture capital and entrepreneurial communities. These activities also manifest his commitment to the growth and success of Silicon Valley companies. We believe that Mr. Berg’s substantial knowledge of and contacts in various technology industries provide a significant benefit to the Company.
Acquiring Properties Developed by the Berg Group
We entered into the Berg land holdings option agreement in December 1998 under which we had an option to purchase all land acquired, directly or indirectly, by Carl E. Berg or Clyde J. Berg that had not been improved with completed buildings and which were zoned, intended or appropriate for R&D, office and/or industrial development or use in the states of California, Oregon and Washington. The Berg land holdings option agreement expired on December 31, 2010. However, the Berg Group remains obligated to present to us in the first instance all investment and acquisition opportunities for development of this nature in these three states, as explained further below under “Opportunistic Acquisition.”
As of December 31, 2010, we had acquired 23 leased R&D properties totaling approximately 2,243,000 rentable square feet under the Berg land holdings option agreement at a cost of approximately $237.8 million, for which we have issued 8,482,085 O.P. Units and assumed debt of approximately $141.4 million.
Although the Berg land holdings option agreement expired on December 31, 2010, we anticipate that we will continue to work with the Berg Group in identifying and acquiring future R&D properties presented by the Berg Group. As a general policy which has been established by the Independent Directors Committee of the board of directors, we do not acquire properties from the Berg Group until they have been leased. We are responsible for a significant portion of the leasing process in connection with such acquisitions, however.
Recent Rental Market Developments and Their Impact on Our Business
All of our properties are located in the Northern California area known as Silicon Valley, which generally consists of portions of Santa Clara County, Southwestern Alameda County, Southeastern San Mateo County and Eastern Santa Cruz County. In the past several years, the Silicon Valley R&D property market has fluctuated with the local economy. According to a recent report by Cassidy Turley Real Estate (the “CT Report”) (formerly Cassidy Turley BT Real Estate), vacancy rates for Silicon Valley R&D property decreased from approximately 19.3% in late 2009 to 18.7% at the end of 2010. Total vacant R&D square footage in Silicon Valley at the end of the fourth quarter of 2010 amounted to approximately 29.1 million rentable square feet, of which 12.2%, or approximately 3.6 million rentable square feet, was sublease space. According to the CT Report, in 2009 total negative net absorption (which is the computation of gross square footage leased less gross new square footage vacated for the period presented) amounted to approximately 5.2 million rentable square feet, and in 2010 there was total positive net absorption of approximately 0.4 million rentable square feet. Local economic conditions remain weak due to a weakened economy, dysfunctional financial markets, depressed housing and high unemployment rates. According to the CT Report, the average asking market rent per square foot was $1.01 and $1.03 at year-end 2010 and 2009, respectively, although individual properties within any particular submarket presently may be leased above or below the current average asking market rental rates within that submarket and the region as a whole. Moreover, the impact of vacancies has
-2-
not been uniform throughout the area. The Silicon Valley R&D property market is characterized by a substantial number of submarkets, with rent and vacancy rates varying by submarket and location within each submarket.
In addition, leasing activity for new build-to-suit and vacated R&D properties has slowed considerably during the past several years. The time to complete the marketing and lease up of vacant space has increased from an average of several months to anywhere from 18 to 40 months in many cases as a result of the over-supply of R&D properties in the market.
Despite our strategic focus on single tenant properties and leases, in order to meet market conditions we have been, and expect to continue, leasing less than the entire premises of some of our R&D properties to a single tenant from time to time. Leasing our R&D properties, which generally have been built for single tenant occupancy, to multiple tenants tends to increase our leasing costs and operating expenses and reduce the profitability of our leasing activities. Although we scrutinize each prospective tenant’s creditworthiness and continually evaluate the financial capacity of both our prospective and existing tenants, a downturn in tenants’ businesses may weaken their financial condition and could result in defaults under their lease obligations.
We believe that the average 2011 renewal rental rates for our properties will be approximately equal to, or perhaps, below current market rents. Excluding month-to-month leases comprised of approximately 114,000 rentable square feet, leases representing approximately 641,000 rentable square feet, representing approximately 8.9% of our projected 2011 cash rent, are scheduled to expire during 2011. If we are unable to lease a significant portion of any vacant space or space scheduled to expire; if we experience significant tenant defaults as a result of the current economic downturn; if we restructure existing leases and lower existing rents in order to retain tenants for an extended term; if we increase our lease costs and operating expenses substantially to accommodate multiple tenants in our R&D properties; or if we are not able to lease space at or above current market rates, our results of operations and cash flows will be affected adversely.
Business Strategy
Our acquisition, growth and operating strategy incorporates the following elements:
|
·
|
capitalizing on opportunistic acquisitions from third parties of high-quality R&D properties that provide attractive initial yields and significant potential for growth in cash-flow;
|
|
·
|
focusing on general purpose, single-tenant Silicon Valley R&D properties for technology companies in order to maintain low operating costs, reduce tenant turnover and capitalize on our relationships with these companies and our extensive knowledge of their real estate needs; and
|
|
·
|
maintaining prudent financial management principles that emphasize current cash flow while building long-term value, the acquisition of pre-leased properties to reduce development and leasing risks and the maintenance of sufficient liquidity to acquire and finance properties on desirable terms.
|
Opportunistic Acquisitions
We believe our acquisitions experience, established network of real estate and information technology professionals, and overall financial condition will continue to provide opportunities for external growth. In general, we will seek opportunistic acquisitions of high quality, well located Silicon Valley R&D properties in situations where illiquidity or inadequate management permit their acquisition at favorable prices, and where our management skills and knowledge of Silicon Valley submarkets may facilitate increases in cash flow and asset value. The management and growth of our business remains Carl E. Berg’s primary real estate focus. Moreover, under the acquisition agreement, Carl E. Berg has agreed not to directly or indirectly acquire or develop any real property zoned for office, industrial or R&D use in the states of California, Oregon and Washington without first disclosing and making the acquisition opportunity available to us. The Independent Directors Committee of the board of directors decides whether we will pursue each opportunity presented to us by Mr. Berg. This restriction will expire only when there is no Berg Group nominee on our board of directors and the Berg Group’s fully diluted ownership percentage, which is calculated based on all outstanding shares of common stock and all shares of common stock that could be acquired upon the exercise of all outstanding options to acquire our voting stock, as well as all shares of common stock issuable upon exchange of all O.P. Units (“Fully Diluted”), falls below 25%.
We believe that our use of the operating partnership structure allows us to offer prospective sellers the opportunity to contribute properties on a tax-deferred basis in exchange for O.P. Units. Although we have not consummated any transactions on this basis since our July 1, 1998 acquisition of the Berg Group properties, this capacity to complete tax-deferred transactions with sellers of real property further enhances our ability to acquire additional properties.
-3-
Focus on Single Tenant Silicon Valley R&D Properties
We intend to continue to emphasize the acquisition of single-tenant rather than multi-tenant properties, a practice that has historically contributed to the relatively low turnover and higher occupancy rates on our properties. We believe that the relatively small number of tenants (71 total) leasing our properties, mostly under the triple net lease structure, allows us to efficiently manage the properties and to serve our tenants’ needs without extensive in-house staff or the assistance of a third-party property management organization. In addition, this emphasis allows us to incur less expense for tenant improvements and leasing commissions than multi-tenant, high turnover property owners. This strategy also reduces the time and expense associated with obtaining building permits and other governmental approvals. We believe that the relatively stable, extended relationships that we have developed with our key tenants are valuable in the expansion of our business.
Operations
We operate as a self-administered, self-advised and self-managed REIT with our own employees. As the sole general partner of the operating partnerships, we control the business and assets of the operating partnerships and have full and complete authority, discretion and responsibility with respect to the operating partnerships’ operations and transactions, including, without limitation, acquiring additional properties, borrowing funds, raising new capital, leasing buildings and selecting and supervising all agents of the operating partnerships.
Although most of our leases are triple net and building maintenance and tenant improvements are the responsibility of the tenants, from time to time we may be required to undertake construction and repair work at our properties. We bid all major work competitively to subcontractors. Members of the Berg Group may participate in the competitive bidding for the work, but all contracts with the Berg Group are subject to review and approval by the Independent Directors Committee of the board of directors.
We generally market our properties and negotiate leases ourselves. We make the availability of our properties known to the brokerage community to garner their assistance in locating prospective tenants, however. As a result, we expect to retain our policy of paying fixed commissions to tenants’ brokers.
We believe that our business practices provide us with competitive advantages, including –
|
·
|
External Development Affiliate. Although the Berg land holdings option agreement expired on December 31, 2010, we anticipate that our relationship with the Berg Group will continue to help us achieve our objectives of long-term sustainable growth as well as maximization of long-term stockholder value. We will still have access to one of the most experienced development teams in the Silicon Valley without the expense of maintaining development personnel. In addition, with the Berg Group’s extensive experience and strong relationship in the Silicon Valley real estate industry, we believe we are well-positioned to take advantage of attractive acquisition and development opportunities. The relationship with the Berg Group helps us maintain and develop long-term relationships with a diverse tenant base and manage operating expenses, capital improvements and tenant improvements through the efficient use of our internal management and leasing function.
|
|
·
|
Lean Organization, Experienced Team. In part because of our primary focus on Silicon Valley, our experience with the special real estate requirements of information technology tenants and the long-term triple-net structure of our leases, we are able to conduct and expand our business with a small management team comprised of highly qualified and experienced professionals working within a relatively flat organizational structure. We believe that the leanness of our organization and our experience will enable us to rapidly assess and respond to market opportunities and tenant needs, control operating expenses and develop and maintain excellent relationships with tenants. We further believe that these advantages translate into significantly lower costs for operations and give us the ability, along with the Berg Group, to compete favorably with other R&D property developers in Silicon Valley, especially for build-to-suit projects subject to competitive bidding. Furthermore, we believe this lower cost structure allows us to generate better returns from properties whose value can be increased through appropriate remodeling and efficient property management.
|
|
·
|
Sound Property Management Practices. For each property, the management team, along with the Berg Group staff, develops a specific marketing and property management program. We select vendors and subcontractors on a competitive bid basis from a select group of highly qualified firms with whom we maintain ongoing relationships and carefully supervise their work.
|
-4-
Operating Partnership Agreements
Management
The operating partnerships consist of four separate limited partnerships engaged in the combined operation and ownership of all our properties. The operating partnership agreements are identical in all material respects for all four of the limited partnerships. Pursuant to the operating partnership agreements, we act as the sole general partner of the operating partnerships, in which capacity we have exclusive control of the business and assets of the operating partnerships and generally have full and complete authority, discretion and responsibility with respect to the operating partnerships’ operations and transactions, including, without limitation, acquisitions of additional properties, borrowing funds, raising new capital, leasing buildings, as well as selecting and supervising all employees and agents of the operating partnerships. Through our authority to manage our business and affairs, our board of directors directs the business of the operating partnerships.
Notwithstanding our effective control of the operating partnerships, the Berg Group holds a substantial majority of the outstanding O.P. Units and the consent of the limited partners holding a majority of the outstanding O.P. Units is required with respect to certain extraordinary actions involving the operating partnerships, including:
|
·
|
the amendment, modification or termination of the operating partnership agreements;
|
|
·
|
a general assignment for the benefit of creditors or the appointment of a custodian, receiver or trustee for any of the assets of the operating partnerships;
|
|
·
|
the institution of any proceeding for bankruptcy of the operating partnerships;
|
|
·
|
the transfer of any general partner interests in the operating partnerships, including, with certain exceptions, transfers attendant to any merger, consolidation or liquidation of our corporation;
|
|
·
|
the admission of any additional or substitute general partner in the operating partnerships; and
|
|
·
|
a change of control of the operating partnerships.
|
In addition, until the ownership interest of the Berg Group and its affiliates is less than 15% of the common stock on a Fully Diluted basis, the consent of the limited partners holding a majority of the outstanding O.P. Units is also required with respect to:
|
·
|
the liquidation of the operating partnerships;
|
|
·
|
the sale or other transfer of all or substantially all of the assets of the operating partnerships and certain mergers and business combinations resulting in the complete disposition of all O.P. Units; and
|
|
·
|
the issuance of limited partnership interests having seniority as to distributions, assets and voting over the O.P. Units.
|
Transferability of O.P. Units
The operating partnership agreements provide that the limited partners may transfer their O.P. Units, subject to certain limitations. Except for certain transfers by the limited partners to or from certain of their affiliates, however, all transfers may be made only with our prior written consent as the sole general partner of the operating partnerships.
In addition, no transfer of O.P. Units by the limited partners may be made in violation of certain regulatory and other restrictions set forth in the operating partnership agreements. Except in the case of certain permitted transfers to or from certain affiliates of the limited partners, the exchange rights, the put rights, rights to participate in future equity financings and provisions requiring the approval of certain limited partners for certain matters will no longer be applicable to O.P. Units so transferred, and the transferee will not have any rights to nominate persons to our board of directors.
Additional Capital Contributions and Loans
Each operating partnership agreement provides that, if the operating partnership requires additional funds to pursue its investment objectives, we may fund such investments by raising additional equity capital and making a capital contribution to the operating partnerships or by borrowing such funds and lending the net proceeds of such loans to the operating partnerships. If we intend to provide additional funds through a contribution to capital and purchase of units of general partner interest, the limited partners will have the right to participate in such funding on a pro rata, pari passu basis and to acquire additional O.P. Units. If the limited partners do not participate in such financing, we will acquire additional units of general partner interest. In either case, the number of additional units of partnership interest will be increased based upon the amount of the additional capital contributions and the value of the operating partnerships as of the date such contributions are made.
-5-
In addition, as general partner of the operating partnerships, we have the ability to cause the operating partnerships to issue additional O.P. Units. In the event that the operating partnerships issue new O.P. Units for cash but not property, the limited partners will have the right to purchase new O.P. Units at the price we offer in the transaction giving rise to such participation right in order, and to the extent necessary, to maintain their respective percentage interests in the operating partnerships.
Exchange Rights, Put Rights and Registration Rights
Under the exchange rights agreement between us and the limited partners, the limited partners have exchange rights that generally became exercisable on December 29, 1999. The exchange rights agreement permits every limited partner to tender O.P. Units to us, and, at our election, to receive common stock on a one-for-one basis at then-current market value, an equivalent amount of cash, or a combination of cash and common stock in exchange for the O.P. Units tendered, subject to the 9% overall ownership limit imposed on non-Berg Group stockholders under our charter document, or the overall 20% Berg Group ownership limit, as the case may be. For more information, please refer to Item 1A, “Risk Factors – Failure to satisfy federal income tax requirements for REITs could reduce our distributions, reduce our income and cause our stock price to fall.” This exchange ratio is subject to adjustment for stock splits, stock dividends, recapitalizations of our common stock and similar types of corporate actions. In addition, once in each 12-month period beginning each December 29, the limited partners, other than Carl E. Berg and Clyde J. Berg, may exercise a put right to sell their O.P. Units to the operating partnerships at a price equal to the average market price of the common stock for the 10-trading day period immediately preceding the date of tender. Upon any exercise of the put rights, we will have the opportunity for a period of 15 days to elect to fund the purchase of the O.P. Units and purchase additional general partner interests in the operating partnerships for cash, unless the purchase price exceeds $1 million in the aggregate for all tendering limited partners, in which case, the operating partnerships or we will be entitled, but not required, to reduce proportionally the number of O.P. Units to be acquired from each tendering limited partner so that the total purchase price is not more than $1 million. Through December 31, 2010 no limited partner ever has exercised this put right.
The number of shares of our common stock issuable in exchange for the total number of O.P. Units outstanding at July 1, 1998 and the O.P. Units issued pursuant to our agreements with the Berg Group were registered under the Securities Act and generally may be sold without restriction if they are acquired by limited partners that are not affiliates, as defined under SEC Rule 144. For more information please refer to Item 1A, “Risk Factors – Shares eligible for future sale could affect the market price of our stock.” The exchange rights agreement gives the holders of O.P. Units the right to participate in any registered public offering of the common stock initiated by us to the extent of 25% of the total shares sold in the offering upon converting O.P. Units to shares of common stock, but subject to the underwriters’ unlimited right to reduce the participation of all selling stockholders. The holders of O.P. Units will be able to request resale registrations of shares of common stock acquired on exchange of O.P. Units on a Form S-3, or any equivalent form of registration statement, subject to limitations and restrictions contained in the exchange rights agreement. In April 2006, we registered up to 86,088,095 shares of common stock issuable on exchange of O.P. Units for resale pursuant to the prospectus included in a registration statement on Form S-3 that the SEC declared effective on April 28, 2006. We intend to maintain the effectiveness of this registration statement in order to facilitate re-sales of shares of common stock acquired by O.P. Unit holders from time to time without volume limitations or other resale restrictions under SEC Rule 144.
Other Matters
The operating partnership agreements require that the operating partnerships be operated in a manner that will enable us to satisfy the requirements for being classified as a REIT and to avoid any federal income or excise tax liability.
The operating partnership agreements provide that the combined net operating cash flow from all the operating partnerships, as well as net sales and refinancing proceeds, will be distributed from time to time as determined by our board of directors, but not less frequently than quarterly, pro rata in accordance with the partners’ percentage interests in the operating partnerships, taken as a whole. This provision is intended to cause the periodic distributions per O.P. Unit and per share of our common stock to be equal. As a consequence of this provision, the capital interest of a partner in each of the operating partnerships, including our capital interests, might at times differ significantly from the partner’s percentage interest in the net income and cash flow of that operating partnership. We do not believe that such differences would have a material impact on our business, financial condition or funds available for distributions, however.
Pursuant to the operating partnership agreements, the operating partnerships will also assume and pay when due, or reimburse us for payment of, certain costs and expenses relating to our continuity of existence and operations.
The operating partnership agreements provide that, upon the exercise of an outstanding option under the 2004 Equity Incentive Plan, we may purchase additional general partner interests in the operating partnerships by contributing the exercise proceeds to the operating partnerships. Our increased interest will be equal to the percentage of outstanding shares of common stock and O.P. Units on an as-converted basis represented by the shares acquired upon exercise of the option.
-6-
Term
The operating partnerships will continue in full force and effect until December 31, 2048 or until sooner dissolved pursuant to the terms of the operating partnership agreements.
Employees
As of February 28, 2011, we employed six people, all of whom work at our executive offices at 10050 Bandley Drive, Cupertino, California, 95014.
Facilities
We lease office space at 10050 Bandley Drive, Cupertino, California from Berg & Berg Enterprises, Inc. and share clerical staff and other overhead on what we consider to be favorable terms. The total monthly rent payable by us to Berg & Berg Enterprises, Inc. is $10,000.
-7-
Item 1A. Risk Factors
You should carefully consider the following risks, together with the other information contained elsewhere in this Form 10-K. The following risks relate principally to our business and the industry in which we operate. The risks and uncertainties classified below are not the only ones we face.
Silicon Valley market and economic conditions.
In the Silicon Valley, recent market and economic conditions have been unprecedented and challenging with tighter credit conditions and slower growth through the fourth quarter of 2010. For the year ended December 31, 2010, continued concerns about the impact of inflation, the availability and cost of credit and a declining real estate market have contributed to increased market volatility and diminished expectations for the Silicon Valley economy and the real estate market, in particular. These conditions, combined with low business and consumer confidence and high unemployment have contributed to volatility of unprecedented levels.
As a result of these market conditions, the cost and availability of credit has been and may continue to be adversely affected by illiquid credit markets and wider credit spreads. Concern about the stability of the markets generally and the strength of counterparties specifically has led many lenders and institutional investors to reduce, and in some cases, cease to provide funding to borrowers. Continued turbulence in the Silicon Valley economy may adversely affect the financial condition and the liquidity and financial condition of our tenants and result in a significantly higher level of defaults. If these market conditions continue, they may limit our ability and the ability of our tenants, to timely refinance maturing liabilities and access the capital markets to meet liquidity needs, resulting in adverse effects on our financial condition and results of operations.
We may be unable to renew leases or re-lease available space.
As of December 31, 2010, we had R&D space available for lease representing approximately 30.1% of the total rentable square footage of our properties. In addition, leases representing approximately 641,000 rentable square feet are scheduled to expire in 2011. Above market rental rates on some of our properties may force us to renew or re-lease expiring leases at rates below current lease rates. Declining rents in a number of our submarkets where our properties are located will affect our business adversely. We cannot give any assurance that leases will be renewed or that available space will be re-leased at rental rates equal to or above the current rental rates. If the average rental rates for our properties decrease, existing tenants do not renew their leases or vacancy rate increases, as we expect to be the case in 2011, our financial condition, results of operations, cash flows, could be adversely affected, and consequently, the quoted trading price of our security, our ability to satisfy our debt service obligations and to pay distributions to stockholders may be affected adversely as well.
We may not be able to obtain additional capital to further our business objectives.
Our ability to acquire properties depends upon our ability to obtain capital. We expect the lack of capital to cause a decrease in the level of new investment activity. An inability to obtain debt financing on acceptable terms could delay or prevent us from acquiring desirable investments.
We are dependent on Carl E. Berg and if we lose his services our business may be harmed and our stock price could fall.
We are substantially dependent upon the leadership of Carl E. Berg, our Chairman and Chief Executive Officer. Losing Mr. Berg’s knowledge and abilities could have a material adverse effect on our business and the value of our common stock. Mr. Berg manages our day-to-day operations and devotes a significant portion of his time to our affairs, but he has a number of other business interests as well. These other activities reduce Mr. Berg’s attention to our business.
Mr. Berg and his affiliates effectively control our corporation and the operating partnerships and may act in ways that are disadvantageous to other stockholders.
Special Board Voting Provisions
Our governing corporate documents, which are our articles of amendment and restatement, or charter, and our bylaws, provide substantial control rights for the Berg Group. The Berg Group’s control of our corporation means that the value and returns from an investment in our common stock are subject to the Berg Group’s exercise of its rights. These rights include a requirement that Mr. Berg or his designee as director approve certain fundamental corporate actions, including amendments to our charter and bylaws and any merger, consolidation or sale of all or substantially all of our assets. In addition, our bylaws provide that a quorum necessary to hold a valid meeting of the board of directors must include Mr. Berg or his designee. The rights described in the two preceding sentences apply only as long as the Berg Group members and their affiliates, other than us and the operating partnerships, beneficially own, in the aggregate, at least 15% of our outstanding shares of common stock on a Fully Diluted basis. Also, directors representing more than 75% of the entire board of directors must approve other significant transactions, such as incurring debt above certain amounts and conducting business other than through the operating partnerships. Without the approval of Mr. Berg or his designee, the
-8-
board of directors’ approval that we may need for actions that might result in a sale of your stock at a premium or raising additional capital when needed could be difficult or impossible to obtain.
Board of Directors Representation
The Berg Group members have the right to designate two of the director nominees submitted by our board of directors to stockholders for election, as long as the Berg Group members and their affiliates, other than us and the operating partnerships, beneficially own, in the aggregate, at least 15% of our outstanding shares of common stock calculated on a Fully Diluted basis. If the Fully Diluted ownership of the Berg Group members and their affiliates, other than us and the operating partnerships, is less than 15% but is at least 10% of the common stock, the Berg Group members have the right to designate one of the director nominees submitted by our board of directors to stockholders for election. Its right to designate director nominees affords the Berg Group substantial control and influence over the management and direction of our corporation. The Berg Group’s interests could conflict with the interests of our stockholders and could adversely affect the price of our common stock.
Substantial Ownership Interest
The Berg Group currently owns common stock and O.P. Units representing approximately 73.9% of the equity interests in the operating partnerships and approximately 73.8% of our equity interests on a Fully Diluted basis as of December 31, 2010. The O.P. Units may be converted into shares of common stock, subject to limitations set forth in our charter and other agreements with the Berg Group, and upon conversion would represent voting control of our corporation. The Berg Group’s ability to exchange its O.P. Units for common stock permits it to exert substantial influence over the management and direction of our corporation. This influence increases our dependence on the Berg Group.
Limited Partner Approval Rights
Mr. Berg and other limited partners, including other members of the Berg Group, may restrict our operations and activities through rights provided under the terms of the amended and restated agreement of limited partnership which governs each of the operating partnerships and our legal relationship to each operating partnership as its general partner. Matters requiring approval of the holders of a majority of the O.P. Units, which necessarily would include the Berg Group, include the following:
|
·
|
the amendment, modification or termination of any of the operating partnership agreements;
|
|
·
|
the transfer of any general partner interest in the operating partnerships, including, with certain exceptions, transfers attendant to any merger, consolidation or liquidation of our corporation;
|
|
·
|
the admission of any additional or substitute general partners in the operating partnerships;
|
|
·
|
any other change of control of the operating partnerships;
|
|
·
|
a general assignment for the benefit of creditors or the appointment of a custodian, receiver or trustee for any of the assets of the operating partnerships; and
|
|
·
|
the institution of any bankruptcy proceeding for any operating partnership.
|
In addition, as long as the Berg Group members and their affiliates, other than us and the operating partnerships, beneficially own, in the aggregate, at least 15% of the outstanding shares of common stock on a Fully Diluted basis, the consent of the limited partners holding the right to vote a majority of the total number of O.P. Units outstanding is also required with respect to:
|
·
|
the sale or other transfer of all or substantially all of the assets of the operating partnerships and certain mergers and business combinations resulting in the complete disposition of all O.P. Units;
|
|
·
|
the issuance of limited partnership interests senior to the O.P. Units as to distributions, assets and voting; and
|
|
·
|
the liquidation of the operating partnerships.
|
The liquidity of an investment in our common stock, including our ability to respond to acquisition offers, will be subject to the exercise of these rights.
Our contractual business relationships with the Berg Group present additional conflicts of interest, which may result in the realization of economic benefits or the deferral of tax liabilities by the Berg Group without equivalent benefits to our stockholders.
Our contracts with the Berg Group provide it with interests that could conflict with those of our other stockholders, including the following:
|
·
|
our headquarters are leased from an entity owned by the Berg Group, to whom we pay rent of $10,000 per month;
|
|
·
|
the Berg Group is permitted to conduct real estate and business activities other than our business;
|
|
·
|
if we decline an opportunity that has been offered to us by the Berg Group, the Berg Group may pursue it, which would reduce the amount of time that Mr. Berg could devote to our affairs and could result in the Berg Group’s development of properties that compete with our properties for tenants;
|
|
·
|
in general, we have agreed to limit the liability of the Berg Group to our corporation and our stockholders arising from the Berg Group’s pursuit of these other opportunities;
|
|
·
|
we acquired most of our properties from the Berg Group on terms that were not negotiated at arm’s length and without many customary representations and warranties that we would have sought in an acquisition from an unrelated party; and
|
|
·
|
we have assumed liability for debt to the Berg Group and debt for which the Berg Group was liable.
|
-9-
The Berg Group has agreed that the Independent Directors Committee of our board of directors must approve all new transactions between us and any of its members, or between us and any entity in which it directly or indirectly owns 5% or more of the equity interests, including the operating partnerships for this purpose. This committee currently consists of three directors who are independent of the Berg Group.
Berg Land Holdings
The Berg land holdings option agreement expired on December 31, 2010 and we no longer have the right to acquire properties from the Berg Group or the pre-determined terms provided in that agreement. Although we do not currently perceive growth opportunities from the land that was subject to the Berg land holdings option agreement, it is possible that the termination of that agreement will result in limitation of our growth, which could cause our stock price to fall.
Terms of Transfers: Enforcement of Agreement of Limited Partnership
The terms of the Berg land holdings option agreement the partnership agreement of each operating partnership and other material agreements through which we have acquired our interests in the operating partnerships and the properties formerly controlled by the Berg Group were not determined through arm’s-length negotiations and could be less favorable to us than those obtained from an unrelated party. In addition, Mr. Berg and representatives of the Berg Group sitting on our board of directors may be subject to conflicts of interests with respect to their obligations as our directors to enforce the terms of the partnership agreement of each operating partnership when such terms conflict with their personal interests. The terms of our charter and bylaws also were not determined through arm’s-length negotiations. Some of these terms, including representations and warranties applicable to acquired properties, are not as favorable as those that we would have sought through arm’s-length negotiations with unrelated parties. As a result, an investment in our common stock may involve risks not found in businesses in which the terms of material agreements have been negotiated at arm’s length.
Related Party Debt
We are liable to the Berg Group under a mortgage loan of approximately $7.7 million due in June 2013, which was extended from the original maturity date of June 2010, in connection with our acquisition of the 5300-5350 Hellyer Avenue R&D properties that we acquired in May 2000 under the Berg land holdings option agreement. Funds from operations have not been sufficient to fund both full dividend distributions and debt service so the Berg Group from time-to-time provides short-term funding for dividend distributions, but is not obligated to do so. As of the date of this report, we had no short-term debt owing to the Berg Group. Due to the lack of large short-term credit facilities, and the favorable terms that have been provided to us by the Berg Group, we frequently rely on these short-term loans from the Berg Group, which may not always be available. If they are not available, we will have to find other probably more expensive sources of funding or reduce dividend distributions. If we are unable to repay our debt to the Berg Group when due, the Berg Group could take action to enforce our payment obligations. Potential actions by the Berg Group to enforce these obligations could result in the foreclosure of one or more of our properties and a reduction in the amount of cash distributions to our stockholders. In turn, if we fail to meet the minimum distributions test because of a loan default or another reason, we could lose our REIT classification for federal income tax purposes. For more information please refer to Item 1A, “Risk Factors – Failure to satisfy federal income tax requirements for REITs could reduce our distributions, reduce our income and cause our stock price to fall.”
We may change our investment and financing policies and increase your risk without stockholder approval.
Our board of directors determines the investment and financing policies of the operating partnerships and our policies with respect to certain other activities, including our business growth, debt capitalization, distribution, and operating policies. Our board of directors may amend these policies at any time without a vote of the stockholders. Changes in these policies could materially adversely affect our financial condition, results of operations and ability to make cash distributions to our stockholders, which could harm our business and cause our stock price to fall. For more information please refer to Item 7, “Management’s Discussion and Analysis of Financial Condition and Results of Operations - Policies with Respect to Certain Activities.”
Anti-takeover provisions in our charter could prevent acquisitions of our stock at a substantial premium.
Provisions of our charter and our bylaws could delay, defer or prevent a transaction or a change in control of our corporation, or a similar transaction, that might involve a premium price for our shares of common stock or otherwise be in the best interests of our stockholders. Provisions of the Maryland general corporation law, which would apply to potential business combinations with acquirers other than the Berg Group or stockholders who invested in us in December 1998, also could prevent the acquisition of our stock for a premium, as discussed in “Certain Provisions of Maryland Law and of our Charter and Bylaws.”
-10-
An investment in our stock involves risks related to real estate investments that could harm our business and cause our stock price to fall.
Rental Income Varies
Real property investments are subject to varying degrees of risk. Investment returns available from equity investments in real estate depend in large part on the amount of income earned and capital appreciation, which our properties generate, as well as our related expenses incurred. If our properties do not generate revenues sufficient to meet operating expenses, debt service and capital expenditures, our income and ability to make distributions to our stockholders will be adversely affected. Income from our properties may also be adversely affected by general economic conditions, local economic conditions such as oversupply of commercial real estate, the attractiveness of our properties to tenants and prospective tenants, competition from other available rental property, our ability to provide adequate maintenance and insurance, the cost of tenant improvements, leasing commissions and tenant inducements and the potential of increased operating costs, including real estate taxes.
Competitive Market
We face significant competition, which may decrease the occupancy and rental rates of our properties. We compete with several developers, owners, and operators of office, industrial, and other commercial real estate, many of which own properties similar to ours in the same submarkets in which our properties are located. Our competitors have an incentive to decrease rental rates until their available space is leased. If our competitors offer space at rental rates below the rates currently charged by us for comparable space, we may be pressured to reduce our rental rates below those currently charged in order to retain tenants when our tenant leases expire. As a result, our financial condition, results of operations, cash flow, the quoted trading prices of our securities, and our ability to satisfy our debt service obligations and to pay distributions to stockholders may be adversely affected.
Expenditures for Property Ownership are Fixed
Income from properties and real estate values also are affected by a variety of other factors, such as governmental regulations and applicable laws, including real estate, zoning and tax laws, interest rate levels and the availability of financing. Various significant expenditures associated with an investment in real estate, such as mortgage payments, real estate taxes and maintenance expenses, generally are not reduced when circumstances cause a reduction in revenue from the investment. Thus, our operating results and our cash flow may decline materially if our rental income is reduced.
Illiquidity
Real estate investments are relatively illiquid, which limits our ability to restructure our portfolio in response to changes in economic or other conditions.
Geographic Concentration
All of our properties are located in the southern portion of the San Francisco Bay Area commonly referred to as the “Silicon Valley.” The Silicon Valley economy has weakened after relatively recent years and there remains significant excess capacity for R&D properties in the Silicon Valley. At present, future increases in values and rents for our properties depend to a significant extent on a strong recovery of this region’s economy, which we do not currently foresee.
Loss of Key Tenants
Single tenants, many of whom are large, publicly traded information technology companies, occupy most of our properties. We may lose tenants when existing leases expire because it may be difficult to re-lease the same property due to substantial overcapacity of R&D properties in the Silicon Valley at present. Losing a key tenant could adversely affect our operating results and our ability to make distributions to stockholders if we are unable to obtain replacement tenants promptly. Moreover, to retain key tenants upon the expiration of existing leases we may need to reduce rents, which also could adversely affect our operating results and ability to make distributions.
Tenant Bankruptcies
Key tenants could seek the protection of the bankruptcy laws, which could result in the rejection and termination of their leases, thereby causing a reduction in our rental income. Under the bankruptcy laws, these tenants may have the right to reject their leases with us and our claim for rent will be limited to the greater of one year or 15% of the total amount owing under the leases upon default, but not to exceed three years of the remaining term of the lease following the earlier of the petition filing date or the date on which we gained repossession of the property, as well as any rent that was unpaid on the earlier of those dates.
-11-
Our Substantial Indebtedness
Our properties are subject to substantial indebtedness. If we are unable to make required mortgage payments, we could sustain a loss as a result of foreclosure on our properties by the mortgagor. Furthermore, our mortgage loans may be subject to covenants that we are obligated to satisfy. For example, under our mortgage loan agreements with Northwestern Mutual Life Insurance Company, the payment of all $73.4 million outstanding as of December 31, 2010 could be accelerated upon the sale or certain other transfers of more than 51% of the total number of O.P. Units and shares of our common stock held by the members of the Berg Group. We have no reason to expect such a sale or transfer in the foreseeable future, but the members of the Berg Group have no obligation to us to refrain from any such sale or other transfer. We have adopted a policy of maintaining a consolidated ratio of debt to total market capitalization, which includes for this purpose the market value of all shares of common stock for which outstanding O.P. Units are exchangeable, of less than 50%. This ratio may not be exceeded without the approval of more than 75% of our entire board of directors. Our board of directors may vote to change this policy, however, and we could become more highly leveraged, resulting in an increased risk of default on our obligations and an increase in debt service requirements that could adversely affect our financial condition, our operating results and our ability to make distributions to our stockholders.
Environmental Clean-Up Liabilities
Our properties may expose us to liabilities under applicable environmental and health and safety laws. If these liabilities are material, our financial condition and ability to pay cash distributions may be affected adversely, which would cause our stock price to fall.
Uninsured Losses
We may sustain uninsured losses with respect to some of our properties. If these losses are material, our financial condition, our operating results and our ability to make distributions to our stockholders may be affected adversely.
Earthquake Damages are Uninsured
All of our properties are located in areas that are subject to earthquake activity. Our insurance policies do not cover damage caused by seismic activity although they do cover losses from fires after an earthquake. We generally do not consider such insurance coverage to be economical. If an earthquake occurs and results in substantial damage to our properties, we could lose our investment in those properties, which loss could have a material adverse effect on our financial condition, our operating results and our ability to make distributions to our stockholders.
Our real estate assets may be subject to impairment charges.
We continually evaluate the recoverability of the carrying value of our real estate assets for impairment indicators. Factors considered in evaluating impairment of our existing real estate assets include significant declines in property operating profits, recurring property operating losses and other significant adverse changes in general market conditions that are considered permanent in nature. Generally, a real estate asset is not considered impaired if the undiscounted, estimated future cash flows of the asset over its estimated holding period are in excess of the asset’s net book value at the balance sheet date. Assumptions used to estimate annual and residual cash flow, the estimated holding period of such assets, the lease up period when properties are vacant and future rental income require the judgment of management. Actual results could be different than our estimates.
There can be no assurance that we will not take impairment charges in the future related to the impairment of our assets. As of the years ended December 31, 2010, 2009 and 2008, management believed it had applied reasonable estimates and judgments in determining the proper classification of its real estate assets. However, should external or internal circumstances change requiring the need to shorten the holding periods or adjust the estimated future cash flows of certain of our assets, we could be required to record additional impairment charges. If any real estate asset held for sale is considered impaired, a loss is provided to reduce the carrying value of the asset to its fair value, less selling costs. Any future impairment could have a material adverse affect on our results of operations and funds from operations in the period in which the charge is taken.
Failure to satisfy federal income tax requirements for REITs could reduce our distributions, reduce our income and cause our stock price to fall.
Failure to Qualify as a REIT
Although we currently operate in a manner designed to enable us to qualify and maintain our REIT status, it is possible that economic, market, legal, tax or other considerations may cause us to fail to qualify as a REIT or may cause our board of directors either to refrain from making the REIT election or to revoke that election once made. To maintain REIT status, we must meet certain tests for income, assets, distributions to stockholders, ownership interests, and other significant conditions. If we fail to qualify as a REIT in any taxable year, we will not be allowed a deduction for distributions to our stockholders in computing our taxable income and would be subject to federal income tax, including any applicable alternative minimum tax, on our taxable income at regular corporate rates. Moreover, unless we were entitled to relief under certain provisions of the tax laws, we would be disqualified from treatment as a REIT for the four taxable years following the year in which our qualification was lost. As a result, funds available for distributions to our stockholders would be reduced for each of the years involved and, in addition, we would no longer be required to make distributions to our stockholders.
-12-
REIT Distribution Requirements
To maintain REIT status, we must distribute as a dividend to our stockholders at least 90% of our otherwise net taxable income, after certain adjustments, with respect to each tax year. We also may be subject to a 4% non-deductible excise tax in the event our distributions to stockholders fail to meet certain other requirements. Failure to comply with these requirements could result in our income being subject to tax at regular corporate rates and could cause us to be liable for the excise tax.
Ownership Limit Necessary to Maintain REIT Qualification
As a REIT, the federal tax laws restrict the percentage of the total value of our stock that may be owned by five or fewer individuals to 50% or less. Our charter generally prohibits the direct or indirect ownership of more than 9% of our common stock by any stockholder. This limit excludes the Berg Group, which has an aggregate ownership limit of 20%. In addition, as permitted by our charter, our board of directors has authorized an exception applicable to two other stockholders that permits them to collectively own, directly or indirectly, up to 18.5% of our common stock on an aggregate basis, subject to the terms of an ownership limit exemption agreement. In general, our charter prohibits the transfer of shares that result in a loss of our REIT qualification and provides that any such transfer or any other transfer that causes a stockholder to exceed the ownership limit will result in the shares being automatically transferred to a trust for the benefit of a charitable beneficiary. Accordingly, in the event that either the Berg Group or the two stockholders increase their stock ownership in our corporation, a stockholder who acquires shares of our common stock, even though his, her or its aggregate ownership may be less than 9%, may be required to transfer a portion of that stockholder’s shares to such a trust in order to preserve our status as a REIT.
Stockholders are not assured of receiving cash distributions from us.
Our income consists primarily of our share of the income of the operating partnerships, and our cash flow consists primarily of our share of distributions from the operating partnerships. Differences in timing between the receipt of income and the payment of expenses in arriving at our taxable income or the taxable income of the operating partnerships and the effect of required debt amortization payments could require us to borrow funds, directly or through the operating partnerships, on a short-term basis to meet our intended distribution policy.
Our board of directors will determine the amount and timing of distributions by the operating partnerships and of distributions to our stockholders. Our board of directors will consider many factors prior to making any distributions, including the following:
|
·
|
the amount of cash available for distribution;
|
|
·
|
availability of financing;
|
|
·
|
our financial condition;
|
|
·
|
whether to reinvest funds rather than to distribute such funds;
|
|
·
|
our committed and projected capital expenditures;
|
|
·
|
the amount of cash required for new property acquisitions;
|
|
·
|
the amount of our annual debt service requirements;
|
|
·
|
the annual distribution requirements under the REIT provisions of the federal income tax laws;
|
|
·
|
our projected rental rates and revenues;
|
|
·
|
our ability to collect rent payments;
|
|
·
|
prospects of tenant renewals and re-leases of properties subject to expiring leases;
|
|
·
|
cash required for re-leasing activities; and
|
|
·
|
such other factors as our board of directors deem relevant.
|
We cannot assure you that we will be able to meet or maintain our cash distribution objectives.
Our properties could be subject to property tax reassessments.
We do not believe that the acquisition of any of our interests in the operating partnerships has resulted in a statutory change in ownership that could give rise to a reassessment of any of our properties for California property tax purposes. We cannot assure you, however, that county assessors or other tax administrative agencies in California will not attempt to assert that such a change occurred as a result of these transactions. Although we believe that such a challenge would not be successful ultimately, we cannot assure you regarding the outcome of any related dispute or proceeding. A reassessment could result in increased real estate taxes on our properties that, as a practical matter, we may be unable to pass through to our tenants in full. This could reduce our net income and our funds available for distributions and cause our stock price to fall.
-13-
Our obligation to purchase tendered O.P. Units could reduce our cash distributions.
Each of the limited partners of the operating partnerships, other than Carl E. Berg and Clyde J. Berg, has the annual right to cause the operating partnerships to purchase the limited partner’s O.P. Units at a purchase price based on the average market value of the common stock for the ten-trading-day period immediately preceding the date of tender. Upon a limited partner’s exercise of any such right, we will have the option to purchase the tendered O.P. Units with available cash, borrowed funds or the proceeds of an offering of newly issued shares of common stock. These put rights became exercisable on December 29, 1999, and are available once during a 12-month period. If the total purchase price of the O.P. Units tendered by all of the eligible limited partners in one year exceeds $1 million, the operating partnerships or we will be entitled, but not required, to reduce proportionately the number of O.P. Units to be acquired from each tendering limited partner so that the total purchase price does not exceed $1 million. Thus, we might repurchase O.P. Units for a total purchase price of more than $1 million in one year. The exercise of these put rights may reduce the amount of cash that we have available to distribute to our stockholders and could cause our stock price to fall.
In addition, all O.P. Unit holders may tender their O.P. Units to us in exchange for shares of common stock on a one-for-one basis at then-current market value or an equivalent amount in cash, at our election. If we elect to pay cash for the O.P. Units, our liquidity may be reduced and we may lack sufficient funds to continue paying the amount of our anticipated or historical cash distributions. This could cause our stock price to fall.
Shares eligible for future sale could affect the market price of our stock.
We cannot predict the effect, if any, that future sales of shares of common stock, or the availability of shares for future sale, could have on the market price of our common stock. As of December 31, 2010, all outstanding shares of our common stock, other than shares controlled by affiliates, were eligible for sale in the public market without resale restrictions under the federal securities laws. Sales of substantial amounts of common stock, including shares issued in connection with the exercise of the exchange rights held by the limited partners of the operating partnerships, or the perception that such sales could occur, could adversely affect prevailing market prices for the common stock. Additional shares of common stock may be issued to limited partners, subject to the applicable REIT qualification ownership limit, if they exchange their O.P. Units for shares of common stock pursuant to their exchange rights, or may be sold by us to raise funds required to purchase such O.P. Units if eligible limited partners elect to tender O.P. Units to us using their put rights. Shares of stock controlled by our affiliates may be sold subject to Rule 144, including the limitation under Rule 144(e) on the number of shares that may be sold within a three-month period. In addition, pursuant to a registration statement on Form S-3 declared effective by the SEC in April 2006, all shares of common stock acquired upon exchange of currently outstanding O.P. Units may be resold without any such restrictions. Additional common stock reserved under our 2004 Equity Incentive Plan, including stock options, also may be sold in the market at some time in the future. Future sales of our common stock in the market could adversely affect the price of our common stock.
Market interest rates may reduce the value of the common stock.
One of the factors that investors consider important in deciding whether to buy or sell shares of a REIT is the distribution rate on such shares, as a percentage of the price of such shares, relative to market interest rates. If market interest rates go up, prospective purchasers of REIT shares may expect a higher distribution rate. Higher interest rates would not, however, increase the funds available for us to distribute, and, in fact, would likely increase our borrowing costs and decrease funds available for distributions. Thus, higher market interest rates could cause the price of our common stock to fall.
Item 1B. Unresolved Staff Comments
None.
-14-
Item 2. Properties
Geographic and Tenant Focus
We focus principally on the facility requirements of information technology companies in the Silicon Valley, which include space for office, R&D, light manufacturing and assembly. With the Silicon Valley’s highly educated and skilled work force, history of numerous successful start-up companies and large contingent of venture capital firms, we believe that this region will, following the current significant slowdown in the market, continue to spawn successful new high-growth industries and entrepreneurial businesses to an extent matched nowhere else in the United States. We believe that our focus and thorough understanding of the Silicon Valley real estate market enables us to:
|
·
|
anticipate trends in the market;
|
|
·
|
identify and concentrate our efforts on the most favorably located sub-markets;
|
|
·
|
take advantage of our experience and extensive contacts and relationships with local government agencies, real estate brokers and subcontractors, as well as with tenants and prospective tenants; and
|
|
·
|
identify strong tenants.
|
All of our properties are general-purpose R&D/office type properties located in desirable sub-markets of the Silicon Valley. Many of our properties have been developed for or leased to single tenants, many of whom are large, publicly traded information technology companies. Most of our major tenants have occupied our properties for many years under triple-net leases that require the tenant to pay substantially all operating costs, including property insurance, real estate taxes and general operating costs.
Leasing
The current leases for our properties have terms ranging from month-to-month to 10 years. Most of the leases provide for fixed periodic rental increases. Substantially all of the leases are triple-net leases pursuant to which the tenant is required to pay substantially all of the property operating expenses, including all maintenance and repairs, property taxes and insurance, and excluding only certain structural repairs to the building shell. Most of the leases contain renewal options that allow the tenant to extend the lease based on adjustments to then prevailing market rates, or based on fixed rental adjustments, which may be at or below market rates.
Property Portfolio
All of our properties are R&D/office type properties. Generally, these properties are one- to two-story buildings of tilt-up concrete construction, have on average 3.5 or more parking spaces per thousand rentable square feet, clear ceiling heights of less than 18 feet, and range in size from approximately 4,500 to 211,000 rentable square feet. Most of the office space is open and suitable for configuration to meet the tenants’ requirements with the use of movable dividers.
The following table sets forth certain information relating to our properties as of December 31, 2010:
|
Location
|
No. of Properties
|
Total
Rentable
Sq. Ft.
|
Percentage
Occupied as of
Dec. 31, 2010
|
Average 2010 Occupancy
|
Major Tenants
|
Major Tenants Rentable
Sq. Ft. at 12/31/10
|
2010 Annual
Base Rent (1)
|
|||||||||||||||||||||
|
5300-5350 Hellyer Avenue (2)
|
2 | 160,000 | 100 | % | 100 | % |
Tyco Electronics Corporation
|
160,000 | $ | 4,078,408 | ||||||||||||||||||
|
10401-10411 Bubb Road (2)
|
1 | 20,330 | 100 | % | 96 | % |
Aeroflex, Inc.
|
20,330 | 326,346 | |||||||||||||||||||
|
45365-45395 Northport Loop West
|
1 | 64,218 | 26 | % | 20 | % |
Optovue, Inc.
|
16,919 | 86,932 | |||||||||||||||||||
|
45738 Northport Loop West
|
1 | 44,256 | 100 | % | 100 | % |
Quicksil, Inc.
|
44,256 | - | |||||||||||||||||||
|
4050 Starboard Drive
|
1 | 52,232 | 100 | % | 100 | % |
Flash Electronics, Inc.
|
52,232 | 540,602 | |||||||||||||||||||
|
3501 West Warren Avenue &
46600 Fremont Boulevard
|
1 | 67,864 | 30 | % | 26 | % |
Sunnyvale Fluid System Tech, Inc.
|
15,675 | 171,672 | |||||||||||||||||||
|
48800 Milmont Drive
|
1 | 53,000 | 0 | % | 0 | % |
Vacant
|
- | - | |||||||||||||||||||
|
4750 Patrick Henry Drive
|
1 | 63,105 | 100 | % | 100 | % |
Infoblox, Inc.
|
63,105 | 719,327 | |||||||||||||||||||
|
Triangle Technology Park (2) (5)
|
7 | 416,927 | 80 | % | 75 | % |
Intevac Corporation
Comtech Xicom Technology, Inc.
LSA Cleanpart, LLC
SASCO
|
169,583
71,216
28,300
25,350
|
3,331,433 | |||||||||||||||||||
-15-
|
Location
|
No. of Properties
|
Total
Rentable
Sq. Ft.
|
Percentage
Occupied as of
Dec. 31, 2010
|
Average 2010 Occupancy
|
Major Tenants
|
Major Tenants Rentable
Sq. Ft. at 12/31/10
|
2010 Annual
Base Rent (1)
|
|
5830-5870 Hellyer Avenue
|
1 | 109,715 | 71 | % | 71 | % |
Shocking Technologies, Inc.
MeiVac, Inc.
|
51,859
26,557
|
834,362 | |||||||||||||||||||
|
5750 Hellyer Avenue
|
1 | 73,312 | 100 | % | 100 | % |
NDS Surgical Imaging, LLC
|
73,312 | 733,360 | |||||||||||||||||||
|
5500-5550 Hellyer Avenue
|
2 | 196,534 | 68 | % | 67 | % |
CTS Corporation
Snap-on, Inc.
|
81,242
52,243
|
1,917,265 | |||||||||||||||||||
|
5400 Hellyer Avenue
|
1 | 77,184 | 60 | % | 60 | % |
Quantum 3D, Inc.
Capella, Inc.
|
24,777
21,750
|
550,788 | |||||||||||||||||||
|
5325-5345 Hellyer Avenue
|
2 | 256,500 | 100 | % | 100 | % |
Celestica Asia, Inc.
|
256,500 | 6,396,204 | |||||||||||||||||||
|
5905-5965 Silver Creek Valley Rd.
|
4 | 346,000 | 0 | % | 0 | % |
Vacant
|
- | - | |||||||||||||||||||
|
5845 Hellyer Avenue
|
1 | 98,500 | 0 | % | 0 | % |
Vacant
|
- | - | |||||||||||||||||||
|
855 Embedded Way
|
1 | 67,912 | 100 | % | 100 | % |
Celestica Asia, Inc.
Lynuxworks, Inc.
|
39,039
28,873
|
1,094,796 | |||||||||||||||||||
|
1065-1105 La Avenida Street
|
5 | 515,700 | 100 | % | 100 | % |
Microsoft Corporation
|
515,700 | 13,179,260 | |||||||||||||||||||
|
1040-1050 La Avenida Street
|
1 | 41,354 | 0 | % | 83 | % |
Vacant
|
- | 184,791 | |||||||||||||||||||
|
1875 Charleston Road
|
1 | 42,126 | 100 | % | 100 | % |
Google, Inc.
|
42,126 | 917,860 | |||||||||||||||||||
|
1750 Automation Parkway
|
1 | 80,641 | 100 | % | 100 | % |
JDS Uniphase Corporation
|
80,641 | 1,058,701 | |||||||||||||||||||
|
1756 Automation Parkway
|
1 | 80,640 | 36 | % | 36 | % |
A&D Engineering, Inc.
|
28,739 | 336,687 | |||||||||||||||||||
|
1762 Automation Parkway
|
1 | 61,100 | 100 | % | 100 | % |
Hermes Microvision, Inc.
|
61,100 | 790,970 | |||||||||||||||||||
|
1764 Automation Parkway
|
1 | 110,592 | 67 | % | 67 | % |
2Wire, Inc.
|
74,584 | 862,533 | |||||||||||||||||||
|
255 Caspian Drive
|
1 | 119,756 | 100 | % | 100 | % |
Equinix Operating Company, Inc.
|
119,756 | 2,695,260 | |||||||||||||||||||
|
245 Caspian Drive (3)
|
1 | - | - | - | - | - | - | |||||||||||||||||||||
|
5981 Optical Court
|
1 | 110,542 | 100 | % | 100 | % |
SoloPower, Inc.
|
110,542 | 2,318,724 | |||||||||||||||||||
|
5970 Optical Court
|
1 | 128,520 | 100 | % | 100 | % |
Orbotech Ltd.
|
128,520 | 1,465,128 | |||||||||||||||||||
|
5900 Optical Court
|
1 | 165,000 | 100 | % | 100 | % |
Stryker Corporation
|
165,000 | 2,862,504 | |||||||||||||||||||
|
2630 Orchard Parkway
|
1 | 60,633 | 100 | % | 8 | % |
Aruba Networks, Inc.
|
60,633 | 10,000 | |||||||||||||||||||
|
2610 Orchard Parkway
|
1 | 54,093 | 0 | % | 0 | % |
Vacant
|
- | - | |||||||||||||||||||
|
55 West Trimble Road
|
1 | 91,722 | 0 | % | 0 | % |
Vacant
|
- | - | |||||||||||||||||||
|
2001 Walsh Avenue
|
1 | 80,000 | 100 | % | 100 | % |
Nvidia Corporation
|
80,000 | 1,010,857 | |||||||||||||||||||
|
2880 Scott Boulevard
|
1 | 200,000 | 100 | % | 100 | % |
NEC Electronics America, Inc.
|
200,000 | 2,743,112 | |||||||||||||||||||
|
2890 Scott Boulevard
|
1 | 75,000 | 100 | % | 100 | % |
Nvidia Corporation
|
75,000 | 1,658,658 | |||||||||||||||||||
|
2770-2800 Scott Boulevard
|
1 | 99,800 | 100 | % | 100 | % |
Nvidia Corporation
|
99,800 | 1,412,674 | |||||||||||||||||||
|
2300 Central Expressway
|
1 | 46,338 | 100 | % | 100 | % |
Huawei Technologies Company Ltd.
|
46,338 | 743,167 | |||||||||||||||||||
|
2220 Central Expressway
|
1 | 62,522 | 100 | % | 100 | % |
Tellabs, Inc.
|
62,522 | 831,343 | |||||||||||||||||||
|
2330 Central Expressway
|
1 | 62,522 | 100 | % | 100 | % |
Huawei Technologies Company Ltd.
|
62,522 | 1,002,728 | |||||||||||||||||||
|
233 South Hillview Drive
|
2 | 95,690 | 100 | % | 100 | % |
Exar Corporation
|
95,690 | 1,411,287 | |||||||||||||||||||
|
2251 Lawson Lane
|
1 | 125,000 | 51 | % | 51 | % |
Synaptics, Inc.
|
64,270 | 1,196,453 | |||||||||||||||||||
|
1230 East Arques
|
1 | 60,000 | 100 | % | 100 | % |
Fujitsu
|
60,000 | 349,964 | |||||||||||||||||||
|
1250 East Arques
|
4 | 200,000 | 100 | % | 100 | % |
Fujitsu
|
200,000 | 869,311 | |||||||||||||||||||
-16-
|
Location
|
No. of Properties
|
Total
Rentable
Sq. Ft.
|
Percentage
Occupied as of
Dec. 31, 2010
|
Average 2010 Occupancy
|
Major Tenants
|
Major Tenants Rentable
Sq. Ft. at 12/31/10
|
2010 Annual
Base Rent (1)
|
|
20400 Mariani Avenue
|
1 | 105,000 | 100 | % | 100 | % |
Apple, Inc.
|
105,000 | 1,976,604 | |||||||||||||||||||
|
10500 De Anza Boulevard
|
1 | 211,000 | 100 | % | 100 | % |
Apple, Inc.
|
211,000 | 4,318,466 | |||||||||||||||||||
|
20605-705 Valley Green Drive
|
2 | 142,000 | 100 | % | 100 | % |
Apple, Inc.
|
142,000 | 2,639,349 | |||||||||||||||||||
|
10300 Bubb Road
|
1 | 23,400 | 100 | % | 100 | % |
Apple, Inc.
|
23,400 | 402,715 | |||||||||||||||||||
|
10440 Bubb Road
|
1 | 19,500 | 100 | % | 100 | % |
Novare Surgical Systems, Inc.
|
10,833 | 298,878 | |||||||||||||||||||
|
10450-10460 Bubb Road
|
1 | 45,460 | 100 | % | 100 | % |
Ricoh Corporation
VMWare, Inc.
|
30,460
15,000
|
758,201 | |||||||||||||||||||
|
1135 Kern Avenue
|
1 | 18,300 | 0 | % | 0 | % |
Vacant
|
- | - | |||||||||||||||||||
|
450 National Avenue
|
1 | 36,100 | 0 | % | 0 | % |
Vacant
|
- | - | |||||||||||||||||||
|
3301 Olcott Street
|
1 | 64,500 | 73 | % | 24 | % |
Mosys, Inc.
|
46,886 | 196,920 | |||||||||||||||||||
|
2800 Bayview Avenue
|
1 | 59,736 | 0 | % | 0 | % |
Vacant
|
- | - | |||||||||||||||||||
|
5521 Hellyer Avenue
|
1 | 203,800 | 44 | % | 44 | % |
Nanosolar, Inc.
|
89,040 | 801,360 | |||||||||||||||||||
|
6850 Santa Teresa Boulevard
|
1 | 30,000 | 41 | % | 41 | % |
Bio-Medical Applications of CA
|
12,350 | 130,039 | |||||||||||||||||||
|
6810 Santa Teresa Boulevard &
180 Great Oaks Boulevard
|
1 | 54,996 | 87 | % | 87 | % |
ZiLOG, Inc.
|
40,527 | 662,972 | |||||||||||||||||||
|
140-160 Great Oaks Boulevard &
6781 Via Del Oro
|
2 | 105,300 | 100 | % | 100 | % |
Semiconductor Tooling Services
Instant Asphalt, Inc.
Santa Clara Valley Water District
|
53,300
26,571
25,429
|
889,279 | |||||||||||||||||||
|
6540-6541 Via Del Oro &
6385-6387 San Ignacio Avenue
|
2 | 66,600 | 72 | % | 62 | % |
Modutek Corporation
|
16,000 | 310,099 | |||||||||||||||||||
|
6311-6351 San Ignacio Avenue
|
5 | 362,767 | 73 | % | 52 | % |
Stion Corporation
|
201,177 | 1,551,957 | |||||||||||||||||||
|
6320-6360 San Ignacio Avenue
|
1 | 157,292 | 0 | % | 0 | % |
Vacant
|
- | - | |||||||||||||||||||
|
75 East Trimble Road &
2610 North First Street
|
2 | 170,810 | 59 | % | 59 | % |
Comerica, Inc.
|
93,984 | 1,244,612 | |||||||||||||||||||
|
2904 Orchard Parkway
|
1 | 75,335 | 100 | % | 100 | % |
BAE Systems Land & Armaments
|
75,335 | 1,303,296 | |||||||||||||||||||
|
3236 Scott Boulevard
|
1 | 54,672 | 49 | % | 87 | % |
Universal Semiconductor Tech., Inc.
|
26,716 | 639,994 | |||||||||||||||||||
|
1212 Bordeaux Lane
|
1 | 71,800 | 100 | % | 100 | % |
Loral Space & Communications, Inc.
|
71,800 | 766,332 | |||||||||||||||||||
|
McCandless Technology Park
|
13 | 628,061 | 13 | % | 13 | % |
STATS ChipPAC, Inc.
Rorze Automation, Inc.
|
33,984
11,087
|
603,308 | |||||||||||||||||||
|
1600 Memorex Drive
|
1 | 107,500 | 21 | % | 21 | % |
BT INS, Inc.
|
22,800 | 240,610 | |||||||||||||||||||
|
1688 Richard Avenue
|
1 | 52,800 | 100 | % | 100 | % |
NWE Technology, Inc.
|
52,800 | 460,108 | |||||||||||||||||||
|
1700 Richard Avenue
|
1 | 58,783 | 100 | % | 100 | % |
Silicon Valley Colocation, Inc.
|
58,783 | 1,614,285 | |||||||||||||||||||
|
Morgan Hill Land (4)
|
- | - | - | - | - | - | - | |||||||||||||||||||||
|
300 Montague Expressway
|
1 | 49,457 | 0 | % | 0 | % |
Vacant
|
- | 28,389 | |||||||||||||||||||
|
337 Trade Zone Boulevard
|
1 | 42,912 | 0 | % | 0 | % |
Vacant
|
- | - | |||||||||||||||||||
|
324-368 Montague Expressway
|
1 | 56,265 | 0 | % | 0 | % |
Vacant
|
- | - | |||||||||||||||||||
|
TOTAL
|
111 | 8,011,026 | 70 | % | $ | 82,531,240 | ||||||||||||||||||||||
-17-
|
(1)
|
Annual cash rents do not include the recognition of rental income on the straight-line method of accounting required by accounting principles generally accepted in the United States of America (“GAAP”) under which contractual rent payment increases are recognized evenly over the lease term.
|
|
(2)
|
Joint venture properties.
|
|
(3)
|
Property represents a commitment by the Berg Group to construct an approximate 75,000 to 90,000 square foot building on land acquired in 2001.
|
|
(4)
|
This property comprises of 55 acres of vacant land, which could support approximately 800,000 rentable square feet of space. The vacant land is currently zoned for industrial use and a portion has the potential to be rezoned for residential use.
|
|
(5)
|
Includes the 2010 base rent for the property at 1325-1375 McCandless Drive, which was sold in October 2010.
|
We own 100% of all of the properties listed in the table, except: one of the buildings in the Triangle Technology Park, which is owned by a joint venture in which we, through an operating partnership, own a 75% interest; the property at 10401-10411 Bubb Road, which is owned by a joint venture in which we, through an operating partnership, own an 83.33% interest; and the properties at 5300-5350 Hellyer Avenue, which are owned by a joint venture in which we, through an operating partnership, own a 50% interest, and a Berg affiliate owns the other 50% venture interest.
For the years ended December 31, 2010, 2009 and 2008, the occupancy rates for leased properties in our portfolio were approximately 69.9%, 65.5% and 66.4%, respectively.
The average annual rental per square foot for our portfolio of properties for the years ended December 31, 2010, 2009 and 2008 was approximately $15.54, $15.58 and $14.97, respectively.
We have four properties, namely the McCandless Technology Park, 300 Montague Expressway, 337 Trade Zone Boulevard and 324-368 Montague Expressway, consisting of approximately 777,000 rentable square feet that are re-zoned for residential development. We are not actively seeking to lease these properties because we expect to sell them. These properties are not classified as assets held for sale because they do not meet the criteria set forth in the accounting provisions of assets held for sale. Excluding these properties, the occupancy rate for leased properties in our portfolio would have been approximately 76.0%.
Schedule of Lease Expirations
The following table sets forth a schedule of the lease expirations for the properties beginning with 2011, assuming that none of the tenants exercise existing renewal options or termination rights. The table excludes 2,397,707 rentable square feet that were vacant as of December 31, 2010.
|
Year of Lease Expiration
|
Number of Expiring Leases
|
Rentable Square Footage Subject to Expiring Leases (1)
|
2011 Annual Base Rent Under Expiring Leases (2)
|
Percentage of Total Annual Base Rent Represented By Expiring Leases (3)
|
||||||||||||
|
2011
|
15 | 640,671 | $ | 7,366,754 | 8.9 | % | ||||||||||
|
2012
|
13 | 791,223 | 15,267,698 | 18.4 | % | |||||||||||
|
2013
|
6 | 339,123 | 4,971,350 | 6.0 | % | |||||||||||
|
2014
|
20 | 1,625,113 | 26,223,937 | 31.6 | % | |||||||||||
|
2015
|
8 | 587,437 | 9,178,846 | 11.1 | % | |||||||||||
|
2016
|
4 | 196,279 | 3,672,284 | 4.4 | % | |||||||||||
|
2017
|
10 | 605,557 | 7,826,608 | 9.5 | % | |||||||||||
|
2018
|
3 | 265,612 | 1,120,944 | 1.4 | % | |||||||||||
|
2019
|
1 | 165,000 | 2,931,834 | 3.5 | % | |||||||||||
|
Thereafter
|
3 | 208,768 | 4,327,563 | 5.2 | % | |||||||||||
| Total | 83 | 5,424,783 | $ | 82,887,818 | 100 | % | ||||||||||
|
(1)
|
Excludes approximately 114,000 rentable square feet which are on month-to-month leases.
|
|
(2)
|
The base rent for expiring leases is based on 2011 scheduled cash rent, which is different than annual rent determined in accordance with GAAP.
|
|
(3)
|
Based upon 2011 cash rent as discussed in Note (1).
|
If we are unable to lease a significant portion of the available space and space scheduled to expire in 2011 and thereafter at any of our properties; if existing tenants do not renew their leases; or if rental rates decrease, our results of operations, financial condition and cash flows would be affected adversely.
-18-
Environmental Matters
To date, compliance with laws and regulations relating to the protection of the environment, including those regarding the discharge of materials into the environment has not had any material effects upon our capital expenditures, earnings or competitive position.
Under various federal, state and local laws, ordinances and regulations, an owner or operator of real property may be held liable for the costs of removal or remediation of certain hazardous or toxic substances located on or in the property. Such laws often impose liability on the owner and expose the owner to governmental proceedings without regard to whether the owner knew of, or was responsible for, the presence of the hazardous or toxic substances. The cost of any required remediation or removal of such substances may be substantial. In addition, the owner’s liability as to any specific property is generally not limited and could exceed the value of the property and/or the aggregate assets of the owner. The presence of such substances, or the failure to properly remove or remediate such substances, may also adversely affect the owner’s ability to sell or rent the property or to borrow using the property as collateral. Persons who arrange for treatment or the disposal of hazardous or toxic substances may also be liable for the costs of any required remediation or removal of the hazardous or toxic substances at a disposal facility, regardless of whether the facility is owned or operated by such owner or entity. In connection with the ownership of the properties or the treatment or disposal of hazardous or toxic substances, we may be liable for such costs.
Some of our properties are leased, in part, to businesses, including manufacturers that use, store or otherwise handle hazardous or toxic substances in their business operations. These operations create a potential for the release of hazardous or toxic substances. In addition, groundwater contaminated by chemicals used in various manufacturing processes, including semiconductor fabrication, underlies a significant portion of northeastern Santa Clara County, where many of our properties are located.
Environmental laws also govern the presence, maintenance and removal of asbestos. These laws require that owners or operators of buildings containing asbestos properly manage and maintain the asbestos, that they adequately inform or train those who may come into contact with asbestos and that they undertake special precautions, including removal or other abatement in the event that asbestos is disturbed during renovation or demolition of a building. These laws may impose fines and penalties on building owners or operators for failure to comply with these requirements and may allow third parties to seek recovery from owners or operators for personal injury associated with exposure to asbestos fibers. We are aware that there are asbestos-containing materials (“ACMs”), present at several of the properties, primarily in floor coverings. We believe that the ACMs present at these properties are generally in good condition and that no ACMs are present at the remaining properties. We believe we are in compliance in all material respects with all present federal, state and local laws relating to ACMs and that if we were given limited time to remove all ACMs present at the properties, the cost of such removal would not have a material adverse effect on our financial condition, results of operations and ability to make cash distributions to our stockholders.
Phase I assessments are intended to discover and evaluate information regarding the environmental condition of the surveyed property and surrounding properties. Phase I assessments generally include a historical review, a public records review, an investigation of the surveyed site and surrounding properties and the preparation and issuance of a written report, but do not include soil sampling or subsurface investigations and typically do not include an asbestos survey. Environmental assessments have been conducted for about half of the properties.
The environmental investigations that have been conducted on our properties have not revealed any environmental liability that we believe would have a material adverse effect on our financial condition, results of operations and assets. To the extent any environmental report or investigation reveals environmental issues, the tenant is responsible for the cost of any remediation under the terms and conditions of our lease agreement and the law. Nonetheless, it is possible that there are material environmental liabilities of which we are unaware. We cannot assure you that future laws, ordinances, or regulations will not impose any material environmental liability, or that the current environmental condition of the properties has not been, or will not be, affected by tenants and occupants of the properties, by the condition of properties in the vicinity of the properties, or by third parties unrelated to us.
-19-
Item 3. Legal Proceedings
Neither the operating partnerships, our properties nor we are subject to any material litigation nor, to our knowledge, is any material litigation threatened against the operating partnerships, our properties or us. From time to time, we are engaged in legal proceedings arising in the ordinary course of our business. We do not expect any of such proceedings to have a material adverse effect on our cash flows, financial condition or results of operations. We are currently involved in the following legal proceedings and we believe that the ultimate outcome of these proceedings will not have a material adverse effect on our operating results, cash flows or financial condition.
Republic Properties Corporation (“RPC”) v. Mission West Properties, L.P. (“MWP”), in the Circuit Court of Maryland for Baltimore City Case No. 24-C-00-005675. On November 20, 2000, RPC commenced a lawsuit against MWP in the Circuit Court of Maryland for Baltimore City. After lengthy litigation, which included a trial on the merits and subsequent appears, in April 2006 Maryland's highest court upheld an earlier Maryland Appeals Court ruling in favor of MWP, finding that the Circuit Court of Maryland could not assert personal jurisdiction over MWP in the RPC suit. The court vacated the judgment and decision in the trial court and dismissed the entire Maryland suit.
Mission West Properties, L.P. v. Republic Properties Corporation, et al. Santa Clara County Superior Court, Case No. CV 796249. In February 2001, while the Maryland case was pending, we filed a suit against RPC in the Superior Court of the State of California for the County of Santa Clara, Case No. CV 796249. The case was stayed pending resolution of the Maryland case, and we dismissed our suit on March 4, 2005. In April 2005, RPC submitted a motion asking the superior court to reinstate the case, which the court granted on May 25, 2005. In April 2006, the Maryland case was dismissed by the highest court in Maryland for lack of personal jurisdiction. On July 5, 2006, RPC filed a cross-complaint in the case seeking partnership distributions to which we demurred. The court sustained our demurrer with leave to amend. Subsequently, RPC filed an amended complaint, and we submitted another demurrer seeking dismissal of the claims on statute of limitations grounds. A trial in the California Superior Court commenced in February 2009. On September 17, 2009, the Superior Court issued a final decision and entry of judgment in favor of RPC in the amount of approximately $6.6 million, together with pre-judgment interest of 10% through September 3, 2009 in the sum of approximately $2.7 million, for a total of approximately $9.3 million. As a result, we recorded an additional $0.5 million in interest expense. We filed an appeal following the court’s issuance of a final decision and entry of judgment. On October 5, 2009, we deposited with the clerk of the Santa Clara County Superior Court a check in the amount of approximately $14.0 million, of which approximately $4.7 million, or 50% of $9.3 million, was a deposit to appeal the court’s final decision. The additional $4.7 million appeal deposit is refundable regardless of the outcome of the appeal process. Pending the outcome of the appeal, we have accrued approximately $3.9 million in interest on the amount of past distributions that would be payable to RPC by Hellyer LP based on the judgment determined at the legal rate of interest of 10%. In addition, we have accrued approximately $1.0 million in interest receivable due from Berg & Berg Enterprises, Inc. because past distributions with respect to RPC’s interest in Hellyer LP were paid to Berg & Berg Enterprises, Inc. which interest income accrual was calculated at an interest rate of LIBOR plus 1.25%.
For additional information about this litigation and the underlying transactions you should refer to Part II “Item 8. – Notes to Consolidated Financial Statements – Notes 13 and 16.”
The Independent Directors Committee of the board of directors has exercised the right to acquire on our behalf the former RPC interest and related distributions from Berg & Berg Enterprises, Inc. under the terms of the Berg land holdings option agreement if the litigation is ultimately decided in our favor, as more fully explained under Item 8, “Financial Statements and Supplementary Data - Note 13.”
Item 4. Removed and Reserved
-20-
PART II
Item 5. Market for Registrant’s Common Equity, Related Stockholder Matters and Issuer Purchases of Equity Securities
Historical Performance Comparison
The following graph compares the change in the Company’s cumulative stockholder return on its shares of common stock to the cumulative total return of the NAREIT Equity REIT Total Return Index (“NAREIT Equity Index”) and the Standard & Poor’s 500 Stock Index (“S&P 500 Index”) from December 31, 2005 to December 31, 2010. The line graph starts December 31, 2005. The graph assumes that the value of the investment in the Company’s common stock was $100 at December 31, 2005 and that all dividends were reinvested. The common stock’s price on December 31, 2005 was $9.74. The Company obtained the information about the NAREIT Equity Index and S&P 500 Index from each entity respectively, and has assumed that the information is reliable, but cannot assume its accuracy. The return shown on the graph is not necessarily indicative of future performance.
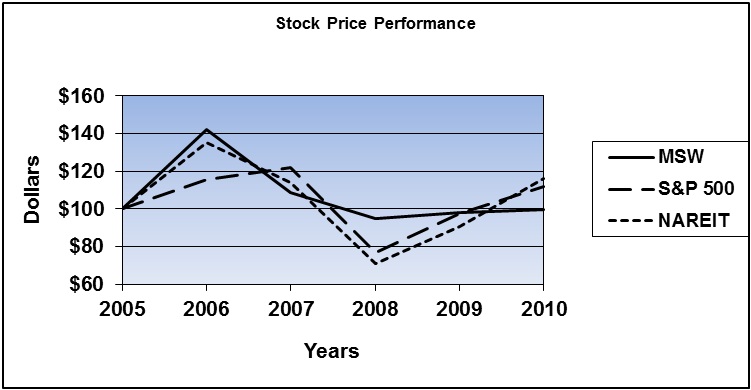
The stock price performance shown in the graph is not necessarily indicative of future performance of the Company’s common stock.
Our common stock is listed on the Nasdaq Stock Market, LLC (“NASDAQ”) and trades under the symbol “MSW.” The closing price of our common stock on December 31, 2010, the last trading day of the year, was $6.69 per share. The high and low price per share of common stock as reported on NASDAQ during each quarter of 2010 and 2009 were as follows:
|
2010
|
2009
|
|||||||||||||||
|
High
|
Low
|
High
|
Low
|
|||||||||||||
|
1st Quarter
|
$ | 7.74 | $ | 6.47 | $ | 7.73 | $ | 5.60 | ||||||||
|
2nd Quarter
|
$ | 7.74 | $ | 6.50 | $ | 7.20 | $ | 6.12 | ||||||||
|
3rd Quarter
|
$ | 7.15 | $ | 6.50 | $ | 7.08 | $ | 6.39 | ||||||||
|
4th Quarter
|
$ | 7.12 | $ | 6.50 | $ | 7.45 | $ | 6.34 | ||||||||
-21-
On February 28, 2011, there were 142 registered holders of the Company’s common stock.
Dividend Policy
We declared and paid dividends in each quarter of 2010 and 2009. We expect to pay quarterly dividends in 2011. The following tables show information for quarterly dividends for 2010 and 2009.
|
2010
|
|||||||
|
Record Date
|
Payment Date
|
Dividend Per Share
|
|||||
|
1st Quarter
|
04/02/10
|
04/08/10
|
$ | 0.15 | |||
|
2nd Quarter
|
06/30/10
|
07/08/10
|
0.15 | ||||
|
3rd Quarter
|
09/30/10
|
10/07/10
|
0.15 | ||||
|
4th Quarter
|
12/31/10
|
01/06/11
|
0.15 | ||||
|
Total
|
$ | 0.60 | |||||
|
2009
|
|||||||
|
Record Date
|
Payment Date
|
Dividend Per Share
|
|||||
|
1st Quarter
|
03/31/09
|
04/09/09
|
$ | 0.20 | |||
|
2nd Quarter
|
06/30/09
|
07/09/09
|
0.15 | ||||
|
3rd Quarter
|
09/30/09
|
10/08/09
|
0.15 | ||||
|
4th Quarter
|
12/31/09
|
01/07/10
|
0.15 | ||||
|
Total
|
$ | 0.65 | |||||
The declaration and payment of dividends and distributions will continue to be determined by the board of directors in light of conditions then existing, including our earnings, financial condition, capital requirements, debt service requirements and other factors.
For federal income tax purposes, we have characterized the dividends declared in 2010 as follows: 83.7% taxable ordinary income and 16.3% long-term capital gain (unaudited). For 2009, we have characterized 93.4% taxable ordinary income and 6.6% return of capital (unaudited).
Securities Authorized for Issuance under Equity Compensation Plans
See Item 12 of Part III of this Report regarding information about securities authorized for issuance under our equity compensation plans.
-22-
Item 6. Selected Financial Data
The following table sets forth selected historical financial information for Mission West Properties, Inc. (see Item 7, “Management’s Discussion and Analysis of Financial Condition and Results of Operations - Overview and Background” for discussion of business combinations and property dispositions that materially affect the comparability of the selected financial data).
Selected consolidated financial data is derived from the audited financial statements and notes thereto (see Item 8, “Financial Statements and Supplementary Data”) and is as follows:
|
Year Ended December 31,
|
||||||||||||||||||||
|
2010
|
2009
|
2008
|
2007
|
2006
|
||||||||||||||||
|
(dollars in thousands, except per share data)
|
||||||||||||||||||||
|
OPERATING INFORMATION: (1)
|
||||||||||||||||||||
|
Operating revenues:
|
||||||||||||||||||||
|
Rental income
|
$ | 81,715 | $ | 82,466 | $ | 78,927 | $ | 80,099 | $ | 91,144 | ||||||||||
|
Above market lease intangible asset amortization
|
- | - | - | (4,091 | ) | (1,888 | ) | |||||||||||||
|
Tenant reimbursements
|
15,094 | 18,668 | 16,293 | 13,168 | 12,951 | |||||||||||||||
|
Other income, including lease terminations and settlements
|
2,619 | 3,756 | 4,220 | 61,975 | 18,201 | |||||||||||||||
|
Total operating revenues
|
99,428 | 104,890 | 99,440 | 151,151 | 120,408 | |||||||||||||||
|
Operating expenses:
|
||||||||||||||||||||
|
Property operating, maintenance and real estate taxes
|
26,400 | 27,532 | 23,140 | 20,013 | 18,139 | |||||||||||||||
|
General and administrative
|
2,219 | 2,336 | 2,635 | 3,035 | 2,248 | |||||||||||||||
|
Depreciation and amortization
|
23,466 | 23,786 | 22,895 | 22,261 | 21,253 | |||||||||||||||
|
Total operating expenses
|
52,085 | 53,654 | 48,670 | 45,309 | 41,640 | |||||||||||||||
|
Operating income
|
47,343 | 51,236 | 50,770 | 105,842 | 78,768 | |||||||||||||||
|
Other income (expenses):
|
||||||||||||||||||||
|
Equity in earnings of unconsolidated joint venture
|
303 | 309 | 19,617 | 1,408 | 1,985 | |||||||||||||||
|
Interest and dividend income
|
102 | 1,309 | 1,735 | 3,086 | 2,344 | |||||||||||||||
|
Realized and unrealized gain (loss) from restricted investment
|
4,067 | 5,011 | (278 | ) | - | - | ||||||||||||||
|
Interest expense
|
(20,069 | ) | (22,117 | ) | (19,787 | ) | (20,131 | ) | (20,708 | ) | ||||||||||
|
Interest expense – related parties
|
(988 | ) | (765 | ) | (1,332 | ) | (724 | ) | (755 | ) | ||||||||||
|
Income from continuing operations
|
30,758 | 34,983 | 50,725 | 89,481 | 61,634 | |||||||||||||||
|
Discontinued operations:
|
||||||||||||||||||||
|
Net gain on disposal of discontinued operations (2)
|
6,199 | - | - | 6,529 | 18,102 | |||||||||||||||
|
Net (loss) income attributable to discontinued operations (2)
|
(462 | ) | (534 | ) | (385 | ) | (162 | ) | 1,252 | |||||||||||
|
Income (loss) from discontinued operations
|
5,737 | (534 | ) | (385 | ) | 6,367 | 19,354 | |||||||||||||
|
Net income
|
36,495 | 34,449 | 50,340 | 95,848 | 80,988 | |||||||||||||||
|
Net income attributable to noncontrolling interests
|
(28,022 | ) | (26,058 | ) | (40,206 | ) | (76,960 | ) | (66,358 | ) | ||||||||||
|
Net income available to common stockholders
|
$ | 8,473 | $ | 8,391 | $ | 10,134 | $ | 18,888 | $ | 14,630 | ||||||||||
|
Basic net income per share from continuing operations
|
$ | 0.34 | $ | 0.39 | $ | 0.51 | $ | 0.91 | $ | 0.60 | ||||||||||
|
Diluted net income per share from continuing operations
|
$ | 0.34 | $ | 0.39 | $ | 0.51 | $ | 0.89 | $ | 0.60 | ||||||||||
|
Basic net income per share from discontinued operations
|
$ | 0.04 | - | - | $ | 0.05 | $ | 0.16 | ||||||||||||
|
Diluted net income per share from discontinued operations
|
$ | 0.04 | - | - | $ | 0.05 | $ | 0.16 | ||||||||||||
|
Basic net income per share to common stockholders
|
$ | 0.39 | $ | 0.39 | $ | 0.51 | $ | 0.96 | $ | 0.77 | ||||||||||
|
Diluted net income per share to common stockholders
|
$ | 0.38 | $ | 0.38 | $ | 0.51 | $ | 0.95 | $ | 0.76 | ||||||||||
|
PROPERTY AND OTHER INFORMATION:
|
||||||||||||||||||||
|
Total properties, end of period (3)
|
111 | 111 | 111 | 109 | 107 | |||||||||||||||
|
Total rentable square feet, end of period (000’s)
|
8,011 | 8,048 | 8,048 | 7,862 | 7,701 | |||||||||||||||
|
Average monthly rental income per square foot (4)
|
$ | 1.30 | $ | 1.30 | $ | 1.25 | $ | 1.42 | $ | 1.57 | ||||||||||
|
Occupancy for leased properties, end of period
|
70 | % | 66 | % | 66 | % | 62 | % | 69 | % | ||||||||||
|
Dividends per share to common stockholders
|
$ | 0.60 | $ | 0.65 | $ | 0.80 | $ | 0.64 | $ | 0.64 | ||||||||||
|
Funds from operations (5)
|
$ | 56,018 | $ | 60,467 | $ | 55,334 | $ | 114,867 | $ | 86,585 | ||||||||||
|
Funds from operations per share (5) (6)
|
$ | 0.53 | $ | 0.57 | $ | 0.52 | $ | 1.09 | $ | 0.83 | ||||||||||
|
CASH FLOW INFORMATION:
|
||||||||||||||||||||
|
Cash flows provided by operating activities
|
$ | 81,768 | $ | 56,072 | $ | 76,872 | $ | 78,814 | $ | 82,630 | ||||||||||
|
Cash flows used in investing activities
|
$ | (6,738 | ) | $ | (278 | ) | $ | (26,496 | ) | $ | (8,548 | ) | $ | (5,369 | ) | |||||
|
Cash flows used in financing activities
|
$ | (72,028 | ) | $ | (54,808 | ) | $ | (74,067 | ) | $ | (80,360 | ) | $ | (74,917 | ) | |||||
-23-
|
December 31,
|
||||||||||||||||||||
| 2010 | 2009 | 2008 | 2007 | 2006 | ||||||||||||||||
|
(dollars in thousands)
|
||||||||||||||||||||
|
BALANCE SHEET INFORMATION:
|
||||||||||||||||||||
|
Net investments in properties
|
$ | 894,980 | $ | 919,647 | $ | 943,579 | $ | 922,117 | $ | 898,889 | ||||||||||
|
Total assets
|
$ | 968,284 | $ | 986,389 | $ | 1,034,285 | $ | 1,053,885 | $ | 1,027,487 | ||||||||||
|
Mortgage notes payable
|
$ | 345,770 | $ | 318,818 | $ | 330,908 | $ | 337,520 | $ | 348,101 | ||||||||||
|
Mortgage note payable – related parties
|
$ | 7,721 | $ | 8,261 | $ | 8,761 | $ | 9,224 | $ | 9,654 | ||||||||||
|
Note payable – related parties
|
- | $ | 9,325 | - | - | - | ||||||||||||||
|
Revolving line of credit
|
- | $ | 14,466 | $ | 13,079 | - | - | |||||||||||||
|
Total liabilities
|
$ | 398,313 | $ | 389,260 | $ | 402,382 | $ | 388,581 | $ | 397,327 | ||||||||||
|
Stockholders’ equity attributable to Mission West Properties, Inc.
|
$ | 142,070 | $ | 144,844 | $ | 134,418 | $ | 138,678 | $ | 128,878 | ||||||||||
|
Noncontrolling interests in operating partnerships
|
$ | 427,901 | $ | 452,285 | $ | 497,485 | $ | 526,626 | $ | 501,282 | ||||||||||
|
Common stock outstanding
|
22,135,770 | 21,870,211 | 19,748,211 | 19,664,087 | 19,443,587 | |||||||||||||||
|
O.P. Units issued and outstanding
|
83,150,265 | 83,404,965 | 85,526,965 | 85,533,935 | 85,206,199 | |||||||||||||||
|
(1)
|
Certain reclassifications have been made to prior period amounts in order to conform to current period presentation.
|
|
(2)
|
The operating results of real estate held for sale and sold are reported as discontinued operations for all years presented. Additionally, all gains and losses on the sale of assets classified as held for sale are included in discontinued operations.
|
|
(3)
|
As of December 31, 2010, 2009, 2008, 2007 and 2006, total properties include a property at 245 Caspian in Sunnyvale with no building. In 2001, we paid the Berg Group approximately $7.5 million for their commitment to complete an approximate 75,000 to 90,000 square foot building on the property.
|
|
(4)
|
Average monthly rental income per square foot has been determined by taking the total cash base rent for the period divided by the number of months in the period, and then divided by the average occupied square feet in the period.
|
|
(5)
|
Funds from Operations (“FFO”) is a non-GAAP financial term used by REITs to measure and compare operating performance. As defined by the National Association of Real Estate Investment Trusts (“NAREIT”), FFO represents net income (loss) (computed in accordance with GAAP), including non-recurring events other than “extraordinary items” under GAAP and excluding gains and losses from sales of discontinued operations or depreciable operating properties, plus real estate related depreciation and amortization (excluding amortization of deferred financing costs and depreciation of non-real estate assets) and after adjustments for unconsolidated partnerships and joint ventures. FFO does include impairment losses for properties held for sale and held for use. Additionally, our 2010, 2009, 2008, 2007 and 2006 FFO calculation includes our portion of the depreciation and amortization of real estate from our unconsolidated joint venture, but excludes the above-market lease intangible asset, which was recorded as a reduction of revenues. Management considers FFO to be an appropriate supplemental measure of our operating and financial performance because when compared year over year, it reflects the impact to operations from trends in occupancy rates, rental rates, operating costs, general and administrative expenses and interest costs, providing a perspective not immediately apparent from net income. In addition, management believes that FFO provides useful information about our financial performance when compared to other REITs because FFO is generally recognized as the industry standard for reporting the operations of REITs. FFO should neither be considered as an alternative for neither net income as a measure of profitability nor is it comparable to cash flows provided by operating activities determined in accordance with GAAP. FFO is not comparable to similarly entitled items reported by other REITs that do not define them exactly as we define FFO.
|
|
(6)
|
Considering the potential effect of all O.P. Units being exchanged for shares of our common stock.
|
Our definition of FFO also assumes conversion at the beginning of the period of all convertible securities, including O.P. Units that may be exchanged for shares of common stock. Our FFO does not represent the amount available for management’s discretionary use; as such funds may be needed for capital replacement or expansion, debt service obligations or other commitments and uncertainties. Furthermore, FFO is not comparable to similarly entitled items reported by other REITs that do not define FFO exactly as we do.
A reconciliation of net income to FFO for the years ended December 31, 2010, 2009, 2008, 2007 and 2006 follows:
|
Year Ended December 31,
|
||||||||||||||||||||
|
|
2010
|
2009
|
2008
|
2007
|
2006
|
|||||||||||||||
|
(dollars in thousands, except per share data)
|
||||||||||||||||||||
|
Net income
|
$ | 36,495 | $ | 34,449 | $ | 50,340 | $ | 95,848 | $ | 80,988 | ||||||||||
|
Add:
|
||||||||||||||||||||
|
Depreciation and amortization (1)
|
26,078 | 26,425 | 25,833 | 26,050 | 24,636 | |||||||||||||||
|
Less:
|
||||||||||||||||||||
|
Gain on sales of assets or joint venture assets
|
(6,199 | ) | - | (20,471 | ) | (6,529 | ) | (18,540 | ) | |||||||||||
|
Noncontrolling interests in joint ventures
|
(356 | ) | (407 | ) | (368 | ) | (502 | ) | (499 | ) | ||||||||||
|
FFO
|
$ | 56,018 | $ | 60,467 | $ | 55,334 | $ | 114,867 | $ | 86,585 | ||||||||||
|
Weighted average common shares and O.P. Units - diluted
|
105,432,088 | 105,461,581 | 105,524,677 | 105,016,651 | 104,809,155 | |||||||||||||||
|
FFO per common share and O.P. Unit - diluted
|
$ | 0.53 | $ | 0.57 | $ | 0.52 | $ | 1.09 | $ | 0.83 | ||||||||||
|
(1)
|
Also includes our portion of depreciation and amortization of real estate from our unconsolidated joint venture totaling approximately $238, $238, $900, $757 and $849 in 2010, 2009, 2008, 2007 and 2006, respectively, amortization of leasing commissions totaling approximately $2,090, $2,077, $1,709, $2,558 and $1,513 in 2010, 2009, 2008, 2007 and 2006, respectively, and depreciation from discontinued operations totaling approximately $285, $324, $329, $474 and $1,021 in 2010, 2009, 2008, 2007 and 2006 respecitively. Amortization of leasing commissions is included in the property operating, maintenance and real estate taxes line item in our consolidated statements of operations. (dollars in thousands)
|
-24-
Item 7. Management’s Discussion and Analysis of Financial Condition and Results of Operations
The following discussion includes forward-looking statements, including, but not limited to, statements with respect to the future financial performance, operating results, plans and objectives of Mission West Properties, Inc. Actual results may differ materially from those currently anticipated depending upon a variety of factors, including those described in Part I – Item 1A, Risk Factors.
Overview and Background
Our original predecessor was formed in 1969 as Palomar Mortgage Investors, a California business trust, which operated as a mortgage REIT until 1979 when, under the name of Mission Investment Trust, it terminated its status as a REIT and began to develop and market its own properties. In 1982, Mission West Properties was incorporated as a successor to Mission Investment Trust. In 1997, our predecessor, Mission West Properties, sold all of its real estate assets and paid a special dividend to stockholders, after which it retained only nominal assets. Subsequently, the Berg Group acquired control of the corporation as a vehicle to acquire R&D properties, or interests in entities owning such properties, in a transaction completed on September 2, 1997. At that time the Berg Group and other investors acquired an aggregate 79.6% controlling ownership position. In May 1998, we, the Berg Group members, an independent limited partner, and certain other persons entered into an acquisition agreement providing, among other things, for our acquisition of interests as the sole general partner in the operating partnerships. At the time, the operating partnerships held approximately 4.34 million rentable square feet of R&D property located in Silicon Valley. The agreement also provided for the parties to enter into the pending projects acquisition agreement, the Berg land holdings option agreement and the exchange rights agreement, following stockholder approval. Effective July 1, 1998, we consummated our acquisition of the general partner interests in the operating partnerships through the purchase of the general partner interests, and all limited partnership interests in the operating partnerships were converted into 59,479,633 O.P. Units, which represented ownership of approximately 87.89% of the operating partnerships. Our general partner interests represented the balance of the ownership of the operating partnerships. At December 31, 2010, we owned a 20.84% general partner interest in the operating partnerships, taken as a whole, on a weighted average basis.
Since the beginning of calendar year 1999, we have been taxed as a qualified REIT.
Our reincorporation under the laws of the State of Maryland through the merger of Mission West Properties into Mission West Properties, Inc. occurred on December 30, 1998, at which time all outstanding shares issued by our predecessor California corporation were converted into shares of our common stock on a one-for-one basis.
In July 1999, we completed a public offering of 8,680,000 shares of our common stock at $8.25 per share. The net proceeds of approximately $66.9 million, after deducting underwriting discounts and other offering costs, were used primarily to repay indebtedness.
We have grown through property acquisitions. Since September 1998, we have acquired a total of approximately 7.18 million rentable square feet of R&D buildings and vacant land under our agreements with the Berg Group and from unrelated third parties. The total cost of these properties was approximately $743.2 million. To acquire these properties, we paid cash or exchanged existing properties, issued a total of 28,510,261 O.P. Units and assumed debt totaling approximately $331.3 million.
Since 1998, we have sold a total of approximately 1.09 million rentable square feet of R&D buildings. The total sales price of these properties was approximately $158.4 million.
Almost all of our earnings and cash flow is derived from rental income received pursuant to leased R&D space at our properties. Key factors that affect our business and financial results include the following:
|
·
|
the current turmoil in the credit markets;
|
|
·
|
economic conditions generally and the real estate market specifically;
|
|
·
|
the occupancy rates of the properties;
|
|
·
|
rental rates on new and renewed leases;
|
|
·
|
tenant improvement and leasing costs incurred to obtain and retain tenants;
|
|
·
|
operating expenses;
|
|
·
|
cost and availability of capital;
|
|
·
|
interest rates;
|
|
·
|
the extent of acquisitions and sales of real estate;
|
|
·
|
legislative or regulatory provisions (including changes to laws governing the taxation of REITs);
|
|
·
|
competition;
|
|
·
|
supply of and demand for R&D, office and industrial properties in our current and proposed market areas;
|
|
·
|
tenant defaults and bankruptcies;
|
|
·
|
lease term expirations and renewals;
|
|
·
|
changes in general accounting principles, policies and guidelines applicable to REITs;
|
|
·
|
and ability to timely refinance maturing debt obligations and the terms of any such refinancing.
|
-25-
Negative effects from any of these factors could cause deterioration in our operating results, cash flows and financial condition.
Critical Accounting Policies and Estimates
We prepare our consolidated financial statements in conformity with accounting principles generally accepted in the United States of America (“GAAP”), which requires us to make certain estimates, judgments and assumptions that affect the reported amounts in the accompanying consolidated financial statements, disclosure of contingent assets and liabilities and related footnotes. Accounting and disclosure decisions with respect to material transactions that are subject to significant management judgments or estimates include impairment of long lived assets, deferred rent, and allocation of purchase price relating to property acquisitions and the related depreciable lives assigned. Actual results may differ from these estimates under different assumptions or conditions.
Critical accounting policies are defined as those that require management to make estimates, judgments and assumptions, giving due consideration to materiality, in certain circumstances that affect amounts reported in the consolidated financial statements, and potentially result in materially different results under different conditions and assumptions. We believe that the following best describe our critical accounting policies:
Real Estate Assets
Real estate assets are stated at cost. Cost includes expenditures for improvements or replacements. Maintenance and repairs are charged to expense as incurred. Gains and losses from sales are included in income. The gain on the sale is only recognized proportionately as the seller receives payments from the purchaser. Interest income is recognized on an accrual basis, when appropriate.
Business Combinations
Acquisitions of properties are based on an allocation of the acquisition cost to land, building, tenant improvements, and intangibles for at market and above and below market in place leases, and the determination of their useful lives are guided by the accounting provisions for business combinations and management’s estimates. Amortization of above and below market lease intangible asset is offset against rental income in the revenue section while amortization of in-place lease value intangible asset is included in depreciation and amortization of real estate in the expense section of our consolidated statements of operations. If we do not appropriately allocate these components or we incorrectly estimate the useful lives of these components, our computation of depreciation and amortization expense may not appropriately reflect the actual impact of these costs over future periods, which will affect net income.
Impairment of Long-Lived Assets
We review real estate assets for impairment whenever events or changes in circumstances indicate that the carrying amount of an asset may not be recoverable. If the carrying amount of the asset exceeds its estimated undiscounted net cash flow, before interest, we will recognize an impairment loss equal to the difference between its carrying amount and its estimated fair value. If impairment is recognized, the reduced carrying amount of the asset will be accounted for as its new cost. For a depreciable asset, the new cost will be depreciated over the asset’s remaining useful life. Generally, fair values are estimated using discounted cash flow, replacement cost or market comparison analyses. The process of evaluating for impairment requires estimates as to future events and conditions, which are subject to varying market factors, such as the vacancy rates, future rental rates and operating costs for R&D facilities in the Silicon Valley area and related submarkets. The analysis that we prepare in connection with determining if there may be any asset impairment loss considers several assumptions: holding period of ten years, 36 months lease up period and cap rate ranging from 8% to 9%. Therefore, it is reasonably possible that a change in these estimates resulting from judgments as to future events could occur which would affect the recorded amounts of the property and increase our operating expense.
Allowance for Deferred Rent and Doubtful Accounts
The preparation of the consolidated financial statements requires us to make estimates and assumptions. As such, we must make estimates of the uncollectability of our accounts receivable based on the evaluation of our tenants’ financial position, analyses of accounts receivable and current economic trends. We also make estimates for a straight-line deferred rent provision for existing tenants with the potential of early termination, bankruptcy or ceasing operations. Our estimates are based on our review of tenants’ payment histories, the remaining lease term, whether or not the tenant is currently occupying our building, publicly available financial information and such additional information about their financial condition as tenants provide to us. The information available to us might lead us to overstate or understate these provision amounts. The use of different estimates or assumptions could produce different results. Moreover, actual future collections of accounts receivable or reductions in future reported rental income due to tenant bankruptcies or other business failures could differ materially from our estimates.
-26-
Consolidation of Joint Ventures
We hold interests in consolidated joint ventures. We consolidate joint ventures when we exhibit financial or operational control. Control is determined using accounting standards related to the consolidation of joint ventures. We, through an operating partnership, own three properties that are in joint ventures of which we have controlling interests. We manage and operate all three properties. The recognition of these properties and their operating results are 100% reflected on our consolidated financial statements, with appropriate allocation to noncontrolling interests, because we have operational and financial control of the investments. We make judgments and assumptions about the estimated monthly payments made to our noncontrolling interest joint venture partners, which are reported with our periodic results of operations. Actual results may differ from these estimates under different assumptions or conditions.
Investment in Unconsolidated Joint Venture
We hold interests in one unconsolidated joint venture. Control is determined using accounting standards related to the consolidation of variable interest entities. For joint ventures that are defined as variable interest entities, the primary beneficiary consolidates the entity. In instances where we are not the primary beneficiary, we do not consolidate the joint venture for financial purposes. We, through an operating partnership, have a 50% non-controlling limited partnership interest in one unconsolidated joint venture. This investment is not consolidated because we do not exercise significant control over major operating and financial decisions. We account for the joint venture using the equity method of accounting.
Under the equity method, investments in unconsolidated joint ventures are initially recognized in the balance sheet at cost and are subsequently adjusted to reflect our proportionate share of net earnings or losses of the joint venture, distributions received, contributions and certain other adjustments, as appropriate.
Consolidation of Variable Interest Entities
We consolidate all variable interest entities (“VIE”) in which we are deemed to be the primary beneficiary. As of December 31, 2010, we consolidated one VIE in the accompanying consolidated financial statements in connection with an assignment of a lease agreement with an unrelated party, M&M Real Estate Control & Restructuring, LLC (see Item 8, “Financial Statements and Supplementary Data – Note 7” for further discussion of this transaction).
Revenue Recognition
Rental income is recognized on the straight-line method of accounting required by GAAP under which contractual rent payment increases are recognized evenly over the lease term, regardless of when the rent payments are received by us. The difference between recognized rental income and rental cash receipts is recorded as “Deferred rent” on the consolidated balance sheets.
Rental income is affected if existing tenants terminate or amend their leases. We try to identify tenants who may be likely to declare bankruptcy, cease operations or are likely to seek a negotiated settlement of their obligation. By anticipating these events in advance, we expect to take steps to minimize their impact on our reported results of operations through lease renegotiations, provisions against deferred rent, and other appropriate measures. Our judgments and estimations about tenants’ capacity to continue to meet their lease obligations will affect the rental income recognized. Material differences may result in the amount and timing of our rental income for any period if we made different judgments or estimations.
Lease termination fees are recognized as other income when there is a signed termination letter agreement, all of the conditions of the agreement have been met, and when the tenant no longer has the right to occupy the property. These fees are paid by tenants who want to terminate their lease obligations before the end of the contractual term of the lease by agreement with us. We cannot predict or forecast the timing or amounts of future lease termination fees.
We recognize income from rent, tenant reimbursements and lease termination fees and other income once all of the following criteria are met:
|
·
|
the agreement has been fully executed and delivered;
|
|
·
|
services have been rendered;
|
|
·
|
the amount is fixed and determinable; and
|
|
·
|
collectability is reasonably assured.
|
With regard to critical accounting policies, where applicable, we have explained and discussed the criteria for identification and selection, methodology in application and impact on the financial statements with the Audit Committee of our board of directors, which has reviewed these policies.
-27-
Results of Operations
Comparison of the year ended December 31, 2010 to the year ended December 31, 2009
Rental Income
As of December 31, 2010 and 2009, through our controlling interests in the operating partnerships, we owned 111 R&D properties totaling approximately 8.0 million rentable square feet. We acquired one R&D property in 2010.
The following table depicts the amounts of rental income from operations for the years ended December 31, 2010 and 2009 represented by our historical properties and the percentage of the total decrease in rental income over the period that is represented by each group of properties.
|
Year Ended December 31,
|
||||||||||||||||
|
2010
|
2009
|
$ Change
|
% Change
|
|||||||||||||
|
(dollars in thousands)
|
||||||||||||||||
|
Same Property (1)
|
$ | 81,530 | $ | 82,466 | $ | (936 | ) | (1.1 | %) | |||||||
|
2010 Acquisition (2)
|
185 | - | 185 | 100.0 | % | |||||||||||
|
Total
|
$ | 81,715 | $ | 82,466 | $ | (751 | ) | (0.9 | %) | |||||||
|
(1)
|
“Same Property” is defined as properties owned by us prior to 2009 that we still owned as of December 31, 2010.
|
|
(2)
|
Operating rental income for 2010 acquisition does not reflect a full 12 months of operations in 2010 because the property was acquired during the year.
|
For the year ended December 31, 2010, our rental income decreased by approximately ($0.8) million, or (0.9%). The ($0.8) million decrease in rental income resulted from two lease terminations during the year ended December 31, 2010. In 2010, we offset approximately ($1.2) million in deferred rent against rental income due to lease terminations and lease modifications.
Our overall occupancy rate for leased properties at December 31, 2010 and 2009 was approximately 69.9% and 65.5%, respectively. According to the CT Report, the leased occupancy rate for R&D property in the Silicon Valley at December 31, 2010 was approximately 81.3%. Due to an over-supply of R&D properties, Silicon Valley landlords are bidding competitively for tenants and consequently, our occupancy rate may drop further in 2011 if we cannot renew or re-lease the approximately 641,000 rentable square feet scheduled to expire this year. The primary factors that have contributed to our low occupancy rate for several consecutive years have been the general downturn in the Silicon Valley’s economy, the softening of the R&D property market specifically, and the weaker relative performance of certain of our properties due to their location and the weak demand in those submarkets.
Other Income
The following table depicts the amounts of other income, including lease terminations and settlements, from operations for the years ended December 31, 2010 and 2009.
|
Year Ended December 31,
|
||||||||||||||||
|
2010
|
2009
|
$ Change
|
% Change
|
|||||||||||||
|
(dollars in thousands)
|
||||||||||||||||
|
Other income
|
$ | 2,619 | $ | 3,756 | $ | (1,137 | ) | (30.3 | %) | |||||||
Other income of approximately $2.6 million for the year ended December 31, 2010 included approximately $1.3 million of litigation proceeds, $1.0 million of management fees, $0.1 million of bankruptcy settlement and $0.2 million of miscellaneous income. Other income of approximately $3.8 million for the year ended December 31, 2009 included approximately $2.0 million from the forfeiture of a purchase deposit under a contract for the sale of our McCandless properties, $1.0 million of management fees, $0.3 million from insurance claims, $0.1 million from a lease settlement and $0.4 million of miscellaneous income. Management fees are paid by tenants for our administration and supervision of the property. We do not consider termination fees and tenant bankruptcy settlements to be recurring items.
-28-
Operating Expenses
The following table reflects the amounts of property operating and maintenance expenses and real estate taxes (“operating expenses”) from operations for the years ended December 31, 2010 and 2009 and the percentage of total decrease in expenses over the period that is represented by each group of properties.
|
Year Ended December 31,
|
||||||||||||||||
|
2010
|
2009
|
$ Change
|
% Change
|
|||||||||||||
|
(dollars in thousands)
|
||||||||||||||||
|
Same Property (1)
|
$ | 26,316 | $ | 27,532 | $ | (1,216 | ) | (4.4 | %) | |||||||
|
2010 Acquisition (2)
|
84 | - | 84 | 100.0 | % | |||||||||||
|
Total
|
$ | 26,400 | $ | 27,532 | $ | (1,132 | ) | (4.1 | %) | |||||||
|
(1)
|
“Same Property” is defined as properties owned by us prior to 2009 that we still owned as of December 31, 2010.
|
|
(2)
|
Operating expenses for 2010 acquisition do not reflect a full 12 months of operations in 2010 because the property was acquired during the year.
|
Operating expenses decreased by approximately ($1.1) million, or (4.1%), from $27.5 million for the year ended December 31, 2009 to $26.4 million for the year ended December 31, 2010 primarily due to lower real estate taxes and repair and maintenance costs. Tenant reimbursements decreased by approximately ($3.6) million, or (19.1%), from $18.7 million for the year ended December 31, 2009 to $15.1 million for the year ended December 31, 2010. The decrease in tenant reimbursements resulted primarily from refunds to tenants related to a decrease in operating expenses. Total operating expenses exceeded tenant reimbursements because of vacancies, since certain operating expenses such as property insurance, real estate taxes, and other fixed expenses are not recoverable from vacant properties. At December 31, 2010 our vacancy rate was approximately 30.1%.
The following table depicts the amounts of general and administrative expenses from operations for the years ended December 31, 2010 and 2009.
|
Year Ended December 31,
|
||||||||||||||||
|
2010
|
2009
|
$ Change
|
% Change
|
|||||||||||||
|
(dollars in thousands)
|
||||||||||||||||
|
General and administrative
|
$ | 2,219 | $ | 2,336 | $ | (117 | ) | (5.0 | %) | |||||||
General and administrative expenses decreased by approximately ($0.1) million, or (5.0%), from $2.3 million for the year ended December 31, 2009 to $2.2 million for the year ended December 31, 2010. The decrease in general and administrative expenses was primarily a result of lower stock-based compensation expense in 2010.
The following table depicts the amounts of depreciation and amortization expense from operations for the years ended December 31, 2010 and 2009.
|
Year Ended December 31,
|
||||||||||||||||
|
2010
|
2009
|
$ Change
|
% Change
|
|||||||||||||
|
(dollars in thousands)
|
||||||||||||||||
|
Depreciation and amortization
|
$ | 23,466 | $ | 23,786 | $ | (320 | ) | (1.3 | %) | |||||||
Depreciation and amortization expense decreased by approximately ($0.3) million, or (1.3%), primarily due to the write-off of tenant improvements in connection with a lease termination in 2009 with no comparable activity in 2010.
Other Income and Expenses
The following table depicts the amounts of equity in earnings of unconsolidated joint venture from operations for the years ended December 31, 2010 and 2009.
|
Year Ended December 31,
|
||||||||||||||||
|
2010
|
2009
|
$ Change
|
% Change
|
|||||||||||||
|
(dollars in thousands)
|
||||||||||||||||
|
Equity in earnings of unconsolidated joint venture
|
$ | 303 | $ | 309 | $ | (6 | ) | (1.9 | %) | |||||||
As of December 31, 2010, we had investments in one R&D building, totaling approximately 155,500 rentable square feet in Morgan Hill, California, through an unconsolidated joint venture with TBI, in which we acquired a 50% interest from the Berg Group in January 2003. We have a non-controlling limited partnership interest in this joint venture, which we account for using the equity method of accounting. For both years ended December 31, 2010 and 2009, equity in earnings from the unconsolidated joint venture was approximately $0.3 million. The occupancy rate for the property owned by this joint venture at December 31, 2010 and 2009 was 100%.
-29-
The following table depicts the amounts of interest and dividend income from operations for the years ended December 31, 2010 and 2009.
|
Year Ended December 31,
|
||||||||||||||||
|
2010
|
2009
|
$ Change
|
% Change
|
|||||||||||||
|
(dollars in thousands)
|
||||||||||||||||
|
Interest and dividend income
|
$ | 102 | $ | 1,309 | $ | (1,207 | ) | (92.2 | %) | |||||||
Interest and dividend income decreased by approximately ($1.2) million, or (92.2%), from $1.3 million for the year ended December 31, 2009 to $0.1 million for the year ended December 31, 2010. The decrease in interest and dividend income resulted primarily from the accrual of approximately $1.0 million in interest related to the RPC litigation in 2009 based on a court judgment, (see Item 3. Legal Proceedings), with no comparable activity in 2010.
|
Year Ended December 31,
|
||||||||||||||||
|
2010
|
2009
|
$ Change
|
% Change
|
|||||||||||||
|
(dollars in thousands)
|
||||||||||||||||
|
Realized gain from investment
|
$ | 4,067 | - | $ | 4,067 | 100.0 | % | |||||||||
|
Unrealized gain from investment
|
- | $ | 5,011 | $ | (5,011 | ) | (100.0 | %) | ||||||||
In 2010, we recorded a net realized gain from investment in marketable securities of approximately $4.1 million. In 2009, we recorded unrealized gain from investment in marketable securities of approximately $5.0 million. As of December 31, 2009, the fair value of the investment totaled approximately $12.1 million and our cost was approximately $6.6 million.
The following table depicts the amounts of interest expense from operations for the years ended December 31, 2010 and 2009.
|
Year Ended December 31,
|
||||||||||||||||
|
2010
|
2009
|
$ Change
|
% Change
|
|||||||||||||
|
(dollars in thousands)
|
||||||||||||||||
|
Interest
|
$ | 20,069 | $ | 22,117 | $ | (2,048 | ) | (9.3 | %) | |||||||
|
Interest (related parties)
|
988 | 765 | 223 | 29.2 | % | |||||||||||
|
Total
|
$ | 21,057 | $ | 22,882 | $ | (1,825 | ) | (8.0 | %) | |||||||
Interest expense decreased by approximately ($2.0) million, or (9.3%), from $22.1 million for the year ended December 31, 2009 to $20.1 million for the year ended December 31, 2010. Interest expense decreased in 2010 primarily because in 2009 we accrued approximately $2.4 million of interest expense for the RPC litigation and we accrued less in 2010. Interest expense (related parties) increased by approximately $0.2 million, or 29.2%, from $0.8 million for the year ended December 31, 2009 to $1.0 million for the year ended December 31, 2010. The increase in interest expense (related parties) was due to increased related party borrowings in 2010 compared to 2009.
Income (loss) from Discontinued Operations
The following table depicts the amounts of income (loss) from discontinued operations for the years ended December 31, 2010 and 2009.
|
Year Ended December 31,
|
||||||||
|
2010
|
2009
|
|||||||
|
(dollars in thousands)
|
||||||||
|
Net gain on disposal of discontinued operations
|
$ | 6,199 | - | |||||
|
Net loss attributable to discontinued operations
|
(462 | ) | $ | (534 | ) | |||
|
Income (loss) from discontinued operations
|
$ | 5,737 | $ | (534 | ) | |||
In 2010, we sold one R&D property and classified one R&D property as assets held for sale and in accordance with the provisions of Accounting Standards Codification (“ASC”) Topic 360 “Property, Plant, and Equipment,” classified the net gain on sale and operating results of the disposed property and assets held for sale as discontinued operations. Prior period results of operations for these properties were retrospectively adjusted and presented as discontinued operations in prior consolidated statements of operations.
We recognized total income (loss) from discontinued operations of approximately $5.7 million and ($0.5) million for the years ended December 31, 2010 and 2009, respectively.
-30-
Net Income to Common Stockholders and Net Income to Noncontrolling Interests
The following table depicts the amounts of earnings attributable to common stockholders and noncontrolling interests for the years ended December 31, 2010 and 2009.
|
Year Ended December 31,
|
||||||||||||||||
|
2010
|
2009
|
$ Change
|
% Change
|
|||||||||||||
|
(dollars in thousands)
|
||||||||||||||||
|
Net income available to common stockholders
|
$ | 8,473 | $ | 8,391 | $ | 82 | 1.0 | % | ||||||||
|
Net income attributable to noncontrolling interests
|
28,022 | 26,058 | 1,964 | 7.5 | % | |||||||||||
|
Total net income
|
$ | 36,495 | $ | 34,449 | $ | 2,046 | 5.9 | % | ||||||||
As of December 31, 2010 and 2009, we owned a controlling general partner interest of 24.83%, 21.86%, 16.32% and 12.53% and 24.31%, 21.85%, 16.31% and 12.52% in the four operating partnerships, Mission West Properties, L.P., Mission West Properties, L.P. I, Mission West Properties, L.P. II and Mission West Properties, L.P. III, respectively. We owned a 20.84% and 20.65% general partner interest in the operating partnerships, taken as a whole, on a consolidated weighted average basis as of December 31, 2010 and 2009, respectively. Net income available to common stockholders in 2010 increased by approximately $0.08 million, or 1.0%, from 2009. Net income attributable to noncontrolling interests in 2010 increased by approximately $2.0 million, or 7.5%, from 2009. The increase in net income attributable to common stockholders and noncontrolling interests primarily resulted from the gain on sale of one R&D property in 2010.
Noncontrolling interests represent the limited partners’ ownership interest of 79.16% and 79.35% in the operating partnerships, on a weighted average basis, as of December 31, 2010 and 2009, respectively.
Comparison of the year ended December 31, 2009 to the year ended December 31, 2008
Rental Income
As of December 31, 2009 and 2008, through our controlling interests in the operating partnerships, we owned 111 R&D properties totaling approximately 8.0 million rentable square feet. We did not acquire any new properties in 2009.
The following table depicts the amounts of rental income from operations for the years ended December 31, 2009 and 2008 represented by our historical properties and the percentage of the total increase in rental income over the period that is represented by each group of properties.
|
Year Ended December 31,
|
||||||||||||||||
|
2009
|
2008
|
$ Change
|
% Change
|
|||||||||||||
|
(dollars in thousands)
|
||||||||||||||||
|
Same Property (1)
|
$ | 81,155 | $ | 77,834 | $ | 3,321 | 4.3 | % | ||||||||
|
2008 Acquisitions (2)
|
1,311 | 1,093 | 218 | 19.9 | % | |||||||||||
|
Total
|
$ | 82,466 | $ | 78,927 | $ | 3,539 | 4.5 | % | ||||||||
|
(1)
|
“Same Property” is defined as properties owned by us prior to 2008 that we still owned as of December 31, 2009.
|
|
(2)
|
Operating rental income for 2008 acquisitions does not reflect a full 12 months of operations in 2008 because these properties were acquired at various times during the year.
|
For the year ended December 31, 2009, our rental income increased by approximately $3.5 million, or 4.5%. The $3.5 million increase in rental income resulted from new lease agreements entered into during the year ended December 31, 2009, as well as full year rental income from leases entered during the year ended December 31, 2008. In 2009, we offset approximately ($0.3) million in deferred rent against rental income due to lease terminations and lease modifications.
Our overall occupancy rate for leased properties at December 31, 2009 and 2008 was approximately 65.5% and 66.4%, respectively. According to the CT Report, the leased occupancy rate for R&D property in the Silicon Valley at December 31, 2009 was approximately 80.7%. The primary factors that have contributed to our low occupancy rate for several consecutive years have been the general downturn in the Silicon Valley’s economy, the softening of the R&D property market specifically, and the weaker relative performance of certain of our properties due to their location and the weak demand in those submarkets.
Other Income
The following table depicts the amounts of other income, including lease terminations and settlements, from operations for the years ended December 31, 2009 and 2008.
|
Year Ended December 31,
|
||||||||||||||||
|
2009
|
2008
|
$ Change
|
% Change
|
|||||||||||||
|
(dollars in thousands)
|
||||||||||||||||
|
Other income
|
$ | 3,756 | $ | 4,220 | $ | (464 | ) | (11.0 | %) | |||||||
-31-
Other income of approximately $3.8 million for the year ended December 31, 2009 included approximately $2.0 million from the forfeiture of a purchase deposit under a contract for the sale of our McCandless properties, $1.0 million of management fees, $0.3 million of insurance claims, $0.1 million from a lease settlement and $0.4 million of miscellaneous income. Other income of approximately $4.2 million for the year ended December 31, 2008 included approximately $3.0 million of lease termination fees, $1.0 million of management fees and $0.2 million of miscellaneous income. Management fees are paid by tenants for our administration and supervision of the property. We do not consider termination fees and tenant bankruptcy settlements to be recurring items.
Operating Expenses
The following table reflects the amounts of property operating and maintenance expenses and real estate taxes (“operating expenses”) from operations for the years ended December 31, 2009 and 2008 and the percentage of total increase in expenses over the period that is represented by each group of properties.
|
Year Ended December 31,
|
||||||||||||||||
|
2009
|
2008
|
$ Change
|
% Change
|
|||||||||||||
|
(dollars in thousands)
|
||||||||||||||||
|
Same Property (1)
|
$ | 27,232 | $ | 22,965 | $ | 4,267 | 18.6 | % | ||||||||
|
2008 Acquisitions (2)
|
300 | 175 | 125 | 71.4 | % | |||||||||||
|
Total
|
$ | 27,532 | $ | 23,140 | $ | 4,392 | 19.0 | % | ||||||||
|
(1)
|
“Same Property” is defined as properties owned by us prior to 2008 that we still owned as of December 31, 2009.
|
|
(2)
|
Operating expenses for 2008 acquisitions do not reflect a full 12 months of operations in 2008 because these properties were acquired at various times during the year.
|
Operating expenses increased by approximately $4.4 million, or 19.0%, from $23.1 million for the year ended December 31, 2008 to $27.5 million for the year ended December 31, 2009 primarily due to higher real estate taxes and repair and maintenance costs. Tenant reimbursements increased by approximately $2.4 million, or 14.6%, from $16.3 million for the year ended December 31, 2008 to $18.7 million for the year ended December 31, 2009. The increase in tenant reimbursements resulted primarily from the increase in operating expenses. Total operating expenses exceeded tenant reimbursements because of vacancies, since certain operating expenses such as property insurance, real estate taxes, and other fixed expenses are not recoverable from vacant properties. At December 31, 2009 our vacancy rate was approximately 34.5%.
The following table depicts the amounts of general and administrative expenses from operations for the years ended December 31, 2009 and 2008.
|
Year Ended December 31,
|
||||||||||||||||
|
2009
|
2008
|
$ Change
|
% Change
|
|||||||||||||
|
(dollars in thousands)
|
||||||||||||||||
|
General and administrative
|
$ | 2,336 | $ | 2,635 | $ | (299 | ) | (11.3 | %) | |||||||
General and administrative expenses decreased by approximately ($0.3) million, or (11.3%), from $2.6 million for the year ended December 31, 2008 to $2.3 million for the year ended December 31, 2009. The decrease in general and administrative expenses was primarily a result of lower stock-based compensation expense and legal fees in 2009.
The following table depicts the amounts of depreciation and amortization expense from operations for the years ended December 31, 2009 and 2008.
|
Year Ended December 31,
|
||||||||||||||||
|
2009
|
2008
|
$ Change
|
% Change
|
|||||||||||||
|
(dollars in thousands)
|
||||||||||||||||
|
Depreciation and amortization
|
$ | 23,786 | $ | 22,895 | $ | 891 | 3.9 | % | ||||||||
Depreciation and amortization expense increased by approximately $0.9 million, or 3.9%, primarily due to construction of new tenant improvements and the write-off of tenant improvements in connection with a lease termination.
Other Income and Expenses
The following table depicts the amounts of equity in earnings of unconsolidated joint venture from operations for the years ended December 31, 2009 and 2008.
|
Year Ended December 31,
|
||||||||||||||||
|
2009
|
2008
|
$ Change
|
% Change
|
|||||||||||||
|
(dollars in thousands)
|
||||||||||||||||
|
Equity in earnings of unconsolidated joint venture
|
$ | 309 | $ | 19,617 | $ | (19,308 | ) | (98.4 | %) | |||||||
-32-
As of December 31, 2009, we had investments in one R&D building, totaling approximately 155,500 rentable square feet in Morgan Hill, California, through an unconsolidated joint venture with TBI, in which we acquired a 50% interest from the Berg Group in January 2003. We have a non-controlling limited partnership interest in this joint venture, which we account for using the equity method of accounting. For the years ended December 31, 2009 and 2008, equity in earnings from the unconsolidated joint venture was approximately $0.3 million and $19.6 million, respectively. Our equity in earnings from this unconsolidated joint venture decreased primarily due to a gain from the sale of two R&D properties in 2008. The occupancy rate for the remaining property owned by this joint venture at December 31, 2009 and 2008 was 100%.
The following table depicts the amounts of interest and dividend income from operations for the years ended December 31, 2009 and 2008.
|
Year Ended December 31,
|
||||||||||||||||
|
2009
|
2008
|
$ Change
|
% Change
|
|||||||||||||
|
(dollars in thousands)
|
||||||||||||||||
|
Interest and dividend income
|
$ | 1,309 | $ | 1,735 | $ | (426 | ) | (24.6 | %) | |||||||
Interest and dividend income decreased by approximately ($0.4) million, or (24.6%), from $1.7 million for the year ended December 31, 2008 to $1.3 million for the year ended December 31, 2009. The decrease in interest and dividend income was primarily a result of lower cash balances and interest rates.
In 2009, we recorded an unrealized gain from investment in marketable securities of approximately $5.0 million. As of December 31, 2009, the fair value of the investment totaled approximately $12.1 million and our cost was approximately $6.6 million. In 2008, we recorded an unrealized loss from investment in marketable securities of approximately ($0.3) million. As of December 31, 2008, the fair value of the investment totaled approximately $3.3 million and our cost was approximately $3.6 million.
The following table depicts the amounts of interest expense from operations for the years ended December 31, 2009 and 2008.
|
Year Ended December 31,
|
||||||||||||||||
|
2009
|
2008
|
$ Change
|
% Change
|
|||||||||||||
|
(dollars in thousands)
|
||||||||||||||||
|
Interest
|
$ | 22,117 | $ | 19,787 | $ | 2,330 | 11.8 | % | ||||||||
|
Interest (related parties)
|
765 | 1,332 | (567 | ) | (42.6 | %) | ||||||||||
|
Total
|
$ | 22,882 | $ | 21,119 | $ | 1,763 | 8.3 | % | ||||||||
Interest expense increased by approximately $2.3 million, or 11.8%, primarily due to approximately $2.4 million related to the RPC litigation. Interest expense (related parties) decreased by approximately ($0.6) million, or (42.6%), due to lower interest rates in 2009.
Loss from Discontinued Operations
The following table depicts the amounts of loss from discontinued operations for the years ended December 31, 2009 and 2008.
|
Year Ended December 31,
|
||||||||
|
2009
|
2008
|
|||||||
|
(dollars in thousands)
|
||||||||
|
Net gain on disposal of discontinued operations
|
- | - | ||||||
|
Net loss attributable to discontinued operations
|
$ | (534 | ) | $ | (385 | ) | ||
|
Loss from discontinued operations
|
$ | (534 | ) | $ | (385 | ) | ||
In 2010, we sold one R&D property and classified one R&D property as assets held for sale and in accordance with the provisions of ASC Topic 360 “Property, Plant, and Equipment,” classified the net gain on sale and operating results of the disposed property and assets held for sale as discontinued operations. Prior period results of operations for these properties were retrospectively adjusted and presented as discontinued operations in prior consolidated statements of operations.
We recognized total loss from discontinued operations of approximately ($0.5) million and ($0.4) million for the years ended December 31, 2009 and 2008, respectively.
-33-
Net Income to Common Stockholders and Net Income to Noncontrolling Interests
The following table depicts the amounts of earnings attributable to common stockholders and noncontrolling interests for the years ended December 31, 2009 and 2008.
|
Year Ended December 31,
|
||||||||||||||||
|
2009
|
2008
|
$ Change
|
% Change
|
|||||||||||||
|
(dollars in thousands)
|
||||||||||||||||
|
Net income to common stockholders
|
$ | 8,391 | $ | 10,134 | $ | (1,743 | ) | (17.2 | %) | |||||||
|
Net income to noncontrolling interests
|
26,058 | 40,206 | (14,148 | ) | (35.2 | %) | ||||||||||
|
Total net income
|
$ | 34,449 | $ | 50,340 | $ | (15,891 | ) | (31.6 | %) | |||||||
As of December 31, 2009 and 2008, we owned a controlling general partner interest of 24.31%, 21.85%, 16.31% and 12.52% and 20.02%, 21.85%, 16.31% and 12.52% in the four operating partnerships, Mission West Properties, L.P., Mission West Properties, L.P. I, Mission West Properties, L.P. II and Mission West Properties, L.P. III, respectively. We owned a 20.65% and 18.73% general partner interest in the operating partnerships, taken as a whole, on a consolidated weighted average basis as of December 31, 2009 and 2008, respectively. Net income available to common stockholders in 2009 decreased by approximately ($1.7) million, or (17.2%), from 2008. Net income attributable to noncontrolling interests in 2009 decreased by approximately ($14.1) million, or (35.2%), from 2008. The decrease in net income attributable to common stockholders and noncontrolling interests resulted primarily because net income in 2008 reflected gain from the sale of two R&D properties in our unconsolidated joint venture, TBI-MWP.
Noncontrolling interests represent the limited partners’ ownership interest of 79.35% and 81.27% in the operating partnerships, on a weighted average basis, as of December 31, 2009 and 2008, respectively.
-34-
Changes in Financial Condition
Year Ended December 31, 2010
The most significant changes in our financial condition in 2010 resulted from the acquisition of one R&D property, the disposition of one R&D property, the exercise of stock options and the exchange of O.P. Units for shares of our common stock.
During 2010, we acquired one R&D property representing approximately 41,000 rentable square feet for a total gross purchase price of approximately $3.9 million. In addition to the property acquisition, we sold one R&D property consisting of approximately 78,000 rentable square feet for a total gross sale price of approximately $14.1 million. The proceeds were classified as restricted cash for use in tax-deferred property exchanges and were reflected on our consolidated balance sheet as restricted cash at December 31, 2010 (see Item 8, “Financial Statements and Supplementary Data – Note 6” for further discussion of this transaction).
Debt outstanding, including amounts due related parties, increased by approximately $2.6 million, or 0.7%, from $350.9 million as of December 31, 2009 to $353.5 million as of December 31, 2010. During 2010, we entered into a new loan with the Hartford Company, retired all short-term debt owed to the Berg Group and under our revolving line of credit, and made recurring scheduled debt payments.
In 2010, stock options to purchase 10,859 shares of our common stock were exercised at $6.14 per share. The total proceeds of approximately $0.07 million increased additional paid-in-capital.
In 2010, three limited partners exchanged a total of 254,700 O.P. Units for 254,700 shares of our common stock pursuant to the exchange rights agreement resulting in a reclassification of approximately $1.7 million from noncontrolling interests to additional paid-in-capital.
The conversion of O.P. Units to shares of our common stock was applied to increase our percentage interest as general partner in the operating partnerships.
Year Ended December 31, 2009
The most significant changes in our financial condition in 2009 resulted from the exchange of O.P. Units for shares of our common stock.
Debt outstanding, including amounts due related parties, decreased by approximately ($1.9) million, or (0.5%), from $352.7 million as of December 31, 2008 to $350.9 million as of December 31, 2009. During 2009, we borrowed from the Berg Group and our revolving line of credit and made recurring scheduled debt payments.
In 2009, two limited partners exchanged a total of 2,122,000 O.P. Units for 2,122,000 shares of our common stock pursuant to the exchange rights agreement resulting in a reclassification of approximately $15.8 million from noncontrolling interests to additional paid-in-capital.
The conversion of O.P. Units to shares of our common stock was applied to increase our percentage interest as general partner in the operating partnerships.
Liquidity and Capital Resources
In 2011, we anticipate operating cash flows from our property portfolio to be in line with 2010. We are still experiencing weak demand for our R&D properties in certain areas of the Silicon Valley, principally the south San Jose area. If we are unable to lease a significant portion of the approximately 641,000 rentable square feet scheduled to expire in 2011, as well as our currently available space, our operating cash flows will be affected adversely. We are also subject to risks of decreased occupancy through tenant defaults and bankruptcies, and potential reduction in rental rates upon renewal of properties, which would result in reduction in cash flows from operations beyond the level we are anticipating currently.
-35-
We expect our principal source of liquidity for distributions to stockholders and O.P. Unit holders (noncontrolling interests), debt service, leasing costs, capital expenditures and tenant improvements to come from net cash flow provided by operations and borrowings from our credit facility and other sources of financing, as required. We expect these sources of liquidity to be adequate to meet projected distributions to stockholders and other presently anticipated liquidity requirements in 2011. We expect to meet our long-term liquidity requirements for the funding of property development, property acquisitions and other material non-recurring capital improvements through cash, long-term secured and unsecured indebtedness and the issuance of additional equity securities by us. We have the ability to meet short-term obligations or other liquidity needs based on our existing cash reserves. In 2011, we will be obligated to make payments totaling approximately $15.2 million of debt principal under our existing mortgage notes without regard to any debt refinancing or new debt obligations that we might incur, or optional payments of debt principal.
The cost and availability of credit have been adversely affected by the continuing state of the capital and commercial lending markets. We continue to evaluate sources of financing for our business activities, including borrowings under the credit facility and fixed-rate secured mortgage financing. However, our ability to obtain new financing or refinance existing borrowings on favorable terms could be impacted by various factors including the continuing recessionary conditions, significant tenant defaults, a further decline in the demand for R&D/office properties, and a decrease in market rental rates or market values of real estate assets in our submarkets.
In 2009, we issued multiple notes in the aggregate amount of $22 million to M&M Real Estate Control & Restructuring, LLC for funds borrowed from restricted cash. The notes bear interest at LIBOR plus 2% and are due December 31, 2010. The proceeds were used to pay outstanding short-term notes issued to the Berg Group and for general corporate purposes. This cash was paid to us in early 2011 under the terms of the lease termination and assumption agreements with M&M Real Estate Control & Restructuring, LLC and the former tenant under the lease.
On August 4, 2010, we entered into a fixed rate term agreement and related contracts and instruments for a secured mortgage loan totaling $40 million from Hartford Life Insurance Company and Hartford Life and Accident Insurance Company (the “Hartford Loan II”). The proceeds were used primarily to repay the remaining balance of an existing loan with the Berg Group and to provide other working capital needs. The Hartford Loan II bears a fixed interest rate of 6.05%, with a 20-year amortization, and matures September 1, 2030, at which time any outstanding principal and interest will be due. Pursuant to the loan agreement, monthly principal and interest installment payments of approximately $0.3 million are due on the first day of each month. The Hartford Loan II is secured by five properties consisting of approximately 0.5 million rentable square feet. In connection with the loan, we paid approximately $0.5 million in loan fees and financing costs, which are amortized over the 20 year loan period.
As of December 31, 2010, we were in compliance with loan covenants relating to the Allianz, Hartford, Northwestern mortgage loans and the Heritage Bank of Commerce (“HBC”) revolving line of credit.
Cash and cash equivalents increased by approximately $3.0 million from $1.0 million as of December 31, 2009 to $4.0 million as of December 31, 2010.
Restricted cash totaled approximately $6.9 million as of December 31, 2010. Of this amount, approximately $6.8 million represented proceeds received from the 1325-1375 McCandless Drive property sale and earned interest income held in a separate cash account at a trust company for future use in tax-deferred exchanges (see Item 8, “Financial Statements and Supplementary Data – Note 6” for further discussion of this transaction) and $0.1 million represented a balance we have consolidated due to the accounting provisions for variable interest entity (see Item 8, “Financial Statements and Supplementary Data – Note 7” for further discussion of this transaction). We do not possess or control these funds or have any rights to receive them except as provided in the applicable agreements. Therefore, restricted cash is not available for distribution to stockholders.
Since 1999, we have elected to be taxed as a REIT under the Internal Revenue Code of 1986. We intend to continue operating as a REIT in 2011. As a REIT, we are subject to a number of organizational and operating requirements, including a requirement to distribute 90% of our taxable income to our stockholders. Also as a REIT, we generally will not be subject to federal income taxes on our taxable income.
Generally, our objective is to meet our short-term liquidity requirement of funding the payment of our current level of quarterly common dividends to stockholders and O.P. Unit holders through our net cash flows provided by operating activities, borrowings from the Berg Group and borrowings from our credit facility, less our recurring and nonrecurring property capital expenditures. These operating capital expenditures are the capital expenditures necessary to maintain the earnings capacity of our operating assets over time.
For 2011, we will decrease our quarterly dividend payment rate to common stockholders and O.P. Unit holders from $0.15 to $0.13 per share. We will fund dividend payments with net cash flow provided by operations and borrowings from our credit facility and other sources of financing, as required. However, distributions are declared at the discretion of our board of directors and are subject to actual cash available for distribution, our financial condition, capital requirements and such other factors, as our board of directors deems relevant (see Item 1A, “Risk Factors - Stockholders are not assured of receiving cash distributions from us”).
-36-
On January 6, 2011, we paid dividends of $0.15 per share of common stock to all common stockholders of record as of December 31, 2010. On the same date, the operating partnerships paid a distribution of $0.15 per O.P. Unit to all holders of O.P. Units. Aggregate dividends and distributions for the quarter ended December 31, 2010 amounted to approximately $15.8 million.
Funds available for distributions does not represent cash generated from operating activities and is not necessarily indicative of cash available to fund cash needs. The actual return that we will realize and the amount available for distributions to stockholders will be affected by a number of factors, including the revenues received from our properties, our operating expenses, debt service on borrowings, and planned and unanticipated capital expenditures.
We anticipate that cash available for distribution will exceed earnings and profits for federal income tax purposes, as the latter figure takes into account non-cash expenses such as depreciation and amortization that we will incur. Distributions other than capital gain distributions by us to the extent of our current and accumulated earnings and profits for federal income tax purposes most likely will be taxable to U.S. stockholders as ordinary dividend income unless a stockholder is a tax-exempt entity. Distributions in excess of earnings and profits generally will be treated as a non-taxable reduction of the U.S. stockholder’s basis in the common stock to the extent of such basis, and thereafter as taxable gain. The percentage of such distributions in excess of earnings and profits, if any, may vary from period to period.
Contractual Obligations
The following table identifies the contractual obligations with respect to the maturities and scheduled principal repayments of our secured debt, note, credit facility and scheduled interest payments of our fixed-rate and variable-rate debt at December 31, 2010 and provides information about our operating lease obligations that will impact our liquidity and cash flow in future periods.
|
2011
|
2012
|
2013
|
2014
|
2015
|
Thereafter
|
Total
|
||||||||||||||||||||||
|
Principal payments (1)
|
$ | 15,187 | $ | 16,080 | $ | 82,485 | $ | 12,183 | $ | 12,893 | $ | 214,663 | $ | 353,491 | ||||||||||||||
|
Interest payments-fixed rate debt (2)
|
20,027 | 19,133 | 15,056 | 13,527 | 12,818 | 81,659 | 162,220 | |||||||||||||||||||||
|
Operating lease obligations (3)
|
120 | 30 | - | - | - | - | 150 | |||||||||||||||||||||
|
Total
|
$ | 35,334 | $ | 35,243 | $ | 97,541 | $ | 25,710 | $ | 25,711 | $ | 296,322 | $ | 515,861 | ||||||||||||||
|
(1)
|
As of December 31, 2010, 100% of our debt was contractually fixed and 0% of our debt bore interest at variable rates. Our debt obligations are set forth in detail in the table below.
|
|
(2)
|
The information in the table above reflects our projected interest rate obligations for the fixed-rate payments based on the contractual interest rates, interest payment dates and scheduled maturity dates.
|
|
(3)
|
Our operating lease obligations relate to a lease of our corporate office facility from a related party.
|
At December 31, 2010, we had total indebtedness of approximately $353.5 million. A table listing our indebtedness as of December 31, 2010 is set forth in Item 8, “Financial Statements and Supplementary Data – Note 8.”
At December 31, 2010, our debt to total market capitalization ratio, which is computed as our total debt outstanding divided by the sum of total debt outstanding plus the market value of common stock (based upon the closing price of $6.69 per share on December 31, 2010) on a fully diluted basis, including the conversion of all O.P. Units into common stock, was approximately 33.4%. On December 31, 2010, the last trading day for the year, total market capitalization was approximately $1.06 billion. By comparison, on December 31, 2009 total debt as a percentage of market capitalization was 31.6% and total market capitalization was approximately $1.11 billion.
At December 31, 2010, the outstanding balance remaining under certain demand notes that we owed to the operating partnerships was approximately $2.4 million. The due date of the demand notes has been extended to September 30, 2012. The principal of the demand notes, along with the interest expense, which is interest income to the operating partnerships, is eliminated in consolidation and is not included in the corresponding line items within the consolidated financial statements. However, the interest income earned by the operating partnerships, which is interest expense to us, in connection with this debt, is included in the calculation of noncontrolling interest as reported on the consolidated statements of operations, thereby reducing our net income by this same amount. At present, our only means for repayment of this debt is through distributions that we receive from the operating partnerships that are in excess of the amount of dividends to be paid to our stockholders or by raising additional equity capital.
-37-
Historical Cash Flows
Our cash flow activities are summarized as follows:
|
Year Ended December 31,
|
||||||||||||
|
2010
|
2009
|
2008
|
||||||||||
|
(dollars in thousands)
|
||||||||||||
|
Cash flow provided by operating activities
|
$ | 81,768 | $ | 56,072 | $ | 76,872 | ||||||
|
Cash flow used in investing activities
|
$ | (6,738 | ) | $ | (278 | ) | $ | (26,496 | ) | |||
|
Cash flow used in financing activities
|
$ | (72,028 | ) | $ | (54,808 | ) | $ | (74,067 | ) | |||
Comparison of the year ended December 31, 2010 to the year ended December 31, 2009
Cash and cash equivalents were approximately $4.0 million at December 31, 2010 compared with $1.0 at December 31, 2009.
Net cash provided by operating activities for the year ended December 31, 2010 was approximately $81.8 million compared with approximately $56.1 million for the year ended December 31, 2009. Cash provided by operating activities was higher in 2010 primarily due to approximately $16.2 million of gains from investments in marketable securities and $2.6 million received from tenants for restoration costs for vacated properties. In addition, in 2009 we used operating cash flow to deposit approximately $14.0 million with the clerk of the Santa Clara County Superior Court in the RPC litigation with no comparable activity in 2010.
Cash used in investing primarily consists of property acquisition, property disposition and improvements to our properties. Net cash used in investing activities was approximately ($6.7) million for the year ended December 31, 2010 compared with approximately ($0.3) million for the year ended December 31, 2009. In 2010, we acquired one property for approximately $3.9 million, sold one property for a net total of approximately $13.8 million and incurred capital expenditures relating to real estate improvements of approximately $2.9 million. We received cash of approximately $6.8 million and a note receivable in the amount of approximately $7.1 million for the property we sold. Net cash used in investing activities for the year ended December 31, 2009 related principally to capital expenditures relating to real estate improvements of approximately $0.2 million and approximately $0.1 million as a deposit for a property purchase offer.
Net cash used in financing activities was approximately ($72.0) million for the year ended December 31, 2010 compared with approximately ($54.8) million for the year ended December 31, 2009. During 2010, financing activities included borrowing $40 million under a new mortgage loan, borrowing approximately $53.0 million from the Berg Group in short-term loans, payments of approximately $14.4 million under our line of credit, payments of approximately $13.6 million for outstanding mortgage debt, payments of approximately $62.3 million to the Berg Group under short-term loans, payment of approximately $10.4 million to M&M Real Estate Control & Restructuring, LLC, payment of approximately $0.4 million in financing costs related to a new mortgage loan, payments of approximately $13.2 million to common stockholders as dividends and payments of approximately $50.7 million to O.P. Unit holders as distributions. During 2009, financing activities included borrowing approximately $1.4 million under our line of credit, borrowing $22 million from M&M Real Estate Control & Restructuring, LLC through restricted cash, payments of approximately $12.6 million for outstanding mortgage debt, borrowing and repayment of approximately $39.4 million to the Berg Group to repay short-term loans, payments of approximately $14.8 million to common stockholders as dividends and payments of approximately $50.8 million to O.P. Unit holders as distributions.
Comparison of the year ended December 31, 2009 to the year ended December 31, 2008
Cash and cash equivalents were approximately $1.0 million at December 31, 2009 compared with $0 at December 31, 2008.
Net cash provided by operating activities for the year ended December 31, 2009 was approximately $56.1 million compared with approximately $76.9 million for the year ended December 31, 2008. Cash provided by operating activities was higher in 2008 primarily because of an approximately $16.9 million cash distribution received from our unconsolidated joint venture, TBI-MWP, from the sale of two R&D buildings. In addition, in 2009 we used operating cash flow to deposit approximately $14.0 million with the clerk of the Santa Clara County Superior Court in the RPC litigation and for higher leasing commission payments (included in other assets).
Cash used in investing primarily consists of property acquisitions, improvements to our properties and proceeds from investment in marketable securities. Net cash used in investing activities was approximately ($0.3) million for the year ended December 31, 2009 compared with approximately ($26.5) million for the year ended December 31, 2008. Net cash used in investing activities for the year ended December 31, 2009 related principally to capital expenditures relating to real estate improvements of approximately $0.2 million and approximately $0.1 million as a deposit for a property purchase offer. In 2008, we acquired two properties for approximately $35.8 million, incurred capital expenditures relating to real estate improvements of approximately $6.5 million and transferred excess restricted cash of approximately $7.7 million to our general cash account. We used restricted cash totaling approximately $8.1 million for the acquisition of one property in a tax-deferred exchange transaction involving our former property at Morse Avenue in Sunnyvale, California.
-38-
Net cash used in financing activities was approximately ($54.8) million for the year ended December 31, 2009 compared with approximately ($74.0) million for the year ended December 31, 2008. During 2009, financing activities included borrowing approximately $1.4 million under our line of credit, borrowing $22 million from M&M Real Estate Control & Restructuring, LLC through restricted cash, payments of approximately $12.6 million for outstanding mortgage debt, borrowing and repayment of approximately $39.4 million to the Berg Group to repay short-term loans, payments of approximately $14.8 million to common stockholders as dividends and payments of approximately $50.8 million to O.P. Unit holders as distributions. During 2008, financing activities included borrowing $115 million under a new collateralized mortgage loan, borrowing approximately $13.1 million under our line of credit, payments of approximately $122.1 million for outstanding mortgage debt, borrowing and repayment of approximately $19.4 million for the purchase of one property, borrowing and repayment of $3.0 million under a short-term loan, payment of approximately $1.2 million in financing costs related to a new mortgage loan, refund of $1.5 million from a certificate of deposit related to a former loan escrow, receipt of approximately $0.8 million from stock option exercises, payments of approximately $15.0 million to common stockholders as dividends and payments of approximately $66.1 million to O.P. Unit holders as distributions.
Capital Expenditures
Our properties require periodic investments of capital for tenant-related capital expenditures and for general capital improvements. For the years ended December 31, 2006 through December 31, 2010, the recurring tenant/building improvement costs and leasing commissions incurred with respect to new leases and lease renewals of the properties averaged approximately $5.5 million annually. We will have approximately 641,000 rentable square feet under expiring leases in 2011. We expect that the average cost of recurring tenant/building improvements and leasing commissions related to these properties will be approximately $5.0 million during 2011. We believe we will recover substantially all of these costs from the tenants under the new or renewed leases through contractual increases in rental rates. Until we actually sign the leases, however, we cannot assure you that this will occur. Capital expenditures may fluctuate in any given period subject to the nature, extent, and timing of improvements required to be made to the properties. Tenant/building improvements and leasing costs also may fluctuate in any given period year depending upon factors such as the property, the term of the lease, the type of lease and the overall market conditions. We expect to meet our long-term liquidity requirements for the funding of property acquisitions and other material non-recurring capital improvements through our currently available sources of capital, including operating cash flows, cash on hand, and our credit facility (see “Policies with Respect to Certain Activities – Financing Policies” below).
Distribution Policy
Distributions are determined by our board of directors and depend on actual cash available for distributions, our financial condition, capital requirements, the annual distribution requirements under the REIT provisions of the Code and such other factors as the board of directors deems relevant. For a discussion of the risk that we will not meet our distribution objectives, see Item 1A, “Risk Factors – Stockholders are not assured of receiving cash distributions from us.”
Policies with Respect to Certain Activities
We have adopted policies with respect to investment, financing, conflicts of interest and other activities. These policies have been formulated by our board of directors, are set forth in our charter, bylaws, operating partnership agreements or agreements with the Berg Group, and generally may be amended or revised from time to time, subject to applicable agreement terms, at the discretion of the board of directors without a vote of the stockholders. Among other things, these policies provide that:
|
·
|
so long as the Berg Group members and their affiliates, other than us and the operating partnerships, beneficially own, in the aggregate, at least 15% of the outstanding shares of common stock on a Fully Diluted basis, the approval of a majority of our directors, including Carl E. Berg or his designee as a director, and of the holders of a majority of the O.P. Units is required for us to take title to assets, other than temporarily in connection with an acquisition prior to contributing such assets to the operating partnerships, or to conduct business other than through the operating partnerships, or for us or the operating partnerships to engage in any business other than the ownership, construction, development and operation of real estate properties, or for certain fundamental corporate actions, including amendments to our charter, bylaws or any operating partnership agreement and any merger, consolidation or sale of all or substantially all of our assets or the assets of the operating partnerships;
|
|
·
|
changes in certain policies with respect to conflicts of interest must be consistent with legal requirements;
|
|
·
|
certain policies with respect to competition by and acquisitions from the Berg Group are imposed pursuant to provisions of the acquisition agreement that cannot be amended or waived without the approval of the Independent Directors Committee of our board of directors;
|
|
·
|
we cannot take any action intended to terminate our qualification as a REIT without the approval of more than 75% of the entire board of directors; and
|
|
·
|
we cannot undertake certain other specified transactions, including the issuance of debt securities, and borrowings in excess of specified limits, or the amendment of our charter and bylaws, without the approval of more than 75% of the entire board of directors.
|
-39-
Investment Policies
We expect to pursue our business and investment objectives principally through the direct ownership by the operating partnerships of our properties and future acquired properties. Development or investment activities are not limited to any specified percentage of our assets. We may also participate with other entities in property ownership, through joint ventures or other types of co-ownership. Equity investments may be subject to existing mortgage financing and other indebtedness that have priority over our equity interests.
While we will emphasize equity real estate investments, we may, in our discretion and subject to the percentage ownership limitations and gross income tests necessary for REIT qualification, invest in mortgage and other real estate interests, including securities of other real estate investment trusts. We have not previously invested in mortgages of other real estate investment trusts. As of December 31, 2010, we had no investments in securities of other real estate investment trusts.
Financing Policies
To the extent that our board of directors determines to seek additional capital, we may raise such capital through additional equity offerings, debt financing or retention of cash flow, or through a combination of these sources, after consideration of provisions of the Code requiring the distribution by a REIT of a certain percentage of its taxable income and taking into account taxes that would be imposed on undistributed taxable income. It is our present intention that any additional borrowings will be made through the operating partnerships, although we may incur borrowings that would be re-loaned to the operating partnerships. Borrowings may be unsecured or may be secured by any or all of our assets, the operating partnerships or any existing or new property, and may have full or limited recourse to all or any portion of our assets, the operating partnerships or any existing or new property.
We have adopted a policy of maintaining a consolidated ratio of debt to total market capitalization, which includes for this purpose the market value of all shares of common stock for which outstanding O.P. Units are exchangeable, of less than 50%. This ratio may not be exceeded without the approval of more than 75% of our entire board of directors. We also may determine to finance acquisitions through the exchange of properties or the issuance of additional O.P. Units in the operating partnerships, shares of common stock or other securities.
In the event that the board of directors determines to raise additional equity capital, it has the authority, without stockholder approval, to issue additional shares of common stock, preferred stock or other capital stock, including securities senior to the common stock, in any manner and on such terms and for such consideration it deems appropriate, including in exchange for property. In the event that we issue any shares of common stock or securities convertible into or exchangeable or exercisable for, shares of common stock, subject to limited exceptions, such as the issuance of common stock pursuant to any stock incentive plan adopted by us or pursuant to limited partners’ exercise of the exchange rights or the put rights, the limited partners will have the right to purchase common stock or such securities in order to maintain their respective percentage interests in us on a Fully Diluted basis. If the board of directors determines that we will raise additional equity capital to fund investments by the operating partnerships, we will contribute such funds to the operating partnerships as a contribution to capital and purchase of additional units of general partner interest; however, holders of O.P. Units will have the right to participate in such funding on a pro rata basis. In the event that holders of O.P. Units sell their O.P. Units to us upon exercise of their put rights, we are authorized to raise the funds for such purchase by issuing additional shares of common stock. Alternatively, we may issue additional shares of common stock in exchange for the tendered O.P. Units.
Our board of directors also has the authority to cause the operating partnerships to issue additional O.P. Units in any manner and on such terms and for such consideration, as it deems appropriate, including in exchange for property. In the event that the operating partnerships issue new O.P. Units for cash, but not property, the limited partners holding O.P. Units in an operating partnership will have the right to purchase O.P. Units in order, and to the extent necessary, to maintain their respective percentage interests in that operating partnership. The new O.P. Units will be exchangeable for common stock pursuant to the exchange rights or may be tendered to us pursuant to the put rights.
Disposition Policies
From time to time we may dispose of properties in our portfolio, subject to the required approvals as set forth below. During the past five years we have sold vacant R&D properties that were either rezoned for residential development resulting in a value greater than being used as an R&D property or we did not believe were likely to earn the type of return on assets that we seek. We will continue to dispose of properties either rezoned for residential or under-performing when we consider it appropriate.
-40-
A significant factor influencing our disposition policy is that the tax basis of the limited partners in the properties in the operating partnerships is substantially less than current fair market value. Accordingly, prior to the disposition of their O.P. Units, upon a disposition of any of the properties, a disproportionately large share of the gain for federal income tax purposes would be allocated to the limited partners.
In addition, the approval of a majority of our directors, including Carl E. Berg or his designee, will be required to sell all or substantially all of our assets. The consent of the holders of a majority of the O.P. Units will be required to effect a sale or sales of all, or substantially all, of the assets of any of the operating partnerships.
Impact of New Accounting Pronouncements
For discussion of recent accounting pronouncements, see Item 8, “Financial Statements and Supplementary Data – Note 2” to our consolidated financial statements included in this report.
-41-
Item 7A. Quantitative and Qualitative Disclosures about Market Risk
We do not generally hold market risk sensitive instruments for trading purposes. We use fixed and variable rate debt to finance our operations. Our exposure to market risk for changes in interest rates relates primarily to our current variable rate debt and our future debt obligations. We are vulnerable to significant fluctuations of interest rates on our floating rate debt.
We manage our market risk by monitoring interest rates where we try to recognize the unpredictability of the financial markets and seek to reduce potentially adverse effects on the results of our operations. This takes frequent evaluation of available lending rates and examination of opportunities to reduce interest expense through new sources of debt financing. Several factors affecting the interest rate risk include governmental monetary and tax policies, domestic and international economics and other factors that are beyond our control. The following table provides information about the principal cash flows, weighted average interest rates, and expected maturity dates for debt outstanding as of December 31, 2010. The current terms of our outstanding debt are described in Item 8, “Financial Statements and Supplementary Data – Note 8.” For fixed rate debt, we estimate fair value by using discounted cash flow analyses based on borrowing rates for similar kinds of borrowing arrangements.
For fixed rate debt, the table presents the assumption that the outstanding principal balance at December 31, 2010 will be paid according to scheduled principal payments and that we will not prepay any of the outstanding principal balance.
|
2011
|
2012
|
2013
|
2014
|
2015
|
Thereafter
|
Total
|
Fair Value
|
|||||||||||||||||||||||||
|
(dollars in thousands)
|
||||||||||||||||||||||||||||||||
|
Fixed Rate Debt:
|
||||||||||||||||||||||||||||||||
|
Secured notes payable
|
$ | 15,187 | $ | 16,080 | $ | 82,485 | $ | 12,183 | $ | 12,893 | $ | 214,663 | $ | 353,491 | $ | 353,199 | ||||||||||||||||
|
Weighted average interest rate
|
5.78 | % | 5.78 | % | 5.78 | % | 5.78 | % | 5.78 | % | 5.78 | % | ||||||||||||||||||||
The fixed rate debt represented 100% and 93.2% and the variable rate debt represented 0% and 6.8% of all debt outstanding for the years ended December 31, 2010 and 2009, respectively.
All of our debt is denominated in United States dollars. The weighted average interest rate for the fixed rate debt was approximately 5.78% and 5.74% for the years ended December 31, 2010 and 2009, respectively. The decrease in interest expense attributable to the average interest rate difference between 2010 and 2009 was approximately $1.8 million, which was a result of approximately $2.4 million recorded in 2009 related to the RPC litigation.
The primary market risk we face is the risk of interest rate fluctuations. With a floating interest rate we could pay lower rates of interest in periods of decreasing interest rates and higher rates of interest in periods of increasing interest rates. At December 31, 2010, we had no variable rate debt outstanding, and thus had no interest rate risk. As of December 31, 2010 and 2009, we did not have any derivative instruments.
-42-
Item 8. Financial Statements and Supplementary Data
MISSION WEST PROPERTIES, INC.
INDEX TO CONSOLIDATED FINANCIAL STATEMENTS
|
PAGE
|
|
|
Report of Independent Registered Public Accounting Firm
|
44
|
|
Report of Independent Registered Public Accounting Firm on Internal Control over Financial Reporting
|
45
|
|
Consolidated Balance Sheets as of December 31, 2010 and 2009
|
46
|
|
Consolidated Statements of Operations for the years ended December 31, 2010, 2009 and 2008
|
47
|
|
Consolidated Statements of Equity for the years ended December 31, 2010, 2009 and 2008
|
48
|
|
Consolidated Statements of Cash Flows for the years ended December 31, 2010, 2009 and 2008
|
49
|
|
Notes to Consolidated Financial Statements
|
50
|
|
Supplemental Financial Information
|
72
|
|
Schedule III: Real Estate and Accumulated Depreciation as of December 31, 2010
|
74
|
|
Schedule III: Real Estate and Accumulated Depreciation as of December 31, 2009
|
76
|
-43-
Report of Independent Registered Public Accounting Firm
Board of Directors and Stockholders
Mission West Properties, Inc.
Cupertino, California
We have audited the accompanying consolidated balance sheets of Mission West Properties, Inc. (the “Company”) as of December 31, 2010 and 2009, and the related consolidated statements of operations, equity and cash flows for each of the three years in the period ended December 31, 2010. Our audits also included the financial statement schedules listed in the Index at Item 15(a). These financial statements and schedules are the responsibility of the Company’s management. Our responsibility is to express an opinion on these financial statements and schedules based on our audits.
We conducted our audits in accordance with the standards of the Public Company Accounting Oversight Board (United States). Those standards require that we plan and perform the audit to obtain reasonable assurance about whether the financial statements are free of material misstatement. An audit includes examining, on a test basis, evidence supporting the amounts and disclosures in the financial statements. An audit also includes assessing the accounting principles used and significant estimates made by management, as well as evaluating the overall financial statement presentation. We believe that our audits provide a reasonable basis for our opinion.
In our opinion, the financial statements referred to above present fairly, in all material respects, the consolidated financial position of Mission West Properties, Inc. at December 31, 2010 and 2009, and the consolidated results of their operations and their cash flows for each of the three years in the period ended December 31, 2010, in conformity with accounting principles generally accepted in the United States of America.
We also have audited, in accordance with the standards of the Public Company Accounting Oversight Board (United States), the Company’s internal control over financial reporting as of December 31, 2010, based on the criteria established in Internal Control – Integrated Framework issued by the Committee of Sponsoring Organizations of the Treadway Commission and our report dated March 16, 2011 expressed an unqualified opinion thereon.
\S\ Burr Pilger Mayer, Inc.
San Francisco, California
March 16, 2011
-44-
Report of Independent Registered Public Accounting Firm on Internal Control over Financial Reporting
Board of Directors and Stockholders
Mission West Properties, Inc.
Cupertino, California
We have audited Mission West Properties, Inc.’s (the Company) internal control over financial reporting as of December 31, 2010, based on criteria established in Internal Control—Integrated Framework issued by the Committee of Sponsoring Organizations of the Treadway Commission (the “COSO criteria”). The Company’s management is responsible for maintaining effective internal control over financial reporting and for its assessment of the effectiveness of internal control over financial reporting included in the accompanying Management’s Report on Internal Control over Financial Reporting. Our responsibility is to express an opinion on the Company’s internal control over financial reporting based on our audit.
We conducted our audit in accordance with the standards of the Public Company Accounting Oversight Board (United States). Those standards require that we plan and perform the audit to obtain reasonable assurance about whether effective internal control over financial reporting was maintained in all material respects. Our audit included obtaining an understanding of internal control over financial reporting, assessing the risk that a material weakness exists, testing and evaluating the design and operating effectiveness of internal control based on the assessed risk, and performing such other procedures as we considered necessary in the circumstances. We believe that our audit provides a reasonable basis for our opinion.
A company’s internal control over financial reporting is a process designed to provide reasonable assurance regarding the reliability of financial reporting and the preparation of financial statements for external purposes in accordance with generally accepted accounting principles. A company’s internal control over financial reporting includes those policies and procedures that (1) pertain to the maintenance of records that, in reasonable detail, accurately and fairly reflect that transactions and dispositions of the assets of the company; (2) provide reasonable assurance that transactions are recorded as necessary to permit preparation of financial statements in accordance with generally accepted accounting principles, and that receipts and expenditures of the company are being made only in accordance with authorizations of management and directors of the company; and (3) provide reasonable assurance regarding prevention or timely detection of unauthorized acquisition, use, or disposition of the company’s assets that could have a material effect on the financial statements.
Because of its inherent limitations, internal control over financial reporting may not prevent or detect misstatements. Also, projections of any evaluation of effectiveness to future periods are subject to the risk that controls may become inadequate because of changes in conditions, or that the degree of compliance with the policies or procedures may deteriorate.
In our opinion, Mission West Properties, Inc. maintained, in all material respects, effective internal control over financial reporting as of December 31, 2010, based on the COSO criteria.
We also have audited, in accordance with the standards of the Public Company Accounting Oversight Board (United States), the consolidated balance sheets of Mission West Properties, Inc. as of December 31, 2010 and 2009, and the related consolidated statements of operations, equity and cash flows for each of the three years in the period ended December 31, 2010, and the related financial statement schedules listed in the Index at Item 15(a), and our report dated March 16, 2011 expressed an unqualified opinion thereon.
\S\ Burr Pilger Mayer, Inc.
San Francisco, California
March 16, 2011
-45-
MISSION WEST PROPERTIES, INC.
CONSOLIDATED BALANCE SHEETS
(dollars in thousands, except per share data)
|
ASSETS
|
||||||||
|
December 31,
|
||||||||
|
2010
|
2009
|
|||||||
|
Investments in real estate:
|
||||||||
|
Land
|
$ | 322,076 | $ | 320,911 | ||||
|
Buildings and improvements
|
790,424 | 799,649 | ||||||
|
Real estate related intangible assets
|
3,240 | 3,240 | ||||||
|
Total investments in properties
|
1,115,740 | 1,123,800 | ||||||
|
Accumulated depreciation and amortization
|
(224,027 | ) | (204,153 | ) | ||||
|
Assets held for sale, net
|
3,267 | - | ||||||
|
Net investments in properties
|
894,980 | 919,647 | ||||||
|
Investment in unconsolidated joint venture
|
3,830 | 3,828 | ||||||
|
Net investments in real estate
|
898,810 | 923,475 | ||||||
|
Cash and cash equivalents
|
3,988 | 986 | ||||||
|
Restricted cash
|
6,892 | 197 | ||||||
|
Restricted investment in marketable securities
|
- | 12,069 | ||||||
|
Deferred rent
|
17,941 | 18,711 | ||||||
|
Other assets, net
|
40,653 | 30,951 | ||||||
|
Total assets
|
$ | 968,284 | $ | 986,389 | ||||
|
LIABILITIES AND EQUITY
|
||||||||
|
Liabilities:
|
||||||||
|
Mortgage notes payable
|
$ | 345,770 | $ | 318,818 | ||||
|
Mortgage note payable (related parties)
|
7,721 | 8,261 | ||||||
|
Note payable (related parties)
|
- | 9,325 | ||||||
|
Revolving line of credit
|
- | 14,466 | ||||||
|
Interest payable
|
1,659 | 1,573 | ||||||
|
Security deposits
|
4,605 | 4,849 | ||||||
|
Prepaid rent
|
6,526 | 6,539 | ||||||
|
Dividends and distributions payable
|
15,793 | 15,791 | ||||||
|
Accounts payable and accrued expenses
|
16,239 | 9,638 | ||||||
|
Total liabilities
|
398,313 | 389,260 | ||||||
|
Commitments and contingencies (Note 16)
|
||||||||
|
Equity:
|
||||||||
|
Stockholders’ equity attributable to Mission West Properties, Inc.:
|
||||||||
|
Preferred stock, $.001 par value, 20,000,000 shares authorized,
|
||||||||
|
none issued or outstanding
|
- | - | ||||||
|
Common stock, $.001 par value, 200,000,000 shares authorized, 22,135,770
|
||||||||
|
and 21,870,211 shares issued and outstanding at December 31, 2010 and 2009
|
22 | 22 | ||||||
|
Additional paid-in capital
|
172,568 | 170,606 | ||||||
|
Distributions in excess of accumulated earnings
|
(30,520 | ) | (25,784 | ) | ||||
|
Total stockholders’ equity attributable to Mission West Properties, Inc.
|
142,070 | 144,844 | ||||||
|
Noncontrolling interests in operating partnerships
|
427,901 | 452,285 | ||||||
|
Total equity
|
569,971 | 597,129 | ||||||
|
Total liabilities and equity
|
$ | 968,284 | $ | 986,389 | ||||
See notes to consolidated financial statements.
-46-
MISSION WEST PROPERTIES, INC.
CONSOLIDATED STATEMENTS OF OPERATIONS
(dollars in thousands, except per share data)
|
Year Ended December 31,
|
||||||||||||
|
2010
|
2009
|
2008
|
||||||||||
|
Operating revenues:
|
||||||||||||
|
Rental income
|
$ | 81,715 | $ | 82,466 | $ | 78,927 | ||||||
|
Tenant reimbursements
|
15,094 | 18,668 | 16,293 | |||||||||
|
Other income, including lease terminations and settlements
|
2,619 | 3,756 | 4,220 | |||||||||
|
Total operating revenues
|
99,428 | 104,890 | 99,440 | |||||||||
|
Operating expenses:
|
||||||||||||
|
Property operating, maintenance and real estate taxes
|
26,400 | 27,532 | 23,140 | |||||||||
|
General and administrative
|
2,219 | 2,336 | 2,635 | |||||||||
|
Depreciation and amortization
|
23,466 | 23,786 | 22,895 | |||||||||
|
Total operating expenses
|
52,085 | 53,654 | 48,670 | |||||||||
|
Operating income
|
47,343 | 51,236 | 50,770 | |||||||||
|
Other income (expenses):
|
||||||||||||
|
Equity in earnings of unconsolidated joint venture
|
303 | 309 | 19,617 | |||||||||
|
Interest and dividend income
|
102 | 1,309 | 1,735 | |||||||||
|
Realized and unrealized gain (loss) from restricted investment
|
4,067 | 5,011 | (278 | ) | ||||||||
|
Interest expense
|
(20,069 | ) | (22,117 | ) | (19,787 | ) | ||||||
|
Interest expense – related parties
|
(988 | ) | (765 | ) | (1,332 | ) | ||||||
|
Income from continuing operations
|
30,758 | 34,983 | 50,725 | |||||||||
|
Discontinued operations:
|
||||||||||||
|
Net gain on disposal of properties classified as discontinued operations
|
6,199 | - | - | |||||||||
|
Net loss attributable to discontinued operations
|
(462 | ) | (534 | ) | (385 | ) | ||||||
|
Income (loss) from discontinued operations
|
5,737 | (534 | ) | (385 | ) | |||||||
|
Net income
|
36,495 | 34,449 | 50,340 | |||||||||
|
Net income attributable to noncontrolling interests
|
(28,022 | ) | (26,058 | ) | (40,206 | ) | ||||||
|
Net income available to common stockholders
|
$ | 8,473 | $ | 8,391 | $ | 10,134 | ||||||
|
Net income per share from continuing operations:
|
||||||||||||
|
Basic
|
$ | 0.34 | $ | 0.39 | $ | 0.51 | ||||||
|
Diluted
|
$ | 0.34 | $ | 0.39 | $ | 0.51 | ||||||
|
Net income per share from discontinued operations:
|
||||||||||||
|
Basic
|
$ | 0.04 | - | - | ||||||||
|
Diluted
|
$ | 0.04 | - | - | ||||||||
|
Net income per share to common stockholders:
|
||||||||||||
|
Basic
|
$ | 0.39 | $ | 0.39 | $ | 0.51 | ||||||
|
Diluted
|
$ | 0.38 | $ | 0.38 | $ | 0.51 | ||||||
|
Weighted average shares of common stock (basic)
|
21,973,599 | 21,736,699 | 19,714,414 | |||||||||
|
Weighted average shares of common stock (diluted)
|
22,121,724 | 21,923,104 | 19,996,349 | |||||||||
|
Weighted average O.P. units
|
83,310,364 | 83,538,477 | 85,528,329 | |||||||||
|
Outstanding common stock
|
22,135,770 | 21,870,211 | 19,748,211 | |||||||||
|
Outstanding O.P. units
|
83,150,265 | 83,404,965 | 85,526,965 | |||||||||
See notes to consolidated financial statements.
-47-
MISSION WEST PROPERTIES, INC.
CONSOLIDATED STATEMENTS OF EQUITY
(dollars in thousands, except per share data)
|
Common Stock
|
||||||||||||||||||||||||||||
|
Number
of Shares
|
Common Stock
|
Additional Paid-in Capital
|
Distributions in Excess of Accumulated Earnings
|
Total Stockholders’ Equity Attributable to
Mission West Properties, Inc.
|
Noncontrolling Interests in Operating Partnerships
|
Total Equity
|
||||||||||||||||||||||
|
Balance, December 31, 2007
|
19,664,087 | $ | 20 | $ | 153,024 | $ | (14,366 | ) | $ | 138,678 | $ | 526,626 | $ | 665,304 | ||||||||||||||
|
Net income
|
- | - | - | 10,134 | 10,134 | 40,206 | 50,340 | |||||||||||||||||||||
|
Dividends declared per common share and O.P. Unit at $0.80 per share/unit
|
- | - | - | (15,782 | ) | (15,782 | ) | (68,423 | ) | (84,205 | ) | |||||||||||||||||
|
Joint ventures distributions
|
- | - | - | - | - | (858 | ) | (858 | ) | |||||||||||||||||||
|
Issuance of common stock upon O.P. Unit conversion
|
6,970 | - | 66 | - | 66 | (66 | ) | - | ||||||||||||||||||||
|
Issuance of common stock upon option exercise
|
77,154 | - | 769 | - | 769 | - | 769 | |||||||||||||||||||||
|
Amortization of stock-based compensation
|
- | - | 553 | - | 553 | - | 553 | |||||||||||||||||||||
|
Balance, December 31, 2008
|
19,748,211 | 20 | 154,412 | (20,014 | ) | 134,418 | 497,485 | 631,903 | ||||||||||||||||||||
|
Net income
|
- | - | - | 8,391 | 8,391 | 26,058 | 34,449 | |||||||||||||||||||||
|
Dividends declared per common share and O.P. Unit at $0.65 per share/unit
|
- | - | - | (14,161 | ) | (14,161 | ) | (54,268 | ) | (68,429 | ) | |||||||||||||||||
|
Joint ventures distributions
|
- | - | - | - | - | (1,146 | ) | (1,146 | ) | |||||||||||||||||||
|
Issuance of common stock upon O.P. Unit conversion
|
2,122,000 | 2 | 15,842 | - | 15,844 | (15,844 | ) | - | ||||||||||||||||||||
|
Amortization of stock-based compensation
|
- | - | 352 | - | 352 | - | 352 | |||||||||||||||||||||
|
Balance, December 31, 2009
|
21,870,211 | 22 | 170,606 | (25,784 | ) | 144,844 | 452,285 | 597,129 | ||||||||||||||||||||
|
Net income
|
- | - | - | 8,473 | 8,473 | 28,022 | 36,495 | |||||||||||||||||||||
|
Dividends declared per common share and O.P. Unit at $0.60 per share/unit
|
- | - | - | (13,209 | ) | (13,209 | ) | (49,962 | ) | (63,171 | ) | |||||||||||||||||
|
Joint ventures distributions
|
- | - | - | - | - | (710 | ) | (710 | ) | |||||||||||||||||||
|
Issuance of common stock upon O.P. Unit conversion
|
254,700 | - | 1,734 | - | 1,734 | (1,734 | ) | - | ||||||||||||||||||||
|
Issuance of common stock upon option exercise
|
10,859 | - | 67 | - | 67 | - | 67 | |||||||||||||||||||||
|
Amortization of stock-based compensation
|
- | - | 161 | - | 161 | - | 161 | |||||||||||||||||||||
|
Balance, December 31, 2010
|
22,135,770 | $ | 22 | $ | 172,568 | $ | (30,520 | ) | $ | 142,070 | $ | 427,901 | $ | 569,971 | ||||||||||||||
See notes to consolidated financial statements.
-48-
MISSION WEST PROPERTIES, INC.
CONSOLIDATED STATEMENTS OF CASH FLOWS
(dollars in thousands)
|
Year Ended December 31,
|
||||||||||||
|
2010
|
2009
|
2008
|
||||||||||
|
Cash flows from operating activities:
|
||||||||||||
|
Net income
|
$ | 36,495 | $ | 34,449 | $ | 50,340 | ||||||
|
Adjustments to reconcile net income to net cash provided by operating activities:
|
||||||||||||
|
Depreciation and amortization
|
23,751 | 24,110 | 23,224 | |||||||||
|
Gain from disposal of properties classified as discontinued operations
|
(6,199 | ) | - | - | ||||||||
|
Realized and unrealized (gain) loss from restricted investment
|
(4,067 | ) | (5,011 | ) | 278 | |||||||
|
Dividend income from restricted investment
|
- | (726 | ) | - | ||||||||
|
Equity in earnings of unconsolidated joint venture
|
(303 | ) | (309 | ) | (19,617 | ) | ||||||
|
Distributions from unconsolidated joint venture
|
300 | 250 | 18,584 | |||||||||
|
Interest earned on restricted cash
|
(12 | ) | (94 | ) | (977 | ) | ||||||
|
Lease termination fee income related to restricted cash
|
10,381 | 10,864 | 9,741 | |||||||||
|
Stock-based compensation
|
160 | 352 | 553 | |||||||||
|
Other
|
9 | - | 123 | |||||||||
|
Change in operating assets and liabilities, net of liabilities assumed:
|
||||||||||||
|
Proceeds from (purchase of) restricted investment
|
16,211 | 3,646 | (3,368 | ) | ||||||||
|
Deferred rent
|
770 | (870 | ) | (3,008 | ) | |||||||
|
Other assets
|
(2,158 | ) | (4,700 | ) | (2,575 | ) | ||||||
|
Interest payable
|
86 | 68 | 265 | |||||||||
|
Security deposits
|
(244 | ) | (423 | ) | 518 | |||||||
|
Prepaid rent
|
(13 | ) | 2,575 | 662 | ||||||||
|
Accounts payable and accrued expenses
|
6,601 | (8,109 | ) | 2,129 | ||||||||
|
Net cash provided by operating activities
|
81,768 | 56,072 | 76,872 | |||||||||
|
Cash flows from investing activities:
|
||||||||||||
|
Improvements to investments in real estate
|
(2,841 | ) | (178 | ) | (6,468 | ) | ||||||
|
Purchase of office equipment
|
(39 | ) | - | - | ||||||||
|
Net proceeds from sale of property
|
6,686 | - | - | |||||||||
|
Acquisition of properties
|
(3,853 | ) | - | (35,764 | ) | |||||||
|
Restricted cash held in escrow
|
(6,791 | ) | (100 | ) | - | |||||||
|
Restricted cash released for purchase of properties
|
100 | - | 8,082 | |||||||||
|
Proceeds from release of restricted cash
|
- | - | 7,654 | |||||||||
|
Net cash used in investing activities
|
(6,738 | ) | (278 | ) | (26,496 | ) | ||||||
|
Cash flows from financing activities:
|
||||||||||||
|
Proceeds from mortgage loan payable
|
40,000 | - | 115,000 | |||||||||
|
Principal payments on mortgage notes payable
|
(13,048 | ) | (12,090 | ) | (121,612 | ) | ||||||
|
Principal payments on mortgage notes payable (related parties)
|
(540 | ) | (500 | ) | (463 | ) | ||||||
|
Real estate purchase financing (related parties)
|
- | - | 19,429 | |||||||||
|
Payment on real estate purchase financing (related parties)
|
- | - | (19,429 | ) | ||||||||
|
Proceeds from note payable (related parties)
|
53,025 | 39,420 | 3,000 | |||||||||
|
Payment on note payable (related parties)
|
(62,350 | ) | (39,420 | ) | (3,000 | ) | ||||||
|
Proceeds from note payable
|
- | 22,000 | - | |||||||||
|
Payment on note payable
|
(10,381 | ) | - | - | ||||||||
|
Net (repayments) borrowings on revolving line of credit
|
(14,466 | ) | 1,387 | 13,079 | ||||||||
|
Debt issuance costs
|
(457 | ) | - | (1,231 | ) | |||||||
|
Loan escrow refund
|
- | - | 1,500 | |||||||||
|
Net proceeds from exercise of stock options
|
67 | - | 768 | |||||||||
|
Distributions paid to noncontrolling interests
|
(50,709 | ) | (50,775 | ) | (66,129 | ) | ||||||
|
Dividends paid to common stockholders
|
(13,169 | ) | (14,830 | ) | (14,979 | ) | ||||||
|
Net cash used in financing activities
|
(72,028 | ) | (54,808 | ) | (74,067 | ) | ||||||
|
Net increase (decrease) in cash and cash equivalents
|
3,002 | 986 | (23,691 | ) | ||||||||
|
Cash and cash equivalents, beginning of year
|
986 | - | 23,691 | |||||||||
|
Cash and cash equivalents, end of year
|
$ | 3,988 | $ | 986 | $ | - | ||||||
See notes to consolidated financial statements.
-49-
MISSION WEST PROPERTIES, INC.
NOTES TO CONSOLIDATED FINANCIAL STATEMENTS
(Dollars in thousands, except per share data)
|
1.
|
ORGANIZATIONS AND FORMATION OF THE COMPANY
|
Mission West Properties, Inc. (“the Company”) is a fully integrated, self-administered and self-managed real estate company that acquires and manages research and development (“R&D”)/office properties in the portion of the San Francisco Bay Area commonly referred to as Silicon Valley. In July 1998, the Company purchased an approximate 12.11% interest in each of four existing limited partnerships (referred to collectively as the “operating partnerships”) and obtained control of these partnerships by becoming the sole general partner in each one effective July 1, 1998 for financial accounting and reporting purposes. At that time, all limited partnership interests in the operating partnerships were converted into 59,479,633 Operating Partnership Units (“O.P. Units”), which represented a limited partnership ownership interest of approximately 87.89% of the operating partnerships. The operating partnerships are the vehicles through which the Company holds its real estate investments, makes real estate acquisitions, and generally conducts its business.
As of December 31, 2010, the Company owns a controlling general partner interest of 24.83%, 21.86%, 16.32% and 12.53% in Mission West Properties, L.P., Mission West Properties, L.P. I, Mission West Properties, L.P. II and Mission West Properties, L.P. III, respectively, for a 20.84% general partner interest in the operating partnerships, taken as a whole, on a consolidated weighted average basis.
The Company, through the operating partnerships, owns interests in 111 R&D properties at December 31, 2010, all of which are located in the Silicon Valley.
Business Segment Information
The Company’s primary business is the ownership and management of R&D/office real estate with a geographic concentration in the Silicon Valley of the San Francisco Bay Area. Accordingly, the Company has concluded that it currently has a single reportable segment.
|
2.
|
BASIS OF PRESENTATION AND SUMMARY OF SIGNIFICANT ACCOUNTING POLICIES
|
Principles of Consolidation and Financial Statement Presentation
The accompanying consolidated financial statements include the accounts of the Company and its controlled subsidiaries, the operating partnerships (the “Company”). All significant intercompany transactions have been eliminated in consolidation.
The Company consolidates all variable interest entities in which it is deemed to be the primary beneficiary.
Management Estimates
The preparation of financial statements in conformity with GAAP requires management to make estimates and assumptions that affect the reported amounts of assets and liabilities and disclosure of contingent assets and liabilities at the dates of the financial statements and the reported amounts of revenue and expenses during the reporting periods. Accounting and disclosure decisions with respect to material transactions that are subject to significant management judgments or estimates include impairment of long lived assets, realizability of deferred rent, allocation of purchase price relating to property acquisitions, accrued liabilities, and Mission West Properties, Inc.’s qualification as a REIT. The Company bases its estimates on historical experience, current market conditions, and various other assumptions that are believed to be reasonable under the circumstances. Actual results could differ materially from those estimates.
The Company has evaluated subsequent events through the date the consolidated financial statements were issued.
Summary of Significant Accounting Policies:
Real Estate Assets and Related Intangible Assets
Real estate assets are stated at cost. Cost includes expenditures for improvements or replacements. Maintenance and repairs are charged to expense as incurred.
Purchase accounting is applied to the assets and liabilities related to all real estate investments acquired from third parties. In accordance with current accounting guidance, the fair value of the real estate acquired is allocated to the acquired tangible assets, consisting primarily of land, building and tenant improvements, and identified intangible assets and liabilities, consisting of the value of above-market and below-market leases, other value of in-place leases, value of tenant relationships and acquired ground leases, based in each case on their fair values.
-50-
MISSION WEST PROPERTIES, INC.
NOTES TO CONSOLIDATED FINANCIAL STATEMENTS, continued
(Dollars in thousands, except per share data)
The fair value of buildings and improvements, tenant improvements, and unamortized leasing commissions are based on current market replacement costs and other relevant market rate information. The fair value of land is derived from comparable sales of land within the same region.
The fair value of acquired in-place leases is derived based on management’s assessment of lost revenue and costs incurred for the period required to lease the “assumed vacant” property to the occupancy level when purchased. The amount recorded for acquired in-place leases is included in real estate related intangible assets in the consolidated balance sheets and amortized as an increase to depreciation and amortization expense over the remaining non-cancelable term of the applicable leases.
The fair value of the above-market or below-market component of an acquired in-place lease is based upon the present value (calculated using a market discount rate) of the difference between (i) the contractual rents to be paid pursuant to the lease over its remaining term and (ii) management’s estimate of the rents that would be paid using fair market rental rates over the remaining term of the lease. The amounts recorded for above-market or below-market leases are included in real estate assets or real estate related liabilities in the consolidated balance sheets and are amortized on a straight-line basis as an increase or reduction of rental income over the remaining non-cancelable term of the applicable leases.
Depreciation and Amortization
Depreciation and amortization are computed using the straight-line method over estimated useful lives as follows:
|
Building shell and base building improvements of newly acquired properties
|
-
|
Weighted average composite life of 40 years
|
|
Base building improvements made subsequent to initial property acquisition
|
-
|
25 years
|
|
Tenant improvements and furniture and fixtures
|
-
|
Lesser of life of asset, generally 5-10 years, or term of lease
|
|
Above-market and in-place lease value
|
-
|
Term of lease
|
Impairment of Long-Lived Assets
The Company reviews real estate assets for impairment whenever events or changes in circumstances indicate that the carrying amount of an asset may not be recoverable. If the carrying amount of the asset, including any intangible assets associated with that asset, exceeds its estimated undiscounted net cash flow, before interest, the Company will recognize an impairment loss equal to the difference between its carrying amount and its estimated fair value. If impairment is recognized, the reduced carrying amount of the asset will be accounted for as its new cost. For a depreciable asset, the new cost will be depreciated over the asset’s remaining useful life. Generally, fair values are estimated using discounted cash flow, replacement cost or market comparison analyses. The analysis that the Company prepares in connection with determining if there may be any asset impairment loss considers several assumptions: holding period of ten years, 36 months lease up period and cap rate ranging from 8% to 9%. The process of evaluating for impairment requires estimates as to future events and conditions, which are subject to varying market and economic factors, such as the vacancy rates, rental rates and operating costs for R&D facilities in the Silicon Valley area and related submarkets. Therefore, it is reasonably possible that a change in estimate resulting from judgments as to future events could occur which would affect the recorded amounts of the property. No impairment losses were recorded for the years ended December 31, 2010 and 2009.
Discontinued Operations and Properties Held for Sale
The results of operations and net gain or loss on the sale of property and the results of operations on properties classified as held for sale are presented in the consolidated statements of operations as discontinued operations for all periods presented through the date of the applicable disposition if both the following criteria are met: (a) the operation and cash flows of the property have been (or will be) eliminated from the ongoing operations of the Company as a result of the disposal transaction; and (b) the Company will not have any significant involvement in the operations of the property after the disposal transaction. Prior period results of operations for these properties are retrospectively adjusted and presented in discontinued operations in prior consolidated statements of operations.
-51-
MISSION WEST PROPERTIES, INC.
NOTES TO CONSOLIDATED FINANCIAL STATEMENTS, continued
(Dollars in thousands, except per share data)
A property is generally classified as held for sale once management has committed to an action to sell the property, the property is available for immediate sale in its present condition (subject to terms that are usual and customary for sales of such properties), an active program to locate a buyer is initiated, the sale is probable, the property is being actively marketed for sale at a price that is reasonable in relation to its current fair value and actions required to complete the plan indicate that it is unlikely that significant changes to the plan will be made or that the plan will be withdrawn. Properties for sale with significant contingencies that may prevent their sale, such as obtaining rezoning approval from the city, are not classified as properties held for sale. Upon the classification of a real estate asset as held for sale, the carrying value of the property is reduced to the lower of its net book value or its fair value, less costs to sell the property. Subsequent to the classification of property as held for sale, no further depreciation expense is recorded. Real estate assets held for sale are stated separately on the accompanying consolidated balance sheets. The operating results of real estate assets held for sale and sold are reported as discontinued operations in the accompanying consolidated statements of operations. The income (loss) from discontinued operations includes the revenues and expenses, including depreciation, associated with the properties. This classification of operating results as discontinued operations applies retroactively for all periods presented for properties designated as held for sale. Additionally, net gains and losses on properties designated as held for sale are classified as part of discontinued operations. The Company had one property classified as held for sale as of December 31, 2010 and none as of December 31, 2009.
Cash and Cash Equivalents
The Company considers highly liquid short-term investments with initial maturities of three months or less to be cash equivalents. Cash and cash equivalents are primarily held in one or more financial institutions, and at times, such balances may be in excess of the Federal Deposit Insurance Corporation insurance limit.
Restricted Cash
Restricted cash totaled approximately $6,892 as of December 31, 2010. Of this amount, approximately $6,803 represents proceeds received from the 1325-1375 McCandless Drive property sale and earned interest income held in a separate cash account at a trust company for future use in tax-deferred exchanges and approximately $89 represents a balance the Company has consolidated due to the accounting provisions applicable to a variable interest entity. The Company does not possess or control these funds or have any rights to receive them except as provided in the applicable agreements. Therefore, restricted cash is not available for distribution to stockholders.
Funds Held at Qualified Intermediary for 1031 Exchange
Periodically, the Company enters into exchange agreements with qualified intermediaries to facilitate the exchange of real property pursuant to Section 1031 of the Code (“Section 1031 Exchange”). A Section 1031 Exchange generally allows for the deferral of income taxes related to the gain attributable to the sale of property if qualified replacement properties are identified within 45 days and such qualified replacement properties are acquired within 180 days from the initial sale. During the replacement period, the Company may direct the proceeds from a disposition to be held at a qualified intermediary for the sole purpose of completing a Section 1031 Exchange. The proceeds are generally classified as restricted cash.
Restricted Investment in Marketable Securities
Marketable securities reported in the Company’s consolidated balance sheets are accounted for as trading securities. These securities were considered restricted because they were held by our consolidated variable interest entity (see Note 7 below). The marketable securities are adjusted to fair value at the end of each accounting period, with the corresponding gain and loss recorded in unrealized gain or loss from investment. For the years ended December 31, 2010 and 2009, the Company recorded net realized and unrealized gain of approximately $4,067 and $5,011, respectively, related to the sale of the securities and the increase in fair value of the marketable securities. As of December 31, 2010, the Company had no investments in marketable securities.
Other Assets
Included in other assets are costs associated with obtaining debt financing and commissions associated with new leases. Such debt financing costs are being amortized over the term of the associated debt, by a method that approximates the effective interest method and such lease commissions are amortized straight-line over the term of the related lease. If the lease is terminated prior to the end of the lease term, the Company charges any unamortized capitalized lease commission cost to expense in the period that the lease is terminated. Also included in other assets are commitments from the Berg Group of approximately $7,494 to construct a building at 245 Caspian Drive in Sunnyvale, California (see Note 13 below).
-52-
MISSION WEST PROPERTIES, INC.
NOTES TO CONSOLIDATED FINANCIAL STATEMENTS, continued
(Dollars in thousands, except per share data)
Noncontrolling Interests in Operating Partnerships
Noncontrolling interests in the operating partnerships represent the proportionate share of the equity in the operating partnerships of the limited partners. Net income attributable to noncontrolling interests is allocated based on their relative ownership percentage of the operating partnerships during the reported period. The issuance of additional shares of common stock or O.P. Units results in changes to the noncontrolling interests’ percentage. As a result, all equity transactions result in an allocation between equity and the noncontrolling interests in the Company’s consolidated balance sheets and statements of equity to account for the changes in the noncontrolling interests’ ownership percentage.
Revenue Recognition
Rental income is derived from operating leases and recognized on the straight-line method of accounting required by GAAP under which contractual rent payment increases are recognized evenly over the lease term. The difference between recognized rental income and rental cash receipts is recorded as “Deferred rent” on the consolidated balance sheets. Certain lease agreements contain terms that provide for additional rents based on reimbursement of certain costs including property operating expenses, maintenance and real estate taxes. These additional rents from tenant reimbursements are reflected on the accrual basis.
Rental income is affected if existing tenants terminate or amend their leases. The Company tries to identify tenants who may be likely to declare bankruptcy, cease operations or otherwise terminate leases prior to the end of the lease term, such as tenants who do not occupy all or a large portion of the property being leased. By anticipating these events in advance, the Company expects to take steps to minimize their impact on its reported results of operations through lease renegotiations and other appropriate measures. Provisions against “Deferred rent” are estimated by management based on known financial conditions of tenants and management’s estimate of net realizability of such receivables based on existing or expected negotiations with tenants. The Company’s judgments and estimations about tenants’ capacity to continue to meet their lease obligations will affect the rental income recognized. To date, actual reductions in revenue as a result of early terminations and the tenants’ inability to pay have been within management’s estimates. However, material differences may result in the amount and timing of the Company’s rental income for any period if it made different judgments or estimations.
Lease termination fees are recognized in operating revenues when there is a signed termination letter agreement, all of the conditions of the agreement have been met, the tenant is no longer occupying the property and the termination consideration is probable of collection. These fees are paid by tenants who want to terminate their lease obligations before the end of the contractual term of the lease by agreement with the Company. There is no way of predicting or forecasting the timing or amounts of future lease termination fees.
The Company recognizes income from rent, tenant reimbursements and lease termination fees and other income once all of the following criteria are met in accordance with SEC Staff Accounting Bulletin 104, “Revenue Recognition”:
|
·
|
the agreement has been fully executed and delivered;
|
|
·
|
services have been rendered;
|
|
·
|
the amount is fixed and determinable; and
|
|
·
|
the collectability is reasonably assured.
|
Income Taxes
The Company has been taxed as a real estate investment trust (“REIT”) under the Internal Revenue Code of 1986, as amended, (the “Code”) commencing with the taxable year ended December 31, 1999. In order for the Company to qualify as a REIT, it must distribute annually at least 90% of its REIT taxable income, as defined in the Code, to its stockholders and comply with certain other requirements. Accordingly, for the years ended December 31, 2010, 2009 and 2008, no provision for federal income taxes has been included in the accompanying consolidated financial statements.
For the year ended December 31, 2010, the Company’s total dividends paid or payable to the stockholders represented approximately 83.7% ordinary income and 16.3% long-term capital gain for income tax purposes (unaudited). For the year ended December 31, 2009, the Company’s total dividends paid or payable to the stockholders represented approximately 93.4% ordinary income and 6.6% return of capital for income tax purposes (unaudited). For the year ended December 31, 2008, the Company’s total dividends paid or payable to the stockholders represented approximately 73.3% ordinary income, 22.2% long-term capital gain and 4.5% unrecaptured section 1250 gain for income tax purposes (unaudited).
-53-
MISSION WEST PROPERTIES, INC.
NOTES TO CONSOLIDATED FINANCIAL STATEMENTS, continued
(Dollars in thousands, except per share data)
Net Income Per Share
Basic net income available to common stockholders per share is computed by dividing net income available for common stockholders by the weighted-average number of common shares outstanding during the period. Diluted net income available to common stockholders per share is computed by dividing net income available for common stockholders by the sum of the weighted-average number of common shares outstanding during the period plus the assumed exercise of all dilutive securities. The impact of the outstanding O.P. Units is considered in the calculation of diluted net income available to common stockholders per share. The O.P. Units are not reflected in the diluted net income available to common stockholders per share calculation because the exchange of O.P. Units into common stock is on a one-for-one basis, and the O.P. Units are allocated net income on a per share basis equal to the common stock. Accordingly, any exchange would not have any effect on diluted net income available to common stockholders per share.
Accounting for Stock-Based Compensation
The cost of stock options, restricted stock, stock appreciation rights, and stock units, as well as other equity-based compensation arrangements, granted to employees, directors and consultants is reflected in the consolidated financial statements based on the estimated fair value of the awards. As of December 31, 2010, the Company had one stock-based compensation plan.
The Company measures compensation cost for its stock options at fair value on the date of grant and recognizes compensation expense relating to the remaining unvested portion of outstanding stock options at the time of adoption ratably over the vesting period, generally four years. The fair value of the Company’s stock options is determined using the Black-Scholes option pricing model. Compensation expense related to the Company’s share-based awards is included in general and administrative expenses in the Company’s accompanying consolidated statements of operations. For the year ended December 31, 2010, the Company recorded approximately $160 of expense for share-based compensation relating to stock options.
In 2005, the Compensation Committee of the board of directors, in accordance with the provisions of the 2004 Equity Incentive Plan, unanimously approved the following awards of dividend equivalent rights (“DERs”), each such DER representing the current right to receive the dividend paid on one share of the Company’s common stock, when paid by the Company:
|
·
|
The three non-employee outside directors each received 45,000 DERs, which remain in effect as long as the individual continues to serve on the board of directors; and
|
|
·
|
Key employees of the Company received a total of 155,000 DERs, which remain in effect for each key employee as long as they continue to be employed by the Company.
|
In 2008, one director and one employee forfeited 45,000 and 15,000 DERs, respectively, when they resigned from the Company. A new non-employee outside director was awarded 45,000 DERs when he joined the Company’s board of directors in the same year. As of December 31, 2010, there were a total of 275,000 DERs. The Company recorded DER compensation expense of approximately $165, $179 and $217 in 2010, 2009 and 2008, respectively.
Fair Value
Fair value is the price that would be received to sell an asset or paid to transfer a liability in an orderly transaction between market participants. There is a three-level hierarchy of valuation techniques based upon whether the inputs reflect assumptions other market participants would use based upon market data obtained from independent sources (observable inputs) or reflect its own assumptions of market participant valuation (unobservable inputs) and requires the use of observable inputs if such data is available without undue cost and effort. At December 31, 2009, the Company had approximately $12.1 million of financial assets classified as Level 1 and thus measured at fair value using quoted market prices for identical instruments in active markets from an independent third party source. In the second quarter of 2010, the Company sold all of its restricted investment in marketable securities. As of December 31, 2010, the Company did not have any financial assets where it had to measure the fair value.
The Company has an option to report selected financial assets and liabilities at fair value and establish presentation and disclosure requirements designed to facilitate comparisons between companies that choose different measurement attributes for similar types of assets and liabilities. The Company did not elect to apply the fair value option to any specific financial assets or liabilities.
-54-
MISSION WEST PROPERTIES, INC.
NOTES TO CONSOLIDATED FINANCIAL STATEMENTS, continued
(Dollars in thousands, except per share data)
The Company’s financial instruments include cash and cash equivalents, accounts receivable, accounts payable and debt. Considerable judgment is required in interpreting market data to develop estimates of fair value. Accordingly, the estimates presented herein are not necessarily indicative of the amounts that the Company could realize in a current market exchange. The use of different market assumptions and/or estimation methodologies may have a material effect on the estimated fair value amounts. Cash and cash equivalents, accounts receivable, and accounts payable are carried at amounts that approximate their fair values due to their short-term maturities. For fixed rate debt, the Company estimates fair value by using discounted cash flow analyses based on borrowing rates for similar kinds of borrowing arrangements. The fair value of the Company’s fixed rate debt at December 31, 2010 was approximately $353,199 compared with its carrying value of approximately $353,491.
Reclassifications
Certain amounts from prior year’s consolidated financial statements have been reclassified to conform to the presentation of the current year’s consolidated financial statements.
Concentration of Credit Risk
The Company’s properties are not geographically diverse, and its tenants operate primarily in the information technology industry. Additionally, because the properties were leased to 71 tenants at December 31, 2010, default by any major tenant could significantly impact the results of the consolidated total. One tenant, Microsoft Corporation, accounted for approximately 16.0%, 15.8% and 16.5% of the Company’s total cash rental income for the years ended December 31, 2010, 2009 and 2008, respectively. Cash rental income from Microsoft Corporation was approximately $13,179, $12,873 and $12,576 for the years ended December 31, 2010, 2009 and 2008, respectively. Future minimum rents from this tenant are approximately $50,415. One other tenant accounted for approximately 11.3%, 9.4% and 9.8% of the Company’s total cash rental income for the years ended December 31, 2010, 2009 and 2008, respectively. During 2010, nine of the Company’s total tenants relocated or ceased operations.
New Accounting Pronouncements
In June 2009, the FASB updated ASC Topic 810 “Consolidation,” and issued new accounting provisions regarding the consolidation of variable interest entities (“VIEs”). The new accounting provisions modify the existing quantitative guidance used in determining the primary beneficiary of a VIE by requiring entities to qualitatively assess whether an enterprise is a primary beneficiary, based on whether the entity has (i) power over the significant activities of the VIE, and (ii) an obligation to absorb losses or the right to receive benefits that could be potentially significant to the VIE. Additionally, the accounting provisions require an ongoing reconsideration of the primary beneficiary and provides a framework for the events that triggers a reassessment of whether an entity is a VIE. The new accounting provisions became effective for all new and existing VIEs on January 1, 2010. The adoption of the accounting provisions did not have a material impact on the Company’s financial position, results of operations or cash flows.
In February 2010, the FASB issued Accounting Standard Update 2010-09 "Subsequent Events (ASC Topic 855) Amendments to Certain Recognition and Disclosure Requirements," which requires an entity that is an SEC filer to evaluate subsequent events through the date that the financial statements are issued and removes the requirement for an SEC filer to disclose a date through which subsequent events have been evaluated. The adoption did not have an impact on the Company's financial position and results of operations.
|
3.
|
DEFERRED RENT
|
The following table represents activity in the allowance against deferred rent, net for the years ended December 31, 2010, 2009 and 2008.
|
Beginning Balance
|
Provision Against Revenue
|
Charge-off
|
Ending Balance
|
|||||||||||||
|
(dollars in thousands)
|
||||||||||||||||
|
Year ended December 31, 2008
|
$ | 250 | $ | 259 | $ | 259 | $ | 250 | ||||||||
|
Year ended December 31, 2009
|
$ | 250 | $ | 312 | $ | 312 | $ | 250 | ||||||||
|
Year ended December 31, 2010
|
$ | 250 | $ | 1,245 | $ | 1,245 | $ | 250 | ||||||||
-55-
MISSION WEST PROPERTIES, INC.
NOTES TO CONSOLIDATED FINANCIAL STATEMENTS, continued
(Dollars in thousands, except per share data)
|
4.
|
STOCK TRANSACTIONS
|
As of December 31, 2010 and 2009, approximately $2,444 and $2,274 remained outstanding under notes issued in connection with the Company’s purchase of its general partner interests in 1998 (the “demand notes”), respectively. The demand notes which accrue interest at 7.25%, along with the interest expense (interest income to the operating partnerships), are eliminated in consolidation and are not included in the corresponding line items within the consolidated financial statements. However, the interest income earned by the operating partnerships, which is interest expense to the Company, in connection with this debt, is included in the calculation of noncontrolling interest as reported on the consolidated statements of operations, thereby reducing the Company’s net income by this same amount. The Company and the operating partnerships have agreed to extend the due date of the demand notes to September 30, 2012. At present, the Company’s only means for repayment of this debt is through distributions received from the operating partnerships in excess of the amount of dividends to be paid to the Company’s stockholders or by raising additional equity capital.
The limited partners of the operating partnerships have the right to tender their O.P. Units to the Company for shares of common stock or, at the Company’s election, for cash. Each of the limited partners of the operating partnerships (other than Carl E. Berg and Clyde J. Berg) has the annual right to exercise put rights and cause the operating partnerships to purchase a portion of the limited partner’s O.P. Units at a purchase price based on the average market value of the common stock for the 10-trading day period immediately preceding the date of tender, generally limited to one-third of the aggregate number of O.P. Units owned by each limited partner. Upon the exercise of any such right by a limited partner, the Company will have the option to purchase the tendered O.P. Units with available cash, borrowed funds or the proceeds of an offering of newly issued shares of common stock. These put rights are available once a year. If the total purchase price of the O.P. Units tendered by all of the eligible limited partners in one year exceeds $1 million, the Company or the operating partnerships is entitled in its discretion to reduce proportionately the number of O.P. Units to be acquired from each tendering limited partner so that the total purchase price does not exceed $1 million.
During the year ended December 31, 2010, stock options to purchase 10,859 shares of the Company’s common stock were exercised at $6.14 per share. Total proceeds to the Company were approximately $67.
There were no stock option exercises in 2009.
During the year ended December 31, 2008, stock options to purchase 70,487 shares of the Company’s common stock were exercised at $10.00 per share and stock options to purchase 6,667 shares of the Company’s common stock were exercised at $9.51 per share. Total proceeds to the Company were approximately $768.
In 2010, 2009 and 2008, 254,700, 2,122,000 and 6,970 O.P. Units were exchanged for 254,700, 2,122,000 and 6,970 shares of the Company’s common stock, respectively, under the terms of the exchange rights agreement among the Company and all limited partners of the operating partnerships. Neither the Company nor the operating partnerships received any proceeds from the issuance of the common stock in exchange for O.P. Units.
|
5.
|
NONCONTROLLING INTERESTS IN OPERATING PARTNERSHIPS
|
Noncontrolling interests represent the separate private ownership of the operating partnerships, by the Berg Group and other non-affiliate interests. In total, these interests account for 79.16% and 79.35%, on a weighted average basis, of the ownership interests in the real estate operations of the Company as of December 31, 2010 and 2009, respectively. Noncontrolling interests in earnings have been calculated by taking the net income of the operating partnerships (on a stand-alone basis) multiplied by the respective noncontrolling interests’ ownership percentage.
The operating partnerships have ownership interests of 83.33%, 75% and 50% and act as the managing member in three separate joint ventures, which were established to hold properties. The operating partnerships control the joint ventures, and accordingly, these joint ventures are consolidated in the Company’s consolidated financial statements. The noncontrolling interests in the joint ventures are reflected as a component of noncontrolling interests of the operating partnerships. For the years ended December 31, 2010, 2009 and 2008, income associated with the noncontrolling interests held by third parties of the three consolidated joint ventures was approximately $356, $407 and $368, respectively.
-56-
MISSION WEST PROPERTIES, INC.
NOTES TO CONSOLIDATED FINANCIAL STATEMENTS, continued
(Dollars in thousands, except per share data)
|
6.
|
REAL ESTATE
|
Property Acquisitions
On January 8, 2010, the Company acquired a fully leased office/R&D building comprised of approximately 41,400 rentable square feet at 1040-1050 La Avenida Street in Mountain View, California from an unrelated party for approximately $3,853 in cash. The purchase price of 1040-1050 La Avenida Street was allocated to long-lived assets. The in-place lease was valued at fair market so there was no intangible asset allocated to above-or-below market lease value.
There were no property acquisitions in 2009.
Property Dispositions
On October 28, 2010, the Company disposed of one R&D property located at 1325-1375 McCandless Drive in Milpitas, California consisting of approximately 78,000 rentable square feet. A total net gain of approximately $6,199 was recognized and classified as discontinued operations on the total sales price of $14,123. The buyer issued a promissory note to the Company in the amount of $7,123 with an interest rate of 3.00% per annum. The principal amount of the note, together with accrued interest, will be due and payable on October 30, 2011.
There were no property dispositions in 2009.
|
7.
|
VARIABLE INTEREST ENTITY
|
Effective January 1, 2010, the Company adopted the modified accounting provisions pertaining to variable interest entity (“VIE”) under ASC Topic 810 “Consolidation.” The VIE accounting provisions modify the existing quantitative guidance used in determining the primary beneficiary of a VIE by requiring entities to qualitatively assess whether an enterprise is a primary beneficiary, based on whether the entity has (i) power over the significant activities of the VIE, and (ii) an obligation to absorb losses or the right to receive benefits that could be potentially significant to the VIE. Additionally, the accounting provisions require an ongoing reconsideration of the primary beneficiary and provides a framework for the events that triggers a reassessment of whether an entity is a VIE. A VIE must be consolidated by a company if that company is subject to a majority of the entity’s expected losses or entitled to receive a majority of the entity’s expected residual returns or both. The provisions require disclosures about VIEs that a company is not required to consolidate, but in which it has a significant variable interest.
Under the provisions, for an entity to qualify as a VIE one or more of the following three characteristics must exist:
|
1.
|
The equity investment at risk is not sufficient to permit the entity to finance its activities without additional subordinated financial support by any parties, including the equity holders.
|
|
2.
|
The equity investors lack one or more of the following essential characteristics of a controlling financial interest:
|
|
a.
|
the direct or indirect ability to make decisions about the entity’s activities through voting or similar rights;
|
|
b.
|
the obligation to absorb the expected loss of the entity;
|
|
c.
|
the right to receive the expected residual returns of the entity; or
|
|
3.
|
The equity investors have voting rights that are not proportionate to their economic interests, and the activities of the entity involve or are conducted on behalf of an investor with a disproportionately small voting interest.
|
In August 2007, one of the Company’s tenants, Ciena Corporation, entered into an assignment of lease agreement with an unrelated party, M&M Real Estate Control & Restructuring, LLC (“M&M”), in connection with leases for approximately 445,000 rentable square feet located in San Jose, California. As a result of the assignment, M&M assumed all of Ciena’s remaining obligations under these leases and received a payment from Ciena of $53,000, of which $7,000 was reserved for tenant improvements. At the same time, the Company entered into a consent for assignment of lease with both parties and a mutual release agreement with Ciena, pursuant to which all of Ciena’s obligations under these leases were effectively transferred to M&M. M&M is obligated to continue to perform all of the obligations under the assumed Ciena leases and has the right to sublease any or all of the 444,500 rentable square feet vacated by Ciena for the remainder of the current lease term, which expires in 2011. Under the terms of the assignment of lease agreement, the Company received monthly rent payments of approximately $789 from July 2007 through June 2008, received $818 from July 2008 through June 2009, received $849 from July 2009 through June 2010, is receiving $881 from July 2010 through June 2011 and will receive $915 from July 2011 through December 2011. Based upon the accounting provisions for VIE, the Company determined that M&M is a VIE. The Company further determined that it is the primary beneficiary of this VIE and therefore has consolidated this entity for financial reporting purposes. Upon consolidation, the Company recognized a gross lease termination fee of $46,000 in August 2007.
-57-
MISSION WEST PROPERTIES, INC.
NOTES TO CONSOLIDATED FINANCIAL STATEMENTS, continued
(Dollars in thousands, except per share data)
Factors considered by the Company in determining whether M&M should be considered a VIE for financial reporting purposes included the following:
|
·
|
No equity was contributed by the partners in the formation of M&M.
|
|
·
|
At present, the assigned leases are the only properties under management by M&M.
|
|
·
|
Because M&M does not have an operating history that demonstrates its ability to finance its activities without additional subordinated financial support.
|
|
·
|
All revenues, other than interest income, are generated by M&M from the Company in the form of fees or commissions.
|
The Company remains at risk with respect to the assigned leases because if M&M’s operating expenses exceed its interest income, fees and commissions there would be insufficient funds to meet the assigned lease obligation without additional financial support from equity holders or other parties. The Company, which had released the original tenant from its obligations under the lease, would have to absorb the majority of any loss, making it the primary beneficiary of M&M’s activities. The Company re-evaluated its interest in M&M. Based on the evaluation performed, management concluded that there is no change from its initial assessment and continues to consolidate the entity.
-58-
MISSION WEST PROPERTIES, INC.
NOTES TO CONSOLIDATED FINANCIAL STATEMENTS, continued
(Dollars in thousands, except per share data)
|
8.
|
DEBT
|
The following table sets forth certain information regarding debt outstanding as of December 31, 2010 and 2009.
|
Debt Description
|
Collateral Properties
|
Balance at December 31,
|
Maturity Date
|
Interest Rate
|
|||||||||||
|
2010
|
2009
|
||||||||||||||
|
Line of Credit:
|
|||||||||||||||
|
Heritage Bank of Commerce (1)
|
1600 Memorex Drive, Santa Clara, CA
1688 Richard Avenue, Santa Clara, CA
1700 Richard Avenue, Santa Clara, CA
|
- | $ | 14,466 |
September 2011
|
(1) | |||||||||
|
Mortgage Notes Payable (related parties) (2) :
|
5300-5350 Hellyer Avenue, San Jose, CA
|
$ | 7,721 | 8,261 |
June 2013
|
7.65 | % | ||||||||
|
Note Payable (related parties):
|
Not Applicable
|
- | 9,325 |
June 2010
|
(7) | ||||||||||
|
Mortgage Notes Payable (2) :
|
|||||||||||||||
|
Hartford Life Insurance Company (3)
Hartford Life and Accident Insurance Company
Hartford Life and Annuity Insurance Company
(collectively known as the “Hartford Loan I”)
|
5981 Optical Court, San Jose, CA
5500 Hellyer Avenue, San Jose, CA
5550 Hellyer Avenue, San Jose, CA
4050 Starboard Drive, Fremont, CA
45738 Northport Loop, Fremont, CA
233 South Hillview Drive, Milpitas, CA
10300 Bubb Road, Cupertino, CA
1230 E. Arques, Sunnyvale, CA
1250-1280 E. Arques, Sunnyvale, CA
1212 Bordeaux Lane, Sunnyvale, CA
2904 Orchard Parkway, San Jose, CA
3236 Scott Blvd, Santa Clara, CA
6311 San Ignacio Avenue, San Jose, CA
6321-6325 San Ignacio Avenue, San Jose, CA
6331 San Ignacio Avenue, San Jose, CA
6341-6351 San Ignacio Avenue, San Jose, CA
3540-3580 Bassett Street, Santa Clara, CA
|
108,262 | 111,485 |
October 2018
|
6.21 | % | |||||||||
|
Hartford Life Insurance Company (4)
Hartford Life and Accident Insurance Company
(collectively known as the “Hartford Loan II”)
|
5830-5870 Hellyer Avenue, San Jose, CA
5750 Hellyer Avenue, San Jose, CA
255 Caspian Drive, Sunnyvale, CA
5970 Optical Court, San Jose, CA
3301 Olcott Street, Santa Clara, CA
|
39,741 | - |
September 2030
|
6.05 | % | |||||||||
|
Northwestern Mutual Life Insurance Co. (5)
|
1750 Automation Parkway, San Jose, CA
1756 Automation Parkway, San Jose, CA
1762 Automation Parkway, San Jose, CA
6320 San Ignacio Avenue, San Jose, CA
6540-6541 Via Del Oro, San Jose, CA
6385-6387 San Ignacio Avenue, San Jose, CA
20605-20705 Valley Green Drive, Cupertino, CA
2001 Walsh Avenue, Santa Clara, CA
2220 Central Expressway, Santa Clara, CA
2300 Central Expressway, Santa Clara, CA
2330 Central Expressway, Santa Clara, CA
|
73,357 | 77,444 |
February 2013
|
5.64 | % | |||||||||
|
Allianz Life Insurance Company (I) (6)
|
5900 Optical Court, San Jose, CA
|
21,233 | 22,146 |
August 2025
|
5.56 | % | |||||||||
|
Allianz Life Insurance Company (II) (6)
|
5325-5345 Hellyer Avenue, San Jose, CA
1768 Automation Parkway, San Jose, CA
2880 Scott Boulevard, Santa Clara, CA
2890 Scott Boulevard, Santa Clara, CA
2800 Scott Boulevard, Santa Clara, CA
10450-10460 Bubb Road, Cupertino, CA
6800-6810 Santa Teresa Blvd., San Jose, CA
6850 Santa Teresa Blvd., San Jose, CA
4750 Patrick Henry Drive, Santa Clara, CA
|
103,177 | 107,743 |
August 2025
|
5.22 | % | |||||||||
| 345,770 | 318,818 | ||||||||||||||
|
Total
|
$ | 353,491 | $ | 350,870 | |||||||||||
-59-
MISSION WEST PROPERTIES, INC.
NOTES TO CONSOLIDATED FINANCIAL STATEMENTS, continued
(Dollars in thousands, except per share data)
|
(1)
|
The interest rate on the revolving line of credit is the greater of LIBOR plus 1.75% or 4.00% per annum. The interest rate for the HBC line of credit at December 31, 2010 and 2009 was 4.00%. The Company paid in aggregate approximately $49 in loan and legal fees. The HBC line of credit contains certain financial loan and reporting covenants as defined in the loan agreement. As of December 31, 2010, the Company was in compliance with these loan covenants.
|
|
(2)
|
Mortgage notes payable and mortgage note payable (related parties) generally require monthly installments of interest and principal ranging from approximately $96 to $840 over various terms extending through the year 2030. The weighted average interest rate for the mortgage notes payable was 5.78% and 5.74% at December 31, 2010 and 2009, respectively.
|
|
(3)
|
The Hartford Loan I is payable in monthly installments of approximately $838, which includes principal (based upon a 20-year amortization) and interest. Costs and fees incurred with obtaining this loan aggregated approximately $1,058, which were deferred and amortized over the loan period. The Hartford Loan I contains certain customary covenants as defined in the loan agreement. As of December 31, 2010, the Company was in compliance with these loan covenants.
|
|
(4)
|
The Hartford Loan II is payable in monthly installments of approximately $288, which includes principal (based upon a 20-year amortization) and interest. Costs and fees incurred with obtaining this loan aggregated approximately $457, which were deferred and amortized over the loan period. The Hartford Loan II contains certain customary covenants as defined in the loan agreement. As of December 31, 2010, the Company was in compliance with these loan covenants.
|
|
(5)
|
The Northwestern loan is payable in monthly installments of approximately $696, which includes principal (based upon a 20-year amortization) and interest. Costs and fees incurred with obtaining this loan aggregated approximately $664, which were deferred and amortized over the loan period. The Northwestern loan contains certain customary covenants as defined in the loan agreement. As of December 31, 2010, the Company was in compliance with these loan covenants.
|
|
(6)
|
The Allianz loans are payable in monthly installments of approximately $1,017, which includes principal (based upon a 20-year amortization) and interest. Costs and fees incurred with obtaining these loans aggregated approximately $1,125, which were deferred and amortized over the loan periods. The Allianz loans contain certain customary covenants as defined in the loan agreements. As of December 31, 2010, the Company was in compliance with these loan covenants.
|
|
(7)
|
The Company issued a short-term note to the Berg Group in connection with the quarterly dividend distributions. The interest rate of the note payable is LIBOR plus 1.75% and matured June 30, 2010. The interest rate for the note payable was 1.98% at December 31, 2009.
|
During 2010, the Company issued multiple short-term notes payable to the Berg Group in connection with quarterly dividend distributions. The interest rate on the notes was LIBOR plus 1.75%, and total interest expense incurred in connection with those short-term notes payable in 2010 was approximately $375. The aggregate loan amount totaled approximately $53,025 at the highest level during the year. The Company repaid all of the notes, all accrued interest and the balance outstanding at December 31, 2009 for total repayments of approximately $62,350 to the Berg Group in 2010.
During 2009, the Company issued multiple short-term notes payable to the Berg Group in connection with quarterly dividend distributions. The interest rate on the notes was LIBOR plus 1.75%. The aggregate loan amount totaled approximately $48,745. Of the amount owed, the Company repaid approximately $39,420 to the Berg Group, which includes accrued interest. For the year ended December 31, 2009, interest expense incurred in connection with those short-term notes payable was approximately $112.
Scheduled principal payments on debt as of December 31, 2010 are as follows:
|
Total Debt
(Including Related Parties)
|
||||
|
December 31, 2011
|
$ | 15,187 | ||
|
December 31, 2012
|
16,080 | |||
|
December 31, 2013
|
82,485 | |||
|
December 31, 2014
|
12,183 | |||
|
December 31, 2015
|
12,893 | |||
|
Thereafter
|
214,663 | |||
|
Total
|
$ | 353,491 | ||
-60-
MISSION WEST PROPERTIES, INC.
NOTES TO CONSOLIDATED FINANCIAL STATEMENTS, continued
(Dollars in thousands, except per share data)
9. OPERATING PARTNERSHIP AND STOCKHOLDER DISTRIBUTIONS
Holders of the Company’s common stock and O.P. Units are entitled to dividend distributions as determined and declared by the Company’s board of directors. Under the exchange rights agreement limited partners have the right to tender O.P. Units to the Company, and, at the Company’s election, to receive common stock on a one-for-one basis at then-current market value, an equivalent amount of cash, or a combination of cash and common stock in exchange for the O.P. Units tendered, subject to the 9% overall ownership limit imposed on non-Berg Group stockholders under the Company’s charter document, or the overall 20% Berg Group ownership limit, as the case may be. O.P. Unit holders are entitled to vote when their O.P. Units are converted to shares of the Company’s common stock. Once in each 12-month period beginning each December 29, the limited partners, other than Carl E. Berg and Clyde J. Berg, may exercise a put right to sell their O.P. Units to the operating partnerships at a price equal to the average market price of the common stock for the 10-trading day period immediately preceding the date of tender. Upon any exercise of the put rights, the Company will have the opportunity for a period of 15 days to elect to fund the purchase of the O.P. Units and purchase additional general partner interests in the operating partnerships for cash, unless the purchase price exceeds $1 million in the aggregate for all tendering limited partners, in which case, the operating partnerships or the Company will be entitled, but not required, to reduce proportionally the number of O.P. Units to be acquired from each tendering limited partner so that the total purchase price is not more than $1 million.
During 2010, the Company, as general partner of the operating partnerships, declared quarterly dividends/distributions aggregating $0.60 per common share and O.P. Unit for total dividends/distributions of approximately $63,171, including $15,793 payable in January 2011. Total distributions attributable to O.P. Units owned by various members of the Berg Group were approximately $46,048.
During 2009, the Company, as general partner of the operating partnerships, declared quarterly dividends/distributions aggregating $0.65 per common share and O.P. Unit for total dividends/distributions of approximately $68,429, including $15,791 payable in January 2010. Total distributions attributable to O.P. Units owned by various members of the Berg Group were approximately $49,911.
During 2008, the Company, as general partner of the operating partnerships, declared quarterly dividends/distributions aggregating $0.80 per common share and O.P. Unit for total dividends/distributions of approximately $84,205, including $21,055 payable in January 2009. Total distributions attributable to O.P. Units owned by various members of the Berg Group were approximately $63,040.
|
10.
|
EQUITY-BASED COMPENSATION AND RETIREMENT INVESTMENT PLANS
|
On November 24, 2004, the 2004 Equity Incentive Plan (“2004 Plan”) was approved by the Company’s stockholders. The Company’s board of directors approved the 2004 Plan in September 2004. The 2004 Plan:
|
·
|
transferred up to 3,991,089 remaining shares available for issuance under the Company’s 1997 Plan and terminated the 1997 Plan for any new grants;
|
|
·
|
transferred up to an additional 767,000 shares subject to outstanding options under the 1997 Plan if they expire without being exercised, of which 647,000 shares had been transferred as of December 31, 2010; and
|
|
·
|
includes the ability to grant restricted stock, restricted stock units, performance units, dividend equivalent rights, and other stock-based compensation, including O.P. Units of the Operating Partnerships, as well as incentive and non-statutory stock options.
|
The 2004 Plan was adopted so that the Company may attract and retain the high quality employees, directors and consultants necessary to build the Company’s infrastructure and to provide ongoing incentives to the Company’s employees in the form of options to purchase the Company’s common stock by enabling them to participate in the Company’s success.
The 2004 Plan provides for the granting to employees, including officers (whether or not they are directors) of “incentive stock options” within the meaning of Section 422 of the Code, and for the granting of non-statutory options to employees, directors and consultants of the Company, of which 1,084,535 and 1,255,535 shares of common stock were available for future option or award grants under the 2004 Plan as of December 31, 2010 and 2009, respectively.
-61-
MISSION WEST PROPERTIES, INC.
NOTES TO CONSOLIDATED FINANCIAL STATEMENTS, continued
(Dollars in thousands, except per share data)
In February 2010, stock options to purchase 171,000 shares of common stock were granted to an employee. Of this total grant, options to purchase 85,500 shares vested immediately and options to purchase 85,500 shares vest monthly for 24 months, subject to continued employment with the Company. Each option grant has a term of six years from the date of grant subject to earlier termination in certain events related to termination of employment. The options were granted at an exercise price of $6.99 per share. The estimated fair value of the options granted was $0.43 per share on the date of grant using the Black-Scholes option pricing model with the following assumptions: dividend yield of 8.58%, volatility of 22.57%, risk free rates of 2.40% and an expected life of 5.5 years. All options were granted at fair market value on the date of grant and were approved by the Compensation Committee of the board of directors.
In January 2009, the Compensation Committee of the board of directors approved the rescission of stock options to purchase a total of 650,000 shares of common stock granted to an employee under its 2004 Equity Incentive Plan in November 2008. The rescission was effected because the number of shares subject to the option grant exceeded the maximum number of shares that can be granted by the Company to one individual in any calendar year under its 2004 Equity Incentive Plan.
In January 2009, stock options to purchase 200,000 shares of common stock held by an employee of the Company expired.
In March 2009, stock options to purchase 500,000 shares of common stock were granted to an employee. Of this total grant, options to purchase 175,000 shares vested immediately, options to purchase 100,000 shares vest monthly for nine months and options to purchase 225,000 shares vest monthly for 36 months, subject to continued employment with the Company. Each option grant has a term of six years from the date of grant subject to earlier termination in certain events related to termination of employment. The options were granted at an exercise price of $5.99 per share. The estimated fair value of the options granted was $0.14 per share on the date of grant using the Black-Scholes option pricing model with the following assumptions: dividend yield of 13.36%, volatility of 23.77%, risk free rates of 1.83% and an expected life of 5.5 years. All options were granted at fair market value on the date of grant and were approved by the Compensation Committee.
In April 2009, stock options to purchase 375,000 shares of common stock held by an employee of the Company lapsed without exercise.
In January 2008, stock options to purchase 1,025,000 shares of common stock were granted to employees, non-employee directors and consultants. The options vest monthly for 48 months from date of grant, subject to continued employment or other service to the Company. Each option grant has a term of six years from the date of grant subject to earlier termination in certain events related to termination of employment or service. The options were granted at an exercise price of $9.51 per share. The estimated fair value of the options granted was $0.57 per share on the date of grant using the Black-Scholes option pricing model with the following assumptions: dividend yield of 8.41%, volatility of 20.43%, risk free rates of 3.45% and an expected life of six years. All options were granted at fair market value on the date of grant and were approved by the Compensation Committee of the board of directors.
In July 2008, stock options to purchase 52,500 shares of common stock were granted to an employee and a non-employee director. The options vest monthly for 48 months from date of grant, subject to continued employment or other service to the Company. Each option grant has a term of six years from the date of grant subject to earlier termination in certain events related to termination of employment or service. The options were granted at an exercise price of $11.36 per share. The estimated fair value of the options granted was $0.99 per share on the date of grant using the Black-Scholes option pricing model with the following assumptions: dividend yield of 7.04%, volatility of 22.07%, risk free rates of 3.20% and an expected life of six years. All options were granted at fair market value on the date of grant and were approved by the Compensation Committee of the board of directors.
In November 2008, stock options to purchase 705,000 shares of common stock were granted to employees, non-employee directors and consultants (does not include 650,000 rescinded shares stated above). The options vest monthly ranging from 36-48 months from date of grant, subject to continued employment or other service to the Company. Each option grant has a term of six years from the date of grant subject to earlier termination in certain events related to termination of employment or service. The options were granted at an exercise price of $6.14 per share. The estimated fair value of the options granted was $0.12 per share on the date of grant using the Black-Scholes option pricing model with the following assumptions: dividend yield of 13.03%, volatility of 22.39%, risk free rates of 2.08% and an expected life of six years. All options were granted at fair market value on the date of grant and were approved by the Compensation Committee of the board of directors.
-62-
MISSION WEST PROPERTIES, INC.
NOTES TO CONSOLIDATED FINANCIAL STATEMENTS, continued
(Dollars in thousands, except per share data)
The following table shows the activity and detail for the 2004 Plan for each of the three years in the period ended December 31, 2010.
|
Options
|
Weighted Average
Exercise Price
|
|||||||
|
Outstanding
|
Per Share
|
|||||||
|
Balance, December 31, 2007
|
1,747,100 | $ | 11.13 | |||||
|
Options granted
|
1,782,500 | $ | 8.23 | |||||
|
Options exercised
|
(77,154 | ) | $ | 9.96 | ||||
|
Options forfeited
|
(119,946 | ) | $ | 10.81 | ||||
|
Balance, December 31, 2008
|
3,332,500 | $ | 9.62 | |||||
|
Options granted
|
500,000 | $ | 5.99 | |||||
|
Options forfeited
|
(575,000 | ) | $ | 10.70 | ||||
|
Balance, December 31, 2009
|
3,257,500 | $ | 8.87 | |||||
|
Options granted
|
171,000 | $ | 6.99 | |||||
|
Options exercised
|
(10,859 | ) | $ | 6.14 | ||||
|
Balance, December 31, 2010
|
3,417,641 | $ | 8.79 | |||||
|
Available for grant at December 31, 2010
|
1,084,535 | |||||||
|
Available for grant at December 31, 2009
|
1,255,535 | |||||||
The following table summarizes information regarding options outstanding for the 2004 Plan at December 31, 2010:
|
Options Outstanding
|
Options Exercisable
|
Options Not Exercisable
|
||||||||||||||||||||||||||||
|
Range of Exercise Prices
|
Options
|
Weighted
Average
Remaining
Contractual
Life in Years
|
Weighted
Average
Exercise Price
|
Options
|
Weighted
Average
Exercise Price
|
Options
|
Weighted
Average
Exercise Price
|
|||||||||||||||||||||||
| $ | 5.99 | 500,000 | 4.17 | $ | 5.99 | 406,250 | $ | 5.99 | 93,750 | $ | 5.99 | |||||||||||||||||||
| $ | 6.14 | 694,141 | 3.92 | $ | 6.14 | 490,079 | $ | 6.14 | 204,062 | $ | 6.14 | |||||||||||||||||||
| $ | 6.99 | 171,000 | 5.08 | $ | 6.99 | 121,125 | $ | 6.99 | 49,875 | $ | 6.99 | |||||||||||||||||||
| $ | 9.51 | 760,000 | 3.00 | $ | 9.51 | 554,167 | $ | 9.51 | 205,833 | $ | 9.51 | |||||||||||||||||||
| $ | 10.00 | 590,000 | 0.33 | $ | 10.00 | 590,000 | $ | 10.00 | - | - | ||||||||||||||||||||
| $ | 11.36 | 52,500 | 3.58 | $ | 11.36 | 31,719 | $ | 11.36 | 20,781 | $ | 11.36 | |||||||||||||||||||
| $ | 12.09 | 650,000 | 2.00 | $ | 12.09 | 636,458 | $ | 12.09 | 13,542 | $ | 12.09 | |||||||||||||||||||
| $ | 5.99 to $12.09 | 3,417,641 | 2.82 | $ | 8.79 | 2,829,798 | $ | 9.02 | 587,843 | $ | 7.69 | |||||||||||||||||||
None of the options granted are contingent upon the attainment of performance goals or subject to other restrictions. As of December 31, 2010 and 2009, “in-the-money” outstanding options to purchase 896,329 and 655,938 shares of common stock, respectively, were exercisable.
The 2004 Plan allows the Company to grant to employees and directors a wider range of awards, including restricted stock, stock grants, restricted stock units, performance units, other stock-based compensation, including O.P. Units exchangeable for shares of common stock, and dividend equivalent rights, which will help the Company achieve its goal of attracting, retaining and motivating its personnel which is necessary to build the Company’s infrastructure, achieve the Company’s business goals and enhance stockholder value. No options or awards may be granted under the 2004 Plan after November 24, 2014.
Awards and options granted under the 2004 Plan may be granted to any employees, non-employee directors or consultants of the Company and any corporation or other entity affiliated with the Company, including the Operating Partnerships. Only employees of the Company or a corporate subsidiary may receive incentive stock options. Options can be granted to non-employee directors and consultants of the Company and to employees of the Company or a corporate subsidiary. No individual may receive in any one calendar year options for more than 500,000 of the total number of shares of stock.
The options generally are granted at the fair market value of the Company’s common shares at the date of grant, vest over a four year period, are exercisable upon vesting and expire six years from the date of grant. The exercise price for all incentive stock options under the 2004 Plan shall not be less than the fair market value of the underlying common shares at the time the option was granted.
-63-
MISSION WEST PROPERTIES, INC.
NOTES TO CONSOLIDATED FINANCIAL STATEMENTS, continued
(Dollars in thousands, except per share data)
Under the 2004 Plan, each non-employee member of the board of directors who became or becomes a member of the board of the directors after November 24, 2004, the date on which the 2004 Plan was approved by the Company’s stockholders, receives automatically a grant of an option to purchase 50,000 shares of common stock at an exercise price equal to 100% of the fair market value of the common stock at the date of grant of such option. Such options become exercisable cumulatively with respect to 1/48th of the underlying shares on the first day of each month following the date of grant. Generally, the options must be exercised while the optionee remains a director. In addition, the board of directors may authorize annual option grants or awards to non-employee directors in the board’s discretion as long as the number of shares or equivalent number of underlying shares of common stock in the case of certain awards, does not exceed 50,000 per year. A disinterested majority of the board also may authorize additional options and awards to a director serving as a committee chair or providing other extraordinary service to the Board. The 2004 Plan further provides that upon an acquisition of the Company in which more than 50% of the total voting power of the Company’s outstanding securities is transferred to the acquirer or acquiring parties, options and awards held by non-employee directors will vest in full and become exercisable prior to their expiration.
The board of directors may terminate the 2004 Plan at any earlier time or make modifications of the 2004 Plan as it deems advisable. Awards and options granted at any time during the term of the 2004 Plan will not expire solely because of the termination of the 2004 Plan, and no amendment or modification of the 2004 Plan shall affect the terms of any outstanding award unless the board expressly provides otherwise. Termination or amendment of the 2004 Plan may not adversely affect the rights of the recipient of an award without his or her consent. The Compensation Committee of the board of directors may amend the terms of any option or award previously granted, but such amendment may not impair the rights of the recipient without his or her consent.
An initial total of 4,638,089 shares of common stock are reserved for issuance under the 2004 Plan. At no time may the number of shares issued pursuant to or subject to outstanding awards granted under the 2004 Plan exceed this number, subject to the provisions for increase and adjustment set forth in the 2004 Plan. If any option or award expires, terminates or is cancelled without being exercised in full, or any other award is forfeited, the shares forfeited or not purchased will be available for future grant of awards.
The Company has adopted an employee investment plan (the “Plan”), under Section 401(k) of the Internal Revenue Code. Employees who are at least 21 years old and who have completed six months of eligibility service may become participants in the Plan. Each participant may make contributions to the Plan through salary deferrals in amounts of at least 1% to a maximum of 15% of the participant’s compensation, subject to certain limitations imposed by the Internal Revenue Code. The Company contributes an amount up to 15% of the participant’s compensation, based upon management’s discretion. A participant’s contribution to the Plan is 100% vested and non-forfeitable. A participant will become vested in 100% of the Company’s contributions after two years of eligible service. For the years ended December 31, 2010, 2009 and 2008, the Company recognized approximately $125, $125 and $118, respectively, of expense for employer contributions made in connection with this Plan.
|
11.
|
NET INCOME PER SHARE
|
Basic net income per share is computed by dividing net income by the weighted-average number of common shares outstanding for the period. Diluted net income per share is computed by dividing net income by the sum of weighted-average number of common shares outstanding for the period plus the assumed exercise of all dilutive securities.
The following table provides a reconciliation of net income available to common stockholders and the number of shares used in the computations of “basic” net income per share available to common stockholders and “diluted” net income per share available to common stockholders.
-64-
MISSION WEST PROPERTIES, INC.
NOTES TO CONSOLIDATED FINANCIAL STATEMENTS, continued
(Dollars in thousands, except per share data)
|
Year Ended December 31,
|
||||||||||||
|
2010
|
2009
|
2008
|
||||||||||
|
(dollars in thousands, except per share data)
|
||||||||||||
|
Numerator:
|
||||||||||||
|
Income from continuing operations
|
$ | 7,537 | $ | 8,478 | $ | 10,196 | ||||||
|
Income (loss) from discontinued operations
|
936 | (87 | ) | (62 | ) | |||||||
|
Net income available to common stockholders
|
$ | 8,473 | $ | 8,391 | $ | 10,134 | ||||||
|
Denominator:
|
||||||||||||
|
Weighted average shares of common stock (basic)
|
21,973,599 | 21,736,699 | 19,714,414 | |||||||||
|
Effect of dilutive securities:
|
||||||||||||
|
Incremental shares from assumed stock options exercise
|
148,125 | 186,405 | 281,935 | |||||||||
|
Weighted average shares of common stock (diluted)
|
22,121,724 | 21,923,104 | 19,996,349 | |||||||||
|
Per share data:
|
||||||||||||
|
Basic net income per share:
|
||||||||||||
|
Net income to common stockholders before discontinued operations
|
$ | 0.34 | $ | 0.39 | $ | 0.51 | ||||||
|
Discontinued operations
|
$ | 0.04 | - | - | ||||||||
|
Net income available to common stockholders
|
$ | 0.39 | $ | 0.39 | $ | 0.51 | ||||||
|
Diluted net income per share:
|
||||||||||||
|
Net income to common stockholders before discontinued operations
|
$ | 0.38 | $ | 0.38 | $ | 0.51 | ||||||
|
Discontinued operations
|
$ | 0.04 | - | - | ||||||||
|
Net income available to common stockholders
|
$ | 0.38 | $ | 0.38 | $ | 0.51 | ||||||
Outstanding options to purchase 2,223,500 shares in 2010 and 2,052,500 shares in 2009 were excluded from the computation of diluted net income per share under the treasury stock method because the option exercise price was greater than the weighted average exercise price of the Company’s common stock during the period. The outstanding O.P. Units have been excluded from the diluted net income per share calculation as there would be no effect on the diluted net income per share since the noncontrolling interests’ share of income would also be added back to net income. O.P. Units outstanding at December 31, 2010, 2009 and 2008 were 83,150,265 83,404,965 and 85,526,965, respectively.
|
12.
|
OTHER INCOME
|
Other income from continuing operations was approximately $2,619, $3,756 and $4,220 for the years ended December 31, 2010, 2009 and 2008, respectively. For the year ended December 31, 2010, litigation proceeds, prior tenant bankruptcy settlement, management fee income, and miscellaneous income accounted for approximately $1,285, $140, $995 and $199, respectively, of other income. For the year ended December 31, 2009, deposit forfeiture, insurance claim, prior tenant bankruptcy settlement, management fee income, and miscellaneous income accounted for approximately $2,019, $300, $68, $992 and $377, respectively, of other income. For the year ended December 31, 2008, termination fees, management fee income and miscellaneous income accounted for approximately $3,007, $967 and $246, respectively, of other income.
|
13.
|
RELATED PARTY TRANSACTIONS
|
As of December 31, 2010, the Berg Group owned 75,803,684 O.P. Units of the total 83,150,265 O.P. Units issued and outstanding. As of December 31, 2009, the Berg Group owned 75,880,384 O.P. Units of the total 83,404,965 O.P. Units issued and outstanding. The Berg Group’s interest in the Company represents 74.0% of the Company as of December 31, 2010 and 2009, assuming conversion of the O.P. Units into common shares of the Company.
Property Acquisition
There were no property acquisitions from the Berg Group in 2010 and 2009.
Debt with the Berg Group
As of December 31, 2010 and 2009, debt in the amount of approximately $7,721 and $8,261, respectively, was due the Berg Group under a mortgage note established May 15, 2000 in connection with the acquisition of a 50% interest in Hellyer Avenue Limited Partnership, the obligor under the mortgage note. The mortgage note bears interest at 7.65%, and is due in ten years with principal payments amortized over 20 years. In the fourth quarter of 2008, the Company and the Berg Group agreed to extend the loan maturity date to June 2013. Interest expense incurred in connection with the Berg Group mortgage note was approximately $613, $653 and $690 for the years ended December 31, 2010, 2009 and 2008, respectively.
-65-
MISSION WEST PROPERTIES, INC.
NOTES TO CONSOLIDATED FINANCIAL STATEMENTS, continued
(Dollars in thousands, except per share data)
During 2010, the Company issued multiple short-term notes payable to the Berg Group in connection with quarterly dividend distributions. The interest rates on these notes were LIBOR plus 1.75%. The aggregate loan amount totaled approximately $53,025. The Company has repaid approximately $62,350 to the Berg Group, which includes accrued interest and the balance outstanding at December 31, 2009. For the year ended December 31, 2010, interest expense incurred in connection with those short-term notes payable was approximately $375.
During 2009, the Company issued multiple short-term notes payable to the Berg Group in connection with quarterly dividend distributions. The interest rates on these notes were LIBOR plus 1.75%. The aggregate loan amount totaled approximately $48,745. Of the amount owed, the Company repaid approximately $39,420 to the Berg Group, which includes accrued interest. For the year ended December 31, 2009, interest expense incurred in connection with those short-term notes payable was approximately $112.
Transfer of Interest in Consolidated Joint Venture to Berg Group
In July 2000, the Hellyer Avenue Limited Partnership (“Hellyer LP”) was formally organized as a California limited partnership between Mission West Properties, L.P. (“MWP”), of which the Company as the managing general partner, and Republic Properties Corporation (“RPC”), an unaffiliated third party, as general partner and limited partners. MWP was designated as the managing general partner of Hellyer LP. For a 50% ownership interest in Hellyer LP, RPC agreed to cause Stellex Microwave Systems, Inc. (“Stellex”) to provide a 15-year lease on approximately 160,000 square foot R&D buildings to be constructed by Berg & Berg Enterprises, Inc. (“BBE”) on land owned by another Berg Group member.
As part of the transaction, MWP acquired the underlying land pursuant to the Berg land holdings option agreement for a price of $5.7 million by issuing 659,223 O.P. Units to the Berg Group entity that owned the property. Further, under the terms of the Hellyer LP partnership agreement MWP then contributed the land to the partnership at an agreed value of $9.6 million, which amount was to be amortized and paid to MWP in the form of income and cash flow preferences. The transaction was reviewed and approved by the Independent Directors Committee of the Company’s board of directors.
In connection with the transaction, BBE built and paid for all improvements on the land. The total cost of the R&D buildings, exclusive of specified tenant improvements obligations, was approximately $11.4 million. Hellyer LP issued a note for the amount of those construction costs to BBE, which note was secured by the buildings.
Because RPC’s interest in Hellyer LP was attributable solely to its commitment to obtain Stellex as a tenant for the property, the partnership agreement provided that if a payment default occurred within the first five years of the Stellex lease, RPC would lose 100% of its interest in the partnership, and if a payment default occurred during the second five year period under the lease, RPC would lose 50% of its interest in Hellyer LP.
Pursuant to RPC’s commitment to Hellyer LP, Stellex executed a lease agreement obligating Stellex, among other things, to pay monthly rent starting at $1.60 per square foot on a triple net basis for 15 years and to reimburse BBE for the tenant improvement obligations, which ultimately totaled approximately $10.5 million.
Under the lease terms, Stellex was obligated to reimburse BBE in full for the tenant improvement costs no later than August 25, 2000. Several days before the due date, representatives of Stellex met with representatives of MWP and informed them that Stellex could not pay the balance due BBE. Stellex requested MWP immediately to draw down the letter of credit as a result of default on the tenant improvement payment required under the lease.
On September 1, 2000, MWP, as the general partner of Hellyer LP, ceased all allocations of income and cash flow to RPC and exercised the right under the partnership agreement to cancel RPC’s entire interest in the partnership. Following discussions with and approval by the Independent Directors Committee of the board of directors, the Company authorized the transfer of RPC’s interest in Hellyer LP to BBE. Under the Berg land holdings option agreement and the acquisition agreement dated as of May 14, 1998, the Independent Directors Committee of the board of directors had the right, but not the obligation, to reacquire on behalf of the Company the property interest and the related distributions related to the property interest at any time. The transfer was effective as of September 1, 2000.
In January 2002, Stellex was acquired through its bankruptcy proceeding by a division of Tyco Corporation. In connection with the acquisition of Stellex, the purchaser assumed the lease with Hellyer LP, agreed to comply with all terms of lease and reimbursed BBE for the tenant improvements, as required under the lease agreement and the Bankruptcy Court order.
-66-
MISSION WEST PROPERTIES, INC.
NOTES TO CONSOLIDATED FINANCIAL STATEMENTS, continued
(Dollars in thousands, except per share data)
Since the inception of Hellyer LP, the Company has accounted for the properties owned by the partnership on a consolidated basis, with reductions for the noncontrolling interest held by the noncontrolling partner (first RPC and then BBE). In each period, the Company has accrued amounts payable by Hellyer LP to the noncontrolling interest partner, including BBE, prior to payment. BBE’s share of earnings allocated to its 50% noncontrolling interest was approximately $1.0 million, $0.8 million and $0.8 million in 2010, 2009 and 2008, respectively. As of December 31, 2010, accumulated distributions from profits of Hellyer LP totaling approximately $7.4 million were accrued and distributed to BBE. If the Company’s litigation with RPC (as described under Note 16 below) is ultimately decided in RPC’s favor, the Company anticipates that BBE may be required to return RPC’s former interest in Hellyer LP and all prior distributions to RPC. Due to the uncertainty created by the litigation over Hellyer LP, since October 2003, the Company has recorded such distributions as an account receivable from BBE, which has been included in “Other assets” on the Company’s consolidated balance sheets, with an offsetting account payable to BBE.
In June 2009, the superior court issued a tentative decision that concluded RPC is a partner in the Hellyer LP relating to the Mission West Properties, L.P. v. Republic Properties Corporation litigation. In September 2009, the Superior Court issued a final decision and entry of judgment in favor of RPC that RPC is and at all times was a partner in Hellyer LP and was entitled to receive all past distributions from profits that were paid to BBE plus accrued interest. The Company has filed an appeal. In October 2009, the Company deposited with the clerk of the Santa Clara County Superior Court a check in the amount of approximately $14.0 million. Of this amount, $9.3 million represents the amount owed to RPC and $4.7 million represents a deposit to appeal the court’s final decision in the litigation. Pending the outcome of the appeal, the Company has accrued approximately $3.9 million in interest on the amount of past distributions that would be payable to RPC by Hellyer LP based on the amount of the judgment at the legal rate of interest of 10%. In addition, because RPC’s interest in the Hellyer LP was transferred to BBE and past distributions from profits were paid to BBE, the Company accrued approximately $1.0 million in interest receivable due from BBE. The $1.0 million interest income accrual was calculated at an interest rate of LIBOR plus 1.25%.
The Independent Directors Committee of the board of directors has exercised the right to acquire on behalf of the Company the former RPC interest and related distributions from BBE under the terms of the Berg land holdings option agreement between the Company and the Berg Group if the litigation is ultimately decided in favor of the Company.
Acquisition of Carl E. Berg’s Interest in Unconsolidated Joint Venture
In July 1999, TBI, an unrelated party, advised Carl E. Berg that TBI had an option to purchase approximately 78.89 acres of unimproved land zoned for R&D development in Morgan Hill at $2.50 per square foot that would expire in approximately six months. TBI offered Mr. Berg a 50% interest in the development of this land if Mr. Berg provided 100% financing for the land at 0% interest for three years. Mr. Berg advised TBI of his obligation to offer all R&D development opportunities on the West Coast to the Company and further advised TBI that the Company’s Independent Directors Committee of the board of directors must approve the acquisition of any properties and that the Company’s policy was only to acquire properties that are leased pursuant to the Berg land holdings option agreement. The development joint venture between TBI and the Berg Group proceeded on that basis. Building construction was financed through loans facilitated by the Berg Group. In early 2003, TBI formed TBI-MWP, a new limited partnership, to own all the leased buildings. The Berg Group offered its 50% non-controlling limited partnership interest in TBI-MWP to the Company at cost plus an annual interest rate of 7% on the funds advanced by the Berg Group which amounted to $1.8 million. The Independent Directors Committee of the board of directors and the Berg Group agreed to use a 7% interest rate instead of the rate and fees specified in the Berg land holdings option agreement because the transaction differed from the standard build-to-suit development specified under that agreement. TBI-MWP owned four fully leased buildings totaling approximately 593,000 rentable square feet. The buildings were subject to mortgage loans totaling approximately $53.6 million. The Independent Directors Committee of the board of directors approved the Company’s acquisition of the Berg Group’s 50% interest in the joint venture effective January 1, 2003. The development joint venture between the Berg Group and TBI retained two vacant shell R&D buildings and five unimproved lots. In April 2003, Comcast, Inc. offered to purchase one of the vacant buildings and two acres of adjoining land from the development joint venture for net proceeds of $2.8 million, after debt repayment. Prior to sale of the property, TBI-MWP acquired this property at no cost under the terms of the Berg land holdings option agreement, and the Company received a net distribution of $1.4 million from the sale. The transaction was approved by the Independent Directors Committee of the board of directors. The Berg Group continues to own a 50% interest in the remaining vacant building and five unimproved lots. In July 2006, TBI-MWP sold one R&D property with approximately 126,400 rentable square feet for approximately $8.5 million. The total gain on the sale was approximately $0.9 million of which $0.45 million was the Company’s share. In November 2008, TBI-MWP sold two R&D properties with approximately 311,200 rentable square feet for approximately $65 million. The total gain on the sale was approximately $40.9 million of which approximately $20.5 million was the Company’s share. TBI-MWP currently owns one fully leased R&D building totaling approximately 155,500 rentable square feet.
-67-
MISSION WEST PROPERTIES, INC.
NOTES TO CONSOLIDATED FINANCIAL STATEMENTS, continued
(Dollars in thousands, except per share data)
Berg Controlled Entities have Financial Interests in Certain Tenants that Lease Space from the Company
During the years ended December 31, 2010, 2009 and 2008, Carl E. Berg or entities controlled by Mr. Berg held financial interests in several companies that lease space from the operating partnerships, which include companies where Mr. Berg has a greater than 10% ownership interest. These related party tenants contributed approximately $1,101, $1,118 and $1,218 in rental income in 2010, 2009 and 2008, respectively. Under the Company’s Charter, bylaws and agreements with the Berg Group, the individual members of the Berg Group are prohibited from acquiring shares of the Company’s common stock if such acquisition would result in their beneficial ownership percentage of the Company’s common stock causing the Company to violate any REIT qualification requirement, and currently their share ownership is below a level at which rent from related party tenants would be excluded in determining compliance with REIT qualification tests.
Berg Group Commitment to Complete Future Building in Connection with an Acquisition from the Berg Group under the Berg Land Holdings Option Agreement
The Berg Group has an approximately $7,494 commitment to complete an approximately 75,000 to 90,000 square foot building in connection with the Company’s 2001 acquisition of 245 Caspian Drive in Sunnyvale, California which is comprised of approximately three acres of unimproved land. The Company recorded this portion of its purchase consideration paid to the Berg Group in “Other assets” on its consolidated balance sheets. The Berg Group plans to satisfy this commitment to construct a building when requested by the Company following the approval of the Independent Directors Committee of the board of directors.
Leasing and Overhead Reimbursements Provided by Berg Controlled Entity
The Company currently leases office space owned by Berg & Berg Enterprises for the Company’s headquarters. Rental amount and overhead reimbursements paid to Berg & Berg Enterprises, Inc. were approximately $120, $120 and $114 for the years ended December 31, 2010, 2009 and 2008.
|
14.
|
FUTURE MINIMUM RENTS
|
The Company, through the operating partnerships, owns interests in 111 R&D properties that are leased to tenants under net operating leases with initial terms extending to the year 2020, and are typically subject to fixed increases. Generally, the leases grant tenants renewal options. Future minimum rentals under non-cancelable operating leases as of December 31, 2010, excluding tenant reimbursements of expenses, are as follows:
|
Year
|
Minimum Rent
|
|||
|
(dollars in thousands)
|
||||
|
2011
|
$ | 81,317 | ||
|
2012
|
69,227 | |||
|
2013
|
59,674 | |||
|
2014
|
48,184 | |||
|
2015
|
26,428 | |||
|
Thereafter
|
64,417 | |||
|
Total
|
$ | 349,247 | ||
|
15.
|
SUPPLEMENTAL CASH FLOW INFORMATION
|
Cash paid for interest was approximately $20,736, $22,507 and $20,712 for the years ended December 31, 2010, 2009 and 2008, respectively.
Amounts of approximately $15,793, $15,791 and $21,055 were accrued for dividends and distributions to common stockholders and O.P. Unit holders for the years ended December 31, 2010, 2009 and 2008, respectively.
Amounts of approximately $46,048, $54,154 and $59,888 were paid to the Berg Group for distributions declared to O.P. Unit holders during the years ended December 31, 2010, 2009 and 2008, respectively.
For the years ended December 31, 2010, 2009 and 2008, 254,700, 2,122,000 and 6,970 O.P. Units were exchanged for 254,700, 2,122,000 and 6,970 shares of the Company’s common stock, respectively, under the terms of the exchange rights agreement among the Company and all limited partners of the operating partnerships. These non-cash transactions were valued at approximately $1,735, $15,844 and $66 for the years ended December 31, 2010, 2009 and 2008, respectively, based on the market closing price on the day of the transactions.
-68-
MISSION WEST PROPERTIES, INC.
NOTES TO CONSOLIDATED FINANCIAL STATEMENTS, continued
(Dollars in thousands, except per share data)
In connection with the property disposition of 1325-1375 McCandless Drive in 2010, the Company received a promissory note from the buyer in the amount of $7,123 with an interest rate of 3.00% per annum. The principal amount of the note, together with accrued interest, will be due and payable on October 30, 2011.
In connection with a property acquisition from the Berg Group in 2008, the Company issued a short-term promissory note for approximately $19,068. The interest rate on the note was LIBOR plus 2.00%. For the year ended December 31, 2008, interest expense incurred in connection with this short-term note was approximately $248. The Company fully repaid the balance and interest due as of December 31, 2008.
|
16.
|
COMMITMENTS AND CONTINGENCIES
|
The Company and the operating partnerships, from time to time, are parties to litigation arising out of the normal course of business. The Company is currently involved in the following legal proceedings, and does not believe the ultimate outcome of any of these proceedings will have a material adverse effect on its financial condition or operating results.
Mission West Properties, L.P. v. Republic Properties Corporation, et al. Santa Clara County Superior Court, Case No. CV 796249. In February 2001, while a related case in Maryland was pending, the Company filed a suit against Republic Properties Corporation (“RPC”) in the Superior Court of the State of California for the County of Santa Clara, Case No. CV 796249. The case was stayed pending resolution of the Maryland case, and the Company dismissed its suit on March 4, 2005. In April 2005, RPC submitted a motion asking the superior court to reinstate the case, which the court granted on May 25, 2005. In April 2006, the Maryland case was dismissed by the highest court in Maryland for lack of personal jurisdiction. On July 5, 2006, RPC filed a cross-complaint in the case seeking partnership distributions. On September 17, 2009, the superior court issued a final decision and entry of judgment that concluded RPC is a partner in the Hellyer LP and is entitled to distribution of profits of the Hellyer LP in accordance with its percentage interest together with pre-judgment interest on each distribution from the date it was due and payable in the total amount of approximately $6,625, plus pre-judgment interest of 10% through September 3, 2009 of $2,692, for a total of approximately $9,317. The Company filed an appeal following the court’s issuance of a final decision and entry of judgment. On October 5, 2009, the Company deposited with the clerk of the Santa Clara County Superior Court a check in the amount of approximately $13,975, of which approximately $4,658, or 50% of $9,317, was a deposit to appeal the court’s final decision. The additional $4,658 appeal deposit is refundable regardless of the outcome of the appeal process. Pending the outcome of the appeal, the Company has accrued in the aggregate of approximately $3,935 in interest on the amount of past distributions that would be payable to RPC by Hellyer LP based on the judgment determined at the legal rate of interest of 10%. In addition, the Company has accrued approximately $1,021 in interest receivable due from Berg & Berg Enterprises, Inc. because past distributions with respect to RPC’s interest in Hellyer LP were paid to Berg & Berg Enterprises, Inc., which interest income accrual was calculated at an interest rate of LIBOR plus 1.25%.
Guarantees
Under its articles of incorporation and bylaws, the Company has agreed to indemnify its officers and directors for certain events or occurrences arising as a result of the officer or director’s serving in such capacity. The maximum potential amount of future payments the Company could be required to make under these indemnification agreements is unlimited. The Company believes the estimated fair value of these indemnification agreements is minimal and has recorded no liabilities for these agreements as of December 31, 2010.
The Company also enters into indemnification provisions under its agreements with other companies in its ordinary course of business, typically with lenders, joint venture partners, contractors, and tenants. Under these provisions the Company typically agrees to indemnify and hold harmless the indemnified party for losses suffered or incurred by the indemnified party as a result of certain kinds of activities or inactions of the Company. These indemnification provisions generally survive termination of the underlying agreement. The maximum potential amount of future payments the Company could be required to make under these indemnification provisions is unlimited. The Company has not incurred material costs to defend lawsuits or settle claims related to these indemnification agreements. As a result, the Company believes the estimated fair value of these agreements is minimal. Accordingly, the Company has recorded no liabilities for these agreements as of December 31, 2010.
Seismic Activity
The Company’s properties are located in an active seismic area of Silicon Valley. Insurance policies currently maintained by the Company do not cover seismic activity, although they do cover losses from fires after an earthquake.
-69-
MISSION WEST PROPERTIES, INC.
NOTES TO CONSOLIDATED FINANCIAL STATEMENTS, continued
(Dollars in thousands, except per share data)
Environmental Issues
The environmental investigations that have been conducted on the Company’s properties have not revealed any environmental liability that it believes would have a material adverse effect on its financial condition, results of operations and assets. To the extent any environmental report or investigation reveals environmental issues, the tenant is responsible for the cost of any remediation under the terms and conditions of the Company’s lease agreement and the law. Nonetheless, it is possible that there are material environmental liabilities of which the Company is unaware. The Company cannot assure you that future laws, ordinances, or regulations will not impose any material environmental liability, or that the current environmental condition of the properties has not been, or will not be, affected by tenants and occupants of the properties, by the condition of properties in the vicinity of the properties, or by third parties unrelated to the Company.
|
17.
|
REAL ESTATE ASSET HELD FOR SALE AND DISCONTINUED OPERATIONS
|
The Company follows the accounting provisions and reporting for the impairment and disposal of long lived assets. In general, income or loss attributable to the operations and sale of property and the operations related to property held for sale are classified as discontinued operations in the consolidated statements of operations. Prior period consolidated statements of operations presented in this report have been reclassified to reflect the income or loss related to properties that were held for sale or sold and presented as discontinued operations for the years ended December 31, 2010, 2009 and 2008. Additionally, all periods presented in this report will likely require further reclassification in future periods if additional properties are held for sale or property sales occur.
In 2010, the Company sold one R&D property for a total sales price of approximately $14,123 resulting in a net gain of approximately $6,199.
As of December 31, 2010, there was one property under contract to be sold which would qualify as assets held for sale.
Results of operations for these properties for the years ended December 31, 2010, 2009 and 2008 are as follows:
|
Year Ended December 31,
|
||||||||||||
|
2010
|
2009
|
2008
|
||||||||||
|
(dollars in thousands)
|
||||||||||||
|
Revenues:
|
||||||||||||
|
Rental income
|
$ | 37 | $ | 55 | $ | 148 | ||||||
|
Tenant reimbursements
|
48 | 63 | 113 | |||||||||
|
Other income
|
- | - | 3 | |||||||||
|
Total operating revenues
|
85 | 118 | 264 | |||||||||
|
Expenses:
|
||||||||||||
|
Property operating, maintenance and real estate taxes
|
262 | 328 | 320 | |||||||||
|
Depreciation
|
285 | 324 | 329 | |||||||||
|
Total operating expenses
|
547 | 652 | 649 | |||||||||
|
Net loss attributable to discontinued operations
|
(462 | ) | (534 | ) | (385 | ) | ||||||
|
Net gain on disposal of discontinued operations
|
6,199 | - | - | |||||||||
|
Income (loss) from discontinued operations
|
$ | 5,737 | $ | (534 | ) | $ | (385 | ) | ||||
|
18.
|
ACQUISITION-RELATED INTANGIBLE ASSETS
|
Amortization expense related to in-place leases of approximately $708, $637 and $600 was recorded for the years ended December 31, 2010, 2009 and 2008, respectively.
Details of real estate related intangible assets at December 31, 2010 and 2009 are as follows:
|
December 31,
|
||||||||
|
2010
|
2009
|
|||||||
|
(dollars in thousands)
|
||||||||
|
Amortizable intangible assets:
|
||||||||
|
In-place leases
|
$ | 3,240 | $ | 3,240 | ||||
|
Accumulated amortization
|
(2,687 | ) | (1,978 | ) | ||||
|
Net real estate related intangible assets
|
$ | 553 | $ | 1,262 | ||||
-70-
MISSION WEST PROPERTIES, INC.
NOTES TO CONSOLIDATED FINANCIAL STATEMENTS, continued
(Dollars in thousands, except per share data)
The estimated aggregate amortization expense for the real estate related intangible assets for the remaining fiscal years is as follows:
|
Year
|
Estimated In-place Lease
Amortization (expense)
|
|||
|
(dollars in thousands)
|
||||
|
2011
|
$ | 292 | ||
|
2012
|
224 | |||
|
2013
|
37 | |||
|
Total
|
$ | 553 | ||
|
19.
|
FAIR VALUE OF RESTRICTED INVESTMENT IN MARKETABLE SECURITIES
|
In accordance with the accounting provisions for certain investments in debt and equity securities, investments in debt and equity “marketable” securities are classified at acquisition, and on subsequent reporting dates, into one of the following categories: (a) Trading Securities - debt and equity securities purchased and held principally for the purpose of selling them in the near future. (b) Available-for-Sale Securities - debt securities not classified as held-to-maturity, and debt and equity securities not classified as trading securities. (c) Held-to-Maturity Debt Securities - those debt securities for which the company has the “positive intent and ability to hold the securities to maturity.”
As of December 31, 2010, the Company had no restricted investment in marketable securities. The Company’s restricted investment in marketable securities on December 31, 2009 was classified as trading securities. The marketable securities are classified as Level 1 of the fair value hierarchy in accordance with the accounting provisions for fair value measurements and disclosures and thus measured at fair value using quoted market prices for identical instruments in active markets from an independent third party source. Unrealized holdings gains and losses (differences between the initial cost and the fair value at the balance sheet date) are included in net income of the current period, and interest and dividend revenue, as well as realized gains and losses on sales, are included in net income of the current period.
The only financial asset or liability recorded at fair value in the Company’s consolidated financial statements is the restricted investment in marketable securities as of December 31, 2009, which was funded by the Company’s restricted cash through its VIE. The restricted marketable securities are an investment of a real estate investment trust company traded on the New York Stock Exchange Euronext. The Company determined the fair value for the marketable securities using quoted prices in active markets for identical securities (Level 1 – see Note 2 under New Accounting Pronouncements).
In the second quarter of 2010, the Company sold all of its restricted investment in marketable securities for a net total of approximately $15,913. The Company realized a net cash gain of approximately $9,601, which included approximately $298 in cash dividends received during the holding period. For the year ended December 31, 2010, the Company recorded net realized and unrealized gain of approximately $4,067.
As of December 31, 2009, the fair value of the marketable securities totaled approximately $12,069, including dividends, and the cost thereof was approximately $6,610. The marketable securities are adjusted to fair value at the end of each accounting period, with the corresponding gain and loss recorded in unrealized gain or loss from investment. For the years ended December 31, 2009 and 2008, the Company recorded net unrealized gain (loss) of approximately $5,011 and ($278), respectively, related to the increase or decrease in fair value of the marketable securities, which was reported in unrealized gain (loss) from investment in the Company’s consolidated statement of operations.
|
20.
|
INCOME TAXES
|
In accordance with ASC Topic 740 "Income Taxes," the Company believes that it has appropriate support for the income tax positions taken and, as such, does not have any uncertain tax positions that result in a material impact on the Company's financial position or results of operation. The Company recognizes the tax benefit from an uncertain tax position only if it is “more-likely-than-not” that the tax position will be sustained on examination by taxing authorities. The prior three years' income tax returns are subject to review by the Internal Revenue Service. The Company will recognize potential interest and penalties related to uncertain tax positions, if any, as a component of the provision for income taxes.
-71-
MISSION WEST PROPERTIES, INC.
NOTES TO CONSOLIDATED FINANCIAL STATEMENTS, continued
(Dollars in thousands, except per share data)
|
21.
|
SUPPLEMENTAL FINANCIAL INFORMATION (Unaudited)
|
Quarterly financial information for the year ended December 31, 2010 (1) is as follows:
|
For the Three Months Ended
|
||||||||||||||||
|
March 31,
|
June 30,
|
September 30,
|
December 31,
|
|||||||||||||
|
(Unaudited)
|
||||||||||||||||
|
(dollars in thousands)
|
||||||||||||||||
|
Rental income
|
$ | 20,803 | $ | 20,659 | $ | 20,596 | $ | 19,657 | ||||||||
|
Operating income
|
$ | 13,434 | $ | 12,903 | $ | 10,911 | $ | 10,094 | ||||||||
|
Net income
|
$ | 10,267 | $ | 10,160 | $ | 5,605 | $ | 4,725 | ||||||||
|
Net income available to common stockholders
|
$ | 2,458 | $ | 2,460 | $ | 1,370 | $ | 2,185 | ||||||||
|
Per share data:
|
||||||||||||||||
|
Basic net income per share
|
$ | 0.11 | $ | 0.11 | $ | 0.06 | $ | 0.10 | ||||||||
|
Diluted net income per share
|
$ | 0.11 | $ | 0.11 | $ | 0.06 | $ | 0.10 | ||||||||
|
Weighted average shares of common stock (basic)
|
21,881,189 | 21,957,654 | 21,976,679 | 22,076,694 | ||||||||||||
|
Weighted average shares of common stock (diluted)
|
22,056,805 | 22,123,527 | 22,109,391 | 22,198,946 | ||||||||||||
Quarterly financial information for the year ended December 31, 2009 (1) is as follows:
|
For the Three Months Ended
|
||||||||||||||||
|
March 31,
|
June 30,
|
September 30,
|
December 31,
|
|||||||||||||
|
(Unaudited)
|
||||||||||||||||
|
(dollars in thousands)
|
||||||||||||||||
|
Rental income
|
$ | 20,634 | $ | 20,413 | $ | 20,431 | $ | 20,988 | ||||||||
|
Operating income
|
$ | 13,454 | $ | 10,950 | $ | 12,147 | $ | 14,684 | ||||||||
|
Net income
|
$ | 5,740 | $ | 7,327 | $ | 11,395 | $ | 10,521 | ||||||||
|
Net income available to common stockholders
|
$ | 1,432 | $ | 1,785 | $ | 2,766 | $ | 2,409 | ||||||||
|
Per share data:
|
||||||||||||||||
|
Basic net income per share
|
$ | 0.07 | $ | 0.08 | $ | 0.13 | $ | 0.11 | ||||||||
|
Diluted net income per share
|
$ | 0.07 | $ | 0.08 | $ | 0.13 | $ | 0.11 | ||||||||
|
Weighted average shares of common stock (basic)
|
21,614,878 | 21,766,343 | 21,770,211 | 21,793,037 | ||||||||||||
|
Weighted average shares of common stock (diluted)
|
21,770,489 | 21,899,906 | 21,902,387 | 21,979,442 | ||||||||||||
|
(1)
|
The summation of the quarterly financial data may not equal the annual number reported on the consolidated statements of operations due to rounding differences.
|
|
22.
|
SUBSEQUENT EVENTS
|
On January 6, 2011, the Company paid dividends of $0.15 per share of common stock to all common stockholders of record as of December 31, 2010. On the same date, the operating partnerships paid a distribution of $0.15 per O.P. Unit to all O.P. Unit holders. Aggregate dividends and distributions amounted to approximately $15,793.
On March 14, 2011, the Company's board of directors approved our recommendation to decrease the quarterly dividend payment rate to common stockholders and O.P. Unit holders from $0.15 to $0.13 per share effective the first quarter of 2011.
-72-
INTENTIONALLY BLANK
-73-
|
MISSION WEST PROPERTIES, INC.
|
||||||||||||||||||||||||||||||||||
|
Schedule III
|
||||||||||||||||||||||||||||||||||
|
Real Estate and Accumulated Depreciation and Amortization
|
||||||||||||||||||||||||||||||||||
|
December 31, 2010
|
||||||||||||||||||||||||||||||||||
|
(dollars in thousands)
|
||||||||||||||||||||||||||||||||||
|
Initial Cost
|
|
Total Cost
|
||||||||||||||||||||||||||||||||
|
Property Name
|
City
|
December 31, 2010
Encumbrances |
Land
|
Buildings
and |
Cost
Subsequent to |
Land
|
Buildings
and |
Total
|
Accumulated
Depreciation |
Date of
Acquisition |
Depreciable
Life |
|
||||||||||||||||||||||
|
5300-5350 Hellyer Avenue
|
San Jose
|
C | $ | 7,721 | $ | 5,742 | $ | 11,442 |
|
$ | 5,742 | $ | 11,442 | $ | 17,184 | $ | 3,039 | 05/00 | M | |||||||||||||||
|
10401-10411 Bubb Road
|
Cupertino
|
A | 633 | 3,078 | 633 | 3,078 | 3,711 | 963 | 07/98 | M | ||||||||||||||||||||||||
|
45365 Northport Loop
|
Fremont
|
2,447 | 5,711 | $ | 11 | 2,447 | 5,722 | 8,169 | 1,475 | 10/00 | M | |||||||||||||||||||||||
|
45738 Northport Loop
|
Fremont
|
F | 891 | 4,338 | 5 | 891 | 4,343 | 5,234 | 1,360 | 07/98 | M | |||||||||||||||||||||||
|
4050 Starboard Drive
|
Fremont
|
F | 1,329 | 6,467 | 8 | 1,329 | 6,475 | 7,804 | 2,025 | 07/98 | M | |||||||||||||||||||||||
|
3501 W. Warren Ave/Fremont Blvd
|
Fremont
|
1,866 | 9,082 | 1,366 | 1,866 | 10,448 | 12,314 | 4,166 | 07/98 | M | ||||||||||||||||||||||||
|
48800 Milmont Blvd
|
Fremont
|
1,013 | 4,932 | 1,013 | 4,932 | 5,945 | 1,543 | 07/98 | M | |||||||||||||||||||||||||
|
4750 Patrick Henry Drive
|
Santa Clara
|
H | 1,604 | 7,805 | 405 | 1,604 | 8,210 | 9,814 | 2,855 | 07/98 | M | |||||||||||||||||||||||
|
3520 Bassett Street
|
Santa Clara
|
D | 1,104 | 5,371 | 1,104 | 5,371 | 6,475 | 1,679 | 07/98 | M | ||||||||||||||||||||||||
|
3530 Bassett Street
|
Santa Clara
|
B,D | 849 | 4,133 | 849 | 4,133 | 4,982 | 1,293 | 07/98 | M | ||||||||||||||||||||||||
|
5850-5870 Hellyer Avenue
|
San Jose
|
F | 2,787 | 6,502 | 131 | 2,787 | 6,633 | 9,420 | 2,086 | 11/98 | M | |||||||||||||||||||||||
|
5750 Hellyer Avenue
|
San Jose
|
F | 3,266 | 3,354 | 2,798 | 3,266 | 6,152 | 9,418 | 2,173 | 08/01 | M | |||||||||||||||||||||||
|
800 Embedded Way
|
San Jose
|
L | 1,794 | - | 1,794 | - | 1,794 | - | 03/00 | - | ||||||||||||||||||||||||
|
5500 Hellyer Avenue
|
San Jose
|
F | 4,735 | 12,485 | 1,545 | 4,735 | 14,030 | 18,765 | 3,534 | 02/01 | M | |||||||||||||||||||||||
|
5550 Hellyer Avenue
|
San Jose
|
F | 3,261 | 3,478 | 3,755 | 3,261 | 7,233 | 10,494 | 2,659 | 06/01 | M | |||||||||||||||||||||||
|
5400 Hellyer Avenue
|
San Jose
|
3,238 | 5,007 | 215 | 3,238 | 5,222 | 8,460 | 1,531 | 07/00 | M | ||||||||||||||||||||||||
|
5325 Hellyer Avenue
|
San Jose
|
H | 4,684 | 10,230 | 40 | 4,684 | 10,270 | 14,954 | 2,606 | 01/01 | M | |||||||||||||||||||||||
|
875 Embedded Way
|
San Jose
|
H | 4,866 | 5,822 | 2,529 | 4,866 | 8,351 | 13,217 | 2,068 | 01/02 | M | |||||||||||||||||||||||
|
5905-5965 Silver Creek Valley Road
|
San Jose
|
8,437 | 17,316 | 46 | 8,437 | 17,362 | 25,799 | 4,124 | 07/01 | M | ||||||||||||||||||||||||
|
5905-5965 Silver Creek Valley Road
|
San Jose
|
3,438 | 2,727 | 3,438 | 2,727 | 6,165 | 631 | 10/01 | M | |||||||||||||||||||||||||
|
5845 Hellyer Avenue
|
San Jose
|
6,090 | 5,029 | 6,090 | 5,029 | 11,119 | 419 | 09/07 | M | |||||||||||||||||||||||||
|
855 Embedded Way
|
San Jose
|
3,289 | 6,521 | 60 | 3,289 | 6,581 | 9,870 | 1,640 | 05/01 | M | ||||||||||||||||||||||||
|
1065-1105 La Avenida Street
|
Mountain View
|
46,832 | 109,275 | 65 | 46,832 | 109,340 | 156,172 | 32,116 | 04/99 | M | ||||||||||||||||||||||||
|
1040-1050 La Avenida Street
|
Mountain View
|
3,653 | 200 | 3,653 | 200 | 3,853 | 100 | 01/10 | M | |||||||||||||||||||||||||
|
1875 Charleston Road
|
Mountain View
|
N | - | 2,615 | - | 2,615 | 2,615 | 967 | 04/06 | M | ||||||||||||||||||||||||
|
1750 Automation Parkway
|
San Jose
|
G | 4,789 | 11,174 | 315 | 4,789 | 11,489 | 16,278 | 3,303 | 07/99 | M | |||||||||||||||||||||||
|
1756 Automation Parkway
|
San Jose
|
G | 4,378 | 10,216 | 704 | 4,378 | 10,920 | 15,298 | 3,083 | 01/00 | M | |||||||||||||||||||||||
|
1762 Automation Parkway
|
San Jose
|
G | 4,804 | 12,224 | 1,332 | 4,804 | 13,556 | 18,360 | 3,947 | 04/00 | M | |||||||||||||||||||||||
|
1768 Automation Parkway
|
San Jose
|
H | 8,195 | 19,121 | 218 | 8,195 | 19,339 | 27,534 | 5,039 | 12/00 | M | |||||||||||||||||||||||
|
255 Caspian Drive
|
Sunnyvale
|
F | 3,491 | 7,160 | 1,658 | 3,491 | 8,818 | 12,309 | 2,849 | 04/00 | M | |||||||||||||||||||||||
|
245 Caspian Drive
|
Sunnyvale
|
5,894 | - | 5,894 | - | 5,894 | - | 04/01 | - | |||||||||||||||||||||||||
|
5981 Optical Court
|
San Jose
|
F | 4,054 | 14,938 | 298 | 4,054 | 15,236 | 19,290 | 2,634 | 01/08 | M | |||||||||||||||||||||||
|
5970 Optical Court
|
San Jose
|
F | 2,758 | 8,395 | 2,758 | 8,395 | 11,153 | 1,469 | 12/03 | M | ||||||||||||||||||||||||
|
5900 Optical Court
|
San Jose
|
3,634 | 12,677 | 83 | 3,634 | 12,760 | 16,394 | 2,777 | 07/02 | M | ||||||||||||||||||||||||
|
2630 Orchard Parkway
|
San Jose
|
2,932 | 5,863 | 22 | 2,932 | 5,885 | 8,817 | 1,317 | 03/02 | M | ||||||||||||||||||||||||
|
2610 Orchard Parkway
|
San Jose
|
K | 2,615 | 5,231 | 2,615 | 5,231 | 7,846 | 1,156 | 03/02 | M | ||||||||||||||||||||||||
|
55 West Trimble Road
|
San Jose
|
K | 4,435 | 8,869 | 4,435 | 8,869 | 13,304 | 1,959 | 03/02 | M | ||||||||||||||||||||||||
|
2001 Walsh Avenue
|
Santa Clara
|
E,G,J | 4,610 | 3,887 | 4,610 | 3,887 | 8,497 | 758 | 04/03 | M | ||||||||||||||||||||||||
|
2880 Scott Blvd
|
Santa Clara
|
E,H,J | 14,501 | 22,555 | 471 | 14,501 | 23,026 | 37,527 | 4,522 | 04/03 | M | |||||||||||||||||||||||
|
2890 Scott Blvd
|
Santa Clara
|
E,H,J | 3,081 | 9,696 | 25 | 3,081 | 9,721 | 12,802 | 1,894 | 04/03 | M | |||||||||||||||||||||||
|
2770-2800 Scott Blvd
|
Santa Clara
|
E,H | 7,138 | 7,075 | 170 | 7,138 | 7,245 | 14,383 | 1,502 | 04/03 | M | |||||||||||||||||||||||
|
2300 Central Expressway
|
Santa Clara
|
E,G,J | 2,390 | 2,459 | 50 | 2,390 | 2,509 | 4,899 | 494 | 04/03 | M | |||||||||||||||||||||||
|
2220 Central Expressway
|
Santa Clara
|
E,G,J | 3,305 | 3,427 | 816 | 3,305 | 4,243 | 7,548 | 1,242 | 04/03 | M | |||||||||||||||||||||||
|
2330 Central Expressway
|
Santa Clara
|
E,G | 3,673 | 3,932 | 1,062 | 3,673 | 4,994 | 8,667 | 1,506 | 04/03 | M | |||||||||||||||||||||||
|
233 South Hillview Drive
|
Milpitas
|
F,O | 3,335 | 10,076 | 3,335 | 10,076 | 13,411 | 2,358 | 03/06 | M | ||||||||||||||||||||||||
|
2251 Lawson Lane
|
Santa Clara
|
1,952 | 9,498 | 622 | 1,952 | 10,120 | 12,072 | 3,227 | 07/98 | M | ||||||||||||||||||||||||
|
1230 East Arques
|
Sunnyvale
|
F | 540 | 2,628 | 39 | 540 | 2,667 | 3,207 | 864 | 07/98 | M | |||||||||||||||||||||||
|
1250 East Arques
|
Sunnyvale
|
F | 1,335 | 6,499 | 1,335 | 6,499 | 7,834 | 2,032 | 07/98 | M | ||||||||||||||||||||||||
|
20400 Mariani Avenue
|
Cupertino
|
1,670 | 8,125 | 946 | 1,670 | 9,071 | 10,741 | 3,176 | 07/98 | M | ||||||||||||||||||||||||
|
10500 De Anza Blvd
|
Cupertino
|
7,666 | 37,304 | 7,666 | 37,304 | 44,970 | 11,661 | 07/98 | M | |||||||||||||||||||||||||
|
20605-20705 Valley Green Drive
|
Cupertino
|
G | 3,490 | 16,984 | 3,490 | 16,984 | 20,474 | 5,311 | 07/98 | M | ||||||||||||||||||||||||
|
10300 Bubb Road
|
Cupertino
|
F | 635 | 3,090 | 635 | 3,090 | 3,725 | 967 | 07/98 | M | ||||||||||||||||||||||||
|
10440 Bubb Road
|
Cupertino
|
434 | 2,112 | 114 | 434 | 2,226 | 2,660 | 777 | 07/98 | M | ||||||||||||||||||||||||
|
10460 Bubb Road
|
Cupertino
|
H | 994 | 4,838 | 1,279 | 994 | 6,117 | 7,111 | 2,049 | 07/98 | M | |||||||||||||||||||||||
|
1135 Kern Avenue
|
Sunnyvale
|
407 | 1,982 | 407 | 1,982 | 2,389 | 623 | 07/98 | M | |||||||||||||||||||||||||
|
450 National Avenue
|
Mountain View
|
611 | 2,973 | 95 | 611 | 3,068 | 3,679 | 992 | 07/98 | M | ||||||||||||||||||||||||
|
3301 Olcott Street
|
Santa Clara
|
F | 1,846 | 8,984 | 1,875 | 1,846 | 10,859 | 12,705 | 2,901 | 07/98 | M | |||||||||||||||||||||||
|
2800 Bayview Avenue
|
Fremont
|
1,070 | 5,205 | 60 | 1,070 | 5,265 | 6,335 | 1,689 | 07/98 | M | ||||||||||||||||||||||||
|
5521 Hellyer Avenue
|
San Jose
|
4,534 | 9,650 | 112 | 4,534 | 9,762 | 14,296 | 1,768 | 02/05 | M | ||||||||||||||||||||||||
-74-
| Initial Cost | Total Cost | |||||||||||||||||||||||||||||||||
| Property Name | City | December 31, 2010 Encumbrances | Land |
Buildings
and Improvements
|
Cost
Subsequent
to Construction/
Acquisition
|
Land |
Building
and Improvements
|
Total |
Accumulated
Depreciation
&
Amortization
|
Date of
Acquisition
|
Depreciable
Life
|
|||||||||||||||||||||||
|
6850 Santa Teresa Blvd
|
San Jose
|
H | 377 | 1,836 | 819 | 377 | 2,655 | 3,032 | 1,073 | 07/98 | M | |||||||||||||||||||||||
|
6810 Santa Teresa Blvd
|
San Jose
|
H | 2,567 | 5,991 | 772 | 2,567 | 6,763 | 9,330 | 2,350 | 03/99 | M | |||||||||||||||||||||||
|
140-160 Great Oaks Blvd
|
San Jose
|
1,402 | 6,822 | 754 | 1,402 | 7,576 | 8,978 | 2,641 | 07/98 | M | ||||||||||||||||||||||||
|
6541 Via del Oro/6385 San Ignacio
|
San Jose
|
G | 1,039 | 5,057 | 163 | 1,039 | 5,220 | 6,259 | 1,671 | 07/98 | M | |||||||||||||||||||||||
|
6311-6351 San Ignacio Avenue
|
San Jose
|
F | 6,246 | 30,396 | 170 | 6,246 | 30,566 | 36,812 | 9,675 | 07/98 | M | |||||||||||||||||||||||
|
6320-6360 San Ignacio Avenue
|
San Jose
|
G | 2,616 | 12,732 | 439 | 2,616 | 13,171 | 15,787 | 4,219 | 07/98 | M | |||||||||||||||||||||||
|
75 E. Trimble Road/2610 N. First St
|
San Jose
|
3,477 | 16,919 | 516 | 3,477 | 17,435 | 20,912 | 5,378 | 07/98 | M | ||||||||||||||||||||||||
|
2904 Orchard Parkway
|
San Jose
|
F,P | 4,704 | 11,992 | 4,704 | 11,992 | 16,696 | 1,405 | 02/08 | M | ||||||||||||||||||||||||
|
3236 Scott Blvd
|
Santa Clara
|
F | 1,234 | 6,005 | 1,234 | 6,005 | 7,239 | 1,879 | 07/98 | M | ||||||||||||||||||||||||
|
1212 Bordeaux Lane
|
Sunnyvale
|
F | 2,250 | 10,948 | 2,250 | 10,948 | 13,198 | 3,424 | 07/98 | M | ||||||||||||||||||||||||
|
1350-1810 McCandless Drive
|
Milpitas
|
12,259 | 57,770 | 1,306 | 12,259 | 59,076 | 71,335 | 18,947 | 07/98 | M | ||||||||||||||||||||||||
|
1600 Memorex Drive
|
Santa Clara
|
I | 1,221 | 5,940 | 11 | 1,221 | 5,951 | 7,172 | 1,844 | 07/98 | M | |||||||||||||||||||||||
|
1688 Richard Avenue
|
Santa Clara
|
I | 1,248 | 2,913 | 6 | 1,248 | 2,919 | 4,167 | 915 | 09/98 | M | |||||||||||||||||||||||
|
1700 Richard Avenue
|
Santa Clara
|
I | 1,727 | 4,030 | 1,727 | 4,030 | 5,757 | 1,154 | 08/99 | M | ||||||||||||||||||||||||
|
Morgan Hill Land
|
Morgan Hill
|
25,543 | - | 25,543 | - | 25,543 | - | 03/07 | - | |||||||||||||||||||||||||
|
Morgan Hill Land
|
Morgan Hill
|
2,297 | - | 2,297 | - | 2,297 | - | 04/07 | - | |||||||||||||||||||||||||
|
300 Montague Expressway
|
Milpitas
|
2,609 | 2,499 | 2,609 | 2,499 | 5,108 | 229 | 04/07 | M | |||||||||||||||||||||||||
|
337 Trade Zone Blvd
|
Milpitas
|
2,264 | 2,168 | 2,264 | 2,168 | 4,432 | 199 | 04/07 | M | |||||||||||||||||||||||||
|
324-368 Montague Expressway
|
Milpitas
|
2,968 | 2,843 | 2,968 | 2,843 | 5,811 | 261 | 04/07 | M | |||||||||||||||||||||||||
|
3506-3510 Bassett Street
|
Santa Clara
|
D | 943 | 4,591 | 182 | 943 | 4,773 | 5,716 | 1,579 | 07/98 | M | |||||||||||||||||||||||
|
3540-3544 Bassett Street
|
Santa Clara
|
F,D | 1,565 | 7,616 | 261 | 1,565 | 7,877 | 9,442 | 2,483 | 07/98 | M | |||||||||||||||||||||||
|
3550 Bassett Street
|
Santa Clara
|
F,D | 1,079 | 5,251 | 33 | 1,079 | 5,284 | 6,363 | 1,678 | 07/98 | M | |||||||||||||||||||||||
|
3560 Bassett Street
|
Santa Clara
|
F,D | 1,075 | 5,233 | 8 | 1,075 | 5,241 | 6,316 | 1,646 | 07/98 | M | |||||||||||||||||||||||
|
3570-3580 Bassett Street
|
Santa Clara
|
F,D | 1,075 | 5,233 | 1,075 | 5,233 | 6,308 | 1,638 | 07/98 | M | ||||||||||||||||||||||||
|
Hartford Loans
|
F | 148,003 | ||||||||||||||||||||||||||||||||
|
Northwestern Mutual Life Insurance Company
|
G | 73,357 | ||||||||||||||||||||||||||||||||
|
Allianz Loans
|
H | 124,410 | ||||||||||||||||||||||||||||||||
|
Heritage Bank of Commerce Line of Credit
|
I | - | ||||||||||||||||||||||||||||||||
|
Total (Q)
|
$ | 353,491 | $ | 322,829 | $ | 766,552 | $ | 30,785 | $ | 322,829 | $ | 797,337 | $ | 1,120,166 | $ | 225,186 | ||||||||||||||||||
| Property Held For Sale: | ||||||||||||||||||||||||||||||||||
| 1425-1455 McCandless Drive | Milpitas | $ | 752 | $ | 3,674 | $ | 752 | $ | 3,674 | $ | 4,426 | $ | 1,159 | 07/98 | M | |||||||||||||||||||
|
(A) 16.67% of this property’s ownership is held by unaffiliated parties outside the operating partnerships of the Company.
|
||||||||||||||||||||||||||||||||||
|
(B) 25% of this property’s ownership is held by unaffiliated parties outside the operating partnerships of the Company.
|
||||||||||||||||||||||||||||||||||
|
(C) 50% of this property’s ownership is held by an affiliated party since September 2000.
|
||||||||||||||||||||||||||||||||||
|
(D) Part of the property group referred to as the Triangle Technology Park.
|
||||||||||||||||||||||||||||||||||
|
(E) Part of the property group referred to as the San Tomas Technology Park.
|
||||||||||||||||||||||||||||||||||
|
(F) Encumbered by the $148,003 Hartford loans - full amount of loan shown at the bottom of the schedule.
|
||||||||||||||||||||||||||||||||||
|
(G) Encumbered by the $73,357 Northwestern Mutual Life Insurance Company loan - full amount of loan shown at the bottom of the schedule.
|
||||||||||||||||||||||||||||||||||
|
(H) Encumbered by the $124,410 Allianz loans - full amount of loan shown at the bottom of the schedule.
|
||||||||||||||||||||||||||||||||||
|
(I) Encumbered by the $0 Heritage Bank of Commerce Line of Credit loan - full amount of loan shown at the bottom of the schedule.
|
||||||||||||||||||||||||||||||||||
|
(J) Purchase price allocated to real estate related intangible assets amounted to $18,284. Approximately $17,410 and $874 was fully amortized in 2007 and 2005, respectively, and the asset cost and its related accumulated amortization was removed from the accounts.
|
||||||||||||||||||||||||||||||||||
|
(K) Purchase price allocated to real estate related intangible assets amounted to $1,367. The amount was fully amortized in 2004 and the asset cost and its related accumulated amortization was removed from the accounts.
|
||||||||||||||||||||||||||||||||||
|
(L) This property was sold in October 2005. The Company retained 32.5%, or approximately 7.9 acres, of raw land.
|
||||||||||||||||||||||||||||||||||
|
(M) Depreciation is computed based on the following estimated lives:
1. Building shell and base building tenant improvements of newly acquired properties are being depreciated on a weighted average composite useful life of 40 years.
2. Real estate intangible assets allocated are being amortized over the remaining life of the underlying leases.
3. Tenant improvements, furniture and fixtures are being depreciated over their estimated useful lives ranging from 5 to 10 years.
|
||||||||||||||||||||||||||||||||||
|
(N) Purchase price allocated to real estate related intangible assets amounted to $745.
|
||||||||||||||||||||||||||||||||||
|
(O) Purchase price allocated to real estate related intangible assets amounted to $1,374.
|
||||||||||||||||||||||||||||||||||
|
(P) Purchase price allocated to real estate related intangible assets amounted to $1,121.
|
||||||||||||||||||||||||||||||||||
| (Q) These real estate and accumulated depreciation totals are inclusive of a property held for sale. | ||||||||||||||||||||||||||||||||||
-75-
|
MISSION WEST PROPERTIES, INC.
|
||||||||||||||||||||||||||||||||||||
|
Schedule III
|
||||||||||||||||||||||||||||||||||||
|
Real Estate and Accumulated Depreciation and Amortization
|
||||||||||||||||||||||||||||||||||||
|
December 31, 2009
|
||||||||||||||||||||||||||||||||||||
|
(dollars in thousands)
|
||||||||||||||||||||||||||||||||||||
|
Initial Cost
|
|
Total Cost
|
||||||||||||||||||||||||||||||||||
|
Property Name
|
City
|
December 31, 2009
Encumbrances |
Land
|
Buildings
and |
Cost
Subsequent to |
Land |
Buildings
and
Improvements
|
Total
|
Accumulated
Depreciation
& Amortization
|
Date of
Acquisition |
Depreciable
Life |
|
||||||||||||||||||||||||
|
5300-5350 Hellyer Avenue
|
San Jose
|
C | $ | 8,261 | $ | 5,742 | $ | 11,442 |
|
$ | 5,742 | $ | 11,442 | $ | 17,184 | $ | 2,753 | 5/00 | M | |||||||||||||||||
|
10401-10411 Bubb Road
|
Cupertino
|
A | 633 | 3,078 | 633 | 3,078 | 3,711 | 887 | 7/98 | M | ||||||||||||||||||||||||||
|
45365 Northport Loop
|
Fremont
|
2,447 | 5,711 | $ | 11 | 2,447 | 5,722 | 8,169 | 1,332 | 10/00 | M | |||||||||||||||||||||||||
|
45738 Northport Loop
|
Fremont
|
F | 891 | 4,338 | 5 | 891 | 4,343 | 5,234 | 1,251 | 7/98 | M | |||||||||||||||||||||||||
|
4050 Starboard Drive
|
Fremont
|
F | 1,329 | 6,467 | 8 | 1,329 | 6,475 | 7,804 | 1,864 | 7/98 | M | |||||||||||||||||||||||||
|
3501 W. Warren Ave/Fremont Blvd
|
Fremont
|
1,866 | 9,082 | 1,382 | 1,866 | 10,464 | 12,330 | 3,917 | 7/98 | M | ||||||||||||||||||||||||||
|
48800 Milmont Blvd
|
Fremont
|
1,013 | 4,932 | 1,013 | 4,932 | 5,945 | 1,419 | 7/98 | M | |||||||||||||||||||||||||||
|
4750 Patrick Henry Drive
|
Santa Clara
|
H | 1,604 | 7,805 | 405 | 1,604 | 8,210 | 9,814 | 2,660 | 7/98 | M | |||||||||||||||||||||||||
|
3520 Bassett Street
|
Santa Clara
|
D | 1,104 | 5,371 | 1,104 | 5,371 | 6,475 | 1,545 | 7/98 | M | ||||||||||||||||||||||||||
|
3530 Bassett Street
|
Santa Clara
|
B,D | 849 | 4,133 | 849 | 4,133 | 4,982 | 1,190 | 7/98 | M | ||||||||||||||||||||||||||
|
5850-5870 Hellyer Avenue
|
San Jose
|
2,787 | 6,502 | 131 | 2,787 | 6,633 | 9,420 | 1,900 | 11/98 | M | ||||||||||||||||||||||||||
|
5750 Hellyer Avenue
|
San Jose
|
3,266 | 3,354 | 2,798 | 3,266 | 6,152 | 9,418 | 1,742 | 8/01 | M | ||||||||||||||||||||||||||
|
800 Embedded Way
|
San Jose
|
L | 1,794 | - | 1,794 | - | 1,794 | - | 3/00 | - | ||||||||||||||||||||||||||
|
5500 Hellyer Avenue
|
San Jose
|
F | 4,735 | 12,485 | 1,545 | 4,735 | 14,030 | 18,765 | 3,024 | 2/01 | M | |||||||||||||||||||||||||
|
5550 Hellyer Avenue
|
San Jose
|
F | 3,261 | 3,478 | 3,755 | 3,261 | 7,233 | 10,494 | 1,812 | 6/01 | M | |||||||||||||||||||||||||
|
5400 Hellyer Avenue
|
San Jose
|
3,238 | 5,007 | 215 | 3,238 | 5,222 | 8,460 | 1,406 | 7/00 | M | ||||||||||||||||||||||||||
|
5325 Hellyer Avenue
|
San Jose
|
H | 4,684 | 10,230 | 40 | 4,684 | 10,270 | 14,954 | 2,350 | 1/01 | M | |||||||||||||||||||||||||
|
875 Embedded Way
|
San Jose
|
H | 4,866 | 5,822 | 2,529 | 4,866 | 8,351 | 13,217 | 1,607 | 1/02 | M | |||||||||||||||||||||||||
|
5905-5965 Silver Creek Valley Road
|
San Jose
|
8,437 | 17,316 | 46 | 8,437 | 17,362 | 25,799 | 3,682 | 7/01 | M | ||||||||||||||||||||||||||
|
5905-5965 Silver Creek Valley Road
|
San Jose
|
3,438 | 2,727 | 3,438 | 2,727 | 6,165 | 562 | 10/01 | M | |||||||||||||||||||||||||||
|
5845 Hellyer Avenue
|
San Jose
|
6,090 | 5,029 | 6,090 | 5,029 | 11,119 | 290 | 9/07 | M | |||||||||||||||||||||||||||
|
855 Embedded Way
|
San Jose
|
3,289 | 6,521 | 60 | 3,289 | 6,581 | 9,870 | 1,480 | 5/01 | M | ||||||||||||||||||||||||||
|
1065-1105 La Avenida Street
|
Mountain View
|
46,832 | 109,275 | 65 | 46,832 | 109,340 | 156,172 | 29,383 | 4/99 | M | ||||||||||||||||||||||||||
|
1875 Charleston Road
|
Mountain View
|
N | - | 2,615 | - | 2,615 | 2,615 | 707 | 4/06 | M | ||||||||||||||||||||||||||
|
1750 Automation Parkway
|
San Jose
|
G | 4,789 | 11,174 | 315 | 4,789 | 11,489 | 16,278 | 3,016 | 7/99 | M | |||||||||||||||||||||||||
|
1756 Automation Parkway
|
San Jose
|
G | 4,378 | 10,216 | 704 | 4,378 | 10,920 | 15,298 | 2,759 | 1/00 | M | |||||||||||||||||||||||||
|
1762 Automation Parkway
|
San Jose
|
G | 4,804 | 12,224 | 1,332 | 4,804 | 13,556 | 18,360 | 3,454 | 4/00 | M | |||||||||||||||||||||||||
|
1768 Automation Parkway
|
San Jose
|
H | 8,195 | 19,121 | 218 | 8,195 | 19,339 | 27,534 | 4,525 | 12/00 | M | |||||||||||||||||||||||||
|
255 Caspian Drive
|
Sunnyvale
|
3,491 | 7,160 | 1,658 | 3,491 | 8,818 | 12,309 | 2,546 | 4/00 | M | ||||||||||||||||||||||||||
|
245 Caspian Drive
|
Sunnyvale
|
5,894 | - | 5,894 | - | 5,894 | - | 4/01 | - | |||||||||||||||||||||||||||
|
5981 Optical Court
|
San Jose
|
F | 4,054 | 14,938 | 298 | 4,054 | 15,236 | 19,290 | 1,754 | 1/08 | M | |||||||||||||||||||||||||
|
5970 Optical Court
|
San Jose
|
2,758 | 8,395 | 2,758 | 8,395 | 11,153 | 1,259 | 12/03 | M | |||||||||||||||||||||||||||
|
5900 Optical Court
|
San Jose
|
3,634 | 12,677 | 83 | 3,634 | 12,760 | 16,394 | 2,460 | 7/02 | M | ||||||||||||||||||||||||||
|
2630 Orchard Parkway
|
San Jose
|
2,932 | 5,863 | 22 | 2,932 | 5,885 | 8,817 | 1,170 | 3/02 | M | ||||||||||||||||||||||||||
|
2610 Orchard Parkway
|
San Jose
|
K | 2,615 | 5,231 | 2,615 | 5,231 | 7,846 | 1,025 | 3/02 | M | ||||||||||||||||||||||||||
|
55 West Trimble Road
|
San Jose
|
K | 4,435 | 8,869 | 4,435 | 8,869 | 13,304 | 1,738 | 3/02 | M | ||||||||||||||||||||||||||
|
2001 Walsh Avenue
|
Santa Clara
|
E,G,J | 4,610 | 3,887 | 4,610 | 3,887 | 8,497 | 661 | 4/03 | M | ||||||||||||||||||||||||||
|
2880 Scott Blvd
|
Santa Clara
|
E,H,J | 14,501 | 22,555 | 471 | 14,501 | 23,026 | 37,527 | 3,911 | 4/03 | M | |||||||||||||||||||||||||
|
2890 Scott Blvd
|
Santa Clara
|
E,H,J | 3,081 | 9,696 | 25 | 3,081 | 9,721 | 12,802 | 1,648 | 4/03 | M | |||||||||||||||||||||||||
|
2770-2800 Scott Blvd
|
Santa Clara
|
E,H | 7,138 | 7,075 | 170 | 7,138 | 7,245 | 14,383 | 1,295 | 4/03 | M | |||||||||||||||||||||||||
|
2300 Central Expressway
|
Santa Clara
|
E,G,J | 2,390 | 2,459 | 50 | 2,390 | 2,509 | 4,899 | 423 | 4/03 | M | |||||||||||||||||||||||||
|
2220 Central Expressway
|
Santa Clara
|
E,G,J | 3,305 | 3,427 | 816 | 3,305 | 4,243 | 7,548 | 1,040 | 4/03 | M | |||||||||||||||||||||||||
|
2330 Central Expressway
|
Santa Clara
|
E,G | 3,673 | 3,932 | 692 | 3,673 | 4,624 | 8,297 | 1,340 | 4/03 | M | |||||||||||||||||||||||||
|
233 South Hillview Drive
|
Milpitas
|
F,O | 3,335 | 10,076 | 3,335 | 10,076 | 13,411 | 1,869 | 3/06 | M | ||||||||||||||||||||||||||
|
2251 Lawson Lane
|
Santa Clara
|
1,952 | 9,498 | 622 | 1,952 | 10,120 | 12,072 | 2,865 | 7/98 | M | ||||||||||||||||||||||||||
|
1230 East Arques
|
Sunnyvale
|
F | 540 | 2,628 | 39 | 540 | 2,667 | 3,207 | 799 | 7/98 | M | |||||||||||||||||||||||||
|
1250 East Arques
|
Sunnyvale
|
F | 1,335 | 6,499 | 1,335 | 6,499 | 7,834 | 1,869 | 7/98 | M | ||||||||||||||||||||||||||
|
20400 Mariani Avenue
|
Cupertino
|
1,670 | 8,125 | 946 | 1,670 | 9,071 | 10,741 | 2,790 | 7/98 | M | ||||||||||||||||||||||||||
|
10500 De Anza Blvd
|
Cupertino
|
7,666 | 37,304 | 7,666 | 37,304 | 44,970 | 10,729 | 7/98 | M | |||||||||||||||||||||||||||
|
20605-20705 Valley Green Drive
|
Cupertino
|
G | 3,490 | 16,984 | 3,490 | 16,984 | 20,474 | 4,886 | 7/98 | M | ||||||||||||||||||||||||||
|
10300 Bubb Road
|
Cupertino
|
F | 635 | 3,090 | 635 | 3,090 | 3,725 | 890 | 7/98 | M | ||||||||||||||||||||||||||
|
10440 Bubb Road
|
Cupertino
|
434 | 2,112 | 114 | 434 | 2,226 | 2,660 | 715 | 7/98 | M | ||||||||||||||||||||||||||
|
10460 Bubb Road
|
Cupertino
|
H | 994 | 4,838 | 1,279 | 994 | 6,117 | 7,111 | 1,899 | 7/98 | M | |||||||||||||||||||||||||
|
1135 Kern Avenue
|
Sunnyvale
|
407 | 1,982 | 407 | 1,982 | 2,389 | 573 | 7/98 | M | |||||||||||||||||||||||||||
|
450 National Avenue
|
Mountain View
|
611 | 2,973 | 72 | 611 | 3,045 | 3,656 | 910 | 7/98 | M | ||||||||||||||||||||||||||
|
3301 Olcott Street
|
Santa Clara
|
1,846 | 8,984 | 37 | 1,846 | 9,021 | 10,867 | 2,608 | 7/98 | M | ||||||||||||||||||||||||||
|
2800 Bayview Avenue
|
Fremont
|
1,070 | 5,205 | 60 | 1,070 | 5,265 | 6,335 | 1,558 | 7/98 | M | ||||||||||||||||||||||||||
|
5521 Hellyer Avenue
|
San Jose
|
4,534 | 9,650 | 4,534 | 9,650 | 14,184 | 1,465 | 2/05 | M | |||||||||||||||||||||||||||
|
6850 Santa Teresa Blvd
|
San Jose
|
H | 377 | 1,836 | 819 | 377 | 2,655 | 3,032 | 1,004 | 7/98 | M | |||||||||||||||||||||||||
-76-
| Initial Cost | Total Cost | |||||||||||||||||||||||||||||||||||
| Property Name | City | December 31, 2009 Encumbrances | Land |
Buildings
and Improvements
|
Cost Subsequent to Construction/ Acquisition | Land |
Buildings
and Improvements
|
Total | Accumulated Depreciation & Amortization |
Date of
Acquisition
|
Depreciable
Life
|
|||||||||||||||||||||||||
|
6810 Santa Teresa Blvd
|
San Jose
|
H | 2,567 | 5,991 | 772 | 2,567 | 6,763 | 9,330 | 2,067 | 3/99 | M | |||||||||||||||||||||||||
|
140-160 Great Oaks Blvd
|
San Jose
|
1,402 | 6,822 | 754 | 1,402 | 7,576 | 8,978 | 2,437 | 7/98 | M | ||||||||||||||||||||||||||
|
6541 Via del Oro/6385 San Ignacio
|
San Jose
|
G | 1,039 | 5,057 | 81 | 1,039 | 5,138 | 6,177 | 1,520 | 7/98 | M | |||||||||||||||||||||||||
|
6311-6351 San Ignacio Avenue
|
San Jose
|
F | 6,246 | 30,396 | 170 | 6,246 | 30,566 | 36,812 | 8,910 | 7/98 | M | |||||||||||||||||||||||||
|
6320-6360 San Ignacio Avenue
|
San Jose
|
G | 2,616 | 12,732 | 439 | 2,616 | 13,171 | 15,787 | 3,887 | 7/98 | M | |||||||||||||||||||||||||
|
75 E. Trimble Road/2610 N. First St
|
San Jose
|
3,477 | 16,919 | 85 | 3,477 | 17,004 | 20,481 | 4,955 | 7/98 | M | ||||||||||||||||||||||||||
|
2904 Orchard Parkway
|
San Jose
|
F,P | 4,704 | 11,992 | 4,704 | 11,992 | 16,696 | 909 | 2/08 | M | ||||||||||||||||||||||||||
|
3236 Scott Blvd
|
Santa Clara
|
F | 1,234 | 6,005 | 1,234 | 6,005 | 7,239 | 1,728 | 7/98 | M | ||||||||||||||||||||||||||
|
1212 Bordeaux Lane
|
Sunnyvale
|
F | 2,250 | 10,948 | 2,250 | 10,948 | 13,198 | 3,150 | 7/98 | M | ||||||||||||||||||||||||||
|
1325-1810 McCandless Drive
|
Milpitas
|
13,994 | 66,213 | 1,455 | 13,994 | 67,668 | 81,662 | 19,988 | 7/98 | M | ||||||||||||||||||||||||||
|
1600 Memorex Drive
|
Santa Clara
|
I | 1,221 | 5,940 | 11 | 1,221 | 5,951 | 7,172 | 1,696 | 7/98 | M | |||||||||||||||||||||||||
|
1688 Richard Avenue
|
Santa Clara
|
I | 1,248 | 2,913 | 6 | 1,248 | 2,919 | 4,167 | 843 | 9/98 | M | |||||||||||||||||||||||||
|
1700 Richard Avenue
|
Santa Clara
|
I | 1,727 | 4,030 | 1,727 | 4,030 | 5,757 | 1,053 | 8/99 | M | ||||||||||||||||||||||||||
|
Morgan Hill Land
|
Morgan Hill
|
25,543 | - | 25,543 | - | 25,543 | - | 3/07 | - | |||||||||||||||||||||||||||
|
Morgan Hill Land
|
Morgan Hill
|
2,297 | - | 2,297 | - | 2,297 | - | 4/07 | - | |||||||||||||||||||||||||||
|
300 Montague Expressway
|
Milpitas
|
2,609 | 2,499 | 2,609 | 2,499 | 5,108 | 167 | 4/07 | M | |||||||||||||||||||||||||||
|
337 Trade Zone Blvd
|
Milpitas
|
2,264 | 2,168 | 2,264 | 2,168 | 4,432 | 145 | 4/07 | M | |||||||||||||||||||||||||||
|
324-368 Montague Expressway
|
Milpitas
|
2,968 | 2,843 | 2,968 | 2,843 | 5,811 | 190 | 4/07 | M | |||||||||||||||||||||||||||
|
3506-3510 Bassett Street
|
Santa Clara
|
D | 943 | 4,591 | 182 | 943 | 4,773 | 5,716 | 1,450 | 7/98 | M | |||||||||||||||||||||||||
|
3540-3544 Bassett Street
|
Santa Clara
|
F,D | 1,565 | 7,616 | 261 | 1,565 | 7,877 | 9,442 | 2,274 | 7/98 | M | |||||||||||||||||||||||||
|
3550 Bassett Street
|
Santa Clara
|
F,D | 1,079 | 5,251 | 33 | 1,079 | 5,284 | 6,363 | 1,546 | 7/98 | M | |||||||||||||||||||||||||
|
3560 Bassett Street
|
Santa Clara
|
F,D | 1,075 | 5,233 | 8 | 1,075 | 5,241 | 6,316 | 1,515 | 7/98 | M | |||||||||||||||||||||||||
|
3570-3580 Bassett Street
|
Santa Clara
|
F,D | 1,075 | 5,233 | 1,075 | 5,233 | 6,308 | 1,507 | 7/98 | M | ||||||||||||||||||||||||||
|
Hartford Loan
|
F | 111,485 | ||||||||||||||||||||||||||||||||||
|
Northwestern Mutual Life Insurance Company
|
G | 77,444 | ||||||||||||||||||||||||||||||||||
|
Allianz Life Insurance Company
|
H | 129,889 | ||||||||||||||||||||||||||||||||||
|
Heritage Bank of Commerce Line of Credit
|
I | 14,466 | ||||||||||||||||||||||||||||||||||
|
Total
|
$ | 341,545 | $ | 320,911 | $ | 774,795 | $ | 28,094 | $ | 320,911 | $ | 802,889 | $ | 1,123,800 | $ | 204,153 | ||||||||||||||||||||
|
(A) 16.67% of this property’s ownership is held by unaffiliated parties outside the operating partnerships of the Company.
|
||||||||||||||||||||||||||||||||||||
|
(B) 25% of this property’s ownership is held by unaffiliated parties outside the operating partnerships of the Company.
|
||||||||||||||||||||||||||||||||||||
|
(C) 50% of this property’s ownership is held by an affiliated party since September 2000.
|
||||||||||||||||||||||||||||||||||||
|
(D) Part of the property group referred to as the Triangle Technology Park.
|
||||||||||||||||||||||||||||||||||||
|
(E) Part of the property group referred to as the San Tomas Technology Park.
|
||||||||||||||||||||||||||||||||||||
|
(F) Encumbered by the $111,485 Hartford loan - full amount of loan shown at the bottom of the schedule.
|
||||||||||||||||||||||||||||||||||||
|
(G) Encumbered by the $77,444 Northwestern Mutual Life Insurance Company loan - full amount of loan shown at the bottom of the schedule.
|
||||||||||||||||||||||||||||||||||||
|
(H) Encumbered by the $129,889 Allianz loans - full amount of loan shown at the bottom of the schedule.
|
||||||||||||||||||||||||||||||||||||
|
(I) Encumbered by the $14,466 Heritage Bank of Commerce Line of Credit loan - full amount of loan shown at the bottom of the schedule.
|
||||||||||||||||||||||||||||||||||||
|
(J) Purchase price allocated to real estate related intangible assets amounted to $18,284. Approximately $17,410 and $874 was fully amortized in 2007 and 2005, respectively, and the asset cost and its related accumulated amortization was removed from the accounts.
|
||||||||||||||||||||||||||||||||||||
|
(K) Purchase price allocated to real estate related intangible assets amounted to $1,367. The amount was fully amortized in 2004 and the asset cost and its related accumulated amortization was removed from the accounts.
|
||||||||||||||||||||||||||||||||||||
|
(L) This property was sold in October 2005. The Company retained 32.5%, or approximately 7.9 acres, of raw land.
|
||||||||||||||||||||||||||||||||||||
|
(M) Depreciation is computed based on the following estimated lives:
1. Building shell and base building tenant improvements of newly acquired properties are being depreciated on a weighted average composite useful life of 40 years.
2. Real estate intangible assets allocated are being amortized over the remaining life of the underlying leases.
3. Tenant improvements, furniture and fixtures are being depreciated over their estimated useful lives ranging from 5 to 10 years.
|
||||||||||||||||||||||||||||||||||||
|
(N) Purchase price allocated to real estate related intangible assets amounted to $745.
|
||||||||||||||||||||||||||||||||||||
|
(O) Purchase price allocated to real estate related intangible assets amounted to $1,374.
|
||||||||||||||||||||||||||||||||||||
|
(P) Purchase price allocated to real estate related intangible assets amounted to $1,121.
|
||||||||||||||||||||||||||||||||||||
-77-
|
MISSION WEST PROPERTIES, INC.
|
||||||||||||
|
NOTE TO SCHEDULE III
|
||||||||||||
|
December 31, 2010, 2009 and 2008
|
||||||||||||
|
(dollars in thousands)
|
||||||||||||
|
1. Reconciliation of real estate and accumulated depreciation and amortization (a):
|
||||||||||||
|
2010
|
2009
|
2008
|
||||||||||
|
Investments in properties:
|
||||||||||||
|
Balance at beginning of year
|
$ | 1,123,800 | $ | 1,123,622 | $ | 1,078,936 | ||||||
|
Additions
|
6,693 | 178 | 42,157 | |||||||||
|
Dispositions
|
(10,327 | ) | - | - | ||||||||
|
Reclassification
|
- | - | 2,529 | |||||||||
|
Balance at end of year
|
$ | 1,120,166 | $ | 1,123,800 | $ | 1,123,622 | ||||||
|
Accumulated depreciation and amortization:
|
||||||||||||
|
Balance at beginning of year
|
$ | 204,153 | $ | 180,043 | $ | 156,819 | ||||||
|
Additions
|
23,751 | 24,110 | 23,224 | |||||||||
|
Dispositions
|
(2,718 | ) | - | - | ||||||||
|
Balance at end of year
|
$ | 225,186 | $ | 204,153 | $ | 180,043 | ||||||
|
Net investments in properties
|
$ | 894,980 | $ | 919,647 | $ | 943,579 | ||||||
(a) The year 2010 amounts are inclusive of a property held for sale.
-78-
Item 9. Changes in and Disagreements with Accountants on Accounting and Financial Disclosure
None.
Item 9A. Controls and Procedures
|
(a)
|
Evaluation of Disclosure Controls and Procedures
|
As required by SEC Rule 13a-15(b) we conducted an evaluation, under the supervision and with the participation of our management, including our Chief Executive Officer, President and Vice President of Finance, of the effectiveness of the design and operation of our disclosure controls and procedures (as defined in Rule 13a-15(f) or Rule 15d-15(f) of the Securities Exchange Act of 1934). Based upon that evaluation, the Chief Executive Officer, President and Vice President of Finance concluded that as of December 31, 2010 our disclosure controls and procedures were effective such that the information required to be disclosed in our reports filed with the Securities and Exchange Commission is recorded, processed, summarized and reported within the time periods specified in the SEC’s rules and forms such information is accumulated and communicated to our management, including our Chief Executive Officer, President and Vice President of Finance, as appropriate, to allow for timely decisions regarding required disclosure.
|
(b)
|
Management’s Report on Internal Control over Financial Reporting
|
Management of Mission West Properties, Inc. is responsible for establishing and maintaining adequate internal control over financial reporting as defined in Rules 13a-15(f) and 15d-15(f) under the Securities Exchange Act of 1934. Management assessed the effectiveness of Mission West Properties, Inc.’s internal control over financial reporting as of December 31, 2010. Management based this assessment on the criteria for effective internal control over financial reporting established in Internal Control – Integrated Framework issued by the Committee of Sponsoring Organizations of the Treadway Commission (COSO). Management’s assessment included an evaluation of the design of Mission West Properties, Inc.’s internal control over financial reporting and testing of the operational effectiveness of its internal control over financial reporting. Management reviewed the results of its assessment with the Audit Committee of the board of directors. Based on this assessment, management determined that Mission West Properties, Inc. maintained effective internal control over financial reporting as of December 31, 2010.
Because of its inherent limitations, internal control over financial reporting may not prevent or detect the possibility of human error, misstatements and the circumvention or overriding of controls. Also, projections of any evaluation of effectiveness to future periods are subject to the risk that controls may become inadequate because of changes in conditions, or that the degree of compliance with the policies or procedures may deteriorate.
Burr Pilger Mayer, Inc., our independent registered public accounting firm, has audited our consolidated financial statements included in this Annual Report on Form 10-K and has issued an attestation report on the effectiveness of our internal control over financial reporting as of December 31, 2010, as stated in their report, which is included under Item 8, above.
|
(c)
|
Changes in Internal Control over Financial Reporting
|
There was no change in our internal control over financial reporting during the fourth fiscal quarter of 2010 that has materially affected, or is reasonably likely to material affect, our internal control over financial reporting.
Item 9B. Other Information
None.
-79-
PART III
Item 10. Directors and Executive Officers and Corporate Governance
The information required by Item 10 is incorporated by reference from the sections titled “Management - Directors and Executive Officers,” “Corporate Governance” and “Code of Ethics” and “Section 16(a) Beneficial Ownership Reporting Compliance” in the Company’s definitive proxy statement to be filed with respect to the 2011 annual stockholders’ meeting.
We have adopted a Code of Business Conduct and Ethics for Employees, Executive Officers and Directors that applies to all of our employees and directors. We have posted this Code of Business Conduct and Ethics on the Company’s website at www.missionwest.com.
Item 11. Executive Compensation
The information required by Item 11 is incorporated by reference from the section titled “Executive Compensation” in the Company’s definitive proxy statement to be filed with respect to the 2011 annual stockholders’ meeting.
Item 12. Security Ownership of Certain Beneficial Owners and Management and Related Stockholder Matters
The information required by Item 12 is incorporated by reference from the sections titled “Share Ownership” and “Securities Authorized for Issuance under Equity Compensation Plans” in the Company’s definitive proxy statement to be filed with respect to the 2011 annual stockholders’ meeting.
Item 13. Certain Relationships and Related Transactions, and Director Independence
The information required by Item 13 is incorporated by reference from the sections titled “Certain Relationships and Related Transactions” and “Corporate Governance” in the Company’s definitive proxy statement to be filed with respect to the 2011 annual stockholders’ meeting.
Item 14. Principal Accountant Fees and Services
The information required by Item 14 is incorporated by reference from the sections titled “Principal Accountant Fees and Services” in the Company’s definitive proxy statement to be filed with respect to the 2011 annual stockholders’ meeting.
-80-
PART IV
|
(a)
|
The following documents are filed as part of this report:
|
|
1.
|
The consolidated financial statements are set forth in Item 8 of this Annual Report on Form 10-K.
|
The following financial statement schedules should be read in conjunction with the consolidated financial statements included in Item 8 of this Annual Report on Form 10-K.
|
2.
|
Schedule III - Real Estate and Accumulated Depreciation and Amortization as of December 31, 2010 and 2009, which can be found on pages 74 and 76, respectively.
|
|
3.
|
The exhibits listed on the Exhibit Index either are filed with this Annual Report on Form 10-K or have been filed previously with the SEC and are incorporated by reference to those prior filings.
|
|
(b)
|
The exhibits required by Item 601 of Regulation S-K, including each management contract or compensatory plan or arrangement required to be filed as an exhibit to this form are listed under Item 15(a)(3).
|
-81-
SIGNATURES
Pursuant to the requirements of the Section 13 or 15(d) of the Securities Exchange Act of 1934, the registrant has duly caused this Report to be signed on its behalf by the undersigned, thereunto duly authorized.
MISSION WEST PROPERTIES, INC.
|
Date: March 16, 2011
|
By: /s/ Carl E. Berg
|
|
Carl E. Berg
|
|
|
Chief Executive Officer
|
|
|
(Principal Executive Officer)
|
|
|
|
|
|
Date: March 16, 2011
|
By: /s/ Wayne N. Pham
|
|
Wayne N. Pham
|
|
|
Vice President of Finance and Controller
|
|
|
(Principal Financial and Accounting Officer)
|
KNOW ALL PERSONS BY THESE PRESENTS, that each person whose signature appears below constitutes and appoints Carl E. Berg his true and lawful attorney-in-fact with the power of substitution, to sign any amendments to this Report on Form 10-K and to file the same, with exhibits thereto and other documents in connection therewith, with the Securities and Exchange Commission, hereby ratifying and confirming all that each of said attorney-in-fact, or his or her substitute, may do or choose to be done by virtue hereof.
Pursuant to the requirements of the Securities Exchange Act of 1934, this Report has been signed below by the following persons on behalf of the registrant and in the capacities and on the dates indicated.
|
Title
|
Date
|
|||
|
/s/ Carl E. Berg
|
Chairman of the Board, Chief Executive Officer and Director
|
March 16, 2011
|
||
|
Carl E. Berg
|
||||
|
/s/ William A. Hasler
|
Director
|
March 16, 2011
|
||
|
William A. Hasler
|
||||
|
/s/ Lawrence B. Helzel
|
Director
|
March 16, 2011
|
||
|
Lawrence B. Helzel
|
||||
|
/s/ Raymond V. Marino
|
President, Chief Operating Officer and Director
|
March 16, 2011
|
||
|
Raymond V. Marino
|
||||
|
/s/ Martin S. Roher
|
Director
|
March 16, 2011
|
||
|
Martin S. Roher
|
-82-
Exhibits required by Item 601 of Regulation S-K.
EXHIBIT INDEX
| 3.2.1 |
Articles of Amendment and Restatement of Mission West Properties, Inc. (1)
|
|
| 3.2.2 |
Amended and Restated Bylaws of Mission West Properties, Inc. as of December 18, 2007 (1a)
|
|
| 4.1 |
Description of Capital Stock (2)
|
|
| 4.1.1 |
Specimen Common Stock certificate (2)
|
|
| 10.1.1 |
Amended and Restated Agreement of Limited Partnership of Mission West Properties, L.P. (2b)
|
|
| 10.1.2 |
Amended and Restated Agreement of Limited Partnership of Mission West Properties, L.P. I (2b)
|
|
| 10.1.3 |
Amended and Restated Agreement of Limited Partnership of Mission West Properties, L.P. II (2b)
|
|
| 10.1.4 |
Amended and Restated Agreement of Limited Partnership of Mission West Properties, L.P. III (2b)
|
|
| 10.2 |
Exchange Rights Agreement between Mission West Properties and the Limited Partners (2b)
|
|
| 10.4.1 |
Acquisition Agreement, dated as of May 14, 1998, among Mission West Properties, certain partnerships and the Berg Group (as defined therein) (1)
|
|
| 10.4.2 |
Amendment of Acquisition Agreement, dated as of July 1, 1998 (1)
|
|
| 10.4.3 |
Form of Partnership Interest Purchase Demand Note (1)
|
|
| 10.5.1 |
Stock Purchase Agreement dated as of May 4, 1998, between Mission West Properties and the purchasers of Common Stock in a private placement of 5,800,000 shares and Subscription Agreement relating to same (1)
|
|
| 10.5.2 |
Stock Purchase Agreement dated as of May 4, 1998 between Mission West Properties and the purchasers of Common Stock in a private placement of 695,058 shares and Subscription Agreement relating to same (1)
|
|
| 10.5.3 |
Form of Registration Rights Agreement for purchasers, who acquired shares of Common Stock under the May 4, 1998 Stock Purchase Agreements (3)
|
|
| 10.6 |
Pending Projects Acquisition Agreement among Mission West Properties, the Operating Partnership and the Berg Group (2b)
|
|
| 10.7 |
Berg Land Holdings Option Agreement between Mission West Properties and certain members of the Berg Group (2b)
|
|
| 10.8 |
Berg & Berg Enterprises, Inc. Sublease Agreement (1)
|
|
| 10.12 |
Lease Agreement with Apple Computer, Inc. (4a)
|
|
| 10.14 |
Lease Agreement with Amdahl Corporation (4b)
|
|
| 10.15 |
Hartford Fixed Rate Term Loan Agreement (5)
|
|
| 10.15.1 |
Hartford Life Insurance Company Promissory Note (5)
|
|
| 10.15.2 |
Hartford Life and Annuity Insurance Company Promissory Note (5)
|
|
| 10.15.3 |
Hartford Life and Accident Insurance Company Promissory Note (5)
|
|
| 10.15.4 |
Hartford-Mission West Properties, L.P. (Santa Clara) Deed of Trust, Security Agreement and Fixture Filing (5)
|
|
| 10.15.5 |
Hartford-Mission West Properties, L.P. (Alameda) Deed of Trust, Security Agreement and Fixture Filing (5)
|
|
| 10.15.6 |
Hartford-Mission West Properties, L.P. I Deed of Trust, Security Agreement and Fixture Filing (5)
|
|
| 10.15.7 |
Hartford-Mission West Properties, L.P. II Deed of Trust, Security Agreement and Fixture Filing (5)
|
|
| 10.15.8 |
Hartford-Mission West Properties, L.P. III Deed of Trust, Security Agreement and Fixture Filing (5)
|
|
| 10.15.9 |
Hartford Carveout Indemnity Agreement (5)
|
|
| 10.15.10 |
Hartford Environmental Indemnity Agreement (5)
|
|
| 10.16 |
Hartford Fixed Rate Term Loan Agreement II (23)
|
|
| 10.16.1 |
Hartford Life Insurance Company Promissory Note II (23)
|
|
| 10.16.2 |
Hartford Life and Accident Insurance Company Promissory Note II (23)
|
|
| 10.16.3 |
Hartford-Mission West Properties, L.P. Deed of Trust, Security Agreement and Fixture Filing II (23)
|
|
| 10.16.4 |
Hartford-Mission West Properties, L.P. I Deed of Trust, Security Agreement and Fixture Filing II (23)
|
|
| 10.16.5 |
Hartford Carveout Indemnity Agreement II (23)
|
|
| 10.16.6 |
Hartford Environmental Indemnity Agreement II (23)
|
|
| 10.19 |
Waiver Agreement (6)
|
|
| 10.20 |
Ownership Limit Exemption Agreement dated December 29, 1998 between Mission West Properties and Dan and Paul McCarthy (7)
|
|
| 10.21 |
Lease Agreement with Microsoft Corporation, dated July 25, 1998 (8)
|
|
| 10.21.1 |
Lease Agreement with Microsoft Corporation, dated December 23, 2004 (8a)
|
|
| 10.22 |
Contribution Agreement (8)
|
|
| 10.26 |
Supplemental Agreement among Mission West Properties, Inc., Carl E. Berg and Clyde J. Berg (9)
|
|
| 10.27 |
Berg Group Revolving Credit – $100,000,000 Secured Promissory Note (10) (Terminated)
|
|
| 10.27.1 |
Third Amendment to Berg Group $100,000,000 Revolving Line of Credit (11) (Terminated)
|
-83-
| 10.28 |
Berg Group Deed of Trust Securing Revolving Promissory Note (12)
|
|
| 10.29 |
Berg Group Promissory Note, dated October 8, 2009 (20) (Terminated)
|
|
| 10.29.1 |
Berg Group Promissory Note, dated January 7, 2010 (21) (Terminated)
|
|
| 10.29.2 |
Berg Group Promissory Note, dated April 8, 2010 (21) (Terminated)
|
|
| 10.29.3 |
Berg Group Promissory Note, dated July 8, 2010 (22) (Terminated)
|
|
| 10.30 |
Mission West Properties, L.P. Continuing Guaranty (13)
|
|
| 10.31 |
Mission West Properties, L.P. II Continuing Guaranty (13)
|
|
| 10.32 |
Mission West Properties, L.P. Promissory Note to Northwestern Mutual Life Insurance Company (13)
|
|
| 10.32.1 |
Mission West Properties, L.P. First Amendment to Promissory Note to Northwestern Mutual Life Insurance Company (18)
|
|
| 10.33 |
Mission West Properties, L.P. I Promissory Note to Northwestern Mutual Life Insurance Company (13)
|
|
| 10.33.1 |
Mission West Properties, L.P. I First Amendment to Promissory Note to Northwestern Mutual Life Insurance Company (18)
|
|
| 10.34 |
Mission West Properties, L.P. II Promissory Note to Northwestern Mutual Life Insurance Company (13)
|
|
| 10.34.1 |
Mission West Properties, L.P. II First Amendment to Promissory Note to Northwestern Mutual Life Insurance Company (18)
|
|
| 10.35 |
Mission West Properties, L.P. Deed of Trust and Security Agreement (First Priority) (13)
|
|
| 10.36 |
Mission West Properties, L.P. Deed of Trust and Security Agreement (Second Priority) (13)
|
|
| 10.36.1 |
Mission West Properties, L.P. First Amendment to Deed of Trust and Security Agreement (18)
|
|
| 10.37 |
Mission West Properties, L.P. I Deed of Trust and Security Agreement (First Priority) (13)
|
|
| 10.38 |
Mission West Properties, L.P. I Deed of Trust and Security Agreement (Second Priority) (13)
|
|
| 10.38.1 |
Mission West Properties, L.P. I First Amendment to Deed of Trust and Security Agreement (18)
|
|
| 10.39 |
Mission West Properties, L.P. II Deed of Trust and Security Agreement (First Priority) (13)
|
|
| 10.40 |
Mission West Properties, L.P. II Deed of Trust and Security Agreement (Second Priority) (13)
|
|
| 10.40.1 |
Mission West Properties, L.P. II First Amendment to Deed of Trust and Security Agreement (18)
|
|
| 10.41 |
Mission West Properties, L.P. Absolute Assignment of Leases and Rents (First Priority) (13)
|
|
| 10.42 |
Mission West Properties, L.P. I Absolute Assignment of Leases and Rents (First Priority) (13)
|
|
| 10.43 |
Mission West Properties, L.P. II Absolute Assignment of Leases and Rents (First Priority) (13)
|
|
| 10.44 |
Mission West Properties L.P., L.P. I and L.P. II First Amendment to Contribution and Reimbursement Agreement (18)
|
|
| 10.46 | * |
2004 Equity Incentive Plan (14)
|
| 10.47 |
Allianz Loan Secured Installment Note (15)
|
|
| 10.48 |
Allianz Loan Deed of Trust, Security Agreement, Fixture Filing with Absolute Assignment of Rents(15)
|
|
| 10.49 |
Allianz Loan Limited Guaranty (15)
|
|
| 10.50 | * |
Form of Non-statutory Stock Option Agreement with Dividend Rights under 2004 Equity Incentive Plan (15)
|
| 10.51 |
Allianz Loan II Secured Installment Note (16)
|
|
| 10.52 |
Allianz Loan II Deed of Trust, Security Agreement, Fixture Filing with Absolute Assignment of Rents (16)
|
|
| 10.53 |
Allianz Loan II Limited Guaranty (16)
|
|
| 10.54 |
Allianz Loan II Loan Modification Agreement (16)
|
|
| 10.55 |
Allianz Loan II Loan Modification Agreement and Amendment of Deed of Trust (18)
|
|
| 10.56 |
Heritage Bank of Commerce Revolving Credit Loan Agreement (19)
|
|
| 10.56.1 |
Heritage Bank of Commerce Revolving Credit Loan Change in Terms Agreement, dated April 17, 2008 (19)
|
|
| 10.56.2 |
Heritage Bank of Commerce Revolving Credit Loan Change in Terms Agreement, dated June 5, 2009 (19)
|
|
| 10.56.3 |
Heritage Bank of Commerce Revolving Credit Loan Change in Terms Agreement, dated August 20, 2009 (20)
|
|
| 10.56.4 |
Heritage Bank of Commerce Revolving Credit Loan Change in Terms Agreement, dated October 13, 2009 (20)
|
|
| 10.57 |
M&M Real Estate Control & Restructuring, LLC Promissory Note, dated April 14, 2009 (19) (Terminated)
|
|
| 10.58 |
M&M Real Estate Control & Restructuring, LLC Promissory Note, dated April 21, 2009 (19) (Terminated)
|
|
| 10.59 |
M&M Real Estate Control & Restructuring, LLC Promissory Note, dated July 1, 2009 (19) (Terminated)
|
|
| 10.60 |
M&M Real Estate Control & Restructuring, LLC Promissory Note, dated October 2, 2009 (20) (Terminated)
|
|
| 10.61 |
M&M Real Estate Control & Restructuring, LLC Promissory Note, dated October 23, 2009 (20) (Terminated)
|
|
| 21.1 |
Subsidiaries of the Registrant (17)
|
|
| 23.1 |
Consent of Independent Registered Public Accounting Firm
|
|
| 24.1 |
Powers of Attorney (included on the signature page hereto)
|
|
| 31.1 |
Certification of Chief Executive Officer pursuant to Rule 13a-14(a)
|
|
| 31.2 |
Certification of Chief Operating Officer pursuant to Rule 13a-14(a)
|
|
| 31.3 |
Certification of Chief Financial Officer pursuant to Rule 13a-14(a)
|
|
| 32.1 |
Certificate Pursuant to Section 906 of the Sarbanes-Oxley Act of 2002
|
-84-
| * |
Management contract or compensatory plan or arrangement
|
|
| (1 | ) |
Incorporated herein by reference to the same-numbered exhibit to the Company’s Registration Statement on Form S-4/A filed on July 20, 1998 and declared effective on November 23, 1998 (Commission File No. 333-52835-99).
|
| (1a | ) |
Incorporated herein by reference to Exhibit 3.2 to the current report on Form 8-K filed on December 20, 2007 (Commission File No. 000-25235).
|
| (2 | ) |
Incorporated herein by reference to the registration statement on Form 8-A/A filed on March 21, 2008 (Commission File No. 001-34000).
|
| (2a | ) |
Incorporated herein by reference to the same numbered exhibit to the registration statement on Form 8-A/A filed on March 21, 2008 (Commission File No. 001-34000).
|
| (2b | ) |
Incorporated herein by reference to the same-numbered exhibit to the Company’s Post-effective Amendment No. 1 to Registration Statement on Form S-4 filed on Form S-3 on February 11, 1999 (Commission File No. 333-52835-99).
|
| (3 | ) |
Incorporated herein by reference to Exhibit 10.8 to the Company’s Post-effective Amendment No. 1 to Registration Statement on Form S-4 filed on Form S-3 on February 11, 1999 (Commission File No. 333-52835-99).
|
| (4a | ) |
Incorporated herein by reference to Exhibit 10.15 to the Company’s Registration Statement on Form S-4/A filed on June 17, 1998 and declared effective on November 23, 1998 (Commission File No. 333-52835).
|
| (4b | ) |
Incorporated herein by reference to Exhibit 10.17 to the Company’s Registration Statement on Form S-4/A filed on June 17, 1998 and declared effective on November 23, 1998 (Commission File No. 333-52835).
|
| (5 | ) |
Incorporated herein by reference to the same-numbered exhibit to current report on Form 8-K filed on October 7, 2008 (Commission File No. 001-34000).
|
| (6 | ) |
Incorporated herein by reference to the same-numbered exhibit to the Registration Statement on Form S-4/A filed on November 16, 1998 and declared effective on November 23, 1998 (Commission File No. 333-52835-99).
|
| (7 | ) |
Incorporated herein by reference to the same numbered exhibit to the annual report on Form 10-K for 1998 filed on March 31, 1999 (Commission File No. 000-25235).
|
| (8 | ) |
Incorporated herein by reference to the same-numbered exhibit to current report on Form 8-K filed on May 14, 1999 (Commission File No. 000-25235).
|
| (8a | ) |
Incorporated herein by reference to the same-numbered exhibit to the quarterly report on Form 10-Q filed on May 10, 2005 (Commission File No. 000-25235).
|
| (9 | ) |
Incorporated herein by reference to the same-numbered exhibit to the Registration Statement on Form S-11/A filed on June 15, 1999 (Commission File No. 333-80203).
|
| (10 | ) |
Incorporated herein by reference to the same-numbered exhibit to the quarterly report on Form 10-Q filed on November 13, 2001 (Commission File No. 000-25235).
|
| (11 | ) |
Incorporated herein by reference to the same-numbered exhibit to the quarterly report on Form 10-Q filed on August 12, 2003 (Commission File No. 000-25235).
|
| (12 | ) |
Incorporated herein by reference to the same numbered exhibit to the annual report on Form 10-K for 1999 filed on March 30, 2000 (Commission File No. 000-25235).
|
| (13 | ) |
Incorporated herein by reference to the same-numbered exhibit to the annual report on Form 10-K for 2002 filed on March 27, 2003 (Commission File No. 000-25235).
|
| (14 | ) |
Incorporated herein by reference to Appendix II to the Company’s Schedule 14A Proxy Statement filed with the Securities and Exchange Commission on October 22, 2004 (Commission File No. 000-25235).
|
| (15 | ) |
Incorporated herein by reference to the same-numbered exhibit to the quarterly report on Form 10-Q filed on May 10, 2005 (Commission File No. 000-25235).
|
| (16 | ) |
Incorporated herein by reference to the same-numbered exhibit to the quarterly report on Form 10-Q filed on August 9, 2005 (Commission File No. 000-25235).
|
| (17 | ) |
Incorporated herein by reference to the same-numbered exhibit to the annual report on Form 10-K for 1998 filed on March 31, 1999 (Commission File No. 000-25235).
|
| (18 | ) |
Incorporated herein by reference to the same-numbered exhibit to the annual report on Form 10-K for 2008 filed on March 16, 2009 (Commission File No. 001-34000).
|
| (19 | ) |
Incorporated herein by reference to the same-numbered exhibit to the quarterly report on Form 10-Q filed on August 7, 2009 (Commission File No. 001-34000).
|
| (20 | ) |
Incorporated herein by reference to the same-numbered exhibit to the quarterly report on Form 10-Q filed on November 9, 2009 (Commission File No. 001-34000).
|
| (21 | ) |
Incorporated herein by reference to the same-numbered exhibit to the quarterly report on Form 10-Q filed on May 10, 2010 (Commission File No. 001-34000).
|
| (22 | ) |
Incorporated herein by reference to the same-numbered exhibit to the quarterly report on Form 10-Q filed on August 9, 2010 (Commission File No. 001-34000).
|
| (23 | ) |
Incorporated herein by reference to the same-numbered exhibit to the quarterly report on Form 10-Q filed on November 9, 2010 (Commission File No. 001-34000).
|
-85-