Attached files
EXHIBIT 13 – REGISTRANT’S ANNUAL REPORT TO SHAREHOLDERS
The First National Bank of Long Island
Where Everyone Knows Your Name ®
Balance + Momentum
2010 Annual Report
[PHOTO OMITTED]
[LOGO]
The First of Long Island Corporation
[PHOTO OMITTED]
Table of Contents
|
2-3
|
President & CEO Message
|
|
4
|
Board of Directors & Executive Officers
|
|
5
|
Financial Strength
|
|
6
|
Loan Growth & Asset Quality
|
|
7
|
Branch Expansion
|
|
8-9
|
New Branches
|
|
10-11
|
Branch Location Map
|
|
12
|
Disaster Recovery Center
|
|
13
|
Community Outreach
|
|
14
|
Selected Financial Data
|
|
15-65
|
Financials
|
|
66
|
Officers & Official Staff
|
|
67
|
Business Advisory Board
|
2010 Financial Highlights
|
|
·
|
Net income was $18.4 million, up 37%, or $4.9 million versus 2009
|
|
|
·
|
Earnings per share were $2.30, up 25%, or $.46 per share versus 2009
|
On an average balance basis:
|
|
·
|
Total assets were $1.66 billion, up 17%, or $244 million versus 2009
|
|
|
·
|
Loans were $864 million, up 21%, or $148 million versus 2009
|
|
|
·
|
Deposits were $1.3 billion, up 19%, or $209 million versus 2009
|
|
|
·
|
Residential Mortgages were $291 million, up 30%, or $66 million versus 2009
|
|
|
·
|
Commercial Mortgages were $409 million, up 29%, or $92 million versus 2009
|
1
A Message from the President & CEO
[PHOTO OMITTED]
Dear Shareholder:
It gives me great pride to report to you that as of year end 2010, The First National Bank of Long Island was the largest independent commercial bank headquartered on Long Island. On an average balance basis, the Bank’s total assets grew $244 million, or 17.2%, during 2010. Profits were at a historic high of $18.4 million, an increase of almost 37% over 2009. On a per share basis, we were up 46 cents, or 25%. We improved our returns on average assets and average equity, which were 1.11% and 12.94%, respectively, in 2010 compared to .95% and 12.15%, respectively, for last year. More importantly, this was the third year in a row our stock price appreciated. Using year end measurement dates, the compounded annual growth rate of our stock price over the last three years was 15.74%. In 2010, our dividend increased by 8 cents per share, or 10.5%. We continued to increase our dividend at a double digit rate because of the confidence we have in our earnings power. Our positioning within the market is gaining momentum and our future remains bright. We are proud of the many accomplishments of our organization.
There are many reasons for the Bank’s positive performance, the most significant being our corporate culture of balance and discipline. The growth of the institution over the last five years has been built upon the foundation of meticulous attention to the risks associated with the business, namely liquidity, interest rate and, most of all, credit risk. Regardless of the temptation for instant gratification, we have remained measured and disciplined with our underwriting standards, our loan review process, and the selection of investment securities; and after we have checked it twice, we do not hesitate to check it again. Our securities portfolio of over $700 million remains our first line of defense as a liquidity cushion. This cushion is backed by the placement of loans and securities at the Federal Reserve Bank and the Federal Home Loan Bank of New York that gives us a borrowing capacity of approximately $700 million. We have, by all accounts, tremendous funding capacity if needed. We have used this capacity sparingly as the Management Team has been able to organically grow deposits at a comfortable double digit rate. In 2010, on an average balance basis, our deposits grew $209 million, or 19%, which funded the growth of our balance sheet. More importantly, our average Checking Deposits grew by $39.3 million, or 11.7%. Growth in Checking Deposits was primarily driven by our market share penetration associated with small business and middle market customers, a valuable and lucrative market segment. We remain dedicated to growing the institution organically, and building the franchise stone by stone.
The First National Bank of Long Island is becoming a unique banking organization that is developing its brand and reputation based on unparalleled customer service. What differentiates us is a culture dedicated to personalizing our service quality approach. We believe the only long-term sustainable competitive advantage we have in the marketplace is the level of service we deliver. This is the overriding fulcrum of our success.
Our history dates back to 1927 and 2011 will be our 84th year of serving the Long Island marketplace. Over the last seven years we have built 14 new branches and converted two commercial banking units into full service branches. This growth represents an increase of 70% to the branch distribution system. With each and every new branch location, we have been able to hire individuals dedicated to the principle of service quality and personalization. With each and every hire of a new commercial banker or new commercial lender, we have attracted a high degree of professional talent as well as an individual who can fit into the culture we are building. As we expand into new markets on Long Island, each newly hired individual and each new branch location work to enhance our reputation and recognition of our brand of banking within the geography. We pride ourselves in knowing every one of our customers, both from a business and personal perspective. That is why we call ourselves the Bank “Where Everyone Knows Your Name.” The Bank is gaining momentum as a recognizable Long Island institution, attracting many new customers, and significantly increasing our market share within one of the most affluent geographies in the country. We will open our 35th branch by this summer.
As we continue to build talent and add branches, our franchise value grows, benefitting our shareholders. The case in point is that over the last two years our Bank has been able to establish relationships with over 100 upper-end small businesses and middle market customers. This increase of market share is a significant part of our deposit growth and exactly the kind of business we want to attract to enhance the future prospects of our stock price. Our momentum is building and has not been interrupted by credit quality concerns.
Our credit quality remains excellent, not only with our loans, but also with our securities. At December 31, 2010, we had only four nonaccruing loans which represent .44% of our total loans. Net chargeoffs in 2010 were four basis points of average loans. We have no more than a handful of delinquencies, almost all of which are 30-day items. Although no one can predict what the future holds, the balance sheet of The First National Bank of Long Island remains among the strongest in the country. We are determined to continue our measured and disciplined approach in booking new earning assets.
In the short term, we do not have plans to redirect tactics. Our strategic initiatives remain the same. We continue to change the composition of our earning assets from securities to loans to enhance our earnings prospects. We are confident loan growth will drive our deposit balances and corresponding franchise value. Our target markets remain consistent: lower middle market companies, small businesses, professionals, and service conscious affluent consumers. We will keep building branch locations in micro-markets we presently do not service, which inevitably will add to the enhancement and recognition of our reputation and brand of banking. Commensurate with our good fortune and success, we have been receiving more calls and interest from the marketplace, both in terms of new business prospects who desire real relationship banking and individual bankers who want to associate themselves with a growing and well disciplined organization. It is our intent to choose the best from both of these categories, and in the process, create additional value.
2
Regardless of our performance to date, I want to assure you the Management Team feels we can not in any way let down our guard. It is hard not to notice record foreclosures, bankruptcies, and an unemployment rate that remains stubbornly high. We remain cautiously optimistic that with our focus on booking loan products we consider to be of a lower risk, we will maintain the quality of our loan portfolio. You may have noticed on our balance sheet that as of December 31, 2010 our Bank had no construction loans in its portfolio. Evergreen and unsecured loans to individuals also remain loan products of which we are wary. We remain strictly “cash flow” lenders who structure our credits carefully with guarantees and collateral as secondary and tertiary sources of repayment.
In closing, I would be remiss if I did not mention the efforts of our employees who certainly are among the most important factors associated with our success. I am extremely proud of our Senior Management Team and our employees at The First National Bank of Long Island. They are, in aggregate, a great group of people and are the secret behind the franchise value we are creating. I would also like to express my appreciation to all of my fellow stockholders for your investment in our company. I can assure you the Executive Team of The First National Bank of Long Island will continue to work diligently with a long-term view towards increasing shareholder value. That objective is what our job is all about; and each and every day, we do not take our eye off that ball. It is our hope our track record and potential for future success will continue to attract an ever-growing number of additional stockholders, and we are confident over the long-term our company will continue to meet your expectations as investors. Although we have been around for almost 85 years, it was only a few years ago that most of Long Island did not seem to recognize The First National Bank of Long Island name. Today, in ever-growing numbers, the marketplace is recognizing our expanding franchise and our reputation for a high quality service culture.
Our people are committed. Our energy level is high. Our work ethic is strong. We are not distracted from building our momentum with capital constraints, credit quality problems or the lack of products to service our desired targeted market segments. Our technology investments have been significant and integrate well into our growth strategy. We have capacity, timely information and processing efficiency. Despite challenges, my expectations are that we will continue to grow and prosper in terms of household share, size, profitability and reputation. More and more customers, more and more people will continue to hear about The First National Bank of Long Island, the Bank “Where Everyone Knows Your Name.”
“We have taken a measured and disciplined approach in growing the Bank’s franchise value.”
Michael N. Vittorio
President and Chief Executive Officer
3
Board of Directors and Executive Officers
|
Board of Directors
|
The First of Long Island Corporation
|
Allen E. Busching
Principal
B&B Capital
(consulting and private investment)
Paul T. Canarick
President & Principal
Paul Todd, Inc.
(construction company)
Alexander L. Cover
Management Consultant
Self Employed
(financial consulting)
Howard Thomas Hogan Jr., Esq.
Director
Hogan & Hogan
(attorney at law)
John T. Lane
Retired Managing Director
J.P. Morgan & Co.
J. Douglas Maxwell Jr.
Chief Financial Officer
NIRx Medical Technologies LLC
(medical instrumentation)
Stephen V. Murphy
President
S.V. Murphy & Co., Inc.
(investment banking)
Milbrey Rennie Taylor
Strategic and Media Consultant
Walter C. Teagle III
Non-executive Chairman
President
Teagle Management, Inc.
(private investment company)
Chairman
Teagle Foundation, Inc.
Michael N. Vittorio
President & Chief Executive Officer
[PHOTO OMITTED]
From left to right (Standing): Allen E. Busching, Stephen V. Murphy, Milbrey Rennie Taylor, Howard Thomas Hogan Jr., Esq. and Paul T. Canarick. From left to right (Sitting): J. Douglas Maxwell, Jr., Michael N. Vittorio, Walter C. Teagle III, Alexander L. Cover and John T. Lane.
|
Executive Officers
|
The First National Bank of Long Island
|
Michael N. Vittorio
President & Chief Executive Officer
4
Sallyanne K. Ballweg
Senior Executive Vice President
Mark D. Curtis
Executive Vice President
Chief Financial Officer & Cashier
Brian J. Keeney
Executive Vice President
Executive Trust Officer
Richard Kick
Executive Vice President
Senior Operations Officer
Donald L. Manfredonia
Executive Vice President
Senior Lending Officer
[PHOTO OMITTED]
From left to right: Sallyanne K. Ballweg, Brian J. Keeney, Michael N. Vittorio, Mark D. Curtis, Richard Kick and Donald L. Manfredonia
Financial Strength
2010 was a year of steady growth for the Bank. We maintained our financial strength by closely managing our credit quality and balance sheet. Plus, we were consistent with our values of personalizing our banking approach with customers.
In June of 2010, Bank Intelligence Solutions, a banking research company, identified 61 banks in the nation as “top performing banks.” Within the State of New York, only two banks were identified. One bank out of Ithaca, New York and ourselves, The First National Bank of Long Island. We are very proud of this achievement and look forward to building momentum as one of the strongest Regional Banks in the country.
Capital Raise
In July 2010, we bolstered our capital position through the sale of 1.4 million shares of common stock at a price of $24 per share. The net proceeds of the offering, after underwriting discount and expenses, were $32.4 million. The purpose of the capital raise was to enable the Corporation to continue to grow in a measured and disciplined manner and meet current regulatory expectations as to what constitutes an appropriate level of capital. The offering was very well received and resulted in the Bank adding a number of high quality institutional investors such as Wellington Management, Putnam Investments, Goldman Sachs Asset Management and JP Morgan Asset Management. Institutional ownership now represents 35% of total shares outstanding.
[PHOTOS OMITTED]
“We look forward to building momentum as one of the strongest Regional Banks in the country.”
Mark D. Curtis
Executive Vice President
Chief Financial Officer & Cashier
Loan Growth & Asset Quality
During 2010, the Bank continued its success of growing its loan portfolio while maintaining exceptional asset quality. On an average balance basis, loans grew in 2010 by 21%, or $148 million.
Our loan originators were able to find attractive loan opportunities that met our underwriting standards despite the challenging economic conditions on Long Island. Growth was generated in two primary loan categories – residential mortgages and commercial mortgages. A significant portion of our growth is attributed to refinance activity.
Toward the latter half of 2009 and the beginning of last year, we embarked upon a comprehensive review of our credit policies in order to insure that our underwriting standards reflected the current economic climate. With certain loan products we became more conservative. For example, we totally eliminated our exposure to construction loans. In addition, in the multifamily product category we elected not to underwrite transactions where there were limited residential units, and in the residential mortgage category we increased our required FICO score minimums.
5
The credit quality of the Bank’s loan portfolio remains excellent, as evidenced by a very low level of delinquent and nonperforming loans. During the year, we built our reserve for loan losses in light of current economic conditions. Our approach toward risk management has served us well. We were able to grow our loans and maintain asset quality. We believe credit risk is the most critical risk we manage for the benefit of our shareholders.
[PHOTO OMITTED]
“We believe credit risk is the most critical risk we manage for the benefit of our shareholders.”
Sallyanne K. Ballweg
Senior Executive Vice President
Branch Expansion
At The First National Bank of Long Island, we continue to build momentum by opening new branch locations and delivering more service to our customers including small businesses, professionals, middle market companies and service conscious consumers.
Our branch expansion strategy has proven to be successful as demonstrated by our deposit growth. On an average balance basis our deposits grew by 19%, or $209 million, in 2010. Ours is a relationship management strategy, not a pricing strategy. We want to know our customers and we want them to know us. Over the long-term, we are confident that building the Bank’s franchise through the growth of deposits will enhance shareholder value.
Our momentum will continue in 2011. The outlook for the Bank is promising. We opened our 34th branch in February in Point Lookout and we are currently scheduled to open a new full service branch in Massapequa, New York later this year. As of today, we have tentative plans to open two more branches in 2012. Our Bank continues to grow because of the dedication and hard work of our employees who contribute to our everyday success. Our employees are the strength behind our balance sheet.
[PHOTOS OMITTED]
“Our employees are the strength behind our balance sheet.”
Richard P. Perro
Senior Vice President
New Branches
[PHOTOS OMITTED]
2010 was a very busy year for the Bank as we opened four new branches on Long Island in Sea Cliff, Cold Spring Harbor, Bellmore and East Meadow. Each branch is richly decorated and designed to create a welcoming, friendly atmosphere with a living room style. The beauty of our branches speaks for itself and our banking professionals are dedicated towards delivering unparalleled service to their customers. These new locations were instrumental in developing household share with the commercial segment and individual consumers. They are all in key markets that will add to our organization’s franchise value in the years that lie ahead.
[PHOTO OMITTED]
Branch Locations
Full Service Offices
[PHOTO OMITTED]
BABYLON
42 Deer Park Avenue
Babylon, NY 11702
(631) 422-1700
Colleen A. Vogelsberg
Vice President & Branch Manager
[PHOTO OMITTED]
BAYVILLE
282 Bayville Avenue
Bayville, NY 11709
(516) 628-1288
Keith DeCuir
Vice President & Branch Manager
Elizabeth A. Materia
Vice President & Branch Market Manager
6
[PHOTO OMITTED]
BELLMORE
408 Bedford Avenue
Bellmore, NY 11710
(516) 679-6200
Julie Freund
Assistant Vice President & Branch Manager
Cathy C. O’Malley
Vice President & Branch Market Manager
[PHOTO OMITTED]
COLD SPRING HARBOR
147 Main Street
Cold Spring Harbor, NY 11724
(631) 367-3600
Colleen De Stefano
Vice President & Branch Manager
Allison Stansfield
Vice President & Branch Market Manager
EAST MEADOW
1975 Hempstead Turnpike
East Meadow, NY 11554
(516) 357-7200
Larry McGovern
Assistant Vice President & Branch Manager
Cathy C. O’Malley
Vice President & Branch Market Manager
[PHOTO OMITTED]
GARDEN CITY
1050 Franklin Avenue
Garden City, NY 11530
(516) 742-6262
Carol A. Kolesar
Vice President & Branch Manager
[PHOTO OMITTED]
GLEN HEAD
10 Glen Head Road
Glen Head, NY 11545
(516) 671-4900
John J. Mulder Jr.
Vice President & Branch Manager
[PHOTO OMITTED]
GREENVALE
7 Glen Cove Road
Greenvale, NY 11548
(516) 621-8811
Christina Marotta
Vice President & Branch Manager
[PHOTO OMITTED]
HUNTINGTON
253 New York Avenue
Huntington, NY 11743
(631) 427-4143
Frank M. Plesche
Vice President & Branch Manager
7
[PHOTO OMITTED]
LOCUST VALLEY
108 Forest Avenue
Locust Valley, NY 11560
(516) 671-2299
Elizabeth A. Materia
Vice President & Branch Market Manager
COMING SOON!
MASSAPEQUA
[PHOTO OMITTED]
MERRICK
1810 Merrick Avenue
Merrick, NY 11566
(516) 771-6000
Cathy C. O’Malley
Vice President & Branch Market Manager
[PHOTO OMITTED]
NORTHPORT
711 Fort Salonga Road
Northport, NY 11768
(631) 261-4000
Mary T. Sullivan
Vice President & Branch Market Manager
[PHOTO OMITTED]
NORTHPORT VILLAGE
105 Main Street
Northport, NY 11768
(631) 261-0331
Vincent P. Bartilucci
Vice President & Branch Manager
Mary T. Sullivan
Vice President & Branch Market Manager
[PHOTO OMITTED]
OLD BROOKVILLE
209 Glen Head Road
Old Brookville, NY 11545
(516) 759-9002
Henry C. Suhr
Vice President & Branch Manager
[PHOTO OMITTED]
POINT LOOKOUT
26A Lido Boulevard
P.O. Box 173
Point Lookout, NY 11569
(516) 431-3144
Linda A. Rowse
Assistant Vice President & Branch Manager
Cathy C. O’Malley
Vice President & Branch Market Manager
8
[PHOTO OMITTED]
ROCKVILLE CENTRE
310 Merrick Road
Rockville Centre, NY 11570
(516) 763-5533
Linda Roldan
Vice President & Branch Manager
[PHOTO OMITTED]
ROSLYN HEIGHTS
130 Mineola Avenue
Roslyn Heights, NY 11577
(516) 621-1900
Lorraine Russo
Vice President & Branch Manager
[PHOTO OMITTED]
SEA CLIFF
299 Sea Cliff Avenue
Sea Cliff, NY 11579
(516) 671-7868
Kirk B. Thomas
Vice President & Branch Manager
[PHOTO OMITTED]
VALLEY STREAM
127 East Merrick Road
Valley Stream, NY 11580
(516) 825-0202
Toni Valente
Vice President & Branch Manager
[PHOTO OMITTED]
WOODBURY
800 Woodbury Road, Suite M
Woodbury, NY 11797
(516) 364-3434
Allison Stansfield
Vice President & Branch Market Manager
Commercial Banking Offices
[PHOTO OMITTED]
BOHEMIA
30 Orville Drive
Bohemia, NY 11716
(631) 218-2500
Kathleen M. Crowe
Vice President & Branch Manager
[PHOTO OMITTED]
DEER PARK
60 East Industry Court
Deer Park, NY 11729
(631) 243-2600
Joanne Maiorana-Davis
Vice President & Branch Manager
[PHOTO OMITTED]
FARMINGDALE
22 Allen Boulevard
Farmingdale, NY 11735
(631) 753-8888
9
Sandy F. Buttacy
Vice President & Branch Manager
[PHOTO OMITTED]
FARMINGDALE
2091 New Highway
Farmingdale, NY 11735
(631) 454-2022
Robert A. Pizza
Vice President & Branch Manager
[PHOTO OMITTED]
GREAT NECK
536 Northern Boulevard
Great Neck, NY 11021
(516) 482-6666
Joanne Bosco
Vice President & Branch Manager
[PHOTO OMITTED]
HAUPPAUGE
330 Motor Parkway
Hauppauge, NY 11788
(631) 952-2900
JoAnn Diamond
Vice President & Branch Manager
[PHOTO OMITTED]
HICKSVILLE
106 Old Country Road
Hicksville, NY 11801
(516) 932-7150
Joyce C. Graber
Vice President & Branch Manager
[PHOTO OMITTED]
NEW HYDE PARK
243 Jericho Turnpike
New Hyde Park, NY 11040
(516) 328-3100
Susan Costabile
Vice President & Branch Manager
[PHOTO OMITTED]
PORT JEFFERSON STATION
Davis Professional Park
5225 Nesconset Highway
Building 4, Suite 21
Port Jefferson Station, NY 11776
(631) 928-4411
Susan Donovan
Vice President & Branch Manager
MANHATTAN
[PHOTO OMITTED]
232 Madison Avenue
New York, NY 10016
(212) 213-8111
10
Judith A. Ferdinand
Vice President & Branch Manager
[PHOTO OMITTED]
225 Broadway, Suite 703
New York, NY 10007
(212) 693-1515
Gladys Ruggiero
Vice President & Branch Manager
[PHOTO OMITTED]
1501 Broadway, Suite 301
New York, NY 10036
(212) 278-0707
Doris M. Burkett
Vice President & Branch Manager
Select Service Banking Centers
[PHOTO OMITTED]
LAKE SUCCESS
3000 Marcus Avenue
Lake Success, NY 11042
(516) 775-3133
Jerry Scansarole
Vice President & Branch Manager
[PHOTO OMITTED]
SMITHTOWN
285 Middle Country Road, Suite 104
Smithtown, NY 11787
(631) 265-0200
Frances A. Koslow
Vice President & Branch Manager
[PHOTO OMITTED]
Disaster Recovery Center
Our detailed Technology Plan supports our business goals, optimizes business investment, and manages the technology related risks and opportunities for the Bank. In order to help drive shareholder value and deliver more effective and convenient services to our customers, we use technology as a tool to increase our business capacity and create expense efficiencies. Plus, it allows us to be the provider of choice within the markets that we service.
In 2010, the Bank built a new Data Center, which serves as the IT Department’s base of operations, as well as our Disaster Recovery Facility. This state-of-the-art facility was built to the highest technological and engineering standards and employs best practices. This includes a Server Room with the appropriate technology, equipment and security to enable substantial future growth of the Bank and ensure we have the appropriate backup capability to manage in the event of a disaster.
We are very proud of the technological investment we made in 2010. The security and protection of our customers’ financial assets are a priority to us.
[PHOTO OMITTED]
“The security and protection of our customers’ financial assets are a priority to us.”
Richard Kick
Executive Vice President
Senior Operations Officer
11
Community Outreach
The First National Bank of Long Island made significant charitable donations in 2010 to support local organizations and activities in the communities we serve. Many of our employees have volunteered their time to support those in need and we thank each and every individual for contributing to the success we have achieved with our community service initiatives.
In order to continue our momentum, the Bank organized a community service committee to help identify future community involvement programs. We look forward to establishing more community initiatives and events in the years to come.
Some of our initiatives are listed below:
|
|
·
|
Toys for Tots – The Bank was proud to participate in the Young CPAs Committee of the NYSSCPA Suffolk Chapter’s 16th Annual Holiday Toy Drive. Hundreds of toys were collected in the Bank’s branches to benefit the U.S. Marine Corps’ Toys for Tots Program. The event was the single largest pickup in all of Suffolk County.
|
|
|
·
|
Toys of Hope Coat Drive – We sponsored a drive for the not-for-profit organization named Toys of Hope located in Huntington Station, New York. Numerous coats, toys and clothing were collected for Long Island homeless children and families.
|
|
|
·
|
The INN (Interfaith Nutrition Network) – The Bank held an Employee Food Drive and collected 700 lbs of food and monetary donations for the INN in Hempstead, Long Island. The organization helps homeless people and families overcome the challenge of hunger.
|
|
|
·
|
Teach Kids to Save Program – The Bank continues to work with local schools on Long Island to promote financial literacy to elementary school students. “Banking Days” are held at the schools and a local Branch Manager makes a presentation to students. In 2010, more than ten schools participated in our program and hundreds of students learned about the importance of saving money and developing good banking habits.
|
|
|
·
|
Long Island Cares Inc., The Harry Chapin Food Bank – We collected 618 pounds of food in our branches to help feed Long Island children and families.
|
|
|
·
|
Operation Warmth – The Bank participated in Northport’s Chamber of Commerce “Operation Warmth” donation drive. We collected over 100 coats, jackets, hats, scarves and gloves that were delivered to those in need on Long Island.
|
[PHOTOS OMITTED]
12
S E L E C T E D F I N A N C I A L D A T A
The following is selected consolidated financial data for the past five years. This data should be read in conjunction with the information contained under the caption "Management's Discussion and Analysis of Financial Condition and Results of Operations" and the accompanying consolidated financial statements and related notes.
|
2010
|
2009
|
2008
|
2007
|
2006
|
||||||||||||||||
|
INCOME STATEMENT DATA:
|
||||||||||||||||||||
|
Interest Income
|
$ | 72,369,000 | $ | 66,274,000 | $ | 59,686,000 | $ | 53,023,000 | $ | 49,000,000 | ||||||||||
|
Interest Expense
|
16,774,000 | 18,334,000 | 16,743,000 | 16,269,000 | 12,949,000 | |||||||||||||||
|
Net Interest Income
|
55,595,000 | 47,940,000 | 42,943,000 | 36,754,000 | 36,051,000 | |||||||||||||||
|
Provision for Loan Losses
|
3,973,000 | 4,285,000 | 1,945,000 | 575,000 | 670,000 | |||||||||||||||
|
Net Income
|
18,392,000 | 13,463,000 | 12,962,000 | 11,482,000 | 11,227,000 | |||||||||||||||
|
PER SHARE DATA:
|
||||||||||||||||||||
|
Basic Earnings
|
$ 2.33 | $ 1.87 | $ 1.79 | $ 1.52 | $ 1.47 | |||||||||||||||
|
Diluted Earnings
|
2.30 | 1.84 | 1.78 | 1.51 | 1.45 | |||||||||||||||
|
Cash Dividends Declared
|
.84 | .76 | .66 | .58 | .50 | |||||||||||||||
|
Dividend Payout Ratio
|
36.52 | % | 41.30 | % | 37.08 | % | 38.41 | % | 34.48 | % | ||||||||||
|
Stock Splits/Dividends Declared
|
- | - | - |
2-for-1
|
- | |||||||||||||||
|
Book Value
|
$ 17.99 | $ 16.15 | $ 14.25 | $ 13.73 | $ 12.60 | |||||||||||||||
|
Tangible Book Value
|
17.97 | 16.12 | 14.22 | 13.71 | 12.57 | |||||||||||||||
|
BALANCE SHEET DATA AT YEAR END:
|
||||||||||||||||||||
|
Total Assets
|
$ | 1,711,023,000 | $ | 1,675,169,000 | $ | 1,261,609,000 | $ | 1,069,019,000 | $ | 954,166,000 | ||||||||||
|
Loans
|
902,959,000 | 827,666,000 | 658,134,000 | 525,539,000 | 449,465,000 | |||||||||||||||
|
Allowance for Loan Losses
|
14,014,000 | 10,346,000 | 6,076,000 | 4,453,000 | 3,891,000 | |||||||||||||||
|
Deposits
|
1,292,938,000 | 1,277,550,000 | 900,337,000 | 869,038,000 | 824,797,000 | |||||||||||||||
|
Borrowed Funds
|
253,590,000 | 273,407,000 | 251,122,000 | 92,110,000 | 28,143,000 | |||||||||||||||
|
Stockholders' Equity
|
156,694,000 | 116,462,000 | 102,532,000 | 102,384,000 | 95,561,000 | |||||||||||||||
|
AVERAGE BALANCE SHEET DATA:
|
||||||||||||||||||||
|
Total Assets
|
$ | 1,657,396,000 | $ | 1,413,632,000 | $ | 1,181,655,000 | $ | 1,003,240,000 | $ | 977,232,000 | ||||||||||
|
Loans
|
864,163,000 | 716,569,000 | 572,356,000 | 480,166,000 | 418,746,000 | |||||||||||||||
|
Allowance for Loan Losses
|
11,954,000 | 6,357,000 | 4,947,000 | 4,167,000 | 3,609,000 | |||||||||||||||
|
Deposits
|
1,310,507,000 | 1,101,828,000 | 919,490,000 | 868,421,000 | 842,399,000 | |||||||||||||||
|
Borrowed Funds
|
193,823,000 | 194,129,000 | 157,275,000 | 32,705,000 | 37,989,000 | |||||||||||||||
|
Stockholders' Equity
|
142,140,000 | 110,767,000 | 100,710,000 | 98,402,000 | 93,064,000 | |||||||||||||||
|
FINANCIAL RATIOS:
|
||||||||||||||||||||
|
Return on Average Assets (ROA)
|
1.11 | % | 0.95 | % | 1.10 | % | 1.14 | % | 1.15 | % | ||||||||||
|
Return on Average Stockholders' Equity (ROE)
|
12.94 | % | 12.15 | % | 12.87 | % | 11.67 | % | 12.06 | % | ||||||||||
|
Average Equity to Average Assets
|
8.58 | % | 7.84 | % | 8.52 | % | 9.81 | % | 9.52 | % | ||||||||||
S T O C K P R I C E S
The Corporation's Common Stock trades on The Nasdaq Capital Market tier of The Nasdaq Stock Market under the symbol FLIC. The following table sets forth high and low sales prices for the years ended December31, 2010 and 2009.
|
2010
|
2009
|
|||||||||||||||
|
Quarter
|
High
|
Low
|
High
|
Low
|
||||||||||||
|
First
|
$25.97 | $22.46 | $23.75 | $19.34 | ||||||||||||
|
Second
|
28.08 | 23.62 | 26.25 | 19.75 | ||||||||||||
|
Third
|
27.00 | 24.01 | 30.00 | 22.25 | ||||||||||||
|
Fourth
|
29.24 | 24.55 | 28.50 | 22.75 | ||||||||||||
At December 31, 2010, there were 559 stockholders of record of the Corporation's Common Stock. The number of stockholders of record includes banks and brokers who act as nominees, each of whom may represent more than one stockholder.
13
M A N A G E M E N T ' S D I S C U S S I O N A N D A N A L Y S I S O F
F I N A N C I A L C O N D I T I O N A N D R E S U L T S O F O P E R A T I O N S
The following is management's discussion and analysis of certain significant factors that have affected the Corporation’s financial condition and operating results during the periods included in the accompanying consolidated financial statements, and should be read in conjunction with such financial statements. The Corporation’s financial condition and operating results principally reflect those of its wholly-owned subsidiary, The First National Bank of Long Island (the “Bank”), and subsidiaries wholly-owned by the Bank, either directly or indirectly, The First of Long Island Agency, Inc., FNY Service Corp. (“FNY”), and The First of Long Island REIT, Inc. (“REIT”). The consolidated entity is referred to as the “Corporation” and the Bank and its subsidiaries are collectively referred to as the “Bank.” The Bank’s primary service area is Nassau and Suffolk Counties, Long Island. However, the Bank has three commercial banking branches in Manhattan and may open additional New York City branches in the future.
Overview
Overview – 2010 Versus 2009. The Corporation earned $18.4 million in 2010. This is an increase of 36.6% over 2009 earnings of $13.5 million. On a per share basis, earnings for 2010 were $2.30. This is $.46 better than $1.84 per share earned in 2009. Returns on average assets and equity were 1.11% and 12.94%, respectively, for 2010 compared to .95% and 12.15%, respectively, for 2009. Cash dividends per share grew by 8 cents, or 10.5%, from 76 cents per share in 2009 to 84 cents this year. In July 2010 the Corporation bolstered its capital position through the sale of 1.4 million shares of common stock at a price of $24 per share. The resulting net proceeds of the offering after underwriting discount and expenses was $32.4 million.
Earnings for the fourth quarter of 2010 were $.46 per share, representing an increase of $.16 per share, or 53.3% over $.30 per share earned in the same quarter last year. The improvement was primarily due to the fact that the provision for loan losses was $2.1 million higher in the fourth quarter of 2009, which impacted earnings by approximately $.17 per share. When comparing fourth quarter to third quarter 2010 results, earnings are down $.09 per share, or 16.4%, primarily as a result of an increase in the provision for loan losses of $725,000, the establishment of a $300,000 valuation allowance on one loan held for sale and the full quarter dilutive impact of the common stock offering. The increase in the provision for loan losses was driven by the establishment of an impairment reserve of $870,000 on one nonaccrual loan.
The large drivers of earnings per share growth in 2010 were growth in the average balances of loans and tax-exempt municipal securities and decreases in the rates paid on various categories of deposits. The positive impact of these items was partially offset by decreases in overall yield on the Bank’s loan and taxable securities portfolios, expense increases attributable to the Bank’s branch growth initiative and general inflation in the cost of goods and services, and the dilutive impact of the 2010 common stock offering which is estimated to be approximately $.16 per share.
On an average balance basis, loans grew by $147.6 million, or 20.6% when comparing 2010 to 2009. Almost all of the growth occurred in commercial and residential mortgages, the average balances of which were up $92.4 million, or 29.2%, and $66.3 million, or 29.5%, respectively. A significant portion of the growth in the average balance of residential mortgages was attributable to loans originated during 2010, with the remainder attributable to loans originated in 2009. By contrast, almost all of the growth in the average balance of commercial mortgages was attributable to loans originated in 2009, with the remainder attributable to loans originated this year. The large reduction in commercial mortgage originations in 2010 was the result of a variety of factors including, but not limited to, a deliberate reduction in originations during the first half of 2010 in order to build the Bank’s Tier 1 leverage capital ratio, a softening in loan demand during the latter half of 2010 and a reduction in multifamily loan originations throughout 2010 in an effort to diversify the Bank’s commercial mortgage portfolio.
The overall yield earned on the Bank’s loan portfolio declined by 26 basis points in 2010 and the overall yield on the Bank’s taxable securities portfolio declined by 70 basis points. The decline in yield on the loan portfolio was primarily attributable to a decline in general interest rates and competitive conditions in the local marketplace. The decline in yield on the taxable securities portfolio was also attributable to a decline in general interest rates and, additionally, a significant increase in the size of the short-term mortgage securities portfolio relative to the total taxable securities portfolio. Short-term mortgage securities, which the Bank generally defines as those having an estimated average life of 2.5 years or less at the date of purchase, represented 38.8% of the average balance of the total taxable securities portfolio in 2010 as compared to 18.2% last year. Management grew this segment of the taxable securities portfolio as a hedge against potential future increases in interest rates, to balance the duration of the overall securities portfolio in light of the increased size of the longer-term municipal securities portfolio, and because the incremental yield that could be earned on longer average life mortgage securities was relatively small. In addition, management temporarily invested a significant portion of the proceeds of the 2010 common stock offering in short-term mortgage securities with the intention of reinvesting the monthly paydowns on such securities in better yielding loans.
14
The credit quality of the Bank’s loan portfolio remains excellent as evidenced by, among other things, low levels of past due, nonaccrual and impaired loans. In an attempt to maintain credit quality, management continues to focus its loan portfolio growth efforts on what it considers lower risk loan categories (i.e., owner occupied commercial mortgages, multifamily loans, and first lien residential mortgages having terms generally between ten and fifteen years) and continues to avoid growing what it considers higher risk loan categories (i.e., construction loans and unsecured loans to individuals). The credit quality of the Bank’s securities portfolio also remains excellent. All of the Bank’s mortgage securities are backed by mortgages underwritten on conventional terms, and almost all of these securities are full faith and credit obligations of the U.S. government. The remainder of the Bank’s securities portfolio consists principally of municipal securities rated AA or better by major rating agencies.
Looking forward to 2011, challenges for the Bank and our industry as a whole will likely include, among others, the maintenance of net interest margin and the cost of complying with the abundance of recently enacted laws and regulations impacting the financial services industry. With respect to net interest margin, the general level of interest rates and competition could cause the yields available on securities and loans to remain relatively low, while at the same time the Bank may have limited opportunity to further reduce its deposit rates. Furthermore, earnings per share in 2011 will include the dilutive impact of the July 2010 common stock offering for a full year. Notwithstanding these challenges, the Bank enters 2011 with a record of steady earnings growth, excellent credit quality, sufficient capital to provide for growth and a corporate philosophy that remains focused on maintaining the strength and quality of the Bank’s balance sheet and creating long-term shareholder value.
Key strategic initiatives for 2011 and beyond include continued loan growth, maintenance of asset quality, maintenance of capital strength and expansion of the Bank’s branch distribution system both on Long Island and in New York City. During 2010 the Bank opened four full service branches on Long Island in Sea Cliff, Cold Spring Harbor, East Meadow and Bellmore. Thus far in 2011, the Bank opened a full service branch in Point Lookout, Long Island and plans to open a full service branch in Massapequa, Long Island later in the year.
Overview – 2009 Versus 2008. The Corporation earned $1.84 per share in 2009, an increase of 6 cents, or 3.4%, over $1.78 earned in 2008. Cash dividends per share grew by 10 cents, or 15.2%, from 66 cents per share in 2008 to 76 cents in 2009.
The Bank’s core business of gathering deposits and making loans was strong in 2009. Total deposits grew by $377.2 million, or 41.9%, and gross loans grew by $169.5 million, or 25.8%. Two thirds of the overall deposit growth came from savings and money market products, with most of the remaining growth occurring in time deposits. Contributing to deposit growth were new branch openings and expansion of existing branches, competitively priced deposit products, a high level of customer service and deposit rate promotions. In addition, management believed that uncertainty in the equity markets and the negative publicity surrounding money center banks also played a role.
Loan growth, the primary driver of earnings growth in 2009, principally occurred in what management considers to be lower risk loan categories including multifamily loans, owner occupied commercial mortgages, and first lien residential mortgages with ten to fifteen year terms. By contrast, management considers construction and land development loans to be high risk and had purposely not grown this category. Construction and land development loans amounted to only $3.1 million, or .4% of gross loans, at year-end 2009. Loan growth occurred in 2009 as part of management’s continued efforts to improve the Bank’s earnings prospects by making loans a larger portion of the overall balance sheet.
National and local economic conditions remained unfavorable throughout 2009. Furthermore, management believed that economic conditions would not improve considerably in 2010, and any improvement beyond 2010 would occur slowly over an extended period of time. In addition the Bank grew its loan portfolio at a compound annual growth rate of 19% over the five year period ended December 31, 2009 and its loan portfolio was primarily comprised of commercial and residential real estate loans concentrated on Long Island and in New York City. Based on these and other factors, and despite the fact that the Bank had a very low level of identified problem loans, in closing the fourth quarter of 2009 management decided to increase the Bank’s allowance for loan losses relative to gross loans. The Bank’s allowance for loan losses at year-end 2009 was $10.3 million, or 1.25% of gross loans, compared to $6.1 million, or .92% of gross loans, at year-end 2008.
The Bank’s capital ratios trended down in 2009 due to overall balance sheet growth and growth in the Bank’s loan portfolio, but at year-end 2009 still exceeded the regulatory criteria for a well-capitalized bank. Total stockholders’ equity before accumulated other comprehensive income or loss grew by $8.7 million in 2009 versus $3.4 million in 2008. The larger growth in 2009 was primarily attributable to the fact that the Corporation significantly reduced its share repurchases in order to preserve and build capital in light of the unfavorable economic climate.
15
Net interest margin declined in 2009 because the rates available for investments in loans and securities declined, and rapid deposit growth resulted in the need to temporarily invest excess cash in low yielding balances with correspondent banks until better yielding loans and securities could be originated or purchased. Margin also declined because management shortened the average duration of the Bank’s taxable securities portfolio as a prudent measure to, among other things, protect the Bank’s net interest income in the event of an increase in interest rates. Noninterest income increased by $1.5 million, or 23.6%, in 2009 because of increases in service charge income and gains on sales of securities of $518,000 and $1.2 million, respectively. FDIC insurance expense increased by $1,630,000, or from $558,000 in 2008 to $2,188,000 in 2009. The increase was caused by failures in the industry and their adverse impact on the deposit insurance fund (“DIF”). Pension plan expense increased by $1,041,000, or from $576,000 in 2008 to $1,617,000 in 2009. The increase resulted from a decline in long-term interest rates and the poor performance of the equity markets in 2008.
The Corporation’s effective tax rate, or income tax expense as a percentage of book income, declined from 26.3% in 2008 to 18.8% in 2009. The decline was attributable to a restructuring of the ownership of the Corporation’s REIT entity in December 2008 and a significant increase during 2009 in the size of the Bank’s tax-exempt municipal securities portfolio. The REIT restructuring, which reduced the Corporation’s 2009 income tax burden by approximately $700,000, was done in response to a change in New York State tax law in 2008. The law change deprived the Corporation in 2008 of the tax benefit that had traditionally been derived from its REIT entity and the restructuring restored that benefit. The Bank significantly increased the size of its tax-exempt municipal securities portfolio in 2009 in response to provisions of the American Recovery and Reinvestment Act of 2009 which enabled the Bank to buy certain tax-exempt securities at what it believed to be attractive yields without the usual limitations imposed by the federal alternative minimum tax.
In the first quarter of 2009, the Bank opened a commercial banking office in Port Jefferson Station, Long Island. Subsequently in 2009, a full service branch was opened in Bayville, Long Island and the Valley Stream commercial banking office was converted to a full service branch.
16
Net Interest Income
Average Balance Sheet; Interest Rates and Interest Differential. The following table sets forth the average daily balances for each major category of assets, liabilities and stockholders’ equity as well as the amounts and average rates earned or paid on each major category of interest-earning assets and interest-bearing liabilities.
|
2010
|
2009
|
2008
|
||||||||||||||||||||||||||||||||||
|
Average Balance
|
Interest/ Dividends
|
Average Rate
|
Average Balance
|
Interest/ Dividends
|
Average Rate
|
Average Balance
|
Interest/ Dividends
|
Average Rate
|
||||||||||||||||||||||||||||
|
Assets:
|
(dollars in thousands)
|
|||||||||||||||||||||||||||||||||||
|
Federal funds sold and overnight investments
|
$ | 283 | $ | - | - | % | $ | 374 | $ | - | - | % | $ | 19,362 | $ | 480 | 2.48 | % | ||||||||||||||||||
|
Investment securities:
|
||||||||||||||||||||||||||||||||||||
|
Taxable
|
472,039 | 16,845 | 3.57 | 443,559 | 18,926 | 4.27 | 386,404 | 18,857 | 4.88 | |||||||||||||||||||||||||||
|
Nontaxable (1)
|
242,830 | 14,945 | 6.15 | 181,084 | 11,508 | 6.36 | 143,121 | 9,373 | 6.55 | |||||||||||||||||||||||||||
|
Loans (1) (2)
|
864,163 | 45,683 | 5.29 | 716,569 | 39,780 | 5.55 | 572,356 | 34,193 | 5.97 | |||||||||||||||||||||||||||
|
Total interest-earning assets (1)
|
1,579,315 | 77,473 | 4.91 | 1,341,586 | 70,214 | 5.23 | 1,121,243 | 62,903 | 5.61 | |||||||||||||||||||||||||||
|
Allowance for loan losses
|
(11,954 | ) | (6,357 | ) | (4,947 | ) | ||||||||||||||||||||||||||||||
|
Net interest-earning assets
|
1,567,361 | 1,335,229 | 1,116,296 | |||||||||||||||||||||||||||||||||
|
Cash and due from banks
|
40,261 | 42,962 | 32,524 | |||||||||||||||||||||||||||||||||
|
Premises and equipment, net
|
20,442 | 16,937 | 11,587 | |||||||||||||||||||||||||||||||||
|
Other assets
|
29,332 | 18,504 | 21,248 | |||||||||||||||||||||||||||||||||
| $ | 1,657,396 | $ | 1,413,632 | $ | 1,181,655 | |||||||||||||||||||||||||||||||
|
Liabilities and
|
||||||||||||||||||||||||||||||||||||
|
Stockholders' Equity:
|
||||||||||||||||||||||||||||||||||||
|
Savings and money market deposits
|
$ | 651,506 | 4,049 | .62 | $ | 501,125 | 5,287 | 1.06 | $ | 364,974 | 4,576 | 1.25 | ||||||||||||||||||||||||
|
Time deposits
|
285,213 | 5,977 | 2.10 | 266,216 | 6,485 | 2.44 | 236,820 | 6,782 | 2.86 | |||||||||||||||||||||||||||
|
Total interest-bearing deposits
|
936,719 | 10,026 | 1.07 | 767,341 | 11,772 | 1.53 | 601,794 | 11,358 | 1.89 | |||||||||||||||||||||||||||
|
Short-term borrowings
|
28,864 | 108 | .37 | 40,663 | 221 | .54 | 48,379 | 746 | 1.54 | |||||||||||||||||||||||||||
|
Long-term debt
|
164,959 | 6,640 | 4.03 | 153,466 | 6,341 | 4.13 | 108,896 | 4,639 | 4.26 | |||||||||||||||||||||||||||
|
Total interest-bearing liabilities
|
1,130,542 | 16,774 | 1.48 | 961,470 | 18,334 | 1.91 | 759,069 | 16,743 | 2.21 | |||||||||||||||||||||||||||
|
Checking deposits
|
373,788 | 334,487 | 317,696 | |||||||||||||||||||||||||||||||||
|
Other liabilities
|
10,926 | 6,908 | 4,180 | |||||||||||||||||||||||||||||||||
| 1,515,256 | 1,302,865 | 1,080,945 | ||||||||||||||||||||||||||||||||||
|
Stockholders' equity
|
142,140 | 110,767 | 100,710 | |||||||||||||||||||||||||||||||||
| $ | 1,657,396 | $ | 1,413,632 | $ | 1,181,655 | |||||||||||||||||||||||||||||||
|
Net interest income (1)
|
$ | 60,699 | $ | 51,880 | $ | 46,160 | ||||||||||||||||||||||||||||||
|
Net interest spread (1)
|
3.43 | % | 3.32 | % | 3.40 | % | ||||||||||||||||||||||||||||||
|
Net interest margin (1)
|
3.84 | % | 3.87 | % | 4.12 | % | ||||||||||||||||||||||||||||||
|
(1)
|
Tax-equivalent basis. Interest income on a tax-equivalent basis includes the additional amount of interest income that would have been earned if the Corporation's investment in tax-exempt loans and investment securities had been made in loans and investment securities subject to Federal income taxes yielding the same after-tax income. The tax-equivalent amount of $1.00 of nontaxable income was $1.52 in each period presented, based on a Federal income tax rate of 34%.
|
|
(2)
|
For the purpose of these computations, nonaccruing loans are included in the daily average loan amounts outstanding.
|
17
Rate/Volume Analysis. The following table sets forth the effect of changes in volumes, rates, and rate/volume on tax-equivalent interest income, interest expense and net interest income.
|
Year Ended December 31,
|
||||||||||||||||||||||||||||||||
|
2010 versus 2009
|
2009 versus 2008
|
|||||||||||||||||||||||||||||||
|
Increase (decrease) due to changes in:
|
Increase (decrease) due to changes in:
|
|||||||||||||||||||||||||||||||
|
Volume
|
Rate
|
Rate/ Volume (1)
|
Net Change
|
Volume
|
Rate
|
Rate/ Volume (1)
|
Net Change
|
|||||||||||||||||||||||||
|
(in thousands)
|
||||||||||||||||||||||||||||||||
|
Interest Income:
|
||||||||||||||||||||||||||||||||
|
Federal funds sold and overnight investments
|
$ | - | $ | - | $ | - | $ | - | $ | (471 | ) | $ | (480 | ) | $ | 471 | $ | (480 | ) | |||||||||||||
|
Investment securities:
|
||||||||||||||||||||||||||||||||
|
Taxable
|
1,215 | (3,097 | ) | (199 | ) | (2,081 | ) | 2,789 | (2,370 | ) | (350 | ) | 69 | |||||||||||||||||||
|
Nontaxable
|
3,924 | (363 | ) | (124 | ) | 3,437 | 2,486 | (278 | ) | (73 | ) | 2,135 | ||||||||||||||||||||
|
Loans
|
8,194 | (1,899 | ) | (392 | ) | 5,903 | 8,615 | (2,419 | ) | (609 | ) | 5,587 | ||||||||||||||||||||
|
Total interest income
|
13,333 | (5,359 | ) | (715 | ) | 7,259 | 13,419 | (5,547 | ) | (561 | ) | 7,311 | ||||||||||||||||||||
|
Interest Expense:
|
||||||||||||||||||||||||||||||||
|
Savings and money market deposits
|
1,587 | (2,173 | ) | (652 | ) | (1,238 | ) | 1,707 | (725 | ) | (271 | ) | 711 | |||||||||||||||||||
|
Time deposits
|
463 | (906 | ) | (65 | ) | (508 | ) | 842 | (1,013 | ) | (126 | ) | (297 | ) | ||||||||||||||||||
|
Short-term borrowings
|
(64 | ) | (69 | ) | 20 | (113 | ) | (119 | ) | (483 | ) | 77 | (525 | ) | ||||||||||||||||||
|
Long-term debt
|
475 | (164 | ) | (12 | ) | 299 | 1,899 | (140 | ) | (57 | ) | 1,702 | ||||||||||||||||||||
|
Total interest expense
|
2,461 | (3,312 | ) | (709 | ) | (1,560 | ) | 4,329 | (2,361 | ) | (377 | ) | 1,591 | |||||||||||||||||||
|
Increase (decrease) in net interest income
|
$ | 10,872 | $ | (2,047 | ) | $ | (6 | ) | $ | 8,819 | $ | 9,090 | $ | (3,186 | ) | $ | (184 | ) | $ | 5,720 | ||||||||||||
|
(1)
|
Represents the change not solely attributable to change in rate or change in volume but a combination of these two factors. The rate/volume variance could be allocated between the volume and rate variances shown in the table based on the absolute value of each to the total for both.
|
Net Interest Income – 2010 Versus 2009
Net interest income on a tax-equivalent basis increased by $8.8 million, or from $51.9 million in 2009 to $60.7 million this year. The most significant reasons for the increase in net interest income were growth in the Bank’s loan and tax-exempt securities portfolios and decreases in the rates paid on various categories of deposits. On an average balance basis, loans grew by $147.6 million, or 20.6%, and tax-exempt securities grew by $61.7 million, or 34.1%. Growth in these asset categories was funded by an increase in interest-bearing deposits, which on an average balance basis grew by $169.4 million, or 22.1%, and an increase in checking deposits, which on an average balance basis grew by $39.3 million, or 11.7%. The positive impact of loan and securities growth and decreases in deposit rates was partially offset by decreases in the overall yield on the Bank’s loan and taxable securities portfolios.
Net interest spread, or the difference between the overall yield on interest-earning assets and the overall cost of interest-bearing liabilities, increased by 11 basis points in 2010. This occurred primarily because management, through a steady reduction in the Bank’s deposit rates throughout 2010, was able to lower the Bank’s cost of deposits by 46 basis points while at the same time the overall yield on the Bank’s interest-earning assets declined by only 32 basis points. The spread increase, when applied to those interest-earning assets funded by interest-bearing liabilities, positively impacted both net interest income and net interest margin. On the other hand, for those interest-earning assets funded by noninterest-bearing checking deposits and capital, the 32 basis point decline in asset yield had a more than offsetting negative impact on net interest income and net interest margin and thereby caused net interest margin to decline. The 32 basis point decline in overall asset yield was primarily attributable to a decline in general interest rates, competitive loan pricing in the Bank’s marketplace, and a significant increase, for reasons previously discussed, in the Bank’s short-term mortgage securities portfolio.
18
Net Interest Income – 2009 Versus 2008
Net interest income on a tax-equivalent basis increased by $5,720,000 or from $46,160,000 in 2008 to $51,880,000 in 2009. The most significant reason for the increase was growth in the Bank’s loan portfolio, which, on an average balance basis, grew by $144.2 million, or 25.2%. Loan growth was funded by an increase in interest-bearing deposits, which, on an average balance basis, grew by $165.5 million, or 27.5%. Deposit growth in excess of that needed to grow loans was mostly invested in a combination of taxable and nontaxable securities. Also contributing to the growth in net interest income was a 30 basis point reduction in the overall cost of deposits and borrowings in 2009 resulting from the steady decline in market interest rates in 2008 and the Bank’s ability to lower its deposit rates throughout 2009 in response to more rational pricing in its marketplace.
The positive impact of loan growth and lower deposit and borrowing costs was partially offset by a decline in rates available for investments in loans and securities. Other offsetting factors were management shortened the average duration of the Bank’s taxable securities portfolio as a prudent measure to, among other things, protect the Bank’s net interest income in the event of an increase in interest rates, and the Bank’s need to temporarily invest excess cash resulting from rapid deposit growth in low yielding balances with correspondent banks until better yielding loans and securities could be originated or purchased. These offsetting factors are the principal causes of the 38 basis point reduction in the overall yield on interest-earning assets in 2009.
While net interest income increased in 2009, net interest spread declined by 8 basis points as the yield on interest-earning assets declined more than the cost of deposits and borrowings. Net interest margin declined even more than net interest spread, or by 38 basis points, because a significant portion of the Corporation’s interest-earning assets are funded by noninterest-bearing liabilities and capital. For these assets, a reduction in yield has no offsetting reduction in interest cost and therefore results in a corresponding reduction in net interest margin. Also negatively impacting net interest margin were deposit rate promotions associated with new branch openings, expansion of existing branches and management’s desire to grow certain categories of deposits.
Noninterest Income, Noninterest Expense, and Income Taxes
Noninterest income includes service charges on deposit accounts, Investment Management Division income, gains or losses on sales of securities, and all other items of income, other than interest, resulting from the business activities of the Corporation. Noninterest income was $8.0 million and $7.8 million in 2010 and 2009, respectively, representing increases over prior year amounts of $201,000, or 2.6%, and $1.5 million, or 23.6%.
The increase in noninterest income in 2010 is almost entirely due to a $291,000 increase in net gains on sales of available-for-sale securities, as partially offset by small decreases in the other categories of noninterest income. The gains on sales of securities resulted from the sale of approximately $77 million of available-for-sale securities. The proceeds of the sales were used to limit the growth of the balance sheet by paying down short-term borrowings and thereby preserving the Bank’s Tier I leverage capital ratio.
The increase in noninterest income in 2009 was almost entirely due to a $1.2 million increase in net gains on sales of available-for-sale securities and a $518,000 increase in service charge income, as partially offset by a $219,000 decrease in Investment Management Division income. The gains on sales of securities resulted from the sale of approximately $49 million of available-for-sale securities. The proceeds of the sale were generally reinvested in securities having a longer duration and average yield slightly higher than the securities sold. Service charge income increased primarily as a result of an increase in return check charges. Investment Management Division income was down primarily as a result of a market related decrease in the value of assets under management.
Noninterest expense is comprised of salaries, employee benefits, occupancy and equipment expense and other operating expenses incurred in supporting the various business activities of the Corporation. Noninterest expense was $35.8 million and $34.8 million in 2010 and 2009, respectively, representing increases over prior year amounts of $986,000, or 2.8%, and $5.2 million, or 17.3%.
The increase in noninterest expense in 2010 is comprised of increases in salaries of $589,000, or 4.0%, occupancy and equipment expense of $461,000, or 7.7%, and other operating expenses of $460,000, or 5.7%, as partially offset by a decrease in employee benefits of $524,000, or 9.0%. The increase in salaries expense is primarily due to normal annual salary adjustments and additions to staff related to the opening of four full service branches during 2010. Occupancy and equipment expense increased primarily due to branch expansion, technology upgrades and the creation of a state-of-the-art disaster recovery center for both information technology and back office functions. The increase in other operating expenses is the result of a $221,000 increase in data processing expense and a number of other small increases, as partially offset by a $279,000 decrease in FDIC deposit insurance expense from $2.2 million in 2009 to $1.9 million this year. The decline in deposit insurance expense occurred because 2009 was burdened with a $647,000 FDIC special assessment. In February 2011, the FDIC approved a final rule which implements changes to the deposit insurance assessment system effective April 1, 2011. These changes include, among other things, basing deposit insurance assessments on average total assets less average tangible capital (rather than total deposits) and changing the assessment rate applicable to each risk category defined by the FDIC. Based on the Bank’s total asset and tangible capital levels at year end 2010 and, assuming that the Bank’s current FDIC risk category remains the same, the changes to the deposit insurance assessment system would reduce the Bank’s FDIC premiums by approximately $900,000 on an annual basis. However, management is concerned about the high level of bank failures that have occurred in the last two years and the resulting depletion of the FDIC deposit insurance fund. Management believes that continued bank failures could make it necessary for the FDIC to raise its assessment rates, impose additional special assessments or both.
19
The 2010 decrease in employee benefits expense is primarily the result of a decrease in retirement plan expense, as partially offset by increases in group health insurance. Retirement plan expense decreased due to additional funding of the Bank’s defined benefit pension plan and improved market performance of plan assets in 2009.
The increase in noninterest expense for 2009 was comprised of increases in other operating expenses of $2.1 million, or 33.8%, employee benefits expense of $1.2 million, or 26.7%, occupancy and equipment expense of $1.0 million, or 20.8%, and salaries of $832,000, or 5.9%. The increase in other operating expenses is largely attributable to a $1.6 million increase in FDIC deposit insurance expense caused by failures in the banking industry. Such failures resulted in an increase in the FDIC’s base assessment rates for 2009 and an industry wide special assessment of 5 basis points on total assets minus Tier 1 capital as of June 30, 2009. The special assessment cost the Bank approximately $647,000.
The increase in employee benefits expense for 2009 was largely the result of a $1.0 million increase in pension plan expense. The increase resulted from the poor performance of the equity markets in 2008. Occupancy and equipment expense increased primarily due to branch expansion, technology upgrades and maintenance of facilities. The increase in salaries expense is primarily due to normal annual salary adjustments and additions to staff related to branch expansion.
Income tax expense as a percentage of book income (“effective tax rate”) was 22.6% in 2010, 18.8% in 2009 and 26.3% in 2008. The effective tax rate was elevated in 2008 because the Corporation lost the tax benefit derived from its REIT entity. The loss of the REIT tax benefit resulted from a change in New York State tax law effective January 1, 2008. In December 2008, the ownership of the REIT entity within the consolidated group was changed to once again obtain favorable tax treatment. This change, combined with an increase in tax-exempt income, caused the effective tax rate to decrease in 2009. The effective tax rate increased in 2010 because tax-exempt income as a percentage of income before income taxes declined. Also contributing to the increase in the effective tax rate was the fact that the tax benefit derived from the Corporation’s FNY and REIT entities decreased somewhat in 2010 while income before income taxes increased significantly.
Application of Critical Accounting Policies
In preparing the consolidated financial statements, management is required to make estimates and assumptions that affect the reported asset and liability balances and revenue and expense amounts. Our determination of the allowance for loan losses is a critical accounting estimate because it is based on our subjective evaluation of a variety of factors at a specific point in time and involves difficult and complex judgments about matters that are inherently uncertain. In the event that management’s estimate needs to be adjusted based on, among other things, additional information that comes to light after the estimate is made or changes in circumstances, such adjustment could result in the need for a significantly different allowance for loan losses and thereby materially impact, either positively or negatively, the Bank’s results of operations.
The Bank’s Management Loan Committee, which is chaired by the Senior Lending Officer, meets on a quarterly basis and is responsible for determining the allowance for loan losses after considering, among other things, the results of credit reviews performed by the Bank’s loan review officer. In addition, and in consultation with the Bank’s Chief Financial Officer, the Management Loan Committee is responsible for implementing and maintaining policies and procedures surrounding the calculation of the required allowance. The Bank’s allowance for loan losses is reviewed by the Loan Committee of the Board of Directors and is subject to periodic examination by the Office of the Comptroller of the Currency, the Bank’s primary federal banking regulator, whose safety and soundness examination includes a determination as to its adequacy to absorb probable incurred losses.
The first step in determining the allowance for loan losses is to identify loans in the Bank’s portfolio that are individually deemed to be impaired. In doing so, subjective judgments need to be made regarding whether or not it is probable that a borrower will be unable to pay all principal and interest due according to contractual terms. Once a loan is identified as being impaired, management uses the fair value of the underlying collateral and/or the discounted value of expected future cash flows to determine the amount of the impairment loss, if any, that needs to be included in the overall allowance for loan losses. In estimating the fair value of real estate collateral, management utilizes appraisals and also makes qualitative judgments based on, among other things, its knowledge of the local real estate market and analyses of current economic conditions and trends. Estimating the fair value of collateral other than real estate is also subjective in nature and sometimes requires difficult and complex judgments. Determining expected future cash flows can be more subjective than determining fair values. Expected future cash flows could differ significantly, both in timing and amount, from the cash flows actually received over the loan’s remaining life.
20
In addition to estimating losses for loans individually deemed to be impaired, management also estimates collective impairment losses for pools of loans that are not specifically reviewed. Statistical information regarding the Bank’s historical loss experience over a period of time is the starting point in making such estimates. However, future losses could vary significantly from those experienced in the past and on a quarterly basis management adjusts its historical loss experience to reflect current conditions. In doing so, management considers a variety of general qualitative factors and then subjectively determines the weight to assign to each in estimating losses. The factors include, among others, loan risk ratings, national and local economic conditions and trends, environmental risks, trends in volume and terms of loans, concentrations of credit, changes in lending policies and procedures, changes in the quality of the Bank’s loan review function, and experience, ability, and depth of the Bank’s lending staff. Because of the nature of the factors and the difficulty in assessing their impact, management’s resulting estimate of losses may not accurately reflect actual losses in the portfolio.
Although the allowance for loan losses has two separate components, one for impairment losses on individual loans and one for collective impairment losses on pools of loans, the entire allowance for loan losses is available to absorb realized losses as they occur whether they relate to individual loans or pools of loans.
Asset Quality
The Corporation has identified certain assets as risk elements. These assets include nonaccruing loans, foreclosed real estate, loans that are contractually past due 90 days or more as to principal or interest payments and still accruing and troubled debt restructurings. These assets present more than the normal risk that the Corporation will be unable to eventually collect or realize their full carrying value. Information about the Corporation’s risk elements is as follows:
|
December 31,
|
||||||||||||||||||||
|
2010
|
2009
|
2008
|
2007
|
2006
|
||||||||||||||||
|
(dollars in thousands)
|
||||||||||||||||||||
|
Nonaccrual loans (including loan held for sale)
|
$ | 3,936 | $ | 432 | $ | 112 | $ | 257 | $ | 135 | ||||||||||
|
Loans past due 90 days or more and still accruing
|
- | - | 42 | 95 | 50 | |||||||||||||||
|
Foreclosed real estate
|
- | - | - | - | - | |||||||||||||||
|
Total nonperforming assets
|
3,936 | 432 | 154 | 352 | 185 | |||||||||||||||
|
Troubled debt restructurings
|
2,433 | 200 | - | - | - | |||||||||||||||
|
Total risk elements
|
$ | 6,369 | $ | 632 | $ | 154 | $ | 352 | $ | 185 | ||||||||||
|
Nonaccrual loans as a percentage of total loans
|
.44 | % | .05 | % | .02 | % | .05 | % | .03 | % | ||||||||||
|
Nonperforming assets as a percentage of total loans and foreclosed real estate
|
.44 | % | .05 | % | .02 | % | .07 | % | .04 | % | ||||||||||
|
Risk elements as a percentage of total loans and foreclosed real estate
|
.70 | % | .08 | % | .02 | % | .07 | % | .04 | % | ||||||||||
|
Year Ended December 31,
|
||||||||||||||||||||
|
2010
|
2009
|
2008
|
2007
|
2006
|
||||||||||||||||
|
(in thousands)
|
||||||||||||||||||||
|
Gross interest income on nonaccrual loans:
|
||||||||||||||||||||
|
Amount that would have been recorded during the year under original terms
|
$ 185 | $ 24 | $ 10 | $ 13 | $ 12 | |||||||||||||||
|
Actual amount recorded during the year
|
156 | 16 | - | 10 | - | |||||||||||||||
|
Commitments for additional funds - troubled debt restructurings
|
None
|
None
|
None
|
None
|
None
|
|||||||||||||||
21
Allowance and Provision for Loan Losses
The allowance for loan losses increased by $3.7 million during 2010, amounting to $14.0 million, or 1.55% of total loans, at December 31, 2010 as compared to $10.3 million, or 1.25% of total loans, at December 31, 2009. During 2010, the Bank had loan chargeoffs and recoveries of $377,000 and $72,000, respectively, and recorded a $4.0 million provision for loan losses. Although the provision for loan losses decreased by $312,000 when comparing 2010 to 2009, the provision in both years was elevated versus prior years. The elevated provisioning in 2010 was primarily attributable to: (1) management’s decision to increase the Bank’s allowance for loan losses relative to gross loans in recognition of, among other things, unfavorable economic conditions and the large concentration of real estate loans in the Bank’s portfolio; (2) the establishment of an $870,000 impairment reserve on one nonaccruing loan; and (3) a $300,000 chargeoff upon the transfer of one nonaccruing loan to the held-for-sale category. The elevated provisioning in 2009 was also primarily attributable to unfavorable economic conditions and the Bank’s large real estate loan concentration and, additionally, robust loan growth.
The allowance for loan losses is an amount that management currently believes will be adequate to absorb probable incurred losses in the Bank’s loan portfolio. As more fully discussed in the “Application of Critical Accounting Policies” section of this discussion and analysis of financial condition and results of operations, the process for estimating credit losses and determining the allowance for loan losses as of any balance sheet date is subjective in nature and requires material estimates. Actual results could differ significantly from those estimates.
The following table sets forth changes in the Bank’s allowance for loan losses.
|
Year ended December 31,
|
||||||||||||||||||||
|
2010
|
2009
|
2008
|
2007
|
2006
|
||||||||||||||||
|
(dollars in thousands)
|
||||||||||||||||||||
|
Balance, beginning of year
|
$ | 10,346 | $ | 6,076 | $ | 4,453 | $ | 3,891 | $ | 3,282 | ||||||||||
|
Loans charged off:
|
||||||||||||||||||||
|
Commercial and industrial
|
- | 162 | 275 | - | 65 | |||||||||||||||
|
Commercial mortgages
|
325 | - | - | - | - | |||||||||||||||
|
Residential mortgages
|
22 | - | - | - | - | |||||||||||||||
|
Other
|
30 | 13 | 50 | 14 | 11 | |||||||||||||||
| 377 | 175 | 325 | 14 | 76 | ||||||||||||||||
|
Recoveries of loans charged off:
|
||||||||||||||||||||
|
Commercial and industrial
|
46 | 148 | - | - | - | |||||||||||||||
|
Other
|
26 | 12 | 3 | 1 | 15 | |||||||||||||||
| 72 | 160 | 3 | 1 | 15 | ||||||||||||||||
|
Net chargeoffs
|
(305 | ) | (15 | ) | (322 | ) | (13 | ) | (61 | ) | ||||||||||
|
Provision for loan losses
|
3,973 | 4,285 | 1,945 | 575 | 670 | |||||||||||||||
|
Balance, end of year
|
$ | 14,014 | $ | 10,346 | $ | 6,076 | $ | 4,453 | $ | 3,891 | ||||||||||
|
Ratio of net chargeoffs to average loans outstanding
|
.04 | % | .00 | % | .06 | % | .00 | % | .01 | % | ||||||||||
The following table sets forth the allocation of the Bank’s total allowance for loan losses by loan type.
|
December 31,
|
||||||||||||||||||||||||||||||||||||||||
|
2010
|
2009
|
2008
|
2007
|
2006
|
||||||||||||||||||||||||||||||||||||
|
Amount
|
% of Loans To Total Loans
|
Amount
|
% of Loans To Total Loans
|
Amount
|
% of Loans To Total Loans
|
Amount
|
% of Loans To Total Loans
|
Amount
|
% of Loans To Total Loans
|
|||||||||||||||||||||||||||||||
|
(dollars in thousands)
|
||||||||||||||||||||||||||||||||||||||||
|
Commercial and industrial
|
$ | 803 | 4.3 | % | $ | 971 | 5.9 | % | $ | 933 | 8.1 | % | $ | 874 | 11.7 | % | $ | 833 | 12.3 | % | ||||||||||||||||||||
|
Commercial mortgages
|
7,680 | 46.2 | 5,932 | 49.5 | 3,011 | 41.5 | 1,785 | 32.3 | 1,464 | 30.7 | ||||||||||||||||||||||||||||||
|
Residential mortgages
|
4,059 | 37.1 | 2,242 | 30.1 | 1,227 | 32.9 | 1,026 | 37.1 | 914 | 38.7 | ||||||||||||||||||||||||||||||
|
Home equity loans
|
1,415 | 11.8 | 1,102 | 13.4 | 706 | 15.5 | 551 | 15.8 | 497 | 14.9 | ||||||||||||||||||||||||||||||
|
Construction loans
|
- | - | 43 | .4 | 100 | 1.4 | 116 | 2.2 | 89 | 2.2 | ||||||||||||||||||||||||||||||
|
Other
|
57 | .6 | 56 | .7 | 99 | .6 | 101 | .9 | 94 | 1.2 | ||||||||||||||||||||||||||||||
| $ | 14,014 | 100.0 | % | $ | 10,346 | 100.0 | % | $ | 6,076 | 100.0 | % | $ | 4,453 | 100.0 | % | $ | 3,891 | 100.0 | % | |||||||||||||||||||||
22
The amount of future chargeoffs and provisions for loan losses will be affected by, among other things, economic conditions on Long Island and in New York City. Such conditions could affect the financial strength of the Bank’s borrowers and will affect the value of real estate collateral securing the Bank’s mortgage loans. Loans secured by real estate represent approximately 95% of the Bank’s total loans outstanding at December 31, 2010. Most of these loans were made to borrowers domiciled on Long Island and in New York City. In the last few years general economic conditions have been unfavorable as characterized by high levels of unemployment, declines in commercial and residential real estate values, and increases in commercial real estate vacancies. These conditions have caused some of the Bank’s borrowers to be unable to make the required contractual payments on their loans and could cause the Bank to be unable to realize the full carrying value of such loans through foreclosure or other collection efforts.
Future provisions and chargeoffs could also be affected by environmental impairment of properties securing the Bank’s mortgage loans. At the present time, management is not aware of any environmental pollution originating on or near properties securing the Bank’s loans that would materially affect the carrying value of such loans.
Off-Balance Sheet Arrangements and Contractual Obligations
The Corporation’s off-balance sheet arrangements and contractual obligations at December 31, 2010 are summarized in the table that follows. Unused home equity lines comprise a substantial portion of the amount shown for commitments to extend credit. Since some of the commitments to extend credit and letters of credit are expected to expire without being drawn upon and, with respect to unused home equity lines, can be frozen, reduced or terminated by the Bank based on the financial condition of the borrower, the total commitment amounts shown in the table do not necessarily represent future cash requirements. The amounts shown for long-term debt are based on the contractual maturities of such borrowings and include scheduled principal and interest payments. The interest payments do not reflect any reduction in payments that the Bank could get from interest rate caps embedded in certain repurchase agreements. Some of these repurchase agreements can be terminated by the purchaser prior to contractual maturity (see Note F to the Corporation’s 2010 consolidated financial statements for more detailed disclosures regarding repurchase agreements). The Corporation believes that its current sources of liquidity are more than sufficient to fulfill the obligations it has at December 31, 2010 pursuant to off-balance sheet arrangements and contractual obligations.
|
Amount of Commitment Expiration Per Period
|
||||||||||||||||||||
|
Total Amounts Committed
|
One Year or Less
|
Over One Year Through Three Years
|
Over Three Years Through Five Years
|
Over Five Years
|
||||||||||||||||
|
(in thousands)
|
||||||||||||||||||||
|
Commitments to extend credit
|
$ | 141,897 | $ | 66,066 | $ | 13,288 | $ | 6,584 | $ | 55,959 | ||||||||||
|
Standby letters of credit
|
4,483 | 4,065 | 418 | - | - | |||||||||||||||
|
Commercial letters of credit
|
314 | 314 | - | - | - | |||||||||||||||
|
Long-term debt
|
218,633 | 18,973 | 80,836 | 80,750 | 38,074 | |||||||||||||||
|
Operating lease obligations
|
9,356 | 1,486 | 2,573 | 1,707 | 3,590 | |||||||||||||||
|
Purchase obligations
|
990 | 348 | 642 | - | - | |||||||||||||||
|
Time deposits
|
268,166 | 177,092 | 31,099 | 59,540 | 435 | |||||||||||||||
| $ | 643,839 | $ | 268,344 | $ | 128,856 | $ | 148,581 | $ | 98,058 | |||||||||||
Commitments to extend credit and letters of credit arise in the normal course of the Bank’s business of meeting the financing needs of its customers and involve, to varying degrees, elements of credit risk in excess of the amount recognized in the consolidated balance sheets.
The Bank's exposure to credit loss in the event of nonperformance by the other party to financial instruments for commitments to extend credit, standby letters of credit, and commercial letters of credit is represented by the contractual notional amount of these instruments. The Bank uses the same credit policies in making commitments to extend credit and generally uses the same credit policies for letters of credit as it does for on-balance-sheet instruments.
Commitments to extend credit are legally binding agreements to lend to a customer as long as there is no violation of any condition established in the contract. Home equity lines generally expire ten years from their date of origination. Other real estate loan commitments generally expire within 60 days and commercial loan commitments generally expire within one year. The amount of collateral obtained, if any, by the Bank upon extension of credit is based on management’s credit evaluation of the borrower. Collateral held varies but may include mortgages on commercial and residential real estate, security interests in business assets, deposit accounts with the Bank or other financial institutions, and securities.
23
Standby letters of credit are conditional commitments issued by the Bank to assure the performance or financial obligations of a customer to a third party. The credit risk involved in issuing standby letters of credit is essentially the same as that involved in extending loans to customers. The Bank generally holds collateral and/or obtains personal guarantees supporting these commitments. Commercial letters of credit are conditional commitments issued by the Bank to assure the payment by a customer to a supplier. The Bank generally obtains personal guarantees supporting these commitments.
The purchase obligations shown in the preceding table are pursuant to contracts that the Bank has with providers of data processing services. Required pension plan contributions for years beyond 2011 are not presently known and are therefore not included in the table. For the Plan year ending September 30, 2011, the Bank has no minimum required pension contribution and a maximum tax deductible contribution of $4.2 million. The Bank expects to make a contribution within that range by September 30, 2011, but the amount of such contribution has not yet been determined.
Capital
The Corporation’s capital management policy is designed to build and maintain capital levels that exceed regulatory standards. Under current regulatory capital standards, banks are classified as well capitalized, adequately capitalized or undercapitalized. Under such standards, a well-capitalized bank is one that has a total risk-based capital ratio equal to or greater than 10%, a Tier 1 risk-based capital ratio equal to or greater than 6%, and a Tier 1 leverage capital ratio equal to or greater than 5%. The Bank’s total risk-based capital, Tier 1 risk-based capital and Tier 1 leverage capital ratios of 21.82%, 20.56% and 9.38%, respectively, at December 31, 2010 exceed the requirements for a well-capitalized bank and, based on management’s belief, are adequate in the current regulatory and economic environment. The Corporation (on a consolidated basis) is subject to minimum risk-based and leverage capital requirements, which the Corporation exceeds as of December 31, 2010.
Total stockholders' equity increased by $40.2 million, from $116.5 million at December 31, 2009 to $156.7 million at December 31, 2010. The most significant reason for the increase was the sale of 1,437,500 shares of common stock through an underwritten public offering at a price of $24 per share. The net proceeds of the offering after the underwriting discount and offering expenses paid by the Corporation were $32.4 million. The offering was undertaken to position the Bank for future growth and to meet current regulatory expectations as to what constitutes an appropriate level of capital. A significant portion of the proceeds of the offering were temporarily invested in short-term mortgage securities with the intention of reinvesting the monthly paydowns on such securities in better yielding loans. The other primary reason for the increase in stockholders’ equity was net income of $18.4 million, as partially offset by $6.7 million in cash dividends declared and unrealized losses on available-for-sale securities of $4.7 million.
Stock Repurchase Program and Market Liquidity. Since 1988, the Corporation has had a stock repurchase program under which it has purchased from time to time shares of its own common stock in market or private transactions. The Corporation’s market transactions are generally intended to comply with the manner, timing, price and volume conditions set forth in SEC Rule 10b-18 and therefore, with respect to such transactions, provide the Corporation with safe harbor from liability for market manipulation under section 9(a)(2) and Rule 10b-5 of the Securities Exchange Act of 1934. Under a plan approved by the Board of Directors in 2008, the Corporation can purchase 76,568 shares in the future.
The Corporation periodically reevaluates whether it wants to continue purchasing shares of its own common stock in open market transactions under Rule 10b-18 or otherwise. The Corporation significantly reduced its open market share repurchases in 2009 and eliminated them in 2010 in order to preserve and build capital in an uncertain economic climate.
Russell 3000 and 2000 Indexes. The Corporation’s common stock is included in the Russell 3000 and Russell 2000 Indices, which were reconstituted in June 2010. Upon reconstitution, the average market capitalization of companies in the Russell 2000 Index was $987 million, the median market capitalization was $448 million, the capitalization of the largest company in the index was $2.3 billion, and the capitalization of the smallest company in the index was $112 million. The Corporation’s market capitalization on December 31, 2010 was approximately $250 million.
The Corporation believes that inclusion in the Russell indices positively affects the price, trading volume and liquidity of its common stock. Conversely, if the Corporation’s market capitalization falls below the minimum necessary to be included in the indices at any future reconstitution date, the opposite could occur.
24
Performance Graph. The following graph compares the Corporation's total stockholder return over a 5-year measurement period with the NASDAQ Market Index and the NASDAQ Bank Stocks Index.
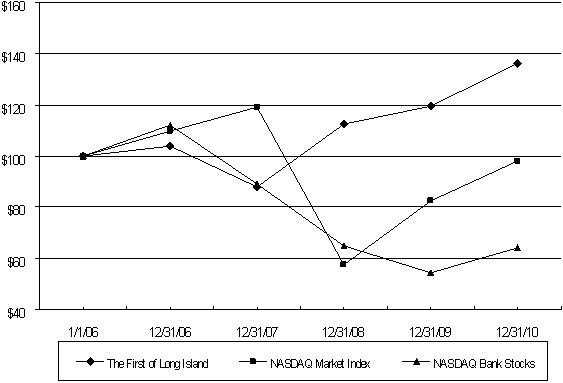
COMPARISON OF FIVE-YEAR CUMULATIVE TOTAL RETURN
THE FIRST OF LONG ISLAND CORPORATION,
NASDAQ BANK STOCKS INDEX AND NASDAQ MARKET INDEX
Assumes $100 Invested on January 1, 2006
Assumes Dividends Reinvested
Cash Flows and Liquidity
Cash Flows. The Corporation’s primary sources of cash are deposit growth, maturities and amortization of loans and investment securities, operations and borrowings. The Corporation uses cash from these and other sources to fund loan growth, purchase investment securities, repay borrowings, expand and improve its physical facilities and pay cash dividends. During 2010, the Corporation’s cash and cash equivalent position decreased by $14.9 million. The decrease occurred primarily because cash used to grow the loan portfolio, repay short-term borrowings, pay cash dividends and improve physical facilities exceeded the cash provided by deposit growth, the securities portfolio, the common stock offering, additional long-term borrowings and operations.
Liquidity. The Bank’s Board of Directors has approved a Liquidity Policy and Liquidity Contingency Plan which are intended to insure that the Bank has sufficient liquidity at all times to meet the ongoing needs of its customers in terms of credit and deposit outflows, take advantage of earnings enhancement opportunities and respond to liquidity stress conditions as they arise.
The Bank has both internal and external sources of liquidity that can be used to fund loan growth and accommodate deposit outflows. The Bank’s primary internal sources of liquidity are its overnight investments, investment securities designated as available-for-sale, and maturities and monthly payments on its investment securities and loan portfolios. At December 31, 2010, the Bank had approximately $414 million in unencumbered available-for-sale securities.
The Bank is a member of the Federal Reserve Bank of New York (“FRB”) and the Federal Home Loan Bank of New York (“FHLB”), has repurchase agreements in place with a number of brokerage firms and commercial banks and has federal funds lines with several commercial banks. In addition to customer deposits, the Bank’s primary external sources of liquidity are secured borrowings from the FRB, FHLB and repurchase agreement counterparties. In addition, the Bank can purchase overnight federal funds under its existing lines. However, the Bank’s FRB membership, FHLB membership, repurchase agreements and federal funds lines do not represent legal commitments to extend credit to the Bank. The amount that the Bank can potentially borrow is currently dependent on, among other things, the amount of unencumbered eligible securities and loans that the Bank can use as collateral and the collateral margins required by the lenders. Based on the collateral in place at the FRB and FHLB at December 31, 2010, the Bank had a total borrowing capacity of approximately $700 million.
25
Market Risk
The Bank invests in interest-earning assets which are funded by interest-bearing deposits and borrowings, noninterest-bearing deposits and capital. The Bank’s results of operations are subject to risk resulting from interest rate fluctuations in general and having assets and liabilities that have different maturity, repricing and prepayment/withdrawal characteristics. The Bank defines interest rate risk as the risk that the Bank's earnings and/or net portfolio value (present value of expected future cash flows from assets less the present value of expected future cash flows from liabilities) will change when interest rates change. The principal objective of the Bank’s asset/liability management activities is to maximize net interest income while at the same time maintain acceptable levels of interest rate and liquidity risk and facilitate the funding needs of the Bank.
Because the Bank’s loans and investment securities generally reprice slower than its interest-bearing liabilities, an immediate increase in interest rates uniformly across the yield curve should initially have a negative effect on net interest income. However, if the Bank does not increase the rates paid on its deposit accounts as quickly or in the same amount as increases in market interest rates and/or owns interest rate caps that are in-the-money at the time of the interest rate increase or become in-the-money as a result of the increase, the magnitude of the negative impact will decline and the impact could even be positive. Over a longer period of time, and assuming that interest rates remain stable after the initial rate increase and the Bank purchases securities and originates loans at yields higher than those maturing and reprices loans at higher yields, the impact of an increase in interest rates should be positive. This occurs primarily because with the passage of time more loans and investment securities will reprice at the higher rates and there will be no offsetting increase in interest expense for those loans and investment securities funded by noninterest-bearing checking deposits and capital.
Conversely, a decrease in interest rates uniformly across the yield curve should initially have a positive impact on the Bank’s net interest income. Furthermore, if the Bank owns interest rate floors that are in-the-money at the time of the interest rate decrease or become in-the-money as a result of the decrease, the magnitude of the positive impact should increase. However, if the Bank does not or cannot decrease the rates paid on its deposit accounts as quickly or in the same amount as decreases in market interest rates, regardless of whether or not it owns interest rate floors, the magnitude of the positive impact will decline and could even be negative.
If interest rates decline, or have declined, and are sustained at the lower levels and, as a result, the Bank purchases securities at lower yields and loans are originated or repriced at lower yields, the impact on net interest income should be negative because a significant portion of the Bank’s average interest-earning assets are funded by noninterest-bearing checking deposits and capital.
The Bank monitors and controls interest rate risk through a variety of techniques including the use of interest rate sensitivity models and traditional repricing gap analysis. Through use of the models, the Bank projects future net interest income and then estimates the effect on projected net interest income of various changes in interest rates and balance sheet growth rates. The Bank also uses the models to calculate the change in net portfolio value over a range of interest rate change scenarios.
Traditional gap analysis involves arranging the Bank’s interest-earning assets and interest-bearing liabilities by repricing periods and then computing the difference, or gap, between the assets and liabilities which are estimated to reprice during each time period and cumulatively through the end of each time period.
Both interest rate sensitivity modeling and gap analysis involve a variety of significant estimates and assumptions and are done at a specific point in time. Interest rate sensitivity modeling requires, among other things, estimates of: (1) how much and when yields and costs on individual categories of interest-earning assets and interest-bearing liabilities will change because of projected changes in market interest rates; (2) future cash flows; (3) discount rates; and (4) decay or runoff rates for nonmaturity deposits such as checking, savings, and money market accounts.
Gap analysis requires estimates as to when individual categories of interest-sensitive assets and liabilities will reprice and assumes that assets and liabilities assigned to the same repricing period will reprice at the same time and in the same amount. Like sensitivity modeling, gap analysis does not fully take into account the fact that the repricing of some assets and liabilities is discretionary and subject to competitive and other pressures.
26
Changes in the estimates and assumptions made for interest rate sensitivity modeling and gap analysis could have a significant impact on projected results and conclusions. Therefore, these techniques may not accurately reflect the actual impact of changes in the interest rate environment on the Bank’s net interest income or net portfolio value.
The table that follows summarizes the Corporation's cumulative interest rate sensitivity gap at December 31, 2010 based upon significant estimates and assumptions that the Corporation believes to be reasonable. The table arranges interest-earning assets and interest-bearing liabilities according to the period in which they contractually mature or, if earlier, are estimated to repay or reprice. Repayment and repricing estimates are based on internal data and management’s assumptions about factors that are inherently uncertain. These factors include, among others, prepayment speeds, changes in market interest rates and the Bank’s response thereto, early withdrawal of deposits and competition. The balances of non-maturity deposit products have been included in categories beyond three months in the table because management believes, based on past experience and its knowledge of current competitive pressures, that the repricing of these products will lag market changes in interest rates to varying degrees. The table does not reflect any protection against interest rate changes that the Corporation may have as a result of its ownership of derivative instruments such as interest rate caps or floors. The only such instruments that the Corporation owns at December 31, 2010 are the interest rate caps disclosed in Note F to the Corporation’s December 31, 2010 consolidated financial statements.
|
Repricing Period
|
||||||||||||||||||||||||||||||||
|
Three Months or Less
|
Over Three Months Through Six Months
|
Over Six Months Through One Year
|
Total Within One Year
|
Over One Year Through Five Years
|
Over Five Years
|
Non-interest- Sensitive
|
Total
|
|||||||||||||||||||||||||
|
Assets:
|
(in thousands)
|
|||||||||||||||||||||||||||||||
|
Overnight Investments
|
$ | 276 | $ | - | $ | - | $ | 276 | $ | - | $ | - | $ | - | $ | 276 | ||||||||||||||||
|
Investment securities
|
36,359 | 32,662 | 61,189 | 130,210 | 246,502 | 359,144 | 3,837 | 739,693 | ||||||||||||||||||||||||
|
Loans
|
181,297 | 39,098 | 78,197 | 298,592 | 478,472 | 125,481 | (12,600 | ) | 889,945 | |||||||||||||||||||||||
|
Other assets
|
7,688 | - | 12,663 | 20,351 | - | - | 60,758 | 81,109 | ||||||||||||||||||||||||
| 225,620 | 71,760 | 152,049 | 449,429 | 724,974 | 484,625 | 51,995 | 1,711,023 | |||||||||||||||||||||||||
|
Liabilities & Stockholders' Equity:
|
||||||||||||||||||||||||||||||||
|
Checking deposits
|
- | - | - | - | - | - | 386,797 | 386,797 | ||||||||||||||||||||||||
|
Savings & money market deposits
|
503,404 | 11,694 | 23,386 | 538,484 | 99,491 | - | - | 637,975 | ||||||||||||||||||||||||
|
Time deposits, $100,000 and over
|
91,022 | 21,596 | 16,239 | 128,857 | 49,680 | 364 | - | 178,901 | ||||||||||||||||||||||||
|
Time deposits, other
|
27,556 | 13,331 | 7,348 | 48,235 | 40,959 | 71 | - | 89,265 | ||||||||||||||||||||||||
|
Borrowed funds
|
71,590 | - | 2,000 | 73,590 | 145,000 | 35,000 | - | 253,590 | ||||||||||||||||||||||||
|
Other liabilities
|
- | - | - | - | - | - | 7,801 | 7,801 | ||||||||||||||||||||||||
|
Stockholders' equity
|
- | - | - | - | - | - | 156,694 | 156,694 | ||||||||||||||||||||||||
| 693,572 | 46,621 | 48,973 | 789,166 | 335,130 | 35,435 | 551,292 | 1,711,023 | |||||||||||||||||||||||||
|
Interest-rate sensitivity gap
|
$ | (467,952 | ) | $ | 25,139 | $ | 103,076 | $ | (339,737 | ) | $ | 389,844 | $ | 449,190 | $ | (499,297 | ) | $ | - | |||||||||||||
|
Cumulative interest-rate sensitivity gap
|
$ | (467,952 | ) | $ | (442,813 | ) | $ | (339,737 | ) | $ | (339,737 | ) | $ | 50,107 | $ | 499,297 | $ | - | $ | - | ||||||||||||
As shown in the preceding table, the Bank has a significant volume of deposit accounts and borrowings that are subject to repricing as short-term interest rates change. Since the amount of these liabilities outweighs the assets held by the Bank whose pricing is tied to short-term interest rates, an increase in short-term interest rates should negatively impact the Bank’s net interest income in the near term. The interest rate caps owned by the Bank at December 31, 2010 may help to reduce the negative impact. In addition, the Bank can reduce the magnitude of the negative impact by not increasing the rates paid on its deposit accounts as quickly or in the same amount as market increases in the overnight funds rate, the prime lending rate, or other short-term rates. Conversely, a decrease in short-term interest rates should positively impact the Bank’s net interest income in the near term. However, if short-term rates decline and the Bank cannot, due to competitive pressures and/or the absolute level of rates, decrease its deposit rates as quickly or in the same amount as decreases in market interest rates, the magnitude of the positive impact will decline and the impact could even be negative.
27
The table that follows is provided pursuant to the market risk disclosure rules set forth in Item 305 of Regulation S-K of the Securities and Exchange Commission (“SEC”). The information provided in the table is based on significant estimates and assumptions and constitutes, like certain other statements included herein, a forward-looking statement. The base case information in the table shows (1) an estimate of the Corporation’s net portfolio value at December 31, 2010 arrived at by discounting estimated future cash flows at current market rates and (2) an estimate of net interest income on a tax-equivalent basis for the year ending December 31, 2011 assuming that maturing assets or liabilities are replaced with new balances of the same type, in the same amount, and at current rate levels and repricing balances are adjusted to current rate levels. For purposes of the base case, nonmaturity deposits are included in the calculation of net portfolio value at their carrying amount. The rate change information in the table shows estimates of net portfolio value at December 31, 2010 and net interest income on a tax-equivalent basis for the year ending December 31, 2011 assuming rate changes of plus 100 and 200 basis points and minus 100 and 200 basis points. The changes in net portfolio value from the base case have not been tax affected. In addition, cash flows for nonmaturity deposits are based on a decay or runoff rate of six years. Also, rate changes are assumed to be shock or immediate changes and occur uniformly across the yield curve regardless of the duration to maturity or repricing of specific assets and liabilities. In projecting future net interest income under the indicated rate change scenarios, activity is simulated by replacing maturing balances with new balances of the same type, in the same amount, but at the assumed rate level and adjusting repricing balances to the assumed rate level.
Based on the foregoing assumptions and as depicted in the table that follows, an immediate increase in interest rates of 100 or 200 basis points would have a negative effect on net interest income over a one-year time period. This is principally because the Bank’s interest-bearing deposit accounts are assumed to reprice faster than its loans and investment securities. However, if the Bank does not increase the rates paid on its deposit accounts as quickly or in the same amount as increases in market interest rates, the magnitude of the negative impact will decline. If the Bank does not increase its deposit rates at all, the impact should be positive. Over a longer period of time, and assuming that interest rates remain stable after the initial rate increase and the Bank purchases securities and originates loans at yields higher than those maturing and reprices loans at higher yields, the impact of an increase in interest rates should be positive. This occurs primarily because with the passage of time more loans and investment securities will reprice at the higher rates and there will be no offsetting increase in interest expense for those loans and investment securities funded by noninterest-bearing checking deposits and capital. Generally, the reverse should be true of an immediate decrease in interest rates of 100 or 200 basis points. However, the positive impact of a decline in interest rates of 100 or 200 basis points is currently constrained by the fact that the annual percentage yields on many of the Bank’s deposit products are below 1%.
|
Net Portfolio Value at December 31, 2010
|
Net Interest Income for 2011
|
|||||||||||||||
|
Rate Change Scenario
|
Amount
|
Percent Change From Base Case
|
Amount
|
Percent Change From Base Case
|
||||||||||||
|
(dollars in thousands)
|
||||||||||||||||
|
+ 200 basis point rate shock
|
$ | 125,806 | (16.0 | )% | $ | 50,914 | (17.4 | )% | ||||||||
|
+ 100 basis point rate shock
|
137,233 | (8.3 | ) | 56,273 | (8.7 | ) | ||||||||||
|
Base case (no rate change)
|
149,698 | - | 61,634 | - | ||||||||||||
|
- 100 basis point rate shock
|
163,693 | 9.3 | 63,825 | 3.6 | ||||||||||||
|
- 200 basis point rate shock
|
180,446 | 20.5 | 62,822 | 1.9 | ||||||||||||
Legislation and Regulatory Matters
In July 2010, the Dodd-Frank Wall Street Reform and Consumer Protection Act (the “Reform Act”) was signed into law. The Reform Act includes sweeping changes that increase regulation and oversight of the financial services industry and impose restrictions on the ability of firms within the industry to conduct business consistent with historical practices. The Reform Act addresses, among other things, corporate governance, systemic risk, deposit insurance assessments, consumer financial protection, interchange fees, derivatives, lending limits, interest on business checking and reassignment of regulatory authority among agencies. In particular, the Reform Act contains the following provisions which, when implemented, could have a significant impact on the Corporation and the Bank.
28
|
|
·
|
As previously discussed, a change in the FDIC deposit insurance assessment base and a change in the assessment rates applicable to each risk category.
|
|
|
·
|
The unlimited FDIC deposit insurance coverage on noninterest-bearing transaction accounts and Interest on Lawyer Trust Accounts is extended for two years through December 31, 2012.
|
|
|
·
|
The Federal Reserve is given the authority to require that debit interchange rates be “reasonable and proportionate to the cost incurred by the issuer with respect to the transaction.” Although the bill contains an exemption for issuers like the Bank with less than $10 billion in assets, the Bank may need to reduce its interchange fees in order to remain competitive or because of implementation issues.
|
|
|
·
|
The long standing prohibition on the payment of interest on corporate checking deposits is repealed effective July 2011. As a result, the Bank may need to pay interest on corporate checking deposits in order to remain competitive. Commercial checking deposits currently account for approximately 21% of the Bank’s total deposits. If the Bank is unable to offset the interest cost with service charges on these accounts, it could have a material adverse impact on the Corporation’s results of operations.
|
|
|
·
|
The minimum Deposit Insurance Fund (“DIF”) ratio is increased from 1.15% of insured deposits to 1.35% and the FDIC is required to reach that level by September 30, 2020. Based on the most recent available information, the DIF balance was a negative $7 billion at December 31, 2010 and would need to be increased by approximately $91 billion to be at the statutory minimum of 1.35% of insured deposits. The long-term impact of this change on the Bank’s deposit insurance cost is uncertain.
|
Certain provisions of the American Recovery and Reinvestment Act of 2009 (the “ARRA”) resulted in more municipal security issuances qualifying for favorable tax treatment by banks and exempted many such issuances from the federal alternative minimum tax (“AMT”). Management took advantage of these provisions and purchased a significant amount of tax-advantaged municipal securities during 2009 and 2010 at what is believed to be attractive yields and without the usual limitations imposed by the AMT. These provisions of the ARRA impacting municipal securities expired on December 31, 2010. The expiration of these provisions could reduce the available supply of municipal securities for which the Bank can receive favorable tax treatment, reduce yields on municipal securities purchased by the Bank or reduce the amount of municipal securities the Bank can hold without being subject to the AMT. The occurrence of any or all of these could adversely impact the income the Bank is able to earn on its securities portfolio.
The SEC is currently considering the incorporation of International Financial Reporting Standards (“IFRS”) into the U.S. financial reporting system and is scheduled to make a determination sometime in 2011. If IFRS is adopted by the SEC, the first time that U.S. companies would report under IFRS would be no earlier than 2015. The Corporation is evaluating the impact of the adoption of IFRS on its results of operations, financial position and disclosures.
In September 2010, the oversight body of the Basel Committee on Banking Supervision released new capital standards for banks including a time frame over which they would need to be implemented. The new common equity requirement and new capital conservation buffer will require banks to hold more capital, predominantly in the form of common equity, than under current rules. The new common equity requirement will be phased in between January 1, 2013 and January 1, 2016, and the new capital conservation buffer will be phased in between January 1, 2016 and January 1, 2019. Management is currently evaluating the impact of the new capital standards on the Bank’s financial position and results of operations.
Forward Looking Statements
“Management’s Discussion and Analysis of Financial Condition and Results of Operations” contains various forward-looking statements with respect to financial performance and other business matters. Such statements are generally contained in sentences including the words “may” or “expect” or “could” or “should” or “would” or “believe”. The Corporation cautions that these forward-looking statements are subject to numerous assumptions, risks and uncertainties, and therefore actual results could differ materially from those contemplated by the forward-looking statements. In addition, the Corporation assumes no duty to update forward-looking statements.
29
MANAGEMENT’S REPORT ON INTERNAL CONTROL OVER FINANCIAL REPORTING
The management of The First of Long Island Corporation is responsible for establishing and maintaining adequate internal control over financial reporting, based on the criteria established in Internal Control—Integrated Framework issued by the Committee of Sponsoring Organizations of the Treadway Commission (“COSO”). The First of Long Island Corporation’s system of internal control over financial reporting was designed by or under the supervision of the Corporation’s chief executive officer and chief financial officer to provide reasonable assurance regarding the reliability of the preparation of the Corporation’s financial statements for external and regulatory reporting purposes, in accordance with U.S. generally accepted accounting principles. Because of its inherent limitations, internal control over financial reporting may not prevent or detect misstatements. Also, projections of any evaluation of effectiveness to future periods are subject to the risk that controls may become inadequate because of changes in conditions, or that the degree of compliance with the policies or procedures may deteriorate.
The First of Long Island Corporation’s management assessed the effectiveness of the Corporation’s internal control over financial reporting as of December 31, 2010, based on the criteria established in Internal Control—Integrated Framework issued by COSO. Based on the assessment, management determined that, as of December 31, 2010, the Corporation’s internal control over financial reporting is effective. Crowe Horwath LLP, an independent registered public accounting firm, has expressed an opinion of the effectiveness of the Corporation’s internal control over financial reporting as of December 31, 2010 in their report which appears on page 64.
March 16, 2011
/s/ MICHAEL N. VITTORIO
Michael N. Vittorio
President & Chief Executive Officer
/s/ MARK D. CURTIS
Mark D. Curtis
Senior Vice President & Treasurer
30
|
December 31,
|
||||||||
|
2010
|
2009
|
|||||||
|
Assets:
|
||||||||
|
Cash and due from banks
|
$ | 18,144,000 | $ | 33,123,000 | ||||
|
Overnight investments
|
276,000 | 219,000 | ||||||
|
Cash and cash equivalents
|
18,420,000 | 33,342,000 | ||||||
|
Investment securities:
|
||||||||
|
Held-to-maturity, at amortized cost (fair value of $89,760,000 and $133,233,000)
|
86,578,000 | 128,979,000 | ||||||
|
Available-for-sale, at fair value (amortized cost of $649,278,000 and $627,189,000)
|
653,115,000 | 638,794,000 | ||||||
| 739,693,000 | 767,773,000 | |||||||
|
Loan held for sale
|
1,000,000 | - | ||||||
|
Loans:
|
||||||||
|
Commercial and industrial
|
39,055,000 | 48,891,000 | ||||||
|
Secured by real estate:
|
||||||||
|
Commercial mortgages
|
416,946,000 | 409,681,000 | ||||||
|
Residential mortgages
|
334,768,000 | 248,888,000 | ||||||
|
Home equity
|
103,829,000 | 109,010,000 | ||||||
|
Construction and land development
|
- | 3,050,000 | ||||||
|
Other
|
5,790,000 | 5,763,000 | ||||||
| 900,388,000 | 825,283,000 | |||||||
|
Net deferred loan origination costs
|
2,571,000 | 2,383,000 | ||||||
| 902,959,000 | 827,666,000 | |||||||
|
Allowance for loan losses
|
(14,014,000 | ) | (10,346,000 | ) | ||||
| 888,945,000 | 817,320,000 | |||||||
|
Federal Home Loan Bank stock, at cost
|
7,688,000 | 7,882,000 | ||||||
|
Bank premises and equipment, net
|
20,843,000 | 18,090,000 | ||||||
|
Prepaid income taxes
|
412,000 | 179,000 | ||||||
|
Deferred income tax benefits
|
2,199,000 | - | ||||||
|
Bank-owned life insurance
|
12,663,000 | 12,167,000 | ||||||
|
Pension plan assets, net
|
5,868,000 | 3,702,000 | ||||||
|
Prepaid FDIC assessment
|
3,792,000 | 5,331,000 | ||||||
|
Other assets
|
9,500,000 | 9,383,000 | ||||||
| $ | 1,711,023,000 | $ | 1,675,169,000 | |||||
|
Liabilities:
|
||||||||
|
Deposits:
|
||||||||
|
Checking
|
$ | 386,797,000 | $ | 333,853,000 | ||||
|
Savings and money market
|
637,975,000 | 634,913,000 | ||||||
|
Time, $100,000 and over
|
178,901,000 | 216,999,000 | ||||||
|
Time, other
|
89,265,000 | 91,785,000 | ||||||
| 1,292,938,000 | 1,277,550,000 | |||||||
|
Short-term borrowings
|
61,590,000 | 111,407,000 | ||||||
|
Long-term debt
|
192,000,000 | 162,000,000 | ||||||
|
Accrued expenses and other liabilities
|
7,801,000 | 6,002,000 | ||||||
|
Deferred income taxes payable
|
- | 1,748,000 | ||||||
| 1,554,329,000 | 1,558,707,000 | |||||||
|
Commitments and Contingent Liabilities (Note M)
|
||||||||
|
Stockholders' Equity:
|
||||||||
|
Common stock, par value $.10 per share:
|
||||||||
|
Authorized, 20,000,000 shares; Issued and outstanding, 8,707,665 and 7,213,056 shares
|
871,000 | 721,000 | ||||||
|
Surplus
|
35,526,000 | 2,043,000 | ||||||
|
Retained earnings
|
121,713,000 | 110,047,000 | ||||||
| 158,110,000 | 112,811,000 | |||||||
|
Accumulated other comprehensive income (loss) net of tax
|
(1,416,000 | ) | 3,651,000 | |||||
| 156,694,000 | 116,462,000 | |||||||
| $ | 1,711,023,000 | $ | 1,675,169,000 | |||||
See notes to consolidated financial statements
31
C O N S O L I D A T E D S T A T E M E N T S O F I N C O M E
|
Year Ended December 31,
|
||||||||||||
|
2010
|
2009
|
2008
|
||||||||||
|
Interest and dividend income:
|
||||||||||||
|
Loans
|
$ | 45,660,000 | $ | 39,753,000 | $ | 34,163,000 | ||||||
|
Investment securities:
|
||||||||||||
|
Taxable
|
16,845,000 | 18,926,000 | 18,857,000 | |||||||||
|
Nontaxable
|
9,864,000 | 7,595,000 | 6,186,000 | |||||||||
|
Federal funds sold and overnight investments
|
- | - | 480,000 | |||||||||
| 72,369,000 | 66,274,000 | 59,686,000 | ||||||||||
|
Interest expense:
|
||||||||||||
|
Savings and money market deposits
|
4,049,000 | 5,287,000 | 4,576,000 | |||||||||
|
Time deposits
|
5,977,000 | 6,485,000 | 6,782,000 | |||||||||
|
Short-term borrowings
|
108,000 | 221,000 | 746,000 | |||||||||
|
Long-term debt
|
6,640,000 | 6,341,000 | 4,639,000 | |||||||||
| 16,774,000 | 18,334,000 | 16,743,000 | ||||||||||
|
Net interest income
|
55,595,000 | 47,940,000 | 42,943,000 | |||||||||
|
Provision for loan losses
|
3,973,000 | 4,285,000 | 1,945,000 | |||||||||
|
Net interest income after provision for loan losses
|
51,622,000 | 43,655,000 | 40,998,000 | |||||||||
|
Noninterest income:
|
||||||||||||
|
Investment Management Division income
|
1,465,000 | 1,484,000 | 1,703,000 | |||||||||
|
Service charges on deposit accounts
|
3,465,000 | 3,503,000 | 2,985,000 | |||||||||
|
Net gains on sales of available-for-sale securities
|
1,719,000 | 1,428,000 | 248,000 | |||||||||
|
Other
|
1,318,000 | 1,351,000 | 1,345,000 | |||||||||
| 7,967,000 | 7,766,000 | 6,281,000 | ||||||||||
|
Noninterest expense:
|
||||||||||||
|
Salaries
|
15,458,000 | 14,869,000 | 14,037,000 | |||||||||
|
Employee benefits
|
5,303,000 | 5,827,000 | 4,599,000 | |||||||||
|
Occupancy and equipment expense
|
6,486,000 | 6,025,000 | 4,987,000 | |||||||||
|
Other operating expenses
|
8,579,000 | 8,119,000 | 6,066,000 | |||||||||
| 35,826,000 | 34,840,000 | 29,689,000 | ||||||||||
|
Income before income taxes
|
23,763,000 | 16,581,000 | 17,590,000 | |||||||||
|
Income tax expense
|
5,371,000 | 3,118,000 | 4,628,000 | |||||||||
|
Net Income
|
$ | 18,392,000 | $ | 13,463,000 | $ | 12,962,000 | ||||||
|
Weighted average:
|
||||||||||||
|
Common shares
|
7,899,241 | 7,203,064 | 7,225,530 | |||||||||
|
Dilutive stock options and restricted stock units
|
108,436 | 106,520 | 69,012 | |||||||||
| 8,007,677 | 7,309,584 | 7,294,542 | ||||||||||
|
Earnings per share:
|
||||||||||||
|
Basic
|
$ 2.33 | $ 1.87 | $ 1.79 | |||||||||
|
Diluted
|
$ 2.30 | $ 1.84 | $ 1.78 | |||||||||
|
Cash dividends declared per share
|
$ .84 | $ .76 | $ .66 | |||||||||
See notes to consolidated financial statements
32
C O N S O L I D A T E D S T A T E M E N T O F C H A N G E S I N S T O C K H O L D E R S' E Q U I T Y
|
Common Stock
|
Compre-
hensive
|
Retained
|
Accumulated Other Compre- hensive Income
|
|||||||||||||||||||||||||
|
Shares
|
Amount
|
Surplus
|
Income | Earnings | (Loss) |
Total
|
||||||||||||||||||||||
|
Balance, January 1, 2008
|
7,454,385 | $ | 745,000 | $ | 96,000 | $ | 99,844,000 | $ | 1,699,000 | $ | 102,384,000 | |||||||||||||||||
|
Net Income
|
$ | 12,962,000 | 12,962,000 | 12,962,000 | ||||||||||||||||||||||||
|
Other comprehensive loss, net of tax and reclassification adjustment
|
(3,301,000 | ) | (3,301,000 | ) | (3,301,000 | ) | ||||||||||||||||||||||
|
Comprehensive income
|
$ | 9,661,000 | ||||||||||||||||||||||||||
|
Repurchase of common stock
|
(298,322 | ) | (30,000 | ) | (5,734,000 | ) | (5,764,000 | ) | ||||||||||||||||||||
|
Common stock issued under stock compensation plans, including tax benefit
|
38,684 | 4,000 | 542,000 | 546,000 | ||||||||||||||||||||||||
|
Stock-based compensation
|
450,000 | 450,000 | ||||||||||||||||||||||||||
|
Cash dividends declared
|
(4,745,000 | ) | (4,745,000 | ) | ||||||||||||||||||||||||
|
Transfer from retained earnings to surplus
|
6,000,000 | (6,000,000 | ) | |||||||||||||||||||||||||
|
Balance, December 31, 2008
|
7,194,747 | 719,000 | 1,354,000 | 102,061,000 | (1,602,000 | ) | 102,532,000 | |||||||||||||||||||||
|
Net Income
|
$ | 13,463,000 | 13,463,000 | 13,463,000 | ||||||||||||||||||||||||
|
Other comprehensive income, net of tax and reclassification adjustment
|
5,253,000 | 5,253,000 | 5,253,000 | |||||||||||||||||||||||||
|
Comprehensive income
|
$ | 18,716,000 | ||||||||||||||||||||||||||
|
Repurchase of common stock
|
(37,443 | ) | (4,000 | ) | (953,000 | ) | (957,000 | ) | ||||||||||||||||||||
|
Common stock issued under stock compensation plans, including tax benefit
|
55,752 | 6,000 | 961,000 | 967,000 | ||||||||||||||||||||||||
|
Stock-based compensation
|
681,000 | 681,000 | ||||||||||||||||||||||||||
|
Cash dividends declared
|
(5,477,000 | ) | (5,477,000 | ) | ||||||||||||||||||||||||
|
Balance, December 31, 2009
|
7,213,056 | 721,000 | 2,043,000 | 110,047,000 | 3,651,000 | 116,462,000 | ||||||||||||||||||||||
|
Net Income
|
$ | 18,392,000 | 18,392,000 | 18,392,000 | ||||||||||||||||||||||||
|
Other comprehensive loss, net of tax and reclassification adjustment
|
(5,067,000 | ) | (5,067,000 | ) | (5,067,000 | ) | ||||||||||||||||||||||
|
Comprehensive income
|
$ | 13,325,000 | ||||||||||||||||||||||||||
|
Repurchase of common stock
|
(3,581 | ) | - | (91,000 | ) | (91,000 | ) | |||||||||||||||||||||
|
Common stock issued under stock compensation plans, including tax benefit
|
60,690 | 6,000 | 709,000 | 715,000 | ||||||||||||||||||||||||
|
Issuance of common stock
|
1,437,500 | 144,000 | 32,218,000 | 32,362,000 | ||||||||||||||||||||||||
|
Stock-based compensation
|
647,000 | 647,000 | ||||||||||||||||||||||||||
|
Cash dividends declared
|
(6,726,000 | ) | (6,726,000 | ) | ||||||||||||||||||||||||
|
Balance, December 31, 2010
|
8,707,665 | $ | 871,000 | $ | 35,526,000 | $ | 121,713,000 | $ | (1,416,000 | ) | $ | 156,694,000 | ||||||||||||||||
See notes to consolidated financial statements
33
C O N S O L I D A T E D S T A T E M E N T S O F C A S H F L O W S
|
Year Ended December 31,
|
||||||||||||
|
2010
|
2009
|
2008
|
||||||||||
|
Cash Flows From Operating Activities:
|
||||||||||||
|
Net income
|
$ | 18,392,000 | $ | 13,463,000 | $ | 12,962,000 | ||||||
|
Adjustments to reconcile net income to net cash provided by operating activities:
|
||||||||||||
|
Provision for loan losses
|
3,973,000 | 4,285,000 | 1,945,000 | |||||||||
|
Loss on loan held for sale
|
300,000 | - | - | |||||||||
|
Deferred income tax credit
|
(612,000 | ) | (72,000 | ) | (229,000 | ) | ||||||
|
Depreciation and amortization
|
2,487,000 | 2,154,000 | 1,831,000 | |||||||||
|
Premium amortization on investment securities, net
|
4,078,000 | 2,353,000 | 544,000 | |||||||||
|
Net gains on sales of available-for-sale securities
|
(1,719,000 | ) | (1,428,000 | ) | (248,000 | ) | ||||||
|
Gain on sale of bank premises and equipment
|
(154,000 | ) | - | - | ||||||||
|
Stock-based compensation expense
|
647,000 | 681,000 | 450,000 | |||||||||
|
Accretion of cash surrender value on bank-owned life insurance
|
(496,000 | ) | (517,000 | ) | (492,000 | ) | ||||||
|
Increase in prepaid income taxes
|
(233,000 | ) | (179,000 | ) | - | |||||||
|
Decrease (increase) in prepaid FDIC assessment
|
1,539,000 | (5,331,000 | ) | - | ||||||||
|
Increase in pension plan and other assets
|
(2,917,000 | ) | (2,772,000 | ) | (2,355,000 | ) | ||||||
|
Increase (decrease) in accrued expenses and other liabilities
|
1,326,000 | (1,689,000 | ) | (27,000 | ) | |||||||
|
Increase (decrease) in income taxes payable
|
- | (75,000 | ) | 38,000 | ||||||||
|
Net cash provided by operating activities
|
26,611,000 | 10,873,000 | 14,419,000 | |||||||||
|
Cash Flows From Investing Activities:
|
||||||||||||
|
Proceeds from sales of available-for-sale securities
|
78,504,000 | 50,697,000 | 36,993,000 | |||||||||
|
Proceeds from maturities and redemptions of investment securities:
|
||||||||||||
|
Held-to-maturity
|
43,103,000 | 42,608,000 | 28,410,000 | |||||||||
|
Available-for-sale
|
141,973,000 | 147,347,000 | 66,569,000 | |||||||||
|
Purchase of investment securities:
|
||||||||||||
|
Held-to-maturity
|
(596,000 | ) | (2,068,000 | ) | (4,637,000 | ) | ||||||
|
Available-for-sale
|
(245,031,000 | ) | (452,851,000 | ) | (206,897,000 | ) | ||||||
|
Net increase in loans to customers
|
(76,898,000 | ) | (169,547,000 | ) | (132,917,000 | ) | ||||||
|
Net decrease (increase) in Federal Home Loan Bank stock
|
194,000 | (1,683,000 | ) | (5,015,000 | ) | |||||||
|
Purchases of bank premises and equipment
|
(5,370,000 | ) | (7,651,000 | ) | (3,502,000 | ) | ||||||
|
Proceeds from sale of bank premises and equipment
|
284,000 | - | - | |||||||||
|
Net cash used in investing activities
|
(63,837,000 | ) | (393,148,000 | ) | (220,996,000 | ) | ||||||
|
Cash Flows From Financing Activities:
|
||||||||||||
|
Net increase in total deposits
|
15,388,000 | 377,213,000 | 31,299,000 | |||||||||
|
Net increase (decrease) in short-term borrowings
|
(49,817,000 | ) | (12,715,000 | ) | 112,012,000 | |||||||
|
Proceeds from long-term debt
|
30,000,000 | 35,000,000 | 47,000,000 | |||||||||
|
Proceeds from issuance of common stock
|
32,362,000 | - | - | |||||||||
|
Proceeds from exercise of stock options
|
676,000 | 901,000 | 525,000 | |||||||||
|
Tax benefit of stock options
|
39,000 | 66,000 | 21,000 | |||||||||
|
Repurchase and retirement of common stock
|
(91,000 | ) | (957,000 | ) | (5,764,000 | ) | ||||||
|
Cash dividends paid
|
(6,253,000 | ) | (5,329,000 | ) | (4,575,000 | ) | ||||||
|
Net cash provided by financing activities
|
22,304,000 | 394,179,000 | 180,518,000 | |||||||||
|
Net increase (decrease) in cash and cash equivalents
|
(14,922,000 | ) | 11,904,000 | (26,059,000 | ) | |||||||
|
Cash and cash equivalents, beginning of year
|
33,342,000 | 21,438,000 | 47,497,000 | |||||||||
|
Cash and cash equivalents, end of year
|
$ | 18,420,000 | $ | 33,342,000 | $ | 21,438,000 | ||||||
|
Supplemental Schedule of Noncash Investing and Financing Activities:
|
||||||||||||
|
Cash dividends payable
|
$ | 1,916,000 | $ | 1,443,000 | $ | 1,295,000 | ||||||
|
Loan transferred from portfolio to held for sale
|
1,300,000 | - | - | |||||||||
The Corporation made interest payments of $15,767,000, $17,365,000, and $17,159,000 and income tax payments of $6,178,000, $3,377,000, and $4,797,000 in 2010, 2009 and 2008, respectively.
See notes to consolidated financial statements
34
N O T E S T O C O N S O L I D A T E D F I N A N C I A L S T A T E M E N T S
NOTE A – SUMMARY OF SIGNIFICANT ACCOUNTING POLICIES
The consolidated financial statements include the accounts of The First of Long Island Corporation (the “Corporation”) and its wholly-owned subsidiary, The First National Bank of Long Island (the “Bank”), and subsidiaries wholly-owned by the Bank, either directly or indirectly, The First of Long Island Agency, Inc., FNY Service Corp. (“FNY”), and The First of Long Island REIT, Inc. (the “REIT”). The Corporation’s financial condition and operating results principally reflect those of the Bank and its subsidiaries. All intercompany balances and amounts have been eliminated. In preparing the consolidated financial statements, management is required to make estimates and assumptions that affect the reported asset and liability balances, revenue and expense amounts, and the disclosure of contingent assets and liabilities. Actual results could differ significantly from those estimates.
The accounting and reporting policies of the Corporation reflect banking industry practice and conform to generally accepted accounting principles in the United States. The following is a summary of the Corporation’s significant accounting policies.
Investment Securities
Current accounting standards require that investment securities be classified as held-to-maturity, trading, or available-for-sale. The trading category is not applicable to any securities in the Bank's portfolio because the Bank does not buy or hold debt or equity securities principally for the purpose of selling in the near term. Held-to-maturity securities are those debt securities which the Bank has the intent and ability to hold to maturity, and are reported at amortized cost. Available-for-sale securities are those debt and equity securities which are neither held-to-maturity securities nor trading securities and are reported at fair value, with unrealized gains and losses, net of the related income tax effect, included in other comprehensive income.
Interest on investment securities includes amortization or accretion of purchase premium or discount. Premiums and discounts on securities are amortized or accreted on the level-yield method. Realized gains and losses on the sale of securities are determined using the specific identification method.
Investment securities are evaluated for other-than-temporary impairment (“OTTI”) no less often than quarterly. In determining OTTI, management considers many factors, including: (1) the length of time and the extent to which the fair value has been less than cost; (2) the financial condition and near-term prospects of the issuer; (3) whether the market decline was affected by macroeconomic conditions; and (4) whether management has the intent to sell the debt security or more likely than not will be required to sell the debt security before its anticipated recovery. The assessment of whether an other-than-temporary decline exists involves a high degree of subjectivity and judgment and is based on the information available to management at a point in time.
When OTTI occurs, management considers whether it intends to sell, or, more likely than not, will be required to sell a security in an unrealized loss position before recovery of its amortized cost basis. If either of these criteria is met, the entire difference between amortized cost and fair value is recognized in earnings. For securities that do not meet the aforementioned criteria, the amount of impairment recognized in earnings is limited to the amount related to credit losses, while impairment related to other factors is recognized in other comprehensive income.
Loan Held for Sale
The loan held for sale is a nonaccruing commercial mortgage loan that is being carried at the lower of cost or fair value. Any subsequent declines in fair value below the initial carrying value are recorded as a valuation allowance.
Loans and Allowance for Loan Losses
Loans are reported at their outstanding principal balance less any chargeoffs and the allowance for loan losses and plus or minus net deferred loan costs and fees, respectively. Interest on loans is credited to income based on the principal amount outstanding. Direct loan origination costs, net of loan origination fees, are deferred and recognized in interest income using the level-yield method without anticipating prepayments.
The past due status of a loan is based on the contractual terms in the loan agreement. Unless a loan is well secured and in the process of collection, the accrual of interest income is discontinued when a loan becomes 90 days past due as to principal or interest payments. The accrual of interest income on a loan is also discontinued when it is determined that the borrower will not be able to make principal and interest payments according to the contractual terms of the loan agreement. When the accrual of interest income is discontinued on a loan, any accrued but unpaid interest is reversed against current period income. Interest received on nonaccrual loans is accounted for on a cash basis. Nonaccrual loans are returned to accrual status when all the principal and interest amounts contractually due are brought current and future payments are reasonably assured.
35
The allowance for loan losses is established through provisions for loan losses charged against income. When available information confirms that specific loans, or portions thereof, are uncollectible, these amounts are promptly charged against the allowance for loan losses, and subsequent recoveries, if any, are credited to the allowance.
The allowance for loan losses is an amount that management currently believes will be adequate to absorb probable incurred losses in the Bank’s loan portfolio. The process for estimating credit losses and determining the allowance for loan losses as of any balance sheet date is subjective in nature and requires material estimates. Actual results could differ significantly from those estimates.
In estimating losses the Bank reviews loans deemed to be impaired and measures impairment losses based on either the fair value of collateral or the discounted value of expected future cash flows. A loan is considered to be impaired when, based on current information and events, it is probable that the Bank will be unable to collect the scheduled principal and interest when due according to the contractual terms of the loan agreement. Factors considered by management in determining impairment include payment status, collateral value, and the probability of collecting scheduled principal and interest payments when due. Loans that experience insignificant payment delays and payment shortfalls generally are not classified as impaired. Management determines the significance of payment delays and payment shortfalls on a case-by-case basis, taking into consideration all of the circumstances surrounding the loan and the borrower, including the length of the delay, the reasons for the delay, the borrower’s prior payment record and financial condition, and the amount of the shortfall in relation to the principal and interest owed.
Estimated losses for loans that are not individually deemed to be impaired are determined on a pooled basis using the Bank’s historical loss experience adjusted to reflect current conditions. In adjusting historical loss experience, management considers a variety of factors including loan risk ratings, national and local economic conditions and trends, environmental risks, trends in volume and terms of loans, concentrations of credit, changes in lending policies and procedures, changes in the quality of the Bank’s loan review function, and experience, ability, and depth of the Bank’s lending staff. The allowance for loan losses is comprised of impairment losses on the loans specifically reviewed plus estimated losses on the pools of loans that are not specifically reviewed.
Bank Premises and Equipment
Land is carried at cost. Other Bank premises and equipment are carried at cost, less accumulated depreciation and amortization. Buildings are depreciated using the straight-line method over their estimated useful lives, which range from thirty-one to forty years. Building improvements are depreciated using the straight-line method over the then remaining lives of the buildings or their estimated useful lives, whichever is shorter. Leasehold improvements are amortized using the straight-line method over the remaining lives of the leases or their estimated useful lives, whichever is shorter. The lives of the respective leases range between five and twenty years. Furniture, fixtures, and equipment are depreciated using the straight-line method over their estimated useful lives, which range from three to ten years.
Bank-owned Life Insurance
The Bank is the owner and beneficiary of insurance policies on the lives of certain executives. Bank-owned life insurance is recorded at the lower of its cash surrender value or the amount that can be realized.
Federal Home Loan Bank Stock
The Bank is a member of the Federal Home Loan Bank of New York (“FHLB”) and as such is required to own a certain amount of stock based on membership and the level of FHLB advances. FHLB stock is carried at cost, classified as a restricted stock, and periodically evaluated for impairment based on the prospects for the ultimate recovery of cost. Cash dividends, if any, are reported as income.
Long-term Assets
Premises and equipment, intangible assets, and other long-term assets, if any, are reviewed for impairment when events indicate that their carrying amount may not be recoverable from future undiscounted cash flows. If impaired, the assets are recorded at fair value.
36
Loan Commitments and Related Financial Instruments
Financial instruments include off-balance sheet credit instruments, such as commitments to make loans, commercial letters of credit and standby letters of credit. The face amount of these items represents the exposure to loss, before considering customer collateral or ability to repay. Such financial instruments are recorded when they are funded or drawn down.
Checking Deposits
Each of the Bank’s commercial checking accounts has a related noninterest-bearing sweep account. The sole purpose of the sweep accounts is to reduce the reserve balances that the Bank is required to maintain with the Federal Reserve Bank, and thereby increase funds available for investment. Although the sweep accounts are classified as savings accounts for regulatory purposes, they are included in checking deposits in the accompanying consolidated balance sheets.
Income Taxes
A current tax liability or asset is recognized for the estimated taxes payable or refundable on tax returns for the current year. A deferred tax liability or asset is recognized for the estimated future tax effects attributable to temporary differences and carryforwards. The measurement of deferred tax assets is reduced, if necessary, by the amount of any tax benefits that, based on available evidence, are not expected to be realized. The measurement of current and deferred tax liabilities and assets is based on provisions of the enacted tax law. The effects of future changes in tax laws or rates are not considered. The Corporation recognizes interest and/or penalties related to income tax matters in noninterest income or noninterest expense as appropriate.
Loss Contingencies
Loss contingencies, including claims and legal actions arising in the ordinary course of business, are recorded as liabilities when the likelihood of loss is probable and an amount or range of loss can be reasonably estimated. Management is not currently aware of any loss contingencies that will have a material effect on the Corporation’s consolidated financial statements.
Stockholders’ Equity
On July 20, 2010 the Corporation sold 1,437,500 shares of its common stock in an underwritten public offering at a price of $24 per share. The net proceeds of the offering, after the underwriting discount and offering expenses paid by the Corporation, were $32,362,000.
Earnings Per Share. Basic earnings per share excludes dilution and is computed by dividing net income by the weighted average number of common shares outstanding for the period. Diluted earnings per share reflects the potential dilution that could occur if outstanding stock options and restricted stock units (“RSUs”) were converted into shares of common stock that then shared in the earnings of the Corporation. Diluted earnings per share is computed by dividing net income by the weighted average number of common shares and dilutive stock options and RSUs. There were 44,594, 64,300 and 275,762 antidilutive stock options at December 31, 2010, 2009 and 2008, respectively, and no antidilutive RSUs. Other than the stock options and RSUs described in Note J and the Rights described in Note I, the Corporation has no securities that could be converted into common stock nor does the Corporation have any contracts that could result in the issuance of common stock.
Stock Repurchase Program. Since 1988, the Corporation has had a stock repurchase program under which it is authorized to purchase shares of its own common stock in market or private transactions. At December 31, 2010, and in accordance with prior approval by its Board of Directors, the Corporation was authorized to purchase 76,568 shares of stock. Share repurchases are financed through available corporate cash.
Shares Tendered Upon the Exercise of Stock Options. The line captioned repurchase of common stock in the Consolidated Statement of Changes in Stockholders’ Equity includes common stock tendered upon the exercise of stock options of 1,843 shares in 2008 with a value of $40,000. No shares of common stock were tendered upon the exercise of stock options in 2009 or 2010.
Shares Withheld Upon the Vesting of RSUs. The line captioned repurchase of common stock in the Consolidated Statement of Changes in Stockholders’ Equity represents 3,581 shares of common stock with a value of $91,000 withheld in 2010 upon the conversion of RSUs. The value of the shares withheld was used to satisfy the personal tax liabilities of the RSU holders.
37
Stock-based Compensation
The Corporation has a stock-based compensation plan as more fully described in Note J. Compensation cost is recognized for stock options and RSUs issued to employees based on the grant date fair value of the award. The cost is recognized over the period during which an employee is required to provide service in exchange for the award which is usually the vesting period.
Comprehensive Income
Comprehensive income includes net income and other comprehensive income. Other comprehensive income includes revenues, expenses, gains, and losses that under generally accepted accounting principles are included in comprehensive income but excluded from net income. Other comprehensive income for the Corporation consists of unrealized holding gains or losses on available-for-sale securities and changes in the funded status of the Bank’s defined benefit pension plan, both net of related income taxes. Accumulated other comprehensive income is recognized as a separate component of stockholders’ equity.
The components of other comprehensive income (loss) and the related tax effects are as follows:
|
2010
|
2009
|
2008
|
||||||||||
|
(in thousands)
|
||||||||||||
|
Unrealized holding gains (losses) on available-for-sale securities:
|
||||||||||||
|
Change arising during period
|
$ | (6,049 | ) | $ | 7,606 | $ | 2,921 | |||||
|
Reclassification adjustment for gains included in net income
|
(1,719 | ) | (1,428 | ) | (248 | ) | ||||||
|
Net unrealized gains (losses) on available-for-sale securities
|
(7,768 | ) | 6,178 | 2,673 | ||||||||
|
Tax effect
|
(3,083 | ) | 2,453 | 1,061 | ||||||||
| (4,685 | ) | 3,725 | 1,612 | |||||||||
|
Change in funded status of pension plan:
|
||||||||||||
|
Unrecognized net gain (loss) arising during period
|
(656 | ) | 2,510 | (8,172 | ) | |||||||
|
Amortization of prior service cost included in pension expense
|
23 | 23 | 25 | |||||||||
| (633 | ) | 2,533 | (8,147 | ) | ||||||||
|
Tax effect
|
(251 | ) | 1,005 | (3,234 | ) | |||||||
| (382 | ) | 1,528 | (4,913 | ) | ||||||||
|
Other comprehensive income (loss)
|
$ | (5,067 | ) | $ | 5,253 | $ | (3,301 | ) | ||||
The following sets forth the components of accumulated other comprehensive income, net of tax:
|
Balance 12/31/09
|
Current Period Change
|
Balance 12/31/10
|
||||||||||
|
(in thousands)
|
||||||||||||
|
Unrealized holding gains (losses) on available-for-sale securities
|
$ | 6,998 | $ | (4,685 | ) | $ | 2,313 | |||||
|
Unrealized actuarial losses on pension plan
|
(3,347 | ) | (382 | ) | (3,729 | ) | ||||||
|
Total accumulated other comprehensive income (loss)
|
$ | 3,651 | $ | (5,067 | ) | $ | (1,416 | ) | ||||
Embedded Derivative Instruments
Under generally accepted accounting principles, changes in the fair value of embedded derivative instruments with economic characteristics and risks that are clearly and closely related to the economic characteristics and risks of the related host contracts are not recognized in earnings in the period of change. Generally, all other embedded derivative instruments, unless they are embedded in contracts that are remeasured at fair value with changes in fair value reported in earnings as they occur, are accounted for as fair value hedges, cash flow hedges, foreign currency hedges or nonhedging instruments.
Operating Segments
While senior management monitors the revenue streams of the Bank’s various products and services, the identifiable segments are not material and operations are managed and financial performance is evaluated on a company-wide basis. Accordingly, all of the financial operations are considered by senior management to be aggregated in one reportable operating segment.
38
Investment Management Division
Assets held in a fiduciary capacity are not assets of the Corporation and, accordingly, are not included in the accompanying consolidated financial statements. The Investment Management Division records fees on the accrual basis.
Reclassifications
Some items in the prior year financial statements were reclassified to conform to the current presentation.
Adoption of New Accounting Pronouncements
The pronouncements discussed in this section are not intended to be an all inclusive list, but rather only those pronouncements that could potentially have an impact on the Corporation’s results of operations, financial position or disclosures.
In June 2009, the Financial Accounting Standards Board (“FASB”) issued Statement of Financial Accounting Standards (“SFAS”) No. 166 “Accounting for Transfers of Financial Assets – an amendment of FASB Statement No. 140”, which was reissued in December 2009 as Accounting Standards Update (“ASU”) 2009-16 and is now part of FASB Accounting Standards Codification (“ASC”) 860 “Transfers and Servicing.” The objective of this Statement is to improve the relevance, representational faithfulness, and comparability of the information that a reporting entity provides in its financial reports about: (1) a transfer of financial assets; (2) the effects of a transfer on its financial position, financial performance, and cash flows; and (3) a transferor’s continuing involvement, if any, in transferred financial assets. SFAS No. 166 was effective for financial statements issued for fiscal years and interim periods beginning after November 15, 2009. The recognition and measurement provisions of this statement need to be applied to transfers that occur on or after the effective date. The adoption of SFAS No. 166 on January 1, 2010 has not impacted the Corporation’s consolidated financial statements.
In January 2010, the FASB issued ASU 2010-06 “Improving Disclosures about Fair Value Measurements.” This ASU requires more robust disclosures about the different classes of assets and liabilities measured at fair value, the valuation techniques and inputs used, the activity in Level 3 fair value measurements, and the transfers between Levels 1, 2 and 3. This ASU was effective for interim and annual periods beginning after December 15, 2009, except for disclosures regarding the roll forward of activity in Level 3 fair value measurements. Those disclosures are effective for interim and annual periods beginning after December 15, 2010. The adoption of ASU 2010-06 on January 1, 2010 has not impacted the Corporation’s disclosures.
In February 2010, the FASB issued ASU 2010-09 “Subsequent Events.” This ASU addresses certain implementation issues related to an entity’s requirement to perform and disclose subsequent events procedures. It clarifies that an entity that is an SEC filer is not required to disclose the date through which subsequent events have been evaluated. This change alleviates potential conflicts with SEC requirements.
In July 2010, the FASB issued ASU 2010-20 “Disclosures about the Credit Quality of Financing Receivables and the Allowance for Credit Losses.” This ASU requires significantly more disclosure about credit quality in a financial institution’s portfolio and the allowance for credit losses. The required disclosures as of the end of a reporting period are effective for interim and annual reporting periods ending on or after December 15, 2010. The required disclosures about activity that occurs during a reporting period are effective for interim and annual reporting periods beginning on or after December 15, 2010. The adoption of ASU 2010-20 on December 31, 2010 resulted in various disclosures included in “Note C – Loans” to the Corporation’s consolidated financial statements.
In January 2011, the FASB issued ASU 2011-1 “Deferral of the Effective Date of Disclosures about Troubled Debt Restructurings in Update No. 2010-20.” Before the amendment in ASU 2011-1, creditors that are public entities were required to comply with the disclosure requirements regarding troubled debt restructurings set forth in ASU 2010-20 in financial statements for interim and annual periods beginning on or after December 15, 2010. The deferral brought about by ASU 2011-1 is intended to allow the FASB time to complete its deliberations on what constitutes a troubled debt restructuring. The effective date for public entities to comply with the disclosures about troubled debt restructurings and the guidance for determining what constitutes a troubled debt restructuring will be coordinated.
39
NOTE B – INVESTMENT SECURITIES
The following table sets forth the amortized cost and estimated fair values of the Bank’s investment securities at December 31, 2010 and 2009.
|
2010
|
||||||||||||||||
|
Amortized Cost
|
Gross Unrealized Gains
|
Gross Unrealized Losses
|
Fair Value
|
|||||||||||||
|
Held-to-Maturity Securities:
|
(in thousands)
|
|||||||||||||||
|
State and municipals
|
$ | 49,294 | $ | 1,632 | $ | (132 | ) | $ | 50,794 | |||||||
|
Pass-through mortgage securities
|
11,025 | 638 | - | 11,663 | ||||||||||||
|
Collateralized mortgage obligations
|
26,259 | 1,044 | - | 27,303 | ||||||||||||
| $ | 86,578 | $ | 3,314 | $ | (132 | ) | $ | 89,760 | ||||||||
|
Available-for-Sale Securities:
|
||||||||||||||||
|
U.S. government agencies
|
$ | 5,000 | $ | 155 | $ | - | $ | 5,155 | ||||||||
|
State and municipals
|
221,832 | 1,793 | (8,013 | ) | 215,612 | |||||||||||
|
Pass-through mortgage securities
|
76,036 | 4,470 | (35 | ) | 80,471 | |||||||||||
|
Collateralized mortgage obligations
|
346,410 | 6,796 | (1,329 | ) | 351,877 | |||||||||||
| $ | 649,278 | $ | 13,214 | $ | (9,377 | ) | $ | 653,115 | ||||||||
|
2009
|
||||||||||||||||
|
Amortized Cost
|
Gross Unrealized Gains
|
Gross Unrealized Losses
|
Fair Value
|
|||||||||||||
|
Held-to-Maturity Securities:
|
(in thousands)
|
|||||||||||||||
|
State and municipals
|
$ | 57,875 | $ | 1,924 | $ | (48 | ) | $ | 59,751 | |||||||
|
Pass-through mortgage securities
|
16,882 | 604 | - | 17,486 | ||||||||||||
|
Collateralized mortgage obligations
|
54,222 | 1,774 | - | 55,996 | ||||||||||||
| $ | 128,979 | $ | 4,302 | $ | (48 | ) | $ | 133,233 | ||||||||
|
Available-for-Sale Securities:
|
||||||||||||||||
|
U.S. government agencies
|
$ | 5,000 | $ | 8 | $ | - | $ | 5,008 | ||||||||
|
State and municipals
|
150,509 | 4,378 | (374 | ) | 154,513 | |||||||||||
|
Pass-through mortgage securities
|
122,186 | 4,349 | (113 | ) | 126,422 | |||||||||||
|
Collateralized mortgage obligations
|
349,494 | 4,450 | (1,093 | ) | 352,851 | |||||||||||
| $ | 627,189 | $ | 13,185 | $ | (1,580 | ) | $ | 638,794 | ||||||||
At December 31, 2010, $260,680,000 of the Corporation’s municipal securities were rated AA or better, $2,602,000 were rated A and $1,624,000 were non-rated bonds of local municipalities. The Corporation’s pass-through mortgage security portfolio at December 31, 2010 is comprised of $77,633,000, $12,960,000 and $903,000 issued by the Government National Mortgage Association (“GNMA”), the Federal National Mortgage Association (“Fannie Mae”) and the Federal Home Loan Mortgage Corporation (“Freddie Mac”), respectively. Each issuer’s pass-through securities are backed by residential mortgages conforming to its underwriting guidelines and each issuer guarantees the timely payment of principal and interest on its securities. All of the Corporation’s collateralized mortgage obligations (“CMOs”) were issued by GNMA and such securities are backed by GNMA residential pass-through mortgage securities. GNMA guarantees the timely payment of principal and interest on its CMOs and the underlying pass-through mortgage securities. Obligations of GNMA represent full faith and credit obligations of the U.S. government (the “Government”), while obligations of Fannie Mae, which is a corporate instrumentality of the Government, and Freddie Mac, which is a Government sponsored corporation, do not. Fannie Mae and Freddie Mac have been placed into conservatorship by their primary regulator, the Federal Housing Finance Agency (“FHFA”) which also acts as conservator. In conjunction with the conservatorship, the U.S. Department of the Treasury entered into Preferred Stock Purchase Agreements with Fannie Mae and Freddie Mac to ensure that each of these entities maintains positive net worth, and established new borrowing facilities for these entities intended to serve as an ultimate liquidity backstop. The Preferred Stock Purchase Agreements and borrowing facilities serve to protect the existing and future holders of Fannie Mae and Freddie Mac mortgage securities and other debt instruments.
At December 31, 2010 and 2009, investment securities with a carrying value of $258,404,000 and $378,913,000, respectively, were pledged as collateral to secure public deposits and borrowed funds.
40
Securities With Unrealized Losses. The following table sets forth securities with unrealized losses at December 31, 2010 and 2009 presented by length of time the securities have been in a continuous unrealized loss position.
|
2010
|
||||||||||||||||||||||||
|
Less than 12 Months
|
12 Months or More
|
Total
|
||||||||||||||||||||||
|
Fair Value
|
Unrealized Loss
|
Fair Value
|
Unrealized Loss
|
Fair Value
|
Unrealized Loss
|
|||||||||||||||||||
|
(in thousands)
|
||||||||||||||||||||||||
|
State and municipals
|
$ | 145,559 | $ | (8,106 | ) | $ | 508 | $ | (39 | ) | $ | 146,067 | $ | (8,145 | ) | |||||||||
|
Pass-through mortgage securities
|
7,451 | (35 | ) | - | - | 7,451 | (35 | ) | ||||||||||||||||
|
Collateralized mortgage obligations
|
68,778 | (1,329 | ) | - | - | 68,778 | (1,329 | ) | ||||||||||||||||
|
Total temporarily impaired
|
$ | 221,788 | $ | (9,470 | ) | $ | 508 | $ | (39 | ) | $ | 222,296 | $ | (9,509 | ) | |||||||||
|
2009
|
||||||||||||||||||||||||
|
Less than 12 Months
|
12 Months or More
|
Total
|
||||||||||||||||||||||
|
Fair Value
|
Unrealized Loss
|
Fair Value
|
Unrealized Loss
|
Fair Value
|
Unrealized Loss
|
|||||||||||||||||||
|
(in thousands)
|
||||||||||||||||||||||||
|
State and municipals
|
$ | 25,403 | $ | (421 | ) | $ | 100 | $ | (1 | ) | $ | 25,503 | $ | (422 | ) | |||||||||
|
Pass-through mortgage securities
|
13,132 | (112 | ) | 13 | (1 | ) | 13,145 | (113 | ) | |||||||||||||||
|
Collateralized mortgage obligations
|
107,781 | (1,093 | ) | - | - | 107,781 | (1,093 | ) | ||||||||||||||||
|
Total temporarily impaired
|
$ | 146,316 | $ | (1,626 | ) | $ | 113 | $ | (2 | ) | $ | 146,429 | $ | (1,628 | ) | |||||||||
Because the unrealized losses reflected in the preceding tables are attributable to changes in interest rates and not credit losses, and because management does not have the intent to sell these securities and it is not likely that it will be required to sell the securities before their anticipated recovery, the Bank does not consider these securities to be other-than-temporarily impaired at December 31, 2010.
Sales of Available-for-Sale Securities. Sales of available-for-sale securities were as follows:
|
2010
|
2009
|
2008
|
||||||||||
|
(in thousands)
|
||||||||||||
|
Proceeds
|
$ | 78,504 | $ | 50,697 | $ | 36,993 | ||||||
|
Gross gains
|
1,885 | 1,428 | 287 | |||||||||
|
Gross losses
|
(166 | ) | - | (39 | ) | |||||||
|
Net gains
|
$ | 1,719 | $ | 1,428 | $ | 248 | ||||||
The tax provision related to these net realized gains was $682,000, $567,000 and $98,000 in 2010, 2009 and 2008, respectively.
41
Maturities and Average Yields. The following table sets forth the maturities and weighted average yields of the Bank’s investment securities at December 31, 2010.
|
Principal Maturing (1)
|
||||||||||||||||||||||||||||||||
|
Within One Year
|
After One But Within Five Years
|
After Five But Within Ten Years
|
After Ten Years
|
|||||||||||||||||||||||||||||
|
Amount
|
Yield
|
Amount
|
Yield
|
Amount
|
Yield
|
Amount
|
Yield
|
|||||||||||||||||||||||||
|
(dollars in thousands)
|
||||||||||||||||||||||||||||||||
|
Held-to-Maturity Securities (Amortized Cost)
|
||||||||||||||||||||||||||||||||
|
State and municipals (2)
|
$ | 2,947 | 6.37 | % | $ | 11,151 | 6.29 | % | $ | 27,998 | 6.24 | % | $ | 7,198 | 6.05 | % | ||||||||||||||||
|
Pass-through mortgage securities
|
2 | 5.92 | 5,377 | 3.91 | 1,193 | 5.18 | 4,453 | 4.88 | ||||||||||||||||||||||||
|
Collateralized mortgage obligations
|
- | - | - | - | - | - | 26,259 | 5.03 | ||||||||||||||||||||||||
| $ | 2,949 | 6.37 | % | $ | 16,528 | 5.52 | % | $ | 29,191 | 6.20 | % | $ | 37,910 | 5.21 | % | |||||||||||||||||
|
Principal Maturing (1)
|
||||||||||||||||||||||||||||||||
|
Within One Year
|
After One But Within Five Years
|
After Five But Within Ten Years
|
After Ten Years
|
|||||||||||||||||||||||||||||
|
Amount
|
Yield
|
Amount
|
Yield
|
Amount
|
Yield
|
Amount
|
Yield
|
|||||||||||||||||||||||||
|
(dollars in thousands)
|
||||||||||||||||||||||||||||||||
|
Held-to-Maturity Securities (Fair Value)
|
||||||||||||||||||||||||||||||||
|
State and municipals (2)
|
$ | 2,984 | 6.37 | % | $ | 11,634 | 6.29 | % | $ | 29,028 | 6.24 | % | $ | 7,148 | 6.05 | % | ||||||||||||||||
|
Pass-through mortgage securities
|
2 | 5.92 | 5,561 | 3.91 | 1,291 | 5.18 | 4,809 | 4.88 | ||||||||||||||||||||||||
|
Collateralized mortgage obligations
|
- | - | - | - | - | - | 27,303 | 5.03 | ||||||||||||||||||||||||
| $ | 2,986 | 6.37 | % | $ | 17,195 | 5.52 | % | $ | 30,319 | 6.20 | % | $ | 39,260 | 5.21 | % | |||||||||||||||||
|
Principal Maturing (1)
|
||||||||||||||||||||||||||||||||
|
Within One Year
|
After One But Within Five Years
|
After Five But Within Ten Years
|
After Ten Years
|
|||||||||||||||||||||||||||||
|
Amount
|
Yield
|
Amount
|
Yield
|
Amount
|
Yield
|
Amount
|
Yield
|
|||||||||||||||||||||||||
|
(dollars in thousands)
|
||||||||||||||||||||||||||||||||
|
Available-for-Sale Securities (Fair Value)
|
||||||||||||||||||||||||||||||||
|
U.S. government agencies
|
$ | - | - | % | $ | - | - | % | $ | 5,155 | 4.50 | % | $ | - | - | % | ||||||||||||||||
|
State and municipals (2)
|
3,103 | 7.31 | 12,906 | 7.00 | 17,458 | 6.50 | 182,145 | 6.13 | ||||||||||||||||||||||||
|
Pass-through mortgage securities
|
- | - | 853 | 4.91 | 4,726 | 5.64 | 74,892 | 4.70 | ||||||||||||||||||||||||
|
Collateralized mortgage obligations
|
- | - | - | - | 3,971 | 3.01 | 347,906 | 3.00 | ||||||||||||||||||||||||
| $ | 3,103 | 7.31 | % | $ | 13,759 | 6.87 | % | $ | 31,310 | 5.60 | % | $ | 604,943 | 4.15 | % | |||||||||||||||||
|
(1)
|
Maturities shown are stated maturities, except in the case of municipal securities which are shown at the earlier of their stated maturity or pre-refunded dates. Securities backed by mortgages, which include the pass-through mortgage securities and collateralized mortgage obligations shown above, are expected to have substantial periodic repayments resulting in weighted average lives considerably shorter than would be surmised from the above table.
|
|
(2)
|
Yields on tax-exempt state and municipal securities have been computed on a tax-equivalent basis.
|
42
NOTE C – LOANS
The following table sets forth changes in the Bank’s allowance for loan losses and the recorded investment in loans by portfolio segment and based on impairment method. The Bank’s construction and land development loans, if any, are included with commercial mortgages.
|
Commercial & Industrial
|
Commercial Mortgages
|
Residential Mortgages
|
Home Equity
|
Other
|
Total
|
|||||||||||||||||||
|
2010
|
(in thousands)
|
|||||||||||||||||||||||
|
Allowance for loan losses:
|
||||||||||||||||||||||||
|
Beginning balance
|
$ | 971 | $ | 5,975 | $ | 2,242 | $ | 1,102 | $ | 56 | $ | 10,346 | ||||||||||||
|
Charge-offs
|
- | 325 | - | 22 | 30 | 377 | ||||||||||||||||||
|
Recoveries
|
46 | - | - | - | 26 | 72 | ||||||||||||||||||
|
Provision for loan losses (credit)
|
(214 | ) | 2,030 | 1,817 | 335 | 5 | 3,973 | |||||||||||||||||
|
Ending balance
|
$ | 803 | $ | 7,680 | $ | 4,059 | $ | 1,415 | $ | 57 | $ | 14,014 | ||||||||||||
|
Ending balance individually evaluated for impairment
|
$ | 27 | $ | 870 | $ | - | $ | - | $ | - | $ | 897 | ||||||||||||
|
Ending balance collectively evaluated for impairment
|
$ | 776 | $ | 6,810 | $ | 4,059 | $ | 1,415 | $ | 57 | $ | 13,117 | ||||||||||||
|
Loans:
|
||||||||||||||||||||||||
|
Ending balance
|
$ | 39,055 | $ | 416,946 | $ | 334,768 | $ | 103,829 | $ | 5,790 | $ | 900,388 | ||||||||||||
|
Ending balance individually evaluated for impairment
|
$ | 27 | $ | 2,314 | $ | 945 | $ | - | $ | - | $ | 3,286 | ||||||||||||
|
Ending balance collectively evaluated for impairment
|
$ | 39,028 | $ | 414,632 | $ | 333,823 | $ | 103,829 | $ | 5,790 | $ | 897,102 | ||||||||||||
|
2009
|
||||||||||||||||||||||||
|
Allowance for loan losses:
|
||||||||||||||||||||||||
|
Beginning balance
|
$ | 933 | $ | 3,111 | $ | 1,227 | $ | 706 | $ | 99 | $ | 6,076 | ||||||||||||
|
Charge-offs
|
162 | - | - | - | 13 | 175 | ||||||||||||||||||
|
Recoveries
|
148 | - | - | - | 12 | 160 | ||||||||||||||||||
|
Provision for loan losses (credit)
|
52 | 2,864 | 1,015 | 396 | (42 | ) | 4,285 | |||||||||||||||||
|
Ending balance
|
$ | 971 | $ | 5,975 | $ | 2,242 | $ | 1,102 | $ | 56 | $ | 10,346 | ||||||||||||
|
Ending balance individually evaluated for impairment
|
$ | 45 | $ | - | $ | - | $ | - | $ | - | $ | 45 | ||||||||||||
|
Ending balance collectively evaluated for impairment
|
$ | 926 | $ | 5,975 | $ | 2,242 | $ | 1,102 | $ | 56 | $ | 10,301 | ||||||||||||
|
Loans:
|
||||||||||||||||||||||||
|
Ending balance
|
$ | 48,891 | $ | 412,731 | $ | 248,888 | $ | 109,010 | $ | 5,763 | $ | 825,283 | ||||||||||||
|
Ending balance individually evaluated for impairment
|
$ | 45 | $ | - | $ | 352 | $ | 80 | $ | - | $ | 477 | ||||||||||||
|
Ending balance collectively evaluated for impairment
|
$ | 48,846 | $ | 412,731 | $ | 248,536 | $ | 108,930 | $ | 5,763 | $ | 824,806 | ||||||||||||
|
2008
|
||||||||||||||||||||||||
|
Allowance for loan losses:
|
||||||||||||||||||||||||
|
Beginning balance
|
$ | 874 | $ | 1,891 | $ | 1,036 | $ | 551 | $ | 101 | $ | 4,453 | ||||||||||||
|
Charge-offs
|
275 | - | - | - | 50 | 325 | ||||||||||||||||||
|
Recoveries
|
- | - | - | - | 3 | 3 | ||||||||||||||||||
|
Provision for loan losses
|
334 | 1,220 | 191 | 155 | 45 | 1,945 | ||||||||||||||||||
|
Ending balance
|
$ | 933 | $ | 3,111 | $ | 1,227 | $ | 706 | $ | 99 | $ | 6,076 | ||||||||||||
43
The following table sets forth information regarding individually impaired loans by class of loans for the years ended December 31, 2010 and 2009, including the interest income recognized while the loans were impaired.
|
2010
|
||||||||||||||||||||
|
Recorded Investment
|
Unpaid Principal Balance
|
Related Allowance
|
Average Recorded Investment
|
Interest Income Recognized
|
||||||||||||||||
|
With no related allowance recorded:
|
(in thousands)
|
|||||||||||||||||||
|
Multifamily commercial mortgages
|
$ | 447 | $ | 447 | $ | - | $ | 451 | $ | 20 | ||||||||||
|
Residential mortgages
|
945 | 945 | - | 945 | 22 | |||||||||||||||
|
With an allowance recorded:
|
||||||||||||||||||||
|
Commercial and industrial
|
27 | 27 | 27 | 31 | 2 | |||||||||||||||
|
Multifamily commercial mortgages
|
1,867 | 1,867 | 870 | 1,867 | 99 | |||||||||||||||
|
Total:
|
||||||||||||||||||||
|
Commercial and industrial
|
27 | 27 | 27 | 31 | 2 | |||||||||||||||
|
Multifamily commercial mortgages
|
2,314 | 2,314 | 870 | 2,318 | 119 | |||||||||||||||
|
Residential mortgages
|
945 | 945 | - | 945 | 22 | |||||||||||||||
| $ | 3,286 | $ | 3,286 | $ | 897 | $ | 3,294 | $ | 143 | |||||||||||
|
2009
|
||||||||||||||||||||
|
Recorded Investment
|
Unpaid Principal Balance
|
Related Allowance
|
Average Recorded Investment
|
Interest Income Recognized
|
||||||||||||||||
|
With no related allowance recorded:
|
(in thousands)
|
|||||||||||||||||||
|
Residential mortgages
|
$ | 352 | $ | 352 | $ | - | $ | 353 | $ | 21 | ||||||||||
|
Home equity
|
80 | 80 | - | 80 | 1 | |||||||||||||||
|
With an allowance recorded:
|
||||||||||||||||||||
|
Commercial and industrial
|
45 | 45 | 45 | 45 | - | |||||||||||||||
|
Total:
|
||||||||||||||||||||
|
Commercial and industrial
|
45 | 45 | 45 | 45 | - | |||||||||||||||
|
Residential mortgages
|
352 | 352 | - | 353 | 21 | |||||||||||||||
|
Home equity
|
80 | 80 | - | 80 | 1 | |||||||||||||||
| $ | 477 | $ | 477 | $ | 45 | $ | 478 | $ | 22 | |||||||||||
The average of individually impaired loans during 2008 was $1,975,000. Interest income recognized while the loans were impaired was $158,000.
Interest income recorded by the Corporation during 2010, 2009 and 2008 on loans considered to be impaired was generally recognized using the accrual method of accounting. Any payments received on nonaccrual impaired loans are applied to the recorded investment in the loan.
The following table presents the recorded investment in nonaccrual loans by class of loans as of December 31, 2010 and 2009.
|
2010
|
2009
|
|||||||
|
(in thousands)
|
||||||||
|
Multifamily commercial mortgages
|
$ | 2,314 | $ | - | ||||
|
Residential mortgages
|
622 | 352 | ||||||
|
Home equity
|
- | 80 | ||||||
| $ | 2,936 | $ | 432 | |||||
44
The following table presents the aging of the recorded investment in loans as of December 31, 2010 by class of loans.
|
Past Due Status
|
||||||||||||||||||||||||
|
30-59 Days
|
60-89 Days
|
90 Days and Over
|
Total
|
Current
|
Total Loans
|
|||||||||||||||||||
|
(in thousands)
|
||||||||||||||||||||||||
|
Commercial and industrial
|
$ | - | $ | - | $ | - | $ | - | $ | 39,055 | $ | 39,055 | ||||||||||||
|
Commercial mortgages:
|
||||||||||||||||||||||||
|
Multifamily
|
- | - | 447 | 447 | 207,652 | 208,099 | ||||||||||||||||||
|
Owner-occupied
|
- | - | - | - | 83,386 | 83,386 | ||||||||||||||||||
|
Other
|
- | - | - | - | 125,461 | 125,461 | ||||||||||||||||||
|
Residential mortgages
|
491 | 839 | 621 | 1,951 | 332,817 | 334,768 | ||||||||||||||||||
|
Home equity
|
328 | - | - | 328 | 103,501 | 103,829 | ||||||||||||||||||
|
Other
|
2 | - | - | 2 | 5,788 | 5,790 | ||||||||||||||||||
| $ | 821 | $ | 839 | $ | 1,068 | $ | 2,728 | $ | 897,660 | $ | 900,388 | |||||||||||||
Credit Quality Indicators. The Corporation categorizes loans into risk categories based on relevant information about the borrower’s ability to service their debt including, but not limited to, current financial information for the borrower and any guarantors, historical payment experience, credit documentation, public information and current economic trends.
Commercial and industrial loans and commercial mortgage loans are risk rated utilizing a ten point rating system. The risk ratings are defined as follows:
|
1 – 2
|
Cash flow is of high quality and stable. Borrower has very good liquidity and ready access to traditional sources of credit. This category also includes loans to borrowers secured by cash and/or marketable securities within approved margin requirements.
|
|
|
3 – 4
|
Cash flow quality is strong, but shows some variability. Borrower has good liquidity and comfortable asset quality. Borrower has access to traditional sources of credit with minimal restrictions.
|
|
|
5 – 6
|
Cash flow quality is acceptable but shows some variability. Liquidity varies with operating cycle and assets provide an adequate margin of protection. Borrower has access to traditional sources of credit, but generally on a secured basis.
|
|
|
7
|
Watch - Cash flow has a high degree of variability and subject to economic downturns. Liquidity is strained and the ability of the borrower to access traditional sources of credit is diminished.
|
|
|
8
|
Special Mention - The borrower has potential weaknesses that deserve management’s close attention. If left uncorrected, these potential weaknesses may result in deterioration of the repayment prospects for the asset or in the institution’s credit position at some future date. Special mention assets are not adversely classified and do not expose an institution to sufficient risk to warrant adverse classification.
|
|
|
9
|
Substandard - Loans are inadequately protected by the current sound worth and paying capacity of the borrower or of the collateral pledged, if any. Loans so classified must have a well-defined weakness, or weaknesses, that jeopardize the liquidation of the debt. They are characterized by the distinct possibility that the Bank will sustain some loss if the deficiencies are not corrected.
|
|
|
10
|
Doubtful - Loans have all the weaknesses inherent as those classified substandard with the added characteristic that the weaknesses make collection or liquidation in full, on the basis of currently existing facts, conditions, and values, highly questionable and improbable.
|
Risk ratings are initially assigned by the lending officer together with any necessary approval authority. The ratings are regularly assessed through ongoing borrower contact, independent loan review, the analysis of the allowance for loan losses and delinquency trends. Commercial and industrial loans and commercial mortgage loans with balances in excess of $500,000 are generally reviewed no less often than annually. Other loans are reviewed periodically, the frequency of which is determined by the Bank’s ongoing assessments of the borrower’s condition.
45
At December 31, 2010, and based on the most recent analysis performed, the recorded investment in commercial and industrial loans and commercial real estate loans by class of loans and credit quality indicator is as follows:
| Internally Assigned | Commercial |
Commercial Mortgages
|
||||||||||||||||||
| Risk Rating |
and Industrial
|
Multifamily
|
Owner-occupied
|
Other
|
Total
|
|||||||||||||||
|
(in thousands)
|
||||||||||||||||||||
|
1 - 2
|
$ | 6,678 | $ | - | $ | - | $ | - | $ | - | ||||||||||
|
3 - 4
|
410 | - | - | - | - | |||||||||||||||
|
5 - 6
|
30,485 | 202,196 | 69,781 | 121,691 | 393,668 | |||||||||||||||
|
7
|
910 | 3,534 | 6,202 | 3,323 | 13,059 | |||||||||||||||
|
8
|
- | 502 | 3,813 | - | 4,315 | |||||||||||||||
|
9
|
572 | 1,867 | 3,590 | 447 | 5,904 | |||||||||||||||
|
10
|
- | - | - | - | - | |||||||||||||||
| $ | 39,055 | $ | 208,099 | $ | 83,386 | $ | 125,461 | $ | 416,946 | |||||||||||
Residential mortgage loans, home equity loans and other consumer loans are risk rated utilizing a three point rating system based on Fair Isaac Corporation (“FICO”) scores. A FICO score is a tool used in the Bank’s loan approval process, and a minimum score of 680 is generally required. FICO scores for each borrower are updated on an annual basis. The risk ratings are defined as follows:
|
|
1.
|
FICO score is equal to or greater than 680.
|
|
|
2.
|
FICO score is 635 to 679.
|
|
|
3.
|
FICO score is below 635.
|
At December 31, 2010, and based on the most recent FICO score obtained by the Corporation, the recorded investment in residential mortgages, home equity loans, and other consumer loans by credit quality indicator is as follows:
|
Internally Assigned Risk Rating
|
Residential Mortgages
|
Home Equity
|
Other
|
|||||||||
|
(in thousands)
|
||||||||||||
|
1
|
$ | 290,820 | $ | 81,987 | $ | 1,489 | ||||||
|
2
|
26,095 | 11,276 | 3,505 | |||||||||
|
3
|
17,853 | 10,566 | 382 | |||||||||
|
Not Rated
|
- | - | 414 | |||||||||
| $ | 334,768 | $ | 103,829 | $ | 5,790 | |||||||
Certain directors, including their immediate families and companies in which they are principal owners, and executive officers were loan customers of the Bank during 2010 and 2009. The aggregate amount of these loans was $1,826,000 and $2,182,000 at December 31, 2010 and 2009, respectively. During 2010, $773,000 of new loans to such persons were made and repayments totaled $1,129,000. There were no loans to directors or executive officers which were nonaccruing at December 31, 2010 or 2009.
NOTE D – PREMISES AND EQUIPMENT
Bank premises and equipment consist of the following:
|
December 31,
|
||||||||
|
2010
|
2009
|
|||||||
|
(in thousands)
|
||||||||
|
Land
|
$ | 4,335 | $ | 2,892 | ||||
|
Buildings and improvements
|
12,344 | 10,668 | ||||||
|
Leasehold improvements
|
6,538 | 5,215 | ||||||
|
Furniture and equipment
|
18,754 | 16,838 | ||||||
|
Construction in process
|
925 | 2,226 | ||||||
| 42,896 | 37,839 | |||||||
|
Accumulated depreciation and amortization
|
(22,053 | ) | (19,749 | ) | ||||
| $ | 20,843 | $ | 18,090 | |||||
Buildings occupied by two of the Bank’s branch offices are leased from a director of the Corporation and the Bank. The leases, which expire on October 31, 2012 and December 31, 2019, provide for base rents for the year ending December 31, 2011 of $33,972 and $33,014, respectively. In addition to base rent, the Bank is responsible for its proportionate share of the real estate taxes on one of the leased properties. The Corporation believes that the foregoing is comparable to the rents that would be charged by an unrelated third party.
46
NOTE E – DEPOSITS
The following table sets forth the remaining maturities of the Bank’s time deposits.
|
Amount
|
||||||||||||
|
Less than $100,000
|
$100,000 or More
|
Total
|
||||||||||
|
(in thousands)
|
||||||||||||
|
2011
|
$ | 48,235 | $ | 128,857 | $ | 177,092 | ||||||
|
2012
|
6,071 | 7,865 | 13,936 | |||||||||
|
2013
|
8,202 | 8,961 | 17,163 | |||||||||
|
2014
|
10,345 | 12,795 | 23,140 | |||||||||
|
2015
|
16,341 | 20,059 | 36,400 | |||||||||
|
Thereafter
|
71 | 364 | 435 | |||||||||
| $ | 89,265 | $ | 178,901 | $ | 268,166 | |||||||
The aggregate amount of deposit account overdrafts included in other loans on the consolidated balance sheet was $414,000 and $1,314,000 at December 31, 2010 and 2009, respectively.
NOTE F – BORROWED FUNDS
The following table summarizes borrowed funds at December 31, 2010 and 2009.
|
December 31,
|
||||||||
|
2010
|
2009
|
|||||||
|
Short-term borrowings:
|
(in thousands)
|
|||||||
|
Securities sold under repurchase agreements
|
$ | 14,090 | $ | 13,907 | ||||
|
Federal Home Loan Bank advances
|
47,500 | 97,500 | ||||||
| 61,590 | 111,407 | |||||||
|
Long-term debt:
|
||||||||
|
Securities sold under repurchase agreements
|
127,000 | 127,000 | ||||||
|
Federal Home Loan Bank advances
|
65,000 | 35,000 | ||||||
| 192,000 | 162,000 | |||||||
| $ | 253,590 | $ | 273,407 | |||||
Accrued interest payable on borrowed funds is included in “accrued expenses and other liabilities” in the Consolidated Balance Sheets, and amounted to $777,000 and $728,000 at December 31, 2010 and 2009, respectively.
Securities Sold Under Repurchase Agreements. Securities sold under repurchase agreements are financing arrangements with contractual maturities between one day and eight years and are collateralized by municipal and mortgage-backed securities. With the exception of those repurchase agreements with embedded interest rate caps as described hereinafter, securities sold under repurchase agreements have fixed rates of interest. At maturity, the securities underlying the agreements will be returned to the Bank. The following table sets forth information concerning securities sold under repurchase agreements.
|
2010
|
2009
|
|||||||
|
(dollars in thousands)
|
||||||||
|
Average daily balance during the year
|
$ | 141,173 | $ | 143,387 | ||||
|
Average interest rate during the year
|
3.91 | % | 3.88 | % | ||||
|
Maximum month-end balance during the year
|
$ | 142,639 | $ | 148,194 | ||||
|
Weighted average interest rate at year-end
|
3.86 | % | 3.87 | % | ||||
The agreements are collateralized by securities with a carrying value of approximately $156 million at December 31, 2010.
47
The following table summarizes the contractual maturities and weighted average interest rates of securities sold under repurchase agreements at December 31, 2010.
|
Contractual Maturity
|
Amount
|
Weighted Average Rate
|
||||||
|
(dollars in thousands)
|
||||||||
|
Overnight
|
$ | 14,090 | 0.34 | % | ||||
|
2011
|
12,000 | 2.92 | ||||||
|
2012
|
50,000 | 4.47 | ||||||
|
2013
|
10,000 | 4.19 | ||||||
|
2015
|
20,000 | 4.15 | ||||||
|
Thereafter
|
35,000 | 4.49 | ||||||
| 127,000 | 4.25 | |||||||
| $ | 141,090 | 3.86 | % | |||||
The repurchase agreements maturing in 2013 are callable in 2011, and those maturing after 2013 are callable beginning in 2011.
$75 million of the repurchase agreements have embedded interest rate caps with a notional amount of $120 million and a weighted average LIBOR strike rate of 4.46%. The interest rate on the repurchase agreements will, as a result of the embedded caps, be reduced on a quarterly basis by the excess, if any, of 3 month LIBOR at the beginning of the quarter over the strike rate on the cap. However, the interest rate on the repurchase agreements can never go below zero. Since the economic characteristics and risks of the embedded caps are clearly and closely related to the economic characteristics and risks of the repurchase agreements, changes in the fair value of the caps are not recognized in earnings in the period of change.
Because the Bank’s loans and investment securities generally reprice slower than its interest-bearing liabilities, an immediate increase in interest rates uniformly across the yield curve should initially have a negative effect on net interest income. The purpose of the embedded interest rate caps is to potentially reduce the Corporation’s exposure in the event of an increase in interest rates.
Federal Home Loan Bank Advances. FHLB advances are collateralized by residential mortgage loans with a carrying amount of approximately $154 million at December 31, 2010. Each advance is non-amortizing and, for those advances with a term greater than one day, subject to a prepayment penalty. The following table sets forth information concerning FHLB advances.
|
December 31,
|
||||||||
|
2010
|
2009
|
|||||||
|
(dollars in thousands)
|
||||||||
|
Average daily balance during the year
|
$ | 52,624 | $ | 50,668 | ||||
|
Average interest rate during the year
|
2.33 | % | 1.97 | % | ||||
|
Maximum month-end balance during the year
|
$ | 112,500 | $ | 132,500 | ||||
|
Weighted average interest rate at year-end
|
1.74 | % | 1.07 | % | ||||
The following table summarizes the contractual maturities and weighted average interest rates of FHLB advances at December 31, 2010.
|
Contractual Maturity
|
Amount
|
Weighted Average Rate
|
||||||
|
(dollars in thousands)
|
||||||||
|
Overnight
|
$ | 47,500 | 0.40 | % | ||||
|
2012
|
10,000 | 2.24 | ||||||
|
2014
|
25,000 | 3.50 | ||||||
|
2015
|
30,000 | 2.23 | ||||||
| 65,000 | 2.72 | |||||||
| $ | 112,500 | 1.74 | % | |||||
48
Other Borrowings. The Bank had no other borrowings at December 31, 2010 or 2009. In 2010 and 2009, the average balance of other borrowings amounted to $26,000 and $74,000, respectively, with average interest rates of .53% and .51%, respectively. The funds were borrowed at the Federal Reserve Bank discount window and from commercial banks.
NOTE G – INCOME TAXES
The Corporation, the Bank, and the Bank’s subsidiaries with the exception of the REIT, file a consolidated federal income tax return. Income taxes charged to earnings in 2010, 2009, and 2008 had effective tax rates of 22.6%, 18.8%, and 26.3%, respectively. The following table sets forth a reconciliation of the statutory Federal income tax rate to the Corporation’s effective tax rate.
|
Year Ended December 31,
|
||||||||||||
|
2010
|
2009
|
2008
|
||||||||||
|
Statutory federal income tax rate
|
34.0 | % | 34.0 | % | 34.0 | % | ||||||
|
State and local income taxes, net of federal income tax benefit
|
2.9 | 1.1 | 5.5 | |||||||||
|
Tax-exempt income, net of disallowed cost of funding
|
(14.6 | ) | (16.6 | ) | (12.6 | ) | ||||||
|
Other
|
0.3 | 0.3 | (0.6 | ) | ||||||||
| 22.6 | % | 18.8 | % | 26.3 | % | |||||||
The effective tax rate was elevated in 2008 as a result of the Corporation losing the tax benefit derived from its REIT entity. The loss of the REIT tax benefit resulted from a change in New York State tax law effective January 1, 2008. In December 2008, the ownership of the REIT entity within the consolidated group was changed to once again obtain favorable tax treatment. This change, combined with an increase in tax-exempt income, caused the effective tax rate to decrease in 2009. The effective tax rate increased in 2010 because tax-exempt income as a percentage of income before income taxes declined. Also contributing to the increase in the effective tax rate was the fact that the tax benefit derived from the Corporation’s FNY and REIT entities decreased somewhat in 2010 while income before income taxes increased significantly.
Provision for Income Taxes. The following table sets forth the components of the provision for income taxes.
|
Year Ended December 31,
|
||||||||||||
|
2010
|
2009
|
2008
|
||||||||||
|
Current:
|
(in thousands)
|
|||||||||||
|
Federal
|
$ | 4,772 | $ | 2,852 | $ | 3,388 | ||||||
|
State and local
|
1,211 | 338 | 1,469 | |||||||||
| 5,983 | 3,190 | 4,857 | ||||||||||
|
Deferred:
|
||||||||||||
|
Federal
|
(459 | ) | (16 | ) | (217 | ) | ||||||
|
State and local
|
(153 | ) | (56 | ) | (12 | ) | ||||||
| (612 | ) | (72 | ) | (229 | ) | |||||||
| $ | 5,371 | $ | 3,118 | $ | 4,628 | |||||||
49
Net Deferred Tax Asset or Liability. The following table sets forth the components of the Bank’s net deferred tax asset or liability.
|
December 31,
|
||||||||
|
2010
|
2009
|
|||||||
|
Deferred tax assets:
|
(in thousands)
|
|||||||
|
Allowance for loan losses
|
$ | 5,478 | $ | 3,830 | ||||
|
Stock-based compensation
|
820 | 693 | ||||||
|
Supplemental executive retirement expense
|
10 | 13 | ||||||
|
Directors' retirement expense
|
80 | 84 | ||||||
|
Accrued rent expense
|
105 | 79 | ||||||
|
Other
|
19 | 31 | ||||||
| 6,512 | 4,730 | |||||||
|
Valuation allowance
|
- | - | ||||||
| 6,512 | 4,730 | |||||||
|
Deferred tax liabilities:
|
||||||||
|
Prepaid pension
|
2,213 | 1,354 | ||||||
|
Unrealized gains on available-for-sale securities
|
1,523 | 4,607 | ||||||
|
Depreciation
|
577 | 517 | ||||||
| 4,313 | 6,478 | |||||||
|
Net deferred tax asset (liability)
|
$ | 2,199 | $ | (1,748 | ) | |||
The Corporation had no unrecognized tax benefits as of December 31, 2010.
The Corporation is subject to U.S. federal income tax as well as New York State and New York City income taxes. The Corporation is subject to examination by taxing authorities for years after 2006 and did not incur any amounts for interest and penalties due taxing authorities for the years ended December 31, 2010, 2009 or 2008.
NOTE H – REGULATORY MATTERS
Minimum Regulatory Capital Requirements. The Corporation (on a consolidated basis) and the Bank are subject to various regulatory capital requirements administered by the federal banking agencies. Failure to meet minimum capital requirements can initiate certain mandatory and possibly additional discretionary actions by the regulators that, if undertaken, could have a direct material effect on the Corporation’s and Bank’s financial statements. Under capital adequacy guidelines and, with respect to the Bank, the regulatory framework for prompt corrective action, the Corporation and the Bank must meet specific capital guidelines that involve quantitative measures of their assets, liabilities, and certain off-balance-sheet items as calculated under regulatory accounting practices. The capital amounts and classification are also subject to qualitative judgments by the regulators about components, risk weightings, and other factors.
Quantitative measures established by regulation to ensure capital adequacy require the Corporation and the Bank to maintain minimum amounts and ratios of total and Tier 1 capital to risk weighted assets and Tier 1 capital to average assets. Tier 1 capital, risk weighted assets and average assets are as defined by regulation. The required minimums for the Corporation and Bank are set forth in the table that follows.
As of December 31, 2010, the most recent notification from the Federal Deposit Insurance Corporation categorized the Bank as well capitalized under the regulatory framework for prompt corrective action. To be categorized as well capitalized, an institution must maintain minimum total risk-based, Tier 1 risk-based, and Tier 1 leverage ratios as set forth in the table that follows. There are no conditions or events since the notification that management believes have changed the Bank’s category. The Corporation’s and the Bank’s actual capital amounts and ratios at December 31, 2010 and 2009 are also presented in the table.
50
|
2010
|
||||||||||||||||||||||||
|
Actual Capital
|
Minimum Capital Adequacy Requirement
|
Minimum To Be Well Capitalized Under Prompt Corrective Action Provisions
|
||||||||||||||||||||||
|
(dollars in thousands)
|
||||||||||||||||||||||||
|
Amount
|
Ratio
|
Amount
|
Ratio
|
Amount
|
Ratio
|
|||||||||||||||||||
|
Total Capital to Risk Weighted Assets:
|
||||||||||||||||||||||||
|
Consolidated
|
$ | 167,568 | 21.76 | % | $ | 61,594 | 8.00 | % | N/A | N/A | ||||||||||||||
|
Bank
|
167,746 | 21.82 | 61,504 | 8.00 | $ | 76,880 | 10.00 | % | ||||||||||||||||
|
Tier 1 Capital to Risk Weighted Assets:
|
||||||||||||||||||||||||
|
Consolidated
|
157,890 | 20.51 | 30,797 | 4.00 | N/A | N/A | ||||||||||||||||||
|
Bank
|
158,082 | 20.56 | 30,752 | 4.00 | 46,128 | 6.00 | ||||||||||||||||||
|
Tier 1 Capital to Average Assets:
|
||||||||||||||||||||||||
|
Consolidated
|
157,890 | 9.37 | 67,395 | 4.00 | N/A | N/A | ||||||||||||||||||
|
Bank
|
158,082 | 9.38 | 67,393 | 4.00 | 84,241 | 5.00 | ||||||||||||||||||
|
2009
|
||||||||||||||||||||||||
|
Actual Capital
|
Minimum Capital Adequacy Requirement
|
Minimum To Be Well Capitalized Under Prompt Corrective Action Provisions
|
||||||||||||||||||||||
|
(dollars in thousands)
|
||||||||||||||||||||||||
|
Amount
|
Ratio
|
Amount
|
Ratio
|
Amount
|
Ratio
|
|||||||||||||||||||
|
Total Capital to Risk Weighted Assets:
|
||||||||||||||||||||||||
|
Consolidated
|
$ | 122,272 | 15.80 | % | $ | 61,906 | 8.00 | % | N/A | N/A | ||||||||||||||
|
Bank
|
120,372 | 15.56 | 61,892 | 8.00 | $ | 77,365 | 10.00 | % | ||||||||||||||||
|
Tier 1 Capital to Risk Weighted Assets:
|
||||||||||||||||||||||||
|
Consolidated
|
112,591 | 14.55 | 30,953 | 4.00 | N/A | N/A | ||||||||||||||||||
|
Bank
|
110,693 | 14.31 | 30,946 | 4.00 | 46,419 | 6.00 | ||||||||||||||||||
|
Tier 1 Capital to Average Assets:
|
||||||||||||||||||||||||
|
Consolidated
|
112,591 | 7.19 | 62,670 | 4.00 | N/A | N/A | ||||||||||||||||||
|
Bank
|
110,693 | 7.06 | 62,703 | 4.00 | 78,378 | 5.00 | ||||||||||||||||||
Other Matters. The Corporation’s principal source of funds for dividend payments is dividends received from the Bank. Banking regulations limit the amount of dividends that may be paid by the Bank without prior approval of regulatory agencies. Under these regulations, the amount of dividends that the Bank may pay in any calendar year is limited to the current year’s net profits, combined with the retained net profits of the preceding two years, subject to the minimum capital requirements described above. During 2011, the Bank could, without prior approval, declare dividends of approximately $25,210,000 plus any 2011 net profits retained to the date of the dividend declaration.
Regulation D of the Board of Governors of The Federal Reserve System requires banks to maintain reserves against certain deposit balances. The Bank’s average reserve requirement for 2010 was approximately $8,914,000.
Under national banking laws and related statutes, the Bank is limited as to the amount it may loan to the Corporation, unless such loans are collateralized by specified obligations. At December 31, 2010, the maximum amount available for transfer from the Bank to the Corporation in the form of loans approximated $23,533,000.
NOTE I – SHAREHOLDER PROTECTION RIGHTS PLAN
On July 18, 2006, the Board of Directors of the Corporation (the “Board”) unanimously determined to renew the Corporation’s Shareholder Protection Rights Plan and declared a distribution of one right (“Right”) for each share of the Corporation’s common stock (the “Common Stock”) outstanding on August 1, 2006.
In the absence of an event of the type described below, the Rights will be evidenced by and trade with the Common Stock and will not be exercisable. However, the Rights will separate from the Common Stock and become exercisable following the earlier of (1) the tenth business day, or such later date as the Board may decide, after any person or persons (collectively referred to as “person”) commences a tender offer that would result in such person holding a total of 20% or more of the outstanding Common Stock, or (2) ten business days after, or such earlier or later date as the Board may decide, the announcement by the Corporation that any person has acquired 20% or more of the outstanding Common Stock.
51
When separated from the Common Stock, each Right will entitle the holder to purchase one share of Common Stock for $75 (the “Exercise Price”). However, in the event that the Corporation has announced that any person has acquired 20% or more of the outstanding Common Stock, the Rights owned by that person will be automatically void and each other Right will automatically become a right to buy, for the Exercise Price, that number of shares of Common Stock having a market value of twice the Exercise Price. Also, if any person acquires 20% or more of the outstanding Common Stock, the Board can require that, in lieu of exercise, each outstanding Right be exchanged for one share of Common Stock.
The Rights may be redeemed by action of the Board at a price of $.01 per Right at any time prior to announcement by the Corporation that any person has acquired 20% or more of the outstanding Common Stock. The Exercise Price and the number of Rights outstanding are subject to adjustment to prevent dilution. The Rights expire ten years from the date of their issuance.
NOTE J – STOCK-BASED COMPENSATION
The Corporation has two share-based compensation plans which are described below. The Corporation’s 2006 Stock Compensation Plan (the “2006 Plan”) was approved by its shareholders on April 18, 2006 as a successor to the 1996 Stock Option and Appreciation Rights Plan (the “1996 Plan”). The 2006 Plan permits the granting of stock options, stock appreciation rights, restricted stock, and restricted stock units (“RSUs”) to employees and non-employee directors for up to 600,000 shares of common stock of which 221,501 shares remain available for grant at December 31, 2010. The number of awards that can be granted under the 2006 Plan to any one person in any one fiscal year is limited to 70,000 shares. Under the terms of the 2006 Plan, stock options and stock appreciation rights can not have an exercise price that is less than 100% of the fair market value of one share of the underlying common stock on the date of grant. The terms and/or vesting of awards made under the 2006 Plan will be determined from time to time in accordance with rules adopted by the Corporation’s Compensation Committee and be in compliance with the applicable provisions, if any, of the Internal Revenue Code. Thus far, the Compensation Committee has used a five year vesting period and a ten year term for stock options granted under the 2006 Plan and has made the ability to convert RSUs into shares of common stock and the related conversion ratio contingent upon the financial performance of the Corporation in the third year of the three calendar year period beginning in the year in which the RSUs were awarded. Notwithstanding anything to the contrary in any award agreement, awards under the 2006 Plan will become immediately exercisable or will immediately vest, as the case may be, in the event of a change in control and, in accordance with the terms of the related award agreements, all awards granted to date under the 2006 Plan will become immediately exercisable or will immediately vest, as applicable, in the event of retirement or total and permanent disability, as defined, or death.
The Corporation’s 1996 Plan permitted the granting of stock options, with or without stock appreciation rights attached, and stand alone stock appreciation rights to employees and non-employee directors for up to 1,080,000 shares of common stock. The number of stock options and stock appreciation rights that could have been granted under the 1996 Plan to any one person in any one fiscal year was limited to 50,000. Each option granted under the 1996 Plan was granted at a price equal to the fair market value of one share of the Corporation’s stock on the date of grant. Options granted under the 1996 Plan on or before December 31, 2000 became exercisable in whole or in part commencing six months from the date of grant and ending ten years after the date of grant. Options granted under the 1996 Plan in January 2005 became exercisable in whole or in part commencing ninety days from the date of grant and ending ten years after the date of grant. By the terms of their grant, all other options under the 1996 Plan were granted with a three year vesting period and a ten year expiration date. However, vesting was subject to acceleration in the event of a change in control, retirement, death, disability, and certain other limited circumstances.
Fair Value of Stock Option Awards. The grant date fair value of option awards is estimated on the date of grant using the Black-Scholes option pricing model. The fair values of awards made in 2010, 2009 and 2008, as well as the assumptions utilized in determining such values, are as follows:
|
2010
|
2009
|
2008
|
||||||||||
|
Grant date fair value
|
$ 9.13 | $ 7.79 | $ 6.72 | |||||||||
|
Expected volatility
|
47.68 | % | 47.08 | % | 45.42 | % | ||||||
|
Expected dividends
|
3.19 | % | 3.21 | % | 3.24 | % | ||||||
|
Expected term (in years)
|
6.82 | 6.82 | 6.82 | |||||||||
|
Risk-free interest rate
|
2.34 | % | 1.52 | % | 3.49 | % | ||||||
Expected volatility was based on historical volatility for the expected term of the options. The Corporation used historical data to estimate the expected term of options granted. The risk-free interest rate is the implied yield at the time of grant on U.S. Treasury zero-coupon issues with a remaining term equal to the expected term of the options.
52
Fair Value of Restricted Stock Units. The fair value of restricted stock units is based on the market price of the shares underlying the awards on the grant date, discounted for dividends which are not paid on restricted stock units.
Compensation Expense. Compensation expense for stock options is recognized ratably over the five-year vesting period or the period from the grant date to the participant’s eligible retirement date, whichever is shorter. Compensation expense for RSUs is recognized over the three-year performance period and adjusted periodically throughout the period to reflect the estimated number of shares of the Corporation’s common stock into which the RSUs will ultimately be convertible. However, if the period between the grant date and the grantee’s eligible retirement date is less than three years, compensation expense is recognized ratably over this shorter period. In determining compensation expense for options and RSUs outstanding and not yet vested, the Corporation assumes, based on prior experience, that no forfeitures will occur. The Corporation recorded compensation expense for share-based payments of $647,000, $681,000 and $450,000 in 2010, 2009 and 2008, respectively, and related income tax benefits of $257,000, $270,000 and $178,000, respectively.
Stock Option Activity. On January 19, 2010, the Board granted 50,649 nonqualified stock options under the 2006 Plan. The options were granted at a price equal to the fair market value of one share of the Corporation’s stock on the date of grant.
A summary of options outstanding under the Corporation’s stock compensation plans as of December 31, 2010 and changes during the year then ended is presented below.
|
Number of Options
|
Weighted- Average Exercise Price
|
Weighted- Average Remaining Contractual Term (yrs.)
|
Aggregate Intrinsic Value (in thousands)
|
|||||||||||||
|
Outstanding at January 1, 2010
|
496,719 | $ | 19.71 | |||||||||||||
|
Granted
|
50,649 | 25.07 | ||||||||||||||
|
Exercised
|
(45,028 | ) | 15.02 | |||||||||||||
|
Forfeited or expired
|
(26,245 | ) | 19.74 | |||||||||||||
|
Outstanding at December 31, 2010
|
476,095 | $ | 20.72 | 5.36 | $ | 3,826 | ||||||||||
|
Exercisable at December 31, 2010
|
313,129 | $ | 20.04 | 4.16 | $ | 2,731 | ||||||||||
The total intrinsic value of options exercised in 2010, 2009 and 2008 was $477,000, $556,000 and $232,000, respectively.
Restricted Stock Activity. On January 19, 2010, the Corporation’s Board of Directors granted 15,985 RSUs under the 2006 Plan. The Corporation’s financial performance for 2012 will determine the number of shares of common stock, if any, into which the RSUs will ultimately be converted. In the table that follows, the number of RSUs granted represents the maximum number of shares into which the RSUs can be converted. A summary of the status of the Corporation’s nonvested shares as of December 31, 2010 and changes during the year then ended is presented below.
|
Number of Shares
|
Weighted- Average Grant-Date Fair Value
|
|||||||
|
Nonvested at January 1, 2010
|
42,360 | $ | 18.49 | |||||
|
Granted
|
15,985 | 22.69 | ||||||
|
Vested
|
(19,614 | ) | 17.04 | |||||
|
Forfeited
|
(5,460 | ) | 19.01 | |||||
|
Nonvested at December 31, 2010
|
33,271 | $ | 21.32 | |||||
The total fair value of RSUs vested during the years ended December 31, 2010, 2009 and 2008 was $558,000, $353,000 and $26,000, respectively.
Unrecognized Compensation Cost. As of December 31, 2010, there was $1,152,000 of total unrecognized compensation cost related to nonvested equity awards. The cost is expected to be recognized over a weighted-average period of 2.68 years.
53
Cash Received and Tax Benefits Realized. Cash received from option exercises in 2010, 2009 and 2008 was $676,000, $901,000 and $525,000, respectively. The actual tax benefit realized for the tax deductions from option exercises in 2010, 2009 and 2008 was $39,000, $66,000 and $21,000, respectively.
Other. No cash was used to settle stock options in 2010, 2009 or 2008. The Corporation uses newly issued shares to settle stock option exercises and for the conversion of RSUs.
NOTE K – RETIREMENT PLANS
The Bank has a 401(k) plan, defined benefit pension plan and supplemental executive retirement plan. Employees are immediately eligible to participate in the 401(k) plan provided they are at least 18 years of age. Participants may elect to contribute, on a tax-deferred basis, up to 100% of gross compensation, as defined, subject to the limitations of Section 401(k) of the Internal Revenue Code. The Bank may, at its sole discretion, make matching contributions to each participant's account based on the amount of the participant's tax deferred contributions. Participants are fully vested in their elective contributions and, after five years of participation in the 401(k) plan, are fully vested (20% vesting per year) in the matching contributions, if any, made by the Bank. Matching contributions were $306,000, $325,000 and $291,000 for 2010, 2009 and 2008, respectively.
The provisions of the Bank’s defined benefit pension plan (the “Pension Plan” or the “Plan”) are governed by the rules and regulations contained in the Prototype Plan of the New York State Bankers Retirement System (the “Retirement System”) and the Retirement System Adoption Agreement executed by the Bank. The Retirement System is overseen by a Board of Trustees (the “Trustees”) who meet quarterly and, among other things, set the investment policy guidelines. For investment purposes, the Pension Plan’s contributions are pooled with the contributions of the other participants in the Retirement System. Assets of the Pension Plan are invested in various debt and equity securities as set forth in this note under the captions “Plan Assets” and “Fair Value of Plan Assets.” Employees are eligible to participate in the Pension Plan after attaining 21 years of age and completing 12 full months of service. Pension benefits are generally based on a percentage of average annual compensation during the period of creditable service. The Bank makes annual contributions to the Pension Plan in an amount sufficient to fund these benefits and participants contribute 2% of their compensation. The Bank’s funding method, the unit credit actuarial cost method, is consistent with the funding requirements of federal law and regulations. Employees become fully vested after four years of participation in the Pension Plan (no vesting occurs during the four-year period).
Significant Actuarial Assumptions. The following tables set forth the significant actuarial assumptions used to determine the benefit obligations at year-end 2010, 2009 and 2008 and the benefit cost for each of the Plan years then ended.
|
Weighted average assumptions used to determine the benefit obligation at year end
|
2010
|
2009
|
2008
|
|||||||||
|
Discount rate
|
5.69% | 5.89% | 6.00% | |||||||||
|
Rate of increase in compensation levels
|
3.50% | 3.50% | 3.50% | |||||||||
|
Weighted average assumptions used to determine net pension cost
|
2010
|
2009
|
2008
|
|||||||||
|
Discount rate
|
5.89% | 6.00% | 5.75% | |||||||||
|
Rate of increase in compensation levels
|
3.50% | 3.50% | 5.00% | |||||||||
|
Expected long-term rate of return on plan assets
|
7.50% | 7.50% | 7.00% | |||||||||
Net Pension Cost. The following table sets forth the components of net periodic pension cost.
|
2010
|
2009
|
2008
|
||||||||||
|
(in thousands)
|
||||||||||||
|
Service cost, net of plan participant contributions
|
$ | 1,200 | $ | 1,074 | $ | 1,014 | ||||||
|
Interest cost
|
1,190 | 1,103 | 910 | |||||||||
|
Expected return on plan assets
|
(1,792 | ) | (1,218 | ) | (1,368 | ) | ||||||
|
Amortization of prior service cost
|
23 | 23 | 20 | |||||||||
|
Amortization of net actuarial loss
|
322 | 635 | - | |||||||||
|
Net pension cost
|
$ | 943 | $ | 1,617 | $ | 576 | ||||||
The estimated prior service costs and net actuarial loss for the defined benefit pension plan that will be amortized from accumulated other comprehensive income into net periodic benefit cost in 2011 are $23,000 and $355,000, respectively.
54
Funded Status of the Plan. The following table sets forth the change in the projected benefit obligation and Plan assets for each year and, as of the end of each year, the funded status of the Plan and accumulated benefit obligation.
|
2010
|
2009
|
2008
|
||||||||||
|
Change in projected benefit obligation
|
(in thousands)
|
|||||||||||
|
Projected benefit obligation at beginning of year
|
$ | 20,605 | $ | 18,744 | $ | 16,139 | ||||||
|
Service cost before plan participant contributions
|
1,444 | 1,284 | 1,551 | |||||||||
|
Expenses
|
(174 | ) | (139 | ) | (183 | ) | ||||||
|
Interest cost
|
1,190 | 1,103 | 1,137 | |||||||||
|
Benefits paid
|
(746 | ) | (646 | ) | (794 | ) | ||||||
|
Assumption changes
|
563 | 277 | 428 | |||||||||
|
Experience loss (gain) and other
|
890 | (18 | ) | 466 | ||||||||
|
Projected benefit obligation at end of year
|
23,772 | 20,605 | 18,744 | |||||||||
|
Change in fair value of plan assets
|
||||||||||||
|
Fair value of plan assets at beginning of year
|
24,307 | 16,030 | 19,864 | |||||||||
|
Actual return on plan assets
|
2,267 | 3,352 | (5,567 | ) | ||||||||
|
Employer contributions
|
3,742 | 5,500 | 2,427 | |||||||||
|
Plan participant contributions
|
244 | 210 | 283 | |||||||||
|
Benefits paid
|
(746 | ) | (646 | ) | (794 | ) | ||||||
|
Expenses
|
(174 | ) | (139 | ) | (183 | ) | ||||||
|
Fair value of plan assets at end of year
|
29,640 | 24,307 | 16,030 | |||||||||
|
Funded status at end of year
|
$ | 5,868 | $ | 3,702 | $ | (2,714 | ) | |||||
|
Accumulated Benefit Obligation
|
$ | 21,620 | $ | 18,417 | $ | 16,404 | ||||||
The information presented for 2008 in the above table is as of and for the fifteen month period ended December 31, 2008.
For the Plan year ending September 30, 2011, the Bank has no minimum required pension contribution and a maximum tax deductible contribution of $4,201,000. The Bank expects to make a contribution within that range by December 31, 2011, but the amount of such contribution has not yet been determined.
The net actuarial loss and prior service cost included in accumulated other comprehensive income as of December 31 are as follows:
|
2010
|
2009
|
|||||||
|
(in thousands)
|
||||||||
|
Net actuarial loss
|
$ | (6,099 | ) | $ | (5,443 | ) | ||
|
Prior service cost
|
(86 | ) | (109 | ) | ||||
| $ | (6,185 | ) | $ | (5,552 | ) | |||
Plan Assets. The Retirement System's overall investment strategy is to have approximately 97% of its investments for long-term growth and 3% for near-term benefit payments, with a wide diversification of asset types, fund strategies, and fund managers. The target allocations for Plan assets are shown in the table that follows.
The weighted average expected long-term rate of return is estimated based on current trends in the Plan assets as well as expected future rates of returns on those assets. The following methodologies were used in determining the long-term rate of return:
|
|
·
|
Equity securities - dividend discount model, the smoothed earnings yield model and the equity risk premium model.
|
|
|
·
|
Fixed income securities - current yield-to-maturity and forecasts of future yields.
|
|
|
·
|
Other financial instruments – applying judgment to a comparison of the specific investment’s risk to that of fixed income and equity instruments.
|
The long-term rate of return considers historical returns and adjusts them to reflect future expectations. Such adjustments are based on, among other things, forecasts by economists of long-term inflation and GDP growth, earnings growth and per capita income.
55
The Plan is currently prohibited from investing in the following instruments:
|
|
·
|
Equity securities – securities in emerging market countries as defined by the Morgan Stanley Emerging Markets Index, short sales, unregistered securities and margin purchases.
|
|
|
·
|
Fixed income securities – securities of BBB quality or less, CMOs that have an inverse floating rate and whose payments don’t include principal, commercial MBSs or commercial property mortgages which aren’t certified or guaranteed by the U.S. Government, asset backed securities that aren’t issued or guaranteed by the U.S. or its agencies or instrumentalities, non-agency residential subprime or alt-A mortgage-backed securities and structured notes.
|
|
|
·
|
Other financial instruments – unhedged currency exposure in countries not defined as “high income economies” by the World Bank.
|
The following table sets forth the Plan asset allocations at December 31, 2010 and 2009 versus the target allocations and the expected long-term rate of return by asset category.
|
Target Allocation
|
Percentage of Plan Assets at December 31,
|
Weighted Average Expected Long-term Rates of Return
|
||||||||||||||
|
2010
|
2009
|
|||||||||||||||
|
Cash equivalents
|
0% - 20% | 11.2 | % | 13.8 | % | .15% | ||||||||||
|
Equity securities
|
40% - 60% | 48.2 | % | 45.7 | % | 10.00% | ||||||||||
|
Fixed income securities
|
40% - 60% | 40.6 | % | 40.5 | % | 5.00% | ||||||||||
|
Other financial instruments
|
0% - 5% | - | - | - | ||||||||||||
| 100.0 | % | 100.0 | % |
7% to 8%
|
||||||||||||
Fair Value of Plan Assets. The fair value of the Plan assets at December 31, 2010 and 2009, by asset category, is summarized below.
|
Fair Value Measurements at December 31, 2010 Using:
|
||||||||||||||||
|
Total
|
Quoted Prices in Active Markets for Identical Assets
(Level 1)
|
Significant Other Observable Inputs
(Level 2)
|
Significant Unobservable Inputs
(Level 3)
|
|||||||||||||
|
Cash equivalents:
|
(in thousands)
|
|||||||||||||||
|
Short term investment funds
|
$ | 3,265 | $ | - | $ | 3,265 | $ | - | ||||||||
|
Foreign currencies
|
64 | 64 | - | - | ||||||||||||
|
Total cash equivalents
|
3,329 | 64 | 3,265 | - | ||||||||||||
|
Equities:
|
||||||||||||||||
|
U.S. large cap
|
8,265 | 8,265 | - | - | ||||||||||||
|
U.S. mid cap
|
844 | 844 | - | - | ||||||||||||
|
U.S. small cap
|
62 | 62 | - | - | ||||||||||||
|
International
|
5,126 | 5,126 | - | - | ||||||||||||
|
Total equities
|
14,297 | 14,297 | - | - | ||||||||||||
|
Fixed income securities:
|
||||||||||||||||
|
Corporate bonds:
|
||||||||||||||||
|
Rated single A or higher by S&P
|
1,617 | - | 1,617 | - | ||||||||||||
|
Rated below single A by S&P
|
1,135 | - | 1,135 | - | ||||||||||||
|
Government issues
|
8,617 | - | 8,617 | - | ||||||||||||
|
Collateralized mortgage obligations:
|
||||||||||||||||
|
Rated single A or higher by S&P
|
445 | - | 445 | - | ||||||||||||
|
Rated below single A by S&P
|
200 | - | 200 | - | ||||||||||||
|
Total fixed income securities
|
12,014 | - | 12,014 | - | ||||||||||||
|
Total Plan Assets
|
$ | 29,640 | $ | 14,361 | $ | 15,279 | $ | - | ||||||||
56
|
Fair Value Measurements at December 31, 2009 Using:
|
||||||||||||||||
|
Total
|
Quoted Prices in Active Markets for Identical Assets
(Level 1)
|
Significant Other Observable Inputs
(Level 2)
|
Significant Unobservable Inputs
(Level 3)
|
|||||||||||||
|
Cash equivalents:
|
(in thousands)
|
|||||||||||||||
|
Short term investment funds
|
$ | 3,283 | $ | - | $ | 3,283 | $ | - | ||||||||
|
Foreign currencies
|
84 | 84 | - | - | ||||||||||||
|
Total cash equivalents
|
3,367 | 84 | 3,283 | - | ||||||||||||
|
Equities:
|
||||||||||||||||
|
U.S. large cap
|
5,926 | 5,926 | - | - | ||||||||||||
|
U.S. mid cap
|
212 | 212 | - | - | ||||||||||||
|
U.S. small cap
|
61 | 61 | - | - | ||||||||||||
|
International
|
4,914 | 4,914 | - | - | ||||||||||||
|
Total equities
|
11,113 | 11,113 | - | - | ||||||||||||
|
Fixed income securities:
|
||||||||||||||||
|
Corporate bonds:
|
||||||||||||||||
|
Rated single A or higher by S&P
|
1,261 | - | 1,261 | - | ||||||||||||
|
Rated below single A by S&P
|
1,049 | - | 1,049 | - | ||||||||||||
|
Government issues
|
6,794 | - | 6,794 | - | ||||||||||||
|
Collateralized mortgage obligations:
|
||||||||||||||||
|
Rated single A or higher by S&P
|
452 | - | 452 | - | ||||||||||||
|
Rated below single A by S&P
|
135 | - | 135 | - | ||||||||||||
|
Other fixed income securities
|
136 | - | 136 | - | ||||||||||||
|
Total fixed income securities
|
9,827 | - | 9,827 | - | ||||||||||||
|
Total Plan Assets
|
$ | 24,307 | $ | 11,197 | $ | 13,110 | $ | - | ||||||||
The definition of Level 1, 2 and 3 fair value measurements is included in Note N to these consolidated financial statements.
At December 31, 2010, the Plan’s short term investment funds were invested in the State Street Bank & Trust Company Short Term Investment Fund. This represented approximately 11.0% of the Plan’s investments.
Estimated Future Benefit Payments. The following benefit payments, which reflect expected future service as appropriate, are expected to be made by the Plan.
|
Year
|
Amount
|
|||
|
(in thousands)
|
||||
|
2011
|
$ | 995 | ||
|
2012
|
1,119 | |||
|
2013
|
1,267 | |||
|
2014
|
1,428 | |||
|
2015
|
1,564 | |||
|
2016-2020
|
9,750 | |||
The Bank’s Supplemental Executive Retirement Plan (“SERP”) currently covers the Bank’s CEO. The benefit under the SERP is equal to the additional amount that the CEO would be entitled to under the Pension and 401(k) plans in the absence of Internal Revenue Code limitations. SERP expense was $126,000, $74,000 and $150,000 in 2010, 2009 and 2008, respectively.
NOTE L – OTHER OPERATING EXPENSES
Expenses included in other operating expenses which exceed one percent of the aggregate of total interest income and noninterest income in one or more of the years shown are as follows:
|
2010
|
2009
|
2008
|
||||||||||
|
(in thousands)
|
||||||||||||
|
FDIC assessment
|
$ | 1,909 | $ | 2,188 | $ | 558 | ||||||
|
Computer services
|
1,728 | 1,507 | 1,229 | |||||||||
57
NOTE M – COMMITMENTS AND CONTINGENT LIABILITIES
Financial Instruments With Off-Balance-Sheet Risk. The Bank is a party to financial instruments with off-balance-sheet risk in the normal course of business to meet the financing needs of its customers. These financial instruments include commitments to extend credit, standby letters of credit, and commercial letters of credit. These instruments involve, to varying degrees, elements of credit risk in excess of the amount recognized in the consolidated balance sheets.
The Bank's exposure to credit loss in the event of nonperformance by the other party to financial instruments for commitments to extend credit, standby letters of credit, and commercial letters of credit is represented by the contractual notional amount of these instruments. The Bank uses the same credit policies in making commitments to extend credit and generally uses the same credit policies for letters of credit as it does for on-balance-sheet instruments. At December 31, financial instruments whose contract amounts represent credit risk are as follows:
|
2010
|
2009
|
|||||||||||||||
|
Fixed Rate
|
Variable Rate
|
Fixed Rate
|
Variable Rate
|
|||||||||||||
|
(in thousands)
|
||||||||||||||||
|
Commitments to extend credit
|
$ | 22,715 | $ | 119,182 | $ | 22,638 | $ | 95,634 | ||||||||
|
Standby letters of credit
|
4,483 | - | 3,023 | - | ||||||||||||
|
Commercial letters of credit
|
314 | - | 435 | - | ||||||||||||
Commitments to extend credit are legally binding agreements to lend to a customer as long as there is no violation of any condition established in the contract. Unused home equity lines comprise a substantial portion of the Bank’s variable rate loan commitments. Since some of the commitments to extend credit are expected to expire without being drawn upon and, with respect to unused home equity lines, can be frozen, reduced or terminated by the Bank based on the financial condition of the borrower, the total commitment amounts do not necessarily represent future cash requirements. Home equity lines generally expire ten years from their date of origination, other real estate loan commitments generally expire within 60 days and commercial loan commitments generally expire within one year. At December 31, 2010, the Bank’s fixed rate loan commitments are to make loans with interest rates ranging from 4.00% to 5.00% and maturities ranging from 9 years to 30 years. The amount of collateral obtained, if any, by the Bank upon extension of credit is based on management’s credit evaluation of the borrower. Collateral held varies but may include mortgages on commercial and residential real estate, security interests in business assets, deposit accounts with the Bank or other financial institutions, and securities.
Standby letters of credit are conditional commitments issued by the Bank to assure the performance or financial obligations of a customer to a third party. The Bank's standby letters of credit extend through February 2012. The credit risk involved in issuing standby letters of credit is essentially the same as that involved in extending loans to customers. The Bank generally holds collateral and/or obtains personal guarantees supporting these commitments. The extent of collateral held for these commitments at December 31, 2010 varied from 0% to 100% and averaged 84%. Standby letters of credit are considered financial guarantees and are recorded at fair value.
Commercial letters of credit are conditional commitments issued by the Bank to assure the payment by a customer to a supplier. The credit risk involved in issuing commercial letters of credit is the same as that discussed in the preceding paragraph for standby letters of credit. The Bank generally holds collateral and/or obtains personal guarantees supporting these commitments. Collateral held for these commitments at December 31, 2010 was not significant. The commercial letters of credit outstanding at December 31, 2010 extend through March 2011.
Concentrations of Credit Risk. Most of the Bank’s loans, personal and commercial, are to borrowers who are domiciled on Long Island and in New York City, and most of the Bank's real estate loans involve mortgages on Long Island and New York City properties. In addition, the Bank’s loan portfolio includes multifamily commercial mortgages that amounted to approximately $208 million, or 23% of the total portfolio, at December 31, 2010. As a result, the income of many of the Bank’s borrowers and the value of and cash flows from collateral securing a majority of the Bank’s mortgage loans is largely dependent on the Long Island and New York City economies.
Employment Contracts. Currently, all of the Bank’s executive officers have employment contracts with the Corporation under which they are entitled to severance compensation in the event of an involuntary termination of employment or resignation of employment following a change in control. The terms of these contracts currently range from eighteen months to three years and, unless the Corporation gives written notice of non-extension within the time frames set forth in the contracts, are automatically extended at the expiration of each year for an additional period of one year, thus resulting in new terms of between eighteen months and three years. The current aggregate annual salaries provided for in these contracts is approximately $1,577,500.
58
Lease Commitments. At December 31, 2010, minimum annual rental commitments under noncancelable operating leases are as follows:
|
Year
|
Amount
|
|||
|
(in thousands)
|
||||
|
2011
|
$ | 1,486 | ||
|
2012
|
1,460 | |||
|
2013
|
1,113 | |||
|
2014
|
923 | |||
|
2015
|
784 | |||
|
Thereafter
|
3,590 | |||
| $ | 9,356 | |||
The Bank has various renewal options on the above leases. Rent expense, including amounts paid for real estate taxes and common area maintenance, was $1,431,000, $1,307,000 and $1,204,000 in 2010, 2009 and 2008, respectively.
NOTE N – FAIR VALUE OF FINANCIAL INSTRUMENTS
Financial Instruments Recorded at Fair Value. When measuring fair value, the Corporation uses a fair value hierarchy which is designed to maximize the use of observable inputs and minimize the use of unobservable inputs. The hierarchy involves three levels of inputs that may be used to measure fair value:
Level 1: Quoted prices (unadjusted) in active markets for identical assets or liabilities that the Corporation has the ability to access at the measurement date.
Level 2: Significant other observable inputs other than Level 1 prices such as quoted prices for similar assets or liabilities in active markets; quoted prices for identical or similar assets or liabilities in markets that are not active; or inputs other than quoted prices that are observable or can be corroborated by observable market data.
Level 3: Significant unobservable inputs that reflect the Corporation’s own assumptions about the assumptions that market participants would use in pricing an asset or liability.
The fair values of the Corporation’s investment securities designated as available-for-sale are currently determined on a recurring basis using matrix pricing (Level 2 inputs). Matrix pricing, which is a mathematical technique widely used in the industry to value debt securities, does not rely exclusively on quoted prices for the specific securities but rather on the relationship of such securities to other benchmark quoted securities.
The fair values of the Corporation’s available-for-sale securities are summarized below.
|
Fair Value Measurements at December 31, 2010 Using:
|
||||||||||||||||
|
Total
|
Quoted Prices in Active Markets for Identical Assets
(Level 1)
|
Significant Other Observable Inputs
(Level 2)
|
Significant Unobservable Inputs
(Level 3)
|
|||||||||||||
|
Available-for-Sale Securities:
|
(in thousands)
|
|||||||||||||||
|
U.S. government agencies
|
$ | 5,155 | $ | - | $ | 5,155 | $ | - | ||||||||
|
State and municipals
|
215,612 | - | 215,612 | - | ||||||||||||
|
Pass-through mortgage securities ..
|
80,471 | - | 80,471 | - | ||||||||||||
|
Collateralized mortgage obligations
|
351,877 | - | 351,877 | - | ||||||||||||
| $ | 653,115 | $ | - | $ | 653,115 | $ | - | |||||||||
|
Fair Value Measurements at December 31, 2009 Using:
|
||||||||||||||||
|
Total
|
Quoted Prices in Active Markets for Identical Assets
(Level 1)
|
Significant Other Observable Inputs
(Level 2)
|
Significant Unobservable Inputs
(Level 3)
|
|||||||||||||
|
Available-for-Sale Securities:
|
(in thousands)
|
|||||||||||||||
|
U.S. government agencies
|
$ | 5,008 | $ | - | $ | 5,008 | $ | - | ||||||||
|
State and municipals
|
154,513 | - | 154,513 | - | ||||||||||||
|
Pass-through mortgage securities
|
126,422 | - | 126,422 | - | ||||||||||||
|
Collateralized mortgage obligations
|
352,851 | - | 352,851 | - | ||||||||||||
| $ | 638,794 | $ | - | $ | 638,794 | $ | - | |||||||||
59
The Corporation’s assets measured at fair value on a nonrecurring basis are summarized below.
|
Fair Value Measurements Using:
|
||||||||||||||||
|
Total
|
Quoted Prices in Active Markets for Identical Assets
(Level 1)
|
Significant Other Observable Inputs
(Level 2)
|
Significant Unobservable Inputs
(Level 3)
|
|||||||||||||
|
Loan Held for Sale:
|
(in thousands)
|
|||||||||||||||
|
December 31, 2010
|
$ | 1,000 | $ | - | $ | 1,000 | $ | - | ||||||||
At December 31, 2010, the loan held for sale is nonaccruing and carried at the lower of cost or fair value. The loan has a cost basis of $1,300,000 and a related valuation allowance of $300,000. The fair value of this loan was determined using indications of interest from several potential buyers. The valuation allowance was established in 2010 through a charge to other noninterest income.
Financial Instruments Not Recorded at Fair Value. Fair value estimates are made at a specific point in time. Such estimates are generally subjective in nature and dependent upon a number of significant assumptions associated with each financial instrument or group of similar financial instruments, including estimates of discount rates, risks associated with specific financial instruments, estimates of future cash flows, and relevant available market information. Changes in assumptions could significantly affect the estimates. In addition, fair value estimates do not reflect the value of anticipated future business, premiums or discounts that could result from offering for sale at one time the Corporation’s entire holdings of a particular financial instrument, or the tax consequences of realizing gains or losses on the sale of financial instruments. The following table sets forth the carrying amounts and estimated fair values of financial instruments that are not recorded at fair value in the Corporation’s financial statements at December 31, 2010 and 2009.
|
2010
|
2009
|
|||||||||||||||
|
Carrying Amount
|
Fair Value
|
Carrying Amount
|
Fair Value
|
|||||||||||||
|
(in thousands)
|
||||||||||||||||
|
Financial Assets:
|
||||||||||||||||
|
Cash and cash equivalents
|
$ | 18,420 | $ | 18,420 | $ | 33,342 | $ | 33,342 | ||||||||
|
Held-to-maturity securities
|
86,578 | 89,760 | 128,979 | 133,233 | ||||||||||||
|
Loans
|
888,945 | 898,779 | 817,320 | 814,465 | ||||||||||||
|
Federal Home Loan Bank stock
|
7,688 | 7,688 | 7,882 | 7,882 | ||||||||||||
|
Restricted stocks (included in other assets)
|
467 | 467 | 467 | 467 | ||||||||||||
|
Accrued interest receivable
|
7,875 | 7,875 | 7,584 | 7,584 | ||||||||||||
|
Financial Liabilities:
|
||||||||||||||||
|
Checking deposits
|
386,797 | 386,797 | 333,853 | 333,853 | ||||||||||||
|
Savings and money market deposits
|
637,975 | 637,975 | 634,913 | 634,913 | ||||||||||||
|
Time deposits
|
268,166 | 274,460 | 308,784 | 315,073 | ||||||||||||
|
Short-term borrowings
|
61,590 | 61,590 | 111,407 | 111,407 | ||||||||||||
|
Long-term debt
|
192,000 | 205,718 | 162,000 | 173,981 | ||||||||||||
|
Accrued interest payable
|
3,027 | 3,027 | 2,019 | 2,019 | ||||||||||||
The following methods and assumptions are used by the Corporation in measuring the fair value of financial instruments disclosed in the preceding table.
Cash and cash equivalents. The recorded book value of cash and cash equivalents is their fair value.
Investment securities. Fair values are based on quoted prices for similar assets in active markets or derived principally from observable market data.
Loans. Fair values are estimated for portfolios of loans with similar financial characteristics. The total loan portfolio is first divided into adjustable and fixed rate interest terms. For adjustable rate loans that are subject to immediate repricing, the recorded book value less the related allowance for loan losses is a reasonable estimate of fair value. For adjustable rate loans that are subject to repricing over time and fixed rate loans, fair value is calculated by discounting anticipated future repricing amounts or cash flows using discount rates equivalent to the rates at which the Bank would currently make loans which are similar with regard to collateral, maturity, and the type of borrower. The discounted value of the repricing amounts and cash flows is reduced by the related allowance for loan losses to arrive at an estimate of fair value.
60
Federal Home Loan Bank stock. The recorded book value of Federal Home Loan Bank stock is its fair value because Federal Home Loan Bank of New York stock is redeemable at cost.
Deposit liabilities. The fair value of deposits with no stated maturity, such as checking deposits, money market deposits, and savings deposits, is equal to their recorded book value. The fair value of time deposits is based on the discounted value of contractual cash flows. The discount rate is equivalent to the rate currently offered by the Bank for deposits of similar size, type and maturity.
Borrowed funds. For short-term borrowings maturing within ninety days, the recorded book value is a reasonable estimate of fair value. The fair value of long-term debt, including repurchase agreements with embedded derivative instruments, is based on quoted prices for similar instruments in active markets or the discounted value of contractual cash flows. The discount rate is equivalent to the rate currently charged for borrowings of similar type and maturity.
Accrued interest receivable and payable. For these short-term instruments, the recorded book value is a reasonable estimate of fair value.
Off-balance-sheet Items. The fair value of off-balance sheet items is not considered to be material.
NOTE O – PARENT COMPANY FINANCIAL INFORMATION
Condensed financial information for The First of Long Island Corporation (parent company only) is as follows:
|
CONDENSED BALANCE SHEETS
|
December 31,
|
|||||||
|
2010
|
2009
|
|||||||
|
Assets:
|
(in thousands)
|
|||||||
|
Cash and due from banks
|
$ | 630 | $ | 2,484 | ||||
|
Investment in subsidiary bank, at equity
|
156,886 | 114,563 | ||||||
|
Prepaid income taxes
|
273 | 163 | ||||||
|
Deferred income tax benefits
|
820 | 693 | ||||||
|
Other assets
|
1 | 2 | ||||||
| $ | 158,610 | $ | 117,905 | |||||
|
Liabilities:
|
||||||||
|
Cash dividends payable
|
$ | 1,916 | $ | 1,443 | ||||
|
Stockholders' equity:
|
||||||||
|
Common stock
|
871 | 721 | ||||||
|
Surplus
|
35,526 | 2,043 | ||||||
|
Retained earnings
|
121,713 | 110,047 | ||||||
| 158,110 | 112,811 | |||||||
|
Accumulated other comprehensive income (loss) net of tax
|
(1,416 | ) | 3,651 | |||||
| 156,694 | 116,462 | |||||||
| $ | 158,610 | $ | 117,905 | |||||
61
|
CONDENSED STATEMENTS OF INCOME
|
Year ended December 31,
|
|||||||||||
|
2010
|
2009
|
2008
|
||||||||||
|
Income:
|
(in thousands)
|
|||||||||||
|
Dividends from subsidiary bank
|
$ | 3,750 | $ | 4,000 | $ | 11,100 | ||||||
|
Interest on deposits with subsidiary bank
|
7 | 26 | 43 | |||||||||
|
Other
|
- | - | 1 | |||||||||
| 3,757 | 4,026 | 11,144 | ||||||||||
|
Expenses:
|
||||||||||||
|
Salaries
|
647 | 681 | 450 | |||||||||
|
Other operating expenses
|
268 | 269 | 278 | |||||||||
| 915 | 950 | 728 | ||||||||||
|
Income before income taxes
|
2,842 | 3,076 | 10,416 | |||||||||
|
Income tax benefit
|
(360 | ) | (367 | ) | (272 | ) | ||||||
|
Income before undistributed earnings of subsidiary bank
|
3,202 | 3,443 | 10,688 | |||||||||
|
Equity in undistributed earnings
|
15,190 | 10,020 | 2,274 | |||||||||
|
Net income
|
$ | 18,392 | $ | 13,463 | $ | 12,962 | ||||||
|
CONDENSED STATEMENTS OF CASH FLOWS
|
Year ended December 31,
|
|||||||||||
|
2010
|
2009
|
2008
|
||||||||||
|
Cash Flows From Operating Activities:
|
(in thousands)
|
|||||||||||
|
Net income
|
$ | 18,392 | $ | 13,463 | $ | 12,962 | ||||||
|
Adjustments to reconcile net income to net cash provided by operating activities:
|
||||||||||||
|
Undistributed earnings of subsidiary bank
|
(15,190 | ) | (10,020 | ) | (2,274 | ) | ||||||
|
Deferred income tax credit
|
(127 | ) | (270 | ) | (168 | ) | ||||||
|
Stock-based compensation expense
|
647 | 681 | 450 | |||||||||
|
Decrease (increase) in prepaid income taxes
|
(110 | ) | (26 | ) | 23 | |||||||
|
Decrease in other assets
|
1 | - | - | |||||||||
|
Net cash provided by operating activities
|
3,613 | 3,828 | 10,993 | |||||||||
|
Cash Flows From Investing Activities:
|
||||||||||||
|
Contribution of capital to subsidiary bank
|
(32,200 | ) | - | - | ||||||||
|
Net cash used in investing activities
|
(32,200 | ) | - | - | ||||||||
|
Cash Flows From Financing Activities:
|
||||||||||||
|
Repurchase and retirement of common stock
|
(91 | ) | (957 | ) | (5,764 | ) | ||||||
|
Proceeds from exercise of stock options
|
676 | 901 | 525 | |||||||||
|
Tax benefit of stock options
|
39 | 66 | 21 | |||||||||
|
Proceeds from issuance of common stock
|
32,362 | - | - | |||||||||
|
Cash dividends paid
|
(6,253 | ) | (5,329 | ) | (4,575 | ) | ||||||
|
Net cash provided by (used in) financing activities
|
26,733 | (5,319 | ) | (9,793 | ) | |||||||
|
Net increase (decrease) in cash and cash equivalents*
|
(1,854 | ) | (1,491 | ) | 1,200 | |||||||
|
Cash and cash equivalents, beginning of year
|
2,484 | 3,975 | 2,775 | |||||||||
|
Cash and cash equivalents, end of year
|
$ | 630 | $ | 2,484 | $ | 3,975 | ||||||
|
Supplemental Schedule of Noncash Financing Activities:
|
||||||||||||
|
Cash dividends payable
|
$ | 1,916 | $ | 1,443 | $ | 1,295 | ||||||
*Cash and cash equivalents is defined as cash and due from banks and includes the checking and money market accounts with the Corporation’s wholly-owned bank subsidiary.
62
NOTE P – QUARTERLY FINANCIAL DATA (Unaudited)
|
First Quarter
|
Second Quarter
|
Third Quarter
|
Fourth Quarter
|
Total
|
||||||||||||||||
|
2010
|
(in thousands, except per share data)
|
|||||||||||||||||||
|
Interest income
|
$ | 18,343 | $ | 17,846 | $ | 17,988 | $ | 18,192 | $ | 72,369 | ||||||||||
|
Interest expense
|
4,714 | 4,057 | 3,949 | 4,054 | 16,774 | |||||||||||||||
|
Net interest income
|
13,629 | 13,789 | 14,039 | 14,138 | 55,595 | |||||||||||||||
|
Provision for loan losses
|
778 | 820 | 825 | 1,550 | 3,973 | |||||||||||||||
|
Noninterest income before net securities gains
|
1,595 | 1,567 | 1,793 | 1,293 | 6,248 | |||||||||||||||
|
Net gains on sales of securities
|
566 | 1,153 | - | - | 1,719 | |||||||||||||||
|
Noninterest expense
|
8,977 | 8,955 | 8,945 | 8,949 | 35,826 | |||||||||||||||
|
Income before income taxes
|
6,035 | 6,734 | 6,062 | 4,932 | 23,763 | |||||||||||||||
|
Income taxes
|
1,430 | 1,716 | 1,357 | 868 | 5,371 | |||||||||||||||
|
Net income
|
4,605 | 5,018 | 4,705 | 4,064 | 18,392 | |||||||||||||||
|
Earnings per share:
|
||||||||||||||||||||
|
Basic
|
.64 | .69 | .56 | .47 | 2.33 | |||||||||||||||
|
Diluted
|
.63 | .68 | .55 | .46 | 2.30 | |||||||||||||||
|
Comprehensive income (loss)
|
5,966 | 7,682 | 8,038 | (8,361 | ) | 13,325 | ||||||||||||||
|
2009
|
||||||||||||||||||||
|
Interest income
|
$ | 15,522 | $ | 15,752 | $ | 16,995 | $ | 18,005 | $ | 66,274 | ||||||||||
|
Interest expense
|
3,931 | 4,731 | 4,743 | 4,929 | 18,334 | |||||||||||||||
|
Net interest income
|
11,591 | 11,021 | 12,252 | 13,076 | 47,940 | |||||||||||||||
|
Provision for loan losses (credit)
|
(168 | ) | 274 | 530 | 3,649 | 4,285 | ||||||||||||||
|
Noninterest income before net securities gains
|
1,576 | 1,575 | 1,561 | 1,626 | 6,338 | |||||||||||||||
|
Net gains on sales of securities
|
- | 947 | 317 | 164 | 1,428 | |||||||||||||||
|
Noninterest expense
|
8,259 | 8,948 | 8,528 | 9,105 | 34,840 | |||||||||||||||
|
Income before income taxes
|
5,076 | 4,321 | 5,072 | 2,112 | 16,581 | |||||||||||||||
|
Income taxes
|
1,148 | 913 | 1,167 | (110 | ) | 3,118 | ||||||||||||||
|
Net income
|
3,928 | 3,408 | 3,905 | 2,222 | 13,463 | |||||||||||||||
|
Earnings per share:
|
||||||||||||||||||||
|
Basic
|
.55 | .47 | .54 | .31 | 1.87 | |||||||||||||||
|
Diluted
|
.54 | .47 | .53 | .30 | 1.84 | |||||||||||||||
|
Comprehensive income (loss)
|
6,197 | 1,695 | 11,199 | (375 | ) | 18,716 | ||||||||||||||
63
REPORT OF INDEPENDENT REGISTERED PUBLIC ACCOUNTING FIRM
The First of Long Island Corporation
Glen Head, New York
We have audited the accompanying consolidated balance sheets of The First of Long Island Corporation as of December 31, 2010 and 2009, and the related statements of income, changes in stockholders' equity, and cash flows for each of the years in the three-year period ended December 31, 2010. We also have audited The First of Long Island Corporation’s internal control over financial reporting as of December 31, 2010, based on criteria established in Internal Control – Integrated Framework issued by the Committee of Sponsoring Organizations of the Treadway Commission (COSO). The First of Long Island Corporation’s management is responsible for these financial statements, for maintaining effective internal control over financial reporting, and for its assessment of the effectiveness of internal control over financial reporting, included in the accompanying Management’s Report on Internal Control over Financial Reporting. Our responsibility is to express an opinion on these consolidated financial statements and an opinion on the company's internal control over financial reporting based on our audits.
We conducted our audits in accordance with the standards of the Public Company Accounting Oversight Board (United States). Those standards require that we plan and perform the audits to obtain reasonable assurance about whether the consolidated financial statements are free of material misstatement and whether effective internal control over financial reporting was maintained in all material respects. Our audits of the consolidated financial statements included examining, on a test basis, evidence supporting the amounts and disclosures in the consolidated financial statements, assessing the accounting principles used and significant estimates made by management, and evaluating the overall financial statement presentation. Our audit of internal control over financial reporting included obtaining an understanding of internal control over financial reporting, assessing the risk that a material weakness exists, and testing and evaluating the design and operating effectiveness of internal control based on the assessed risk. Our audits also included performing such other procedures as we considered necessary in the circumstances. We believe that our audits provide a reasonable basis for our opinions.
A company's internal control over financial reporting is a process designed to provide reasonable assurance regarding the reliability of financial reporting and the preparation of financial statements for external purposes in accordance with generally accepted accounting principles. A company's internal control over financial reporting includes those policies and procedures that (1) pertain to the maintenance of records that, in reasonable detail, accurately and fairly reflect the transactions and dispositions of the assets of the company; (2) provide reasonable assurance that transactions are recorded as necessary to permit preparation of financial statements in accordance with generally accepted accounting principles, and that receipts and expenditures of the company are being made only in accordance with authorizations of management and directors of the company; and (3) provide reasonable assurance regarding prevention or timely detection of unauthorized acquisition, use, or disposition of the company's assets that could have a material effect on the consolidated financial statements.
Because of its inherent limitations, internal control over financial reporting may not prevent or detect misstatements. In addition, projections of any evaluation of effectiveness to future periods are subject to the risk that controls may become inadequate because of changes in conditions, or that the degree of compliance with the policies or procedures may deteriorate.
In our opinion, the consolidated financial statements referred to above present fairly, in all material respects, the financial position of The First of Long Island Corporation as of December 31, 2010 and 2009, and the results of its operations and its cash flows for each of the years in the three-year period ended December 31, 2010, in conformity with accounting principles generally accepted in the United States of America. Also in our opinion, The First of Long Island Corporation maintained, in all material respects, effective internal control over financial reporting as of December 31, 2010, based on criteria established in Internal Control – Integrated Framework issued by the Committee of Sponsoring Organizations of the Treadway Commission (COSO).
|
/s/Crowe Horwath LLP
|
|
|
Crowe Horwath LLP
|
Livingston, New Jersey
March 16, 2011
64
Officers & Official Staff
Officers - The First of Long Island Corporation
Michael N. Vittorio
President & Chief Executive Officer
Sallyanne K. Ballweg
Senior Vice President & Secretary
Mark D. Curtis
Senior Vice President & Treasurer
Brian J. Keeney
Senior Vice President
Richard Kick
Senior Vice President
Donald L. Manfredonia
Senior Vice President
Christopher Becker
Vice President
Wayne B. Drake
Assistant Treasurer
Kitty W. Craig
Chief Auditor
Official Staff - The First National Bank of Long Island
ADMINISTRATION
Michael N. Vittorio
President & Chief Executive Officer
Sallyanne K. Ballweg
Senior Executive Vice President
AUDITING
Kitty W. Craig
Vice President and Chief Auditor
BRANCH ADMINISTRATION
Richard P. Perro
Senior Vice President
Giuseppe Sparacino
Vice President
Linda Cutter
Vice President
Joseph Dioguardi
Vice President
Al Ghelarducci
Vice President
65
Genevieve D. Marchitto
Vice President
COMMERCIAL BANKING
James P. Johnis
Senior Vice President
NASSAU COUNTY REGIONAL OFFICE
Robert F. Eisen
Vice President
Dante D. Mancini
Vice President
Jane F. Reed
Vice President
SUFFOLK COUNTY REGIONAL OFFICE
Margaret M. Curran-Rusch
Vice President
Stephen Durso
Vice President
Richard B. Smith
Vice President
NEW YORK CITY REGIONAL OFFICE
Alessandro Scichilone
Vice President
PERSONAL BANKERS
Janine Chaisty
Vice President
Patricia A. DeMasi
Vice President
COMMERCIAL LENDING
Donald L. Manfredonia
Executive Vice President
Paul J. Daley
Senior Vice President
John G. Fitzpatrick
Vice President
Kevin J. Talty
Vice President
COMPLIANCE AND PROCEDURES
Louis A. Antoniello
Vice President
CREDIT DEPARTMENT
Anne Marie Stefanucci
Vice President
66
DATA PROCESSING
Jose Diaz
Vice President
DEPOSIT OPERATIONS
Carmela Lalonde
Assistant Cashier
FINANCE
Mark D. Curtis
Executive Vice President & Chief Financial Officer
Christopher Becker
Senior Vice President & Deputy Chief Financial Officer
Wayne B. Drake
Senior Vice President
Howard F. Hoeberlein
Senior Vice President & Controller
Matthew J. Mankowski
Vice President
GENERAL SERVICES
Daniel Sapanara
Vice President
HUMAN RESOURCES
Susan J. Hempton
Vice President
INFORMATION TECHNOLOGY SERVICES
Conrad Lissade
Vice President
INVESTMENT MANAGEMENT DIVISION
Brian J. Keeney
Executive Vice President
Josephine Buckley
Vice President
Jane Carmody
Vice President
Sharon E. Pazienza
Vice President
LOAN CENTER
Robert B. Jacobs
Vice President
Rose A. Florio
Vice President
67
MARKETING
Laura C. Ierulli
Vice President
OPERATIONS ADMINISTRATION
Richard Kick
Executive Vice President
Betsy Gustafson
Senior Vice President
RESIDENTIAL MORTGAGE
Frederick T. Hughes
Vice President
COUNSEL
Schupbach, Williams & Pavone LLP
INDEPENDENT AUDITORS
Crowe Horwath LLP
ANNUAL REPORT ON FORM 10-K
A copy of the Corporation’s annual report on Form 10-K for 2010, filed with the Securities and Exchange Commission, may be obtained without charge upon written request to Mark D. Curtis, Senior Vice President and Treasurer, The First of Long Island Corporation, 10 Glen Head Road, PO Box 67, Glen Head, New York 11545-0067.
EXECUTIVE OFFICE
The First of Long Island Corporation
10 Glen Head Road
Glen Head, New York 11545
(516) 671-4900
www.fnbli.com
TRANSFER AGENT AND REGISTRAR
Registrar and Transfer Company
10 Commerce Drive
Cranford, New Jersey 07016-3572
(800) 368-5948
www.rtco.com
ANNUAL MEETING NOTICE
The Annual Meeting of Stockholders will be held at The Carltun, Eisenhower Park, East Meadow, New York on Wednesday, April 20, 2011 at 3:30 P.M.
68
Business Advisory Board
[PHOTO OMITTED]
Joseph R. Albanese, Esq.
Managing Partner
Albanese & Albanese LLP
[PHOTO OMITTED]
Howard Annenberg
President & CEO
Shannen Promotions, Inc.
[PHOTO OMITTED]
Nicola Arena
Chairman & CEO
Mediterranean Shipping Co. (USA), Inc.
[PHOTO OMITTED]
Richard Arote Sr.
President
A.D.E. Systems, Inc./Air Distribution Enterprises, Inc.
[PHOTO OMITTED]
Thomas Burke
Chief Executive Officer
Ophthalmic Consultants of Long Island
[PHOTO OMITTED]
Michael DeVivo
President
MRZ Trucking Corporation
[PHOTO OMITTED]
Bernard Esquenet
Chief Executive Officer
The Ruhof Corporation
[PHOTO OMITTED]
Robert Giambalvo, CPA
President
Giambalvo, Giammarese & Stalzer, CPAs, P.C.
[PHOTO OMITTED]
Kevin J. Harding, Esq.
Partner
Harding and Harding
[PHOTO OMITTED]
Herbert Kotler, Esq.
[PHOTO OMITTED]
Melvin F. Lazar
Director
ParenteBeard, LLC
[PHOTO OMITTED]
Wallace Leinheardt, Esq.
Attorney
[PHOTO OMITTED]
Linda Levy, CPA
Tax Consultant
69
[PHOTO OMITTED]
James Lynch
Attorney
Lynch Legal Associates LLP
[PHOTO OMITTED]
John I. Martinelli
Principal
Owen Petersen & Co., LLP
[PHOTO OMITTED]
Susan Hirschfeld Mohr
President
J. W. Hirschfeld Agency, Inc.
[PHOTO OMITTED]
James Panos
Attorney at Law
[PHOTO OMITTED]
John G. Passarelli, M.D.
President & Medical Director
Long Island Eye Surgical Care, P.C.
[PHOTO OMITTED]
Jay Pitti
Chief Executive Officer
Merrick House & Gardens
[PHOTO OMITTED]
Melvin Schreiber, CPA
Managing Member
Moses & Schreiber
[PHOTO OMITTED]
Arthur C. Schupbach, Esq.
Partner
Schupbach, Williams & Pavone, LLP
[PHOTO OMITTED]
Frank Shahery
Vice President
Convermat Corporation
[PHOTO OMITTED]
Lloyd Straus
President & Chief Operating Officer
North American Partners in Anesthesia, LLP
[PHOTO OMITTED]
H. Craig Treiber
Area Chairman
The Treiber Insurance Group/AJG Risk Management Services
[PHOTO OMITTED]
Sal Turano
President
Abstracts Incorporated
70
[PHOTO OMITTED]
Arthur Ventura
President
Badge Agency, Inc.
[PHOTO OMITTED]
George J. Walsh
Attorney
Thompson Hine LLP
[PHOTO OMITTED]
Robert A. Wilkie, Esq.
Partner
Wilkie & Wilkie
[PHOTO OMITTED]
Mark Wurzel
President
Calico Cottage, Inc.
Business of the Corporation
The First of Long Island Corporation (“Corporation”) is a one-bank holding company organized under the laws of the State of New York. Its primary business is the operation of its sole subsidiary, The First National Bank of Long Island (“Bank”).
The Bank was organized in 1927 under national banking laws and became the sole subsidiary of the Corporation under a plan of reorganization effected April 30, 1984.
The Bank is a full service commercial bank which provides a broad range of financial services to individual, professional, corporate, institutional and government customers through its thirty-four branch system on Long Island and in Manhattan.
The Bank is subject to regulation and supervision of the Federal Reserve Board, the Comptroller of the Currency, and the Federal Deposit Insurance Corporation which also insures its deposits. The Comptroller of the Currency is the primary banking agency responsible for regulating the subsidiary Bank. In addition, the Corporation is subject to the regulations and supervision of the Federal Reserve Board and the Securities and Exchange Commission.
The First National Bank of Long Island
Where Everyone Knows Your Name ®
Long Island (516) 671-4900 Manhattan (212) 566-1500
www.fnbli.com
71