Attached files
| file | filename |
|---|---|
| 10-K - FORM 10-K - FEDERAL SIGNAL CORP /DE/ | c62191e10vk.htm |
| EX-23 - EX-23 - FEDERAL SIGNAL CORP /DE/ | c62191exv23.htm |
| EX-21 - EX-21 - FEDERAL SIGNAL CORP /DE/ | c62191exv21.htm |
| EX-4.E - EX-4.E - FEDERAL SIGNAL CORP /DE/ | c62191exv4we.htm |
| EX-4.F - EX-4.F - FEDERAL SIGNAL CORP /DE/ | c62191exv4wf.htm |
| EX-31.2 - EX-31.2 - FEDERAL SIGNAL CORP /DE/ | c62191exv31w2.htm |
| EX-31.1 - EX-31.1 - FEDERAL SIGNAL CORP /DE/ | c62191exv31w1.htm |
| EX-10.Z - EX-10.Z - FEDERAL SIGNAL CORP /DE/ | c62191exv10wz.htm |
| EX-32.2 - EX-32.2 - FEDERAL SIGNAL CORP /DE/ | c62191exv32w2.htm |
| EX-32.1 - EX-32.1 - FEDERAL SIGNAL CORP /DE/ | c62191exv32w1.htm |
| EX-10.AA - EX-10.AA - FEDERAL SIGNAL CORP /DE/ | c62191exv10waa.htm |
| EX-99.1 - EX-99.1 - FEDERAL SIGNAL CORP /DE/ | c62191exv99w1.htm |
Exhibit 99.2

| Federal Signal Q4 2010 Earnings Call Dennis Martin, President & CEO Bill Barker, Chief Financial Officer March 16, 2011 |

| 2 CEO Perspective Dennis Martin President & CEO Overview |

| 3 Q4 Charges Reported Q4 EPS, Continuing Operations ($2.55) EPS Impacts of Q4 Charges: Hearing Loss Settlement ($0.04) Restructuring & CEO Change ($0.02) Tax Valuation Allowance ($1.37) FSTech Intangible Impairment ($1.15) |

| 4 Q4 Orders Orders ($ Millions) Q4 2010 Q4 2010 Q3 2010 Change vs. Q4 2009 ESG $84 $79 +$5 +15% Bronto $29 $21 +$8 +1% SSG $52 $48 +$4 -3% FSTech* $22 $21 +$1 +20% Total FSS $187 $170 +$17 +7% * Includes Sirit and VES results in 2010. |

| 5 Q4 Results (Ex. Restructuring/Impairment) |

| 6 Cash Flow Summary YTD 2010 YTD 2009 Operating Cash Flow from Continuing Operations: Operating Cash Flow from Continuing Operations: Operating Cash Flow from Continuing Operations: Operating Cash Flow from Continuing Operations: (Loss) Income from Continuing Ops (Loss) Income from Continuing Ops (Loss) Income from Continuing Ops (Loss) Income from Continuing Ops (175.7) 23.1 Tax Valuation Tax Valuation 85.0 - Goodwill and Intangible Asset Impairment Goodwill and Intangible Asset Impairment Goodwill and Intangible Asset Impairment Goodwill and Intangible Asset Impairment Goodwill and Intangible Asset Impairment 78.9 - Depreciation and Amortization Depreciation and Amortization Depreciation and Amortization Depreciation and Amortization 19.2 14.7 Stock-based compensation expense Stock-based compensation expense Stock-based compensation expense Stock-based compensation expense 2.3 3.1 Pension Pension Pension Pension (1.0) (1.0) Primary Working Capital Primary Working Capital 29.1 21.1 Subtotal Operating Cash Flow Subtotal Operating Cash Flow Subtotal Operating Cash Flow 37.8 61.0 Capital Expenditures Capital Expenditures Capital Expenditures (12.8) (14.4) Asset Sales / Divestitures Asset Sales / Divestitures Asset Sales / Divestitures 1.9 4.0 Acquisitions Acquistions (97.3) (13.5) Dividends Dividends (13.3) (11.7) Proceeds from equity offering Proceeds from equity offering Proceeds from equity offering Proceeds from equity offering 71.2 - Other - 10.0 Net Cash Flow before Financing Net Cash Flow before Financing Net Cash Flow before Financing (12.5) (35.4) Cash Flow from Disc Ops Cash Flow from Disc Ops Cash Flow from Disc Ops (7.4) 39.0 |

| 7 Balance Sheet ($ Millions) ($ Millions) ($ Millions) December December 2010 2009 Cash Cash Cash 62.1 21.1 Other Current Assets Other Current Assets Other Current Assets 237.9 256.3 PP&E, net PP&E, net PP&E, net 63.2 64.2 Goodwill & Other Goodwill & Other Goodwill & Other 398.2 389.0 Mfg Assets Subtotal 761.4 730.6 Net Asset of Disc Ops Net Asset of Disc Ops Net Asset of Disc Ops 3.1 13.9 Net Assets Net Assets Net Assets 764.5 744.5 Current Liabilities (excl. debt) Current Liabilities (excl. debt) Current Liabilities (excl. debt) 136.6 122.3 Total Debt Total Debt Total Debt 262.4 201.6 Deferred Taxes & Other Deferred Taxes & Other Deferred Taxes & Other 126.4 76.0 Net Liabilities of Disc Operations Net Liabilities of Disc Operations Net Liabilities of Disc Operations 18.2 15.9 Equity Equity Equity 220.9 328.7 Liabilities & Equity Liabilities & Equity Liabilities & Equity 764.5 744.5 Net Debt Net Debt $ 200.3 $ 180.5 Debt / Capital Debt / Capital Debt / Capital 54% 38% Net Debt / Capital Net Debt / Capital Net Debt / Capital 48% 35% |

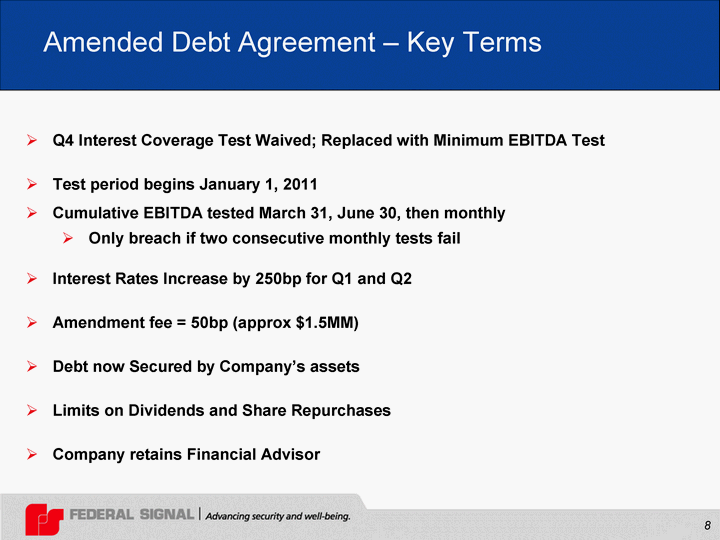
| 8 Amended Debt Agreement - Key Terms Q4 Interest Coverage Test Waived; Replaced with Minimum EBITDA Test Test period begins January 1, 2011 Cumulative EBITDA tested March 31, June 30, then monthly Only breach if two consecutive monthly tests fail Interest Rates Increase by 250bp for Q1 and Q2 Amendment fee = 50bp (approx $1.5MM) Debt now Secured by Company's assets Limits on Dividends and Share Repurchases Company retains Financial Advisor |

| 9 CEO Perspective Dennis Martin President & CEO |

| Federal Signal Q4 2010 Earnings Call Dennis Martin, President & CEO Bill Barker, Chief Financial Officer March 16, 2011 |
