Attached files
Table of Contents
UNITED STATES
SECURITIES AND EXCHANGE COMMISSION
WASHINGTON, D.C. 20549
FORM 10-K
(Mark One)
| x | ANNUAL REPORT PURSUANT TO SECTION 13 OR 15(d) OF THE SECURITIES EXCHANGE ACT OF 1934 |
For the fiscal year ended December 31, 2010
OR
| ¨ | TRANSITION REPORT PURSUANT TO SECTION 13 OR 15(d) OF THE SECURITIES EXCHANGE ACT OF 1934 |
For the transition period from to .
Commission File Number: 0-51142
UNIVERSAL TRUCKLOAD SERVICES, INC.
(Exact Name of Registrant as Specified in Its Charter)
| Michigan | 38-3640097 | |
| (State or Other Jurisdiction of Incorporation or Organization) |
(I.R.S. Employer Identification No.) |
12755 E. Nine Mile Road
Warren, Michigan 48089
(Address, including Zip Code of Principal Executive Offices)
(586) 920-0100
(Registrant’s telephone number, including area code)
Securities registered pursuant to section 12(b) of the Act: None
Securities registered pursuant to section 12(g) of the Act:
Common Stock, no par value
(TITLE OF CLASS)
Indicate by check mark if the registrant is a well-known seasoned issuer, as defined in Rule 405 of the Securities Act. Yes ¨ No x
Indicate by check mark if the registrant is not required to file reports pursuant to Section 13 or Section 15(d) of the Act. Yes ¨ No x
Indicate by check mark whether the registrant (1) has filed all reports required to be filed by Section 13 or 15(d) of the Securities Exchange Act of 1934 during the preceding 12 months (or for such shorter period that the registrant was required to file such reports), and (2) has been subject to such filing requirements for the past 90 days. Yes x No ¨
Indicate by checkmark whether the registrant has submitted electronically and posted on its corporate Website, if any, every Interactive Data File required to be submitted and posted pursuant to Rule 405 of Regulation S-T during the preceding 12 months (or for a shorter period that the registrant was required to submit and post such files). Yes x No ¨
Indicate by check mark if disclosure of delinquent filers pursuant to item 405 of Regulation S-K is not contained herein, and will not be contained, to the best of registrant’s knowledge, in definitive proxy or information statements incorporated by reference in Part III of this Form 10-K or any amendment to this Form 10-K. x
Indicate by check mark whether the registrant is a large accelerated filer, an accelerated filer, or a non-accelerated filer, or a smaller reporting company. See the definitions of “large accelerated filer”, “accelerated filer”, and “smaller reporting company” in Rule 12b-2 of the Exchange Act.
| Large Accelerated filer ¨ | Accelerated filer x | |
| Non-accelerated filer ¨ (Do not check if a smaller reporting company) | Smaller reporting company ¨ |
Indicate by check mark whether the registrant is a shell company (as defined in Exchange Act Rule 12b-2). Yes ¨ No x
As of July 3, 2010, the last business day of the registrant’s most recently completed second quarter, the aggregate market value of the registrant’s common stock held by non-affiliates of the registrant, based upon the closing sale price of the common stock on July 2, 2010, as reported by The Nasdaq Stock Market, was approximately $82.7 million (assuming, but not admitting for any purpose, that all directors and executive officers of the registrant are affiliates).
The number of shares of common stock, no par value, outstanding as of March 1, 2011, was 15,621,783.
DOCUMENTS INCORPORATED BY REFERENCE
Portions of the following document, to the extent specified in this report, are incorporated by reference in Part III of this report:
| Document | Incorporated by reference in: | |
| Proxy Statement for 2011 Annual Meeting of Shareholders | Part III, Items 10 - 14 |
Table of Contents
UNIVERSAL TRUCKLOAD SERVICES, INC.
2010 ANNUAL REPORT ON FORM 10-K
| PART I | ||||||
| Item 1. |
3 | |||||
| Item 1A. |
11 | |||||
| Item 1B. |
18 | |||||
| Item 2. |
18 | |||||
| Item 3. |
18 | |||||
| Item 4. |
18 | |||||
| PART II | ||||||
| Item 5. |
Market for Registrant’s Common Equity, Related Stockholder Matters and Issuer Purchases of Equity Securities | 19 | ||||
| Item 6. |
22 | |||||
| Item 7. |
Management’s Discussion and Analysis of Financial Condition and Results of Operations |
24 | ||||
| Item 7A. |
34 | |||||
| Item 8. |
35 | |||||
| Item 9. |
Changes in and Disagreements with Accountants on Accounting and Financial Disclosure |
63 | ||||
| Item 9A. |
63 | |||||
| Item 9B. |
65 | |||||
| PART III | ||||||
| Item 10. |
66 | |||||
| Item 11. |
66 | |||||
| Item 12. |
Security Ownership of Certain Beneficial Owners and Management and Related Stockholder Matters | 66 | ||||
| Item 13. |
Certain Relationships and Related Transactions, and Director Independence |
66 | ||||
| Item 14. |
67 | |||||
| PART IV | ||||||
| Item 15. |
68 | |||||
| 69 | ||||||
| EX-21.1 List of Subsidiaries |
||||||
| EX-23.1 Consent of KPMG |
||||||
| EX-31.1 Section 302 CEO Certification |
||||||
| EX-31.2 Section 302 CFO Certification |
||||||
| EX-32.1 Section 906 CEO and CFO Certification |
||||||
Table of Contents
DISCLOSURE REGARDING FORWARD-LOOKING STATEMENTS
Some of the statements and assumptions in this Form 10-K are forward-looking statements. These statements identify prospective information. Important factors could cause actual results to differ, possibly materially, from those in the forward-looking statements. In some cases you can identify forward-looking statements by words such as “anticipate,” “believe,” “could,” “estimate,” “plan,” “intend,” “may,” “should,” “will” and “would” or other similar words. You should read statements that contain these words carefully because they discuss our future expectations, contain projections of our future results of operations or of our financial position or state other “forward-looking” information. Forward-looking statements should not be read as a guarantee of future performance or results, and will not necessarily be accurate indications of the times at, or by which, such performance or results will be achieved. Forward-looking information is based on information available at the time and/or management’s good faith belief with respect to future events, and is subject to risks and uncertainties that could cause actual performance or results to differ materially from those expressed in the statements. The factors listed in the section captioned “Risk Factors” in Item 1A in this Form 10-K, as well as any other cautionary language contained in this Form 10-K, provide examples of risks, uncertainties and events that may cause our actual results to differ materially from the expectations we describe in our forward-looking statements.
Forward-looking statements speak only as of the date the statements are made. We assume no obligation to update forward-looking statements to reflect actual results, changes in assumptions or changes in other factors affecting forward-looking information except to the extent required by applicable securities laws. If we do update one or more forward-looking statements, no inference should be drawn that we will make additional updates with respect thereto or with respect to other forward-looking statements.
Unless the context indicates otherwise, “we,” “our” and “us” refers to Universal Truckload Services, Inc. and its subsidiaries.
PART I
Overview
We are primarily an asset-light provider of transportation services to shippers throughout the United States and in the Canadian provinces of Ontario and Quebec. Our over-the-road trucking services include both flatbed and dry van operations and we provide rail-truck and steamship-truck intermodal support services. We also offer truck brokerage services, which allow us to supplement our capacity and provide our customers with transportation of freight not handled by our owner-operators. In addition, we offer full service international freight forwarding and customs house brokerage services.
We primarily operate through a contractor network of agents and owner-operators who provide us with approximately 2,800 tractors and approximately 3,000 trailers. At December 31, 2010, the Company had approximately 660 agents. Customer relationships are primarily managed by our agents who solicit freight business directly from shippers and also provide dispatch and other services to our owner-operators. Our owner-operators own, operate and maintain substantially all of the tractors and over 50% of the trailers used in our business. Some of our owner-operators also act as fleet contractors and provide us with multiple tractors and drivers. In return for their services, we pay our agents and owner-operators fixed commissions based on a percentage of the revenue they generate for us. This network of agents and owner-operators allows us to minimize our investment in tractors and trailers, manage our sales effort in a manner we believe is more efficient than employing a large sales staff, and maximize the variable portion of our cost structure. In addition, through our brokerage operations, we are able to expand our capacity by arranging for other carriers to transport shipments when we generate more freight shipments than our owner-operators can service.
3
Table of Contents
We believe our commission schedule, prompt payment practices, industry reputation, financial stability, back office support and national freight network helps us to attract agents and owner-operators. In addition, we acquired the operations of 22 transportation companies between October 2000 and December 2010. We are continually evaluating new acquisition opportunities.
We were incorporated in Michigan on December 11, 2001. Our common stock began trading on the NASDAQ Global Select Market under the symbol “UACL” on February 11, 2005, the date of our initial public offering. Our principal executive offices are located at 12755 E. Nine Mile Road, Warren, Michigan 48089. Our website address is www.goutsi.com. The information contained on, or accessible through, our website is not a part of this Form 10-K.
Industry
According to the American Trucking Association, or ATA, the trucking industry was estimated at approximately $544.4 billion in revenue in 2009 and accounted for approximately 81.9% of domestic spending on freight transportation. The trucking industry is highly competitive on the basis of service and price and is necessary in many industries operating in the United States. Customers generally choose truck transportation over other surface transportation modes due to the industry’s higher levels of reliability, shipment integrity and speed.
The trucking industry includes both private fleets and for-hire’ carriers. Private fleets consist of trucks owned and operated by shippers that move their own goods and, according to the ATA, accounted for approximately $259.6 billion of revenue in 2009. For-hire carriers include both truckload and less-than truckload operations. We primarily operate in the highly fragmented for-hire truckload segment of this market, which according to the ATA generated revenues of approximately $284.8 billion in 2009. Truckload carriers dedicate an entire trailer to one customer from origin to destination and can be further classified by the trailing equipment they use to haul a customer’s freight, such as dry van, temperature-controlled, tank or flatbed.
Our primary source of revenue results from hauling flatbed and dry van freight, which during the year ended December 31, 2010 accounted for $509.0 million, or 84.0% of our revenues. We believe the truckload market offers significant opportunities for expansion by for-hire carriers, such as ourselves, because shippers increasingly are focused on operating within and conserving capital for their core competencies, which often do not include freight transportation. In our intermodal support services, which during the year ended December 31, 2010 accounted for $87.9 million or 14.5% of our revenues, we believe that third party logistics companies, railroads and ocean carriers are increasingly seeking efficiencies gained by using companies with greater service offerings, capacity and geographic coverage than the smaller private operators upon which they have historically relied.
Recent economic trends have led to a continuing consolidation of the truckload industry. We believe that the truckload market will continue to experience further consolidation due to a number of economic factors that have forced many smaller carriers to exit the business, merge or file for bankruptcy. These factors include rising insurance costs, scarcity of capital, volatility of fuel prices, increased prices for new environmentally friendly equipment, purchasing advantages available to larger carriers and customer demand for total service solutions that can only be provided by large carriers. As a result, we believe that larger, better-capitalized companies, like us, will have greater opportunities to gain market share and increase profit margins.
Asset Light Strategy
We primarily employ an asset light business model. Substantially all tractors and over 50% of trailers are provided by our owner-operators. In addition, our use of agents reduces our need for sizable terminals. The primary physical assets we provide to our agents and owner-operators include a portion of our trailer fleet, our intermodal depot facilities, our headquarters facility and our management information systems. We believe that
4
Table of Contents
our business model offers the following advantages compared with primarily asset-based trucking companies that own significant tractor fleets and use an employee sales force:
| • | Variable cost structure. We pay our agents and owner-operators a percentage of the revenue they generate, which gives us flexibility to quickly adjust to increases or decreases in customer demand. Additionally, having a high proportion of variable costs reduces our risks of making fixed payments on under-utilized equipment and personnel and minimizes our exposure to fluctuating equipment values. In 2010, approximately 84.7% of our total operating expenses were variable in nature. |
| • | Reduced capital expenditures. Limiting our investment in tractors and trailers reduces our capital needs and allows us to grow organically using relatively small amounts of cash. This allows us to conserve our financial resources to fund our expansion strategy, including acquisitions. Our operating revenues have grown from $213.3 million in 2001 to $605.9 million in 2010, reaching a maximum level of $759.5 million in 2008, while we have spent an aggregate of $104.8 million on capital expenditures over the same period of time, excluding property and equipment acquired in connection with the acquisitions of businesses. |
| • | Higher financial returns. Given similar operating performance, we believe that our low fixed costs and capital expenditure requirements will produce higher returns on our assets than many of our asset-based competitors. We manage our business with a view toward enhancing these returns. In 2010, we achieved a 4.7% return on average assets, excluding gains on the sales of marketable securities. |
| • | Entrepreneurial spirit. Our agents and owner-operators are business owners who are compensated based on the revenue they produce. We believe this model gives our agents a strong incentive to seek new revenue opportunities. In addition, we believe that our owner-operators have a greater incentive to operate their equipment more reliably, efficiently and safely than would be the case with employee drivers using employer-provided equipment. |
Although we believe our asset light business model is advantageous, there are certain disadvantages. Our use of owner-operators limits the pool of potential drivers and could constrain our growth. In addition, our variable cost structure does not allow us to take advantage of freight cycles as well as a fixed cost structure would. Thus, in times of very high economic activity and increasing freight rates, our profitability may not expand as much as that of an asset-based carrier. We share control over customer relationships with our agents and may be constrained in our ability to seek large national contracts. Overall, however, we believe our long experience with this business model and our growth, profitability, and financial returns demonstrate that we have adequately managed these risks.
Growth Strategy
We believe that our flexible business model offers us substantial opportunities to grow. By continuing to implement our strategy, we believe that we can continue to increase our revenues and profitability, while generating a higher return on assets than many of our asset-based competitors. The key elements of our strategy are as follows:
| • | Grow our brokerage operations. Our brokerage services have grown substantially, expanding to $148.0 million in operating revenues in 2010 from $25.7 million in 2001, a compound annual growth rate of 21.5%. In 2010, brokerage services accounted for 24.4% of our operating revenues. We encourage our agents to generate shipping contracts above the levels that can be accommodated by our owner-operators and provide the training and management information systems that enable our agents to broker these contracts to third party carriers. We intend to continue to grow this business both organically and through investments in management information systems and strategic acquisitions. |
| • | Make strategic acquisitions. Acquisitions have been an important part of our growth and we continually evaluate strategic acquisition opportunities. Our acquisition plan is to focus on targets that are primarily non-asset based, but we also will consider companies that derive a portion of their |
5
Table of Contents
| business from asset-based operations. Our predecessor began operations in 1981 when Universal Am-Can Ltd. was formed as an owner-operator and agent based carrier. Since then, we have successfully integrated 25 acquisitions, 22 of which we have consummated between October 2000 and December 2010. During each of the years ended December 31, 2010, 2009, and 2008 acquisition revenues totaled 10.3%, 4.2% and 5.1%, respectively, of our total revenue in each year. Our current growth is highly dependent upon being able to continue to make strategic acquisitions. Our operational integration strategy is to centralize administrative functions of acquired businesses at our headquarters, while maintaining the localized operations of the acquired businesses and maintaining the target’s network of agents and owner-operators. We believe that allowing most of our acquired businesses to continue to operate under their pre-acquisition names, in their original regions and with the same agents and owner-operators enables us to maintain the loyalty of the agents and owner-operators and continue pre-existing customer relationships. |
| • | Expand our network of agents and owner-operators. Increasing the number of agents and owner-operators has also been a driver of our historical growth. We intend to continue to recruit qualified agents and owner-operators in order to penetrate new markets and expand our operations in existing markets. Our agents typically focus on a small number of shippers in a particular market and are attuned to the specific transportation needs of that core group of shippers, while remaining alert to growth opportunities. With their detailed knowledge of local trucking markets, our agents serve as an excellent platform for recruiting additional owner-operators. In addition, we believe that the current environment of increasing costs and industry consolidation has created substantial uncertainty for agents, owner-operators and shippers. This uncertainty has led to a desire within these constituencies to associate themselves with a stable company that has an established market presence, and we have successfully converted small independent trucking companies into agents and owner-operators. |
| • | Expand our intermodal support services. Our intermodal support services have grown from $28.9 million in operating revenues in 2001 to $87.9 million in 2010, a compound annual growth rate of 13.2%. We intend to continue the growth of this business by expanding our service offerings, acquiring or renting additional intermodal facilities and also expanding our network of intermodal agents. We will evaluate future intermodal facility sites based on regional and international shipping volumes and market saturation. We currently operate eight full service container yards located in the mid-western and south-western United States and own over 475 chassis. Our facilities provide container and chassis inventory systems, full service repair facilities, and overhead lift capabilities. U.S. Customs has approved our Dearborn, Michigan facility as a container freight station. With the assistance of our container and chassis management services, we are able to offer steamship companies a neutral facility to store, repair, and track their equipment for future use. At our container freight station in Michigan, we can transfer bonded freight between overseas containers and other equipment for delivery to its final destination. We believe that providing container and chassis management as well as bonded customs services will allow us the opportunity to provide additional services for these customers. |
Our Operations
We conduct our operations through our eleven wholly owned operating subsidiaries under the brand names Universal Am-Can, Ltd., Mason & Dixon Lines, Inc., Economy Transport, Inc., Louisiana Transportation Inc., Mason Dixon Intermodal, Inc., Great American Lines, Inc., CrossRoad Carriers Inc., NYP of Michigan, Inc., Universal Logistics, Inc., D. Kratt International, and Cavalry Transportation, LLC.
We broadly group our services into the following three categories: truckload services, brokerage services and intermodal support services.
| • | Truckload. Our truckload operations represented approximately $370.1 million, or 61.1%, of our operating revenues in 2010. We transport a wide variety of general commodities, including machinery, building materials, paper, food, consumer goods, automotive parts, furniture, steel and other metals on behalf of customers in various industries. |
6
Table of Contents
| • | Brokerage. Our brokerage operations represented approximately $148.0 million, or 24.4%, of our operating revenues in 2010. We primarily broker freight to third party transportation providers through our agent network at times when we generate more freight business than we can service with our available owner-operators. These transportation providers may include competing truckload carriers or, occasionally, shipper-owned and operated private motor carrier transport fleets with excess capacity. We also offer full service international freight forwarding and customs house brokerage services as well as third-party logistic services. |
| • | Intermodal support services. Our intermodal support services represented $87.9 million or 14.5% of our operating revenues in 2010. Our intermodal support services are primarily short-to-medium distance delivery of rail and steamship containers between the railhead or port and the customer and drayage services. |
Independent Contractor Network
We utilize a network of agents and owner-operators located throughout the United States and in the Canadian provinces of Ontario and Quebec. These agents and owner-operators are independent contractors who earn a fixed commission calculated as a percentage of the revenue they generate for us and who bring an entrepreneurial spirit to our business. We believe that this gives them greater incentive to respond quickly to customer needs and market opportunities and, in the case of owner-operators, to operate their equipment more reliably, efficiently and safely than would be the case with employee-drivers.
Agents
Our agents provide the primary interaction with our shippers. Approximately 72.9% of the freight we hauled in 2010 was solicited and controlled by our agents, with the remaining 27.1% generated by company-managed terminals and full service freight forwarding and customs house brokerage offices. Of our approximately 660 agents, 401 generated more than $100,000 of operating revenues and 119 generated more than $1.0 million of operating revenues, in 2010. Our agents typically focus on three or four shippers within a particular market and solicit most of their freight business from this core group. By focusing on a relatively small number of shippers, each agent is attuned to the specific transportation needs of that core group of shippers, while remaining alert to growth opportunities.
While the agent’s most important function is to generate freight shipments, they also provide valuable terminal and dispatch services for our owner-operators and are an important source for recruitment of new owner-operators. Our agents use a company-provided software program to list available freight procured by the agent, dispatch owner-operators to haul the freight and provide all administrative information necessary for us to establish the credit arrangements for each shipper. Our agents do not have the authority to execute or fulfill shipping contracts on their own, as all shipping contracts are between one of our operating subsidiaries and the shipper directly, and we generally assume the liability for freight loss or damages.
We believe that our commission schedule, prompt payment practices, industry reputation, financial stability, back-office support and national freight network are attractive to agents and we have grown from 209 agents who generated more than $100,000 of operating revenues in 2000 to 401 who generated more than $100,000 of operating revenues in 2010. Our top 100 agents in 2010 generated 49.5% of our annual operating revenues. We generally pay our full-service agents a commission of 8% of revenue generated, excluding fuel surcharges. While we have signed agreements with most of our newer agents, we rely on verbal agreements with most of our long-term agents. We believe that very few of our agents work exclusively with us. The loss of any large-volume agent or a significant decrease in volume from one of these agents could have a materially adverse effect on our results of operations.
Owner-Operators
Owner-operators are individuals who own, operate and maintain one or more tractors that they either provide drivers for, or drive themselves. Our owner-operators provide us with approximately 2,800 tractors, which
7
Table of Contents
represent substantially all of the tractors used in our business. Owner-operators also may own trailers that they provide to us in addition to their tractor and driving services. Our owner-operators provide approximately 3,000 trailers, which represent over 50% of the trailers we use in our business. Owner-operators are responsible for all expenses of owning and operating their equipment, including the wages and benefits paid to any drivers, fuel, physical damage insurance, maintenance, fuel taxes, highway use taxes and debt service.
We believe that our commission schedule, prompt payment practices, financial stability, back-office support and national freight network are attractive to owner-operators. The number of tractors provided by our owner-operators has grown from 2,266 at December 31, 2001 to 2,839 at December 31, 2010, a compound annual growth rate of 2.5%. We generally pay our owner-operators a commission of 75% of the revenue generated from the freight they haul, if both a tractor and trailer are supplied. We generally also pass on 100% of any fuel surcharges we receive and a portion of other accessorial charges (at the commission rate) to our owner-operators. Most owner-operators are recruited directly by our agents. All owner-operators enter into standard, short-term written contracts with one of our operating subsidiaries that can be terminated by either party on short notice.
Pursuant to our arrangements with the owner-operators, we maintain the federal and state licensing required for them to operate a motor coach carrier. We also provide insurance coverage for the owner-operators and are primarily liable to the shipper for damaged or lost freight and to third parties for personal injury claims arising out of accidents involving the owner-operators. We also administer the owner-operators’ compliance with safety, vehicle licensing and fuel-tax reporting rules. Each owner-operator must meet our guidelines with respect to matters such as motor vehicle records, or MVR’s, insurance, driving experience and past work history and must pass a federally mandated physical exam. Additionally, our owner-operators are also subject to pre-lease drug and alcohol screening and are subject to subsequent random testing.
Corporate Services
We oversee certain administrative functions at our headquarters, while all operations and sales efforts are performed by our operating subsidiaries, each of which functions as a distinct operational unit and is not dependant on the operations of any of the other subsidiaries. These administrative functions are primarily focused on providing support to our agents, which includes billing and collections, contractor settlements, management information systems, purchasing, safety, and risk management. In addition, we conduct our accounting, strategic planning and human resource management functions at our headquarters. The management information systems used by our agents and owner-operators in connection with our operations are centralized in our corporate administrative offices in Warren, Michigan. We provide systems that handle all billing with shippers, allow agents to list pending freight shipments and owner-operators with available capacity, and track particular shipments at various points in the shipping route. We rely on the proper operation of our management information systems. Any significant disruption or failure of these systems could have a materially adverse effect on our operations and results of operations.
Customers
We provide our truckload, brokerage and intermodal support services throughout the United States and in the Canadian provinces of Ontario and Quebec to a wide variety of shippers, including a number of Fortune 500 and multi-national companies across a wide variety of industries. Our largest concentration of customers comes from the steel, automotive and alternative energy industries geographically located throughout the United States. In addition, a significant portion of our revenue results from our providing capacity to other transportation companies who aggregate loads from a variety of shippers in these and other industries. No single customer has accounted for more than 5% of our operating revenues in 2008, 2009 or 2010, and the aggregate operating revenues generated by our top ten customers did not account for more than 18% of our operating revenues in any such year. We believe the diversity of our customers and their industries lessens the impact of business cycles affecting any one company or industry.
8
Table of Contents
Revenue Equipment
We offer our customers a wide range of transportation services by utilizing a diverse fleet of trailing equipment provided by us and our owner-operators. At December 31, 2010, our owner-operators provided us with approximately 2,800 tractors and 3,000 trailers. At December 31, 2010, the Company owned approximately 115 tractors, 1,750 trailers, 475 chassis and operated 13 leased tractors with company drivers.
Insurance
We maintain auto liability, workers compensation and general liability insurance with licensed insurance carriers. We are self-insured for all cargo and equipment damage claims. Insurance and claims expense represents premiums paid by us and the accruals made for claims within our self-insured retention amounts. The accruals are primarily related to auto liability, cargo and equipment damage claims. A liability is recognized for the estimated cost of all self-insured claims and for claims expected to exceed our policy limit, based on our knowledge of the facts and, in certain cases, opinions of outside counsel, including estimates of incurred but not reported claims based on historical experience. We may also make accruals for personal injury and property damage to third parties, and workers’ compensation claims if a claim exceeds our insurance coverage.
To reduce our exposure to non-trucking use liability claims (claims incurred while the vehicle is being operated without a trailer attached or is being operated with an attached trailer which does not contain or carry any cargo), we require our owner-operators to maintain non-trucking use liability coverage, which we refer to as deadhead bobtail coverage, of $2.0 million per occurrence.
In brokerage arrangements, our exposure to liability associated with accidents incurred by other third-party carriers, who haul freight on our behalf, is reduced by various factors including the extent to which the third party providers maintain their own insurance coverage.
Our insurance and claims expense varies primarily based upon the frequency and severity of the Company’s accident experience, the market for insurance, our coverage limits, and self-insured retention amounts.
Competitive Environment
We compete for truckload freight primarily in the U.S. markets of the transportation industry. The transportation industry is extremely competitive and fragmented. We compete with asset and non-asset based truckload carriers, intermodal transportation, logistics providers and, in some aspects of our business, with less-than-truckload carriers and railroads. We also compete with other motor carriers for owner-operators and agents.
Recent economic trends have led to a consolidation of the truckload industry. We believe that the truckload market will continue to experience further consolidation due to a number of economic factors that have forced many smaller carriers to exit the business, merge or file for bankruptcy. These factors include rising insurance costs, scarcity of capital, volatility of fuel prices, increased prices for new environmentally friendly equipment, purchasing advantages available to larger carriers and customer demand for total service solutions that can only be provided by large carriers.
Government Regulation
Our operations are regulated and licensed by various federal and state agencies. Interstate motor carrier operations are subject to safety and insurance requirements prescribed by the Federal Motor Carrier Safety Administration, or FMCSA. Such matters as weight and equipment dimensions also are subject to federal and state regulation. We operate in the United States throughout the 48 contiguous states pursuant to operating authority granted by the FMSCA and in various Canadian provinces pursuant to operation authority granted by the Ministries of Transportation and Communications in such provinces. To the extent that we conduct operations outside the United States, we are subject to the Foreign Corrupt Practices Act, which generally prohibits U.S. companies and their intermediaries from bribing foreign officials for the purpose of obtaining or retaining favorable treatment.
9
Table of Contents
In November 2008, following the submission of additional data by FMCSA and a series of appeals and related court rulings, the FMCSA adopted the final hours-of-service (HOS) provisions of its December 2007 Interim Final Ruling (IFR), which allows commercial motor carrier drivers to continue to drive up to 11 hours within a 14-hour workday and mandates at least 10 consecutive off-duty hours between workdays. The ruling also allows drivers to continue to restart their calculations of weekly on-duty time limits after having at least 34 consecutive hours off-duty. Advocacy groups continued to challenge HOS regulations and on October 27, 2009, the FMCSA announced that it will “completely rewrite” the 2008 regulations. In December 2010, the FMCSA published proposed HOS rules, which comply with a court imposed settlement agreement that would require publication of the final rules by July 2011. The proposed rules include changes to the 34-hour restart, a mandatory 1 hour break during the work day, and the completion of all work within 14 hours. Although no decision has been made, the Company believes that the FMCSA also favors a 10-hour driving limit, which would yield a loss of 1-hour of service from current standards.
In December 2010, the FMCSA also initiated its Compliance Safety Accountability (CSA) initiative (formerly Comprehensive Safety Analysis 2010). The CSA system fundamentally changes the safety evaluation process for all motor carriers and includes a scope of enforcement to the driver level (in our case the owner-operator) to make driver safety performance history more transparent to law enforcement and motor carriers. The Company believes the intent is to improve regulatory oversight of motor carriers and drivers.
We are also preparing for an anticipated change in the manner in which commercial drivers will be required to document their HOS. In April 2010, the FMCSA published a regulation that will require interstate carriers with documented patterns of HOS violations to install electronic on-board recorders (EOBR) in their vehicles. EOBR’s are devices attached to the vehicle that automatically record the number of hours a driver spends operating the vehicle. The current system is a manual log system. In January 2011, the FMCSA proposed to expand this requirement to all motor carriers. It is expected that a final rule will be published in June 2012, and motor carriers will have 3 years to comply with the mandate.
We are also subject to regulations relating to testing and specifications of equipment and product handling requirements. In addition, our owner-operators must comply with safety and fitness regulations promulgated by the FMCSA, including those relating to drug and alcohol testing.
Environmental
We are subject to various environmental laws and regulations and, among other things, our operations are subject to the risk of fuel spillage and the consequential environmental damage. If we are involved in a fuel spill or other accident involving hazardous substances, we are subject to substantial fines or penalties and to criminal and civil liability.
Laws and regulations concerning the discharge of pollutants into the air and water, the handling and disposal of hazardous materials, the investigation and remediation of property contamination, and other aspects of environmental protection are in effect wherever we operate. Our current operations do not involve material costs to comply with such laws and regulations, and they have not given rise to, and are not expected to give rise to, material liabilities under these laws and regulations for investigation or remediation of contamination.
Claims for environmental liabilities arising out of property contamination have been asserted against us and our predecessors from time to time. Such claims, in some instances, have been associated with businesses related to entities we acquired and have been based on conduct that occurred prior to our acquisition of those entities. While none of the claims identified to date have resulted in a material liability to us, additional environmental liabilities relating to any of our former operations or any entities we have acquired could be identified and give rise to claims against us involving significant losses.
In August 2005, UTS Realty, LLC, or Realty, purchased a container storage facility in Cleveland, Ohio. In connection with the acquisition of the property, Realty received indemnity from the seller from any and all
10
Table of Contents
claims, which Realty may incur as a direct consequence of any environmental condition of which the seller had actual knowledge as of the date of the acquisition of the property.
Seasonality
Our results of operations are subject to seasonal trends common to the trucking industry. Our results of operations in the first fiscal quarter of each year are typically lower than the other quarters, principally because some shippers reduce their shipments and the productivity of our owner-operators generally decreases during the winter season because inclement weather impedes operations.
Employees
At December 31, 2010, we employed 714 individuals. None of our employees is represented by a collective bargaining unit. We believe that our employee relations are good.
Available Information
We make available free of charge on or through our website our annual reports on Form 10-K, quarterly reports on Form 10-Q, current reports on Form 8-K and all amendments to those reports as soon as reasonably practicable after such material is electronically filed with or furnished to the Securities and Exchange Commission, or the SEC. Our website address is www.goutsi.com. The SEC maintains a website at www.sec.gov that contains the Company’s current and periodic reports, proxy and information statements and other information filed electronically with the SEC.
We primarily rely on owner-operators to provide transportation services to our customers. Continued reliance primarily on owner-operators, as well as reductions in our pool of available driver candidates could limit our growth.
The transportation services that we provide are primarily carried out by owner-operators who are generally responsible for paying for their own equipment, fuel and other operating costs. Our owner-operators provide substantially all of the tractors and over 50% of the trailers used in our business. Owner-operators make up a relatively small portion of the pool of all truck drivers. Thus, continued reliance primarily on owner-operators could limit our ability to grow. In addition, the following factors recently have combined to create a difficult operating environment for owner-operators:
| • | increases in the prices of new and used tractors; |
| • | a tightening of financing sources available to owner-operators for the acquisition of equipment; |
| • | high fuel prices; and |
| • | increases in insurance costs. |
In recent years, these factors have caused many owner-operators to join company-owned fleets or to exit the industry entirely. As a result of the smaller available pool of qualified owner-operators, the already strong competition among carriers for their services has intensified. Due to the difficult operating environment and intense competition, turnover among owner-operators in the trucking industry is high. In 2010, turnover among our owner-operators was approximately 84%. Additionally, our agreements with our owner-operators are terminable by either party upon short notice and without penalty. Consequently, we regularly need to recruit qualified owner-operators to replace those who have left our fleet. We are also preparing for the FMCSA to change the carrier review, safety measurement and enforcement standards to a new system known as Comprehensive Safety Analysis 2010 (CSA 2010). The CSA 2010 system changes the safety evaluation process
11
Table of Contents
for all motor carriers and includes a scope of enforcement to the driver level (in our case the owner-operator) to make driver safety performance history more transparent to law enforcement and motor carriers. If we are unable to retain our existing owner-operators or recruit new owner-operators, it could have a materially adverse effect on our business and results of operations.
In the event that the current operating environment for owner-operators worsens, we could adjust our owner-operator compensation package or, alternatively, acquire more of our own revenue equipment and seat it with employee drivers in order to maintain or increase the size of our fleet. The adoption of either of these measures could materially and adversely affect our financial condition and results of operations. If we are required to increase the compensation of owner-operators, our results of operations would be adversely affected to the extent increased expenses are not offset by higher freight rates. If we elect to purchase more of our own tractors and hire additional employee drivers, our capital expenditures would increase, we would incur additional employee benefits costs and depreciation, interest, and/or equipment rental expenses, our financial return on our assets would decline and we would be exposed to the risks associated with implementing a business model with which we have limited experience.
We rely heavily upon our agents to develop customer relationships and to locate freight, and the loss of any agent or agents responsible for a significant portion of our revenue could adversely affect our revenue and results of operations.
We rely heavily upon our agents to market our transportation services, to act as intermediaries with customers and to recruit owner-operators. Although we employ a small field management staff that maintains direct relationships with some of our larger, national customers and is responsible for supporting, coordinating and supervising our agent’s activities, the primary relationship with our customers generally is with our agents and not directly with us. We rely on verbal agreements with many of our agents and these verbal agreements do not obligate our agents to provide us with a specific amount of service or to refer freight exclusively to us. Our reliance on verbal agreements may increase the likelihood that we or our agents have a disagreement or a misunderstanding of our and their respective rights and obligations. In addition, in the event of a dispute with one of our agents, we may not be able to verify the terms of the agreement.
We compete with other trucking companies that utilize agent networks both to recruit quality agents and for the business that they generate, which typically involves both competition with respect to the freight rates that we charge shippers and the compensation paid to the agents. There can be no assurance that we will be able to retain our agents or that our agents will continue to refer to us the amount of business that they have in the past. In 2010, 119 of our agents generated more than $1.0 million in operating revenues each and our five largest revenue-producing agents generated an aggregate of approximately 8.6% of our operating revenues. If we were to lose the service of an agent or agents responsible for a significant portion of our operating revenues or if any such agent or agents were to significantly reduce the volume of business that they refer to us, it would have a materially adverse effect on our operating revenues and results of operations. Further, if we were required to increase the compensation we pay to agents in order to retain, or maintain business volumes with them, our operating results would be adversely affected to the extent that we could not pass these increased costs on to our customers.
We self-insure for a significant portion of our potential liability for auto liability, workers’ compensation and general liability claims. One or more significant claims, our failure to adequately reserve for such claims, or the cost of maintaining our insurance, could have a materially adverse impact on our financial condition and results of operations.
We maintain auto liability, workers compensation and general liability insurance with licensed insurance carriers. We are self-insured for all cargo and equipment damage claims.
The nature of our industry is that auto accidents occur and, when they do, they almost always result in equipment damage and they often result in injuries or death. Since January 1, 2000, less than 1% of our total casualty claims
12
Table of Contents
exceeded our insurance policy limits. If we experience claims that are not covered by our insurance or that exceed our reserves, or if we experience claims for which coverage is not provided, it could increase the volatility of our earnings and have a materially adverse effect on our financial condition and results of operations.
Our insurance premiums continue to increase over our historical levels and as a result we expect our insurance and claims expense to continue to increase over historical levels, even if we do not experience an increase in the number of insurance claims. Insurance carriers have significantly raised premiums for many businesses, including trucking companies. If this continues, the cost of maintaining our insurance would increase. In addition, if we decide to increase our insurance coverage in the future, our costs would be expected to further increase.
Our business is subject to general economic and business factors that are largely out of our control, any of which could have a materially adverse effect on our operating results.
Our business is dependent upon a number of general economic and business factors that may have a materially adverse effect on our results of operations. Many of these are beyond our control, including new equipment prices and used equipment values, interest rates, fuel taxes, tolls, and license and registration fees, all of which could increase the costs borne by our owner-operators, and capacity levels in the trucking industry, particularly in the market segments and geographic regions in which we operate.
We also are affected by recessionary economic cycles, changes in inventory levels, and downturns in customers’ business cycles, particularly in market segments and industries where we have a significant concentration of customers, such as automotive, steel and other metals, building materials and machinery. Economic conditions may adversely affect our customers, their need for our services or their ability to pay for our services. Adverse changes in any of these factors could have a materially adverse effect on our business and results of operations.
We operate in a highly competitive and fragmented industry, and our business may suffer if we are unable to adequately address factors that may adversely affect our revenue and costs relative to our competitors.
Numerous competitive factors could impair our ability to maintain our current profitability. These factors include the following:
| • | we compete with many other truckload carriers of varying sizes and to a lesser extent, with less than truckload carriers and railroads, some of which have more equipment, a broader coverage network, a wider range of services and greater capital resources than we do; |
| • | some of our competitors periodically reduce their freight rates to gain business, especially during times of reduced growth rates in the economy, which may limit our ability to maintain or increase freight rates, maintain our operating margins or maintain significant growth in our business; |
| • | many customers reduce the number of carriers they use by selecting so-called “core carriers” as approved service providers, and in some instances we may not be selected; |
| • | many customers periodically accept bids from multiple carriers for their shipping needs, and this process may depress freight rates or result in the loss of some of our business to competitors; |
| • | the trend toward consolidation in the trucking industry may create other large carriers with greater financial resources and other competitive advantages relating to their size and with whom we may have difficulty competing; |
| • | advances in technology require increased investments to remain competitive, and our customers may not be willing to accept higher freight rates to cover the cost of these investments; |
| • | competition from Internet-based and other brokerage companies may adversely affect our relationships with our customers and freight rates; and |
| • | economies of scale that may be passed on to smaller carriers by procurement aggregation providers may improve the ability of smaller carriers to compete with us. |
13
Table of Contents
Fluctuations in the price or availability of fuel and our ability to collect fuel surcharges may affect our ability to retain or recruit owner-operators.
Our owner-operators bear the costs of operating their tractors, including the cost of fuel and fuel taxes. The tractors operated by our owner-operators consume large amounts of diesel fuel. Diesel fuel prices fluctuate greatly due to economic, political and other factors beyond our control. For example, average weekly diesel fuel prices ranged from $3.00 per gallon to $3.29 per gallon in the fourth quarter 2010, compared with $2.58 per gallon to $2.73 per gallon in the fourth quarter of 2009. To address fluctuations in fuel prices, we seek to impose fuel surcharges on our customers and pass these surcharges on to our owner-operators. These arrangements will not fully protect our owner-operators from fuel price increases. If costs for fuel escalate significantly it could make it more difficult to attract additional qualified owner-operators and retain our current owner-operators. Our owner-operators also may seek higher compensation from us in the form of higher commissions, which could have a materially adverse effect on our results of operations. If we lose the services of a significant number of owner-operators or are unable to attract additional owner-operators, it could have a materially adverse effect on our business and results of operations.
We may not be able to successfully execute our acquisition strategy, which could cause our business and future growth prospects to suffer.
One component of our growth strategy is to pursue strategic acquisitions of truckload and other transportation companies that meet our acquisition criteria. During each of the years ended December 31, 2010, 2009, and 2008 acquisition revenues totaled 10.3%, 4.2% and 5.1%, respectively, of our total revenue in each year. Our current growth is highly dependent upon being able to continue to make strategic acquisitions. However, suitable acquisition candidates may not be available on terms and conditions we find acceptable. In pursuing acquisitions, we compete with other companies, many of which may have greater resources than we do. If we are unable to secure sufficient funding for potential acquisitions, we may not be able to complete strategic acquisitions that we otherwise find desirable. Further, if we succeed in consummating strategic acquisitions, our business, financial condition and results of operations may be negatively affected because:
| • | some of the acquired businesses may not achieve anticipated revenues, earnings or cash flows; |
| • | we may assume liabilities that were not disclosed to us or exceed our estimates; |
| • | we may be unable to integrate acquired businesses successfully and realize anticipated economic, operational, and other benefits in a timely manner, which could result in substantial costs and delays or other operational, technical or financial problems; |
| • | acquisitions could disrupt our ongoing business, distract our management and divert our resources; |
| • | we may experience difficulties operating in markets in which we have had no or only limited direct experience; |
| • | we may lose the customers, key employees, agents and owner-operators of the acquired company; |
| • | we may finance future acquisitions by issuing common stock for some or all of the purchase price, which could dilute the ownership interests of our shareholders; |
| • | we may incur additional debt related to future acquisitions; or |
| • | we may acquire companies that derive a portion of their revenues from asset-based operations and experience unforeseen difficulties in integrating this unfamiliar business model. |
If we are unable to retain our executive officers, our business and results of operations could be harmed.
We are highly dependent upon the services of our executive officers and the officers of our operating subsidiaries. We do not maintain key-man life insurance on any of these persons. The loss of the services of any of these individuals could have a materially adverse effect on our operations and future profitability. We also need to continue to develop and retain a core group of managers if we are to realize our goal of expanding our
14
Table of Contents
operations and continuing our growth. The market for qualified employees can be highly competitive, and we cannot assure you that we will be able to attract and retain the services of qualified executives, managers or other employees.
We operate in a highly regulated industry and increased costs of compliance with, liability for violation of, or changes in, existing or future regulations could have a materially adverse effect on our business and our ability to retain or recruit owner-operators.
The U.S. Federal Motor Carrier Safety Administration, or FMCSA, and various state and local agencies exercise broad powers over our business, generally governing such activities as authorization to engage in motor carrier operations, safety and insurance requirements. Our owner-operators must comply with the safety and fitness regulations promulgated by the FMCSA, including those relating to drug and alcohol testing and hours-of-service. There also are regulations specifically relating to the trucking industry, including testing and specifications of equipment and product handling requirements. These measures could disrupt or impede the timing of our deliveries and we may fail to meet the needs of our customers. The cost of complying with these regulatory measures, or any future measures, could have a materially adverse effect on our business or results of operations.
In November 2008, following the submission of additional data by FMCSA and a series of appeals and related court rulings, the FMCSA adopted the final hours-of-service (HOS) provisions of its December 2007 Interim Final Ruling (IFR), which allows commercial motor carrier drivers to continue to drive up to 11 hours within a 14-hour workday and mandates at least 10 consecutive off-duty hours between workdays. The ruling also allows drivers to continue to restart their calculations of weekly on-duty time limits after having at least 34 consecutive hours off-duty. Advocacy groups continued to challenge HOS regulations and on October 27, 2009, the FMCSA announced that it will “completely rewrite” the 2008 regulations. In December 2010, the FMCSA published proposed HOS rules, which comply with a court imposed settlement agreement that would require publication of the final rules by July 2011. The proposed rules include changes to the 34-hour restart, a mandatory 1 hour break during the work day, and the completion of all work within 14 hours. Although no decision has been made, the Company believes that the FMCSA also favors a 10-hour driving limit, which would yield a loss of 1-hour of service from current standards.
In December 2010, the FMCSA also initiated its Compliance Safety Accountability (CSA) initiative (formerly Comprehensive Safety Analysis 2010). The CSA system fundamentally changes the safety evaluation process for all motor carriers and includes a scope of enforcement to the driver level (in our case the owner-operator) to make driver safety performance history more transparent to law enforcement and motor carriers. The Company believes the intent is to improve regulatory oversight of motor carriers and drivers.
We are also preparing for an anticipated change in the manner in which commercial drivers will be required to document their HOS. In April 2010, the FMCSA published a regulation that will require interstate carriers with documented patterns of HOS violations to install electronic on-board recorders (EOBR) in their vehicles. EBOR’s are devices attached to the vehicle that automatically record the number of hours a driver spends operating the vehicle. The current system is a manual log system. In January 2011, the FMCSA proposed to expand this requirement to all motor carriers. It is expected that a final rule will be published in June 2012, and motor carriers will have 3 years to comply with the mandate.
Advocacy groups may continue to challenge the final rulings of the FMCSA, and we are unable to predict how a court may rule on such challenges. We will continue to monitor the actions of the FMCSA.
Our operations are subject to various environmental laws and regulations, the violation of which could result in substantial fines or penalties.
Our operations involve the risks of fuel spillage and environmental damage, among others, and we are subject to various environmental laws and regulations. If we are involved in a spill or other accident involving hazardous
15
Table of Contents
substances, or if we are found to be in violation of applicable laws or regulations, we could be subject to substantial fines or penalties and to criminal and civil liability, which could have a materially adverse effect on our business and operating results. In addition, claims for environmental liabilities arising out of property contamination have been asserted against us from time to time. Such claims, in some instances, have been associated with businesses related to entities or facilities we acquired and have been based on conduct that occurred prior to our acquisition of those entities or facilities. While none of the claims identified to date have resulted in a material liability to us, additional environmental liabilities relating to any of our former operations or any entities or facilities we have acquired could be identified and give rise to claims against us involving significant losses.
A determination by regulators that our agents and owner-operators are employees could expose us to various liabilities and additional costs.
From time to time, tax and other regulatory authorities have sought to assert that independent contractors in the trucking industry, such as our agents and owner-operators, are employees rather than independent contractors. There can be no assurance that these interpretations and tax laws that consider these persons independent contractors will not change or that these authorities will not successfully assert this position. If our agents or owner-operators are determined to be our employees, that determination could materially increase our exposure under a variety of federal and state tax, workers’ compensation, unemployment benefits, labor, employment and tort laws, as well as our potential liability for employee benefits. Our business model relies on the fact that our agents and owner-operators are not deemed to be our employees, and exposure to any of the above increased costs would have a materially adverse effect on our business and operating results.
Our business may be harmed by terrorist attacks, future war or anti-terrorism measures.
In the aftermath of the terrorist attacks of September 11, 2001, federal, state and municipal authorities have implemented and continue to follow various security measures, including checkpoints and travel restrictions on large trucks. Such measures may have costs associated with them, which we or our owner-operators could be forced to bear, or may otherwise reduce the productivity of our owner-operators. For example, security measures imposed at bridges, tunnels, border crossings and other points on key trucking routes may cause delays and increase the non-driving time of our owner-operators, which could have a materially adverse effect on our operating results. In addition, war, risk of war or a terrorist attack also may have an adverse effect on the economy. A decline in economic activity could adversely affect our revenues or restrict our future growth. Instability in the financial markets as a result of terrorism or war also could affect our ability to raise capital. In addition, the insurance premiums charged for some or all of the coverage currently maintained by us could increase dramatically or such coverage could be unavailable in the future.
Our ability to grow may be affected if shippers refuse to use our services because we operate primarily through agents and owner-operators.
In our experience, certain high-volume shippers have determined that their freight must be hauled by carriers that use company drivers and equipment. Such shippers believe that they can obtain a more homogenous fleet and more control over service standards. Such policies could prevent us from pursuing certain business opportunities, which could adversely affect our growth and results of operations.
A decrease in intermodal volume shipments could adversely affect our business.
A portion of our business comes from the intermodal segment of the trucking market and we believe that by expanding our intermodal support services we have a substantial opportunity to grow our business. A decrease in intermodal transportation services resulting from general economic conditions or other factors such as work stoppages, price competition from other modes of transportation, or a disruption in steamship or rail service could have an adverse effect on these growth opportunities and have a materially adverse effect on our business.
16
Table of Contents
Seasonality and the impact of weather can affect our operations.
The productivity of our owner-operators generally decreases during the winter season because some shippers reduce their shipments and inclement weather impedes operations. At the same time, our operating expenses generally increase because harsh weather creates higher accident frequency and increased claims.
We have incurred and will continue to incur increased costs as a result of being a public company.
As a public company, we have incurred and will continue to incur significant legal, accounting and other expenses that we did not incur as a private company. In addition, recent acts such as the Dodd-Frank Wall Street Reform and Consumer Protection Act of 2010 and the Sarbanes-Oxley Act of 2002 and the rules and regulations promulgated thereunder, as well as anticipated rules subsequently implemented by the SEC and the NASDAQ National Market, have required changes in corporate governance practices of public companies. We expect new rules and regulations to continuously increase our legal and financial compliance costs and to make some activities more time-consuming and costly. We are continuously evaluating and monitoring developments with respect to these new laws, rules and regulations, and we cannot predict or estimate the amount of additional costs we may incur or the timing of such costs. The costs of compliance or our failure to comply with these laws, rules and regulations could adversely affect our reputation, financial condition, results of operation and the price of our common stock.
We may be required to write down goodwill and other intangible assets, causing our financial condition and results to be negatively impacted.
When we acquire a business, a portion of the purchase price is allocated to goodwill and other identifiable intangible assets. Goodwill represents the excess purchase price over the fair value of assets acquired in connection with our acquisitions. At December 31, 2010, our goodwill and other identifiable intangible assets were approximately $29.2 million. Under current accounting standards, if we determine goodwill or intangible assets are impaired, we would be required to write down the value of these assets. We are required to test goodwill for impairment annually or more frequently, whenever events occur or circumstances change that would more likely than not reduce the fair value of a reporting unit with goodwill below its carrying amount. We annually test goodwill impairment as of the last day of our 2nd fiscal quarter. During the third quarter of 2010 we completed our impairment analysis and concluded that no impairment charge was necessary for the year ended December 31, 2010. We cannot provide assurance whether we will be required to take an impairment charge in the future. Any impairment charge would have a negative effect on our financial results.
We may be subject to additional impairment charges due to further declines in the fair value of our equity securities.
As of December 31, 2010, we held equity securities with a fair value of $15.0 million as short term investments. Holding equity securities subjects us to fluctuations in the market value of our investment portfolio based on current market prices. Marketable securities are carried at fair value and are marked to market at the end of each quarter, with the unrealized gains and losses, net of tax, included as a component of accumulated other comprehensive income, unless the declines in value are judged to be other-than-temporary, in which case an impairment charge is included in the determination of net income. During 2009, the Company recorded pre-tax other-than-temporary impairment charges of $1.3 million for marketable equity securities classified as available-for-sale. We may incur future impairment charges if declines in market values continue or worsen and impairments are no longer considered temporary.
Any disputes that arise between us and CenTra, an entity controlled by our majority shareholders, with respect to our past and ongoing relationships could harm our business operations.
Disputes may arise between CenTra and us in a number of areas relating to our past and ongoing relationships, including:
| • | labor, tax, employee benefit, indemnification and other matters arising from our separation from CenTra; |
17
Table of Contents
| • | employee retention and recruiting; |
| • | the nature, quality and pricing of transitional services CenTra has agreed to provide us; and |
| • | business opportunities that may be attractive to both CenTra and us. |
We may not be able to resolve any potential conflicts, and even if we do, the resolution may be less favorable than if we were dealing with an unaffiliated party. The agreements we have entered into with CenTra may be amended upon agreement between the parties. While we are controlled by Matthew T. Moroun and Manuel J. Moroun, who also control CenTra, CenTra may be able to require us to agree to amendments to these agreements that may be less favorable to us than the original terms of the agreements.
ITEM 1B: UNRESOLVED SECURITIES & EXCHANGE COMMISSION STAFF COMMENTS
None.
We are headquartered and maintain our corporate administrative offices in Warren, Michigan. We own our corporate administrative offices, as well as terminal yards in the following locations: Dearborn, Michigan; Columbus, Ohio; Reading, Ohio; Latty, Ohio; Cleveland, Ohio; Gary, Indiana; Millwood, West Virginia; Dallas, Texas; South Kearny, New Jersey; Garden City, Georgia and Memphis, Tennessee; offices in Tampa, Florida; Houston, Texas and a condominium in Monroeville, Pennsylvania. As of December 31, 2010, our subsidiaries also leased 47 office, terminal and yard facilities in various cities and states. The leased facilities are generally leased on a month-to-month basis and 13 of these facilities are leased from affiliates of CenTra, an entity controlled by our majority shareholders. We believe that all of the properties we lease from affiliates of our majority shareholders are leased at market rates. We believe that all of the properties leased by us are suitable for their purposes and adequate to meet our needs.
The nature of our business routinely results in litigation incidental to the ordinary course of our business, primarily involving claims for personal injury and property damage incurred in the transportation of freight. Based on knowledge of the facts and, in certain cases, opinions of outside counsel, we believe all such litigation is adequately covered by insurance or otherwise reserved for and that adverse results in one or more of those cases would not have a materially adverse effect on our financial condition, operating results and cash flows.
ITEM 4: (REMOVED AND RESERVED)
18
Table of Contents
PART II
| ITEM 5: | MARKET FOR THE REGISTRANT’S COMMON EQUITY, RELATED STOCKHOLDER MATTERS AND ISSUER PURCHASES OF EQUITY SECURITIES |
Market Information
Our common stock is traded on The NASDAQ Global Select Market under the symbol “UACL”. Our common stock began trading on February 11, 2005, the date of our initial public offering. Prior to such date, there was no public market for our common stock. The following table shows the reported high and low sales prices of our common stock for the periods indicated.
| 2010 | 2009 | |||||||||||||||
| Fiscal Period |
High | Low | High | Low | ||||||||||||
| First Quarter |
$ | 18.85 | $ | 15.39 | $ | 15.63 | $ | 10.51 | ||||||||
| Second Quarter |
$ | 19.19 | $ | 13.57 | $ | 18.94 | $ | 12.13 | ||||||||
| Third Quarter |
$ | 15.66 | $ | 13.25 | $ | 17.45 | $ | 14.00 | ||||||||
| Fourth Quarter |
$ | 16.00 | $ | 14.07 | $ | 18.58 | $ | 15.17 | ||||||||
The reported last sale price per share of the Common Stock as quoted through the NASDAQ Global Select Market on March 1, 2011 was $15.90 per share. The number of shareholders of record on March 1, 2011, was 4. However, we estimate that we have a significantly greater number of shareholders because a substantial number of our common shares are held at The Depository Trust & Clearing Corporation on behalf of our shareholders.
Dividends
Historically, we have not paid dividends and no dividends or distributions on our common stock were paid during 2007, 2008 or 2010. However, on February 25, 2009, the Board of Directors declared a special one-time cash dividend of $1.00 per common share payable to stockholders of record on March 7, 2009. As a result of the special dividend, a total of approximately $16.0 million was paid on our 16.0 million common shares outstanding. We currently intend to retain any future earnings to finance the growth, development and expansion of our business and do not anticipate paying cash dividends in the future. Any future determination to pay dividends will be at the discretion of our Board of Directors and will depend on our financial condition, results of operations, capital requirements, any legal or contractual restrictions on the payment of dividends and other factors the Board of Directors deems relevant.
Limitations on our ability to pay dividends are described under the section captioned “Liquidity and Capital Resources—Unsecured Line of Credit” in Item 7 of this Form 10-K.
19
Table of Contents
Equity Compensation Plan Information
We maintain one stock incentive plan, the 2004 Stock Incentive Plan. In December 2004, our Board of Directors approved, effective upon completion of our initial public offering, the issuance of 260,000 stock options to employees under such plan. These options were issued on February 11, 2005. Through December 31, 2010, 4,983 of these options were exercised and 67,517 were forfeited. For more information on the 2004 Stock Incentive Plan, see Note 14 to the Consolidated Financial Statements, included in Item 8 of this report. The following table presents information related to securities authorized for issuance under this plan at December 31, 2010:
| Plan Category |
Number of securities to be issued upon exercise of outstanding options, warrants and rights |
Weighted average exercise price of outstanding options, warrants and rights |
Number of securities remaining available for future issuance |
|||||||||
| Equity compensation plans approved by security holders |
0 | $ | 0 | 0 | ||||||||
| Equity compensation plans not approved by security holders |
187,500 | $ | 22.50 | 240,000 | ||||||||
| Total |
187,500 | $ | 22.50 | 240,000 | ||||||||
Purchases of Equity Securities by the Issuer and Affiliated Purchasers
The following table provides information regarding the Company’s purchases of its Common Stock during the period from October 3, 2010 to December 31, 2010, the Company’s fourth fiscal quarter:
| Fiscal Period |
Total Number of Shares Purchased |
Average Price Paid per Share |
Total Number of Shares Purchased as Part of Publicly Announced Program |
Maximum Number of Shares that May Yet be Purchased Under the Program |
||||||||||||
| October 2, 2010 |
245,900 | 554,100 | ||||||||||||||
| Oct. 3, 2010 – Oct. 30, 2010 |
49,200 | $ | 14.75 | 295,100 | 504,900 | |||||||||||
| Oct. 31, 2010 – Nov. 27, 2010 |
66,400 | 14.66 | 361,500 | 438,500 | ||||||||||||
| Nov. 28, 2010 – Dec. 31, 2010 |
93,500 | 15.08 | 455,000 | 345,000 | ||||||||||||
| Total |
209,100 | $ | 14.87 | 455,000 | 345,000 | |||||||||||
On November 6, 2007, the Company announced that it had been authorized to purchase up to 800,000 shares of its Common Stock from time to time in the open market. No specific expiration date has been assigned to the authorization.
20
Table of Contents
Performance Graph
The graph below compares the cumulative 5-year total return provided to shareholders on Universal Truckload Services, Inc.’s common stock relative to the cumulative total returns of the NASDAQ Composite index and the NASDAQ Transportation index. An investment of $100 (with reinvestment of all dividends) is assumed to have been made in our common stock and in each of the indexes on 12/31/2005 and its relative performance is tracked through 12/31/2010.
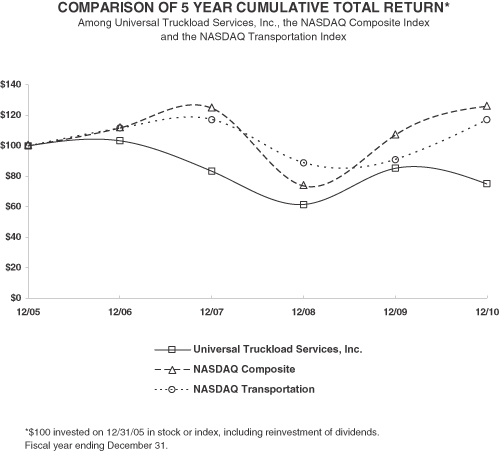
| 12/05 | 12/06 | 12/07 | 12/08 | 12/09 | 12/10 | |||||||||||||||||||
| Universal Truckload Services, Inc. |
100.00 | 103.26 | 83.30 | 61.57 | 85.17 | 74.91 | ||||||||||||||||||
| NASDAQ Composite |
100.00 | 111.74 | 124.67 | 73.77 | 107.12 | 125.93 | ||||||||||||||||||
| NASDAQ Transportation |
100.00 | 111.57 | 117.39 | 88.90 | 91.15 | 117.01 | ||||||||||||||||||
The stock price performance included in this graph is not necessarily indicative of future stock price performance.
21
Table of Contents
ITEM 6: SELECTED FINANCIAL DATA
The following table sets forth the selected historical financial and operating data as of and for the periods presented. The selected historical balance sheet data at December 31, 2010, 2009, 2008, 2007 and 2006 and the selected historical statement of income data for the years ended December 31, 2010, 2009, 2008, 2007 and 2006 have been derived from our audited consolidated financial statements. The selected historical financial and operating data presented below should be read in conjunction with the information included under the heading “Management’s Discussion and Analysis of Financial Condition and Results of Operations” and our consolidated financial statements and related notes included elsewhere in this Form 10-K. The following financial and operating data may not be indicative of our future performance.
| Year ended December 31, | ||||||||||||||||||||
| 2010 | 2009 | 2008 | 2007 | 2006 | ||||||||||||||||
| (in thousands, except per share information, operating data and percentages) |
||||||||||||||||||||
| Statements of Income Data: |
||||||||||||||||||||
| Operating revenues |
$ | 605,943 | $ | 503,230 | $ | 759,517 | $ | 680,359 | $ | 641,627 | ||||||||||
| Operating expenses: |
||||||||||||||||||||
| Purchased transportation |
461,041 | 378,008 | 592,982 | 520,064 | 491,840 | |||||||||||||||
| Commissions expense |
38,805 | 33,953 | 47,333 | 45,081 | 40,360 | |||||||||||||||
| Other operating expense |
13,276 | 10,316 | 9,510 | 9,429 | 8,642 | |||||||||||||||
| Selling, general and administrative |
49,253 | 44,232 | 52,036 | 48,418 | 46,137 | |||||||||||||||
| Insurance and claims |
17,205 | 17,348 | 21,388 | 21,178 | 15,828 | |||||||||||||||
| Depreciation and amortization |
10,996 | 10,354 | 9,638 | 8,163 | 5,730 | |||||||||||||||
| Total operating expenses |
590,576 | 494,211 | 732,887 | 652,333 | 608,537 | |||||||||||||||
| Income from operations |
15,367 | 9,019 | 26,630 | 28,026 | 33,090 | |||||||||||||||
| Interest and other non-operating expense (income), net |
(6,089 | ) | 999 | 2,375 | (944 | ) | (1,043 | ) | ||||||||||||
| Income before provision for income taxes |
21,456 | 8,020 | 24,255 | 28,970 | 34,133 | |||||||||||||||
| Provision for income taxes |
8,712 | 3,120 | 9,369 | 11,134 | 13,124 | |||||||||||||||
| Net income |
$ | 12,744 | $ | 4,900 | $ | 14,886 | $ | 17,836 | $ | 21,009 | ||||||||||
| Earnings per common share: |
||||||||||||||||||||
| Basic |
$ | 0.80 | $ | 0.31 | $ | 0.93 | $ | 1.11 | $ | 1.30 | ||||||||||
| Diluted |
$ | 0.80 | $ | 0.31 | 0.93 | 1.11 | 1.30 | |||||||||||||
| Weighted average number of common shares outstanding: |
||||||||||||||||||||
| Basic |
15,917 | 15,982 | 16,073 | 16,115 | 16,118 | |||||||||||||||
| Diluted |
15,917 | 15,982 | 16,077 | 16,122 | 16,159 | |||||||||||||||
| Cash dividends per common share |
$ | — | $ | 1.00 | $ | — | $ | — | $ | — | ||||||||||
| Balance Sheet Data ( end of year): |
||||||||||||||||||||
| Cash and cash equivalents |
$ | 6,261 | $ | 953 | $ | 28,767 | $ | 5,416 | $ | 5,008 | ||||||||||
| Total assets |
212,048 | 201,611 | 211,547 | 207,188 | 190,900 | |||||||||||||||
| Line of credit and long-term debt, including current portion |
90 | 730 | 820 | 910 | 1,000 | |||||||||||||||
| Total shareholders’ equity |
164,211 | 154,425 | 164,477 | 151,442 | 134,453 | |||||||||||||||
| Other Financial Data (unaudited): |
||||||||||||||||||||
| Pretax margin |
3.6 | % | 1.6 | % | 3.2 | % | 4.3 | % | 5.3 | % | ||||||||||
| EBITDA (1) |
$ | 32,332 | $ | 18,640 | $ | 33,881 | $ | 36,811 | $ | 39,509 | ||||||||||
| Capital expenditures (2) |
$ | 10,256 | $ | 22,262 | $ | 10,108 | $ | 14,774 | $ | 15,530 | ||||||||||
| Return on average assets (3) |
6.2 | % | 2.4 | % | 7.1 | % | 9.0 | % | 12.0 | % | ||||||||||
| Operating Data (unaudited): |
||||||||||||||||||||
| Number of agents (4) |
401 | 397 | 409 | 425 | 395 | |||||||||||||||
| Average number of tractors provided by owner-operators |
3,111 | 3,387 | 3,618 | 3,776 | 3,420 | |||||||||||||||
| Number of employees |
714 | 630 | 649 | 642 | 644 | |||||||||||||||
| Operating revenues per loaded mile (5) |
$ | 2.47 | $ | 2.19 | $ | 2.74 | $ | 2.34 | $ | 2.36 | ||||||||||
| Operating revenues per load (5) |
$ | 1,075 | $ | 1,007 | $ | 1,175 | $ | 1,031 | $ | 1,032 | ||||||||||
| Average length of haul (in miles) (5) |
435 | 460 | 429 | 439 | 437 | |||||||||||||||
| Number of loads (5) |
450,877 | 414,822 | 531,716 | 529,497 | 492,305 | |||||||||||||||
22
Table of Contents
| (1) | EBITDA represents earnings from continuing operations before interest, taxes, depreciation and amortization. Management believes that the presentation of EBITDA included in this Form 10-K provides useful information to investors regarding our results of operations because it assists in analyzing and benchmarking the performance and value of our business. Although management uses EBITDA as a financial measure to assess the performance of our business compared to that of others in our industry, the use of EBITDA is limited because it does not include certain material costs, such as depreciation, amortization and interest, necessary to operate our business. EBITDA is not measured under generally accepted accounting principles and, when analyzing our operating performance, investors should use EBITDA in addition to, not as an alternative for, operating income, net income and cash flows from operating activities. Investors also should note that our presentation of EBITDA may not be comparable to similarly titled measures used by other companies. |
EBITDA is calculated in the following manner for each of the periods presented:
| Year ended December 31, | ||||||||||||||||||||
| 2010 | 2009 | 2008 | 2007 | 2006 | ||||||||||||||||
| (in thousands) | ||||||||||||||||||||
| Net income |
$ | 12,744 | $ | 4,900 | $ | 14,886 | $ | 17,836 | $ | 21,009 | ||||||||||
| Add (subtract): |
||||||||||||||||||||
| Interest (income) expense, net |
(120 | ) | 266 | (12 | ) | (322 | ) | (354 | ) | |||||||||||
| Provision for income taxes |
8,712 | 3,120 | 9,369 | 11,134 | 13,124 | |||||||||||||||
| Depreciation and amortization |
10,996 | 10,354 | 9,638 | 8,163 | 5,730 | |||||||||||||||
| EBITDA |
$ | 32,332 | $ | 18,640 | $ | 33,881 | $ | 36,811 | $ | 39,509 | ||||||||||
| (2) | Excludes property and equipment acquired in connection with the acquisition of businesses in each period as follows: $117 thousand in 2010, $675 thousand in 2009, $1.2 million in 2008 and $3.8 million in 2006. |
| (3) | Net income divided by total average assets during the period. Average assets are the sum of our total assets at the end of the fiscal year and our total assets at the end of the prior fiscal year divided by two. |
| (4) | Includes only those agents who generated at least $100,000 in operating revenues during the period indicated. |
| (5) | Includes fuel surcharges and excludes operating data from our intermodal support services and the operating results of CrossRoad Carriers, D. Kratt International, and Cavalry Transportation in order to improve the relevance of the statistical data related to our truckload and brokerage services and improve the comparability to our peer companies. |
23
Table of Contents
| ITEM 7: | MANAGEMENT’S DISCUSSION AND ANALYSIS OF FINANCIAL CONDITION AND RESULTS OF OPERATIONS |
Overview
We are primarily an asset light provider of transportation services to shippers throughout the United States and in the Canadian provinces of Ontario and Quebec. We offer flatbed and dry van trucking services, as well as rail-truck and steamship-truck intermodal and truck brokerage services. We primarily operate through a contractor network of independent sales agents and owner-operators of tractors and trailers. In return for their services, we pay our agents and owner-operators a percentage of the revenue they generate for us.
Our owner-operators provided us with approximately 2,800 tractors and approximately 3,000 trailers, which represented substantially all of the tractors and over 50% of the trailers used in our business. Our use of agents and owner-operators reduces our need to provide terminals and tractor and trailer fleets. The primary physical assets we provide to our agents and owner-operators include a portion of our trailer fleet, our headquarters facility, our management information systems and our intermodal depot facilities. Our business model provides us with a highly variable cost structure, allows us to grow organically using relatively small amounts of cash, gives us a higher return on assets compared to many of our asset-based competitors and preserves an entrepreneurial spirit among our agents and owner-operators that we believe leads to improved operating performance. In 2010, approximately 84.7% of our total operating expenses were variable in nature. Our capital expenditures for 2010 were $10.3 million and our return on average assets was 6.2%.
Over the past nine years, our operating revenues have increased to $605.9 million in 2010, reaching a maximum level of $759.5 million in 2008, from $213.3 million in 2001, a compounded annual growth rate of 12.3%. We have achieved this growth through a mixture of organic growth and acquisitions. We expect to continue to make strategic acquisitions of companies that complement our asset light business model, as well as companies that derive a portion of their revenues from asset based operations. We believe that our willingness to expand our business to include a portion of asset based operations will expand the universe of potential acquisition targets, as most companies that we consider acquiring use a combination of asset based and non-asset based operations. We also intend to continue our organic growth, primarily by recruiting new agents and increasing the productivity of our existing agents. We believe that increasing our agent network is critical to our ability to penetrate new shipping markets and also to expand our network of owner-operators.
In January 2008, we acquired certain assets of Trimodal, Inc., or Trimodal, for $1,777,000 through an Asset Purchase Agreement. Trimodal is a regional provider of intermodal services in the Midwestern United States. Trimodal operates as part of Mason Dixon Intermodal, Inc.
In June 2008, we acquired certain assets of Overnite Express, Inc., or Overnite, for $1,976,000 through an Asset Purchase Agreement. We are also required to pay cash consideration to the former owners of Overnite based on a percentage of revenues generated during the period from July 1, 2008 to June 30, 2010. Overnite is a regional provider of van trucking services in the Midwestern United States. Overnite operates as part of Universal Am-Can, Ltd.
In July 2009, we acquired certain assets of the David Ohlrich Agency, or Ohlrich, for $285,000 through a Limited Asset Purchase Agreement. Ohlrich is a regional provider of flatbed services throughout the Southwestern United States. Ohlrich operates as part of Louisiana Transportation, Inc.
In August 2009, we acquired certain assets utilized in the operations of Pacer Transport, Inc., or Pacer Transport, and two of its subsidiaries, S&H Transport, Inc. and S&H Leasing, Inc., based in Desoto, Texas through a Limited Asset Purchase Agreement for approximately $2.0 million. Pacer Transport was a wholly-owned subsidiary of Pacer International, Inc. Pacer Transport is a provider of flatbed, van, and specialized heavy-haul equipment services throughout the United States. Pacer Transport operates as part of Universal Am-Can, Ltd.
24
Table of Contents
In December 2009, we acquired D. Kratt International, Inc., or D. Kratt, through a Stock Purchase Agreement for approximately $2.0 million. Included in the estimated purchase price is approximately $546,000 of additional consideration estimated to be paid the former owner of D. Kratt based on a percentage of revenues generated through December 2012. D. Kratt is a full service international freight forwarding and customs house brokerage firm based in Chicago, IL. D. Kratt also provides extensive domestic and international logistics and warehousing functions, as well as comprehensive documentary and cargo insurance services. D. Kratt operates as part of Universal Logistics, Inc.
In January 2010, we acquired Cavalry Transportation, LLC and Cavalry Logistics, LLC, or Cavalry, based in Nashville, Tennessee, through a Membership Interest Purchase Agreement for $2,688,000. Cavalry offers fully integrated transportation resources designed to maximize value for its customers through logistic solutions in intermodal, truckload, and less-than-truckload transportation options. Cavalry operates as a wholly-owned subsidiary of Universal Truckload Services, Inc.
In January 2010, we acquired certain assets of TSD Transportation L.P., or TSD, based in Texarkana, Texas, through a Limited Asset Purchase Agreement for $684,000. Included in the estimated purchase price is approximately $434,000 of additional consideration estimated to be paid to the former owners of TSD based on a percentage of revenues generated through December 31, 2011. TSD operates as part of Louisiana Transportation, Inc.
Revenues and Expenses
Operating Revenues. We generate substantially all of our revenues through fees charged to customers for the transportation of freight. We also derive revenue from fuel surcharges, loading and unloading activities, equipment detention, container storage and other services. Our historical revenue growth has been primarily driven by increases in the volume of freight shipped. Generally, we are paid by the mile for our services. The main factors that affect our shipping rates are competition, available truck capacity, and economic market conditions. We recognize our revenues at the time of delivery to the receiver’s location. For service arrangements, we recognize revenue after the related services have been rendered.
Purchased transportation. Purchased transportation represents the amount we pay our owner-operators or other third party equipment providers to haul freight and includes the amount of fuel surcharges that we pass through to our owner-operators. The amount of the purchased transportation we pay to our owner-operators is primarily based on a contractually agreed-upon percentage of our revenue for each load hauled. Purchased transportation is the largest component of our costs and increases or decreases proportionately with changes in the amount of revenue generated by our owner-operators and other third party providers. We recognize purchased transportation expenses at the time we recognize the associated revenue.
Commissions expense. Commissions expense represents the amount we pay our agents for generating shipments on our behalf. The commissions we pay to our agents are generally established through informal oral agreements and are based on a percentage of revenue generated by each load hauled. Traditionally, commissions increase or decrease in proportion to the revenues generated through our agents. We recognize commission expenses at the time we recognize the associated revenue.
Other operating expense. Other operating expenses represent the repair, tires and parts expenses primarily related to the maintenance of company owned/leased trailers and lift equipment, and operating taxes and licenses, net of the rental income we receive from leasing our trailers to our owner-operators. We recognize these expenses as they are incurred and the rental income as it is earned.
Selling, general and administrative. Employee compensation and benefits historically have accounted for over 60% of our selling, general and administrative expense. Other components of selling, general and administrative expense include allowance for doubtful customer accounts, communications and rent expense.
25
Table of Contents
Insurance and claims. Insurance and claims expense represents our insurance premiums and the accruals we make for claims within our self-insured retention amounts. Our insurance premiums are generally calculated based on the size of our tractor fleet. Our accruals have primarily related to cargo and property damage claims. We may also make accruals for personal injuries and property damage to third parties, physical damage to our equipment, and workers’ compensation claims if we experience a claim in excess of our insurance coverage. To reduce our exposure to non-trucking use liability claims (claims incurred while the vehicle is being operated without a trailer attached or is being operated with an attached trailer which does not contain or carry any cargo), we require our owner-operators to maintain non-trucking use liability coverage, which we refer to as deadhead bobtail coverage, of $2.0 million per occurrence. Our exposure to liability associated with accidents incurred by other third party providers who haul freight on our behalf is reduced by various factors including the extent to which they maintain their own insurance coverage. Our insurance expense varies primarily based upon the frequency and severity of our accident experience, insurance rates, our coverage limits and our self-insured retention amounts.
Depreciation and amortization. Depreciation and amortization expense relates primarily to the depreciation of trailers, management information services equipment, buildings and equipment as well as the amortization of the intangible assets recorded for our acquired customer and agent relationships. We estimate the salvage value and useful lives of depreciable assets based on current market conditions and experience with past dispositions.
Results of Operations
The following table sets forth items derived from our consolidated statements of income for the years ended December 31, 2010, 2009 and 2008, presented as a percentage of operating revenues:
| Year Ended December 31, | ||||||||||||
| 2010 | 2009 | 2008 | ||||||||||
| Operating revenues |
100 | % | 100 | % | 100 | % | ||||||
| Operating expenses: |
||||||||||||
| Purchased transportation |
76.1 | 75.1 | 78.1 | |||||||||
| Commissions expense |
6.4 | 6.7 | 6.2 | |||||||||
| Other operating expenses |
2.2 | 2.0 | 1.3 | |||||||||
| Selling, general and administrative |
8.1 | 8.8 | 6.9 | |||||||||
| Insurance and claims |
2.8 | 3.4 | 2.8 | |||||||||
| Depreciation and amortization |
1.8 | 2.1 | 1.3 | |||||||||
| Total operating expenses |
97.5 | 98.2 | 96.5 | |||||||||
| Income from operations |
2.5 | 1.8 | 3.5 | |||||||||
| Interest and other non-operating income (expense), net |
1.0 | (0.2 | ) | (0.3 | ) | |||||||
| Income before provision for income taxes |
3.5 | 1.6 | 3.2 | |||||||||
| Provision for income taxes |
1.4 | 0.6 | 1.2 | |||||||||
| Net income |
2.1 | % | 1.0 | % | 2.0 | % | ||||||
2010 Compared to 2009
Operating revenues. Operating revenues increased by $102.7 million, or 20.4%, to $605.9 million for 2010 from $503.2 for 2009. The increase in operating revenues is primarily attributable to an increase in the number of loads in our truckload and intermodal operations, an increase in our brokerage operations attributable to our acquisitions made since the third quarter of 2009, an increase in our operating revenue per loaded mile, and an increase in fuel surcharges. The increase in the number of loads in our truckload operations is primarily attributable to our acquisitions made since the third quarter of 2009, and the increase in the number of loads in our intermodal operations is attributable to organic growth. The number of loads from our combined truckload and intermodal operations was 639,000 for 2010 compared to 569,000 for 2009. Included in operating revenues
26
Table of Contents
are fuel surcharges of $54.2 million for 2010 compared to $35.9 million for 2009. For 2010, our operating revenue per loaded mile, excluding fuel surcharges, from our combined truckload and brokerage operations increased to $2.25 from $2.04 for 2009. Included in operating revenue is approximately $62.4 million of revenue attributable to acquisitions made since the third quarter of 2009, which consists of $31.6 million in truckload operations and $30.8 million in brokerage operations. Excluding the effects of acquisitions made since the third quarter of 2009, revenue from our truckload operations increased by $24.9 million, or 7.9%, to $338.5 million for 2010 from $313.6 million for 2009. Excluding the effects of acquisitions made since the third quarter of 2009, revenue from our brokerage operations increased by $4.2 million, or 3.7%, to $117.1 million for 2010 compared to $112.9 million for 2009. Revenue from our intermodal support services increased by $11.2 million, or 14.5%, to $87.9 million for 2010 from $76.7 million for 2009.
Purchased transportation. Purchased transportation expense for 2010 increased by $83.0 million, or 22.0%, to $461.0 million from $378.0 million for 2009. As a percentage of operating revenues, purchased transportation expense increased to 76.1% for 2010 from 75.1% for 2009. The absolute increase was primarily due to the increase in our operating revenues. Purchased transportation expense generally increases or decreases in proportion to the revenues generated through owner-operators and other third party providers. The increase in purchased transportation as a percent of operating revenues is primarily due to an increase in fuel surcharges, which are passed through to owner-operators, and a higher cost of transportation in our brokerage business.
Commissions expense. Commissions expense for 2010 increased by $4.9 million, or 14.3%, to $38.8 million from $33.9 million for 2009. As a percentage of operating revenues, commissions expense decreased to 6.4% for 2010 compared to 6.7% for 2009. The absolute increase was primarily due to the increase in our operating revenues. Commissions expense generally increases or decreases in proportion to the revenues. As a percentage of revenues, the decrease in commissions expense is due to an increase in fuel surcharges, which are passed on through to our owner-operators, and as such, no commission is paid, and an increase in revenues generated by our company managed locations.
Other operating expense. Other operating expense increased by $3.0 million, or 28.7%, to $13.3 million for 2010 from $10.3 million for 2009. As a percentage of operating revenues, other operating expense increased to 2.2% for 2010 from 2.0% for 2009. The absolute increase was primarily due to an increase in repairs and maintenance cost of $2.6 million primarily on company owned equipment, an increase property tax and other operating expenses of $0.7 million, and an increase licensing and permit costs of $0.4 million, associated with an increase in operating revenues. These increases were partially offset by decreases in highway use and fuel tax, and IRP plate expenses of $0.7 million.
Selling, general and administrative. Selling, general and administrative expense for 2010 increased by $5.0 million, or 11.4%, to $49.2 million from $44.2 million for 2009. As a percentage of operating revenues, selling, general and administrative expense decreased to 8.1% for 2010 compared to 8.8% for 2009. The absolute increase was primarily the result of increases in salaries and wage expense of $4.4 million, travel and entertainment costs of $0.6 million, legal and professional fees of $0.4 million, our provision for uncollectible agent loans of $0.3 million, and other selling, general, and administrative costs of $0.6 million. These increases are primarily due to the additional costs incurred in connection with the acquisitions made since the third quarter of 2009. These increases were partially offset by decreases in our bad debt expense of $0.9 million and facility related costs of $0.4 million.
Insurance and claims. Insurance and claims expense for 2010 decreased by $0.1 million, or 0.8%, to $17.2 million from $17.3 million for 2009. As a percentage of operating revenues, insurance and claims decreased to 2.8% for 2010 from 3.4% for 2009. The absolute decrease is the result of decreases in our cargo claims expense of $1.5 million and other contractor insurance and safety costs of $0.1 million. These decreases were partially offset by a $1.5 million increase in our auto liability insurance premiums and claims expense.
Depreciation and amortization. Depreciation and amortization for 2010 increased by $0.6 million, or 6.2%, to $11.0 million from $10.4 million for 2009. As a percent of operating revenues, depreciation and amortization
27
Table of Contents
decreased to 1.8% for 2010 from 2.1% for 2009. The absolute increase is primarily the result of additional depreciation on our capital expenditures made throughout 2010, and the additional amortization with respect to intangible assets resulting from the acquisitions made since the third quarter of 2009.
Interest expense, net. Net interest income for 2010 was $0.1 million compared to net interest expense of $0.3 million for 2009. The increase is primarily the result of 2009 including an assessment of interest expense in connection with the settlement of a fuel tax audit.
Other non-operating income (expense). Other non-operating income for 2010 was $6.0 million compared to other non-operating expense of $0.7 million for 2009. Included in other non-operating income in 2010 were $5.4 million in pre-tax gains on the sale of marketable equity securities compared to $1.3 million of pre-tax charges for other-than-temporary impairments of marketable equity securities classified as available-for-sale in other non-operating expense in 2009.
Provision for income taxes. Provision for income taxes for 2010 was $8.7 million compared to $3.1 million for 2009. The increase was primarily attributable to the increase in our taxable income and an increase in our effective income tax rate. The effective income tax rates for 2010 and 2009 were 40.6% and 38.9%, respectively, based upon our income before provision for income taxes. The increase in our effective tax rate is due to prior period adjustments to our state income taxes.
2009 Compared to 2008
Operating revenues. Operating revenues decreased by $256.3 million, or 33.7%, to $503.2 million for 2009 from $759.5 for 2008. The decrease in operating revenues is primarily attributable to a decrease in the number of loads in our truckload, brokerage and intermodal operations attributable to the current economic recession, a decrease in fuel surcharges, and a decrease in operating revenues per loaded mile. The number of loads from our combined truckload, brokerage, and intermodal operations was 658,000 for 2009 compared to 837,000 for 2008. Included in operating revenues are fuel surcharges of $35.9 million for 2009 compared to $101.3 million for 2008. For 2009, our operating revenue per loaded mile, excluding fuel surcharges, from our combined truckload and brokerage operations decreased to $2.04 from $2.39 for 2008. These decreases in our operating revenues were partially offset by increases in revenue attributable to acquisitions made since the beginning 2008. Included in operating revenues is approximately $21.0 million attributable to these acquisitions, consisting of $17.1 million in truckload operations, $3.1 million in brokerage operations, and $0.8 million in intermodal operations. Excluding the effects of these acquisitions, revenue from our truckload operations decreased by $141.8 million, or 32.4%, to $296.4 million for 2009 from $438.2 million for 2008. Excluding the effects of these acquisitions, revenue from our brokerage operations decreased by $98.5 million, or 47.3%, to $109.8 million for 2009 compared to $208.3 million for 2008. Excluding the effects of these acquisitions, revenue from our intermodal support services decreased by $37.1 million, or 32.8%, to $76.0 million for 2009 from $113.0 million for 2008.
Purchased transportation. Purchased transportation expense for 2009 decreased by $215.0 million, or 36.3%, to $378.0 million from $593.0 million for 2008. As a percentage of operating revenues, purchased transportation expense decreased to 75.1% for 2009 from 78.1% for 2008. The absolute decrease was primarily due to the decrease in our operating revenues. Purchased transportation expense generally increases or decreases in proportion to the revenues generated through owner-operators and other third party providers. The decrease in purchased transportation as a percent of operating revenues is primarily due to a decrease in fuel surcharges, which are passed through to owner-operators and a change in the mix of operating revenues attributable to lower brokerage revenues, which typically payout at higher purchased transportation rates than truckload and intermodal revenues. Fuel surcharges for 2009 were $35.9 million compared to $101.3 million for 2008.
Commissions expense. Commissions expense for 2009 decreased by $13.4 million, or 28.3%, to $33.9 million from $47.3 million for 2008. As a percentage of operating revenues, commissions expense increased to 6.7% for 2009 compared to 6.2% for 2008. The absolute decrease was primarily due to the decrease in our operating
28
Table of Contents
revenues. As a percentage of revenues, commissions expense increased primarily due to $65.3 million of the decrease in operating revenues being attributable to a decrease in fuel surcharges, which are passed on through to our owner-operators, and as such, no commission is paid.
Other operating expense. Other operating expense increased by $0.8 million, or 8.5%, to $10.3 million for 2009 from $9.5 million for 2008. As a percentage of operating revenues, other operating expense increased to 2.0% for 2009 from 1.3% for 2008. The absolute increase was primarily attributable to an increase in repairs and maintenance expenses on our company equipment and an increase in our highway use and fuel tax expense due to the settlement of a fuel tax audit. These increases were partially offset by a decrease in licensing and permit costs, associated with decreases in operating revenues, and a decrease in other operating costs due to several cost saving initiatives and terminal consolidations.
Selling, general and administrative. Selling, general and administrative expense for 2009 decreased by $7.8 million, or 15.0%, to $44.2 million from $52.0 million for 2008. As a percentage of operating revenues, selling, general and administrative expense increased to 8.8% for 2009 compared to 6.9% for 2008. The absolute decrease in selling, general and administrative expense was primarily the result of a $5.9 million decrease in compensation expense due to reductions in employee headcounts and several cost savings measures that include company wide pay decreases, the implementation of unpaid time-off in the second quarter of 2009 and a change in our earned vacation policy. Other cost saving initiatives resulted in decreases in travel and entertainment expenditures of $650 thousand, a decrease in other selling, general, and administrative costs of $1.3 million, and decreases in building rents and office supplies of $975 thousand. These decreases were partially offset by an increase in our allowance for doubtful accounts of $855 thousand, an increase in communications and utilities of $130 thousand and increase in salaries, wages and benefit cost attributed to our acquisitions made throughout 2008 and 2009.
Insurance and claims. Insurance and claims expense for 2009 decreased by $4.1 million, or 18.9%, to $17.3 million from $21.4 million for 2008. As a percentage of operating revenues, insurance and claims increased to 3.4% for 2009 from 2.8% for 2008. The absolute decrease is primarily the result of a $5.1 million decrease in auto liability insurance premiums and claims expense which was partially offset by a $1.1 million increase in other contractor insurance, cargo claims and safety costs.
Depreciation and amortization. Depreciation and amortization for 2009 increased by $0.7 million, or 7.4%, to $10.3 million from $9.6 million for 2008. As a percent of operating revenues, depreciation and amortization increased to 2.1% for 2009 from 1.3% for 2008, which is primarily attributable to lower operating revenues. The absolute increase is primarily the result of additional depreciation on our capital expenditures made throughout 2009.
Interest expense, net. Net interest expense for 2009 was $266 thousand compared to net interest income of $12 thousand for 2008. The increase in interest expense is primarily the result of interest expense assessed in connection with the settlement of a fuel tax.
Other non-operating income (expense). Other non-operating expense for 2009 was $733 thousand compared to $2.4 million for 2008. Included in other non-operating expense in 2009 were $1.3 million of pre-tax charges for other-than-temporary impairments of marketable equity securities classified as available-for-sale offset by $525 thousand of dividend income compared to $3.6 million of pre-tax charges for other-than-temporary impairments in 2008 offset by $950 thousand of dividend income and $300 thousand of gains on the sale of marketable equity securities.
Provision for income taxes. Provision for income taxes decreased by $6.2 million, or 66.7%, to $3.1 million for 2009 from $9.4 million for 2008. The effective income tax rate was 38.9% for 2009 compared to 38.6% for 2008, based upon our income before provision for income taxes.
29
Table of Contents
Liquidity and Capital Resources
Our primary sources of liquidity are funds generated by operations, proceeds from the sales of marketable securities, and our revolving unsecured line of credit with KeyBank.
We employ a primarily asset-light operating strategy. Substantially all of the tractors and more than 50% of the trailers utilized in our business are provided by our owner-operators and we have no capital expenditure requirements relating to this equipment. As a result, our capital expenditure requirements are limited in comparison to most large trucking companies which maintain sizable fleets of owned tractors and trailers, requiring significant capital expenditures.
In 2010, we have made capital expenditures totaling $10.3 million. These expenditures primarily consisted of land and improvements, tractors and trailers, and computer equipment.
In 2011, exclusive of acquisitions, we expect to incur capital expenditures of $1.6 million to $2.2 million relating to real property acquisitions and improvements to our existing facilities and terminal yards. We also expect to incur capital expenditures of $9.5 million to $10.6 million for tractors, trailers, containers, and other equipment.
We expect that our working capital and available borrowings will be sufficient to meet our capital commitments and fund our operational needs for at least the next twelve months. Based on the availability under our unsecured line of credit and assuming the continuation of our current operating cash flows, we do not expect that we will experience any liquidity constraints in the foreseeable future.
We continue to evaluate business development opportunities, including potential acquisitions that fit our strategic plans. There can be no assurance that we will identify any opportunities that fit our strategic plans or will be able to execute any such opportunities on terms acceptable to us. Any such opportunities will be financed from available cash and cash equivalents, and our unsecured line of credit.
We currently intend to retain our future earnings to finance our growth and do not anticipate paying cash dividends in the foreseeable future.
Unsecured Line of Credit
On October 28, 2010, the Company and KeyBank National Association, or KeyBank, entered into an Amended and Restated Loan Agreement and Promissory Note, collectively referred to as the Agreement, for the period October 25, 2010 to October 24, 2011, thereby replacing the previous loan agreements. Under the Agreement with KeyBank, the Company’s maximum permitted borrowings and letters of credit in the aggregate may not exceed $20 million. The line of credit is unsecured, and bears interest at a rate equal to the lesser of the Prime Rate minus 0.50% or LIBOR plus 1.00% (effective rate of 1.26% at December 31, 2010). The Agreement governing our unsecured line of credit contains various financial and restrictive covenants to be maintained by the Company including requirements to maintain a tangible net worth of at least $85 million, a debt to tangible net worth ratio not to exceed 1 to 1, and quarterly net profits of at least one dollar. For purposes of this Agreement, tangible net worth is defined as total assets, excluding all intangible assets, less total debt. The Agreement also may, in certain circumstances, limit our ability to pay dividends or distributions utilizing our line of credit. The Agreement also contains customary representations and warranties, affirmative and negative covenants and events of default. As of December 31, 2010, the Company was in compliance with its debt covenants. The Company did not have any amounts outstanding under its line of credit at December 31, 2010, and there were $1,300,000 letters of credit issued against the line.
Discussion of Cash Flows
At December 31, 2010, we had cash and cash equivalents of $6.3 million compared to $1.0 million at December 31, 2009. The increase in cash and cash equivalents of $5.3 million in 2010 resulted from $12.5 million
30
Table of Contents
in cash provided by operating activities partially offset by $1.7 million of in cash used in investing activities and $5.5 million in cash used in financing activities.
The $12.5 million in cash provided by operations was primarily attributed to $12.7 million of net income adjusted for $11.0 million of non-cash charges for depreciation and amortization, $5.4 million of gains on the sales of marketable securities, $1.2 million of non-cash charges for provisions for doubtful accounts, $0.7 million in changes in deferred income taxes, and an increase in the working capital position of the Company of $6.5 million. The increase in the working capital position is primarily the result of an increase in accounts receivable due to increased sales, which was partially offset by a decrease in prepaid expenses and other assets and an increase in accounts payable and other current liabilities.
The $1.7 million in net cash used in investing activities in 2010 consisted of $10.3 million of capital expenditures, $2.6 million in purchases of marketable securities, and $0.4 million for the acquisition of businesses, partially offset by $11.4 million in proceeds from the sales of marketable securities and $0.4 million in proceeds on the sale of property and equipment. In 2009, the Company made $2.7 million in advances for the acquisitions of businesses.
The $5.5 million in cash used in financing activities in 2010 consisted of $0.5 million in repayments on our loan from Cuyahoga County, $0.4 for the payments of earnout obligations on acquisitions, and $4.6 million for purchases of treasury stock under our stock repurchase plan.
Contractual Obligations
The following summarizes our contractual obligations at December 31, 2010, and the effect such obligations are expected to have on our liquidity and cash flow in future periods (in thousands):
| Total | Payments due by period | |||||||||||||||||||
| Contractual Obligations |
Less Than 1 Year |
1 – 3 Years |
3 – 5 Years |
More Than 5 Years |
||||||||||||||||
| Short-term debt |
$ | 90 | $ | 90 | $ | — | $ | — | $ | — | ||||||||||
| Operating Lease Obligations |
1,423 | 654 | 757 | 12 | — | |||||||||||||||
| Total |
$ | 1,513 | $ | 744 | $ | 757 | $ | 12 | $ | — | ||||||||||
The short-term debt represents the un-forgiven amount due under the loan from the County of Cuyahoga, Ohio, to be forgiven provided the Company meets the conditions for forgiveness at the next measurement period and is included in other current liabilities. As of December 31, 2010, the total amount of gross unrecognized tax benefits was $632,000. This amount is not included in the above table as the Company cannot reasonably estimate the timing of cash settlements, if any, with taxing authorities.
Off-Balance Sheet Arrangements
None.
Legal Matters
We are subject to various legal proceedings and other contingencies, the outcomes of which are subject to significant uncertainty. We accrue for estimated losses if it is probable that an asset has been impaired or a liability has been incurred and the amount of the loss can be reasonably estimated. We use judgment and evaluate, with the assistance of legal counsel, whether a loss contingency arising from litigation should be disclosed or recorded. The outcome of legal proceedings is inherently uncertain and so typically a loss cannot be reasonably estimated. Accordingly, if the outcome of legal proceedings are different than is anticipated by us, we would have to record a charge for the matter, generally in the full amount at which it was resolved, in the period resolved, negatively impacting our results of operations and financial position for the period.
31
Table of Contents
Critical Accounting Policies
Our financial statements have been prepared in accordance with U.S. generally accepted accounting principles. The preparation of these financial statements requires us to make estimates and judgments that affect the reported amounts of assets, liabilities, operating revenues and operating expenses.
Critical accounting policies are those that are both (1) important to the portrayal of our financial condition and results of operations and (2) require management’s most difficult, subjective or complex judgments, often as a result of the need to make estimates about the effect of matters that are inherently uncertain. As the number of variables and assumptions affecting the possible future resolution of the uncertainties increase, those judgments become even more subjective and complex. In order to provide an understanding about how our management forms its judgments about future events, including the variables and assumptions underlying the estimates, and the sensitivity of those judgments to different circumstances, we have identified our critical accounting policies below.
Allowance for Uncollectible Receivables
The allowance for potentially uncollectible receivables is based on a combination of historical data, cash payment trends, specific customer issues, write-off trends, general economic conditions and other factors. Management continuously monitors these factors to arrive at the estimate of accounts receivable that may be ultimately uncollectible. The receivables analyzed include trade receivables, as well as loans and advances made to owner-operators. All other balances are reviewed on a pooled basis. This analysis requires us to make significant estimates. Changes in the facts and circumstances that these estimates are based upon and changes in the general economic environment could result in a material change to the allowance for uncollectible receivables. These changes include, but are not limited to, deterioration of customers’ financial position, changes in our relationships with our customers, agents and owner-operators and unforeseen issues relating to individual receivables.
Insurance and Claim Costs
We maintain auto liability, workers compensation and general liability insurance with licensed insurance carriers. We are self-insured for all cargo and equipment damage claims. Insurance and claims expense represents premiums paid by us and the accruals made for claims within our self-insured retention amounts. A liability is recognized for the estimated cost of all self-insured claims including an estimate of incurred but not reported claims based on historical experience and for claims expected to exceed the our policy limits. In addition, we are responsible for all of the legal expenses related to claims.
As of December 31, 2010, we did not have any reserves for workers’ compensation or general liability claims. We do establish reserves for anticipated losses and expenses related to cargo and equipment damage claims and auto liability claims. The reserves consist of specific reserves for all known claims and an estimate for claims incurred but not reported, and losses arising from known claims ultimately settling in excess of insurance coverage using loss development factors based upon industry data and past experience. In determining the reserves, we specifically review all known claims and record a liability based upon our best estimate of the amount to be paid. In making our estimate, we consider the amount and validity of the claim, as well as our past experience with similar claims. In establishing the reserve for claims incurred but not reported, we consider our past claims history, including the length of time it takes for claims to be reported to us. Based on our past experience, the time between when a claim occurs and when it is reported to us is short. As a result, we believe that the number of incurred but not reported claims at any given point in time is small. These reserves are periodically reviewed and adjusted to reflect our experience and updated information relating to specific claims. If we experience claims that are not covered by our insurance or that exceed our estimated claim reserve, it could increase the volatility of our earnings and have a materially adverse effect on our financial condition and results of operations.
32
Table of Contents
Valuation of Long-Lived Asset, including Goodwill and Intangible Assets
We are required to test goodwill for impairment annually or more frequently, whenever events occur or circumstances change that would more likely than not reduce the fair value of a reporting unit with goodwill below its carrying amount. We annually test goodwill impairment as of the last day of our 2nd fiscal quarter. Goodwill represents the excess purchase price over the fair value of assets acquired in connection with our acquisitions. We continually assess whether any indicators of impairment exist, which requires a significant amount of judgment. Such indicators may include a sustained significant decline in our share price and market capitalization; a decline in our expected future cash flows; a significant adverse change in legal factors or in the business climate; unanticipated competition; overall weaknesses in our industry; and slower growth rates. Adverse changes in these factors could have a significant impact on the recoverability of goodwill and could have a material impact on our consolidated financial statements. The goodwill impairment test is a two-step test. Under the first step, we compare the fair value of each of the Company’s reporting units with goodwill to their related carrying values. If the fair value of a reporting unit is less than its carrying value, an indication of goodwill impairment exists for the reporting unit and we must perform step two of the impairment test. Under step two, an impairment loss is recognized for any excess of the carrying amount of the reporting unit’s goodwill over the implied fair value of that goodwill. Determining the fair value of a reporting unit requires the use of significant estimates and assumptions. The Company estimates the fair value of its reporting units utilizing the income approach through the application of a discounted cash flow analysis. Key assumptions used to determine the fair value of each reporting unit are: (a) future expected cash flows; (b) estimated residual growth rates; and (c) discount rates, which were based on the Company’s best estimates of the after-tax weighted-average cost of capital. Additionally, the Company considers its market capitalization in comparison to the fair value of its reporting units. During the third quarter of 2010, we completed our goodwill impairment testing and determined that the fair value of each reporting unit with goodwill exceeded the carrying value of its net assets. Accordingly, no impairment loss was recognized.
We evaluate the carrying value of long-lived assets, other than goodwill, for impairment by analyzing the operating performance and anticipated future cash flows for those assets, whenever events or changes in circumstances indicate that the carrying amounts of such assets may not be recoverable. We evaluate the need to adjust the carrying value of the underlying assets if the sum of the expected cash flows is less than the carrying value. Our projection of future cash flows, the level of actual cash flows, the methods of estimation used for determining fair values and salvage values can impact impairment. Any changes in management’s judgments could result in greater or lesser annual depreciation and amortization expense or impairment charges in the future. Depreciation and amortization of long-lived assets is calculated using the straight-line method over the estimated useful lives of the assets.
Other-than-temporary Impairments
Periodically, we review all available-for-sale securities for other-than-temporary impairment. An impairment that is an other-than-temporary impairment is a decline in the fair value of a security below its cost basis attributable to factors that indicate the cost basis in the security may not be recoverable in the near term. The determination of an other-than-temporary impairment is a subjective process, and requires judgment and assumptions that could affect the timing of loss realization. We consider several factors including the severity and duration of the decline, the financial condition and near-term prospects of the specific issuers and the industries in which they operate, and our intent and ability to hold these securities for a sufficient period of time to allow for a recovery. If, in our judgment, the impairment is determined to be other-than-temporary, the cost basis of the security is written down to the then-current market value, and the unrealized loss is transferred from accumulated other comprehensive loss as an immediate reduction of current earnings. Gross unrealized holding losses of $0.2 million as of December 31, 2010 have not been recognized in earnings as these impairments in value were judged to be temporary. We may incur future impairment charges if declines in market values continue or worsen and impairments are no longer considered temporary.
33
Table of Contents
Recently Issued Accounting Pronouncements Not Currently Effective
See Item 8: Note 1(u) to the Consolidated Financial Statements for discussion of new accounting pronouncements.
ITEM 7A: QUANTITATIVE AND QUALITATIVE DISCLOSURES ABOUT MARKET RISK
Interest Rate Risk
Our market risk is affected by changes in interest rates. Our unsecured line of credit with Key Bank bears interest at a floating rate equal to the lesser of the Prime Rate minus 0.50% or LIBOR plus 1.00%. Accordingly, changes in the Prime Rate or LIBOR would affect the interest rate on and therefore our cost under the line of credit. We currently do not have an outstanding balance under our line of credit.
Included in cash and cash equivalents is $59 thousand in short-term investment grade instruments. The interest rates on these instruments are adjusted to market rates at least monthly. In addition, we have the ability to put these instruments back to the issuer at any time. Accordingly, any future interest rate risk on these short-term investments would not be material.
Commodity Price Risk
Fluctuations in fuel prices can affect our profitability by affecting our ability to retain or recruit owner-operators. Our owner-operators bear the costs of operating their tractors, including the cost of fuel. The tractors operated by our owner-operators consume large amounts of diesel fuel. Diesel fuel prices fluctuate greatly due to economic, political and other factors beyond our control. To address fluctuations in fuel prices, we seek to impose fuel surcharges on our customers and pass these surcharges on to our owner-operators. Historically, these arrangements have not fully protected our owner-operators from fuel price increases. If costs for fuel escalate significantly it could make it more difficult to attract additional qualified owner-operators and retain our current owner-operators. If we lose the services of a significant number of owner-operators or are unable to attract additional owner-operators, it could have a materially adverse effect on our financial condition and results of operations.
Short Term Investments
The Company from time to time invests cash in excess of its current needs in marketable securities, much of which is held in equity securities, which are actively traded on public exchanges. It is the philosophy of the Company to minimize the risk of capital loss without foregoing the potential for capital appreciation through investing in value-and-income oriented investments. However, holding equity securities subjects the Company to fluctuations in the market value of its investment portfolio based on current market prices. A drop in market prices or other unstable market conditions could cause a loss in the value of the Company’s marketable securities classified as available-for-sale.
Marketable securities are carried at fair value and are marked to market at the end of each quarter, with the unrealized gains and losses, net of tax, included as a component of accumulated other comprehensive income, unless the declines in value are judged to be other-than-temporary, in which case an impairment charge would be included in the determination of net income. Gross unrealized holding losses of $0.2 million as of December 31, 2010 have not been recognized in earnings as these impairments in value were judged to be temporary. We may incur future impairment charges if declines in market values continue or worsen and impairments are no longer considered temporary. See Part II, Item 8, Note 1(e) of “Notes to Consolidated Financial Statements.”
As of December 31, 2010, the fair value of equity securities was $15.0 million compared to $15.7 million at December 31, 2009. The decrease during 2010 represents sales of securities with $11.4 million in proceeds with $5.4 million in realized gains, which was partially offset by additional purchases of $2.6 million and net unrealized holding gains of $2.7 million. A 10% decrease in the market price of our marketable equity securities would cause a corresponding 10% decrease in the carrying amounts of these securities, or approximately $1.5 million.
34
Table of Contents
ITEM 8: FINANCIAL STATEMENTS AND SUPPLEMENTARY DATA
REPORT OF INDEPENDENT REGISTERED PUBLIC ACCOUNTING FIRM
The Board of Directors and Shareholders
Universal Truckload Services, Inc.:
We have audited the accompanying consolidated balance sheets of Universal Truckload Services, Inc. and subsidiaries as of December 31, 2010 and 2009, and the related consolidated statements of income, stockholders’ equity and comprehensive income (loss), and cash flows for each of the years in the three-year period ended December 31, 2010. These consolidated financial statements are the responsibility of the Company’s management. Our responsibility is to express an opinion on these consolidated financial statements based on our audits.
We conducted our audits in accordance with generally accepted auditing standards as established by the Auditing Standards Board (United States) and in accordance with the auditing standards of the Public Company Accounting Oversight Board (United States). Those standards require that we plan and perform the audit to obtain reasonable assurance about whether the financial statements are free of material misstatement. An audit includes examining, on a test basis, evidence supporting the amounts and disclosures in the financial statements. An audit also includes assessing the accounting principles used and significant estimates made by management, as well as evaluating the overall financial statement presentation. We believe that our audits provide a reasonable basis for our opinion.
In our opinion, the consolidated financial statements referred to above present fairly, in all material respects, the financial position of Universal Truckload Services, Inc. and subsidiaries as of December 31, 2010 and 2009, and the results of their operations and their cash flows for each of the years in the three-year period ended December 31, 2010, in conformity with U.S. generally accepted accounting principles.
We also have audited, in accordance with the standards of the Public Company Accounting Oversight Board (United States), Universal Truckload Services, Inc. and subsidiaries’ internal control over financial reporting as of December 31, 2010, based on criteria established in Internal Control—Integrated Framework issued by the Committee of Sponsoring Organizations of the Treadway Commission (COSO), and our report dated March 15, 2011 expressed an unqualified opinion on the effectiveness of the Company’s internal control over financial reporting.
The Company has changed its method of accounting for business combinations in 2009 due to the adoption of Financial Accounting Standards Board Statement No. 141R, Business Combinations (included in FASB ASC Topic 805, Business Combinations), as of January 1, 2009.
/s/ KPMG LLP
Detroit, Michigan
March 15, 2011
35
Table of Contents
UNIVERSAL TRUCKLOAD SERVICES, INC.
Consolidated Balance Sheets
December 31, 2010 and 2009
(In thousands, except share data)
| 2010 | 2009 | |||||||
| Assets | ||||||||
| Current assets: |
||||||||
| Cash and cash equivalents |
$ | 6,261 | $ | 953 | ||||
| Marketable securities |
15,041 | 15,721 | ||||||
| Accounts receivable—net of allowance for doubtful accounts of $4,540 and $5,464, respectively |
68,833 | 60,701 | ||||||
| Due from CenTra and affiliates |
80 | — | ||||||
| Prepaid income taxes |
1,821 | 2,310 | ||||||
| Prepaid expenses and other |
6,488 | 6,185 | ||||||
| Deferred income taxes |
2,973 | 3,754 | ||||||
| Total current assets |
101,497 | 89,624 | ||||||
| Property and equipment |
116,461 | 108,608 | ||||||
| Less accumulated depreciation |
(38,255 | ) | (32,362 | ) | ||||
| Property and equipment—net |
78,206 | 76,246 | ||||||
| Goodwill |
17,231 | 14,226 | ||||||
| Intangible assets—net of accumulated amortization of $15,803 and $12,393, respectively |
11,977 | 14,564 | ||||||
| Other assets |
3,137 | 6,951 | ||||||
| Total assets |
$ | 212,048 | $ | 201,611 | ||||
| Liabilities and Shareholders’ Equity | ||||||||
| Current liabilities: |
||||||||
| Accounts payable |
$ | 23,773 | $ | 25,100 | ||||
| Accrued expenses and other current liabilities |
18,521 | 15,028 | ||||||
| Due to CenTra and affiliates |
— | 177 | ||||||
| Total current liabilities |
42,294 | 40,305 | ||||||
| Long-term liabilities: |
||||||||
| Long-term debt |
— | 730 | ||||||
| Deferred income taxes |
5,425 | 5,823 | ||||||
| Other long-term liabilities |
118 | 328 | ||||||
| Total long-term liabilities |
5,543 | 6,881 | ||||||
| Shareholders’ equity: |
||||||||
| Common stock, no par value. Authorized 40,000,000 shares; 16,122,483 shares issued; 15,667,483 and 15,980,483 shares outstanding, respectively |
16,122 | 16,122 | ||||||
| Paid-in capital |
79,914 | 79,914 | ||||||
| Treasury stock, at cost; 455,000 and 142,000 shares, respectively |
(6,625 | ) | (2,058 | ) | ||||
| Retained earnings |
72,559 | 59,815 | ||||||
| Accumulated other comprehensive income—unrealized holding gain on available-for-sale securities, net of income taxes of $(1,524) and $(399), respectively |
2,241 | 632 | ||||||
| Total shareholders’ equity |
164,211 | 154,425 | ||||||
| Total liabilities and shareholders’ equity |
$ | 212,048 | $ | 201,611 | ||||
See accompanying notes to consolidated financial statements.
36
Table of Contents
UNIVERSAL TRUCKLOAD SERVICES, INC.
Consolidated Statements of Income
Years ended December 31, 2010, 2009 and 2008
(In thousands, except per share data)
| 2010 | 2009 | 2008 | ||||||||||
| Operating revenues: |
||||||||||||
| Truckload, including related party amounts of $130, $2 and $201, respectively |
$ | 370,096 | $ | 313,573 | $ | 438,203 | ||||||
| Brokerage |
147,970 | 112,914 | 208,289 | |||||||||
| Intermodal |
87,877 | 76,743 | 113,025 | |||||||||
| Total operating revenues |
605,943 | 503,230 | 759,517 | |||||||||
| Operating expenses: |
||||||||||||
| Purchased transportation, including related party amounts of |
||||||||||||
| $0, $2 and $6,377, respectively |
461,041 | 378,008 | 592,982 | |||||||||
| Commissions expense |
38,805 | 33,953 | 47,333 | |||||||||
| Other operating expense, including related party amounts of $213, $52 and $28, respectively |
13,276 | 10,316 | 9,510 | |||||||||
| Selling, general, and administrative, including related party amounts of $5,266, $4,923 and $3,782, respectively |
49,253 | 44,232 | 52,036 | |||||||||
| Insurance and claims, including related party amounts of |
||||||||||||
| $13,884, $11,959 and $15,289, respectively |
17,205 | 17,348 | 21,388 | |||||||||
| Depreciation and amortization |
10,996 | 10,354 | 9,638 | |||||||||
| Total operating expenses |
590,576 | 494,211 | 732,887 | |||||||||
| Income from operations |
15,367 | 9,019 | 26,630 | |||||||||
| Interest income |
136 | 90 | 150 | |||||||||
| Interest expense |
(16 | ) | (356 | ) | (138 | ) | ||||||
| Other non-operating income (expense), net |
5,969 | (733 | ) | (2,387 | ) | |||||||
| Income before provision for income taxes |
21,456 | 8,020 | 24,255 | |||||||||
| Provision for income taxes |
8,712 | 3,120 | 9,369 | |||||||||
| Net income |
$ | 12,744 | $ | 4,900 | $ | 14,886 | ||||||
| Earnings per common share: |
||||||||||||
| Basic |
$ | 0.80 | $ | 0.31 | $ | 0.93 | ||||||
| Diluted |
$ | 0.80 | $ | 0.31 | $ | 0.93 | ||||||
| Weighted average number of common shares outstanding: |
||||||||||||
| Basic |
15,917 | 15,982 | 16,073 | |||||||||
| Diluted |
15,917 | 15,982 | 16,077 | |||||||||
| Dividends paid per common share |
$ | — | $ | 1.00 | $ | — | ||||||
| Other-than-temporary impairment losses: |
||||||||||||
| Total other-than-temporary impairment losses |
$ | — | $ | 1,258 | $ | 3,642 | ||||||
| Portion of loss recognized in other comprehensive income |
— | — | — | |||||||||
| Net impairment loss recognized in earnings |
$ | — | $ | 1,258 | $ | 3,642 | ||||||
See accompanying notes to consolidated financial statements.
37
Table of Contents
UNIVERSAL TRUCKLOAD SERVICES, INC.
Consolidated Statements of Shareholders’ Equity and Comprehensive Income (Loss)
Years ended December 31, 2010, 2009 and 2008
(In thousands)
| Common stock |
Paid-in capital |
Treasury stock |
Retained earnings |
Accumulated Other Comprehensive Income (Loss) |
Total | |||||||||||||||||||
| Balances—January 1, 2008 |
$ | 16,122 | $ | 79,914 | $ | (480 | ) | $ | 56,012 | $ | (126 | ) | $ | 151,442 | ||||||||||
| Comprehensive income |
||||||||||||||||||||||||
| Net income |
— | — | — | 14,886 | — | 14,886 | ||||||||||||||||||
| Unrealized loss on available for sale investments, net of income taxes of $393 |
— | — | — | — | (628 | ) | (628 | ) | ||||||||||||||||
| Total comprehensive income |
14,258 | |||||||||||||||||||||||
| Purchases of treasury stock |
— | — | (1,223 | ) | — | — | (1,223 | ) | ||||||||||||||||
| Balances—December 31, 2008 |
$ | 16,122 | $ | 79,914 | $ | (1,703 | ) | $ | 70,898 | $ | (754 | ) | $ | 164,477 | ||||||||||
| Comprehensive income |
||||||||||||||||||||||||
| Net income |
— | — | — | 4,900 | — | 4,900 | ||||||||||||||||||
| Unrealized gain on available for sale investments, net of income taxes of $(874) |
— | — | — | — | 1,386 | 1,386 | ||||||||||||||||||
| Total comprehensive income |
6,286 | |||||||||||||||||||||||
| Dividends paid ($1.00 per share) |
— | — | — | (15,983 | ) | — | (15,983 | ) | ||||||||||||||||
| Purchases of treasury stock |
— | — | (355 | ) | — | — | (355 | ) | ||||||||||||||||
| Balances—December 31, 2009 |
$ | 16,122 | $ | 79,914 | $ | (2,058 | ) | $ | 59,815 | $ | 632 | $ | 154,425 | |||||||||||
| Comprehensive income |
||||||||||||||||||||||||
| Net income |
— | — | — | 12,744 | — | 12,744 | ||||||||||||||||||
| Unrealized gain on available for sale investments, net of income taxes of $(1,125) |
— | — | — | — | 1,609 | 1,609 | ||||||||||||||||||
| Total comprehensive income |
14,353 | |||||||||||||||||||||||
| Purchases of treasury stock |
— | — | (4,567 | ) | — | — | (4,567 | ) | ||||||||||||||||
| Balances—December 31, 2010 |
$ | 16,122 | $ | 79,914 | $ | (6,625 | ) | $ | 72,559 | $ | 2,241 | $ | 164,211 | |||||||||||
See accompanying notes to consolidated financial statements.
38
Table of Contents
UNIVERSAL TRUCKLOAD SERVICES, INC.
Consolidated Statements of Cash Flows
Years ended December 31, 2010, 2009 and 2008
(In thousands)
| 2010 | 2009 | 2008 | ||||||||||
| Cash flows from operating activities: |
||||||||||||
| Net income |
$ | 12,744 | $ | 4,900 | $ | 14,886 | ||||||
| Adjustments to reconcile net income to net cash provided by operating activities: |
||||||||||||
| Depreciation and amortization |
10,996 | 10,354 | 9,638 | |||||||||
| Other-than-temporary impairment of marketable securities |
— | 1,258 | 3,642 | |||||||||
| Gain on sale of marketable equity securities |
(5,370 | ) | — | (303 | ) | |||||||
| Loss on disposal of property and equipment |
300 | 266 | 72 | |||||||||
| Change in the fair value of acquisition related contingent consideration |
(145 | ) | — | — | ||||||||
| Provision for doubtful accounts |
1,248 | 2,136 | 1,483 | |||||||||
| Deferred income taxes |
(740 | ) | 1,603 | (1,964 | ) | |||||||
| Change in assets and liabilities: |
||||||||||||
| Accounts receivable |
(7,706 | ) | 7,023 | 13,493 | ||||||||
| Prepaid income taxes, prepaid expenses and other assets |
1,375 | (3,107 | ) | 2,031 | ||||||||
| Accounts payable, accrued expenses and other current liabilities |
263 | (1,127 | ) | (8,108 | ) | |||||||
| Due to CenTra and affiliates |
(257 | ) | 142 | 35 | ||||||||
| Other long-term liabilities |
(210 | ) | (531 | ) | (388 | ) | ||||||
| Net cash provided by operating activities |
12,498 | 22,917 | 34,517 | |||||||||
| Cash flows from investing activities: |
||||||||||||
| Capital expenditures |
(10,256 | ) | (22,262 | ) | (10,108 | ) | ||||||
| Proceeds from the sale of property and equipment |
438 | 442 | 419 | |||||||||
| Purchases of marketable securities |
(2,582 | ) | (6,004 | ) | (12,485 | ) | ||||||
| Proceeds from sale of marketable securities |
11,364 | 93 | 17,278 | |||||||||
| Payment of earnout obligations related to acquisitions |
(232 | ) | (505 | ) | (794 | ) | ||||||
| Advance for acquisition of business |
— | (2,658 | ) | — | ||||||||
| Acquisitions of businesses |
(441 | ) | (3,499 | ) | (4,253 | ) | ||||||
| Net cash used in investing activities |
(1,709 | ) | (34,393 | ) | (9,943 | ) | ||||||
| Cash flows from financing activities: |
||||||||||||
| Dividends paid |
— | (15,983 | ) | — | ||||||||
| Repayment of long-term debt |
(550 | ) | — | — | ||||||||
| Payment of earnout obligations related to acquisitions |
(364 | ) | — | — | ||||||||
| Purchases of treasury stock |
(4,567 | ) | (355 | ) | (1,223 | ) | ||||||
| Net cash used in financing activities |
(5,481 | ) | (16,338 | ) | (1,223 | ) | ||||||
| Net increase (decrease) in cash |
5,308 | (27,814 | ) | 23,351 | ||||||||
| Cash and cash equivalents – January 1 |
953 | 28,767 | 5,416 | |||||||||
| Cash and cash equivalents – December 31 |
$ | 6,261 | $ | 953 | $ | 28,767 | ||||||
| Supplemental cash flow information: |
||||||||||||
| Cash paid for interest |
$ | 20 | $ | 356 | $ | 138 | ||||||
| Cash paid for income taxes |
$ | 8,978 | $ | 4,367 | $ | 10,866 | ||||||
| Acquisition of businesses: |
||||||||||||
| Fair value of assets acquired, including goodwill |
$ | 5,825 | $ | 5,058 | $ | 4,433 | ||||||
| Liabilities assumed |
(2,453 | ) | (803 | ) | — | |||||||
| Advances made for acquisitions of businesses in 2009 |
(2,647 | ) | — | — | ||||||||
| Payment of acquisitions obligations |
150 | — | 500 | |||||||||
| Acquisition obligations |
(434 | ) | (756 | ) | (680 | ) | ||||||
| Net cash paid for acquisition of businesses |
$ | 441 | $ | 3,499 | $ | 4,253 | ||||||
See accompanying notes to consolidated financial statements.
39
Table of Contents
UNIVERSAL TRUCKLOAD SERVICES, INC.
Consolidated Statements of Cash Flows—Continued
Years ended December 31, 2010, 2009 and 2008
(In thousands)
Non-cash financing transactions (Note 9):
During each of the years ended December 31, 2010, 2009 and 2008, the Company recorded the forgiveness of the loan from the County of Cuyahoga of $90,000 as a reduction of the loan and as a reduction of the underlying land improvements.
See accompanying notes to consolidated financial statements.
40
Table of Contents
UNIVERSAL TRUCKLOAD SERVICES, INC.
Notes to Consolidated Financial Statements
December 31, 2010, 2009 and 2008
| (1) | Summary of Significant Accounting Policies |
| (a) | Business |
Universal Truckload Services, Inc., referred to herein as UTSI or the Company, through its subsidiaries, operates as an owner-operator and agency based truckload motor carrier in the United States and in the Canadian provinces of Ontario and Quebec. Our over-the-road trucking services include both flatbed and dry van operations and we provide rail-truck and steamship-truck intermodal support services. We also offer truck brokerage services, which allow us to supplement our capacity and provide our customers with transportation of freight not handled by our owner-operators, and full service international freight forwarding and customs house brokerage services.
| (b) | Basis of Presentation |
The consolidated financial statements include the accounts of the Company and its wholly owned subsidiaries, Universal Am-Can Ltd., or UACL, The Mason & Dixon Lines, Inc., or MADL, Mason Dixon Intermodal, Inc., or MDII, Economy Transport, Inc., or ECON, Louisiana Transportation, Inc., or LTI, Great American Lines, Inc., or GAML, CrossRoad Carriers, Inc., or CRC, NYP of Michigan, Inc., or NYP, Universal Logistics Solutions, Inc., or ULSI, D. Kratt International, Inc. or D. Kratt, and Cavalry Transportation, LLC, or Cavalry. In 2010, the Company completed two acquisitions. The activities of the acquired companies are included from the date of acquisition through December 31, 2010 (see Note 2). All significant intercompany accounts and transactions have been eliminated.
Through December 31, 2004, UTSI was a wholly owned subsidiary of CenTra, Inc. On December 31, 2004, CenTra distributed all of UTSI’s common stock to Matthew T. Moroun and a trust controlled by Manuel J. Moroun, collectively the Morouns, the sole shareholders of CenTra, Inc. CenTra, Inc., its subsidiaries and affiliates are referred to as “CenTra.” Subsequent to the initial public offering in 2005, the Morouns retained and continue to hold a controlling interest in UTSI. The accompanying consolidated financial statements present the historical financial position, results of operations, and cash flows of the Company and are not necessarily indicative of what the financial position, results of operations, or cash flows would have been had the Company operated as an unaffiliated company during the periods presented.
The Company’s fiscal year consists of four quarters, each with thirteen weeks.
Certain reclassifications have been made to the December 31, 2009 and 2008 consolidated financial statements in order for them to conform to the December 31, 2010 presentation.
| (c) | Use of Estimates |
The preparation of the consolidated financial statements requires management of the Company to make a number of estimates and assumptions related to the reported amounts of assets and liabilities and the disclosure of contingent assets and liabilities at the date of the consolidated financial statements and the reported amounts of revenues and expenses during the period. Significant items subject to such estimates and assumptions include the carrying amount of property and equipment and intangible assets; marketable securities; valuation allowances for receivables and deferred income tax assets; and liabilities related to insurance and claim costs. Actual results could differ from those estimates.
41
Table of Contents
UNIVERSAL TRUCKLOAD SERVICES, INC.
Notes to Consolidated Financial Statements—(Continued)
December 31, 2010, 2009 and 2008
| (1) | Summary of Significant Accounting Policies—continued |
| (d) | Cash and Cash Equivalents |
Cash and cash equivalents consist of cash and short-term, highly liquid investments with maturity at the time of acquisition of three months or less.
It is the policy of the Company to record checks issued in excess of funds on deposit as accounts payable for balance sheet presentation, and include the changes in these positions as cash flows from operating activities in the statements of cash flows. At December 31, 2010, funds on deposit were in excess of checks issued and no reclassification was necessary. Accounts payable included reclassification of checks issued in excess of funds on deposit in the amount of $2.4 million at December 31, 2009. The change in the reclassified amounts of checks issued in excess of funds on deposit of $(2.4) million, $2.4 million, and $(9.6) million for 2010, 2009 and 2008, respectively, is included in cash flows from operating activities in the statements of cash flows.
| (e) | Marketable Securities |
At December 31, 2010 and 2009, marketable securities, all of which are available-for-sale, consist of common and preferred stocks. Marketable securities are carried at fair value, with unrealized gains and losses, net of related income taxes, reported as accumulated other comprehensive income (loss), except for losses from impairments which are determined to be other-than-temporary. Realized gains and losses, and declines in value judged to be other-than-temporary on available-for-sale securities are included in the determination of net income and are included in other non-operating income (expense), at which time the average cost basis of these securities are adjusted to fair value. Fair values are based on quoted market prices at the reporting date. Interest and dividends on available-for-sale securities are included in other non-operating income (expense). During the years ended December 31, 2010, 2009 and 2008, the Company received proceeds of $11.4 million, $0.1 million, and $17.3 million from the sale of marketable securities with a combined cost of $6.0 million, $0.1 million, and $17.0 million resulting in a realized gain of $5.4 million, $0, and $303 thousand, respectively.
The cost, gross unrealized holding gains, gross unrealized holding losses, and fair value of available-for-sale securities by type were as follows (in thousands):
| Cost | Gross unrealized holding gains |
Gross unrealized holding (losses) |
Fair Value |
|||||||||||||
| At December 31, 2010 |
||||||||||||||||
| Equity Securities |
$ | 11,276 | $ | 3,993 | $ | (228 | ) | $ | 15,041 | |||||||
| At December 31, 2009 |
||||||||||||||||
| Equity Securities |
$ | 14,690 | $ | 2,025 | $ | (994 | ) | $ | 15,721 | |||||||
Included in equity securities at December 31, 2010 were securities with a book basis of $2.4 million and a cumulative loss position of $0.2 million, the impairment of which the Company considers to be temporary. The Company considers several factors in its determination as to whether declines in value are judged to be temporary or other-than-temporary, including the severity and duration of the decline, the financial condition and near-term prospects of the specific issuers and the industries in which they operate, and the Company’s intent and ability to hold these securities. The Company may incur future impairment charges if declines in market values continue and/or worsen and impairments are no longer considered temporary.
42
Table of Contents
UNIVERSAL TRUCKLOAD SERVICES, INC.
Notes to Consolidated Financial Statements—(Continued)
December 31, 2010, 2009 and 2008
| (1) | Summary of Significant Accounting Policies—continued |
| (e) | Marketable Securities—continued |
The fair value and gross unrealized holding losses of the Company’s marketable securities that are not deemed to be other-than-temporarily impaired aggregated by type and length of time they have been in a continuous unrealized loss position were as follows (in thousands):
| Less than 12 Months | 12 Months or Greater | Total | ||||||||||||||||||||||
| Fair Value |
Unrealized Losses |
Fair Value |
Unrealized Losses |
Fair Value |
Unrealized Losses |
|||||||||||||||||||
| At December 31, 2010 |
||||||||||||||||||||||||
| Equity securities |
$ | 2,073 | $ | 190 | $ | 95 | $ | 38 | $ | 2,168 | $ | 228 | ||||||||||||
| At December 31, 2009 |
||||||||||||||||||||||||
| Equity securities |
$ | 5,979 | $ | 892 | $ | 644 | $ | 102 | $ | 6,623 | $ | 994 | ||||||||||||
At December 31, 2010, the Company’s portfolio of equity securities in a continuous loss position, the impairment of which the Company considers to be temporary, consists primarily of common stocks in the oil and gas, banking, utility and pharmaceutical industries. The oil and gas industry accounts for approximately $0.7 million, or 34%, of the total fair value and $0.1 million, or 54%, of the total unrealized losses of equity securities in a continuous loss position and the banking industry accounts for approximately $0.5 million, or 23%, of the total fair value and $0.1 million, or 34%, of the total unrealized losses of equity securities in a continuous loss position. The utility and pharmaceutical industries accounts for approximately $0.9 million, or 43%, of the total fair value and $28 thousand, or 12%, of the total unrealized losses of equity securities in a continuous loss position.
The fair value and unrealized losses are distributed in 9 publicly traded companies. The Company has evaluated the near-term prospects of the various industries, as well as the specific issuers within its portfolio, in relation to the severity and duration of the impairments, and based on that evaluation, and the Company’s ability and intent to hold these investments for a reasonable period of time to allow for a recovery of fair value, the Company does not consider these investments to be other-than-temporarily impaired at December 31, 2010.
During the years ended December 31, 2009 and 2008, the Company recorded other-than-temporary impairment charges of $1.3 million and $3.6 million, respectively, for marketable equity securities classified as available-for-sale. These charges resulted from the Company’s equity holdings in various industries including the automotive, transportation, energy, tobacco and banking and finance, all of which had experienced severe declines in their respective stock prices. As such, the average cost basis of these securities were adjusted to fair value as of the reporting date, and the losses have been reclassified from accumulated other comprehensive income and included in other non-operating income (expense) in the consolidated statement of income for the years then ended. There were no such charges during the year ended December 31, 2010.
The Company from time to time invests cash in excess of its current needs in marketable securities, much of which is held in equity securities, which are actively traded on public exchanges. It is the philosophy of the Company to minimize the risk of capital loss without foregoing the potential for capital appreciation through investing in value-and-income oriented investments. However, holding equity securities subjects the Company to fluctuations in the market value of its investment portfolio based on current market prices, and a decline in market prices or other unstable market conditions could cause a loss in the value of the Company’s marketable securities classified as available-for-sale.
43
Table of Contents
UNIVERSAL TRUCKLOAD SERVICES, INC.
Notes to Consolidated Financial Statements—(Continued)
December 31, 2010, 2009 and 2008
| (1) | Summary of Significant Accounting Policies—continued |
| (f) | Accounts Receivable |
Accounts receivable are recorded at the invoiced amount and do not bear interest. The allowance for doubtful accounts is the Company’s best estimate of the amount of probable credit losses in the Company’s existing accounts receivable. The Company determines the allowance based on historical write-off experience and the aging of its outstanding accounts receivable. Balances are considered past due based on invoiced terms. All other balances are reviewed on a pooled basis. Account balances are charged off against the allowance after all means of collection have been exhausted and the potential for recovery is considered remote. The Company does not have any off-balance-sheet credit exposure related to its customers.
| (g) | Property and Equipment |
Property and equipment are stated at cost and depreciated on the straight-line basis over estimated useful lives of seven years for trailers and tractors, five years for computers, office equipment and miscellaneous equipment, and the remaining lease term for leasehold improvements. Annually, the Company evaluates the salvage value and useful life of trailers based on the current market environment and its recent experience with disposition values. The amounts recorded for depreciation expense were $7,586,000, $7,221,000, and $6,543,000 for the years ended December 31, 2010, 2009 and 2008, respectively.
| (h) | Intangible Assets |
Intangible assets consist of the cost of customer and agent relationships that have been acquired in business combinations. The gross amount recorded for the agent contracts and customer relationships is $27,780,000 and $26,957,000 at December 31, 2010 and 2009, respectively. The agent contracts and customer relationships are being amortized over periods ranging from seven to fifteen years which represents the expected average life of the agent and customer relationships. As of December 31, 2010, the weighted average amortization period for customer and agent relationships was approximately 9 years. Accumulated amortization is $15,803,000 and $12,393,000 as of December 31, 2010 and 2009, respectively. The amounts recorded for amortization expense were $3,410,000, $3,133,000, and $3,095,000 for the years ended December 31, 2010, 2009 and 2008, respectively.
Estimated amortization expense by year is as follows (in thousands):
| 2011 |
$ | 3,294 | ||
| 2012 |
2,838 | |||
| 2013 |
1,883 | |||
| 2014 |
1,353 | |||
| 2015 |
753 | |||
| Thereafter |
1,856 | |||
| Total |
$ | 11,977 | ||
44
Table of Contents
UNIVERSAL TRUCKLOAD SERVICES, INC.
Notes to Consolidated Financial Statements—(Continued)
December 31, 2010, 2009 and 2008
| (1) | Summary of Significant Accounting Policies—continued |
| (i) | Goodwill |
Goodwill represents the excess purchase price over the fair value of assets acquired in connection with the Company’s acquisitions. Under FASB Accounting Standards Codification, or ASC, Topic 805 “Business Combinations”, the Company is required to test goodwill for impairment annually (on the last day of the Company’s second fiscal quarter) or more frequently, whenever events occur or circumstances change that would more likely than not reduce the fair value of a reporting unit with goodwill below its carrying amount. Annual impairment is done by initially comparing the fair value of each of the Company’s reporting units with goodwill to their related carrying values. Determining the fair value of a reporting unit requires the use of significant estimates and assumptions. The Company estimates the fair value of its reporting units utilizing the income approach through the application of a discounted cash flow analysis. Key assumptions used to determine the fair value of each reporting unit as of the Company’s annual testing date were: (a) future expected cash flows; (b) estimated residual growth rates and (c) discount rates, which were based on the Company’s best estimates of the after-tax weighted-average cost of capital. Additionally, the Company considers its market capitalization in comparison to the fair value of its reporting units. During the third quarter of 2010, the Company completed its goodwill impairment testing and determined that the fair value of each reporting unit with goodwill exceeded its respective carrying value of the net assets. Accordingly, no impairment loss was recognized.
The changes in the carrying amount of goodwill for the years ended December 31, 2010 and 2009 are as follows (in thousands):
| Balance as of January 1, 2009 |
$ | 11,891 | ||
| Business Acquisitions |
2,134 | |||
| Additional contingent consideration paid for: |
||||
| TriStar |
75 | |||
| Djewels |
1 | |||
| Glenn National |
125 | |||
| Total |
201 | |||
| Balance as of December 31, 2009 |
14,226 | |||
| Business Acquisitions |
2,773 | |||
| Additional contingent consideration paid for: |
||||
| Glenn National |
232 | |||
| Total |
232 | |||
| Balance as of December 31, 2010 |
$ | 17,231 | ||
| (j) | Long-Lived Assets |
Long-lived assets, other than goodwill, such as property and equipment and purchased intangible assets subject to amortization are reviewed for impairment whenever events or changes in circumstances indicate that the carrying amount of an asset may not be recoverable. If circumstances require a long-lived asset to be tested for possible impairment, the Company first compares the undiscounted cash flows expected to be generated by a long-lived asset to its carrying value. If the carrying value of the long-lived asset is deemed to not be recoverable on an undiscounted cash flow basis, an impairment
45
Table of Contents
UNIVERSAL TRUCKLOAD SERVICES, INC.
Notes to Consolidated Financial Statements—(Continued)
December 31, 2010, 2009 and 2008
| (1) | Summary of Significant Accounting Policies—continued |
| (j) | Long-Lived Assets—continued |
charge is recognized to the extent that the carrying value exceeds its fair value. Fair value is determined through various valuation techniques including discounted cash flow models, quoted market prices and independent third-party appraisals. Changes in management’s judgment relating to salvage values and/ or estimated useful lives could result in greater or lesser annual depreciation expense or impairment charges in the future.
| (k) | Contingent Consideration |
Contingent consideration arrangements granted in connection with a business combination is evaluated to determine whether contingent consideration is, in substance, additional purchase price of an acquired enterprise or compensation for services, use of property or profit sharing. Additional purchase price is added to the fair value of consideration transferred in the business combination and compensation is included in operating expenses in the period it is incurred. Contingent consideration is remeasured to fair value at each reporting date until the contingency is resolved.
| (l) | Income Taxes |
Deferred income taxes are provided for temporary differences between the carrying amounts of assets and liabilities for financial reporting purposes and the amounts used for income tax purposes. Deferred tax assets and liabilities are measured using enacted tax rates expected to apply to taxable income in the years in which those temporary differences are expected to be recovered or settled. The effect on deferred tax assets and liabilities of a change in tax rates is recognized in income in the period that includes the enactment date.
The Company is no longer subject to U.S. federal income tax examinations by tax authorities for years before 2007. In addition, the Company files income tax returns in various state and local jurisdictions. Historically, the Company has been responsible for filing separate state and local income tax returns for itself and its subsidiaries. The Company is no longer subject to state income tax examinations for years before 2003.
The Company recognizes the effect of income tax positions only if those positions are more likely than not of being sustained. Recognized income tax positions are measured at the largest amount that is greater than 50% likely of being realized. Changes in recognition or measurement are reflected in the period in which the change in judgment occurs. The Company recognizes interest related to unrecognized tax benefits in income tax expense and penalties in other operating expenses.
| (m) | Freight Revenue and Related Expenses |
The Company is the primary obligor when rendering its truckload, brokerage and intermodal services and assumes the corresponding credit risk with customers. As such, revenue and the related purchased transportation and commissions are recognized on a gross basis when persuasive evidence of an arrangement exists, delivery has occurred at the receiver’s location or for service arrangements after the related services have been rendered, the revenue and related expenses are fixed or determinable and collectability is reasonably assured. Fuel surcharges of $54,223,000, $35,935,000 and $101,258,000 for the years ended December 31, 2010, 2009 and 2008, respectively, are included in operating revenues and purchased transportation.
46
Table of Contents
UNIVERSAL TRUCKLOAD SERVICES, INC.
Notes to Consolidated Financial Statements—(Continued)
December 31, 2010, 2009 and 2008
| (1) | Summary of Significant Accounting Policies—continued |
| (n) | Insurance & Claims |
Insurance and claims expense represents charges for premiums and the accruals made for claims within the Company’s self-insured retention amounts. The accruals are primarily related to auto liability, cargo and equipment damage claims. A liability is recognized for the estimated cost of all self-insured claims including an estimate of incurred but not reported claims based on historical experience and for claims expected to exceed the Company’s policy limits. The Company may also make accruals for personal injury and property damage to third parties, and workers’ compensation claims if a claim exceeds the Company’s insurance coverage. Such accruals are based upon individual cases and estimates of ultimate losses, incurred but not reported losses, and losses arising from known claims ultimately settling in excess of insurance coverage using loss development factors based upon industry data and past experience. Since the reported accrual is an estimate, the ultimate liability may be different from the amount recorded. If adjustments to previously established accruals are required, such amounts are included in operating expenses in the current period. The Company maintains insurance with licensed insurance carriers.
In brokerage arrangements, the Company’s exposure to liability associated with accidents incurred by other third-party carriers, who haul freight on the Company’s behalf, is reduced by various factors including the extent to which the third party providers maintain their own insurance coverage.
The Company’s insurance expense varies primarily based upon the frequency and severity of the Company’s accident experience, insurance rates, the Company’s coverage limits, and self-insured retention amounts.
| (o) | Repairs and Maintenance |
Repairs and maintenance costs are expensed as incurred.
| (p) | Tires |
Tires purchased as part of trailers are capitalized as part of the cost of the equipment. Replacement tires are charged to expense when placed in service.
| (q) | Segment Information |
The Company operates in one reportable segment. The Company provides truckload transportation and related services for a wide range of general commodities over irregular routes using dry and specialty vans and un-sided trailers, including flatbed, drop deck, and specialty. Such transportation services are provided to customers throughout the United States and in the Canadian provinces of Ontario and Quebec.
| (r) | Concentrations of Credit Risk |
Financial instruments, which potentially subject the Company to concentrations of credit risk, consist principally of cash and cash equivalents, marketable securities and accounts receivable. The Company places its cash and cash equivalents and marketable securities with high quality financial institutions. The Company performs ongoing credit evaluations of its customers and generally does not require
47
Table of Contents
UNIVERSAL TRUCKLOAD SERVICES, INC.
Notes to Consolidated Financial Statements—(Continued)
December 31, 2010, 2009 and 2008
| (1) | Summary of Significant Accounting Policies—continued |
| (r) | Concentrations of Credit Risk—continued |
collateral. The Company’s customers are generally concentrated in the automotive, wind energy, building materials, machinery and metals industries. Concentration of credit risk relating to accounts receivable is limited by the diversity and number of the Company’s customers with no customer balance representing more than 10% of the Company’s accounts receivable.
| (s) | Fair Value of Financial Instruments |
For cash equivalents, accounts receivables, accounts payable, and accrued expenses, the carrying amounts are reasonable estimates of fair value as the assets are readily redeemable or short-term in nature and the liabilities are short-term in nature. Marketable securities, consisting primarily of equity securities, are carried at fair market value as determined by quoted market prices. The fair value of the long-term debt with the County of Cuyahoga approximates its carrying value based on current rates available for similar issues. The carrying amounts for the line of credit, if any, would approximate fair value because the interest rates are adjusted frequently.
| (t) | Share based Payments |
The Company records compensation expense for stock or stock options granted on or after January 1, 2006, if any. No options were granted in 2010, 2009 or 2008, and as such, no compensation expense was recorded.
| (u) | New Accounting Standards |
In June 2009, the Company adopted the FASB Accounting Standards Codification, or ASC. The ASC did not alter current generally accepted accounting principles in the United States, or GAAP, but rather identifies the ASC as the single source of authoritative GAAP for nongovernmental entities and supersedes all other previously issued non-SEC accounting and reporting guidance. The FASB no longer issues new standards in the form of Statements, FASB Staff Positions, or Emerging Issues Task Force Abstracts, but provides additional guidance and amendments to the ASC in the form of Accounting Standards Updates, or ASU.
In December 2010, the FASB issued ASU 2010-29, to address diversity in practice about the interpretation of pro-forma revenue and earnings disclosure requirements for business combinations. The ASU requires public companies to disclose pro-forma information for business combinations that occurred in the current reporting period. The disclosures include pro-forma revenue and earnings of the combined entity for the current reporting period as though the acquisition date for all business combinations that occurred during the year had been as of the beginning of the annual reporting period. If comparative financial statements are presented, the pro-forma revenue and earnings of the combined entity for the comparable prior reporting period should be reported as though the acquisition date for all business combinations that occurred during the current year had been as of the beginning of the comparable prior annual reporting period. The ASU will be effective for business combinations beginning after December 15, 2010. The Company believes once adopted, the ASU will not have a significant impact on the Company’s financial statement disclosures.
48
Table of Contents
UNIVERSAL TRUCKLOAD SERVICES, INC.
Notes to Consolidated Financial Statements—(Continued)
December 31, 2010, 2009 and 2008
| (1) | Summary of Significant Accounting Policies—continued |
| (u) | New Accounting Standards—continued |
In December 2010, the FASB issued ASU 2010-28, which (1) does not prescribe a specific method of calculating the carrying value of a reporting unit in the performance of step 1 of the goodwill impairment test and (2) requires reporting entities with a zero or negative carrying value to assess whether it is more likely than not that a goodwill impairment exists after considering qualitative factors. Based on an assessment of these factors, if an entity concludes that it is more likely than not that a goodwill impairment may exists, the entity must perform step 2 of the goodwill impairment test. This ASU is effective for impairment tests performed during entities’ fiscal years that begin after December 15, 2010. The Company believes once adopted, the ASU will not have a significant impact on the Company’s financial position, results of operations, or cash flows.
| (2) | Acquisitions |
In 2010, UTSI acquired the following companies for a total cost of $3,372,000:
| • | Effective January 1, 2010, the Company acquired Cavalry Transportation, LLC and Cavalry Logistics, LLC, or Cavalry, based in Nashville, Tennessee, for $2,688,000. Cavalry offers fully integrated transportation resources designed to maximize value for its customers through logistic solutions in intermodal, truckload, and less-than-truckload transportation options. As of December 31, 2009, $2,647,000 of the original purchase price was paid in cash as an advance for the acquisition, and recorded in other assets. The remaining amount was included in accrued expenses and other current liabilities and paid during 2010. The Company used cash and cash equivalents to finance the acquisition. Pursuant to the acquisition, Cavalry operates as a wholly-owned subsidiary of Universal Truckload Services, Inc. |
| • | Effective January 1, 2010, the Company acquired certain assets of TSD Transportation L.P., or TSD, based in Texarkana, Texas, for $684,000. Included in the estimated purchase price is approximately $434,000 of additional consideration to be paid to the former owners of TSD based on a percentage of revenues generated through December 31, 2011. As of December 31, 2010, the total amount of additional cash consideration paid to the former owners of TSD was approximately $133,000 and was recorded as a reduction of the earnout liability. At each reporting period, the earnout liability is remeasured at fair value and changes in fair value are included in earnings until the contingent consideration is fully resolved. As a result of this remeasurement, the Company recorded a decrease in the fair value of the earnout liability of $145,000 based on changes in management’s estimates and other factors that occurred during the thirteen-weeks ended December 31, 2010, and included this amount as a reduction to selling, general, and administrative expenses in the consolidated statements of income for the year ended December 31, 2010. As of December 31, 2010 the fair value of the earnout liability was $156,000. TSD provides a wide variety of for hire freight services including van, flatbed, step deck, heavy haul, hot shots, and intermodal services throughout the United States. The Company used cash and cash equivalents to finance the acquisition. Pursuant to the acquisition, TSD operates as part of Louisiana Transportation, Inc., a wholly-owned subsidiary of Universal Truckload Services, Inc. |
49
Table of Contents
UNIVERSAL TRUCKLOAD SERVICES, INC.
Notes to Consolidated Financial Statements—(Continued)
December 31, 2010, 2009 and 2008
| (2) | Acquisitions—continued |
The pro forma effect of these acquisitions has been omitted, as the effect is immaterial to the Company’s results of operations, financial position and cash flows. The allocation of the purchase price of these companies is as follows (in thousands):
| Current assets |
$ | 1,707 | ||
| Equipment |
117 | |||
| Intangible assets |
1,228 | |||
| Goodwill (tax deductible) |
2,773 | |||
| Accrued liabilities |
(2,453 | ) | ||
| $ | 3,372 | |||
The intangible assets acquired represent the acquired companies’ customer relationships and are being amortized over a period of seven years.
Goodwill represents the expected synergies to be achieved through the integration of the acquired companies into UTSI, and intangible assets that do not qualify for separate accounting recognition under generally accepted accounting principles.
The operating results of the acquired companies have been included in the consolidated statements of income since their respective acquisition dates; however, they have not been separately disclosed as they are deemed immaterial.
In 2009, UTSI acquired the following companies for a total cost of $4,255,000.
| • | On July 27, 2009, the Company acquired certain assets of the David Ohlrich Agency, or Ohlrich, for $285,000 through a Limited Asset Purchase Agreement. Ohlrich is a regional provider of flatbed services throughout the Southwestern United States. The Company used cash and cash equivalents to finance the acquisition. Pursuant to the acquisition, Ohlrich operates as part of Louisiana Transportation, Inc., a wholly owned subsidiary of the Company. |
| • | On August 17, 2009, the Company acquired certain assets utilized in the operations of Pacer Transport, Inc., or Pacer Transport, and two of its subsidiaries, S&H Transport, Inc. and S&H Leasing, Inc., based in Desoto, Texas through a Limited Asset Purchase Agreement for approximately $2.0 million. Pacer Transport was a wholly-owned subsidiary of Pacer International, Inc. Pacer Transport is a provider of flatbed, van, and specialized heavy-haul equipment services throughout the United States. The Company used cash and cash equivalents to finance the acquisition. Pursuant to the acquisition, Pacer Transport operates as part of Universal Am-Can, Ltd., or UACL, a wholly owned subsidiary of the Company. |
| • | On December 11, 2009, the Company acquired D. Kratt International, Inc., or D. Kratt, for approximately $2.0 million. Included in the estimated purchase price is approximately $546,000 of additional consideration to be paid to the former owner of D. Kratt based on a percentage of revenues generated during the period from January 1, 2010 to December 31, 2012. As of December 31, 2010, the total amount of additional cash consideration paid to the former owners of D. Kratt was approximately $180,000 and was recorded as a reduction of the earnout liability. At each reporting period, the earnout liability is remeasured at fair value and any changes in fair value are included in earnings until the contingent consideration is fully resolved. As of December 31, 2010 the fair value of the earnout liability was $366,000. D. Kratt is a full service |
50
Table of Contents
UNIVERSAL TRUCKLOAD SERVICES, INC.
Notes to Consolidated Financial Statements—(Continued)
December 31, 2010, 2009 and 2008
| (2) | Acquisitions—continued |
| international freight forwarding and customs house brokerage firm based in Chicago, IL. D. Kratt International also provides extensive domestic and international logistics and warehousing functions, as well as comprehensive documentary and cargo insurance services. The Company used cash and cash equivalents to finance the acquisition. Pursuant to the acquisition, D. Kratt operates as part of Universal Logistics, Inc., a wholly-owned subsidiary of the Company. |
The pro forma effect of these acquisitions has been omitted, as the effect is immaterial to the Company’s results of operations, financial position and cash flows. The allocation of the purchase price is as follows (in thousands):
| Accounts receivable and other assets |
$ | 1,235 | ||
| Equipment |
675 | |||
| Intangible assets |
1,014 | |||
| Goodwill (tax deductible) |
2,134 | |||
| Accrued liabilities |
(803 | ) | ||
| $ | 4,255 | |||
The intangible assets acquired represent the acquired companies’ customer relationships and are being amortized over a period of seven years.
Goodwill represents the expected synergies to be achieved through the integration of the acquired companies into UTSI, and intangible assets that do not qualify for separate accounting recognition under generally accepted accounting principles.
The operating results of the acquired companies have been included in the consolidated statements of income since their respective acquisition dates; however, they have not been separately disclosed as they are deemed immaterial.
In 2008, UTSI acquired the following companies for a total cost of $3,753,000.
| • | On January 14, 2008, the Company acquired certain assets of Trimodal, Inc., or Trimodal, for $1,777,000 through an Asset Purchase Agreement. Trimodal is a regional provider of intermodal services in the Midwestern United States. The Company used cash and marketable securities on hand to finance the acquisition. Trimodal operates as part of Mason Dixon Intermodal, Inc. |
| • | On June 13, 2008, the Company acquired certain assets of Overnite Express, Inc., or Overnite, for $1,976,000 through an Asset Purchase Agreement. Additionally, the Company is required to pay cash consideration to the former owners of Overnite based on a percentage of revenues generated during the period from July 1, 2008 to June 30, 2010. As of December 31, 2009 and 2008, the total of the additional consideration paid to the former owners of Overnite was approximately $225,000 and $104,000, respectively. Additional consideration, up to the Company remaining estimate of $455,000, paid to the former owners of Overnite will be treated as an additional cost of acquiring Overnite and will be recorded as a reduction of an earn-out liability. Any additional consideration paid in excess of the recorded earn-out liability at December 31, 2009 will be treated as an additional cost of acquiring Overnite and will be recorded as goodwill. Overnite is a regional provider of van trucking services in the Midwestern United States. Overnite operates as part of Universal Am-Can, Ltd. |
51
Table of Contents
UNIVERSAL TRUCKLOAD SERVICES, INC.
Notes to Consolidated Financial Statements—(Continued)
December 31, 2010, 2009 and 2008
| (2) | Acquisitions—continued |
The pro forma effect of these acquisitions has been omitted, as the effect is immaterial to the Company’s results of operations, financial position and cash flows. The allocation of the purchase price of these companies is as follows (in thousands):
| Equipment |
$ | 1,226 | ||
| Intangible assets |
2,656 | |||
| Goodwill (tax deductible) |
551 | |||
| Accrued Liabilities |
(680 | ) | ||
| $ | 3,753 | |||
The intangible assets acquired represent the acquired companies’ customer relationships and are amortized over a period of seven years.
Goodwill represents the expected synergies to be achieved through the integration of the acquired companies into UTSI, and intangible assets that do not qualify for separate accounting recognition under generally accepted accounting principles.
The operating results of the acquired companies have been included in the consolidated statements of income since their respective acquisition dates; however, they have not been separately disclosed as they are deemed immaterial.
| (3) | Transactions with CenTra and Affiliates |
Through December 31, 2004, UTSI was a wholly owned subsidiary of CenTra, Inc. On December 31, 2004, CenTra distributed all of UTSI’s common stock to the sole shareholders of CenTra, the Morouns. Subsequent to the initial public offering in 2005, the Morouns retained and continue to hold a controlling interest in UTSI.CenTra provides management services to UTSI, including legal, human resources, and tax services. The cost of these services is based on the estimated utilization of the specific services and is allocated to the Company. Management believes the allocation method is reasonable. However, the costs of these services charged to UTSI are not necessarily indicative of the costs that would have been incurred if UTSI had internally performed or acquired these services as a separate unaffiliated entity.
In addition to the management services described above, UTSI purchases other services from CenTra and affiliates. Following is a schedule of cost incurred for services provided by CenTra and affiliates for the years ended December 31 (in thousands):
| 2010 | 2009 | 2008 | ||||||||||
| Management services |
$ | 1,067 | $ | 991 | $ | 950 | ||||||
| Building and terminal rents |
540 | 581 | 870 | |||||||||
| Maintenance services |
213 | 52 | 28 | |||||||||
| Trailer rents |
— | — | 16 | |||||||||
| Personal liability and property damage insurance |
13,884 | 11,959 | 15,289 | |||||||||
| Health and other insurances |
3,659 | 3,351 | 1,962 | |||||||||
| Total |
$ | 19,363 | $ | 16,934 | $ | 19,115 | ||||||
52
Table of Contents
UNIVERSAL TRUCKLOAD SERVICES, INC.
Notes to Consolidated Financial Statements—(Continued)
December 31, 2010, 2009 and 2008
| (3) | Transactions with CenTra and Affiliates—continued |
Operating revenues from freight services provided to CenTra for the years ended December 31, 2010, 2009 and 2008 were $130,000, $2,000 and $201,000, respectively.
Included in purchased transportation for the years ended December 31, 2009 and 2008 were $2,000 and $6,361,000, respectively, of transportation services provided by CenTra to CrossRoad Carriers. There were no such services proved by CenTra during the year ended December 31, 2010.
Additionally, the Company charged CenTra approximately $207,000 for vehicle maintenance services performed during the year ended December 31, 2010. There were no such charges for vehicle maintenance services during the years ended December 31, 2009 or 2008.
At December 31, 2010 amounts due from CenTra and affiliates were $80,000 compared to $177,000 due to CenTra and affiliates at December 31, 2009.
The Company also retained the law firm of Sullivan Hincks & Conway to provide legal services during 2010. Daniel C. Sullivan, a member of our Board, is a partner at Sullivan Hincks & Conway. Amounts paid for legal services during 2010 were $341,000.
In June 2009, the Company closed on the purchase of property located in South Kearny, NJ with Crown Enterprises, Inc., a related party, for $15.2 million. The Company used this location to consolidate the local operations of two of its operating subsidiaries.
| (4) | Retirement Plans |
The Company maintains a 401(k) plan for its employees. Employees may make 401(k) contributions subject to Internal Revenue Code limitations. The plan matches contributions up to $600 for employees who are not considered highly compensated. The expense for the Company match in 2010, 2009 and 2008 was $51,000, $54,000 and $51,000, respectively.
Great American Lines, Inc., a wholly owned subsidiary of the Company, maintained a Simplified Employee Pension Plan, which covers all full-time employees. Eligibility requirements include completion of one year of service and attaining the age of 21. Contributions to the plan are at management’s discretion. No contributions were made under this plan for the years ended December 31, 2010, 2009 or 2008.
| (5) | Accounts Receivable |
Accounts receivable are presented net of an allowance for doubtful accounts. Following is a summary of the activity in the allowance for doubtful accounts for the years ended December 31 (in thousands):
| 2010 | 2009 | 2008 | ||||||||||
| Balance at beginning of year |
$ | 5,464 | $ | 4,486 | $ | 3,874 | ||||||
| Provision for doubtful accounts |
1,248 | 2,136 | 1,483 | |||||||||
| Acquisition of businesses |
43 | — | — | |||||||||
| Uncollectible accounts written off |
(2,215 | ) | (1,158 | ) | (871 | ) | ||||||
| Balance at end of year |
$ | 4,540 | $ | 5,464 | $ | 4,486 | ||||||
53
Table of Contents
UNIVERSAL TRUCKLOAD SERVICES, INC.
Notes to Consolidated Financial Statements—(Continued)
December 31, 2010, 2009 and 2008
| (6) | Property and Equipment |
Property and equipment at December 31 consists of the following (in thousands):
| 2010 | 2009 | |||||||
| Land and buildings |
$ | 59,600 | $ | 53,013 | ||||
| Trailers |
34,733 | 34,378 | ||||||
| Tractors |
9,139 | 8,423 | ||||||
| Computer equipment and software |
3,029 | 2,655 | ||||||
| Office and miscellaneous equipment |
6,673 | 6,280 | ||||||
| Construction in process |
3,287 | 3,859 | ||||||
| 116,461 | 108,608 | |||||||
| Less accumulated depreciation |
(38,255 | ) | (32,362 | ) | ||||
| Total |
$ | 78,206 | $ | 76,246 | ||||
| (7) | Income Taxes |
The provision for income taxes attributable to income from continuing operations for the years ended December 31 consists of the following (in thousands):
| 2010 | 2009 | 2008 | ||||||||||
| Current: |
||||||||||||
| U.S. Federal |
$ | 7,139 | $ | 1,286 | $ | 9,766 | ||||||
| State |
2,315 | 231 | 1,567 | |||||||||
| Deferred: |
||||||||||||
| U.S. Federal |
(343 | ) | 1,354 | (1,750 | ) | |||||||
| State |
(399 | ) | 249 | (214 | ) | |||||||
| Total |
$ | 8,712 | $ | 3,120 | $ | 9,369 | ||||||
The Company also recorded income taxes directly to accumulated other comprehensive income relating to unrealized gains (losses) on available–for-sale investments in the amount of $1,125,000, $874,000, and $(393,000) for the years ended December 31, 2010, 2009 and 2008, respectively.
54
Table of Contents
UNIVERSAL TRUCKLOAD SERVICES, INC.
Notes to Consolidated Financial Statements—(Continued)
December 31, 2010, 2009 and 2008
| (7) | Income Taxes—continued |
Deferred income tax assets and liabilities at December 31 consist of the following (in thousands):
| 2010 | 2009 | |||||||||||||||
| Current | Long-term | Current | Long-term | |||||||||||||
| Deferred tax assets: |
||||||||||||||||
| Allowance for doubtful accounts |
$ | 802 | $ | — | $ | 1,077 | $ | — | ||||||||
| Marketable securities |
— | — | 1,157 | — | ||||||||||||
| Other assets |
— | 1,457 | — | 923 | ||||||||||||
| Accrued expenses |
3,645 | — | 2,593 | — | ||||||||||||
| Total |
4,447 | 1,457 | 4,827 | 923 | ||||||||||||
| Deferred tax liabilities: |
||||||||||||||||
| Prepaid expenses |
(1,281 | ) | — | (1,073 | ) | — | ||||||||||
| Marketable securities |
(193 | ) | — | — | — | |||||||||||
| Property and equipment |
— | (6,882 | ) | — | (6,746 | ) | ||||||||||
| Total |
(1,474 | ) | (6,882 | ) | (1,073 | ) | (6,746 | ) | ||||||||
| Net deferred tax asset (liability) |
$ | 2,973 | $ | (5,425 | ) | $ | 3,754 | $ | (5,823 | ) | ||||||
In assessing the realizability of deferred tax assets, management considers whether it is more likely than not that some portion or all of the deferred tax assets will not be realized. The ultimate realization of deferred tax assets is dependent upon the generation of future taxable income (both ordinary income and taxable capital gains) during the periods in which those temporary differences reverse. Management considers the scheduled reversal of deferred tax liabilities, projected future taxable income, and tax planning strategies in making this assessment. Valuation allowances are established when necessary to reduce deferred tax assets when it is more likely than not that a portion or all of the deferred tax assets will not be realized. Based upon the level of historical taxable income, reversal of existing taxable temporary differences, projections for future taxable income over the periods in which the deferred tax assets are expected to reverse, and the Company’s ability to generate future capital gains, management believes it is more likely than not that the Company will realize the benefits of these deductible differences. Thus, no valuation allowance has been established. The amount of the deferred tax asset considered realizable, however, could be reduced in the near term if estimates of future taxable income are reduced or capital gains contemplated under tax planning strategies are not realized.
Income tax expense attributable to income from continuing operations differs from the statutory rates as follows:
| 2010 | 2009 | 2008 | ||||||||||
| Federal statutory rate |
35 | % | 35 | % | 35 | % | ||||||
| State—net of federal benefit |
6 | 4 | 4 | |||||||||
| Effective tax rate |
41 | % | 39 | % | 39 | % | ||||||
As of December 31, 2010, the total amount of unrecognized tax benefit representing uncertainty in certain tax positions was $632,000 of which $411,000 would impact the effective tax rate if recognized. These uncertain tax positions are based on recognition thresholds and measurement
55
Table of Contents
UNIVERSAL TRUCKLOAD SERVICES, INC.
Notes to Consolidated Financial Statements—(Continued)
December 31, 2010, 2009 and 2008
| (7) | Income Taxes—continued |
attributes for the financial statement recognition and measurements of a tax position taken or expected to be taken in a tax return. Any prospective adjustments to our accrual for uncertain tax positions will be recorded as an increase or decrease to the provision for income taxes and would impact our effective tax rate. At December 31, 2010, there are no positions for which it is reasonably possible that the total amounts of unrecognized tax benefits would significantly increase or decrease within 12 months. As of December 31, 2010, the amount of accrued interest and penalties was $43,000 and $55,000, respectively.
The changes in the Company’s gross unrecognized tax benefits during the years ended December 31 are as follows (in thousands):
| 2010 | 2009 | |||||||
| Unrecognized tax benefit—beginning of year |
$ | 546 | $ | 537 | ||||
| Increases related to prior year tax positions |
38 | — | ||||||
| Increases related to current year tax positions |
48 | 22 | ||||||
| Decreases related to prior year tax positions |
— | — | ||||||
| Settlements with taxing authorities |
— | (13 | ) | |||||
| Lapse of statutes of limitations |
— | — | ||||||
| Unrecognized tax benefit—end of year |
$ | 632 | $ | 546 | ||||
| (8) | Accrued Expenses |
Accrued expenses consist of the following items at December 31 (in thousands):
| 2010 | 2009 | |||||||
| Auto liability claims |
$ | 7,350 | $ | 3,850 | ||||
| Driver escrow liabilities |
4,694 | 4,286 | ||||||
| Payroll related items |
1,702 | 1,661 | ||||||
| Commissions |
959 | 991 | ||||||
| Cargo claims |
931 | 1,168 | ||||||
| Taxes, interest, and insurance |
731 | 784 | ||||||
| Other |
2,154 | 2,288 | ||||||
| Total |
$ | 18,521 | $ | 15,028 | ||||
| (9) | Debt |
On October 28, 2010, the Company and KeyBank National Association, or KeyBank, entered into an Amended and Restated Loan Agreement and Promissory Note, collectively referred to as the Agreement, for the period October 25, 2010 to October 24, 2011, thereby replacing the previous loan agreements. Under the Agreement with KeyBank, the Company’s maximum permitted borrowings and letters of credit in the aggregate may not exceed $20 million. The line of credit is unsecured, and bears interest at a rate equal to the lesser of the Prime Rate minus 0.50% or LIBOR plus 1.00% (effective rate of 1.26% at December 31, 2010). The Agreement governing our unsecured line of credit contains various financial and restrictive covenants to be maintained by the Company including requirements to
56
Table of Contents
UNIVERSAL TRUCKLOAD SERVICES, INC.
Notes to Consolidated Financial Statements—(Continued)
December 31, 2010, 2009 and 2008
| (9) | Debt—continued |
maintain a tangible net worth of at least $85 million, a debt to tangible net worth ratio not to exceed 1 to 1, and quarterly net profits of at least one dollar. For purposes of this Agreement, tangible net worth is defined as total assets, excluding all intangible assets, less total debt. The Agreement also may, in certain circumstances, limit our ability to pay dividends or distributions utilizing our line of credit. The Agreement also contains customary representations and warranties, affirmative and negative covenants and events of default. As of December 31, 2010, the Company was in compliance with its debt covenants. The Company did not have any amounts outstanding under its line of credit at December 31, 2010, and there were $1,300,000 letters of credit issued against the line.
The previous loan agreement with KeyBank was unsecured and permitted maximum borrowings and letters of credit in the aggregate not to exceed $20 million. The unsecured line of credit bore interest at a rate equal to the lesser of the Prime Rate or LIBOR plus 1.50% (effective rate of 1.75% at December 31, 2009). The Agreement governing our unsecured line of credit contained various financial and restrictive covenants to be maintained by us including requiring us to maintain a tangible net worth of at least $100 million, a debt to tangible net worth ratio not to exceed 1 to 1, and quarterly net profits of at least one dollar. For purposes of this Agreement, tangible net worth is defined as total assets, excluding all intangible assets, less total debt. The Agreement also limited our ability to pay dividends or distributions utilizing our line of credit. The Agreement also contained customary representations and warranties, affirmative and negative covenants and events of default. As of December 31, 2009, the Company was in compliance with its debt covenants. The Company did not have any amounts outstanding under its line of credit at December 31, 2009, and there were $755,000 letters of credit issued against the line.
On May 1, 2006, UTS Realty, LLC, or Realty, a wholly owned subsidiary of the Company, received a $1,000,000 loan from the County of Cuyahoga, Ohio, or the County, to be used for improvements to its Cleveland, Ohio container storage facility. The loan agreement requires quarterly interest payments at an annual rate of 5.0%. Through January 31, 2011, subject to certain conditions, the County will forgive $450,000 of the principal amount owed. On January 31, 2007, the Company began recording the forgiveness as a reduction of the loan and as a reduction in the cost of the underlying improvements at a rate of $90,000 per annum. The remaining principal was due at maturity on January 31, 2011; however, at Realty’s option, the maturity date could have been extended until January 31, 2021. In June 2010, the Company repaid $550,000 of the remaining principal balance. As of December 31, 2010 and 2009, the outstanding balance under the loan was $90,000 (presented under other current liabilities) and $730,000, respectively. At December 31, 2009, the fair value of this debt was approximately $490,000. In connection with this loan, Realty and the Company entered into an environmental indemnity agreement with the County and the Company issued a $640,000 standby letter of credit that expires February 14, 2011. Under the terms of the environmental indemnity agreement, Realty and the Company have agreed to indemnify the County, without limitation, against any loss attributable to the generation, storage, release or presence of Regulated Materials, as defined in the environmental indemnity agreement, at the container storage facility. In connection with the acquisition of the Cleveland, Ohio property in August 2005, Realty received indemnity from the seller from any and all claims, which Realty may incur as a direct consequence of any environmental condition of which the seller had actual knowledge as of the date of the acquisition of the property.
57
Table of Contents
UNIVERSAL TRUCKLOAD SERVICES, INC.
Notes to Consolidated Financial Statements—(Continued)
December 31, 2010, 2009 and 2008
| (10) | Operating Leases |
The Company leases office space, terminal yards and equipment under non-cancelable operating leases. Total rent expense amounted to approximately $2,122,000, $2,432,000, and $2,794,000 for 2010, 2009 and 2008, respectively. It is expected that in the ordinary course of business that leases will be renewed or replaced as they expire. Future minimum rental payments under non-cancelable operating leases having initial or remaining terms in excess of one year are as follows (in thousands):
| 2011 |
$ | 654 | ||
| 2012 |
532 | |||
| 2013 |
159 | |||
| 2014 |
66 | |||
| 2015 |
12 | |||
| Thereafter |
— | |||
| Total |
$ | 1,423 | ||
| (11) | Comprehensive Income |
Comprehensive income includes the following for the years ended December 31 (in thousands):
| 2010 | 2009 | 2008 | ||||||||||
| Net income |
$ | 12,744 | $ | 4,900 | $ | 14,886 | ||||||
| Other comprehensive income (loss): |
||||||||||||
| Unrealized holding gains (losses) on available-for-sale investments arising during the year, net of income tax of $(3,298), $(387) and $1,683, respectively |
4,805 | 615 | (2,677 | ) | ||||||||
| (Gains) losses on available-for-sale investments reclassified into income: |
||||||||||||
| Other-than-temporary impairment losses, net of tax of $0, ($487) and ($1,407), respectively |
— | 771 | 2,235 | |||||||||
| Realized gains, net of tax of $2,173, $0 and $117, respectively |
(3,196 | ) | — | (186 | ) | |||||||
| Net gain (loss) recognized in other comprehensive income (loss) |
1,609 | 1,386 | (628 | ) | ||||||||
| Total comprehensive income |
$ | 14,353 | $ | 6,286 | $ | 14,258 | ||||||
The unrealized holding gains and losses on available-for-sale investments represent mark-to-market adjustments net of related income taxes.
| (12) | Fair Value Measurements and Disclosures |
FASB ASC Topic 820, “Fair Value Measurements and Disclosures”, defines fair value as the exchange price that would be received for an asset or paid to transfer a liability in the principal or most advantageous market for the asset or liability in an orderly transaction between market participants at the measurement date and expanded disclosures with respect to fair value measurements.
58
Table of Contents
UNIVERSAL TRUCKLOAD SERVICES, INC.
Notes to Consolidated Financial Statements—(Continued)
December 31, 2010, 2009 and 2008
| (12) | Fair Value Measurements and Disclosures—continued |
FASB ASC Topic 820 also establishes a three-level fair value hierarchy that prioritizes the inputs used to measure fair value. This hierarchy requires entities to maximize the use of observable inputs and minimize the use of unobservable inputs. The three levels of inputs used to measure fair value are as follows:
| • | Level 1—Quoted prices in active markets for identical assets or liabilities. |
| • | Level 2—Observable inputs other than quoted prices included in Level 1, such as quoted prices for similar assets and liabilities in active markets; quoted prices for identical or similar assets and liabilities in markets that are not active; or other inputs that are observable or can be corroborated by observable market data. |
| • | Level 3—Unobservable inputs that are supported by little or no market activity and that are significant to the fair value of the assets or liabilities. This includes certain pricing models, discounted cash flow methodologies and similar techniques that use significant unobservable inputs. |
The Company has segregated all financial assets that are measured at fair value on a recurring basis into the most appropriate level within the fair value hierarchy based on the inputs used to determine the fair value at the measurement date in the tables below (in thousands):
| December 31, 2010 | ||||||||||||||||
| Level 1 | Level 2 | Level 3 | Fair
Value Measurement |
|||||||||||||
| Assets |
||||||||||||||||
| Cash equivalents |
$ | 59 | $ | — | $ | — | $ | 59 | ||||||||
| Marketable securities |
15,041 | — | — | 15,041 | ||||||||||||
| Total Assets |
$ | 15,100 | $ | — | $ | — | $ | 15,100 | ||||||||
| December 31, 2009 | ||||||||||||||||
| Level 1 | Level 2 | Level 3 | Fair Value Measurement |
|||||||||||||
| Assets |
||||||||||||||||
| Cash equivalents |
$ | 347 | $ | — | $ | — | $ | 347 | ||||||||
| Marketable securities |
15,721 | — | — | 15,721 | ||||||||||||
| Total Assets |
$ | 16,068 | $ | — | $ | — | $ | 16,068 | ||||||||
The valuation techniques used to measure fair value for the items in the tables above are as follows:
| • | Cash equivalents—This category consists of money market funds which are listed as Level 1 assets and measured at fair value based on quoted prices for identical instruments in active markets. |
| • | Marketable securities—Marketable securities represent equity securities, which consist of common and preferred stocks, are actively traded on public exchanges and are listed as Level 1 assets. Fair value was measured based on quoted prices for these securities in active markets. |
59
Table of Contents
UNIVERSAL TRUCKLOAD SERVICES, INC.
Notes to Consolidated Financial Statements—(Continued)
December 31, 2010, 2009 and 2008
| (13) | Contingencies |
The Company is involved in certain claims and pending litigation arising from the ordinary conduct of business. We also provide accruals for claims within our self-insured retention amounts. Based on the knowledge of the facts, and in certain cases, opinions of outside counsel, in the Company’s opinion the resolution of these claims and pending litigation will not have a material effect on the Company’s financial position, results of operations or cash flows.
| (14) | Stock Based Compensation |
In December 2004, UTSI’s Board of Directors adopted the 2004 Stock Incentive Plan, or the Plan, which became effective upon completion of the Company’s initial public offering. The Plan allows for the issuance of a total of 500,000 shares. The grants may be made in the form of restricted stock bonuses, restricted stock purchase rights, stock options, phantom stock units, restricted stock units, performance share bonuses, performance share units or stock appreciation rights. On February 11, 2005, UTSI granted 260,000 options to certain of its employees. The stock options granted vested immediately, have a life of seven years and have an exercise price of $22.50 per share. The total intrinsic value of all outstanding options as of December 31, 2010 and 2009 was $0 and $0, respectively.
The following table summarizes the stock option activity and related information for the period indicated:
| Options | Weighted Average Exercise Price |
|||||||
| Balance at January 1, 2009 |
190,000 | $ | 22.50 | |||||
| Granted |
— | — | ||||||
| Exercised |
— | — | ||||||
| Expired |
— | — | ||||||
| Forfeited |
— | — | ||||||
| Balance at December 31, 2009 |
190,000 | $ | 22.50 | |||||
| Granted |
— | — | ||||||
| Exercised |
— | — | ||||||
| Expired |
— | — | ||||||
| Forfeited |
2,500 | $ | 22.50 | |||||
| Balance at December 31, 2010 |
187,500 | $ | 22.50 | |||||
| Exercisable at December 31, 2010 |
187,500 | $ | 22.50 | |||||
| (15) | Earnings Per Share |
Basic earnings per common share amounts are based on the weighted average number of common shares outstanding, and diluted earnings per share amounts are based on the weighted average number of common shares outstanding plus the incremental shares that would have been outstanding upon the assumed exercise of all dilutive stock options. As of December 31, 2010 and 2009, there were no dilutive stock options included in the denominator for the calculation of diluted earnings per share. As of December 31, 2008, there were 4,500 weighted average dilutive stock options included in the denominator for the calculation of diluted earnings per share.
60
Table of Contents
UNIVERSAL TRUCKLOAD SERVICES, INC.
Notes to Consolidated Financial Statements—(Continued)
December 31, 2010, 2009 and 2008
| (15) | Earnings Per Share—continued |
For the years ended December 31, 2010, 2009 and 2008, 187,500 options, 190,000 options and 190,000 options to purchase shares of common stock, respectively, were excluded from the calculation of diluted earnings per share because such options were anti-dilutive.
| (16) | Quarterly Financial Data (unaudited) |
| 2010 | ||||||||||||||||
| 1st quarter | 2nd quarter | 3rd quarter | 4th quarter | |||||||||||||
| (in thousands, except per share information) | ||||||||||||||||
| Operating revenue |
$ | 139,044 | $ | 154,304 | $ | 156,462 | $ | 156,133 | ||||||||
| Operating income |
1,470 | 4,068 | 4,655 | 5,174 | ||||||||||||
| Income before income taxes |
3,390 | 7,793 | 4,911 | 5,362 | ||||||||||||
| Provision for income taxes |
1,325 | 3,220 | 1,979 | 2,188 | ||||||||||||
| Net income |
$ | 2,065 | $ | 4,573 | $ | 2,932 | $ | 3,174 | ||||||||
| Earnings per common share: |
||||||||||||||||
| Basic |
$ | 0.13 | $ | 0.29 | $ | 0.18 | $ | 0.20 | ||||||||
| Diluted |
$ | 0.13 | $ | 0.29 | $ | 0.18 | $ | 0.20 | ||||||||
| Weighted average number of common shares outstanding: |
||||||||||||||||
| Basic |
15,980 | 15,980 | 15,925 | 15,780 | ||||||||||||
| Diluted |
15,980 | 15,980 | 15,925 | 15,780 | ||||||||||||
| 2009 | ||||||||||||||||
| 1st quarter | 2nd quarter | 3rd quarter | 4th quarter | |||||||||||||
| (in thousands, except per share information) | ||||||||||||||||
| Operating revenue |
$ | 115,026 | $ | 119,897 | $ | 128,458 | $ | 139,849 | ||||||||
| Operating income |
769 | 2,354 | 2,881 | 3,015 | ||||||||||||
| Income before income taxes |
223 | 2,083 | 2,728 | 2,986 | ||||||||||||
| Provision for income taxes |
84 | 778 | 1,029 | 1,229 | ||||||||||||
| Net income |
$ | 139 | $ | 1,305 | $ | 1,699 | $ | 1,757 | ||||||||
| Earnings per common share: |
||||||||||||||||
| Basic |
$ | 0.01 | $ | 0.08 | $ | 0.11 | $ | 0.11 | ||||||||
| Diluted |
$ | 0.01 | $ | 0.08 | $ | 0.11 | $ | 0.11 | ||||||||
| Weighted average number of common shares outstanding: |
||||||||||||||||
| Basic |
15,989 | 15,980 | 15,980 | 15,980 | ||||||||||||
| Diluted |
15,989 | 15,980 | 15,980 | 15,980 | ||||||||||||
| (17) | Subsequent Events |
The Company evaluated subsequent events through the time of filing this Annual Report on Form 10-K. Except for the following matters, we are not aware of any significant events that occurred subsequent to the balance sheet date but prior to the filing of this report that would have a material impact on the Consolidated Financial Statements.
61
Table of Contents
UNIVERSAL TRUCKLOAD SERVICES, INC.
Notes to Consolidated Financial Statements—(Continued)
December 31, 2010, 2009 and 2008
| (17) | Subsequent Events—(Continued) |
On March 14, 2011, we acquired certain assets of Hart Transportation, Inc., or Hart, based in Jacksonville, Florida through a Limited Asset Purchase Agreement for approximately $1.4 million. Included in the purchase price is approximately $0.3 million of additional consideration estimated to be paid to the former owner of Hart based on a percentage of revenues generated during the period from April 1, 2011 to March 31, 2014. Hart is primarily a regional provider of van and flatbed services throughout the Southeastern United States. Pursuant to the acquisition, Hart will operate as part of Universal Am-Can, Ltd.
62
Table of Contents
| ITEM 9: | CHANGES IN AND DISAGREEMENTS WITH ACCOUNTANTS ON ACCOUNTING AND FINANCIAL DISCLOSURES |
There were no changes in or disagreements with accountants on accounting and financial disclosure during the fiscal years 2009 or 2010.
| ITEM 9A: | CONTROLS AND PROCEDURES |
Disclosure Controls and Procedures
We carried out an evaluation, under the supervision and with the participation of our management, including our Chief Executive Officer and Chief Financial Officer, of the effectiveness of the design and operation of our disclosure controls and procedures pursuant to Rule 13a-15(e) and 15d-15(e) of the Exchange Act. Based upon that evaluation, our Chief Executive Officer and Chief Financial Officer concluded that, as of December 31, 2010, our disclosure controls and procedures were effective in causing the material information required to be disclosed in the reports that it files or submits under the Exchange Act to be recorded, processed, summarized and reported, to the extent applicable, within the time periods required for us to meet the SEC filing deadlines for these reports specified in the SEC’s rules and forms.
Changes in Internal Controls
There have been no changes in our internal controls over financial reporting as such term is defined in Rules 13a-15(f) and 15d-15(f) under the Exchange Act, during the quarter ended December 31, 2010 identified in connection with our evaluation that has materially affected, or are reasonably likely to materially affect, our internal controls over financial reporting.
63
Table of Contents
REPORT OF MANAGEMENT ON INTERNAL CONTROL OVER FINANCIAL REPORTING
Management of Universal Truckload Services, Inc., or the Company, is responsible for establishing and maintaining effective internal controls over financial reporting, as such term is defined in Rules 13a-15(f) under the Securities Exchange Act of 1934, as amended.
Internal control over financial reporting is a process designed to provide reasonable assurance regarding the reliability of financial reporting and the preparation of financial statements for external purposes in accordance with generally accepted accounting principles. The Company’s internal control over financial reporting includes those policies and procedures that (1) pertain to the maintenance of records that, in reasonable detail, accurately and fairly reflect the transactions and dispositions of the assets of the Company; (2) provide reasonable assurance that transactions are recorded as necessary to permit preparation of financial statements in accordance with generally accepted accounting principles, and that receipts and expenditures of the Company are being made only in accordance with authorizations of management and directors of the Company; and (3) provide reasonable assurance regarding prevention or timely detection of unauthorized acquisition, use, or disposition of the Company’s assets that could have a material effect on the Company’s financial statements.
Management, with the participation of the Company’s principal executive and principal financial officers, assessed the effectiveness of the Company’s internal control over financial reporting as of December 31, 2010. This assessment was performed using the criteria established under the Internal Control-Integrated Framework established by the Committee of Sponsoring Organizations of the Treadway Commission, or COSO.
Based on the assessment performed using the criteria established by COSO, management has concluded that the Company maintained effective internal control over financial reporting as of December 31, 2010.
KPMG LLP, the independent registered public accounting firm that audited the financial statements included in this Annual Report on Form 10-K for the fiscal year ended December 31, 2010, has issued an audit report on the effectiveness of the Company’s internal control over financial reporting as of December 31, 2010. Such report appears immediately below.
64
Table of Contents
REPORT OF INDEPENDENT REGISTERED PUBLIC ACCOUNTING FIRM
The Board of Directors and Shareholders
Universal Truckload Services, Inc.:
We have audited Universal Truckload Services, Inc.’s internal control over financial reporting as of December 31, 2010, based on criteria established in Internal Control—Integrated Framework issued by the Committee of Sponsoring Organizations of the Treadway Commission (COSO). Universal Truckload Services Inc.’s management is responsible for maintaining effective internal control over financial reporting and for its assessment of the effectiveness of internal control over financial reporting, included in the accompanying Report of Management on Internal Control over Financial Reporting. Our responsibility is to express an opinion on the Company’s internal control over financial reporting based on our audit.
We conducted our audit in accordance with the standards of the Public Company Accounting Oversight Board (United States). Those standards require that we plan and perform the audit to obtain reasonable assurance about whether effective internal control over financial reporting was maintained in all material respects. Our audit included obtaining an understanding of internal control over financial reporting, assessing the risk that a material weakness exists, and testing and evaluating the design and operating effectiveness of internal control based on the assessed risk. Our audit also included performing such other procedures as we considered necessary in the circumstances. We believe that our audit provides a reasonable basis for our opinion.
A company’s internal control over financial reporting is a process designed to provide reasonable assurance regarding the reliability of financial reporting and the preparation of financial statements for external purposes in accordance with generally accepted accounting principles. A company’s internal control over financial reporting includes those policies and procedures that (1) pertain to the maintenance of records that, in reasonable detail, accurately and fairly reflect the transactions and dispositions of the assets of the company; (2) provide reasonable assurance that transactions are recorded as necessary to permit preparation of financial statements in accordance with generally accepted accounting principles, and that receipts and expenditures of the company are being made only in accordance with authorizations of management and directors of the company; and (3) provide reasonable assurance regarding prevention or timely detection of unauthorized acquisition, use, or disposition of the company’s assets that could have a material effect on the financial statements.
Because of its inherent limitations, internal control over financial reporting may not prevent or detect misstatements. Also, projections of any evaluation of effectiveness to future periods are subject to the risk that controls may become inadequate because of changes in conditions, or that the degree of compliance with the policies or procedures may deteriorate.
In our opinion, Universal Truckload Services, Inc. maintained, in all material respects, effective internal control over financial reporting as of December 31, 2010, based on criteria established in Internal Control—Integrated Framework issued by COSO.
We also have audited, in accordance with the standards of the Public Company Accounting Oversight Board (United States), the consolidated balance sheets of Universal Truckload Services, Inc. and subsidiaries as of December 31, 2010 and 2009, and the related consolidated statements of income, stockholders’ equity and comprehensive income (loss), and cash flows for each of the years in the three-year period ended December 31, 2010, and our report dated March 15, 2011 expressed an unqualified opinion on those consolidated financial statements.
/s/ KPMG LLP
Detroit, Michigan
March 15, 2011
Not applicable.
65
Table of Contents
PART III
| ITEM 10: | DIRECTORS, EXECUTIVE OFFICERS, AND CORPORATE GOVERNANCE |
The information required by this Item concerning the Directors and Executive Officers of the Company is set forth under the captions “Election of Directors,” “Directors of the Company,” “Information Regarding Board of Directors and Committees,” and “Executive Officers of the Company” and “Section 16(a) Beneficial Ownership Reporting Compliance” in the Company’s definitive Proxy Statement for its annual meeting of shareholders to be filed with the Securities and Exchange Commission within 120 days of December 31, 2010, and is incorporated herein by reference. The information required by this Item concerning Director Independence, the Company’s Audit Committee and the Audit Committee’s Financial Expert is set forth under the caption “Information Regarding Board of Directors and Committees” and “Report of the Audit Committee” in the Company’s definitive Proxy Statement for its annual meeting of shareholders filed with the Securities and Exchange Commission pursuant to Regulation 14A, and is incorporated herein by reference.
We have adopted a Code of Business Conduct and Ethics that applies to all our directors, executive and financial officers and employees. The Code of Business Conduct and Ethics has been posted on our website at www.goutsi.com in the Investor Relations section under Corporate Governance and is available free of charge through our website. We will post information regarding any amendment to, or waiver from, our Code of Business Conduct and Ethics for executive and financial officers and directors on our website in the Company section under the Investor Relations section under Corporate Governance.
| ITEM 11: | EXECUTIVE COMPENSATION |
The information required by this Item is set forth under the captions “Compensation of Directors,” “Compensation of Executive Officers,” “Compensation and Stock Option Committee Report on Executive Compensation,” “Compensation Committee Interlocks and Insider Participation” and “Key Executive Employment Protection Agreements” in the Company’s definitive Proxy Statement for its annual meeting of shareholders to be filed with the Securities and Exchange Commission within 120 days of December 31, 2010, and is incorporated herein by reference.
| ITEM 12: | SECURITY OWNERSHIP OF CERTAIN BENEFICIAL OWNERS AND MANAGEMENT AND RELATED STOCKHOLDER MATTERS |
The information required by this Item pursuant to Item 201(d) of Regulation S-K is set forth under the caption “Market for Registrants Common Equity and Related Stockholder Matters” in Part II, Item 5 of this report, and is incorporated by reference herein.
The information required by this Item pursuant to Item 403 of Regulation S-K is set forth under the captions “Security Ownership by Management and Others” and “Equity Compensation Plan Information,” in the Company’s definitive Proxy Statement for its annual meeting of shareholders to be filed with the Securities and Exchange Commission within 120 days of December 31, 2010, and is incorporated herein by reference.
| ITEM 13: | CERTAIN RELATIONSHIPS AND RELATED TRANSACTIONS, AND DIRECTOR INDEPENDENCE |
The information required by this item is set forth under the captions “Transactions With Management and Others” and “Transactions With Management and Others and Certain Business Relationships” and “Compensation Committee Interlocks and Insider Participation,” in the Company’s definitive Proxy Statement for its annual meeting of shareholders filed with the Securities and Exchange Commission within 120 days of December 31, 2010, and is incorporated herein by reference.
66
Table of Contents
| ITEM 14: | PRINCIPAL ACCOUNTING FEES AND SERVICES |
The information required by this item is set forth under the captions “Report of the Audit Committee” and “Ratification of Appointment of Independent Registered Public Accounting Firm” in the Company’s definitive Proxy Statement for its annual meeting of shareholders filed with the Securities and Exchange Commission within 120 days of December 31, 2010, and is incorporated herein by reference.
67
Table of Contents
PART IV
| ITEM 15: | EXHIBITS AND FINANCIAL STATEMENT SCHEDULES |
| (1) Financial Statements |
||||
| Page | ||||
| 35 | ||||
| 36 | ||||
| 37 | ||||
| Consolidated Statements of Shareholders’ Equity and Comprehensive Income (Loss) |
38 | |||
| 39 | ||||
| 41 | ||||
| (2) Financial Statement Schedules |
||||
| Financial statement schedules have been omitted since they are either not required, not applicable, or the information is otherwise included elsewhere in this Form 10-K. |
||||
| (3) Exhibits |
||||
| Exhibit |
Description | |
| 3.1 | Amended and Restated Articles of Incorporation (Incorporated by reference to Exhibit 3.1 to the Registrant’s Registration Statement on Form S-1 filed on November 15, 2004 (Commission File No. 000-51142)) | |
| 3.2 | Amended and Restated Bylaws, as amended effective April 22, 2009 (Incorporated by reference to Exhibit 3.1 to the Registrant’s Current Report on Form 8-K filed on April 24, 2009 (Commission File No. 000-51142)) | |
| 4.1 | Registration Rights Agreement, dated as of December 31, 2004, among the Registrant, Matthew T. Moroun and The Manuel J. Moroun Trust (Incorporated by reference to Exhibit 4.1 to the Registrant’s Registration Statement on Form S-1 filed on January 7, 2005 (Commission File No. 000-51142)) | |
| 4.2 | Specimen Common Share Certificate (Incorporated by reference to Exhibit 4.2 to the Registrant’s Registration Statement on Form S-1 filed on November 15, 2004 (Commission File No. 000-51142)) | |
| 10.1 | Amended and Restated Loan Agreement between Universal Truckload Services, Inc. and KeyBank National Association dated October 28, 2010 ((Incorporated by reference to Exhibit 10.2 to the Registrant’s Current Report on Form 8-K filed on October 29, 2010 (Commission File No. 000-51142)) | |
| 21.1* | Subsidiaries of Universal Truckload Services, Inc. | |
| 23.1* | Consent of KPMG LLP, independent registered public accounting firm | |
| 24* | Powers of Attorney (see signature page) | |
| 31.1* | Chief Executive Officer certification, as adopted pursuant to section 302 of the Sarbanes-Oxley Act of 2002 | |
| 31.2* | Chief Financial Officer certification, as adopted pursuant to section 302 of the Sarbanes-Oxley Act of 2002 | |
| 32.1** | Chief Executive Officer and Chief Financial Officer certification pursuant to 18 U.S.C. Section 1350, as adopted pursuant to section 906 of the Sarbanes-Oxley Act of 2002 | |
| * | Filed herewith. |
| ** | Furnished herewith |
68
Table of Contents
Pursuant to the requirements of Section 13 or 15(d) of the Securities Exchange Act of 1934, the registrant has duly caused this report on Form 10-K to be signed on its behalf by the undersigned, thereunto duly authorized.
| Universal Truckload Services, Inc. | ||
| (Registrant) | ||
| By: | /S/ ROBERT E. SIGLER | |
| Robert E. Sigler, Vice President, Chief Financial Officer, Secretary and Treasurer | ||
Date: March 15, 2011
POWER OF ATTORNEY
Know all persons by these presents, that each person whose signature appears below constitutes and appoints Donald B. Cochran and Robert E. Sigler, jointly and severally, his attorneys-in-fact, each with the power of substitution, for him in any and all capacities, to sign any amendments to this Form 10-K, and to file the same, with exhibits thereto and other documents in connection therewith, with the Securities and Exchange Commission, hereby ratifying and confirming all that each of said attorneys-in-fact, or his substitutes, may do or cause to be done by virtue hereof.
Pursuant to the requirements of the Securities Exchange Act of 1934, this report has been signed below by the following persons on behalf of the registrant and in the capacities and on the dates indicated.
| Signatures |
Title |
Date | ||
| /S/ DONALD B. COCHRAN Donald B. Cochran |
President, Chief Executive Officer and Director (Principal Executive Officer) | March 15, 2011 | ||
| /S/ ROBERT E. SIGLER Robert E. Sigler |
Vice President, Chief Financial Officer, Secretary and Treasurer (Principal Financial and Accounting Officer) | March 15, 2011 | ||
| /S/ MATTHEW T. MOROUN Matthew T. Moroun |
Chairman of the Board | March 15, 2011 | ||
| /S/ MANUEL J. MOROUN Manuel J. Moroun |
Director | March 15, 2011 | ||
| /S/ FREDERICK P. CALDERONE Frederick P. Calderone |
Director | March 15, 2011 | ||
| /S/ JOSEPH J. CASAROLL Joseph J. Casaroll |
Director | March 15, 2011 | ||
| /S/ DANIEL J. DEANE Daniel J. Deane |
Director | March 15, 2011 | ||
69
Table of Contents
| Signatures |
Title |
Date | ||
| /S/ DANIEL C. SULLIVAN Daniel C. Sullivan |
Director | March 15, 2011 | ||
| /S/ RICHARD P. URBAN Richard P. Urban |
Director | March 15, 2011 | ||
| /S/ TED B. WAHBY Ted B. Wahby |
Director | March 15, 2011 | ||
70