Attached files
UNITED STATES
SECURITIES AND EXCHANGE COMMISSION
Washington, D.C. 20549
__________________________________
Form 10-K
__________________________________
x | ANNUAL REPORT PURSUANT TO SECTION 13 OR 15(d) OF THE SECURITIES EXCHANGE ACT OF 1934 For the fiscal year ended December 31, 2010 |
Or
o | TRANSITION REPORT PURSUANT TO SECTION 13 OR 15(d) OF THE SECURITIES EXCHANGE ACT OF 1934 For the transition period from to . |
Commission file number 0-26844
__________________________________
RADISYS CORPORATION
(Exact name of registrant as specified in its charter)
__________________________________
Oregon | 93-0945232 | |
(State or other jurisdiction of incorporation or organization) | (I.R.S. Employer Identification Number) |
5445 N.E. Dawson Creek Drive, Hillsboro, OR | 97124 | |
(Address of principal executive offices) | (Zip Code) | |
Registrant’s telephone number, including area code | (503) 615-1100 |
Securities registered pursuant to Section 12(b) of the Act:
Title of each Class | Name of each exchange on which registered | |
Common Stock, No Par Value | The NASDAQ Stock Market LLC |
Securities registered pursuant to Section 12(g) of the Act:
None
____________________________________________________________________
Indicate by check mark if the registrant is a well-known seasoned issuer, as defined in Rule 405 of the Securities Act.
Yes o No x
Indicate by check mark if the registrant is not required to file reports pursuant to Section 13 or Section 15(d) of the Act.
Yes o No x
Indicate by check mark whether the Registrant (1) has filed all reports required to be filed by Section 13 or 15(d) of the Securities Exchange Act of 1934 during the preceding 12 months (or for such shorter period that the registrant was required to file such reports), and (2) has been subject to the filing requirements for the past 90 days. Yes x No o
Indicate by check mark whether the registrant has submitted electronically and posted on its corporate Web site, if any, every Interactive Data File required to be submitted and posted pursuant to Rule 405 of Regulation S-T (§232.405 of this chapter) during the preceding 12 months (or for such shorter period that the registrant was required to submit and post such files). Yes o No o
Indicate by check mark if disclosure of delinquent filers pursuant to Item 405 of Regulation S-K is not contained herein, and will not be contained, to the best of Registrant’s knowledge, in definitive proxy or information statements incorporated by reference in Part III of this Form 10-K or in any amendment to this Form 10-K. x
Indicate by check mark whether the registrant is a large accelerated filer, an accelerated filer, a non accelerated filer, or a smaller reporting company. See definition of “large accelerated filer,” “accelerated filer” and “smaller reporting company” in Rule 12b-2 of the Exchange Act. (Check one):
Large Accelerated Filer o | Accelerated Filer x | |
Non-accelerated filer o (Do not check if a smaller reporting company) | Smaller Reporting Company o | |
Indicate by check mark whether the registrant is a shell company (as defined in Rule 12b-2 of the Exchange Act) Yes o No x
The aggregate market value of the voting and non-voting common equity held by non-affiliates (based upon the closing price of the NASDAQ Global Select Market on June 30, 2010 of $9.52) of the Registrant at that date was approximately $160,419,511. For purposes of the calculation executive officers, directors and holders of 10% or more of the outstanding common stock are considered affiliates.
Number of shares of common stock outstanding as of March 11, 2011: 24,280,508
DOCUMENTS INCORPORATED BY REFERENCE
None.
RADISYS CORPORATION
FORM 10-K
TABLE OF CONTENTS
Page | ||
i
PART I
Item 1. Business
General
RadiSys Corporation is a leading provider of innovative hardware and software platforms for Next Generation IP-based wireless, wireline and video networks. RadiSys products include its market leading Advanced Telecommunications Computing Architecture ("ATCA") and Internet Protocol ("IP") Media Server platforms as well as application software for new IP-based communications services. These products enable customers to bring more new high-value products and services to market faster with a lower investment. RadiSys products are used in a wide variety of applications including 3G/4G/long term evolution ("LTE") wireless voice, data and video, Femtocell, Voice over Internet Protocol ("VoIP") and Video over IP communications and conferencing, Voice Quality Enhancement ("VQE"), and secure defense communications. Unless required by context, or as otherwise indicated, “we,” “us,” “our” and similar terms, as well as references to the “Company” and “RadiSys” refer to RadiSys Corporation and include all of our consolidated subsidiaries.
Our Markets
We provide application-ready software and hardware platforms to the following two markets:
Communications networks
The communications networks market is comprised of two product categories: Next Generation and Legacy/ Traditional Communication Networking products. Included in our Next Generation Communications Networks product group are ATCA and media server products. Included in our Legacy/ Traditional Communications Networks product group are our legacy/traditional wireless products and all other Communications Networks revenues that are not included in the Next Generation Communications Networks group.
We enable applications in the ATCA market such as 3G/4G/LTE wireless voice, data and video, deep packet inspection (“DPI”), Femtocell, mobile video, VoIP and Video over IP communications and conferencing, VQE, worldwide inter-operability for microwave access ("WiMax"), IP Video ("IPTV"), satellite, security and secure defense communications, among others.
We enable applications in the media server market such as conferencing, interactive voice and video network services, transcoding and VQE.
Commercial Systems
The commercial market consists primarily of solutions and systems for the medical imaging, test and measurement, and military/aerospace submarkets. Specific applications include:
• | Military/aerospace: ruggedized terminals, small unmanned ground vehicles and other military applications |
• | Small form factor communications |
• | Medical imaging: X-Ray machines, MRI scanners, CT scan imaging equipment and ultrasound equipment |
Market Drivers
We believe there are a number of fundamental drivers for growth in our target markets, including:
• | The increasing desire by original equipment manufacturers (“OEMs”) to utilize standards-based, merchant-supplied platforms to develop their systems. We believe more OEMs will see the advantage of combining their internal development efforts with merchant-supplied platforms from partners like RadiSys to deliver a larger number of more valuable new products to get to market faster at a lower total cost. |
• | Meaningful traffic growth in the network will require high density, high speed, high performance systems. RadiSys’ ATCA 10G and 40G systems provide 2 to 10 times the density and performance over legacy/traditional systems. |
1
• | The industry structure is changing in that Telecommunications Equipment Manufactures (“TEMs”) are focusing more on applications and network operations, while operators and carriers are focusing more on service and content delivery. RadiSys is benefiting from these market shifts and is providing more platforms and solutions to TEMs. |
• | Continued emergence, growth and evolution of applications utilizing 4G or LTE, WiMAX networks, Femtocell Gateways, VoIP, IP Communications, Mobile Video, Video Gateways, Video Conferencing, IPTV, IP interactive voice response ("IVR")/ Voice-to-text, IP Messaging, Network Surveillance, Network Security, Military/aerospace and Packet Inspection, all of which are supported by ATCA. |
Our Solutions
We provide our customers with advanced software and hardware platforms that enable them to focus their resources and development efforts on their key areas of differentiation, bring more products and services to market with speed and flexibility, using the latest technologies with reduced product and delivery costs.
Our customers select our solutions because we provide:
Superior technology. We have been the first to market with many technological advancements such as the industry’s first 10G common managed platform, and we are a leader in areas such as IP conferencing and COM Express new product development. Our design capabilities extend to media processing and central processing units (“CPUs”), graphics processing units and network processing units (“NPUs”), digital signal processing and integrated software managed platforms, such as media and application servers, as well as many other areas.
Experienced technical personnel. Our research and development ("R&D") staff has extensive experience in designing complex hardware and software solutions for the communications and commercial markets. We believe that our customers benefit from the broad array of IP and solutions that our R&D staff develop and support.
Reduced time to market. We offer standards-based, turn-key solutions such as ATCA and media server solutions for the communications networks market and COM Express solutions for the commercial market. These standards-based solutions combined with our strong technical resources provide our OEM customers with more flexibility and reduced time-to-market than if they developed these solutions internally.
Broad portfolio of products. Our product lines include a large portfolio of solutions including fully integrated platforms and application-ready systems with software rich content. Our product portfolio addresses a large range of customer requirements and applications. We believe that over time many of our customers will increasingly rely on a smaller set of suppliers who can address a broader set of their solution needs.
Long term customer relationships. We understand what our customers need and work closely with them. Accordingly, we have developed and maintained long-term relationships with many Tier 1 and 2 customers.
Our Strategy
To build market leadership in standards-based advanced infrastructure platforms in our target markets. We believe this strategy enables our customers to focus their resources and development efforts on their key areas of competency, allowing them to provide higher value systems with a time-to-market advantage and a lower total cost. We believe that we are currently the leading provider in the ATCA and IP Media Server markets. We also believe that we are a leading provider with our COM Express solutions in our targeted markets. We intend to continue to invest significant R&D and sales and marketing resources to build our presence in these market segments.
To develop our offering of higher value platform solutions. Historically, the majority of our revenues were derived from the sale of stand-alone boards. We have spent considerable resources developing application-ready platform solutions that incorporate hardware and software developed by us. We intend to increasingly focus our development efforts on providing more software content, positioning us to provide more complete application-ready platforms that provide more value for our customers. These platforms provide an additional revenue opportunity for us, and we believe revenues from these products have the potential to generate higher average selling prices and higher gross margins relative to the sale of boards or hardware centric platforms.
2
To expand our global customer base. We continue to expand the number of customers that we work with, particularly as more customers become aware of the benefits of standards-based solutions. Our global reach allows us to market our solutions to most of the leading system vendors in our target markets. We are also expanding our customer base through entrance into adjacent markets like military/aerospace.
To explore new partnerships and strategic acquisitions as a means to build leadership in our target markets. We continue to investigate partnerships and strategic relationships, which can expand the number of solutions we offer and increase our market reach. We also continue to evaluate potential acquisition opportunities to acquire new capabilities, which can help us achieve our strategic goals. For example, in the last four years, we acquired Convedia Corporation or Convedia®, a closely-held vendor of IP media servers, and certain assets of the Modular Communications Platform Division (“MCPD”) business from Intel Corporation (“Intel”), which included ATCA and compact peripheral component interconnect (“PCI”) product lines. Most recently we acquired the assets of privately-held Pactolus Communications Software Company ("Pactolus"), a developer of Next Generation IP communications solutions for converged time-division multiplexing/internet protocol ("TDM/IP") and session initiation protocol ("SIP") enabled VoIP networks.
Strategic Progress
• | New Product Announcements—We announced many new products this year, including our Integrated Mobile Media Server for mobile video services, our LTE Security Gateway solution, new 10/40 gigabit ATCA products, our Media Server based VQE, our C2 Server, a ruggedized ATCA platform for the military/ aerospace market, transcoding services for our media server and new COM Express modules in our Commercial business. |
• | Providing Higher Value Solutions—Strategically, we are focused on providing our customers more solution level products that leverage and add value to our existing platforms. These solutions command margins from between 40 and 50 percent. In March, we acquired Pactolus Communications Software Corporation ("Pactolus") that further strengthened our higher value, software-based solutions and is a great example of added software on top of our existing platforms enabling us to provide a more complete set of solutions to our customers. |
• | Market Share—We believe that we continue to be market leaders in our target markets with our Next Generation ATCA and Media Server platforms and solutions. |
• | Design Wins—We had awards across a number of new and growing market segments with our Next Generation platforms and solutions. Some of our media server wins this past year were in applications such as VoIP VQE, which was a new market for us, conferencing, network voice services and IVR. In ATCA we won business in markets such as LTE, Network Security, unmanned vehicle reconnaissance, WiMax for an Access Service Network Gateway, Femtocell Gateways and WLAN and satellite communications. In Commercial we won new COM Express business in network switching, medical imaging, VoIP and various telecommunications and defense applications. |
• | Customers—We are now selling Next Generation products into many of the largest and most innovative communications customers in the market. Our Next Generation products are sold to nine of the top ten Conference Service Providers (“CSPs”) and to more than three dozen different TEMs worldwide. |
• | Next Generation Growth—We have tripled our Next Generation revenues over the past three years, growing from $36 million in 2007 to $118 million in 2010. Overall gross margin percentages on our Next Generation platforms are between 40 and 50 percent and are approximately 20 percentage points higher than our Legacy/Traditional Communications Networks products. |
Our Products
We design a broad range of products at different levels of integration:
• | complete turn-key software and hardware integrated solutions allowing our customer's to provide revenue–generating telecommunication services, including multimedia conferencing, audio and video ringback tones, unified communications, prepaid and postpaid calling cards, Voice over Broad Band (VoBB), and IP contact center applications; |
• | security solutions for next generation communications infrastructure in the form of our LTE Security Gateway ("LTE SEG") which enables secure backhaul and provides packet network protection for 2G, 3G and 4G networks; |
3
• | application-ready platforms for communications networks such as 10G and 40G ATCA platforms and carrier grade IP media servers (“Media Servers”) with significant software content; |
• | subsystems and functional platforms using ATCA, COM Express and customer-specific proprietary platforms; |
• | compute, input/output (“I/O”), storage, inter-networking media processing and packet processing solutions; and |
• | software and firmware specific to the aforementioned hardware that includes intelligent platform management interface (“IPMI”) and hardware platform interface (“HPI”) for platform management. We also make all the necessary modifications to third party software, including basic input output system (“BIOS”), operating systems, protocol stacks and other requisite software, to provide a platform for our customer’s use. |
As a long-time member of the PCI Industrial Computer Manufacturers Group (“PICMG”), SCOPE Alliance and the Service Availability (“SA”) Forum standards bodies, we believe that we continue to play a leading role in the development and deployment of system architectural standards that are most relevant to our markets. In the IP communications market we believe that we continue to play a leading role in the development and deployment of media server and Multimedia Resource Function (“MRF”) standards through our membership in the Third-Generation Partnership Project (“3GPP”) and our long-term contributions to the Internet Engineering Task Force (“IETF”).
We have three primary product families: Media Servers, ATCA, and Commercial.
Media Servers
Our line of market leading IP media server products enables innovation and differentiation by providing powerful, reusable and highly scalable multimedia processing platforms for the VoIP and IMS telecommunication service providers, solution developers and enterprise customers. Together with our own application solutions or products offered by our solution partners, our IP media server products support the next generation of feature all IP rich, application-ready, high-value services that combine the best of the Internet and telecommunications worlds.
Our IP media servers enable fixed mobile convergence by delivering a shared IP media processing resource for any access network, including wireless, broadband, cable, public switched telephone network (PSTN) or satellite. The system's multi-service versatility enables service providers, and their application development partners, to rapidly deploy innovative revenue-generating telecommunications services including multimedia conferencing, ringback tones, unified communications and IP contact center applications. The introduction of our VQE solution provides a group of features specifically designed to address noise, packet loss, and echo in VoIP networks which greatly enhances the already compelling economic benefits of VoIP services. Our media server family of products includes these product choices that can address varying requirements and price points.
CMS-9000 Media Server. The RadiSys CMS–9000 media server provides a standards–based Multimedia Resource Function (“MRF”) that can be shared across a broad range of IMS applications from multiple application suppliers. Increased processing power and I/O throughput results in significant performance improvements for XML–based IVR and messaging applications, while expanding multi–service versatility for numerous IMS applications, including multimedia conferencing, IP Centrex, ringback tones, IP contact centers, video communications, and complex audio/video transcoding. We believe that the CMS–9000 media server provides industry–leading scalability and flexibility. Capacity can be increased through additional media processing cards, while innovative Digital Signal Processing (“DSP”), CPU and security accelerator cards provide hardware–level tuning based on application requirements.
CMS-3000 Media Server. The CMS-3000 media server consolidates the functions of traditional announcement and recording servers, audio and video conference bridges, interactive voice response units (IVR/VRU), messaging equipment and speech platforms onto a single, economical, purpose-built platform for delivering any enhanced service in your IP telephony data center.
Software Media Server. The Software Media Server extends RadiSys media processing technology into a flexible software-only product, providing enterprise VoIP and IMS solution vendors with additional platform and deployment options. A single entry-level Software Media Server deployment can economically support a broad range of Enterprise VoIP applications including IP PBX, IP Contact Centers, VoiceXML-based IVR, Unified Messaging, or voice/video enterprise-wide conferencing. Software Media Server can be deployed on commercial-off-the-shelf Linux appliance or blade servers, as well as the RadiSys ATCA platforms.
Solutions Software. With the acquisition of Pactolus we can now offer our customers a service delivery platform and turnkey application software for next generation network voice services. This software can be seamlessly integrated with our existing Media Server platforms or integrated with third party hardware. The introduction of VQE provides our customers with
4
an optional feature that can greatly enhance their VoIP services.
During 2010, we had the following significant developments associated with our media server line of products.
• | We were awarded new business in North America, Asia Pacific and Europe. Our wins are in a wide range of applications, including voice and video services, video lawful intercept, conferencing, announcements and IVR applications. We were also awarded our first VoIP VQE win with a North American Tier 1 service provider. This was an important win for us as it expands the market for our media server products to now include VQE. In addition, a new Tier 1 equipment maker went live with the RadiSys CMS-9000 with China Mobile. Finally, we were awarded other new business for our IP Media Server product in Color Ring Back Tone (“CRBT”), conferencing and network announcement applications. |
• | Our Integrated Mobile Media Server ("IMMS"), which was announced earlier this year, received the NGN 2010 Leadership Award from Technology Marketing Corporations NGN Magazine. The RadiSys IMMS is built on the Company's industry-leading IP Media Server. IMMS enhances mobile service providers' ability to grow new revenues through interactive voice and video services offered on expanded 3G and emerging 4G LTE deployments. During the third quarter we released our IMMS to a China-based Tier 1 equipment maker to begin trials. |
• | The VQE feature for our media server was recognized for exceptional innovation by Unified Communications Magazine and won 2009 product of the year. This feature improves audio quality, minimizes end-to-end delay and streamlines network integration. |
• | We announced real-time transcoding services for our media server product family. This transcoding capability converts one type of digital encoding standard to another, achieving interoperability among media streams using different endpoints in the network. TEMs and service providers need flexible, IP-based solutions to support the new transcoding requirements in converged IP-based mobile, NGN and IP Multimedia Subsystem networks. |
• | In the first quarter of 2010, we acquired the assets of Pactolus, a developer of Next Generation IP communications solutions for converged TDM/IP and SIP enabled VoIP networks. Pactolus software is used in operator-assisted and reservationless conferencing, prepaid/post-paid long distance services and is installed in over 45 telecommunications service provider customers worldwide. We believe that the acquisition will further strengthen our offering of telecom solutions. |
• | We were again named the market leader in media servers for the sixth consecutive year by Infonetics Research. RadiSys' media servers captured approximately 66.0% of the total fourth quarter 2010 market and approximately 65.0% for the full year 2010, which represents an 6.0% and 8.0% gain, respectively, from 2009. |
ATCA Product Family
Our ATCA product family includes a fully integrated, application-ready platform as well as a set of modular solutions all configurable for a wide variety of applications. ATCA delivers a common managed platform for network element and dataplane applications, which offers a significant benefit to our customers. Utilizing the same managed platform for a variety of applications, TEMs can reduce overall development time and significantly reduce development, lifecycle and equipment costs.
SYS-6010. The foundation of the RadiSys ATCA portfolio is our industry leading platform with 10G switching to handle high-throughput applications. The RadiSys ATCA SYS-6010 is a 10 Gigabit Ethernet platform that integrates with a multitude of state-of-the-art building blocks such as:
• | 10G switch and control module |
• | Dual/multi-core compute modules |
• | High density media resource modules |
• | High throughput packet processing modules |
• | Advanced Mezzanine Card (“AMC”) carrier-based line card modules and a comprehensive choice of AMCs |
Flexible Product Offerings. TEMs can design their own unique communications solutions using RadiSys’ broad range of award-winning modular solutions in conjunction with the RadiSys SYS-6010 or with other ATCA hardware. These building blocks include carrier blades, chassis, disk modules, line cards, and processing and switch modules.
5
Platform Software. RadiSys and our ecosystem partners provide a full complement of platform software, including operating systems, middleware, shelf management, high availability, system management and data path management.
During 2010 we had the following significant developments associated with our ATCA line of products.
• | We were awarded business in the following applications: |
• | Ethernet Passive Optical Network ("EPON") |
• | Femtocells |
• | IPTV |
• | 4G and LTE Networks |
• | Military reconnaissance |
• | Satellite communication |
• | Test and measurement |
• | WiMAX |
• | WLAN |
One LTE win was of notable size with a Tier 1 TEM. The military reconnaissance application will be used for high performance computer control and image acquisition and processing. The test and measurement win was for a carrier test equipment project and demonstrates one of the many different adjacent markets that are starting to adopt ATCA. The WiMAX win was with a new customer for an Access Service Network ("ASN") gateway project.
• | We announced our new LTE Security Gateway (“SEG”) product. The RadiSys LTE SEG is a carrier grade solution providing user authentication, data integrity and encryption for IP-based wireless networks and can be deployed as a standalone network element or integrated into other wireless data systems. The Security Gateway went into trials in the fourth quarter of 2010 and is expected to be commercially available in the first half of 2011. |
• | We announced the C2 Server, the industry's first ruggedized portable ATCA platform designed to provide the performance and features required for demanding, mobile applications in military/aerospace. |
• | Our 40G ATCA platform received the NGN 2010 Leadership Award from Technology Marketing Corporation's NGN Magazine. |
• | Our 40G ATCA platform was named as a recipient of the 2009 Product of the Year Award by Technology Marketing Corporation's Internet Telephony magazine. |
• | We announced three new ATCA products that offer customers increased choice and flexibility in 10/40G processing power. We believe that these new products provide significant performance increases and improved energy efficiency over previous processing technology and target applications for the communications and military/aerospace markets. |
Commercial Product Line
COM Express. Our COM Express solutions are designed for applications that require a standard processor and memory subsystem, but also modular flexibility to retain key design level IP on a separate carrier board. COM Express products are based on modular computing solutions. COM Express is a standard that provides a bridge from legacy interfaces such as PCI and integrated drive electronics (“IDE”) to new serial differential signaling technologies such as PCI Express, Serial ATA, USB 2.0, LVDS, and Serial DVO. Because they are modular and standards-based, our COM Express products help equipment manufacturers shorten their time to market and reduce development costs. By making processor, chipset and memory modular and independent of the rest of the system design, manufacturers can focus engineering resources on developing differentiating features and avoid the design turnover that comes with implementing new processor generations.
Embedded Servers. Also in the commercial product family are our embedded servers that specialize in meeting the needs of specific applications that are designed to be the central control point of a larger integrated system. Examples of systems that incorporate embedded servers include medical imaging systems, high performance test and measurement instruments, telecommunications “appliances,” and military imaging and signal processing systems.
6
During 2010 we had the following significant developments associated with our Commercial line of products.
• | We were awarded new COM Express business across all three geographies in the following applications: |
• | Defense |
• | Medical imaging |
• | Patient network monitoring |
• | Private Automatic Branch Exchange ("PABX") |
• | Telecommunications |
• | Test and measurement |
• | VoIP monitoring |
Specifically, the PABX win was for a strategic new telecom customer in Europe. In addition, a Tier 1 enterprise infrastructure provider in North America began production of a new network switching/routing solution using RadiSys' high performance COM Express products.
• | We introduced a new ruggedized COM Express module for deployment in harsh military/aerospace industrial environments that require extended temperature and vibration specifications. |
Segments
RadiSys is one operating segment as determined by the way that management makes operating decisions and assesses RadiSys’ financial performance. See Note 18 — Segment Information of the Notes to the Consolidated Financial Statements for segment information.
Competition
We have three different types of competitors:
• | Our target customers—Our most significant competition is from our own customers and potential customers who choose to remain vertically integrated and continue to internally design and supply all or most of their own platforms, modules and/or sub-systems. |
• | Platform Providers—Our competitors in the platform product space include Emerson Network Power, HP, and IBM. In addition, we face competition in the media server market from AudioCodes, Dialogic and Movius. |
• | Board providers—Our competitors in the board product space include ADLink Technologies, Advantech Co., Continuous Computing, Emerson Network Power and Kontron AG. |
We believe that our system level architecture and design expertise, coupled with our broad technology portfolio and flexibility in working intimately with system makers, will enable us to differentiate our products against our competition. We believe our rapid design cycles and standards-based solutions coupled with our global presence will provide customers with a time to market advantage at a lower total cost.
Customers
Our customers include many leading system makers in a variety of end markets. Examples of these customers include: AAI, Agilent Technologies, Arrow Electronics, AT&T (fulfilled through Nokia Siemens Networks), Bigband Networks, Cisco Systems, Comverse Technology, G.E. Healthcare, IBM, IP Access, Italtel, Kineto Wireless, Lestina International, LG Ericsson, Miltope, Motorola, Danaher (fulfilled through NEI), Nokia Siemens Networks, Okaya (end customer Fujitsu), PGi (formerly Premiere Global), Philips Healthcare, PointRed, Qwest, Samsung, Siemens Medical, Tellabs, NEC, UTStarcom, Viasat, Webex, West Corporation, and ZTE.
7
Our five largest customers, accounting for approximately 63.4% of revenues in 2010 are listed below with an example of the type of application which incorporates RadiSys products:
Customer | Application / End Customer | |
Arrow Electronics | Defense communications / telecommunications applications to various end customers | |
NEI | Network performance monitoring equipment with Danaher as the primary end customer | |
G.E. Healthcare | Medical imaging equipment with G.E. Healthcare as the end customer | |
Nokia Siemens Networks | 2, 2.5, and 3G wireless infrastructure equipment with Nokia Siemens Networks as the end customer and conferencing solutions sold through to AT&T as the end cusotmer | |
Philips Healthcare | Medical imaging equipment with Philips Healthcare as the end customer |
_____________________________________
Nokia Siemens Networks was our largest customer in 2010 accounting for 37.4% of total 2010 revenues.
Technology, Research, Development and Engineering
We believe that our technology, research, development and engineering expertise represents an important competitive advantage. Our R&D staff consisted of 289 engineers and technicians as of February 4, 2011. We currently have design centers located in the U.S, Canada, China and Malaysia as well as a relationship with design services firms in India.
A majority of our R&D efforts are focused on the development of sophisticated products targeted at a wide variety of applications. This is an important part of our strategy to provide a broader set of products, which allows deployment of flexible solutions leveraged off of reusable designs and commercially available components. We believe this will result in significant savings in development time and investment for our customers and will increase the number of applications into which RadiSys solutions can be incorporated. In addition, we are increasingly combining our standards-based products to create more integrated and more complex hardware and software based systems.
We believe that we have developed a unique and valuable portfolio of technology and intellectual property associated with our solutions that provides us a competitive advantage. Our objective is to retain the rights to technology developed during the design process. In some cases, we agree to share technology rights, manufacturing rights, or both, with the customer. However, we generally retain nonexclusive rights to use any shared technology.
Sales, Marketing, and Service
Our products are sold through a variety of channels, including direct sales, distributors and sales representatives. The total direct sales and marketing headcount was 88 as of February 4, 2011. We use our dedicated cross-functional teams to develop long-term relationships with our customers. Our cross-functional teams include sales, application engineering, marketing, program management, supply chain management and design engineering. Our teams collaborate with our customers to combine their development efforts in key areas of competency with our solutions to achieve higher quality, lower development and product cost and faster time to market for their products.
We market and sell our products in North America, EMEA and Asia Pacific. EMEA includes Europe, the Middle East and Africa while the Asia Pacific region includes India. In each of these geographic markets, products are sold principally through a direct sales force with our sales resources located in the U.S., Canada, Europe, China and Japan. In addition, in each of these geographies we make use of an indirect distribution model and sales representatives to access additional customers. In 2010, global revenues were comprised geographically of 34.3% from North America, 28.2% from EMEA and 37.5% from Asia Pacific. See Note 18—Segment Information of the Notes to the Consolidated Financial Statements for financial information by geographic area.
We believe that, along with providing our customers competitive time to market, low-cost and high-quality products our global services organization’s detailed involvement, beginning early in the product life-cycle, reduces our customer’s product risks. Service areas include warranty, repair, integration, training as well as product upgrades and enhancements in some of our Next Generation ATCA products.
8
Manufacturing Operations
Total manufacturing operations headcount was 137 as of February 4, 2011. We have historically utilized a combination of internal and outsourced manufacturing. However, during 2009 we initiated a plan to complete our strategic goal of operating based on a fully outsourced manufacturing model. As part of this plan, in 2010, we transferred our remaining internally manufactured products from our plant in Hillsboro, Oregon to lower cost manufacturing partners in Asia.
We utilize our offices in Shenzhen, China and Penang, Malaysia to oversee the manufacturing, integration and product testing efforts conducted by our contract manufacturing partners in these regions. Because many of our products typically have long life reliability requirements, they must undergo particularly rigorous stress testing. In addition, the oversight includes supply chain management as well as quality control.
In the fourth quarter of 2010, we decided to further consolidate all of our manufacturing capabilities with one contract manufacturer. We expect this transition to be substantially complete by September 30, 2011. Upon completion of our transition to a single contract manufacturer, we intend to close our office in Shenzhen, China. While our contract manufacturing agreements are on terms and conditions that we believe are customary for the industry and do not impart any rights of exclusivity and while our contract manufacturers do not supply any specialized know-how or intellectual property necessary to manufacture our products, alternative sources of manufacturing services for the RadiSys products, including transitioning the products, could require significant time and resources to establish. In addition, any decline in the quality of products produced by our contracting manufacturing partners could adversely impact our reputation and business performance. Finally, we could be adversely impacted if our contract manufacturer does not cooperate with our transition plan.
We also have an integration facility in Burnaby, British Columbia, which is responsible for the final integration, testing and delivery of Media Server systems. This organization works closely with our contract manufacturer to oversee the manufacturing process and functionality test all hardware components of an end system.
Backlog
As of December 31, 2010, our backlog was approximately $43.9 million, compared to $51.4 million as of December 31, 2009. We include in our backlog statistic all purchase orders scheduled for delivery within 12 months.
Intellectual Property
We hold 39 U.S. and 44 foreign utility patents, three U.S. design patents and have four U.S. and twelve foreign patent applications pending. We also rely on trade secrets, know how and rapid time to market for protection and leverage of our intellectual property. We have from time to time been made aware of others in the industry who assert exclusive rights to certain technologies, usually in the form of an offer to license certain rights for fees or royalties. Our policy is to evaluate such claims on a case-by-case basis. We may seek to enter into licensing agreements with companies having or asserting rights to technologies if we conclude that such licensing arrangements are necessary or desirable in developing specific products.
Employees
As of February 4, 2011, we had 619 employees, of which 567 were regular employees and 52 were agency temporary employees or contractors. We are not subject to any collective bargaining agreement, have never been subject to a work stoppage, and believe that we have maintained good relationships with our employees.
Corporate History
RadiSys Corporation was incorporated in March 1987 under the laws of the State of Oregon. Our principal offices are located at 5545 N.E. Dawson Creek Drive, Hillsboro, OR 97124; our telephone number is (503) 615-1100. Our website address is www.radisys.com.
9
INTERNET INFORMATION
Copies of our Annual Report on Form 10-K, Quarterly Reports on Form 10-Q, Current Reports on Form 8-K, and amendments to those reports filed or furnished pursuant to Section 13(a) or 15(d) of the Securities Exchange Act of 1934 (the “Exchange Act”) are available free of charge through our website (www.radisys.com) as soon as reasonably practicable after we electronically file the information with, or furnish it to, the Securities and Exchange Commission (the “SEC”).
We have adopted Corporate Governance Guidelines for our Board of Directors and a Code of Conduct and Ethics (“the Code”) for our Board of Directors, our Chief Executive Officer, principal financial and accounting officers and other persons responsible for financial management and our employees generally. We also have charters for the Audit Committee, Compensation and Development Committee, Nominating and Corporate Governance Committee of our Board of Directors. Copies of the above-referenced documents may be obtained on our website (www.radisys.com), and such information is available in print to any shareholder who requests it by contacting us at our corporate headquarters at (503)-615-1100. Information contained on the Company’s website is not included as part of, or incorporated by reference into, this report.
We also utilize a third party compliance website, EthicsPoint®, to provide our employees with a simple, risk-free way to anonymously and confidentially report actual or suspected activities that may involve financial or criminal misconduct or violations of the Code. This webpage is hosted on EthicsPoint’s secure servers and is not part of our website or intranet.
FORWARD-LOOKING STATEMENTS
This Annual Report on Form 10-K contains forward-looking statements. Some of the forward-looking statements contained in this Annual Report on Form 10-K include:
• | expectations and goals for revenues, gross margin, R&D expenses, selling, general and administrative expenses and profits; |
• | the impact of our restructuring events on future operating results; |
• | our projected liquidity; |
• | future operations and market conditions; |
• | industry trends or conditions and the business environment; and |
• | future levels of inventory and backlog and new products introductions. |
All statements that relate to future events or to our future performance are forward-looking statements. In some cases, forward-looking statements can be identified by terms such as “may,” “will,” “should,” “expect,” “plans,” “seeks,” “anticipate,” “believe,” “estimate,” “predict,” “potential,” “continue,” “seek to continue,” “intends,” or other comparable terminology. These forward-looking statements are made pursuant to safe-harbor provisions of the Private Securities Litigation Reform Act of 1995. These forward-looking statements involve known and unknown risks, uncertainties and other factors that may cause our actual results or our industries’ actual results, levels of activity, performance, or achievements to be materially different from any future results, levels of activity, performance, or achievements expressed or implied by these forward-looking statements.
These factors include, among others, (a) the Company's high degree of customer concentration, (b) the Company's transition to one contract manufacturer and use of the single contract manufacturer in the future for the significant portion of the production of our products, (c) the anticipated amount and timing of revenues from design wins due to the Company's customers' product development schedule, cancellations or delays, (d) matters affecting the embedded system industry, including changes in industry standards, changes in customer requirements and new product introductions, (e) currency exchange rate fluctuations, changes in tariff and trade policies and other risks associated with foreign operations, and (f) other factors listed in Item 1 A “Risk Factors” and in other reports we file with the SEC.
Forward-looking statements in this Annual Report on Form 10-K include discussions of our goals, including those discussions set forth in Item 7. “Management’s Discussion and Analysis of Financial Condition and Results of Operations”. We cannot provide assurance that these goals will be achieved.
Although forward-looking statements help provide additional information about us, investors should keep in mind that forward-looking statements are only predictions, at a point in time, and are inherently less reliable than historical information. In evaluating these statements, you should specifically consider the risks outlined above and those listed under “Risk Factors” in Item 1A. These risk factors may cause our actual results to differ materially from any forward-looking statement.
10
We do not guarantee future results, levels of activity, performance or achievements and we do not assume responsibility for the accuracy and completeness of these statements. The forward-looking statements contained in this Annual Report are made and based on information as of the date of this report. We assume no obligation to update any of these statements based on information after the date of this report.
Item 1A. Risk Factors
There are many factors that affect our business and the results of our operations, many of which are beyond our control. The risks described in this Annual Report on Form 10-K for the year ended December 31, 2010, are not the only risks facing our Company. Additional risks and uncertainties not currently known to us or that we currently deem to be immaterial also may materially adversely affect our business, financial condition and/or operating results.
Because of the significant percentage of our sales to certain customers, the loss of, or a substantial decline in sales to, a top customer could have a material adverse effect on our revenues and profitability.
For 2010, 2009 and 2008, we derived 63.4%, 64.6%, and 59.7%, respectively, of our revenues from our five largest customers during these periods. These five customers were Arrow Electronics, Danaher, G.E. Healthcare, Nokia Siemens Networks and Philips Healthcare, which each purchase a variety of products from us. During 2010, 2009 and 2008, revenues attributable to Nokia Siemens Networks were 37.4%, 45.9%, and 43.5%, respectively. Because of our significant customer concentration, our largest customers have additional pricing power over us that can adversely affect revenues, gross margins or cause us to gradually exit lines of business with them that do not meet profitability objectives. Further, a financial hardship experienced by, or a substantial decrease in sales to, any one of our customers could materially affect our revenues and profitability. Generally, our products are components for our customers’ products and, in certain instances, our customers are not the end-users of our products. If any of these customers’ efforts to market the products we design and manufacture for them or the end products into which our products are incorporated are unsuccessful in the marketplace or if these customers experience a decrease in demand for such products, our design wins, sales and/or profitability will be significantly reduced. Furthermore, if these customers experience adverse economic conditions in the end markets into which they sell our products, we would expect a significant reduction in spending by these customers in addition to increasing our exposure to credit risk, which may limit our ability to collect. Some of these end markets are characterized by intense competition, rapid technological change and economic uncertainty and as such there is no guarantee that the revenues associated with the potential loss of a key customer will be replaced by the establishment of new business relationships. Our exposure to economic cyclicality and any related fluctuation in demand from these customers could have a material adverse effect on our revenues and financial condition.
We use two major contract manufacturers to assemble certain RadiSys products, and a loss or degradation in performance of a contract manufacturer could have a material adverse effect on our business or our profitability.
In 2010, we completed the transition to a fully outsourced model of manufacturing. Furthermore, in the fourth quarter of 2010, we began a process to consolidate all of our manufacturing capabilities with one contract manufacturer. If our third party manufacturers fail to adequately perform, our revenues and profitability could be adversely affected. Among other things, inadequate performance by our contract manufacturers could include the production of products that do not meet our quality standards or schedule and delivery requirements and could cause us to manufacture products internally or seek additional sources of manufacturing. Additionally, our contract manufacturers may decide in the future to discontinue conducting business with us. If we are required to change contract manufacturers or assume internal manufacturing operations due to any termination of the agreements with our contract manufacturers, we may lose revenue, experience manufacturing delays, incur increased costs or otherwise damage our customer relationships. We cannot guarantee that we will be able to establish alternative manufacturing relationships on similar terms.
Also, once the transition to one contract manufacturer is complete, the loss of this manufacturer, a deterioration of our relationship with them, or any unilateral modification to the contractual terms could have an adverse effect on our business and operating results.
Additionally, if our contract manufacturers are responsible for a patent or copyright infringement (including through the supply of counterfeit parts), we may or may not be able to hold them responsible and we may incur costs in defending claims or providing remedies. Such infringements may also cause our customers to abruptly discontinue selling the impacted products, which would adversely affect our net sales of those products, and could affect our customer relationships more broadly.
11
Our ability to successfully transition all of our manufacturing to one contract manufacturer depends on the performance of our current contract manufacturers as well as our own management. If our contract manufacturers do not perform as expected, we underestimate the cost of the transfer or our internal measures to mitigate this risk are not effective, we could have a material adverse affect on our business or our profitability.
In 2010, we made the decision to consolidate all of our manufacturing capabilities with one manufacturer. During 2011, we will begin the process of transitioning manufacturing to Jabil, which is expected to be substantially complete by September 30, 2011. The successful transition of our manufacturing to Jabil is partly dependent upon the cooperation and continued performance of our other contract manufacturer. During the transition period, we must establish procedures to ensure that our contract manufacturer maintains its high standards of quality and on time delivery with a reasonable cost structure despite the pending termination of our relationship. Our master supplier agreement provides for a six month notification period for the termination of the agreement. Although we have not yet provided formal notice of termination of the master supplier agreement, we must still ensure that the transition is completed smoothly with sustained high performance before setting a formal termination date.
As part of the transition, we plan to increase our inventory to mitigate the risk of not being able to meet customer demand during the transition and to be able to fulfill last time buy orders of products that will not be transferred to Jabil. Holding increased levels of inventory could expose us to increased excess and obsolete charges that could negatively impact our operating results. Not maintaining adequate levels of inventory could result in missed sales opportunities and a loss of market share, negatively impacting revenues and our overall operating results.
If the transition does not go as expected, in addition to other issues noted above, each of the following events could have an adverse effect on our business and operating results and our business reputation:
• | delay of shipments; |
• | unexpected cost overruns; and |
• | quality issues with outsourced products. |
Once the transition is complete, our use of one primary contract manufacturer to produce all of our products could increase our exposure to product quality problems, late deliveries and increased costs. While we will have influence as their customer, we will not have complete control.
Our ability, as well as our contract manufacturers’ ability, to meet customer demand depends largely on our ability to obtain raw materials and a reduction or disruption in the availability of raw materials could negatively impact our business.
The continued global economic contraction has caused many of our component suppliers to reduce their manufacturing capacity. As the global economy improves, our component suppliers are experiencing and will continue to experience supply constraints until they expand capacity to meet increased levels of demand. These supply constraints may adversely affect the availability and lead times of components for our products. Increased lead times mean we may have to forsake flexibility in aligning our supply to customer demand changes and increase our exposure to excess inventory since we may have to order material earlier and in larger quantities. Further, supply constraints will likely result in increased expedite and overall procurement costs as we attempt to meet customer demand requirements. In addition, these supply constraints may affect our ability, as well as our contract manufacturers’ ability, to meet customer demand and thus result in missed sales opportunities and a loss of market share, negatively impacting revenues and our overall operating results.
Because of the limited number of direct and indirect suppliers, or in some cases, one supplier, for some of the components we and our contract manufacturers use, a loss of a supplier, a decline in the quality of these components, or a shortage of any of these components could have a material adverse effect on our business or our profitability.
There are only a limited number of direct and indirect suppliers, or in some cases, only one supplier, for a continuing supply of the components our contract manufacturers use in the manufacture of our products and any disruption in supply could adversely impact our financial performance. For example, we have some silicon that is solely sourced from companies like Intel, Texas Instruments, Cavium or Broadband, to name a few. We obtain these components from resellers, integrators and component manufacturers. Alternative sources of components that are procured from one supplier or a limited number of suppliers could be difficult to locate and/or would require a significant amount of time and resources to establish. We have in the past experienced and may in the future experience difficulty obtaining adequate quantities of key components used in certain of our products, which have resulted and may result in delayed or lost sales. Delayed sales can also result from our silicon vendor's delays or cancellations of new technologies and products as these technologies and products are often designed into new RadiSys products before they are fully available from our suppliers. In addition, current economic conditions expose us to an increased risk of vendor insolvency, which, given our reliance upon a limited supply base, could result in an inability to
12
procure adequate quantities of materials and components to meet our customers’ demand and/or ability to procure the quality of materials and components our customers require.
Our failure to develop and introduce new products on a timely basis could harm our ability to attract and retain customers.
Our industry is characterized by rapidly evolving technology, frequent product introductions and ongoing demands for greater performance and functionality. Therefore, we must continually identify, design, develop and introduce new and updated products with improved features to remain competitive. To introduce these products on a timely basis we must:
• | design innovative and performance-improving features that differentiate our products from those of our competitors; |
• | identify emerging technological trends in our target markets, including new standards for our products in a timely manner; |
• | accurately define and design new products to meet market needs; |
• | anticipate changes in end-user preferences with respect to our customers’ products; |
• | rapidly develop and produce these products at competitive prices; |
• | anticipate and respond effectively to technological changes or product announcements by others; and |
• | provide effective technical and post-sales support for these new products as they are deployed. |
We intend to develop new products and expand into new markets, which may not be successful and could harm our operating results.
We intend to expand into new markets and develop new products and applications based on our existing technologies integrated with new technologies organically developed or acquired. These efforts have required and will continue to require us to make substantial investments, including but not limited to significant research, development and engineering expenditures. Additionally, many of the new products and applications we are working on may take longer and more resources to develop and commercialize than originally anticipated. Specific risks in connection with expanding into new products and markets include, but are not limited to the inability to transfer our quality standards and technology into new products, the failure of customers to accept our new products, longer product development cycles and competition and intellectual property disputes. We may not be able to successfully manage expansion into new markets and products and these unsuccessful efforts may harm our financial condition and operating results.
Our projections of future purchase orders, revenues and earnings are highly subjective and may not reflect future results which could negatively affect our financial results and cause volatility in the price of our common stock.
We have several contracts with most of our major customers but these contracts do not commit them to purchase a minimum amount of our products. These contracts generally require our customers to provide us with forecasts of their anticipated purchases. However, our experience indicates that customers can change their purchasing patterns quickly in response to market demands, changes in their management or strategy, among other factors, and therefore these forecasts may not be relied upon to accurately forecast sales. From time to time we provide projections to our shareholders and the investment community of our future sales and earnings. Since we do not have long-term purchase commitments from our major customers and the customer order cycle is short, it is difficult for us to accurately predict the amount of our sales and related earnings in any given period. Our projections are based on management’s best estimate of sales using historical sales data, information from customers and other information deemed relevant. These projections are highly subjective since sales to our customers can fluctuate substantially based on the demands of their customers and the relevant markets. Our period to period revenues have varied in the past and may continue to vary in the future.
Unanticipated reductions in purchase orders from our customers may also result in us having to write off excess or obsolete inventory. Conversely, if we underestimate customer demand or if insufficient manufacturing capacity is available or if our customers experience a financial hardship or if we experience unplanned cancellations of customer contracts, the current provision for the inventory reserves may be inadequate and as a result we could forego revenue opportunities and potentially lose market share and damage our customer relationships. In addition and as stated above, we have a high degree of customer concentration. Any significant change in purchases by any one of our large customers can significantly affect our sales and profitability.
If demand for our products fluctuates, our revenues, profitability and financial condition could be adversely affected. Important factors that could cause demand for our products to fluctuate include:
• | changes in customer product needs; |
13
• | changes in the level of customers’ inventory; |
• | changes in business and economic conditions; |
• | changes in the mix of products we sell; and |
• | market acceptance of our products. |
The price of our common stock may be adversely affected by numerous factors, such as general economic and market conditions, changes in analysts’ estimates regarding earnings as well as factors relating to the commercial systems and communication networking markets in general. We cannot accurately forecast all of the above factors. As a result, we believe that period-to-period comparisons may not be indicative of future operating results. Our operating results in any future period may fall below the expectations of public market analysts or investors.
Our business depends on conditions in the communications networks and commercial systems markets. Demand in these markets can be cyclical and volatile, and any inability to sell products to these markets or forecast customer demand due to unfavorable or volatile market conditions could have a material adverse effect on our revenues and gross margin.
We derive our revenues from a number of diverse end markets, some of which are subject to significant cyclical changes in demand. In 2010, we derived 73.8% and 26.2% of our revenues from the communications networks and commercial systems markets, respectively. In 2009, we derived 78.5% and 21.5% of our revenues from the communications networks and commercial systems markets, respectively. In 2008, we derived 79.2% and 20.8% of our revenues from the communications networks and commercial systems markets, respectively. We believe that our revenues will continue to be derived primarily from these two markets. Communications networks revenues include, but are not limited to, sales to AT&T (fulfilled through Nokia Siemens Networks), Bigband Networks, Cisco Systems, Comverse Technology, IBM, IP Access, Italtel, Kineto Wireless, LG Ericsson, Motorola, Danaher (fulfilled through NEI), Nokia Siemens Networks, Okaya (end customer Fujitsu), PGi (formerly Premiere Global), PointRed, Qwest, Samsung, Tellabs, NEC, UTStarcom, Viasat, Webex, West Corporation, and ZTE. Commercial systems revenues include, but are not limited to, sales to AAI, Agilent Technologies, Arrow Electronics, G.E. Healthcare, IBM, Lestina International, Miltope, Philips Healthcare, and Siemens Medical. Generally, our products are components for our customers’ products and, in certain instances, our customers are not the end-users of our products. If our customers experience adverse economic conditions in the end markets into which they sell our products, we would expect a significant reduction in spending by our customers. Some of these end markets are characterized by intense competition, rapid technological change, consolidation of providers and economic uncertainty. Our exposure to economic cyclicality and any related fluctuation in customer demand in these end markets could have a material adverse effect on our revenues and financial condition. We are expanding into applications either through new product development projects with our existing customers or through new customer relationships, but no assurance can be given that this strategy will be successful.
In addition, customer demand for our products is subject to significant fluctuation. A prolonged economic downturn in the business or geographic areas in which we sell our products could reduce demand for our products and result in a decline in our revenue, gross margin and overall profitability. Volatility and disruption of financial and credit markets could limit our customers’ ability to obtain adequate financing to maintain operations and invest in network infrastructure and therefore could also reduce demand for our products and result in a decline revenue, gross margin and overall profitability. If we overestimate demand, we may experience underutilized capacity and excess inventory levels. As such, if we underestimate demand, we may miss sales opportunities and incur additional costs for labor overtime, equipment overuse and logistical complexities. Additionally, we have adverse purchase commitment liabilities, which means we are contractually obligated to reimburse our contract manufacturers for the cost of excess inventory used in the manufacture of our products for which there is no forecasted or alternative use. Unexpected decreases in customer demand or our inability to accurately forecast customer demand could also result in increases in our adverse purchase commitment liability and have a material adverse effect on our gross margins and profitability.
Not all new design wins ramp into production, and even if ramped into production, the timing of such production may not occur as we or our customers had estimated or the volumes derived from such projects may not be as significant as we had estimated, which could have a substantial negative impact on our anticipated revenues and profitability.
Our revenue growth expectations for our Next Generation products are highly dependent upon successful ramping of our design wins. The time between when we achieve a design win with a customer and when we begin shipping to that customer at production levels generally has been shortened with our standards-based model. In some cases there is no time in between when a design win is achieved and when production level shipments begin. With many new design wins with our ATCA platforms and our COM Express module’s, customers may require us to provide customization to our products. In addition, customers may require significant time to port their own applications to our systems. Customization of our products as well as porting of customer specific applications can take six to twelve months and in some circumstances can be as long as 24 months. After that, there is an additional time lag from the start of production ramp to peak revenue. Not all design wins ramp into
14
production and, even if a design win ramps into production, the volumes derived from such projects may be less than we had originally estimated. Customer projects related to design wins are sometimes canceled or delayed, or can perform below original expectations, which can adversely impact anticipated revenues and profitability. In particular, the volumes and time to production ramp associated with new design wins depend on the adoption rate of new technologies in our customers’ end markets, especially in the communications networking sector. Program delays or cancellations could be more frequent during times of meaningful economic downturn or due to the consolidation of one or more of our end customers. Should technologies such as Voice over IP, IMS, 3G and 4G/LTE wireless technologies, IPTV, advanced multimedia applications, Femtocell applications and other emerging technologies not be adopted as fast as we or our customers anticipate, actual volumes from new design wins may be lower than we are expecting, which could adversely affect our revenue growth and gross margin expectations.
We rely on our key management and depend on the recruitment and retention of qualified personnel, and our failure to attract and retain such personnel could seriously harm our business.
A small number of key executives manage our business. Their departure could have a material adverse effect on our operations. In addition, due to the specialized nature of our business, our future performance is highly dependent upon our ability to attract and retain qualified engineering, manufacturing, marketing, sales and management personnel for our operations. Competition for personnel is intense, and we may not be successful in attracting and retaining qualified personnel. Our failure to compete for these personnel could seriously harm our business, results of operations and financial condition. In addition, if incentive programs we offer are not considered desirable by current and prospective employees, we could have difficulty retaining or recruiting qualified personnel. If we are unable to recruit and retain key employees, our product development, and marketing and sales could be harmed.
As of December 31, 2010, we had 1.9 million outstanding stock options awarded to our executive management team with an average grant price of $12.49. As the average grant price of our outstanding options is greater than our current stock price, our stock option program may become less effective as an incentive to retain our current management team.
The growth of our business is dependent in part on successfully implementing our international expansion strategy.
In 2010, we completed the transition to a fully outsourced manufacturing model utilizing Asian-based contract manufacturers. We also increased our international headcount partly due to our strategic plan to increase our engineering presence in Asia.
Both of these strategic initiatives increase our international presence, which along with our existing international operations involve risks inherent in doing business on an international level. These risks include the following:
• | difficulties in managing operations due to distance, language, and cultural differences; |
• | different or conflicting laws and regulations; |
• | accounting (including managing internal control over financial reporting in our non-U.S. subsidiaries), tax and legal complexities arising from international operations; |
• | burdensome regulatory requirements and unexpected changes in these requirements, including data protection requirements; |
• | political and economic instability; |
• | fluctuations in currency exchange rates; and |
• | different laws and regulations surrounding taxes and their potentially adverse consequences. |
Our foreign currency exchange risk management program reduces, but does not eliminate, the impact of currency exchange rate movements. If we cannot manage our international operations successfully, our business, results of operations and financial condition could be adversely affected.
Acquisitions and partnerships may be more costly or less profitable than anticipated and may adversely affect the price of our common stock.
Future acquisitions and partnerships may involve the use of significant amounts of cash, potentially dilutive issuances of equity or equity-linked securities, issuances of debt and amortization of intangible assets with determinable lives. Moreover, to the extent that any proposed acquisition or strategic investment is not favorably received by shareholders, analysts and others in the investment community, the price of our common stock could be adversely affected. In addition, acquisitions or strategic investments involve numerous risks, including:
15
• | difficulties in the assimilation of the operations, technologies, products and personnel of the acquired company; |
• | the diversion of management’s attention from other business concerns; |
• | the risks of entering markets in which we have no or limited prior experience; |
• | the potential loss of key employees of the acquired company; |
• | unanticipated liabilities; |
• | performance by the acquired business below our expectations; and |
• | issues with meeting the needs of acquired customers. |
In the event that we make an acquisition or enter into a partnership and we are unable to successfully integrate operations, technologies, products or personnel that we acquire, our business, results of operations and financial condition could be materially adversely affected. We may expend additional resources without receiving a related benefit from strategic alliances with third parties.
We operate in intensely competitive industries, and our failure to respond quickly to technological developments and incorporate new features into our products could have an adverse effect on our ability to compete.
We operate in intensely competitive industries that experience rapid technological developments, changes in industry standards, changes in customer requirements, and frequent new product introductions and improvements. If we are unable to respond quickly and successfully to these developments, we may lose our competitive position, and our products or technologies may become uncompetitive or obsolete. Similarly, if there are changes to technology requirements, it can render our products and technologies uncompetitive. To compete successfully, we must maintain a successful marketing and R&D effort, develop new products and production processes, and improve our existing products and processes at the same pace or ahead of our competitors. We may not be able to successfully develop and market these new products; the products we invest in and develop may not be well received by customers; and products developed and new technologies offered by others may affect the demand for our products. These types of events could have a variety of negative effects on our competitive position and our profitability and financial condition, such as reducing our revenue, increasing our costs, lowering our gross margin, reducing our profitability and/or requiring us to recognize and record impairments of our assets.
There are a number of trends and factors affecting our markets, including economic conditions in the United States, Europe and Asia, which are beyond our control. These trends and factors may result in increasing upward pressure on the costs of products and an overall reduction in demand.
There are trends and factors affecting our markets and our sources of supply that are beyond our control and may negatively affect our cost of sales. Such trends and factors include: adverse changes in the cost of raw commodities and increasing freight, energy, and labor costs in developing regions such as China. Our business strategy has been to provide customers with faster time-to-market and greater value solutions in order to help them compete in an industry that generally faces downward pricing pressure. In addition, our competitors have in the past lowered, and may again in the future lower, prices in order to increase their market share, which would ultimately reduce the price we may realize from our customers. If we are unable to realize prices that allow us to continue to compete on this basis of performance, our profit margin, market share, and overall financial condition and operating results may be materially and adversely affected.
Some of the products or technologies acquired, licensed or developed by us incorporate open source software, and we may incorporate open source software into other products in the future. Any failure to comply with the terms of one or more of open source licenses could negatively affect our business.
Certain of our products and technologies incorporate software licensed by its authors or other third parties under so-called open source licenses, including, for example, the GNU General Public License (“GPL”), GNU Lesser General Public License (“LGPL”), the Common Public License, "Apache-style" licenses, "Berkley Software Distribution or BSD-style" licenses, among other open source licenses. Some of these open source licenses contain requirements that we offer our products that use the open source software for no cost, that we make available source code for modifications or derivative works we create based upon, incorporating or using the open source software and/or that we license such modifications or derivative works under the terms of the particular open source license, granting third parties certain rights of further use. By the terms of certain open source licenses, we could be required to release the source code of our proprietary software if we combine our proprietary software with open source software in a certain manner. If an author or other third-party that distributes such open source software were to allege that we had not complied with the conditions of one or more of these licenses, we could be required to incur significant legal expenses defending against such allegations. If our defenses were not successful, we could be enjoined from the distribution of our products that contained the open source software and required to make the source code for the open source software available to others, to grant third parties certain rights of further use of our software or to remove the open source software from our products, which could disrupt the distribution and sale of some of our products. Further, if we
16
combine our proprietary software with open source software in a certain manner, under some open source licenses we could be required to release the source code of our proprietary software. If an author or other third-party that distributes open source software were to obtain a judgment against us based on allegations that we had not complied with the terms of any such open source licenses, we could also be subject to liability for copyright infringement damages and breach of contract for our past distribution of such open source software. In addition to risks related to license requirements, usage of open source software can lead to greater risks than use of third party commercial software, as open source licensor's generally do not provide warranties or controls on origin of the software.
We monitor our use of open source software to avoid subjecting our products to unwanted conditions. Although we believe that we have complied with our obligations under the various applicable licenses for open source software that we use, there is little or no legal precedent governing the interpretation of many of the terms of certain of these licenses, and therefore the potential impact of these terms on our business is somewhat unknown and may result in unanticipated obligations regarding our products and technologies, which may negatively affect our business, financial condition, operating results, cash flow and ability to commercialize our products or technologies.
Competition in the market for embedded systems is intense, and if we lose our market share, our revenues and profitability could decline.
We face competition in the design of embedded solutions from a number of sources. Our principal competition remains the internal design resources of our own customers. Many of our customers retain the ability to design embedded solutions in-house. In order to achieve design wins and receive subsequent orders from these customers, we must convince them of the benefits associated with using our design services and solutions rather than solutions designed by their in-house personnel. While we believe that many of our customers will increase the proportion of their solutions sourced from merchant suppliers, we will need to continue to demonstrate the benefits of our solutions relative to similar products that could be developed by our customers’ internal personnel in order to successfully execute our strategy. In addition, consolidation of our customers can cause material changes in their use of third parties to realize new product designs.
We also compete with a number of companies and divisions of companies that focus on providing embedded solutions, including, but not limited to, ADLink Technologies, Advantech Co., AudioCodes, Continuous Computing, Dialogic, Emerson Network Power, Hewlett-Packard, IBM, Kontron AG, and Movius.
Because the embedded systems market is growing, the market is attracting new non-traditional competitors. These non-traditional competitors include contract manufacturers that provide design services and Asian-based original design manufacturers.
Some of our competitors and potential competitors have a number of significant advantages over us, including:
• | a longer operating history; |
• | greater name recognition and marketing power; |
• | preferred vendor status with our existing and potential customers; |
• | significantly greater financial, technical, marketing and other resources, which allow them to respond more quickly to new or changing opportunities, technologies and customer requirements; |
• | broader product and service offering to provide more complete and valued solutions; and |
• | lower cost structures which, among other things, could include different accounting principles relative to U.S. generally accepted accounting principles (“GAAP”). |
Furthermore, existing or potential competitors may establish cooperative relationships with each other or with third parties or adopt aggressive pricing policies to gain market share.
As a result of increased competition, we could encounter significant pricing pressures and/or suffer losses in market share. These pricing pressures could result in significantly lower average selling prices for our products. We may not be able to offset the effects of any price reductions with an increase in the number of customers, cost reductions or otherwise. In addition, many of the industries we serve, such as the communications industry, are encountering market consolidation, or are likely to encounter consolidation in the near future, which could result in increased pricing pressure and additional competition thus weakening our position or causing delays in new design wins and their associated production.
17
We have incurred, and may in the future incur, restructuring and other charges, the amounts of which are difficult to predict accurately.
From time to time, we have sought to optimize our operational capabilities and efficiencies and focus our efforts and expertise through business restructurings. In the future we may decide to engage in discrete restructurings of our operations if business or economic conditions warrant. Possible adverse consequences related to such actions may include various charges for such items as idle capacity, disposition costs, severance costs, loss of propriety information and in-house knowledge. We may be unsuccessful in any of our current or future efforts to restructure our business, which may have a material adverse effect upon our business, financial condition or results of operations.
Our international operations expose us to additional political, economic and regulatory risks not faced by businesses that operate only in the United States.
In 2010, 2009, and 2008, as measured by delivery destination, we derived 0.3%, 0.9% and 1.6%, respectively, of our revenues from Canada and Mexico, 28.2%, 27.2% and 37.0%, respectively, of our revenues from EMEA and 37.5%, 39.9% and 30.5%, respectively, from Asia Pacific. During 2010, we continued to globally diversify our operations and completed our transition to a fully outsourced manufacturing model. As part of this plan we transferred our remaining internally manufactured products from our plant in Hillsboro, Oregon to lower cost manufacturing partners in Asia. As of December 31, 2010, 100% of our manufacturing was completed by our Asian contract manufacturing partners. As a result of all these activities, we are subject to worldwide economic and market conditions risks generally associated with global trade, such as fluctuating exchange rates, tariff and trade policies, domestic and foreign tax policies, foreign governmental regulations, political unrest, wars and other acts of terrorism and changes in other economic conditions. These risks, among others, could adversely affect our results of operations or financial position. Additionally, some of our sales to overseas customers are made under export licenses that must be obtained from the U.S. Department of Commerce. Protectionist trade legislation in either the United States or other countries, such as a change in the current tariff structures, export compliance laws, trade restrictions resulting from war or terrorism, or other trade policies could adversely affect our ability to sell or to manufacture in international markets. Additionally, U.S. federal and state agency restrictions imposed by the Buy American Act or the Trade Agreement Act may apply to our products manufactured outside the United States. Furthermore, revenues from outside the United States are subject to inherent risks, including the general economic and political conditions in each country. As a result of the recent financial crisis and tightening of the credit markets, our customers and suppliers may face issues gaining timely access to sufficient credit, which could impair our customers’ ability to make timely payments to us and could cause key suppliers to delay shipments and face serious risks of insolvency. These risks, among others, could adversely affect our results of operations or financial position.
Our ability to procure contracts, maintain and increase revenues in foreign markets may be negatively impacted by increasing protectionism of foreign governments.
Some foreign governments have come under increased pressure to protect their domestic economy and national security. Economic and security concerns have resulted in increasing protectionism that excludes foreign market participants from successfully procuring contracts and gaining sales in foreign markets. As a result, our revenues could decrease and business and operating results could be adversely affected.
If we are unable to protect our intellectual property, we may lose a valuable competitive advantage or be forced to endure costly litigation.
We are a technology dependent company, and our success depends on developing and protecting our intellectual property. We rely on patents, copyrights, trademarks and trade secret laws to protect our intellectual property. At the same time, our products are complex and are often not patentable in their entirety. We also license intellectual property from third parties and rely on those parties to maintain and protect their technology. We cannot be certain that our actions will protect our proprietary rights. Any patents owned by us may be invalidated, circumvented or challenged. Any of our patent applications, whether or not being currently challenged, may not be issued with the scope of the claims we seek, if at all. If we are unable to adequately protect our technology, or if we are unable to continue to obtain or maintain licenses for protected technology from third parties, it could have a material adverse effect on our results of operations. In addition, some of our products are now designed, manufactured and sold outside of the United States. Despite the precautions we take to protect our intellectual property, this international exposure may reduce or limit protection of our intellectual property, which is more prone to design piracy outside of the United States.
Third parties may also assert infringement claims against us in the future; assertions by third parties may result in costly litigation and we may not prevail in such litigation or be able to license any valid and infringed patents from third parties on
18
commercially reasonable terms. Litigation, regardless of its outcome, could result in substantial costs and diversion of our resources. Any infringement claim or other litigation against us or by us could materially adversely affect our financial condition and results of operations.
Changes to the inputs used to value our share based awards could adversely affect our operating results.
We are required to recognize the fair value of stock options and other share-based payment compensation to employees and Board of Directors as compensation expense in the statement of income. Option pricing models require the input of highly subjective assumptions, including stock price volatility, expected life and forfeiture rate of such options. We base our estimates on historical experience as well as other assumptions management believes to be reasonable under the circumstances at the time of updating our assumptions. Accordingly, actual results may differ significantly from these estimates, which could have a material impact on our financial position and results of operations. Given the unpredictable nature and current significant volatility of the “Black-Scholes” variables and other management assumptions such as number of options to be granted, underlying strike price and associated income tax impact, share based payment costs may differ from estimates as well as increase in future periods.
Total share-based compensation expense decreased for the year end December 31, 2010, as compared to the year ended December 31, 2009, however unfavorable changes in the other assumptions used to value our share-based payment arrangements could result in future increased compensation costs. Any such increase will be driven by significant fluctuations to the inputs used in applying our Black-Scholes valuation model, which may have a material impact on our operating results.
Our disclosure controls and internal control over financial reporting do not guarantee the absence of error or fraud.
Disclosure controls are procedures designed to ensure that information required to be disclosed in our reports filed under the Exchange Act is recorded, processed, summarized and reported within the time periods specified in the SEC’s rules and forms. Disclosure controls are also designed to ensure that the information is accumulated and communicated to our management, including the Chief Executive Officer and Chief Financial Officer, as appropriate to allow timely decisions regarding required disclosure.
Internal controls over financial reporting are procedures which are designed to provide reasonable assurance regarding the reliability of financial reporting and the preparation of financial statements for external purposes in accordance with accounting principles generally accepted in the United States and includes those policies and procedures that: (1) pertain to the maintenance of records that in reasonable detail accurately and fairly reflect the transactions and dispositions of our assets; (2) provide reasonable assurance that transactions are recorded as necessary to permit preparation of financial statements in accordance with generally accepted accounting principles, and that receipts and expenditures are being made only in accordance with authorizations of our management and directors; and (3) provide reasonable assurance regarding prevention or timely detection of unauthorized acquisition, use or disposition of our assets that could have a material effect on our financial statements.
Our management, including our Chief Executive Officer and Chief Financial Officer, do not expect that our disclosure controls or internal controls over financial reporting will prevent all error and all fraud. A control system, no matter how well designed and operated, can provide only reasonable, not absolute, assurance that the control system’s objectives will be met. Further, the design of a control system must reflect the fact that there are resource constraints, and the benefits of controls must be considered relative to their costs. Because of the inherent limitations in all control systems, no evaluation of controls can provide absolute assurance that all control issues and instances of fraud, if any, have been detected. These inherent limitations include the realities that judgments in decision-making can be faulty, and breakdowns can occur because of simple error or mistake. Controls can also be circumvented by the individual acts of some persons, by collusion of two or more people, or by management override of the controls. The design of any system of controls is based in part upon certain assumptions about the likelihood of future events, and we cannot assure that any design will succeed in achieving its stated goals under all potential future conditions. Over time, controls may become inadequate because of changes in conditions or deterioration in the degree of compliance with policies or procedures. Because of the inherent limitations in a cost-effective control system, misstatements due to error or fraud may occur and not be detected.
Oregon corporate law, our articles of incorporation and our bylaws contain provisions that could prevent or discourage a third party from acquiring us even if the change of control would be beneficial to our shareholders.
Our articles of incorporation and our bylaws contain anti-takeover provisions that could delay or prevent a change of control of our company, even if a change of control would be beneficial to our shareholders. These provisions:
19
• | authorize our Board of Directors to issue up to 5,663,952 shares of preferred stock and to determine the price, rights, preferences, privileges and restrictions, including voting rights, of those shares without prior shareholder approval, which could adversely affect the voting power or other rights of the holders of outstanding shares of preferred stock or common stock; |
• | establish advance notice requirements for nominations for election to our Board of Directors or for proposing matters that can be acted upon by shareholders at shareholder meetings; |
• | prohibit cumulative voting in the election of directors, which would otherwise allow less than a majority of shareholders to elect director candidates; and |
• | limit the ability of shareholders to take action by written consent, thereby effectively requiring all common shareholder actions to be taken at a meeting of our common shareholders. |
In addition, if our common stock is acquired in specified transactions deemed to constitute “control share acquisitions,” provisions of Oregon law condition the voting rights that would otherwise be associated with those common shares upon approval by our shareholders (excluding, among other things, the acquirer in any such transaction). Provisions of Oregon law also restrict, subject to specified exceptions, the ability of a person owning 15% or more of our common stock to enter into any “business combination transaction” with us.
The foregoing provisions of Oregon law and our articles of incorporation and bylaws could limit the price that investors might be willing to pay in the future for shares of our common stock and value of our convertible notes.
Sales of a significant number of shares of our common stock in the public markets, or the perception of such sales, could depress the market price of our common stock.
Sales of a substantial number of shares of our common stock or other equity-related securities in the public markets could depress the market price of our common stock, and impair our ability to raise capital through the sale of additional equity securities. We cannot predict the effect that future sales of our common stock or other equity-related securities would have on the market price of our common stock. As of December 31, 2010, we had $50.0 million aggregate principal amount of our 2013 convertible senior notes outstanding. The price of our common stock could be affected by possible sales of our common stock by investors who view convertible notes as a more attractive means of equity participation in our company and by hedging or arbitrage trading activity which we expect to occur involving our common stock.
The capped call transaction may affect the value of our common stock and any desired dilution mitigation will be limited to the extent that our stock price remains below $23.08 per share.
The capped call transaction, which we entered into with a hedge counterparty in connection with the issuance of our 2013 convertible senior notes, is expected to reduce the potential dilution upon conversion of the 2013 convertible senior notes in the event that the market value per share of our common stock, as measured under the terms of the capped call transaction, at the time of exercise is greater than the strike price of the capped call transaction, which corresponds to the initial conversion price of the notes and is subject to certain adjustments similar to those contained in the 2013 convertible senior notes. Because the maximum number of shares deliverable under the capped call transaction is less than the number of shares issuable upon conversion of the 2013 convertible senior notes, we refer to this effect as “dilution mitigation.” If, however, the market value per share of our common stock exceeds the cap price of the capped call transaction of $23.08 per share, as measured under the terms of the capped call transaction, no additional shares would be delivered under the capped call transaction, and correspondingly, the dilution mitigation under the capped call transaction will be limited, which means that there would be dilution to the extent that the then market value per share of our common stock exceeds the cap price of the capped call transaction.
In connection with hedging the capped call transaction, the hedge counterparty or its affiliates:
• | expect to purchase our common stock in the open market and/or enter into various derivatives and/or enter into various derivative transactions with respect to our common stock; and |
• | may enter into or unwind various derivatives and/or purchase or sell our common stock in secondary market transactions. |
These activities could have had the effect of increasing or preventing a decline in the price of our common stock concurrently with or following the pricing of the 2013 convertible senior notes and could have the effect of decreasing the price of our common stock during the period immediately prior to a conversion of the 2013 convertible senior notes.
The hedge counterparty or its affiliates are likely to modify their hedge positions in relation to the capped call transaction
20
from time to time prior to conversion or maturity of the notes by purchasing and selling our common stock, other of our securities, or other instruments they may wish to use in connection with such hedging.
In addition, we intend to exercise options we hold under the capped call transaction whenever 2013 convertible senior notes are converted. In order to unwind its hedge positions with respect to those exercised options, the counterparty or affiliates thereof expect to sell our common stock in secondary market transactions or unwind various derivative transactions with respect to our common stock during the period immediately prior to conversion of the 2013 convertible senior notes. We have also agreed to indemnify the hedge counterparty and affiliates thereof for losses incurred in connection with a potential unwinding of their hedge positions under certain circumstances.
The effect, if any, of any of these transactions and activities on the market price of our common stock will depend in part on market conditions and cannot be ascertained at this time, but any of these activities could adversely affect the value of our common stock. For further information regarding the mechanics of our capped call transaction refer to our discussion in the Liquidity and Capital Resources section of Item 7. Management’s Discussion and Analysis of Financial Condition and Results of Operations.
Conversion of our convertible senior notes will dilute the ownership interest of existing shareholders, including holders who have previously converted their convertible senior notes.
Our 2013 convertible senior notes have a conversion price of equivalent to $13.03 per share. Upon conversion of our 2013 convertible senior notes, some or all of the ownership interests of existing shareholders may be diluted. Although the capped call transaction is expected to reduce potential dilution upon conversion of our 2013 convertible senior notes, the conversion of our 2013 convertible senior notes could still have a dilutive effect on our earnings per share to the extent that the price of our common stock exceeds the cap price of $23.08 per share for the capped call. Any sales in the public market of our common stock issuable upon such conversion could adversely affect prevailing market prices of our common stock. In addition, the anticipated conversion of our 2013 convertible senior notes into shares of our common stock could depress the price of our common stock.
Item 1B. Unresolved Staff Comments
None.
Item 2. Properties
Information concerning our principal properties at December 31, 2010 is set forth below:
Location | Type | Principal Use | Square Footage | Ownership | |||||
Hillsboro, OR | Office & Plant | Headquarters, marketing, repair services, research and engineering | 103,603 | Leased | |||||
Land | Held for sale | 214,664 | Owned | ||||||
Burnaby, Canada | Office | Marketing, research and engineering | 29,081 | Leased | |||||
Dublin, Ireland | Office | Marketing and distribution | 1,658 | Leased | |||||
Marlborough, MA | Office | Sales, marketing, research and engineering | 13,150 | Leased | |||||
Penang, Malaysia | Office | Manufacturing support, research and engineering | 18,164 | Leased | |||||
Shanghai, China | Office | Sales, research and engineering | 25,059 | Leased | |||||
Shenzhen, China | Office | Manufacturing support | 3,066 | Leased | |||||
We also lease sales offices in the United States located in San Diego, California and Boca Raton, FL. We have international sales offices located in Munich, Germany and Tokyo, Japan. As noted in the above properties, we own a parcel of land adjacent to our Hillsboro, Oregon facility.
Item 3. Legal Proceedings
In the normal course of business, the Company becomes involved in litigation. As of December 31, 2010, in the opinion of management, RadiSys had no pending litigation that would have a material effect on the Company’s financial position, results of operations or cash flows.
Item 4. Reserved
21
PART II
Item 5. Market for the Registrant’s Common Equity, Related Shareholder Matters and Issuer Purchases of Equity Securities
Our common stock is traded on the NASDAQ Global Select Market under the symbol “RSYS.” The following table sets forth, for the periods indicated, the highest and lowest sale prices for the common stock, as reported by the NASDAQ Global Select Market.
High | Low | |||||||
2010 | ||||||||
Fourth Quarter | $ | 10.45 | $ | 8.46 | ||||
Third Quarter | 10.95 | 8.47 | ||||||
Second Quarter | 11.00 | 8.22 | ||||||
First Quarter | 10.18 | 7.13 | ||||||
2009 | ||||||||
Fourth Quarter | $ | 10.10 | $ | 7.50 | ||||
Third Quarter | 9.71 | 6.80 | ||||||
Second Quarter | 9.45 | 5.76 | ||||||
First Quarter | 8.00 | 4.30 | ||||||
The closing price as reported on the NASDAQ Global Select Market on March 11, 2011 was $8.50 per share. As of March 11, 2011, there were approximately 255 holders of record of our common stock. We believe that the number of beneficial owners is substantially greater than the number of record holders because a large portion of our outstanding common stock is held of record in broker “street names” for the benefit of individual investors.
Dividend Policy
We have never paid any cash dividends on our common stock and do not expect to declare cash dividends on the common stock in the foreseeable future. Our ability to pay dividends is restricted by our policy as well as the covenants arising from our line of credit agreement with Silicon Valley Bank. As such, we plan to retain all of our earnings to finance future growth.
Share Repurchase Program
On December 16, 2010, we announced the Board of Director's authorization of a share repurchase program under which we may repurchase up to $20 million of our common stock at the discretion of management. Shares may be purchased from time to time at prevailing market prices, in the open market or through privately negotiated transactions, subject to market conditions and as permitted by the securities laws and in compliance with other legal requirements. Under the program, the purchases will be funded from available working capital, and any repurchased shares will be returned to authorized but unissued status. The duration of the repurchase program is two years, although it may be extended, suspended or discontinued without prior notice, at the discretion of the Board. During the fourth quarter of 2010, no shares were repurchased under the program.
22
Stock Price Performance Graph
The following graph sets forth our total cumulative shareholder return as compared to the return of the S&P 500 Index, the NASDAQ Index, the NASDAQ Computer Manufacturers Index, and the NASDAQ Telecommunications Index for the period of December 31, 2005 through December 31, 2010. The graph reflects the investment of $100 on December 31, 2005 in our stock, the S&P 500 Index, the NASDAQ Index, and in published industry indexes.
Total return also assumes reinvestment of dividends. As noted above, we have never paid dividends on our common stock. Historical stock price performance should not be relied upon as indicative of future stock price performance.
COMPARISON OF 5 YEAR CUMULATIVE TOTAL RETURN
Among RadiSys Corporation, the S&P 500 Index, the NASDAQ Index,
the NASDAQ Computer Manufactures Index,
and the NASDAQ Telecommunications Index
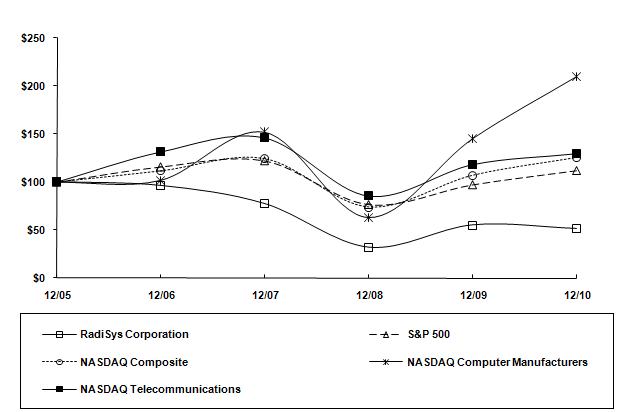
Cumulative Total Return | ||||||||||||||||||
12/2005 | 12/2006 | 12/2007 | 12/2008 | 12/2009 | 12/2010 | |||||||||||||
RadiSys | 100.00 | 96.14 | 77.28 | 31.89 | 55.07 | 51.33 | ||||||||||||
S&P 500 | 100.00 | 115.80 | 122.16 | 76.96 | 97.33 | 111.99 | ||||||||||||
NASDAQ Composite | 100.00 | 111.74 | 124.67 | 73.77 | 107.12 | 125.93 | ||||||||||||
NASDAQ Computer Manufacturers | 100.00 | 101.97 | 152.15 | 63.25 | 145.32 | 210.16 | ||||||||||||
NASDAQ Telecommunications | 100.00 | 131.50 | 146.22 | 85.43 | 118.25 | 129.78 | ||||||||||||
23
Item 6. Selected Financial Data
For the Years Ended December 31, | ||||||||||||||||||||
2010 | 2009 | 2008 (A) | 2007 (A) | 2006 (A) | ||||||||||||||||
(In thousands, except per share data) | ||||||||||||||||||||
Consolidated Statements of Operations Data | ||||||||||||||||||||
Revenues | $ | 284,311 | $ | 304,273 | $ | 372,584 | $ | 325,232 | $ | 292,481 | ||||||||||
Gross margin | 87,214 | 92,822 | 96,083 | 71,838 | 78,956 | |||||||||||||||
Income (loss) from operations | 699 | (2,192 | ) | (76,464 | ) | (28,124 | ) | (22,229 | ) | |||||||||||
Loss from continuing operations | (369 | ) | (42,567 | ) | (67,262 | ) | (21,150 | ) | (16,346 | ) | ||||||||||
Net loss | (369 | ) | (42,567 | ) | (67,262 | ) | (21,150 | ) | (16,346 | ) | ||||||||||
Net loss per common share: | ||||||||||||||||||||
Basic | $ | (0.02 | ) | $ | (1.81 | ) | $ | (2.98 | ) | $ | (0.97 | ) | $ | (0.77 | ) | |||||
Diluted | $ | (0.02 | ) | $ | (1.81 | ) | $ | (2.98 | ) | $ | (0.97 | ) | $ | (0.77 | ) | |||||
Weighted average shares outstanding (basic) | 24,144 | 23,493 | 22,552 | 21,883 | 21,158 | |||||||||||||||
Weighted average shares outstanding (diluted) | 24,144 | 23,493 | 22,552 | 21,883 | 21,158 | |||||||||||||||
December 31, | ||||||||||||||||||||
2010 | 2009 | 2008 (A) | 2007 (A) | 2006 (A) | ||||||||||||||||
(In thousands) | ||||||||||||||||||||
Consolidated Balance Sheet Data | ||||||||||||||||||||
Working capital | $ | 147,049 | $ | 140,438 | $ | 66,067 | $ | 66,573 | $ | 161,575 | ||||||||||
Total assets | 240,928 | 277,034 | 309,026 | 394,844 | 385,471 | |||||||||||||||
Long term obligations, excluding current portion | 50,450 | 52,565 | 52,989 | 3,585 | 87,976 | |||||||||||||||
Total shareholders’ equity | 137,394 | 129,717 | 157,468 | 222,974 | 230,052 | |||||||||||||||
__________________________________
(A) | As adjusted due to the implementation of the cash conversion subsections of ASC Topic 470-20 “Debt with Conversion and Other Options—Cash Conversion.” |
Item 7. Management’s Discussion and Analysis of Financial Condition and Results of Operations
Overview
We are a leading provider of innovative hardware and software platforms for Next Generation IP-based wireless, wireline and video networks. Our products include our market leading ATCA and IP Media Server platforms as well as application software for new IP-based communication services. These products enable customers to bring more new high-value products and services to market with speed and flexibility using the latest technologies and with a lower investment.
Financial Results—Total revenue was $284.3 million, $304.3 million and $372.6 million in 2010, 2009 and 2008, respectively. Backlog was approximately $43.9 million, $51.4 million and $34.4 million at December 31, 2010, 2009 and 2008, respectively. Backlog includes all purchase orders scheduled for delivery within 12 months. The decrease in revenues during 2010 compared to 2009 was driven by decreased revenues in our Legacy/ Traditional Communications Networks products of $45.0 million partially offset by increases in our Next Generation Communications Networks products of $16.0 million as well as by the commercial systems market of $9.0 million. The decrease in revenues during 2009 compared to 2008 was driven by decreased revenues in all of our product groups.
Gross margins as a percentage of revenues were 30.7%, 30.5% and 25.8% for 2010, 2009 and 2008, respectively. The increase in gross margin as a percentage of revenues was driven by our transition to a fully outsourced manufacturing model, thereby lowering our manufacturing and operational costs, favorable changes in our product mix and a reduction in the amortization of purchased technology. The favorable change in our product mix resulted from a larger percentage of overall revenues coming from our higher margin Next Generation Communications Networks products. In addition, we incurred lower charges for excess and obsolete inventory primarily due to the continued realization of internal process improvements during 2010. These increases were partially offset by reductions to the gross margins of our Legacy/ Traditional revenues.
Net loss was $369,000, $42.6 million, $67.3 million in 2010, 2009 and 2008, respectively. Net loss per share was $0.02, $1.81 and $2.98 for 2010, 2009 and 2008, respectively. The net loss from 2009, was primarily due to the establishment of a deferred tax valuation allowance in the amount of $42.0 million. The net loss from 2008 was primarily due to a goodwill
24
impairment charge in the amount of $67.3 million. In the absence of these charges, net loss per share for 2009 and 2008 would have been $0.02 and $0.00, respectively.
Cash and cash equivalents amounted to $129.1 million and $100.7 million at December 31, 2010 and December 31, 2009, respectively. The increase in cash and cash equivalents was primarily due to cash flows from operating activities in the amount of $16.1 million as well as the settlement of our Auction Rate Securities ("ARS"). See Note 2—Cash Equivalents and Investments for details on the ARS settlement.
In the following discussion of our financial condition and results of operations, we intend to provide information that will assist in understanding our financial statements, changes in certain key items in those financial statements from year to year, and the primary factors that accounted for those changes, as well as how certain accounting principles, policies and estimates affect our financial statements.
Critical Accounting Policies and Estimates
Management’s discussion and analysis of our financial condition and results of operations are based upon the Consolidated Financial Statements, which have been prepared in accordance with U.S. GAAP. The preparation of these financial statements requires management to make estimates and judgments that may affect the reported amounts of assets, liabilities, and revenues and expenses. On an on-going basis, management evaluates its estimates. Management bases its estimates on historical experience and on various other assumptions that are believed to be reasonable under the circumstances, the results of which form the basis for making judgments about the carrying values of assets and liabilities that are not readily apparent from other sources. Actual results may differ from these estimates under different assumptions or conditions.
An accounting policy is deemed to be critical if it requires an accounting estimate to be made based on assumptions about matters that are highly uncertain at the time the estimate is made, and if different estimates that reasonably could have been used, or changes in the accounting estimates that are reasonably likely to occur periodically, could materially impact the financial statements. Management believes the following critical accounting policies reflect the more significant estimates and assumptions used in the preparation of the Consolidated Financial Statements.
Inventory Valuation
We record the inventory valuation allowance for estimated obsolete or unmarketable inventories as the difference between the cost of inventories and the estimated net realizable value based upon assumptions about future demand and market conditions. Our inventory valuation allowances establish a new cost basis for inventory. Factors influencing the provision include: changes in demand; rapid technological changes; product life cycle and development plans; component cost trends; product pricing; regulatory requirements affecting components; and physical deterioration. If actual market conditions are less favorable than those projected by management, additional provisions for inventory reserves may be required. Our estimate for the allowance is based on the assumption that our customers comply with their current contractual obligations. We provide long-life support to our customers and therefore we have material levels of customer specific inventory. If our customers experience a financial hardship or if we experience unplanned cancellations of customer contracts, the current provision for the inventory reserves may be inadequate. Additionally, we may incur additional expenses associated with any non-cancelable purchase obligations to our suppliers if they provide customer-specific components.
Adverse Purchase Commitments
We are contractually obligated to reimburse our contract manufacturers for the cost of excess inventory used in the manufacture of our products, and for which there is no alternative use. Excess inventory is defined as raw materials or assemblies (“components”) used in the manufacture of our products for which the contract manufacturers’ on-hand and on-order quantities are in excess of the requirements derived from our current product forecast of customer demand. We are liable for excess inventory only to the extent that the contract manufacturer procures components to fulfill the manufacturing requirements as set forth in our current product forecast and agreed upon lead times and minimum order quantities. Unexpected decreases in customer demand or our inability to accurately forecast customer demand could result in increases in our adverse purchase commitment liability and have a material adverse effect on our profitability. Factors influencing the adverse purchase commitments liability include: changes in demand, rapid technological changes, product life cycle and development plans, component cost trends, product pricing, customer liability and physical deterioration. If actual market conditions are less favorable than those projected by management, we may incur additional expenses due to increases in our adverse purchase commitment liabilities. Our estimate for the adverse purchase commitments liabilities is based on the assumption that our customers comply with their current contractual obligations to us. If our customers experience a financial hardship or if we experience unplanned cancellations of customer contracts, the current adverse purchase commitments liabilities may be
25
inadequate.
Estimates for adverse purchase commitments are derived from reports received on a quarterly basis from our contract manufacturers. Increases to this liability are charged to cost of goods sold. When and if we take possession of inventory reserved for in this liability, the liability is transferred from other liabilities to our excess and obsolete inventory valuation allowance. This liability, referred to as adverse purchase commitments, is provided for in other accrued liabilities in the accompanying Consolidated Balance Sheets.
Accrued Warranty
We provide for the estimated cost of product warranties at the time revenue is recognized. Our standard product warranty terms generally include repairs or replacement of a product at no additional charge for a specified period of time, which is generally 24 months after shipment. The workmanship of our products produced by contract manufacturers is covered under warranties provided by the contract manufacturer for a specified period of time ranging from 12 to 15 months. We engage in extensive product quality programs and processes, including actively monitoring and evaluating the quality of our component suppliers. Our estimated warranty obligation is based upon ongoing product failure rates, internal repair costs, contract manufacturing repair charges for repairs not covered by the contract manufacturer’s warranty, average cost per call and current period product shipments. If actual product failure rates, repair rates, service delivery costs, or post-sales support costs differ from our estimates, revisions to the estimated warranty liability would be required. Additionally, we accrue warranty costs for specific customer product repairs that are in excess of our warranty obligation calculation described above. Accrued warranty reserves are included in other accrued liabilities in the accompanying Consolidated Balance Sheets.
Long-Lived Assets
Our long-lived assets include definite-lived intangible assets and property and equipment. The net balance of our definite-lived intangible assets and property and equipment at December 31, 2010 amounted to $7.1 million and $9.5 million, respectively.
Intangible assets, net of accumulated amortization, primarily consist of acquired patents, completed technology, technology licenses, trade names and customer lists. Intangible assets are being amortized on a straight-line basis over estimated useful lives ranging from three to ten years. Property and equipment, net of accumulated depreciation, primarily consists of office equipment and software, manufacturing equipment, leasehold improvements and other physical assets owned by us. Property and equipment are being depreciated or amortized on a straight-line basis over estimated useful lives ranging from one to 15 years. We assess impairment of intangible assets and property and equipment whenever conditions indicate that the carrying values of the assets may not be recoverable.
Conditions that would trigger a long-lived asset impairment assessment include, but are not limited to, a significant adverse change in legal factors or in the business climate that could affect the value of an asset or an adverse action or assessment by a regulator. If we determine that a long-lived asset impairment assessment is required, we must determine the fair value of the asset. Impairments would be recognized in operating results to the extent that the carrying value exceeds this calculated fair value of the long-lived assets.
Considerable management judgment is required in determining if and when a condition would trigger an impairment assessment of our long-lived assets and once such a determination has been made, considerable management judgment is required to determine the fair market value of the long-lived asset. If the trading price or the average trading price of our common stock is below the book value per share for a sustained period or if and when a condition has triggered an impairment analysis of our long-lived assets, we may incur substantial impairment losses due to the write-down or the write-off of our long-lived assets.
Income Taxes
Income tax accounting requires the recognition of deferred tax assets and liabilities for the expected future tax consequences of temporary differences between the carrying amounts and tax bases of the assets and liabilities. We record a valuation allowance to reduce deferred tax assets if it is “more likely than not” that all or portion of the asset will not be realized due to inability to generate sufficient taxable income in the relevant period to utilize the deferred tax asset. Our net deferred tax assets amounted to $16.6 million as of December 31, 2010. We have considered future market growth, forecasted earnings, future taxable income, the mix of earnings in the jurisdictions in which we operate and prudent and feasible tax planning strategies in determining the need for a valuation allowance. In the event we were to determine that we would not be able to realize all or part of our net deferred tax assets in the future, we would increase the valuation allowance and make a
26
corresponding charge to earnings in the period in which we make such determination. Likewise, if we later determine that we are more likely than not to realize the net deferred tax assets, we would reverse the applicable portion of the previously provided valuation allowance. All future reversals of the valuation allowance would result in a benefit in the period recognized.
Allowance for Doubtful Accounts
We have a relatively small set of multinational customers that typically make up the majority of our accounts receivable balance. Our allowance for doubtful accounts is determined using a combination of factors to ensure that our trade receivables balances are not overstated. We record reserves for individual accounts when we become aware of a customer’s inability to meet its financial obligations to us, such as in the case of bankruptcy filings or deterioration in the customer’s operating results or financial position. If circumstances related to customers change, our estimates of the recoverability of receivables would be further adjusted. At December 31, 2010, 32.0% of our accounts receivable was due from our largest customer. If one of our large customers or a number of our smaller customers files for bankruptcy or otherwise is unable to pay the amounts due to us, the current allowance for doubtful accounts may not be adequate. During the years ended December 31, 2010 and 2009, there were no significant account balances reserved.
We maintain a non-specific bad debt reserve for all customers based on a variety of factors, including the length of time receivables are past due, trends in overall weighted average risk rating of the total portfolio, macroeconomic conditions, significant events and historical experience. Typically, this non-specific bad debt reserve amounts to approximately 1% of quarterly revenues.
Accrued Restructuring and Other Charges
Because we have a history of paying severance benefits, expenses associated with exit or disposal activities are recognized when probable and estimable.
We have engaged, and may continue to engage, in restructuring actions, which require us to make significant estimates in several areas including: realizable values of assets made redundant or obsolete; expenses for severance and other employee separation costs; the ability to generate sublease income, as well as our ability to terminate lease obligations at the amounts we have estimated; and other exit costs. Should the actual amounts differ from our estimates, the amount of the restructuring charges could be materially impacted. For a description of our restructuring actions, refer to our discussion of restructuring charges in the Results of Operations section.
Revenue Recognition
Multiple Element Arrangements
A significant portion of our revenue relates to product sales for which revenue is recognized upon shipment, with limited judgment required related to product returns. Product sales are shipped FOB shipping point. The software elements included in certain components of ATCA systems and Media Servers is considered to be functioning together with the non-software elements to provide the tangible product's essential functionality and these arrangements generally include multiple elements such as hardware, technical support services as well as software upgrades or enhancements on a when and if available basis. Arrangements that include multiple elements require significant management judgment to evaluate the effective terms of agreements, our performance commitments and determination of fair value of the various deliverables under the arrangement. During the first quarter of 2010 we elected early adoption of ASU No. 2009−13, “Multiple−Deliverable Revenue Arrangements—a consensus of the FASB Emerging Issues Task Force” ("ASU 2009−13") and ASU No. 2009−14, “Certain Arrangements That Include Software Elements,” (amendments to FASB ASC Topic 985, Software) (“ASU 2009−14”). Adoption of ASU 2009−13 and ASU 2009−14 allows us to meet separation criteria required for multiple element arrangements where we could not previously establish a fair value for one or more of the relevant deliverables. Previously, when we could not establish fair value for certain technical support agreements all revenue was deferred. These revenues were then recognized over the appropriate period, generally coinciding with an explicit or implied support period, or in some cases until all elements of the arrangement had been delivered. Under ASU 2009−13, overall consideration is allocated among the separate units of accounting based on their relative fair value. This will result in the ability to recognize each unit of accounting upon delivery. Revenue for hardware, which includes software that is considered more than incidental, will be recognized upon delivery whereas technical support services will be recognized over the applicable service period.
ASU 2009−13 provides a fair value hierarchy in order to determine the appropriate relative fair value for each element of an arrangement. When available, we use vendor specific objective evidence (“VSOE”) to determine the estimated selling price.
27
In the absence of VSOE or third−party evidence ("TPE") for a delivered element, we then use an estimated selling price in order to determine fair value. Estimated selling prices represent our best estimate of the price at which it would transact if the deliverables were sold on a standalone basis. For technical support services, we generally determine our selling price based on VSOE as supported by substantive renewal rates in the related service agreements. In certain instances where VSOE cannot be established, we then rely upon the estimated selling price for such deliverables as TPE is generally not available due to the unique company specific terms surrounding such service agreements. In establishing an appropriate estimated selling price for these technical support agreements, we considered entity specific factors such as its historical and projected costs, historical and projected revenues, and profit objectives. We also considered market specific factors when establishing reasonable profit objectives.
For the Years Ended December 31, | ||||||||||||
2010 | 2009 | 2008 | ||||||||||
(in thousands) | ||||||||||||
Hardware | $ | 257,533 | $ | 278,907 | $ | 356,228 | ||||||
Software royalties and licenses | 16,614 | 17,878 | 10,382 | |||||||||
Software maintenance | 4,980 | 3,326 | 3,093 | |||||||||
Engineering and other services | 5,184 | 4,162 | 2,881 | |||||||||
Total revenues | $ | 284,311 | $ | 304,273 | $ | 372,584 | ||||||
Hardware
Revenue from hardware products is recognized in accordance with applicable GAAP for revenue recognition. Under our standard terms and conditions of sale, we transfer title and risk of loss to the customer at the time product is shipped to the customer and revenue is recognized accordingly, unless customer acceptance is uncertain or significant obligations remain. We reduce revenue for estimated customer returns for rotation rights as well as for price protection rights according to agreements with our distributors. The amount of revenues derived from these distributors as a percentage of total revenues was 18.1%, 17.5% and 15.2% for the years ended December 31, 2010, 2009 and 2008, respectively. We accrue the estimated cost of post-sale obligations for product warranties, based on historical experience at the time we recognize revenue.
The software elements included in certain components of ATCA systems and Media Servers are considered to be functioning together with the non-software elements to provide the tangible product's essential functionality and our ATCA arrangements generally include multiple elements such as hardware, technical support services as well as specified software upgrades or enhancements. As such, the revenue associated with these products is recognized in accordance with applicable GAAP for revenue recognition .
Software royalties and licenses
Revenue from software royalties and licenses is recognized in accordance with applicable GAAP for revenue recognition. Revenue from customers for prepaid, non-refundable software royalties is recorded when the revenue recognition criteria have been met. Revenue for non-prepaid royalties is recognized at the time the underlying product is shipped by the customer paying the royalty. We recognize software license revenue at the time of shipment or upon delivery of the software master provided that the revenue recognition criteria have been met and VSOE exists to allocate the total fee to all undelivered elements of the arrangement. We defer revenue on arrangements including specified software upgrades until the specified upgrade has been delivered.
Technical support services
Technical support services are recognized as earned on the straight-line basis over the terms of the contract in accordance with applicable GAAP for revenue recognition. The fair value of our post-contract support has been determined by renewal rates within our support agreements, the actual amounts charged to customers for renewal of their support services or based on an estimated selling price.
Engineering and other services
Engineering services revenue is recognized upon completion of certain contractual milestones and customer acceptance of the services rendered. Other services revenues include hardware repair services and custom software implementation projects. Hardware repair services revenues are recognized when the services are complete. Software implementation revenues are recognized upon completion of certain contractual milestones and customer acceptance of the services rendered.
28
Deferred income
Deferred income represents amounts received or billed for the following types of transactions:
• | Distributor sales—Certain sales are made to distributors under agreements providing price protection and right of return on unsold merchandise. Revenue and costs relating to such distributor sales are deferred until the product is sold by the distributor or return privileges and price protection rights terminate, at which time related estimated distributor resale revenue, estimated effects of distributor price adjustments, and estimated costs are reflected in the Consolidated Statement of Operations. |
Our revenue reporting for these distributors is highly dependent on receiving pertinent and accurate data from our distributors in a timely fashion. Distributors provide us periodic data regarding the product, price, quantity, and end customer when products are resold as well as the quantities of our products they still have in stock. We must use estimates and apply judgments to reconcile distributors’ reported inventories to their activities. Any error in our judgment could lead to inaccurate reporting of our revenues, deferred income on sales to distributors, and net income.
• | Undelivered elements of an arrangement—Certain arrangements include specified software upgrades and enhancements to an existing product. Revenue for such arrangements is deferred until the future obligation is fulfilled. |
Stock-based Compensation
Equity instruments are granted to employees, directors and consultants in certain instances, as defined in the respective plan agreements. In 2010, 2009, and 2008, we issued stock options, restricted stock units under our 2007 stock plan and long-term incentive plan (“LTIP”) and stock under employee stock purchase plan (“ESPP”).
We continue to use the Black-Scholes model to measure the grant date fair value of stock options and ESPP shares. The grant date fair value of stock options that are expected to vest is recognized on a straight-line basis over the requisite service period, which is equal to the option vesting period, which is generally three years. The grant date fair value of ESPP shares that are expected to vest is recognized on a straight-line basis over the requisite service period, which is generally 18 months, subject to modification at the date of purchase due to the ESPP look-back feature. The grant date fair value of restricted stock units granted under our 2007 stock plan and LTIP is equal to the closing price of our shares as quoted on the NASDAQ Global Select Market on the date of grant. The grant date fair value of restricted stock issued under our 2007 stock plan that are expected to vest is recognized on a straight-line basis over the requisite service period, which is three years. The estimate of the number of options, ESPP shares, restricted stock unit awards issued under our 2007 stock plan expected to vest is determined based on historical experience.
The grant date fair value of restricted stock units issued under our LTIP that are expected to vest is recognized ratably over the service period of the award. The service period of restricted stock units issued under our LTIP is equal to the period of time over which performance objectives underlying the awards are expected to be achieved. The estimate of the number of restricted stock units, issued under our LTIP, expected to vest is determined based upon our financial results as compared to the performance goals set for the award and is adjusted quarterly.
To determine the fair value of the stock options and ESPP shares, using the Black-Scholes option pricing model, the calculation takes into consideration the effect of the following:
• | exercise price of the option or purchase price of the ESPP share; |
• | price of our common stock on the date of grant; |
• | expected term of the option or share; |
• | expected volatility of our common stock over the expected term of the option or share; |
• | risk free interest rate during the expected term of the option or share; and |
• | illiquidity associated with one year required holding period for ESPP shares. |
The calculation includes several assumptions that require management's judgment. The expected term of the option or share is determined based on assumptions about patterns of employee exercises and represents a probability-weighted average time-period from grant until exercise of stock options, subject to information available at time of grant. Determining expected volatility generally begins with calculating historical volatility for a similar long-term period and then considers the ways in which the future is reasonably expected to differ from the past.
29
We also examined our historical pattern of option exercises in an effort to determine if there were any discernable activity patterns based on certain employee populations. From this analysis, we identified three employee populations. The expected term computation is based on historical vested option exercises and post-vest forfeiture patterns. The risk free interest rate is based on the U.S. Treasury constant maturities in effect at the time of grant for the expected term of the option or share.
Determining the appropriate fair value model and, as noted above, calculating the fair value of equity instruments associated with our employee benefit plans require the input of highly subjective assumptions. The assumptions used in calculating the fair value of these equity instruments represent management's best estimates, but these estimates involve inherent uncertainties and the application of management judgment. As a result, if factors change and we use different assumptions, our stock-based compensation expense could be materially different in the future. In addition, we are required to estimate the expected forfeiture rate and only recognize expense for those shares expected to vest. If our actual forfeiture rate is materially different from our estimate the stock-based compensation expense could be significantly different from what we have recorded in the current period. See Note 17-Employee Benefit Plans of the Notes to the Consolidated Financial Statements for a further discussion on stock-based compensation.
The LTIP performance awards are valued at the closing price of our common stock on the grant date. The corresponding compensation cost of each LTIP award is expensed ratably over the measurement period of the award. Since the number of shares that may be issued under the LTIP and the measurement period are both variable, we reevaluate the LTIP awards on a quarterly basis and adjust the number of shares expected to be awarded based upon our financial results as compared to the performance goals set for the award. Adjustments to the number of shares awarded, and to the corresponding compensation expense, are made on a cumulative basis at the date of adjustment based upon the estimated probable number of shares to be awarded. Adjustments made to compensation expense resulting from a change in the estimated probable vesting date of the awards are made on a prospective basis. For the year ended December 31, 2010, we recorded $1.6 million in stock compensation expense associated with LTIP awards.
On October 5, 2009, we announced an offer to exchange certain outstanding options for restricted stock units or new options. Eligible employees were permitted to exchange some or all of their outstanding options, with an exercise price greater than $9.44 per share (which is equal to the 52-week high closing price of our common stock as of the start of this offer), that were granted on or before October 5, 2008, whether vested or unvested, for restricted stock units, except for employees in Canada who received new stock options with new vesting schedules and exercise prices. All employees of RadiSys and its subsidiaries, other than members of our Board of Directors, executive officers and employees located in the Netherlands and Israel were eligible to participate in the exchange offer, so long as they remain employed through the expiration date of the offer. The option exchange took place on November 3, 2009. Pursuant to the option exchange 848,800 eligible options were canceled and replaced with 169,600 restricted stock units and 35,000 stock options. The new restricted stock units and stock options have a new three year vesting period that began on November 3, 2009. The exchange resulted in $173,000 in additional stock compensation expense which will be recognized over the new three year vesting period.
Results of Operations
The following table sets forth certain operating data as a percentage of revenues for the years ended December 31, 2010, 2009 and 2008.
During the first quarter of 2009, we adopted the cash conversion subsections of ASC Topic 470-20 “Debt with Conversion and Other Options—Cash Conversion” (“ASC Topic 470-20”). The Cash Conversion Subsections are effective for our previously outstanding 1.375% convertible senior notes due 2023. Although, our 2023 convertible senior notes were retired as of December 31, 2009, we were still required to retrospectively apply Cash Conversion Subsections in all periods presented that include our 2023 convertible senior notes. As a result of this retrospective application, we adjusted our opening accumulated deficit and additional paid in capital balances, as of December 31, 2006, by ($9.6 million) and $16.2 million, net of tax, respectively. In addition, amounts previously reported in our Consolidated Statements of Operations for interest expense, other income (expense), net, income tax expense (benefit), and net loss have been adjusted as a result of adoption.
30
For the Years Ended December 31, | |||||||||
2010 | 2009 | 2008 (A) | |||||||
Revenues | 100.0 | % | 100.0 | % | 100.0 | % | |||
Cost of sales: | |||||||||
Cost of sales | 67.1 | 67.4 | 70.3 | ||||||
Amortization of purchased technology | 2.2 | 2.1 | 3.9 | ||||||
Total cost of sales | 69.3 | 69.5 | 74.2 | ||||||
Gross margin | 30.7 | 30.5 | 25.8 | ||||||
Research and development | 13.6 | 13.8 | 13.2 | ||||||
Selling, general, and administrative | 16.0 | 14.8 | 13.6 | ||||||
Intangible assets amortization | 0.3 | 0.9 | 1.2 | ||||||
Goodwill impairment charge | — | — | 18.1 | ||||||
Restructuring and other charges | 0.6 | 1.7 | 0.2 | ||||||
Loss from operations | 0.2 | (0.7 | ) | (20.5 | ) | ||||
Interest expense | (0.7 | ) | (0.8 | ) | (1.3 | ) | |||
Interest income | 0.2 | 0.4 | 0.8 | ||||||
Other income (expense), net | (0.0 | ) | 0.0 | 0.2 | |||||
Loss from continuing operations before income tax expense (benefit) | (0.3 | ) | (1.1 | ) | (20.8 | ) | |||
Income tax expense (benefit) | (0.2 | ) | 12.9 | (2.7 | ) | ||||
Net loss | (0.1 | )% | (14.0 | )% | (18.1 | )% | |||
__________________________________
(A) | As adjusted due to the implementation of the cash conversion subsections of ASC Topic 470-20. |
Comparison of Year 2010 and Year 2009
Revenues
Revenues decreased by $20.0 million, or 6.6%, to $284.3 million in 2010 from $304.3 million in 2009. Changes in our revenues by product group for the years ended December 31, 2010 and 2009, were as follows (in thousands):
For the Year Ended December 31, | ||||||||||||
2010 | 2009 | Change | ||||||||||
Next Generation Communications Networks Products | $ | 118,078 | $ | 102,047 | $ | 16,031 | ||||||
Legacy/ Traditional Communications Networks Products | 91,873 | 136,828 | (44,955 | ) | ||||||||
Total Communications Networks Products | 209,951 | 238,875 | (28,924 | ) | ||||||||
Medical Products | 33,366 | 26,261 | 7,105 | |||||||||
Other Commercial Products | 40,994 | 39,137 | 1,857 | |||||||||
Total Commercial Products | 74,360 | 65,398 | 8,962 | |||||||||
Total revenues | $ | 284,311 | $ | 304,273 | $ | (19,962 | ) | |||||
Communications Networks Product Group
Revenues in the Communications Networks market decreased by $28.9 million or 12.1%, to $210.0 million in 2010 from $238.9 million in 2009. The decrease was driven by the maturity of our Legacy/ Traditional Communications Networks products, which resulted in a decline in revenue of $45.0 million or 32.9% for the year ended December 31, 2010 as compared with the same period in 2009. We expect further decreases to our Legacy/Traditional Communications Networks products revenues as these products continue to migrate toward end of life in 2011.
Partially offsetting the decline were the revenues from our Next Generation Communications Networks products. Revenues from our Next Generation Communications Networks products increased by $16.0 million or 15.7% for the year ended December 31, 2010 as compared with the same period in 2009. Increased revenues from our Next Generation Communications Networks products were primarily driven by increased deployments of 3G and 4G infrastructure as well as telecommunication network monitoring equipment during the year ended December 31, 2010. We expect further growth to our Next Generation Communications Networks products in 2011.
31
Commercial Products Group
Revenues in the Commercial Systems market increased by $9.0 million, or 13.7%, to $74.4 million in 2010 from $65.4 million in 2009. Increased revenues from the Commercial products group were driven by increased Medical Products revenues, which increased by $7.1 million or 27.1% for the year ended December 31, 2010 as compared with the same period in 2009. In addition, revenues from our Other Commercial products category increased by $1.9 million or 4.7% for the year ended December 31, 2010 as compared with the same period in 2009. Revenues from Medical and Other Commercial products grew primarily due to increased customer spending driven by an overall improvement in the economy and the healthcare sector in particular as compared to the same period in 2009. We expect further growth due to our COM Express product line offset by declines from our Rack Mount Server product line in 2011.
Revenue by Geography
The following tables outline overall revenue dollars (in thousands) and the percentage of revenues, by geographic region, for the years ended December 31, 2010 and 2009:
For the Years Ended December 31, | ||||||||
2010 | 2009 | |||||||
North America | $ | 97,361 | $ | 100,138 | ||||
EMEA | 80,218 | 82,654 | ||||||
Asia Pacific | 106,732 | 121,481 | ||||||
Total | $ | 284,311 | $ | 304,273 | ||||
For the Years Ended December 31, | ||||||
2010 | 2009 | |||||
North America | 34.3 | % | 32.9 | % | ||
EMEA | 28.2 | 27.2 | ||||
Asia Pacific | 37.5 | 39.9 | ||||
Total | 100.0 | % | 100.0 | % | ||
North America. From a geographic perspective, revenues from North America decreased by $2.8 million, or 2.8%, to $97.4 million in 2010 from $100.1 million in 2009. Revenues from North America increased slightly as a percent of total revenues and represented 34.3% in 2010, up from 32.9% in 2009. The decline in overall revenues from North America was attributable to decreases in revenues from our Legacy/ Traditional Communications Networks and Media Server products partially offset by increases from our Next Generation Communications Networks products
EMEA. Revenues from the EMEA region decreased $2.4 million or 2.9% to $80.2 million in 2010 from $82.7 million in 2009. The decrease was driven by the maturity of our Legacy/ Traditional Communications Networks products. This decrease was partially offset by increased revenues from our Next Generation Communications Networks products along with increased revenues from our Medical Products.
Asia Pacific. Revenues from the Asia Pacific region decreased by $14.7 million or 12.1% to $106.7 million in 2010 from $121.5 million in 2009. The decrease was driven by the maturity of our Legacy/ Traditional Communications Networks products. This decrease was partially offset by increased revenues from our media server products as well as our test and measurement products.
We currently expect continued fluctuations in the percentage of revenue from each geographic region. Additionally, we expect non-U.S. revenues to remain a significant portion of our revenues.
Gross Margin
Gross margins as a percentage of revenues increased by 0.2 percentage points to 30.7% in 2010 from 30.5% in 2009. The increase in gross margin as a percentage of revenues was driven by increased revenues from our higher margin Next Generation Communications Networks products along with lower manufacturing and operational costs. These increases were partially offset by decreased gross margins associated with our Legacy/ Traditional Communications Networks products as these products are mostly dual sourced and we are getting pricing pressure by our customers as they approach end of life. Decreases
32
in manufacturing and operational costs are attributable to our completed transition to a fully outsourced manufacturing model. We expect gross margins to be down sequentially, in the first quarter of 2011, due primarily to reductions to the gross margins of our Legacy/ Traditional revenues, as these products are mostly dual sourced and we are getting pricing pressure by our customers as they approach end of life, as well as unfavorable changes to our product mix with lower expected media server revenues.
Research and Development
R&D expenses consist primarily of salary, bonuses and benefits for product development staff, and cost of design and development supplies and equipment, net of reimbursements for non-recurring engineering services. R&D expenses decreased $3.2 million, or 7.7%, to $38.7 million in 2010 from $41.9 million in 2009. At the beginning of 2010, we closed our Boca Raton, Florida R&D office as we transitioned the work to lower cost regions resulting in lower payroll costs. This transition to lower cost regions combined with the closure of our Boca Raton office was the biggest contributing factor to the decrease in R&D expense. R&D expense also declined due to lower stock-based compensation costs which decreased by $873,000 or 40.1% for the year ended December 31, 2010 as compared with the same period in 2009. Offsetting these decreases were increased costs related to the acquisition of Pactolus.
Selling, General, and Administrative
Selling, general and administrative (“SG&A”) expenses consist primarily of salary, commissions, bonuses and benefits for sales, marketing, executive, and administrative personnel, as well as professional services and costs of other general corporate activities. SG&A expenses increased $427,000, or 0.9%, to $45.5 million in 2010 from $45.1 million in 2009. This slight increase was primarily due to increased travel expenses related to the improved economic environment along with increased professional service fees. Travel expenses and professional service fees increased by $1.3 million or 42.0% for the year ended December 31, 2010 as compared with 2009 and was primarily attributable to our acquisition of Pactolus during the first quarter of 2010. These increases were partially offset by lower stock-based compensation costs which decreased by $1.0 million or 20.2% for the year ended December 31, 2010 as compared with the same period in 2009.
Stock-based Compensation Expense
Stock-based compensation expense consists of amortization of stock-based compensation associated with unvested stock options, restricted stock units issued to employees under the 2007 stock plan and the LTIP, and the ESPP. During 2010, we incurred $6.2 million in stock-based compensation. During 2009, we incurred $8.5 million in stock-based compensation expense. The decrease in stock-based compensation expense was driven primarily by our restructuring activities that have occurred over the past two years. As a result of our restructuring activities many awards have been forfeited and there has been a decrease in the participation in our ESPP. In addition to lower participation, the decline in ESPP expense of $1.4 million during the year ended December 31, 2010 as compared with the same period in 2009, was also due to a liquidity discount applied to the stock-based compensation calculation to reflect a one-year holding period that was added to the plan at the end of 2009. Partially offsetting these declines was $1.2 million of additional stock-based compensation during the year ended December 31, 2010 as compared with the same period in 2009, associated with shares granted from our LTIP in the fourth quarter of 2009.
We incurred and recognized stock-based compensation expense as follows (in thousands):
For the Year Ended December 31, | ||||||||
2010 | 2009 | |||||||
Cost of sales | $ | 816 | $ | 1,050 | ||||
Research and development | 1,303 | 2,176 | ||||||
Selling, general, and administrative | 4,039 | 5,060 | ||||||
Restructuring | — | 234 | ||||||
Total stock-based compensation expense | $ | 6,158 | $ | 8,520 | ||||
On October 5, 2009, we announced an offer to exchange certain outstanding options for restricted stock units or new options. Eligible employees were permitted to exchange some or all of their outstanding options, with an exercise price greater than $9.44 per share (which is equal to the 52-week high closing price of our common stock as of the start of this offer), that were granted on or before October 5, 2008, whether vested or unvested, for restricted stock units, except for employees in Canada who received new stock options with new vesting schedules and exercise prices. All employees of RadiSys and its
33
subsidiaries, other than members of our Board of Directors, executive officers and employees located in the Netherlands and Israel were eligible to participate in the exchange offer, so long as they remain employed through the expiration date of the offer. The option exchange took place on November 3, 2009. Pursuant to the option exchange 848,800 eligible options were canceled and replaced with 169,600 restricted stock units and 35,000 stock options. The new restricted stock units and stock options have a new three year vesting period that began on November 3, 2009. The exchange resulted in $173,000 in additional stock compensation expense which will be recognized over the new three year vesting period.
Intangible Assets Amortization
Intangible asset amortization expense included in operating expenses consists of the amortization of trade names and customer related intangible assets. Intangible assets amortization expense included in results of operations decreased $1.9 million or 71.8% to $730,000 in 2010 from $2.6 million in 2009. Intangible assets amortization decreased due to certain assets becoming fully amortized at the end of 2009. These decreases were partially offset by the addition of amortization expense associated with the acquisition of Pactolus in the first quarter of 2010. We perform reviews for impairment of the purchased intangible assets whenever events or changes in circumstances indicate that the carrying amount of an asset may not be recoverable.
Restructuring and Other Charges
We evaluate the adequacy of the accrued restructuring and other charges on a quarterly basis. As a result, we record reversals to the accrued restructuring in the period in which we determine that expected restructuring and other obligations are less than the amounts accrued. Tables summarizing the activity in the accrued liability for each restructuring event are contained in Note 9—Accrued Restructuring and Other Charges of the Notes to the Consolidated Financial Statements. During 2010 and 2009, we recorded restructuring and other charges and reversals as described below.
First Quarter 2009 Restructuring. During the first quarter of 2009, we initiated a restructuring plan that included the elimination of 29 positions. The restructuring was initiated to align our costs with our annual operating plan. During 2010, we recorded reversals of $85,000 of previously recorded expenses resulting primarily from the re-assignment of employees initially included in the restructuring plan. During 2009 we incurred a total of $1.5 million in restructuring charges, which were comprised almost entirely of employee payroll related severance costs. Included in these costs were charges related to the modification of equity awards to certain employees included in this restructuring activity. As of December 31, 2010, all activities associated with this restructuring were completed.
Second Quarter 2009 Restructuring. During the second quarter of 2009, we initiated a restructuring plan that included the elimination of 115 positions and the relocation of eight employees as part of two strategic initiatives within manufacturing operations and engineering. As part of the initiative, we began our transition to a fully outsourced manufacturing model, which has transfered remaining manufacturing from our manufacturing plant in Hillsboro, Oregon to our manufacturing partners in Asia. The plan also included consolidating our North American R&D positions and programs, and specifically transferring current projects from our design center in Boca Raton, Florida, to other existing R&D centers. During 2010, we recorded a net reversal of $121,000, consisting of reversals of $501,000 of previously recorded expenses resulting primarily from the re-assignment of employees initially included in the restructuring plan partially offset by additional accrued employee severance, healthcare benefits and associated payroll costs along with the facilities related costs and legal fees of $380,000. During 2009, we incurred a total of $3.1 million in restructuring charges, which consisted of accrued severance obligations, healthcare benefits, relocation incentives and related payroll taxes. The expense from 2009 also included legal expenditures as well as contract termination fees. This transition was substantially complete as of December 31, 2010.
Fourth Quarter 2009 Restructuring. During the fourth quarter of 2009, we initiated a restructuring plan that included the elimination of 22 positions at various locations throughout the company. The primary focus of this initiative was to align expenses with our 2010 operating plan objectives, which included the need to continue focusing on lowered costs. During 2010, we recorded a net reversal of $173,000, consisting of reversals of $309,000 of previously recorded expenses resulting primarily from changes in previously estimated expenses as well as the re-assignment of employees initially included in the restructuring plan. These reversals were partially offset by additional employee severance, healthcare benefits and associated payroll costs along with legal fees and foreign currency adjustments of $136,000. During 2009, we incurred $882,000 in charges associated with this restructuring plan, which consisted of severance and related payroll costs as well as healthcare benefits. We expect all activities associated with this restructuring plan to be completed by the end of 2011.
Fourth Quarter 2010 Restructuring. During the fourth quarter of 2010, we initiated a restructuring plan that includes the elimination of 67 positions at various locations throughout the company. The primary focus of this initiative is to align expenses with our 2011 operating plan objectives, which includes the need to reduce our infrastructure associated with the
34
maturity of our legacy/traditional communications networks products, as well as the consolidation of our contract manufacturers. During 2010, we incurred $2.0 million in charges associated with this restructuring plan, which consisted of severance and related payroll costs as well as healthcare benefits. We expect all activities associated with this restructuring plan to be substantially completed by the end of 2011.
Interest Expense
Interest expense includes interest incurred on our convertible notes and our lines of credit. During 2010, interest expense decreased $338,000, or 14.2%, to $2.0 million from $2.4 million in 2009. The decrease in interest expense in 2010 compared to 2009 was driven by the settlement of our revolving line of credit.
Interest Income
During 2010, interest income decreased $486,000, or 43.3%, to $636,000 from $1.1 million in 2009. Interest income decreased largely as a result of our sales of ARS investments upon execution of our settlement right with UBS AG.
Income Tax Provision
We recorded a tax benefit of $485,000 for the year ended December 31, 2010 and a tax expense of $39.3 million for the year ended December 31, 2009. Our current effective tax rate differs from the statutory rate primarily due to a full valuation allowance provided against our U.S. net deferred tax assets and the Canadian scientific research and experimental development expenditures claim.
At December 31, 2010, we had net deferred tax assets of $16.6 million. In addition, we had valuation allowances of $49.6 million and $48.4 million, as of December 31, 2010 and 2009, respectively. This represents a full valuation allowance against our U.S. deferred tax assets. In evaluating our valuation allowance, we considered all available positive and negative evidence, including scheduled reversals of deferred tax liabilities, projected future taxable income, tax planning strategies, and recent financial performance. Based on our review of all positive and negative evidence, including a three year U.S. cumulative pre-tax loss and taxable loss, it was concluded that a full valuation allowance should be recorded against our U.S. net deferred tax assets. In the event we were to determine that we would not be able to realize all or part of our foreign net deferred tax assets in the future, we would increase the valuation allowance and make a corresponding charge to earnings in the period in which we make such determination. Likewise, if we later determine that we are more likely than not to realize all or a portion of the U.S. net deferred tax assets, we would reverse the previously provided valuation allowance. All future reversals of the valuation allowance would result in a benefit in the period recognized. Although realization is not assured, management believes that it is more likely than not that the balance of the deferred tax assets, net of the valuation allowance, as of December 31, 2010 will be realized.
We are subject to income taxes in the U.S. and ten foreign countries, and on occasion, we have been subject to corporate income tax audits. Specifically, we are currently under examination in Canada by the Canada Revenue Agency (“CRA”). In determining the amount of income tax liabilities for uncertain tax positions, we have evaluated whether certain tax positions are more likely than not to be sustained by taxing authorities. We believe that we have adequately provided in our financial statements for additional taxes that may result from this examination. To the extent the ultimate outcome of the examination differs from the amounts provided for as uncertain tax positions either additional expense or benefit will be recognized in the period in which the examination is effectively settled.
During the fourth quarter of 2009, the Internal Revenue Service (“IRS”) commenced its examination of the 2007 and 2008 tax years. The examination was effectively settled in the first quarter of 2010, when we agreed to a Notice of Proposed Adjustment that was issued by the IRS. The Proposed Adjustment did not have a material impact on our Consolidated Financial Statements and it was provided in full as an uncertain tax position at December 31, 2009.
35
Comparison of Year 2009 and Year 2008
Revenues
Revenues decreased by $68.3 million, or 18.3%, to $304.3 million in 2009 from $372.6 million in 2008. Changes in our revenues by product group for the years ended December 31, 2009 and 2008, were as follows (in thousands):
For the Year Ended December 31, | ||||||||||||
2009 | 2008 | Change | ||||||||||
Next Generation Communications Networks Products | $ | 102,047 | $ | 103,676 | $ | (1,629 | ) | |||||
Legacy/ Traditional Communications Networks Products | 136,828 | 191,507 | (54,679 | ) | ||||||||
Total Communications Networks Products | 238,875 | 295,183 | (56,308 | ) | ||||||||
Medical Products | 26,261 | 29,607 | (3,346 | ) | ||||||||
Other Commercial Products | 39,137 | 47,794 | (8,657 | ) | ||||||||
Total Commercial Products | 65,398 | 77,401 | (12,003 | ) | ||||||||
Total revenues | $ | 304,273 | $ | 372,584 | $ | (68,311 | ) | |||||
Communications Networks Product Group
Revenues in the Communications Networks market decreased by $56.3 million or 19.1%, to $238.9 million in 2009 from $295.2 million in 2008 due to decreased revenues from both submarkets within our Communications Networks product group. Both product groups were affected by continued economic weakness during 2009. The decreases in revenues from our Legacy/Traditional Communications Networks products were further driven by the maturity of the products within this group as they approach end of life. The decline in revenues from our Next Generation Communications Networks products was further affected by the recognition of approximately $8.7 million in previously deferred revenues during 2008.
Commercial Products Group
Revenues in the Commercial Systems market decreased by $12.0 million, or 15.5%, to $65.4 million in 2009 from $77.4 million in 2008. These declines were primarily driven by the maturity of our Legacy/ Traditional products within our Commercial products group. These decreases were also affected by a decline in demand caused by general global economic weakness in all of our submarkets including medical and test and measurement equipment. Revenues from our Medical Products group declined by $3.3 million, or 11.3%, to $26.3 million during 2009 from $29.6 million in 2008. Revenues from our test and measurement product group declined by $5.4 million, or 42.6%, to $7.3 million in 2009 from $12.7 million in 2008.
Revenue by Geography
The following table outlines the percentage of revenues, by geographic region, for the years ended December 31, 2009 and 2008:
For the Years Ended December 31, | ||||||
2009 | 2008 | |||||
North America | 32.9 | % | 32.5 | % | ||
EMEA | 27.2 | 37.0 | ||||
Asia Pacific | 39.9 | 30.5 | ||||
Total | 100.0 | % | 100.0 | % | ||
From a geographic perspective, non-North American revenues by delivery destination decreased by $47.4 million, or 18.8%, to $204.1 million during 2009 from $251.5 million during 2008. As a percentage of total revenues, non-North American revenues by delivery destination remained relatively consistent while the percentage of revenues by region continued to shift from the EMEA region to the Asia Pacific region. Specifically, non-North American revenues by delivery destination accounted for 67.1% of total revenues during 2009, down from 67.5% during 2008. In addition, revenues from the Asia Pacific region increased by $8.0 million in 2009 and represented 39.9% of total revenues, up from 30.5% in 2008. Revenues from the EMEA region decreased $55.3 million during 2009 and represented 27.2% of total revenues, down from 37.0% in 2008. The shift in revenues from the EMEA region to the Asia Pacific region was largely driven by continued changes to our existing customers’
36
integration processes which have been transitioning to this region coupled with an increased percentage of our revenues being derived from our Next Generation Communications Networks products sold to customers in the Asia Pacific region. Revenues from North America decreased by $21.0 million, or 17.3%, to $100.1 million during 2009 from $121.1 million in 2008. Revenues from North America remained flat as a percent of total revenues and represented 32.9% during 2009, up from 32.5% during 2008. The decrease in overall revenues from North America was attributable to general economic weakness as well as the maturity of products being sold to customers in this region.
Gross Margin
Gross margins as a percentage of revenues increased by 4.7 percentage points to 30.5% in 2009 from 25.8% in 2008. The increase in gross margin as a percentage of revenues was driven by a reduction in the amortization of purchased technology, favorable changes in our product mix, and lower charges incurred for warranty and excess and obsolete inventories. Amortization of purchased technology decreased by $7.9 million, or 55.0%, to $6.5 million in 2009 from $14.4 million in 2008. This was driven by assets which have become fully amortized over the past two years, which accounted for $4.9 million of the decrease, along with the extension of the useful lives of various intangible assets in the fourth quarter of 2008, which resulted in a decrease of $3.1 million in amortization costs during 2009. The favorable change in our product mix resulted from a larger percentage of overall revenues coming from our higher margin Next Generation Communications Networks products. We incurred reduced charges for excess and obsolete inventory primarily due to the continued realization of internal process improvements implemented over the last few years.
Research and Development
R&D expenses consist primarily of salary, bonuses and benefits for product development staff, and cost of design and development supplies and equipment, net of reimbursements for non-recurring engineering services. R&D expenses decreased $7.4 million, or 15.1%, to $41.9 million in 2009 from $49.3 million in 2008. This decrease, compared to the same periods in 2008, is primarily due to lower payroll costs, which decreased by $3.2 million, or 14.2%, to $19.4 million in 2009 from $22.6 million in 2008. Decreases in payroll costs resulted from restructuring activities undertaken during 2008 and 2009. The decrease was further driven by decreased incentive compensation and bonus costs, which decreased by $2.5 million, or 37.2%, to $4.3 million in 2009 from $6.8 million in 2008. The decrease in incentive compensation and bonus costs were a direct result of restructuring activities along with a lower payout factor for employee incentive compensation plans associated with the achievement of corporate objectives.
Selling, General, and Administrative
SG&A expenses consist primarily of salary, commissions, bonuses and benefits for sales, marketing, executive, and administrative personnel, as well as professional services and costs of other general corporate activities. SG&A expenses decreased $5.7 million, or 11.3%, to $45.1 million in 2009 from $50.8 million in 2008. This decrease was largely driven by lower incentive compensation costs, which decreased by $2.5 million, or 24.7%, and totaled $7.5 million in 2009 down from $9.9 million in 2008. The decrease in incentive compensation costs were driven by a lower payout factor for employee incentive compensation plans associated with the achievement of corporate objectives. The decrease was further driven by decreased travel costs of $837,000 and a decrease in overall payroll costs of $765,000. Our decreased payroll costs resulted from restructuring activities undertaken during 2008 and 2009 and our overall headcount decreased by 15 to 221 employees in 2009 from 236 employees in 2008.
Stock-based Compensation Expense
Stock-based compensation expense consists of amortization of stock-based compensation associated with unvested stock options, restricted stock units issued to employees under the 2007 stock plan and the LTIP, and the ESPP. During 2009, we incurred $8.5 million in stock-based compensation. During 2008, we incurred $9.6 million in stock-based compensation expense. The decrease in stock-based compensation expense was driven by older share based payment awards becoming fully vested along with decreased costs of new awards, which were the result of our overall lower stock price.
37
We incurred and recognized stock-based compensation expense as follows (in thousands):
2009 | 2008 | |||||||
Cost of sales | $ | 1,050 | $ | 1,031 | ||||
Research and development | 2,176 | 3,001 | ||||||
Selling, general, and administrative | 5,060 | 5,584 | ||||||
Restructuring | 234 | — | ||||||
Total stock-based compensation expense | $ | 8,520 | $ | 9,616 | ||||
On October 5, 2009, we announced an offer to exchange certain outstanding options for restricted stock units or new options. Eligible employees were permitted to exchange some or all of their outstanding options, with an exercise price greater than $9.44 per share (which is equal to the 52-week high closing price of our common stock as of the start of this offer), that were granted on or before October 5, 2008, whether vested or unvested, for restricted stock units, except for employees in Canada who received new stock options with new vesting schedules and exercise prices. All employees of RadiSys and its subsidiaries, other than members of our Board of Directors, executive officers and employees located in the Netherlands and Israel were eligible to participate in the exchange offer, so long as they remain employed through the expiration date of the offer. The option exchange took place on November 3, 2009. Pursuant to the option exchange 848,800 eligible options were canceled and replaced with 169,600 restricted stock units and 35,000 stock options. The new restricted stock units and stock options have a new three year vesting period that began on November 3, 2009. The exchange resulted in $173,000 in additional stock compensation expense which will be recognized over the new three year vesting period.
Intangible Assets Amortization
Intangible asset amortization expense included in operating expenses consists of the amortization of trade names and customer related intangible assets. Intangible assets amortization expense included in results of operations was $2.6 million and $4.6 million in 2009 and 2008, respectively. Intangible assets amortization decreased due to the extension of the useful lives of various intangible assets in the fourth quarter of 2008. We perform reviews for impairment of the purchased intangible assets whenever events or changes in circumstances indicate that the carrying amount of an asset may not be recoverable.
Restructuring and Other Charges
During 2009 and 2008, we recorded restructuring and other charges and reversals as described below.
Second Quarter 2008 Restructuring. During the second quarter of 2008, we initiated a restructuring plan that included the elimination of 23 positions. The restructuring was primarily initiated to return our engineering spend to levels which align with targeted profitability as well as refocus our skill sets in order to promote new product growth and provide enhanced service and support to existing customers. During 2008, we incurred $598,000 of employee-related expenses as part of this restructure. All restructuring activities were completed during the first quarter of 2009. No charges associated with the second quarter 2008 restructuring plan were incurred during 2009.
First Quarter 2009 Restructuring. During the first quarter of 2009, we initiated a restructuring plan that included the elimination of 29 positions. During 2009 we incurred a total of $1.5 million in restructuring charges, which were comprised almost entirely of employee payroll related severance costs. Included in these costs were charges related to the modification of equity awards to certain employees included in this restructuring activity.
Second Quarter 2009 Restructuring. During the second quarter of 2009, we initiated a restructuring plan that includes the elimination of 115 positions and the relocation of eight employees as part of two strategic initiatives within manufacturing operations and engineering. During 2009 we incurred a total of $3.1 million in restructuring charges, which consisted of accrued severance obligations, healthcare benefits, relocation incentives and related payroll taxes. The balance also includes legal expenditures as well as contract termination fees.
Fourth Quarter 2009 Restructuring. During the fourth quarter of 2009, we initiated a restructuring plan that includes the elimination of 22 positions at various locations throughout the company. During 2009, we incurred $882,000 in charges associated with this restructuring plan, which consisted of severance and related payroll costs as well as healthcare benefits.
Interest Expense
Interest expense includes interest incurred on our convertible notes and our new lines of credit. During 2009, interest
38
expense decreased $2.5 million, or 51.3%, to $2.4 million from $4.9 million in 2008. The decrease in interest expense in 2009 compared to 2008 was driven by the adoption of the ASC Topic 470-20 during the first quarter of 2009, which resulted in the retrospective recognition of interest expense in the amount of $2.2 million during 2008. Refer to Note 12—Convertible Debt of the Notes to the Consolidated Financial Statements for further details of the interest costs resulting from our adoption of ASC Topic 470-20.
Interest Income
During 2009, interest income decreased $2.0 million, or 63.3%, to $1.1 million in 2009 from $3.1 million in 2008. Interest income decreased as a result of a decline in the average yield on investment holdings. The decline in our average investment yield was driven primarily by lower reset interest rates associated with our ARS as well as a decline in earnings from our cash equivalents.
Income Tax Provision
We recorded tax expense and benefit of $39.3 million and $9.5 million for the years ended December 31, 2009 and 2008, respectively. Our current effective tax rate differs from the statutory rate primarily due to a full valuation allowance provided against its U.S. net deferred tax assets, revaluation of the Canadian net deferred tax asset and Canadian research and experimental development claims.
At December 31, 2009, we had net deferred tax assets of $16.8 million. In addition, we had valuation allowances of $48.4 million and $5.6 million, as of December 31, 2009 and 2008, respectively. The $48.4 million valuation at December 31, 2009 represents a full valuation allowance against our U.S. deferred tax assets. The $5.6 million valuation allowance at December 31, 2008 was related primarily to certain U.S. net operating loss and tax credit carryforwards.
Liquidity and Capital Resources
The following table summarizes selected financial information:
For the years ended December 31, | ||||||||||||
2010 | 2009 | 2008 (A) | ||||||||||
(Dollar amounts in thousands) | ||||||||||||
Cash and cash equivalents | $ | 129,078 | $ | 100,672 | $ | 73,980 | ||||||
Short-term investments | — | 54,321 | — | |||||||||
Long-term investments | — | — | 51,213 | |||||||||
Cash and cash equivalents and investments | $ | 129,078 | $ | 154,993 | $ | 125,193 | ||||||
Working capital | $ | 147,049 | $ | 140,438 | $ | 66,067 | ||||||
Accounts receivable, net | $ | 42,855 | $ | 44,614 | $ | 45,551 | ||||||
Inventories, net | $ | 15,178 | $ | 15,325 | $ | 28,796 | ||||||
Accounts payable | $ | 29,190 | $ | 29,073 | $ | 34,123 | ||||||
2013 convertible senior notes | $ | 50,000 | $ | 50,000 | $ | 50,000 | ||||||
Days sales outstanding (B) | 55 | 54 | 45 | |||||||||
Days to pay (C) | 56 | 52 | 48 | |||||||||
Inventory turns (D) | 8.9 | 11.8 | 10.0 | |||||||||
Inventory turns—days (E) | 44 | 30 | 44 | |||||||||
Cash cycle time—days (F) | 43 | 32 | 41 | |||||||||
_________________________________
(A) | As adjusted due to the implementation of the cash conversion subsections of ASC Topic 470-20. |
(B) | Based on ending net trade receivables divided by daily revenue (based on 365 days in each year presented). |
(C) | Based on ending accounts payable divided by daily cost of sales excluding amortization of purchased technology (based on 365 days in each year presented). |
(D) | Based on cost of sales, excluding amortization of purchased technology, divided by ending inventory, which also includes inventory deposits. |
(E) | Based on ending inventory, including inventory deposits, divided by daily cost of sales excluding amortization of purchased technology (quarterly cost of sales, annualized and divided by 365 days). |
(F) | Days sales outstanding plus inventory turns—days, less days to pay. |
39
Cash and cash equivalents increased by $28.4 million to $129.1 million at December 31, 2010 from $100.7 million at December 31, 2009. Activities impacting cash and cash equivalents are as follows:
Cash Flows
For the Years Ended December 31, | ||||||||||||
2010 | 2009 | 2008 | ||||||||||
(In thousands) | ||||||||||||
Cash provided by operating activities | $ | 16,089 | $ | 25,440 | $ | 34,855 | ||||||
Cash (used in) provided by investing activities | 51,448 | (4,847 | ) | 4,003 | ||||||||
Cash provided by (used in) financing activities | (39,170 | ) | 6,007 | (15,099 | ) | |||||||
Effects of exchange rate changes | 39 | 92 | (301 | ) | ||||||||
Net increase in cash and cash equivalents | $ | 28,406 | $ | 26,692 | $ | 23,458 | ||||||
During the years ended December 31, 2010, 2009 and 2008, we used $4.1 million, $4.8 million and $6.3 million, respectively, for capital expenditures. During the year ended December 31, 2010 capital expenditures consisted primarily of additions associated with our transition to lower cost regions as well as upgrades and expansions to our internal infrastructure. During the year ended December 31, 2009 capital expenditures consisted primarily of upgrades to our internal infrastructure, expenditures associated with our transition to a fully outsourced manufacturing model and the expansion of our Shanghai, China design center. During the year ended December 31, 2008 capital expenditures were primarily associated with integrating the MCPD business as well as various purchases made to upgrade our internal infrastructure.
The increase in cash provided by investing activities was the result of gross proceeds from ARS investments purchased from UBS through the exercise of the Company's settlement right or from the ARS being called by the original issuer. Proceeds from ARS activities totaled $62.2 million, which were partially offset by the acquisition of Pactolus' assets for $3.4 million in cash.
During the year ended December 31, 2010 we used net cash totaling $39.2 million for financing activities. This was due to net repayments of $41.3 million on our UBS revolving line of credit.
During the years ended December 31, 2010, 2009 and 2008, we received $2.6 million, $4.8 million and $5.2 million, respectively, in proceeds from the issuance of common stock through our stock compensation plans.
Changes in foreign currency rates had a favorable impact on our cash balances of $39,000 and $92,000, and $(301,000) during 2010, 2009 and 2008, respectively. Due to our international operations where transactions are recorded in functional currencies other than the U.S. Dollar, the effects of changes in foreign currency exchange rates on existing cash balances during any given periods results in amounts on the Consolidated Statements of Cash Flows that may not reflect the changes in the corresponding accounts on the Consolidated Balance Sheets.
As of December 31, 2010 and 2009, working capital was $147.0 million and $140.4 million, respectively. Working capital increased by $6.6 million due primarily to cash flows from operations totaling $16.1 million for the year ended December 31, 2010.
Investments
Short-term and long-term investments reported as (in thousands):
As of December 31, | ||||||||
2010 | 2009 | |||||||
Short-term investments | $ | — | $ | 54,321 | ||||
ARS Settlement right | — | 7,833 | ||||||
$ | — | $ | 62,154 | |||||
During the year ended December 31, 2010, we exercised our right with UBS and as a result the investment bank repurchased our remaining balance of ARS. As of December 31, 2010, we held no ARS investments. During 2010, we recorded net gains of $21,000 associated with our settlement right, which are included in other income, net in the Consolidated
40
Statement of Operations.
As of December 31, 2009, we held investments in auction rate securities (“ARS”), the majority of which represented interests in collateralized debt obligations supported by pools of government-backed student loans with S&P AAA or Moody’s Aaa ratings at the time of purchase. During the first quarter of 2008, our portfolio of ARS investments experienced multiple failed auctions as the amount of securities submitted for sale exceeded the amount of purchase orders. An auction failure, which is not a default in the underlying debt instrument, occurs when there are more sellers than buyers at a scheduled interest rate auction date and parties desiring to sell their auction rate securities are unable to do so. During the fourth quarter of 2008, we accepted a settlement offer from UBS associated with the failed auctions. Under the terms of the offer, we had the right to require the bank to repurchase at par value our ARS investments at any time between June 30, 2010 and June 30, 2012.
Lines of Credit
Silicon Valley Bank
We have a secured revolving line of credit agreement with Silicon Valley Bank (“SVB”), dated as of August 7, 2008. The credit facility provides us with a two-year secured revolving credit facility of $30.0 million, which is subject to a borrowing base and secured by our accounts receivable. Borrowings under the credit facility bear interest at the prime rate, which was 3.25% as of December 31, 2010, or the LIBOR rate, which was 0.26% as of December 31, 2010, plus 1.25%, with either interest rate determined by our election. We are required to make interest payments monthly. We are further required to pay a commitment fee equal to 0.08% of the $30.0 million maximum borrowing limit on an annual basis, and to pay quarterly in arrears an unused facility fee in an amount equal to 0.375% per year of the unused amount of the facility. In addition, the credit facility provides sub-facilities for letters of credit and foreign exchange contracts to be issued on our behalf.
The credit facility requires us to make and maintain certain financial covenants, representations, warranties and other agreements that are customary in credit agreements of this type. The credit facility requires us to maintain a minimum quarterly current ratio (current assets divided by the sum of current liabilities less deferred income plus the amount of outstanding advances and letters of credit) of 1.5 during the term of the credit facility. Additionally, any quarterly EBITDA (earnings before interest, taxes, depreciation, amortization, stock based compensation, goodwill impairment charges, and deferred tax asset valuation charges, as defined by the credit facility) loss may not exceed $3.0 million in any one quarter. We must maintain a positive rolling four quarter EBITDA and capital expenditures may not exceed $8.0 million in any fiscal year.
During the fourth quarter of 2010, we amended the credit facility with SVB. Among other amendments, we extended the term of the agreement for another year to September 30, 2012. Additionally, we amended the non-formula borrowing base to a maximum amount of $30.0 million as long as we maintain a minimum quarterly current ratio of 2:1.
As of December 31, 2010, we had no outstanding balances on the line of credit or letters of credit issued on our behalf, however we were eligible to borrow up to $30.0 million. As of December 31, 2010, we were in compliance with all covenants, with a current ratio of 4:1, rolling four quarter EBITDA of $19.4 million and capital expenditures for 2010 of $4.1 million.
UBS
On June 30, 2010, we exercised our settlement right with UBS AG, which resulted in the repurchase by UBS AG of our remaining ARS investments. On July 1, 2010, upon the settlement of the ARS investments sold to UBS AG, we repaid our line of credit with UBS AG in full. On July 2, 2010, the UBS AG line of credit was terminated upon completion of all of the parties' obligations.
During the fourth quarter of 2008, we accepted a settlement offer from UBS AG, associated with failed auctions for our previously held ARS. Under the terms of the offer, we had the right to require the bank to repurchase at par value our ARS investments at any time between June 30, 2010 and June 30, 2012. Acceptance of the offer also entitled us to receive no net cost loans from UBS AG, or its affiliates, for up to 75% of the market value of our ARS.
2013 Convertible Senior Notes
During February 2008, we offered and sold in a public offering pursuant to the shelf registration statement $55.0 million aggregate principal amount of 2.75% convertible senior notes due 2013 (the “2013 convertible senior notes”). Interest is payable semi-annually, in arrears, on each August 15 and February 15, beginning on August 15, 2008, to the holders of record at the close of business on the preceding August 1 and February 1, respectively. The 2013 convertible senior notes mature on February 15, 2013. Holders of the 2013 convertible senior notes may convert their notes into a number of shares of our
41
common stock determined as set forth in the indenture governing the notes at their option on any day up to and including the business day prior to the maturity date. The 2013 convertible senior notes are initially convertible into 76.7448 shares of our common stock per $1,000 principal amount of the notes (which is equivalent to a conversion price of approximately $13.03 per share), subject to adjustment upon the occurrence of certain events. Upon the occurrence of a fundamental change, holders of the 2013 convertible senior notes may require us to repurchase some or all of their notes for cash at a price equal to 100% of the principal amount of the notes being repurchased, plus accrued and unpaid interest, if any. In addition, if certain fundamental changes occur, we may be required in certain circumstances to increase the conversion rate for any 2013 convertible senior notes converted in connection with such fundamental changes by a specified number of shares of our common stock. The 2013 convertible senior notes are our general unsecured obligations and rank equal in right of payment to all of our existing and future senior indebtedness, and senior in right of payment to our future subordinated debt. Our obligations under the 2013 convertible senior notes are not guaranteed by, and are effectively subordinated in right of payment to all existing and future obligations of our subsidiaries and are effectively subordinated in right of payment to our future secured indebtedness to the extent of the assets securing such debt.
In connection with the issuance of the 2013 convertible senior notes, we entered into a capped call transaction with a hedge counterparty. The capped call transaction is expected to reduce the potential dilution upon conversion of the 2013 convertible senior notes in the event that the market value per share of our common stock, as measured under the terms of the capped call transaction, at the time of exercise is greater than the strike price of the capped call transaction of approximately $13.03. The strike price of the capped call transaction corresponds to the initial conversion price of the 2013 convertible senior notes and is subject to certain adjustments similar to those contained in the notes. The capped call transaction provides for net-share settlement in the event that the volume-weighted average price per share of our common stock on the settlement date exceeds the strike price of approximately $13.03 per share. In such event, the hedge counterparty would deliver to us a number of shares equal to a formula determined by the quotient resulting from (a) the shares being settled times the difference between the volume-weighted average price on the settlement date and the strike price of approximately $13.03 per share, divided by (b) the volume-weighted average price on the settlement date. If the volume-weighted average price on the settlement date equals or exceeds the cap price of $23.085 per share, the difference in (a) would be $23.085 minus $13.03, or $10.055. Because the maximum number of shares deliverable under the capped call transaction is less than the number of shares issuable upon conversion of the 2013 convertible senior notes, we refer to this effect as “dilution mitigation.” If the market value per share of our common stock exceeds the cap price of the capped call transaction of $23.085, as measured under the terms of the capped call transaction, no additional shares would be delivered under the capped call transaction, and correspondingly, the dilution mitigation under the capped call transaction will be limited, which means that there would be dilution to the extent that the then market value per share of our common stock exceeds the cap price of the capped call transaction. Although the capped call transaction covers approximately 4.2 million shares, in order to facilitate an orderly settlement process, the shares are divided into tranches of approximately 211,000 shares each, settling on the twenty consecutive trading days prior to the date of maturity of our convertible notes. Thus, on each settlement date, approximately 211,000 shares would be settled, assuming a volume-weighted average price on such settlement date of $23.085. Assuming volume-weighted average price of $23.085, the hedge counterparty would deliver to us approximately 91,904 shares on each settlement date, calculated as follows: 211,000 x ($23.085 – $13.03)/$23.085 = 91,904.
We were advised by the hedge counterparty that, in order to hedge or manage its risk of having to deliver shares under the capped call transaction, depending on whether our stock price rises or falls, the counterparty may purchase our common stock in the open market or enter into derivative transactions equivalent to purchasing our stock (in which case its derivative counterparty would be expected to purchase common stock or accomplish the equivalent in derivative transactions) and/or may sell our common stock, enter into derivative transactions equivalent to selling our stock or unwind (that is, cancel upon payment of agreed consideration) previous derivative transactions (which would be the equivalent of selling our common stock). These types of transactions are commonly referred to as “modifying hedge positions.” Such modifications to our counterparty’s hedge positions may have an effect on our stock price.
As of December 31, 2010 and 2009, we had outstanding 2013 convertible senior notes with a face value of $50.0 million. As of December 31, 2010 and 2009, the fair value of our 2013 convertible senior notes was $49.1 million and $44.8 million, respectively.
During the fourth quarter of 2008, we repurchased $5.0 million aggregate principal amount of the 2013 convertible senior notes, with associated unamortized issuance costs of $196,000. We repurchased the notes in the open market for $3.1 million and, as a result, recorded a net gain of $1.7 million.
Derivatives
During 2008, we began to enter into forward foreign currency exchange contracts for the Canadian Dollar to reduce the
42
impact of foreign currency exchange risks where natural hedging strategies could not be effectively employed.
We do not hold or issue derivative financial instruments for trading purposes. The purpose of our hedging activities are to reduce the risk that the eventual cash flows of the underlying assets, liabilities and firm commitments will be adversely affected by changes in exchange rates. In general, our hedging activities do not create foreign currency exchange rate risk because fluctuations in the value of the instruments used for hedging purposes are offset by fluctuations in the value of the underlying exposures being hedged. Counterparties to derivative financial instruments expose us to credit-related losses in the event of non-performance. We do not believe there is a significant credit risk associated with our hedging activities because the counterparties are all large financial institutions with high credit ratings.
All derivatives, including foreign currency exchange contracts are recognized on the balance sheet at fair value. Unrealized gain positions are recorded as other current assets and unrealized loss positions are recorded as other current liabilities. Changes in the fair values of the outstanding derivatives that are highly effective are recorded in other comprehensive income until net income is affected by the variability of the cash flows of the hedged transaction. Typically, hedge ineffectiveness could result when the amount of our hedge contracts exceed our forecasted or actual transactions for which the hedge contracts were designed to hedge. Once a hedge contract matures the associated gain (loss) on the contract will remain in other comprehensive income until the underlying hedged transaction affects net income (loss), at which time the gain (loss) will be recorded to the expense line item being hedged, which is primarily R&D. One of the criteria for this accounting treatment is that the forward foreign currency exchange contract amount should not be in excess of specifically identified anticipated transactions. By their nature, estimates of anticipated transactions may fluctuate over time and may ultimately vary from actual transactions. If anticipated transaction estimates or actual transaction amounts decrease below hedged levels, or when the timing of transactions change significantly, we would reclassify a portion of the cumulative changes in fair values of the related hedge contracts from other comprehensive income (loss) to other income (expense) during the quarter in which the changes occur.
Contractual Obligations
The following summarizes our contractual obligations at December 31, 2010 and the effect of such on its liquidity and cash flows in future periods (in thousands).
2011 | 2012 | 2013 | 2014 | 2015 | Thereafter | |||||||||||||||||||
Future minimum lease payments | $ | 2,755 | $ | 2,401 | $ | 2,115 | $ | 1,819 | $ | 1,745 | $ | 4,995 | ||||||||||||
Purchase obligations (A) | 20,123 | — | — | — | — | — | ||||||||||||||||||
Foreign-currency cash flow hedge contracts | 8,525 | 4,022 | — | — | — | — | ||||||||||||||||||
2013 convertible senior notes | — | — | 50,000 | — | — | — | ||||||||||||||||||
Interest on convertible senior notes | 1,375 | 1,375 | 688 | — | — | — | ||||||||||||||||||
Total contractual obligations | $ | 32,778 | $ | 7,798 | 52,803 | $ | 1,819 | $ | 1,745 | $ | 4,995 | |||||||||||||
_______________________________
(A) | Purchase obligations include agreements or purchase orders to purchase goods or services that are enforceable and legally binding and specify all significant terms, including: fixed or minimum quantities to be purchased; fixed, minimum or variable price provisions and the approximate timing of the transaction. Purchase obligations exclude agreements that are cancelable without penalty. These purchase obligations are entered into in the ordinary course of business and are expected to be funded by cash flows from continuing operations. |
In addition to the above, as discussed in Note 16—Income Taxes of the Notes to the Consolidated Financial Statements, we have approximately $1.4 million associated with unrecognized tax benefits and related interest and penalties. These liabilities are primarily included as a component of “other accrued liabilities” in our Consolidated Balance Sheet as we do not anticipate that settlement of the liabilities will require payment of cash within the next twelve months. We are not able to reasonably estimate when we would make any cash payments required to settle these liabilities, but do not believe that the ultimate settlement of our obligations will materially affect our liquidity.
Off-Balance Sheet Arrangements
We do not engage in any activity involving special purpose entities or off-balance sheet financing.
Shelf Registration Statement
On October 26, 2010, we filed an unallocated shelf registration statement on Form S-3 for the offering from time to time
43
of up to $100 million in securities consisting of common stock, preferred stock, depositary shares, warrants, debt securities or units consisting of one or more of these securities. The SEC declared the shelf registration statement effective on November 24, 2010, and it will expire in November 2013. Except as may be stated in a prospectus supplement for any particular offering, we intend to use the net proceeds from the sale of any securities for general corporate purposes, which may include acquiring companies in our industry and related businesses, repaying existing debt, providing additional working capital and procuring capital assets.
Liquidity Outlook
At December 31, 2010, our cash, cash equivalents and investments, net, amounted to $129.1 million. We believe that our current cash, cash equivalents and investments, net, the cash generated from operations and our line of credit facilities will satisfy our short and long-term expected working capital needs, capital expenditures, stock repurchases, and other liquidity requirements associated with our existing business operations.
Recent Accounting Pronouncements
See Note 1—Significant Accounting Policies of the Notes to the Consolidated Financial Statements for a full description of recent accounting pronouncements including the respective expected dates of adoption and effects on results of operations and financial condition.
Item 7A. Quantitative and Qualitative Disclosures about Market Risk
We are exposed to market risk from changes in interest rates, foreign currency exchange rates, and equity trading prices, which could affect our financial position and results of operations.
Foreign Currency Risk. We pay the expenses of our international operations in local currencies, namely, the Canadian Dollar, Euro, Chinese Yuan, Japanese Yen, Malaysian Ringgit, British Pound Sterling, and New Shekel. Our international operations are subject to risks typical of an international business, including, but not limited to: differing economic conditions, changes in political climate, differing tax structures, foreign exchange rate volatility and other regulations and restrictions. Accordingly, future results could be materially and adversely affected by changes in these or other factors. We are also exposed to foreign exchange rate fluctuations as the balance sheets and income statements of our foreign subsidiaries are translated into U.S. Dollars during the consolidation process. Because exchange rates vary, these results, when translated, may vary from expectations and adversely affect overall expected profitability.
Based on our policy, we have established a foreign currency exposure management program which uses derivative foreign exchange contracts to address nonfunctional currency exposures. In order to reduce the potentially adverse effects of foreign currency exchange rate fluctuations, we have entered into forward exchange contracts. These hedging transactions limit our exposure to changes in the U.S. Dollar/Canadian Dollar exchange rate, and as of December 31, 2010 the total notional or contractual value of the contracts we held was $12.5 million. These contracts will mature over the next two years.
Holding other variables constant, a 10% adverse fluctuation, in relation to our hedge positions, of the U.S. Dollar relative to the Canadian Dollar would require an adjustment of $1.3 million, reversing our hedge asset and creating a hedge liability as of December 31, 2010, in the amount of $854,000. A 10% favorable fluctuation, in relation to our hedge positions, of the U.S. Dollar relative to the Canadian Dollar would result in an adjustment of $1.3 million and increase our total hedge asset as of December 31, 2010, to $1.7 million. We do not expect a 10% fluctuation to have any impact on our operating results as the underlying hedged transactions will move in an equal and opposite direction. As of December 31, 2010 our hedged positions are associated with our exposure to movements in the Canadian Dollar. If there is an unfavorable movement in the Canadian Dollar relative to our hedged positions this would be offset by reduced expenses, after conversion to the U.S. Dollar, associated with obligations paid for in the Canadian Dollar.
Convertible Notes. The fair value of the convertible senior notes is sensitive to interest rate changes as well as changes in our stock price. Interest rate changes would result in an increase or decrease in the fair value of the convertible notes due to differences between market interest rates and rates in effect at the inception of the obligation. Fluctuations in our stock price would result in an increase or decrease in the fair value of the convertible notes due to the value of the notes derived from the conversion feature. Unless we elect to repurchase our senior convertible notes in the open market, changes in the fair value of the senior convertible notes have no impact on our cash flows or Consolidated Financial Statements. The estimated fair value of the 2013 convertible senior notes was $49.1 million at December 31, 2010.
44
Item 8. Financial Statements and Supplementary Data
Quarterly Financial Data (unaudited)
For the Year Ended December 31, 2010 | For the Year Ended December 31, 2009 | |||||||||||||||||||||||||||||||
First Quarter | Second Quarter | Third Quarter | Fourth Quarter | First Quarter | Second Quarter | Third Quarter | Fourth Quarter | |||||||||||||||||||||||||
(In thousands, except per share data) | ||||||||||||||||||||||||||||||||
Revenues | $ | 67,307 | $ | 75,011 | $ | 75,167 | $ | 66,826 | $ | 77,604 | $ | 78,093 | $ | 70,448 | $ | 78,128 | ||||||||||||||||
Gross margin | 20,296 | 22,285 | 22,797 | 21,836 | 24,034 | 24,319 | 20,743 | 23,726 | ||||||||||||||||||||||||
Income (loss) from operations | (993 | ) | 1,087 | 1,745 | (1,140 | ) | (1,100 | ) | (1,097 | ) | (1,078 | ) | 1,083 | |||||||||||||||||||
Net income (loss) (A) | (1,048 | ) | 590 | 2,171 | (2,082 | ) | (40,097 | ) | (2,118 | ) | (832 | ) | 480 | |||||||||||||||||||
Net income (loss) per share: | ||||||||||||||||||||||||||||||||
Basic | $ | (0.04 | ) | $ | 0.02 | $ | 0.09 | $ | (0.09 | ) | $ | (1.73 | ) | $ | (0.09 | ) | $ | (0.04 | ) | $ | 0.02 | |||||||||||
Diluted | $ | (0.04 | ) | $ | 0.02 | $ | 0.09 | $ | (0.09 | ) | $ | (1.73 | ) | $ | (0.09 | ) | $ | (0.04 | ) | $ | 0.02 | |||||||||||
________________________________
(A) | First Quarter 2009 Deferred Tax Valuation Allowance. During the first quarter of 2009, we incurred $42.0 million in charges related to the establishment of a full valuation allowance against our U.S. net deferred tax assets. We record deferred tax assets to the extent we believes these assets will more likely than not be realized. In making such determination, we considered all available positive and negative evidence, including scheduled reversals of deferred tax liabilities, projected future taxable income, tax planning strategies, and recent financial performance. Based upon our review of all positive and negative evidence, including our projected three year U.S. cumulative pre-tax book loss and taxable loss, we concluded that a full valuation allowance should be recorded against our U.S. net deferred tax assets. |
45
MANAGEMENT’S REPORT ON INTERNAL CONTROL OVER FINANCIAL REPORTING
The management of the Company is responsible for establishing and maintaining adequate internal control over financial reporting as defined in Rules 13a-15(f) and 15d-15(f) under the Securities Exchange Act of 1934. The Company’s internal control over financial reporting is a process designed to provide reasonable assurance regarding reliability of financial reporting and the preparation and fair presentation of published financial statements for external purposes in accordance with generally accepted accounting principles.
Because of its inherent limitations, internal control over financial reporting may not prevent or detect misstatements. Also, projections of any evaluation of effectiveness to future periods are subject to the risk that controls may become inadequate because of changes in conditions, or that the degree of compliance with the policies or procedures may deteriorate.
Management assessed the effectiveness of the Company’s internal control over financial reporting as of December 31, 2009. In making this assessment, management used the criteria set forth by the Committee of Sponsoring Organizations of the Treadway Commission (COSO) in Internal Control—Integrated Framework. Based on our assessment, we conclude that, as of December 31, 2010, the Company’s internal control over financial reporting is effective based on those criteria to provide reasonable assurance regarding the reliability of financial reporting and the preparation of financial statements for external purposes in accordance with generally accepted accounting principles.
The effectiveness of internal control over financial reporting as of December 31, 2010, has been audited by KPMG, LLP, the independent registered public accounting firm who also audited the Company’s Consolidated Financial Statements included in this Item 8, as stated in the report which appears on page 47 hereof.
46
REPORT OF INDEPENDENT REGISTERED PUBLIC ACCOUNTING FIRM
The Board of Directors and Shareholders
RadiSys Corporation:
We have audited RadiSys Corporation’s internal control over financial reporting as of December 31, 2010, based on criteria established in Internal Control—Integrated Framework issued by the Committee of Sponsoring Organizations of the Treadway Commission (COSO). RadiSys Corporation’s management is responsible for maintaining effective internal control over financial reporting and for its assessment of the effectiveness of internal control over financial reporting, included in the accompanying Management’s Report on Internal Control over Financial Reporting. Our responsibility is to express an opinion on the Company’s internal control over financial reporting based on our audit.
We conducted our audit in accordance with the standards of the Public Company Accounting Oversight Board (United States). Those standards require that we plan and perform the audit to obtain reasonable assurance about whether effective internal control over financial reporting was maintained in all material respects. Our audit included obtaining an understanding of internal control over financial reporting, assessing the risk that a material weakness exists, and testing and evaluating the design and operating effectiveness of internal control based on the assessed risk. Our audit also included performing such other procedures as we considered necessary in the circumstances. We believe that our audit provides a reasonable basis for our opinion.
A company’s internal control over financial reporting is a process designed to provide reasonable assurance regarding the reliability of financial reporting and the preparation of financial statements for external purposes in accordance with generally accepted accounting principles. A company’s internal control over financial reporting includes those policies and procedures that (1) pertain to the maintenance of records that, in reasonable detail, accurately and fairly reflect the transactions and dispositions of the assets of the company; (2) provide reasonable assurance that transactions are recorded as necessary to permit preparation of financial statements in accordance with generally accepted accounting principles, and that receipts and expenditures of the company are being made only in accordance with authorizations of management and directors of the company; and (3) provide reasonable assurance regarding prevention or timely detection of unauthorized acquisition, use, or disposition of the company’s assets that could have a material effect on the financial statements.
Because of its inherent limitations, internal control over financial reporting may not prevent or detect misstatements. Also, projections of any evaluation of effectiveness to future periods are subject to the risk that controls may become inadequate because of changes in conditions, or that the degree of compliance with the policies or procedures may deteriorate.
In our opinion, RadiSys Corporation maintained, in all material respects, effective internal control over financial reporting as of December 31, 2010, based on criteria established in Internal Control – Integrated Framework issued by the Committee of Sponsoring Organizations of the Treadway Commission.
We also have audited, in accordance with the standards of the Public Company Accounting Oversight Board (United States), the consolidated balance sheets of RadiSys Corporation and subsidiaries as of December 31, 2010 and 2009, and the related consolidated statements of operations, changes in shareholders’ equity and comprehensive loss, and cash flows for each of the years in the three-year period ended December 31, 2010, and our report dated March 15, 2011 expressed an unqualified opinion on those consolidated financial statements.
/s/ KPMG LLP
Portland, Oregon
March 15, 2011
47
REPORT OF INDEPENDENT REGISTERED PUBLIC ACCOUNTING FIRM
The Board of Directors and Shareholders
RadiSys Corporation:
We have audited the accompanying consolidated balance sheets of RadiSys Corporation and subsidiaries as of December 31, 2010 and 2009, and the related consolidated statements of operations, changes in shareholders’ equity and comprehensive loss, and cash flows for each of the years in the three year period ended December 31, 2010. These consolidated financial statements are the responsibility of the Company’s management. Our responsibility is to express an opinion on these consolidated financial statements based on our audits.
We conducted our audits in accordance with the standards of the Public Company Accounting Oversight Board (United States). Those standards require that we plan and perform the audit to obtain reasonable assurance about whether the financial statements are free of material misstatement. An audit includes examining, on a test basis, evidence supporting the amounts and disclosures in the financial statements. An audit also includes assessing the accounting principles used and significant estimates made by management, as well as evaluating the overall financial statement presentation. We believe that our audits provide a reasonable basis for our opinion.
In our opinion, the consolidated financial statements referred to above present fairly, in all material respects, the financial position of RadiSys Corporation and subsidiaries as of December 31, 2010 and 2009, and the results of their operations and their cash flows for each of the years in the three year period ended December 31, 2010, in conformity with U.S. generally accepted accounting principles.
The Company adopted Financial Accounting Standards Board Staff Position No. APB 14–1, Accounting for Convertible Debt Instruments That May Be Settled in Cash Upon Conversion (Including Partial Cash Settlement) (FSP APB 14–1) (codified in FASB ASC Topic 470, Debt with Conversions and Other Options) effective as of January 1, 2009 and retrospectively adjusted its accounting for its consolidated financial statements for the year ended December 31, 2008 presented herein.
We also have audited, in accordance with the standards of the Public Company Accounting Oversight Board (United States), RadiSys Corporation’s internal control over financial reporting as of December 31, 2010, based on criteria established in Internal Control—Integrated Framework issued by the Committee of Sponsoring Organizations of the Treadway Commission (COSO), and our report dated March 15, 2011 expressed an unqualified opinion on the effectiveness of the Company’s internal control over financial reporting.
/s/ KPMG LLP
Portland, Oregon
March 15, 2011
48
RADISYS CORPORATION
CONSOLIDATED STATEMENTS OF OPERATIONS
For the Years Ended December 31, | ||||||||||||
2010 | 2009 | 2008 (A) | ||||||||||
(In thousands, except per share amounts) | ||||||||||||
Revenues | $ | 284,311 | $ | 304,273 | $ | 372,584 | ||||||
Cost of sales: | ||||||||||||
Cost of sales | 190,915 | 204,975 | 262,100 | |||||||||
Amortization of purchased technology | 6,182 | 6,476 | 14,401 | |||||||||
Total cost of sales | 197,097 | 211,451 | 276,501 | |||||||||
Gross margin | 87,214 | 92,822 | 96,083 | |||||||||
Research and development | 38,678 | 41,886 | 49,325 | |||||||||
Selling, general and administrative | 45,532 | 45,105 | 50,837 | |||||||||
Goodwill impairment charge | — | — | 67,256 | |||||||||
Intangible assets amortization | 730 | 2,588 | 4,554 | |||||||||
Restructuring and other charges, net | 1,575 | 5,435 | 575 | |||||||||
Income (loss) from operations | 699 | (2,192 | ) | (76,464 | ) | |||||||
Interest expense | (2,035 | ) | (2,373 | ) | (4,871 | ) | ||||||
Interest income | 636 | 1,122 | 3,059 | |||||||||
Other income (expense), net | (154 | ) | 211 | 719 | ||||||||
Loss before income tax expense (benefit) | (854 | ) | (3,232 | ) | (77,557 | ) | ||||||
Income tax expense (benefit) | (485 | ) | 39,335 | (10,295 | ) | |||||||
Net loss | $ | (369 | ) | $ | (42,567 | ) | $ | (67,262 | ) | |||
Net loss per share: | ||||||||||||
Basic | $ | (0.02 | ) | $ | (1.81 | ) | $ | (2.98 | ) | |||
Diluted | $ | (0.02 | ) | $ | (1.81 | ) | $ | (2.98 | ) | |||
Weighted average shares outstanding: | ||||||||||||
Basic | 24,144 | 23,493 | 22,552 | |||||||||
Diluted | 24,144 | 23,493 | 22,552 | |||||||||
______________________________
(A) | As adjusted due to the implementation of the cash conversion subsections of ASC Topic 470-20 “Debt with Conversion and Other Options—Cash Conversion” (“ASC Topic 470-20”). |
The accompanying notes are an integral part of these financial statements.
49
RADISYS CORPORATION
CONSOLIDATED BALANCE SHEETS
December 31, 2010 | December 31, 2009 | |||||||
(In thousands) | ||||||||
ASSETS | ||||||||
Current assets: | ||||||||
Cash and cash equivalents (Notes 2 and 3) | $ | 129,078 | $ | 100,672 | ||||
Short-term investments (Notes 2 and 3) | — | 54,321 | ||||||
ARS settlement right (Notes 2 and 3) | — | 7,833 | ||||||
Accounts receivable, net (Notes 4 and 18) | 42,855 | 44,614 | ||||||
Other receivables (Note 4) | 1,665 | 3,708 | ||||||
Inventories, net (Note 5) | 15,178 | 15,325 | ||||||
Inventory deposit, net (Note 5) | 6,194 | 2,126 | ||||||
Other current assets (Notes 8 and 13) | 4,612 | 4,679 | ||||||
Deferred tax assets, net (Note 16) | 551 | 1,912 | ||||||
Total current assets | 200,133 | 235,190 | ||||||
Property and equipment, net (Notes 6 and 18) | 9,487 | 9,926 | ||||||
Intangible assets, net (Notes 7, 16 and 18) | 7,088 | 10,720 | ||||||
Long-term deferred tax assets, net (Note 16) | 16,005 | 14,925 | ||||||
Other assets (Note 8) | 8,215 | 6,273 | ||||||
Total assets | $ | 240,928 | $ | 277,034 | ||||
LIABILITIES AND SHAREHOLDERS’ EQUITY | ||||||||
Current liabilities: | ||||||||
Accounts payable | $ | 29,190 | $ | 29,073 | ||||
Accrued wages and bonuses | 6,556 | 6,934 | ||||||
Deferred income | 4,424 | 3,156 | ||||||
Line of credit (Note 11) | — | 41,287 | ||||||
Other accrued liabilities (Notes 10 and 14) | 12,914 | 14,302 | ||||||
Total current liabilities | 53,084 | 94,752 | ||||||
Long-term liabilities: | ||||||||
2013 convertible senior notes (Note 12) | 50,000 | 50,000 | ||||||
Other long-term liabilities (Note 16) | 450 | 2,565 | ||||||
Total long-term liabilities | 50,450 | 52,565 | ||||||
Total liabilities | 103,534 | 147,317 | ||||||
Commitments and contingencies (Note 14) | — | — | ||||||
Shareholders’ equity (Notes 12, 14 and 15): | ||||||||
Preferred stock—$.01 par value, 5,664 shares authorized; none issued or outstanding | — | — | ||||||
Common stock—no par value, 100,000 shares authorized; 24,351 and 23,876 shares issued and outstanding at December 31, 2010 and December 31, 2009 | 266,945 | 258,670 | ||||||
Accumulated deficit | (134,683 | ) | (134,314 | ) | ||||
Accumulated other comprehensive income: | ||||||||
Cumulative translation adjustments | 4,739 | 4,614 | ||||||
Unrealized gain on hedge instruments | 393 | 747 | ||||||
Total accumulated other comprehensive income | 5,132 | 5,361 | ||||||
Total shareholders’ equity | 137,394 | 129,717 | ||||||
Total liabilities and shareholders’ equity | $ | 240,928 | $ | 277,034 | ||||
The accompanying notes are an integral part of these financial statements.
50
RADISYS CORPORATION
CONSOLIDATED STATEMENT OF CHANGES IN SHAREHOLDERS’ EQUITY
AND COMPREHENSIVE LOSS
Common Stock | Accumulated Deficit | Accumulated Other Comprehensive Income | Total | Total Comprehensive Loss | |||||||||||||||||||
Shares | Amount | ||||||||||||||||||||||
(In thousands) | |||||||||||||||||||||||
Balances, December 31, 2007 | 22,312 | $ | 243,071 | $ | (24,485 | ) | $ | 4,388 | $ | 222,974 | $ | (20,775 | ) | ||||||||||
Shares issued pursuant to benefit plans | 694 | 5,324 | — | — | 5,324 | ||||||||||||||||||
Stock based compensation associated with employee benefit plans | — | 9,571 | — | — | 9,571 | ||||||||||||||||||
Restricted stock issued | 76 | — | — | — | — | ||||||||||||||||||
Restricted share cancellations and forfeitures for tax settlements | (49 | ) | (378 | ) | — | — | (378 | ) | |||||||||||||||
Purchase of capped call | — | (10,154 | ) | — | — | (10,154 | ) | ||||||||||||||||
Translation adjustments | — | — | — | (62 | ) | (62 | ) | (62 | ) | ||||||||||||||
Net adjustment for fair value of hedge derivatives, net of taxes of $467 | — | — | — | (859 | ) | (859 | ) | (859 | ) | ||||||||||||||
Repurchase of 2023 convertible senior notes | — | (1,686 | ) | — | — | (1,686 | ) | ||||||||||||||||
Net loss for the period | — | — | (67,262 | ) | — | (67,262 | ) | (67,262 | ) | ||||||||||||||
Balances, December 31, 2008 | 23,033 | $ | 245,748 | $ | (91,747 | ) | $ | 3,467 | $ | 157,468 | |||||||||||||
Comprehensive loss, for the year ended December 31, 2008 | $ | (68,183 | ) | ||||||||||||||||||||
Shares issued pursuant to benefit plans | 761 | 4,754 | — | — | 4,754 | ||||||||||||||||||
Stock-based compensation associated with employee benefit plans | — | 8,520 | — | — | 8,520 | ||||||||||||||||||
Vesting of restricted stock units | 135 | — | — | — | — | ||||||||||||||||||
Restricted share cancellations and forfeitures for tax settlements | (53 | ) | (352 | ) | — | — | (352 | ) | |||||||||||||||
Translation adjustments | — | — | — | 288 | 288 | 288 | |||||||||||||||||
Net adjustment for fair value of hedge derivatives, net of taxes of $732 | — | — | — | 1,606 | 1,606 | 1,606 | |||||||||||||||||
Net loss for the period | — | — | (42,567 | ) | — | (42,567 | ) | (42,567 | ) | ||||||||||||||
Balances, December 31, 2009 | 23,876 | $ | 258,670 | $ | (134,314 | ) | $ | 5,361 | $ | 129,717 | |||||||||||||
Total comprehensive loss for the year ended December 31, 2009 | $ | (40,673 | ) | ||||||||||||||||||||
Shares issued pursuant to benefit plans | 380 | 2,586 | — | — | 2,586 | ||||||||||||||||||
Stock-based compensation associated with employee benefit plans | — | 6,158 | — | — | 6,158 | ||||||||||||||||||
Vesting of restricted stock units | 144 | — | — | — | — | ||||||||||||||||||
Restricted share cancellations and forfeitures for tax settlements | (49 | ) | (469 | ) | — | — | (469 | ) | |||||||||||||||
Translation adjustments | — | — | — | 125 | 125 | 125 | |||||||||||||||||
Net adjustment for fair value of hedge derivatives, net of taxes of $142 | — | — | — | (354 | ) | (354 | ) | (354 | ) | ||||||||||||||
Net loss for the period | — | — | (369 | ) | — | (369 | ) | (369 | ) | ||||||||||||||
Balances, December 31, 2010 | 24,351 | $ | 266,945 | $ | (134,683 | ) | $ | 5,132 | $ | 137,394 | |||||||||||||
Total comprehensive loss for the year ended December 31, 2010 | $ | (598 | ) | ||||||||||||||||||||
The accompanying notes are an integral part of these financial statements.
51
For the Years Ended December 31, | ||||||||||||
2010 | 2009 | 2008 (A) | ||||||||||
(In thousands) | ||||||||||||
Cash flows from operating activities: | ||||||||||||
Net loss | $ | (369 | ) | $ | (42,567 | ) | $ | (67,262 | ) | |||
Adjustments to reconcile net loss to net cash provided by operating activities: | ||||||||||||
Depreciation and amortization | 11,922 | 15,354 | 25,147 | |||||||||
Inventory valuation allowance | 1,368 | 2,995 | 3,720 | |||||||||
Non-cash amortization associated with the acquisition of Convedia | — | 36 | 112 | |||||||||
Deferred tax valuation allowance | — | 42,003 | — | |||||||||
Deferred income taxes | 403 | (513 | ) | (9,991 | ) | |||||||
Canadian deferred tax foreign exchange benefit | — | (3,204 | ) | — | ||||||||
Tax liability adjustments | (1,029 | ) | — | — | ||||||||
Non-cash interest expense | 448 | 448 | 2,689 | |||||||||
Goodwill impairment charge | — | — | 67,256 | |||||||||
(Gain) loss on disposal of property and equipment | (462 | ) | 39 | 93 | ||||||||
Loss (gain) on ARS settlement right | 7,833 | 3,238 | (11,071 | ) | ||||||||
(Gain) loss on ARS | (7,854 | ) | (3,658 | ) | 11,512 | |||||||
Gain on early extinguishments of convertible subordinated notes | — | — | (933 | ) | ||||||||
Stock-based compensation expense | 6,158 | 8,520 | 9,616 | |||||||||
Other | 641 | 413 | 5 | |||||||||
Changes in operating assets and liabilities, net of acquisitions: | ||||||||||||
Accounts receivable | 2,102 | 937 | 24,932 | |||||||||
Other receivables | 2,043 | (2,618 | ) | 1,588 | ||||||||
Inventories | (1,030 | ) | 12,130 | (9,415 | ) | |||||||
Inventory deposit | (4,068 | ) | (2,370 | ) | (654 | ) | ||||||
Other current assets | (934 | ) | 432 | 1,282 | ||||||||
Accounts payable | 82 | (5,050 | ) | (15,586 | ) | |||||||
Accrued wages and bonuses | (536 | ) | (4,319 | ) | 3,177 | |||||||
Accrued restructuring | (971 | ) | 2,932 | 26 | ||||||||
Deferred income | 998 | 881 | (3,124 | ) | ||||||||
Other accrued liabilities | (656 | ) | (619 | ) | 1,736 | |||||||
Net cash provided by operating activities | 16,089 | 25,440 | 34,855 | |||||||||
Cash flows from investing activities: | ||||||||||||
Acquisition of Pactolus, net of cash acquired | (3,385 | ) | — | — | ||||||||
Proceeds from sale of auction rate securities | 62,175 | 550 | 10,025 | |||||||||
Capital expenditures | (4,061 | ) | (4,805 | ) | (6,324 | ) | ||||||
Purchase of long-term assets | (3,758 | ) | (592 | ) | 302 | |||||||
Proceeds from the sale of property and equipment | 477 | — | — | |||||||||
Net cash provided by (used in) investing activities | 51,448 | (4,847 | ) | 4,003 | ||||||||
Cash flows from financing activities: | ||||||||||||
Proceeds from issuance of 2013 convertible senior notes | — | — | 55,000 | |||||||||
Purchase of capped call | — | — | (10,154 | ) | ||||||||
Repurchase of 2023 convertible senior notes | — | — | (98,419 | ) | ||||||||
Repurchase of 2013 convertible senior notes | — | — | (3,125 | ) | ||||||||
Restricted share cancellations and forfeitures for tax settlement | (469 | ) | (352 | ) | (422 | ) | ||||||
Borrowings on line of credit | 13,738 | 1,752 | 59,800 | |||||||||
Payments on line of credit | (55,025 | ) | — | (20,265 | ) | |||||||
Financing costs | — | — | (2,539 | ) | ||||||||
Payments on capital lease obligation | — | (147 | ) | (150 | ) | |||||||
Proceeds from issuance of common stock | 2,586 | 4,754 | 5,175 | |||||||||
Net cash (used in) provided by financing activities | (39,170 | ) | 6,007 | (15,099 | ) | |||||||
Effect of exchange rate changes on cash | 39 | 92 | (301 | ) | ||||||||
52
For the Years Ended December 31, | ||||||||||||
2010 | 2009 | 2008 (A) | ||||||||||
(In thousands) | ||||||||||||
Net increase in cash and cash equivalents | 28,406 | 26,692 | 23,458 | |||||||||
Cash and cash equivalents, beginning of period | 100,672 | 73,980 | 50,522 | |||||||||
Cash and cash equivalents, end of period | $ | 129,078 | $ | 100,672 | $ | 73,980 | ||||||
Supplemental disclosure of cash flow information: | ||||||||||||
Cash paid during the year for: | ||||||||||||
Interest | $ | 1,375 | $ | 1,375 | $ | 1,662 | ||||||
Income taxes paid (refunded) | $ | 592 | $ | 194 | $ | 229 | ||||||
Supplemental disclosure of non-cash financing activities: | ||||||||||||
Capital lease obligation | $ | — | $ | — | $ | 155 | ||||||
___________________________
(A) | As adjusted due to the implementation of the cash conversion subsections of ASC Topic 470-20. |
The accompanying notes are an integral part of these financial statements.
53
RADISYS CORPORATION
NOTES TO CONSOLIDATED FINANCIAL STATEMENTS
Note 1—Significant Accounting Policies
Basis of Presentation
RadiSys Corporation (“RadiSys” or the “Company”) was incorporated in March 1987 under the laws of the State of Oregon for the purpose of developing, producing and marketing hardware and software platforms for next-generation IP-based wireless, wireline and video networks. The Company's products include Advanced Telecommunications Computing Architecture ("ATCA") and IP Media Server platforms as well as application software for new IP-based communication services. These products enable customers to bring more new high-value products and services to market with speed and flexibility using the latest technologies and with a lower investment.
Principles of Consolidation
The accompanying Consolidated Financial Statements include the accounts of the Company and its wholly owned subsidiaries. All inter-company accounts and transactions have been properly eliminated in consolidation.
Management Estimates
The Consolidated Financial Statements have been prepared in accordance with U.S. generally accepted accounting principles (“GAAP”). The preparation of these Consolidated Financial Statements requires management to make estimates and judgments that may affect the amounts reported in its Consolidated Financial Statements and accompanying notes. Actual results may differ from these estimates under different assumptions or conditions.
Revenue Recognition
Multiple Element Arrangements
A significant portion of the Company's revenue relates to product sales for which revenue is recognized upon shipment, with limited judgment required related to product returns. Product sales are shipped FOB shipping point. The software elements included in certain components of Advanced Telecommunications Computing Architecture ("ATCA") systems and Media Servers is considered to be functioning together with the non-software elements to provide the tangible product's essential functionality and these arrangements generally include multiple elements such as hardware, technical support services as well as software upgrades or enhancements on a when and if available basis. Arrangements that include multiple elements require significant management judgment to evaluate the effective terms of agreements, our performance commitments and determination of fair value of the various deliverables under the arrangement. During the first quarter of 2010 the Company elected early adoption of ASU No. 2009−13, “Multiple−Deliverable Revenue Arrangements—a consensus of the FASB Emerging Issues Task Force” ("ASU 2009−13") and ASU No. 2009−14, “Certain Arrangements That Include Software Elements,” (amendments to FASB ASC Topic 985, Software) (“ASU 2009−14”). Adoption of ASU 2009−13 and ASU 2009−14 allows the Company to meet separation criteria required for multiple element arrangements where it could not previously establish a fair value for one or more of the relevant deliverables. Previously, when the Company could not establish fair value for certain technical support agreements all revenue was deferred. These revenues were then recognized over the appropriate period, generally coinciding with an explicit or implied support period, or in some cases until all elements of the arrangement had been delivered. Under ASU 2009−13, overall consideration is allocated among the separate units of accounting based on their relative fair value. This will result in the ability to recognize each unit of accounting upon delivery. Revenue for hardware, which includes software that is considered more than incidental, will be recognized upon delivery whereas technical support services will be recognized over the applicable service period.
ASU 2009−13 provides a fair value hierarchy in order to determine the appropriate relative fair value for each element of an arrangement. When available, the Company uses vendor specific objective evidence (“VSOE”) to determine the estimated selling price. In the absence of VSOE or third−party evidence ("TPE") for a delivered element, the Company then uses an estimated selling price in order to determine fair value. Estimated selling prices represent the Company's best estimate of the price at which it would transact if the deliverables were sold on a standalone basis. For technical support services, the Company generally determines its selling price based on VSOE as supported by substantive renewal rates in the related service agreements. In certain instances where VSOE cannot be established, the Company then relies upon its estimated selling price for such deliverables as TPE is generally not available due to the unique company specific terms surrounding such service
54
agreements. In establishing an appropriate estimated selling price for these technical support agreements, the Company considered entity specific factors such as its historical and projected costs, historical and projected revenues, and profit objectives. The Company also considered market specific factors when establishing reasonable profit objectives.
The transition guidance provided within ASU 2009−13 is only allowed to be applied to new or substantially modified arrangements. No previously existing arrangements were modified during the year and therefore existing arrangements were not effected by ASU 2009−13. This guidance was applied to new revenue arrangements arising in the first quarter of 2010 where tangible products were bundled with technical support services. For these arrangements, the Company used an estimated selling price to determine the revenue related to technical support service elements of these arrangements. The adoption of ASU 2009-13 and ASU 2009-14 has not materially affected the Company's Consolidated Financial Statements for the year ended December 31, 2010.
Hardware
Revenue from hardware products is recognized in accordance with applicable GAAP for revenue recognition. Under the Company’s standard terms and conditions of sale, the Company transfers title and risk of loss to the customer at the time product is shipped to the customer and revenue is recognized accordingly, unless customer acceptance is uncertain or significant obligations remain. The Company reduces revenue for estimated customer returns for rotation rights as well as for price protection rights according to agreements with its distributors. The amount of revenues derived from these distributors as a percentage of revenues was 18.1%, 17.5% and 15.2% for the years ended December 31, 2010, 2009 and 2008, respectively. The Company accrues the estimated cost of post-sale obligations for product warranties, based on historical experience at the time the Company recognizes revenue.
The software elements included in certain components of ATCA systems and Media Servers are considered to be functioning together with the non-software elements to provide the tangible product's essential functionality and the Company’s ATCA arrangements generally include multiple elements such as hardware, technical support services as well as specified software upgrades or enhancements. As such, the revenue associated with these products is recognized in accordance with applicable GAAP for revenue recognition.
Software royalties and licenses
Revenue from software royalties and licenses is recognized in accordance with applicable GAAP for revenue recognition. Revenue from customers for prepaid, non-refundable software royalties is recorded when the revenue recognition criteria have been met. Revenue for non-prepaid royalties is recognized at the time the underlying product is shipped by the customer paying the royalty. The Company recognizes software license revenue at the time of shipment or upon delivery of the software master provided that the revenue recognition criteria have been met and VSOE exists to allocate the total fee to all undelivered elements of the arrangement. The Company defers revenue on arrangements, including specified software upgrades, until the specified upgrade has been delivered.
Technical support services
Technical support services are recognized as earned on the straight-line basis over the terms of the contract in accordance with applicable GAAP for revenue recognition. The fair value of the Company’s post-contract support has been determined by renewal rates within the Company’s support agreements, the actual amounts charged to customers for renewal of their support services or based on an estimated selling price.
Engineering and other services
Engineering services revenue is recognized upon completion of certain contractual milestones and customer acceptance of the services rendered. Other services revenues include hardware repair services and custom software implementation projects. Hardware repair services revenues are recognized when the services are complete. Software implementation revenues are recognized upon completion of certain contractual milestones and customer acceptance of the services rendered.
55
Deferred income
Deferred income represents amounts received or billed for the following types of transactions:
• | Distributor sales—Certain sales are made to distributors under agreements providing price protection and right of return on unsold merchandise. Revenue and costs relating to such distributor sales are deferred until the product is sold by the distributor or return privileges and price protection rights terminate, at which time related estimated distributor resale revenue, estimated effects of distributor price adjustments, and estimated costs are reflected in the Consolidated Statement of Operations. |
Revenue reporting for these distributors is highly dependent on receiving pertinent and accurate data from the Company’s distributors in a timely fashion. Distributors provide periodic data regarding the product, price, quantity, and end customer when products are resold as well as the quantities of the Company’s products they still have in stock. The Company must use estimates and apply judgments to reconcile distributors’ reported inventories to its activities.
• | Undelivered elements of an arrangement—Certain software sales include specified upgrades and enhancements to an existing product. Revenue for such products is deferred until the future obligation is fulfilled. |
Capitalized Software Development Costs
The Company does not capitalize internal software development costs incurred in the production of computer software as the Company does not incur any material costs between the point of technological feasibility and general release of the product to customers in the future. As such software development costs are expensed as research and development (“R&D”) costs.
Shipping Costs
The Company’s shipping and handling costs for product sales are included under cost of sales for all periods presented. For the years ended December 31, 2010, 2009 and 2008 shipping and handling costs represented approximately 1% of cost of sales.
Advertising Costs
The Company expenses advertising costs as incurred. Advertising costs consist primarily of media, display, and print advertising, along with trade show costs and product demos and brochures. For the years ended December 31, 2010, 2009 and 2008 advertising costs were $2.1 million, $1.5 million and $1.6 million, respectively.
Cash Equivalents
The Company considers all highly liquid investments purchased with an original or remaining maturity of three months or less at the date of purchase to be cash equivalents.
Investments
The Company classifies, at the date of acquisition, its investments into categories in accordance with applicable GAAP for investments in debt and equity securities. The Company’s investment policy requires that the held-to-maturity investments, including cash and investments, not exceed a maximum weighted-average maturity of 12 months. In addition, the policy mandates that an individual investment must have a maturity of less than 24 months, with no more than 20% of the total portfolio exceeding 18 months. Realized gains and losses, and interest and dividends on all securities were included in other income (expense), net in the Consolidated Statements of Operations.
Accounts Receivable
Trade accounts receivable are stated net of an allowance for doubtful accounts. An allowance for doubtful accounts is maintained for estimated losses resulting from the inability of customers to make required payments. Management reviews the allowance for doubtful accounts quarterly for reasonableness and adequacy. If the financial condition of the Company’s customers were to deteriorate resulting in an impairment of their ability to make payments, additional provisions for
56
uncollectible accounts receivable may be required. In the event the Company determined that a smaller or larger reserve was appropriate, it would record a credit or a charge in the period in which such determination is made. In addition to customer accounts that are specifically reserved for, the Company maintains a non-specific bad debt reserve for all customers based on a variety of factors, including the length of time receivables are past due, trends in overall weighted average risk rating of the total portfolio, macroeconomic conditions, significant events and historical experience. Typically, this non-specific bad debt reserve amounts to at least 1% of quarterly revenues. The Company’s customers are concentrated in the technology industry and the collection of its accounts receivable are directly associated with the operational results of the industry.
Inventories
Inventories are stated at the lower of cost, determined on the first-in, first-out (FIFO) basis, or market, net of an inventory valuation allowance. The Company uses a standard cost methodology to determine its cost basis for its inventories. The Company evaluates inventory on a quarterly basis for obsolete or slow-moving items to ascertain if the recorded allowance is reasonable and adequate. Inventory is written down for estimated obsolescence or unmarketable inventory equal to the difference between the cost of inventory and the estimated net realizable value based upon assumptions about future demand and market conditions. Our inventory valuation allowances establish a new cost basis for inventory.
Long-Lived Assets
Long-lived assets, such as property and equipment and definite-life intangible assets are evaluated for impairment whenever events or changes in circumstances indicate the carrying value of an asset may not be recoverable. The Company assesses the impairment of the assets based on the undiscounted future cash flow the assets are expected to generate compared to the carrying value of the assets. If the carrying amount of the assets is determined not to be recoverable, a write-down to fair value is recorded. Management estimates future cash flows using assumptions about expected future operating performance. Management’s estimates of future cash flows may differ from actual cash flow due to, among other things, technological changes, economic conditions or changes to the Company’s business operations.
Goodwill represents the excess of cost over the assigned value of the net assets in connection with all acquisitions. Goodwill is reviewed for impairment during the fourth quarter as well as when certain triggering events suggest impairment has occurred. During the fourth quarter of 2008, the Company impaired its entire amount of previously recorded goodwill in the amount of $67.3 million. As of December 31, 2010 and 2009, the Company had $160,000 and zero goodwill balances recorded, respectively.
Intangible assets with estimable useful lives are amortized on a straight-line basis over their respective estimated life and reviewed for impairment whenever events or circumstances require management to do so.
Property and Equipment
Property and equipment is recorded at historical cost and generally depreciated or amortized on a straight-line basis according to the table below. In certain circumstances where the Company is aware that an asset’s life differs from the general guidelines set forth in its policy, management adjusts its depreciable life accordingly, to ensure that expense is being recognized over the appropriate future periods.
Machinery, equipment, furniture and fixtures | 5 years | |
Software, computer hardware and manufacturing test fixtures | 3 years | |
Engineering demonstration products and samples | 1 year | |
Leasehold improvements | Lesser of the lease term or estimated useful lives |
Ordinary maintenance and repair expenses are expensed when incurred.
Accounting for Leases
The Company leases all of its facilities, certain office equipment and vehicles under non-cancelable operating leases that expire at various dates through 2020, along with options that permit renewals for additional periods. Rent escalations are considered in the determination of straight-line rent expense for operating leases. Leasehold improvements made at the inception of or during the lease are amortized over the shorter of the asset life or the lease term.
57
Asset Retirement Obligations
The Company leases all of its facilities under various operating leases, some of which contain clauses that require the Company to restore the leased facility to its original state at the end of the lease term. Any identified material asset retirement obligation is initially measured at the fair value and recorded as a liability with a corresponding increase in the carrying amount of the underlying property. Subsequently, the asset retirement obligation would accrete until the time the retirement obligation is expected to settle while the asset retirement cost is amortized over the useful life of the underlying property. As of December 31, 2009 the Company identified $75,000 of asset retirement obligations, which is included in other long-term liabilities, net in the accompanying Consolidated Balance Sheets. During the fourth quarter of 2010, the Company renegotiated its Hillsboro lease and as a result of the amendment to this lease the asset retirement obligation was removed, and therefore the related liability was reversed.
Accrued Restructuring and Other Charges
For the years ended December 31, 2010, 2009 and 2008, expenses associated with exit or disposal activities are recognized when probable and estimable because the Company has a history of paying severance benefits. For leased facilities that were no longer used, an amount equal to the total future lease obligations from the date of vacating the premises through the expiration of the lease, net of any future sublease income, was recorded as a part of restructuring charges.
Warranty
The Company provides for the estimated cost of product warranties at the time it recognizes revenue. Products are generally sold with warranty coverage for a period of 24 months after shipment. On a quarterly basis the Company assesses the reasonableness and adequacy of the warranty liability and adjusts such amounts as necessary. Warranty reserves are included in other accrued liabilities in the accompanying Consolidated Balance Sheets as of December 31, 2010 and 2009.
Research and Development
Research, development and engineering costs are expensed as incurred. R&D expenses consist primarily of salary, bonuses and benefits for product development staff, and cost of design and development supplies and equipment, net of reimbursements for non-recurring engineering services.
Income Taxes
Income tax accounting requires the recognition of deferred tax assets and liabilities for the expected future tax consequences of temporary differences between the financial statement carrying amounts and tax bases of assets and liabilities. Valuation allowances are established to reduce deferred tax assets if it is “more likely than not” that all or portion of the asset will not be realized due to inability to generate sufficient taxable income in the relevant period to utilize the deferred tax asset. Tax law and rate changes are reflected in the period such changes are enacted. The Company recognizes uncertain tax positions after evaluating whether certain tax positions are more likely than not to be sustained by taxing authorities. In addition, the Company recognizes potential accrued interest and penalties related to unrecognized tax benefits within its global operations in income tax expense.
Fair Value of Financial Assets and Liabilities
The Company measures at fair value certain financial assets and liabilities, including cash equivalents, short-term investments, its ARS settlement right, and the cash surrender value of life insurance contracts. GAAP specifies a hierarchy of valuation techniques based on whether the inputs to those valuation techniques are observable or unobservable. Observable inputs reflect market data obtained from independent sources, while unobservable inputs reflect the Company’s market assumptions. These two types of inputs have created the following fair-value hierarchy:
Level 1—Quoted prices for identical instruments in active markets;
Level 2—Quoted prices for similar instruments in active markets, quoted prices for identical or similar instruments in markets that are not active, and model-derived valuations in which all significant inputs and significant value drivers are observable in active markets; and
58
Level 3—Valuations derived from valuation techniques in which one or more significant inputs or significant value drivers are unobservable.
Comprehensive Income (Loss)
The Company reports accumulated other comprehensive income (loss) in its Consolidated Balance Sheets. Comprehensive income (loss) includes net income (loss), translation adjustments and unrealized gains (losses) on hedging instruments. The cumulative translation adjustments consist of unrealized gains (losses) for foreign currency translation.
Stock-Based Compensation
Stock-based compensation expense for all stock-based compensation awards is based on the estimated grant-date fair value. The Company uses the Black-Scholes model to measure the grant date fair value of stock options and ESPP shares. The Company recognizes these compensation costs on a straight-line basis over the requisite service period of the award. The grant date fair value of stock options that are expected to vest is recognized on a straight-line basis over the requisite service period, which is equal to the option vesting period which is, generally, three years. The grant date fair value of ESPP shares that are expected to vest is recognized on a straight-line basis over the requisite service period, which is generally, 18 months, subject to modification at the date of purchase due to the ESPP look-back feature. The grant date fair value of restricted stock units issued under the 2007 stock plan that are expected to vest is recognized on a straight-line basis over the requisite service period, which is three years. The estimate of the number of options, ESPP shares and restricted stock units issued under the 2007 stock plan expected to vest is determined based on historical experience.
The Company computes the grant date fair value of restricted stock units granted under the LTIP and 2007 Stock Plan as the closing price of RadiSys shares as quoted on the NASDAQ Global Select Market on the earlier of the date of grant or the first date of the service period. The grant date fair value of restricted stock units, issued under the LTIP, are expensed ratably over the measurement period of the award. The estimated number of restricted stock units, issued under the LTIP, expected to vest is based upon financial results of the Company as compared to the performance goals set for the award and is adjusted quarterly.
Net income (loss) per share
Basic earnings per share amounts are computed based on the weighted-average number of common shares outstanding. Diluted earnings per share amounts incorporate the incremental shares issuable upon assumed exercise of stock options, incremental shares associated with the assumed vesting of restricted stock and the assumed conversion of the Company’s convertible notes, as if the conversion to common shares had occurred at the beginning of the fiscal year and when such conversion would have a dilutive effect. When the conversion of the Company’s convertible notes are dilutive earnings have also been adjusted for interest expense foregone on the convertible notes.
Derivatives
During 2008, the Company began to enter into forward foreign currency exchange contracts for the Canadian Dollar to reduce the impact of foreign currency exchange risks where natural hedging strategies could not be effectively employed.
The Company’s activities expose it to a variety of market risks, including the effects of changes in foreign currency exchange rates. The Company manages these risks through the use of forward exchange contracts, designated as foreign-currency cash flow hedges, in an attempt to reduce the potentially adverse effects of foreign currency exchange rate fluctuations that occur in the normal course of business. As such, the Company’s hedging activities are all employed solely for risk management purposes. All hedging transactions are conducted with, in the opinion of management, financially stable and reputable financial institutions.
These derivatives are recognized on the balance sheet at their fair value. Unrealized gain positions are recorded as other current assets and unrealized loss positions are recorded as other current liabilities. Changes in the fair values of the outstanding derivatives that are highly effective are recorded in other comprehensive income until net income (loss) is affected by the variability of the cash flows of the hedged transaction. Typically, hedge ineffectiveness could result when the amount of the Company’s hedge contracts exceed the Company’s forecasted or actual transactions for which the hedge contracts were designed to hedge. Once a hedge contract matures the associated gain (loss) on the contract will remain in other comprehensive
59
income until the underlying hedged transaction affects net income (loss), at which time the gain (loss) will be recorded to the expense line item being hedged, which is primarily R&D. The Company only enters into derivative contracts in order to hedge foreign currency exposure. If the Company entered into a contract for speculative reasons or if the Company’s current hedge position becomes ineffective, changes in the fair values of the derivatives would be recognized in earnings in the current period.
Foreign currency translation
Assets and liabilities of international operations, using a functional currency other than the U.S. dollar, are translated into U.S. dollars at exchange rates as of December 31, 2010 and 2009. Income and expense accounts are translated into U.S. dollars at the actual daily rates of exchange prevailing during the period. Adjustments resulting from translating foreign functional currency financial statements into U.S. dollars are recorded as a separate component in shareholders’ equity. Foreign exchange transaction gains and losses are included in other expense, net, in the Consolidated Statements of Operations. Foreign currency exchange rate fluctuations resulted in a net transaction loss of $177,000 and $195,000 for the years ended December 31, 2010 and 2009, respectively. Foreign currency exchange rate fluctuations resulted in a net transaction gain of $193,000 for the year ended December 31, 2008.
Recent Accounting Pronouncements
In January 2010, the FASB issued Accounting Standard Update ("ASU") No. 2010−06, "Improving Disclosures about Fair Value Measurements" ("ASU 2010−06"), which amended standards to require additional fair value disclosures. These amended standards require disclosures about inputs and valuation techniques used to measure fair value as well as disclosures about significant transfers, beginning in the first quarter of 2010. Additionally, these amended standards require presentation of disaggregated activity within the reconciliation for fair value measurements using significant unobservable inputs (Level 3), beginning in the first quarter of 2011. The Company adopted the applicable portion of the ASU 2010−06 during the three months ended March 31, 2010. The implementation of this portion of ASU 2010−06 did not have a material impact on the Company’s financial position, financial performance, or cash flows; however, it changed the way in which the Company discloses information regarding fair value measurements. The implementation of the remaining portions of this standard will not have a material impact on the Company’s financial position, financial performance, or cash flows; however, it will change the way in which the Company discloses information regarding fair value measurements.
In April 2010, the FASB issued ASU 2010-17, "Revenue Recognition—Milestone Method" ("ASU 2010-17"), which updated its guidance related to the milestone method of revenue recognition. The update provides guidance on the criteria that should be met for determining whether the milestone method of revenue recognition is appropriate. The Company can recognize consideration that is contingent upon achievement of a milestone in its entirety as revenue in the period in which the milestone is achieved only if the milestone meets all criteria to be considered substantive. The updated guidance became effective on a prospective basis for milestones achieved in fiscal years, and interim periods within those years beginning on or after June 15, 2010, with early adoption permitted. The Company is currently assessing the future impact of this new accounting update to its Consolidated Financial Statements.
In December 2010, the FASB issued ASU No. 2010-28, "Intangibles—Goodwill and Other (Topic 350)," ("ASU 2010-28"), which amends ASC Topic 350. ASU 2010-28 clarifies the requirement to test for the impairment of goodwill. ASC Topic 350 has required that goodwill be tested for impairment if the carrying amount of a reporting unit exceeds its fair value. Under ASU 2010-28, when the carrying amount of a reporting unit is zero or negative an entity must assume that it is more likely than not that a goodwill impairment exists, perform an additional test to determine whether goodwill has been impaired and calculate the amount of that impairment. The modifications to ASC Topic 350 resulting from the issuance of ASU 2010-28 are effective for fiscal years beginning after December 15, 2010 and interim periods within those years. Early adoption is not permitted. The Company is currently assessing the future impact of this new accounting update to its Consolidated Financial Statements.
In December 2010, the FASB issued ASU No. 2010-29, "Business Combinations (Topic 805)—Disclosure of Supplementary Pro Forma Information for Business Combinations," ("ASU 2010-29"). This standard update clarifies that, when presenting comparative financial statements, SEC registrants should disclose revenue and earnings of the combined entity as though the current period business combinations had occurred as of the beginning of the comparable prior annual reporting period only. The update also expands the supplemental pro forma disclosures to include a description of the nature and amount of material, nonrecurring pro forma adjustments directly attributable to the business combination included in the reported pro
60
forma revenue and earnings. ASU 2010-29 is effective prospectively for material (either on an individual or aggregate basis) business combinations entered into in fiscal years beginning on or after December 15, 2010. The Company is currently assessing the future impact of this new accounting update to its Consolidated Financial Statements.
Note 2—Cash Equivalents and Investments
As of December 31, 2010, the Company held no cash equivalents or investments.
The following table summarizes the fair value and unrealized gains and losses for the Company's cash equivalents and short-term investments and ARS settlement right as of December 31, 2009 (in thousands):
Amortized Cost | Gross Unrealized Gains | Gross Unrealized Losses | Fair Value | |||||||||||||
December 31, 2009 | ||||||||||||||||
Cash Equivalents | ||||||||||||||||
Money market mutual funds (A) | $ | 15,885 | $ | — | $ | — | $ | 15,885 | ||||||||
Short-term investments and ARS settlement right | ||||||||||||||||
Auction rate securities | $ | 54,321 | $ | — | $ | — | $ | 54,321 | ||||||||
ARS settlement right | 7,833 | — | — | 7,833 | ||||||||||||
Total short-term investments and ARS settlement right | $ | 62,154 | $ | — | $ | — | $ | 62,154 | ||||||||
___________________________
(A) | Balance included $826,000 in money market mutual funds restricted by the Company’s investment bank. All restricted amounts were held as collateral by the Company’s investment bank unless the bank permitted withdrawal of all or part of such amounts. |
As of December 31, 2009, the Company held investments in auction rate securities (“ARS”), the majority of which represented interests in collateralized debt obligations supported by pools of government-backed student loans with S&P AAA or Moody’s Aaa ratings at the time of purchase. During the first quarter of 2008, the Company’s portfolio of ARS experienced multiple failed auctions as the amount of securities submitted for sale exceeded the amount of purchase orders. An auction failure, which is not a default in the underlying debt instrument, occurs when there are more sellers than buyers at a scheduled interest rate auction date and parties desiring to sell their auction rate securities are unable to do so. During the fourth quarter of 2008, the Company accepted a settlement offer from its investment bank, UBS AG, associated with the failed auctions. Under the terms of the offer, the Company had the right to require the bank to repurchase at par value its ARS investments at any time between June 30, 2010 and June 30, 2012. As the Company planned to require UBS AG to repurchase its ARS on June 30, 2010, these investments were classified as short-term investments. For its ARS settlement right, the Company elected the fair value option for financial assets and financial liabilities. Management elected the fair value option for the ARS settlement right in order to quantify its agreement with UBS AG, as it guaranteed settlement at par value, which essentially offset any impairment on its ARS.
The Company recorded its ARS and corresponding settlement right at fair value, using the income approach, in accordance with the applicable GAAP using level 3 inputs, as defined in Note 3—Fair Value of Financial Instruments. The Company considered various inputs to estimate the fair value of its ARS at December 31, 2009, including the estimated time believed to allow the market for such investments to recover, projected estimates of future risk-free rates, as well as premiums designed to account for liquidity and credit risks associated with its ARS holdings.
The Company determined the fair value of its ARS settlement right based on the difference between the estimated fair value of the ARS and the par value of the ARS. This difference was then discounted based on the future date when the settlement right was expected to be exercised to account for the time value of money and to reflect the degree of credit risk associated with UBS. The discount rate used took into consideration the risk free rate as well as UBS AG’s credit quality.
On June 30, 2010, the Company exercised its settlement right with UBS AG and as a result the investment bank repurchased the Company's remaining balance of ARS. On July 1, 2010, the transaction settled and the Company had no outstanding balances on its UBS line of credit nor any restricted money market mutual funds. The Company recorded net gains of $21,000 during the year ended December 31, 2010 resulting from the exercise of its settlement right. These gains are included in other income, net in the accompanying Consolidated Statement of Operations.
61
Note 3—Fair Value of Financial Instruments
The Company measures at fair value certain financial assets and liabilities, including cash equivalents, short-term investments, its ARS settlement right, and the cash surrender value of life insurance contracts. GAAP specifies a hierarchy of valuation techniques based on whether the inputs to those valuation techniques are observable or unobservable. Observable inputs reflect market data obtained from independent sources, while unobservable inputs reflect the Company’s market assumptions. These two types of inputs have created the following fair-value hierarchy:
Level 1—Quoted prices for identical instruments in active markets;
Level 2—Quoted prices for similar instruments in active markets, quoted prices for identical or similar instruments in markets that are not active, and model-derived valuations in which all significant inputs and significant value drivers are observable in active markets; and
Level 3—Valuations derived from valuation techniques in which one or more significant inputs or significant value drivers are unobservable.
The following table summarizes the fair value measurements as of December 31, 2010, for the Company’s financial instruments (in thousands):
Fair Value Measurements as of December 31, 2010 | ||||||||||||||||
December 31, 2010 | Level 1 | Level 2 | Level 3 | |||||||||||||
Cash surrender value of life insurance contracts | $ | 3,618 | $ | — | $ | 3,618 | $ | — | ||||||||
Foreign currency forward contracts | 432 | — | 432 | — | ||||||||||||
Total | $ | 4,050 | $ | — | $ | 4,050 | $ | — | ||||||||
The following table summarizes the fair value measurements as of December 31, 2009, for the Company’s financial instruments, including its ARS (in thousands):
Fair Value Measurements as of December 31, 2009 | ||||||||||||||||
December 31, 2009 | Level 1 | Level 2 | Level 3 | |||||||||||||
Cash equivalents | $ | 15,885 | $ | 15,885 | $ | — | $ | — | ||||||||
Short-term investments | 54,321 | — | — | 54,321 | ||||||||||||
ARS settlement right | 7,833 | — | — | 7,833 | ||||||||||||
Cash surrender value of life insurance contracts | 3,178 | — | 3,178 | — | ||||||||||||
Foreign currency forward contracts | 842 | — | 842 | — | ||||||||||||
Total | $ | 82,059 | $ | 15,885 | $ | 4,020 | $ | 62,154 | ||||||||
The following tables outline changes in the fair value of the Company’s ARS and ARS settlement right, where fair value is determined using Level 3 inputs (in thousands):
Fair Value | ||||||||
Short-term Investments | ARS Settlement Right | |||||||
Balance as of December 31, 2008 | $ | 51,213 | $ | 11,071 | ||||
Unrealized gain (loss) (A) | 3,658 | (3,238 | ) | |||||
Sales of ARS | (550 | ) | — | |||||
Balance as of December 31, 2009 | $ | 54,321 | $ | 7,833 | ||||
Realized gain (A) | 7,854 | — | ||||||
Exercise of ARS settlement right (B) | — | (7,833 | ) | |||||
Sales of ARS | (62,175 | ) | — | |||||
Balance as of December 31, 2010 | $ | — | $ | — | ||||
62
__________________________
(A) | Refer to Note 2—Cash Equivalents and Investments for discussion of the inputs used in determining the appropriate fair values for the Company’s ARS and ARS settlement right. Unrealized gains on the Company’s ARS, which totaled $3.7 million for the year ended December 31, 2009, are included in other income, net in the Company’s Consolidated Statement of Operations. Realized gains on the Company’s ARS which totaled $7.9 million for the year ended December 31, 2010, are included in other expense, net in the Company’s Consolidated Statement of Operations. |
(B) | Valuation of the Company's ARS settlement right was performed using a present value approach on the difference between the estimated fair value and the par value of the ARS investments. Therefore, there was an inverse relationship between changes in the value of the Company's ARS investment and its settlement right. Unrealized losses on the Company's ARS settlement right, which totaled $3.2 million for the year ended December 31, 2009, are included in other income, net in the Company’s Consolidated Statement of Operations. Realized losses on the Company's ARS settlement right, which totaled $7.8 million for the year ended December 31, 2010, are included in other expense, net in the Company’s Consolidated Statement of Operations. |
Note 4—Accounts Receivable and Other Receivables
Accounts receivable balances consisted of the following (in thousands):
December 31, 2010 | December 31, 2009 | |||||||
Accounts receivable, gross | $ | 43,788 | $ | 45,580 | ||||
Less: allowance for doubtful accounts | (933 | ) | (966 | ) | ||||
Accounts receivable, net | $ | 42,855 | $ | 44,614 | ||||
Accounts receivable at December 31, 2010 and 2009 primarily consisted of sales to the Company’s customers which are generally based on standard terms and conditions. The Company recorded the following activity in allowance for doubtful accounts (in thousands):
For the Years Ended December 31, | ||||||||||||
2010 | 2009 | 2008 | ||||||||||
Allowance for doubtful accounts, beginning of the year | $ | 966 | $ | 970 | $ | 884 | ||||||
Charged to costs and expenses | — | — | 168 | |||||||||
Less: write-offs, net of recoveries | (33 | ) | (4 | ) | (82 | ) | ||||||
Remaining allowance, end of the year | $ | 933 | $ | 966 | $ | 970 | ||||||
As of December 31, 2010 and 2009, other receivables were $1.7 million and $3.7 million, respectively. Other receivables consisted primarily of non-trade receivables including receivables for inventory transferred to the Company’s contract manufacturing partners. There is no revenue recorded associated with non-trade receivables.
Note 5—Inventories
Inventories consisted of the following (in thousands):
December 31, 2010 | December 31, 2009 | |||||||
Raw materials | $ | 8,204 | $ | 14,066 | ||||
Work-in-process | — | 985 | ||||||
Finished goods | 10,521 | 5,066 | ||||||
18,725 | 20,117 | |||||||
Less: inventory valuation allowance | (3,547 | ) | (4,792 | ) | ||||
Inventories, net | $ | 15,178 | $ | 15,325 | ||||
63
December 31, 2010 | December 31, 2009 | |||||||
(in thousands) | ||||||||
Inventory deposit (A) | $ | 8,468 | $ | 3,024 | ||||
Less: inventory deposit valuation allowance | (2,274 | ) | (898 | ) | ||||
Inventory deposit, net | $ | 6,194 | $ | 2,126 | ||||
________________________________
(A) | The Company is contractually obligated to reimburse its contract manufacturers for the cost of excess inventory purchased based on the Company’s forecasted demand when there is no alternative use. The Company’s inventory deposit represents a cash deposit paid to its contract manufacturers for inventory in excess of near term demand. The deposit is recorded net of adverse purchase commitment liabilities, and therefore the net balance of the deposit represents inventory the Company believes will be utilized. The deposit will be applied against future adverse purchase commitments owed to the Company’s contract manufacturers or reduced based on the usage of inventory. See Note 14—Commitments and Contingencies for additional information regarding the Company’s adverse purchase commitment liability. |
Consigned inventory is held at third-party locations, including the Company’s contract manufacturing partners and customers. The Company retains title to the inventory until purchased by the third-party. Consigned inventory, consisting of raw materials and finished goods, was $3.0 million and $3.0 million at December 31, 2010 and 2009, respectively.
During the years ended December 31, 2010, 2009 and 2008 the Company recorded provision for excess and obsolete inventory of $2.9 million, $3.0 million and $3.7 million, respectively.
The following is a summary of the change in the Company’s inventory valuation allowance (in thousands):
For the Years Ended December 31, | ||||||||
2010 | 2009 | |||||||
Inventory valuation allowance, beginning of the year | $ | 4,792 | $ | 11,251 | ||||
Usage: | ||||||||
Inventory scrapped | (1,625 | ) | (8,223 | ) | ||||
Inventory utilized | (1,225 | ) | (1,089 | ) | ||||
Subtotal—usage | (2,850 | ) | (9,312 | ) | ||||
Write-downs of inventory valuation | 2,899 | 2,995 | ||||||
Transfer from other liabilities (A) | 178 | 756 | ||||||
Transfer to inventory deposit valuation allowance | (1,376 | ) | (898 | ) | ||||
Inventory revaluation for standard cost changes | (96 | ) | — | |||||
Inventory valuation allowance, end of the year | $ | 3,547 | $ | 4,792 | ||||
____________________________
(A) | Transfer from other liabilities is related to obsolete inventory purchased from contract manufacturers during the year which was previously reserved for as an adverse purchase commitment. (Note 10—Other Accrued Liabilities and Note 14—Commitments and Contingencies.) |
64
Note 6—Property and Equipment
Property and equipment consisted of the following (in thousands):
December 31, 2010 | December 31, 2009 | |||||||
Land | $ | 644 | $ | — | ||||
Manufacturing equipment | 18,128 | 21,224 | ||||||
Office equipment and software | 26,152 | 26,825 | ||||||
Leasehold improvements | 5,975 | 6,294 | ||||||
50,899 | 54,343 | |||||||
Less: accumulated depreciation and amortization | (41,412 | ) | (44,417 | ) | ||||
Property and equipment, net | $ | 9,487 | $ | 9,926 | ||||
Depreciation and amortization expense for property and equipment for the years ended December 31, 2010, 2009 and 2008 was $5.1 million, $6.3 million and $6.2 million, respectively.
Note 7—Intangible Assets
The following tables summarize details of the Company’s total purchased intangible assets (dollar amounts in thousands):
Weighted Average Amortization Period (in years) | Gross | Accumulated Amortization | Net | ||||||||||||
December 31, 2010 | |||||||||||||||
Existing technology | 4.2 | $ | 40,915 | $ | (36,291 | ) | $ | 4,624 | |||||||
Technology licenses | 5.1 | 18,588 | (17,258 | ) | 1,330 | ||||||||||
Patents | 10.5 | 6,472 | (6,314 | ) | 158 | ||||||||||
Customer lists | 4.0 | 11,500 | (10,938 | ) | 562 | ||||||||||
Trade names | 6.0 | 3,636 | (3,222 | ) | 414 | ||||||||||
Total intangible assets | 4.6 | $ | 81,111 | $ | (74,023 | ) | $ | 7,088 | |||||||
December 31, 2009 | |||||||||||||||
Existing technology | 3.4 | $ | 38,315 | $ | (32,654 | ) | $ | 5,661 | |||||||
Technology licenses | 4.2 | 18,589 | (14,911 | ) | 3,678 | ||||||||||
Patents | 10.5 | 6,652 | (6,358 | ) | 294 | ||||||||||
Customer lists | — | 10,800 | (10,800 | ) | — | ||||||||||
Trade names | 5.7 | 3,636 | (2,549 | ) | 1,087 | ||||||||||
Total intangible assets | 4.1 | $ | 77,992 | $ | (67,272 | ) | $ | 10,720 | |||||||
Intangible assets amortization expense was $6.9 million, $9.1 million and $19.0 million for the years ended December 31, 2010, 2009 and 2008, respectively. The Company’s purchased intangible assets have lives ranging from one to 10 years. The Company reviews for impairment of all its purchased intangible assets whenever events or changes in circumstances indicate that the carrying amount of an asset may not be recoverable.
During 2008, general economic conditions as well as the decline in the Company’s stock price were considered triggering events that required the Company to re-perform an impairment test of its long lived assets, including intangible assets. The Company assesses the impairment of the assets based on the undiscounted future cash flow the assets are expected to generate compared to the carrying value of the assets. If the carrying amount of the assets is determined not to be recoverable, a write-down to fair value is recorded. Management estimates future cash flows using assumptions about expected future operating performance. For its long lived intangible assets, the Company determined no impairment existed, however, during its analysis, the remaining depreciable lives were reviewed for adequacy. The Company noted that expected future benefits derived from certain intangible assets of its Canadian subsidiary exceeded their remaining depreciable lives. Accordingly, an adjustment was made in order to match amortization expense over the period of expected future benefit. The intangible asset categories impacted were existing technology and customer lists. The adjustments to depreciable lives of the Company’s intangible assets
65
were treated as changes in estimates and their effects were recognized prospectively in our Consolidated Financial Statements, effective October 1, 2008.
The intangible asset balance within existing technology is primarily made up of one asset, which is related to technology acquired in the Company’s purchase of Convedia in 2007. In the quarter and year ended December 31, 2008, this prospective treatment resulted in a reduction in our amortization expense of $637,000. The balance within customer lists is also primarily associated with the Convedia acquisition. In the quarter and year ended December 31, 2008, this prospective treatment resulted in a reduction in our amortization expense of $1.0 million. In the quarter and year ended December 31, 2008, this prospective treatment resulted in a collective reduction in our amortization expense of $1.7 million. The impact of the change in estimate resulted in a pre-tax decrease to net loss of $1.7 million, and a pre-tax decrease in fully diluted loss per share of $0.08.
The estimated future amortization expense of purchased intangible assets as of December 31, 2010 is as follows (in thousands):
For the Years Ending December 31, | Estimated Intangible Amortization Amount | ||
2011 | $ | 4,370 | |
2012 | 1,337 | ||
2013 | 687 | ||
2014 | 467 | ||
2015 | 227 | ||
Total estimated future amortization expense | $ | 7,088 | |
Note 8—Other Assets
Other current assets consisted of the following (in thousands):
December 31, 2010 | December 31, 2009 | |||||||
Prepaid maintenance, rent and other | $ | 4,162 | $ | 3,193 | ||||
Assets held for sale | — | 644 | ||||||
Hedge derivative asset | 432 | 842 | ||||||
Income tax receivable, net | 18 | — | ||||||
Other current assets | $ | 4,612 | $ | 4,679 | ||||
Other assets consisted of the following (in thousands):
December 31, 2010 | December 31, 2009 | |||||||
Employee deferred compensation arrangement | $ | 3,618 | $ | 3,393 | ||||
2013 convertible senior notes debt issuance costs | 499 | 947 | ||||||
Other, net | 3,938 | 1,933 | ||||||
Goodwill | 160 | — | ||||||
Other assets, net | $ | 8,215 | $ | 6,273 | ||||
Employee deferred compensation arrangement represents the cash surrender value of insurance contracts purchased by the Company as part of its deferred compensation plan established in January 2001. Any elective deferrals by the eligible employees are invested in insurance contracts.
66
Note 9—Accrued Restructuring and Other Charges
Accrued restructuring is recorded in other accrued liabilities as of December 31, 2010 and 2009, and consisted of the following (in thousands):
December 31, 2010 | December 31, 2009 | |||||||
First quarter 2009 restructuring charge | $ | — | $ | 263 | ||||
Second quarter 2009 restructuring charge | 58 | 1,933 | ||||||
Fourth quarter 2009 restructuring charge | 182 | 829 | ||||||
Fourth quarter 2010 restructuring charge | 1,814 | — | ||||||
Total | $ | 2,054 | $ | 3,025 | ||||
The Company evaluates the adequacy of the accrued restructuring and other charges on a quarterly basis. As a result, the Company records reversals to the accrued restructuring charges in the period in which the Company determines that expected restructuring and other obligations are less than the amounts accrued.
First Quarter 2009 Restructuring
During the first quarter of 2009, the Company initiated a restructuring plan that included the elimination of 29 positions. The restructuring was initiated in an effort to lower the Company's overall cost structure in accordance with operating plan targets. Total costs of the first quarter 2009 restructuring activities included accrued severance obligations and healthcare benefits, which totaled $1.4 million. As of December 31, 2010, all activities associated with this restructuring were completed.
The following table summarizes the changes to the first quarter 2009 restructuring costs (in thousands):
Employee Termination and Related Costs | |||
Balance accrued as of December 31, 2009 | $ | 263 | |
Additions | — | ||
Reversals | (85 | ) | |
Expenditures | (178 | ) | |
Balance accrued as of December 31, 2010 | $ | — | |
Second Quarter 2009 Restructuring
During the second quarter of 2009, the Company initiated a restructuring plan that included the elimination of 115 positions and the relocation of eight employees as part of two strategic initiatives within manufacturing operations and engineering. As part of the initiative, the Company began a transition to a fully outsourced manufacturing model, which has transferred remaining manufacturing from its manufacturing plant in Hillsboro, Oregon to its manufacturing partners in Asia. The plan also included consolidating the Company’s North American R&D positions and programs, and specifically transferring projects from its design center in Boca Raton, Florida, to other existing R&D centers. To date, the Company has incurred total second quarter 2009 restructuring costs of $3.0 million which has consisted primarily of accrued severance obligations, healthcare benefits, relocation incentives and related payroll taxes as well as equipment moving costs.
During the year ended December 31, 2010, the Company incurred an additional $380,000 in expenses while it reversed $501,000 in previously estimated amounts associated with the second quarter 2009 restructuring plan. The additional costs consisted of $228,000 in employee severance, healthcare benefits and associated payroll costs along with the facilities related costs and legal fees of $152,000. Reversals consisted of $473,000 in previously estimated employee severance, healthcare benefits and associated payroll costs, primarily associated with retaining employees in new roles with the Company. In addition, the Company reversed $28,000 in facilities related expenses. This transition was substantially complete as of December 31, 2010.
67
The following table summarizes the changes to the second quarter 2009 restructuring costs (in thousands):
Employee Termination and Related Costs | Other | Total | ||||||||||
Balance accrued as of December 31, 2009 | $ | 1,885 | $ | 48 | $ | 1,933 | ||||||
Additions | 228 | 152 | 380 | |||||||||
Reversals | (473 | ) | (28 | ) | (501 | ) | ||||||
Expenditures | (1,582 | ) | (172 | ) | (1,754 | ) | ||||||
Balance accrued as of December 31, 2010 | $ | 58 | $ | — | $ | 58 | ||||||
Fourth Quarter 2009 Restructuring
During the fourth quarter of 2009, the Company initiated a restructuring plan that included the elimination of 22 positions at various locations throughout the company. The primary focus of this initiative was to align expenses with the Company’s 2010 operating plan objectives, which included the need to continue focusing on lowered costs. To date, the Company has incurred total fourth quarter 2009 restructuring costs of $709,000, which consisted primarily of severance and related payroll costs as well as healthcare benefits.
During the year ended December 31, 2010, the Company incurred an additional $136,000 in expenses while it reversed $309,000 in previously estimated amounts associated with the fourth quarter 2009 restructuring plan. The additional costs consisted of employee severance, healthcare benefits and associated payroll costs along with legal fees and foreign currency adjustments. Reversals consisted of changes in previously estimated expenses as well as the re-assignment of employees initially included in the restructuring plan. The Company expects all activities associated with this restructuring plan to be completed by the end of 2011.
The following table summarizes the changes to the fourth quarter 2009 restructuring costs (in thousands):
Employee Termination and Related Costs | |||
Balance accrued as of December 31, 2009 | $ | 829 | |
Additions | 136 | ||
Reversals | (309 | ) | |
Expenditures | (474 | ) | |
Balance accrued as of December 31, 2010 | $ | 182 | |
Fourth Quarter 2010 Restructuring
During the fourth quarter of 2010, the Company initiated a restructuring plan that included the elimination of 67 positions at various locations throughout the company. The primary focus of this initiative was to align expenses with the Company’s 2011 operating plan objectives, which included the need to reduce the Company's infrastructure associated with the maturity of the Company's legacy/traditional communications networks products, as well as the consolidation of it's contract manufacturers. During 2010, the Company incurred $2.0 million in charges associated with this restructuring plan, which consisted of severance and related payroll costs as well as healthcare benefits. The Company expects all activities associated with this restructuring plan to be substantially completed by the end of 2011.
The following table summarizes the changes to the fourth quarter 2010 restructuring costs (in thousands):
Employee Termination and Related Costs | |||
Balance accrued as of December 31, 2009 | $ | — | |
Restructuring and other costs | 1,968 | ||
Expenditures | (154 | ) | |
Balance accrued as of December 31, 2010 | $ | 1,814 | |
68
Note 10—Other Accrued Liabilities
Other accrued liabilities consisted of the following (in thousands):
December 31, 2010 | December 31, 2009 | |||||||
Accrued warranty reserve | $ | 3,025 | $ | 2,810 | ||||
Deferred compensation plan liability | 2,402 | 2,396 | ||||||
Adverse purchase commitments | 1,268 | 1,828 | ||||||
Accrued interest payable | 516 | 516 | ||||||
Accrued restructuring | 2,054 | 3,025 | ||||||
Income tax payable, net | 1,480 | 740 | ||||||
Other | 2,169 | 2,987 | ||||||
Other accrued liabilities | $ | 12,914 | $ | 14,302 | ||||
Note 11—Short-Term Borrowings
Silicon Valley Bank
The Company has a secured revolving line of credit agreement with Silicon Valley Bank ("SVB"), dated as of August 7, 2008 (as amended, the “Agreement”), which provides the Company with a two-year secured revolving credit facility of $30.0 million, which is subject to a borrowing base and secured by its accounts receivable. Borrowings under the Agreement bear interest at the prime rate, which was 3.25% as of December 31, 2010, or the LIBOR rate, which was 0.26% as of December 31, 2010, plus 1.25%, with either interest rate determined by the Company’s election. The Company is required to make interest payments monthly. The Company is further required to pay a commitment fee equal to 0.08% of the $30.0 million maximum borrowing limit on an annual basis, and to pay quarterly in arrears an unused facility fee in an amount equal to 0.375% per year of the unused amount of the facility. In addition, the credit facility provides sub-facilities for letters of credit and foreign exchange contracts to be issued on the Company’s behalf.
The credit facility requires the Company to make and maintain certain financial covenants, representations, warranties and other agreements that are customary in credit agreements of this type. The Agreement also requires the Company to maintain a minimum quarterly current ratio (current assets divided by the sum of current liabilities less deferred income plus the amount of outstanding advances and letters of credit) of 1.5 during the term of the agreement. Additionally, any quarterly EBITDA (earnings before interest, taxes, depreciation, amortization, stock based compensation, goodwill impairment charges, and deferred tax asset valuation charges, as defined in the Agreement) loss may not exceed $3.0 million in any one quarter. For quarterly periods beginning after January 1, 2009, the Company must maintain a positive rolling four quarter EBITDA. In addition, capital expenditures may not exceed $8.0 million in any fiscal year.
During the fourth quarter of 2010, the Company amended the Agreement with SVB. Among other amendments, the Company and SVB extended the term of the Agreement for another year to September 30, 2012. Additionally, the Company and SVB amended the non-formula borrowing base to a maximum amount of $30.0 million as long as the Company maintains a minimum quarterly current ratio of 2:1. The current ratio is calculated as current assets divided by the sum of current liabilities, including the outstanding aggregate amount of borrowings and letters of credit, less deferred income.
As of December 31, 2010 and 2009, the Company had no outstanding balances on the line of credit or letters of credit issued on its behalf. As of December 31, 2010, the Company was in compliance with all covenants, with a current ratio of 4:1, rolling four quarter EBITDA of $19.4 million and capital expenditures for 2010 of $4.1 million.
UBS
During the fourth quarter of 2008, the Company accepted a settlement offer from its investment bank, UBS AG, associated with failed auctions for its previously held ARS. Under the terms of the offer, the Company had the right to require the bank to repurchase at par value its ARS investments at any time between June 30, 2010 and June 30, 2012. Under the terms of the offer, UBS AG issued ARS settlement rights to the Company, which in addition to the terms discussed in Note 2—Cash Equivalents and Investments, also entitled the Company to receive no net cost loans from UBS AG, or its affiliates, for up to 75% of the market value of the Company’s ARS.
69
On June 30, 2010, the Company exercised its settlement right with UBS AG, which resulted in the repurchase by UBS AG of the Company's remaining ARS investments. On July 1, 2010, upon the settlement of the ARS investments sold to UBS AG, the Company repaid its line of credit with UBS AG in full. On July 2, 2010, the Company terminated its line of credit with UBS AG upon completion of all parties' obligations.
Note 12—Convertible Debt
2013 Convertible Senior Notes
During February 2008, the Company offered and sold in a public offering pursuant to the shelf registration statement $55.0 million aggregate principal amount of 2.75% convertible senior notes due 2013 (the “2013 convertible senior notes”). Interest is payable semi-annually, in arrears, on each August 15 and February 15, beginning on August 15, 2008, to the holders of record at the close of business on the preceding August 1 and February 1, respectively. The 2013 convertible senior notes mature on February 15, 2013. Holders of the 2013 convertible senior notes may convert their notes into a number of shares of the Company’s common stock determined as set forth in the indenture governing the notes at their option on any day to and including the business day prior to the maturity date. The 2013 convertible senior notes are initially convertible into 76.7448 shares of the Company’s common stock per $1,000 principal amount of the notes (which is equivalent to a conversion price of approximately $13.03 per share), subject to adjustment upon the occurrence of certain events. Upon the occurrence of a fundamental change, holders of the 2013 convertible senior notes may require the Company to repurchase some or all of their notes for cash at a price equal to 100% of the principal amount of the notes being repurchased, plus accrued and unpaid interest, if any. In addition, if certain fundamental changes occur, the Company may be required in certain circumstances to increase the conversion rate for any 2013 convertible senior notes converted in connection with such fundamental changes by a specified number of shares of the Company’s common stock. The 2013 convertible senior notes are the Company’s general unsecured obligations and rank equal in right of payment to all of its existing and future senior indebtedness, and senior in right of payment to the Company’s future subordinated debt. The Company’s obligations under the 2013 convertible senior notes are not guaranteed by, and are effectively subordinated in right of payment to all existing and future obligations of its subsidiaries and are effectively subordinated in right of payment to its future secured indebtedness to the extent of the assets securing such debt.
In connection with the issuance of the 2013 convertible senior notes, the Company entered into a capped call transaction with a hedge counterparty. The capped call transaction is expected to reduce the potential dilution upon conversion of the 2013 convertible senior notes in the event that the market value per share of the Company’s common stock, as measured under the terms of the capped call transaction, at the time of exercise is greater than the strike price of the capped call transaction of approximately $13.03. The strike price of the capped call transaction corresponds to the initial conversion price of the 2013 convertible senior notes and is subject to certain adjustments similar to those contained in the notes. The capped call transaction provides for net-share settlement in the event that the volume-weighted average price per share of the Company’s common stock on the settlement date exceeds the strike price of approximately $13.03 per share. In such event, the hedge counterparty would deliver to the Company a number of shares equal to a formula determined by the quotient resulting from (a) the shares being settled times the difference between the volume-weighted average price on the settlement date and the strike price of approximately $13.03 per share, divided by (b) the volume-weighted average price on the settlement date. If the volume-weighted average price on the settlement date equals or exceeds the cap price of $23.085 per share, the difference in (a) would be $23.085 minus $13.03, or $10.055. If the market value per share of the Company’s common stock exceeds the cap price of the capped call transaction of $23.085, as measured under the terms of the capped call transaction, the dilution mitigation under the capped call transaction will be limited, which means that there would be dilution to the extent that the then market value per share of the Company’s common stock exceeds the cap price of the capped call transaction. Although the capped call transaction covers approximately 4.2 million shares, in order to facilitate an orderly settlement process, the shares are divided into tranches of approximately 211,000 shares each, settling on the twenty consecutive trading days prior to the date of maturity of the Company’s convertible notes. Thus, on each settlement date, approximately 211,000 shares would be settled, assuming a volume-weighted average price on such settlement date of $23.085. Assuming a volume-weighted average price of $23.085, the hedge counterparty would deliver to the Company approximately 91,904 shares on each settlement date, calculated as follows: 211,000 x ($23.085 – $13.03)/$23.085 = 91,904.
During the fourth quarter of 2008, the Company repurchased $5.0 million aggregate principal amount of the 2013 convertible senior notes, with associated unamortized issuance costs of $196,000. The Company repurchased the notes in the open market for $3.1 million and, as a result, recorded a net gain of $1.7 million.
70
For the years ended December 31, 2010 and 2009, the effective interest rate for the 2013 convertible senior notes was approximately 3.6%. During the years ended December 31, 2010 and 2009, the Company incurred contractually stated interest costs totaling $1.4 million and $1.4 million, respectively. During the years ended December 31, 2010 and 2009, the Company incurred costs related to the amortization of issuance costs totaling $447,000 and $447,000, respectively.
As of December 31, 2010 and 2009, the Company had outstanding 2013 convertible senior notes with a face value of $50.0 million. As of December 31, 2010 and 2009, the fair value of the Company’s 2013 convertible senior notes was $49.1 million and $44.8 million, respectively.
Note 13—Hedging
The Company’s activities expose it to a variety of market risks, including the effects of changes in foreign currency exchange rates. The Company manages these risks through the use of forward exchange contracts, designated as foreign-currency cash flow hedges, in an attempt to reduce the potentially adverse effects of foreign currency exchange rate fluctuations that occur in the normal course of business. As such, the Company’s hedging activities are all employed solely for risk management purposes. All hedging transactions are conducted with, in the opinion of management, financially stable and reputable financial institutions. As of December 31, 2010 and 2009, and for the years ended December 31, 2010 and 2009, the only hedge instruments executed by the Company are associated with its exposure to fluctuations in the Canadian Dollar which result from obligations such as payroll and rent paid in Canadian Dollars.
These derivatives are recognized on the balance sheet at their fair value. Unrealized gain positions are recorded as other current assets and unrealized loss positions are recorded as other current liabilities. Changes in the fair values of the outstanding derivatives that are highly effective are recorded in other comprehensive income until net income is affected by the variability of the cash flows of the hedged transaction. Typically, hedge ineffectiveness could result when the amount of the Company’s hedge contracts exceed the Company’s forecasted or actual transactions for which the hedge contracts were designed to hedge. Once a hedge contract matures the associated gain (loss) on the contract will remain in other comprehensive income until the underlying hedged transaction affects net income (loss), at which time the gain (loss) will be recorded to the expense line item being hedged, which is primarily R&D. The Company only enters into derivative contracts in order to hedge foreign currency exposure. If the Company entered into a contract for speculative reasons or if the Company’s current hedge position becomes ineffective, changes in the fair values of the derivatives would be recognized in earnings in the current period.
The Company assesses, both at the inception of the hedge and on an ongoing basis, whether the derivatives that are used in hedging transactions have been highly effective in offsetting changes in the cash flows of hedged items and whether those derivatives are expected to remain highly effective in future periods. For the years ended December 31, 2010 and 2009 the Company had no hedge ineffectiveness.
During the year ended December 31, 2010, the Company entered into 56 new foreign currency forward contracts, with total contractual values of $9.1 million. During the year ended December 31, 2009, the Company entered into 56 new foreign currency forward contracts, with total contractual values of $11.8 million.
A summary of the aggregate contractual or notional amounts, balance sheet location and estimated fair values of derivative financial instruments designated as cash flow hedges at December 31, 2010 is as follows (in thousands):
Contractual / Notional Amount | Consolidated Balance Sheet Classification | Estimated Fair Value | ||||||||||||
Asset | (Liability) | |||||||||||||
Foreign currency forward exchange contracts | $ | 12,547 | Other current assets | $ | 432 | $ | — | |||||||
A summary of the aggregate contractual or notional amounts, balance sheet location and estimated fair values of derivative financial instruments designated as cash flow hedges at December 31, 2009 is as follows (in thousands):
Contractual / Notional Amount | Consolidated Balance Sheet Classification | Estimated Fair Value | ||||||||||||
Asset | (Liability) | |||||||||||||
Foreign currency forward exchange contracts | $ | 11,224 | Other current assets | $ | 842 | $ | — | |||||||
71
The effect of derivative instruments on the Consolidated Financial Statements for the year ended December 31, 2010 was as follows (in thousands):
Type of Cash Flow Hedge | Effective Portion | Ineffective Portion | ||||||||||||||
Hedge Gain (Loss) Recognized in Other Comprehensive Income | Consolidated Statement of Operations Classification of Gain (Loss) Reclassified from Accumulated Other Comprehensive Income | Hedge Gain (Loss) Reclassified from Accumulated Other Comprehensive Income | Consolidated Statement of Operations Classification of Gain (Loss) Recognized | Hedge Gain (Loss) Recognized | ||||||||||||
Foreign currency forward exchange contracts | $ | (354 | ) | |||||||||||||
Cost of sales | $ | 104 | None | $ | — | |||||||||||
Research and development | 705 | None | — | |||||||||||||
Selling, general and administrative | 162 | None | — | |||||||||||||
The effect of derivative instruments on the Consolidated Financial Statements for the year ended December 31, 2009 was as follows (in thousands):
Type of Cash Flow Hedge | Effective Portion | Ineffective Portion | ||||||||||||||
Pretax Hedge Gain (Loss) Recognized in Other Comprehensive Income | Consolidated Statement of Operations Classification of Gain (Loss) Reclassified from Accumulated Other Comprehensive Income | Hedge Gain (Loss) Reclassified from Accumulated Other Comprehensive Income | Consolidated Statement of Operations Classification of Gain (Loss) Recognized | Hedge Gain (Loss) Recognized | ||||||||||||
Foreign currency forward exchange contracts | $ | 1,606 | ||||||||||||||
Cost of sales | $ | (81 | ) | None | $ | — | ||||||||||
Research and development | (573 | ) | None | — | ||||||||||||
Selling, general and administrative | (150 | ) | None | — | ||||||||||||
Over the next twelve months, the Company expects to reclassify into earnings a gain of approximately $398,000, currently recorded as other comprehensive income, as a result of the maturity of currently held forward exchange contracts.
The bank counterparties in these contracts expose the Company to credit-related losses in the event of their nonperformance. However, to mitigate that risk, the Company only contracts with counterparties who meet its minimum requirements regarding counterparty credit worthiness. In addition, the Company monitors credit ratings, credit spreads and potential downgrades prior to entering into any new hedging contracts.
Note 14—Commitments and Contingencies
Operating Leases
RadiSys leases most of its facilities, certain office equipment, and vehicles under non-cancelable operating leases which require minimum lease payments expiring from one to four years after December 31, 2010. Amounts of future minimum lease commitments in each of the five years ending December 31, 2011through 2015 and thereafter, are as follows (in thousands):
For the Years Ending December 31, | Future Minimum Lease Payments | ||
2011 | $ | 2,755 | |
2012 | 2,401 | ||
2013 | 2,115 | ||
2014 | 1,819 | ||
2015 and thereafter | 6,740 | ||
Total future minimum lease commitments | $ | 15,830 | |
72
Rent expense totaled $4.2 million, $5.2 million and $5.4 million for the years ended December 31, 2010, 2009 and 2008, respectively.
During 2010, the Company renegotiated several of its leases, most notably it's lease for its headquarters located in Hillsboro, Oregon, extending the lease to June 30, 2020 as well as a reduction of approximately 26,000 square feet of plant space.
Adverse Purchase Commitments
The Company is contractually obligated to reimburse its contract manufacturers for the cost of excess inventory used in the manufacture of the Company’s products, if there is no alternative use. This liability, referred to as adverse purchase commitments, is provided for in other accrued liabilities in the accompanying balance sheets. Estimates for adverse purchase commitments are derived from reports received on a quarterly basis from the Company’s contract manufacturers. Increases to this liability are charged to cost of goods sold. When and if the Company takes possession of inventory reserved for in this liability, the liability is transferred from other accrued liabilities (Note 10—Other Accrued Liabilities) to the excess and obsolete inventory valuation allowance (Note 5—Inventories).
Guarantees and Indemnification Obligations
As permitted under Oregon law, the Company has agreements whereby it indemnifies its officers, directors and certain finance employees for certain events or occurrences while the officer, director or employee is or was serving in such capacity at the request of the Company. The term of the indemnification period is for the officer’s, director’s or employee’s lifetime. The maximum potential amount of future payments the Company could be required to make under these indemnification agreements is unlimited; however, the Company has a Director and Officer insurance policy that limits its exposure and enables the Company to recover a portion of any future amounts paid. To date, the Company has not incurred any costs associated with these indemnification agreements and, as a result, management believes the estimated fair value of these indemnification agreements is minimal. Accordingly, the Company has not recorded any liabilities for these agreements as of December 31, 2010.
The Company enters into standard indemnification agreements in its ordinary course of business. Pursuant to these agreements, the Company indemnifies, holds harmless, and agrees to reimburse the indemnified party for losses suffered or incurred by the indemnified party, generally the Company’s business partners or customers, in connection with patent, copyright or other intellectual property infringement claims by any third party with respect to the Company’s current products, as well as claims relating to property damage or personal injury resulting from the performance of services by us or the Company’s subcontractors. The maximum potential amount of future payments the Company could be required to make under these indemnification agreements is generally limited. Historically, the Company’s costs to defend lawsuits or settle claims relating to such indemnity agreements have been minimal and accordingly management believes the estimated fair value of these agreements is immaterial.
The Company provides for the estimated cost of product warranties at the time it recognizes revenue. Products are generally sold with warranty coverage for a period of 24 months after shipment. Parts and labor are covered under the terms of the warranty agreement. The workmanship of the Company’s products produced by contract manufacturers is covered under warranties provided by the contract manufacturer for a specified period of time ranging from 12 to 15 months. The warranty provision is based on historical experience by product family. The Company engages in extensive product quality programs and processes, including actively monitoring and evaluating the quality of its components suppliers; however ongoing failure rates, material usage and service delivery costs incurred in correcting product failure, as well as specific product class failures out of the Company’s baseline experience affect the estimated warranty obligation. If actual product failure rates, material usage or service delivery costs differ from estimates, revisions to the estimated warranty liability would be required.
73
The following is a summary of the change in the Company’s warranty accrual reserve (in thousands):
For the Years Ended December 31, | ||||||||
2010 | 2009 | |||||||
Warranty liability balance, beginning of the year | $ | 2,810 | $ | 3,072 | ||||
Product warranty accruals | 3,543 | 3,729 | ||||||
Adjustments for payments made | (3,328 | ) | (3,991 | ) | ||||
Warranty liability balance, end of the year | $ | 3,025 | $ | 2,810 | ||||
The warranty liability balance is included in other accrued liabilities in the accompanying Consolidated Balance Sheets as of December 31, 2010 and 2009.
Note 15—Basic and Diluted Loss per Share
A reconciliation of the numerator and the denominator used to calculate basic and diluted loss per share is as follows (in thousands, except per share amounts):
For the Years Ended December 31, | ||||||||||||
2010 | 2009 | 2008 | ||||||||||
Numerator—Basic | ||||||||||||
Net loss, basic | $ | (369 | ) | $ | (42,567 | ) | $ | (67,262 | ) | |||
Numerator—Diluted | ||||||||||||
Net loss, basic | $ | (369 | ) | $ | (42,567 | ) | $ | (67,262 | ) | |||
Interest on convertible senior notes, net of tax benefit (A) | — | — | — | |||||||||
Net loss, diluted | $ | (369 | ) | $ | (42,567 | ) | $ | (67,262 | ) | |||
Denominator—Basic | ||||||||||||
Weighted average shares used to calculate net loss per share, basic | 24,144 | 23,493 | 22,552 | |||||||||
Denominator—Diluted | ||||||||||||
Weighted average shares used to calculate net loss per share, basic | 24,144 | 23,493 | 22,552 | |||||||||
Effect of dilutive restricted stock | — | — | — | |||||||||
Effect of dilutive stock options (A) | — | — | — | |||||||||
Effect of convertible senior notes (B) | — | — | — | |||||||||
Weighted average shares used to calculate net loss per share, diluted | 24,144 | 23,493 | 22,552 | |||||||||
Net loss per share: | ||||||||||||
Basic | $ | (0.02 | ) | $ | (1.81 | ) | $ | (2.98 | ) | |||
Diluted | $ | (0.02 | ) | $ | (1.81 | ) | $ | (2.98 | ) | |||
______________________________
(A) | For the years ended December 31, 2010, 2009 and 2008, the following shares, by equity award type, were excluded from the calculation, as their effect would have been anti-dilutive (in thousands): |
For the Years Ended December 31, | |||||||||
2010 | 2009 | 2008 | |||||||
Stock options | 2,698 | 2,736 | 3,473 | ||||||
Restricted stock | 1,121 | 1,007 | 381 | ||||||
Total shares excluded from earnings per share calculation | 3,819 | 3,743 | 3,854 | ||||||
______________________________
(B) | For the years ended December 31, 2010, 2009 and 2008, as-if converted shares associated with the Company’s 2013 and 2023 convertible notes, as well as its previously issued convertible subordinated notes, were excluded from the calculation if the effect would be anti-dilutive. The following table summarizes the total number of shares excluded from the earnings per share calculation, by year, for the different forms of convertible debt (in thousands): |
74
For the Years Ended December 31, | |||||||||
2010 | 2009 | 2008 | |||||||
2023 convertible senior notes | — | — | 1,896 | ||||||
2013 convertible senior notes | 3,837 | 3,837 | 3,653 | ||||||
Total shares excluded from earnings per share calculation | 3,837 | 3,837 | 5,549 | ||||||
Note 16—Income Taxes
The income tax provision consists of the following (in thousands):
For the Years Ended December 31, | ||||||||||||
2010 | 2009 | 2008 | ||||||||||
Current provision (benefit): | ||||||||||||
Federal | $ | (358 | ) | $ | 12 | $ | (216 | ) | ||||
State | 26 | 37 | 34 | |||||||||
Foreign | (573 | ) | 532 | (193 | ) | |||||||
Total current provision (benefit) | (905 | ) | 581 | (375 | ) | |||||||
Deferred provision (benefit): | ||||||||||||
Federal | — | 38,640 | (12,819 | ) | ||||||||
State | — | 3,363 | (526 | ) | ||||||||
Foreign | 420 | (3,249 | ) | 3,425 | ||||||||
Total deferred provision (benefit) | 420 | 38,754 | (9,920 | ) | ||||||||
Total income tax provision (benefit) | $ | (485 | ) | $ | 39,335 | $ | (10,295 | ) | ||||
The income tax provision (benefit) differs from the amount computed by applying the statutory federal income tax rate to pretax income as a result of the following differences (dollar amounts in thousands):
For the Years Ended December 31, | |||||||||||||||||||||
2010 | 2009 | 2008 | |||||||||||||||||||
$ | % | $ | % | $ | % | ||||||||||||||||
Statutory federal tax (benefit) rate | $ | (299 | ) | (35.0 | )% | $ | (1,131 | ) | (35.0 | )% | $ | (27,145 | ) | (35.0 | )% | ||||||
Increase (decrease) in rates resulting from: | |||||||||||||||||||||
State taxes | (132 | ) | (15.5 | ) | (127 | ) | (3.9 | ) | (486 | ) | (0.6 | ) | |||||||||
Foreign dividend | — | — | 3,195 | 98.9 | — | — | |||||||||||||||
Goodwill impairment expense and (benefit) from acquisitions | (251 | ) | (29.4 | ) | (250 | ) | (7.7 | ) | 11,792 | 15.2 | |||||||||||
Valuation allowance | 1,173 | 137.3 | 42,828 | 1,325.5 | 84 | 0.1 | |||||||||||||||
Taxes on foreign income that differ from U.S. tax rate | (2,886 | ) | (338.0 | ) | (2,973 | ) | (92.0 | ) | 808 | 1.0 | |||||||||||
Tax credits | 142 | 16.7 | (2,031 | ) | (62.9 | ) | (1,474 | ) | (1.9 | ) | |||||||||||
Non-deductible stock-based compensation expense | 1,528 | 179.0 | 2,056 | 63.6 | 1,860 | 2.4 | |||||||||||||||
Foreign currency adjustments | — | — | (3,205 | ) | (99.2 | ) | 2,744 | 3.5 | |||||||||||||
Other | 240 | 28.1 | 973 | 30.0 | 1,522 | 2.0 | |||||||||||||||
Effective tax rate | $ | (485 | ) | (56.8 | )% | $ | 39,335 | 1,217.3 | % | $ | (10,295 | ) | (13.3 | )% | |||||||
75
The components of deferred taxes consist of the following (in thousands):
December 31, 2010 | December 31, 2009 | |||||||
Deferred tax assets: | ||||||||
Accrued warranty | $ | 1,010 | $ | 916 | ||||
Inventory | 2,356 | 2,381 | ||||||
Restructuring accrual | 678 | 874 | ||||||
Net operating loss carryforwards | 14,610 | 12,193 | ||||||
Tax credit carryforwards | 23,014 | 22,881 | ||||||
Stock-based compensation | 3,862 | 3,622 | ||||||
Capitalized research and development | 811 | 1,075 | ||||||
Fixed assets | 3,483 | 5,100 | ||||||
Intangible Assets | 6,900 | 6,410 | ||||||
Goodwill | 5,786 | 6,829 | ||||||
Other | 3,851 | 3,182 | ||||||
Total deferred tax assets | 66,361 | 65,463 | ||||||
Less: valuation allowance | (49,558 | ) | (48,385 | ) | ||||
Net deferred tax assets | 16,803 | 17,078 | ||||||
Deferred tax liabilities: | ||||||||
Other | (247 | ) | (242 | ) | ||||
Total deferred tax liabilities | (247 | ) | (242 | ) | ||||
Total net deferred tax assets | $ | 16,556 | $ | 16,836 | ||||
At December 31, 2010, our unrecognized tax benefits associated with uncertain tax positions were $1.4 million, substantially all of which, if recognized, would favorably affect the effective tax rate.
The Company’s ongoing practice is to recognize potential accrued interest and penalties related to unrecognized tax benefits within its global operations in income tax expense. During the year ended December 31, 2010, the Company recognized a net decrease of approximately $694,000 in potential interest and penalties associated with uncertain tax positions. The Company did not have any potential accrued interest and penalties related to unrecognized tax benefits at December 31, 2010.
76
The Company’s total amounts of unrecognized tax benefits at the beginning and end of the period are as follows (in thousands):
Total | |||
Balance accrued as of December 31, 2008 | $ | 1,755 | |
Additions based on tax positions related to the current year | — | ||
Additions for tax positions of prior years | 395 | ||
Reductions for tax positions of prior years | — | ||
Settlements | — | ||
Reductions as a result of a lapse of applicable statute of limitations | (77 | ) | |
Other | 105 | ||
Balance accrued as of December 31, 2009 | $ | 2,178 | |
Additions based on tax positions related to the current year | — | ||
Additions for tax positions of prior years | 400 | ||
Reductions for tax positions of prior years | (171 | ) | |
Settlements | (148 | ) | |
Reductions as a result of a lapse of applicable statute of limitations | (901 | ) | |
Other | — | ||
Balance accrued as of December 31, 2010 | $ | 1,358 | |
The Company and its subsidiaries are subject to federal income tax as well as income tax of multiple state and foreign jurisdictions. The Company's statute of limitations are closed for all federal and state income tax years before 2007 and 2006, respectively. The statute of limitations for the Company's Canadian subsidiary are closed for all tax years ended before August 31, 2006. The statute of limitations for the Company's other foreign subsidiaries are closed for all income tax years before 2001 which includes federal and state income tax returns. However, to the extent allowed by law, the taxing authorities may have the right to examine prior periods where net operating losses and credits were generated and carried forward, and make adjustments up to the net operating loss and credit carryforward amounts. It is reasonably possible that the Company's uncertain tax positions could decrease by approximately $1.1 million in the next twelve months.
During 2010 an IRS examination was effectively settled when we agreed to a Notice of Proposed Adjustment that was issued by the IRS. The Proposed Adjustment was provided in full as an uncertain tax position at December 31, 2009. The Company is currently under examination in Canada by the Canada Revenue Agency (“CRA”). The periods under examination by the CRA include the tax years 2006 through 2008. During the fourth quarter of 2010, the CRA has issued proposed adjustment notices and the Company is currently in the process of reviewing the proposed adjustments. The Company believes that it has adequately provided for uncertain tax positions related to the CRA examination. However, should the Company experience an unfavorable outcome, it could have a material impact on its results of operations, financial position, or cash flow. The Company is not currently under examination in any other states or foreign jurisdictions.
The Company has recorded valuation allowances of $49.6 million and $48.4 million, as of December 31, 2010 and 2009, respectively. This represents a full valuation allowance against the Company's U.S. net deferred tax assets. In evaluating its valuation allowance, the Company considers all available positive and negative evidence, including scheduled reversals of deferred tax liabilities, projected future taxable income, tax planning strategies, and recent financial performance. Based on the Company's review of all positive and negative evidence, including a three year U.S. cumulative pre-tax loss it concluded that a full valuation allowance should be recorded against its U.S. net deferred tax assets.
At December 31, 2010 and 2009, the Company had total available federal net operating loss carryforwards of approximately $43.0 million and $35.6 million, respectively. The federal net operating loss carryforwards expire between 2011 and 2030 and consist of approximately $33.5 million of consolidated taxable loss remaining after loss carrybacks to prior years, $2.2 million of loss carryforwards from the Texas Micro merger in 1999, and $7.3 million of loss carryforwards from the Microware acquisition in August of 2001. The net operating losses from Texas Micro and Microware are stated net of limitations pursuant to Section 382 of the Internal Revenue Code. The annual utilization limitations are $5.7 million and $732,000 for Texas Micro and Microware, respectively. The Company had total state net operating loss carryforwards of approximately $44.9 million and $42.4 million at December 31, 2010 and 2009, respectively. The state net operating loss carryforwards expire between 2011 and 2030. The Company also had net operating loss carryforwards of approximately $1.5 million from certain non-U.S. jurisdictions. The non-U.S. net operating loss carryforwards are attributable to United Kingdom
77
(“U.K.”), Netherlands, and Japan. The U.K. tax losses may be carried forward indefinitely provided certain requirements are met. The Netherlands and Japan tax losses may be carried forward between 7 and 9 years.
The Company has federal and state research and development tax credit and other federal tax credit carryforwards of approximately $13.4 million at December 31, 2010, to reduce future income tax liabilities. The federal and state tax credits expire between 2011 and 2030. The federal tax credit carryforwards include research and development tax credits of $600,000 and $205,000 from the Texas Micro and Microware acquisitions, respectively. The utilization of these acquired credits is subject to an annual limitation pursuant to Section 383 of the Internal Revenue Code. On December 17, 2010, President Barack Obama signed into law H.R. 4853, the Tax Relief, Unemployment Insurance Reauthorization, and Job Creation Act of 2010 which extended the research and development tax credit through December 31, 2011. The Company's Canadian subsidiary also had approximately $7.0 million in investment tax credit, $12.6 million in unclaimed scientific research and experimental expenditures and $10.7 million in undepreciated capital cost to be carried forward and applied against future income in Canada.
Realization of the foreign deferred tax assets is dependent on generating sufficient taxable income prior to the expiration of the net operating loss and tax credit carryforwards. Although realization is not assured, management believes that it is more likely than not that the results of future operations will generate sufficient taxable income to realize the balance of the deferred tax assets, net of the valuation allowance, as of December 31, 2010. The amount of the net deferred tax assets that is considered realizable, however, could be reduced in the near term if estimates of future taxable income during the carryforward periods are reduced. Should management determine that the Company would not be able to realize all or part of the net deferred tax assets in the future, adjustments to the valuation allowance for deferred tax assets may be required.
The Company repatriated $40.1 million from its foreign subsidiaries during 2009. The repatriation resulted in a taxable dividend of $8.9 million. The remainder of the repatriation was a return of capital and, therefore, was not subject to U.S. income taxes. The Company did not repatriate any earnings of its foreign subsidiaries in 2010. The Company plans to indefinitely reinvest the remaining earnings of all its foreign subsidiaries. Should the Company plan to repatriate any foreign earnings in the future, it will be required to establish an income tax liability and recognize additional income tax expense related to such earnings. The Company has indefinitely reinvested approximately $17.1 million of the undistributed earnings of certain foreign subsidiaries at December 31, 2010. Such earnings would be subject to U.S. taxation if repatriated to the United States.
Pretax book loss from domestic operations for the fiscal years 2010, 2009 and 2008 was $12.8 million, $15.6 million, and $42.4 million, respectively. Pretax book income from foreign operations for the fiscal years 2010 and 2009 was $11.9 million and $12.3 million, respectively. Pretax book loss from foreign operations for the fiscal year 2008 was $33.1 million.
Note 17—Employee Benefit Plans
Stock-Based Employee Benefit Plans
Equity instruments are granted to employees, directors and consultants in certain instances, as defined in the respective plan agreements.
Stock Options and Restricted Stock Awards
On May 15, 2007, the Shareholders approved the 2007 Stock Plan (the “Plan”) to replace the 1995 Stock Incentive Plan, the 2001 Nonqualified Stock Option Plan and the RadiSys Corporation Stock Plan for Convedia Employees. The Plan provides the Board of Directors broad discretion in creating employee equity incentives. Unless otherwise stipulated in the plan document, the Board of Directors, at their discretion, determines stock option exercise prices, which may not be less than the fair value of RadiSys common stock at the date of grant, vesting periods and the expiration periods which are a maximum of 10 years from the date of grant. Under the Plan, 3.2 million shares of common stock have been reserved and authorized for issuance to any non-employee directors and employees, with a maximum of 400,000 shares in any calendar year to one participant. The Plan provides for the issuance of stock options, restricted shares, restricted stock units and performance-based awards.
On May 15, 2008, the shareholders approved the Long-Term Incentive Plan (the “LTIP”). The LTIP provides for the grants of awards payable in shares of common stock or cash upon the achievement of performance goals set by the Company’s Compensation and Development Committee (“the Committee”). The number of shares of the Company’s common stock
78
initially reserved for issuance under the LTIP is 2.0 million shares with a maximum of 500,000 shares in any calendar year to one participant.
The Company granted the first award to participants under the LTIP on October 1, 2009. The target performance goal for these awards is non-GAAP earnings per share of $0.75. Non-GAAP earnings per share is measured as the cumulative sum over four consecutive quarters with the first measurement period ending September 30, 2010. Subsequent measurement dates occur each calendar quarter thereafter until the awards fully vest or expire. Quarterly non-GAAP earnings equals earnings (as calculated in accordance with GAAP) plus stock-based compensation expense, plus amortization of intangible assets, plus or minus restructuring charges or reversals, plus or minus such other items determined as non-recurring or adjusted from non-GAAP earnings as reported by the Company and as approved by the Committee, plus other adjustments resulting from purchase accounting as determined by the Committee, plus a fixed 20% effective tax rate notwithstanding the tax rate otherwise applicable in accordance with GAAP. Non-GAAP earnings per share targets range from $0.65 to $0.85 with payouts ranging from 75% to 125% of the target payout amounts. In the aggregate, the target payout amount for the first performance period equals 731,400 shares, or approximately one-third of the total number of shares authorized under the LTIP. Shares cliff-vest upon achievement of the performance goal and if the performance target is not met by the last measurement period of December 31, 2012, awards will expire unvested. If a portion of a participant’s award has been settled on a prior payout determination date upon achievement of a performance goal with respect to a quarter during the performance period, the previously settled portion of such participant’s award shall be taken into account and shall be offset against any subsequently settled portion of such participant’s award on any subsequent payout determination date.
Restricted stock units issued under the LTIP are valued at the closing price of our common stock on the grant date. At December 31, 2010, outstanding restricted stock units granted under the LTIP have a weighted average valuation of $8.24. The corresponding compensation cost of each LTIP award is expensed ratably over the measurement period of the award. Since the number of shares that may be issued under the LTIP and the service period are both variable, the Company reevaluates the LTIP awards on a quarterly basis and adjust the number of shares expected to be awarded based upon financial results of the Company as compared to the performance goals set for the award. Adjustments to the number of shares awarded, and to the corresponding compensation expense, are made on a cumulative basis at the date of adjustment based upon the estimated probable number of shares to be awarded. Adjustments made to compensation expense resulting from a change in the estimated probable vesting date of the awards are made on a prospective basis. For the year ended December 31, 2010 the Company recorded $1.6 million in stock compensation expense associated with LTIP awards.
In November 2009, the Company completed a stock option exchange program. The Company's eligible employees were permitted to exchange some or all of their outstanding options, with an exercise price greater than $9.44 per share (which is equal to the 52-week high closing price of our common stock as of the start of this offer), that were granted on or before October 5, 2008, whether vested or unvested, for restricted stock units, except for employees in Canada who received new stock options with new vesting schedules and exercise prices. All employees of RadiSys and its subsidiaries, other than members of our Board of Directors, executive officers and employees located in the Netherlands and Israel were eligible to participate in the exchange offer. The option exchange took place on November 3, 2009. Pursuant to the option exchange 848,800 eligible options were canceled and replaced with 169,600 restricted stock units and 35,000 stock options. The new restricted stock units and stock options have a new three year vesting period that began on November 3, 2009. The exchange resulted in $173,000 in additional stock compensation expense which will be recognized over the new three year vesting period.
79
The table below summarizes the activities related to the Company’s stock plans (in thousands, except average prices and weighted average remaining contractual lives):
Shares Available for Grant | Stock Options Outstanding | Weighted Average Remaining Contractual Life (Years) | Aggregate Intrinsic Value | ||||||||||||||
Number | Average Price | ||||||||||||||||
Balance, December 31, 2009 | 1,860 | 2,736 | $ | 12.91 | 4.26 | $ | 1,718 | ||||||||||
Authorized | 500 | — | — | ||||||||||||||
Options granted (C) | (385 | ) | 385 | 9.74 | |||||||||||||
Restricted stock units granted (A, B) | (541 | ) | — | — | |||||||||||||
Options forfeited from 2007 plan (A) | 36 | (36 | ) | 7.91 | |||||||||||||
Options expired from 2007 plan (A) | 27 | (27 | ) | 12.58 | |||||||||||||
Options expired | — | (291 | ) | 20.48 | |||||||||||||
Restricted stock units canceled (A,C) | 71 | — | — | ||||||||||||||
Options exercised | — | (69 | ) | 7.77 | |||||||||||||
Balance, December 31, 2010 | 1,568 | 2,698 | $ | 11.84 | 4.05 | $ | 948 | ||||||||||
Vested and expected to vest, December 31, 2010 | 2,685 | $ | 11.86 | 4.04 | $ | 940 | |||||||||||
Vested at December 31, 2010 | 1,910 | $ | 13.07 | 3.31 | $ | 558 | |||||||||||
_____________________________
(A) | The 2007 plan that replaced the 1995 Stock Incentive Plan, the 2001 Nonqualified Stock Option Plan and the RadiSys Corporation Stock Plan for Convedia Employees requires all restricted stock to be counted as two shares and stock options to be counted as one share for both grants and forfeitures. In addition, options and restricted stock from the 2007 plan that are forfeited, expire or are repurchased are returned to the pool of shares available for grant. |
(B) | Includes 47,500 LTIP performance stock units granted in 2010. |
(C) | Includes 1,000 LTIP performance stock units canceled in 2010. |
The aggregate intrinsic value in the table above represents the total pretax intrinsic value (the difference between the closing price of RadiSys shares as quoted on the NASDAQ Global Select Market for December 31, 2010 and the exercise price, multiplied by the number of in-the-money options) that would have been received by the option holders had all option holders exercised their options on December 31, 2010. The intrinsic value of options changes based on the fair market value of RadiSys stock. Total intrinsic value of options exercised for the years ended December 31, 2010, 2009 and 2008 was $132,000, $206,000 and $591,000, respectively.
The following table summarizes the information about stock options outstanding at December 31, 2010 (shares in thousands):
Options Outstanding | Options Exercisable | ||||||||||||||||
Range of Exercise Prices | Number Outstanding | Weighted Average Remaining Contractual Life | Weighted Average Exercise Price | Number Exercisable | Weighted Average Exercise Price | ||||||||||||
$ 4.34-$ 6.26 | 71 | 4.97 | $ | 5.63 | 45 | $ | 5.74 | ||||||||||
$ 6.38-$ 7.82 | 590 | 5.08 | 7.81 | 347 | 7.81 | ||||||||||||
$ 7.87-$ 9.44 | 535 | 4.71 | 9.05 | 347 | 9.18 | ||||||||||||
$ 9.45-$13.56 | 662 | 5.08 | 11.27 | 331 | 12.59 | ||||||||||||
$13.66-$18.34 | 478 | 2.27 | 15.16 | 478 | 15.16 | ||||||||||||
$18.69-$ 24.50 | 362 | 1.72 | 20.42 | 362 | 20.42 | ||||||||||||
$ 4.34-$ 24.50 | 2,698 | 4.05 | 11.84 | 1,910 | 13.07 | ||||||||||||
Employee Stock Purchase Plan
In December 1995, the Company established an Employee Stock Purchase Plan (“ESPP”). All employees of RadiSys and its subsidiaries who customarily work 20 or more hours per week, including all officers, are eligible to participate in the ESPP. Separate offerings of common stock to eligible employees under the ESPP (an “Offering”) commence on February 15, May 15,
80
August 15 and November 15 of each calendar year (“Enrollment Dates”) and continue for a period of 18 months. Multiple separate Offerings are in operation under the ESPP at any given time. An employee may participate in only one Offering at a time and may purchase shares only through payroll deductions permitted under the provisions stipulated by the ESPP. The purchase price is the lesser of 85% of the fair market value of the common stock on date of grant or that of the purchase date (“look-back feature”). Pursuant to the provisions of the ESPP, as amended, the Company is authorized to issue up to 5.7 million shares of common stock under the plan. For the years ended December 31, 2010, 2009 and 2008 the Company issued 311,000, 660,000 and 596,000 shares under the plan, respectively. At December 31, 2010, 827,000 shares were available for issuance under the plan.
During the second quarter of 2009, the Board of Directors approved an amendment to the Company’s ESPP plan to provide for a one-year holding period with respect to common stock shares purchased by participants under the 1996 plan. The one-year holding period took effect during the fourth quarter of 2009. Due to the holding period, the Company applies a discount to the ESPP stock compensation to reflect the decreased liquidity. The Company utilizes the Finnerty Asian Put Option Approach to estimate the discount. Inputs for the model include the length of the holding period, volatility and risk-free rate. The discount applied in the fourth quarter of 2010 was 10.0%.
Stock-Based Compensation associated with Stock-Based Employee Benefit Plans
The Company uses the Black-Scholes model to measure the grant date fair value of stock options and ESPP shares. The grant date fair value of stock options that are expected to vest is recognized on a straight-line basis over the requisite service period, which is equal to the option vesting period which is, generally, three years. The grant date fair value of ESPP shares that are expected to vest is recognized on a straight-line basis over the requisite service period, which is generally, 18 months, subject to modification at the date of purchase due to the ESPP look-back feature. The Company computes the grant date fair value of restricted stock units granted under the 2007 stock plan and LTIP as the closing price of RadiSys shares as quoted on the NASDAQ Global Select Market on the earlier of the date of grant or the first date of the service period. The grant date fair value of restricted stock units granted under the 2007 stock plan that are expected to vest is recognized on a straight-line basis over the requisite service period, which is three years. The estimate of the number of options, ESPP shares and restricted stock units granted under the 2007 stock plan expected to vest is determined based on historical experience.
The grant date fair value of restricted stock units issued under the Company’s LTIP that are expected to vest is recognized ratably over the service period of the award. The service period of restricted stock units issued under the Company’s LTIP is equal to the period of time over which performance objectives underlying the awards underlying objectives are expected to be achieved. The estimated number of restricted stock units under the Company’s LTIP expected to vest is determined based upon financial results of the Company as compared to the performance goals set for the award and is adjusted quarterly. During the year ended December 31, 2010 the estimated service period associated with outstanding LTIP restricted stock units was adjusted resulting in a reduction of stock compensation expense of $230,000.
To determine the fair value of the stock options and ESPP shares using the Black-Scholes option pricing model, the calculation takes into consideration the effect of the following:
• | Exercise price of the option or purchase price of the ESPP share; |
• | Price of the Company’s common stock on the date of grant; |
• | Expected term of the option or share; |
• | Expected volatility of the Company’s common stock over the expected term of the option or share; and |
• | Risk free interest rate during the expected term of the option or share. |
The calculation includes several assumptions that require management’s judgment. The expected term of the option or share is determined based on assumptions about patterns of employee exercises, and represents a probability-weighted-average time period from grant until exercise of stock options, subject to information available at time of grant. Determining expected volatility generally begins with calculating historical volatility for a similar long-term period and then considering the ways in which the future is reasonably expected to differ from the past.
The Company uses three employee populations. The expected term computation is based on historical vested option exercise and post-vest forfeiture patterns and is also factored by an estimate of the expected term for fully vested and outstanding options. The estimate of the expected term for options that were fully vested and outstanding was determined as the midpoint between the evaluation date and the contractual term date of the option. The risk free interest rate is based on the
81
U.S. Treasury constant maturities in effect at the time of grant for the expected term of the option or share.
The Company computed the value of options granted and ESPP shares issued during 2010, 2009 and 2008 using the Black-Scholes option pricing model. The fair value of the following stock-based awards was estimated using the Black-Scholes model with the following weighted-average assumptions for the fiscal years ended December 31:
Options | Employee Stock Purchase Plan | |||||||||||||||||
2010 | 2009 | 2008 | 2010 | 2009 | 2008 | |||||||||||||
Expected life (in years) | 4.3 | 4.1 | 4.2 | 1.5 | 1.5 | 1.5 | ||||||||||||
Interest rate | 1.34 | % | 1.64 | % | 2.55 | % | 0.33 | % | 0.44 | % | 1.59 | % | ||||||
Volatility | 71 | % | 60 | % | 46 | % | 88 | % | 98 | % | 59 | % | ||||||
Dividend yield | — | — | — | — | — | — | ||||||||||||
For the years ended December 31, 2010, 2009 and 2008, the total value of the options granted was approximately $2.1 million, $3.5 million and $2.2 million, respectively. For the years ended December 31, 2010, 2009 and 2008 the weighted-average valuation per option granted was $5.41, $3.96 and $3.67, respectively. The total estimated value associated with ESPP shares to be granted under enrollment periods beginning in the years ended December 31, 2010, 2009 and 2008 was $1.6 million, $164,000 and $563,000, respectively.
The table below summarizes the activities related to the Company’s unvested restricted stock unit grants (shares in thousands):
Restricted Shares | Weighted-Average Grant Date Fair Value | ||||||
Balance, December 31, 2009 | 1,018 | $ | 8.83 | ||||
Stock units granted | 294 | 9.56 | |||||
Shares vested | (11 | ) | 17.68 | ||||
Stock units vested | (144 | ) | 10.79 | ||||
Stock units canceled | (36 | ) | 9.36 | ||||
Balance, December 31, 2010 | 1,121 | $ | 8.67 | ||||
The Company expects that approximately 865,000 of the balance of restricted stock units at December 31, 2010 will vest. According to the Restricted Stock Grant Agreement, upon the vesting dates, the holder of the restricted stock unit grant shall be issued a number of shares equal to the number of restricted stock units which have vested.
For the years ended December 31, 2010, 2009 and 2008, stock-based compensation was recognized and allocated in the Consolidated Statements of Operations as follows (in thousands):
2010 | 2009 | 2008 | ||||||||||
Cost of sales | $ | 816 | $ | 1,050 | $ | 1,031 | ||||||
Research and development | 1,303 | 2,176 | 3,001 | |||||||||
Selling, general and administrative | 4,039 | 5,060 | 5,584 | |||||||||
Restructuring | — | 234 | — | |||||||||
Total stock-based compensation expense | $ | 6,158 | $ | 8,520 | $ | 9,616 | ||||||
As of December 31, 2010, $3.3 million of total unrecognized compensation cost related to stock options is expected to be recognized over a weighted-average period of 1.88 years. As of December 31, 2010, $4.7 million of unrecognized stock-based compensation expense related to unvested restricted stock units is expected to be recognized over a weighted-average period of 2.10 years.
401(k) Savings Plan
The Company established a 401(k) Savings Plan (“401(k) Plan”), a defined contribution plan, as of January 1, 1989 and
82
amended through January 1, 2007, in compliance with Section 401(k) and other related sections of the Internal Revenue Code and corresponding Regulations issued by the Department of Treasury and Section 404(c) of Employee Retirement Income Security Act of 1974 (“ERISA”), to provide retirement benefits for its U.S employees. Under the provisions of the plan, eligible employees are allowed pre-tax contributions of up to 30% of their annual compensation or the maximum amount permitted by the applicable statutes. Additionally, eligible employees can elect to make catch-up contributions, within the limits set forth by pre-tax contributions, or to the maximum amount permitted by the applicable statutes. Pursuant to the provisions of the 401(k) Plan, the Company may contribute 50% of pre-tax contributions made by eligible employees, adjusted for loans and withdrawals, up to 6% of annual compensation for each eligible employee. The Company may elect to make supplemental contributions as periodically determined by the Board of Directors at their discretion. The contributions made by the Company on behalf of eligible employees become 100% vested after three years of service, or 33% per year after one year of service. The Company’s total contributions to the 401(k) Plan amounted to $885,000, $1.1 million and $1.0 million in 2010, 2009 and 2008, respectively. In addition, some of the Company’s employees outside the U.S are covered by various defined contribution plans, in compliance with the statutes of respective countries. The participants pay for the 401(k) Savings Plan administrative expenses.
Deferred Compensation Plan
The Company has a Deferred Compensation Plan, providing its directors and certain eligible employees with opportunities to defer a portion of their compensation as defined by the provisions of the plan. The Company credits additional amounts to the deferred compensation plan to make up for reductions of Company contributions under the 401(k) Plan. The deferred amounts are credited with earnings and losses under investment options chosen by the participants. The Company sets aside deferred amounts, which are then invested in long-term insurance contracts. All deferred amounts and earnings are 100% vested at all times, but are subject to the claims of creditors of the Company under a bankruptcy proceeding. Benefits are payable to a participant upon retirement, death, and termination of employment and paid as elected by the participant in accordance with the terms of the plan. The Plan also permits scheduled in-service distributions. (see Note 8—Other Assets) Deferred amounts may be withdrawn by the participant in case of financial hardship as defined in the plan agreement.
Cash Incentive Program
On September 30, 2009, the Committee put in place a cash incentive program (the “Incentive Program”) for certain of the Company’s employees to drive breakthrough Company transformations in an accelerated timeframe. The Incentive Program was intended to motivate and recognize the employees’ performance in achieving the Company’s defined strategy and goals by aligning measurable results with rewards. The Incentive Program was designed to reward the Company’s employees who were leading or significantly contributing to the transformational business initiatives in the engineering and operations organizations.
Awards under the Incentive Program were based on Company performance as measured by two sets of goals: an operations outsourcing performance goal and an engineering enterprise performance goal. The performance period for the Incentive Program ran from October 1, 2009 to June 30, 2010. During 2010, the Company paid $839,000 in connection with this plan.
Note 18—Segment Information
The Company is one operating segment. This is because results of operations are provided and analyzed at a company-wide level. Key resources, decisions, and assessment of performance are also analyzed on a company-wide level. This is the way management organizes the Company for making operating decisions and assessing financial performance by the chief operating decision maker.
Revenues on a product and services basis are as follows (in thousands):
For the Years Ended December 31, | ||||||||||||
2010 | 2009 | 2008 | ||||||||||
Hardware | $ | 257,533 | $ | 278,907 | $ | 356,228 | ||||||
Software royalties and licenses | 16,614 | 17,878 | 10,382 | |||||||||
Software maintenance | 4,980 | 3,326 | 3,093 | |||||||||
Engineering and other services | 5,184 | 4,162 | 2,881 | |||||||||
Total revenues | $ | 284,311 | $ | 304,273 | $ | 372,584 | ||||||
83
The Company ultimately derives its revenues from two end markets as follows (in thousands):
For the Year Ended December 31, | ||||||||||||
2010 | 2009 | 2008 | ||||||||||
Next Generation Communications Networks Products | $ | 118,078 | $ | 102,047 | $ | 103,676 | ||||||
Legacy/ Traditional Communications Networks Products | 91,873 | 136,828 | 191,507 | |||||||||
Total Communications Networks Products | 209,951 | 238,875 | 295,183 | |||||||||
Medical Products | 33,366 | 26,261 | 29,607 | |||||||||
Other Commercial Products | 40,994 | 39,137 | 47,794 | |||||||||
Total Commercial Products | 74,360 | 65,398 | 77,401 | |||||||||
Total revenues | $ | 284,311 | $ | 304,273 | $ | 372,584 | ||||||
Information about the Company’s geographic revenues and long-lived assets by geographical area is as follows (in thousands):
Geographic Revenues
Revenues are reported in the geographic area of the ship-to customer.
For the Years Ended December 31, | ||||||||||||
2010 | 2009 | 2008 | ||||||||||
United States | $ | 96,449 | $ | 97,407 | $ | 114,582 | ||||||
Other North America | 912 | 2,731 | 6,552 | |||||||||
North America | 97,361 | 100,138 | 121,134 | |||||||||
Europe, the Middle East and Africa (“EMEA”) | 80,218 | 82,654 | 137,940 | |||||||||
Asia Pacific | 106,732 | 121,481 | 113,510 | |||||||||
Total revenues | $ | 284,311 | $ | 304,273 | $ | 372,584 | ||||||
Long-lived assets by Geographic Area
December 31, 2010 | December 31, 2009 | December 31, 2008 | ||||||||||
Property and equipment, net | ||||||||||||
United States | $ | 6,404 | $ | 6,914 | $ | 9,343 | ||||||
Other North America | 716 | 914 | 706 | |||||||||
EMEA | 30 | 71 | 66 | |||||||||
Asia Pacific | 2,337 | 2,027 | 1,441 | |||||||||
Total property and equipment, net | $ | 9,487 | $ | 9,926 | $ | 11,556 | ||||||
Goodwill | ||||||||||||
EMEA | $ | 160 | $ | — | $ | — | ||||||
Total goodwill | $ | 160 | $ | — | $ | — | ||||||
Intangible assets, net | ||||||||||||
United States | $ | 1,552 | $ | 4,088 | $ | 8,454 | ||||||
Other North America | 912 | 962 | 2,440 | |||||||||
EMEA | 4,624 | 5,670 | 8,910 | |||||||||
Total intangible assets, net | $ | 7,088 | $ | 10,720 | $ | 19,804 | ||||||
For the years ended December 31, 2010, 2009 and 2008, the following customers accounted for more than 10% of total revenues. These customers accounted for the following percentages of total revenue:
2010 | 2009 | 2008 | |||||||
Nokia Siemens Networks | 37.4 | % | 45.9 | % | 43.5 | % | |||
NEI (primarily related to end customer Danaher) | 10.0 | % | NA | NA | |||||
84
The following customer accounted for more than 10% of accounts receivable. This customer accounted for the following percentages of accounts receivable:
December 31, 2010 | December 31, 2009 | |||||
Nokia Siemens Networks | 32.0 | % | 30.8 | % | ||
Suppliers
In 2010 the Company used two contract manufacturers for the supply of all its products. By the end of September 2011 the Company expects to consolidate all manufacturing with one contract manufacturer.
Note 19—Acquisition of Pactolus
On March 11, 2010, the Company acquired the assets of Pactolus Communications Software Company ("Pactolus"), a developer of next-generation IP communications solutions for converged time-division multiplexing/internet protocol ("TDM/IP") and session initiation protocol ("SIP") enabled voice over internet protocol ("VoIP") networks. The Company paid $3.5 million in cash on the closing date and assumed certain contractual liabilities of Pactolus. The purchase price was allocated to Pactolus' assets and liabilities based on their estimated fair value as follows (in thousands):
Cash | $ | 115 | |
Tangible assets | 490 | ||
Liabilities assumed | (565 | ) | |
Developed technology | 2,600 | ||
Customer related intangibles | 700 | ||
Goodwill | 160 | ||
Total | $ | 3,500 | |
Developed technology and customer related intangibles will be amortized over a period of approximately five years and four years, respectively. Goodwill is calculated as the purchase price in excess of the fair values of Pactolus' assets and liabilities.
Pro forma results of operations have not been presented for this acquisition because its effect was not material to the Company.
Note 20—Legal Proceedings
In the normal course of business, the Company becomes involved in litigation. As of December 31, 2010, in the opinion of management, RadiSys had no pending litigation that would have a material effect on the Company’s financial position, results of operations or cash flows.
Note 21—Subsequent Events
On December 16, 2010, the Company announced the Board of Director's authorization of a share repurchase program under which the Company may repurchase up to $20 million of its common stock at the discretion of management. Shares may be purchased from time to time at prevailing market prices, in the open market or through privately negotiated transactions, subject to market conditions and as permitted by the securities laws and in compliance with other legal requirements. Under the program, the purchases will be funded from available working capital, and any repurchased shares will be returned to authorized but unissued status. The duration of the repurchase program is two years, although it may be extended, suspended or discontinued without prior notice, at the discretion of the Board.
85
The following table sets forth information concerning shares of the Company's common stock repurchased subsequent to December 31, 2010 (in thousands, except average prices paid per share):
Issuer Purchases of Equity Securities | ||||||||||||||
Period | Total Number of Shares Purchased | Average Price Paid per Share | Total Number of Shares Purchased as Part of Publicly Announced Plans or Programs | Approximate Dollar Value of Shares that May Yet be Purchased Under the Plans or Programs | ||||||||||
January 1, 2011 through January 31, 2011 | — | $ | — | — | $ | 20,000 | ||||||||
February 1, 2011 through February 28, 2011 | 117,737 | 8.36 | 117,737 | 19,016 | ||||||||||
March 1, 2011 through March 15, 2011 | 32,010 | 8.42 | 149,747 | 18,747 | ||||||||||
Total | 149,747 | $ | 8.37 | 149,747 | $ | 18,747 | ||||||||
86
Item 9. Changes In and Disagreements with Accountants on Accounting and Financial Disclosure
There has been no change of accountants nor any disagreements with accountants on any matter of accounting principles or practices or finance statement disclosure required to be reported under this item.
Item 9A. Controls and Procedures
Disclosure Controls and Procedures. Based on their evaluation as of the end of the period covered by this Annual Report on Form 10-K, the Company’s Chief Executive Officer and Chief Financial Officer have concluded that the Company’s “disclosure controls and procedures” (as defined in Rules 13a-15(e) and 15d-15(e) under the Exchange Act) are effective.
During the Company’s fiscal quarter ended December 31, 2010, no change occurred in the Company’s internal control over financial reporting that has materially affected, or is reasonably likely to materially affect, the Company’s internal control over financial reporting.
Management’s Report on Internal Control over Financial reporting appears on page 46 hereof. KPMG LLP’s attestation report on the effectiveness of the Company’s internal control over financial reporting appears on page 47 hereof.
Item 9B. Other Information
Director Appointment
On March 15, 2011, our Board, upon the recommendation of the Nominating and Governance Committee, increased the size of the Board to nine members and elected Mr. David Nierenberg to fill the vacancy effective as of March 16, 2011. His term will expire at the upcoming annual meeting of our stockholders.
David Nierenberg is the Founder and President of Nierenberg Investment Management Company, Inc. in Camas, Washington, which manages The D3 Family Funds. Prior to founding Nierenberg Investment Management Company in 1996, Mr. Nierenberg was a General Partner at Trinity Ventures, a venture capital fund, where he invested in financial services, healthcare and turnarounds. Prior to 1985, he was a Partner with Bain & Company, a business and strategy consulting firm, in San Francisco, Boston and London. Mr. Nierenberg is Chairman of the Advisory Board of the Millstein Center for Corporate Governance and Performance at the Yale School of Management. He also serves on the Washington State Investment Board and the advisory board of Glass-Lewis & Co, a leading investment research and global proxy advisory and voting services firm. He is Chairman of PSA Healthcare, a leading provider of pediatric home care services, and a member of the board of directors of Electro Scientific Industries, Inc., a designer and manufacturer of sophisticated production equipment used by microelectronics manufacturers, First Independent Bank, a diversified financial services institution, Kuni Automotive Group, an auto dealership company, and HDV/Holt.
Mr. Nierenberg will receive the same compensation for service on the Board as that of our other non-employee directors. Non-employee director compensation includes a retainer of $31,500 per year (increased to $35,000, effective April 1, 2011), pro-rated in the case of Mr. Nierenberg from the date of his election to the Board. Mr. Nierenberg is eligible to participate in the RadiSys Corporation Deferred Compensation Plan, which allows the members of the Board to defer up to 100% of compensation (including annual retainer and committee fees). In connection with his appointment as a director, Mr. Nierenberg will also receive options to acquire 7,000 shares of our common stock and 4,000 restricted stock units under the RadiSys Corporation 2007 Stock Plan. Under the Company's current compensation policy for directors, Mr. Nierenberg will also be eligible to receive a grant of 7,500 restricted stock units made annually to all directors, which is expected to be effective as of June 15, 2011, subject to the approval of the increase of the number of shares available for issuance under the 2007 Stock Plan by our stockholders at the next annual meeting.
87
PART III
The Company will file its definitive proxy statement for the Annual Meeting of Shareholders to be held on June 15, 2011, pursuant to Regulation 14A of the Exchange Act (the “Proxy Statement”), not later than 120 days after the end of the fiscal year covered by this Annual Report. This Annual Report incorporates by reference specified information included in the Proxy Statement.
Item 10. Directors, Executive Officers and Corporate Governance
The information with respect to the Company’s directors and officers and corporate governance is included in the Company’s Proxy Statement and is incorporated herein by reference. The information with respect to the Company’s code of ethics is included in the Description of Business in Item 1.
Item 11. Executive Officer Compensation
Information with respect to executive compensation is included under “Director Compensation,” “Executive Compensation,” “Compensation Committee Report on Executive Compensation,” “Comparison of Cumulative Total Returns,” and “Employment Contracts and Severance Arrangements” in the Company’s Proxy Statement and is incorporated herein by reference.
Item 12. Security Ownership of Certain Beneficial Owners and Management
Information with respect to security ownership of certain beneficial owners and management and equity compensation plan information is included under “Security Ownership of Certain Beneficial Owners and Management” in the Company’s Proxy Statement and is incorporated herein by reference.
EQUITY COMPENSATION PLAN INFORMATION
The following table summarizes information about the Company’s equity compensation plans as of December 31, 2010. All outstanding awards relate to the Company’s common stock.
Plan category | Number of securities to be issued upon exercise of outstanding options, warrants and rights | Weighted-average exercise price of outstanding options, warrants and rights ($) | Number of securities remaining available for future issuance under equity compensation plans | ||||||||
Equity compensation plans approved by security holders | 3,512,644 | (1) | $ | 11.54 | 2,576,564 | (2) | |||||
Equity compensation plans not approved by security holders (3) | 123,339 | 18.03 | — | ||||||||
Total | 3,635,983 | $ | 11.84 | 2,576,564 | |||||||
_____________________________
(1) | Includes 392,234 restricted stock units which will vest only if specific service measures are met and 548,550 restricted stock units which will vest only upon attaining certain performance goals. |
(2) | Includes 825,438 of securities authorized and available for issuance in connection with the RadiSys Corporation 1996 Employee Stock Purchase Plan. |
(3) | Includes 2,250 shares granted under the RadiSys Corporation Stock Plan For Convedia Employees. The Plan is intended to comply with the NASD Marketplace Rule 4350 which provides an exception to the NASD shareholder approval requirement for the issuance of securities with regard to grants to new employees of the Company, including grants to transferred employees in connection with a merger or other acquisition. |
Description of Equity Compensation Plans Not Adopted by Shareholders
Additional information required by this item is included in the Company’s Proxy Statement for the Annual Meeting of Shareholders to be held June 15, 2011 and is incorporated herein by reference.
Item 13. Certain Relationships and Related Transactions, and Director Independence
The information with respect to certain relationships and related transactions is included under “Certain Relationships and Related Transactions” in the Company’s Proxy Statement and is incorporated herein by reference.
88
Item 14. Principal Accounting Fees and Services
The information with respect to principal accountant fees and services is included under “Principal Accountant Fees and Services” in the Company’s proxy statement and is incorporated herein by reference.
89
PART IV
Item 15. Exhibits and Financial Statement Schedules
(a) (1) Financial Statements
Index to Financial Statements
Form 10-K Page No. | ||
(a) (2) Financial Statement Schedule
None.
(a) (3) Exhibits
Exhibit No. | Description | |
2.1 | Amended and Restated Asset Purchase Agreement, dated September 12, 2007, by and between the Company and Intel Corporation. Incorporated by reference from Exhibit 2.1 in the Company’s Amended Current Report of Form 8-K/A, filed on November 1, 2007, SEC File No. 000-26844. | |
2.2 | Transition Services Agreement, dated September 12, 2007, by and between the Company and Intel Corporation (portions of the exhibit have been omitted pursuant to a request for confidential treatment to the Commission). Incorporated by reference from Exhibit 10.2 to the Company’s Quarterly Report on Form 10-Q for the quarterly period ended September 30, 2007, filed on November 8, 2007, SEC File No. 000-26844. | |
2.3 | Warranty Services Agreement, dated September 12, 2007, by and between the Company and Intel Corporation (portions of the exhibit have been omitted pursuant to a request for confidential treatment to the Commission). Incorporated by reference from Exhibit 10.3 to the Company’s Quarterly Report on Form 10-Q for the quarterly period ended September 30, 2007, filed on November 8, 2007, SEC File No. 000-26844. | |
2.4 | Arrangement Agreement among RadiSys Corporation, Convedia Corporation and RadiSys Canada Inc., effective as of July 26, 2006. Incorporated by reference from Exhibit 2.1 to the Company’s Current Report on Form 8-K filed on July 28, 2006, SEC File No. 000-26844. | |
3.1 | Second Restated Articles of Incorporation and amendments thereto. Incorporated by reference from Exhibit 4.1 to the Company’s Registration Statement on Form S-8, filed on September 1, 2006, SEC File No. 333-137060, as amended by the Articles of Amendment incorporated by reference from Exhibit 3.1 in the Company’s Current Report on Form 8-K filed on January 30, 2008. | |
3.2 | Restated Bylaws. Incorporated by reference from Exhibit 3.1 to the Company’s Quarterly Report on From 10-Q, filed on May 8, 2007. | |
4.1 | Indenture, dated February 12, 2008, by and between the Company and The Bank of New York Trust Company, N.A. Incorporated by reference from Exhibit 4.1 in the Company’s Current Report on Form 8-K, filed on February 12, 2008. | |
4.2 | First Supplemental Indenture, dated February 12, 2008, by and between the Company and The Bank of New York Trust Company, N.A. Incorporated by reference from Exhibit 4.2 in the Company’s Current Report on Form 8-K, filed on February 12, 2008. | |
4.3 | Form of Global Security for the 2.75% Convertible Senior Notes due 2013 (included in Exhibit 4.2). | |
4.4 | Form of Debt Securities Indenture. Incorporated by reference from Exhibit 4.5 in the Company's registration statement in Form S-3, filed on October 26, 2010, SEC File No. 333-170148. | |
90
Exhibit No. | Description | |
10.1 | Amended and Restated Asset Purchase Agreement, dated September 12, 2007, by and between the Company and Intel Corporation. See Exhibit 2.1. | |
10.2 | Transition Services Agreement, dated September 12, 2007, by and between the Company and Intel Corporation. See Exhibit 2.2 | |
10.3 | Warranty Services Agreement, dated September 12, 2007, by and between the Company and Intel Corporation. See Exhibit 2.3 | |
10.4* | RadiSys Corporation 1995 Employee Stock Incentive Plan, as amended. Incorporated by reference from Exhibit (d)(1) to the Tender Offer Statement filed by the Company on Schedule TO-I, filed July 31, 2003, SEC File No. 005-49160. | |
10.5* | RadiSys Corporation Employee Stock Purchase Plan, as amended through August 18, 2009. Incorporated by reference from Appendix A to the Company’s Proxy Statement on Schedule 14A , filed on July 6, 2009, SEC File No. 000-26844 09929350. | |
10.6* | RadiSys Corporation 2001 Nonqualified Stock Option Plan, as amended. Incorporated by reference from Exhibit (d)(2) to the Tender Offer Statement filed by the Company on Schedule TO-I, filed July 31, 2003, SEC File No. 005-49160. | |
10.7* | Form of Restricted Stock Agreement, as amended. Incorporated by reference from Exhibit 10.1 to the Company’s Quarterly Report on Form 10-Q, for the quarterly period ended March 31, 2006, filed on May 9, 2006, SEC File No. 000-26844. | |
10.8* | Form of Notice of Stock Option Grant for the 1995 Stock Incentive Plan. Incorporated by reference from Exhibit (d)(3) to the Tender Offer Statement filed by the Company on TO-I, filed July, 31, 2003, SEC File No. 005-49160. | |
10.9* | Form of Notice of Stock Option Grant for the 2001 Nonqualified Stock Option Plan. Incorporated by reference from Exhibit (d)(4) to the Tender Offer Statement filed by the Company on TO-I, filed July, 31, 2003, SEC File No. 005-49160. | |
10.10* | Deferred Compensation Plan. Incorporated by reference from Exhibit 10.1 to the Company’s Quarterly Report on Form 10-Q for the quarterly period ended March 31, 2001, filed on May 15, 2001, SEC File No. 000-26844. | |
10.11* | RadiSys Corporation Stock Plan for Convedia Employees. Incorporated by reference from Exhibit 4.4 to the Company’s Registration Statement on Form S-8, filed on September 1, 2006, SEC Registration No. 333-137060. | |
10.12* | Form of Notice of Option Grant for United States employees for RadiSys Corporation Stock Plan for Convedia Employees. Incorporated by reference from Exhibit 4.5 to the Company’s Registration Statement on Form S-8, filed on September 1, 2006, SEC Registration No. 333-137060. | |
10.13* | Form of Notice of Option Grant for Canada employees for RadiSys Corporation Stock Plan for Convedia Employees. Incorporated by reference from Exhibit 4.6 to the Company’s Registration Statement on Form S-8 filed on September 1, 2006, SEC Registration No. 333-137060. | |
10.14* | Form of Notice of Option Grant for international employees for RadiSys Corporation Stock Plan for Convedia Employees. Incorporated by reference from Exhibit 4.7 to the Company’s Registration Statement on Form S-8, filed on September 1, 2006, SEC Registration No. 333-137060. | |
10.15* | Form of Notice of Option Grant for China employees for RadiSys Corporation Stock Plan for Convedia Employees. Incorporated by reference from Exhibit 4.8 to the Company’s Registration Statement on Form S-8, filed on September 1, 2006, SEC Registration No. 333-137060. | |
10.16* | Form of Restricted Stock Grant Agreement for RadiSys Corporation Stock Plan for Convedia Employees. Incorporated by reference from Exhibit 4.9 to the Company’s Registration Statement on Form S-8, filed on September 1, 2006, SEC Registration No. 333-137060. | |
10.17* | Form of Restricted Stock Unit Grant Agreement for RadiSys Corporation Stock Plan for Convedia Employees. Incorporated by reference from Exhibit 4.10 to the Company’s Registration Statement on Form S-8, filed on September 1, 2006, SEC Registration No. 333-137060. | |
10.18* | Description of the Revisions of the Company’s Directors Compensation Arrangements. Incorporated by reference from Exhibit 10.4 to the Company’s Quarterly Report on Form 10-Q filed on November 8, 2007. | |
10.19* | RadiSys Corporation 2007 Stock Plan. Incorporated by reference from Exhibit 4.4 to the Company’s Registration Statement on Form S-8, filed on May 15, 2007, SEC Registration No. 333-142968. |
91
Exhibit No. | Description | |
10.20* | Form of Notice of Option Grant for United States employees for RadiSys Corporation 2007 Stock Plan. Incorporated by reference from Exhibit 4.5 to the Company’s Registration Statement on Form S-8, filed on May 15, 2007, SEC Registration No. 333-142968. | |
10.21* | Form of Notice of Option Grant for Canada employees for RadiSys Corporation 2007 Stock Plan. Incorporated by reference from Exhibit 4.6 to the Company’s Registration Statement on Form S-8, filed on May 15, 2007, SEC Registration No. 333-142968. | |
10.22* | Form of Notice of Option Grant for China employees for RadiSys Corporation 2007 Stock Plan. Incorporated by reference from Exhibit 4.7 to the Company’s Registration Statement on Form S-8, filed on May 15, 2007, SEC Registration No. 333-142968. | |
10.23* | Form of Notice of Option Grant for international employees for RadiSys Corporation 2007 Stock Plan. Incorporated by reference from Exhibit 4.8 to the Company’s Registration Statement on Form S-8, filed on May 15, 2007, SEC Registration No. 333-142968. | |
10.24* | Form of Restricted Stock Unit Grant Agreement for RadiSys Corporation 2007 Stock Plan. Incorporated by reference from Exhibit 4.9 to the Company’s Registration Statement on Form S-8, filed on May 15, 2007, SEC Registration No. 333-142968. | |
10.25* | Amended and Restated Executive Change of Control Agreement dated December 24, 2008 between the Company and Scott C. Grout. Incorporated by reference from Exhibit 10.7 to the Company’s Quarterly Report on Form 10-Q for the quarterly period ended September 30, 2009, filed on November 6, 2009, SEC File No. 000-26844. | |
10.26* | Amended and Restated Executive Change of Control Agreement dated December 31, 2008 between the Company and Christian Lepiane. Incorporated by reference from Exhibit 10.10 to the Company’s Quarterly Report on Form 10-Q for the quarterly period ended September 30, 2009, filed on November 6, 2009, SEC File No. 000-26844. | |
10.27* | Amended and Restated Executive Change of Control Agreement dated December 22, 2008 between the Company and Brian Bronson. Incorporated by reference from Exhibit 10.6 to the Company’s Quarterly Report on Form 10-Q for the quarterly period ended September 30, 2009, filed on November 6, 2009, SEC File No. 000-26844. | |
10.28* | Form of Indemnity Agreement for directors and officers of the Company. Incorporated by reference from Exhibit 10.23 to the Company’s Annual Report on Form 10-K for the year ended December 31, 2006, filed on March 2, 2007, SEC File No. 000-26844. | |
10.29* | Offer letter dated September 16, 2002 between the Company and Scott C. Grout. Incorporated by reference from Exhibit 10.24 to the Company’s Annual Report on Form 10-K for the year ended December 31, 2006, filed on March 2, 2007, SEC File No. 000-26844. | |
10.30* | Offer letter dated August 15, 2003 between the Company and Christian Lepiane. Incorporated by reference from Exhibit 10.25 to the Company’s Annual Report on Form 10-K for the year ended December 31, 2006, filed on March 2, 2007, SEC File No. 000-26844. | |
10.31 | Dawson Creek II lease, dated March 21, 1997, incorporated by reference from Exhibit 10.1 to the Company’s Quarterly Report on Form 10-Q for the quarterly period ended June 30, 1997, filed on August 13, 1997, SEC File No. 000-26844. | |
10.32* | Summary of Compensatory Arrangements of Certain Officers. Incorporated by reference from Exhibit 10.1 in the Company’s Quarterly Report on Form 10-Q for the quarterly period ended March 31, 2010, filed on May 7, 2010, SEC File No. 000-26844. | |
10.33 | Summary of Revisions to Compensatory Arrangements of Directors. Incorporated by reference from Exhibit 10.2 in the Company's Quarterly Report on Form 10-Q for the quarterly period ended March 31, 2010, filed on May 7, 2010, SEC File No. 000-26844. | |
10.34 | Loan and Security Agreement, dated August 7, 2008, between the Company and Silicon Valley Bank. Incorporated by reference from Exhibit 10.3 in the Company’s Quarterly report on Form 10-Q for the quarterly period ended June 30, 2008, filed on August 8, 2008, SEC File No. 000-26844. | |
10.35* | Amended and Restated Executive Severance Agreement, dated December 24, 2008, between the Company and Scott Grout. Incorporated by reference from Exhibit 10.8 in the Company’s Quarterly report on Form 10-Q for the quarterly period ended September 30, 2009, filed on November 6, 2009, SEC File No. 000-26844. | |
10.36* | Amended and Restated Executive Severance Agreement, dated December 22, 2008, between the Company and Brian Bronson. Incorporated by reference from Exhibit 10.5 in the Company’s Quarterly report on Form 10-Q for the quarterly period ended September 30, 2009, filed on November 6, 2009, SEC File No. 000-26844. |
92
Exhibit No. | Description | |
10.37* | Code Section 409A Amendment to Offer Letter, dated December 31, 2008, between the Company and Christian Lepiane. Incorporated by reference from Exhibit 10.9 to the Company’s Quarterly Report on Form 10-Q for the quarterly period ended September 30, 2009, filed on November 6, 2009, SEC File No. 000-26844. | |
10.38* | RadiSys Corporation Long-Term Incentive Plan. Incorporated by reference from Appendix A to the Company’s Proxy Statement on Schedule 14A , filed on April 15, 2008, SEC File No. 000-26844 08756410. | |
10.39* | Amendment to RadiSys Corporation Long-Term Incentive Plan. Incorporated by reference from Exhibit 4.4 in the Company’s Registration Statement on Form S-8, filed on September 30, 2009, SEC File No. 333-162231. | |
10.40* | Form of Award Agreement for Performance-Based Restricted Stock Units under the RadiSys Corporation Long-Term Incentive Plan. Incorporated by reference from Exhibit 4.5 in the Company’s Registration Statement on Form S-8, filed on September 30, 2009, SEC File No. 333-162231. | |
10.41 | Credit Line Agreement by and between the Company and UBS AG, dated December 12, 2008. Incorporated by reference from Exhibit 10.39 to the Company’s Annual Report on Form 10-K for the year ended December 31, 2008, filed on March 6, 2009, SEC File No. 000-26844. | |
10.42* | Severance agreement, dated November 4, 2008, between the Company and John T. Major. Incorporated by reference from Exhibit 10.40 to the Company’s Annual Report on Form 10-K for the year ended December 31, 2008, filed on March 6, 2009, SEC File No. 000-26844. | |
10.43* | Severance agreement, dated December 29, 2008, between the Company and Anthony Ambrose. Incorporated by reference from Exhibit 10.41 to the Company’s Annual Report on Form 10-K for the year ended December 31, 2008, filed on March 6, 2009, SEC File No. 000-26844. | |
10.44* | Executive Change of Control Agreement dated December 30, 2008, between the Company and John T. Major. Incorporated by reference from Exhibit 10.42 to the Company’s Annual Report on Form 10-K for the year ended December 31, 2008, filed on March 6, 2009, SEC File No. 000-26844. | |
10.45* | Executive Change of Control Agreement dated August 3, 2010, between the Company and Anthony Ambrose. Incorporated by reference from Exhibit 10.1 to the Company’s Quarterly Report on Form 10-Q for the quarterly period ended June 30, 2010, filed on August 6, 2010, SEC File No. 000-26844. | |
10.46 | Second Amendment and Limited Waiver to Loan and Security Agreement, dated February 13, 2009, between the Company and Silicon Valley Bank. Incorporated by reference from Exhibit 10.43 to the Company’s Annual Report on Form 10-K for the year ended December 31, 2008, filed on March 6, 2009, SEC File No. 000-26844. | |
10.47 | Third Amendment to Loan and Security Agreement, dated February 13, 2009, between the Company and Silicon Valley Bank. Incorporated by reference from Exhibit 10.44 to the Company’s Annual Report on Form 10-K for the year ended December 31, 2008, filed on March 6, 2009, SEC File No. 000-26844. | |
10.48 | Fourth Amendment to Loan and Security Agreement, dated August 7, 2008, between the Company and Silicon Valley Bank, dated as of April 27, 2009. Incorporated by reference from Exhibit 10.4 in the Company’s Quarterly Report on Form 10-Q for the quarterly period ended March 31, 2009, filed on May 8, 2009, SEC File No. 000-26844. | |
10.49 | Fifth Amendment to Loan and Security Agreement, dated August 7, 2008, between the Company and Silicon Valley Bank, dated as of November 4, 2009. Incorporated by reference from Exhibit 10.4 in the Company’s Quarterly report on Form 10-Q for the quarterly period ended September 30, 2009, filed on November 6, 2009, SEC File No. 000-26844. | |
10.50 | Sixth Amendment to Loan and Security Agreement, dated August 7, 2008, between the Company and Silicon Valley Bank, dated as of November 2, 2010. Incorporated by reference from Exhibit 10.1 in the Company’s Quarterly report on Form 10-Q for the quarterly period ended September 30, 2010, filed on November 5, 2009, SEC File No. 000-26844. | |
21.1** | List of Subsidiaries. | |
23.1** | Consent of KPMG LLP. | |
24.1** | Power of Attorney of C. Scott Gibson | |
24.2** | Power of Attorney of Richard J. Faubert | |
24.3** | Power of Attorney of William W. Lattin | |
24.4** | Power of Attorney of Kevin C. Melia | |
24.5** | Power of Attorney of Carl Neun |
93
Exhibit No. | Description | |
24.6** | Power of Attorney of Lorene K. Steffes | |
24.7** | Power of Attorney of M. Niel Ransom | |
31.1** | Certification of the Chief Executive Officer required by Rule 13a-14(a) or Rule 15d-14(a) of the Exchange Act pursuant to Section 302 of the Sarbanes-Oxley Act of 2002. | |
31.2** | Certification of the Chief Financial Officer required by Rule 13a-14(a) or Rule 15d-14(a) of the Exchange Act pursuant to Section 302 of the Sarbanes-Oxley Act of 2002. | |
32.1** | Certification of the Chief Executive Officer pursuant to 18 U.S.C. Section 1350, as adopted pursuant to Section 906 of the Sarbanes-Oxley Act of 2002. | |
32.2** | Certification of the Chief Financial Officer pursuant to 18 U.S.C. Section 1350, as adopted pursuant to Section 906 of the Sarbanes-Oxley Act of 2002. |
* | This Exhibit constitutes a management contract or compensatory plan or arrangement |
** | Filed herewith |
(b) See (a) (3) above.
See (a) (2) above.
94
SIGNATURES
Pursuant to the requirements of Section 13 or 15(d) of the Securities Exchange Act of 1934, the Registrant has duly caused this report to be signed on its behalf by the undersigned, thereunto duly authorized.
RADISYS CORPORATION | ||
By: | /S/ SCOTT C. GROUT | |
Scott C. Grout | ||
President and Chief Executive Officer | ||
Dated: March 15, 2011
Pursuant to the requirements of the Securities Exchange Act of 1934, this report has been signed below by the following persons on behalf of the Registrant and in the capacities indicated on March 15, 2011.
Signature | Title | |
/S/ SCOTT C. GROUT | President, Chief Executive Officer and Director | |
Scott C. Grout | (Principal Executive Officer) | |
/S/ BRIAN BRONSON | Chief Financial Officer | |
Brian Bronson | (Principal Financial and Accounting Officer) | |
Directors: | ||
/S/ C. SCOTT GIBSON* | Chairman of the Board and Director | |
C. Scott Gibson | ||
/S/ RICHARD J. FAUBERT* | Director | |
Richard J. Faubert | ||
/S/ DR. WILLIAM W. LATTIN* | Director | |
Dr. William W. Lattin | ||
/S/ KEVIN C. MELIA* | Director | |
Kevin C. Melia | ||
/S/ CARL NEUN* | Director | |
Carl Neun | ||
/S/ LORENE K. STEFFES* | Director | |
Lorene K. Steffes | ||
/S/ Niel Ranson* | Director | |
Niel Ransom | ||
*By: | /S/ SCOTT C. GROUT | |
Scott C. Grout, as attorney-in-fact |
95
EXHIBIT INDEX
Exhibit No. | Description | |
2.1 | Amended and Restated Asset Purchase Agreement, dated September 12, 2007, by and between the Company and Intel Corporation. Incorporated by reference from Exhibit 2.1 in the Company’s Amended Current Report of Form 8-K/A, filed on November 1, 2007, SEC File No. 000-26844. | |
2.2 | Transition Services Agreement, dated September 12, 2007, by and between the Company and Intel Corporation (portions of the exhibit have been omitted pursuant to a request for confidential treatment to the Commission). Incorporated by reference from Exhibit 10.2 to the Company’s Quarterly Report on Form 10-Q for the quarterly period ended September 30, 2007, filed on November 8, 2007, SEC File No. 000-26844. | |
2.3 | Warranty Services Agreement, dated September 12, 2007, by and between the Company and Intel Corporation (portions of the exhibit have been omitted pursuant to a request for confidential treatment to the Commission). Incorporated by reference from Exhibit 10.3 to the Company’s Quarterly Report on Form 10-Q for the quarterly period ended September 30, 2007, filed on November 8, 2007, SEC File No. 000-26844. | |
2.4 | Arrangement Agreement among RadiSys Corporation, Convedia Corporation and RadiSys Canada Inc., effective as of July 26, 2006. Incorporated by reference from Exhibit 2.1 to the Company’s Current Report on Form 8-K filed on July 28, 2006, SEC File No. 000-26844. | |
3.1 | Second Restated Articles of Incorporation and amendments thereto. Incorporated by reference from Exhibit 4.1 to the Company’s Registration Statement on Form S-8, filed on September 1, 2006, SEC File No. 333-137060, as amended by the Articles of Amendment incorporated by reference from Exhibit 3.1 in the Company’s Current Report on Form 8-K filed on January 30, 2008. | |
3.2 | Restated Bylaws. Incorporated by reference from Exhibit 3.1 to the Company’s Quarterly Report on From 10-Q, filed on May 8, 2007. | |
4.1 | Indenture, dated February 12, 2008, by and between the Company and The Bank of New York Trust Company, N.A. Incorporated by reference from Exhibit 4.1 in the Company’s Current Report on Form 8-K, filed on February 12, 2008. | |
4.2 | First Supplemental Indenture, dated February 12, 2008, by and between the Company and The Bank of New York Trust Company, N.A. Incorporated by reference from Exhibit 4.2 in the Company’s Current Report on Form 8-K, filed on February 12, 2008. | |
4.3 | Form of Global Security for the 2.75% Convertible Senior Notes due 2013 (included in Exhibit 4.2). | |
4.4 | Form of Debt Securities Indenture. Incorporated by reference from Exhibit 4.5 in the Company's registration statement in Form S-3, filed on October 26, 2010, SEC File No. 333-170148. | |
10.1 | Amended and Restated Asset Purchase Agreement, dated September 12, 2007, by and between the Company and Intel Corporation. See Exhibit 2.1. | |
10.2 | Transition Services Agreement, dated September 12, 2007, by and between the Company and Intel Corporation. See Exhibit 2.2 | |
10.3 | Warranty Services Agreement, dated September 12, 2007, by and between the Company and Intel Corporation. See Exhibit 2.3 | |
10.4* | RadiSys Corporation 1995 Employee Stock Incentive Plan, as amended. Incorporated by reference from Exhibit (d)(1) to the Tender Offer Statement filed by the Company on Schedule TO-I, filed July 31, 2003, SEC File No. 005-49160. | |
10.5* | RadiSys Corporation Employee Stock Purchase Plan, as amended through August 18, 2009. Incorporated by reference from Appendix A to the Company’s Proxy Statement on Schedule 14A , filed on July 6, 2009, SEC File No. 000-26844 09929350. | |
10.6* | RadiSys Corporation 2001 Nonqualified Stock Option Plan, as amended. Incorporated by reference from Exhibit (d)(2) to the Tender Offer Statement filed by the Company on Schedule TO-I, filed July 31, 2003, SEC File No. 005-49160. | |
10.7* | Form of Restricted Stock Agreement, as amended. Incorporated by reference from Exhibit 10.1 to the Company’s Quarterly Report on Form 10-Q, for the quarterly period ended March 31, 2006, filed on May 9, 2006, SEC File No. 000-26844. | |
10.8* | Form of Notice of Stock Option Grant for the 1995 Stock Incentive Plan. Incorporated by reference from Exhibit (d)(3) to the Tender Offer Statement filed by the Company on TO-I, filed July, 31, 2003, SEC File No. 005-49160. | |
96
Exhibit No. | Description | |
10.9* | Form of Notice of Stock Option Grant for the 2001 Nonqualified Stock Option Plan. Incorporated by reference from Exhibit (d)(4) to the Tender Offer Statement filed by the Company on TO-I, filed July, 31, 2003, SEC File No. 005-49160. | |
10.10* | Deferred Compensation Plan. Incorporated by reference from Exhibit 10.1 to the Company’s Quarterly Report on Form 10-Q for the quarterly period ended March 31, 2001, filed on May 15, 2001, SEC File No. 000-26844. | |
10.11* | RadiSys Corporation Stock Plan for Convedia Employees. Incorporated by reference from Exhibit 4.4 to the Company’s Registration Statement on Form S-8, filed on September 1, 2006, SEC Registration No. 333-137060. | |
10.12* | Form of Notice of Option Grant for United States employees for RadiSys Corporation Stock Plan for Convedia Employees. Incorporated by reference from Exhibit 4.5 to the Company’s Registration Statement on Form S-8, filed on September 1, 2006, SEC Registration No. 333-137060. | |
10.13* | Form of Notice of Option Grant for Canada employees for RadiSys Corporation Stock Plan for Convedia Employees. Incorporated by reference from Exhibit 4.6 to the Company’s Registration Statement on Form S-8 filed on September 1, 2006, SEC Registration No. 333-137060. | |
10.14* | Form of Notice of Option Grant for international employees for RadiSys Corporation Stock Plan for Convedia Employees. Incorporated by reference from Exhibit 4.7 to the Company’s Registration Statement on Form S-8, filed on September 1, 2006, SEC Registration No. 333-137060. | |
10.15* | Form of Notice of Option Grant for China employees for RadiSys Corporation Stock Plan for Convedia Employees. Incorporated by reference from Exhibit 4.8 to the Company’s Registration Statement on Form S-8, filed on September 1, 2006, SEC Registration No. 333-137060. | |
10.16* | Form of Restricted Stock Grant Agreement for RadiSys Corporation Stock Plan for Convedia Employees. Incorporated by reference from Exhibit 4.9 to the Company’s Registration Statement on Form S-8, filed on September 1, 2006, SEC Registration No. 333-137060. | |
10.17* | Form of Restricted Stock Unit Grant Agreement for RadiSys Corporation Stock Plan for Convedia Employees. Incorporated by reference from Exhibit 4.10 to the Company’s Registration Statement on Form S-8, filed on September 1, 2006, SEC Registration No. 333-137060. | |
10.18* | Description of the Revisions of the Company’s Directors Compensation Arrangements. Incorporated by reference from Exhibit 10.4 to the Company’s Quarterly Report on Form 10-Q filed on November 8, 2007. | |
10.19* | RadiSys Corporation 2007 Stock Plan. Incorporated by reference from Exhibit 4.4 to the Company’s Registration Statement on Form S-8, filed on May 15, 2007, SEC Registration No. 333-142968. | |
10.20* | Form of Notice of Option Grant for United States employees for RadiSys Corporation 2007 Stock Plan. Incorporated by reference from Exhibit 4.5 to the Company’s Registration Statement on Form S-8, filed on May 15, 2007, SEC Registration No. 333-142968. | |
10.21* | Form of Notice of Option Grant for Canada employees for RadiSys Corporation 2007 Stock Plan. Incorporated by reference from Exhibit 4.6 to the Company’s Registration Statement on Form S-8, filed on May 15, 2007, SEC Registration No. 333-142968. | |
10.22* | Form of Notice of Option Grant for China employees for RadiSys Corporation 2007 Stock Plan. Incorporated by reference from Exhibit 4.7 to the Company’s Registration Statement on Form S-8, filed on May 15, 2007, SEC Registration No. 333-142968. | |
10.23* | Form of Notice of Option Grant for international employees for RadiSys Corporation 2007 Stock Plan. Incorporated by reference from Exhibit 4.8 to the Company’s Registration Statement on Form S-8, filed on May 15, 2007, SEC Registration No. 333-142968. | |
10.24* | Form of Restricted Stock Unit Grant Agreement for RadiSys Corporation 2007 Stock Plan. Incorporated by reference from Exhibit 4.9 to the Company’s Registration Statement on Form S-8, filed on May 15, 2007, SEC Registration No. 333-142968. | |
10.25* | Amended and Restated Executive Change of Control Agreement dated December 24, 2008 between the Company and Scott C. Grout. Incorporated by reference from Exhibit 10.7 to the Company’s Quarterly Report on Form 10-Q for the quarterly period ended September 30, 2009, filed on November 6, 2009, SEC File No. 000-26844. | |
10.26* | Amended and Restated Executive Change of Control Agreement dated December 31, 2008 between the Company and Christian Lepiane. Incorporated by reference from Exhibit 10.10 to the Company’s Quarterly Report on Form 10-Q for the quarterly period ended September 30, 2009, filed on November 6, 2009, SEC File No. 000-26844. |
97
Exhibit No. | Description | |
10.27* | Amended and Restated Executive Change of Control Agreement dated December 22, 2008 between the Company and Brian Bronson. Incorporated by reference from Exhibit 10.6 to the Company’s Quarterly Report on Form 10-Q for the quarterly period ended September 30, 2009, filed on November 6, 2009, SEC File No. 000-26844. | |
10.28* | Form of Indemnity Agreement for directors and officers of the Company. Incorporated by reference from Exhibit 10.23 to the Company’s Annual Report on Form 10-K for the year ended December 31, 2006, filed on March 2, 2007, SEC File No. 000-26844. | |
10.29* | Offer letter dated September 16, 2002 between the Company and Scott C. Grout. Incorporated by reference from Exhibit 10.24 to the Company’s Annual Report on Form 10-K for the year ended December 31, 2006, filed on March 2, 2007, SEC File No. 000-26844. | |
10.30* | Offer letter dated August 15, 2003 between the Company and Christian Lepiane. Incorporated by reference from Exhibit 10.25 to the Company’s Annual Report on Form 10-K for the year ended December 31, 2006, filed on March 2, 2007, SEC File No. 000-26844. | |
10.31 | Dawson Creek II lease, dated March 21, 1997, incorporated by reference from Exhibit 10.1 to the Company’s Quarterly Report on Form 10-Q for the quarterly period ended June 30, 1997, filed on August 13, 1997, SEC File No. 000-26844. | |
10.32* | Summary of Compensatory Arrangements of Certain Officers. Incorporated by reference from Exhibit 10.1 in the Company’s Quarterly Report on Form 10-Q for the quarterly period ended March 31, 2010, filed on May 7, 2010, SEC File No. 000-26844. | |
10.33 | Summary of Revisions to Compensatory Arrangements of Directors. Incorporated by reference from Exhibit 10.2 in the Company's Quarterly Report on Form 10-Q for the quarterly period ended March 31, 2010, filed on May 7, 2010, SEC File No. 000-26844. | |
10.34 | Loan and Security Agreement, dated August 7, 2008, between the Company and Silicon Valley Bank. Incorporated by reference from Exhibit 10.3 in the Company’s Quarterly report on Form 10-Q for the quarterly period ended June 30, 2008, filed on August 8, 2008, SEC File No. 000-26844. | |
10.35* | Amended and Restated Executive Severance Agreement, dated December 24, 2008, between the Company and Scott Grout. Incorporated by reference from Exhibit 10.8 in the Company’s Quarterly report on Form 10-Q for the quarterly period ended September 30, 2009, filed on November 6, 2009, SEC File No. 000-26844. | |
10.36* | Amended and Restated Executive Severance Agreement, dated December 22, 2008, between the Company and Brian Bronson. Incorporated by reference from Exhibit 10.5 in the Company’s Quarterly report on Form 10-Q for the quarterly period ended September 30, 2009, filed on November 6, 2009, SEC File No. 000-26844. | |
10.37* | Code Section 409A Amendment to Offer Letter, dated December 31, 2008, between the Company and Christian Lepiane. Incorporated by reference from Exhibit 10.9 to the Company’s Quarterly Report on Form 10-Q for the quarterly period ended September 30, 2009, filed on November 6, 2009, SEC File No. 000-26844. | |
10.38* | RadiSys Corporation Long-Term Incentive Plan. Incorporated by reference from Appendix A to the Company’s Proxy Statement on Schedule 14A , filed on April 15, 2008, SEC File No. 000-26844 08756410. | |
10.39* | Amendment to RadiSys Corporation Long-Term Incentive Plan. Incorporated by reference from Exhibit 4.4 in the Company’s Registration Statement on Form S-8, filed on September 30, 2009, SEC File No. 333-162231. | |
10.40* | Form of Award Agreement for Performance-Based Restricted Stock Units under the RadiSys Corporation Long-Term Incentive Plan. Incorporated by reference from Exhibit 4.5 in the Company’s Registration Statement on Form S-8, filed on September 30, 2009, SEC File No. 333-162231. | |
10.41 | Credit Line Agreement by and between the Company and UBS AG, dated December 12, 2008. Incorporated by reference from Exhibit 10.39 to the Company’s Annual Report on Form 10-K for the year ended December 31, 2008, filed on March 6, 2009, SEC File No. 000-26844. | |
10.42* | Severance agreement, dated November 4, 2008, between the Company and John T. Major. Incorporated by reference from Exhibit 10.40 to the Company’s Annual Report on Form 10-K for the year ended December 31, 2008, filed on March 6, 2009, SEC File No. 000-26844. | |
10.43* | Severance agreement, dated December 29, 2008, between the Company and Anthony Ambrose. Incorporated by reference from Exhibit 10.41 to the Company’s Annual Report on Form 10-K for the year ended December 31, 2008, filed on March 6, 2009, SEC File No. 000-26844. | |
10.44* | Executive Change of Control Agreement dated December 30, 2008, between the Company and John T. Major. Incorporated by reference from Exhibit 10.42 to the Company’s Annual Report on Form 10-K for the year ended December 31, 2008, filed on March 6, 2009, SEC File No. 000-26844. |
98
Exhibit No. | Description | |
10.45* | Executive Change of Control Agreement dated August 3, 2010, between the Company and Anthony Ambrose. Incorporated by reference from Exhibit 10.1 to the Company’s Quarterly Report on Form 10-Q for the quarterly period ended June 30, 2010, filed on August 6, 2010, SEC File No. 000-26844. | |
10.46 | Second Amendment and Limited Waiver to Loan and Security Agreement, dated February 13, 2009, between the Company and Silicon Valley Bank. Incorporated by reference from Exhibit 10.43 to the Company’s Annual Report on Form 10-K for the year ended December 31, 2008, filed on March 6, 2009, SEC File No. 000-26844. | |
10.47 | Third Amendment to Loan and Security Agreement, dated February 13, 2009, between the Company and Silicon Valley Bank. Incorporated by reference from Exhibit 10.44 to the Company’s Annual Report on Form 10-K for the year ended December 31, 2008, filed on March 6, 2009, SEC File No. 000-26844. | |
10.48 | Fourth Amendment to Loan and Security Agreement, dated August 7, 2008, between the Company and Silicon Valley Bank, dated as of April 27, 2009. Incorporated by reference from Exhibit 10.4 in the Company’s Quarterly Report on Form 10-Q for the quarterly period ended March 31, 2009, filed on May 8, 2009, SEC File No. 000-26844. | |
10.49 | Fifth Amendment to Loan and Security Agreement, dated August 7, 2008, between the Company and Silicon Valley Bank, dated as of November 4, 2009. Incorporated by reference from Exhibit 10.4 in the Company’s Quarterly report on Form 10-Q for the quarterly period ended September 30, 2009, filed on November 6, 2009, SEC File No. 000-26844. | |
10.50 | Sixth Amendment to Loan and Security Agreement, dated August 7, 2008, between the Company and Silicon Valley Bank, dated as of November 2, 2010. Incorporated by reference from Exhibit 10.1 in the Company’s Quarterly report on Form 10-Q for the quarterly period ended September 30, 2010, filed on November 5, 2009, SEC File No. 000-26844. | |
21.1** | List of Subsidiaries. | |
23.1** | Consent of KPMG LLP. | |
24.1** | Power of Attorney of C. Scott Gibson | |
24.2** | Power of Attorney of Richard J. Faubert | |
24.3** | Power of Attorney of William W. Lattin | |
24.4** | Power of Attorney of Kevin C. Melia | |
24.5** | Power of Attorney of Carl Neun | |
24.6** | Power of Attorney of Lorene K. Steffes | |
24.7** | Power of Attorney of M. Niel Ransom | |
31.1** | Certification of the Chief Executive Officer required by Rule 13a-14(a) or Rule 15d-14(a) of the Exchange Act pursuant to Section 302 of the Sarbanes-Oxley Act of 2002. | |
31.2** | Certification of the Chief Financial Officer required by Rule 13a-14(a) or Rule 15d-14(a) of the Exchange Act pursuant to Section 302 of the Sarbanes-Oxley Act of 2002. | |
32.1** | Certification of the Chief Executive Officer pursuant to 18 U.S.C. Section 1350, as adopted pursuant to Section 906 of the Sarbanes-Oxley Act of 2002. | |
32.2** | Certification of the Chief Financial Officer pursuant to 18 U.S.C. Section 1350, as adopted pursuant to Section 906 of the Sarbanes-Oxley Act of 2002. |
* | This Exhibit constitutes a management contract or compensatory plan or arrangement |
** | Filed herewith |
99