Attached files
Table of Contents
Index to Financial Statements
UNITED STATES
SECURITIES AND EXCHANGE COMMISSION
WASHINGTON, D.C. 20549
FORM 10-K
(Mark One)
| þ | ANNUAL REPORT PURSUANT TO SECTION 13 OR 15(d) OF THE SECURITIES EXCHANGE ACT OF 1934 |
For the fiscal year ended December 31, 2010
or
| ¨ | TRANSITION REPORT PURSUANT TO SECTION 13 OR 15(d) OF THE SECURITIES EXCHANGE ACT OF 1934 |
For the transition period from to
COMMISSION FILE NUMBER: 000-32647
KNOLOGY, INC.
(Exact name of registrant as specified in its charter)
| DELAWARE | 58-2424258 | |
| (State or other jurisdiction of incorporation or organization) |
(I.R.S. Employer Identification No.) | |
| KNOLOGY, INC. 1241 O.G. SKINNER DRIVE WEST POINT, GEORGIA |
31833 | |
| (Address of principal executive offices) | (Zip Code) | |
Registrant’s telephone number, including area code: (706) 645-8553
Securities registered pursuant to Section 12(b) of the Act:
| Title of Each Class |
Name of Exchange on Which Registered | |
| Common Stock, $0.01 par value | The NASDAQ Stock Market, LLC |
Securities registered pursuant to Section 12(g) of the Act:
Options to Purchase Shares of Common Stock
Indicate by check mark if the registrant is a well-known seasoned issuer, as defined in Rule 405 of the Securities Act. Yes ¨ No þ
Indicate by check mark if the registrant is not required to file reports pursuant to Section 13 or Section 15(d) of the Act. Yes ¨ No þ
Indicate by check mark whether the registrant (1) has filed all reports required to be filed by Section 13 or 15(d) of the Securities Exchange Act of 1934 during the preceding 12 months (or for such shorter period that the registrant was required to file such reports), and (2) has been subject to such filing requirements for the past 90 days. Yes þ No ¨
Indicate by check mark whether the registrant has submitted electronically and posted on its corporate Web site, if any, every Interactive Data File required to be submitted and posted pursuant to Rule 405 of Regulation S-T during the preceding 12 months (or for such shorter period that the registrant was required to submit and post such files). Yes ¨ No ¨
Indicate by check mark if disclosure of delinquent filers pursuant to Item 405 of Regulation S-K is not contained herein, and will not be contained, to the best of registrant’s knowledge, in definitive proxy or information statements incorporated by reference in Part III of this Form 10-K or any amendment to this Form 10-K. ¨
Indicate by check mark whether the registrant is a large accelerated filer, an accelerated filer, a non-accelerated filer or a smaller reporting company. See definition of “large accelerated filer”, “accelerated filer” and “smaller reporting company” in Rule 12b-2 of the Exchange Act. (Check one):
| Large accelerated filer ¨ | Accelerated filer þ | |
| Non-accelerated filer ¨ | Smaller reporting company ¨ | |
| (Do not check if a smaller reporting company) |
Indicate by check mark whether the registrant is a shell company (as defined in Rule 12b-2 of the Exchange Act). Yes ¨ No þ
The aggregate market value of the outstanding common equity held by non-affiliates of the registrant at June 30, 2010, computed by reference to the closing price for such stock on the NASDAQ Global Market on such date, was approximately $271 million.
The number of shares outstanding of the registrant’s common stock as of February 28, 2011 was 37,349,059 shares.
DOCUMENTS INCORPORATED BY REFERENCE:
Portions of the registrant’s definitive proxy statement relating to its 2011 Annual Meeting of Stockholders are incorporated by reference into Part III of this Annual Report on Form 10-K where indicated.
Table of Contents
Index to Financial Statements
| PAGE | ||||||
| PART I |
||||||
| ITEM 1. |
4 | |||||
| ITEM 1A. |
19 | |||||
| ITEM 1B. |
27 | |||||
| ITEM 2. |
27 | |||||
| ITEM 3. |
27 | |||||
| ITEM 4. |
28 | |||||
| PART II |
||||||
| ITEM 5. |
MARKET FOR REGISTRANT’S COMMON EQUITY, RELATED STOCKHOLDER MATTERS AND ISSUER PURCHASES OF EQUITY SECURITIES | 29 | ||||
| ITEM 6. |
31 | |||||
| ITEM 7. |
MANAGEMENT’S DISCUSSION AND ANALYSIS OF FINANCIAL CONDITION AND RESULTS OF OPERATIONS | 32 | ||||
| ITEM 7A. |
48 | |||||
| ITEM 8. |
50 | |||||
| ITEM 9. |
CHANGES IN AND DISAGREEMENTS WITH ACCOUNTANTS ON ACCOUNTING AND FINANCIAL DISCLOSURE | 50 | ||||
| ITEM 9A. |
50 | |||||
| ITEM 9B. |
51 | |||||
| PART III |
||||||
| ITEM 10. |
54 | |||||
| ITEM 11. |
57 | |||||
| ITEM 12. |
SECURITY OWNERSHIP OF CERTAIN BENEFICIAL OWNERS AND MANAGEMENT AND RELATED STOCKHOLDER MATTERS | 57 | ||||
| ITEM 13. |
CERTAIN RELATIONSHIPS AND RELATED TRANSACTIONS, AND DIRECTOR INDEPENDENCE | 57 | ||||
| ITEM 14. |
57 | |||||
| PART IV |
||||||
| ITEM 15. |
58 | |||||
| 65 | ||||||
| F-1 | ||||||
2
Table of Contents
Index to Financial Statements
CAUTION REGARDING FORWARD-LOOKING STATEMENTS
This Annual Report on Form 10-K for the year ended December 31, 2010 contains forward-looking statements within the meaning of the Private Securities Litigation Reform Act of 1995 including, specifically, the information under the captions “Business” and “Management’s Discussion and Analysis of Financial Condition and Results of Operations,” as well as other places in this annual report. Statements in this annual report that are not historical facts are “forward-looking statements.” Such forward-looking statements include those relating to:
| • | our anticipated capital expenditures; |
| • | our anticipated sources of capital and other funding; |
| • | plans to develop future networks and upgrade facilities; |
| • | the current and future markets for our services and products; |
| • | consumers’ reactions to current and future general economic conditions; |
| • | the effects of regulatory changes on our business; |
| • | competitive and technological developments; |
| • | possible acquisitions, alliances or dispositions; and |
| • | projected revenues, liquidity, interest costs and income. |
The words “estimate,” “project,” “intend,” “expect,” “believe,” “may,” “could,” “plan,”, “will,” “should” and similar expressions are intended to identify forward-looking statements. Wherever they occur in this annual report or in other statements attributable to us, forward-looking statements are necessarily estimates reflecting our best judgment. These statements relate to future events or our future financial performance and involve known and unknown risks, uncertainties and other factors that could cause our actual results, levels of activity, performance or achievements to differ materially from any future results, levels of activity, performance or achievements expressed or implied by these forward-looking statements. The most significant of these risks, uncertainties and other factors are discussed above. We caution you to carefully consider these risks and those risks and uncertainties discussed in “Item 1A. Risk Factors” in this annual report and not to place undue reliance on our forward-looking statements. Except as required by law, we assume no responsibility for updating any forward-looking statements.
3
Table of Contents
Index to Financial Statements
PART I
For convenience in this annual report, “Knology,” “we,” “us,” and “the Company” refer to Knology, Inc. and our consolidated subsidiaries, taken as a whole.
| ITEM 1. | BUSINESS |
We were formed as a Delaware corporation in September 1998. Our shares of common stock are publicly traded on the NASDAQ Global Market. We are a fully integrated provider of video, voice, data and advanced communications services to residential and business customers in ten markets in the southeastern United States and three markets in the midwestern United States. For the year ended December 31, 2010, our revenues were $459.5 million and we had a net loss attributable to common stockholders of $281,000. Video, voice, data and other revenues accounted for approximately 45%, 28%, 23% and 4%, respectively, of our consolidated revenues for the year ended December 31, 2010. We report an aggregate number of connections for video, voice and data services. For example, a single customer who purchases cable television, local telephone and Internet access services would count as three connections. As of December 31, 2010, we had 766,361 total connections.
We provide our services over our wholly owned, fully upgraded minimum 750 MHz interactive broadband network. As of December 31, 2010, our network passed 1,045,355 marketable homes, which are residential and business units passed by our broadband network that are listed in our database and which we do not believe are covered by exclusive arrangements with other providers of competing services. Our network is designed with sufficient capacity to meet the growing demand for high-speed and high-bandwidth video, voice and data services, as well as the introduction of new communications services.
We have operating experience in marketing, selling, provisioning, servicing and operating video, voice and data systems and services. We have delivered a bundled service offering for over ten years, and we are supported by a management team with decades of experience operating video, voice and data networks. We provide a full suite of video, voice and data services in certain markets in Alabama, Florida, Georgia, Iowa, Kansas, Minnesota, South Carolina, South Dakota and Tennessee, which are in the southeastern and midwestern regions of the United States. We offer our bundled service to all of our marketable passings.
We have built our company through:
| • | construction and expansion of our broadband network to offer integrated video, voice and data services; |
| • | organic growth of connections through increased penetration of services to new marketable homes and our existing customer base, along with new service offerings; |
| • | upgrades of acquired networks to introduce expanded broadband services, including bundled voice and data services; and |
| • | acquisitions of other broadband systems. |
On November 17, 2009, we completed the acquisition of Private Cable Co., LLC (“PCL Cable”), a provider of video, voice and data services to residential and business customers in Athens and Decatur, Alabama for $7.5 million. The acquisition was funded with cash on hand.
On October 15, 2010, we completed the acquisition of Sunflower Broadband (“Sunflower”), a provider of video, voice and data services to residential and business customers in Douglas County, Lawrence, Kansas and the surrounding area for $165 million. In connection with the acquisition, Knology has entered into a $770 million secured credit facility with proceeds used to partially fund the acquisition purchase price, refinance the company’s existing credit facility, and pay related transaction costs. Knology also used approximately $48 million of cash on hand to partially fund the transaction.
4
Table of Contents
Index to Financial Statements
Website Access to SEC Filings
The Company makes its SEC filings, including its annual report on Form 10-K, quarterly reports on Form 10-Q, current reports on Form 8-K and any amendments to those reports, available free of charge on the Company’s Internet website, www.knology.com, as soon as reasonably practicable after the reports are electronically filed with or furnished to the SEC.
Our Industry
In recent years, regulatory developments and advances in technology have substantially altered the competitive dynamics of the communications industry and blurred the lines among traditional video, voice and data providers. The Telecommunications Act of 1996 (the 1996 Act) and its implementation through Federal Communications Commission (FCC) regulation have encouraged competition in these markets. Advances in technology have made the transmission of video, voice and data on a single platform feasible and economical. Communications providers seek to bundle products to leverage their significant capital investments, protect market share in their core service offerings from new sources of competition and achieve operating efficiencies by providing more than one service over their networks at lower incremental costs while increasing revenue from the existing customer base.
Incumbent cable operators have expanded their core services by offering a bundled package of services, including the provision of Internet Protocol (IP) based voice services for their customers. Most of the major providers have rolled out Voice over Internet Protocol (VoIP) services. Likewise, incumbent telephone providers are expanding their services to include the bundled package of services. Many are providing dial-up or Digital Subscriber Line (DSL) Internet access to their customers and some are offering video service via third-party satellite companies. In addition, some telephone providers are offering video services over their networks.
We believe the future of the industry will include a broader competitive landscape in which communications providers will offer bundled video, voice and data services and compete with each other based on scope and depth of the service offering, pricing, customer service and convenience.
Our Strategy
Our goal is to be the leading provider of integrated broadband communications services to residential and business customers in our target markets and to fully leverage the capacity and capability of our interactive broadband network. The key components of our strategy include:
| • | Focus on offering fully integrated bundles of video, voice and data services. We provide video, voice and data services over our broadband network and promote the adoption of these services by new and existing customers in bundled offerings. Bundling is central to our operating strategy and provides us with meaningful revenue opportunities, enables us to increase penetration and operating efficiencies, facilitates customer service, and reduces customer acquisition and installation costs. We believe that offering our customers a bundle of video, voice and data services allows us to maximize the revenue generating capability of our network, increase revenue per customer, provide greater pricing flexibility and promote customer retention. |
| • | Leverage our broadband network to provide new services. We built our high-capacity, interactive broadband network with fiber optics as close to the customer as economically feasible. Our entire network is a minimum of 750 MHz, which enables us to provide at least 750 MHz of capacity and two-way capability to all of our homes passed in these markets. We have invested in advanced technology platforms that support advanced communications services and multiple emerging interactive services such as video-on-demand, subscriber video-on-demand, digital video recorder, high-definition television, hosted IP Centrex services, Session Initiated Protocol (“SIP”) trunking, pure fiber services and Gigabit Ethernet services that allow for IP based voice and data services in all of our markets. |
5
Table of Contents
Index to Financial Statements
| • | Deliver industry-leading customer service. Outstanding customer service is a critical element of our operating philosophy. We deliver personalized and responsive customer care 24 hours a day, seven days a week through our Augusta, Georgia and Sioux Falls, South Dakota call centers. Through our network operations center (NOC), we monitor and evaluate network performance and quality of service. Our philosophy is to be proactive in retaining customers rather than reactive, and we strive to resolve service delivery problems prior to the customer becoming aware of them. Because we own our network and actively monitor our digital services from a centralized location to the customer premises, we have greater control over the quality of the services we deliver to our customers and, as a result, the overall customer experience. We have an enterprise management system that enhances our service capability by providing us with a single platform for sales, provisioning, customer care, trouble ticketing, credit control, scheduling and dispatch of service calls, as well as providing our customers with a single bill for all services. |
| • | Pursue expansion opportunities. We have a history of acquiring, integrating, upgrading and expanding systems, enabling us to offer bundled video, voice and data services and increasing our revenue opportunity, penetration and operating efficiency. To augment our organic growth, we will pursue value-enhancing expansion opportunities meeting our target market criteria that allow us to leverage our experience as a bundled broadband provider and endorse our operating philosophy of delivering profitable growth. These opportunities include acquisitions and fill-in and edge-out expansion in existing markets. We will continue to evaluate growth opportunities based on targeted return requirements and access to capital. |
Our Interactive Broadband Network
Our network is critical to the implementation of our operating strategy, allowing us to offer bundled video, voice and data services to our customers in an efficient manner and with a high level of service. In addition to providing high capacity and scalability, our network has been specifically engineered to have increased reliability, including features such as:
| • | redundant fiber routing and use of the Synchronous Optical Network (SONET) protocol which enables the rapid, automatic redirection of network traffic in the event of a fiber cut; |
| • | back-up power supplies in our network which ensure continuity of our service in the event of a power outage; and |
| • | network monitoring to the customer premises for all digital video, voice and data services. |
Technical Overview
Our interactive broadband network consists of fiber-optic cable, coaxial cable and copper wire. Fiber-optic cable is a communications medium that uses hair-thin glass fibers to transmit signals over long distances with minimum signal loss or distortion. In most of our network, our system’s main high capacity fiber-optic cables connect to multiple nodes throughout our network. These nodes are connected to individual homes and buildings by coaxial cable and are shared by a number of customers, generally 500 homes. We have sufficient fibers in our cables to further subdivide our nodes to 125 homes if growth so dictates. Our network has excellent broadband frequency characteristics and physical durability, which is conducive to providing video, voice service and data transmission.
As of December 31, 2010, our network consisted of approximately 13,000 miles of network, passed 1,045,355 marketable homes and served 766,361 connections. Our interactive broadband network is designed using redundant fiber-optic cables. Our SONET rings are “self-healing,” which means that they provide for the very rapid, automatic redirection of network traffic so that our service will continue even if there is a single point of failure on a fiber ring.
6
Table of Contents
Index to Financial Statements
We distribute our bundled services from locations called hub sites, each of which is equipped with a generator and battery back-up power source to allow service to continue during a power outage. Additionally, individual nodes that are served by hubs are equipped with back-up generators or batteries. Our redundant fiber-optic cables and network powering systems allow us to provide circuit-based voice services consistent with industry reliability standards for traditional telephone systems.
We monitor our network 24 hours a day, seven days a week from our NOC in West Point, Georgia. Technicians in each of our service areas schedule and perform installations and repairs and monitor the performance of our interactive broadband network. We actively maintain the quality of our network to minimize service interruptions and extend the network’s operational life.
Video
We offer video services over our network in the same way that other traditional cable companies provide cable TV service. Our network is designed for an analog and digital two-way interactive transmission with fiber-optic cable carrying signals from the headend to hubs and to distribution points (nodes) within our customers’ neighborhoods, where the signals are transferred to our coaxial cable network for delivery to our customers.
Voice
We offer telephone service over our broadband network in much the same way local phone companies provide service. We install a network interface box outside a customer’s home or an Embedded Multimedia Terminal Adapter (EMTA) in the home to provide dial tone service. Our network interconnects with those of other local phone companies. We provide long-distance service using leased facilities from other telecommunications service providers. We have multiple Class 4 and Class 5 full-featured switches located in West Point, Georgia; Huguley and Ashford, Alabama; and Rapid City and Viborg, South Dakota that direct all of our voice traffic and allow us to provide enhanced custom calling services. We also operate telephone systems in Valley and Ashford, Alabama; West Point, Georgia; and Viborg, South Dakota where we are the rural incumbent telephone companies.
Data
We provide Internet access using high-speed cable modems in much the same way customers receive Internet services over modems linked to the local telephone network. We provide our customers with a high level of data transfer rates through multiple peering arrangements with tier-one Internet facility providers.
Our Bundled Service Offering
We offer a complete solution of video, voice and data services in all of our markets.
We offer a broad range of service bundles designed to address the varying needs and interests of existing and potential customers. We sell individual services at prices competitive to those of the incumbent providers, but attractively price additional services from our bundle. Bundling our services enables us to increase penetration, average revenue per customer (ARPC) and operating efficiencies, facilitate customer service, reduce customer acquisition and installation costs, and increase customer retention.
Our bundled strategy means that we may deliver more than one service to each customer, and therefore we report an aggregate number of connections for video, voice and data services. For example, a single customer who purchases video, voice and data services would count as three connections.
7
Table of Contents
Index to Financial Statements
Video Services
We offer our customers a full array of video services and programming choices. Customers generally pay initial connection charges and fixed monthly fees for video service.
Our video service offering comprises the following:
| • | Analog Cable Service: All of our video customers receive a package of basic programming, which generally consists of local broadcast television and local community programming, including public, educational and government access channels. The expanded basic level of programming includes approximately 65 channels of satellite-delivered or non-broadcast channels, such as ESPN, MTV, USA, CNN, The Discovery Channel, Nickelodeon and various home shopping networks. |
| • | Digital Cable Service, HD channels, and Premiums: This digital level of service includes approximately 275 channels of digital programming, including our expanded basic cable service and approximately 46 music channels. We have introduced new service offerings to strengthen our competitive position and generate additional revenues, including high definition TV, digital video recorder, video-on-demand and subscription video-on-demand. Video-on-demand permits customers to order movies and other programming on demand with DVD-like functions on a fee-per-viewing basis. Subscription video-on-demand is a similar service that has specific content available from our premium channel offerings for an incremental charge. |
| • | Premium Channels: These channels, such as HBO, Showtime, Starz, Encore and Cinemax, provide commercial-free movies, sports and other special event entertainment programming and are available at an additional charge above our expanded basic and digital tiers of services. |
Our platform enables us to provide an attractive service offering of extensive programming as well as interactive services.
Voice Services
Our voice services include local and long-distance telephone services. Our telephone packages can be customized to include different combinations of the following core services:
| • | local area calling plans; |
| • | flat-rate local and long-distance plans; |
| • | calling features; and |
| • | measured and fixed rate toll packages based on usage. |
For local service, our customers pay a fixed monthly rate, per month that includes custom and advanced calling features such as call waiting, caller ID, caller ID on TV and voicemail.
Residential Data Services
We offer tiered data services to residential customers that include always-on high-speed connections to the Internet using cable modems. Intronet, a high speed service aimed at first-time or dial-up Internet users, is offered at a download speed of one megabit per second, which is faster than traditional dial-up but slower than our typical high-speed service, and priced at a discount to our faster products. Our standard Internet product provides a targeted download speed of six to eight megabits per second in non-DOCSIS 3.0 markets and download speeds of 12 to 15 megabits per second in DOCSIS 3.0 markets. The Edge product gives customers a higher download connection speed, offered at eight to fifteen megabits per second in non-DOCSIS 3.0 markets and download speeds of 22 to 50 megabits per second in DOCSIS 3.0 markets.
Our data packages generally include the following:
| • | specialized technical support 24 hours a day, seven days a week; |
8
Table of Contents
Index to Financial Statements
| • | access to exclusive local content, weather, national news, sports and financial reports; |
| • | value-added features such as e-mail accounts, on-line storage, spam protection and parental controls; and |
| • | a DOCSIS-compliant modem installed by a trained professional. |
Business Voice and Data Services
Our broadband network also supports services to business customers, and accordingly, we have developed a full suite of products for small, medium and large enterprises. We offer the traditional bundled product offering to these business customers. We also have developed new products to meet the more complex voice and data needs of the larger business sector. We offer pure fiber services, which enable our customers to have T-1 voice services, data speeds of up to 1 gigabit per second on our fiber network, and office-to-office VLAN services that provide a secure and managed connection between customer locations. We have introduced our Matrix product offering, which can replace customers’ aging, low functionality PBX products with an IP Centrex voice and data service that offers more flexible features at a lower cost. In addition, we have a Session Initiated Protocol (“SIP”) trunking service. It is a direct replacement for traditional telephone service used by large PBX customers and is delivered over our pure fiber services network and terminated via an Ethernet connection at the customer premise. We serve our business customers from locally based business offices with customer service and network support 24 hours a day, seven days a week.
Broadband Carrier Services
We use unused capacity on our network to offer wholesale services to other local and long distance telephone companies, Internet service providers and other integrated services providers, called broadband carrier services. This is additive to our core strategy and we believe our interactive broadband network offers other service providers a reliable and cost competitive alternative to other telecommunications service providers.
Customer Service
Customer service is an essential element of our operations and marketing strategy, and we believe our quality of service and responsiveness differentiates us from many of our competitors. A significant number of our employees are dedicated to customer service activities, including:
| • | sales and service upgrades; |
| • | customer activations and provisioning; |
| • | service issue resolutions; and |
| • | administration of our customer satisfaction programs. |
We provide customer service 24 hours a day, seven days a week. Our representatives are cross-trained to handle customer service transactions for all of our products and currently exceed the industry standards for call answer times. We operate two centralized customer service call centers in Augusta, Georgia and Sioux Falls, South Dakota, which handle all customer service transactions. In addition, we provide our business customers with a centralized Business Customer Care Center that is distinctly dedicated to our business customers 24 hours per day, 7 days per week. Also located in Augusta, Georgia, we have found this dedicated facility improves our responsiveness to customer needs and distinguishes our product in the market. We believe it is a competitive advantage to provide our customers with the convenience of a single point of contact for all customer service issues for our video, voice and data service offerings and is consistent with our bundling strategy.
We monitor our network 24 hours a day, seven days a week. Through our network operations center, we monitor our digital video, voice and data services to the customer level and our analog video services to the node level. We strive to resolve service delivery problems prior to the customer being aware of any service interruptions.
9
Table of Contents
Index to Financial Statements
Sales and Marketing
We believe that we were the first-to-market service provider of a bundled video, voice and data communications service package in each of our current markets, except the Pinellas market, which we entered via acquisition at the end of 2003. Our sales and marketing materials emphasize the convenience, savings and improved service that can be obtained by subscribing to our bundled services.
We position ourselves as the local provider of choice in our markets, with a strong local customer interface and community presence, while simultaneously taking advantage of economies of scale from the centralization of certain marketing functions.
We have a sales staff in each of our markets including managers and direct sales teams for both residential and business services. Our standard residential team consists of direct sales, front counter sales and local market coordination as well as support personnel. Our business services sales team consists of our account executives, specialized business installation coordinators and dedicated installation service teams. Our call center sales team handles all inbound and outbound telemarketing sales for residential and business services.
Our sales team is cross-trained on all our products to support our bundling strategy. The sales team is compensated based on new connections or revenue and is therefore motivated to sell more than one product to each customer. Our marketing and advertising strategy is to target bundled service prospects utilizing a broad mix of media tactics including broadcast television, cross channel cable spots, radio, social media channels, outdoor space, Internet and direct mail. We have utilized database-marketing techniques to shape our offers, segment and target our prospect base to increase response and reduce acquisition costs.
We have implemented customer relationship management and retention techniques, as well as customer referral tactics, including newsletters and personalized e-mail communications. These programs are designed to increase loyalty and retention and to vertically integrate our current base of customers.
Pricing for Our Products and Services
We attractively price our services to promote sales of bundled packages. We offer bundles of two or more services with tiered features and prices to meet the demands of a variety of customers. The bundles significantly reduce the number of plans our sales and call center personnel handle, simplifying the customer’s experience and reducing the products supported in the billing system. Product acceptance by new and existing customers has been strong.
We also sell individual services at prices competitive to those of the incumbent providers. An installation fee may be charged to new and reconnected customers. We charge monthly fees for customer premise equipment.
Programming
We purchase some of our programming directly from the program networks by entering into affiliation agreements with the programming suppliers. We also benefit from our membership with the National Cable Television Cooperative (NCTC), which enables us to take advantage of volume discounts. As of December 31, 2010, approximately 72% of our programming was sourced from the cooperative, which also handles our contracting and billing arrangements on this programming.
10
Table of Contents
Index to Financial Statements
Markets
Current Markets
As of December 31, 2010, we served the following markets with our interactive broadband network:
| Year Added |
Source |
Market |
Marketable Homes 12/31/2010 |
Year Services First Offered By Knology |
||||||||||||||||
| Video | Voice | Data | ||||||||||||||||||
| 1995 | Acquired |
Montgomery, AL | 95,026 | 1995 | 1997 | 1997 | ||||||||||||||
| 1995 | Acquired | Columbus, GA | 74,363 | 1995 | 1998 | 1998 | ||||||||||||||
| 1997 | Acquired | Panama City, FL | 66,430 | 1997 | 1998 | 1998 | ||||||||||||||
| 1998 | Acquired | Huntsville, AL | 89,756 | 1998 | 1999 | 1999 | ||||||||||||||
| 1998 | Built | Charleston, SC | 72,682 | 1998 | 1998 | 1998 | ||||||||||||||
| 1998 | Built | Augusta, GA | 58,001 | 1998 | 1998 | 1998 | ||||||||||||||
| 1999 | Acquired | West Point, GA | 14,381 | 1999 | 1999 | 1999 | ||||||||||||||
| 2000 | Built | Knoxville, TN | 43,165 | 2001 | 2001 | 2001 | ||||||||||||||
| 2003 | Acquired | Pinellas, FL | 276,924 | 2003 | 2004 | 2003 | ||||||||||||||
| 2007 | Acquired | Rapid City, SD | 52,242 | 2007 | 2007 | 2007 | ||||||||||||||
| 2007 | Acquired | Sioux Falls, SD | 67,072 | 2007 | 2007 | 2007 | ||||||||||||||
| 2008 | Acquired | Dothan, AL | 22,792 | 2008 | 2008 | 2008 | ||||||||||||||
| 2010 | Acquired | Lawrence, KS | 63,142 | 2010 | 2010 | 2010 | ||||||||||||||
New Markets
We plan to evaluate expansion of our operations to other markets that have the critical mass, market conditions, demographics and geographical location consistent with our business strategy. We will evaluate target cities that have the following characteristics, among others:
| • | targeted return requirements; |
| • | an average of at least 70 homes per mile; |
| • | competitive dynamics that allow us to be the leading provider of integrated video, voice and data services; and |
| • | conditions that will afford us the opportunity to capture a substantial number of customers. |
Competition
We have at least one competitor in each market. Our competition comes from a variety of communications companies because of the broad number of video, voice and data services we offer. Competition is based on service, content, reliability, bundling, value and convenience. Virtually all markets for video, voice and data services are extremely competitive, and we expect that competition will intensify in the future. Our competitors are often larger, better-financed companies with greater access to capital resources. These incumbents presently have numerous advantages as a result of their historic monopolistic control of their respective markets, brand recognition, economies of scale and scope and control of limited conduit relationships.
Video Services
Cable television providers. Cable television systems are operated under non-exclusive franchises granted by local authorities, which may result in more than one cable operator providing video services in a particular market. Other cable television operations exist in each of our current markets and many of those operations have long-standing customer relationships with the residents in those markets. Our competitors currently include Bright House Networks (Bright House), Charter Communications, Inc. (Charter), Comcast Corporation (Comcast), Mediacom Communication Corporation (Mediacom), Midcontinent Communications (Midco) and
11
Table of Contents
Index to Financial Statements
Time Warner Cable, Inc. (Time Warner). We also encounter competition from direct broadcast satellite systems, including Direct TV, Inc. (DirecTV) and Echostar Communications Corporation (Dish Networks) that transmit signals to small dish antennas owned by the end-user.
Other television providers. Cable television distributors may, in some markets, compete for customers with other video programming distributors and other providers of entertainment, news and information. Alternative methods of distributing the same or similar video programming offered by cable television systems exist. Congress and the FCC have encouraged these alternative methods and technologies in order to offer services in direct competition with existing cable systems. These competitors include local telephone companies and Internet content providers.
We compete with systems that provide multichannel program services directly to hotel, motel, apartment, condominium and other multiunit complexes through a satellite master antenna—a single satellite dish for an entire building or complex. These systems are generally free of any regulation by state and local governmental authorities. Pursuant to the 1996 Act, these systems, called satellite master antenna television systems, are not commonly owned or managed and do not cross public rights-of-way and, therefore, do not need a franchise to operate.
The 1996 Act eliminated many restrictions on local telephone companies offering video programming and we may face increased competition from those companies. Several major local telephone companies, including AT&T Inc. (AT&T), CenturyTel, Inc. (CenturyTel), Qwest Communications (Qwest) and Verizon Communications Inc. (Verizon), started to provide video services to homes.
In addition to other factors, we compete with these companies using programming content, including the number of channels and the availability of local programming. We obtain our programming by entering into contracts or arrangements with video programming suppliers. A programming supplier may enter into an exclusive arrangement with one of our video competitors, creating a competitive disadvantage for us by restricting our access to programming.
Voice Services
In providing local and long-distance voice services, we compete with the incumbent local phone company, various long-distance providers and VoIP telephone providers in each of our markets. AT&T, CenturyTel, Qwest and Verizon are the incumbent local phone companies in our current markets and are particularly strong competitors. We also compete with a number of providers of long-distance telephone services, such as AT&T, CenturyTel (which acquired Embarq Communications in 2009) and Verizon. In addition, we compete with a variety of smaller, more regional, competitors that lease network components from AT&T, CenturyTel, Qwest or Verizon and focus on the commercial segment of our markets.
We expect to continue to face intense competition in providing our telephone and related telecommunications services. The 1996 Act allows service providers to enter markets that were previously closed to them. Incumbent local exchange carriers (ILECs) are no longer protected from significant competition in local service markets.
We are anticipating an increase in the deployment of VoIP telephone services. Following years of development, VoIP has been deployed by a variety of service providers including the other Multiple System Operators (MSOs) that we compete against and independent service providers such as Vonage Holding Corporation. Unlike circuit switched technology, this technology does not require ownership of the last mile and eliminates the need to rent the last mile from the Regional Bell Operating Companies (RBOCs). VoIP is essentially a data service and can be more feature-rich than traditional circuit-switched telephone service. The VoIP providers have differing levels of success based on their brand recognition, financial support, technical abilities, and legal and regulatory decisions.
12
Table of Contents
Index to Financial Statements
Wireless telephone service is viewed by some consumers as a supplement to, and sometimes a replacement for, traditional telephone service. Wireless service is priced on a flat-rate or usage-sensitive basis and rates are decreasing quarterly. We expect there to be more competition between providers of wireless and traditional telephone service in the future.
Data Services
Competition for data services is rapidly growing in each of our markets, coming from cable television companies, ILECs that provide dial-up and DSL services, and satellite and other wireless Internet access services. Some of our competitors benefit from greater experience, resources, marketing capabilities and name recognition. The incumbent cable television company in each of our markets currently offers high-speed Internet access services for both residential and business customers. The data offerings from the competitors include a range of services from DSL to gigabit Ethernet.
A large number of companies provide businesses and individuals with Internet access and a variety of supporting services. These companies can offer services over traditional telephone networks or broadband data networks. Our services are offered via pure and hybrid fiber network connections. Additional services include spam filtering, email, private web space, online storage, customizable news and entertainment content.
Bundled Services
Most of our competitors have deployed their own versions of the triple-play bundle in our markets. Comcast, Charter, Bright House, Mediacom, Midco and other MSOs have launched VoIP and thereby enabled their third service offering.
AT&T, CenturyTel, Qwest and Verizon initiated agreements/partnerships with satellite providers enabling their third service offering, video. AT&T (U-Verse), CenturyTel and Verizon (FiOS) have begun to provide video via their broadband networks. Thus far, Verizon (FiOS) has deployed broadband video in a portion of Pinellas and AT&T has deployed video (U-Verse) in our Lawrence market.
Knology believes that its emphasis on customer service must continue to be a strategic initiative, and the additional focus on technology and deploying broadband data applications is the way to retain and attract customers.
Legislation and Regulation
We operate in highly regulated industries and both our cable television and telecommunications voice services are subject to regulation at the federal, state and local levels. Our Internet services are subject to more limited regulation. The following is a summary of laws and regulations affecting the growth and operation of the cable television and telecommunications industries. It does not purport to be a complete summary of all present and proposed legislation and regulations pertaining to our operations.
Regulation of Cable Services
The FCC, the principal federal regulatory agency with jurisdiction over cable television, has promulgated regulations covering many aspects of cable television operations. The FCC may enforce its regulations through the imposition of fines, the issuance of cease and desist orders and/or the imposition of other administrative sanctions. A brief summary of certain key federal regulations follows.
Rate regulation. The Cable Television Consumer Protection and Competition Act of 1992 (the 1992 Cable Act) authorized rate regulation for certain cable services and equipment. It also eliminated oversight by the FCC and local franchising authorities of all but the basic service tier. Cable service rate regulation does not apply where a cable operator demonstrates to the FCC that it is subject to effective competition in the community. We are not currently subject to rate regulation in any of our markets.
13
Table of Contents
Index to Financial Statements
Program access. To promote competition between incumbent cable operators and independent cable programmers, the 1992 Cable Act placed restrictions on dealings between cable programmers and cable operators. Satellite video programmers affiliated with cable operators are prohibited from favoring those cable operators over competing distributors of multichannel video programming, such as satellite television operators and competitive cable operators such as us. The existing ban on these exclusive contracts will remain in place until October 5, 2012.
The Communications Act of 1934, as amended (the Communications Act) requires cable systems with 36 or more channels must make available a portion of their channel capacity for commercial leased access by third parties to facilitate competitive programming efforts. We have not been subject to many requests for carriage under the leased access rules. However, the FCC has modified the way that cable operators must calculate their rates for such access. It is possible that, unless this change is reversed on appeal, there may be more carriage requests in the future. We cannot assure that we would be able to recover our costs under the new methodology or that the use of our network capacity for such carriage would not materially impact our ability to compete effectively in our markets.
Carriage of broadcast television signals. The 1992 Cable Act established broadcast signal carriage requirements that allow local commercial television broadcast stations to elect every three years whether to require the cable system to carry the station (“must-carry”) or whether to require the cable system to negotiate for consent to carry the station (retransmission consent). The most recent election by broadcasters became effective on January 1, 2009. For local, non-commercial stations, cable systems are subject to limited must-carry obligations but are not required to renegotiate for retransmission consent. We now carry most stations pursuant to retransmission consent agreements and pay fees for such consents or have agreed to carry additional services. We carry other stations pursuant to must-carry elections.
All cable television systems must file a registration statement with the FCC and periodically file various informational reports with the FCC. Cable operators that operate in certain frequency bands, including us, are required on an annual basis to file the results of their periodic cumulative leakage testing measurements. Operators that fail to make this filing or who exceed certain leakage indices risk sanctions including being prohibited from operating in those frequency bands.
Franchise authority. Cable television systems operate pursuant to franchises issued by franchising authorities (which are the states, cities, counties or political subdivisions in which a cable operator provides cable service). Franchising authority is premised upon the cable operator’s facilities crossing the public rights-of-way. Franchises must be nonexclusive. The terms of franchises, while variable, typically include requirements concerning service rates, franchise fees, construction timelines, mandated service areas, customer service standards, technical requirements, public, educational and government access channels, and channel capacity. Franchises often may be terminated, or penalties may be assessed, if the franchised cable operator fails to adhere to the conditions of the franchise. Although largely discretionary, the exercise of state and local franchise authority is limited by federal statutes and regulations adopted pursuant thereto. We believe that the conditions in our franchises are fairly typical for the industry. Our franchises generally provide for the payment of fees of 5% of cable service revenues.
On December 20, 2006, the FCC established rules and provided guidance pursuant to the Communications Act, prohibiting local franchising authorities from unreasonably refusing to award competitive franchises for the provision of cable services. In order to eliminate the unreasonable barriers to entry into the cable market, and to encourage investment in broadband facilities, the FCC preempted local laws, regulations, and requirements, including local level-playing-field provisions, to the extent they impose greater restrictions on market entry than those adopted under the order. This order benefits us by facilitating our provision of cable service in a more expeditious manner subject to fewer requirements imposed by local franchising authorities.
Many state legislatures have enacted legislation streamlining the franchising process, including having the state, instead of local governments, issue franchises. Of particular relevance to Knology, states with new laws
14
Table of Contents
Index to Financial Statements
include Florida, Georgia, Iowa, Kansas, South Carolina and Tennessee. These laws enable Knology to expand its operations more rapidly and with fewer government-imposed obligations. At the same time, they enable easier entry by other providers into Knology’s service territories.
Franchise renewal. Franchise renewal, or approval for the sale or transfer of a franchise, may involve the imposition of additional requirements not present in the initial franchise and although franchise renewal is not guaranteed, federal law imposes certain standards to prohibit the arbitrary denial of franchise renewal. Our franchises generally have 10 to 15 year terms, and we expect our franchises to be renewed by the relevant franchising authority. The 2006 FCC order discussed in the “Franchise authority” section above reduces the potential for unreasonable conditions being imposed during renewal.
Pole attachments. The 1996 Act requires all local telephone companies and electric utilities, except those owned by municipalities and co-operatives, to provide cable operators and telecommunications carriers (with the exception of ILECs) with nondiscriminatory access to poles, ducts, conduit and rights-of-way at just and reasonable rates, except where states have certified to the FCC that they regulate pole access and pole attachment rates. The right to access is beneficial to facilities-based providers such as us. Federal law also establishes principles to govern the pricing of and terms of such access. Currently, 19 states plus the District of Columbia have certified to the FCC, leaving pole attachment matters to be regulated by those states. Of the states in which we operate, none has certified to the FCC. The FCC has clarified that the provision of Internet services by a cable operator does not affect the agency’s jurisdiction over pole attachments by that cable operator, nor does it affect the rate formula otherwise applicable to the cable operator.
Internet service. The FCC has rejected requests by some Internet service providers to require cable operators to provide unaffiliated Internet service providers with direct access to the operators’ broadband facilities. Although the FCC has indicated a clear preference for minimizing regulation of broadband services, future regulation of cable modem service by federal, state or local government entities remains possible. The future regulation of cable modem service could have a material adverse effect on our business, results of operations and financial condition. See also “Regulation of Telecommunications Services—Regulatory treatment of cable modem service” below.
Tier buy-through. The tier buy-through prohibition of the 1992 Cable Act generally prohibits cable operators from requiring subscribers to purchase a particular service tier, other than the basic service tier, in order to obtain access to video programming offered on a per-channel or per-program basis. In general, a cable television operator has the right to select the channels and services that are available on its cable system. With the exception of certain channels, such as local broadcast television channels, that are required to be carried by federal law as part of the basic tier, as discussed above, the cable operator has broad discretion in choosing the channels that will be available and how those channels will be packaged and marketed to subscribers. In order to maximize the number of subscribers, the cable operator selects channels that are likely to appeal to a broad spectrum of viewers. If the Congress or the FCC were to place more stringent requirements on how we package our services, it could have an adverse effect on our profitability.
Potential regulatory changes. The regulation of cable television systems at the federal, state and local levels is subject to the political process and has seen constant change over the past decade. Material additional changes in the law and regulatory requirements, both those described above and others such as the regulatory fees we pay the FCC as a cable operator and wireless licensee, must be anticipated in the future, even if what those changes will be cannot be ascertained with any certainty at this time. Our business could be adversely affected by future regulations.
Regulation of Telecommunication Services
Our telecommunications services are subject to varying degrees of federal, state and local regulation. Pursuant to the Communications Act, as amended by the 1996 Act, the FCC generally exercises jurisdiction over the facilities of, and the services offered by, telecommunications carriers that provide interstate or international
15
Table of Contents
Index to Financial Statements
communications services. Barring federal preemption, state regulatory authorities retain jurisdiction over the same facilities to the extent that they are used to provide intrastate communications services, as well as facilities solely used to provide intrastate services. Local regulation is largely limited to management of the occupation and use of county or municipal public rights-of-way. Various international authorities may also seek to regulate the provision of certain services.
Regulation of Local Exchange Operations
Our four ILEC subsidiaries are regulated by both federal and state agencies. Our interstate products and services and the regulated earnings are subject to federal regulation by the FCC and our local and intrastate products and services and the regulated earnings are subject to regulation by state Public Service Commissions (PSCs). The FCC has principal jurisdiction over matters including, but not limited to, interstate switched and special access rates. It also regulates the rates that ILECs may charge for the use of their local networks in originating or terminating interstate and international transmissions. The PSCs have jurisdiction over matters including local service rates, intrastate access rates and the quality of service.
The Communications Act places certain obligations, including those described below, on ILECs to open their networks to competitive access as well as heightened interconnection obligations and a duty to make their services available to resellers at a wholesale discount rate. The following are certain obligations that the Communications Act and the 1996 Act place on ILECs, which gives us important rights to connect with the networks of ILECs in areas where we operate:
| • | Interconnection. Preempts laws that prohibit competition for local telephone services, establishes requirements and standards for local network interconnection, unbundling of network elements, and resale and requires ILECs to enter into mutual compensation arrangements with competing local exchange carriers (CLECs) for transport and termination of local calls on each other’s networks. |
| • | Reciprocal Compensation. Requires all ILECs and CLECs to complete calls originated by competing local exchange carriers under reciprocal arrangements at prices set by the FCC, public utilities commissions or at negotiated prices. |
| • | Collacation of Equipment. Allows CLECs to install and maintain their own network equipment in ILEC central offices. |
| • | Number Portability. Requires all providers of telecommunications services, as well as providers of interconnected VoIP service, to permit users of telecommunications services to retain existing telephone numbers without impairment of quality, reliability or convenience when switching from one telecommunications provider to another. Although number portability generally benefits our CLEC operations, it represents a burden to Valley Telephone, Knology of the Valley, Inc., Knology Community Telephone and Knology Total Communications. |
| • | Dialing Parity. Requires ILECs and CLECs to establish dialing parity so that all customers must dial the same number of digits to place the same type of call. |
| • | Access to Rights-of-Way. Requires ILECs to permit competing carriers access to poles, ducts, conduits and rights-of-way at regulated prices. |
We have state-PSC approved local interconnection agreements with AT&T , CenturyTel (which acquired Embarq Communications in 2009), Qwest, and Verizon for, among other things, the transport and termination of local telephone traffic. These arrangements are subject to changes as a result of changes in laws and regulations, and there is no guarantee that the rates and terms concerning our interconnection arrangements with incumbent local carriers under which we operate today will be available in the future.
Inter-Carrier Compensation
Our ILEC subsidiaries currently receive compensation from other telecommunications providers, including long distance companies, for origination and termination of interexchange traffic through network access charges
16
Table of Contents
Index to Financial Statements
that are established in accordance with state and federal laws. Accordingly, we benefit from the receipt of intrastate and interstate long distance traffic. The FCC and many PSCs are considering proposals to substantially reduce both access charges and reciprocal compensation payments. See also “Regulatory treatment of VoIP services” below. Revenue arising out of inter-carrier compensation could be at risk as these proposals are implemented.
Regulatory treatment of VoIP services.
Currently, the FCC and state regulators do not treat most IP-enabled enhanced services, as regulated telecommunications services. A number of providers are using VoIP to compete with our voice services, and some providers using VoIP may be avoiding certain regulatory burdens or access charges for interexchange services that might otherwise be due if such voice over IP offerings were subject to regulation. The FCC has initiated a rulemaking proceeding to examine issues relating to IP-enabled services, including VoIP services. We cannot predict when or if the FCC will issue a final decision in this proceeding. The FCC currently has before it a series of petitions for declaratory rulings requesting clarification on which parties are interexchange carriers for purposes of access charge liability on any IP-enabled traffic subject to access charges, whether interexchange carriers not directly connected to local exchange carriers (“LECs”) can be subject to access charges, and whether intermediate, terminating LECs can rely on certification by their customers that traffic is enhanced services traffic in making decisions regarding the routing of an intercarrier compensation for access traffic and other issues. (See also “—Forbearance and other relief to dominant carriers” below) Decisions and regulations adopted in these and other similar proceedings could lead to an increase in the costs of VoIP providers if they become subject to additional regulation, and may change the compensation structure for IP-enabled services. At this time, we are unable to predict the impact, if any, that additional regulatory action on these issues will have on our business. Other aspects of VoIP and Internet telephony services, such as regulations relating to the confidentiality of data and communications, copyright issues, taxation of services, cooperation with law enforcement, licensing and 911 emergency access, may be subject to federal or state regulation.
Forbearance and other relief to dominant carriers.
The 1996 Act permits the FCC to forbear from requiring telecommunications carriers to comply with certain regulations if certain conditions that make the regulations unnecessary are present. Future reduction or elimination of federal regulatory requirements could free us from regulatory burdens, but also might increase the relative flexibility of our major competitors. As a result of grants of forbearance, our costs (and those of our competitors) of purchasing broadband services from carriers could increase significantly, as the rates, terms and conditions offered in non-tariffed “commercial agreements” may become less favorable and we may not be able to purchase services from alternative vendors. Changes to the rates, terms and conditions under which we purchase broadband services may increase our costs and, thus, may have a material adverse effect on our business, results of operations, and financial condition.
Access to, and competition in, multiple tenant properties by and among telecommunications carriers.
The FCC has prohibited telecommunications carriers from entering into exclusive access agreements with building owners or managers in both commercial and residential multi-tenant environments. The FCC has also adopted rules requiring utilities (including LECs) to provide telecommunications carriers (and cable operators) with reasonable and non-discriminatory access to utility-owned or controlled conduits and rights-of-way in all multiple tenant environments (e.g., apartment buildings, office buildings, campuses, etc.) in those states where the state government has not certified to the FCC that it regulates utility pole attachments and rights-of-way matters. These requirements may facilitate our access (as well as the access of competitors) to customers in multi-tenant environments, at least with regard to our provision of telecommunications services.
Customer proprietary network information.
FCC rules protect the privacy of certain information about customers that communications carriers, including us, acquire in the course of providing communications services. Such protected information, known as
17
Table of Contents
Index to Financial Statements
Customer Proprietary Network Information (CPNI), includes information related to the quantity, technological configuration, type, destination and the amount of use of a communications service. Certain states have also adopted state-specific CPNI rules. The FCC’s rules require carriers to implement policies to notify customers of their rights, take reasonable precautions to protect CPNI, notify law enforcement agencies if a breach of CPNI occurs, and file a certification with the FCC stating that its policies and procedures ensure compliance. We filed our most recent compliance certificate with the FCC on February 25, 2011, stating that we use our subscribers’ CPNI in accordance with applicable regulatory requirements. However, if a federal or state regulatory body determines that we have implemented the FCC’s requirements incorrectly, we could be subject to fines or penalties. Additionally, the FCC is considering whether additional security measures should be adopted to prevent the unauthorized disclosure of sensitive customer information held by telecommunications companies.
Taxes and regulatory fees.
We are subject to numerous local, state and federal taxes and regulatory fees, including but not limited to FCC regulatory fees and public utility commission regulatory fees. We have procedures in place to ensure that we properly collect taxes and fees from our customers and remit such taxes and fees to the appropriate entity pursuant to applicable law and/or regulation. If our collection procedures prove to be insufficient or if a taxing or regulatory authority determines that our remittances were inadequate, we could be required to make additional payments, which could have a material adverse effect on our business.
Environmental Regulation
We are subject to a variety of federal, state, and local environmental, safety and health laws, and regulations governing matters such as the generation, storage, handling, use, and transportation of hazardous materials, the emission and discharge of hazardous materials into the atmosphere, the emission of electromagnetic radiation, the protection of wetlands, historic sites, and endangered species and the health and safety of employees. We also may be subject to laws requiring the investigation and cleanup of contamination at sites we own or operate or at third-party waste disposal sites. Such laws often impose liability even if the owner or operator did not know of, or was not responsible for, the contamination. We operate several sites in connection with our operations. Our switch site and some customer premise locations are equipped with back-up power sources in the event of an electrical failure. Each of our switch site locations has battery and diesel fuel powered backup generators, and we use batteries to back-up some of our customer premise equipment. We believe that we currently are in compliance with the relevant federal, state, and local requirements in all material respects, and we are not aware of any liability or alleged liability at any operated sites or third-party waste disposal sites that would be expected to have a material adverse effect on us.
Franchises
As described above, cable television systems and local telephone systems generally are constructed and operated under the authority of nonexclusive franchises, granted by local and/or state governmental authorities. Franchises typically contain many conditions, such as time limitations on commencement and completion of system construction, customer service standards including number of channels, the provision of free service to schools and certain other public institutions and the maintenance of insurance and indemnity bonds. As of December 31, 2010, Knology held approximately 100 cable franchises. We are currently in the process of renegotiating one of our existing franchises in Huntsville, Alabama.
Local regulation of cable television operations and franchising matters is currently subject to federal regulation under the Communications Act and the corresponding regulations of the FCC. As discussed in the “Legislation and Regulation” section above, the FCC has taken recent steps toward streamlining the franchising process. See “Legislation and Regulation—Regulation of Cable Services” above.
Prior to the scheduled expiration of most franchises, we may initiate renewal proceedings with the relevant franchising authorities. The Cable Communications Policy Act of 1984 provides for an orderly franchise renewal
18
Table of Contents
Index to Financial Statements
process in which the franchising authorities may not unreasonably deny renewals. If a renewal is withheld and the franchising authority takes over operation of the affected cable system or awards the franchise to another party, the franchising authority must pay the cable operator the “fair market value” of the system. The Cable Communications Policy Act of 1984 also established comprehensive renewal procedures requiring that the renewal application be evaluated on its own merit and not as part of a comparative process with other proposals.
Employees
At December 31, 2010 we had 1,846 full-time employees. We consider our relations with our employees to be good, and we structure our compensation and benefit plans in order to attract and retain high-caliber personnel. We will need to recruit additional employees in order to implement our expansion plan, including general managers for each new city and additional personnel for installation, sales, customer service and network construction. We recruit from several major industries for employees with skills in video, voice and data technologies.
Executive Officers of the Registrant
Information regarding our executive officers is included in Part III, Item 10 of this annual report and incorporated herein by reference.
| ITEM 1A. | RISK FACTORS |
Risks Related to Our Business
We have a history of net losses and may not be profitable in the future.
As of December 31, 2010, we had an accumulated deficit of $626.7 million. Our ability to generate profits will depend in large part on our ability to increase our revenues to offset the costs of operating our network and providing services. If we cannot achieve and maintain operating profitability or positive cash flow from operating activities, our business, financial condition and operating results will be adversely affected.
Failure to obtain additional funding may limit our ability to expand our business.
As of December 31, 2010, we had working capital of $20.4 million. If we expand our build out in existing or new markets, it will have to be funded by cash flow from operations or from additional financings. Because of our substantial indebtedness and potential adverse changes in the capital markets, our ability to raise additional capital on a timely basis and with acceptable terms or at all is uncertain, and our ability to make distributions or payments is subject to availability of funds and restrictions under our debt instruments and under applicable law. See “Item 7. Management’s Discussion and Analysis of Financial Condition and Results of Operations—Liquidity and Capital Resources.”
Our substantial indebtedness may adversely affect our cash flows, future financing and flexibility.
As of December 31, 2010, we had approximately $731.3 million of outstanding indebtedness, including accrued interest, and our stockholders’ deficit was $15.9 million. We pay interest in cash on our indebtedness. Our level of indebtedness could adversely affect our business in a number of ways, including:
| • | we may have to dedicate a significant amount of our available funding and cash flow from operating activities to the payment of interest and the repayment of principal on outstanding indebtedness; |
| • | depending on the levels of our outstanding debt and the terms of our debt agreements, we may have trouble obtaining future financing for working capital, capital expenditures, general corporate and other purposes, especially given the current volatility and disruption in the capital and credit markets and the deterioration of general economic conditions; |
| • | high levels of indebtedness may limit our flexibility in planning for or reacting to changes in our business; and |
19
Table of Contents
Index to Financial Statements
| • | increases in our outstanding indebtedness and leverage will make us more vulnerable to adverse changes in general economic and industry conditions, as well as to competitive pressure. |
We may not be able to make future principal and interest payments on our indebtedness.
Our ability to make future principal and interest payments on our debt depends upon our future performance, which is subject to general economic conditions, industry cycles and financial, business and other factors affecting our operations, many of which are beyond our control. It is difficult to assess the impact that the general economic downturn and recent turmoil in the capital and credit markets will have on future operations and financial results. We believe that the general economic downturn could result in reduced spending by customers and advertisers, which could reduce our revenues and our cash flows from operating activities from those that otherwise would have been generated. If we cannot grow and generate sufficient cash flow from operating activities to service our debt payments, we may be required, among other things to:
| • | seek additional financing in the debt or equity markets; |
| • | refinance or restructure all or a portion of our debt; |
| • | sell selected assets; or |
| • | reduce or delay planned capital expenditures. |
These measures may not be sufficient to enable us to service our debt. In addition, any such financing, refinancing or sale of assets may not be available on commercially reasonable terms, or at all, especially given the recent volatility and disruption in the capital and credit markets and the deterioration of general economic conditions in the United States.
Restrictions on our business imposed by our credit agreements could limit our growth or activities.
Our credit agreements place operating and financial restrictions on us and our subsidiaries. These restrictions affect, and any restrictions created by future financings will affect, our subsidiaries’ ability to, among other things:
| • | incur additional debt; |
| • | create or incur liens on our assets; |
| • | make certain investments; |
| • | use the proceeds from the sale of assets; |
| • | pay cash dividends on or redeem or repurchase our capital stock; |
| • | utilize excess liquidity except for debt reduction; |
| • | engage in potential mergers and acquisitions, sale/leaseback transactions or other fundamental changes in the nature of our business; and |
| • | make capital expenditures. |
In addition, our credit facilities require us to maintain specified financial ratios, such as debt to EBITDA (earnings before income, taxes, depreciation and amortization) and EBITDA to cash interest. These limitations may affect our ability to finance our future operations or to engage in other business activities that may be in our interest. If we violate any of these restrictions or any restrictions created by future financings, we could be in default under our agreements and be required to repay our debt immediately rather than at scheduled maturity.
Weakening economic conditions may have a negative impact on our results of operations and financial condition.
During 2010, the global financial markets continued to display uncertainty, and the equity and credit markets experienced extreme volatility, which caused already weak economic conditions to worsen. A substantial
20
Table of Contents
Index to Financial Statements
portion of our revenue comes from residential customers whose spending patterns may be affected by prevailing economic conditions. To the extent these conditions continue, customers may reduce the advanced or premium services to which they subscribe, or may discontinue subscribing to one or more of our video, voice or data services. This risk may be worsened by the expanded availability of free or lower cost competitive services, such as video streaming over the Internet, or substitute services, such as wireless phones. If these economic conditions continue to deteriorate, the growth of our business and results of operations may be adversely affected.
The soundness of financial institutions could adversely affect us.
Our ability to borrow under our credit facilities and to engage in other routine funding transactions could be adversely affected by the actions and commercial soundness of financial services institutions. Financial services institutions are interrelated as a result of trading, clearing, counterparty or other relationships. We have exposure to different counterparties, and we execute transactions with counterparties in the financial services industry, including commercial banks, investment banks and other financial institutions. Defaults by, or even rumors or questions about one or more financial services institutions, or the financial services industry generally, have led to market-wide liquidity problems and could affect our liquidity or lead to losses or defaults by us.
Our exposure to the credit risks of our customers, vendors and third parties could adversely affect our cash flow, results of operations and financial condition.
We are exposed to risks associated with the potential financial instability of our customers, many of whom may be adversely affected by the general economic downturn. Dramatic declines in the housing market over the past year, including falling home prices and increasing foreclosures, together with significant unemployment, have severely affected consumer confidence and may cause increased delinquencies or cancellations by our customers or lead to unfavorable changes in the mix of products purchased. The general economic downturn also may affect advertising sales, as companies seek to reduce expenditures and conserve cash. Any of these events may adversely affect our cash flow, results of operations and financial condition.
In addition, we are susceptible to risks associated with the potential financial instability of the vendors and third parties on which we rely to provide products and services or to which we delegate certain functions. The same economic conditions that may affect our customers, as well as volatility and disruption in the capital and credit markets, also could adversely affect vendors and third parties and lead to significant increases in prices, reduction in output or the bankruptcy of our vendors or third parties upon which we rely. Any interruption in the services provided by our vendors or by third parties could adversely affect our cash flow, results of operation and financial condition.
We may not be able to integrate acquired businesses successfully.
Our future growth and profitability will depend in part on the success of integrating acquired operations into our operations. Our ability to successfully integrate such operations will depend on a number of factors, including our ability to devote adequate personnel to the integration process while still managing our current operations effectively. We may experience difficulties in integrating the acquired businesses, which could increase our costs or adversely impact our ability to operate our business.
Future acquisitions and joint ventures could strain our business and resources.
If we acquire existing companies or networks or enter into joint ventures, we may:
| • | miscalculate the value of the acquired company or joint venture; |
| • | divert resources and management time; |
| • | experience difficulties in integrating the acquired business or joint venture with our operations; |
21
Table of Contents
Index to Financial Statements
| • | experience relationship issues, such as with customers, employees and suppliers as a result of changes in management; |
| • | incur additional liabilities or obligations as a result of the acquisition or joint venture; and |
| • | assume additional financial burdens or dilution in connection with the transaction. |
Additionally, ongoing consolidation in our industry may reduce the number of attractive acquisition targets.
The demand for our bundled broadband communications services may be lower than we expect.
The demand for video, voice and data services, either alone or as part of a bundle, cannot readily be determined. Our business could be adversely affected if demand for bundled broadband communications services is materially lower than we expect. Our ability to generate revenue will suffer if the markets for the services we offer, including voice and data services, fail to develop, grow more slowly than anticipated or become saturated with competitors.
Competition from other providers of video services could adversely affect our results of operations.
To be successful, we will need to retain our existing video customers and attract video customers away from our competitors. Some of our competitors have advantages over us, such as long-standing customer relationships, larger networks, and greater experience, resources, marketing capabilities and name recognition. In addition, a continuing trend toward business combinations and alliances in cable television and in the telecommunications industry as a whole, as well as changes in the regulatory environment facilitating entry for additional providers of video service, may result in the emergence of significant new competitors for us. In providing video service, we currently compete with Bright House, Charter, Comcast, Mediacom, Midco and Time Warner. We also compete with satellite television providers, including DirecTV and Echostar. Legislation now allows satellite television providers to offer local broadcast television stations. This may reduce our current advantage over satellite television providers and our ability to attract and maintain customers.
The providers of video services in our markets have, from time to time, adopted promotional discounts. We expect these promotional discounts in our markets to continue into the foreseeable future and additional promotional discounts may be adopted. We may need to offer additional promotional discounts to be competitive, which could have an adverse impact on our revenues. In addition, incumbent local phone companies may market video services in their service areas to provide a bundle of services. As telephone service providers offer video services in our markets, it could increase our competition for our video and voice services and for our bundled services.
Competition from other providers of voice services could adversely affect our results of operations.
In providing local and long-distance telephone services, we compete with the incumbent local phone company in each of our markets. AT&T, CenturyTel, Qwest and Verizon are the primary ILECs in our targeted region. They offer both local and long-distance services in our markets and are particularly strong competitors. To succeed, we must also attract customers away from other telephone companies, and cable television service operators offering telephone services with Internet-based telephony. Cable operators offering voice services in our markets increase competition for our bundled services.
Competition from other providers of data services could adversely affect our results of operations.
Providing data services is a rapidly growing business and competition is increasing in each of our markets. Some of our competitors have advantages over us, such as greater experience, resources, marketing capabilities and name recognition. In providing data services, we compete with:
| • | local telephone companies that provide dial-up and DSL services; |
| • | providers of wireless or satellite-based Internet access services; and |
| • | cable television companies. |
22
Table of Contents
Index to Financial Statements
In addition, some providers of data services have reduced prices and engaged in aggressive promotional activities. We expect these price reductions and promotional activities to continue into the foreseeable future and additional price reductions may be adopted. We may need to lower our prices for data services to remain competitive and this could adversely affect our results of operations.
Our programming costs are increasing, which could reduce our gross profit.
Programming has been our largest single operating expense and we expect this to continue. In recent years, the cable industry has experienced rapid increases in the cost of programming, particularly sports programming. Further, local commercial television broadcast stations are beginning to charge retransmission fees, similar to fees charged by other program providers. Our relatively small base of subscribers limits our ability to negotiate lower programming costs. We expect these increases to continue, and we may not be able to pass our programming cost increases on to our customers. In addition, as we increase the channel capacity of our systems and add programming to our expanded basic and digital programming tiers, we may face additional market constraints on our ability to pass programming costs on to our customers. Any inability to pass programming cost increases on to our customers would have an adverse impact on our gross profit. See “Item 1. Business—Legislation and Regulation—Regulation of Cable Services” for more information.
Programming exclusivity in favor of our competitors could adversely affect the demand for our video services.
We obtain our programming by entering into contracts or arrangements with programming suppliers. A programming supplier could enter into an exclusive arrangement with one of our video competitors that could create a competitive advantage for that competitor by restricting our access to this programming. If our ability to offer popular programming on our cable television systems is restricted by exclusive arrangements between our competitors and programming suppliers, the demand for our video services may be adversely affected and our cost to obtain programming may increase. See “Item 1. Business—Legislation and Regulation—Regulation of Cable Services—Program access” for more information.
The rates we pay for pole attachments may increase significantly.
The rates we must pay utility companies for space on their utility poles is the subject of frequent disputes. If these rates were to increase significantly or unexpectedly, it would cause our network to be more expensive to operate. It could also place us at a competitive disadvantage with video and telecommunications service providers who do not require or who are less dependent upon pole attachments, such as satellite providers and wireless voice service providers. See “Item 1. Business—Legislation and Regulation—Regulation of Cable Services—Pole attachments” for more information.
Loss of interconnection arrangements could impair our telephone service.
We rely on other companies to connect our local telephone customers with customers of other local telephone providers. We presently have access to AT&T’s telephone network under a nine-state interconnection agreement, which expires on December 16, 2011. We have access to Verizon’s telephone network in Florida under an interconnection agreement covering Florida. The initial term of this agreement expired on November 19, 2008. However, the agreement has provisions allowing it to continue in effect after the initial term until a new agreement is executed. Knology notified Verizon of its intent to continue operating under the existing agreement in November 2008. If the AT&T and Verizon agreements are terminated or not renewed, we could be adversely affected and our interconnection arrangements could be on terms less favorable than those we receive currently.
It is generally expected that the 1996 Act will continue to undergo considerable interpretation and implementation, including potential forbearance from federal regulation enforcing these carriers’ statutory obligations, which could have a negative impact on our interconnection agreements with AT&T and Verizon. It
23
Table of Contents
Index to Financial Statements
is also possible that further amendments to the Communications Act may be enacted which could have a negative impact on our interconnection agreements with AT&T and Verizon. The contractual arrangements for interconnection and access to unbundled network elements with incumbent carriers generally contain provisions for incorporation of changes in governing law. Thus, future FCC, state public service commission and/or court decisions may negatively impact the rates, terms and conditions of the interconnection services we have obtained and may seek to obtain under these agreements, which could adversely affect our business, financial condition or results of operations. Our ability to compete successfully in the provision of services will depend on the nature and timing of any such legislative changes, regulations and interpretations and whether they are favorable to us or to our competitors. See “Item 1. Business—Legislation and Regulation” for more information.
We could be negatively impacted by future interpretation or implementation of regulations or legislation.
The current communications and cable legislation and regulations are complex and in many areas set forth policy objectives to be implemented by regulation at the federal, state and local levels. It is generally expected that the Communications Act, the 1996 Act and implementing regulations and decisions, as well as applicable state laws and regulations, will continue to undergo considerable interpretation and implementation. From time to time federal legislation, FCC and PSC decisions, or courts decisions interpreting legislation, FCC or PSC decisions, are made that can affect our business. We cannot predict the timing or the future financial impact of legislation or decisions. Our ability to compete successfully will depend on the nature and timing of any such legislative changes, regulations or interpretations, and whether they are favorable to us or to our competitors. See “Item 1. Business—Legislation and Regulation” for more information.
In particular, the United States District Court for the District of Columbia in PAETEC Communications, Inc. v. CommPartners, recently held that the termination of VoIP-originated calls is an information service not subject to access charges and that a tariff imposing such charges lacks legal force. There have been inconsistent court, PSC and FCC decisions on this issue that raise concerns about collecting revenue related to the termination of VoIP originated calls on our telephone networks.
We operate our network under franchises that are subject to non-renewal or termination.
Our network generally operates pursuant to franchises, permits or licenses typically granted by a municipality or other state or local government controlling the public rights-of-way. Often, franchises are terminable if the franchisee fails to comply with material terms of the franchise order or the local franchise authority’s regulations. Although none of our existing franchise or license agreements have been terminated, and we have received no threat of such a termination, one or more local authorities may attempt to take such action. We may not prevail in any judicial or regulatory proceeding to resolve such a dispute.
Further, franchises generally have fixed terms and must be renewed periodically. Local franchising authorities may resist granting a renewal if they consider either past performance or the prospective operating proposal to be inadequate. In a number of jurisdictions, local authorities have attempted to impose rights-of-way fees on providers that have been challenged as violating federal law. A number of FCC and judicial decisions have addressed the issues posed by the imposition of rights-of-way fees on CLECs and on video distributors. To date, the state of the law is uncertain and may remain so for some time. We may become subject to future obligations to pay local rights-of-way fees that are excessive or discriminatory.
The local franchising authorities can grant franchises to competitors who may build networks in our market areas. Recent FCC decisions facilitate competitive video entry by limiting the actions that local franchising authorities may take when reviewing applications by new competitors and lessen some of the burdens that can be imposed upon incumbent cable operators with which we ourselves compete. Local franchise authorities have the ability to impose regulatory constraints or requirements on our business, including those that could materially increase our expenses. In the past, local franchise authorities have imposed regulatory constraints on the construction of our network either by local ordinance or as part of the process of granting or renewing a franchise. They have also imposed requirements on the level of customer service we provide, as well as other
24
Table of Contents
Index to Financial Statements
requirements. The local franchise authorities in our markets may also impose regulatory constraints or requirements that may be found to be consistent with applicable law but which could increase our expenses in operating our business. See “Item 1. Business—Legislation and Regulation” for more information.
We may not be able to obtain telephone numbers for new voice customers in a timely manner.
In providing voice services, we rely on access to numbering resources in order to provide our customers with telephone numbers. A shortage of or a delay in obtaining new numbers from numbering administrators, as has sometimes been the case for LECs in the recent past, could adversely affect our ability to expand into new markets or enlarge our market share in existing markets.
We may encounter difficulties in implementing and developing new technologies.
We have invested in advanced technology platforms that support advanced communications services and multiple emerging interactive services, such as video-on-demand, subscriber video-on-demand, digital video recording, interactive television, IP Centrex services and pure fiber network services. However, existing and future technological implementations and developments may allow new competitors to emerge, reduce our network’s competitiveness or require expensive and time-consuming upgrades or additional equipment, which may also require the write-down of existing equipment. In addition, we may be required to select in advance one technology over another and may not choose the technology that is the most economic, efficient or attractive to customers. We may also encounter difficulties in implementing new technologies, products and services and may encounter disruptions in service as a result.
We may encounter difficulties expanding into additional markets.
To expand into additional cities, we will have to obtain pole attachment agreements, construction permits, telephone numbers and other regulatory approvals. Delays in entering into pole attachment agreements, receiving the necessary construction permits and conducting the construction itself have adversely affected our schedule in the past and could do so again in the future. Difficulty in obtaining numbering resources may also adversely affect our ability to expand into new markets. We may face legal or similar resistance from competitors who are already in markets we wish to enter. These difficulties could significantly harm or delay the development of our business in new markets. See “Item 1. Business—Legislation and Regulation—Regulation of Cable Services—Program access” for more information.
We depend on the services of key personnel to implement our strategy. If we lose the services of our key personnel or are unable to attract and retain other qualified management personnel, we may be unable to implement our strategy.
Our business is currently managed by a small number of key management and operating personnel. We do not have any employment agreements with, nor do we maintain “key man” life insurance policies on, these or any other employees. The loss of members of our key management and certain other members of our operating personnel could adversely affect our business.
Our ability to manage our anticipated growth depends on our ability to identify, hire and retain additional qualified management personnel. While we are able to offer competitive compensation to prospective employees, we may still be unsuccessful in attracting and retaining personnel, which could affect our ability to grow effectively and adversely affect our business.
Since our business is concentrated in specific geographic locations, our business could be adversely impacted by a depressed economy and natural disasters in these areas.
We provide our services to areas in Alabama, Florida, Georgia, Iowa, Kansas, Minnesota, South Carolina, South Dakota and Tennessee, which are in the Southeastern and Midwestern regions of the United States. A stagnant or depressed economy in the United States, and the Southeastern or Midwestern United States in particular, could affect all of our markets and adversely affect our business and results of operations.
25
Table of Contents
Index to Financial Statements
Our success depends on the efficient and uninterrupted operation of our communications services. Our network is attached to poles and other structures in many of our service areas, and our ability to provide service depends on the availability of electric power. A tornado, hurricane, flood, mudslide or other natural catastrophe in one of these areas could damage our network, interrupt our service and harm our business in the affected area. In addition, many of our markets are close together, and a single natural catastrophe could damage our network in more than one market.
Risks Related to Our Common Stock
If we issue more stock in future offerings, the percentage of our stock that our stockholders own will be diluted.
As of February 28, 2011, we had 37,349,059 shares of common stock outstanding. We also had outstanding on that date options to purchase 3,143,775 shares of common stock and warrants to purchase 1,000,000 shares of common stock. Our authorized capital stock includes 200,000,000 shares of common stock and 199,000,000 shares of preferred stock, which our board of directors has the authority to issue without further stockholder action. Future stock issuances also will reduce the percentage ownership of our current stockholders.
Our board of directors has the authority to issue, without stockholder approval, shares of preferred stock with rights and preferences senior to the rights and preferences of the common stock. As a result, our board of directors could issue shares of preferred stock with the right to receive dividends and the assets of the company upon liquidation prior to the holders of the common stock.
Anti-takeover provision could make it more difficult for a third-party to acquire us.
We have adopted a stockholder rights plan and initially declared a dividend distribution of one right for each outstanding share of common stock to stockholders of record as of August 10, 2005. Each right entitles the holder to purchase one unit consisting of one one-thousandth of a share of our Series X Junior Participating Preferred Stock for $16.00 per unit. Under certain circumstances, if a person or group acquires 18% or more of our outstanding common stock, holders of the rights (other than the person or group triggering their exercise) will be able to purchase, in exchange for the $16.00 exercise price, shares of our common stock or of any company into which we are merged having a value of $32.00. Because the rights may substantially dilute the stock ownership of a person or group attempting to take us over without the approval of our Board of Directors, our rights plan could make it more difficult for a third-party to acquire us for a significant percentage of our outstanding capital stock) without first negotiating with our Board of Directors regarding that acquisition. The rights plan expires on July 27, 2015.
In addition, our Board of Directors has the authority to issue up to 199 million shares of Preferred Stock (of which 2 million shares have been designated as Series X Junior Participating Preferred Stock) and to determine the price, rights, preferences, privileges and restriction, including voting rights, of those shares without any further vote or action by the stockholders.
The rights of the holders of our common stock may be subject to, and may be adversely affected by, the rights of the holders of any Preferred Stock that may be issued in the future. The issuance of Preferred Stock may have the effect of delaying, deterring or preventing a change in control of Knology without further action by the stockholders and may adversely affect the voting and other rights of the holders of our common stock. Further, come provisions of our charter documents, including provisions eliminating the ability of stockholders to take action by written consent and limiting the ability of stockholders to raise matters at a meeting of stockholders without giving advance notice, may have the effect of delaying or preventing changes in control or changes in our management, which could have an adverse effect on the market price of our stock. In addition, our charter documents do not permit cumulative voting, which may make it more difficult for a third-party to gain control of our Board of Directors, Further, we are subject to the anti-takeover provision of Section 203 of the Delaware General Corporation Law, which will prohibit us from engaging in a “business combination” with an “interested stockholder” for a period of three years after the date of the transaction in which the person became an interested
26
Table of Contents
Index to Financial Statements
stockholder, even if such combination is favored by a majority of stockholders, unless the business combination is approved in a prescribed manner. The application of Section 203 also could have the effect of delaying or preventing a change in control of us.
The value of our stock could be hurt by substantial price fluctuations.
The value of our common stock could be subject to sudden and material increases and decreases. The value of our stock could fluctuate in response to:
| • | our quarterly operating results; |
| • | changes in our business; |
| • | changes in the market’s perception of our bundled services; |
| • | changes in the businesses or market perceptions of our competitors; and |
| • | changes in general market or economic conditions. |
In addition, the stock market has experienced extreme price and volume fluctuations in recent years, including the decline in the stock market in 2008-2009, that have significantly affected the value of securities of many companies. These changes often appear to occur without regard to specific operating performance. The value of our common stock could increase or decrease based on change of this type. These fluctuations could materially reduce the value of our stock. Fluctuations in the value of our stock will also affect the value of our outstanding warrants and options, which may adversely affect stockholders’ equity, net income or both.
| ITEM 1B. | UNRESOLVED STAFF COMMENTS |
None
| ITEM 2. | PROPERTIES |
We have assets in Alabama, Florida, Georgia, Iowa, Kansas, Minnesota, South Carolina, South Dakota and Tennessee. Our primary assets consist of voice, video and data distribution plant and equipment, including voice switching equipment, data receiving equipment, data decoding equipment, data encoding equipment, headend reception facilities, distribution systems and customer premise equipment.
Our plant and related equipment are generally attached to utility poles under pole rental agreements with public electric utilities, electric cooperative utilities, municipal electric utilities and telephone companies. In certain locations our plant is buried underground. We own or lease real property for signal reception sites. Our headend locations are located on owned or leased parcels of land.
We own or lease the real property and buildings for our market administrative offices, customer call centers, data center and our corporate offices.
The physical components of our broadband systems require maintenance as well as periodic upgrades to support the new services and products we may introduce. We believe that our properties are generally in good operating condition and are suitable for our business operations.
| ITEM 3. | LEGAL PROCEEDINGS |
We are subject to litigation in the normal course of our business. However, in our opinion, there is no legal proceeding pending against us which would have a material adverse effect on our financial position, results of operations or liquidity. We are also a party to regulatory proceedings affecting the segments of the communications industry generally in which we engage in business.
27
Table of Contents
Index to Financial Statements
We have been named as a defendant in a lawsuit captioned Manard v. Knology, Inc. filed in the United States District Court for the Middle District of Georgia. The complaint was filed on February 2, 2010 as a punative class action. The case arose out of an online advertising trial of a system designed by a third-party advertising company, NebuAd, Inc., for delivery of advertising to computer users while they are navigating the Internet. The complaint, which was filed on behalf of Knology customers using the Internet during the trial period, alleges that electronic communications were intercepted and used in violation of the federal and state privacy statutes and seeks statutory damages for such alleged violations. The action was initially filed in California against Knology and other defendants where it was dismissed for lack of jurisdiction. Counsel for the plaintiff has filed new complaints against the same defendants but they filed separate complaints against each company trialing NebuAd’s system. Knology filed its motion to dismiss on March 26, 2010. On April 22, 2010, Knology filed a motion to compel arbitration and stay the proceedings in the District Court. On June 18, 2010, the District Court granted our motion to compel arbitration and stay court proceedings and determined that Knology’s motion to dismiss was moot. We intend to vigorously defend the case in arbitration. Given that this claim is still in its initial stages, it is premature to estimate the impact it could have to our results of operation, financial condition or cash flows.
| ITEM 4. | [RESERVED] |
28
Table of Contents
Index to Financial Statements
PART II
| ITEM 5. | MARKET FOR REGISTRANT’S COMMON EQUITY RELATED STOCKHOLDER MATTERS AND ISSUER PURCHASES OF EQUITY SECURITIES |
Market Information
Our common stock has traded on the NASDAQ Global Market under the ticker symbol “KNOL” since December 18, 2003. The following table sets forth the high and low sales prices as reported on the NASDAQ Global Market for the period from January 1, 2009 through December 31, 2010.
| High | Low | |||||||
| 2010 |
||||||||
| Fourth Quarter |
$ | 15.95 | $ | 13.33 | ||||
| Third Quarter |
$ | 13.66 | $ | 10.42 | ||||
| Second Quarter |
$ | 14.00 | $ | 10.45 | ||||
| First Quarter |
$ | 14.14 | $ | 10.40 | ||||
| 2009 |
||||||||
| Fourth Quarter |
$ | 12.00 | $ | 9.49 | ||||
| Third Quarter |
$ | 10.18 | $ | 7.67 | ||||
| Second Quarter |
$ | 8.96 | $ | 7.42 | ||||
| First Quarter |
$ | 5.69 | $ | 3.95 | ||||
Holders
As of February 28, 2011, there were approximately 373 stockholders of record of our common stock (excluding beneficial owners of shares registered in nominee or street name).
Dividends
We have never declared or paid any cash dividends on our common stock and do not anticipate paying cash dividends on our common stock in the foreseeable future. It is the current policy of our board of directors to retain earnings to finance the upgrade and expansion of our operations. In addition, there are material limitations on our ability to pay dividends on and repurchase shares of our common stock pursuant to the terms of our credit agreement. We may use a minimum of $30 million to pay dividends or repurchase shares, plus, commencing in 2012, limited additional amounts so long as our leverage ratio does not exceed 3.5 to 1.0. Future declarations and payments of dividends, if any, will be determined based on the then-current conditions, including our earnings, operations, capital requirements, financial condition, any restrictions in our debt agreements and other factors our board of directors deems relevant.
29
Table of Contents
Index to Financial Statements
Comparison of Cumulative Total Stockholder Return
The following graph and related information shall not be deemed “soliciting material” or to be “filed” with the SEC, nor shall such information be incorporated by reference into any future filings under the Securities Act of 1933 or the Securities Exchange Act of 1934, each as amended, except to the extent we specifically incorporate it by reference into such filing.
The following graph and table set forth our cumulative total stockholder return as compared to the NASDAQ Composite Index and the NASDAQ Telecommunications Index since the close of business on December 31, 2005. This graph assumes that $100 was invested on December 31, 2005 and assumes reinvestment of all dividends.
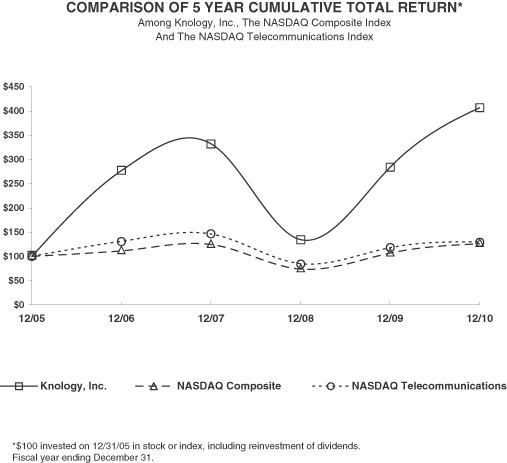
| Cumulative Total Return | ||||||||||||||||||||||||
| As of December 31: |
2005 | 2006 | 2007 | 2008 | 2009 | 2010 | ||||||||||||||||||
| Knology, Inc. |
$ | 100.00 | $ | 277.08 | $ | 332.81 | $ | 134.38 | $ | 284.38 | $ | 407.03 | ||||||||||||
| NASDAQ Composite |
100.00 | 111.74 | 124.67 | 73.77 | 107.12 | 125.93 | ||||||||||||||||||
| NASDAQ Telecommunications |
100.00 | 131.50 | 146.22 | 85.43 | 118.25 | 129.78 | ||||||||||||||||||
There have been no recent sales of unregistered securities. Additionally, we did not repurchase any shares of our common stock during the fourth quarter ended December 31, 2010.
30
Table of Contents
Index to Financial Statements
| ITEM 6. | SELECTED FINANCIAL DATA |
The selected financial data set forth below should be read in conjunction with “Item 7. Management’s Discussion and Analysis of Financial Condition and Results of Operations,” our consolidated financial statements and the related notes, and other financial data included elsewhere in this annual report. The data include operating results from PrairieWave (acquired in April 2007), Graceba (acquired in January 2008), PCL Cable (acquired in November 2009), and Sunflower (acquired in October 2010).
| Year Ended December 31, | ||||||||||||||||||||
| 2006 | 2007 | 2008 | 2009 | 2010 | ||||||||||||||||
| (in thousands, except per share) | ||||||||||||||||||||
| Statement of Operations Data: |
||||||||||||||||||||
| Operating revenues |
$ | 258,991 | $ | 347,652 | $ | 410,230 | $ | 425,565 | $ | 459,546 | ||||||||||
| Operating expenses: |
||||||||||||||||||||
| Direct costs |
75,497 | 104,060 | 123,663 | 132,870 | 148,108 | |||||||||||||||
| Selling, general and administrative (a) |
116,191 | 138,509 | 151,724 | 148,728 | 155,410 | |||||||||||||||
| Depreciation and amortization |
68,189 | 85,776 | 95,375 | 90,702 | 87,594 | |||||||||||||||
| Capital markets activity |
1,623 | 219 | 0 | 0 | 0 | |||||||||||||||
| Non-cash stock compensation |
2,025 | 2,799 | 4,640 | 6,197 | 6,409 | |||||||||||||||
| Litigation fees |
0 | 0 | 0 | 0 | 0 | |||||||||||||||
| Total operating expenses |
263,525 | 331,363 | 375,402 | 378,497 | 397,521 | |||||||||||||||
| Operating income (loss) |
(4,534 | ) | 16,289 | 34,828 | 47,068 | 62,025 | ||||||||||||||
| Interest expense, net |
(33,722 | ) | (40,622 | ) | (46,586 | ) | (40,976 | ) | (42,182 | ) | ||||||||||
| Gain (loss) on interest rate derivative instrument |
(63 | ) | (758 | ) | 0 | 12,096 | 9,827 | |||||||||||||
| Debt modification expense |
0 | 0 | 0 | (3,422 | ) | 0 | ||||||||||||||
| Loss on debt extinguishment |
0 | (27,375 | ) | 0 | 0 | (19,788 | ) | |||||||||||||
| Amortization of deferred loss on interest rate swaps |
0 | 0 | 0 | (18,299 | ) | (10,324 | ) | |||||||||||||
| Gain (loss) on adjustments of warrants to market |
(464 | ) | (262 | ) | 0 | 0 | 0 | |||||||||||||
| Loss on investments |
0 | 0 | 0 | (353 | ) | 0 | ||||||||||||||
| Other income (expense), net |
25 | (53 | ) | (367 | ) | 479 | 161 | |||||||||||||
| Loss from continuing operations |
(38,758 | ) | (52,781 | ) | (12,125 | ) | (3,407 | ) | (281 | ) | ||||||||||
| Income from discontinued operations |
0 | 8,863 | 0 | 0 | 0 | |||||||||||||||
| Provision for income taxes |
0 | 0 | 0 | 0 | 0 | |||||||||||||||
| Net loss |
(38,758 | ) | (43,918 | ) | (12,125 | ) | (3,407 | ) | (281 | ) | ||||||||||
| Preferred stock dividends |
(747 | ) | 0 | 0 | 0 | 0 | ||||||||||||||
| Net loss attributable to common stockholders |
$ | (39,505 | ) | $ | (43,918 | ) | $ | (12,125 | ) | $ | (3,407 | ) | $ | (281 | ) | |||||
| Basic and diluted net loss per share from continuing operations attributable to common stockholders |
$ | (1.41 | ) | $ | (1.51 | ) | $ | (0.34 | ) | $ | (0.09 | ) | $ | (0.01 | ) | |||||
| Basic and diluted net loss per share attributable to common stockholders |
$ | (1.41 | ) | $ | (1.25 | ) | $ | (0.34 | ) | $ | (0.09 | ) | $ | (0.01 | ) | |||||
| Other Financial Data: |
||||||||||||||||||||
| Capital expenditures |
$ | 27,821 | $ | 45,792 | $ | 46,349 | $ | 54,901 | $ | 76,078 | ||||||||||
| Cash provided by operating activities |
30,543 | 57,507 | 79,977 | 104,157 | 98,309 | |||||||||||||||
| Cash used in investing activities |
(26,028 | ) | (293,073 | ) | (121,542 | ) | (99,681 | ) | (213,522 | ) | ||||||||||
| Cash provided by (used in) financing activities |
(5,121 | ) | 270,437 | 52,479 | (17,822 | ) | 118,317 | |||||||||||||
| (a) | excludes asset impairment and severance, non-cash stock compensation and litigation fees, each shown separately in this table. |
31
Table of Contents
Index to Financial Statements
| December 31, | ||||||||||||||||||||
| 2006 | 2007 | 2008 | 2009 | 2010 | ||||||||||||||||
| (in thousands) | ||||||||||||||||||||
| Balance Sheet Data: |
||||||||||||||||||||
| Net working capital |
$ | (9,670 | ) | $ | 6,810 | $ | 25,675 | $ | 26,166 | $ | 20,416 | |||||||||
| Property and equipment, net |
243,831 | 403,476 | 379,710 | 357,880 | 400,347 | |||||||||||||||
| Total assets |
336,561 | 601,437 | 643,418 | 647,901 | 787,678 | |||||||||||||||
| Noncurrent liabilities |
271,301 | 562,938 | 632,690 | 591,514 | 728,450 | |||||||||||||||
| Total liabilities |
319,188 | 636,387 | 699,875 | 680,793 | 803,537 | |||||||||||||||
| Accumulated deficit |
(566,992 | ) | (610,910 | ) | (623,035 | ) | (626,442 | ) | (626,723 | ) | ||||||||||
| Total stockholders’ equity (deficit) |
17,373 | (34,950 | ) | (56,457 | ) | (33,892 | ) | (15,859 | ) | |||||||||||
| ITEM 7. | MANAGEMENT’S DISCUSSION AND ANALYSIS OF FINANCIAL CONDITION AND RESULTS OF OPERATIONS |
Overview
We are a fully integrated provider of video, voice, data and advanced communications services to residential and business customers in ten markets in the southeastern United States, as well as two markets in South Dakota and a market in Kansas. We provide a full suite of video, voice and data services in Huntsville, Montgomery and Dothan, Alabama; Panama City and portions of Pinellas County, Florida; Augusta, Columbus and West Point, Georgia; Charleston, South Carolina; Knoxville, Tennessee; Lawrence, Kansas; and Rapid City and Sioux Falls, South Dakota, as well as portions of Minnesota and Iowa. Our primary business is the delivery of bundled communication services over our own network and approximately 80% of our customers are bundled. In addition to our bundled package offerings, we sell these services on an unbundled basis.
We have built our business through:
| • | construction and expansion of our broadband network to offer integrated video, voice and data services; |
| • | organic growth of connections through increased penetration of services to new marketable homes and our existing customer base, along with new service offerings; |
| • | upgrades of acquired networks to introduce expanded broadband services, including bundled video, voice and data services; and |
| • | acquisitions of other broadband systems; |
The following discussion includes details, highlights and insight into our consolidated financial condition and results of operations, including recent business developments, critical accounting policies, estimates used in preparing the financial statements and other factors that are expected to affect our prospective financial condition. The following discussion and analysis should be read in conjunction with our “Selected Financial Data” and our consolidated financial statements and related notes, and other financial data elsewhere in this annual report.
To date, we have experienced net losses as a result of the expansion of our service territories and the construction of our network. We expect to continue to focus on increasing our customer base and expanding our broadband operations. Although we expect to begin generating net income in the near future, our ability to generate profits will depend in large part on our ability to increase revenues to offset depreciation and operation of our business.
In January 2008, we completed the $75 million acquisition of Graceba, which has delivered significant increases in key operating and financial metrics as well as being free cash flow accretive. The transaction was funded by a $59 million add-on financing to our existing credit facility and $16 million from available cash.
32
Table of Contents
Index to Financial Statements
In November 2009, we completed the $7.5 million acquisition of the assets of PCL Cable, which has delivered small increases in key operating and financial metrics as well as being free cash flow accretive. The transaction was funded using $7.5 million from cash on hand.
On October 15, 2010, we completed the acquisition of Sunflower, a provider of video, voice and data services to residential and business customers in Douglas County, Lawrence, Kansas and the surrounding area for $165 million. In connection with the acquisition, Knology has entered into a $770 million secured credit facility with proceeds used to partially fund the acquisition purchase price, refinance the company’s existing credit facility, and pay related transaction costs. Knology also used approximately $48 million of cash on hand to partially fund the transaction.
On February 21, 2011, we signed a definitive agreement to acquire from CoBridge Broadband, LLC certain cable and broadband operations in Fort Gordon, Georgia and Troy, Alabama for $30 million. The combined operations of these two markets represent approximately $15 million in expected annual revenues (unaudited). The transaction is expected to close in the second quarter of 2011, subject to certain normal and customary closing conditions, including regulatory approvals. We expect to fund the proposed transaction by using $10 million of cash on hand and $20 million in proceeds from the additional Term Loan A closed in connection with the debt repricing transaction discussed below.
In connection with the acquisition, on February 18, 2011, we entered into a debt repricing transaction that will reduce our annual interest expense by approximately $10 million. The interest rate on Term Loan A was repriced to LIBOR plus a margin ranging from 2.5% to 3.25% and the maturity was extended to February 2016. The interest rate on Term Loan B was repriced to LIBOR plus 3%, with a LIBOR floor of 1%, and the maturity was extended to August 2017. In connection with the terms of the repricing, the credit facility was amended to increase the capacity of the incremental basket from $200 million to $250 million, and the Term Loan A principal was increased $20 million with the proceeds to be used to partially fund the acquisition, as noted above.
Current Economic Conditions
We are exposed to risks associated with the potential financial instability of our customers, many of whom may be adversely affected by the general economic downturn. The housing market continues to suffer with depressed home prices, and along with continued high levels of unemployment, have severely affected consumer confidence and may cause increased delinquencies or cancellations by our customers or lead to unfavorable changes in the mix of products purchased. The general economic downturn also may affect advertising sales, as companies seek to reduce expenditures and conserve cash.
In addition, we are susceptible to risks associated with the potential financial instability of the vendors and third parties on which we rely to provide products and services or to which we delegate certain functions. The same economic conditions that may affect our customers, as well as volatility and disruption in the capital and credit markets, also could adversely affect vendors and third parties and lead to significant increases in prices, reduction in output or the bankruptcy of our vendors or third parties upon which we rely.
We believe the current economic conditions may impact the rate of organic growth in our business compared to previous years. However, we believe that our strategy of operating in secondary and tertiary markets provides better operating and financial stability compared to the more competitive environments in large metropolitan markets. We also believe that the highly bundled profile of our customer base (about 80% of our customers take two or three of our services) and our companywide focus on customer service create added customer loyalty. Further, we believe that services such as cable television and high-speed Internet become more valuable as consumers spend more time at home and reduce discretionary spending during the current economic downturn.
33
Table of Contents
Index to Financial Statements
Critical Accounting Estimates
Our consolidated financial statements are prepared in accordance with accounting principles generally accepted in the United States, which require us to make estimates and assumptions. We believe that, of our significant accounting estimates described in Note 2 of “Notes to Consolidated Financial Statements” included elsewhere in this annual report, the following may involve a higher degree of judgment and complexity.
Allowance for doubtful accounts. We use estimates to determine our allowance for bad debts. These estimates are based on historical collection experience, current trends, credit policy and a percentage of our delinquent customer accounts receivable.
Capitalization of labor and overhead costs. Our business is capital intensive, and a large portion of the capital we have raised to date has been spent on activities associated with building, extending, upgrading and enhancing our network. As of December 31, 2009 and 2010, the net carrying amount of our property, plant and equipment was approximately $357.9 million, 55% of total assets, and $400.3 million, 51% of total assets, respectively. Total capital expenditures for the years ended December 31, 2008, 2009 and 2010 were approximately $46.3 million, $54.9 million and $76.1 million, respectively.
Costs associated with network construction, network enhancements and initial customer installation are capitalized. Costs capitalized as part of the initial customer installation include materials, direct labor, and certain indirect costs. These indirect costs are associated with the activities of personnel who assist in connecting and activating the new service and consist of compensation and overhead costs associated with these support functions. The costs of disconnecting service at a customer’s premise or reconnecting service to a previously installed premise are charged to operating expense in the period incurred. Costs for repairs and maintenance are charged to operating expense as incurred, while equipment replacement and significant enhancements, including replacement of cable drops from the pole to the premise, are capitalized.
We make judgments regarding the installation and construction activities to be capitalized. We capitalize direct labor and certain indirect costs using operational data and estimations of capital activity. We calculate standards for items such as the labor rates, overhead rates and the actual amount of time required to perform a capitalizable activity. Overhead rates are established based on an estimation of the nature of costs incurred in support of capitalizable activities and a determination of the portion of costs that is directly attributable to capitalizable activities. In the fourth quarter of 2010, we established a new capitalization rate for our installation activities. This rate increase resulted in $2.3 million of additional capitalized expense over the previous rate. If the new capitalization rate were in effect for the entire year of 2010, it would have resulted in an additional $8.9 million being capitalized over the old rate. The company believes this new rate brings us more in line with the industry and properly reflects the company’s activities.
Judgment is required to determine the extent to which overhead is incurred as a result of specific capital activities, and therefore should be capitalized. The primary costs that are included in the determination of the overhead rate are (i) employee benefits and payroll taxes associated with capitalized direct labor, (ii) direct variable costs associated with capitalizable activities, consisting primarily of installation costs, (iii) the cost of support personnel that directly assist with capitalizable installation activities, and (iv) indirect costs directly attributable to capitalizable activities.
While we believe our existing capitalization policies are reasonable, a significant change in the nature or extent of our system activities could affect management’s judgment about the extent to which we should capitalize direct labor or overhead in the future. We monitor the appropriateness of our capitalization policies, and perform updates to our internal studies on an ongoing basis to determine whether facts or circumstances warrant a change to our capitalization policies.
34
Table of Contents
Index to Financial Statements
Valuation of long-lived and intangible assets and goodwill. We assess the impairment of identifiable long-lived assets and related goodwill whenever events or changes in circumstances indicate that the carrying value may not be recoverable in accordance with Accounting Standards Codification (“ASC”) 350 and ASC 360. Factors we consider important and that could trigger an impairment review include the following:
| • | significant underperformance of our assets relative to historical or projected future operating results; |
| • | significant changes in the manner in which we use our assets or significant changes in our overall business strategy; and |
| • | significant negative industry economic trends. |
In accordance with ASC 350, we identified each separate geographic operating unit for goodwill impairment testing purposes. These geographic operating units meet the requirements to be reporting units as they are businesses (and legal entities) in which separate internal financial statements are prepared, including a balance sheet, statement of operations and a statement of cash flows. These geographic operating units are our markets as set forth under “Item 1. Business—Markets”. Also, management evaluates the business and measures operating performance on a geographic operating unit basis.
The geographic operating units shown in the table on the next page represent all the operating units with goodwill on their balance sheets. Goodwill is subject to periodic impairment assessment by applying a fair value test based upon a two-step method. The first step of the process compares the fair value of the reporting unit with the carrying value of the reporting unit, including any goodwill. We utilize a discounted cash flow valuation methodology to determine the fair value of the reporting unit. If the fair value of the reporting unit exceeds the carrying amount of the reporting unit, goodwill is deemed not to be impaired in which case the second step in the process is unnecessary. If the carrying amount exceeds fair value, we perform the second step to measure the amount of impairment loss. Any impairment loss is measured by comparing the implied fair value of goodwill, calculated per ASC 350, with the carrying amount of goodwill at the reporting unit, with the excess of the carrying amount over the fair value recognized as an impairment loss. We have adopted January 1 as the calculation date and have evaluated these assets as of January 1, 2011, and no impairment was identified. Based on the results of the test, we recorded no impairment loss to our goodwill as of January 1, 2009, 2010 and 2011.
Our discounted cash flow calculation is based on a five year projection, with a terminal value applied to the cash flow of the fifth year. We believe the discounted cash flow methodology utilizing a terminal value is the most meaningful valuation method because businesses like ours in the cable industry sector are generally valued based on a multiple of cash flow. The discount rate of 12% is based on our weighted average cost of capital. Our cash flow projections include a growth factor of 5% year over year and a terminal multiple factor of 7.5 applied to the fifth year cash flow projection. Our cash flow growth factor is based on historical organic growth rates, discounted from our growth rates before the current economic downturn. It includes our expectation for continued annual pricing increases to our customers and continued growth in our residential and business video, voice and data connections. Our terminal multiple factor of 7.5 is based on the most recent merger and acquisition transactions of Knology and in our sector as well as historical valuation multiples of companies in the cable industry.
We could record impairment charges in the future if there are long-term changes in market conditions, expected future operating results or federal or state regulations that prevent us from recovering the carrying value of goodwill. For example, we believe a slowdown in the economy impacted our operating results during 2010. Assumptions made about the continuation of these market conditions on a longer-term basis could impact the valuations to be used in the January 1, 2011 annual impairment test and result in a reduction of fair values from those determined in the January 1, 2010 annual impairment test. Such assumptions and fair values will not be determined until the annual impairment test is performed. The following table shows the net carrying value of goodwill as of December 31, 2010 and illustrates the hypothetical impairment charge related to changes in our
35
Table of Contents
Index to Financial Statements
discounted cash flows (i.e., fair value) from any combination of adjustments to key assumptions at our last annual impairment test date.
| Net Carrying Values |
Percent Hypothetical Reduction in Fair Value and Related Impairment Charge |
|||||||||||||||||||
| (in millions) |
10% | 15% | 20% | 25% | ||||||||||||||||
| Columbus |
$ | 2.8 | $ | — | $ | — | $ | — | $ | — | ||||||||||
| Dothan |
48.0 | (1 | ) | (5 | ) | (9 | ) | (13 | ) | |||||||||||
| Lawrence |
104.2 | — | (1 | ) | (11 | ) | (21 | ) | ||||||||||||
| Montgomery |
3.2 | — | — | — | — | |||||||||||||||
| Panama City |
2.1 | — | — | — | — | |||||||||||||||
| Huntsville |
3.1 | — | — | — | — | |||||||||||||||
| Rapid City |
25.9 | — | — | — | — | |||||||||||||||
| Sioux Falls |
31.9 | — | — | — | — | |||||||||||||||
| West Point |
32.7 | — | — | — | — | |||||||||||||||
| 253.9 | (1 | ) | $ | (6 | ) | $ | (20 | ) | $ | (34 | ) | |||||||||
Fair Value Measurements. ASC Topic 820 “Fair Value Measurements and Disclosures” defines fair value and establishes a framework for measuring fair value. ASC 820 replaced Financial Accounting Standards Statement 157 which we adopted with respect to fair value measurements of financial instruments on January 1, 2008.
We record interest rate swaps in our consolidated balance sheet at fair value on a recurring basis. ASC 820 provides a hierarchy that prioritizes inputs to valuation techniques used to measure fair value into three broad levels.
| • | Level 1 inputs are quoted market prices in active markets for identical assets or liabilities that the reporting entity has the ability to access at the measurement date. We currently have no Level 1 financial instrument assets or liabilities. |
| • | Level 2 inputs are inputs, other than quoted market prices included within Level 1, that are observable for the asset or liability, either directly or indirectly. We use a discounted cash flow analysis of the implied yield curves to value our interest rate swaps. We also consider our credit risk and counterparty credit risk in estimating the fair value of our financial instruments. While these inputs are observable, they are not all quoted market prices, so the fair values of our financial instruments fall in Level 2. As of December 31, 2010, the carrying value of our interest swap liabilities was $6.7 million. |
| • | Level 3 inputs are unobservable inputs for an asset or liability. We currently have no Level 3 financial instrument assets or liabilities. |
Significant and subjective estimates. The following discussion and analysis of our results of operations and financial condition is based upon our consolidated financial statements, which have been prepared in accordance with accounting principles generally accepted in the United States. The preparation of these financial statements requires us to make estimates that affect the reported amounts of assets, liabilities, revenues and expenses, and related disclosure of contingent assets and contingent liabilities. In many cases, the accounting treatment of a particular transaction is specifically dictated by accounting principles generally accepted in the United States, with no need for us to judge the application. On an ongoing basis, we evaluate our estimates, including those related to our ability to collect accounts receivable, valuation of investments, valuation of stock based compensation, recoverability of goodwill and intangible assets, income taxes and contingencies. We base our judgments on historical experience and on various other assumptions that we believe are reasonable under the circumstances, the results of which form the basis for making estimates about the carrying values of assets and liabilities that are not readily apparent from other sources. Actual results may differ from these estimates under different assumptions or conditions. See our consolidated financial statements and related notes thereto included elsewhere in this annual report, which contain accounting policies and other disclosures required by accounting principles generally accepted in the United States.
36
Table of Contents
Index to Financial Statements
Homes Passed and Connections
We report homes passed as the number of residential and business units, such as single residence homes, apartments and condominium units, passed by our broadband network and listed in our database. “Marketable homes passed” are homes passed other than those we believe are covered by exclusive arrangements with other providers of competing services. Because we deliver multiple services to our customers, we report the total number of connections for video, voice and data rather than the total number of customers. We count each video, voice or data purchase as a separate connection. For example, a single customer who purchases cable television, local telephone and Internet access services would count as three connections. We do not record the purchase of digital video services by an analog video customer as an additional connection.
As we continue to sell bundled services, we expect more of our video customers to purchase voice, data and other enhanced services in addition to basic video services. Further, business customers primarily take voice and data services, with relatively smaller amounts of video products. On the other hand, we believe some of our phone customers, especially customers who are only taking our voice product, are moving to alternative voice products (e.g., mobile phones). As a result of these various factors, we expect that our data connections will grow the fastest and that voice connections will benefit from our growing commercial business.
Revenues
Our operating revenues are primarily derived from monthly charges for video, voice and Internet data services and other services to residential and business customers. We provide these services over our network. Our products and services involve different types of charges and in some cases a different method of accounting for recording revenues. Below is a description of our significant sources of revenue:
| • | Video revenues. Our video revenues consist of fixed monthly fees for basic, expanded basic, premium and digital cable television services, as well as fees from pay-per-view movies, fees for video-on-demand and events such as boxing matches and concerts that involve a charge for each viewing. Video revenues accounted for approximately 41.8%, 43.2% and 45.0% of our consolidated revenues for the years ended December 31, 2008, 2009 and 2010, respectively. |
| • | Voice revenues. Our voice revenues consist primarily of fixed monthly fees for local service and enhanced services, such as call waiting, voice mail and measured and flat rate long-distance service. Voice revenues accounted for approximately 33.5%, 30.8% and 27.8% of our consolidated revenues for the years ended December 31, 2008, 2009 and 2010, respectively. |
| • | Data revenues. Our data revenues consist primarily of fixed monthly fees for data service and rental of cable modems. Data revenues accounted for approximately 22.8%, 23.2% and 23.4% of our consolidated revenues for the years ended December 31, 2008, 2009 and 2010, respectively. Providing data services is a rapidly growing business and competition is increasing in each of our markets. |
| • | Other revenues. Other revenues result principally from broadband carrier services. Other revenues accounted for approximately 1.9%, 2.8% and 3.7% of our consolidated revenues for the years ended December 31, 2008, 2009 and 2010, respectively. |
Our ability to increase the number of our connections and, as a result, our revenues is directly affected by the level of competition we face in each of our markets with respect to each of our service offerings:
| • | In providing video services, we currently compete with AT&T, Bright House, CenturyTel, Charter, Comcast, Mediacom, MidCo, Qwest, Time Warner and Verizon. We also compete with satellite television providers such as DirecTV and Echostar. Our other competitors include broadcast television stations and other satellite television companies. We expect in the future to face additional competition from telephone companies providing video services within their service areas. |
| • | In providing local and long-distance telephone services, we compete with the ILEC and various long-distance providers in each of our markets. AT&T, CenturyTel, Qwest and Verizon are the incumbent |
37
Table of Contents
Index to Financial Statements
| local phone companies in our markets. They offer both local and long-distance services in our markets and are particularly strong competitors. We also compete with providers of long-distance telephone services, such as AT&T, CenturyTel (which acquired Embarq Communications in 2009) and Verizon. We expect an increase in the deployment of VoIP services and expect to continue to compete with Vonage Holding Company, cable competitors as they roll out VoIP and other providers. |
| • | In providing data services, we compete with ILECs that offer dial-up and DSL services, providers of satellite-based Internet access services, cable television companies, providers of wireless high-speed data services, and providers of dial-up Internet service. Data services and Internet access is a rapidly growing business and competition is increasing in each of our markets. |
| • | Some of our competitors have competitive advantages such as greater experience, resources, marketing capabilities and stronger name recognition. |
Costs and Expenses
Our operating expenses primarily include cost of services, selling, operating and administrative expenses, and depreciation and amortization.
Direct costs include:
| • | Direct costs of video services. Direct costs of video services consist primarily of monthly fees to the National Cable Television Cooperative and other programming providers. Programming costs are our largest single cost and we expect this trend to continue. Programming costs as a percentage of video revenue were approximately 52.7%, 52.0% and 51.4% for the years ended December 31, 2008, 2009 and 2010, respectively. We have entered into contracts with various entities to provide programming to be aired on our network. We pay a monthly fee for these programming services, generally based on the average number of subscribers to the program, although some fees are adjusted based on the total number of subscribers to the system and/or the system penetration percentage. Since programming cost is partially based on numbers of subscribers, it will increase as we add more subscribers. It will also increase as costs per channel increase over time, including retransmission costs we incurred with traditional networks beginning in 2009. |
| • | Direct costs of voice services. Direct costs of voice services consist primarily of transport cost and network access fees. The direct costs of voice services as a percentage of voice revenues were approximately 15.7%, 17.8% and 17.8% for the years ended December 31, 2008, 2009 and 2010, respectively. |
| • | Direct costs of data services. Direct costs of data services consist primarily of transport costs and network access fees. The direct costs of data services as a percentage of data revenue were 5.9%, 7.2% and 7.4% for the years ended December 31, 2008, 2009 and 2010, respectively. |
| • | Direct costs of other services. Direct costs of other services consist primarily of transport costs, network access fees and costs of dark fiber. The direct costs of other services as a percentage of other revenue were 18.0%, 22.8% and 35.0% for the years ended December 31, 2008, 2009 and 2010, respectively. |
| • | Pole attachment and other network rental expenses. Pole attachment rents are paid to utility companies for space on their utility poles to deliver our various services. Other network rental expenses consist primarily of network hub rents. Pole attachment and other network rental expenses as a percentage of total revenue were approximately 1.2%, 1.0% and 1.1% of total revenues for the years ended December 31, 2008, 2009 and 2010, respectively. |
We provide our services in competitive markets and we are not always able to pass along significant price increases and maintain margins, especially for our video services. However, we expect higher-margin voice, data and other revenue to become larger percentages of our overall revenue, and the favorable product mix may potentially offset pressures on gross profits within individual product lines.
38
Table of Contents
Index to Financial Statements
Selling, general and administrative expenses include:
| • | Sales and marketing expenses. Sales and marketing expenses include the cost of sales and marketing personnel and advertising and promotional expenses. |
| • | Network operations and maintenance expenses. Network operations and maintenance expenses include payroll and departmental costs incurred for network design, 24/7 maintenance monitoring and plant maintenance activity. |
| • | Service and installation expenses. Service and installation expenses include payroll and departmental costs incurred for customer installation and service technicians. |
| • | Customer service expenses. Customer service expenses include payroll and departmental costs incurred for customer service representatives and customer service management, primarily at our centralized call centers. |
| • | General and administrative expenses. General and administrative expenses consist of corporate and subsidiary management and administrative costs. |
Depreciation and amortization expenses include depreciation of our interactive broadband networks and equipment, buildings and amortization of other intangible assets primarily related to acquisitions.
As our sales and marketing efforts continue and our networks expand, we expect to add customer connections resulting in increased revenue. We also expect our cost of services and operating expenses to increase as we grow our business.
39
Table of Contents
Index to Financial Statements
Results of Operations
The following table sets forth financial data as a percentage of operating revenues for the years ended December 31, 2008, 2009 and 2010.
| Year Ended December 31, |
||||||||||||
| 2008 | 2009 | 2010 | ||||||||||
| Operating revenues: |
||||||||||||
| Video |
42 | % | 43 | % | 45 | % | ||||||
| Voice |
33 | 31 | 28 | |||||||||
| Data |
23 | 23 | 23 | |||||||||
| Other |
2 | 3 | 4 | |||||||||
| Total operating revenues |
100 | 100 | 100 | |||||||||
| Operating expenses: |
||||||||||||
| Direct costs |
30 | 31 | 32 | |||||||||
| Selling, general and administrative expenses |
38 | 37 | 36 | |||||||||
| Depreciation and amortization |
23 | 21 | 19 | |||||||||
| Total operating expenses |
91 | 89 | 87 | |||||||||
| Operating income |
9 | 11 | 13 | |||||||||
| Other expense: |
||||||||||||
| Interest income |
0 | 0 | 0 | |||||||||
| Interest expense |
(12 | ) | (10 | ) | (9 | ) | ||||||
| Loss on early extinguishment of debt |
0 | 0 | (4 | ) | ||||||||
| (Loss) gain on interest rate cap agreement |
0 | (2 | ) | 0 | ||||||||
| Other income (expense), net |
0 | 0 | 0 | |||||||||
| Total other expense |
(12 | ) | (12 | ) | (13 | ) | ||||||
| Loss before income taxes, discontinued operations and preferred stock dividends |
(3 | ) | (1 | ) | (0 | ) | ||||||
| Income tax benefit (provision) |
0 | 0 | 0 | |||||||||
| Income from discontinued operations |
0 | 0 | 0 | |||||||||
| Preferred stock dividend |
0 | 0 | 0 | |||||||||
| Net loss attributable to common stockholders |
(3 | )% | (1 | )% | (0 | )% | ||||||
40
Table of Contents
Index to Financial Statements
Quarterly Comparison
The following table presents certain unaudited consolidated statements of operations and other operating data for our eight most recent quarters. The information for each of these quarters is unaudited and has been prepared on the same basis as our audited consolidated financial statements appearing elsewhere in this annual report. In the opinion of our management, all necessary adjustments, consisting only of normal recurring adjustments, have been included to present fairly the unaudited quarterly results when read in conjunction with our consolidated financial statements and related notes included elsewhere in this annual report. We believe that results of operations for interim periods should not be relied upon as any indication of the results to be expected or achieved in any future periods or any year as a whole.
| Quarters ended | ||||||||||||||||||||||||||||||||
| Mar. 31, 2009 |
June 30, 2009 |
Sept. 30, 2009 |
Dec. 31, 2009 |
Mar. 31, 2010 |
June 30, 2010 |
Sept. 30, 2010 |
Dec. 31, 2010 |
|||||||||||||||||||||||||
| (in thousands, except per share and operating data) | ||||||||||||||||||||||||||||||||
| Revenues (3) |
$ | 104,683 | $ | 107,931 | $ | 105,802 | $ | 107,149 | $ | 110,118 | $ | 112,987 | $ | 112,877 | $ | 123,564 | ||||||||||||||||
| Direct costs (4) |
32,679 | 34,086 | 31,896 | 34,210 | 36,116 | 36,383 | 36,710 | 38,898 | ||||||||||||||||||||||||
| Income/(Loss) from continuing operations (3) (4) (5) |
(2,273 | ) | 1,334 | (3,334 | ) | 866 | (816 | ) | 7,640 | 5,932 | (13,038 | ) | ||||||||||||||||||||
| Net income (loss) (3) (4) (5) |
(2,273 | ) | 1,334 | (3,334 | ) | 866 | (816 | ) | 7,640 | 5,932 | (13,038 | ) | ||||||||||||||||||||
| Basic and diluted net income (loss) per share |
$ | (.06 | ) | $ | .04 | $ | (.09 | ) | $ | .03 | $ | (.02 | ) | $ | .21 | $ | .16 | $ | (.36 | ) | ||||||||||||
| Homes passed |
1,152,841 | 1,145,882 | 1,148,763 | 1,152,035 | 1,154,005 | 1,181,571 | 1,192,229 | 1,265,386 | ||||||||||||||||||||||||
| Marketable homes passed |
923,533 | 927,576 | 930,402 | 932,834 | 934,236 | 962,321 | 972,038 | 1,045,355 | ||||||||||||||||||||||||
| Video connections (1) |
235,332 | 231,050 | 231,186 | 234,008 | 235,668 | 231,925 | 231,355 | 255,391 | ||||||||||||||||||||||||
| Video penetration (2) |
25.5 | % | 24.9 | % | 24.8 | % | 25.1 | % | 25.2 | % | 24.1 | % | 23.8 | % | 24.4 | % | ||||||||||||||||
| Digital video connections |
108,735 | 107,110 | 109,511 | 113,128 | 119,973 | 123,100 | 127,917 | 131,776 | ||||||||||||||||||||||||
| Digital penetration of video connections |
46.2 | % | 46.4 | % | 47.4 | % | 48.3 | % | 50.9 | % | 53.1 | % | 55.3 | % | 51.6 | % | ||||||||||||||||
| Voice connections |
250,795 | 247,711 | 247,457 | 251,047 | 253,364 | 253,543 | 254,435 | 268,315 | ||||||||||||||||||||||||
| Voice penetration (2) |
27.2 | % | 26.7 | % | 26.6 | % | 26.9 | % | 27.1 | % | 26.3 | % | 26.2 | % | 25.7 | % | ||||||||||||||||
| Data connections |
202,034 | 200,584 | 203,277 | 208,816 | 214,631 | 213,249 | 214,686 | 242,655 | ||||||||||||||||||||||||
| Data penetration (2) |
21.9 | % | 21.6 | % | 21.8 | % | 22.4 | % | 23.0 | % | 22.2 | % | 22.1 | % | 23.2 | % | ||||||||||||||||
| Total connections (3) |
688,161 | 679,345 | 681,920 | 693,871 | 703,663 | 698,717 | 700,476 | 766,361 | ||||||||||||||||||||||||
| Average monthly revenue per connection |
$ | 51.00 | $ | 52.64 | $ | 51.96 | $ | 51.94 | $ | 52.84 | $ | 53.73 | $ | 53.76 | $ | 54.43 | ||||||||||||||||
| (1) | Video connections include customers who receive analog or digital video services. |
| (2) | Penetration is measured as a percentage of marketable homes passed. |
| (3) | Connections of 70,524 along with revenues of $10.5 million and net income of $1.7 million were acquired in the Sunflower acquisition |
| (4) | The period ended Dec. 31, 2010 contains $2.3 million reduction for change in estimate of capitalized installation costs |
| (5) | The period ended Dec. 31, 2010 contains $19.8 million of debt extinguishment expense |
Year Ended December 31, 2010 Compared to Year Ended December 31, 2009
Revenues. Operating revenues increased 8.0% from $425.6 million for the year ended December 31, 2009, to $459.5 million for the year ended December 31, 2010. Operating revenues from video services increased 12.4% from $184.0 million for the year ended December 31, 2009, to $206.8 million for the same period in 2010. Operating revenues from voice services decreased 2.5% from $131.1 million for the year ended December 31, 2009, to $127.9 million for the same period in 2010. Operating revenues from data services increased 9.1% from $98.6 million for the year ended December 31, 2009, to $107.6 million for the same period in 2010. Operating revenues from other services increased 45.8% from $11.8 million for the year ended December 31, 2009, to $17.2 million for the same period in 2010.
The increased revenues from video, data and other services are due primarily to an increase in the number of connections, from 693,871 as of December 31, 2009, to 766,361 as of December 31, 2010 and rate increases effective the first quarter of 2010. The additional connections resulted primarily from the Sunflower acquisition and:
| • | Continued growth in our bundled customers; |
| • | Continued strong growth in business sales; and |
| • | Continued penetration in our mature markets. |
41
Table of Contents
Index to Financial Statements
We continued to add video connections in 2010 as the popularity of additional services and products such as DVR’s and high-definition televisions continued to grow. However, the growth of new video connections has slowed over time relative to our other services as our video segment matures in our current markets. While the number of new video connections may grow at a declining rate, we believe that new products and new technology, such as additional high-definition channels and video on demand, will continue to fuel growth. Data connections are expected to increase as we continue our sales and marketing efforts directed at selling customers our bundled service offerings. Further, business customers primarily take voice and data services, with relatively smaller amounts of video products. On the other hand, we believe some of our phone customers, especially customers who are only taking our voice product, are moving to alternative voice products (e.g., mobile phones). As a result of these various factors, we expect that data will represent a higher percentage of our total connections in the future, and voice connections will benefit from our growing commercial business.
Direct costs. Direct costs increased 11.5% from $132.9 million for the year ended December 31, 2009, to $148.1 million for the year ended December 31, 2010. Direct costs of services for video services increased 11.3% from $95.6 million for the year ended December 31, 2009, to $106.4 million for the same period in 2010. Direct costs of services for voice services decreased 2.4% from $23.4 million for the year ended December 31, 2009, to $22.8 million for the same period in 2010. Direct costs of services for data services increased 11.3% from $7.1 million for the year ended December 31, 2009, to $7.9 million for the same period in 2010. Direct costs of services for other services increased 122.6% from $2.7 million for the year ended December 31, 2009, to $6.0 million for the same period in 2010. Pole attachment and other network rental expenses increased 22.0% from $4.1 million for the year ended December 31, 2009, to $4.9 million for the same period in 2010. We expect our direct costs to increase as we add more connections. In addition, the increase in direct costs of video services is also due to higher programming costs, which have been increasing over the last several years on an aggregate basis due to an increase in subscribers and on a per subscriber basis due to an increase in costs per program channel. Further, local commercial television broadcast stations began charging retransmission fees in 2009, similar to fees charged by other program providers. We expect to experience annual percentage increases hereafter similar to our other cable programming costs. We expect this trend to continue and may not be able to pass these higher costs on to customers because of competitive factors, which could adversely affect our cash flow and gross profit. We expect increases in voice, data and other costs of services with the additions of leased facilities used to backhaul our traffic to our switching facilities as connections and data capacity requirements increase. The other costs of services also reflects the cost of dark fiber sales and will increase or decrease in relation to the amount of dark fiber sales experienced in future years.
Selling, general and administrative. Our selling, general and administrative increased 4.5% from $154.9 million for the year ended December 31, 2009, to $161.8 million for the year ended December 31, 2010. The increase in our operating costs, included in selling, general and administrative included increases in personnel costs, repairs and maintenance, fuel expense, and bad debt expense, that were partially offset by decreases in taxes and licenses, professional services, installation costs after the change in estimate of $2.3 million of capitalized costs and sales and marketing expense. Our non-cash stock option compensation expense, included in selling, general and administrative, increased from $6.2 million for the year ended December 31, 2009, to $6.4 million for the year ended December 31, 2010.
Depreciation and amortization. Our depreciation and amortization decreased from $90.7 million for the year ended December 31, 2009, to $87.6 million for the year ended December 31, 2010, primarily due to the maturing of our asset base.
Debt modification fees. In 2009, we recorded $3.4 million of expense related to the modification of the debt under the Credit Agreement in accordance with the terms of Amendment No. 2, which provides for the extension of the maturity date of an aggregate $397 million of term loans by two years to 2014. During 2010, we recorded $19.8 million of debt extinguishment expense related to the modification of the debt under the secured credit facility which provides a $175.0 million term loan A with a term of five years and a $545.0 million term loan B with a term of six years along with a $50.0 million revolving credit facility.
42
Table of Contents
Index to Financial Statements
Interest income. Interest income was $656,000 for the year ended December 31, 2009, compared to $322,000 for the same period in 2010. The decrease in interest income primarily reflects a decrease in the balance of cash and cash equivalent during the year ended December 31, 2010.
Interest expense. Interest expense increased from $41.6 million for the year ended December 31, 2009, to $42.5 million for the year ended December 31, 2010. The increase in interest expense is primarily a result of the increase in rates and the higher balance on our long term debt from the new credit facility.
Loss on interest rate derivative instrument. Our loss on interest rate derivative instruments decreased 92.0% from $6.2 million for the year ended December 31, 2009 to $497,000 for the same period of 2010. As discussed in the Notes to the Financial Statements, the Company no longer qualifies to use hedge accounting for our interest rate swaps on our debt and we recorded $18.3 million in amortization of deferred loss associated with these derivative instruments for the year ended December 31, 2009 compared to $10.3 million for the same period in 2010. A gain was recorded on the value of the interest rate swaps of $12.1 million for the year ended December 31, 2009 compared to $9.8 million for the same period in 2010, as a result of the decrease in the market value of the liability representing the derivative instruments.
Loss on investments. We recorded a loss of $353,000 for the impairment of our investment in Grande Communications for the year ended December 31, 2009. During 2009, the ownership of Grande was reorganized to form a new operating LLC, called Grande Communications Networks, LLC. Upon reorganization, all existing shareholders in Grande, including Knology, were combined to form the new Rio Holdings, Inc. Rio Holdings owns 24.7% class A general partnership units in the newly formed Grande Investment, L.P., which through a holding company owns 100% of Grande Communications Networks, LLC. No loss was recorded for the year ended December 31, 2010.
Other income, net. Other income decreased from income of $479,000 for the year ended December 31, 2009, to income of $160,000 for the year ended December 31, 2010, primarily due to decreased disposition of property, plant and equipment.
Income tax provision. We recorded no income tax provision for the years ended December 31, 2009 and 2010, respectively, as our net operating losses are fully offset by a valuation allowance.
Loss from continuing operations. We incurred a loss before discontinued operations of $3.4 million for the year ended December 31, 2009, compared to $281,000 for the year ended December 31, 2010.
Net loss attributable to common stockholders. We incurred a net loss attributable to common stockholders of $3.4 million and $281,000 for the years ended December 31, 2009 and 2010, respectively. We expect to have net income as our business matures.
Year Ended December 31, 2009 Compared to Year Ended December 31, 2008
Revenues. Operating revenues increased 3.7% from $410.2 million for the year ended December 31, 2008, to $425.6 million for the year ended December 31, 2009. Operating revenues from video services increased 7.4% from $171.4 million for the year ended December 31, 2008, to $184.0 million for the same period in 2009. Operating revenues from voice services decreased 4.6% from $137.4 million for the year ended December 31, 2008, to $131.1 million for the same period in 2009. Operating revenues from data services increased 5.5% from $93.5 million for the year ended December 31, 2008, to $98.6 million for the same period in 2009. Operating revenues from other services increased 49.3% from $7.9 million for the year ended December 31, 2008, to $11.8 million for the same period in 2009.
43
Table of Contents
Index to Financial Statements
The increased revenues from video, data and other services are due primarily to an increase in the number of connections, from 676,794 as of December 31, 2008, to 693,871 as of December 31, 2009 and rate increases effective the first quarter of 2009. The additional connections resulted primarily from the PCL Cable acquisition and:
| • | Continued growth in our bundled customers; |
| • | Continued strong growth in business sales; and |
| • | Continued penetration in our mature markets. |
We continued to add video connections in 2009 as the popularity of additional services and products such as DVR’s and high-definition televisions continued to grow. However, the growth of new video connections has slowed over time relative to our other services as our video segment matures in our current markets.
Direct costs. Direct costs increased 7.4% from $123.7 million for the year ended December 31, 2008, to $132.9 million for the year ended December 31, 2009. Direct costs of services for video services increased 5.8% from $90.3 million for the year ended December 31, 2008, to $95.6 million for the same period in 2009. Direct costs of services for voice services increased 8.5% from $21.5 million for the year ended December 31, 2008, to $23.4 million for the same period in 2009. Direct costs of services for data services increased 29.5% from $5.5 million for the year ended December 31, 2008, to $7.1 million for the same period in 2009. Direct costs of services for other services increased 90.0% from $1.4 million for the year ended December 31, 2008, to $2.7 million for the same period in 2009. Pole attachment and other network rental expenses decreased 16.3% from $4.8 million for the year ended December 31, 2008, to $4.1 million for the same period in 2009. We expect our direct costs to increase as we add more connections. In addition, the increase in direct costs of video services is also due to higher programming costs, which have been increasing over the last several years on an aggregate basis due to an increase in subscribers and on a per subscriber basis due to an increase in costs per program channel. Further, local commercial television broadcast stations are charging retransmission fees beginning in 2009, similar to fees charged by other program providers. Our direct cost of video services increased about $3.3 million for these additional costs in 2009, with annual percentage increases hereafter similar to our other cable programming costs.
Selling, general and administrative. Our selling, general and administrative decreased 0.9% from $156.4 million for the year ended December 31, 2008, to $154.9 million for the year ended December 31, 2009. The decrease in our operating costs, included in selling, general and administrative included decreases in fuel expense, billing, installation costs, supplies, travel, and pole attachment rent, that were partially offset by increases in professional services, personnel cost, insurance expense, and bad debt expense. Our non-cash stock option compensation expense, included in selling, general and administrative, increased from $4.6 million for the year ended December 31, 2008, to $6.2 million for the year ended December 31, 2009.
Depreciation and amortization. Our depreciation and amortization decreased from $95.4 million for the year ended December 31, 2008, to $90.7 million for the year ended December 31, 2009, primarily due to the maturing of our asset base.
Debt modification fees. In 2009, we recorded $3.4 million of expense related to the modification of the debt under the Credit Agreement in accordance with the terms of Amendment No. 2, which provides for the extension of the maturity date of an aggregate $397 million of term loans by two years to 2014.
Interest income. Although the cash and certificate of deposit balances were higher in 2009 than in 2008, interest income was $746,000 for the year ended December 31, 2008, compared to $656,000 for the same period in 2009. The decrease in interest income primarily reflects a lower rate of earnings on the cash and cash equivalent balance during the year ended December 31, 2009.
Interest expense. Interest expense decreased from $47.3 million for the year ended December 31, 2008, to $41.6 million for the year ended December 31, 2009. The decrease in interest expense is primarily a result of the decline in interest rates on our long term debt.
44
Table of Contents
Index to Financial Statements
Loss on interest rate derivative instrument. Our loss on interest rate derivative instruments was $6.2 million for the year ended December 31, 2009. As discussed in the Notes to the Financial Statements, the Company no longer qualifies to use hedge accounting for our interest rate swaps on our debt and we recorded $18.3 million in amortization of deferred loss associated with these derivative instruments for the year ended December 31, 2009. A gain of $12.1 million was recorded on the value of the interest rate swaps for the year ended December 31, 2009 as a result of the decrease in the market value of the liability representing the derivative instruments.
Loss on investments. We recorded a loss of $353,000 for the impairment of our investment in Grande Communications for the year ended December 31, 2009. This investment is now recorded on our books as Rio Holdings. During 2009, the ownership of Grande was reorganized to form a new operating LLC, called Grande Communications Networks, LLC. Upon reorganization, all existing shareholders in Grande, including Knology, were combined to form the new Rio Holdings, Inc. Rio Holdings owns 24.7% class A general partnership units in the newly formed Grande Investment, L.P., which through a holding company owns 100% of Grande Communications Networks, LLC.
Other income (expense), net. Other income (expense), net decreased from expense of $367,000 for the year ended December 31, 2008, to income of $479,000 for the year ended December 31, 2009, primarily due to the disposition of property, plant and equipment.
Income tax provision. We recorded no income tax provision for the years ended December 31, 2008 and 2009, respectively, as our net operating losses are fully offset by a valuation allowance.
Loss from continuing operations. We incurred a loss before discontinued operations of $12.1 million for the year ended December 31, 2008, compared to a loss before discontinued operations of $3.4 million for the year ended December 31, 2009.
Net loss attributable to common stockholders. We incurred a net loss attributable to common stockholders of $12.1 million and $3.4 million for the years ended December 31, 2008 and 2009, respectively. We expect to have net income as our business matures.
Liquidity and Capital Resources
Overview. As of December 31, 2010, we had approximately $54.6 million of cash, cash equivalents, restricted cash, and certificates of deposit on our balance sheet. Our net working capital on December 31, 2010 was $20.4 million, compared to net working capital of $26.2 million as of December 31, 2009.
Our financial condition has been significantly influenced by positive cash flow from operations and changes in our debt capital structure. On March 14, 2007, the Company entered into the Credit Agreement, which provides for a $580.0 million credit facility, consisting of a $555.0 million term loan and a $25.0 million revolving credit facility. On April 3, 2007, the Company received the proceeds of the term loan to fund the PrairieWave acquisition purchase price, refinance the Company’s first and second lien credit agreements, and pay transaction costs associated with the transactions.
On May 3, 2007, the Company entered into a new interest rate swap contract to mitigate interest rate risk on a notional amount of $555.0 million amortizing at a rate of 1.0% annually. The swap agreement, which became effective May 3, 2007 and ended July 3, 2010, fixed $451.1 million of the floating rate debt at 4.977% as of December 31, 2009.
On January 4, 2008, the Company entered into a First Amendment to the Credit Agreement, which provides for a $59.0 million incremental term loan. The proceeds of the incremental term loan were used to fund in part the $75.0 million Graceba acquisition purchase price. Prior to Amendment No. 2 discussed below, the term loan bears interest at LIBOR plus 2.75% and amortizes at a rate of 1.0% per annum, payable quarterly, with a June 30, 2012 maturity date. As of December 31, 2009, $32.8 million is outstanding under the incremental loan. In December 2007, the Company entered into a new interest rate swap contract to mitigate interest rate risk on a
45
Table of Contents
Index to Financial Statements
notional amount of $59.0 million amortizing at a rate of 1.0% annually. The swap agreement, which became effective January 4, 2008, fixes $57.8 million of the floating rate debt at 3.995% as of December 31, 2009.
On September 28, 2009, the Company entered into Amendment No. 2 which extends the maturity date of an aggregate $397 million of term loans under the Credit Agreement by two years. The Extended Term Loan bears interest at LIBOR plus 3.50% and amortizes at a rate of 1% per annum, payable quarterly, with a June 30, 2014 maturity date. Amendment No. 2 also, among other modifications, increases the revolving credit facility to $35.0 million from $25.0 million and allows for an annual, cumulative restricted payment allowance of $10 million for dividends and/or share repurchases utilizing excess cash flow and subject to a maximum leverage test.
On October 15, 2010, the Company entered into a New Credit Agreement that provided for a $770 million secured credit facility with proceeds used to partially fund the $165 million Sunflower acquisition purchase price, refinance the company’s existing credit facility, and pay related transaction costs. The New Credit Agreement includes a $50 million revolving credit facility, a $175 million Term Loan A and a $545 million Term Loan B. The Term Loan A bears interest at LIBOR plus a margin ranging from 3.5% to 4.25% and has a term of five years with annual amortization of $8.75 million, $8.75 million, $17.5 million and $26.25 million in 2012, 2013, 2014 and 2015, respectively, with the balance due at maturity. The Term Loan B bears interest at LIBOR plus 4%, with a LIBOR floor of 1.5%, and has a term of six years with 1% principal amortization annually with the balance due at maturity.
The Credit Agreement is guaranteed by substantially all of the Company’s subsidiaries and secured by a first-priority lien and security interest in substantially all of the Company’s assets and the assets of its subsidiaries. The Credit Agreement contains customary representations, warranties, various affirmative and negative covenants and customary events of default. As of December 31, 2010, we are in compliance with all of our debt covenants.
On February 18, 2011, the Company entered into a debt repricing transaction that will reduce the Company’s annual interest expense by approximately $10 million. The interest rate on Term Loan A was repriced to LIBOR plus a margin ranging from 2.5% to 3.25% and the maturity was extended to February 2016. The interest rate on Term Loan B was repriced to LIBOR plus 3%, with a LIBOR floor of 1%, and the maturity was extended to August 2017. In connection with the terms of the repricing, the credit facility was amended to increase the capacity of the incremental basket from $200 million to $250 million, and the Term Loan A principal was increased $20 million with the proceeds to be used to partially fund the CoBridge Broadband, LLC acquisition.
We believe there is adequate liquidity from cash on hand, cash provided from operations and funds available under our $50.0 million revolving credit facility to meet our capital spending requirements and to execute our current business plan.
Operating, investing and financing activities. As of December 31, 2010, we had a net working capital of $20.4 million, compared to net working capital of $26.2 million as of December 31, 2009. The decrease in the working capital from December 31, 2009 to December 31, 2010 is primarily due to a decrease in certificates of deposit resulting from the use of cash for acquisitions activity offset by the expiration of interest rate swaps previously in current liabilities.
Net cash provided by operating activities from continuing operations totaled $80.0 million, $104.2 million and $98.3 million for the years ended December 31, 2008, 2009 and 2010, respectively. The net cash flow activity related to operations consists primarily of changes in operating assets and liabilities and adjustments to net income for non-cash transactions including:
| • | depreciation and amortization; |
| • | loss on debt extinguishment; |
46
Table of Contents
Index to Financial Statements
| • | non-cash stock compensation; |
| • | non-cash bank loan interest expense; |
| • | non-cash gain on interest rate derivative instrument; |
| • | non-cash amortization of deferred loss on interest rate derivative instruments; |
| • | loss on investment; |
| • | provision for bad debt; |
| • | non-cash interest expense; |
| • | loss on disposition of assets; and |
| • | gain on sale of short-term investments. |
Net cash used in investing activities was $121.5 million, $99.7 million and $213.5 million for the years ended December 31, 2008, 2009 and 2010, respectively. In 2008, our investing activities consisted primarily of $75.1 million for the purchase of Graceba, and $46.3 million of capital expenditures. Our 2009 investing activities included $54.9 million of capital expenditures, $35.1 million for the purchase of certificates of deposit, $7.5 million for the purchase of assets from PCL Cable, and the investment of $1.5 million in Tower Cloud, Inc. During 2010, investing activities consisted of $164.8 million for the purchase of assets from Sunflower Broadband, $76.1 million of capital expenditures, and $30.0 million for the purchase of certificates of deposit, partially offset by $35.0 million of maturities of certificates of deposit, and $24.0 million of proceeds from the sale of treasury bills.
Net cash provided by financing activities was $52.5 million for the year ended December 31, 2008. We used net cash from financing activities of $17.8 million for the year ended December 31, 2009. We experienced net cash provided by financing activities of $118.3 million for the year ended December 31, 2010. In 2008, financing activities consisted primarily of $59.0 million proceeds from long term debt and $818,000 proceeds from stock options exercised, partially offset by $7.1 million in principal payments on debt. During 2009, financing activities consisted primarily of $17.5 million in principal payments on debt, $1.8 million of debt modification expenses, partially offset by $1.5 million of proceeds from stock options exercised. For 2010, financing activities consisted primarily of $720.0 million of proceeds from long term debt and $1.6 million of proceeds from stock options exercised, partially offset by $594.7 million of principal payments on debt, and $8.6 million of debt extinguishment expenses.
Capital expenditures, operating expenses and debt service. We spent approximately $76.1 million in capital expenditures during 2010, of which approximately $26.9 million related to the purchase and installation of customer premise equipment, $26.5 million related to plant extensions and enhancements and $22.7 million related to network equipment, billing and information systems and other capital items.
We expect to spend approximately $102.9 million in capital expenditures during 2011. We believe we will have sufficient cash on hand, certificates of deposit and cash from internally generated cash flow to cover our planned operating expenses, capital expenditures and service our debt during 2011. Although the covenants on our credit facility limit the amount of our capital expenditures on an annual basis, we believe we have sufficient capacity under those covenants to fund planned capital expenditures.
We will evaluate acquisition opportunities based on the capital markets and our ability to finance potential transactions on terms attractive to the Company.
Contractual obligations. The following table sets forth, as of December 31, 2010, our long-term debt, capital leases, operating lease and other obligations for 2011 and thereafter. The long-term debt obligations are our principal payments on cash debt service obligations. Interest is comprised of interest payments on cash debt service and capital lease obligations. The capital lease obligations are our future lease payments for video on
47
Table of Contents
Index to Financial Statements
demand equipment, network fiber leasing and other agreements. Operating lease obligations are the future minimum rental payments required under the operating leases that have initial or remaining non-cancelable lease terms in excess of one year as of December 31, 2010.
| Payment due by period | ||||||||||||||||||||
| Contractual obligations (in millions) |
Total | January 1, 2011 through December 31, 2011 |
January 1, 2012 through December 31, 2013 |
January 1, 2014 through December 31, 2015 |
After December 31, 2015 |
|||||||||||||||
| Long-term debt obligations |
$ | 720.0 | $ | 4.1 | $ | 26.2 | $ | 170.6 | $ | 519.1 | ||||||||||
| Interest |
223.6 | 41.5 | 81.2 | 76.7 | 24.2 | |||||||||||||||
| Capital lease obligations |
11.3 | 5.4 | 5.6 | 0.2 | 0.1 | |||||||||||||||
| Operating lease obligations |
20.4 | 5.5 | 8.4 | 3.1 | 3.4 | |||||||||||||||
| Programming contracts (1) |
383.5 | 117.0 | 266.5 | 0 | 0 | |||||||||||||||
| Pole attachment obligations (2) |
13.6 | 4.5 | 9.1 | 0 | 0 | |||||||||||||||
| Total |
$ | 1,372.4 | $ | 178.0 | $ | 397.0 | $ | 250.6 | $ | 546.8 | ||||||||||
| (1) | We have entered into contracts with various entities to provide programming to be aired by us. We pay a monthly fee for the programming services, generally based on the number of average video subscribers to the program, although some fees are adjusted based on the total number of video subscribers to the system and/or the system penetration percentage. The amounts presented are based on the estimated number of connections we will have in future periods through the completion of the current contracts. |
| (2) | Federal law requires utilities, defined to include all local telephone companies and electric utilities except those owned by municipalities and co-operatives, to provide cable operators and telecommunications carriers with nondiscriminatory access to poles, ducts, conduit and rights-of-way at just and reasonable rates. Utilities may charge telecommunications carriers a different rate for pole attachments than they charge cable operators providing solely cable service. The amounts presented are based on the estimated number of poles we will attach to in future periods through the completion of the current contracts. |
As discussed above, we currently expect to spend about $102.9 million in capital expenditures in 2011. We expect to fund our contractual obligations, programming costs, expected capital expenditures and service debt using a portion of the approximately $54.6 million of cash and cash equivalents on hand, and certificates of deposit as of December 31, 2010, with the remainder funded by cash flow generated by operations. Beyond 2011, we may need to raise additional capital through equity offerings, asset sales or debt refinancing to grow the business through any potential merger and acquisition activity.
Recent Accounting Pronouncements
See Note 2 (Summary of Significant Accounting Policies) to our Consolidated Financial Statements included in this annual report for details.
| ITEM 7A. | QUANTITATIVE AND QUALITATIVE DISCLOSURES ABOUT MARKET RISK |
We use interest rate swap and interest rate cap contracts to manage the impact of interest rate changes on earnings and operating cash flows. Interest rate swaps involve the receipt of variable-rate amounts in exchange for fixed-rate payments over the life of the agreements without exchange of the underlying principal amount. Interest rate caps involve the receipt of variable-rate amounts beyond a specified strike price over the life of the agreements without exchange of the underlying principal amount. We believe that these agreements are with counterparties who are creditworthy financial institutions.
In July 2005, we entered into an interest rate cap agreement with Credit Suisse First Boston International with a notional amount of $280 million to cap its adjustable LIBOR rate at 5%, mitigating interest rate risk on the
48
Table of Contents
Index to Financial Statements
first and second lien term loans. We paid $1.3 million for this cap agreement, which became effective July 29, 2005 and terminated July 29, 2008. We did not designate the cap agreement as an accounting hedge under the proper FASB guidance. Accordingly changes in fair value of the cap agreement were recorded through earnings as derivative gains/(losses). On April 18, 2007, we unwound our existing interest rate cap agreement for $0.7 million cash proceeds. “Gain (loss) on interest rate derivative instrument” was $(0.8) million, $0 and $12.1 million for the years ended December 31, 2007, 2008 and 2009, respectively.
On April 18, 2007, we entered into an interest rate swap contract to mitigate interest rate risk on an initial notional amount of $555 million in connection with the first lien term loan associated with the acquisition of PrairieWave. The swap agreement, which became effective May 3, 2007 and ended July 3, 2010, fixed $451.1 million at 4.977% as of December 31, 2009.
The hedge notional amount for the next annual period is summarized below:
| Start date |
End date |
Amount | ||
| October 3, 2009 |
January 3, 2010 | $451.1 million | ||
| January 3, 2010 |
April 2, 2010 | $449.7 million | ||
| April 3, 2010 |
July 3, 2010 | $398.4 million |
On December 19, 2007, the Company entered into a second interest rate swap contract to mitigate interest rate risk on an initial notional amount of $59 million, amortizing 1% annually, in connection with the incremental term loan associated with the acquisition of Graceba. The swap agreement, which became effective January 4, 2008 and ended September 30, 2010, fixed $57.8 million of the floating rate debt at 3.995% as of December 31, 2009.
The notional amount for the next annual period is summarized below:
| Start date |
End date |
Amount | ||
| December 31, 2009 |
March 30, 2010 | $57.8 million | ||
| March 31, 2010 |
June 29, 2010 | $57.7 million | ||
| June 30, 2010 |
September 30, 2010 | $57.5 million |
On November 25, 2009, the Company entered into a third interest rate swap contract to mitigate interest rate risk on an initial notional amount of $400 million. The swap agreement, which did not become effective until July 3, 2010 and ends April 3, 2012, will fix the scheduled notional amount of the floating rate debt at 1.98%.
The notional amount for the next annual period is summarized below:
| Start date |
End date |
Amount | ||
| July 3, 2010 |
October 2, 2010 | $400.0 million | ||
| October 3, 2010 |
January 2, 2011 | $398.8 million |
Until the December 31, 2008 reset of the borrowing rate on the $59 million term loan, changes in the fair value of the Company’s swap agreements were recorded as “Accumulated other comprehensive loss” in the equity section of the balance sheet, and the swap in variable to fixed interest rate was recorded as “Interest expense” on the statement of operations when the interest was incurred. Starting with the reset of the borrowing rate on December 31, 2008, changes in the fair value of the interest rate swaps are recorded as “Gain (loss) on interest rate derivative instruments” in the “Other income (expense)” section of the statement of operations as they are incurred. The Company recorded a gain on the change in the fair value of the interest rate swaps in the amount of $12.1 million for the year ended December 31, 2009. All of the remaining balance in “Accumulated other comprehensive loss” in the stockholders’ equity section of the balance sheet was related to the interest rate swaps, and it was amortized as “Amortization of deferred loss on interest rate swaps” on the statement of
49
Table of Contents
Index to Financial Statements
operations over the remaining life of the derivative instruments. The Company recorded amortization expense related to the deferred loss on interest rate swaps in the amount of $18.3 million and $10.3 million for the years ended December 31, 2009 and 2010, respectively. As of December 31, 2010, there was no amount remaining in accumulated other comprehensive loss to be amortized.
| ITEM 8. | FINANCIAL STATEMENTS AND SUPPLEMENTARY DATA |
Item 8 is incorporated by reference to pages F-1 through F-30 of this annual report.
| ITEM 9. | CHANGES IN AND DISAGREEMENTS WITH ACCOUNTANTS ON ACCOUNTING AND FINANCIAL DISCLOSURE |
None.
| ITEM 9A. | CONTROLS AND PROCEDURES |
Evaluation of Disclosure Controls and Procedures. Our management, with the participation of the Chief Executive Officer and Chief Financial Officer, has evaluated the effectiveness of our disclosure controls and procedures (as defined in Rules 13a-15(e) and 15d-15(e) under the Securities Exchange Act of 1934, as amended) as of December 31, 2010. Based on that evaluation, the Chief Executive Officer and Chief Financial Officer have concluded that, as of December 31, 2010, our disclosure controls and procedures are effective.
Evaluation of Internal Control over Financial Reporting. Pursuant to Section 404 of the Sarbanes-Oxley Act of 2002, we have included a report on management’s assessment of the design and effectiveness of our internal control over financial reporting as part of this Annual Report on Form 10-K for the year ended December 31, 2010. Our independent registered public accounting firm also audited, and reported on the effectiveness of our internal control over financial reporting. Management’s report is included below under the caption “Management’s Report on Internal Control over Financial Reporting” and the independent registered public accounting firm’s attestation report is included below under the caption “Report of Independent Registered Public Accounting Firm on Internal Control over Financial Reporting”.
Changes in Internal Control over Financial Reporting. There have been no changes in our internal control over financial reporting that occurred during the quarter ended December 31, 2010 that have materially affected, or are reasonably likely to materially affect, our internal control over financial reporting.
50
Table of Contents
Index to Financial Statements
MANAGEMENT’S REPORT ON INTERNAL CONTROL OVER FINANCIAL REPORTING
Our management is responsible for establishing and maintaining adequate internal control over financial reporting, as such term is defined in Exchange Act Rules 13a-15(f) and 15d-15(f). Under the supervision and with the participation of our management, including our Chief Executive Officer and Chief Financial Officer, we conducted an evaluation of the effectiveness of our internal control over financial reporting as of December 31, 2010 based on the framework in Internal Control—Integrated Framework issued by the Committee of Sponsoring Organizations of the Treadway Commission (COSO). Based on that evaluation, our management concluded that our internal control over financial reporting was effective as of December 31, 2010.
Management excluded Sunflower from its assessment of internal control over financial reporting as of December 31, 2010 because they were acquired by the Company in a purchase business combination during 2010. Sunflower is a wholly-owned subsidiary whose net assets represent 22%, and whose net revenues represent 2%, of the related consolidated financial statement amounts as of and for the year ended December 31, 2010.
Because of its inherent limitations, internal control over financial reporting may not prevent or detect misstatements. Therefore, even those systems determined to be effective can provide only reasonable assurance with respect to financial statement preparation and presentation.
The effectiveness of our internal control over financial reporting as of December 31, 2010 has been audited by BDO USA, LLP, an independent registered public accounting firm, as stated in their report which is included elsewhere herein.
Date: March 15, 2011
| /s/ RODGER L. JOHNSON |
/s/ ROBERT K. MILLS | |||
| Rodger L. Johnson | Robert K. Mills | |||
| Chief Executive Officer | Chief Financial Officer |
| ITEM 9B. | OTHER INFORMATION |
None.
51
Table of Contents
Index to Financial Statements
Report of Independent Registered Public Accounting Firm
Board of Directors and Stockholders
Knology, Inc.
West Point, Georgia
We have audited Knology, Inc.’s internal control over financial reporting as of December 31, 2010, based on criteria established in Internal Control—Integrated Framework issued by the Committee of Sponsoring Organizations of the Treadway Commission (the COSO criteria). Knology Inc.’s management is responsible for maintaining effective internal control over financial reporting and for its assessment of the effectiveness of internal control over financial reporting, included in the accompanying Item 9A, Management’s Report on Internal Control Over Financial Reporting. Our responsibility is to express an opinion on the company’s internal control over financial reporting based on our audit.
We conducted our audit in accordance with the standards of the Public Company Accounting Oversight Board (United States). Those standards require that we plan and perform the audit to obtain reasonable assurance about whether effective internal control over financial reporting was maintained in all material respects. Our audit included obtaining an understanding of internal control over financial reporting, assessing the risk that a material weakness exists, and testing and evaluating the design and operating effectiveness of internal control based on the assessed risk. Our audit also included performing such other procedures as we considered necessary in the circumstances. We believe that our audit provides a reasonable basis for our opinion.
A company’s internal control over financial reporting is a process designed to provide reasonable assurance regarding the reliability of financial reporting and the preparation of financial statements for external purposes in accordance with generally accepted accounting principles. A company’s internal control over financial reporting includes those policies and procedures that (1) pertain to the maintenance of records that, in reasonable detail, accurately and fairly reflect the transactions and dispositions of the assets of the company; (2) provide reasonable assurance that transactions are recorded as necessary to permit preparation of financial statements in accordance with generally accepted accounting principles, and that receipts and expenditures of the company are being made only in accordance with authorizations of management and directors of the company; and (3) provide reasonable assurance regarding prevention or timely detection of unauthorized acquisition, use, or disposition of the company’s assets that could have a material effect on the financial statements.
Because of its inherent limitations, internal control over financial reporting may not prevent or detect misstatements. Also, projections of any evaluation of effectiveness to future periods are subject to the risk that controls may become inadequate because of changes in conditions, or that the degree of compliance with the policies or procedures may deteriorate.
As indicated in the accompanying Item 9A. Management’s Report on Internal Control over Financial Reporting, management’s assessment of and conclusion on the effectiveness of internal control over financial reporting did not include the internal controls of Sunflower Broadband, which was acquired on October 15, 2010, and which is included in the consolidated balance sheets of Knology, Inc. as of December 31, 2010, and the related consolidated statements of operations, stockholders’ equity, and cash flows for the year then ended. Sunflower Broadband constituted 22% of total assets, as of December 31, 2010, and 2% of net revenues for the year then ended. Management did not assess the effectiveness of internal control over financial reporting of Sunflower Broadband because of the timing of the acquisition which was completed on October 15, 2010. Our audit of internal control over financial reporting of Knology, Inc. also did not include an evaluation of the internal control over financial reporting of Sunflower Broadband.
In our opinion, Knology, Inc. maintained, in all material respects, effective internal control over financial reporting as of December 31, 2010, based on the COSO criteria.
52
Table of Contents
Index to Financial Statements
We also have audited, in accordance with the standards of the Public Company Accounting Oversight Board (United States), the consolidated balance sheets of Knology, Inc. as of December 31, 2010 and 2009, and the related consolidated statements of operations, stockholders’ deficit, and cash flows for each of the three years in the period ended December 31, 2010 and our report dated March 15, 2011 expressed an unqualified opinion thereon.
/s/ BDO USA, LLP
Atlanta, Georgia
March 15, 2011
53
Table of Contents
Index to Financial Statements
PART III
| ITEM 10. | DIRECTORS, EXECUTIVE OFFICERS AND CORPORATE GOVERNANCE |
The following table sets forth information regarding our officers and directors. Our board of directors is divided among three classes, with members serving three-year terms expiring in the years indicated. Our officers serve at the discretion of the board of directors and until the earlier of their resignation, termination or until their successors are duly elected and qualified.
| Name |
Age | Position |
Current Term Expires |
|||||||
| Rodger L. Johnson |
63 | Chief Executive Officer and Chairman of the Board | 2011 | |||||||
| M. Todd Holt |
43 | President | ||||||||
| Robert K. Mills |
47 | Chief Financial Officer | ||||||||
| Bret T. McCants |
51 | Executive Vice President of Operations | ||||||||
| John D. Treece |
41 | Vice President of Engineering and Chief Technical Officer | ||||||||
| Chad S. Wachter |
44 | Vice President, General Counsel and Secretary | ||||||||
| Alan A. Burgess (1) |
75 | Director | 2012 | |||||||
| Donald W. Burton (2) |
67 | Director | 2013 | |||||||
| Eugene I. Davis (1)(3) |
56 | Director | 2011 | |||||||
| O. Gene Gabbard (1)(2) |
70 | Director | 2012 | |||||||
| Campbell B. Lanier, III |
60 | Lead Director | 2011 | |||||||
| William H. Scott, III (2)(3) |
63 | Director | 2013 | |||||||
| (1) | Member of the audit committee. |
| (2) | Member of the compensation and stock option committee. |
| (3) | Member of the nominating committee. |
Provided below are biographies of each of the officers and directors listed in the table above.
Rodger L. Johnson was appointed Chairman of the Board in July 2008 and continues as Chief Executive Officer, a position he has held since June 1999. Mr. Johnson had served as President from April 1999 to July 2008 and has served as a director since April 1999. Prior to joining us, Mr. Johnson had served as President and Chief Executive Officer, as well as a director, of Communications Central, Inc., a publicly traded provider of pay telephone services. Prior to joining Communications Central, Mr. Johnson served as the President and Chief Executive Officer of JKC Holdings, Inc., a consulting company providing advice to the information processing industry. In that capacity, Mr. Johnson also served as the Chief Operating Officer of CareCentric, Inc., a publicly traded medical software manufacturer. Before founding JKC Holdings, Inc., Mr. Johnson served for approximately eight years as the President and Chief Operating Officer and as the President and Chief Executive Officer of Firstwave Technologies, Inc., a publicly traded sales and marketing software provider. Mr. Johnson spent his early career from June 1971 to November 1984 with AT&T where he worked in numerous departments, including sales, marketing, engineering, operations and human resources. In his final job at AT&T, he directed the development of consumer market sales strategies for AT&T’s Northeastern Region.
Todd Holt has served as our President since July 2008. Mr. Holt served as President and Chief Financial Officer from April 2009 to February 2011, and served as Chief Financial Officer from August 2005 to July 2008. Mr. Holt was Knology’s Corporate Controller from January 1998 to July 2005. Mr. Holt is a member of the American Institute of Certified Public Accountants and previously practiced public accounting as an audit manager with Ernst & Young.
Robert K. Mills was appointed Chief Financial Officer in February 2011. Mr. Mills previously served as our Chief Financial Officer from 1999 to August 2005. From 2005 to August 2007, Mr. Mills served as the chief
54
Table of Contents
Index to Financial Statements
financial officer of Tri-S Security Corporation, a publicly traded company focused on building a large, diversified federal and commercial contracting business in the security services industry. From August 2007 to October 2008, Mr. Mills served as the chief financial officer of Vyyo, Inc., a publicly traded manufacturer of technology intended to provide extended bandwidth solutions for cable system operators. From December 2008 to April 2010, Mr. Mills served as the chief financial officer of Industriaplex, Inc., a global sourcing and services company. From April 2010 to January 2011, Mr. Mills served as the chief operating officer and chief financial officer of Clearleap, Inc., a venture-backed startup software company that specializes in Internet-protocol (IP) based video-on-demand delivery services to the cable and IPTV industry. Mr. Mills is a certified public accountant and served as an auditor with an international accounting firm for seven years.
Bret T. McCants has served as our Executive Vice President of Operations since July 2008 and served as our Senior Vice President of Operations from December 2004 to July 2008. From April 1997 to December 2004, Mr. McCants served as our Vice President of Network Services. Prior to joining Knology, Mr. McCants served as Director of Operations and Energy Management for CSW Communications. Mr. McCants has extensive experience in two-way customer controlled load management equipment and their facilitating networks. He has over twelve years of experience in operations, sales and marketing and engineering with the electric utility industry.
John D. Treece has served as our Vice President of Engineering and Chief Technical Officer since joining Knology in August 2009. Mr. Treece oversees our technology strategy for IP infrastructure, managing the direction of network operations, engineering, and information technology. From 2007 to 2009, Mr. Treece held the position of Vice President of Network Engineering for Comcast’s Southern Division. From 2005 to 2007, Mr. Treece held the position of Director of Business Development with Juniper Networks. From 1999 to 2005, Mr. Treece held various positions with Comcast Corporation. Prior to that time, Mr. Treece also worked for Viacom and InterMedia Partners.
Chad S. Wachter has served as our Vice President since October 1999 and as General Counsel and Secretary since August 1998. From April 1997 to August 1998, Mr. Wachter served as Assistant General Counsel of Powertel, Inc., which was a provider of wireless communications services. From May 1990 until April 1997, Mr. Wachter was an associate and then a partner with Capell, Howard, Knabe & Cobbs, P.A. in Montgomery, Alabama.
Alan A. Burgess has been one of our directors since January 1999. From 1967 until his retirement in 1997, Mr. Burgess was a partner with Accenture (formerly Andersen Consulting). Over his 30-year career he held a number of positions with Accenture, including Managing Partner of Regulated Industries from 1974 to 1989. In 1989, he assumed the role of Managing Partner of the Communications Industry Group. In addition, he served on Accenture’s Global Management council and was a member of the Partner Income Committee.
Donald W. Burton has been one of our directors since January 1996. Since December 1983, he has served as Managing General Partner of South Atlantic Venture Funds. Mr. Burton also has been the General Partner of the Burton partnerships since October 1979. Since January 1981, he has served as President and Chairman of South Atlantic Capital Corporation. Mr. Burton is a director of Capital Southwest Corporation and serves as an independent director on the BlackRock Equity Bond Board.
Eugene I. Davis has been one of our directors since November 2002. Mr. Davis is Chairman and Chief Executive Officer of Pirinate Consulting Group, LLC, a privately held consulting firm, and of RBX Industries, Inc., a manufacturer and distributor of rubber and plastic products. From May 1999 to June 2001, he served as Chief Executive Officer of SmarTalk Teleservices Corp., an independent provider of prepaid calling cards. Mr. Davis was Chief Operating Officer of Total-Tel Communications, Inc., a long-distance telecommunications provider from October 1998 to March 1999. Mr. Davis currently serves as the chairman of the board of Atlas Air Worldwide Holdings, Inc. In addition, during the past five years, Mr. Davis has held directorship positions with the following public companies: American Commercial Lines Inc., Exide Technologies, iPCS, Inc., Oglebay
55
Table of Contents
Index to Financial Statements
Norton Industrial Sands, Inc., Tipperary Corporation, Viskase Companies, Inc., McLeod Communications, Granite Broadcasting Corporation, Footstar Corporation, PRG-Schultz International, Inc., Silicon Graphics International Corp., SeraCare Life Sciences, Inc., FXI-Foamex Innovations, Ion Media Networks, Inc., Delta Airlines, Inc., Atari, Inc., Solutia Inc., Media General, Inc., Rural/Metro Corporation, TerreStar Corporation, Spectrum Brands, Inc., Ambassadors International, Inc., and DEX One Corporation.
O. Gene Gabbard has been one of our directors since September 2003. Mr. Gabbard has worked independently as an entrepreneur and consultant since February 1993. From August 1990 to January 1993, Mr. Gabbard served as Executive Vice President and Chief Financial Officer of MCI Communications Corporation. Mr. Gabbard also served from June 1998 to June 2002 as Chairman of the Board of ClearSource, Inc., a provider of broadband communications services. In January 2005, Mr. Gabbard was appointed to the Board of Directors of COLT Telecom Group, SA, Luxembourg, a provider of telecommunications service to businesses throughout Europe. Since June 2006, he has also been a member of the board and audit committee of Hughes Communications, Inc., Germantown, Maryland, the leading provider of satellite based data communications systems and services. He is currently a Special Limited Partner in Ballast Point Ventures, a venture capital fund based in St. Petersburg, Florida.
Campbell B. Lanier, III has been one of our directors since November 1995 and served as Chairman of the Board from September 1998 until July 2008, when he was designated as our Lead Director. Since May 2003, Mr. Lanier has served as Chairman and Chief Executive Officer of Magnolia Holding Company, LLC and Chairman of ITC Holding Company, LLC. Magnolia is a major shareholder in a promotional goods business, and a minor shareholder in Interactive Communications, Inc. (InComm), a provider of stored value card services, prepaid telephony, and other prepaid products. Mr. Lanier serves on the Board of Directors of InComm. ITC provides early stage funding for businesses in technology, telecom, and financial services. Mr. Lanier served as Chairman of the Board and Chief Executive Officer of ITC Holding Company, Inc. from its inception in May 1989 until its sale to West Corporation in May 2003. During this period, Mr. Lanier was also an officer and director of several subsidiaries of ITC Holding, Inc. In conjunction with the sale of ITC Holding Company, Inc. to West Corporation, the ITC Holding Company name was transferred to an entity owned by Mr. Lanier, and continues to operate currently as ITC Holding Company, LLC (noted above). In addition, since January 2008 Mr. Lanier has served as Manager of the General Partner of ITC Partners Fund I, LP, a private investment fund targeting primarily early stage technology companies. Mr. Lanier has also served as a Managing Director of South Atlantic Private Equity Fund, IV, Limited Partnership since July 1997, and as a Senior Director of Kinetic Ventures, LLC since January 2009.
William H. Scott, III has been one of our directors since November 1995. He served as President of ITC Holding Company, Inc. from December 1991 and was a director of that company until its sale in May 2003. Mr. Scott is a private investor in and serves as a director of several private companies.
The remaining information required by this Item 10 will be contained in our definitive proxy statement for our 2011 Annual Meeting of Stockholders to be filed with the SEC (the Proxy Statement) in the sections entitled “Information About Our Executive Officers, Directors and Nominees,” “Meetings and Committees of the Board”, “Section 16(a) Beneficial Ownership Reporting Compliance” and possibly elsewhere therein, and such information is incorporated in this Annual Report on Form 10-K by this reference.
We have adopted a code of ethics that applies to our employees, officers and directors, including our chief executive officer, chief financial officer, principal accounting officer and controller. This code of ethics is posted on our website located at www.knology.com. The code of ethics may be found as follows: from our main web page, first click on “Corporate Information” and then on “About Us” at the top of the page and then on “Investors.” Next, click on “Corporate Governance.” Finally, click on “Standards of Conduct.” We intend to satisfy the disclosure requirement under Item 5.05 of Form 8-K regarding an amendment to, or waiver from, a provision of this code of ethics by posting such information on our website, at the address and location specified above.
56
Table of Contents
Index to Financial Statements
| ITEM 11. | EXECUTIVE COMPENSATION |
The information required by this Item 11 will be contained in the sections entitled “Executive Compensation”, “Compensation Committee Interlocks and Insider Participation” and “Meetings and Committees of the Board” of our 2011 Proxy Statement and possibly elsewhere therein, and such information is incorporated in this Annual Report on Form 10-K by this reference.
| ITEM 12. | SECURITY OWNERSHIP OF CERTAIN BENEFICIAL OWNERS AND MANAGEMENT AND RELATED STOCKHOLDER MATTERS |
The information required by this Item 12 will be contained in the section entitled “Principal Stockholders” of our 2011 Proxy Statement and possibly elsewhere therein, and such information is incorporated in this Annual Report on Form 10-K by this reference.
| ITEM 13. | CERTAIN RELATIONSHIPS AND RELATED TRANSACTIONS, AND DIRECTOR INDEPENDENCE |
The information required by this Item 13 will be contained in the section entitled “Transactions with Related Persons” of our 2011 Proxy Statement and possibly elsewhere therein, and such information is incorporated in this Annual Report on Form 10-K by this reference.
| ITEM 14. | PRINCIPAL ACCOUNTANT FEES AND SERVICES |
The information required by this Item 14 will be contained in the section entitled “Fees Paid to Independent Registered Public Accounting Firms” of our 2011 Proxy Statement and possibly elsewhere therein, and such information is incorporated in this Annual Report on Form 10-K by this reference.
57
Table of Contents
Index to Financial Statements
PART IV
| ITEM 15. | EXHIBITS AND FINANCIAL STATEMENT SCHEDULES |
(a)(1) The following Consolidated Financial Statements of the Company and independent auditors’ report are included in Item 8 of this Annual Report on Form 10-K.
Report of Independent Registered Public Accounting Firm.
Consolidated Balance Sheets as of December 31, 2009 and 2010.
Consolidated Statements of Operations for the Years Ended December 31, 2008, 2009 and 2010.
Consolidated Statements of Stockholders’ Equity for the Years Ended December 31, 2008, 2009 and 2010.
Consolidated Statements of Cash Flows for the Years Ended December 31, 2008, 2009 and 2010.
Notes to Consolidated Financial Statements.
(a)(2) All schedules for which provision is made in the applicable accounting regulations of the Securities and Exchange Commission either have been included in the Consolidated Financial Statements of the Company or the notes thereto, are not required under the related instructions or are inapplicable, and therefore have been omitted.
(a)(3) The following exhibits are either provided with this Form 10-K or are incorporated herein by reference:
| Exhibit No. |
Exhibit Description | |
| 2.1 | Share Purchase Agreement, dated November 2, 2007, by and among Graceba Total Communications, Inc., C. Christopher Dupree, Knology, Inc. and Knology of Alabama, Inc. (Incorporated herein by reference to Exhibit 2.2 to Knology, Inc.’s Annual Report on Form 10-K for the year ended December 31, 2007 (File No. 000-32647)). | |
| 2.2 | Asset Purchase Agreement, dated as of August 3, 2010, by and between The World Company and Knology of Kansas, Inc. (Incorporated herein by reference to Exhibit 2.1 to Knology, Inc.’s Quarterly Report on Form 10-Q for the period ended September 30, 2010 (File No. 000-32647)). | |
| 3.1 | Amended and Restated Certificate of Incorporation of Knology, Inc. (Incorporated herein by reference to Exhibit 3.1 to Knology, Inc.’s Quarterly Report Form 10-Q for the period ended June 30, 2004 (File No. 000-32647)). | |
| 3.2 | Certificate of Designations of Powers, Preferences, Rights, Qualifications, Limitations and Restrictions of Series X Junior Participating Preferred Stock of Knology, Inc. (Incorporated herein by reference to Exhibit 3.1 to Knology, Inc.’s Current Report on Form 8-K filed July 29, 2005 (File No. 000-32647)). | |
| 3.3 | Bylaws of Knology, Inc. (Incorporated herein by reference to Exhibit 3.2 to Knology, Inc. Registration Statement on Form S-1 (File No. 333-89179)). | |
| 4.1 | Stockholder Protection Rights Agreement, dated as of July 27, 2005, by and between Knology, Inc. and Wachovia Bank, N.A., acting as Rights Agent (which includes as Exhibit A thereto the Form of Rights Certificate) (Incorporated herein by reference to Exhibit 4.1 to Knology, Inc.’s Current Report on Form 8-K filed July 29, 2005 (File No. 000-32647)). | |
| 10.1.1 | Stockholders Agreement dated February 7, 2000 among Knology, Inc., certain holders of the Series A preferred stock, the holders of Series B Preferred stock, certain management holders and certain additional stockholders (Incorporated herein by reference to Exhibit 10.84 to Knology, Inc.’s Post-Effective Amendment No. 2 to Form S-1 (File No. 333-89179)). | |
58
Table of Contents
Index to Financial Statements
| Exhibit No. |
Exhibit Description | |
| 10.1.2 | Amendment No. 1 to Stockholders Agreement, dated as of February 7, 2000, by and among Knology, Inc. and the other signatories thereto, dated as of January 12, 2001, by and among Knology, Inc. and the other signatories thereto (Incorporated herein by reference to Exhibit 10.2 to Knology, Inc.’s Current Report on Form 8-K filed January 26, 2001 (File No. 000-32647)). | |
| 10.1.3 | Amendment No. 2 to Stockholders Agreement, dated as of February 7, 2000, by and among Knology, Inc. and the other signatories thereto, as amended as of January 12, 2001, dated as of October 18, 2002, by and among Knology, Inc. and the other signatories thereto (Incorporated herein by reference to Exhibit 10.1.3 to Knology, Inc.’s Annual Report on Form 10-K for the year ended December 31, 2002 (File No. 000-32647)). | |
| 10.2 | Lease, dated June 1, 2003 by and between D. L. Jordan, L.L.P. Family Partnership and Knology, Inc. (Incorporated herein by reference to Exhibit 10.62 to Knology, Inc.’s Annual Report on Form 10-K for the year ended December 31, 2003 (File No. 000-32647)). | |
| 10.3 | Pole Attachment Agreement dated January 1, 1998 by and between Gulf Power Company and Beach Cable, Inc. (Incorporated herein by reference to Exhibit 10.7 to Knology Broadband, Inc.’s Registration Statement on Form S-4 (File No. 333-43339)). | |
| 10.4 | Telecommunications Facility Lease and Capacity Agreement, dated September 10, 1996, by and between Troup EMC Communications, Inc. and Cybernet Holding, Inc. (Incorporated herein by reference to Exhibit 10.16 to Knology Broadband, Inc.’s Registration Statement on Form S-4 (File No. 333-43339)). | |
| 10.5 | Master Pole Attachment agreement dated January 12, 1998 by and between South Carolina Electric and Gas and Knology Holdings, Inc. d/b/a/ Knology of Charleston (Incorporated herein by reference to Exhibit 10.17 to Knology Broadband, Inc.’s Registration Statement on Form S-4 (File No. 333-43339)). | |
| 10.6 | Lease Agreement, dated December 5, 1997 by and between The Hilton Company and Knology of Panama City, Inc. (Incorporated herein by reference to Exhibit 10.25 to Knology Broadband, Inc.’s Registration Statement on Form S-4 (File No. 333-43339)). | |
| 10.7 | Certificate of Membership with National Cable Television Cooperative, dated January 29, 1996, of Cybernet Holding, Inc. (Incorporated herein by reference to Exhibit 10.34 to Knology Broadband, Inc.’s Registration Statement on Form S-4 (File No. 333-43339)). | |
| 10.8 | Ordinance No. 99-16 effective March 16, 1999 between Columbus consolidated Government and Knology of Columbus Inc. (Incorporated herein by reference to Exhibit 10.18 to Knology Broadband, Inc.’s Annual Report on Form 10-K for the year ended December 31, 1998 (File No. 333-43339)). | |
| 10.9 | Ordinance No. 16-90 (Montgomery, Alabama) dated March 6, 1990 (Incorporated herein by reference to Exhibit 10.44 to Knology Broadband, Inc.’s Registration Statement on Form S-4 (File No. 333-43339)). | |
| 10.10 | Ordinance No. 50-76 (Montgomery, Alabama) (Incorporated herein by reference to Exhibit 10.45 to Knology Broadband, Inc.’s Registration Statement on Form S-4 (File No. 333-43339)). | |
| 10.11 | Ordinance No. 9-90 (Montgomery, Alabama) dated January 16, 1990 (Incorporated herein by reference to Exhibit 10.45.1 to Knology Broadband, Inc.’s Registration Statement on Form S-4 (File No. 333-43339)). | |
| 10.12 | Resolution No. 58-95 (Montgomery, Alabama) dated April 6, 1995 (Incorporated herein by reference to Exhibit 10.46 to Knology Broadband, Inc.’s Registration Statement on Form S-4 (File No. 333-43339)). | |
59
Table of Contents
Index to Financial Statements
| Exhibit No. |
Exhibit Description | |
| 10.13 | Ordinance No. 78-2007 (Montgomery, Alabama), dated November 5, 2007 (Incorporated herein by reference to Exhibit 10.13 to Knology, Inc.’s Annual Report on Form 10-K for the year ended December 31, 2007 (File No. 000-32647)). | |
| 10.14 | Resolution No. 97-22 (Panama City Beach, Florida) dated December 3, 1997 (Incorporated herein by reference to Exhibit 10.49 to Knology Broadband, Inc.’s Registration Statement on Form S-4 (File No. 333-43339)). | |
| 10.15 | Ordinance No. 5999 (Augusta, Georgia) dated January 20, 1998 (Incorporated herein by reference to Exhibit 10.53 to Knology Broadband, Inc.’s Annual Report on Form 10-K for the year ended December 31, 1997 (File No. 333-43339)). | |
| 10.16 | Ordinance No. 1723 (Panama City, Florida) dated March 10, 1998 (Incorporated herein by reference to Exhibit 10.54 to Knology Broadband, Inc.’s Annual Report on Form 10-K for the year ended December 31, 1997 (File No. 333-43339)). | |
| 10.17 | Franchise Agreement (Charleston County, South Carolina) dated December 15, 1998 (Incorporated herein by reference to Exhibit 10.31 to Knology Broadband, Inc.’s Annual Report on Form 10-K for the year ended December 31, 1998 (File No. 333-43339)). | |
| 10.18 | Ordinance No. 1998-47 (North Charleston, South Carolina) dated May 28, 1998 (Incorporated herein by reference to Exhibit 10.32 to Knology Broadband, Inc.’s Annual Report on Form 10-K for the year ended December 31, 1998 (File No. 333-43339)). | |
| 10.19 | Ordinance No. 1998-77 (Charleston, South Carolina) dated April 28, 1998 (Incorporated herein by reference to Exhibit 10.33 to Knology Broadband, Inc.’s Annual Report on Form 10-K for the year ended December 31, 1998 (File No. 333-43339)). | |
| 10.20 | Ordinance No. 98-5 (Columbia County, Georgia) dated August 18, 1998 (Incorporated herein by reference to Exhibit 10.34 to Knology Broadband Inc.’s Annual Report on Form 10-K for the year ended December 31, 1998 (File No. 333-43339)). | |
| 10.21 | Network Access Agreement dated July 1, 1998 between SCANA Communications, Inc., f/k/a MPX Systems, Inc. and Knology Holdings, Inc. (Incorporated herein by reference to Exhibit 10.36 to Knology Broadband, Inc.’s Annual Report on Form 10-K for the year ended December 31, 1998 (File No. 333-43339)). | |
| 10.22 † | Collocation Agreement for Multiple Sites dated on or about June 1998 between Interstate FiberNet, Inc. and Knology Holdings, Inc. (Incorporated herein by reference to Exhibit 10.38 to Knology Broadband, Inc.’s Annual Report on Form 10-K for the year ended December 31, 1998 (File No. 333-43339)). | |
| 10.23 † | Lease Agreement dated October 12, 1998 between Southern Company Services, Inc. and Knology Holdings, Inc. (Incorporated herein by reference to Exhibit 10.39 to Knology Broadband, Inc.’s Annual Report on Form 10-K for the year ended December 31, 1998 (File No. 333-43339)). | |
| 10.24 | Facilities Transfer Agreement dated February 11, 1998 between South Carolina Electric and Gas Company and Knology Holdings, Inc., d/b/a Knology of Charleston (Incorporated herein by reference to Exhibit 10.40 to Knology Broadband, Inc.’s Annual Report on Form 10-K for the year ended December 31, 1998 (File No. 333-43339)). | |
| 10.25 | License Agreement dated March 3, 1998 between BellSouth Telecommunications, Inc. and Knology Holdings, Inc. (Incorporated herein by reference to Exhibit 10.41 to Knology Broadband, Inc.’s Annual Report on Form 10-K for the year ended December 31, 1998 (File No. 333-43339)). | |
| 10.26 | Pole Attachment Agreement dated February 18, 1998 between Knology Holdings, Inc. and Georgia Power Company (Incorporated herein by reference to Exhibit 10.44 to Knology Broadband, Inc.’s Annual Report on Form 10-K for the year ended December 31, 1998 (File No. 333-43339)). | |
60
Table of Contents
Index to Financial Statements
| Exhibit No. |
Exhibit Description | |
| 10.27 | Assignment Agreement dated March 4, 1998 between Gulf Power Company and Knology of Panama City, Inc. (Incorporated herein by reference to Exhibit 10.46 to Knology Broadband, Inc.’s Annual Report on Form 10-K for the year ended December 31, 1998 (File No. 333-43339)). | |
| 10.28 | Pole Attachment Agreement, dated April 12, 2007, between PrairieWave Black Hills, LLC and Black Hills Power, Inc. (Incorporated herein by reference to Exhibit 10.29 to Knology, Inc.’s Annual Report on Form 10-K for the year ended December 31, 2007 (File No. 000-32647)). | |
| 10.29 | Right of First Refusal and Option Agreement, Dated November 19, 1999 by and between Knology of Columbus, Inc. and ITC Service Company, Inc. (Incorporated herein by reference to Exhibit 10.60 to Knology, Inc.’s Registration Statement on Form S-1 (File No. 333-89179)). | |
| 10.304 | Services Agreement dated November 2, 1999 between Knology, Inc. and ITC Service Company, Inc. (Incorporated herein by reference to Exhibit 10.61 to Knology, Inc.’s Registration Statement on Form S-1 (File No. 333-89179)). | |
| 10.31 | Support Agreement, dated November 2, 1999 between Interstate Telephone Company, Inc. and ITC Service Company, Inc. (Incorporated herein by reference to Exhibit 10.62 to Knology, Inc.’s Registration Statement on Form S-1 (File No. 333-89179)). | |
| 10.32 ** | Knology, Inc. Amended and Restated 2002 Long Term Incentive Plan (Incorporated by reference to Exhibit B to Knology, Inc.’s Proxy Statement for the 2004 Annual Meeting of Shareholders (File No. 000-32647)). | |
| 10.33 | Joint Ownership Agreement dated as of December 8, 1998, among ITC Service Company, Powertel, Inc., ITC/\DeltaCom Communications, Inc. and Knology Holdings, Inc. (Incorporated herein by reference to Exhibit 10.48 to Knology, Inc.’s Annual Report on Form 10-K for the year ended December 31, 1999 (File No. 000-32647)). | |
| 10.34 † | Dedicated Capacity Agreement between DeltaCom and Knology Holdings, Inc. dated August 22, 1997. (Incorporated herein by reference to Exhibit 10.50 to Knology, Inc.’s Annual Report on Form 10-K for the year ended December 31, 1999 (File No. 000-32647)). | |
| 10.35 † | Agreement for Telecommunications Services dated April 28, 1999 between ITC/\DeltaCom Communications, Inc. and Knology Holdings, Inc. (Incorporated herein by reference to Exhibit 10.51 to Knology, Inc.’s Annual Report on Form 10-K for the year ended December 31, 1999 (File No. 000-32647)). | |
| 10.36 † | Amendment to Master Capacity Lease dated November 1, 1999 between Interstate Fibernet, Inc. and Knology Holdings, Inc. (Incorporated herein by reference to Exhibit 10.52 to Knology, Inc.’s Annual Report on Form 10-K for the year ended December 31, 1999 (File No. 000-32647)). | |
| 10.37 | Duct Sharing Agreement dated July 27, 1999 between Knology Holdings, Inc. and Interstate Fiber Network. (Incorporated herein by reference to Exhibit 10.53 to Knology, Inc.’s Annual Report on Form 10-K for the year ended December 31, 1999 (File No. 000-32647)). | |
| 10.38 | Assumption of Lease Agreement dated November 9, 1999 between Knology Holdings, Inc., ITC Holding Company, Inc. and J. Smith Lanier II. (Incorporated herein by reference to Exhibit 10.54 to Knology, Inc.’s Annual Report on Form 10-K for the year ended December 31, 1999 (File No. 000-32647)). | |
| 10.39 | Assumption of Lease Agreement dated November 9, 1999 among Knology Holdings, Inc., ITC Holding Company, Inc. and Midtown Realty, Inc. (Incorporated herein by reference to Exhibit 10.55 to Knology, Inc.’s Annual Report on Form 10-K for the year ended December 31, 1999 (File No. 000-32647)). | |
61
Table of Contents
Index to Financial Statements
| Exhibit No. |
Exhibit Description | |
| 10.40 † | Contract for Centrex Switching Services dated January 4, 1999 between Interstate Telephone Company and InterCall, Inc. (Incorporated herein by reference to Exhibit 10.56 to Knology, Inc.’s Annual Report on Form 10-K for the year ended December 31, 1999 (File No. 000-32647)). | |
| 10.41 | Sublease Agreement, dated as of December 30, 2003, by and between Verizon Media Ventures, Inc. and Knology Broadband of Florida, Inc. (Incorporated herein by reference to Exhibit 10.53 to Knology, Inc.’s Annual Report on Form 10-K for the year ended December 31, 2003 (File No. 000-32647)). | |
| 10.42 | State of Florida Department of State Certificate of Franchise Authority issued to Knology, Inc. on January 9, 2008, as amended June 10, 2008. (Incorporated herein by reference to Exhibit 10.42 to Knology, Inc.’s Annual Report on Form 10-K for the year ended December 31, 2008 (File No. 000-32647)). | |
| 10.43 | Tennessee Regulatory Authority Certificate of Franchise Authority issued to Knology, Inc. on December 15, 2008. (Incorporated herein by reference to Exhibit 10.43 to Knology, Inc.’s Annual Report on Form 10-K for the year ended December 31, 2008 (File No. 000-32647)). | |
| 10.44 † | Lease, dated December 15, 2008 by and between D. L. Jordan Company and Knology, Inc. (Incorporated herein by reference to Exhibit 10.44 to Knology, Inc.’s Annual Report on Form 10-K for the year ended December 31, 2008 (File No. 000-32647)). | |
| 10.45 | MCI Internet Dedicated OC12 Burstable Agreement, dated June 11, 2003, by and between Knology, Inc. and MCI WORLDCOM Communications, Inc. (Incorporated herein by reference to Exhibit 10.59 to Knology, Inc.’s Annual Report on Form 10-K for the year ended December 31, 2003 (File No. 000-32647)). | |
| 10.46 | Consent to Assignment and Assumption, dated December 17, 2003, among Verizon Media Ventures Inc., Progress Energy Florida, Inc. and Knology Broadband of Florida, Inc. (Incorporated herein by reference to Exhibit 10.60 to Knology, Inc.’s Annual Report on Form 10-K for the year ended December 31, 2003 (File No. 000-32647)). | |
| 10.47 | Lease, dated March 5, 2004, by and between Ted Alford and Knology, Inc. (Incorporated herein by reference to Exhibit 10.61 to Knology, Inc.’s Annual Report on Form 10-K for the year ended December 31, 2003 (File No. 000-32647)). | |
| 10.48 ** | Form of Incentive Stock Option Award Certificate under Knology, Inc. 2008 Incentive Plan | |
| *** | ||
| 10.49 ** | Form of Restricted Stock Award Certificate under Knology, Inc. 2008 Incentive Plan | |
| *** | ||
| 10.50 ** | Knology, Inc. 2006 Incentive Plan (Incorporated herein by reference to Exhibit 99.1 to Knology Inc.’s Current Report on Form 8-K filed on May 9, 2006 (File No. 000-32647)). | |
| 10.51 ** | Knology, Inc. 2008 Incentive Plan (Incorporated herein by reference to Exhibit 10.1 to Knology Inc.’s Amended Quarterly Report on Form 10-Q/A (Amendment No. 1) for the period ended June 30, 2008 (File No. 000-32647)). | |
| 10.52 | Amended and Restated Credit Agreement, dated as of March 14, 2007, among Knology, Inc., as Borrower and the Lenders and Issuers Party thereto and Credit Suisse, as Administrative Agent and Collateral Agent and Jefferies & Company, Inc., as Syndication Agent, Royal Bank of Canada and CIT Lending Services Corporation, as Co-Documentation Agents, and Credit Suisse Securities (USA) LLC, as Sole Bookrunner and Sole Lead Arranger (Incorporated herein by reference to Exhibit 10.1 to Knology, Inc.’s Quarterly Report on Form 10-Q for the period ended March 31, 2007 (File No. 000-32647)). | |
62
Table of Contents
Index to Financial Statements
| Exhibit No. |
Exhibit Description | |
| 10.53 | Amended and Restated Pledge and Security Agreement, dated as of April 3, 2007, by and among Knology, Inc. as a Grantor and Each Other Grantor From Time to Time Party Thereto and Credit Suisse, Cayman Islands Branch, as Collateral Agent (Incorporated herein by reference to Exhibit 10.4 to Knology, Inc.’s Quarterly Report on Form 10-Q for the period ended June 30, 2007 (File No. 000-32647)). | |
| 10.54 | Amended and Restated Trademark Security Agreement, dated as of April 3, 2007, by and among Knology, Inc., Knology Broadband, Inc., Valley Telephone Co., LLC, Black Hills FiberCom, LLC and PrairieWave Communications, Inc., each as a Grantor and Each Other Grantor From Time to Time Party Thereto and Credit Suisse, Cayman Islands Branch, as Collateral Agent (Incorporated herein by reference to Exhibit 10.5 to Knology, Inc.’s Quarterly Report on Form 10-Q for the period ended June 30, 2007 (File No. 000-32647)). | |
| 10.55 | Amended and Restated Guaranty, dated as of April 3, 2007, executed by each Guarantor From Time to Time Party Thereto in Favor of the Administrative Agent, the Collateral Agent, each Lender, each Issuer and Each Other Holder of an Obligation (Incorporated herein by reference to Exhibit 10.6 to Knology, Inc.’s Quarterly Report on Form 10-Q for the period ended June 30, 2005 (File No. 000-32647)). | |
| 10.56 | Revolving Note, dated as of April 3, 2007, in favor of Royal Bank of Canada (Incorporated herein by reference to Exhibit 10.2 to Knology, Inc.’s Quarterly Report on Form 10-Q for the period ended June 30, 2005 (File No. 000-32647)). | |
| 10.57 | Revolving Note, dated as of April 3, 2007, in favor of CoBank, ACB (Incorporated herein by reference to Exhibit 10.3 to Knology, Inc.’s Quarterly Report on Form 10-Q for the period ended June 30, 2005 (File No. 000-32647)). | |
| 10.58 | First Amendment to Amended and Restated Credit Agreement dated as of March 14, 2007 by and among Knology, Inc., each Guarantor party thereto, each of the Incremental Term loan lenders party thereto and Credit Suisse, acting through one or more of its branches as Administrative Agent, such Second Amendment dated as of January 4, 2008 (Incorporated by reference to Exhibit 10.66 to Knology, Inc.’s Annual Report on Form 10-K for the year ended December 31, 2007 (File No. 000-32647)). | |
| 10.59 | Amendment No. 2, dated as of September 28, 2009, to the Amended and Restated Credit Agreement dated as of March 14, 2007 as amended on January 4, 2008, by and among Knology, Inc., as borrower, certain subsidiaries of Knology party thereto, as guarantors, the lenders named therein, the syndication and documentation co-agents named therein and Credit Suisse, acting through one or more of its branches, as administrative agent (Incorporated herein by reference to Exhibit 10.1 to Knology, Inc.’s Quarterly Report on Form 10-Q for the period ended September 30, 2009 (File No. 000-32647)). | |
| 10.60 *** | Credit Agreement, dated as of October 15, 2010, among Knology, Inc., as Borrower and the Lenders and Issuers Party thereto and Credit Suisse AG, as Administrative Agent, Credit Suisse AG, Cayman Islands Branch, as Collateral Agent and SunTrust Robinson Humphrey, Inc., as Syndication Agent for the Term A Loan Facility, CoBank, ACB, as Syndication Agent for the Term B Loan Facility, Bank of America, N.A., RBC Capital Markets and Raymond James Bank, FSB, as Co-Documentation Agents, and Credit Suisse Securities (USA) LLC and SunTrust Robinson Humphrey, Inc., as Joint Lead Arrangers and Joint Bookrunners, and Deutsche Bank Securities Inc., as Joint Bookrunner | |
| 10.61 *** | Pledge and Security Agreement, dated as of October 15, 2010, by and among Knology, Inc. as a Grantor and Each Other Grantor From Time to Time Party Thereto and Credit Suisse, Cayman Islands Branch, as Collateral Agent | |
63
Table of Contents
Index to Financial Statements
| Exhibit No. |
Exhibit Description | |
| 10.62 *** | Trademark Security Agreement, dated as of October 15, 2010, by and among Knology, Inc., Knology Broadband, Inc., Valley Telephone Co., LLC, Knology of Kansas, Inc., BlackHills FiberCom, LLC, each as a Grantor and Each Other Grantor From Time to Time Party Thereto and Credit Suisse AG, Cayman Islands Branch, as Collateral Agent | |
| 10.63 *** | Guaranty, dated as of October 15, 2010, executed by each Guarantor From Time to Time Party Thereto in Favor of the Administrative Agent, the Collateral Agent, each Lender, each Issuer and Each Other Holder of an Obligation | |
| 21.1 *** | Subsidiaries of Knology, Inc. | |
| 23.1 *** | Consent of BDO USA, LLP. | |
| 31.1 *** | Certification of the Chief Executive Officer of Knology, Inc. pursuant to Securities Exchange Act Rule 13a-14. | |
| 31.2 *** | Certification of the Chief Financial Officer of Knology, Inc. pursuant to Securities Exchange Act Rule 13a-14. | |
| 32.1 *** | Statement of the Chief Executive Officer of Knology, Inc. pursuant to §18 U.S.C. S. 1350. | |
| 32.2 *** | Statement of the Chief Financial Officer of Knology, Inc. pursuant to §18 U.S.C. S. 1350. | |
| † | Confidential treatment has been requested pursuant to Rule 24b-2 of the Securities Exchange Act of 1934, as amended. The copy on file as an exhibit omits the information subject to the confidentiality request. Such omitted information has been filed separately with the Commission. |
| ** | Compensatory plan or arrangement. |
| *** | Filed herewith. |
64
Table of Contents
Index to Financial Statements
Pursuant to the requirements of Section 13 or 15(d) of the Securities Exchange Act of 1934, the registrant has duly caused this report to be signed on its behalf by the undersigned, thereunto duly authorized.
| KNOLOGY, INC. | ||
| By: | /s/ RODGER L. JOHNSON | |
| Rodger L. Johnson | ||
| Chairman of the Board and Chief Executive Officer | ||
| March 15, 2011 | ||
| (Date) | ||
Pursuant to the requirements of the Securities Exchange Act of 1934, this report has been signed below by the following persons on behalf of the registrant and in the capacities indicated and on the dates indicated.
| SIGNATURE |
TITLE |
DATE | ||
| /s/ RODGER L. JOHNSON Rodger L. Johnson |
Chairman of the Board and Chief Executive Officer |
March 15, 2011 | ||
| /s/ ROBERT K. MILLS Robert K. Mills |
Chief Financial Officer |
March 15, 2011 | ||
| /s/ ALAN A. BURGESS Alan A. Burgess |
Director |
March 15, 2011 | ||
| /s/ DONALD W. BURTON Donald W. Burton |
Director |
March 15, 2011 | ||
| /s/ EUGENE I. DAVIS Eugene I. Davis |
Director |
March 15, 2011 | ||
| /s/ O. GENE GABBARD O. Gene Gabbard |
Director |
March 15, 2011 | ||
| /s/ CAMPBELL B. LANIER, III Campbell B. Lanier, III |
Director |
March 15, 2011 | ||
| /s/ WILLIAM H. SCOTT III William H. Scott III |
Director |
March 15, 2011 | ||
65
Table of Contents
Index to Financial Statements
Index to Consolidated Financial Statements
F-1
Table of Contents
Index to Financial Statements
REPORT OF INDEPENDENT REGISTERED PUBLIC ACCOUNTING FIRM
Board of Directors and Stockholders
Knology, Inc.
West Point, Georgia
We have audited the accompanying consolidated balance sheets of Knology, Inc. as of December 31, 2010 and 2009 and the related consolidated statements of operations, stockholders’ equity, and cash flows for each of the three years in the period ended December 31, 2010. These financial statements are the responsibility of the Company’s management. Our responsibility is to express an opinion on these financial statements based on our audits.
We conducted our audits in accordance with the standards of the Public Company Accounting Oversight Board (United States). Those standards require that we plan and perform the audit to obtain reasonable assurance about whether the financial statements are free of material misstatement. An audit includes examining, on a test basis, evidence supporting the amounts and disclosures in the financial statements, assessing the accounting principles used and significant estimates made by management, as well as evaluating the overall financial statement presentation. We believe that our audits provide a reasonable basis for our opinion.
In our opinion, the consolidated financial statements referred to above present fairly, in all material respects, the financial position of Knology, Inc. at December 31, 2010 and 2009, and the results of its operations and its cash flows for each of the three years in the period ended December 31, 2010, in conformity with accounting principles generally accepted in the United States of America.
We also have audited, in accordance with the standards of the Public Company Accounting Oversight Board (United States), Knology, Inc.’s internal control over financial reporting as of December 31, 2010, based on criteria established in Internal Control—Integrated Framework issued by the Committee of Sponsoring Organizations of the Treadway Commission (COSO) and our report dated March 15, 2011 expressed an unqualified opinion thereon.
/s/ BDO USA, LLP
Atlanta, Georgia
March 15, 2011
F-2
Table of Contents
Index to Financial Statements
KNOLOGY, INC. AND SUBSIDIARIES
CONSOLIDATED BALANCE SHEETS
(IN THOUSANDS, EXCEPT SHARE AND PER SHARE DATA)
| DECEMBER 31, | ||||||||
| 2009 | 2010 | |||||||
| ASSETS | ||||||||
| CURRENT ASSETS: |
||||||||
| Cash and cash equivalents |
$ | 44,016 | $ | 47,120 | ||||
| Restricted cash |
725 | 1,401 | ||||||
| Certificates of deposit |
35,050 | 6,105 | ||||||
| Accounts receivable, net of allowance for doubtful accounts of $1,218 and $1,439 as of December 31, 2009 and 2010, respectively |
32,668 | 37,504 | ||||||
| Prepaid expenses and other |
2,986 | 3,373 | ||||||
| Total current assets |
115,445 | 95,503 | ||||||
| PROPERTY, PLANT AND EQUIPMENT, NET: |
||||||||
| System and installation equipment |
886,018 | 982,715 | ||||||
| Test and office equipment |
68,426 | 73,215 | ||||||
| Automobiles and trucks |
7,549 | 7,089 | ||||||
| Production equipment |
781 | 864 | ||||||
| Land |
6,267 | 6,567 | ||||||
| Buildings |
37,740 | 40,461 | ||||||
| Construction and premise inventory |
9,454 | 13,484 | ||||||
| Leasehold improvements |
2,457 | 3,553 | ||||||
| 1,018,692 | 1,127,948 | |||||||
| Less accumulated depreciation and amortization |
(660,812 | ) | (727,601 | ) | ||||
| Property, plant, and equipment, net |
357,880 | 400,347 | ||||||
| OTHER LONG-TERM ASSETS: |
||||||||
| Goodwill |
149,741 | 253,933 | ||||||
| Customer base, net |
8,661 | 19,250 | ||||||
| Deferred debt issuance and debt modification costs, net |
7,544 | 8,167 | ||||||
| Investments |
3,683 | 4,011 | ||||||
| Other intangibles and other assets, net |
3,947 | 6,467 | ||||||
| Total assets |
$ | 646,901 | $ | 787,678 | ||||
| LIABILITIES AND STOCKHOLDERS’ DEFICIT | ||||||||
| CURRENT LIABILITIES: |
||||||||
| Current portion of long term debt |
$ | 9,841 | $ | 9,561 | ||||
| Accounts payable |
25,768 | 28,217 | ||||||
| Accrued liabilities |
22,349 | 20,360 | ||||||
| Unearned revenue |
14,795 | 16,949 | ||||||
| Interest rate swaps |
16,526 | 0 | ||||||
| Total current liabilities |
89,279 | 75,087 | ||||||
| NONCURRENT LIABILITIES: |
||||||||
| Long term debt, net of current portion |
591,514 | 721,751 | ||||||
| Interest rate swaps |
0 | 6,699 | ||||||
| Total noncurrent liabilities |
591,514 | 728,450 | ||||||
| Total liabilities |
680,793 | 803,537 | ||||||
| COMMITMENTS AND CONTINGENCIES (NOTE 6) |
||||||||
| STOCKHOLDERS’ EQUITY: |
||||||||
| Preferred stock, $.01 par value per share; 199,000,000 shares authorized, 0 shares issued and outstanding at December 31, 2009 and 2010, respectively |
0 | 0 | ||||||
| Non-voting common stock, $.01 par value per share; 25,000,000 shares authorized, none outstanding |
0 | 0 | ||||||
| Common stock, $.01 par value per share; 200,000,000 shares authorized, 36,561,405 and 37,160,283 shares issued and outstanding at December 31, 2009 and 2010, respectively |
366 | 372 | ||||||
| Additional paid-in capital |
602,508 | 610,492 | ||||||
| Accumulated other comprehensive loss |
(10,324 | ) | 0 | |||||
| Accumulated deficit |
(626,442 | ) | (626,723 | ) | ||||
| Total stockholders’ deficit |
(33,892 | ) | (15,859 | ) | ||||
| Total liabilities and stockholders’ deficit |
$ | 646,901 | $ | 787,678 | ||||
See notes to consolidated financial statements.
F-3
Table of Contents
Index to Financial Statements
KNOLOGY, INC. AND SUBSIDIARIES
CONSOLIDATED STATEMENTS OF OPERATIONS
(IN THOUSANDS, EXCEPT SHARE AND PER SHARE DATA)
| YEAR ENDED DECEMBER 31, | ||||||||||||
| 2008 | 2009 | 2010 | ||||||||||
| OPERATING REVENUES: |
||||||||||||
| Video |
$ | 171,439 | $ | 184,040 | $ | 206,840 | ||||||
| Voice |
137,411 | 131,127 | 127,913 | |||||||||
| Data |
93,459 | 98,571 | 107,587 | |||||||||
| Other |
7,921 | 11,827 | 17,206 | |||||||||
| Total operating revenues |
410,230 | 425,565 | 459,546 | |||||||||
| OPERATING EXPENSES: |
||||||||||||
| Direct costs (excluding depreciation and amortization) |
123,663 | 132,870 | 148,108 | |||||||||
| Selling, general and administrative |
156,364 | 154,925 | 161,819 | |||||||||
| Depreciation and amortization |
95,375 | 90,702 | 87,594 | |||||||||
| Total operating expenses |
375,402 | 378,497 | 397,521 | |||||||||
| OPERATING INCOME |
34,828 | 47,068 | 62,025 | |||||||||
| OTHER INCOME (EXPENSE): |
||||||||||||
| Interest income |
746 | 656 | 322 | |||||||||
| Interest expense |
(47,332 | ) | (41,632 | ) | (42,504 | ) | ||||||
| Debt modification expense |
0 | (3,422 | ) | 0 | ||||||||
| Loss on debt extinguishment |
0 | 0 | (19,788 | ) | ||||||||
| Gain on interest rate swaps |
0 | 12,096 | 9,827 | |||||||||
| Amortization of deferred loss on interest rate swaps |
0 | (18,298 | ) | (10,324 | ) | |||||||
| Other than temporary impairment of investments |
0 | (353 | ) | 0 | ||||||||
| Other income (expense), net |
(367 | ) | 478 | 161 | ||||||||
| Total other expense |
(46,953 | ) | (50,475 | ) | (62,306 | ) | ||||||
| NET LOSS |
$ | (12,125 | ) | $ | (3,407 | ) | $ | (281 | ) | |||
| BASIC AND DILUTED NET LOSS PER SHARE |
$ | (0.34 | ) | $ | (0.09 | ) | $ | (0.01 | ) | |||
| BASIC AND DILUTED WEIGHTED AVERAGE NUMBER OF COMMON SHARES OUTSTANDING |
35,520,016 | 35,990,536 | 36,896,346 | |||||||||
See notes to consolidated financial statements.
F-4
Table of Contents
Index to Financial Statements
KNOLOGY, INC. AND SUBSIDIARIES
CONSOLIDATED STATEMENTS OF STOCKHOLDERS’ EQUITY
(DOLLARS IN THOUSANDS)
| COMMON STOCK | ADDITIONAL PAID-IN CAPITAL |
ACCUMULATED OTHER COMPREHENSIVE LOSS |
ACCUMULATED DEFICIT |
TOTAL STOCKHOLDERS’ EQUITY (DEFICIT) |
||||||||||||||||||||
| SHARES | AMOUNT | |||||||||||||||||||||||
| BALANCE, December 31, 2007 |
35,310,012 | $ | 353 | $ | 589,389 | $ | (13,782 | ) | $ | (610,910 | ) | $ | (34,950 | ) | ||||||||||
| Net loss |
(12,125 | ) | (12,125 | ) | ||||||||||||||||||||
| Change in fair value of interest rate swap |
(14,840 | ) | (14,840 | ) | ||||||||||||||||||||
| Exercise of stock options and stock awards |
353,285 | 4 | 814 | 818 | ||||||||||||||||||||
| Non-cash stock compensation |
4,640 | 4,640 | ||||||||||||||||||||||
| BALANCE, December 31, 2008 |
35,663,297 | $ | 357 | $ | 594,843 | $ | (28,622 | ) | $ | (623,035 | ) | $ | (56,457 | ) | ||||||||||
| Net loss |
(3,407 | ) | (3,407 | ) | ||||||||||||||||||||
| Amortization of deferred loss on interest rate swaps |
18,298 | 18,298 | ||||||||||||||||||||||
| Exercise of stock options and stock awards |
898,108 | 9 | 1,467 | 1,476 | ||||||||||||||||||||
| Non-cash stock compensation |
6,198 | 6,198 | ||||||||||||||||||||||
| BALANCE, December 31, 2009 |
36,561,405 | $ | 366 | $ | 602,508 | $ | (10,324 | ) | $ | (626,442 | ) | $ | (33,892 | ) | ||||||||||
| Net loss |
(281 | ) | (281 | ) | ||||||||||||||||||||
| Amortization of deferred loss on interest rate swaps |
10,324 | 10,324 | ||||||||||||||||||||||
| Exercise of stock options and stock awards |
598,878 | 6 | 1,575 | 1,581 | ||||||||||||||||||||
| Non-cash stock compensation |
6,409 | 6,409 | ||||||||||||||||||||||
| BALANCE, December 31, 2010 |
37,160,283 | $ | 372 | $ | 610,492 | $ | 0 | $ | (626,723 | ) | $ | (15,859 | ) | |||||||||||
See notes to consolidated financial statements.
F-5
Table of Contents
Index to Financial Statements
KNOLOGY, INC. AND SUBSIDIARIES
CONSOLIDATED STATEMENTS OF CASH FLOWS
(DOLLARS IN THOUSANDS)
| YEAR ENDED DECEMBER 31, | ||||||||||||
| 2008 | 2009 | 2010 | ||||||||||
| CASH FLOWS FROM OPERATING ACTIVITIES: |
||||||||||||
| Net loss |
$ | (12,125 | ) | $ | (3,407 | ) | $ | (281 | ) | |||
| Adjustments to reconcile net loss to net cash provided by operating activities: |
||||||||||||
| Depreciation and amortization |
95,375 | 90,702 | 87,594 | |||||||||
| Non-cash loss on debt extinguishment |
0 | 0 | 5,251 | |||||||||
| Non-cash stock compensation |
4,640 | 6,198 | 6,409 | |||||||||
| Non-cash bank loan interest expense |
2,836 | 2,748 | 2,730 | |||||||||
| Non-cash gain on interest rate swaps |
0 | (12,096 | ) | (9,827 | ) | |||||||
| Non-cash amortization of deferred loss on interest rate swaps |
0 | 18,298 | 10,324 | |||||||||
| Non-cash loss on investments |
0 | 353 | 0 | |||||||||
| Provision for bad debt |
5,326 | 5,774 | 6,917 | |||||||||
| Non-cash interest income |
0 | 0 | (41 | ) | ||||||||
| Loss (gain) on disposition of assets |
392 | (160 | ) | (50 | ) | |||||||
| Gain on sale of short term investments |
0 | 0 | (15 | ) | ||||||||
| Changes in operating assets and liabilities: |
||||||||||||
| Accounts receivable |
(7,170 | ) | (5,754 | ) | (9,591 | ) | ||||||
| Prepaid expenses and other assets |
(261 | ) | (1,662 | ) | 948 | |||||||
| Accounts payable |
(2,541 | ) | 712 | (641 | ) | |||||||
| Accrued liabilities |
(6,196 | ) | 1,944 | (2,660 | ) | |||||||
| Unearned revenue |
(299 | ) | 506 | 1,244 | ||||||||
| Total adjustments |
92,102 | 107,563 | 98,592 | |||||||||
| Net cash provided by operating activities |
79,977 | 104,156 | 98,311 | |||||||||
| CASH FLOWS FROM INVESTING ACTIVITIES: |
||||||||||||
| Capital expenditures |
(46,349 | ) | (54,901 | ) | (76,078 | ) | ||||||
| Acquisition of businesses, net of cash acquired |
(75,145 | ) | (7,500 | ) | (164,795 | ) | ||||||
| Maturities of certificates of deposit |
0 | 0 | 35,050 | |||||||||
| Proceeds from sale of short term investments |
0 | 0 | 23,975 | |||||||||
| Investment in certificates of deposit and other short term investments |
0 | (35,050 | ) | (30,024 | ) | |||||||
| Investment in Tower Cloud, Inc. |
0 | (1,500 | ) | (328 | ) | |||||||
| MDU signing bonuses and other intangible expenditures |
(1,104 | ) | (950 | ) | (768 | ) | ||||||
| Proceeds from sale of property |
277 | 266 | 122 | |||||||||
| Change in restricted cash |
779 | (45 | ) | (676 | ) | |||||||
| Net cash used in investing activities |
(121,542 | ) | (99,680 | ) | (213,522 | ) | ||||||
F-6
Table of Contents
Index to Financial Statements
KNOLOGY, INC. AND SUBSIDIARIES
CONSOLIDATED STATEMENTS OF CASH FLOWS—(Continued)
(DOLLARS IN THOUSANDS)
| YEAR ENDED DECEMBER 31, | ||||||||||||
| 2008 | 2009 | 2010 | ||||||||||
| CASH FLOWS FROM FINANCING ACTIVITIES: |
||||||||||||
| Proceeds from long term debt |
59,000 | 0 | 720,000 | |||||||||
| Principal payments on debt and short-term borrowings |
(7,134 | ) | (17,467 | ) | (594,662 | ) | ||||||
| Expenditures related to issuance and modification of long term debt |
(205 | ) | (1,831 | ) | (8,604 | ) | ||||||
| Stock options exercised |
818 | 1,476 | 1,581 | |||||||||
| Net cash provided by (used in) financing activities |
52,479 | (17,822 | ) | 118,315 | ||||||||
| NET INCREASE (DECREASE) IN CASH AND CASH EQUIVALENTS |
10,914 | (13,346 | ) | 3,104 | ||||||||
| CASH AND CASH EQUIVALENTS AT BEGINNING OF YEAR |
46,448 | 57,362 | 44,016 | |||||||||
| CASH AND CASH EQUIVALENTS AT END OF YEAR |
$ | 57,362 | $ | 44,016 | $ | 47,120 | ||||||
| SUPPLEMENTAL DISCLOSURES OF CASH FLOW INFORMATION: |
||||||||||||
| Cash paid during the year for interest |
$ | 44,655 | $ | 39,532 | $ | 44,040 | ||||||
| Non-cash financing activities: Debt acquired in capital lease transactions |
$ | 4,499 | $ | 7,140 | $ | 4,129 | ||||||
| Detail of acquisition: |
||||||||||||
| Accounts receivables, net |
644 | 48 | 2,162 | |||||||||
| Prepaid expenses |
75 | 4 | 595 | |||||||||
| Property, plant and equipment |
18,631 | 4,399 | 46,832 | |||||||||
| Goodwill |
47,980 | 3,123 | 104,192 | |||||||||
| Customer base |
9,135 | 106 | 13,000 | |||||||||
| Intangible and other assets |
0 | 0 | 3,175 | |||||||||
| Accounts payable |
(583 | ) | (180 | ) | (3,090 | ) | ||||||
| Accrued liabilities |
(737 | ) | 0 | (671 | ) | |||||||
| Unearned revenue |
0 | 0 | (910 | ) | ||||||||
| Long term debt |
0 | 0 | (490 | ) | ||||||||
| Cash paid for acquisition, net of cash acquired of $459 in 2008, $0 for 2009 and $205 for 2010 |
$ | 75,145 | $ | 7,500 | $ | 164,795 | ||||||
See notes to consolidated financial statements.
F-7
Table of Contents
Index to Financial Statements
Knology, Inc. and Subsidiaries
Notes to Consolidated Financial Statements
(dollars in thousands, except per share)
1. Organization, Nature of Business, and Basis of Presentation
Organization and Nature of Business
Knology, Inc. and its subsidiaries (“Knology” or the “Company”) is a publicly traded company incorporated under the laws of the State of Delaware in September 1998.
Knology owns and operates an advanced interactive broadband network and provides residential and business customers broadband communications services, including analog and digital cable television, local and long-distance telephone, high-speed Internet access, and broadband carrier services to various markets in the Southeastern and Midwestern United States. Certain subsidiaries are subject to regulation by state public service commissions of applicable states for intrastate telecommunications services. For applicable interstate matters related to telephone service, certain subsidiaries are subject to regulation by the Federal Communications Commission.
Basis of presentation
The consolidated financial statements of Knology have been prepared in accordance with accounting principles generally accepted in the United States of America (“GAAP”). The statements include the accounts of the Company’s wholly owned subsidiaries. All intercompany transactions and balances have been eliminated. Investments in which the Company does not exercise significant influence are accounted for using the cost method of accounting.
The Company operates as one operating segment.
On January 4, 2008, the Company completed its acquisition of Graceba Total Communications Group, Inc. (“Graceba”), a voice, video and high-speed Internet broadband services provider in Dothan, Alabama. The financial position and results of operations for Graceba are included in the Company’s consolidated financial statements since the date of acquisition.
On November 17, 2009, the Company completed its acquisition of the assets of Private Cable Co., LLC (“PCL Cable”), a voice, video and high-speed Internet broadband services provider in Athens and Decatur, Alabama. The financial position and results of operations for PCL Cable are included in the Company’s consolidated financial statements since the date of acquisition.
On October 15, 2010, the Company completed its acquisition of Sunflower Broadband (“Sunflower”), a provider of video, voice and data services to residential and business customers in Douglas County, Lawrence, Kansas and the surrounding area. The financial position and results of operations for Sunflower are included in the Company’s consolidated financial statements since the date of acquisition.
2. Summary of Significant Accounting Policies
Accounting estimates
The preparation of financial statements in conformity with GAAP requires management to make estimates and assumptions that affect the reported amounts of assets and liabilities, disclosure of contingent assets and liabilities at the date of the financial statements and the reported amounts of revenue and expenses during the reporting period. On an on-going basis, the Company evaluates its estimates, including those related to collectibility of accounts receivable, valuation of investments, valuation of stock based compensation, useful
F-8
Table of Contents
Index to Financial Statements
Knology, Inc. and Subsidiaries
Notes to Consolidated Financial Statements—(Continued)
(dollars in thousands, except per share)
lives of property, plant and equipment, installation cost capitalization, recoverability of goodwill and intangible assets, income taxes and contingencies. The Company bases its estimates on historical experience and on various other assumptions that are believed to be reasonable under the circumstances, the results of which form the basis for making judgments about the carrying values of assets and liabilities that are not readily apparent from other sources. Actual results may differ from these estimates under different assumptions or conditions. These changes in estimates are recognized in the period they are realized.
Effective October 1, 2010, the Company changed its estimated capitalization of installation costs to more accurately reflect its current operating results and conditions. The effect of this change resulted in approximately $2,325 in additional installation costs being reduced from operating expenses and capitalized in the fourth quarter of 2010. As is consistent with the appropriate accounting literature, this change in estimate was recognized in the current period (fourth quarter of 2010) and the change in estimate will be accounted for prospectively. Had the change in estimate been in effect for the full year 2010, the Company would have had a net income of $6,318 for the year, or $0.17 per share. If the change in estimate had not been made beginning in the fourth quarter 2010, the Company would have had a net loss of $2,606 for the year, or ($0.07) per share.
Cash and cash equivalents
Cash and cash equivalents are highly liquid investments with an original maturity of three months or less at the date of purchase and consist of time deposits and investment in money market funds with commercial banks and financial institutions. At times throughout the year and at year-end, cash balances held at financial institutions were in excess of federally insured limits.
Restricted cash
Restricted cash is presented as a current asset since the associated maturity dates expire within one year of the balance sheet date.
As of December 31, 2009 and 2010, the Company had $725 and $1,401, respectively, of cash that was restricted in use, all of which was pledged as collateral related to certain insurance, franchise and surety bond agreements.
Allowance for doubtful accounts
The allowance for doubtful accounts represents the Company’s best estimate of probable losses in the accounts receivable balance. The allowance is based on known troubled accounts, historical experience and other currently available evidence. The Company writes off and sends to collections any accounts receivable 115 days past due. Activity in the allowance for doubtful accounts is as follows:
| Year ended December 31 |
Balance at beginning of period |
Charged
to operating expenses |
Write-offs | Recoveries | Balance at end of period |
|||||||||||||||
| 2008 |
$ | 975 | $ | 5,326 | $ | 7,002 | $ | 1,715 | $ | 1,014 | ||||||||||
| 2009 |
$ | 1,014 | $ | 5,774 | $ | 6,701 | $ | 1,131 | $ | 1,218 | ||||||||||
| 2010 |
$ | 1,218 | $ | 6,917 | $ | 7,943 | $ | 1,247 | $ | 1,439 | ||||||||||
F-9
Table of Contents
Index to Financial Statements
Knology, Inc. and Subsidiaries
Notes to Consolidated Financial Statements—(Continued)
(dollars in thousands, except per share)
Property, plant, and equipment
Property, plant, and equipment are stated at cost. Depreciation and amortization are calculated using the straight-line method over the estimated useful lives of the assets, commencing when the asset is installed or placed in service. Maintenance, repairs, and renewals are charged to expense as incurred. The cost and accumulated depreciation of property and equipment disposed of are removed from the related accounts, and any gain or loss is included in or deducted from income. Depreciation and amortization are provided over the estimated useful lives as follows:
| Years | ||||
| Buildings |
25 | |||
| System and installation equipment |
3-10 | |||
| Production equipment |
9 | |||
| Test and office equipment |
3-7 | |||
| Automobiles and trucks |
5 | |||
| Leasehold improvements |
5-25 | |||
Depreciation expense for the years ended December 31, 2008, 2009 and 2010 was $92,575, $88,164 and $84,500, respectively. Inventories are valued at the lower of cost (determined on a weighted average basis) or market and include customer premise equipment and certain plant construction materials. These items are transferred to system and installation equipment when installed.
Goodwill and intangible assets
Summarized below are the carrying values and accumulated amortization of intangible assets that will continue to be amortized under the Financial Accounting Standards Board (“FASB”)’s accounting guidance, as well as the carrying value of goodwill as of December 31, 2009 and 2010.
| 2009 | 2010 | Weighted average amortization period (years) |
||||||||||
| Customer base |
$ | 14,103 | $ | 27,103 | 8.4 | |||||||
| Other |
4,571 | 7,107 | 6.1 | |||||||||
| Gross carrying value of intangible assets subject to amortization |
18,674 | 34,210 | ||||||||||
| Less: Accumulated amortization |
||||||||||||
| Accumulated amortization, customer base |
5,442 | 7,853 | ||||||||||
| Accumulated amortization, other |
2,423 | 1,880 | ||||||||||
| Total accumulated amortization |
7,865 | 9,733 | ||||||||||
| Net carrying value |
10,809 | 24,477 | ||||||||||
| Goodwill |
149,741 | 253,933 | ||||||||||
| Total goodwill and intangibles |
$ | 160,550 | $ | 278,410 | ||||||||
Goodwill represents the excess of the cost of businesses acquired over fair value of net identifiable assets at the date of acquisition. Goodwill is subject to a periodic impairment assessment by applying a fair value test based upon a two-step method. The first step of the process compares the fair value of the reporting unit with the
F-10
Table of Contents
Index to Financial Statements
Knology, Inc. and Subsidiaries
Notes to Consolidated Financial Statements—(Continued)
(dollars in thousands, except per share)
carrying value of the reporting unit, including any goodwill. The Company utilizes a discounted cash flow valuation methodology to determine the fair value of the reporting unit. If the fair value of the reporting unit exceeds the carrying amount of the reporting unit, goodwill is deemed not to be impaired and the second step in the process is unnecessary. If the carrying amount exceeds fair value, the Company would perform the second step to measure the amount of impairment loss. Any impairment loss is measured by comparing the implied fair value of goodwill, calculated in accordance with the appropriate FASB guidance, to the carrying amount of goodwill at the reporting unit. The excess of the carrying amount over the fair value would be recognized as an impairment loss. The Company has adopted January 1 as the calculation date and evaluated these assets as of January 1, 2009, 2010 and 2011, and no impairment was identified.
A summary of changes in the Company’s goodwill and other intangibles related to continuing operations during the years ended December 31, 2010 and 2009 is as follows:
| December 31, 2009 |
Acquisitions | Amortization and other activity |
December 31, 2010 |
|||||||||||||
| Goodwill |
$ | 151,035 | $ | 104,192 | 0 | $ | 255,227 | |||||||||
| Accumulated Impairment |
(1,294 | ) | 0 | 0 | (1,294 | ) | ||||||||||
| Customer Base |
8,661 | 13,000 | $ | (2,411 | ) | 19,250 | ||||||||||
| Other |
2,148 | 2,995 | 84 | 5,227 | ||||||||||||
| Total goodwill and intangibles |
$ | 160,550 | $ | 278,410 | ||||||||||||
| December 31, 2008 |
Acquisitions | Amortization and other activity |
December 31, 2009 |
|||||||||||||
| Goodwill |
$ | 147,912 | $ | 3,123 | 0 | $ | 151,035 | |||||||||
| Accumulated Impairment |
(1,294 | ) | 0 | 0 | (1,294 | ) | ||||||||||
| Customer Base |
10,684 | 106 | $ | (2,129 | ) | 8,661 | ||||||||||
| Other |
1,607 | 0 | 541 | 2,148 | ||||||||||||
| Total goodwill and intangibles |
$ | 158,909 | $ | 160,550 | ||||||||||||
Amortization expense related to intangible assets was $2,800, $2,538 and $3,094 for the years ended December 31, 2008, 2009 and 2010, respectively. If incurred, the company capitalizes the costs incurred to renew or extend the costs of a recognized intangible asset.
Scheduled amortization of intangible assets for the next five years as of December 31, 2010 is as follows:
| 2011 |
$ | 4,346 | ||
| 2012 |
2,979 | |||
| 2013 |
2,942 | |||
| 2014 |
2,785 | |||
| 2015 |
2,785 | |||
| Thereafter |
8,640 | |||
| $ | 24,477 | |||
F-11
Table of Contents
Index to Financial Statements
Knology, Inc. and Subsidiaries
Notes to Consolidated Financial Statements—(Continued)
(dollars in thousands, except per share)
Deferred debt issuance and debt modification costs
Deferred debt issuance and debt modification costs include costs associated with the issuance, refinancing and modification of debt and credit facilities (see Note 4). Deferred debt issuance and debt modification costs are amortized to interest expense over the contractual term of the debt using the effective interest method. Deferred debt issuance and debt modification costs and the related useful lives and accumulated amortization as of December 31, 2009 and 2010 are as follows:
| 2009 | 2010 | Amortization Period (Years) |
||||||||||
| Previous deferred debt issuance costs |
$ | 8,461 | $ | 7,544 | 4-6 | |||||||
| Expenditures related to bank loans |
1,831 | 8,604 | 4-6 | |||||||||
| Costs amortized to interest expense |
(2,748 | ) | (2,730 | ) | ||||||||
| Writeoff of costs due to debt extinguishment |
0 | (5,251 | ) | |||||||||
| Deferred debt issuance costs, net |
$ | 7,544 | $ | 8,167 | 4-6 | |||||||
Derivative Financial Instruments
The Company uses interest rate swap contracts to manage the impact of interest rate changes on earnings and operating cash flows. Interest rate swaps involve the receipt of variable-rate amounts in exchange for fixed-rate payments over the life of the agreements without exchange of the underlying principal amount. The Company believes these agreements are with counter-parties who are creditworthy financial institutions.
On April 18, 2007, the Company entered into an interest rate swap contract to mitigate interest rate risk on an initial notional amount of $555,000 in connection with the term loan associated with the acquisition of PrairieWave Holdings, Inc. (“PrairieWave”). The swap agreement became effective May 3, 2007 and ended on July 3, 2010.
On December 19, 2007, the Company entered into a second interest rate swap contract to mitigate interest rate risk on an initial notional amount of $59,000, amortizing 1% annually, in connection with the incremental term loan associated with the acquisition of Graceba. The swap agreement became effective January 4, 2008 and ended on September 30, 2010.
Until December 31, 2008, the Company matched 3-month LIBOR rates on the term loans and the interest rate swaps, creating effective hedges under the FASB’s guidance on accounting for derivative instruments and hedging activities. Due to a significant difference between the 1-month and 3-month LIBOR rates, the Company decided to reset the borrowing rate on the debt using 1-month LIBOR.
| • | On December 31, 2008, the Company reset the borrowing rate on the $59,000 term loan to 1-month LIBOR (although this became an ineffective hedge under the FASB’s accounting guidance, there was no material effect on the Company’s financial results for the one day in 2008). |
| • | On January 2, 2009, the Company reset the borrowing rate on the $555,000 term loan to 1-month LIBOR. |
| • | The Company will determine LIBOR rates on future reset dates based on prevailing conditions at the time. |
F-12
Table of Contents
Index to Financial Statements
Knology, Inc. and Subsidiaries
Notes to Consolidated Financial Statements—(Continued)
(dollars in thousands, except per share)
As a result of the LIBOR rates on the term loans (1-month LIBOR) not matching the LIBOR rate on the interest rate swaps (3-month LIBOR), the Company was no longer eligible for hedge accounting related to the interest rate swaps associated with both of these loans.
Until the December 31, 2008 reset of the borrowing rate on the $59,000 term loan, changes in the fair value of the Company’s swap agreements were recorded as “Accumulated other comprehensive loss” in the equity section of the balance sheet, and the swap in variable to fixed interest rate was recorded as “Interest expense” on the statement of operations when the interest was incurred. Starting with the reset of the borrowing rate on December 31, 2008, changes in the fair value of the interest rate swaps are recorded as “Gain (loss) on interest rate swaps” in the “Other income (expense)” section of the statement of operations as they are incurred. The remaining balance in “Accumulated other comprehensive loss” in the stockholders’ equity section of the balance sheet that was related to the interest rate swaps was amortized as “Amortization of deferred loss on interest rate swaps” on the statement of operations over the remaining life of the derivative instruments. The Company recorded amortization expense related to the deferred loss on interest rate swaps in the amounts of $18,298 and $10,324 for the years ended December 31, 2009 and 2010, respectively. As of December 31, 2010, the entire remaining amount in accumulated other comprehensive loss relating to these interest rate swaps has been amortized.
On November 25, 2009, the Company entered into a third interest rate swap contract to mitigate interest rate risk on an initial notional amount of $400,000. The swap agreement, which became effective July 3, 2010 and ends April 3, 2012, fixes $400,000 of the floating rate debt at 1.98% as of December 31, 2010.
The notional amount for the next annual period is summarized below:
| Start date |
End date |
Amount | ||
| October 3, 2010 |
January 2, 2011 | $398,800 | ||
| January 3, 2011 |
April 2, 2011 | $382,600 | ||
| April 3, 2011 |
July 2, 2011 | $381,400 | ||
| July 3, 2011 |
October 2, 2011 | $380,200 | ||
| October 3, 2011 |
January 2, 2012 | $379,000 |
As with the previous two interest rate swaps, this interest rate instrument is not designated as a hedge and therefore does not utilize hedge accounting. Changes in the fair value of the swap agreement are recorded as “Gain (loss) on interest rate swaps” in the “Other income (expense)” section of the statement of operations and the swap in variable to fixed interest rate is recorded as “Interest expense” on the statement of operations when the interest is incurred. The Company recorded a gain on the change in the fair value of all interest rate swaps in the amounts of $12,096 and $9,827 for the years ended December 31, 2009 and 2010, respectively.
The interest rate swaps are valued by an independent third party. An error occurred due to a misinterpretation of the valuation information, specifically related to the inclusion of accrued interest in the third party valuation as well as separately accruing interest payable. The correction of the error in the valuation of the derivative resulted in a credit to other income in the amount of $4,163 in the second quarter of 2010. Further, the Company would have recognized $3,524 less charge to expense from the change in derivative value during the first quarter of 2009 had the interest rate swaps been recorded correctly. The effect over all other quarters in 2009 was approximately $783. The Company believes the correction of this non-cash item is immaterial to the users of our financial statements as it has no impact on total revenue; Earnings Before Interest, Taxes, Depreciation and Amortization (“EBITDA”); net operating income and cash flows for the periods affected, and these are key
F-13
Table of Contents
Index to Financial Statements
Knology, Inc. and Subsidiaries
Notes to Consolidated Financial Statements—(Continued)
(dollars in thousands, except per share)
metrics used by analysts, lenders and other users of our financial statements in evaluating the Company’s performance. Therefore no restatement of prior period financial statements is deemed necessary. The correction has no impact on the statement of operations prior to January 1, 2009.
Valuation of long-lived assets
In accordance with FASB accounting guidance, the Company reviews long-lived assets for impairment when circumstances indicate the carrying amount of an asset may not be recoverable based on the undiscounted future cash flows of the asset. If the carrying amount of the asset is determined not to be recoverable, a write-down to fair value is recorded. The Company evaluated these assets as of December 31, 2010, and no impairment was identified.
Direct Costs
Cost of services related to video consists primarily of monthly fees to the National Cable Television Cooperative and other programming providers and is generally based on the average number of subscribers to each program. Cost of services related to voice, data and other services consists primarily of transport cost and network access fees specifically associated with each of these revenue streams. Pole attachment rents are paid to utility companies for space on their utility poles to deliver the Company’s various services. Other network rental expenses consist primarily of network hub rents.
Stock-based compensation
The Company utilizes the recognition provisions of the related FASB accounting guidance for stock-based employee compensation. As a result, the Company recorded $4,640, $6,198 and $6,409 of non-cash stock compensation expense, which was included in selling, general and administrative expenses on the statement of operations for the years ended December 31, 2008, 2009 and 2010, respectively. See Note 8—Equity Interests for further discussion of the assumptions used in calculating non-cash stock compensation expense.
Investments
Investments and equity ownership in associated companies consisted of the following as of December 31, 2009 and 2010:
| 2009 | 2010 | |||||||
| Rio Holdings, Inc. (“Rio Holdings”) |
$ | 890 | $ | 890 | ||||
| PrairieWave Condominium Association (“PWCA”) |
1,293 | 1,293 | ||||||
| Tower Cloud, Inc. (“Tower Cloud”) |
1,500 | 1,828 | ||||||
| Total investments |
$ | 3,683 | $ | 4,011 | ||||
As of December 31, 2008, the Company, through its wholly owned subsidiaries, owned approximately 10,946,556 shares, or 1.5%, of the common stock of Grande. The Company’s investment in Grande was accounted for under the cost method of accounting adjusted for impairment write downs. During 2009, the ownership of Grande was reorganized to form a new operating LLC, called Grande Communications Networks, LLC. Upon reorganization, all existing shareholders in Grande, including Knology, were combined to form the new Rio Holdings, Inc. Rio Holdings owns 24.7% class A general partnership units in the newly formed Grande
F-14
Table of Contents
Index to Financial Statements
Knology, Inc. and Subsidiaries
Notes to Consolidated Financial Statements—(Continued)
(dollars in thousands, except per share)
Investment, L.P., which through a holding company owns 100% of Grande Communications Networks, LLC. The Company’s investment in Rio Holdings is accounted for under the cost method of accounting adjusted for impairment write downs because the Company owns less than 20% interest in Rio Holdings.
As part of the PrairieWave acquisition, the Company acquired an investment in PWCA. In 2003, PrairieWave formed PWCA to which it contributed land with a book value of $1,207 and other assets of $86. On June 10, 2003, PrairieWave and a real estate developer entered into a Condominium Unit Purchase Agreement, whereby the developer committed to construct a building connected to PrairieWave’s headquarters building. The real estate developer paid PrairieWave one dollar and granted PrairieWave the option to acquire its condominium interest in PWCA and the building to be constructed for approximately $5,200. The option is exercisable from June 1, 2012 to May 31, 2013. PrairieWave appoints two members and the real estate developer appoints one member to PWCA’s three-member board. The Company’s investment in PWCA is accounted for under the equity method of accounting.
As of December 31, 2010, the Company, through its wholly owned subsidiaries, owned approximately 5,711,064 shares, or 5.30%, of the series A preferred stock of Tower Cloud. The Company’s investment in Tower Cloud is accounted for under the cost method of accounting adjusted for impairment write downs. The Company did not estimate the fair value of the investment in Tower Cloud since there are no identified events or changes in circumstances that may have a significant adverse effect on the fair value of the investment.
Accrued liabilities
Accrued liabilities as of December 31, 2009 and 2010 consisted of the following:
| 2009 | 2010 | |||||||
| Accrued trade expenses |
$ | 5,328 | $ | 7,136 | ||||
| Accrued property and other taxes |
2,518 | 1,904 | ||||||
| Accrued compensation |
5,347 | 6,430 | ||||||
| Accrued interest |
9,156 | 4,890 | ||||||
| Total accrued liabilities |
$ | 22,349 | $ | 20,360 | ||||
Fair Value of Financial Instruments
The Company adopted the required provisions of the FASB’s accounting guidance pertaining to the valuation of financial instruments on January 1, 2008. The guidance defines fair value, expands related disclosure requirements and specifies a hierarchy of valuation techniques based on the nature of the inputs used to develop the fair value measures. Fair value is defined as the price that would be received to sell an asset or paid to transfer a liability in an orderly transaction between market participants at the measurement date. The FASB accounting guidance establishes a three-tier fair value hierarchy, which prioritizes the inputs used in measuring fair value as follows:
| • | Level 1—Observable inputs such as quoted prices in active markets for identical assets or liabilities; |
| • | Level 2—Inputs other than Level 1 that are observable, either directly or indirectly, such as quoted prices for similar assets or liabilities, quoted prices in markets that are not active; or other inputs that are observable or can be corroborated by observable market data for substantially the full term of the assets or liabilities; and |
| • | Level 3—Unobservable inputs that are supported by little or no market activity, which require management judgment or estimation. |
F-15
Table of Contents
Index to Financial Statements
Knology, Inc. and Subsidiaries
Notes to Consolidated Financial Statements—(Continued)
(dollars in thousands, except per share)
Assets and liabilities measured at fair value on a recurring basis as of December 31, 2010 and 2009 are summarized below:
| December 31, 2010 | ||||||||||||||||
| Level 1 | Level 2 | Level 3 | Total Assets/Liabilities, at Fair Value |
|||||||||||||
| Liabilities |
||||||||||||||||
| Interest rate swaps |
$ | 0 | $ | 6,699 | $ | 0 | $ | 6,699 | ||||||||
| Total liabilities |
$ | 0 | $ | 6,699 | $ | 0 | $ | 6,699 | ||||||||
| December 31, 2009 | ||||||||||||||||
| Level 1 | Level 2 | Level 3 | Total Assets/Liabilities, at Fair Value |
|||||||||||||
| Liabilities |
||||||||||||||||
| Interest rate swaps |
$ | 0 | $ | 16,526 | $ | 0 | $ | 16,526 | ||||||||
| Total liabilities |
$ | 0 | $ | 16,526 | $ | 0 | $ | 16,526 | ||||||||
The Company used a discounted cash flow analysis applied to the LIBOR forward yield cures to value the interest rate swaps on its balance sheet at December 31, 2010.
The carrying values of cash and cash equivalents, certificates of deposit, accounts receivable, accounts payable and accrued liabilities are reasonable estimates of their fair values due to the short maturity of these financial instruments.
The estimated fair value of the Company’s variable-rate debt is subject to the effects of interest rate risk. On December 31, 2010, the estimated fair value of that debt, based on a dealer quote considering current market rates, was approximately $726,131, compared to a carrying value of $720,000.
Revenue recognition
Knology accounts for the revenue, costs and expense related to residential cable services (including video, voice, data and other services) in accordance with the proper FASB accounting guidance relating to financial reporting by cable television companies. Installation revenue for residential cable services is recognized to the extent of direct selling costs incurred. Direct selling costs, or commissions, have exceeded installation revenue in all reported periods and are expensed as period costs in accordance with the FASB guidance. Credit risk is managed by disconnecting services to customers who are delinquent.
All other revenue is accounted for in accordance with the FASB’s revenue recognition guidance. In accordance with this guidance, revenue from advertising sales is recognized as the advertising is transmitted over the Company’s broadband network. Revenue derived from other sources, including commercial data and other services, is recognized as services are provided, as persuasive evidence of an arrangement exists, the price to the customer is fixed and determinable and collectibility is reasonably assured.
The Company generates recurring revenues for its broadband offerings of video, voice and data and other services. Revenues generated from these services primarily consists of a fixed monthly fee for access to cable programming, local phone services and enhanced services and access to the Internet. Additional fees are charged
F-16
Table of Contents
Index to Financial Statements
Knology, Inc. and Subsidiaries
Notes to Consolidated Financial Statements—(Continued)
(dollars in thousands, except per share)
for services including pay-per-view movies, events such as boxing matches and concerts, long distance service and cable modem rental. Revenues are recognized as services are provided, but advance billings or cash payments received in advance of services performed are recorded as unearned revenue.
Advertising costs
The Company expenses all advertising costs as incurred. Approximately $7,643, $7,832 and $7,655 of advertising expenses are recorded in the Company’s consolidated statements of operations for the years ended December 31, 2008, 2009, and 2010, respectively.
Sources of supplies
The Company purchases customer premise equipment and plant materials from outside vendors. Although numerous suppliers market and sell customer premise equipment and plant materials, the Company currently purchases digital set top boxes from the two original equipment manufacturers supplying their proprietary systems. The Company has several suppliers for other customer premise equipment and plant materials. If the suppliers are unable to meet the Company’s needs as it continues to operate its business, it could adversely affect operating results.
Credit risk
The Company’s accounts receivable subject the Company to credit risk, as customer deposits are generally not required. The Company’s risk of loss is limited due to advance billings to customers for services and the ability to terminate access on delinquent accounts. The potential for material credit loss is mitigated by the large number of customers with relatively small receivable balances. The carrying amounts of the Company’s receivables approximate their fair values.
Income taxes
The Company utilizes the liability method of accounting for income taxes, as set forth in the appropriate FASB accounting guidance. Under the liability method, deferred taxes are determined based on the difference between the financial and tax bases of assets and liabilities using enacted tax rates in effect in the years in which the differences are expected to reverse. Deferred tax benefit represents the change in the deferred tax asset and liability balances (see Note 7).
On January 1, 2007, the Company adopted the provisions of the appropriate FASB accounting guidance in accounting for uncertainty in income taxes. The guidance addresses the determination of whether tax benefits claimed or expected to be claimed on a tax return should be recorded in the financial statements. Also, the Company may recognize the tax benefit from an uncertain tax position only if it is more likely than not that the tax position will be sustained on examination by the taxing authorities, based on the technical merits of the position. The tax benefits recognized in the financial statements from such a position should be measured based on the largest benefit that has a greater than fifty percent likelihood of being realized upon ultimate settlement. The accounting literature also provides guidance on derecognition, classification, interest and penalties on income taxes, accounting in interim periods and requires increased disclosures. In accordance with this guidance, any interest and penalties related to unrecognized tax benefits would be recognized in income tax expense. Since the date of adoption, the Company has not recorded a liability for unrecognized tax benefits at any time.
F-17
Table of Contents
Index to Financial Statements
Knology, Inc. and Subsidiaries
Notes to Consolidated Financial Statements—(Continued)
(dollars in thousands, except per share)
Net loss per share
With regards to earnings per share, the Company follows the appropriate FASB accounting guidance, which requires the disclosure of basic net loss per share and diluted net loss per share. Basic net loss per share is computed by dividing net loss attributable to common stockholders by the weighted average number of common shares outstanding during the period. Diluted net loss per share gives effect to all potentially dilutive securities. The effect of the Company’s warrants (1,000,000 in 2008, 2009 and 2010), stock options (3,652,921, 3,135,552 and 3,217,895 shares in 2008, 2009 and 2010, respectively, using the treasury stock method) and preferred stock (zero shares in 2008, 2009 and 2010) were not included in the computation of diluted EPS as their effect was antidilutive. The warrants expire in December 2013, and each warrant is a right to buy one share of common stock at an exercise price of $9.00 per share.
Recently adopted accounting pronouncements
In February 2010, the Financial Accounting Standards Board (the “FASB”) issued new accounting guidance that amends and establishes general standards of accounting for and disclosure of events that occur after the balance sheet date but before financial statements are issued or are available to be issued. The new guidance is effective for interim and annual financial periods ending after February 24, 2010. The adoption of this guidance did not have a material impact on the Company’s results of operations or financial position.
In January 2010, the FASB issued new accounting guidance that improves fair value measurement disclosures by requiring new disclosures about transfers into and out of levels of the fair value hierarchy. It also requires separate disclosures about purchases, sales, issuances, and settlements related to the fair value hierarchy. The new guidance is effective for interim and annual financial periods beginning after December 15, 2009. The adoption of this guidance did not have a material impact on the Company’s results of operations or financial position.
In June 2009, the FASB issued new accounting guidance that improves financial reporting by enterprises involved with variable interest entities. The new guidance is effective for financial statements issued for fiscal years beginning after November 15, 2009. The adoption of this guidance did not have a material impact on the Company’s results of operations or financial position.
In June 2009, the FASB issued new accounting guidance that improves and defines the information that a reporting entity provides in its financial statements about a transfer of financial assets; the effects of a transfer on its financial position, financial performance, and cash flows; and a transferor’s continuing involvement, if any, in transferred financial assets. The new guidance is effective for financial statements issued for fiscal years beginning after November 15, 2009. The adoption of this guidance did not have a material impact on the Company’s results of operations or financial position.
In April 2009, the FASB issued new accounting guidance related to disclosures about the fair values of financial instruments for interim reporting periods of publicly traded companies as well as in annual financial statements. The new guidance also amends previous accounting literature to require those disclosures in summarized financial information at interim reporting periods. This guidance is effective for interim reporting periods ending after June 15, 2009, with early adoption permitted for periods ending after March 15, 2009. The adoption of this guidance did not have a material impact on the Company’s results of operations or financial position.
F-18
Table of Contents
Index to Financial Statements
Knology, Inc. and Subsidiaries
Notes to Consolidated Financial Statements—(Continued)
(dollars in thousands, except per share)
In April 2009, the FASB issued new accounting guidance related to estimating fair value in accordance with previous accounting literature when the volume and level of activity for the asset or liability have significantly decreased. The new guidance also relates to identifying circumstances that indicate if a transaction is not orderly (i.e., a forced liquidation or distressed sale). The adoption of this guidance did not have a material impact on the Company’s results of operations or financial position.
In April 2008, the FASB issued new accounting guidance that amends the factors that should be considered in developing renewal or extension assumptions in determining the useful life of a recognized intangible asset under previous accounting literature. The new guidance is effective for financial statements issued for fiscal years beginning after December 15, 2008. The adoption of this guidance did not have a material impact on the Company’s results of operations or financial position.
In March 2008, the FASB issued new accounting guidance that requires enhanced disclosures about an entity’s derivative and hedging activities and thereby improves the transparency of financial reporting on those activities. The new guidance is effective for financial statements issued for fiscal years beginning after November 15, 2008. The adoption of this guidance did not have a material impact on the Company’s results of operations or financial position.
Recent Accounting Standards Not Yet Adopted
In December 2010, the FASB issued new accounting guidance concerning when to perform step two of the goodwill impairment test for reporting units with zero or negative carrying amounts. The new guidance is effective for financial statements issued for interim and annual periods beginning after December 15, 2010. The Company does not expect that the adoption of this guidance will have a material impact on the Company’s results of operations or financial position.
In December 2010, the FASB issued new accounting guidance updating the pro forma financial reporting and disclosure requirements for material business combinations. The new guidance is effective prospectively for business combinations with an acquisition date on or after the beginning of the first annual reporting period beginning on or after December 15, 2010. The Company does not expect that the adoption of this guidance will have a material impact on the Company’s results of operations or financial position.
3. Employee Benefit Plan
The Company has a 401(k) Profit Sharing Plan (the “Plan”) for the benefit of eligible employees and their beneficiaries. All employees are eligible to participate in the Plan on the first day of employment. The Plan provides for a matching contribution at the discretion of the board up to 8% of eligible contributions. The Company contributions for the years ended December 31, 2008, 2009, and 2010 were $1,570, $1,074 and $1,480, respectively.
4. Long-Term Debt
On March 14, 2007, the Company entered into an Amended and Restated Credit Agreement (the “Original Credit Agreement”) that provided for a $580,000 credit facility, consisting of a $555,000 term loan (the “Initial Term Loan”) and a $25,000 revolving credit facility. On April 3, 2007, the Company received proceeds of $555,000 to fund the $255,000 PrairieWave acquisition purchase price, refinance the Company’s existing first and second term loans, and pay transaction costs associated with the transactions. This term loan bore interest at LIBOR plus 2.25% and was payable quarterly, with a June 30, 2012 maturity date. Prior to Amendment No. 2 discussed below, this term loan originally amortized at a rate of 1% per annum.
F-19
Table of Contents
Index to Financial Statements
Knology, Inc. and Subsidiaries
Notes to Consolidated Financial Statements—(Continued)
(dollars in thousands, except per share)
On January 4, 2008, the Company entered into a First Amendment to the Original Credit Agreement which provided for a $59,000 incremental term loan (the “First Amendment Incremental Term Loan”) used to fund in part the $75,000 Graceba acquisition purchase price. This term loan bore interest at LIBOR plus 2.75% and was payable quarterly, with a June 30, 2012 maturity date. Prior to Amendment No. 2 discussed below, this term loan originally amortized at a rate of 1% per annum.
On September 28, 2009, the Company entered into Amendment No. 2 to the Original Credit Agreement (“Amendment No. 2”) which extended the maturity date of an aggregate $399,000 of existing term loans under the Credit Agreement by two years (the “Extended Term Loan”). The Extended Term Loan bore interest at LIBOR plus 3.50% and amortized at a rate of 1% per annum, payable quarterly, with a June 30, 2014 maturity date. Amendment No. 2 also, among other modifications, increased the revolving credit facility to $35,000 from $25,000 and allowed for an annual, cumulative restricted payment allowance of $10,000 for dividends and/or share repurchases utilizing excess cash flow and subject to a maximum leverage test.
On October 15, 2010, the Company entered into a New Credit Agreement that provided for a $770,000 secured credit facility with proceeds used to partially fund the $165,000 Sunflower acquisition purchase price, refinance the company’s existing credit facility, and pay related transaction costs. The New Credit Agreement includes a $50,000 revolving credit facility, a $175,000 Term Loan A and a $545,000 Term Loan B. The Term Loan A bears interest at LIBOR plus a margin ranging from 3.5% to 4.25% and has a term of five years with annual amortization of $8,750, $8,750, $17,500 and $26,250 in 2012, 2013, 2014 and 2015, respectively, with the balance due at maturity. The Term Loan B bears interest at LIBOR plus 4%, with a LIBOR floor of 1.5%, and has a term of six years with 1% principal amortization annually with the balance due at maturity.
F-20
Table of Contents
Index to Financial Statements
Knology, Inc. and Subsidiaries
Notes to Consolidated Financial Statements—(Continued)
(dollars in thousands, except per share)
Long-term debt at December 31, 2009 and 2010 consisted of the following:
| 2009 | 2010 | |||||||
| Term Loan A, at a rate of LIBOR plus a margin ranging from 3.5% to 4.25% (4.26% total rate at December 31, 2010), with annual principal amortization as noted above, principal payable quarterly with final principal and any unpaid interest due October 15, 2015 |
$ | 0 | $ | 175,000 | ||||
| Term Loan B, at a rate of LIBOR plus 4%, with a LIBOR floor of 1.5% (5.50% total rate at December 31, 2010), with $5,450 annual principal amortization, principal payable quarterly with final principal and any unpaid interest due October 15, 2016 |
0 | 545,000 | ||||||
| Initial Term Loan, at a rate of LIBOR plus 2.25%, with $1,614 annual principal amortization, principal payable quarterly with final principal and any unpaid interest due June 30, 2012 (subsequently paid off in full on October 15, 2010 with the New Credit Agreement) |
160,586 | 0 | ||||||
| First Amendment Incremental Term Loan, at a rate of LIBOR plus 2.75%, with $330 annual principal amortization, principal payable quarterly with final principal and any unpaid interest due June 30, 2012 (subsequently paid off in full on October 15, 2010 with the New Credit Agreement) |
32,833 | 0 | ||||||
| Extended Term Loan, at a rate of LIBOR plus 3.50% (3.78% at December 31, 2009), with $3,988 annual principal amortization, principal payable quarterly with final principal and any unpaid interest due June 30, 2014 (subsequently paid off in full on October 15, 2010 with the New Credit Agreement) |
396,783 | 0 | ||||||
| Capitalized lease obligations, at various rates, with monthly principal and interest payments through April 2017 |
11,153 | 11,312 | ||||||
| 601,355 | 731,312 | |||||||
| Less current portion of long-term debt |
9,841 | 9,561 | ||||||
| Total long-term debt, net of current portion |
$ | 591,514 | $ | 721,751 | ||||
Following are maturities of long-term debt for each of the next five years as of December 31, 2010
| 2011 |
$ | 9,561 | ||
| 2012 |
16,249 | |||
| 2013 |
15,556 | |||
| 2014 |
20,850 | |||
| 2015 |
149,911 | |||
| Thereafter |
519,185 | |||
| Total |
$ | 731,312 | ||
The term loans are guaranteed by all of the Company’s subsidiaries. The term loans are also secured by first liens on all of the Company’s assets and the assets of its guarantor subsidiaries.
The New Credit Agreement contains defined events of default. The New Credit Agreement also contains defined representations and warranties and various affirmative and negative covenants, including:
| • | limitations on the incurrence of additional debt; |
| • | limitations on the incurrence of liens; |
F-21
Table of Contents
Index to Financial Statements
Knology, Inc. and Subsidiaries
Notes to Consolidated Financial Statements—(Continued)
(dollars in thousands, except per share)
| • | restrictions on investments; |
| • | restrictions on the sale of assets; |
| • | restrictions on the payment of cash dividends on and the redemption or repurchase of capital stock; |
| • | mandatory prepayment of amounts outstanding, as applicable, with excess cash flow, proceeds from asset sales, use of proceeds from the issuance of debt obligations, proceeds from any equity offerings, and proceeds from casualty losses; |
| • | restrictions on mergers and acquisitions, sale/leaseback transactions and fundamental changes in the nature of our business; |
| • | limitations on capital expenditures; and |
| • | maintenance of minimum ratios of debt to EBITDA (as defined in the credit agreements) and EBITDA to cash interest. |
As of December 31, 2010, the Company was in compliance with its debt covenants.
5. Operating and Capital Leases
The Company leases office space, utility poles, and other assets for varying periods, some of which have renewal or purchase options and escalation clauses. Leases that expire are generally expected to be renewed or replaced by other leases. Total rental expense for all operating leases was approximately $5,153, $5,427 and $4,983 for the years ended December 31, 2008, 2009, and 2010, respectively. Future minimum rental payments required under the operating and capital leases that have initial or remaining non-cancelable lease terms, in excess of one year as of December 31, 2010 are as follows:
| Capitalized Leases |
Operating Leases |
|||||||
| 2011 |
$ | 6,233 | 5,518 | |||||
| 2012 |
4,390 | 4,780 | ||||||
| 2013 |
1,390 | 3,623 | ||||||
| 2014 |
93 | 1,813 | ||||||
| 2015 |
90 | 1,285 | ||||||
| Thereafter |
74 | 3,373 | ||||||
| Total minimum lease payments |
$ | 12,270 | $ | 20,392 | ||||
| Less imputed interest |
958 | |||||||
| Present value of minimum capitalized lease payments |
11,312 | |||||||
| Less current portion |
5,474 | |||||||
| Long-term capitalized lease obligations |
$ | 5,838 | ||||||
The Company recorded $4,499, $7,140 and $4,608 for the years ended December 31, 2008, 2009 and 2010, respectively, as property, plant and equipment due to capital lease transactions for Video on Demand equipment, the buildout of various multiple dwelling units, and other properties. The Company had $15,872 and $20,479 of gross capitalized leases recorded as property plant and equipment at December 31, 2009 and 2010, respectively.
F-22
Table of Contents
Index to Financial Statements
Knology, Inc. and Subsidiaries
Notes to Consolidated Financial Statements—(Continued)
(dollars in thousands, except per share)
The accumulated amortization associated with these capitalized leases was $4,323 and $6,342 at December 31, 2009 and 2010, respectively. The amortization of the capital leases is recorded in “Depreciation and amortization” on the statement of operations along with other property, plant and equipment. The base rentals recorded to the multiple dwelling unit capital leases are contingent upon the Company acquiring subscribers. The Company has agreed to pay various amounts per subscriber to the lessors as the base monthly rentals. The lease terms are generally seven years. In accordance with the proper FASB guidance relating to accounting for leases, the Company has projected the number of subscribers to record the capital asset and liability and will update the projections to actual subscribers on an annual basis.
6. Commitments and Contingencies
Purchase commitments
The Company has entered into contracts with various entities to provide programming to be aired by the Company. The Company pays a monthly fee for the programming services, generally based on the number of video subscribers to the program, although some fees are adjusted based on the total number of video subscribers to the system and/or the system penetration percentage. These contracts generally last for three or more years with annual price adjustments. Total programming fees were approximately $84,014, $88,736 and $98,450 for the years ended December 31, 2008, 2009, and 2010, respectively. The Company estimates that it will pay approximately $117,052, $127,644 and $138,842 in programming fees under these contracts in 2011, 2012 and 2013, respectively. As of December 31, 2010, approximately 72% of our programming was sourced from the National Cable Television Cooperative, which also handles our contracting and billing arrangements on this programming.
Legal proceedings
The Company is subject to litigation in the normal course of its business. However, in the Company’s opinion, there is no legal proceeding pending against it that would have a material adverse effect on its financial position, results of operations or liquidity. The Company is also a party to regulatory proceedings affecting the segments of the communications industry generally in which it engages in business.
Unused Letters of Credit
The Company’s unused letters of credit for vendors and suppliers was $2,012 as of December 31, 2010, which reduces the funds available under the $50,000 revolving credit facility.
F-23
Table of Contents
Index to Financial Statements
Knology, Inc. and Subsidiaries
Notes to Consolidated Financial Statements—(Continued)
(dollars in thousands, except per share)
7. Income Taxes
The benefit/(provision) for income taxes from continuing operations consisted of the following for the years ended December 31, 2008, 2009, and 2010:
| 2008 | 2009 | 2010 | ||||||||||
| Current |
||||||||||||
| Federal |
$ | 0 | 0 | 0 | ||||||||
| State |
0 | 0 | 0 | |||||||||
| Total Current |
0 | 0 | 0 | |||||||||
| Deferred |
||||||||||||
| Federal |
12,137 | (9,577 | ) | 5,493 | ||||||||
| State |
1,071 | (845 | ) | (294 | ) | |||||||
| Total Deferred |
13,208 | (10,422 | ) | 5,199 | ||||||||
| (Increase) decrease in valuation allowance |
(13,208 | ) | 10,422 | (5,199 | ) | |||||||
| Income tax benefit (provision) |
$ | 0 | $ | 0 | $ | 0 | ||||||
In 2008, the Company had a net increase in deferred tax liabilities of $6,872 as a result of the 2008 Graceba acquisition, with a corresponding decrease in the valuation allowance. In October 2010, the Company purchased Sunflower, a division of The World Company. The acquisition was structured as an asset acquisition with the purchase price being allocated to the basis of the assets acquired. The tax allocation of the purchase price resulted in $121,000 of goodwill and $16,000 of other intangibles that will be amortized for tax purposes over 15 years. As an asset acquisition, the Company did not acquire any tax attributes of Sunflower.
Deferred income taxes reflect the net tax effect of temporary differences between the carrying amount of assets and liabilities for financial reporting purposes and the amounts used for income tax purposes. The significant components of deferred tax assets and liabilities as of December 31, 2009 and 2010 are as follows:
| 2009 | 2010 | |||||||
| Current deferred tax assets: |
||||||||
| Inventory reserve |
$ | 29 | $ | 34 | ||||
| Allowance for doubtful accounts |
444 | 536 | ||||||
| Other |
782 | 612 | ||||||
| Valuation allowance |
(1,255 | ) | (1,182 | ) | ||||
| Total current deferred taxes |
0 | 0 | ||||||
| Non-current deferred tax assets: |
||||||||
| Net operating loss & other attributes carryforwards |
84,897 | 83,719 | ||||||
| Deferred revenues |
218 | 242 | ||||||
| Depreciation and amortization |
(43,273 | ) | (52,830 | ) | ||||
| Goodwill amortization |
0 | 5,328 | ||||||
| Investment marked to market |
4,760 | 4,987 | ||||||
| Compensation and benefits |
1,308 | 1,258 | ||||||
| Change in value of interest rate hedge |
2,385 | 2,638 | ||||||
| Other |
479 | 306 | ||||||
| Valuation allowance |
(50,774 | ) | (45,648 | ) | ||||
| Total non-current deferred tax assets |
0 | 0 | ||||||
| Net deferred income taxes |
$ | 0 | $ | 0 | ||||
F-24
Table of Contents
Index to Financial Statements
Knology, Inc. and Subsidiaries
Notes to Consolidated Financial Statements—(Continued)
(dollars in thousands, except per share)
As of December 31, 2010, the Company has an interest rate swap that is not designated as a hedge for financial reporting purposes. Changes in the fair value of the interest rate swap are recorded as a gain or loss in the “Other income (expense)” section of the statement of operations as they are incurred. Pursuant to current income tax laws and regulations, the Company does not record the fair value of the derivative or recognize any charges to income. Therefore, the $6,699 loss on change in fair value recorded for financial purposes results in a $2,638 deferred tax asset at December 31, 2010.
At December 31, 2010, the Company had available federal net operating loss carryforwards of approximately $215,000 that expire from 2011 to 2028. Approximately $ 75,000 of this carryforward is subject to annual limitations due to a change in ownership of the Company as defined in the Internal Revenue Code. In addition, the Company had approximately $2,700 in federal net operating losses from share-based payment awards for which it has not recorded a financial statement benefit as per the appropriate FASB guidance. The Company also had various state net operating loss carryforwards totaling approximately $ 619,000. Of this amount, approximately $268,000 is subject to $45,000 in annual limitations due to an ownership change of the Company, resulting in $351,000 of useable state net operating loss carryforwards. Unless utilized, the state carryforwards expire from 2014 to 2029. For 2010, management has recorded a total valuation allowance of $46,830 against its deferred tax assets including the operating loss carryforwards.
At December 31, 2009, the Company had available federal net operating loss carryforwards of approximately $225,000 that expire from 2010 to 2029. Of this $225,000 carryforward, $42,000 is related to the PrairieWave acquisition and expire from 2022 to 2027. Approximately $70,000 of this carryforward is subject to annual limitations due to a change in ownership of the Company, as defined in the Internal Revenue Code. In addition, the Company had approximately $3,200 in federal net operating losses from share-based payment awards for which it has not recorded a financial statement benefit as per the appropriate FASB guidance. The Company also had various state net operating loss carryforwards totaling approximately $620,000. Unless utilized, the state net operating loss carryforwards expire from 2010 to 2026. For 2009, management has recorded a total valuation allowance of $52,029 against its deferred tax assets including the operating loss carryforwards.
A reconciliation of the income tax provision computed at statutory tax rates to the income tax provision for the years ended December 31, 2008, 2009, and 2010 is as follows:
| 2008 | 2009 | 2010 | ||||||||||
| Income tax benefit at statutory rate |
34 | % | 34 | % | 35 | % | ||||||
| State income taxes, net of federal benefit |
7 | % | 16 | % | 208 | % | ||||||
| Meals & Entertainment |
0 | % | 0 | % | (31 | )% | ||||||
| Rate Differential |
0 | % | 0 | % | 488 | % | ||||||
| NOL & Charitable Contribution Expiration |
0 | % | 0 | % | (2,391 | )% | ||||||
| Disqualifying Dispositions of ISO’s and Restricted Stock |
0 | % | (11 | )% | (177 | )% | ||||||
| Other |
(1 | )% | (3 | )% | 19 | % | ||||||
| 40 | % | 36 | % | (1,849 | )% | |||||||
| (Increase) decrease in valuation allowance |
(40 | )% | (36 | )% | 1,849 | % | ||||||
| Income tax benefit (provision) |
0 | % | 0 | % | 0 | % | ||||||
The 2010 rate reconciliation includes a rate differential that reflects a change from using a 34% federal tax rate to a 35% federal tax rate to calculate the deferred taxes. The Company believes the 35% rate more accurately reflects the tax rate at which the deferred items will reverse.
F-25
Table of Contents
Index to Financial Statements
Knology, Inc. and Subsidiaries
Notes to Consolidated Financial Statements—(Continued)
(dollars in thousands, except per share)
On January 1, 2007, the Company adopted the provisions of the FASB related to accounting for uncertainty in income taxes. At the date of adoption, and as of December 31, 2010, the Company did not have a liability for uncertain tax benefits. The Company recognizes interest and penalties related to uncertain tax positions in income tax expense. As of December 31, 2010, the Company made no provisions for interest or penalties related to uncertain tax positions.
The Company and its subsidiaries file income tax returns in the U.S. federal jurisdiction, and various state jurisdictions. For federal tax purposes, the Company’s 2007 through 2010 tax years remain open for examination by the tax authorities under the normal three year statute of limitations. Generally, for state tax purposes, the Company’s 2007 through 2010 tax years remain open for examination by the tax authorities under a three year statute of limitations. Should the Company utilize any of its U.S. or state loss carryforwards, its carryforward losses, which date back to 1995, would be subject to examination.
8. Equity Interests
Knology, Inc. stock award plans
In 2008, the board of directors and stockholders approved the Knology, Inc. 2008 Incentive Plan (the “2008 Plan”). The 2008 Plan authorizes the issuance of up to 3,750,000 shares of common stock pursuant to stock option and other stock-based awards. The maximum number of shares of common stock that may be granted under the 2008 Plan to any one person during any one calendar year is 300,000. The aggregate dollar value of any share-based award that may be paid to any one participant during any one calendar year under the 2008 Plan is $3,000. The 2008 Plan is administered by the compensation and stock option committee of the board of directors. Options granted under the plans are intended to qualify as “incentive stock options” under Section 422 of the Internal Revenue Code of 1986, as amended. The exercise price shall be determined by the board of directors, provided that the exercise price shall not be less than the fair value of the common stock at the date of grant. The options have a vesting period of 4 years and expire 10 years from the date of grant. As of December 31, 2010, there are approximately 2,034,368 shares remaining available for future issuance under the 2008 Plan.
Stock-based compensation expense
The Company utilizes the recognition provisions of the related FASB accounting guidance for stock-based employee compensation. The following represent the expected stock option compensation expense of all stock-based compensation plans for the next five years assuming no additional grants.
| 2011 |
$ | 4,068 | ||
| 2012 |
1,879 | |||
| 2013 |
855 | |||
| 2014 |
177 | |||
| 2015 |
0 | |||
| $ | 6,979 | |||
F-26
Table of Contents
Index to Financial Statements
Knology, Inc. and Subsidiaries
Notes to Consolidated Financial Statements—(Continued)
(dollars in thousands, except per share)
Stock options
The fair value of stock options was estimated at the date of grant using a Black-Scholes option pricing model and the following weighted average assumptions in 2008, 2009, and 2010:
| Common |
2008 | 2009 | 2010 | |||||||||
| Risk-free interest rate |
1.55-3.49 | % | 1.82-2.71 | % | 1.27-2.55 | % | ||||||
| Expected dividend yield |
0 | % | 0 | % | 0 | % | ||||||
| Expected lives |
Four years | Four years | Four years | |||||||||
| Expected forfeiture rate |
9.0 | % | 7.5 | % | 1.25 | % | ||||||
| Expected volatility |
57 | % | 159 | % | 53 | % | ||||||
A summary of the status of the Company’s stock options as of December 31, 2010 is presented in the following table:
| Common shares |
Weighted average exercise price per share |
Weighted average fair value price per share |
Weighted average remaining contractual life |
Intrinsic Value |
||||||||||||||||
| Outstanding as of December 31, 2007 |
3,080,892 | $ | 6.84 | 7.29 | $ | 21,001 | ||||||||||||||
| Granted |
945,494 | 12.07 | $ | 5.39 | ||||||||||||||||
| Forfeited |
(77,623 | ) | 10.28 | |||||||||||||||||
| Expired |
(67,345 | ) | 14.02 | |||||||||||||||||
| Exercised |
(228,497 | ) | 3.58 | $ | 1,949 | |||||||||||||||
| Outstanding as of December 31, 2008 |
3,652,921 | $ | 8.20 | 7.14 | $ | 3,899 | ||||||||||||||
| Granted |
399,711 | 5.72 | $ | 3.36 | ||||||||||||||||
| Forfeited |
(99,384 | ) | 10.61 | |||||||||||||||||
| Expired |
(199,319 | ) | 18.19 | |||||||||||||||||
| Exercised |
(618,377 | ) | 2.39 | $ | 4,475 | |||||||||||||||
| Outstanding as of December 31, 2009 |
3,135,552 | $ | 8.32 | 6.91 | $ | 11,054 | ||||||||||||||
| Granted |
386,127 | 11.44 | $ | 9.83 | ||||||||||||||||
| Forfeited |
(18,604 | ) | 9.44 | |||||||||||||||||
| Expired |
(9,324 | ) | 8.49 | |||||||||||||||||
| Exercised |
(275,856 | ) | 5.73 | $ | 2,105 | |||||||||||||||
| Outstanding as of December 31, 2010 |
3,217,895 | $ | 8.91 | 6.36 | $ | 21,819 | ||||||||||||||
| Exercisable shares as of December 31, 2010 |
2,019,254 | $ | 7.89 | 5.38 | $ | 15,762 | ||||||||||||||
Cash received from option exercises under all share-based payment arrangements was $818, $1,476 and $1,582 for the years ended December 31, 2008, 2009 and 2010, respectively. There were no actual tax benefits realized for the tax deductions from option exercises of the share-based payment arrangements for the years ended December 31, 2008, 2009 and 2010.
F-27
Table of Contents
Index to Financial Statements
Knology, Inc. and Subsidiaries
Notes to Consolidated Financial Statements—(Continued)
(dollars in thousands, except per share)
The following table sets forth the exercise price range, number of shares, weighted average exercise price, and remaining contractual lives by groups of similar price and grant date:
Common shares
| Range of exercise prices |
Outstanding as of 12/31/2010 |
Weighted average remaining contractual life |
Weighted average exercise price |
Exercisable as of 12/31/2010 |
Weighted average exercise price |
|||||||||||||||
| $1.70-$5.08 |
682,607 | 4.83 | $ | 2.77 | 683,191 | $ | 2.68 | |||||||||||||
| $5.42-$7.94 |
921,932 | 5.81 | $ | 6.75 | 594,349 | $ | 7.34 | |||||||||||||
| $9.00-$11.17 |
667,779 | 7.76 | $ | 10.90 | 190,477 | $ | 10.41 | |||||||||||||
| $11.63-$13.51 |
733,513 | 7.09 | $ | 13.37 | 397,948 | $ | 13.35 | |||||||||||||
| $13.56-$18.30 |
212,064 | 6.81 | $ | 16.35 | 153,289 | $ | 16.61 | |||||||||||||
| 3,217,895 | 2,019,254 | |||||||||||||||||||
As of December 31, 2010, 2,019,254 options for the Company’s common shares with a weighted average of $7.89 per share were exercisable by employees of the Company. As of December 31, 2009, 1,707,775 options for the Company’s common shares with a weighted average price of $6.90 per share were exercisable by employees of the Company. As of December 31, 2008, 1,903,523 options for the Company’s common shares with a weighted average of $5.82 per share were exercisable by employees of the Company.
Restricted Stock
On February 12, 2008, the Company granted 124,681 shares of performance-based restricted shares with a market value of $1,363 to certain officers. The shares vest equally on each of the three anniversaries following the grant date.
On May 8, 2008, the Company granted 486,000 shares of performance-based restricted shares with a market value of $6,566 to certain officers. The shares vest equally on each of the three anniversaries following the grant date.
On February 12, 2009, the Company granted 138,000 shares of performance-based restricted shares with a market value of $748 to certain officers. The shares vest equally on each of the three anniversaries following the grant date.
On August 19, 2009, the Company granted 15,000 shares of performance-based restricted shares with a market value of $118 to a certain officer. The shares vest equally on each of the three anniversaries following the grant date.
On February 15, 2010, the Company granted 137,405 shares of performance-based restricted shares with a market value of $1,535 to certain officers. The shares vest equally on each of the three anniversaries following the grant date.
F-28
Table of Contents
Index to Financial Statements
Knology, Inc. and Subsidiaries
Notes to Consolidated Financial Statements—(Continued)
(dollars in thousands, except per share)
A summary of the status of the Company’s restricted stock as of December 31, 2010 is presented in the following table:
| Common shares |
Weighted average grant date fair value |
|||||||
| Nonvested as of December 31, 2007 |
272,997 | $ | 11.52 | |||||
| Activity during 2008: |
||||||||
| Granted |
610,681 | 12.98 | ||||||
| Forfeited |
0 | |||||||
| Vested |
(120,677 | ) | 9.59 | |||||
| Nonvested as of December 31, 2008 |
763,001 | $ | 12.99 | |||||
| Activity during 2009: |
||||||||
| Granted |
153,000 | 5.66 | ||||||
| Forfeited |
0 | |||||||
| Vested |
(279,720 | ) | 13.00 | |||||
| Nonvested as of December 31, 2009 |
636,281 | $ | 11.23 | |||||
| Activity during 2010: |
||||||||
| Granted |
137,405 | 11.17 | ||||||
| Forfeited |
(18,045 | ) | 9.68 | |||||
| Vested |
(323,022 | ) | 11.90 | |||||
| Nonvested as of December 31, 2010 |
432,619 | $ | 10.77 | |||||
Total non-cash stock compensation expense related to these restricted stock grants was approximately $2,805, $3,878 and $3,344 for the years ended December 31, 2008, 2009, and 2010, respectively. The total non-cash stock compensation expense for all stock based compensation was approximately $4,640, $6,198 and $6,409 for the years ended December 31, 2008, 2009, and 2010, respectively.
9. Related Party Transactions
The Company participates in an agreement with ITC Holding Co., LLC, Enon Plantation, Inc., J. Smith Lanier & Co. and Kenzie Lane Ventures, LLC regarding the joint ownership of an aircraft. ITC Holding Co., LLC and Enon Plantation, Inc. are primarily owned by a member of the Company’s board of directors. The travel costs incurred by the Company for use of the aircraft were approximately $266, $89 and $214 for the years ended December 31, 2008, 2009, and 2010, respectively.
10. Acquisitions
Private Cable Co., LLC
On November 17, 2009, the Company completed its acquisition of the assets of PCL Cable, a voice, video, and high-speed Internet broadband services provider in Athens and Decatur, Alabama. The Company’s purchase of PCL Cable is a strategic acquisition that fits well in its existing operation in Huntsville, Alabama.
The Company used the cash on hand to fund the $7,500 purchase price. The financial position and results of operations for PCL are included in the Company’s presented consolidated financial statements since the date of
F-29
Table of Contents
Index to Financial Statements
Knology, Inc. and Subsidiaries
Notes to Consolidated Financial Statements—(Continued)
(dollars in thousands, except per share)
acquisition. Supplemental pro forma results of operations were not required to be presented here as the acquisition of PCL Cable was determined not to be a material transaction. The total purchase price for the assets acquired, net of liabilities assumed and including direct acquisition costs, was $7,500. Goodwill represents the excess of the cost of the business acquired over fair value or net identifiable assets at the date of acquisition. Since the Company purchased the assets of PCL Cable, the goodwill is deductible for tax purposes.
The following table summarizes the allocation of purchase price to the fair values of the assets acquired, net of liabilities and direct acquisition costs, as of November 17, 2009. The allocation adjustments have been finalized as of December 31, 2010.
| November 17, 2009 |
||||
| Assets acquired: |
||||
| Accounts receivable |
$ | 48 | ||
| Prepaid expenses |
4 | |||
| Property, plant and equipment |
4,399 | |||
| Goodwill |
3,123 | |||
| Customer base |
106 | |||
| Total assets acquired |
7,680 | |||
| Liabilities assumed: |
||||
| Accounts payable |
180 | |||
| Total liabilities assumed |
180 | |||
| Purchase price, net of cash acquired of $0 |
$ | 7,500 | ||
For the year ended December 31, 2009, it is impracticable for the Company to provide the financial results of PCL’s operations since the acquisition was absorbed by the operations of the Huntsville division. We do not record the revenues or expenses for the PCL acquisition separately from the division and no separate financial statements are produced.
Sunflower Broadband
On October 15, 2010, the Company completed its acquisition of Sunflower Broadband (“Sunflower”), a provider of video, voice and data services to residential and business customers in Douglas County, Lawrence, Kansas and the surrounding area. The Company’s purchase of Sunflower is a strategic acquisition that maintains the Company’s strategic niche, operating in secondary and tertiary markets with favorable demographics and positive economic growth characteristics. The acquisition also offers attractive edge-out possibilities, tack-on acquisition and larger acquisition opportunities bridging the Company’s Southeast and Upper Midwest footprints.
The Company used the $720,000 in proceeds of the New Credit Agreement to partially fund the $165,000 acquisition purchase price, refinance the Company’s existing credit facility, and pay related transaction costs. The Company also used approximately $48,000 of cash on hand to partially fund the transaction. The financial position and results of operations for Sunflower are included in the Company’s presented consolidated financial statements since the date of acquisition. The total purchase price for the assets acquired, net of liabilities assumed, was $164,795. Goodwill represents the excess of the cost of the business acquired over fair value or net identifiable assets at the date of acquisition. Since the Company purchased the assets of Sunflower, the goodwill is deductible for tax purposes.
F-30
Table of Contents
Index to Financial Statements
Knology, Inc. and Subsidiaries
Notes to Consolidated Financial Statements—(Continued)
(dollars in thousands, except per share)
The following table summarizes the allocation of purchase price to the estimated fair values of the assets acquired, net of liabilities and direct acquisition costs, as of October 15, 2010.
| October 15, 2010 |
||||
| Assets acquired: |
||||
| Accounts receivable |
$ | 2,162 | ||
| Prepaid expenses |
595 | |||
| Property, plant and equipment |
46,832 | |||
| Goodwill |
104,192 | |||
| Customer base |
13,000 | |||
| Intangible and other assets |
3,175 | |||
| Total assets acquired |
169,956 | |||
| Liabilities assumed: |
||||
| Accounts payable |
3,090 | |||
| Accrued liabilities |
671 | |||
| Unearned revenue |
910 | |||
| Long term debt |
490 | |||
| Total liabilities assumed |
5,161 | |||
| Purchase price, net of cash acquired of $205 |
$ | 164,795 | ||
11. Unaudited Pro Forma Results of Operations
The following unaudited pro forma consolidated results of operations for the years ended December 31, 2009 and 2010 assume that the acquisition of Sunflower occurred on January 1, 2009. The unaudited pro forma information is presented for informational purposes only and may not be indicative of the actual results of the operations had the acquisition occurred on the assumed date, nor is the information necessarily indicative of future results of operations.
| 12 months ended December 31, 2009 |
12 months ended December 31, 2010 |
|||||||
| Operating revenues |
$ | 474,668 | $ | 499,060 | ||||
| Net loss |
(8,229 | ) | (231 | ) | ||||
| Net loss per share |
(0.23 | ) | (0.01 | ) | ||||
12. Subsequent Events
Subsequent to quarter end, on February 21, 2011, the Company signed a definitive agreement to acquire from CoBridge Broadband, LLC certain cable and broadband operations in Fort Gordon, Georgia and Troy, Alabama for $30,000 cash. The combined operations of these two markets represent approximately $15,000 in expected annual revenues (unaudited). The transaction is expected to close in the second quarter of 2011, subject to certain normal and customary closing conditions, including regulatory approvals. The Company expects to fund the proposed transaction by using $10,000 in cash on hand and $20,000 in proceeds from the additional term Loan A closed in connection with the debt repricing transaction (see below).
F-31
Table of Contents
Index to Financial Statements
Knology, Inc. and Subsidiaries
Notes to Consolidated Financial Statements—(Continued)
(dollars in thousands, except per share)
In connection with the acquisition, on February 18, 2011, the Company entered into a debt repricing transaction that will reduce the Company’s annual interest expense by approximately $10,000. The interest rate on term loan A was repriced to LIBOR plus a margin ranging from 2.5% to 3.25% and the maturity was extended to February 2016. The interest rate on term loan B was repriced to LIBOR plus 3%, with a LIBOR floor of 1%, and the maturity was extended to August 2017. In connection with the terms of the repricing, the credit facility was amended to increase the capacity of the incremental basket from $200,000 to $250,000, and the term loan A principal was increased $20,000 with the proceeds to be used to partially fund the acquisition, as noted above.
F-32