Attached files
UNITED STATES
SECURITIES AND EXCHANGE COMMISSION
Washington, D.C. 20549
FORM 10-K
ANNUAL REPORT PURSUANT TO SECTION 13 OR 15(d)
OF THE SECURITIES EXCHANGE ACT OF 1934
For the fiscal year ended December 31, 2010
Commission File No. 0-24753
ECB BANCORP, INC.
(Name of Registrant as specified in its charter)
| North Carolina | 56-2090738 | |
| (State or other jurisdiction of incorporation or organization) |
(I.R.S. Employer Identification No.) |
Post Office Box 337
Engelhard, North Carolina 27824
(Address of principal executive offices, including Zip Code)
(252) 925-5501
Registrant’s telephone number, including area code
| Securities registered under Section 12(b) of the Act: | Common Stock, $3.50 par value per share | |
| Name of exchange on which registered: | The NASDAQ Global Market | |
| Securities registered under Section 12(g) of the Act: | None | |
| (Title of class) |
Indicate by check mark if the Registrant is a well-known seasoned issuer, as defined in Rule 405 of the Securities Act. Yes ¨ No x
Indicate by check mark if the Registrant is not required to file reports pursuant to Section 13 or Section 15(d) of the Act. Yes ¨ No x
Indicate by check mark whether the Registrant (1) has filed all reports required to be filed by Section 13 or 15(d) of the Exchange Act during the preceding 12 months (or for such shorter period that the Registrant was required to file such reports), and (2) has been subject to such filing requirements for the past 90 days. Yes x No ¨
Indicate by checkmark whether the registrant has submitted electronically and posted on its corporate Website, if any, every Interactive Date File required to be submitted and posted pursuant to Rule 405 of Regulation S-T (§ 232.405 of this chapter) during the preceding 12 months (or for such shorter period that the registrant was required to submit and post such files). Yes ¨ No ¨
Indicate by check mark if disclosure of delinquent filers pursuant to Item 405 of Regulation S-K is not contained herein, and will not be contained, to the best of Registrant’s knowledge, in definitive proxy or information statements incorporated by reference in Part III of this Form 10-K or any amendment to this Form 10-K. x
Indicate by check mark whether the Registrant is a large accelerated filer, an accelerated filer, a non-accelerated filer, or a smaller reporting company. See definition of “accelerated filer”, “large accelerated filer” and “smaller reporting company” in Rule 12b-2 of the Exchange Act.
| Large accelerated filer | ¨ | Accelerated filer | ¨ | |||
| Non-accelerated filer | ¨ | Smaller reporting company | x |
Indicate by check mark whether the Registrant is a shell company (as defined in Rule 12b-2 of the Exchange Act). Yes ¨ No x
State the aggregate market value of the voting and non-voting common equity held by non-affiliates computed by reference to the price at which the common equity was last sold, or the average bid and asked price of such common equity, as of the last business day of the Registrant’s most recently completed second fiscal quarter.
$26,006,607
On March 7, 2011, there were 2,849,841 outstanding shares of Registrant’s common stock.
Documents Incorporated by Reference
Portions of Registrant’s definitive Proxy Statement to be filed with the Securities and Exchange Commission in connection with its 2011 Annual Meeting are incorporated into Part III of this Report.
PART I
When used in this Report, the terms “we,” “us,” “our” and similar terms refer to the registrant, ECB Bancorp, Inc. The term “Bank” refers to our bank subsidiary, The East Carolina Bank.
Item 1. Business.
General
We are a North Carolina corporation organized during 1998 by the Bank and at the direction of its Board of Directors to serve as the Bank’s parent holding company. We operate as a bank holding company registered with the Federal Reserve Board, and our primary business activity is owning the Bank and promoting its banking business. Through the Bank, we engage in a general, community-oriented commercial and consumer banking business.
The Bank is a North Carolina-chartered bank that was founded in 1919. Its deposits are insured under the FDIC’s Deposit Insurance Fund to the maximum amount permitted by law, and it is subject to supervision and regulation by the FDIC and the North Carolina Commissioner of Banks.
Like other community banks, our net income depends primarily on our net interest income, which is the difference between the interest income we earn on loans, investment assets and other interest-earning assets, and the interest we pay on deposits and other interest-bearing liabilities. To a lesser extent, our net income also is affected by non-interest income we derive principally from fees and charges for our services, as well as the level of our non-interest expenses, such as expenses related to our banking facilities and salaries and employee benefits.
Our operations are significantly affected by prevailing economic conditions, competition, and the monetary, fiscal and regulatory policies of governmental agencies. Lending activities are influenced by the general credit needs of small and medium-sized businesses and individuals in our banking markets, competition among lenders, the level of interest rates, and the availability of funds. Deposit flows and costs of funds are influenced by prevailing market interest rates (primarily the rates paid on competing investments), account maturities and the levels of personal income and savings in our banking markets.
Our and the Bank’s headquarters are located at 35050 U.S. Highway 264 East in Engelhard, North Carolina, and our telephone number at that address is (252) 925-9411.
2
Business Offices and Banking Markets
The Bank has 25 full-service banking offices located in thirteen North Carolina counties. Our banking markets are located east of the Interstate Highway 95 corridor in portions of the Coastal Plain region of North Carolina which extends from the Virginia border along the coast of North Carolina to the South Carolina border. Within that region, we subdivide our banking markets into three banking regions. The following table lists our branch offices in each banking region.
| Region |
Branches |
County | ||
| Outer Banks Region |
Currituck | Currituck | ||
| Southern Shores/ Kitty Hawk | Dare | |||
| Nags Head | Dare | |||
| Manteo | Dare | |||
| Avon | Dare | |||
| Hatteras | Dare | |||
| Ocracoke | Hyde | |||
| Northeast Region |
Greenville (three offices) | Pitt | ||
| Winterville | Pitt | |||
| Washington | Beaufort | |||
| Engelhard | Hyde | |||
| Swan Quarter | Hyde | |||
| Fairfield | Hyde | |||
| Williamston | Martin | |||
| Columbia | Tyrrell | |||
| Creswell | Washington | |||
| Hertford | Perquimans | |||
| Coastal Region |
Wilmington | New Hanover | ||
| Porters Neck | New Hanover | |||
| Ocean Isle Beach | Brunswick | |||
| Leland | Brunswick | |||
| Morehead City | Carteret | |||
| New Bern | Craven | |||
Competition
Commercial banking in North Carolina is highly competitive, due in large part to our state’s early adoption of statewide branching. Over the years, federal and state legislation (including the elimination of restrictions on interstate banking) has heightened the competitive environment in which all financial institutions conduct their business, and competition among financial institutions of all types has increased significantly.
Banking also is highly competitive in our banking markets, and customers tend to aggressively “shop” the terms of both their loans and deposits. We compete with other commercial banks, savings banks and credit unions, including banks headquartered or controlled by companies headquartered outside of North Carolina but that have offices in our banking markets. According to the most recent market share data published by the FDIC, on June 30, 2010 there were 303 offices of 34 different FDIC-insured depository institutions (including us) in the 13 counties in which we have banking offices. Three of those banks (Wells Fargo, BB&T and First-Citizens Bank) controlled an aggregate of approximately 51% of all deposits in the 13-county area held by those 3 institutions, while we held approximately 6% of total deposits.
We believe community banks can compete successfully by providing personalized service and making timely, local decisions, and that further consolidation in the banking industry is likely to create additional opportunities for community banks to capture deposits from customers of other financial institutions who become dissatisfied as their financial institutions grow larger. Additionally, we believe continued growth in our banking markets provides us with an opportunity to capture new deposits from new residents.
3
Almost all our customers are small- and medium-sized businesses and individuals. We try to differentiate ourselves from our larger competitors with our focus on relationship banking, personalized service, direct customer contact, and our ability to make credit and other business decisions locally. We also depend on our reputation as a community bank in our banking markets, our involvement in the communities we serve, the experience of our senior management team, and the quality of our associates. We believe that our focus allows us to be more responsive to our customers’ needs and more flexible in approving loans based on collateral quality and personal knowledge of our customers.
Services
Our banking operations are primarily retail oriented and directed toward small- and medium-sized businesses and individuals located in our banking markets. We derive the majority of our deposits and loans from customers in our banking markets, but we also make loans and have deposit relationships with commercial and consumer customers in areas surrounding our immediate banking markets. We also market certificates of deposit by advertising our deposit rates on an Internet certificate of deposit network, and we accept “brokered” deposits. We provide most traditional commercial and consumer banking services, but our principal activities are taking demand and time deposits and making commercial and consumer loans. Our primary source of revenue is interest income we derive from our lending activities.
We do not believe we have any one customer from whom more than 10% of our revenues are derived. However, we have multiple customers, commercial and retail, that are directly or indirectly affected by, or engaged in businesses related to, the tourism and agribusiness industries and that, in the aggregate, historically have provided greater than 10% of our revenues.
Seasonality and Cycles
Because the local economies of communities in our Outer Banks, Northeast Region, and Coastal Regions depend, to a large extent, on tourism and agribusiness (including seafood related businesses), historically there has been an element of seasonality in our business in those regions. However, more recently, the extent to which seasonality affects our business has diminished somewhat, largely as a result of a shift away from the seasonal population growth that once characterized many of our coastal communities and toward a more year-round economy resulting from increasing numbers of permanent residents and retirees relocating to these markets. The seasonal patterns that once characterized agribusiness also have been lessened with agricultural product diversification, the year round marketing and sales of agricultural commodities, and agribusiness tax and financial planning.
The current real estate cycle has been trending downward in most of the Bank’s markets. This downward trend has and will continue to have an impact on the real estate lending of the Bank. Continued emphasis will be placed on the customer’s ability to generate sufficient cash flow to support their total credit exposure rather than reliance upon the underlying value of the real estate being held as collateral for those loans.
Lending Activities
General. We make a variety of commercial and consumer loans to small- and medium-sized businesses and individuals for various business and personal purposes, including term and installment loans, business and personal lines of credit, equity lines of credit and overdraft checking credit. For financial reporting purposes, our loan portfolio generally is divided into real estate loans, consumer installment loans, commercial and industrial loans (including agricultural production loans), and credit cards and related plans. We make credit card services available to our customers through a correspondent relationship. Statistical information about our loan portfolio is contained in Item 7 of this report under the caption “Management’s Discussion and Analysis of Financial Condition and Results of Operations.”
Real Estate Loans. Our real estate loan classification includes all loans secured by real estate. Real estate loans include loans made to purchase, construct or improve residential or commercial real estate, and for real estate development purposes. However, many of our real estate loans, while secured by real estate, were made for various other commercial, agricultural and consumer purposes (which may or may not be related to our real estate collateral). This generally reflects our efforts to reduce credit risk by taking real estate as primary or additional collateral, whenever possible, without regard to loan purpose. Substantially all of our real estate loans are secured by real property located in or near our banking markets. On December 31, 2010, loans amounting to approximately 80.1% of our loan portfolio were
4
classified as real estate loans. We make long-term residential mortgage loans through our mortgage department. These loans are held for sale and we generally hold these loans for a short period of time of approximately ten days. This allows us to make long-term residential loans available to our customers and generate fee income but avoid most risks associated with those loans.
Commercial real estate and construction loans typically involve larger loan balances concentrated with single borrowers or groups of related borrowers. Repayment of commercial real estate loans may depend on the successful operation of income producing properties, a business, or a real estate project and, therefore, may, to a greater extent than in the case of other loans, be subject to the risk of adverse conditions in the economy generally or in the real estate market in particular.
Construction loans involve special risks because loan funds are advanced on the security of houses or other improvements that are under construction and are of uncertain value before construction is complete. For that reason, it is more difficult to evaluate accurately the total loan funds required to complete a project and the related loan-to-value ratios. To reduce these risks, we generally limit loan amounts to 85% of the projected “as built” appraised values of our collateral on completion of construction. For larger projects, we include amounts for contingencies in our construction cost estimates. We generally require a qualified permanent financing commitment from an outside lender unless we have agreed to convert the construction loan to permanent financing ourselves.
On December 31, 2010, our construction and acquisition and development loans (consumer and commercial) amounted to approximately 15.9% of our loan portfolio, and our other commercial real estate loans amounted to approximately 38.4% of our loan portfolio.
Our real estate loans may be made at fixed or variable interest rates, and they generally have maturities that do not exceed five years and provide for payments based on amortization schedules of less than twenty years. A real estate loan with a maturity of more than five years or that is based on an amortization schedule of more than five years generally will include contractual provisions that allow us to call the loan in full, or provide for a “balloon” payment in full, at the end of a period of no more than five years.
Our real estate loans also include home equity lines of credit that generally are used for consumer purposes and usually are secured by junior liens on residential real property. Our commitment on each line is for a term of 15 years. During the terms of the lines of credit, borrowers may either pay accrued interest only (calculated at variable interest rates), with their outstanding principal balances becoming due in full at the maturity of the lines, or they may make monthly payments of principal and interest equal to 1.5% of their outstanding balances. On December 31, 2010, our home equity lines of credit amounted to approximately 6.1% of our loan portfolio.
Consumer Installment Loans. Our consumer installment loans consist primarily of loans for various consumer purposes, as well as the outstanding balances of non-real estate secured consumer revolving credit accounts. A majority of these loans are secured by liens on various personal assets of the borrowers, but they also may be made on an unsecured basis. On December 31, 2010, our consumer installment loans made up approximately 0.7% of our loan portfolio, and approximately 17.7% of the aggregate outstanding balances of those loans were unsecured. In addition to loans classified on our books as consumer installment loans, many of our loans included in the real estate loan classification are made for consumer purposes but are classified as real estate loans on our books because they are secured by first or junior liens on real estate. Consumer loans generally are made at fixed interest rates and with maturities or amortization schedules that generally do not exceed five years. However, consumer-purpose loans secured by real estate (and, thus, classified as real estate loans as described above) may be made for terms of up to 15 years but under terms that allow us to call the loan in full, or provide for a “balloon” payment, at the end of a period of no more than five years.
Consumer installment loans involve greater risks than other loans, particularly in the case of loans that are unsecured or secured by depreciating assets. When damage or depreciation reduces the value of our collateral below the unpaid balance of a defaulted loan, repossession may not result in repayment of the entire outstanding loan balance. The resulting deficiency may not warrant further substantial collection efforts against the borrower. In connection with consumer lending in general, the success of our loan collection efforts is highly dependent on the continuing financial stability of our borrowers, and our collection of consumer installment loans may be more likely to be adversely affected by a borrower’s job loss, illness, personal bankruptcy or other change in personal circumstances than is the case with other types of loans.
5
Commercial and Industrial Loans. Our commercial and industrial loan classification includes loans to small- and medium-sized businesses and individuals for working capital, equipment purchases and various other business and agricultural purposes. This classification excludes any loan secured by real estate. These loans generally are secured by business assets, such as inventory, accounts receivable, equipment or similar assets, but they also may be made on an unsecured basis. On December 31, 2010, our commercial and industrial loans made up approximately 15.6% of our loan portfolio, and approximately 16.0% of the aggregate outstanding balances of those loans represented unsecured loans. Those loans included approximately $28.2 million, or approximately 5.0% of our total loans, to borrowers engaged in agriculture, commercial fishing or seafood-related businesses. In addition to loans classified on our books as commercial and industrial loans, many of our loans included in the real estate loan classification are made for commercial or agricultural purposes but are classified as real estate loans on our books because they are secured by first or junior liens on real estate. Commercial and industrial loans may be made at variable or fixed rates of interest. However, any loan that has a maturity or amortization schedule of longer than five years normally will be made at an interest rate that varies with our prime lending rate and will include contractual provisions that allow us to call the loan in full, or provide for a “balloon” payment in full, at the end of a period of no more than five years. Commercial and industrial loans typically are made on the basis of the borrower’s ability to make repayment from business cash flow. As a result, the ability of borrowers to repay commercial loans may be substantially dependent on the success of their businesses, and the collateral for commercial loans may depreciate over time and cannot be appraised with as much precision as real estate.
Loan Pricing. We price our loans under policies established as a part of our asset/liability management function. For larger loans, we use a pricing model developed by an outside vendor to reduce our exposure to interest rate risk on fixed and variable rate loans that have maturities of longer than three years. On December 31, 2010, approximately 62.3% of the total dollar amount of our loans accrued interest at variable rates.
Loan Administration and Underwriting. We make loans based, to a great extent, on our assessment of borrowers’ income, cash flow, net worth, sources of repayment and character. The principal risk associated with each of the categories of our loans is the creditworthiness of our borrowers, and our loans may be viewed as involving a higher degree of credit risk than is the case with some other types of loans, such as long-term residential mortgage loans, in which greater emphasis is placed on collateral values. To manage this risk, we have adopted written loan policies and procedures, and our loan portfolio is administered under a defined process. That process includes guidelines and standards for loan underwriting and risk assessment, and procedures for loan approvals, loan grading, ongoing identification and management of credit deterioration, and portfolio reviews to assess loss exposure and to test our compliance with our credit policies and procedures.
The loan underwriting standards we use include an evaluation of various factors, including a loan applicant’s income, cash flow, payment history on other debts, and ability to meet existing obligations and payments on the proposed loan. Although an applicant’s creditworthiness is a primary consideration in the loan approval process, our underwriting process for secured loans also includes analysis of the value of the proposed collateral in relation to the proposed loan amount. We consider the value of collateral, the degree of certainty of that value, the marketability of the collateral in the event of foreclosure or repossession, and the likelihood of depreciation in the collateral value.
Our Board of Directors has approved levels of lending authority for lending and credit personnel based on our aggregate credit exposure to a borrower. A loan that satisfies the Bank’s loan policies and is within a lending officer’s assigned authority may be approved by that officer alone. Loans involving aggregate credit exposures in excess of a lending officer’s authority may be approved by a Credit Policy Officer in our Loan Administration Department up to the amount of that officer’s authority. Above those amounts, a secured or unsecured loan involving an aggregate exposure to a single relationship of up to $2 million may be approved either by our Chief Executive Officer, Chief Operating Officer, Chief Revenue Officer, Chief Financial Officer or Chief Credit Officer, and a loan involving an aggregate exposure to a single relationship of up to $3 million may be approved by our General Loan Committee which consists of our Chief Executive Officer, Chief Operating Officer, Chief Revenue Officer, Chief Financial Officer and Chief Credit Officer. A loan that exceeds the approval authority of that Committee, and, notwithstanding the above credit authorities, any single loan in excess of $2 million, must be approved by the Executive Committee of our Board of Directors.
When a loan is made, our lending officer handling that loan assigns it a grade based on various underwriting and other criteria under our risk grading procedures. Any proposed loan that grades below a threshold set by our Board of Directors must be reviewed by a Credit Policy Officer before it can be made, even if the loan amount is within the loan
6
officer’s approval authority. The grades assigned to loans we make indicate the level of ongoing review and attention we will give to those loans to protect our position and reduce loss exposure.
After loans are made, they are reviewed by our Loan Administration personnel for adequacy of contract documentation, compliance with regulatory requirements, and documentation of compliance with our loan underwriting criteria. Also, our Credit Policy Officers conduct detailed reviews of selected loans based on various criteria, including loan type, amount, collateral, and borrower identity, and the particular lending officer’s or branch’s lending history. These reviews include at least 10% of the loans made by each lending officer. All loans involving an aggregate exposure of $2 million or more ultimately are reviewed after funding by the Executive Committee of our Board of Directors. Each loan involving an aggregate exposure of more than $350,000 is required to be reviewed at least annually by the lending officer who originated the loan, and those reviews are monitored by a Credit Policy Officer. Loan Administration personnel also periodically review various loans based on various criteria, and we retain the services of an independent credit risk management consultant to annually review our problem loans, a random sampling of performing loans related to our larger aggregate credit exposures, and selected other loans.
During the life of each loan, its grade is reviewed and validated or modified to reflect changes in circumstances and risk. We generally place a loan on a nonaccrual status when it becomes 90 days past due or whenever we believe collection of that loan has become doubtful. We charge off loans when the collection of principal and interest has become doubtful and the loans no longer can be considered sound collectible assets (or, in the case of unsecured loans, when they become 90 days past due).
Our Special Assets Manager, who reports directly to our Chief Credit Officer, monitors the overall performance of our loan portfolio, monitors the collection activities of our lending officers, and directly supervises collection actions that involve legal action or bankruptcies.
Allowance for Loan Losses. Our Board of Directors reviews all impaired loans at least quarterly, and our management reviews asset quality trends monthly. Based on these reviews and our current judgments about the credit quality of our loan portfolio and other relevant internal and external factors, we have established an allowance for loan losses. The adequacy of the allowance is assessed by our management monthly and reviewed by our Board of Directors each quarter. On December 31, 2010, our allowance was $13.2 million and amounted to 2.33% of our total loans and approximately 60% of our nonperforming loans.
On December 31, 2010, our nonperforming loans (consisting of non-accrual loans, loans past due greater than 90 days and still accruing interest, and restructured loans) amounted to approximately $22.1 million, and we had $4.5 million of other real estate owned and repossessed collateral acquired in settlement of loans on our books. (See Item 7 “Management’s Discussion and Analysis of Financial Condition and Results of Operations.”)
Deposit Activities
Our deposit services include business and individual checking accounts, NOW accounts, money market checking accounts, savings accounts and certificates of deposit. We monitor our competition in order to keep the rates paid on our deposits at a competitive level. On December 31, 2010, our time deposits of $100,000 or more amounted to approximately $92.9 million, or approximately 11.8% of our total deposits. We derive the majority of our deposits from within our banking market. However, we also accept deposits through deposit brokers and market our certificates of deposit by advertising our deposit rates on an Internet certificate of deposit network, and we generate a significant amount of out-of-market deposits in that manner. Although we accept these deposits primarily for liquidity purposes, we also use them to manage our interest rate risk. On December 31, 2010, our out-of-market deposits amounted to approximately $109.1 million, or approximately 13.9% of our total deposits and approximately 28.1% of our total certificates of deposit.
Statistical information about our deposit accounts is contained in Item 7 of this report under the caption “Management’s Discussion and Analysis of Financial Condition and Results of Operations.”
Investment Portfolio
On December 31, 2010, our investment portfolio totaled approximately $273.2 million and included municipal securities, corporate notes, mortgage-backed securities guaranteed by the Government National Mortgage Association or
7
issued by the Federal National Mortgage Corporation and Federal Home Loan Mortgage Corporation (including collateralized mortgage obligations), and securities issued by U.S. government-sponsored enterprises and agencies. We have classified all of our securities as “available-for-sale,” and we analyze their performance at least quarterly. Our securities have various interest rate features, maturity dates and call options.
Statistical information about our investment portfolio is contained in Item 7 of this report under the caption “Management’s Discussion and Analysis of Financial Condition and Results of Operations.”
Employees
On December 31, 2010, the Bank employed 233 full-time employees (including our executive officers), and 9 part-time employees. We have no separate employees of our own. The Bank is not party to any collective bargaining agreement with its employees, and we consider the Bank’s relations with its employees to be good.
Supervision and Regulation
Our business and operations are subject to extensive federal and state governmental regulation and supervision. The following is a summary of some of the basic statutes and regulations that apply to us. However, it is not a complete discussion of all the laws that affect our business, and it is qualified in its entirety by reference to the particular statutory or regulatory provision or proposal being described.
General. We are a bank holding company registered with the Federal Reserve Board (the “FRB”) under the Bank Holding Company Act of 1956, as amended (the “BHCA”). We are subject to supervision and examination by, and the regulations and reporting requirements of, the FRB. Under the BHCA, a bank holding company’s activities are limited to banking, managing or controlling banks, or engaging in other activities the FRB determines are closely related and a proper incident to banking or managing or controlling banks.
The BHCA prohibits a bank holding company from acquiring direct or indirect control of more than 5.0% of the outstanding voting stock, or substantially all of the assets, of any financial institution, or merging or consolidating with another bank holding company or savings bank holding company, without the FRB’s prior approval. Additionally, the BHCA generally prohibits bank holding companies from engaging in a nonbanking activity, or acquiring ownership or control of more than 5.0% of the outstanding voting stock of any company that engages in a nonbanking activity, unless that activity is determined by the FRB to be closely related and a proper incident to banking. In approving an application to engage in a nonbanking activity, the FRB must consider whether that activity can reasonably be expected to produce benefits to the public, such as greater convenience, increased competition, or gains in efficiency, that outweigh possible adverse effects, such as undue concentration of resources, decreased or unfair competition, conflicts of interest or unsound banking practices.
The law imposes a number of obligations and restrictions on a bank holding company and its insured bank subsidiaries designed to minimize potential losses to depositors and the FDIC insurance funds. For example, if a bank holding company’s insured bank subsidiary becomes “undercapitalized,” the bank holding company is required to guarantee the bank’s compliance (subject to certain limits) with the terms of any capital restoration plan filed with its federal banking agency. A bank holding company is required to serve as a source of financial strength to its bank subsidiaries and to commit resources to support those banks in circumstances in which, absent that policy, it might not do so. Under the BHCA, the FRB may require a bank holding company to terminate any activity or relinquish control of a nonbank subsidiary if the FRB determines that the activity or control constitutes a serious risk to the financial soundness and stability of a bank subsidiary of a bank holding company.
The Bank is a North Carolina-chartered bank. Its deposits are insured under the FDIC’s Deposit Insurance Fund, and it is subject to supervision and examination by, and the regulations and reporting requirements of, the FDIC and the North Carolina Commissioner of Banks (the “Commissioner”). The Bank is not a member of the Federal Reserve System.
As an insured bank, the Bank is prohibited from engaging as a principal in an activity that is not permitted for national banks unless (1) the FDIC determines that the activity would pose no significant risk to the deposit insurance fund and (2) the Bank is in compliance with applicable capital standards. Insured banks also are prohibited generally from directly acquiring or retaining any equity investment of a type or in an amount not permitted for national banks.
8
The Commissioner and the FDIC regulate all areas of the Bank’s business, including its payment of dividends and other aspects of its operations. They conduct regular examinations of the Bank, and the Bank must furnish periodic reports to the Commissioner and the FDIC containing detailed financial and other information about its affairs. The Commissioner and the FDIC have broad powers to enforce laws and regulations that apply to the Bank and to require corrective action of conditions that affect its safety and soundness. These powers include, among others, issuing cease and desist orders, imposing civil penalties, removing officers and directors, and otherwise intervening in the Bank’s operation and management if examinations of the Bank and the reports it files indicate the need to do so.
Under North Carolina banking laws, if a bank’s capital stock becomes impaired by losses or other causes, and the bank’s surplus and undivided profits are insufficient to make good the impairment, the Commissioner may require the bank to make the impairment good by an assessment upon the bank’s stockholders (or on its sole stockholder in the case of a bank owned by a bank holding company). If any stockholder does not pay the assessment, the bank’s board of directors must sell a sufficient amount of the bank’s stock held by that stockholder at public auction to make good the assessment on that stockholder.
The Bank’s business also is influenced by prevailing economic conditions and governmental policies, both foreign and domestic, and by the monetary and fiscal policies of the FRB. The Bank is not a member of the Federal Reserve System. However, under the FRB’s regulations, all FDIC-insured banks must maintain average daily reserves against their transaction accounts. Currently, no reserves are required on the first $10.7 million of transaction accounts, but a bank must maintain reserves equal to 3.0% on aggregate balances between $10.7 million and $58.8 million, and reserves equal to 10.0% on aggregate balances in excess of $58.8 million. The FRB may adjust these percentages from time to time. Because the Bank’s reserves must be maintained in the form of vault cash or in an account at a Federal Reserve Bank or with a qualified correspondent bank, one effect of the reserve requirement is to reduce the amount of the Bank’s assets that are available for lending and other investment activities. The FRB’s actions and policy directives determine to a significant degree the cost and availability of funds the Bank obtains from money market sources for lending and investing, and they also influence, directly and indirectly, the rates of interest the Bank pays on its time and savings deposits and the rates it charges on commercial bank loans.
Gramm-Leach-Bliley Act. Various federal laws governing the banking industry, as well as the securities and insurance industries, were changed during 1999 with the enactment of the Gramm-Leach-Bliley Act (the “GLB Act”). It permitted bank holding companies to become “financial holding companies” and, in general (1) expanded opportunities to affiliate with securities firms and insurance companies; (2) overrode certain state laws that would prohibit certain banking and insurance affiliations; (3) expanded the activities in which banks and bank holding companies may participate; (4) required that banks and bank holding companies engage in some activities only through affiliates owned or managed in accordance with specified requirements; and (5) reorganized responsibility among various federal regulators for oversight of certain securities activities conducted by banks and bank holding companies.
The GLB Act expanded opportunities for us and the Bank to provide other services and obtain other revenues. However, this expanded authority also presents challenges as our larger competitors are able to expand their services and products into areas that are not feasible for smaller, community oriented financial institutions. To date we have not elected to become a “financial holding company.”
Dodd-Frank Act. During 2010, the bank regulatory landscape was again dramatically changed by the Dodd-Frank Wall Street Reform and Consumer Protection Act (the “Dodd-Frank Act”) which was enacted on July 21, 2010 and which implements far-reaching regulatory reform. Among its many significant provisions, the Dodd-Frank Act:
| · | established the Financial Stability Oversight Counsel made up of the heads of the various bank regulatory and other agencies to identify and respond to risks to U.S. financial stability arising from ongoing activities of large financial companies; |
| · | established centralized responsibility for consumer financial protection by creating a new Consumer Financial Protection Bureau which will be responsible for implementing, examining and enforcing compliance with federal consumer financial laws with respect to financial institutions with over $10 billion in assets; |
| · | required that banking agencies establish for most bank holding companies the same leverage and risk-based capital requirements as apply to insured depository institutions, and that bank holding companies and banks be well-capitalized and well managed in order to acquire banks located outside their home states; and, prohibits bank |
9
| holding companies from including new trust preferred securities in their Tier 1 capital and, beginning with a three-year phase-in period on January 1, 2013, requires bank holding companies with assets over $15 billion to deduct existing trust preferred securities from their Tier 1 capital; |
| · | required the FDIC to set a minimum DIF reserve ratio of 1.35% and that the DIF reserve ratio be increased to that level by September 30, 2020, off-set the effect of the higher minimum ratio on insured depository institutions with assets of less than $10 billion, and change the assessment base used for calculating insurance assessments from the amount of insured deposits to average consolidated total assets minus average tangible equity; |
| · | established a permanent $250,000 limit for federal deposit insurance; provided separate, unlimited federal deposit insurance until December 31, 2012 for noninterest-bearing demand transaction accounts, and repealed the federal prohibition on the payment of interest on certain demand deposits, thereby permitting depository institutions to pay interest on business transaction and other accounts; |
| · | amended the Electronic Fund Transfer Act to, among other things, give the Federal Reserve the authority to establish rules regarding interchange fees charged for electronic debit transactions by payment card issuers having assets over $10 billion and to enforce a new statutory requirement that those fees be reasonable and proportional to the actual cost of a transaction to the issuer; and |
| · | required implementation of various corporate governance processes affecting areas such as executive compensation and proxy access by shareholders; |
Many provisions of the Dodd-Frank Act are subject to rulemaking by bank regulatory agencies and the Securities and Exchange Commission and will take effect over time, making it difficult to anticipate the overall financial impact on financial institutions and consumers. However, many provisions in the Act (including those permitting the payment of interest on demand deposits and restricting interchange fees) are likely to increase expenses and reduce revenues for all financial institutions.
Restrictions on Payment of Dividends. Under North Carolina law, we are authorized to pay dividends as declared by our Board of Directors, provided that no such distribution results in our insolvency on a going concern or balance sheet basis. However, although we are a legal entity separate and distinct from the Bank, our principal source of funds with which we can pay dividends to our shareholders and our separate expenses is dividends we receive from the Bank. For that reason, our ability to pay dividends effectively is subject to the same limitations that apply to the Bank.
In general, the Bank may pay dividends only from its undivided profits. However, if its surplus is less than 50% of its paid-in capital stock, the Bank’s directors may not declare any cash dividend until it has transferred to surplus 25% of its undivided profits or any lesser percentage necessary to raise its surplus to an amount equal to 50% of its paid-in capital stock.
Federal law prohibits the Bank from making any capital distributions, including paying a cash dividend, if it is, or after making the distribution it would become, “undercapitalized” as that term is defined in the Federal Deposit Insurance Act (the “FDIA”). Also, if in the FDIC’s opinion an insured bank under its jurisdiction is engaged in or is about to engage in an unsafe or unsound practice, the FDIC may require, after notice and hearing, that the bank cease and desist from that practice. The FDIC has indicated that paying dividends that deplete a bank’s capital base to an inadequate level would be an unsafe and unsound banking practice. (See “—Prompt Corrective Action” below.) The FDIC has issued policy statements which provide that insured banks generally should pay dividends only out of their current operating earnings. Also, under the FDIA no dividend may be paid by an FDIC-insured bank while it is in default on any assessment due the FDIC. The Bank’s payment of dividends also may be affected or limited by other factors, such as events or circumstances that lead the FDIC to require the Bank to maintain its capital above regulatory guidelines.
In the future, our ability to declare and pay cash dividends will be subject to our Board of Directors’ evaluation of our operating results, capital levels, financial condition, future growth plans, general business and economic conditions, and other relevant considerations. See “—U.S. Treasury’s TARP Capital Purchase Program” below for a discussion of additional restrictions on our ability to pay dividends.
Capital Adequacy. We and the Bank are required to comply with the FRB’s and FDIC’s capital adequacy standards for bank holding companies and insured banks. The FRB and FDIC have issued risk-based capital and leverage capital
10
guidelines for measuring capital adequacy, and all applicable capital standards must be satisfied for us or the Bank to be considered in compliance with regulatory capital requirements.
Under the risk-based capital guidelines, the minimum ratio (“Total Capital Ratio”) of an entity’s total capital (“Total Capital”) to its risk-weighted assets (including certain off-balance-sheet items, such as standby letters of credit) is 8.0%. At least half of Total Capital must be composed of “Tier 1 Capital.” Tier 1 Capital includes common equity, undivided profits, minority interests in the equity accounts of consolidated subsidiaries, qualifying noncumulative perpetual preferred stock, and a limited amount of cumulative perpetual preferred stock, less goodwill and certain other intangible assets. The remaining Total Capital may consist of “Tier 2 Capital” which includes certain subordinated debt, certain hybrid capital instruments and other qualifying preferred stock, and a limited amount of loan loss reserves. A bank or bank holding company that does not satisfy minimum capital requirements may be required to adopt and implement a plan acceptable to its federal banking regulator to achieve an adequate level of capital.
Under the leverage capital measure, the minimum ratio (the “Leverage Capital Ratio”) of Tier 1 Capital to average assets, less goodwill and various other intangible assets, is 3.0% for entities that meet specified criteria, including having the highest regulatory rating. All other entities generally are required to maintain an additional cushion of 100 to 200 basis points above the stated minimum. The guidelines also provide that banks experiencing internal growth or making acquisitions will be expected to maintain strong capital positions substantially above the minimum levels without significant reliance on intangible assets. A bank’s “Tangible Leverage Ratio” (deducting all intangibles) and other indicators of capital strength also will be taken into consideration by banking regulators in evaluating proposals for expansion or new activities.
The FRB and the FDIC also consider interest rate risk (when the interest rate sensitivity of an institution’s assets does not match the sensitivity of its liabilities or its off-balance-sheet position) in evaluating capital adequacy. Banks with excessive interest rate risk exposure must hold additional amounts of capital against their exposure to losses resulting from that risk. The regulators also require banks to incorporate market risk components into their risk-based capital. Under these market risk requirements, capital is allocated to support the amount of market risk related to a bank’s trading activities.
The following table lists our consolidated regulatory capital ratios, and the Bank’s separate regulatory capital ratios, at December 31, 2010. On that date, our capital ratios were at levels to qualify us as “well capitalized.”
| Minimum Required Ratios |
Required to be “Well Capitalized” |
Our Consolidated Capital Ratios |
The Bank’s Capital Ratios |
|||||||||||||
| Leverage Capital Ratio (Tier 1 Capital to average assets) |
3.0 | % | 5.0 | % | 8.66 | % | 8.66 | % | ||||||||
| Risk-based capital ratios: |
||||||||||||||||
| Tier 1 Capital Ratio (Tier 1 Capital to risk-weighted assets) |
4.0 | % | 6.0 | % | 12.08 | % | 12.08 | % | ||||||||
| Total Capital Ratio (Total Capital to risk-weighted assets) |
8.0 | % | 10.0 | % | 13.34 | % | 13.34 | % | ||||||||
Our capital categories are determined only for the purpose of applying the “prompt corrective action” rules described below which have been adopted by the various federal banking regulators, and they do not necessarily constitute an accurate representation of overall financial condition or prospects for other purposes. A failure to meet capital guidelines could subject us to a variety of enforcement remedies under those rules, including issuance of a capital directive, termination of FDIC deposit insurance, a prohibition on taking brokered deposits, and other restrictions on our business. As described below, substantial additional restrictions can be imposed on banks that fail to meet applicable capital requirements. (See “—Prompt Corrective Action” below.)
Prompt Corrective Action. Federal law establishes a system of prompt corrective action to resolve the problems of undercapitalized banks. Under this system, the FDIC has established five capital categories (“well capitalized,” “adequately capitalized,” “undercapitalized,” “significantly undercapitalized,” and “critically undercapitalized”) and it is required to take various mandatory supervisory actions, and is authorized to take other discretionary actions, with respect to banks in the three undercapitalized categories. The severity of any actions taken will depend on the capital category in
11
which a bank is placed. Generally, subject to a narrow exception, current federal law requires the FDIC to appoint a receiver or conservator for a bank that is critically undercapitalized.
Under the FDIC’s rules implementing the prompt corrective action provisions, an insured, state-chartered bank that (1) has a Total Capital Ratio of 10.0% or greater, a Tier 1 Capital Ratio of 6.0% or greater, and a Leverage Ratio of 5.0% or greater, and (2) is not subject to any written agreement, order, capital directive, or prompt corrective action directive issued by the FDIC, is considered “well capitalized.” A bank with a Total Capital Ratio of 8.0% or greater, a Tier 1 Capital Ratio of 4.0% or greater, and a Leverage Ratio of 4.0% or greater, is considered “adequately capitalized.” A bank that has a Total Capital Ratio of less than 8.0%, a Tier 1 Capital Ratio of less than 4.0%, or a Leverage Ratio of less than 4.0%, is considered “undercapitalized.” A bank that has a Total Capital Ratio of less than 6.0%, a Tier 1 Capital Ratio of less than 3.0%, or a Leverage Ratio of less than 3.0%, is considered “significantly undercapitalized,” and a bank that has a tangible equity capital to assets ratio equal to or less than 2.0% is considered “critically undercapitalized.” For purposes of these rules, the term “tangible equity” includes core capital elements counted as Tier 1 Capital for purposes of the risk-based capital standards (see “—Capital Adequacy” above), plus the amount of outstanding cumulative perpetual preferred stock (including related surplus), minus all intangible assets (with various exceptions). A bank may be deemed to be in a lower capitalization category than indicated by its actual capital position if it receives an unsatisfactory examination rating.
A bank categorized as “undercapitalized,” “significantly undercapitalized,” or “critically undercapitalized” is required to submit an acceptable capital restoration plan to the FDIC. An “undercapitalized” bank also is generally prohibited from increasing its average total assets, making acquisitions, establishing new branches, or engaging in new lines of business, other than in accordance with an accepted capital restoration plan or with the FDIC’s approval. Also, the FDIC may treat an “undercapitalized” bank as being “significantly undercapitalized” if it determines that is necessary to carry out the purpose of the law. On December 31, 2010, our capital ratios were at levels to qualify us as “well capitalized.”
Federal Deposit Insurance and Assessments. The Bank’s deposits are insured by the FDIC to the full extent provided in the Federal Deposit Insurance Act (the “FDIA”), and the Bank pays assessments to the FDIC for that insurance coverage. The Dodd-Frank Act established a permanent $250,000 limit for federal deposit insurance coverage and provided separate, unlimited federal deposit insurance until December 31, 2012 for noninterest-bearing demand transaction accounts. The FDIC may terminate a bank’s deposit insurance if it finds that the bank has engaged in unsafe and unsound practices, is in an unsafe or unsound condition to continue operations, or has violated applicable laws, regulations, rules or orders.
Under the FDIA, the FDIC uses a revised risk-based assessment system to determine the amount of the Bank’s deposit insurance assessment based on an evaluation of the probability that its Deposit Insurance Fund (the “DIF”) will incur a loss with respect to the Bank. That evaluation takes into consideration risks attributable to different categories and concentrations of the Bank’s assets and liabilities and any other factors the FDIC considers to be relevant, including information obtained from the Commissioner. A higher assessment rate results in an increase in the assessments paid by the Bank to the FDIC for deposit insurance
The FDIC is responsible for maintaining the adequacy of the DIF, and the amount the Bank pays for deposit insurance is influenced not only by an assessment of the risk it poses to the DIF, but also by the adequacy of the insurance fund at any time to cover the risk posed by all insured institutions. Because the DIF reserve ratio had fallen below the minimum level required by law, during 2008 the FDIC adopted a restoration plan to return the reserve ratio to the minimum level and, during 2009, it imposed a special assessment on insured institutions, increased regular assessment rates, and required that insured institutions prepay their regular quarterly assessments through 2012. More recently, as required by the Dodd-Frank Act, the FDIC has increased the minimum DIF reserve ratio to 1.35% which must be achieved by September 30, 2020. Although the Dodd-Frank Act requires the FDIC to off-set the effect of the higher minimum ratio on insured depository institutions with assets of less than $10 billion, FDIC insurance assessments could be increased substantially in the future if the FDIC finds such an increase to be necessary in order to adequately maintain the insurance fund.
12
Restrictions on Transactions with Affiliates. The Bank is subject to the provisions of Sections 23A and 23B of the Federal Reserve Act which restrict certain transactions between a bank and its “affiliates,” including its bank holding company. Among other things, Section 23A limits the amount:
| · | a bank’s loans or extensions of credit to, or investment in, its affiliates; |
| · | assets a bank may purchase from affiliates, except for real and personal property exempted by the FRB; |
| · | the amount of a bank’s loans or extensions of credit to third parties collateralized by securities or obligations of the bank’s affiliates; and |
| · | a bank’s issuance of a guarantee, acceptance or letter of credit for its affiliates. |
The total amount of these transactions is limited in amount, as to any one affiliate, to 10% of a bank’s capital and surplus and, as to all affiliates, to 20% of a bank’s capital and surplus. In addition to the amount limitations, each of the above transactions must also meet specified collateral requirements. The Bank also must comply with other provisions under Section 23A that are designed to avoid the taking of low-quality assets from an affiliate.
Section 23B, among other things, prohibits a bank or its subsidiaries generally from engaging in transactions with its affiliates unless those transactions are on terms substantially the same, or at least as favorable to the bank or its subsidiaries, as would apply in comparable transactions with nonaffiliated companies.
Federal law also restricts the Bank’s ability to extend credit to its and our executive officers, directors, principal shareholders and their related interests. These credit extensions:
| · | must be made on substantially the same terms, including interest rates and collateral, as those prevailing at the time for comparable transactions with unrelated third parties, and |
| · | must not involve more than the normal risk of repayment or present other unfavorable features. |
Community Reinvestment. Under the Community Reinvestment Act (the “CRA”), an insured bank has a continuing and affirmative obligation, consistent with its safe and sound operation, to help meet the credit needs of its entire community, including low and moderate income neighborhoods. The CRA does not establish specific lending requirements or programs for banks, nor does it limit a bank’s discretion to develop, consistent with the CRA, the types of products and services it believes are best suited to its particular community. The CRA requires the federal banking regulators, in their examinations of insured banks, to assess the banks’ records of meeting the credit needs of their communities, using the ratings of “outstanding,” “satisfactory,” “needs to improve,” or “substantial noncompliance,” and to take that record into account in its evaluation of various applications by those banks. All banks are required to make public disclosure of their CRA performance ratings. We received a “satisfactory” rating in our last CRA examination during 2009.
USA Patriot Act of 2001. The USA Patriot Act of 2001 was enacted in response to the terrorist attacks that occurred in the United States on September 11, 2001. The Act strengthened the ability of U.S. law enforcement and the intelligence community to work cohesively to combat terrorism on a variety of fronts. The Act’s impact on all financial institutions has been significant and wide ranging. The Act contains sweeping anti-money laundering and financial transparency requirements and imposes various other regulatory requirements, including standards for verifying customer identification at account opening, and rules promoting cooperation among financial institutions, regulators and law enforcement agencies in identifying parties that may be involved in terrorism or money laundering.
Sarbanes-Oxley Act of 2002. The Sarbanes-Oxley Act of 2002 became effective on July 30, 2002. In general, it mandated important new corporate governance and financial reporting requirements intended to enhance the accuracy and transparency of public companies’ reported financial results. It established new responsibilities for corporate chief executive officers, chief financial officers and audit committees in the financial reporting process, and it created a new regulatory body to oversee auditors of public companies. It enhanced these requirements with new SEC enforcement tools, new criminal penalties for federal mail, wire and securities fraud, and new criminal penalties for document and record destruction in connection with federal investigations. It also lengthened the statute of limitations for securities fraud claims and providing new corporate whistleblower protection.
13
In response to the Act, the various securities exchanges adopted listing standards that require listed companies to comply with various corporate governance requirements, including the requirement that (1) audit committees include only directors who are “independent” as defined by the SEC’s and Exchanges’ rules, and (2) actions on various other matters (including executive compensation and director nominations) be approved, or recommended for approval, by issuers’ full boards of directors or by committees that include only “independent” directors. Because our common stock is listed on the NASDAQ Global Market, we are subject to those requirements.
The economic and operational effects of the Sarbanes-Oxley Act on public companies, including us, have been significant in terms of the time, resources and costs associated with compliance. Because the Act, for the most part, applies equally to larger and smaller public companies, we will continue to be presented with additional challenges as a smaller, community-oriented financial institution seeking to compete with larger financial institutions in our markets.
U.S. Treasury’s Troubled Asset Relief Program (TARP) Capital Purchase Program. On January 16, 2009, we issued Series A Preferred Stock in the amount of $17,949,000 and a warrant to purchase 144,984 shares of our common stock to the U.S. Treasury as a participant in the TARP Capital Purchase Program. The Series A Preferred Stock qualifies as Tier 1 capital for purposes of regulatory capital requirements and calls for cumulative dividends at a rate of 5% per annum for the first five years and 9% per annum thereafter. Prior to January 16, 2012, unless we have redeemed all of this preferred stock or the U.S. Treasury has transferred all of this preferred stock to a third party, the consent of the U.S. Treasury will be required for us to, among other things, increase our common stock dividend above a quarterly rate of $0.1825 per share or repurchase our common stock except in limited circumstances. In addition, until the U.S. Treasury ceases to own our securities sold under the TARP Capital Purchase Program, the compensation arrangements for our senior executive officers must comply in all respects with the U.S. Emergency Economic Stabilization Act of 2008, as amended by the American Recovery and Reinvestment Act of 2009, and the rules and regulations thereunder.
Available Information
Copies of reports we file electronically with the Securities and Exchange Commission, including copies of our Annual Reports on Form 10-K, Quarterly Reports on Form 10-Q, and Current Reports on Form 8-K, and amendments to those reports, are available free of charge through our Internet website as soon as reasonably practicable after they are filed. Our website address is www.myecb.com. These filings also are accessible on the SEC’s website at www.sec.gov.
14
Item 1A. Risk Factors
RISK FACTORS
The following paragraphs describe material risks that could affect our business. Other risks and uncertainties not presently known to us or that we currently deem immaterial also may impair our business operations. If any of the following risks actually occur, our business, results of operations and financial condition could suffer. The risks discussed below also include forward-looking statements, and our actual results may differ materially from those discussed in these forward-looking statements.
Risks Relating to our Business
| · | Difficult market conditions and economic trends have adversely affected our industry and our business. |
Dramatic declines in the housing market, with decreasing home prices and increasing delinquencies and foreclosures, have negatively impacted the credit performance of mortgage and construction loans and resulted in significant write-downs of assets by many financial institutions. In addition, the values of other real estate collateral supporting many loans have declined and may continue to decline. General downward economic trends, reduced availability of commercial credit and increasing unemployment have negatively impacted the credit performance of commercial and consumer credit, resulting in additional write-downs. Concerns over the stability of the financial markets and the economy have resulted in decreased lending by financial institutions to their customers and to each other. This market turmoil and tightening of credit has led to increased commercial and consumer loan delinquencies, lack of customer confidence, increased market volatility and widespread reduction in general business activity. Competition among depository institutions for deposits has increased significantly. Financial institutions have experienced decreased access to capital and to deposits or borrowings.
The resulting economic pressure on consumers and businesses and the lack of confidence in the financial markets has adversely affected most businesses and the prices of securities in general, and financial institutions in particular, and it will continue to adversely affect our business, financial condition, results of operations and stock price.
Our ability to assess the creditworthiness of customers and to estimate the losses inherent in our credit exposure is made more complex by these difficult market and economic conditions. As a result of the foregoing factors, there is a potential for new federal or state laws and regulations regarding lending and funding practices and liquidity standards, and bank regulatory agencies have been aggressive in responding to concerns and trends identified in examinations. This increased government action may increase our costs and limit our ability to pursue certain business opportunities. We also may be required to pay even higher Federal Deposit Insurance Corporation (“FDIC”) premiums than the recently increased level, because financial institution failures resulting from the depressed market conditions have depleted and may continue to deplete the deposit insurance fund and reduce its ratio of reserves to insured deposits.
We do not believe these difficult conditions are likely to improve in the near future. A worsening of these conditions would likely exacerbate the adverse effects of these difficult market and economic conditions on us, our customers and the other financial institutions in our market. As a result, we may experience increases in foreclosures, delinquencies and customer bankruptcies, as well as more restricted access to funds.
| · | Current levels of market volatility are unprecedented. |
The capital and credit markets have experienced volatility and disruption for more than a year, producing downward pressure on stock prices and credit availability for many issuers without regard to their underlying financial strength. This has been particularly the case with respect to financial institutions, and the market prices of the stocks of financial services companies in general, including ours, are at their lowest levels in recent history. If current levels of market disruption and volatility continue or worsen, there can be no assurance that we will not experience an adverse effect, which may be material, on our ability to access capital and on our business, financial condition and results of operations.
15
| · | Our allowance for loan losses may prove to be insufficient to absorb probable losses in our loan portfolio. |
Lending money is a substantial part of our business. Every loan carries a degree of risk that it will not be repaid in accordance with its terms or that any underlying collateral will not be sufficient to assure repayment. This risk is affected by, among other things:
| · | cash flow of the borrower and/or a business activity being financed; |
| · | in the case of a collateralized loan, changes in and uncertainties regarding future values of collateral; |
| · | the credit history of a particular borrower; |
| · | changes in economic and industry conditions; and |
| · | the duration of the loan. |
We use underwriting procedures and criteria that we believe minimize the risk of loan delinquencies and losses, but banks routinely incur losses in their loan portfolios. Regardless of the underwriting criteria we use, we will experience loan losses from time to time in the ordinary course of our business, and many of those losses will result from factors beyond our control. These factors include, among other things, changes in market, economic, business or personal conditions, or other events (including changes in market interest rates), that affect our borrowers’ abilities to repay their loans and the value of properties that collateralize loans.
As a result of recent difficulties in the national economy and housing market, declining real estate values, rising unemployment, and loss of consumer confidence, we and most other financial institutions have experienced increasing levels of non-performing loans, foreclosures and loan losses. We maintain an allowance for loan losses which we believe is appropriate to provide for potential losses in our loan portfolio. The amount of our allowance is determined by our management through a periodic review and consideration of internal and external factors that affect loan collectibility, including, but not limited to:
| · | an ongoing review of the quality, size and diversity of the loan portfolio; |
| · | evaluation of non-performing loans; |
| · | historical default and loss experience; |
| · | historical recovery experience; |
| · | existing economic conditions; |
| · | risk characteristics of various classifications of loans; and |
| · | the amount and quality of collateral, including guarantees, securing the loans. |
However, if delinquency levels continue to increase or we continue to incur higher than expected loan losses in the future, there is no assurance that our allowance will be adequate to cover resulting losses or that we will not have to make significant provisions to our allowance.
| · | A large percentage of our loans are secured by real estate. Adverse conditions in the real estate market in our banking markets have adversely affected our loan portfolio. |
While we do not have a sub-prime lending program, a relatively large percentage of our loans are secured by real estate. Our management believes that, in the case of many of those loans, the real estate collateral is not being relied upon as the primary source of repayment, and the level of our real estate loans reflects, at least in part, our policy to take real estate whenever possible as primary or additional collateral rather than other types of collateral. However, adverse conditions in the real estate market and the economy in general have decreased real estate values in our banking markets. If the value of our collateral for a loan falls below the outstanding balance of that loan, our ability to collect the balance of the loan by selling the underlying real estate in the event of a default will be diminished, and we would be more likely to suffer a loss on the loan. An increase in our loan losses could have a material adverse effect on our operating results and financial condition.
16
The FDIC recently adopted rules aimed at placing additional monitoring and management controls on financial institutions whose loan portfolios are deemed to have concentrations in commercial real estate (“CRE”). At December 31, 2010, our loan portfolio exceeded thresholds established by the FDIC for CRE concentrations and for additional regulatory scrutiny. Indications from regulators are that strict limitations on the amount or percentage of CRE within any given portfolio are not expected, but, rather, that additional reporting and analysis will be required to document management’s evaluation of the potential additional risks of such concentrations and the impact of any mitigating factors. It is possible that regulatory constraints associated with these rules could adversely affect our ability to grow loan assets and thereby limit our overall growth and expansion plans. These rules also could increase the costs of monitoring and managing this component of our loan portfolio. Either of these eventualities could have an adverse impact on our operating results and financial condition.
| · | Liquidity risk could impair our ability to fund operations and jeopardize our financial condition. |
Liquidity is essential to our business. An inability to raise funds through deposits, borrowings, the sale of loans and other sources could have a substantial negative effect on our liquidity. Our access to funding sources in amounts adequate to finance our activities, or on terms which are acceptable to us, could be impaired by factors that affect us specifically or the financial services industry or economy in general. Factors that could detrimentally affect our access to liquidity sources include a decrease in the level of our business activity as a result of a downturn in the markets in which our loans are concentrated or adverse regulatory action against us. Our ability to borrow could also be impaired by factors that are not specific to us, such as the current disruption in the financial markets or negative views and expectations about the prospects for the financial services industry in light of the recent turmoil faced by banking organizations and the continued deterioration in credit markets.
Among other sources of funds, we rely heavily on deposits, including out-of-market certificates of deposit, for funds to make loans and provide for our other liquidity needs. Those out-of-market deposits may not be as stable as other types of deposits and, in the future, depositors may not renew those time deposits when they mature, or we may have to pay a higher rate of interest to attract or keep them or to replace them with other deposits or with funds from other sources. Not being able to attract those deposits, or to keep or replace them as they mature, would adversely affect our liquidity. Paying higher deposit rates to attract, keep or replace those deposits could have a negative effect on our interest margin and operating results.
| · | We may need to raise additional capital in the future in order to continue to grow, but that capital may not be available when it is needed. |
Federal and state banking regulators require us to maintain adequate levels of capital to support our operations. In addition, in the future we may need to raise additional capital to support our business or to finance acquisitions, if any, or we may otherwise elect or be required to raise additional capital. In that regard, recently a number of financial institutions have sought to raise considerable amounts of additional capital in response to a deterioration in their results of operations and financial condition arising from increases in their non-performing loans and loan losses, deteriorating economic conditions, declines in real estate values and other factors. On December 31, 2010, our three capital ratios were above “well capitalized” levels under bank regulatory guidelines. However, growth in our earning assets resulting from internal expansion and new branch offices, at rates in excess of the rate at which our capital is increased through retained earnings, will reduce our capital ratios unless we continue to increase our capital. Also, future unexpected losses, whether resulting from loan losses or other causes, would reduce our capital.
Should we need, or be required by regulatory authorities, to raise additional capital, we may seek to do so through the issuance of, among other things, our common stock or preferred stock. However, our ability to raise that additional capital will depend on conditions at that time in the capital markets, economic conditions, our financial performance and condition, and other factors, many of which are outside our control. There is no assurance that, if needed, we will be able to raise additional capital on terms favorable to us or at all. Our inability to raise additional capital, if needed, on terms acceptable to us, may have a material adverse effect on our ability to expand our operations, and on our financial condition, results of operations and future prospects.
17
| · | If we are unable to redeem our Series A Preferred Stock after five years, the cost of this capital to us will increase substantially. |
If we are unable to redeem the Series A Preferred Stock we have sold to Treasury prior to January 16, 2014, the cost of this capital to us will increase from 5.0% per annum (approximately $897,450 annually) to 9.0% per annum (approximately $1,615,410 annually). Depending on our financial condition at the time, this increase in the annual dividend rate on the Series A Preferred Stock could have a material negative effect on our liquidity and on our net income available to holders of our common stock.
| · | Our profitability is subject to interest rate risk. Changes in interest rates could have an adverse effect on our operating results. |
Our profitability depends, to a large extent, on our net interest income, which is the difference between our income on interest-earning assets and our expense on interest-bearing deposits and other liabilities. In other words, to be profitable, we have to earn more interest on our loans and investments than we pay on our deposits and borrowings. Like most financial institutions, we are affected by changes in general interest rate levels and by other economic factors beyond our control. Interest rate risk arises in part from the mismatch (i.e., the interest sensitivity “gap”) between the dollar amounts of repricing or maturing interest-earning assets and interest-bearing liabilities, and is measured in terms of the ratio of the interest rate sensitivity gap to total assets. When more interest-earning assets than interest-bearing liabilities will reprice or mature over a given time period, a bank is considered asset-sensitive and has a positive gap. When more liabilities than assets will reprice or mature over a given time period, a bank is considered liability-sensitive and has a negative gap. A liability-sensitive position (i.e., a negative gap) may generally enhance net interest income in a falling interest rate environment and reduce net interest income in a rising interest rate environment. An asset-sensitive position (i.e., a positive gap) may generally enhance net interest income in a rising interest rate environment and reduce net interest income in a falling interest rate environment. Our ability to manage our gap position determines to a great extent our ability to operate profitably. However, fluctuations in interest rates are not predictable or controllable, and recent economic and financial market conditions have made it extremely difficult to manage our gap position. Our profitability and results of operations will be adversely affected if we do not successfully manage our interest sensitivity gap.
On December 31, 2010, we had a negative one-year cumulative interest sensitivity gap, which means that, during a one-year period, our interest-bearing liabilities generally would be expected to reprice at a faster rate than our interest-earning assets. A rising rate environment within that one-year period generally would have a negative effect on our earnings, while a falling rate environment generally would have a positive effect on our earnings.
| · | Our long-range business strategy includes the continuation of our growth plans, and our financial condition and operating results could be negatively affected if we fail to grow or fail to manage our growth effectively. |
Subject to market conditions and the economy, we intend to continue to grow in our existing banking markets (internally and through additional offices) and to expand into new markets as appropriate opportunities arise. We have opened ten de novo branch offices since 2000. Consistent with our business strategy, and to sustain our growth, in the future we may establish other de novo branches or acquire other financial institutions or their branch offices.
There are considerable costs involved in opening branches, and new branches generally do not generate sufficient revenues to offset their costs until they have been in operation for some period of time. Any new branches we open can be expected to negatively affect our operating results until those branches reach a size at which they become profitable. In establishing new branches in new markets, we compete against other banks with greater knowledge of those local markets and may need to hire and rely on local managers who have local affiliations and to whom we may need to give significant autonomy. If we grow but fail to manage our growth effectively, there could be material adverse effects on our business, future prospects, financial condition or operating results, and we may not be able to successfully implement our business strategy. On the other hand, our operating results also could be materially affected in an adverse way if our growth occurs more slowly than anticipated, or declines.
Although we believe we have management resources and internal systems in place to successfully manage our future growth, we cannot assure you that we will be able to expand our market presence in our existing markets or successfully enter new markets, or that expansion will not adversely affect our operating results.
18
| · | Our business depends on the condition of the local and regional economies where we operate. |
We currently have offices only in eastern North Carolina. Consistent with our community banking philosophy, a majority of our customers are located in and do business in that region, and we lend a substantial portion of our capital and deposits to commercial and consumer borrowers in our local banking markets. Therefore, our local and regional economy has a direct impact on our ability to generate deposits to support loan growth, the demand for loans, the ability of borrowers to repay loans, the value of collateral securing our loans (particularly loans secured by real estate), and our ability to collect, liquidate and restructure problem loans. The local economies of the coastal communities in our banking markets are heavily dependent on the tourism industry. If our local communities are adversely affected by current conditions in the national economy or by other specific events or trends, including a significant decline in the tourism industry in our coastal communities, there could be a direct adverse effect on our operating results. Adverse economic conditions in our banking markets could reduce our growth rate, affect the ability of our customers to repay their loans to us, and generally affect our financial condition and operating results. We are less able than larger institutions to spread risks of unfavorable local economic conditions across a large number of diversified economies.
The economy of North Carolina’s coastal region can be affected by adverse weather events, particularly hurricanes. Our banking markets lie primarily in coastal communities, and we cannot predict whether or to what extent damage caused by future hurricanes will affect our operations, our customers or the economies in our banking markets. However, weather events could cause a decline in loan originations, destruction or decline in the value of properties securing our loans, or an increase in the risks of delinquencies, foreclosures and loan losses.
| · | New or changes in existing tax, accounting, and regulatory rules and interpretations could have an adverse effect on our strategic initiatives, results of operations, cash flows, and financial condition. |
We operate in a highly regulated industry and are subject to examination, supervision and comprehensive regulation by various federal and state agencies. Federal and state banking regulations are designed primarily to protect the deposit insurance funds and consumers, not to benefit a financial company’s shareholders. These regulations may sometimes impose significant limitations on our operations, and our compliance with regulations is costly and restricts certain of our activities, including payment of dividends, mergers and acquisitions, investments, loans and interest rates charged, interest rates paid on deposits, and locations of offices.
The significant federal and state banking regulations that affect us are described under “Item 1. Business—Supervision and Regulation.” These regulations, along with the currently existing tax, accounting, securities, insurance, and monetary laws, regulations, rules, standards, policies, and interpretations, control the methods by which financial institutions conduct business, implement strategic initiatives and tax compliance, and govern financial reporting and disclosures. The laws, regulations, rules, standards, policies, and interpretations are constantly evolving and may change significantly over time. As a result of recent turmoil in the financial services industry, during 2010 Congress enacted the Dodd-Frank Act which implements far-reaching regulatory reform dramatically changed the bank regulatory landscape. Many aspects of the Dodd-Frank Act are subject to rulemaking and will take effect over time, making it difficult to anticipate the overall financial impact on financial institutions and consumers. However, various provisions of the Act likely will reduce the revenues and increase the expenses of all financial institutions, and those provisions could have an adverse affect on our operating results.
| · | Significant legal actions could subject us to substantial liabilities. |
We are from time to time subject to claims related to our operations. These claims and legal actions, including supervisory actions by our regulators, could involve large monetary claims and significant defense costs. As a result, we may be exposed to substantial liabilities, which could adversely affect our results of operations and financial condition.
Among the laws that apply to us, the USA Patriot and Bank Secrecy Acts require financial institutions to develop programs to prevent financial institutions from being used for money laundering and terrorist activities. If such activities are detected, financial institutions are obligated to file suspicious activity reports with the Treasury’s Office of Financial Crimes Enforcement Network. These rules require financial institutions to establish procedures for identifying and verifying the identity of customers seeking to open new financial accounts. Failure to comply with these regulations could result in fines or sanctions. Several banking institutions have recently received large fines for non-compliance with these
19
laws and regulations. Although we have developed policies and procedures designed to assist in compliance with these laws and regulations, no assurance can be given that these policies and procedures will be effective in preventing violations of these laws and regulations.
| · | Competition from financial institutions and other financial service providers may adversely affect our profitability. |
Our future growth and success will depend on, among other things, our ability to compete effectively with other financial services providers in our banking markets. To date, we have grown our business by focusing on our lines of business and emphasizing the high level of service and responsiveness desired by our customers. However, commercial banking in our banking markets and in North Carolina as a whole is extremely competitive. We compete against commercial banks, credit unions, savings and loan associations, mortgage banking firms, consumer finance companies, securities brokerage firms, insurance companies, money market funds and other mutual funds, as well as other local and community, super-regional, national and international financial institutions that operate offices in our market areas and elsewhere. We compete with these institutions in attracting deposits and in making loans, and we have to attract our customer base from other existing financial institutions and from new residents. Our larger competitors have greater resources, broader geographic markets and name recognition, and higher lending limits than we do, and they can offer more products and services and better afford and more effectively use media advertising, support services and electronic technology than we can. Also, larger competitors may be able to price loans and deposits more aggressively than we do. While we believe we compete effectively with other financial institutions, we may face a competitive disadvantage as a result of our size, lack of geographic diversification and inability to spread marketing costs across a broader market. Although we compete by concentrating our marketing efforts in our primary markets with local advertisements, personal contacts and greater flexibility and responsiveness in working with local customers, we cannot assure you that we will continue to be an effective competitor in our banking markets.
| · | We rely on dividends from the Bank for substantially all of our revenue. |
We receive substantially all of our revenue as dividends from the Bank. As described under “Item 1. Business—Supervision and Regulation, federal and state regulations limit the amount of dividends that the Bank may pay to us. If the Bank becomes unable to pay dividends to us, then we may not be able to service our debt, pay our other obligations or pay dividends on our common stock and the Series A Preferred Stock we have sold to Treasury. Accordingly, our inability to receive dividends from the Bank could also have a material adverse effect on our business, financial condition and results of operations and the value of your investment in our common stock.
| · | We depend on the services of our current management team. |
Our operating results and ability to adequately manage our growth and minimize loan losses are highly dependent on the services, managerial abilities and performance of our executive officers. Smaller banks, like us, sometimes find it more difficult to attract and retain experienced management personnel than larger banks. We currently have an experienced management team that our Board of Directors believes is capable of managing and growing the Bank. However, changes in or losses of key personnel of any company could disrupt that company’s business and could have an adverse effect on its business and operating results.
Risks Relating to Our Common Stock
| · | Increases in our capital through sales of common or preferred stock could dilute our existing shareholders. |
In the event that we seek to raise additional capital to support our business and growth, we likely would do that through the issuance of new shares of our common stock or preferred stock. However, our ability to sell additional shares, and the terms (including price) upon which we could sell shares, will depend on conditions in the capital markets, economic conditions, our financial performance and condition, and other factors, many of which are outside our control. Any sales of additional shares of our common stock or preferred stock could dilute the book value and earnings per share of our existing stock and the interests of our existing shareholders.
20
| · | The price of our common stock may fluctuate significantly, and this may make it difficult for you to resell our common stock when you want or at prices you find attractive. |
We cannot predict how or at what prices our common stock will trade in the future. The market value of our common stock will likely continue to fluctuate in response to a number of factors including the following, most of which are beyond our control, as well as the other factors described in this “Risk Factors” section:
| · | actual or anticipated quarterly fluctuations in our operating and financial results; |
| · | changes in financial estimates and recommendations by financial analysts; |
| · | actions of our current shareholders, including sales of common stock by existing shareholders and our directors and executive officers; |
| · | fluctuations in the stock price and operating results of our competitors; |
| · | regulatory developments; and |
| · | developments related to the financial services industry. |
The market value of and trading in our common stock also is affected by conditions (including price and trading fluctuations) affecting the financial markets in general, and in the market for the stocks of financial services companies in particular. These conditions may result in volatility in the market prices of stocks generally and, in turn, our common stock. Also, market conditions may result in sales of substantial amounts of our common stock in the market. In each case, market conditions could affect the market price of our stock in a way that is unrelated or disproportionate to changes in our operating performance.
| · | The trading volume in our common stock has been low, and the sale of a substantial number of shares in the public market could depress the price of our stock and make it difficult for you to sell your shares. |
Our common stock is listed on the NASDAQ Global Market, but it has a relatively low average daily trading volume relative to many other stocks. Thinly traded stock can be more volatile than stock trading in an active public market, which can lead to significant price swings even when a relatively small number of shares are being traded and limit an investor’s ability to quickly sell blocks of stock. We cannot predict what effect future sales of our common stock in the market, or the availability of shares of our common stock for sale in the market, will have on the market price of our common stock.
Of the shares of our common stock beneficially owned by our directors and executive officers, in excess of 10% of our outstanding shares are held by an estate. We cannot predict the timing or amount of sales, if any, of those shares in the public markets or the effects any such sales may have on the trading price of our common stock.
| · | Our management beneficially owns a substantial percentage of our common stock, so our directors and executive officers can significantly affect voting results on matters voted on by our shareholders. |
Our current directors and executive officers, as a group, beneficially own a significant percentage of our outstanding common stock, much of which is held by an estate of which one of our directors serves as a co-executor. Because of their voting rights, in matters put to a vote of our shareholders it could be difficult for any group of our other shareholders to defeat a proposal favored by our management (including the election of one or more of our directors) or to approve a proposal opposed by management.
| · | The securities purchase agreement between us and Treasury limits our ability to pay dividends on and repurchase our common stock. |
The securities purchase agreement between us and Treasury provides that prior to the earlier of January 16, 2012, and the date on which all of the shares of Series A Preferred Stock held by Treasury have been redeemed by us or transferred by Treasury to third parties, we may not, without the consent of Treasury:
| · | increase the cash dividend on our common stock above $0.1825 per quarter; or |
| · | subject to limited exceptions, redeem, repurchase or otherwise acquire shares of our common stock or preferred stock (other than the Series A Preferred Stock) or trust preferred securities. |
21
In addition, we are unable to pay any dividends on our common stock unless we are current in our dividend payments on the Series A Preferred Stock. These restrictions, together with the potentially dilutive impact of the warrant described in the next risk factor, could have a negative effect on the value of our common stock. Moreover, holders of our common stock are entitled to receive dividends only when, as and if declared by our Board of Directors. Although we have historically paid cash dividends on our common stock, we are not required to do so and our Board of Directors could reduce or eliminate our common stock dividend in the future.
| · | Our outstanding Series A Preferred Stock affects net income available to our common shareholders and earnings per common share, and the warrant we issued to Treasury may be dilutive to holders of our common stock. |
The dividends declared on our Series A Preferred Stock will reduce the net income available to common shareholders and our earnings per common share. The Series A Preferred Stock will also receive preferential treatment in the event of liquidation, dissolution or winding up of our company. Additionally, the ownership interest of the existing holders of our common stock will be diluted to the extent the warrant we issued to Treasury in conjunction with the sale to Treasury of Series A Preferred Stock is exercised. The shares of common stock underlying the warrant represent approximately 4.84% of the shares of our common stock outstanding as of March 7, 2011 (including the shares issuable upon exercise of the warrant). Although Treasury has agreed not to vote any of the shares of common stock it receives upon exercise of the warrant, a transferee of any portion of the warrant or of any shares of common stock acquired upon exercise of the warrant is not bound by this restriction.
Item 1B. Unresolved Staff Comments
Not applicable.
22
Item 2. Properties
Our offices are located in the Bank’s corporate offices in Engelhard, North Carolina, and we do not own or lease any separate properties. The Bank maintains 25 branch offices, 22 of which are owned by the Bank, and three of which are leased from unaffiliated third parties. The following table contains information about our branch offices.
| Office location |
Opening date of original banking office |
Owned/Leased | Date current facility built or purchased (1) | |||
| 35050 Hwy 264 Engelhard, NC |
January 1920 | Owned | 2004 | |||
| 80 Main and Pearl St. Swan Quarter, NC |
March 1935 | Owned (2) | 1975 | |||
| 204 Scuppernong Dr. Columbia, NC |
December 1936 | Owned (2) | 1975 | |||
| 7th St. & Hwy. 64 Creswell, NC |
January 1963 | Owned | 1963 | |||
| 205 Virginia Dare Rd. Manteo, NC |
June 1969 | Owned | 1999 | |||
| 2721 S Croatan Hwy. Nags Head, NC |
April 1971 | Owned (2) | 1974 | |||
| State Hwy. 12 Hatteras, NC |
April 1973 | Owned (2) | 1980 | |||
| 6839 N.C. Hwy. 94 Fairfield, NC |
June 1973 | Owned (2) | 1973 | |||
| Hwy. 12 Ocracoke, NC |
May 1978 | Owned | 1978 | |||
| Hwy. 158 & Juniper Tr. Kitty Hawk, NC |
May 1984 | Owned (3) | 2006 | |||
| 1001 Red Banks Rd. Greenville, NC |
August 1989 | Owned | 1990 | |||
| 2400 Stantonsburg Rd. Greenville, NC |
June 1995 | Owned | 1995 | |||
| NC Hwy. 12 Avon, NC |
June 1997 | Leased (4) | — | |||
| 2878 Caratoke Hwy. Currituck, NC |
January 1998 | Owned | 2001 | |||
| 1418 Carolina Ave. Washington, NC |
May 1999 | Leased (4) | — | |||
| 1801 S Glenburnie Rd. New Bern, NC |
August 2000 | Owned | 1996 | |||
| 1103 Harvey Point Road Hertford, NC |
October 2000 | Owned (5) | 2006 | |||
| 403 East Blvd. Williamston, NC |
May 2003 | Owned | 2003 | |||
| 168 Hwy. 24 Morehead City, NC |
January 2004 | Owned | 2004 | |||
23
| Office location |
Opening date of original banking office |
Owned/Leased | Date current facility built or purchased (1) | |||
| 1724 Eastwood Rd. Wilmington, NC |
June 2004 | Owned | 2004 | |||
| 100 Causeway Drive Unit 4 Ocean Isle Beach, NC |
May 2007 | Leased (4) | — | |||
| 1221 Portertown Rd. Greenville, NC |
July 2007 | Owned | 2007 | |||
| 3810 S. Memorial Dr. Winterville, NC |
July 2007 | Owned | 2007 | |||
| 1101 New Pointe Blvd. Leland, NC |
July 2008 | Owned | 2008 | |||
| 7961 Market Street Wilmington, NC |
December 2010 |
Owned | 2010 | |||
| (1) | Includes only facilities owned by the Bank. |
| (2) | Leased from the Bank’s subsidiary, ECB Realty, Inc. until February 2, 2007. ECB Realty, Inc. was merged into the Bank on that date and the Bank acquired title to the property. |
| (3) | Constructed by the Bank and first occupied during February 2006 to replace a facility previously leased from ECB Realty, Inc. |
| (4) | Leased from a third party. |
| (5) | Constructed by the Bank and first occupied during January 2006 to replace a facility previously leased from a third party. |
The Bank owns a vacant property in each of Jacksonville, Wilmington, Ocean Isle Beach, New Bern and Grandy, North Carolina, as sites for possible future branch offices.
All the Bank’s existing branch offices are in good condition and fully equipped for the Bank’s purposes. At December 31, 2010, our consolidated investment in premises and banking equipment (cost less accumulated depreciation) was approximately $26.6 million.
Item 3. Legal Proceedings
From time to time we may become involved in legal proceedings in the ordinary course of our business. However, subject to the uncertainties inherent in any litigation, we believe that, at December 31, 2010 there was no pending proceedings that are likely to result in a material adverse change in our financial condition or operating results.
Item 4. (Removed and Reserved)
24
PART II
Item 5. Market for Registrant’s Common Equity; Related Stockholder Matters and Issuer Purchases of
Equity Securities
Our common stock is listed on The NASDAQ Global Market under the trading symbol “ECBE.” The following table lists the high and low sales prices for our common stock as reported by The Nasdaq Stock Market, and cash dividends declared on our common stock, for the periods indicated.
| Sales Price Range | Cash Dividend Declared Per Share |
|||||||||||
| Quarter |
High | Low | ||||||||||
| 2010 Fourth |
$ | 14.50 | $ | 12.57 | $ | 0.0700 | ||||||
| Third |
14.55 | 11.25 | 0.0700 | |||||||||
| Second |
16.97 | 11.37 | 0.0700 | |||||||||
| First |
12.77 | 11.00 | 0.0700 | |||||||||
| 2009 Fourth |
$ | 17.21 | $ | 11.11 | $ | 0.1825 | ||||||
| Third |
19.89 | 15.56 | 0.1825 | |||||||||
| Second |
21.18 | 15.50 | 0.1825 | |||||||||
| First |
17.75 | 13.52 | 0.1825 | |||||||||
On March 8, 2011, there were approximately 647 record holders of our common stock. We believe the number of beneficial owners of our common stock is greater than the number of record holders because a large amount of our common stock is held of record through brokerage firms in “street name.”
Under North Carolina law, we are authorized to pay dividends as declared by our Board of Directors, provided that no such distribution results in our insolvency on a going concern or balance sheet basis. We have paid cash dividends since we were incorporated during 1998, and we intend to continue to pay dividends on a quarterly basis. However, although we are a legal entity separate and distinct from the Bank, our principal source of funds with which we can pay dividends to our shareholders is dividends we receive from the Bank. For that reason, our ability to pay dividends effectively is subject to the limitations that apply to the Bank.
In general, the Bank may pay dividends only from its undivided profits. However, if its surplus is less than 50% of its paid-in capital stock, the Bank’s directors may not declare any cash dividend until it has transferred to surplus 25% of its undivided profits or any lesser percentage necessary to raise its surplus to an amount equal to 50% of its paid-in capital stock. The Bank’s ability to pay dividends to us is subject to other regulatory restrictions. (See “Supervision and Regulation—Restrictions on Payment of Dividends” under Item 1. Business.)
Our sale of Series A Preferred Stock to the U.S. Treasury during January 2009 under the TARP Capital Purchase Program resulted in additional restrictions on our ability to pay dividends on our common stock and to repurchase shares of our common stock. Unless all accrued dividends on the Series A Preferred Stock have been paid in full, (1) no dividends may be declared or paid on our common stock, and (2) we may not repurchase any of our outstanding common stock. Additionally, until January 16, 2012, we are required to obtain the consent of the U.S. Treasury in order to declare or pay any dividend or make any distribution on our common stock other than regular quarterly cash dividends of not more than $0.1825 per share, or, subject to certain exceptions, repurchase shares of our common stock unless we have redeemed all of the Series A Preferred Stock or the U.S. Treasury has transferred all of those shares to third parties.
In the future, in addition to the restrictions discussed above, our ability to declare and pay cash dividends on our common stock will be subject to evaluation by our Board of Directors of our and the Bank’s operating results, capital levels, financial condition, future growth plans, general business and economic conditions, and other relevant considerations. We cannot assure you that we will continue to pay cash dividends on any particular schedule or that we will not reduce the amount of dividends we pay in the future.
25
The following information is being furnished for purposes of Rule 14a-3. It is not deemed to be filed with
the Securities and Exchange Commission or to be incorporated by reference into any filing under
the Securities Act of 1933 or the Securities Exchange Act of 1934, except to the extent
that we specifically incorporate it by reference into such a filing.
The following graph compares the cumulative total shareholder return (CTSR) on our common stock during the previous five years with the CTSR over the same measurement period of the Nasdaq Composite index and the SNL Bank NASDAQ index. Each trend line assumes that $100 was invested on December 31, 2005, and that dividends were reinvested for additional shares.
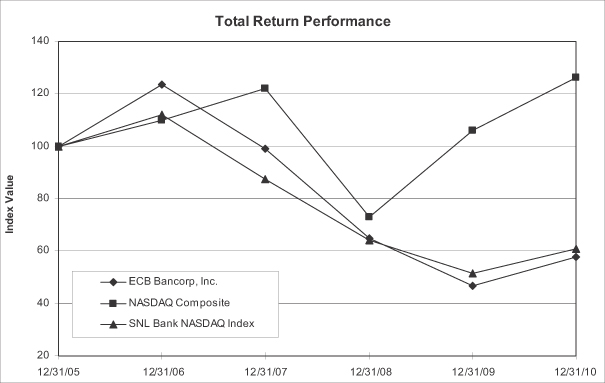
| Period Ending | ||||||||||||||||||||||||
| Index |
12/31/05 | 12/31/06 | 12/31/07 | 12/31/08 | 12/31/09 | 12/31/10 | ||||||||||||||||||
| ECB Bancorp, Inc. |
100.00 | 123.69 | 99.48 | 64.29 | 46.78 | 57.96 | ||||||||||||||||||
| NASDAQ Composite |
100.00 | 110.39 | 122.15 | 73.32 | 106.57 | 125.91 | ||||||||||||||||||
| SNL Bank NASDAQ Index |
100.00 | 112.27 | 88.14 | 64.01 | 51.93 | 61.27 | ||||||||||||||||||
26
Item 6. Selected Financial Data
The following table contains summary historical consolidated financial information from our consolidated financial statements. You should read it in conjunction with our audited year end consolidated financial statements, including the related notes, and “Management’s Discussion and Analysis of Financial Condition and Results of Operations” which are included elsewhere in this report.
| At or for the Year Ended December 31, | ||||||||||||||||||||
| 2010 | 2009 | 2008 | 2007 | 2006 | ||||||||||||||||
| (Dollars in thousands, except per share data) | ||||||||||||||||||||
| Income Statement Data: |
||||||||||||||||||||
| Net interest income |
$ | 27,919 | $ | 26,748 | $ | 20,273 | $ | 20,357 | $ | 20,520 | ||||||||||
| Provision for loan losses |
12,980 | 11,100 | 2,450 | (99 | ) | 351 | ||||||||||||||
| Non-interest income |
11,995 | 8,649 | 6,809 | 6,377 | 6,360 | |||||||||||||||
| Non-interest expense |
26,840 | 23,152 | 20,633 | 20,344 | 18,537 | |||||||||||||||
| Provision for income taxes |
(766 | ) | (357 | ) | 580 | 1,677 | 2,410 | |||||||||||||
| Net income |
860 | 1,502 | 3,419 | 4,812 | 5,582 | |||||||||||||||
| Preferred stock dividend & accretion of discount |
1,063 | 1,003 | — | — | — | |||||||||||||||
| Net income (loss) available to common shareholders |
$ | (203 | ) | 499 | 3,419 | 4,812 | 5,582 | |||||||||||||
| Per Share Data and Shares Outstanding: |
||||||||||||||||||||
| Basic net income (loss)(1) |
$ | (0.07 | ) | $ | 0.18 | $ | 1.19 | $ | 1.65 | $ | 2.07 | |||||||||
| Diluted net income (loss)(1) |
(0.07 | ) | 0.18 | 1.18 | 1.65 | 2.05 | ||||||||||||||
| Cash dividends declared |
0.28 | 0.73 | 0.73 | 0.70 | 0.68 | |||||||||||||||
| Book value at period end |
22.32 | 23.62 | 23.89 | 22.88 | 21.64 | |||||||||||||||
| Weighted-average number of common shares outstanding: |
||||||||||||||||||||
| Basic |
2,849,594 | 2,844,950 | 2,884,396 | 2,908,371 | 2,700,663 | |||||||||||||||
| Diluted |
2,849,594 | 2,845,966 | 2,889,016 | 2,914,352 | 2,724,717 | |||||||||||||||
| Shares outstanding at period end |
2,849,841 | 2,847,881 | 2,844,489 | 2,920,769 | 2,902,242 | |||||||||||||||
| Balance Sheet Data: |
||||||||||||||||||||
| Total assets |
$ | 919,869 | $ | 888,720 | $ | 841,851 | $ | 643,889 | $ | 624,070 | ||||||||||
| Loans receivable |
567,631 | 577,791 | 538,836 | 454,198 | 417,943 | |||||||||||||||
| Allowance for loan losses |
13,247 | 9,725 | 5,931 | 4,083 | 4,725 | |||||||||||||||
| Other interest-earning assets |
290,371 | 253,183 | 244,470 | 133,970 | 151,555 | |||||||||||||||
| Total deposits |
785,941 | 754,730 | 629,152 | 526,361 | 512,249 | |||||||||||||||
| Borrowings |
46,009 | 43,910 | 83,716 | 43,174 | 41,415 | |||||||||||||||
| Shareholders’ equity |
80,894 | 84,375 | 67,943 | 66,841 | 62,793 | |||||||||||||||
| Selected Performance Ratios: |
||||||||||||||||||||
| Return on average assets |
0.09 | % | 0.17 | % | 0.47 | % | 0.77 | % | 0.96 | % | ||||||||||
| Return on average shareholders’ equity |
0.99 | 1.74 | 5.14 | 7.48 | 10.13 | |||||||||||||||
| Net interest margin(2) |
3.40 | 3.41 | 3.12 | 3.72 | 4.01 | |||||||||||||||
| Efficiency ratio(3) |
65.36 | 63.48 | 73.91 | 73.44 | 67.06 | |||||||||||||||
| Asset Quality Ratios: |
||||||||||||||||||||
| Nonperforming loans to period-end loans |
3.89 | % | 2.54 | % | 1.85 | % | 0.10 | % | 0.04 | % | ||||||||||
| Allowance for loan losses to period-end loans |
2.33 | 1.68 | 1.10 | 0.90 | 1.13 | |||||||||||||||
| Allowance for loan losses to nonperforming loans |
59.97 | 66.17 | 59.42 | 876.92 | 2,567.93 | |||||||||||||||
| Nonperforming assets to total assets(4) |
2.89 | 2.27 | 1.63 | 0.08 | 0.07 | |||||||||||||||
| Net loan charge-offs to average loans outstanding |
1.64 | 1.30 | 0.12 | 0.13 | 0.01 | |||||||||||||||
| Capital Ratios: |
||||||||||||||||||||
| Equity-to-assets ratio(5) |
8.79 | % | 9.49 | % | 8.07 | % | 10.38 | % | 10.06 | % | ||||||||||
| Leverage capital ratio(6) |
8.66 | 9.59 | 8.65 | 10.66 | 12.05 | |||||||||||||||
| Tier 1 capital ratio(6) |
12.08 | 12.77 | 10.83 | 12.94 | 15.08 | |||||||||||||||
| Total capital ratio(6) |
13.34 | 14.02 | 11.80 | 13.72 | 16.04 | |||||||||||||||
| (1) | Per share amounts are computed based on the weighted-average number of shares outstanding during each period. |
| (2) | Net interest margin is net interest income divided by average interest earning assets, net of allowance for loan losses. |
| (3) | Efficiency ratio is non-interest expense divided by the sum of net interest income and non-interest income, both as calculated on a fully taxable-equivalent basis. |
| (4) | Nonperforming assets consist of the aggregate amount of any non-accruing loans, loans past due greater than 90 days and still accruing interest, restructured loans, repossessions and foreclosed assets on each date. |
| (5) | Equity-to-assets ratios are computed based on total shareholders’ equity and total assets at each period end. |
| (6) | These ratios are described in Item 1 under the captions “Supervision and Regulation—Capital Adequacy” and “—Prompt Corrective Action.” |
27
Item 7. Management’s Discussion and Analysis of Financial Condition and Results of Operations.
This section presents management’s discussion and analysis of our financial condition and results of operations. You should read the discussion in conjunction with our financial statements and related notes included elsewhere in this report. This discussion contains forward-looking statements that involve risks and uncertainties. Our actual results could differ significantly from those described in these forward-looking statements as a result of various factors. This discussion is intended to assist in understanding our financial condition and results of operations.
Executive Summary
ECB Bancorp, Inc. is a bank holding company headquartered in Engelhard, North Carolina. Our wholly-owned subsidiary, The East Carolina Bank (the “Bank”), is a state-chartered community bank that was founded in 1919. For the purpose of this discussion, “we,” “us” and “our” refers to the Bank and the bank holding company as a single, consolidated entity unless the context otherwise indicates.
Our consolidated assets increased 3.5% to $919.9 million on December 31, 2010, from $888.7 million at year-end 2009. Our loan portfolio decreased 1.8% to $567.6 million at December 31, 2010, from loans of $577.8 million at year-end 2009 while deposits increased 4.1% to $785.9 million at year-end 2010 from $754.7 million at year-end 2009. Total shareholders’ equity was approximately $80.9 million at year-end 2010.
In 2010, we had a loss attributable to common shareholders of $203 thousand or $(0.07) basic and $(0.07) diluted loss per share, compared to income available to common shareholders of $499 thousand or $0.18 basic and $0.18 diluted earnings per share for the year ended December 31, 2009. The 2010 loss attributable to common shareholders represents a decrease over reported 2009 income available to common shareholders mainly due to an increase in non-interest expense and an increase in provision expense. Part of the increase in non-interest expense was from a nonrecurring one-time expense of $1.1 million for early termination fees payable on certain multi-year support and maintenance contracts in connection with our conversion of our core processing system, scheduled for May 2011.
Critical Accounting Policies
Our significant accounting policies are set forth in Note 1 to our audited consolidated financial statements included in Item 8 of this report. Of these significant accounting policies, we consider our policy regarding the allowance for loan losses to be our most critical accounting policy, because it requires management’s most subjective and complex judgments. In addition, changes in economic conditions can have a significant impact on the allowance for loan losses and, therefore, the provision for loan losses and results of operations. We have developed policies and procedures for assessing the adequacy of the allowance for loan losses, recognizing that this process requires a number of assumptions and estimates with respect to our loan portfolio. Our assessments may be impacted in future periods by changes in economic conditions, the results of regulatory examinations, and the discovery of information with respect to borrowers that is not currently known to management. For additional discussion concerning our allowance for loan losses and related matters, see “—Allowance for Loan Losses” and “—Nonperforming Assets and Past Due Loans.”
We also consider our determination of retirement plans and other postretirement benefit plans to be a critical accounting estimate as it requires the use of estimates and judgments related to the amount and timing of expected future cash out-flows for benefit payments and cash in-flows for maturities and return on plan assets. Our retirement plans and other postretirement benefit plans are actuarially determined based on assumptions on the discount rate, estimated future return on plan assets and the health care cost trend rate. Changes in estimates and assumptions related to mortality rates and future health care costs could have a material impact to our financial condition or results of operations. The discount rate is used to determine the present value of future benefit obligations and the net periodic benefit cost. The discount rate used to value the future benefit obligation as of each year-end is the rate used to determine the periodic benefit cost in the following year. For additional discussion concerning our retirement plans and other postretirement benefits refer to Note 8 of our consolidated financial statements.
28
Results of Operations for the Years Ended December 31, 2010, 2009 and 2008
In 2010, our loss attributable to common shareholders was $203 thousand or $(0.07) basic and $(0.07) diluted loss per share, compared to income available to common shareholders of $499 thousand or $0.18 basic and $0.18 diluted earnings per share for the year ended December 31, 2009. The decrease in earnings is primarily due to an increase in non-interest expense and an increase in provision expense. Part of the increase in non-interest expense was from a nonrecurring one-time expense of $1.1 million for early termination fees payable on certain multi-year support and maintenance contracts in connection with our conversion of our core processing system, scheduled for May 2011.
The following table shows return on assets (net income before preferred dividends and accretion of discount divided by average assets), return on equity (net income before preferred dividends and accretion of discount divided by average shareholders’ equity), dividend payout ratio (dividends declared per share divided by net income available to common shareholders per share) and shareholders’ equity to assets ratio (average shareholders’ equity divided by average total assets) for each of the years presented.
| Year Ended December 31, | ||||||||||||
| 2010 | 2009 | 2008 | ||||||||||
| Return on assets |
0.09 | % | 0.17 | % | 0.47 | % | ||||||
| Return on equity |
0.99 | 1.74 | 5.14 | |||||||||
| Dividend payout |
(400.00 | ) | 405.56 | 61.34 | ||||||||
| Shareholders’ equity to assets |
9.53 | 9.98 | 9.13 | |||||||||
Our core strategies continue to be: (1) grow the loan portfolio while maintaining high asset quality; (2) grow core deposits; (3) increase non-interest income; (4) control expenses; and (5) make strategic investments in new and existing communities that will result in increased shareholder value. We continued to make strategic investments in our future as we opened a new branch in December 2010.
Net Interest Income
Net interest income (the difference between the interest earned on assets, such as loans and investment securities and the interest paid on liabilities, such as deposits and other borrowings) is our primary source of operating income. The level of net interest income is determined primarily by the average balances (volume) of interest-earning assets and our interest-bearing liabilities and the various rate spreads between our interest-earning assets and interest-bearing liabilities. Changes in net interest income from period to period result from increases or decreases in the volume of interest-earning assets and interest-bearing liabilities, increases or decreases in the average interest rates earned and paid on such assets and liabilities, the ability to manage the interest-earning asset portfolio, and the availability of particular sources of funds, such as non-interest-bearing deposits.
The banking industry uses two key ratios to measure profitability of net interest income: net interest rate spread and net interest margin. The net interest rate spread measures the difference between the average yield on earning assets and the average rate paid on interest-bearing liabilities. The net interest rate spread does not consider the impact of non-interest-bearing deposits and gives a direct perspective on the effect of market interest rate movements. The net interest margin is defined as net interest income as a percentage of total average earning assets and takes into account the positive effects of investing non-interest-bearing deposits in earning assets.
Our net interest income for the year ended December 31, 2010 was $27.9 million, an increase of $1.2 million or 4.49% when compared to net interest income of $26.7 million for the year ended December 31, 2009. Our net interest margin, on a tax-equivalent basis, for 2010 was 3.40% compared to 3.41% for 2009. Our net interest rate spread, on a tax-equivalent basis, for 2010 was 3.16% compared to 3.09% for 2009. The spread increased by seven basis points as the decrease in the rates paid on interest-bearing liabilities was forty-two basis points while the decrease on yields earned on interest-earning assets was thirty-five basis points for the year.
Total interest income decreased $1.1 million or 2.7% to $39.8 million in 2010 compared to $40.9 million in interest income in 2009. Increases in our average earning assets of $38.7 million in 2010 when compared to 2009 resulted in $1.6 million increase in interest income from 2009 to 2010 but this was more than offset by a decrease in interest income
29
of $2.7 million from a decline in yields. We funded the increases in interest-earning assets primarily with interest-bearing demand accounts. The tax equivalent yield on average earning assets decreased 35 basis points during 2010.
The effect of variances in volume and rate on interest income and interest expense is illustrated in the table titled “Change in Interest Income and Expense on Tax Equivalent Basis.” Management attributes the decrease in the yield on our earning assets to the continued low level of market interest rates. Yields on our taxable securities decreased approximately 111 basis points for 2010 as compared to 2009 as securities sold, called or matured have been replaced with lower yielding securities.
Our average cost of funds for 2010 was 1.65%, a decrease of 42 basis points when compared to 2.07% for 2009. The average cost on Bank certificates of deposit decreased 48 basis points from 2.54% paid in 2009 to 2.06% paid in 2010, while our average cost of borrowed funds increased 64 basis points during 2010 compared to 2009. The increase in the average cost of borrowed funds for 2010 compared to 2009 is the result of a decrease in the volume of lower cost short-term borrowings.
Total interest expense decreased $2.3 million or 16.2% to $11.9 million in 2010 from $14.2 million in 2009, primarily the result of decreased market rates paid on Bank certificates of deposit. The volume of average interest-bearing liabilities increased approximately $37.6 million when comparing 2010 with that of 2009. The decrease to interest expense resulting from decreased rates on all interest-bearing liabilities was $3.2 million and the increase attributable to higher volumes of interest-bearing liabilities was $0.9 million.
Our net interest income for the year ended December 31, 2009 was $26.7 million, an increase of $6.4 or 31.5% when compared to net interest income of $20.3 million for the year ended December 31, 2008. Our net interest margin, on a tax-equivalent basis, for 2009 was 3.41% compared to 3.12% for 2008. The increase in our net interest margin is mainly the result of decreased rates paid on our interest bearing liabilities. Our net interest rate spread, on a tax-equivalent basis, for 2009 was 3.09% compared to 2.60% for 2008. The spread increased by forty-nine basis points as the decrease in the rates paid on interest-bearing liabilities was forty-nine basis points more than the change in yields earned on interest-earning assets for the year.
Total interest income increased $1.8 million or 4.6% to $40.9 million in 2009 compared to $39.1 million in interest income in 2008. Increases in our average earning assets of $135.4 million in 2009 when compared to 2008 resulted in $7.0 million increase in interest income from 2008 to 2009 but this was partially offset by a decrease in interest income of $5.2 million from a decline in yields. We funded the increases in interest-earning assets primarily with certificates of deposit. The tax equivalent yield on average earning assets decreased 77 basis points during 2009.
Similarly, our average cost of funds for 2009 was 2.07%, a decrease of 126 basis points when compared to 3.33% for 2008. The average cost on Bank certificates of deposit decreased 155 basis points from 4.09% paid in 2008 to 2.54% paid in 2009, while our average cost of borrowed funds decreased 173 basis points during 2009 compared to 2008.
Total interest expense decreased $4.6 million or 24.5% to $14.2 million in 2009 from $18.8 million in 2008, primarily the result of decreased market rates paid on Bank certificates of deposit. The volume of average interest-bearing liabilities increased approximately $117.8 million when comparing 2009 with that of 2008. The decrease to interest expense resulting from decreased rates on all interest-bearing liabilities was $7.9 million and the increase attributable to higher volumes of interest-bearing liabilities was $3.2 million.
30
The following table presents an analysis of average interest-earning assets and interest-bearing liabilities, the interest income or expense applicable to each asset or liability category and the resulting yield or rate paid.
Average Consolidated Balances and Net Interest Income Analysis
| Year Ended December 31, | ||||||||||||||||||||||||||||||||||||
| 2010 | 2009 | 2008 | ||||||||||||||||||||||||||||||||||
| Average Balance |
Yield/ Rate |
Income/ Expense |
Average Balance |
Yield/ Rate |
Income/ Expense |
Average Balances |
Yield/ Rate |
Income/ Expense |
||||||||||||||||||||||||||||
| (Dollars in thousands) | ||||||||||||||||||||||||||||||||||||
| Assets: |
||||||||||||||||||||||||||||||||||||
| Loans—net(1) |
$ | 566,007 | 5.43 | % | $ | 30,745 | $ | 556,017 | 5.50 | % | $ | 30,595 | $ | 499,771 | 6.22 | % | $ | 31,104 | ||||||||||||||||||
| Taxable securities |
227,505 | 3.30 | 7,508 | 201,676 | 4.41 | 8,901 | 125,985 | 5.11 | 6,432 | |||||||||||||||||||||||||||
| Nontaxable securities(2) |
38,351 | 6.09 | 2,335 | 36,743 | 5.80 | 2,130 | 34,733 | 5.69 | 1,977 | |||||||||||||||||||||||||||
| Other investments(3) |
12,981 | 0.10 | 13 | 11,705 | 0.03 | 3 | 10,279 | 2.50 | 257 | |||||||||||||||||||||||||||
| Total interest-earning assets |
844,844 | 4.81 | 40,601 | 806,141 | 5.16 | 41,629 | 670,768 | 5.93 | 39,770 | |||||||||||||||||||||||||||
| Cash and due from banks |
11,645 | 10,999 | 12,663 | |||||||||||||||||||||||||||||||||
| Bank premises and equipment, net |
25,577 | 25,506 | 25,255 | |||||||||||||||||||||||||||||||||
| Other assets |
27,277 | 23,745 | 19,407 | |||||||||||||||||||||||||||||||||
| Total assets |
$ | 909,343 | $ | 866,391 | $ | 728,093 | ||||||||||||||||||||||||||||||
| Liabilities and Shareholders’ Equity: |
||||||||||||||||||||||||||||||||||||
| Interest-bearing deposits |
$ | 680,920 | 1.62 | % | $ | 11,010 | $ | 607,880 | 2.13 | % | $ | 12,958 | $ | 488,309 | 3.33 | % | $ | 16,276 | ||||||||||||||||||
| Short-term borrowings(4) |
15,842 | 1.52 | 241 | 52,293 | 0.94 | 492 | 55,131 | 3.44 | 1,895 | |||||||||||||||||||||||||||
| Long-term obligations |
23,195 | 2.75 | % | 637 | 22,219 | 3.18 | % | 707 | 21,120 | 3.10 | % | 654 | ||||||||||||||||||||||||
| Total interest-bearing liabilities |
719,957 | 1.65 | 11,888 | 682,392 | 2.07 | 14,157 | 564,560 | 3.33 | 18,825 | |||||||||||||||||||||||||||
| Non-interest-bearing deposits |
102,039 | 90,732 | 90,031 | |||||||||||||||||||||||||||||||||
| Other liabilities |
705 | 6,783 | 7,037 | |||||||||||||||||||||||||||||||||
| Shareholders’ equity |
86,642 | 86,484 | 66,465 | |||||||||||||||||||||||||||||||||
| Total liabilities and shareholders’ equity |
$ | 909,343 | $ | 866,391 | $ | 728,093 | ||||||||||||||||||||||||||||||
| Net interest income and net interest margin (FTE)(5) |
3.40 | % | $ | 28,713 | 3.41 | % | $ | 27,472 | 3.12 | % | $ | 20,945 | ||||||||||||||||||||||||
| Net interest rate spread (FTE)(6) |
3.16 | % | 3.09 | % | 2.60 | % | ||||||||||||||||||||||||||||||
| (1) | Average loans include non accruing loans, net of allowance for loan losses, and loans held for sale. Amortization of deferred loan fees of $49 thousand, $9 thousand, and $5 thousand for 2010, 2009, and 2008, respectively, are included in interest income. |
| (2) | Yields on tax-exempt investments have been adjusted to a fully taxable-equivalent basis (FTE) using the federal income tax rate of 34%. The taxable equivalent adjustment was $794 thousand, $724 thousand, and $672 thousand for the years 2010, 2009, and 2008, respectively. |
| (3) | Other investments include federal funds sold and interest-bearing deposits with banks and other institutions. |
| (4) | For 2008, expense includes $ 350 thousand for interest on taxes. |
| (5) | Net interest margin is computed by dividing net interest income by total average earning assets, net of the allowance for loan losses. |
| (6) | Net interest rate spread equals the earning asset yield minus the interest-bearing liability rate. |
31
The following table presents the relative impact on net interest income of the volume of earning assets and interest- bearing liabilities and the rates earned and paid by us on such assets and liabilities. Variances resulting from a combination of changes in rate and volume are allocated in proportion to the absolute dollar amount of the change in each category.
Change in Interest Income and Expense on Tax Equivalent Basis
| 2010 Compared to 2009 | 2009 Compared to 2008 | |||||||||||||||||||||||
| Volume(1) | Rate(1) | Net | Volume(1) | Rate(1) | Net | |||||||||||||||||||
| (Dollars in thousands) | ||||||||||||||||||||||||
|
Loans(2) |
$ | 546 | $ | (396 | ) | $ | 150 | $ | 3,298 | $ | (3,807 | ) | $ | (509 | ) | |||||||||
| Taxable securities |
996 | (2,389 | ) | (1,393 | ) | 3,602 | (1,133 | ) | 2,469 | |||||||||||||||
| Nontaxable securities(3) |
96 | 109 | 205 | 115 | 38 | 153 | ||||||||||||||||||
| Other investments |
1 | 9 | 10 | 18 | (272 | ) | (254 | ) | ||||||||||||||||
| Interest income |
1,639 | (2,667 | ) | (1,028 | ) | 7,033 | (5,174 | ) | 1,859 | |||||||||||||||
| Interest-bearing deposits |
1,369 | (3,318 | ) | (1,949 | ) | 3,267 | (6,585 | ) | (3,318 | ) | ||||||||||||||
| Short-term borrowings |
(449 | ) | 198 | (251 | ) | (62 | ) | (1,341 | ) | (1,403 | ) | |||||||||||||
| Long-term obligations |
29 | (99 | ) | (70 | ) | 35 | 18 | 53 | ||||||||||||||||
| Interest expense |
949 | (3,219 | ) | (2,270 | ) | 3,240 | (7,908 | ) | (4,668 | ) | ||||||||||||||
| Net interest income |
$ | 690 | $ | 552 | $ | 1,242 | $ | 3,793 | $ | 2,734 | $ | 6,527 | ||||||||||||
| (1) | The combined rate/volume variance for each category has been allocated equally between rate and volume variances. |
| (2) | Income on non-accrual loans is included only to the extent that it represents interest payments received. |
| (3) | Yields on tax-exempt investments have been adjusted to a fully taxable-equivalent basis (FTE) using the federal income tax rate of 34%. The taxable equivalent adjustment was $794 thousand, $724 thousand, and $672 thousand for the years 2010, 2009, and 2008, respectively. |
Rate Sensitivity Management
Rate sensitivity management, an important aspect of achieving satisfactory levels of net interest income, is the management of the composition and maturities of rate-sensitive assets and liabilities. The following table sets forth our interest sensitivity analysis at December 31, 2010 and describes, at various cumulative maturity intervals, the gap-ratios (ratios of rate-sensitive assets to rate-sensitive liabilities) for assets and liabilities that we consider to be rate sensitive. The interest-sensitivity position has meaning only as of the date for which it was prepared. Variable rate loans are considered to be highly sensitive to rate changes and are assumed to reprice within 12 months.
The difference between interest-sensitive asset and interest-sensitive liability repricing within time periods is referred to as the interest-rate-sensitivity gap. Gaps are identified as either positive (interest-sensitive assets in excess of interest-sensitive liabilities) or negative (interest-sensitive liabilities in excess of interest-sensitive assets).
As of December 31, 2010, we had a negative one-year cumulative gap of 8.7%. We have interest-earning assets of $472.3 million maturing or repricing within one year and interest-bearing liabilities of $546.7 million repricing or maturing within one year. This is primarily the result of short-term interest sensitive liabilities being used to fund longer term interest-earning assets, such as loans and investment securities. A negative gap position implies that interest-bearing liabilities (deposits and other borrowings) will reprice at a faster rate than interest-earning assets (loans and investments). In a falling rate environment, a negative gap position will generally have a positive effect on earnings, while in a rising rate environment this will generally have a negative effect on earnings.
On December 31, 2010, our savings and time deposits of less than $100 thousand of $588.1 million included savings, NOW and Money Market accounts of $292.9 million. In our rate sensitivity analysis, these deposits are considered as repricing in the earliest period (3 months or less) because the rate we pay on these interest-bearing deposits can be changed weekly. However, our historical experience has shown that changes in market interest rates have little, if any, effect on those deposits within a given time period and, for that reason, those liabilities could be considered non-rate sensitive. If those deposits were excluded from rate sensitive liabilities, our rate sensitive assets and liabilities would be more closely matched at the end of the one-year period.
32
Rate Sensitivity Analysis as of December 31, 2010
| 3 Months Or Less |
4-12 Months |
Total Within 12 Months |
Over 12 Months |
Total | ||||||||||||||||
| (Dollars in thousands) | ||||||||||||||||||||
| Earning assets: |
||||||||||||||||||||
| Loans—gross |
$ | 377,559 | $ | 36,732 | $ | 414,291 | $ | 153,340 | $ | 567,631 | ||||||||||
| Loans held for sale |
4,136 | — | 4,136 | — | 4,136 | |||||||||||||||
| Investment securities |
28,573 | 12,306 | 40,879 | 232,350 | 273,229 | |||||||||||||||
| Interest bearing deposits |
20 | — | 20 | — | 20 | |||||||||||||||
| Federal funds sold |
8,415 | — | 8,415 | — | 8,415 | |||||||||||||||
| FHLB stock |
4,571 | — | 4,571 | — | 4,571 | |||||||||||||||
| Total earning assets |
423,274 | 49,038 | 472,312 | 385,690 | 858,002 | |||||||||||||||
| Percent of total earnings assets |
49.3 | % | 5.7 | % | 55.0 | % | 45.0 | % | 100.0 | % | ||||||||||
| Cumulative percentage of total earning assets |
49.3 | 55.0 | 55.0 | 100.0 | ||||||||||||||||
| Interest-bearing liabilities: |
||||||||||||||||||||
| Savings, NOW and Money Market deposits |
292,915 | — | 292,915 | — | 292,915 | |||||||||||||||
| Time deposits of $100,000 or more |
20,535 | 49,907 | 70,442 | 22,446 | 92,888 | |||||||||||||||
| Other time deposits |
65,959 | 105,908 | 171,867 | 123,339 | 295,206 | |||||||||||||||
| Short-term borrowings |
11,509 | — | 11,509 | — | 11,509 | |||||||||||||||
| Long-term obligations |
— | — | — | 34,500 | 34,500 | |||||||||||||||
| Total interest-bearing liabilities |
$ | 390,918 | $ | 155,815 | $ | 546,733 | $ | 180,285 | $ | 727,018 | ||||||||||
| Percent of total interest-bearing liabilities |
53.8 | % | 21.4 | % | 75.2 | % | 24.8 | % | 100.0 | % | ||||||||||
| Cumulative percent of total interest-bearing liabilities |
53.8 | 75.2 | 75.2 | 100.0 | ||||||||||||||||
| Ratios: |
||||||||||||||||||||
| Ratio of earning assets to interest-bearing liabilities (gap ratio) |
108.3 | % | 31.5 | % | 86.4 | % | 213.9 | % | 118.0 | % | ||||||||||
| Cumulative ratio of earning assets to interest-bearing liabilities (cumulative gap ratio) |
108.3 | % | 86.4 | % | 86.4 | % | 118.0 | % | ||||||||||||
| Interest sensitivity gap |
$ | 32,356 | $ | (106,777 | ) | $ | (74,421 | ) | $ | 205,405 | $ | 130,984 | ||||||||
| Cumulative interest sensitivity gap |
32,356 | (74,421 | ) | (74,421 | ) | 130,984 | 130,984 | |||||||||||||
| As a percent of total earnings assets |
3.8 | % | (8.7 | )% | (8.7 | )% | 15.3 | % | 15.3 | % | ||||||||||
As of December 31, 2010, approximately 55.0% of our interest-earning assets could be repriced within one year and approximately 69.7% of interest-earning assets could be repriced within five years. Approximately 75.2% of interest-bearing liabilities could be repriced within one year and 99.7% could be repriced within five years.
Market Risk
Our primary market risk is interest rate risk. Interest rate risk results from differing maturities or repricing intervals of interest-earning assets and interest-bearing liabilities and the fact that rates on these financial instruments do not change uniformly. These conditions may impact the earnings generated by our interest-earning assets or the cost of our interest-bearing liabilities, thus directly impacting our overall earnings.
We actively monitor and manage interest rate risk. One way this is accomplished is through the development of and adherence to our asset/liability policy. This policy sets forth our strategy for matching the risk characteristics of interest-earning assets and interest-bearing liabilities so as to mitigate the effect of changes in the rate environment.
33
Market Risk Analysis
| Principal Maturing in Years Ended December 31, | ||||||||||||||||||||||||||||||||
| 2011 | 2012 | 2013 | 2014 | 2015 | Thereafter | Total | Fair Value |
|||||||||||||||||||||||||
| (Dollars in thousands) | ||||||||||||||||||||||||||||||||
| Assets: |
||||||||||||||||||||||||||||||||
| Loans, gross: |
||||||||||||||||||||||||||||||||
| Fixed rate |
$ | 60,478 | $ | 40,473 | $ | 48,099 | $ | 13,819 | $ | 17,381 | $ | 33,568 | $ | 213,818 | $ | 210,042 | ||||||||||||||||
| Average rate (%) |
6.05 | % | 6.86 | % | 6.51 | % | 6.94 | % | 6.24 | % | 5.70 | % | 6.33 | % | ||||||||||||||||||
| Variable rate |
108,359 | 37,797 | 56,350 | 61,129 | 41,602 | 48,576 | 353,813 | 353,813 | ||||||||||||||||||||||||
| Average rate (%) |
5.06 | 5.04 | 4.70 | 4.86 | 5.08 | 3.97 | 4.82 | |||||||||||||||||||||||||
| Loans held for sale: |
||||||||||||||||||||||||||||||||
| Fixed rate |
4,136 | — | — | — | — | — | 4,136 | 4,136 | ||||||||||||||||||||||||
| Average rate (%) |
4.21 | 4.21 | ||||||||||||||||||||||||||||||
| Investment securities: |
||||||||||||||||||||||||||||||||
| Fixed rate |
370 | 251 | — | 848 | 9,932 | 222,590 | 233,991 | 231,385 | ||||||||||||||||||||||||
| Average rate (%) |
7.45 | 7.33 | — | 3.50 | 2.99 | 3.36 | 3.36 | |||||||||||||||||||||||||
| Variable rate |
— | — | — | — | — | 41,892 | 41,892 | 41,844 | ||||||||||||||||||||||||
| Average rate (%) |
— | — | — | — | — | 1.93 | 1.93 | |||||||||||||||||||||||||
| Interest-bearing deposits: |
||||||||||||||||||||||||||||||||
| Variable rate |
20 | — | — | — | — | — | 20 | 20 | ||||||||||||||||||||||||
| Average rate (%) |
0.01 | — | — | — | — | — | 0.01 | |||||||||||||||||||||||||
| Liabilities: |
||||||||||||||||||||||||||||||||
| Savings and interest-bearing checking: |
||||||||||||||||||||||||||||||||
| Variable rate |
292,915 | — | — | — | — | — | 292,915 | 292,915 | ||||||||||||||||||||||||
| Average rate (%) |
0.83 | — | — | — | — | — | 0.83 | |||||||||||||||||||||||||
| Certificate of deposit: |
||||||||||||||||||||||||||||||||
| Fixed rate |
241,529 | 68,776 | 27,295 | 6,560 | 43,154 | — | 387,314 | 391,478 | ||||||||||||||||||||||||
| Average rate (%) |
1.61 | 2.10 | 2.32 | 3.07 | 2.81 | — | 1.90 | |||||||||||||||||||||||||
| Variable rate |
780 | — | — | — | — | — | 780 | 780 | ||||||||||||||||||||||||
| Average rate (%) |
0.50 | — | — | — | — | — | 0.50 | |||||||||||||||||||||||||
| Short-term borrowings: |
||||||||||||||||||||||||||||||||
| Fixed rate |
8,000 | — | — | — | — | — | 8,000 | 8,000 | ||||||||||||||||||||||||
| Average rate (%) |
2.42 | — | — | — | — | — | 2.42 | |||||||||||||||||||||||||
| Variable rate |
3,509 | — | — | — | — | — | 3,509 | 3,509 | ||||||||||||||||||||||||
| Average rate (%) |
1.00 | % | — | — | — | — | — | 1.00 | ||||||||||||||||||||||||
| Long-term borrowings: |
||||||||||||||||||||||||||||||||
| Fixed rate |
— | 9,000 | 9,500 | 6,000 | 7,500 | 2,500 | 34,500 | 34,954 | ||||||||||||||||||||||||
| Average rate (%) |
— | 2.64 | 3.02 | 1.49 | 1.84 | 2.21 | 2.34 | |||||||||||||||||||||||||
34
Non-interest Income
Non-interest income, principally charges and fees assessed for the use of our services, is a significant contributor to net income. The following table presents the components of non-interest income for 2010, 2009 and 2008.
Non-interest Income
| Year Ended December 31, | ||||||||||||
| 2010 | 2009 | 2008 | ||||||||||
| (Dollars in thousands) | ||||||||||||
| Service charges on deposit accounts |
$ | 3,418 | $ | 3,652 | $ | 3,500 | ||||||
| Other service charges and fees |
1,419 | 1,160 | 1,367 | |||||||||
| Mortgage origination fees |
1,283 | 950 | 1,035 | |||||||||
| Net gain (loss) on sale of securities |
5,508 | 2,565 | 218 | |||||||||
| Income from bank owned life insurance |
297 | 310 | 316 | |||||||||
| Other operating income |
70 | 12 | 373 | |||||||||
| Total non-interest income |
$ | 11,995 | $ | 8,649 | $ | 6,809 | ||||||
Non-interest income increased $3.3 million or 38.7% to $12.0 million in 2010 compared to $8.6 million for the same period in 2009. The increase in non-interest income for the year ending December 31, 2010 is primarily the result of an increase of $2.9 million in gains on the sale of securities compared to the same period in 2009. Service charges on deposit accounts decreased $234 thousand or 6.4% as we saw a decline in our overdraft protection fees. Other service charges and fees increased $259 thousand or 22.3% in 2010 compared to the prior year mainly due to increased investment brokerage fees of $295 thousand. Mortgage origination fees increased $333 thousand or 35.1% over 2009. The increase is mainly because we established a correspondent bank platform for our mortgage department in 2010 and we began originating loans in our name and selling them in the secondary market. Mortgage origination fees now include origination fees, servicing release premiums and commitment fees. Other operating income increased $58 thousand in 2010 compared to the prior year due to a gain on mortgage loan commitments.
Non-interest income increased $1.8 million or 26.4% to $8.6 million in 2009 compared to $6.8 million for the same period in 2008. The increase in non-interest income for the year ending December 31, 2009 was primarily the result of $2.6 million in gains on the sale of securities compared to $218 thousand for the same period in 2008. Service charges on deposit accounts were up by $152 thousand or 4.3% as we saw an increase in cardholder fees. Other service charges and fees decreased $207 thousand or 15.1% in 2009 compared to the prior year mainly due to decreased investment brokerage fees of $105 thousand. Mortgage origination fees decreased $85 thousand or 8.2% over 2008. Other operating income decreased $361 thousand in 2009 compared to the prior year. The main reason for this decrease was that 2008 included a nonrecurring Visa distribution in the amount of $386 thousand.
35
Non-interest Expense
Non-interest expense increased $3.7 million or 15.9% to $26.8 million in 2010 compared to $23.2 million in 2009 and non-interest expense increased $2.6 million or 12.6% in 2009 compared to $20.6 million in 2008. The following table presents the components of non-interest expense for 2010, 2009 and 2008.
Non-interest Expense
| Year Ended December 31, | ||||||||||||
| 2010 | 2009 | 2008 | ||||||||||
| (Dollars in thousands) | ||||||||||||
| Salaries |
$ | 9,832 | $ | 8,287 | $ | 8,161 | ||||||
| Retirement and other employee benefits |
2,924 | 2,488 | 2,706 | |||||||||
| Occupancy |
1,876 | 1,832 | 1,857 | |||||||||
| Equipment |
2,160 | 1,763 | 1,638 | |||||||||
| Professional fees |
936 | 832 | 717 | |||||||||
| Supplies |
221 | 216 | 312 | |||||||||
| Telephone |
663 | 642 | 679 | |||||||||
| FDIC Insurance |
1,445 | 1,689 | 384 | |||||||||
| Other outside services |
528 | 470 | 482 | |||||||||
| Net cost of real estate and repossessions acquired in settlement of loans |
1,104 | 1,345 | 145 | |||||||||
| Contract early termination fees |
1,141 | — | — | |||||||||
| Other |
4,010 | 3,588 | 3,552 | |||||||||
| Total |
$ | 26,840 | $ | 23,152 | $ | 20,633 | ||||||
Salary expense increased $1.5 million or 18.6% in 2010 compared to 2009. The increase is primarily the result of additions made to senior management and other management positions during the past twelve months and general cost of living and merit increases. Employee benefits increased $436 thousand or 17.5% in 2010 over the prior year principally due to the additional positions mentioned above and an increase in supplemental employee retirement plan expense. As of December 31, 2010, we had 239 full time equivalent employees and operated 25 full service banking offices and a mortgage loan origination office. At December 31, 2009 we had 219 full time equivalent employees and operated 24 full service banking offices, a loan production office and a mortgage loan origination office.
Equipment expense increased $397 thousand or 22.5% in 2010 mainly due to maintenance expense increasing $239 thousand and furniture and equipment rental expense increasing $68 thousand.
Professional fees, which include audit, legal and consulting fees, increased $104 thousand or 12.5% to $936 thousand for 2010 compared to $832 thousand in 2009. Legal fees increased $138 thousand year over year but were offset by consulting fees decreasing $1 thousand and audit fees decreasing $32 thousand during 2010 as compared to 2009.
FDIC insurance decreased $244 thousand in 2010 compared to 2009. The decrease is related to the special assessment that was levied on all banks by the FDIC in 2009.
Net cost of real estate and repossessions acquired in settlement of loans expense decreased $241 thousand to $1.1 million in 2010 compared to $1.3 million in 2009.
During 2010 we accrued an expense for contract early termination fees in the amount of $1.1 million. The Bank announced on August 12, 2010, that it had signed an extensive agreement with InfoTech Alliance Bank Services to implement the FIS integrated HORIZON banking system. As a result of this decision, it was determined that several existing multi year support and maintenance agreements with current vendors would be terminated early resulting in the accrual of the expenses in 2010.
36
Other operating expense increased $422 thousand in 2010 compared to 2009. The increase is related to increased director fees of $138 thousand due to an accrual of retirement benefits and an increase in franchise taxes of $122 thousand in 2010 as compared to 2009.
Salary expense increased $126 thousand or 1.5% in 2009 compared to 2008. The increase was the result of general cost of living and merit increases. Employee benefits decreased $218 thousand or 8.1% in 2009 over 2008 principally due a decrease in supplemental employee retirement plan expense and a decrease in employee incentive expense.
Equipment expense increased $125 thousand or 7.6% in 2009 compared to 2008 mainly due to maintenance expense increasing $73 thousand and depreciation expense increasing $34 thousand.
Professional fees, which include audit, legal and consulting fees, increased $115 thousand or 16.0% to $832 thousand for 2009 compared to $717 thousand in 2008. Legal fees remained relatively flat only increasing $4 thousand from 2008 to 2009. Consulting fees increased $33 thousand in 2009 compared to 2008 mainly the result of fees associated with the search for our new president and CEO. Audit fees increased $36 thousand during 2009 as compared to 2008 due to fees associated with an IRS audit and various fees associated with other consultations.
Supplies expense decreased $96 thousand in 2009 compared to same period of 2008 primarily the result of decreases at our bankcard center and at our corporate office.
FDIC insurance increased $1.3 million in 2009 compared to 2008 due to increased assessment rates and an increase in our deposit balances. Also, $405 thousand of the increase is related to the special assessment that was levied on all banks by the FDIC.
Net cost of real estate and repossessions acquired in settlement of loans expense increased $1.2 million to $1.3 million in 2009 compared to $145 thousand in 2008. The majority of this expense was related to the disposition of collateral on two large real estate loans.
Income Taxes
For the year-ended December 31, 2010, we recorded income tax benefit of $766 thousand, compared to a benefit of $357 thousand and an expense of $580 thousand for the years ended December 31, 2009 and 2008, respectively. Our effective tax rate for the years ended December 31, 2010, 2009 and 2008 was (814.9%), (31.2%) and 14.5%, respectively. The effective tax rate in 2010, 2009 and 2008 also differs from the federal statutory rate of 34.0% primarily due to tax-exempt interest income we earned on tax-exempt securities in our investment portfolio. For more information see disclosure on income taxes in note 6.
The valuation allowance for deferred tax assets was $43 thousand for December 31, 2010, $43 thousand for December 31, 2009 and $105 thousand for December 31, 2008. The valuation allowance was for certain capital losses related to perpetual preferred stock issued by FNMA and FHLMC in 2004. These losses are capital in character and we may not have current capital gain capacity to offset these losses.
Financial Condition at December 31, 2010, 2009 and 2008
Our total assets were $919.9 million at December 31, 2010, $888.7 million at December 31, 2009 and $841.9 million at December 31, 2008. Asset growth during 2010 was funded primarily by an increase in interest-bearing demand accounts of $121.0 million. For the year ended December 31, 2010 our loans declined $10.2 million which can be attributed to weak economic conditions. For the year ended December 31, 2009, we grew our loans $39.0 million due to favorable loan demand in our market areas and our addition of new branches during 2007 and 2008. For the years ended December 31, 2010 and 2009, we grew our deposits $31.2 million and $125.6 million, respectively. The deposit growth was mainly through interest-bearing demand deposits in 2010 and mainly through wholesale certificates of deposit in 2009, the proceeds of which were invested in interest-earning assets.
We believe our financial condition is sound. The following discussion focuses on the factors considered by us to be important in assessing our financial condition.
37
The following table sets forth the relative composition of our balance sheets at December 31, 2010, 2009 and 2008.
Distribution of Assets and Liabilities
| December 31, | ||||||||||||||||||||||||
| 2010 | 2009 | 2008 | ||||||||||||||||||||||
| (Dollars in thousands) | ||||||||||||||||||||||||
| Assets: | Amount | % | Amount | % | Amount | % | ||||||||||||||||||
| Loan, gross |
$ | 567,631 | 61.7 | % | $ | 577,791 | 65.0 | % | $ | 538,836 | 64.0 | % | ||||||||||||
| Loans held for sale |
4,136 | 0.4 | — | 0.0 | — | 0.0 | ||||||||||||||||||
| Investment securities |
273,229 | 29.7 | 239,332 | 26.9 | 239,709 | 28.4 | ||||||||||||||||||
| Interest-bearing deposits |
20 | 0.0 | 870 | 0.1 | 902 | 0.1 | ||||||||||||||||||
| FHLB stock |
4,571 | 0.5 | 5,116 | 0.6 | 3,859 | 0.5 | ||||||||||||||||||
| Federal funds sold |
8,415 | 0.9 | 7,865 | 0.9 | — | 0.0 | ||||||||||||||||||
| Total earning assets |
858,002 | 93.2 | 830,974 | 93.5 | 783,306 | 93.0 | ||||||||||||||||||
| Allowance for loan losses |
(13,247 | ) | (1.4 | ) | (9,725 | ) | (1.1 | ) | (5,931 | ) | (0.7 | ) | ||||||||||||
| Non-interest-bearing deposits and cash |
11,731 | 1.3 | 9,076 | 1.0 | 15,897 | 1.9 | ||||||||||||||||||
| Bank premises and equipment, net |
26,636 | 2.9 | 25,329 | 2.9 | 25,737 | 3.1 | ||||||||||||||||||
| Other assets |
36,747 | 4.0 | 33,066 | 3.7 | 22,842 | 2.7 | ||||||||||||||||||
| Total assets |
$ | 919,869 | 100.0 | % | $ | 888,720 | 100.0 | % | $ | 841,851 | 100.0 | % | ||||||||||||
| Liabilities and Shareholders’ Equity: |
||||||||||||||||||||||||
| Demand deposits |
$ | 104,932 | 11.4 | % | $ | 93,492 | 10.5 | % | $ | 90,197 | 10.7 | % | ||||||||||||
| Savings, NOW and Money Market deposits |
292,915 | 31.8 | 161,551 | 18.2 | 115,893 | 13.8 | ||||||||||||||||||
| Time deposits of $100,000 or more |
92,889 | 10.1 | 198,388 | 22.3 | 224,185 | 26.6 | ||||||||||||||||||
| Other time deposits |
295,205 | 32.1 | 301,299 | 33.9 | 198,877 | 23.6 | ||||||||||||||||||
| Total deposits |
785,941 | 85.4 | 754,730 | 84.9 | 629,152 | 74.7 | ||||||||||||||||||
| Short-term borrowings |
11,509 | 1.3 | 22,910 | 2.6 | 57,716 | 6.8 | ||||||||||||||||||
| Long-term obligations |
34,500 | 3.7 | 21,000 | 2.4 | 26,000 | 3.1 | ||||||||||||||||||
| Accrued interest and other liabilities |
7,025 | 0.8 | 5,705 | 0.6 | 61,040 | 7.3 | ||||||||||||||||||
| Total liabilities |
838,975 | 91.2 | 804,345 | 90.5 | 773,908 | 91.9 | ||||||||||||||||||
| Shareholders’ equity |
80,894 | 8.8 | 84,375 | 9.5 | 67,943 | 8.1 | ||||||||||||||||||
| Total liabilities and share-holders’ equity |
$ | 919,869 | 100.0 | % | $ | 888,720 | 100.0 | % | $ | 841,851 | 100.0 | % | ||||||||||||
Loans
As of December 31, 2010, total loans decreased to $567.6 million, down 1.8% from total loans of $577.8 million at December 31, 2009. Construction and land development loans decreased from $125.9 million in 2009 to $90.1 million in 2010. The decrease in construction and development loans was a function of the continuing decline of economic conditions. Commercial and residential real estate loans increased from $335.0 million in 2009 to $364.6 million in 2010. The growth in residential and commercial real estate loans was due to a continued focus on growth by the bank in owner-occupied small business lending during the year.
As of December 31, 2009, total loans increased to $577.8 million, up 7.2% from total loans of $538.8 million at December 31, 2008. Construction and land development loans decreased from $132.5 million in 2008 to $125.9 million in 2009. The decrease in construction and development loans was a function of the declining economic conditions during the past two years. Commercial and residential real estate loans increased from $299.0 million in 2008 to $335.0 million in 2009. The growth in residential and commercial real estate loans was due to the growth in branches and a focus on growth by the bank in owner-occupied small business lending during the year.
At December 31, 2010, our loan portfolio contained no foreign loans, and we believe the portfolio is adequately diversified. Real estate loans represent approximately 80.1% of our loan portfolio. However, many of our real estate loans,
38
while secured by real estate, were made for various other commercial, agricultural and consumer purposes (which may or may not be related to our real estate collateral). Real estate loans are primarily loans secured by real estate, including mortgage and construction loans. Residential mortgage loans accounted for approximately $120.3 million or 26.4% of our real estate loans at December 31, 2010. Commercial loans are spread throughout a variety of industries, with no particular industry or group of related industries accounting for a significant portion of the commercial loan portfolio. At December 31, 2010, our ten largest loans accounted for approximately 6.91% of our loans outstanding. As of December 31, 2010, we had outstanding loan commitments of approximately $105.3 million. The amounts of loans outstanding at the indicated dates are shown in the following table according to loan type.
Loan Portfolio Composition
| At December 31, | ||||||||||||||||||||
| 2010 | 2009 | 2008 | 2007 | 2006 | ||||||||||||||||
| (Dollars in thousands) | ||||||||||||||||||||
| Real estate—construction and land development |
$ | 90,145 | $ | 125,856 | $ | 132,525 | $ | 104,339 | $ | 116,279 | ||||||||||
| Real estate—commercial, residential and other(1) |
364,648 | 335,004 | 298,959 | 234,812 | 211,440 | |||||||||||||||
| Installment loans |
4,209 | 4,351 | 5,115 | 5,808 | 6,109 | |||||||||||||||
| Credit card and related plans |
2,261 | 2,451 | 2,214 | 2,002 | 2,167 | |||||||||||||||
| Commercial and all other loans |
106,368 | 110,129 | 100,023 | 107,237 | 81,948 | |||||||||||||||
| Total |
$ | 567,631 | $ | 577,791 | $ | 538,836 | $ | 454,198 | $ | 417,943 | ||||||||||
| (1) | The majority of the commercial real estate is owner-occupied and operated. |
Maturities and Sensitivities of Loans to Changes in Interest Rates
The following table sets forth the maturity distribution of our loans as of December 31, 2010. A significant majority of our loans maturing after one year reprice at two and three year intervals. In addition, approximately 62.3% of our loan portfolio is comprised of variable rate loans.
Loan Maturities at December 31, 2010
| 1 year or less |
Due after 1 year through 5 years |
Due after 5 years | Total | |||||||||||||||||||||
| Floating | Fixed | Floating | Fixed | |||||||||||||||||||||
| (Dollars in thousands) | ||||||||||||||||||||||||
| Real estate—construction and land development |
$ | 52,663 | $ | 21,647 | $ | 13,274 | $ | 2,270 | $ | 291 | $ | 90,145 | ||||||||||||
| Real estate—commercial, residential and other |
55,926 | 152,603 | 92,263 | 42,966 | 20,890 | 364,648 | ||||||||||||||||||
| Installment loans |
526 | 257 | 2,912 | — | 514 | 4,209 | ||||||||||||||||||
| Credit card and related plans |
1,227 | 274 | 31 | 41 | 688 | 2,261 | ||||||||||||||||||
| Commercial and all other loans |
58,665 | 21,933 | 11,285 | 3,299 | 11,186 | 106,368 | ||||||||||||||||||
| Total |
$ | 169,007 | $ | 196,714 | $ | 119,765 | $ | 48,576 | $ | 33,569 | $ | 567,631 | ||||||||||||
Allowance for Loan Losses
We consider the allowance for loan losses adequate to cover estimated probable loan losses relating to the loans outstanding as of each reporting period. However, the procedures and methods used in the determination of the allowance necessarily rely upon various judgments and assumptions about economic conditions and other factors affecting our loans. In addition, various regulatory agencies, as an integral part of their examination process, periodically review our allowance for loan losses. Those agencies may require us to recognize adjustments to the allowance for loan losses based on their judgments about the information available to them at the time of their examinations. No assurance can be given that we will not in any particular period sustain loan losses that are sizable in relation to the amount reserved or that subsequent evaluations of the loan portfolio, in light of conditions and factors then prevailing, will not require significant changes in the allowance for loan losses or future charges to earnings.
39
The following table summarizes the balances of loans outstanding, average loans outstanding, changes in the allowance arising from charge-offs and recoveries by category and additions to the allowance that have been charged to expense.
Analysis of the Allowance for Loan Losses
| Year ended December 31, | ||||||||||||||||||||
| 2010 | 2009 | 2008 | 2007 | 2006 | ||||||||||||||||
| (Dollars in thousands) | ||||||||||||||||||||
| Total loans outstanding at end of year—gross |
$ | 567,631 | $ | 577,791 | $ | 538,836 | $ | 454,198 | $ | 417,943 | ||||||||||
| Average loans outstanding—gross |
$ | 575,374 | $ | 562,095 | $ | 504,426 | $ | 431,579 | $ | 409,565 | ||||||||||
| Allowance for loan losses at beginning of year |
$ | 9,725 | $ | 5,931 | $ | 4,083 | $ | 4,725 | $ | 4,650 | ||||||||||
| Loans charged off: |
||||||||||||||||||||
| Real estate |
8,211 | 7,032 | 381 | 433 | — | |||||||||||||||
| Installment loans |
21 | 18 | 64 | 43 | 68 | |||||||||||||||
| Credit cards and related plans |
44 | 19 | — | — | — | |||||||||||||||
| Commercial and all other loans |
1,469 | 497 | 253 | 161 | 59 | |||||||||||||||
| Total charge-offs |
9,745 | 7,566 | 698 | 637 | 127 | |||||||||||||||
| Recoveries of loans previously charged off: |
||||||||||||||||||||
| Real estate |
130 | 72 | 1 | — | 7 | |||||||||||||||
| Installment loans |
7 | 3 | 4 | 18 | 16 | |||||||||||||||
| Credit cards and related plans |
1 | 4 | 9 | — | 3 | |||||||||||||||
| Commercial and all other loans |
149 | 181 | 82 | 76 | 65 | |||||||||||||||
| Total recoveries |
287 | 260 | 96 | 94 | 91 | |||||||||||||||
| Net charge-offs |
9,458 | 7,306 | 602 | 543 | 36 | |||||||||||||||
| Provision for loan losses |
12,980 | 11,100 | 2,450 | (99 | ) | 351 | ||||||||||||||
| Adjustment for unfunded loans(1) |
— | — | — | — | (240 | ) | ||||||||||||||
| Allowance for loan losses at end of year |
$ | 13,247 | $ | 9,725 | $ | 5,931 | $ | 4,083 | $ | 4,725 | ||||||||||
| Ratios: |
||||||||||||||||||||
| Net charge-offs during year to average loans outstanding |
1.64 | % | 1.30 | % | 0.12 | % | 0.13 | % | 0.01 | % | ||||||||||
| Allowance for loan losses to loans at year end(2) |
2.33 | 1.68 | 1.10 | 0.90 | 1.13 | |||||||||||||||
| Allowance for loan losses to nonperforming loans |
60 | 66 | 59 | 877 | 2,568 | |||||||||||||||
| (1) | $240 thousand allocated to approximately $80 million of committed but unfunded loan obligations was reclassed to other liabilities from the Bank’s allowance for loan losses. |
| (2) | As a result of the Interagency Policy Statement on the Allowance for Loan and Lease Losses jointly issued in December 2006 by the federal banking regulatory agencies, management re-evaluated and adjusted the methodology it used to estimate the allowance for loan losses during the second quarter of 2007. |
At December 31, 2010, our allowance for loan losses as a percentage of loans was 2.33%, up from 1.68% at December 31, 2009. The increase in part reflects the increase in our historical loss rate as our charge-offs have increased during the past year. Also, the increase reflects the recognition of additional loans identified as being impaired. In evaluating the allowance for loan losses, we prepare an analysis of our current loan portfolio through the use of historical loss rates, homogeneous risk analysis grouping to include probabilities for loss in each group by risk grade, estimation of years to impairment in each homogeneous grouping, analysis of internal credit processes, past due loan portfolio performance and overall economic conditions, both regionally and nationally.
40
Historical loss calculations for each homogeneous risk group are based on a three year average loss ratio calculation with the most recent quarter’s loss history included in the model. The impact is to more quickly recognize and increase the loss history in a respective grouping. For those groups with little or no loss history, management increases the historical factor through a positive adjustment to more accurately represent current economic conditions and their potential impact on that particular loan group.
Homogeneous loan groups are assigned risk factors based on their perceived loss potential, current economic conditions and on their respective risk ratings. The probability of loss is increased as the risk grade increases within each risk grouping to more accurately reflect the Bank’s exposure in that particular group of loans. The Bank utilizes a system of eight possible risk ratings. The risk ratings are established based on perceived probability of loss. All loans risk rated “substandard”, “doubtful” and “loss” are removed from their homogeneous group and individually analyzed for impairment. Other groups of loans based on loan size may be selected for impairment review. Loans are considered impaired if, based on current information and events, it is probable that the bank will be unable to collect the scheduled payments of principal and interest when due according to the contractual terms of the loan agreement. The measurement of impaired loans is based on either the fair value of the underlying collateral, the present value of the future cash flows discounted at the historical effective interest rate stipulated in the loan agreement, or the estimated market value of the loan. In measuring the fair value of the collateral, management uses a comparison to the recent selling price of similar assets, which is consistent with those that would be utilized by unrelated third parties.
A portion of the Bank’s allowance for loan losses is not allocated to any specific category of loans. This general portion of the allowance reflects the elements of imprecision and estimation risk inherent in the calculation of the overall allowance. Due to the subjectivity involved in determining the overall allowance, including the portion determined through general qualitative and quantitative internal and external factors, the general portion may fluctuate from period to period based on management’s evaluation of the factors affecting the assumptions used in calculating the allowance, including historical loss experience, current and expected economic conditions and geographic conditions. The Bank has identified an acceptable range for this general portion to be 5% to 15% of the total reserve. While we believe that our management uses the best information available to determine the allowance for loan losses, unforeseen market conditions could result in adjustments to the allowance for loan losses, and net income could be significantly affected, if circumstances differ substantially from the assumptions used in making the final determination. Because these factors and management’s assumptions are subject to change, the allocation is not necessarily indicative of future loan portfolio performance.
Unsecured loans are charged-off against the Bank’s allowance for loan losses as soon as the loan becomes uncollectible. Unsecured loans are considered uncollectible when no regularly scheduled monthly payment has been made within three months, the loan matured over 90 days ago and has not been renewed or extended or the borrower files for bankruptcy. Secured loans are considered uncollectible when the liquidation of collateral is deemed to be the most likely source of repayment. Once secured loans reach 90 days past due, they are placed into non-accrual status. If the loan is deemed to be collateral dependent, the principal balance is written down immediately to reflect the current market valuation based on current independent appraisal. Included in the write-down is the estimated expense to liquidate the property and typically an additional allowance for the foreclosure discount. Generally, if the loan is unsecured the loan must be charged-off in full while if it is secured the loan is charged down to the net liquidation value of the collateral.
Net charge-offs of $9.5 million in 2010 increased $2.2 million and $8.9 million when compared to 2009 and 2008, respectively. Net charge-offs from real estate secured loans were $8.1 million, $7.0 million and $380 thousand for 2010, 2009 and 2008, respectively. Asset quality remains a top priority of the Bank. For the year ending December 31, 2010, net loan charge-offs were 1.64% of average loans compared to 1.30% for the year ending December 31, 2009. Declining economic conditions, particularly in our southern coastal markets, resulted in an increased number of impaired collateral dependant loans which resulted in a portion of these loans being charged-off. The increase in the allowance for loan losses to loans to 2.33% at December 31, 2010 from 1.68% at December 31, 2009 reflects the increase in our historical loss rate as our charge-offs have increased during the past year. Also, the increase reflects the recognition of additional loans identified as being impaired. The ratio of our allowance for loan losses to nonperforming loans decreased to 60% as of December 31, 2010 compared to 66% at December 31, 2009. The decrease is the result of our allowance increasing approximately 36% year over year while our nonperforming loans have increased approximately 50% year over year.
41
Construction, land and development (“CLD”) loans make up 15.9% of the Bank’s loan portfolio. This sector of the economy has been particularly impacted by declines in housing activity, and has had a disproportionate impact on the credit quality of the Company. The table below shows trends of CLD loans, along with ratios relating to their relative credit quality.
| CLD Loans | All Other Loans | Total | ||||||||||||||||||
| Balance | % of Total | Balance | % of Total | Loans | ||||||||||||||||
| Dollars in thousands | ||||||||||||||||||||
| Balances at December 31, 2010 |
$ | 90,145 | 15.9 | % | $ | 477,486 | 84.1 | % | $ | 567,631 | ||||||||||
| Impaired loans |
15,940 | 60.7 | % | 10,312 | 39.3 | % | 27,332 | |||||||||||||
| Allocated Reserves |
6,168 | 52.6 | % | 5,557 | 47.4 | % | 11,725 | |||||||||||||
| YTD Net Charge-offs |
5,865 | 62.0 | % | 3,593 | 38.0 | % | 9,458 | |||||||||||||
| Nonperforming loans (NPL) |
12,623 | 57.1 | % | 9,467 | 42.9 | % | 22,090 | |||||||||||||
| NPL as % of loans |
14.0 | % | 2.0 | % | 3.9 | % | ||||||||||||||
While balances of CLD loans make up 15.9% of the Bank’s loan portfolio, they represent 60.7% and 62.0% of the Bank’s impaired loans and YTD net charge-offs, respectively. CLD loans represent 57.1% of the Bank’s nonperforming loans and 52.6% of the Bank’s allocated allowance for loan loss is reserved for to CLD loans.
Allocation of the Allowance for Loan Losses
The following table sets forth the allocation of allowance for loan losses and percent of our total loans represented by the loans in each loan category for each of the years presented. The reserves allocated to real estate increased during 2010, 2009 and 2008 as declining economic conditions, particularly in our southern coastal markets, resulted in an increased number of impaired collateral dependant loans.
Allocation of the Allowance for Loan Losses
| December 31, | ||||||||||||||||||||||||||||||||||||||||
| 2010 | 2009 | 2008 | 2007 | 2006 | ||||||||||||||||||||||||||||||||||||
| Amount | Percent | Amount | Percent | Amount | Percent | Amount | Percent | Amount | Percent | |||||||||||||||||||||||||||||||
| (Dollars in thousands) | ||||||||||||||||||||||||||||||||||||||||
| Real estate |
$ | 10,653 | 90.8 | % | $ | 7,572 | 91.0 | % | $ | 4,762 | 80.1 | % | $ | 2,642 | 74.7 | % | $ | 3,630 | 78.4 | % | ||||||||||||||||||||
| Installment loans |
12 | 0.1 | 23 | 0.3 | 25 | 0.9 | 73 | 1.3 | 233 | 1.5 | ||||||||||||||||||||||||||||||
| Credit cards and related plans |
21 | 0.2 | 13 | 0.2 | 16 | 0.4 | 38 | 0.4 | 8 | 0.5 | ||||||||||||||||||||||||||||||
| Commercial and all other loans |
1,039 | 8.9 | 708 | 8.5 | 507 | 18.6 | 773 | 23.6 | 817 | 19.6 | ||||||||||||||||||||||||||||||
| Total allocated |
11,725 | 100.0 | % | 8,316 | 100.0 | % | 5,310 | 100.0 | % | 3,526 | 100.0 | % | 4,688 | 100.0 | % | |||||||||||||||||||||||||
| Unallocated1 |
1,522 | 1,409 | 621 | 557 | 37 | |||||||||||||||||||||||||||||||||||
| Total |
$ | 13,247 | $ | 9,725 | $ | 5,931 | $ | 4,083 | $ | 4,725 | ||||||||||||||||||||||||||||||
| 1. | Beginning in 2009 unallocated reserve was reflected in our homogenous pool estimates based on general qualitative and quantitative internal and external factors. |
Loans Considered Impaired
We review our nonperforming loans and other groups of loans based on loan size or other factors for impairment. At December 31, 2010, we had loans totaling $26.3 million (which includes $21.0 million in nonperforming loans) which were considered to be impaired compared to $23.9 million at December 31, 2009. Loans are considered impaired if, based on current information, circumstances or events, it is probable that the Bank will not collect the scheduled payments of principal and interest when due according to the contractual terms of the loan agreement. However, treating a loan as impaired does not necessarily mean that we expect to incur a loss on that loan, and our impaired loans may include loans that currently are performing in accordance with their terms. For example, if we believe it is probable that a loan will be collected, but not according to its original agreed upon payment schedule, we may treat that loan as impaired
42
even though we expect that the loan will be repaid or collected in full. As indicated in the table below, when we believe a loss is probable on a non-collateral dependent impaired loan, a portion of our reserve is allocated to that probable loss. If the loan is deemed to be collateral dependent, the principal balance is written down immediately to reflect the current market valuation based on current independent appraisal.
The following table sets forth the number and volume of loans net of previous charge-offs considered impaired and their associated reserve allocation, if any, at December 31, 2010. Twenty-two non-accrual loans with a total balance of $1.1 million were not removed from their homogeneous group and individually analyzed for impairment because their individual loan balances were less than $100 thousand.
| Number of Loans |
Loan Balances Outstanding |
Allocated Reserves |
||||||||||
| (Dollars in millions) | ||||||||||||
| Non-accrual loans |
47 | $ | 14.8 | $ | 0.5 | |||||||
| Restructured loans |
9 | 6.2 | 1.4 | |||||||||
| Total nonperforming loans |
56 | $ | 21.0 | $ | 1.9 | |||||||
| Other impaired loans with allocated reserves |
7 | 2.6 | 0.5 | |||||||||
| Impaired loans without allocated reserves |
2 | 2.7 | — | |||||||||
| Total impaired loans |
65 | $ | 26.3 | $ | 2.4 | |||||||
Nonperforming Assets and Past Due Loans
The following table summarizes our nonperforming assets and past due loans at the dates indicated.
Nonperforming Assets and Past Due Loans
| December 31, | ||||||||||||||||||||
| 2010 | 2009 | 2008 | 2007 | 2006 | ||||||||||||||||
| (Dollars in thousands) | ||||||||||||||||||||
| Non-accrual loans |
$ | 15,896 | $ | 13,343 | $ | 9,957 | $ | 393 | $ | 130 | ||||||||||
| Loans past due 90 days or more days still accruing |
— | — | — | — | — | |||||||||||||||
| Restructured loans |
6,193 | 1,353 | 24 | 73 | 54 | |||||||||||||||
| Other real estate owned & repossessions |
4,536 | 5,443 | 3,724 | 66 | 240 | |||||||||||||||
| Total |
$ | 26,625 | $ | 20,139 | $ | 13,705 | $ | 532 | $ | 424 | ||||||||||
A loan is placed on non-accrual status when, in our judgment, the collection of interest income appears doubtful or the loan is past due 90 days or more. Interest receivable that has been accrued and is subsequently determined to have doubtful collectability is charged to the appropriate interest income account. Interest on loans that are classified as non-accrual is recognized when received. In some cases, where borrowers are experiencing financial difficulties, loans may be restructured to provide terms significantly different from the original terms.
At December 31, 2010 and 2009, nonperforming assets were approximately 2.89% and 2.27%, respectively, of total assets outstanding at such dates. The general downturn in the overall economy has contributed to the overall increase in nonperforming assets reflected at year end. The impact of our impaired loans at December 31, 2010, on our interest income was approximately $1.1 million as we would have accrued $1.7 million in interest income versus the $0.6 million recognized.
Any loans that are classified for regulatory purposes as loss, doubtful, substandard or special mention, and that are not included as nonperforming loans, do not (i) represent or result from trends or uncertainties that management reasonably expects will materially impact future operating results; or (ii) represent material credits about which management has any information which causes management to have serious doubts as to the ability of such borrower to comply with the loan repayment terms.
43
Off-Balance Sheet Arrangements and Contractual Obligations
We have various financial instruments (outstanding commitments) with off-balance sheet risk that are issued in the normal course of business to meet the financing needs of our customers. These financial instruments include commitments to extend credit and standby letters of credit. We also have contractual cash obligations and commitments, including certificates of deposit, other borrowings, operating leases and loan commitments. The following tables set forth our commercial commitments and contractual payment obligations as of December 31, 2010.
| Amount of Commitment Expiration per Period | ||||||||||||||||||||
| Commercial Commitments |
Total | Less than 1 year |
1-3 years |
4-5 years |
More than 5 years |
|||||||||||||||
| (Dollars in thousands) | ||||||||||||||||||||
| Loan commitments and lines of credit |
$ | 103,420 | $ | 66,253 | $ | 9,469 | $ | 3,819 | $ | 23,879 | ||||||||||
| Standby letters of credit |
1,864 | 1,684 | 121 | — | 59 | |||||||||||||||
| Total commercial commitments |
$ | 105,284 | $ | 67,937 | $ | 9,590 | $ | 3,819 | $ | 23,938 | ||||||||||
| Amount of Payments Due per Period | ||||||||||||||||||||
| Contractual Obligations |
Total | Less than 1 year |
1-3 years |
4-5 years |
More than 5 years |
|||||||||||||||
| (Dollars in thousands) | ||||||||||||||||||||
| Short-term borrowings |
$ | 11,509 | $ | 11,509 | $ | — | $ | — | $ | — | ||||||||||
| Long-term borrowings |
34,500 | — | 18,500 | 13,500 | 2,500 | |||||||||||||||
| Operating leases |
2,897 | 536 | 1,070 | 557 | 734 | |||||||||||||||
| Deposits |
785,941 | 640,156 | 96,071 | 49,714 | — | |||||||||||||||
| Total contractual obligations |
$ | 834,847 | $ | 652,201 | $ | 115,641 | $ | 63,771 | $ | 3,234 | ||||||||||
Investment Portfolio
The composition of our securities portfolio reflects our investment strategy of maintaining an appropriate level of liquidity while providing a relatively stable source of income. Our securities portfolio also provides a balance to interest rate risk and credit risk in other categories of the balance sheet while providing a vehicle for investing available funds, furnishing liquidity and supplying securities to pledge as required collateral for certain deposits and borrowed funds. We use two categories to classify our securities: “held-to-maturity” and “available-for-sale.” Currently, none of our investments are classified as held-to-maturity. While we have no plans to liquidate a significant amount of our securities, the securities classified as available-for-sale may be sold to meet liquidity needs should management deem it to be in our best interest.
Our investment securities totaled $273.2 million at December 31, 2010, $239.3 million at December 31, 2009 and $239.7 million at December 31, 2008. The investment portfolio increased $33.9 million or 14.1% from December 31, 2009 when compared to December 31, 2010. The balance of the investment portfolio at December 31, 2009 compared to December 31, 2008 remained flat. Additions to the investment securities portfolio depend to a large extent on the availability of investable funds that are not otherwise needed to satisfy loan demand. Investable funds not otherwise utilized are temporarily invested as federal funds sold or as interest-bearing balances at other banks, the level of which is affected by such considerations as near-term loan demand and liquidity needs.
44
The carrying values of investment securities held by us at the dates indicated are summarized as follows:
Investment Portfolio Composition
| December 31, | ||||||||||||||||||||||||
| 2010 | Percentage | 2009 | Percentage | 2008 | Percentage | |||||||||||||||||||
| (Dollars in thousands) | ||||||||||||||||||||||||
| Securities available-for-sale: |
||||||||||||||||||||||||
| Government-sponsored enterprises and FFCB bonds |
$ | 24,781 | 9.1 | % | $ | 35,843 | 15.0 | % | $ | 29,524 | 12.3 | % | ||||||||||||
| Collaterized mortgage obligations |
21,683 | 7.9 | 25,285 | 10.6 | 19,129 | 8.0 | ||||||||||||||||||
| Corporate bonds |
28,527 | 10.4 | 5,860 | 2.5 | 6,888 | 2.9 | ||||||||||||||||||
| Mortgage-backed securities |
128,407 | 47.0 | 92,851 | 38.8 | 148,649 | 62.0 | ||||||||||||||||||
| SBA-backed securities |
56,853 | 20.8 | 32,665 | 13.6 | 1,630 | 0.7 | ||||||||||||||||||
| Tax-exempt municipal securities |
12,978 | 4.8 | 46,022 | 19.2 | 33,209 | 13.8 | ||||||||||||||||||
| Equity securities |
— | — | 806 | 0.3 | 680 | 0.3 | ||||||||||||||||||
| Total investments |
$ | 273,229 | 100.0 | % | $ | 239,332 | 100.0 | % | $ | 239,709 | 100.0 | % | ||||||||||||
The following table shows maturities of the carrying values and the weighted-average yields of investment securities held by us at December 31, 2010.
Investment Portfolio Maturity Schedule
| 3 months or less |
Over 3 months through 1 year |
Over 1 year through 5 years |
Over 5 years but within 10 years |
Over 10 years |
Total/ Yield |
|||||||||||||||||||
| Amount/ Yield |
Amount/ Yield |
Amount/ Yield |
Amount/ Yield |
Amount/ Yield |
||||||||||||||||||||
| (Dollars in thousands) | ||||||||||||||||||||||||
| Securities available-for-sale: |
||||||||||||||||||||||||
| Government-sponsored enterprises and FFCB bonds |
$ | — | $ | — | $ | 1,971 | $ | 22,810 | $ | — | $ | 24,781 | ||||||||||||
| — | % | — | % | 2.25 | % | 2.81 | % | — | % | 2.77 | % | |||||||||||||
| Collaterized mortgage obligations(1) |
78 | 3,399 | 11,539 | 6,667 | — | 21,683 | ||||||||||||||||||
| 5.27 | 2.78 | 1.43 | 2.86 | — | 2.09 | |||||||||||||||||||
| Corporate bonds |
— | — | 8,712 | 19,815 | — | 28,527 | ||||||||||||||||||
| — | — | 3.20 | 4.39 | — | 4.04 | |||||||||||||||||||
| Mortgage-backed securities(1) |
— | — | 80,510 | 20,244 | 27,653 | 128,407 | ||||||||||||||||||
| — | — | 2.91 | 2.70 | 3.31 | 2.96 | |||||||||||||||||||
| SBA-backed |
— | — | — | 5,973 | 50,880 | 56,853 | ||||||||||||||||||
| — | — | — | 1.49 | 3.21 | 3.03 | |||||||||||||||||||
| Tax-exempt municipal securities(2) |
100 | 272 | 254 | 5,606 | 6,746 | 12,978 | ||||||||||||||||||
| 7.59 | 7.39 | 7.33 | 5.89 | 5.77 | 5.90 | |||||||||||||||||||
| Total investments |
$ | 178 | $ | 3,671 | $ | 102,986 | $ | 81,115 | $ | 85,279 | $ | 273,229 | ||||||||||||
| 6.58 | % | 3.12 | % | 2.76 | % | 3.29 | % | 3.44 | % | 3.14 | % | |||||||||||||
| (1) | Mortgage-backed securities (MBS) and collaterized mortgage obligations (CMO) maturities are based on the average life at the projected prepayment assumptions. All other bond maturities are based on maturity date. |
| (2) | Yields on tax-exempt investments have been adjusted to a fully taxable-equivalent basis (FTE) using the federal income tax rate of 34%. |
The weighted average yields shown are calculated on the basis of cost and effective yields for the scheduled maturity of each security. At December 31, 2010, the market value of the investment portfolio was approximately $2.7 million below its book value, which is primarily the result of higher market interest rates compared to the interest rates on the investments in the portfolio.
45
We currently have the ability to hold our available-for-sale investment securities to maturity. However, should conditions change, we may sell unpledged securities. We consider the overall quality of the securities portfolio to be high. All securities held are traded in liquid markets. As of December 31, 2010, we owned securities from issuers in which the aggregate amortized cost from such issuers exceeded 10% of our shareholders’ equity. As of December 31, 2010 the amortized cost and market value of the securities from each issuer were as follows:
| Amortized Cost | Market Value | |||||||
| (Dollars in thousands) | ||||||||
| Federal National Mortgage Corporation |
$ | 82,776 | $ | 82,373 | ||||
| Federal Home Loan Mortgage Corporation |
39,199 | 39,089 | ||||||
| Federal Home Loan Banks |
16,339 | 15,841 | ||||||
| Government National Mortgage Association |
35,355 | 34,971 | ||||||
| Small Business Administration |
57,362 | 56,853 | ||||||
At December 31, 2010, we held $9.0 million in bank owned life insurance, compared to $8.7 million at December 31, 2009.
Deposits
Deposits increased to $785.9 million, up 4.1% as of December 31, 2010 compared to deposits of $754.7 million at December 31, 2009. Non-interest-bearing deposits increased $11.4 million from year-end 2009 to year-end 2010, while total interest-bearing deposits increased $19.8 million over the same period. The increase came from interest- bearing demand deposits. During 2010, we experienced a 150% increase of public funds interest-bearing demand deposits as municipalities desiring to maintain more liquidity moved monies from lower rate certificates of deposits into highly liquid money market accounts at favorable interest rates. Time deposits, including wholesale time deposits, decreased $111.6 million year over year. Time deposits of less than $100,000 decreased $6.1 million and time deposits of $100,000 or more decreased $105.5 million as we made a strategic decision to reduce the reliance on large volatile time deposits. We believe that we can improve our core deposit funding by improving our branch network and providing more convenient opportunities for customers to bank with us. We anticipate that our deposits will continue to increase throughout 2011.
Total deposits at December 31, 2009 increased $125.5 million or 19.9% compared to total deposits of $629.2 million at December 31, 2008. Non-interest-bearing deposits increased $3.3 million from year-end 2008 to year-end 2009, while total interest-bearing deposits increased $122.3 million over the same period. The most significant increases in deposits are attributed to time deposits, including wholesale time deposits, which increased $76.6 million year over year. Time deposits of less than $100,000 increased $102.4 million while time deposits of $100,000 or more decreased $25.8 million.
The average balance of deposits and interest rates thereon for the years ended December 31, 2010, 2009, and 2008 are summarized below.
Average Deposits
| Year ended December 31, | ||||||||||||||||||||||||
| 2010 | 2009 | 2008 | ||||||||||||||||||||||
| Average Balance |
Rate | Average Balance |
Rate | Average Balance |
Rate | |||||||||||||||||||
| (Dollars in thousands) | ||||||||||||||||||||||||
| Interest-bearing demand deposits |
$ | 202,951 | 0.75 | % | $ | 112,971 | 0.74 | % | $ | 96,032 | 0.93 | % | ||||||||||||
| Savings deposits |
22,795 | 0.40 | 18,429 | 0.25 | 17,870 | 0.49 | ||||||||||||||||||
| Time deposits |
455,174 | 2.06 | 476,480 | 2.54 | 374,407 | 4.09 | ||||||||||||||||||
| Total interest-bearing deposits |
680,920 | 1.62 | 607,880 | 2.13 | 488,309 | 3.33 | ||||||||||||||||||
| Non-interest-bearing deposits |
102,039 | 90,732 | 90,031 | |||||||||||||||||||||
| Total deposits |
$ | 782,959 | 1.41 | % | $ | 698,612 | 1.85 | % | $ | 578,340 | 2.81 | % | ||||||||||||
46
For the years ended December 31, 2010, 2009 and 2008, our average non-interest-bearing deposits have been approximately 13.0%, 13.0% and 15.6%, respectively of our average total deposits. We subscribe to an Internet bulletin board service to advertise our deposit rates. At year-end 2010 and 2009, we had approximately $77.9 million and $140.8 million, respectively, in these types of deposits, most of which have a maturity of two years or less.
As of December 31, 2010, we held approximately $71.5 million in time deposits of $100,000 or more of individuals, local governments or municipal entities and $21.4 million of wholesale deposits of $100,000 or more. Non-wholesale time deposits less than $100,000 were approximately $207.5 million at December 31, 2010. The following table is a maturity schedule of our time deposits as of December 31, 2010.
Time Deposit Maturity Schedule
| 3 months or less |
4-6 months |
7-12 months |
Over 12 months |
Total | ||||||||||||||||
| (Dollars in thousands) | ||||||||||||||||||||
| Non-wholesale time certificates of deposit of less than $100,000 |
$ | 43,519 | $ | 22,594 | $ | 54,281 | $ | 87,096 | $ | 207,490 | ||||||||||
| Non-wholesale time certificates of deposit of $100,000 or more |
19,635 | 17,946 | 19,128 | 14,754 | 71,463 | |||||||||||||||
| Wholesale time certificates of deposit of less than $100,000 |
22,440 | 18,117 | 10,916 | 36,244 | 87,717 | |||||||||||||||
| Wholesale time certificates of deposit of $100,000 or more |
900 | — | 12,833 | 7,691 | 21,424 | |||||||||||||||
| Total time deposits |
$ | 86,494 | $ | 58,657 | $ | 97,158 | $ | 145,785 | $ | 388,094 | ||||||||||
Borrowings
Short-term borrowings include sweep accounts and advances from the Federal Home Loan Bank of Atlanta (the “FHLB”) having maturities of one year or less. Our short-term borrowings totaled $11.5 million on December 31, 2010, compared to $22.9 million on December 31, 2009, a decrease of $11.4 million. Our short-term advances from FHLB decreased $12.0 million while sweep accounts increased $599 thousand from December 31, 2009 to December 31, 2010.
The following table details the maturities and rates of our borrowings from the FHLB, as of December 31, 2010.
| Borrow Date |
Type |
Principal | Term |
Rate | Maturity | |||||||||
| (Dollars in thousands) | ||||||||||||||
| February 29, 2008 |
Fixed rate | $ | 5,000 | 4 years | 3.18 | % | February 29, 2012 | |||||||
| March 12, 2008 |
Fixed rate | 6,500 | 3 years | 2.89 | March 14, 2011 | |||||||||
| March 12, 2008 |
Fixed rate | 2,000 | 4 years | 3.25 | March 12, 2012 | |||||||||
| March 12, 2008 |
Fixed rate | 7,500 | 5 years | 3.54 | March 12, 2013 | |||||||||
| August 17, 2010 |
Fixed rate | 3,000 | 4 years | 1.49 | August 18, 2014 | |||||||||
| August 17, 2010 |
Fixed rate | 4,500 | 5 years | 1.85 | August 17, 2015 | |||||||||
| August 17, 2010 |
Fixed rate | 2,500 | 6 years | 2.21 | August 17, 2016 | |||||||||
| August 20, 2010 |
Fixed rate | 2,000 | 3 years | 1.09 | August 20, 2013 | |||||||||
| August 20, 2010 |
Fixed rate | 3,000 | 4 years | 1.48 | August 20, 2014 | |||||||||
| August 20, 2010 |
Fixed rate | 3,000 | 5 years | 1.83 | August 20, 2015 | |||||||||
| August 31, 2010 |
Fixed rate | 1,500 | 1 years | 0.36 | August 31, 2011 | |||||||||
| September 1, 2010 |
Fixed rate | 2,000 | 2 years | 0.66 | September 4, 2012 | |||||||||
Total Borrowings: $ 42,500 Composite rate: 2.35%
Long-Term Obligations
Long-term obligations consist of advances from FHLB with maturities greater than one year. Our long-term borrowings from the FHLB totaled $34.5 million on December 31, 2010, compared to $21.0 million long-term FHLB advances on December 31, 2009.
47
Liquidity
Liquidity refers to our continuing ability to meet deposit withdrawals, fund loan and capital expenditure commitments, maintain reserve requirements, pay operating expenses and provide funds for payment of dividends, debt service and other operational requirements. Liquidity is immediately available from five major sources: (a) cash on hand and on deposit at other banks; (b) the outstanding balance of federal funds sold; (c) lines for the purchase of federal funds from other banks; (d) lines of credit established at the FHLB, less existing advances; and (e) our investment securities portfolio. All our debt securities are of investment grade quality and, if the need arises, can promptly be liquidated on the open market or pledged as collateral for short-term borrowing.
Consistent with our general approach to liquidity management, loans and other assets of the Bank are funded primarily using a core of local deposits, proceeds from retail repurchase agreements and excess Bank capital. During 2010 the Bank relied more heavily on interest-bearing demand deposits to meet our liquidity needs. Interest bearing demand deposits increased $121.0 million from December 31, 2009 to December 31, 2010 mainly from an increase in public fund money market accounts. During 2010, we experienced a 150% increase of public funds interest-bearing demand deposits as municipalities desiring to maintain more liquidity moved monies from lower rate certificates of deposits into highly liquid money market accounts at favorable interest rates. The Bank reduced its reliance on wholesale deposits as these deposits decreased $63.2 million from December 31, 2009 to December 31, 2010. The Bank intends to continue to focus on increasing core deposits.
We are a member of the Federal Home Loan Bank of Atlanta. Membership, along with a blanket collateral commitment of our one-to-four family residential mortgage loan portfolio, as well as our commercial real estate loan portfolio, provided us the ability to draw up to $184.0 million, $177.7 million and $168.6 million of advances from the FHLB at December 31, 2010, 2009 and 2008, respectively. At December 31, 2010, we had outstanding FHLB advances totaling $42.5 million compared to $41.0 million and $60.0 million at December 31, 2009 and 2008, respectively.
As a requirement for membership, we invest in stock of the FHLB in the amount of 1.0% of our outstanding residential loans or 5.0% of our outstanding advances from the FHLB, whichever is greater. That stock is pledged as collateral for any FHLB advances drawn by us. At December 31, 2010, we owned 45,708 shares of the FHLB’s $100 par value capital stock, compared to 51,160 and 38,591 shares at December 31, 2009 and 2008, respectively. No ready market exists for FHLB stock, which is carried at cost.
We also had unsecured federal funds lines in the aggregate amount of $31.0 million available to us at December 31, 2010 under which we can borrow funds to meet short-term liquidity needs. At December 31, 2010, we did not have any advances under these federal funds lines. We also have the ability to borrow from the Federal Reserve Discount Window by pledging certain types of collateral. Another source of funding available is loan participations sold to other commercial banks (in which we retain the servicing rights). As of December 31, 2010, we did not have any loan participations sold. We believe that our liquidity sources are adequate to meet our operating needs.
Capital Resources and Shareholders’ Equity
As of December 31, 2010, our total shareholders’ equity was $80.9 million (consisting of common shareholders’ equity of $63.6 million and preferred stock of $17.3 million) compared with total shareholders’ equity of $84.4 million as of December 31, 2009 (consisting of common shareholders’ equity of $67.3 million and preferred stock of $17.1 million).
Common shareholders’ equity decreased by approximately $3.7 million to $63.6 million at December 31, 2010 from $67.3 million at December 31, 2009. We experienced net income in 2010 of $0.9 million and recognized stock compensation of $36 thousand on stock options. We had a decrease in net unrealized gains on available-for-sale securities of $2.7 million. We declared cash dividends of $798 thousand on our common shares or $0.28 per share during 2010 and dividends of $897 thousand on preferred shares.
Common shareholders’ equity decreased by approximately $0.6 million to $67.3 million at December 31, 2009 from $67.9 million at December 31, 2008. We experienced net income in 2009 of $1.5 million and recognized stock compensation of $85 thousand on restricted stock awards and stock options. We had a decrease in net unrealized gains on available-for-sale securities of $205 thousand. We declared cash dividends of $2.1 million on our common shares or $0.73 per share during 2009 and dividends of $745 thousand on preferred shares. On January 16, 2009, we issued Series A
48
Preferred Stock in the amount of $17,949,000 and a warrant to purchase 144,984 shares of our common stock to the U.S. Treasury as a participant in the TARP Capital Purchase Program. The Series A Preferred Stock qualifies as Tier 1 capital for purposes of regulatory capital requirements and calls for cumulative dividends at a rate of 5% per annum for the first five years and 9% per annum thereafter. Prior to January 16, 2012, unless we have redeemed all of this preferred stock or the U.S. Treasury has transferred all of this preferred stock to a third party, the consent of the U.S. Treasury will be required for us to, among other things, increase our common stock dividend above a quarterly rate of $0.1825 per share or repurchase our common stock except in limited circumstances. In addition, until the U.S. Treasury ceases to own our securities sold under the TARP Capital Purchase Program, the compensation arrangements for our senior executive officers must comply in all respects with the U.S. Emergency Economic Stabilization Act of 2008, as amended by the American Recovery and Reinvestment Act of 2009, and the rules and regulations thereunder.
The following table presents information concerning capital required of us and our actual capital ratios.
| To be well capitalized under prompt corrective action provisions |
Minimum required for capital adequacy purposes |
Our Ratio |
Bank’s Ratio |
|||||||||||||
| Ratio | Ratio | |||||||||||||||
| As of December 31, 2010: |
||||||||||||||||
| Tier 1 Capital (to Average Assets) |
³ | 5.00 | % | ³ | 3.00 | % | 8.66 | % | 8.66 | % | ||||||
| Tier 1 Capital (to Risk Weighted Assets) |
³ | 6.00 | ³ | 4.00 | 12.08 | 12.08 | ||||||||||
| Total Capital (to Risk Weighted Assets) |
³ | 10.00 | ³ | 8.00 | 13.34 | 13.34 | ||||||||||
| As of December 31, 2009: |
||||||||||||||||
| Tier 1 Capital (to Average Assets) |
³ | 5.00 | % | ³ | 3.00 | % | 9.59 | % | 7.53 | % | ||||||
| Tier 1 Capital (to Risk Weighted Assets) |
³ | 6.00 | ³ | 4.00 | 12.77 | 10.03 | ||||||||||
| Total Capital (to Risk Weighted Assets) |
³ | 10.00 | ³ | 8.00 | 14.02 | 11.28 | ||||||||||
Inflation and Other Issues
Because our assets and liabilities are primarily monetary in nature, the effect of inflation on our assets is less significant compared to most commercial and industrial companies. However, inflation does have an impact on the growth of total assets in the banking industry and the resulting need to increase capital at higher than normal rates in order to maintain an appropriate equity-to-assets ratio. Inflation also has a significant effect on other expenses, which tend to rise during periods of general inflation. Notwithstanding these effects of inflation, management believes our financial results are influenced more by our ability to react to changes in interest rates than by inflation.
Except as discussed in this Management’s Discussion and Analysis, management is not aware of trends, events or uncertainties that will have or that are reasonably likely to have a material adverse effect on the liquidity, capital resources or operations. Management is not aware of any current recommendations by regulatory authorities which, if they were implemented, would have such an effect.
Recent Accounting Pronouncements
Please refer to Note (1) (S) of our consolidated financial statements for a summary of recent authoritative pronouncements that could impact our accounting, reporting, and/or disclosure of financial information.
49
Summary Quarterly Financial Information
The following table contains summary financial information for each quarterly period listed below. This information has been derived from our unaudited interim consolidated financial statements. This information has not been audited but, in the opinion of our management, it includes all adjustments (consisting only of normal recurring adjustments) which management considers necessary for a fair presentation of our results for those periods. You should read this information in conjunction with our audited year end consolidated financial statements that appear in Item 8 of this report. Our results for quarterly periods shown in the table are not necessarily indicative of our results for any future period.
| 2010 | 2009 | |||||||||||||||||||||||||||||||
| Fourth Quarter |
Third Quarter |
Second Quarter |
First Quarter |
Fourth Quarter |
Third Quarter |
Second Quarter |
First Quarter |
|||||||||||||||||||||||||
| (Dollars in thousands, except per share data) | ||||||||||||||||||||||||||||||||
| Summary of Operations |
||||||||||||||||||||||||||||||||
| Income Statement Data: |
||||||||||||||||||||||||||||||||
| Interest income |
$ | 9,840 | $ | 9,982 | $ | 9,965 | $ | 10,020 | $ | 10,051 | $ | 10,320 | $ | 10,305 | $ | 10,229 | ||||||||||||||||
| Interest expense |
2,926 | 3,005 | 2,932 | 3,025 | 3,033 | 3,244 | 3,663 | 4,217 | ||||||||||||||||||||||||
| Net interest income |
6,914 | 6,977 | 7,033 | 6,995 | 7,018 | 7,076 | 6,642 | 6,012 | ||||||||||||||||||||||||
| Provision for loan losses |
4,337 | 3,863 | 1,780 | 3,000 | 5,675 | 2,675 | 2,000 | 750 | ||||||||||||||||||||||||
| Net interest income after provision |
2,577 | 3,114 | 5,253 | 3,995 | 1,343 | 4,401 | 4,642 | 5,262 | ||||||||||||||||||||||||
| Non-interest income |
3,661 | 3,800 | 1,866 | 2,668 | 3,024 | 1,926 | 1,763 | 1,936 | ||||||||||||||||||||||||
| Non-interest expense |
8,307 | 6,379 | 5,916 | 6,238 | 6,117 | 6,135 | 5,455 | 5,445 | ||||||||||||||||||||||||
| Income (loss) before income taxes |
(2,069 | ) | 535 | 1,203 | 425 | (1,750 | ) | 192 | 950 | 1,753 | ||||||||||||||||||||||
| Income taxes |
(945 | ) | (5 | ) | 246 | (62 | ) | (853 | ) | (154 | ) | 150 | 500 | |||||||||||||||||||
| Net income(loss) |
(1,124 | ) | 540 | 957 | 487 | (897 | ) | 346 | 800 | 1,253 | ||||||||||||||||||||||
| Preferred stock dividend & accretion of discount |
266 | 267 | 265 | 265 | 265 | 263 | 268 | 207 | ||||||||||||||||||||||||
| Net income (loss) available to common shareholders |
(1,390 | ) | 273 | 692 | 222 | (1,162 | ) | 83 | 532 | 1,046 | ||||||||||||||||||||||
| Per Share Data and Shares Outstanding: |
||||||||||||||||||||||||||||||||
| Net income (loss)—basic |
$ | (0.49 | ) | $ | 0.10 | $ | 0.24 | $ | 0.08 | $ | (0.41 | ) | $ | 0.03 | $ | 0.19 | $ | 0.37 | ||||||||||||||
| Net income (loss)—diluted |
(0.49 | ) | 0.10 | 0.24 | 0.08 | (0.41 | ) | 0.03 | 0.19 | 0.37 | ||||||||||||||||||||||
| Cash dividends |
0.0700 | 0.0700 | 0.0700 | 0.0700 | 0.1825 | 0.1825 | 0.1825 | 0.1825 | ||||||||||||||||||||||||
| Book value at period end |
22.32 | 24.70 | 24.46 | 23.56 | 23.62 | 24.88 | 24.17 | 24.58 | ||||||||||||||||||||||||
| Shares outstanding at period end |
2,849,841 | 2,849,841 | 2,849,841 | 2,849,841 | 2,847,881 | 2,847,881 | 2,844,489 | 2,844,489 | ||||||||||||||||||||||||
| Balance Sheet Data: |
||||||||||||||||||||||||||||||||
| Total assets |
$ | 919,869 | $ | 932,209 | $ | 921,840 | $ | 897,754 | $ | 888,720 | $ | 858,737 | $ | 877,465 | $ | 865,383 | ||||||||||||||||
| Investments |
273,229 | 263,946 | 268,064 | 197,520 | 239,332 | 218,591 | 232,521 | 247,663 | ||||||||||||||||||||||||
| Loans |
567,631 | 575,003 | 570,174 | 577,964 | 577,791 | 573,837 | 566,601 | 550,639 | ||||||||||||||||||||||||
| Interest-earning assets |
858,002 | 877,540 | 862,410 | 841,344 | 830,974 | 800,015 | 815,778 | 806,045 | ||||||||||||||||||||||||
| Deposits |
785,941 | 790,592 | 792,454 | 772,927 | 754,730 | 696,633 | 703,467 | 688,082 | ||||||||||||||||||||||||
| Long-term obligations |
34,500 | 34,500 | 14,500 | 14,500 | 21,000 | 21,000 | 21,000 | 21,000 | ||||||||||||||||||||||||
| Shareholders’ equity |
80,894 | 87,632 | 86,918 | 84,292 | 84,375 | 87,936 | 85,792 | 86,925 | ||||||||||||||||||||||||
| Selected Performance Ratios: |
||||||||||||||||||||||||||||||||
| Rate of return (annualized) on: |
||||||||||||||||||||||||||||||||
| Total assets |
(0.48 | )% | 0.23 | % | 0.43 | % | 0.22 | % | (0.41 | )% | 0.16 | % | 0.37 | % | 0.58 | % | ||||||||||||||||
| Shareholders’ equity |
(5.15 | ) | 2.44 | 4.48 | 2.28 | (4.09 | ) | 1.59 | 3.64 | 5.98 | ||||||||||||||||||||||
| Dividend payout ratio |
(14.29 | ) | 70.00 | 29.17 | 87.50 | (44.51 | ) | 608.33 | 96.05 | 49.32 | ||||||||||||||||||||||
50
CAUTIONARY NOTE ABOUT FORWARD-LOOKING STATEMENTS
Statements in this Report and exhibits relating to plans, strategies, economic performance and trends, projections of results of specific activities or investments, expectations or beliefs about future events or results, and other statements that are not descriptions of historical facts, may be forward-looking statements within the meaning of the Private Securities Litigation Reform Act of 1995, Section 27A of the Securities Act of 1933 and Section 21E of the Securities Exchange Act of 1934. Forward-looking information is inherently subject to risks and uncertainties, and actual results could differ materially from those currently anticipated due to a number of factors, which include, but are not limited to, risk factors discussed in Item 1A under the heading “Rick Factors” and in other documents filed by us with the Securities and Exchange Commission from time to time. Forward-looking statements may be identified by terms such as “may,” “will,” “should,” “could,” “expects,” “plans,” “intends,” “anticipates,” “feels,” “believes,” “estimates,” “predicts,” “forecasts,” “potential” or “continue,” or similar terms or the negative of these terms, or other statements concerning opinions or judgments of our management about future events. Factors that could influence the accuracy of those forward-looking statements include, but are not limited to, (a) pressures on the our earnings, capital and liquidity resulting from current and future conditions in the credit and equity markets, (b) continued or unexpected increases in credit losses in our loan portfolio, (c) continued adverse conditions in the economy and in the real estate market in our banking markets (particularly those conditions that affect our loan portfolio, the abilities of our borrowers to repay their loans, and the values of collateral that secures our loans), (d) the financial success or changing strategies of our customers, (e) actions of government regulators, or changes in laws, regulations or accounting standards, that adversely affect our business, (f) changes in the interest rate environment and the level of market interest rates that reduce our net interest margins and/or the values of loans we make and securities we hold, (g) changes in competitive pressures among depository and other financial institutions or in our ability to compete effectively against other financial institutions in our banking markets; (h) weather and similar conditions, particularly the effect of hurricanes on our banking and operations facilities and on our customers and the communities in which we do business; and (i) other developments or changes in our business that we do not expect. Although we believe that the expectations reflected in the forward-looking statements in this Report are reasonable, we cannot guarantee future results, levels of activity, performance or achievements. All forward-looking statements attributable to us are expressly qualified in their entirety by the cautionary statements in this paragraph. We have no obligation, and do not intend, to update these forward-looking statements.
Item 7A. Quantitative and Qualitative Disclosures About Market Risk
Information required by this Item is included in Management’s Discussion and Analysis of Financial Condition and Results of Operations contained in Item 7 under the caption “Market Risk.”
51
Item 8. Financial Statements and Supplementary Data
INDEX TO CONSOLIDATED FINANCIAL STATEMENTS
| Page | ||||
| Audited Financial Statements for the years ended December 31, 2010, 2009 and 2008 |
||||
| 53 | ||||
| Consolidated Balance Sheets as of December 31, 2010 and 2009 |
54 | |||
| Consolidated Statements of Income (Loss) for the years ended December 31, 2010, 2009 and 2008 |
55 | |||
| 56 | ||||
| Consolidated Statements of Cash Flows for the years ended December 31, 2010, 2009 and 2008 |
57 | |||
| Notes to Consolidated Financial Statements—December 31, 2010 and 2009 |
59 | |||
52

REPORT OF INDEPENDENT REGISTERED PUBLIC ACCOUNTING FIRM
The Board of Directors
ECB Bancorp, Inc.
Engelhard, North Carolina
We have audited the accompanying consolidated balance sheets of ECB Bancorp, Inc. and Subsidiary (the “Company”) as of December 31, 2010 and 2009 and the related consolidated statements of income (loss), shareholders’ equity, and cash flows for each of the years in the three-year period ended December 31, 2010. These consolidated financial statements are the responsibility of the Company’s management. Our responsibility is to express an opinion on these consolidated financial statements based on our audits.
We conducted our audits in accordance with the standards of the Public Company Accounting Oversight Board (United States). Those standards require that we plan and perform the audit to obtain reasonable assurance about whether the financial statements are free of material misstatement. An audit includes examining, on a test basis, evidence supporting the amounts and disclosures in the financial statements. An audit also includes assessing the accounting principles used and significant estimates made by management, and evaluating the overall financial statement presentation. We believe that our audits provide a reasonable basis for our opinion.
In our opinion, the consolidated financial statements referred to above present fairly, in all material respects, the financial position of ECB Bancorp, Inc. and Subsidiary as of December 31, 2010 and 2009, and the results of their operations and their cash flows for each of the years in the three-year period ended December 31, 2010, in conformity with accounting principles generally accepted in the United States of America.
We also have audited, in accordance with the standards of the Public Company Accounting Oversight Board (United States), ECB Bancorp, Inc. and Subsidiary’s internal control over financial reporting as of December 31, 2010, based on criteria established in Internal Control – Integrated Framework issued by the Committee of Sponsoring Organizations of the Treadway Commission, and our report dated March 15, 2011 expressed an unqualified opinion.

Greenville, North Carolina
March 15, 2011
53
ECB BANCORP, INC. AND SUBSIDIARY
CONSOLIDATED BALANCE SHEETS
DECEMBER 31, 2010 AND 2009
(Dollars in thousands, except per share data)
| 2010 | 2009 | |||||||
| ASSETS |
||||||||
| Non-interest bearing deposits and cash |
$ | 11,731 | $ | 9,076 | ||||
| Interest-bearing deposits |
20 | 870 | ||||||
| Overnight investments |
8,415 | 7,865 | ||||||
| Total cash and cash equivalents |
20,166 | 17,811 | ||||||
| Investment securities available-for-sale, at fair value (cost of $275,883 and $237,594 at December 31, 2010 and 2009, respectively) |
273,229 | 239,332 | ||||||
| Loans held for sale |
4,136 | — | ||||||
| Loans |
567,631 | 577,791 | ||||||
| Allowance for loan losses |
(13,247 | ) | (9,725 | ) | ||||
| Loans, net |
554,384 | 568,066 | ||||||
| Real estate and repossessions acquired in settlement of loans, net |
4,536 | 5,443 | ||||||
| Federal Home Loan Bank common stock, at cost |
4,571 | 5,116 | ||||||
| Bank premises and equipment, net |
26,636 | 25,329 | ||||||
| Accrued interest receivable |
5,243 | 4,967 | ||||||
| Bank owned life insurance |
8,954 | 8,657 | ||||||
| Other assets |
18,014 | 13,999 | ||||||
| Total |
$ | 919,869 | $ | 888,720 | ||||
| LIABILITIES AND SHAREHOLDERS’ EQUITY |
||||||||
| Deposits |
||||||||
| Demand, non-interest-bearing |
$ | 104,932 | $ | 93,492 | ||||
| Demand, interest-bearing |
262,977 | 141,956 | ||||||
| Savings |
29,938 | 19,595 | ||||||
| Time |
388,094 | 499,687 | ||||||
| Total deposits |
785,941 | 754,730 | ||||||
| Accrued interest payable |
631 | 1,121 | ||||||
| Short-term borrowings |
11,509 | 22,910 | ||||||
| Long-term obligations |
34,500 | 21,000 | ||||||
| Other liabilities |
6,394 | 4,584 | ||||||
| Total liabilities |
838,975 | 804,345 | ||||||
| Commitments and contingent liabilities |
||||||||
| SHAREHOLDERS’ EQUITY |
||||||||
| Preferred stock, Series A |
17,288 | 17,122 | ||||||
| Common stock, par value $3.50 per share |
9,974 | 9,968 | ||||||
| Capital surplus |
25,852 | 25,803 | ||||||
| Warrant |
878 | 878 | ||||||
| Retained earnings |
28,554 | 29,555 | ||||||
| Accumulated other comprehensive income (loss) |
(1,652 | ) | 1,049 | |||||
| Total shareholders’ equity |
80,894 | 84,375 | ||||||
| Total |
$ | 919,869 | $ | 888,720 | ||||
| Common shares outstanding |
2,849,841 | 2,847,881 | ||||||
| Common shares authorized |
10,000,000 | 10,000,000 | ||||||
| Preferred shares outstanding |
17,949 | 17,949 | ||||||
| Preferred shares authorized |
2,000,000 | 2,000,000 | ||||||
See accompanying Notes to Consolidated Financial Statements.
54
ECB BANCORP, INC. AND SUBSIDIARY
CONSOLIDATED STATEMENTS OF INCOME (LOSS)
FOR THE YEARS ENDED DECEMBER 31, 2010, 2009 AND 2008
(Dollars in thousands, except per share data)
| 2010 | 2009 | 2008 | ||||||||||
| INTEREST INCOME |
||||||||||||
| Interest and fees on loans |
$ | 30,745 | $ | 30,595 | $ | 31,104 | ||||||
| Interest on investment securities: |
||||||||||||
| Interest exempt from federal income taxes |
1,541 | 1,406 | 1,305 | |||||||||
| Taxable interest income |
7,464 | 8,774 | 6,215 | |||||||||
| Dividend income |
44 | 127 | 217 | |||||||||
| Other interest |
13 | 3 | 257 | |||||||||
| Total interest income |
39,807 | 40,905 | 39,098 | |||||||||
| INTEREST EXPENSE |
||||||||||||
| Deposits |
||||||||||||
| Demand accounts |
1,527 | 833 | 894 | |||||||||
| Savings |
91 | 46 | 87 | |||||||||
| Time |
9,392 | 12,079 | 15,295 | |||||||||
| Short-term borrowings |
241 | 462 | 1,545 | |||||||||
| Long-term obligations |
637 | 707 | 654 | |||||||||
| Other interest expense |
— | 30 | 350 | |||||||||
| Total interest expense |
11,888 | 14,157 | 18,825 | |||||||||
| Net interest income |
27,919 | 26,748 | 20,273 | |||||||||
| Provision for loan losses |
12,980 | 11,100 | 2,450 | |||||||||
| Net interest income after provision for loan losses |
14,939 | 15,648 | 17,823 | |||||||||
| NON-INTEREST INCOME |
||||||||||||
| Service charges on deposit accounts |
3,418 | 3,652 | 3,500 | |||||||||
| Other service charges and fees |
1,419 | 1,160 | 1,367 | |||||||||
| Mortgage origination fees |
1,283 | 950 | 1,035 | |||||||||
| Net gain (loss) on sale of securities |
5,508 | 2,565 | 218 | |||||||||
| Income from bank owned life insurance |
297 | 310 | 316 | |||||||||
| Other operating income |
70 | 12 | 373 | |||||||||
| Total non-interest income |
11,995 | 8,649 | 6,809 | |||||||||
| NON-INTEREST EXPENSE |
||||||||||||
| Salaries |
9,832 | 8,287 | 8,161 | |||||||||
| Retirement and other employee benefits |
2,924 | 2,488 | 2,706 | |||||||||
| Occupancy |
1,876 | 1,832 | 1,857 | |||||||||
| Equipment |
2,160 | 1,763 | 1,638 | |||||||||
| Professional fees |
936 | 832 | 717 | |||||||||
| Supplies |
221 | 216 | 312 | |||||||||
| Telephone |
663 | 642 | 679 | |||||||||
| FDIC insurance |
1,445 | 1,689 | 384 | |||||||||
| Other outside services |
528 | 470 | 482 | |||||||||
| Net cost of real estate and repossessions acquired in settlement of loans |
1,104 | 1,345 | 145 | |||||||||
| Contract early termination fees |
1,141 | — | — | |||||||||
| Other operating expenses |
4,010 | 3,588 | 3,552 | |||||||||
| Total non-interest expense |
26,840 | 23,152 | 20,633 | |||||||||
| Income before income taxes |
94 | 1,145 | 3,999 | |||||||||
| Income tax expense (benefit) |
(766 | ) | (357 | ) | 580 | |||||||
| Net income |
860 | 1,502 | 3,419 | |||||||||
| Preferred stock dividends |
897 | 853 | — | |||||||||
| Accretion of discount |
166 | 150 | — | |||||||||
| Income (loss) available to common shareholders |
$ | (203 | ) | $ | 499 | $ | 3,419 | |||||
| Net income (loss) per share—basic |
$ | (0.07 | ) | $ | 0.18 | $ | 1.19 | |||||
| Net income (loss) per share—diluted |
$ | (0.07 | ) | $ | 0.18 | $ | 1.18 | |||||
| Weighted average shares outstanding—basic |
2,849,594 | 2,884,950 | 2,884,396 | |||||||||
| Weighted average shares outstanding—diluted |
2,849,594 | 2,845,966 | 2,889,016 | |||||||||
See accompanying Notes to Consolidated Financial Statements.
55
ECB BANCORP, INC. AND SUBSIDIARY
CONSOLIDATED STATEMENTS OF CHANGES IN SHAREHOLDERS’ EQUITY
FOR THE YEARS ENDED DECEMBER 31, 2010, 2009 AND 2008
(Dollars in thousands, except per share data)
| Preferred Stock |
Common stock | Common Stock warrant |
Capital surplus |
Retained earnings |
Accumulated other comprehensive income (loss) |
Comprehensive income |
Total | |||||||||||||||||||||||||||||
| Number | Amount | |||||||||||||||||||||||||||||||||||
| BALANCE—December 31, 2007 |
$ | — | 2,920,769 | $ | 10,184 | $ | — | $ | 27,026 | $ | 30,099 | $ | (468 | ) | $ | 66,841 | ||||||||||||||||||||
| Record postretirement benefit related to split-dollar insurance due to change in accounting standards |
— | — | — | (387 | ) | — | (387 | ) | ||||||||||||||||||||||||||||
| Unrealized gains, net of income tax expense of $1,078 |
— | — | — | — | 1,722 | $ | 1,722 | 1,722 | ||||||||||||||||||||||||||||
| Net income |
— | — | — | 3,419 | — | 3,419 | 3,419 | |||||||||||||||||||||||||||||
| Total comprehensive income |
$ | 5,141 | ||||||||||||||||||||||||||||||||||
| Stock based compensation |
— | 39 | 173 | — | — | 212 | ||||||||||||||||||||||||||||||
| Repurchase of common stock |
(78,780 | ) | (276 | ) | (1,483 | ) | — | — | (1,759 | ) | ||||||||||||||||||||||||||
| Issuance of restricted stock |
2,500 | 9 | (9 | ) | — | — | — | |||||||||||||||||||||||||||||
| Cash dividends ($ .73 per share) |
— | — | — | (2,105 | ) | — | (2,105 | ) | ||||||||||||||||||||||||||||
| BALANCE—December 31, 2008 |
— | 2,844,489 | 9,956 | — | 25,707 | 31,026 | 1,254 | 67,943 | ||||||||||||||||||||||||||||
| Unrealized loss, net of income tax expense of $128 |
— | — | — | — | (205 | ) | $ | (205 | ) | (205 | ) | |||||||||||||||||||||||||
| Net income |
— | — | — | 1,502 | — | 1,502 | 1,502 | |||||||||||||||||||||||||||||
| Total comprehensive income |
$ | 1,297 | ||||||||||||||||||||||||||||||||||
| Issuance of preferred stock in connection with Capital Purchase Program, net of discount on preferred stock |
17,067 | 17,067 | ||||||||||||||||||||||||||||||||||
| Issuance of common stock warrant in connection with Capital Purchase Program |
882 | 882 | ||||||||||||||||||||||||||||||||||
| Cost associated with issuance of preferred stock and common warrant |
(95 | ) | (4 | ) | (99 | ) | ||||||||||||||||||||||||||||||
| Stock based compensation |
— | — | 61 | — | — | 61 | ||||||||||||||||||||||||||||||
| Stock options exercised |
1,892 | 7 | 16 | — | — | 23 | ||||||||||||||||||||||||||||||
| Issuance of restricted stock |
1,500 | 5 | 19 | — | — | 24 | ||||||||||||||||||||||||||||||
| Preferred stock accretion |
150 | (150 | ) | |||||||||||||||||||||||||||||||||
| Cash dividends on preferred stock |
(745 | ) | (745 | ) | ||||||||||||||||||||||||||||||||
| Cash dividends ($ .73 per share) |
— | — | — | (2,078 | ) | — | (2,078 | ) | ||||||||||||||||||||||||||||
| BALANCE—December 31, 2009 |
17,122 | 2,847,881 | 9,968 | 878 | 25,803 | 29,555 | 1,049 | 84,375 | ||||||||||||||||||||||||||||
| Unrealized loss, net of income tax expense of $1,691 |
— | — | — | — | (2,701 | ) | $ | (2,701 | ) | (2,701 | ) | |||||||||||||||||||||||||
| Net income |
— | — | — | 860 | — | 860 | 860 | |||||||||||||||||||||||||||||
| Total comprehensive loss |
$ | (1,841 | ) | |||||||||||||||||||||||||||||||||
| Stock based compensation |
— | — | 36 | — | — | 36 | ||||||||||||||||||||||||||||||
| Stock options exercised |
1,960 | 6 | 13 | — | — | 19 | ||||||||||||||||||||||||||||||
| Preferred stock accretion |
166 | (166 | ) | |||||||||||||||||||||||||||||||||
| Cash dividends on preferred stock |
(897 | ) | (897 | ) | ||||||||||||||||||||||||||||||||
| Cash dividends ($ .28 per share) |
— | — | — | (798 | ) | — | (798 | ) | ||||||||||||||||||||||||||||
| BALANCE—December 31, 2010 |
$ | 17,288 | 2,849,841 | $ | 9,974 | $ | 878 | $ | 25,852 | $ | 28,554 | $ | (1,652 | ) | $ | 80,894 | ||||||||||||||||||||
See accompanying Notes to Consolidated Financial Statements.
56
ECB BANCORP, INC. AND SUBSIDIARY
CONSOLIDATED STATEMENTS OF CASH FLOWS
FOR THE YEARS ENDED DECEMBER 31, 2010, 2009 AND 2008
(Dollars in thousands)
| Years Ended December 31, | ||||||||||||
| 2010 | 2009 | 2008 | ||||||||||
| CASH FLOWS FROM OPERATING ACTIVITIES |
||||||||||||
| Net income |
$ | 860 | $ | 1,502 | $ | 3,419 | ||||||
| Adjustments to reconcile net income to net cash provided by operating activities: |
||||||||||||
| Depreciation |
1,365 | 1,351 | 1,342 | |||||||||
| Amortization of premium on investment securities, net |
2,084 | 940 | 110 | |||||||||
| Provision for loan losses |
12,980 | 11,100 | 2,450 | |||||||||
| Deferred income taxes |
(1,732 | ) | (3,918 | ) | (746 | ) | ||||||
| (Gain) loss on sale of securities |
(5,508 | ) | (2,565 | ) | (218 | ) | ||||||
| Impairment charge on community bank trust services investment |
— | 37 | 100 | |||||||||
| Stock based compensation |
36 | 85 | 212 | |||||||||
| Loss on sale of real estate and repossessions acquired in settlement of loans |
1,004 | 1,156 | 93 | |||||||||
| Loss on disposal of premises and equipment |
11 | 15 | 23 | |||||||||
| Increase in accrued interest receivable |
(276 | ) | (304 | ) | (207 | ) | ||||||
| Income from bank owned life insurance |
(297 | ) | (310 | ) | (316 | ) | ||||||
| Origination of loans held for sale |
(35,452 | ) | — | — | ||||||||
| Proceeds from sale of loans held for sale |
31,316 | — | — | |||||||||
| (Increase) decrease in other assets |
(342 | ) | (4,010 | ) | 1,037 | |||||||
| (Decrease) increase in accrued interest payable |
(490 | ) | (1,768 | ) | 364 | |||||||
| (Decrease) increase in other liabilities |
2,130 | (13 | ) | (1,737 | ) | |||||||
| Net cash provided by operating activities |
7,689 | 3,298 | 5,926 | |||||||||
| CASH FLOWS FROM INVESTING ACTIVITIES |
||||||||||||
| Proceeds from sales of investment securities classified as available-for-sale |
191,192 | 120,310 | 34,839 | |||||||||
| Proceeds from maturities of investment securities classified as available-for-sale |
55,657 | 55,613 | 28,580 | |||||||||
| Purchases of investment securities classified as available-for-sale |
(281,964 | ) | (227,680 | ) | (120,907 | ) | ||||||
| Redemption (purchase) of Federal Home Loan Bank common stock |
545 | (1,257 | ) | (1,477 | ) | |||||||
| Proceeds from disposal of premises and equipment |
— | 12 | — | |||||||||
| Purchases of premises and equipment |
(2,285 | ) | (970 | ) | (2,652 | ) | ||||||
| Purchase of real estate in settlement of foreclosed property |
— | — | (145 | ) | ||||||||
| Proceeds from disposal of real estate and repossessions acquired in settlement of loans |
2,775 | 2,801 | 223 | |||||||||
| Net loan originations |
(2,568 | ) | (51,937 | ) | (89,069 | ) | ||||||
| Net cash used in investing activities |
(36,648 | ) | (103,108 | ) | (150,608 | ) | ||||||
| CASH FLOWS FROM FINANCING ACTIVITIES |
||||||||||||
| Net increase in deposits |
31,211 | 125,578 | 102,791 | |||||||||
| Net increase (decrease) in borrowings |
2,099 | (39,806 | ) | 40,542 | ||||||||
| Dividends paid to common shareholders |
(1,118 | ) | (2,078 | ) | (2,096 | ) | ||||||
| Dividends paid on preferred stock |
(897 | ) | (745 | ) | — | |||||||
| Repurchase of common stock |
— | — | (1,759 | ) | ||||||||
| Net proceeds from stock options exercised |
19 | 23 | — | |||||||||
| Net proceeds from issuance of preferred stock and warrant to purchase common stock |
— | 17,850 | — | |||||||||
| Net cash provided by financing activities |
31,314 | 100,822 | 139,478 | |||||||||
| Increase (decrease) in cash and cash equivalents |
2,355 | 1,012 | (5,204 | ) | ||||||||
| Cash and cash equivalents at beginning of year |
17,811 | 16,799 | 22,003 | |||||||||
| Cash and cash equivalents at end of year |
$ | 20,166 | $ | 17,811 | $ | 16,799 | ||||||
See accompanying Notes to Consolidated Financial Statements.
57
ECB BANCORP, INC. AND SUBSIDIARY
CONSOLIDATED STATEMENTS OF CASH FLOWS, continued
FOR THE YEARS ENDED DECEMBER 31, 2010, 2009 AND 2008
(Dollars in thousands)
| Years Ended December 31, | ||||||||||||
| 2010 | 2009 | 2008 | ||||||||||
| SUPPLEMENTAL DISCLOSURE OF NONCASH FINANCING AND INVESTING ACTIVITIES |
||||||||||||
| Unrealized gains on available-for-sale securities, net of deferred taxes |
$ | (2,702 | ) | $ | (205 | ) | $ | 1,722 | ||||
| Transfer from long-term to short-term borrowings |
$ | 6,500 | $ | 5,000 | $ | — | ||||||
| Cash dividends declared but not paid |
$ | 199 | $ | 520 | $ | 519 | ||||||
| Transfer from investments to other assets |
$ | 250 | $ | — | $ | — | ||||||
| Transfer from loans to real estate and repossessions acquired in settlement of loans |
$ | 3,270 | $ | 5,676 | $ | 3,829 | ||||||
| Transfer from real estate and repossessions acquired in settlement of loans to bank premises and equipment |
$ | 398 | $ | — | $ | — | ||||||
| Record postretirement benefit related to split-dollar insurance |
$ | — | $ | — | $ | 387 | ||||||
| Payable, settlement for securities purchased |
$ | — | $ | — | $ | 53,426 | ||||||
| SUPPLEMENTAL DISCLOSURE OF CASH FLOW INFORMATION |
||||||||||||
| Interest paid |
$ | 12,378 | $ | 15,925 | $ | 18,461 | ||||||
| Taxes paid |
$ | 1,792 | $ | 3,455 | $ | 1,905 | ||||||
See accompanying Notes to Consolidated Financial Statements.
58
ECB BANCORP, INC. AND SUBSIDIARY
NOTES TO CONSOLIDATED FINANCIAL STATEMENTS
DECEMBER 31, 2010 and 2009
1. SUMMARY OF SIGNIFICANT ACCOUNTING POLICIES
(A) Consolidation
The consolidated financial statements include the accounts of ECB Bancorp, Inc. (Bancorp) and its wholly owned subsidiary, The East Carolina Bank (the Bank) (collectively referred to hereafter as the Company). The Bank has one wholly-owned subsidiary, ECB Financial Services, Inc., which formerly provided courier services to the Bank but is currently inactive. All significant inter-company transactions and balances have been eliminated in consolidation.
(B) Basis of Financial Statement Presentation
The preparation of financial statements in conformity with accounting principles generally accepted in the United States of America requires management to make estimates and assumptions that affect the reported amounts of assets and liabilities and disclosure of contingent assets and liabilities as of the date of the balance sheets and the reported amounts of income and expenses for the periods presented. Actual results could differ significantly from those estimates.
Material estimates that are particularly susceptible to significant change in the near-term relate to the determination of the allowance for loan losses and the valuation of the deferred tax asset.
(C) Business
Bancorp is a bank holding company incorporated in North Carolina on March 4, 1998. The principal activity of Bancorp is ownership of the Bank. The Bank provides financial services through its branch network located in eastern North Carolina. The Bank competes with other financial institutions and numerous other non-financial services commercial entities offering financial services products. The Bank is further subject to the regulations of certain federal and state agencies and undergoes periodic examinations by those regulatory authorities. The Company has no foreign operations, and the Company’s customers are principally located in eastern North Carolina.
(D) Cash and Cash Equivalents
Cash and cash equivalents include demand and time deposits (with original maturities of ninety days or less) at other financial institutions and overnight investments. Overnight investments include federal funds sold which are generally outstanding for one-day periods.
(E) Investment Securities
Certain debt securities that management has the positive intent and ability to hold to maturity are classified as “held to maturity” and recorded at amortized cost. Trading securities are recorded at fair value with changes in fair value included in earnings. Securities not classified as held to maturity or trading, including equity securities with readily determinable fair values, are classified as “available for sale” and recorded at fair value, with unrealized gains and losses excluded from earnings and reported in other comprehensive income.
Purchase premiums and discounts are recognized in interest income using the interest method over the terms of the securities. Declines in the fair value of held-to-maturity and available-for-sale securities below their cost that are deemed to be other than temporary are reflected in earnings as realized losses. In determining whether other-than-temporary impairment exists, management considers many factors, including (1) the length of time and the extent to which the fair value has been less than cost, (2) the financial condition and near-term prospects of the issuer, and (3) the intent and ability of the Company to retain its investment in the issuer for a period of time sufficient to allow for any anticipated recovery in fair value. Gains and losses on the sale of securities are recorded on the trade date and are determined using the specific identification method.
59
ECB BANCORP, INC. AND SUBSIDIARY
NOTES TO CONSOLIDATED FINANCIAL STATEMENTS—(Continued)
DECEMBER 31, 2010 and 2009
(F) Loans
Loans are generally stated at their outstanding unpaid principal balances adjusted for charge-offs, the allowance for loan losses and any deferred fees or costs. Loan origination fees net of certain direct loan origination costs are deferred and amortized as a yield adjustment over the contractual life of the related loans using the level-yield method.
Impaired loans are defined as those which management believes it is probable we will not collect all amounts due according to the contractual terms of the loan agreement, as well as those loans whose terms have been modified in a troubled debt restructuring.
Interest on loans is recorded based on the principal amount outstanding. The Company ceases accruing interest on loans (including impaired loans) when, in management’s judgment, the collection of interest appears doubtful or the loan is past due 90 days or more. All interest accrued but not collected for loans that are placed on nonaccrual or charged off is reversed against interest income. The interest on these loans is accounted for on the cash-basis or cost-recovery method, until qualifying for return to accrual. Management may return a loan classified as nonaccrual to accrual status when the obligation has been brought current, has performed in accordance with its contractual terms over an extended period of time, and the ultimate collectability of the total contractual principal and interest is no longer in doubt.
(G) Loans Held for Sale
Loans held for sale represent residential real estate loans originated by the mortgage department. Generally, commitments to sell these loans are made after the intent to proceed with mortgage applications are initiated with borrowers, and all necessary components of the loan are approved according to secondary market underwriting by the investor that purchases the loan. Loans held for sale are recorded at fair value when loans are originated and subsequently measured at the lower of cost or fair value. The Company is exposed to certain risks relating to its ongoing mortgage origination business. The Company enters into interest rate lock commitments and commitments to sell mortgages. The primary risks managed by derivative instruments are these interest rate lock commitments and forward-loan-sale commitments. Interest rate lock commitments are entered into to manage interest rate risk associated with the Company’s fixed rate loan commitments. The period of time between the issuance of a loan commitment and the closing and sale of the loan generally ranges from 10 to 60 days. Such interest rate lock commitments and forward-loan-sale commitments represent derivative instruments which are required to be carried at fair value. These derivative instruments do not qualify as hedges under the Derivatives and Hedging topic of the FASB Accounting Standards Codification. The fair value of the Company’s interest rate lock commitments are based on current secondary market pricing and included on the balance sheet in the loans held for sale and on the income statement in gain on sale of mortgages. The balance of forward loan sales commitments is deemed insignificant. The gains and losses from the future sales of the mortgages is recognized when the Company, the borrower and the investor enter into the loan contract and the resulting gain or loss is recorded on the income statement.
(H) Allowance for Loan Losses
The allowance for loan losses (AFLL) is established through provisions for losses charged against income. Loan amounts deemed to be uncollectible are charged against the AFLL, and subsequent recoveries, if any, are credited to the allowance. The AFLL represents management’s estimate of the amount necessary to absorb estimated probable losses in the loan portfolio. Management’s periodic evaluation of the adequacy of the allowance is based on individual loan reviews, past loan loss experience, economic conditions in the Company’s market areas, the fair value and adequacy of underlying collateral, and the growth and loss attributes of the loan portfolio. This evaluation is inherently subjective as it requires material estimates, including the amounts and timing of future cash flows expected to be received on impaired loans that may be susceptible to significant change. Thus, future changes to the AFLL may be necessary based on the impact of changes in economic conditions. In addition, various regulatory agencies, as an integral part of their examination process, periodically review the Company’s AFLL. Such agencies may require the Company to recognize adjustments to the AFLL based on their judgments about information available to them at the time of their examination.
60
ECB BANCORP, INC. AND SUBSIDIARY
NOTES TO CONSOLIDATED FINANCIAL STATEMENTS—(Continued)
DECEMBER 31, 2010 and 2009
In evaluating the allowance for loan losses, the Company prepares an analysis of its current loan portfolio through the use of historical loss rates, homogeneous risk analysis grouping to include probabilities for loss in each group by risk grade, estimation of years to impairment in each homogeneous grouping, analysis of internal credit processes, past due loan portfolio performance and overall economic conditions, both regionally and nationally.
Historical loss calculations for each homogeneous risk group are based on a three year average loss ratio calculation with the most recent quarter’s loss history included in the model. The impact is to more quickly recognize and increase the loss history in a respective grouping. For those groups with little or no loss history, management increases the historical factor through a positive adjustment to more accurately represent current economic conditions and their potential impact on that particular loan group.
Homogeneous loan groups are assigned risk factors based on their perceived loss potential, current economic conditions and on their respective risk ratings. The probability of loss is increased as the risk grade increases within each risk grouping to more accurately reflect the Bank’s exposure in that particular group of loans. The Bank utilizes a system of eight—possible risk ratings. The risk ratings are established based on perceived probability of loss. Most loans risk rated “substandard”, “doubtful” and “loss” are removed from their homogeneous group and individually analyzed for impairment. Some smaller loans risk rated “substandard”, “doubtful” and “loss” with balances less than $100 thousand are not removed from their homogeneous group and individually analyzed for impairment. Other groups of loans based on loan size may be selected for impairment review. Loans are considered impaired if, based on current information and events, it is probable that the bank will be unable to collect the scheduled payments of principal and interest when due according to the contractual terms of the loan agreement. The measurement of impaired loans is based on either the fair value of the underlying collateral, the present value of the future cash flows discounted at the historical effective interest rate stipulated in the loan agreement, or the estimated market value of the loan. In measuring the fair value of the collateral, management uses a comparison to the recent selling price of similar assets, which is consistent with those that would be utilized by unrelated third parties.
A portion of the Bank’s allowance for loan losses is not allocated to any specific category of loans. This general portion of the allowance reflects the elements of imprecision and estimation risk inherent in the calculation of the overall allowance. Due to the subjectivity involved in determining the overall allowance, including the portion determined through general qualitative and quantitative internal and external factors, the general portion may fluctuate from period to period based on management’s evaluation of the factors affecting the assumptions used in calculating the allowance, including historical loss experience, current and expected economic conditions and geographic conditions. The Company has identified an acceptable range for this general portion to be 5% to 15% of the total reserve. While the Company believes that our management uses the best information available to determine the allowance for loan losses, unforeseen market conditions could result in adjustments to the allowance for loan losses, and net income could be significantly affected, if circumstances differ substantially from the assumptions used in making the final determination. Because these factors and management’s assumptions are subject to change, the allocation is not necessarily indicative of future loan portfolio performance.
Unsecured loans are charged-off against the Company’s allowance for loan losses as soon as the loan becomes uncollectible. Unsecured loans are considered uncollectible when no regularly scheduled monthly payment has been made within three months, the loan matured over 90 days ago and has not been renewed or extended or the borrower files for bankruptcy. Secured loans are considered uncollectible when the liquidation of collateral is deemed to be the most likely source of repayment. Once secured loans reach 90 days past due, they are placed into non-accrual status. If the loan is deemed to be collateral dependent, the principal balance is written down immediately to reflect the current market valuation based on current independent appraisal. Included in the write-down is the estimated expense to liquidate the property and typically an additional allowance for the foreclosure discount. Generally, if the loan is unsecured the loan must be charged-off in full while if it is secured the loan is charged down to the net liquidation value of the collateral.
61
ECB BANCORP, INC. AND SUBSIDIARY
NOTES TO CONSOLIDATED FINANCIAL STATEMENTS—(Continued)
DECEMBER 31, 2010 and 2009
(I) Real Estate and Repossessions Acquired in Settlement of Loans
Real estate acquired in settlement of loans consists of property acquired through a foreclosure proceeding or acceptance of a deed-in-lieu of foreclosure. Real estate acquired in settlement of loans is recorded initially at estimated fair value of the property less estimated selling costs at the date of foreclosure. The initial recorded value may be subsequently reduced by additional allowances, which are charged to earnings if the estimated fair value of the property less estimated selling costs declines below the initial recorded value. Costs related to the improvement of the property are capitalized, whereas those related to holding the property are expensed. Such properties are held for sale and, accordingly, no depreciation or amortization expense is recognized. Repossessions are recorded at the lower of cost or market.
(J) Membership/Investment in Federal Home Loan Bank Stock
The Company is a member of the Federal Home Loan Bank of Atlanta (FHLB). Membership, along with a signed blanket collateral agreement, provided the Company with the ability to draw $184.0 million and $177.7 million of advances from the FHLB at December 31, 2010 and 2009, respectively. At December 31, 2010 and 2009, the Company had outstanding advances totaling $42.5 million and $41.0 million, respectively, from the FHLB.
As a requirement for membership, the Company invests in stock of the FHLB in the amount of 1% of its outstanding residential loans or 5% of its outstanding advances from the FHLB, whichever is greater. Such stock is pledged as collateral for any FHLB advances drawn by the Company. At December 31, 2010 and 2009, the Company owned 45,708 and 51,160 shares, respectively, of the FHLB’s $100 par value capital stock. No ready market exists for such stock, which is carried at cost. Due to the redemption provisions of the FHLB, cost approximates market value.
(K) Premises and Equipment
Land is carried at cost. Buildings and equipment are stated at cost less accumulated depreciation. Depreciation is computed by the straight-line method and is charged to operations over the estimated useful lives of the assets which range from 25 to 50 years for bank premises and 3 to 10 years for furniture and equipment. Construction in progress includes buildings and equipment carried at cost and depreciated once placed into service.
Maintenance, repairs, renewals and minor improvements are charged to expense as incurred. Major improvements are capitalized and depreciated.
(L) Short-Term Borrowings
Short-term borrowings consist of securities sold under agreements to repurchase, overnight sweep accounts, federal funds purchased and short-term FHLB advances.
(M) Long-Term Obligations
Long-term obligations consist of advances from FHLB with maturities greater than one year. Our long-term borrowing from the FHLB totaled $34.5 million on December 31, 2010, compared to $21.0 million long-term FHLB advances on December 31, 2009.
(N) Income Taxes
The Company records income taxes using the asset and liability method. Under this method, deferred income taxes are determined based on temporary differences between the financial statement and tax bases of assets and liabilities and gives current recognition to changes in tax rates and laws.
62
ECB BANCORP, INC. AND SUBSIDIARY
NOTES TO CONSOLIDATED FINANCIAL STATEMENTS—(Continued)
DECEMBER 31, 2010 and 2009
Tax positions are analyzed in accordance with generally accepted accounting principles and are discussed in Note 6. Interest recognized as a result of our analysis of tax positions would be classified as interest expense. Penalties would be classified as noninterest expense.
(O) Advertising Costs
Advertising costs are expensed as incurred.
(P) Stock Option Plan
The Company recognizes compensation cost relating to share-based payment transactions in the financial statements in accordance with generally accepted accounting principles. The cost is measured based on the fair value of the equity or liability instruments issued. The expense measures the cost of employee services received in exchange for stock options based on the grant-date fair value of the award, and recognizes the cost over the period the employee is required to provide services for the award.
During 2008, the Company adopted the 2008 Omnibus Equity Plan (the Plan) which replaced the expired 1998 Omnibus Stock Ownership and Long-Term Incentive Plan. The Plan provides for the issuance of up to an aggregate of 200,000 shares of common stock of the Company in the form of stock options, restricted stock awards and performance share awards. It is the Company’s policy to issue new shares to satisfy option exercises. Stock options generally vest one-third each year beginning three years after the grant date and expire after 10 years. However, certain grants vest one-third each year, beginning one year after the grant date. Restricted stock generally vests one-third each year beginning three years after the grant date.
(Q) Net Income Per Share
Basic net income per share is calculated by dividing net income (loss) available to common shareholders by the weighted-average number of common shares outstanding during the period. For purposes of basic net income per share, unvested restricted stock is considered “contingently issuable” and is not included in the weighted average number of common shares outstanding.
Diluted net income per share is computed by assuming the issuance of common shares for all dilutive potential common shares outstanding during the reporting period. Restricted stock is considered outstanding for purposes of diluted net income per share. The amount of compensation cost attributed to future services and not yet recognized is considered “proceeds” using the treasury stock method. Restricted stock had no affect on diluted weighted-average shares outstanding for the years ended December 31, 2010 and December 31, 2009. Diluted weighted-average shares outstanding increased 2 thousand shares for 2008 due to the dilutive impact of restricted stock.
In computing diluted net income per share, it is assumed that all dilutive stock options are exercised during the reporting period at their respective exercise prices, with the proceeds from the exercises used by the Company to buy back stock in the open market at the average market price in effect during the reporting period. The difference between the number of shares assumed to be exercised and the number of shares bought back is added to the number of weighted-average common shares outstanding during the period. The sum is used as the denominator to calculate diluted net income per share for the Company. Diluted weighted-average shares outstanding did not increase for 2010 and increased 1 thousand and 3 thousand shares for 2009 and 2008, respectively, due to the dilutive impact of options. As of December 31, 2010 and 2009 the warrant, covering approximately 145 thousand shares, issued to the U.S. Treasury Department was not included in the computation of net income per share for the period because its exercise price exceeded the average market price of the Company’s stock for the period.
63
ECB BANCORP, INC. AND SUBSIDIARY
NOTES TO CONSOLIDATED FINANCIAL STATEMENTS—(Continued)
DECEMBER 31, 2010 and 2009
The following is a reconciliation of the numerators and denominators used in computing basic and diluted net income (loss) per share.
| Year Ended December 31, 2010 | ||||||||||||
| Income (Numerator) |
Shares (Denominator) |
Per Share Amount |
||||||||||
| (Amounts in thousands, except per share data) | ||||||||||||
| Basic net loss per share |
$ | (203 | ) | 2,850 | $ | (0.07 | ) | |||||
| Effect of dilutive securities |
— | — | ||||||||||
| Diluted net loss per share |
$ | (203 | ) | 2,850 | $ | (0.07 | ) | |||||
At December 31, 2010, there were 29 thousand options outstanding and a warrant covering 145 thousand shares which would have had an anti-dilutive affect on the loss per share.
| Year Ended December 31, 2009 | ||||||||||||
| Income (Numerator) |
Shares (Denominator) |
Per Share Amount |
||||||||||
| (Amounts in thousands, except per share data) | ||||||||||||
| Basic net income per share |
$ | 499 | 2,845 | $ | 0.18 | |||||||
| Effect of dilutive securities |
— | 1 | ||||||||||
| Diluted net income per share |
$ | 499 | 2,846 | $ | 0.18 | |||||||
At December 31, 2009, there were 54 thousand options outstanding and a warrant covering 145 thousand shares with an exercise price above the average market value of the Company’s stock for the period.
| Year Ended December 31, 2008 | ||||||||||||
| Income (Numerator) |
Shares (Denominator) |
Per Share Amount |
||||||||||
| (Amounts in thousands, except per share data) | ||||||||||||
| Basic net income per share |
$ | 3,419 | 2,884 | $ | 1.19 | |||||||
| Effect of dilutive securities |
— | 5 | ||||||||||
| Diluted net income per share |
$ | 3,419 | 2,889 | $ | 1.18 | |||||||
At December 31, 2008, there were 54 thousand options outstanding with an exercise price above the average market value of the Company’s stock for the period.
64
ECB BANCORP, INC. AND SUBSIDIARY
NOTES TO CONSOLIDATED FINANCIAL STATEMENTS—(Continued)
DECEMBER 31, 2010 and 2009
(R) Comprehensive Income
Comprehensive income is defined as the change in equity during a period for non-owner transactions and is divided into net income and other comprehensive income (loss). Other comprehensive income (loss) includes revenues, expenses, gains, and losses that are excluded from earnings under current accounting standards. The components of other comprehensive income (loss) included in comprehensive income for the periods presented are as follows (dollars in thousands):
| 2010 | 2009 | 2008 | ||||||||||
| Unrealized gains arising during the period |
$ | 1,116 | $ | 2,232 | $ | 3,018 | ||||||
| Tax expense |
(430 | ) | (860 | ) | (1,163 | ) | ||||||
| Reclassification to realized gains |
(5,508 | ) | (2,565 | ) | (218 | ) | ||||||
| Tax expense |
2,121 | 988 | 85 | |||||||||
| Other comprehensive income (loss) |
$ | (2,701 | ) | $ | (205 | ) | $ | 1,722 | ||||
(S) New Accounting Pronouncements
The following is a summary of recent authoritative pronouncements:
In March 2010, guidance related to derivatives and hedging was amended to exempt embedded credit derivative features related to the transfer of credit risk from potential bifurcation and separate accounting. Embedded features related to other types of risk and other embedded credit derivative features are not exempt from potential bifurcation and separate accounting. The amendments were effective for the Company on July 1, 2010. These amendments had no impact on the financial statements.
In July 2010, the Receivables topic of the ASC was amended to require expanded disclosures related to a company’s allowance for credit losses and the credit quality of its financing receivables. The amendments will require the allowance disclosures to be provided on a disaggregated basis. The Company is required to begin to comply with the disclosures in its financial statements for the year ended December 31, 2010. Disclosures about Troubled Debt Restructurings (“TDRs”) required by the update have been deferred by an update issued in early 2011. The TDR disclosures are anticipated to be effective for periods ending after June 15, 2011. See Note 4.
Other accounting standards that have been issued or proposed by the FASB or other standards-setting bodies are not expected to have a material impact on the Company’s financial position, results of operations or cash flows.
(T) SUBSEQUENT EVENTS
In preparing these consolidated financial statements, the Company has evaluated events and transactions for potential recognition or disclosure through the date the consolidated financial statements were issued.
65
ECB BANCORP, INC. AND SUBSIDIARY
NOTES TO CONSOLIDATED FINANCIAL STATEMENTS—(Continued)
DECEMBER 31, 2010 and 2009
2. INVESTMENT SECURITIES
The following is a summary of the securities portfolio by major classification (dollars in thousands):
| December 31, 2010 | ||||||||||||||||
| Amortized Cost |
Gross Unrealized Gains |
Gross Unrealized Losses |
Fair Value |
|||||||||||||
| Securities available-for-sale: | (Dollars in Thousands) | |||||||||||||||
| Government-sponsored enterprises and FFCB bonds |
$ | 25,466 | $ | 183 | $ | (868 | ) | $ | 24,781 | |||||||
| Obligations of states and political subdivisions |
12,818 | 240 | (80 | ) | 12,978 | |||||||||||
| Mortgage-backed securities |
150,850 | 837 | (1,597 | ) | 150,090 | |||||||||||
| SBA-backed securities |
57,362 | 258 | (767 | ) | 56,853 | |||||||||||
| Corporate bonds |
29,387 | 77 | (937 | ) | 28,527 | |||||||||||
| $ | 275,883 | $ | 1,595 | $ | (4,249 | ) | $ | 273,229 | ||||||||
| December 31, 2009 | ||||||||||||||||
| Amortized Cost |
Gross Unrealized Gains |
Gross Unrealized Losses |
Fair Value | |||||||||||||
| Securities available-for-sale: | (Dollars in Thousands) | |||||||||||||||
| Government-sponsored enterprises and FFCB bonds |
$ | 36,141 | $ | 69 | $ | (367 | ) | $ | 35,843 | |||||||
| Obligations of states and political subdivisions |
45,242 | 997 | (217 | ) | 46,022 | |||||||||||
| Mortgage-backed securities |
116,829 | 1,844 | (537 | ) | 118,136 | |||||||||||
| SBA-backed securities |
32,338 | 359 | (32 | ) | 32,665 | |||||||||||
| Corporate bonds |
6,044 | — | (184 | ) | 5,860 | |||||||||||
| Equity securities |
1,000 | — | (194 | ) | 806 | |||||||||||
| $ | 237,594 | $ | 3,269 | $ | (1,531 | ) | $ | 239,332 | ||||||||
Gross realized gains and losses on sales of securities for the years ended December 31, 2010, 2009 and 2008 were as follows (dollars in thousands):
| 2010 | 2009 | 2008 | ||||||||||
| Gross realized gains |
$ | 5,943 | $ | 2,579 | $ | 256 | ||||||
| Gross realized losses |
(435 | ) | (14 | ) | (38 | ) | ||||||
| Net realized (losses) gains |
$ | 5,508 | $ | 2,565 | $ | 218 | ||||||
66
ECB BANCORP, INC. AND SUBSIDIARY
NOTES TO CONSOLIDATED FINANCIAL STATEMENTS—(Continued)
DECEMBER 31, 2010 and 2009
Impairment of Certain Investments in Debt and Equity Securities. The following tables set forth the amount of unrealized losses at December 31, 2010 and 2009 (that is, the amount by which cost or amortized cost exceeds fair value), and the related fair value of investments with unrealized losses, none of which are considered to be other-than-temporarily impaired. The tables are segregated into investments that have been in a continuous unrealized-loss position for less than 12 months from those that have been in a continuous unrealized-loss position for 12 months or longer (dollars in thousands).
December 31, 2010
| Less Than 12 Months | 12 Months or longer | Total | ||||||||||||||||||||||
| Fair Value |
Unrealized Losses |
Fair Value |
Unrealized Losses |
Fair Value |
Unrealized Losses |
|||||||||||||||||||
| Government-sponsored enterprises and FFCB bonds |
$ | 17,410 | $ | 868 | $ | — | $ | — | $ | 17,410 | $ | 868 | ||||||||||||
| Obligations of states and political subdivisions |
3,548 | 80 | — | — | 3,548 | 80 | ||||||||||||||||||
| Mortgage-backed securities |
99,549 | 1,597 | — | — | 99,549 | 1,597 | ||||||||||||||||||
| SBA-backed securities |
31,963 | 767 | — | — | 31,963 | 767 | ||||||||||||||||||
| Corporate bonds |
20,815 | 654 | 1,717 | 283 | 22,532 | 937 | ||||||||||||||||||
| Total |
$ | 173,285 | $ | 3,966 | $ | 1,717 | $ | 283 | $ | 175,002 | $ | 4,249 | ||||||||||||
December 31, 2009
| Less Than 12 Months | 12 Months or longer | Total | ||||||||||||||||||||||
| Fair Value |
Unrealized Losses |
Fair Value |
Unrealized Losses |
Fair Value |
Unrealized Losses |
|||||||||||||||||||
| Government-sponsored enterprises and FFCB bonds |
$ | 18,431 | $ | 367 | $ | — | $ | — | $ | 18,431 | $ | 367 | ||||||||||||
| Obligations of states and political subdivisions |
7,315 | 96 | 3,118 | 121 | 10,433 | 217 | ||||||||||||||||||
| Mortgage-backed securities |
46,771 | 536 | 102 | 1 | 46,873 | 537 | ||||||||||||||||||
| SBA-backed securities |
9,688 | 32 | — | — | 9,688 | 32 | ||||||||||||||||||
| Corporate bonds |
3,354 | 154 | 2,505 | 30 | 5,859 | 184 | ||||||||||||||||||
| Equity securities |
— | — | 806 | 194 | 806 | 194 | ||||||||||||||||||
| Total |
$ | 85,559 | $ | 1,185 | $ | 6,531 | $ | 346 | $ | 92,090 | $ | 1,531 | ||||||||||||
As of December 31, 2010 and 2009, management has concluded that the unrealized losses presented above are temporary in nature since they are not related to the underlying credit quality of the issuers, and the Company has the intent and ability to hold these investments for a time necessary to recover their cost. The losses above, except for equity securities, are on debt securities that have contractual maturity dates and are primarily related to market interest rates. Losses on obligations of states and political subdivisions are also related to lack of liquidity and demand in the general investment market. All unrealized losses on investment securities are not considered to be other-than-temporary, because they are related to changes in interest rates, lack of liquidity and demand in the general investment market and do not affect the expected cash flows of the underlying collateral or the issuer. The Bank’s mortgage-backed securities are all backed by government sponsored enterprises or agencies. The Bank does not own any private label mortgage-backed securities.
67
ECB BANCORP, INC. AND SUBSIDIARY
NOTES TO CONSOLIDATED FINANCIAL STATEMENTS—(Continued)
DECEMBER 31, 2010 and 2009
At December 31, 2010 and December 31, 2009, the balance of Federal Home Loan Bank (“FHLB”) of Atlanta stock held by the Company was $4.6 million and $5.1 million, respectively. The FHLB paid a dividend for the third quarter of 2010 with an annualized rate of 0.39%. The dividend rate was equal to the average three month LIBOR for the period of July 1, 2010 to September 30, 2010, and was applicable to capital stock held during that period. Management believes that its investment in FHLB stock was not other-than-temporarily impaired as of December 31, 2010 or December 31, 2009. However, there can be no assurance that the impact of recent or future legislation on the Federal Home Loan Banks will not also cause a decrease in the value of the FHLB stock held by the Company.
The aggregate amortized cost and fair value of the available-for-sale securities portfolio at December 31, 2010 by remaining contractual maturity are as follows (dollars in thousands):
| Amortized Cost |
Fair Value |
|||||||
| Government-sponsored enterprises and FFCB bonds: |
||||||||
| Due in one through five years |
$ | 2,000 | $ | 1,972 | ||||
| Due in five through ten years |
16,108 | 15,982 | ||||||
| Due after ten years |
7,358 | 6,827 | ||||||
| Obligations of states and political subdivisions: |
||||||||
| Due in one year or less |
370 | 373 | ||||||
| Due in one through five years |
252 | 253 | ||||||
| Due in five through ten years |
5,203 | 5,354 | ||||||
| Due after ten years |
6,993 | 6,998 | ||||||
| Mortgage-backed securities: |
||||||||
| Due in five through ten years |
4,307 | 4,551 | ||||||
| Due after ten years |
146,543 | 145,539 | ||||||
| SBA-backed securities: |
||||||||
| Due in five through ten years |
5,889 | 5,973 | ||||||
| Due after ten years |
51,473 | 50,880 | ||||||
| Corporate bonds: |
||||||||
| Due in one year or less |
8,779 | 8,712 | ||||||
| Due in five through ten years |
17,421 | 16,767 | ||||||
| Due after ten years |
3,187 | 3,048 | ||||||
| Total securities |
$ | 275,883 | $ | 273,229 | ||||
68
ECB BANCORP, INC. AND SUBSIDIARY
NOTES TO CONSOLIDATED FINANCIAL STATEMENTS—(Continued)
DECEMBER 31, 2010 and 2009
Securities with an amortized cost of $212.2 million at December 31, 2010 are pledged as collateral. Of this total, amortized cost of $52.9 million and fair value of $52.2 million are pledged as collateral for FHLB advances.
The aggregate amortized cost and fair value of the available-for-sale securities portfolio at December 31, 2009 by remaining contractual maturity are as follows (dollars in thousands):
| Amortized Cost |
Fair Value |
|||||||
| Government-sponsored enterprises and FFCB bonds: |
||||||||
| Due in one through five years |
$ | 7,152 | $ | 7,166 | ||||
| Due in five through ten years |
20,610 | 20,392 | ||||||
| Due after ten years |
8,379 | 8,285 | ||||||
| Obligations of states and political subdivisions: |
||||||||
| Due in one year or less |
870 | 876 | ||||||
| Due in one through five years |
7,006 | 7,343 | ||||||
| Due in five through ten years |
17,997 | 18,448 | ||||||
| Due after ten years |
19,369 | 19,355 | ||||||
| Mortgage-backed securities: |
||||||||
| Due in five through ten years |
7,942 | 8,296 | ||||||
| Due after ten years |
108,887 | 109,840 | ||||||
| SBA-backed securities: |
||||||||
| Due in five through ten years |
6,505 | 6,506 | ||||||
| Due after ten years |
25,833 | 26,159 | ||||||
| Corporate bonds: |
||||||||
| Due in five through ten years |
6,044 | 5,860 | ||||||
| Equity securities: |
1,000 | 806 | ||||||
| Total securities |
$ | 237,594 | $ | 239,332 | ||||
Securities with an amortized cost of $142.4 million at December 31, 2009 are pledged as collateral. Of this total, amortized cost of $55.6 million and fair value of $56.6 million are pledged as collateral for FHLB advances.
69
ECB BANCORP, INC. AND SUBSIDIARY
NOTES TO CONSOLIDATED FINANCIAL STATEMENTS—(Continued)
DECEMBER 31, 2010 and 2009
3. LOANS
Loans at December 31, 2010 and 2009 classified by type are as follows (dollars in thousands):
| 2010 | 2009 | |||||||
| Real estate loans: |
||||||||
| Construction and land development |
$ | 90,267 | $ | 126,032 | ||||
| Secured by farmland |
26,694 | 25,025 | ||||||
| Secured by residential properties |
120,183 | 110,754 | ||||||
| Secured by nonfarm, nonresidential properties |
218,028 | 199,501 | ||||||
| Consumer installment |
4,096 | 4,243 | ||||||
| Credit cards and related plans |
2,261 | 2,452 | ||||||
| Commercial and all other loans: |
||||||||
| Commercial and industrial |
60,242 | 65,949 | ||||||
| Loans to finance agricultural production |
28,217 | 25,481 | ||||||
| All other loans |
17,863 | 18,626 | ||||||
| 567,851 | 578,063 | |||||||
| Less deferred fees and costs, net |
220 | 272 | ||||||
| $ | 567,631 | $ | 577,791 | |||||
| Included in the above: |
||||||||
| Nonaccrual loans |
$ | 15,896 | $ | 13,344 | ||||
| Restructured loans1 |
6,193 | 1,353 | ||||||
| 1. | Restructed loans includes loans restructured and still accruing. The Company is not committed to advance additional funds on restructured loans. |
70
ECB BANCORP, INC. AND SUBSIDIARY
NOTES TO CONSOLIDATED FINANCIAL STATEMENTS—(Continued)
DECEMBER 31, 2010 and 2009
At December 31, 2010, the recorded investment in loans that are considered to be impaired is $26.3 million; of this total, $13.2 million had allowance for loan losses allocated to these loans in the amount of $2.4 million. At December 31, 2010 $11.8 million of the recorded investment in impaired loans were loans that were written down through partial charge-offs of $7.3 million. At December 31, 2009, the recorded investment in loans that were considered to be impaired was $23.9 million; of this total, $8.7 million had allowance for loan losses allocated to these loans in the amount of $2.0 million. At December 31, 2009 $5.8 million of the recorded investment in impaired loans were loans that were written down through partial charge-offs of $3.1 million and therefore did not require allocated reserves.
The average recorded investment in loans that are considered to be impaired during the year ended December 31, 2010 is $31.2 million. For the year ended December 31, 2010, the Company recognized approximately $0.6 million of interest income on impaired loans.
The average recorded investment in loans that were considered to be impaired during the year ended December 31, 2009 was $21.9 million. For the year ended December 31, 2009, the Company recognized approximately $0.3 million of interest income on impaired loans.
The average recorded investment in loans that were considered to be impaired during the year ended December 31, 2008 was $10.7 million. For the year ended December 31, 2008, the Company recognized approximately $0.5 million of interest income on impaired loans.
The Company, through its normal lending activity, originates and maintains loans receivable that are substantially concentrated in the Eastern region of North Carolina, where its offices are located. The Company’s policy calls for collateral or other forms of repayment assurance to be received from the borrower at the time of loan origination. Such collateral or other form of repayment assurance is subject to changes in economic value due to various factors beyond the control of the Company, and such changes could be significant.
At December 31, 2010 and 2009, included in mortgage, commercial, and residential loans were loans collateralized by owner-occupied residential real estate of approximately $55.5 million and $54.0 million, respectively.
Loans with a book value of approximately $30.1 million at December 31, 2010 are pledged as eligible collateral for FHLB advances.
4. CREDIT QUALITY OF LOANS AND ALLOWANCE FOR LOAN LOSSES
An analysis of the allowance for loan losses for the years ended December 31, 2010, 2009 and 2008 follows (dollars in thousands):
| December 31, | ||||||||||||
| 2010 | 2009 | 2008 | ||||||||||
| Beginning balance |
$ | 9,725 | $ | 5,931 | $ | 4,083 | ||||||
| Provision for loan losses |
12,980 | 11,100 | 2,450 | |||||||||
| Recoveries |
287 | 260 | 97 | |||||||||
| Loans charged off |
(9,745 | ) | (7,566 | ) | (699 | ) | ||||||
| Ending balance |
$ | 13,247 | $ | 9,725 | $ | 5,931 | ||||||
71
ECB BANCORP, INC. AND SUBSIDIARY
NOTES TO CONSOLIDATED FINANCIAL STATEMENTS—(Continued)
DECEMBER 31, 2010 and 2009
The following table summarizes the balances by loan category of the allowance for loan losses with changes arising from charge-offs, recoveries and provision expense for the year ending December 31, 2010 (dollars in thousands):
Allowance for Loan Losses
As of December 31, 2010
| Allowance for Credit Losses |
Real Estate Construction and Land Development |
Real Estate Secured by Farmland |
Real Estate Secured by Residential Properties |
Real Estate Secured by Nonfarm Nonresidential |
Consumer Installment |
Credit Cards and Related Plans |
Commercial and Industrial |
Loans to Finance Agricultural Production |
All Other Loans |
General Qualitative & Quantitative Portion |
Total | |||||||||||||||||||||||||||||||||
| Beginning balance |
$ | 4,623 | $ | 25 | $ | 2,383 | $ | 541 | $ | 23 | $ | 13 | $ | 523 | $ | 16 | $ | 169 | $ | 1,409 | $ | 9,725 | ||||||||||||||||||||||
| Charge-offs |
(5,977 | ) | (—) | (2,022 | ) | (213 | ) | (54 | ) | (11 | ) | (1,191 | ) | (—) | (277 | ) | (—) | (9,745 | ) | |||||||||||||||||||||||||
| Recoveries |
111 | — | 19 | — | 7 | 1 | 19 | — | 130 | — | 287 | |||||||||||||||||||||||||||||||||
| Provisions |
7,411 | 3 | 3,070 | 679 | 36 | 18 | 1,531 | 2 | 117 | 113 | 12,980 | |||||||||||||||||||||||||||||||||
| Ending Balance |
$ | 6,168 | $ | 28 | $ | 3,450 | $ | 1,007 | $ | 12 | $ | 21 | $ | 882 | $ | 18 | $ | 139 | $ | 1,522 | $ | 13,247 | ||||||||||||||||||||||
| Ending Balance |
||||||||||||||||||||||||||||||||||||||||||||
| Individually evaluated for impairment |
$ | 803 | $ | — | $ | 916 | $ | 546 | $ | — | $ | — | $ | 102 | $ | — | $ | — | $ | — | $ | 2,367 | ||||||||||||||||||||||
| Ending Balance |
||||||||||||||||||||||||||||||||||||||||||||
| Collectively evaluated for impairment |
$ | 5,365 | $ | 28 | $ | 2,534 | $ | 461 | $ | 12 | $ | 21 | $ | 780 | $ | 18 | $ | 139 | $ | 1,522 | $ | 10,880 | ||||||||||||||||||||||
| Loans |
||||||||||||||||||||||||||||||||||||||||||||
| Ending Balance |
$ | 90,145 | $ | 26,661 | $ | 120,278 | $ | 217,709 | $ | 4,209 | $ | 2,261 | $ | 60,238 | $ | 28,215 | $ | 17,915 | $ | — | $ | 567,631 | ||||||||||||||||||||||
| Ending Balance: individually evaluated for impairment |
$ | 15,940 | $ | — | $ | 6,103 | $ | 3,812 | $ | — | $ | — | $ | 397 | $ | — | $ | — | $ | — | $ | 26,252 | ||||||||||||||||||||||
| Ending Balance: collectively evaluated for impairment |
$ | 74,205 | $ | 26,661 | $ | 114,175 | $ | 213,897 | $ | 4,209 | $ | 2,261 | $ | 59,841 | $ | 28,215 | $ | 17,915 | $ | — | $ | 541,379 | ||||||||||||||||||||||
72
ECB BANCORP, INC. AND SUBSIDIARY
NOTES TO CONSOLIDATED FINANCIAL STATEMENTS—(Continued)
DECEMBER 31, 2010 and 2009
Loans are closely monitored by management for changes in quality. This monitoring includes assessing the appropriateness of the credit quality indicator in relation to the risk of the loan. Management uses the following indicators to grade the risk of each loan.
Pass: The primary source of repayment for pass loans is very likely to be sufficient, with secondary sources readily available; strong financial position; minimal risk; profitability, liquidity and capitalization are better than industry norms.
Weak Pass: The asset quality for weak pass assets is generally acceptable. Primary source of loan repayment is acceptable and secondary sources are likely to be realized, if needed; acceptable business credit, but borrowers operations, cash flow, or financial condition evidence more than average risk; requires above average levels of supervision and attention from Loan Officer. The source of increased risk has been identified, can be effectively managed/corrected, and the increased risk is not significant to warrant a more severe rating.
Special Mention: A special mention asset is considered to be high risk due to potential weaknesses that deserve management’s close attention. If left uncorrected, these potential weaknesses may result in the deterioration of the repayment prospects for the asset or in the Company’s credit position at some future date. Special mention assets are not adversely classified and do not expose the Company to sufficient risk to warrant adverse classification.
Substandard: Loans rated as substandard are considered to be very high risk. A substandard asset is inadequately protected by the current sound worth and paying capacity of the obligor or of the collateral pledged, if any. Assets so classified must have a well-defined weakness or weakness that jeopardizes the liquidation of the debt. They are characterized by the distinct possibility that the Company will sustain some loss if the deficiencies are not corrected.
The following table presents loans as of December 31, 2010 classified by risk type (dollars in thousands):
Credit Quality Indicators
As of December 31, 2010
| Pass | Weak Pass |
Special Mention |
Substandard | Total | ||||||||||||||||
| Real Estate—Construction and Land Development Loans |
$ | 35,356 | $ | 27,978 | $ | 9,466 | $ | 17,345 | $ | 90,145 | ||||||||||
| Real Estate—Secured by Farmland |
17,869 | 6,294 | 2,495 | 3 | 26,661 | |||||||||||||||
| Real Estate—Secured by Residential Properties |
64,457 | 43,364 | 3,469 | 8,988 | 120,278 | |||||||||||||||
| Real Estate—Secured by Nonfarm Nonresidential |
94,208 | 96,287 | 20,107 | 7,107 | 217,709 | |||||||||||||||
| Consumer Installment |
2,466 | 1,460 | 265 | 18 | 4,209 | |||||||||||||||
| Credit Cards and Related Plans |
1,211 | 869 | 89 | 92 | 2,261 | |||||||||||||||
| Commercial and Industrial |
33,416 | 22,805 | 3,292 | 725 | 60,238 | |||||||||||||||
| Loans to Finance Agriculture Production |
18,346 | 7,230 | 2,639 | — | 28,215 | |||||||||||||||
| All Other Loans |
8,442 | 9,341 | 119 | 13 | 17,915 | |||||||||||||||
| Total |
$ | 275,771 | $ | 215,628 | $ | 41,941 | $ | 34,291 | $ | 567,631 | ||||||||||
73
ECB BANCORP, INC. AND SUBSIDIARY
NOTES TO CONSOLIDATED FINANCIAL STATEMENTS—(Continued)
DECEMBER 31, 2010 and 2009
The following table summarizes the past due loans by category as of December 31, 2010 (dollars in thousands):
Past Due Loans
As of December 31, 2010
| 30-59 Days Past Due |
60-89 Days Past Due |
Greater than 90 Days |
Total Past Due |
Current | Total | |||||||||||||||||||
| Real Estate Construction and Land Development |
$ | 2,997 | $ | 929 | $ | 9,627 | $ | 13,553 | $ | 76,592 | $ | 90,145 | ||||||||||||
| Real Estate Secured by Farmland |
— | — | — | — | 26,661 | 26,661 | ||||||||||||||||||
| Real Estate Secured by Residential Properties |
251 | 389 | 2,526 | 3,166 | 117,112 | 120,278 | ||||||||||||||||||
| Real Estate Secured by Nonfarm Nonresidential |
545 | — | 919 | 1,464 | 216,245 | 217,709 | ||||||||||||||||||
| Consumer Installment |
35 | 6 | 5 | 46 | 4,163 | 4,209 | ||||||||||||||||||
| Credit Cards and Related Plans |
3 | — | — | 3 | 2,258 | 2,261 | ||||||||||||||||||
| Commercial and Industrial |
111 | 19 | 553 | 683 | 59,555 | 60,238 | ||||||||||||||||||
| Loans to Finance Agricultural Production |
— | — | — | — | 28,215 | 28,215 | ||||||||||||||||||
| All Other Loans |
22 | 4 | — | 26 | 17,889 | 17,915 | ||||||||||||||||||
| Total |
$ | 3,964 | $ | 1,347 | $ | 13,630 | $ | 18,941 | $ | 548,690 | $ | 567,631 | ||||||||||||
74
ECB BANCORP, INC. AND SUBSIDIARY
NOTES TO CONSOLIDATED FINANCIAL STATEMENTS—(Continued)
DECEMBER 31, 2010 and 2009
The following table presents impaired loans as of December 31, 2010 (dollars in thousands):
Impaired Loans
As of December 31, 2010
| Recorded Investment |
Unpaid Principal Balance |
Related Allowance |
Average Recorded Investment |
Interest Income Recognized |
||||||||||||||||
| With no related allowance recorded: |
||||||||||||||||||||
| Real Estate Construction and Land Development |
$ | 9,212 | $ | 13,354 | $ | — | $ | 9,146 | $ | 190 | ||||||||||
| Real Estate Secured by Farmland |
— | — | — | — | — | |||||||||||||||
| Real Estate Secured by Residential Properties |
2,700 | 2,972 | — | 3,909 | 81 | |||||||||||||||
| Real Estate Secured by Nonfarm Nonresidential |
1,029 | 1,097 | — | 5,662 | 117 | |||||||||||||||
| Consumer Installment |
— | — | — | — | — | |||||||||||||||
| Credit Cards and Related Plans |
— | — | — | — | — | |||||||||||||||
| Commercial and Industrial |
218 | 217 | — | 385 | 8 | |||||||||||||||
| Loans to Finance Agricultural Production |
— | — | — | — | — | |||||||||||||||
| All Other Loans |
— | — | — | — | — | |||||||||||||||
| Total impaired loans with no related allowance recorded |
$ | 13,159 | $ | 17,640 | $ | — | $ | 19,102 | $ | 396 | ||||||||||
| With an allowance recorded: |
||||||||||||||||||||
| Real Estate Construction and Land Development |
$ | 6,771 | $ | 9,497 | $ | 803 | $ | 6,571 | $ | 136 | ||||||||||
| Real Estate Secured by Farmland |
— | — | — | — | — | |||||||||||||||
| Real Estate Secured by Residential Properties |
3,411 | 3,405 | 915 | 3,312 | 69 | |||||||||||||||
| Real Estate Secured by Nonfarm Nonresidential |
2,794 | 2,784 | 546 | 1,241 | 26 | |||||||||||||||
| Consumer Installment |
— | — | — | — | — | |||||||||||||||
| Credit Cards and Related Plans |
— | — | — | — | — | |||||||||||||||
| Commercial and Industrial |
179 | 199 | 102 | 925 | 19 | |||||||||||||||
| Loans to Finance Agricultural Production |
— | — | — | — | — | |||||||||||||||
| All Other Loans |
— | — | — | — | — | |||||||||||||||
| Total impaired loans with related allowance recorded |
$ | 13,155 | $ | 15,885 | $ | 2,366 | $ | 12,049 | $ | 250 | ||||||||||
| Total |
||||||||||||||||||||
| Construction and Land Development |
$ | 15,983 | $ | 22,851 | $ | 803 | $ | 15,717 | $ | 326 | ||||||||||
| Residential |
6,111 | 6,377 | 915 | 7,221 | 150 | |||||||||||||||
| Commercial |
4,220 | 4,297 | 648 | 8,213 | 170 | |||||||||||||||
| Consumer |
— | — | — | — | — | |||||||||||||||
| Total impaired loans |
$ | 26,314 | $ | 33,525 | $ | 2,366 | $ | 31,151 | $ | 646 | ||||||||||
75
ECB BANCORP, INC. AND SUBSIDIARY
NOTES TO CONSOLIDATED FINANCIAL STATEMENTS—(Continued)
DECEMBER 31, 2010 and 2009
The following table presents nonaccrual loans as of December 31, 2010 by loan category (dollars in thousands):
Nonaccrual Loans
As of December 31, 2010
| 2010 | ||||
| Real Estate Construction and Land Development |
$ | 10,839 | ||
| Real Estate Secured by Farmland |
— | |||
| Real Estate Secured by Residential Properties |
3,268 | |||
| Real Estate Secured by Nonfarm Nonresidential |
1,231 | |||
| Consumer Installment |
5 | |||
| Credit Cards and Related Plans |
— | |||
| Commercial and Industrial |
553 | |||
| Loans to Finance Agricultural Production |
— | |||
| All Other Loans |
— | |||
| Total |
$ | 15,896 | ||
5. BANK PREMISES AND EQUIPMENT
The components of bank premises and equipment at December 31, 2010 and 2009 are as follows (dollars in thousands):
| Cost | Accumulated Depreciation |
Undepreciated Cost |
||||||||||
| December 31, 2010: |
||||||||||||
| Land |
$ | 10,241 | $ | — | $ | 10,241 | ||||||
| Land improvements |
302 | 203 | 99 | |||||||||
| Buildings |
18,993 | 5,430 | 13,563 | |||||||||
| Construction in progress |
463 | — | 463 | |||||||||
| Furniture and equipment |
7,253 | 4,983 | 2,270 | |||||||||
| Total |
$ | 37,252 | $ | 10,616 | $ | 26,636 | ||||||
| December 31, 2009: |
||||||||||||
| Land |
$ | 10,036 | $ | — | $ | 10,036 | ||||||
| Land improvements |
280 | 188 | 92 | |||||||||
| Buildings |
17,492 | 4,866 | 12,626 | |||||||||
| Construction in progress |
617 | — | 617 | |||||||||
| Furniture and equipment |
6,399 | 4,441 | 1,958 | |||||||||
| Total |
$ | 34,824 | $ | 9,495 | $ | 25,329 | ||||||
76
ECB BANCORP, INC. AND SUBSIDIARY
NOTES TO CONSOLIDATED FINANCIAL STATEMENTS—(Continued)
DECEMBER 31, 2010 and 2009
6. INCOME TAXES
The components of income tax expense (benefit) are as follows (dollars in thousands):
| Current | Deferred* | Total | ||||||||||
| Year ended December 31, 2010: |
||||||||||||
| Federal |
$ | 831 | $ | (1,439 | ) | $ | (608 | ) | ||||
| State |
135 | (293 | ) | (158 | ) | |||||||
| $ | 966 | $ | (1,732 | ) | $ | (766 | ) | |||||
| Year ended December 31, 2009: |
||||||||||||
| Federal |
$ | 2,863 | $ | (3,455 | ) | $ | (592 | ) | ||||
| State |
698 | (463 | ) | 235 | ||||||||
| $ | 3,561 | $ | (3,918 | ) | $ | (357 | ) | |||||
| Year ended December 31, 2008: |
||||||||||||
| Federal |
$ | 1,113 | $ | (684 | ) | $ | 429 | |||||
| State |
213 | (62 | ) | 151 | ||||||||
| $ | 1,326 | $ | (746 | ) | $ | 580 | ||||||
| * | Included in deferred tax is release of valuation allowance adjustment of $62 thousand for year ending December 31, 2009 and $230 thousand for year ending December 31, 2008. |
Total income tax expense was less than the amount computed by applying the federal income tax rate of 34% to income before income taxes. The reasons for the difference were as follows (dollars in thousands):
| Years ended December 31, |
||||||||||||
| 2010 | 2009 | 2008 | ||||||||||
| Income taxes at statutory rate |
$ | 32 | $ | 389 | $ | 1,360 | ||||||
| Increase (decrease) resulting from: |
||||||||||||
| Effect of non-taxable interest income |
(539 | ) | (548 | ) | (493 | ) | ||||||
| Decrease in valuation allowance |
(— | ) | (62 | ) | (230 | ) | ||||||
| Bank owned life insurance |
(101 | ) | (105 | ) | (108 | ) | ||||||
| State taxes, net of federal benefit |
(105 | ) | 155 | 99 | ||||||||
| CAHEC tax credits |
(145 | ) | (144 | ) | (122 | ) | ||||||
| Other, net |
92 | (42 | ) | 74 | ||||||||
| Applicable income taxes |
$ | (766 | ) | $ | (357 | ) | $ | 580 | ||||
77
ECB BANCORP, INC. AND SUBSIDIARY
NOTES TO CONSOLIDATED FINANCIAL STATEMENTS—(Continued)
DECEMBER 31, 2010 and 2009
The tax effects of temporary differences that give rise to significant portions of the deferred tax assets and deferred tax liabilities at December 31, 2010 and 2009 are presented below (dollars in thousands):
| 2010 | 2009 | |||||||
| Deferred tax assets: |
||||||||
| Allowance for loan losses |
$ | 5,107 | $ | 3,749 | ||||
| Unrealized loss associated with FNMA and FHLMC preferred stock |
43 | 43 | ||||||
| Postretirement benefits |
282 | 282 | ||||||
| Unrealized losses on available-for-sale investment securities |
1,022 | — | ||||||
| Unfunded postretirement benefits |
12 | 11 | ||||||
| Bank premises and equipment, principally due to differences in depreciation |
75 | 49 | ||||||
| Other |
1,573 | 1,254 | ||||||
| Total gross deferred tax assets |
$ | 8,114 | $ | 5,388 | ||||
| Valuation allowance |
(43 | ) | (43 | ) | ||||
| Total net deferred tax assets |
8,071 | 5,345 | ||||||
| Deferred tax liabilities: |
||||||||
| Bank premises and equipment, principally due to differences in depreciation |
— | — | ||||||
| Unrealized gains on securities available for sale |
— | 669 | ||||||
| Other |
143 | 171 | ||||||
| Total gross deferred tax liabilities |
143 | 840 | ||||||
| Net deferred tax asset |
$ | 7,928 | $ | 4,505 | ||||
The valuation allowance for deferred tax assets was $43 thousand at both December 31, 2010 and December 31, 2009. The valuation allowance required at December 31, 2010 and 2009 was for certain capital losses related to perpetual preferred stock issued by Federal National Mortgage Association and Federal Home Loan Mortgage Corporation. These losses are capital in character and the corporation may not have current capital gain capacity to offset these losses. In order for these capital losses to be realized, the Company would need capital gains to offset them.
During 2010 and 2009, the Company recognized capital gains which decreased the valuation allowance. However the Company does not have plans in place to generate any capital gains in the future. Accordingly, it is more likely than not that these capital losses will fail to be realized and a valuation allowance is required on this portion of the deferred tax asset.
Based on the Company’s historical and current earnings, management believes it is more likely than not the Company will realize the benefits of the deferred tax assets which are not provided for under the valuation allowance.
The Company has analyzed the tax positions taken or expected to be taken in its tax returns and concluded it has no liability related to uncertain tax positions. Years ended December 31, 2007 through December 31, 2009 remain open for audit for all major jurisdictions.
78
ECB BANCORP, INC. AND SUBSIDIARY
NOTES TO CONSOLIDATED FINANCIAL STATEMENTS—(Continued)
DECEMBER 31, 2010 and 2009
7. BORROWED FUNDS
Borrowed funds and the corresponding weighted average rates (WAR) at December 31, 2010 and 2009 are summarized as follows (dollars in thousands):
| 2010 | WAR | 2009 | WAR | |||||||||||||
| Sweep accounts |
$ | 3,509 | 1.00 | % | $ | 2,910 | 1.00 | % | ||||||||
| Advances from FHLB |
8,000 | 2.42 | 20,000 | 0.81 | ||||||||||||
| Total short-term borrowings |
11,509 | 1.98 | 22,910 | 0.84 | ||||||||||||
| Advances from FHLB |
34,500 | 2.34 | 21,000 | 3.22 | ||||||||||||
| Total long-term obligations |
34,500 | 2.34 | 21,000 | 3.22 | ||||||||||||
| Total borrowed funds |
$ | 46,009 | 2.25 | % | $ | 43,910 | 1.98 | % | ||||||||
The average amount of short-term borrowings and the weighted average rates for the years ended December 31, 2010 and 2009 were $15.8 million and 1.52% and $52.3 million and 0.94%, respectively.
The following table details the maturities and rates of our long-term borrowings from the FHLB, as of December 31, 2010.
| Borrow Date |
Type |
Principal | Term |
Rate | Maturity | |||||||||
| (Dollars in thousands) | ||||||||||||||
| February 29, 2008 |
Fixed rate | $ | 5,000 | 4 years | 3.18 | % | February 29, 2012 | |||||||
| March 12, 2008 |
Fixed rate | 2,000 | 4 years | 3.25 | March 12, 2012 | |||||||||
| March 12, 2008 |
Fixed rate | 6,500 | 3 years | 2.89 | March 14, 2011 | |||||||||
| March 12, 2008 |
Fixed rate | 7,500 | 5 years | 3.54 | March 12, 2013 | |||||||||
| August 17, 2010 |
Fixed rate | 3,000 | 4 years | 1.49 | August 18, 2014 | |||||||||
| August 17, 2010 |
Fixed rate | 4,500 | 5 years | 1.85 | August 17, 2015 | |||||||||
| August 17, 2010 |
Fixed rate | 2,500 | 6 years | 2.21 | August 17, 2016 | |||||||||
| August 20, 2010 |
Fixed rate | 2,000 | 3 years | 1.09 | August 20, 2013 | |||||||||
| August 20, 2010 |
Fixed rate | 3,000 | 4 years | 1.48 | August 20, 2014 | |||||||||
| August 20, 2010 |
Fixed rate | 3,000 | 5 years | 1.83 | August 20, 2015 | |||||||||
| August 31, 2010 |
Fixed rate | 1,500 | 1 years | 0.36 | August 31, 2011 | |||||||||
| September 1, 2010 |
Fixed rate | 2,000 | 2 years | 0.66 | September 4, 2012 | |||||||||
Pursuant to a collateral agreement with the FHLB, advances are collateralized by all the Company’s FHLB stock and qualifying first mortgage loans. The eligible residential 1-4 family first mortgage loans as of December 31, 2010, were $30.1 million. This agreement with the FHLB provides for a line of credit up to 20% of the Bank’s assets. In addition, the Bank had $52.2 million of investment securities held as collateral by the FHLB on advances as of December 31, 2010. The maximum month end balances were $42.5 million, $107.0 million and $80.0 million during the years ended December 31, 2010, 2009 and 2008, respectively.
The Company has established various credit facilities to provide additional liquidity if and as needed. These include unsecured lines of credit with correspondent banks totaling $31.0 million.
The Company enters into agreements with customers to transfer excess funds in demand accounts into repurchase agreements. Under the repurchase agreement, the Company sells the customer an interest in government-sponsored enterprise securities. The customer’s interest in the underlying security shall be repurchased by the Company at the opening of the next banking day. The rate paid fluctuates with the weekly average federal funds rate minus 125 basis points and has a floor of 50 basis points. Securities with a fair value of $6.2 million secured customer sweep accounts as of December 31, 2010.
79
ECB BANCORP, INC. AND SUBSIDIARY
NOTES TO CONSOLIDATED FINANCIAL STATEMENTS—(Continued)
DECEMBER 31, 2010 and 2009
8. RETIREMENT PLANS AND OTHER POSTRETIREMENT BENEFITS
The Company has a defined contribution 401(k) plan that covers all eligible employees. The Company matches employee contributions up to certain amounts as defined in the plan. Total expense related to this plan was $451 thousand, $414 thousand and $391 thousand in 2010, 2009 and 2008, respectively. The Company also has a postretirement benefit plan whereby the Company pays postretirement health care benefits for certain of its retirees that have met minimum age and service requirements.
In 2002, the Company adopted a supplemental executive retirement plan to provide benefits for members of management and directors. The liability was calculated by discounting the anticipated future cash flows for the years ended December 31, 2010 and 2009 at 5.50% and 6.25%, respectively. The liability accrued for this obligation was $2.6 million and $2.3 million at December 31, 2010 and 2009, respectively. Charges to income are based on changes in the cash value of insurance, which funds the liability. The related expense for the years ended December 31, 2010, 2009 and 2008 was $343 thousand, $216 thousand and $360 thousand, respectively.
The Company recognizes a liability for the future death benefit provided to certain employees in relation to the postretirement benefit related to split-dollar life insurance arrangements. A liability of $387 thousand was recorded on January 1, 2008 through a cumulative-effect adjustment to retained earnings and an additional $68 thousand was expensed during 2008. During 2010 the Company expensed $80 thousand and during 2009 the Company expensed $18 thousand. The liability amounted to $561 thousand and $473 thousand at December 31, 2010 and 2009, respectively. The calculation of the liability is based on the present value of the post-retirement cost of insurance.
The following tables provide information relating to the Company’s postretirement health care benefit plan using a measurement date of December 31 (dollars in thousands):
| 2010 | 2009 | |||||||
| Reconciliation of benefit obligation: |
||||||||
| Net benefit obligation, January 1 |
$ | 748 | $ | 746 | ||||
| Service cost |
6 | 5 | ||||||
| Interest cost |
39 | 47 | ||||||
| Actuarial (gain) loss |
39 | (17 | ) | |||||
| Benefit paid |
(33 | ) | (33 | ) | ||||
| Net benefit obligation, December 31 |
$ | 799 | $ | 748 | ||||
| Fair value of plan assets |
$ | — | $ | — | ||||
| Funding status and net amount recognized in other liabilities |
$ | 799 | $ | 748 | ||||
Net periodic postretirement benefit cost for 2010, 2009 and 2008 includes the following components (dollars in thousands):
| 2010 | 2009 | 2008 | ||||||||||
| Service cost |
$ | 6 | $ | 5 | $ | 5 | ||||||
| Interest cost |
39 | 47 | 42 | |||||||||
| Amortization of prior year service cost |
(8 | ) | (8 | ) | (7 | ) | ||||||
| Net periodic postretirement benefit cost |
$ | 37 | $ | 44 | $ | 40 | ||||||
80
ECB BANCORP, INC. AND SUBSIDIARY
NOTES TO CONSOLIDATED FINANCIAL STATEMENTS—(Continued)
DECEMBER 31, 2010 and 2009
The following table presents assumptions relating to the plan at December 31, 2010 and 2009:
| 2010 | 2009 | |||||||
| Discount rate in determining benefit obligation |
4.5 | % | 5.3 | % | ||||
| Annual health care cost trend rate |
7.0 | % | 7.0 | % | ||||
| Ultimate medical trend rate |
7.0 | % | 7.0 | % | ||||
| Medical trend rate period (in years) |
4 | 4 | ||||||
| Effect of 1% increase in assumed health care cost on: |
||||||||
| Service and interest cost |
13.6 | % | 13.2 | % | ||||
| Benefit obligation |
12.5 | % | 12.1 | % | ||||
| Effect of 1% decrease in assumed health care cost on: |
||||||||
| Service and interest cost |
(10.6 | )% | (11.0 | )% | ||||
| Benefit obligation |
(10.5 | )% | (10.2 | )% | ||||
9. STOCK OPTION AND RESTRICTED STOCK PLANS
During 2008, the Company adopted the 2008 Omnibus Equity Plan (the Plan) which replaced the expired 1998 Omnibus Stock Ownership and Long-Term Incentive Plan. The Plan provides for the issuance of up to an aggregate of 200,000 shares of common stock of the Company in the form of stock options, restricted stock awards and performance share awards.
Compensation cost charged to income for the years ended December 31, 2010 and 2009 was approximately $36 thousand and $48 thousand respectively, related to stock options. There was no expense related to restricted stock for the year ended December 31, 2010 and $37 thousand charged to income for the year ended December 31, 2009. No income tax benefit was recognized for stock based compensation, as the Company does not have any outstanding nonqualified stock options.
Stock Options
Stock options may be issued as incentive stock options or as nonqualified stock options. The term of the option will be established at the time is it granted but shall not exceed ten years. Vesting will also be established at the time the option is granted. The exercise price may not be less than the fair market value of a share of common stock on the date the option is granted. It is the Company’s policy to issue new shares of stock to satisfy option exercises.
Restricted Stock Awards
Restricted stock awards are subject to restrictions and the risk of forfeiture if conditions stated in the award agreement are not satisfied at the end of a restriction period. During the restriction period, restricted stock covered by the award will be held by the Company. If the conditions stated in the award agreement are satisfied at the end of the restriction period, the restricted stock will become unrestricted and the certificate evidencing the stock will be delivered to the employee.
There were no shares of non-vested restricted stock on December 31, 2010 or December 31, 2009.
81
ECB BANCORP, INC. AND SUBSIDIARY
NOTES TO CONSOLIDATED FINANCIAL STATEMENTS—(Continued)
DECEMBER 31, 2010 and 2009
A summary of the status of stock options as of December 31, 2010, 2009, and 2008, and changes during the years then ended, is presented below:
| 2010 | 2009 | 2008 | ||||||||||||||||||||||
| Number | Weighted Average Option Price |
Number | Weighted Average Option Price |
Number | Weighted Average Option Price |
|||||||||||||||||||
| Options outstanding, beginning of year |
57,335 | $ | 28.31 | 59,227 | $ | 27.79 | 58,251 | $ | 28.22 | |||||||||||||||
| Granted |
— | — | — | — | 6,100 | 24.50 | ||||||||||||||||||
| Exercised |
(1,960 | ) | 10.00 | (1,892 | ) | 11.98 | — | — | ||||||||||||||||
| Expired |
(26,862 | ) | 30.04 | — | — | (5,124 | ) | 28.76 | ||||||||||||||||
| Options outstanding, end of year |
28,513 | $ | 27.94 | 57,335 | $ | 28.31 | 59,227 | $ | 27.79 | |||||||||||||||
The following table summarizes information about the stock options outstanding at December 31, 2010:
| Options Outstanding | Options Exercisable | |||||||||||||||||||
| Exercise Price |
Number Outstanding December 31, 2010 |
Weighted- Average Remaining Contractual Life (Years) |
Number Outstanding December 31, 2010 |
Weighted- Average Exercise Price |
Weighted- Average Remaining Contractual Life (Years) |
|||||||||||||||
| $13.01 – $28.50 |
7,800 | 6.0 | 1,700 | $ | 13.25 | 1.0 | ||||||||||||||
| $28.51 – $29.00 |
13,142 | 4.8 | 10,951 | 28.81 | 4.7 | |||||||||||||||
| $29.01 – $32.60 |
7,571 | 6.2 | 2,498 | 32.60 | 6.2 | |||||||||||||||
| 28,513 | 5.5 | 15,149 | $ | 27.69 | 4.5 | |||||||||||||||
The aggregate intrinsic value of both options outstanding and options exercisable at December 31, 2010 was less than $1 thousand. The aggregate intrinsic value of both options outstanding and options exercisable at December 31, 2009 was $2 thousand. Cash received for options exercised in 2010 was $19 thousand with an intrinsic value of $3 thousand. Cash received for options exercised in 2009 was $23 thousand with an intrinsic value of $10 thousand.
The weighted average fair value of each stock option grant is estimated on the date of grant using the Black-Scholes option-pricing model. The weighted average estimated fair values of stock option grants and the assumptions that were used in calculating such fair values were based on estimates at the date of grant as follows:
| 2010 | 2009 | 2008 | ||||||||||
| Weighted average fair value of options granted during the year |
n/a | n/a | $ | 5.84 | ||||||||
| Assumptions: |
||||||||||||
| Average risk free interest rate |
n/a | n/a | 3.52 | % | ||||||||
| Average expected volatility |
n/a | n/a | 24.37 | % | ||||||||
| Expected dividend rate |
n/a | n/a | 2.40 | % | ||||||||
| Expected life in years |
n/a | n/a | 7.00 | |||||||||
The total fair value of shares that contractually vested during 2010 and 2009 was $60 thousand and $276 thousand, respectively.
82
ECB BANCORP, INC. AND SUBSIDIARY
NOTES TO CONSOLIDATED FINANCIAL STATEMENTS—(Continued)
DECEMBER 31, 2010 and 2009
Anticipated total unrecognized compensation costs related to outstanding non-vested stock options and restricted stock grants will be recognized over the following periods:
| Stock Options |
||||
| (Dollars in thousands) | ||||
| 2011 |
$ | 21 | ||
| 2012 |
8 | |||
| 2013 |
2 | |||
| Total |
$ | 31 | ||
10. DEPOSITS
At December 31, 2010 and 2009, certificates of deposit of $100,000 or more amounted to approximately $92.9 million and $198.4 million, respectively.
Time deposit accounts as of December 31, 2010, mature in the following years and amounts: 2011—$242.3 million; 2012—$68.8 million; 2013—$27.3 million; 2014—$6.6 million and 2015—$43.1 million.
For the years ended December 31, 2010, 2009 and 2008, interest expense on certificates of deposit of $100,000 or more amounted to approximately $2.5 million, $6.8 million and $8.7 million, respectively.
11. LEASES
The Company has noncancellable operating leases for three branch locations. These leases generally contain renewal options for periods ranging from three to twenty years and require the Company to pay all executory costs such as maintenance and insurance. Rental expense for operating leases during 2010, 2009 and 2008 was $579 thousand, $485 thousand and $521 thousand, respectively.
Future minimum lease payments under noncancellable operating leases as of December 31, 2010 are as follows (dollars in thousands):
| Year ending December 31, |
||||
| 2011 |
$ | 536 | ||
| 2012 |
534 | |||
| 2013 |
536 | |||
| 2014 |
332 | |||
| 2015 |
225 | |||
| Thereafter |
734 | |||
| Total minimum lease payments |
$ | 2,897 | ||
12. RESERVE REQUIREMENTS
The aggregate net reserve balances maintained under the requirements of the Federal Reserve were approximately $401 thousand at December 31, 2010.
13. COMMITMENTS AND CONTINGENCIES
The Company has various financial instruments (outstanding commitments) with off-balance sheet risk that are issued in the normal course of business to meet the financing needs of its customers. These financial instruments included commitments to extend credit of $103.4 million and standby letters of credit of $1.9 million.
83
ECB BANCORP, INC. AND SUBSIDIARY
NOTES TO CONSOLIDATED FINANCIAL STATEMENTS—(Continued)
DECEMBER 31, 2010 and 2009
The Company’s exposure to credit loss for commitments to extend credit and standby letters of credit is the contractual amount of those financial instruments. The Company uses the same credit policies for making commitments and issuing standby letters of credit as it does for on-balance sheet financial instruments. Each customer’s creditworthiness is evaluated on an individual case-by-case basis. The amount and type of collateral, if deemed necessary by management, is based upon this evaluation of creditworthiness. Collateral obtained varies, but may include marketable securities, deposits, property, plant and equipment, investment assets, real estate, inventories and accounts receivable. Management does not anticipate any significant losses as a result of these financial instruments and anticipates funding them from normal operations.
The Company is not involved in any legal proceedings which, in management’s opinion, could have a material effect on the consolidated financial position or results of operations of the Company.
14. FAIR VALUE OF FINANCIAL INSTRUMENTS
Fair value estimates are made by management at a specific point in time, based on relevant information about the financial instrument and the market. These estimates do not reflect any premium or discount that could result from offering for sale at one time the Company’s entire holdings of a particular financial instrument nor are potential taxes and other expenses that would be incurred in an actual sale considered. Fair value estimates are based on judgments regarding future expected loss experience, current economic conditions, risk characteristics of various financial instruments, and other factors. These estimates are subjective in nature and involve uncertainties and matters of significant judgment and therefore cannot be determined with precision. Changes in assumptions and/or the methodology used could significantly affect the estimates disclosed. Similarly, the fair values disclosed could vary significantly from amounts realized in actual transactions.
The following table presents the carrying values and estimated fair values of the Company’s financial instruments at December 31, 2010 and 2009 (dollars in thousands):
| 2010 | 2009 | |||||||||||||||
| Carrying Value |
Estimated Fair Value |
Carrying Value |
Estimated Fair Value |
|||||||||||||
| Financial assets: |
||||||||||||||||
| Cash and cash equivalents |
$ | 20,166 | $ | 20,166 | $ | 17,811 | $ | 17,811 | ||||||||
| Investment securities |
273,229 | 273,229 | 239,332 | 239,332 | ||||||||||||
| FHLB stock |
4,571 | 4,571 | 5,116 | 5,116 | ||||||||||||
| Accrued interest receivable |
5,243 | 5,243 | 4,967 | 4,967 | ||||||||||||
| Net loans |
554,384 | 550,614 | 568,066 | 565,178 | ||||||||||||
| Loans held for sale |
4,136 | 4,136 | — | — | ||||||||||||
| Financial liabilities: |
||||||||||||||||
| Deposits |
$ | 785,941 | $ | 790,105 | $ | 754,730 | $ | 759,647 | ||||||||
| Short-term borrowings |
11,509 | 11,509 | 22,910 | 22,910 | ||||||||||||
| Accrued interest payable |
631 | 631 | 1,121 | 1,121 | ||||||||||||
| Long-term obligations |
34,500 | 34,954 | 21,000 | 21,210 | ||||||||||||
The fair value of net loans is based on estimated cash flows using the current rates at which similar loans would be made to borrowers with similar credit ratings and for the same remaining maturities. This does not include consideration of liquidity that market participants would use to value such loans. The estimated fair values of deposits and long-term obligations at December 31 are based on estimated cash flows discounted at market interest rates. The carrying values of other financial instruments, including various receivables and payables, approximate fair value. Refer to note 1(E) for investment securities fair value information. The fair value of off-balance sheet financial instruments is considered immaterial. As discussed in note 13, these off-balance sheet financial instruments are commitments to extend credit and are either short-term in nature or subject to immediate repricing.
84
ECB BANCORP, INC. AND SUBSIDIARY
NOTES TO CONSOLIDATED FINANCIAL STATEMENTS—(Continued)
DECEMBER 31, 2010 and 2009
Fair Value Hierarchy
The Company groups assets and liabilities at fair value in three levels, based on the markets in which the assets and liabilities are traded and the reliability of the assumptions used to determine fair value. These levels are:
| Level 1 | Valuation is based upon quoted prices for identical instruments traded in active markets. | |
| Level 2 | Valuation is based upon quoted prices for similar instruments in active markets, quoted prices for identical or similar instruments in markets that are not active, and model-based valuation techniques for which all significant assumptions are observable in the market. | |
| Level 3 | Valuation is generated from model-based techniques that use at least one significant assumption not observable in the market. These unobservable assumptions reflect estimates of assumptions that market participants would use in pricing the asset or liability. Valuation techniques include use of option pricing models, discounted cash flow models and similar techniques. | |
The Company utilizes fair value measurements to record fair value adjustments to certain assets and liabilities and to determine fair value disclosures. Securities available-for-sale are recorded at fair value on a recurring basis. Additionally, from time to time, the Company may be required to record at fair value other assets on a nonrecurring basis, such as loans held for sale, loans held for investment and certain other assets. These nonrecurring fair value adjustments typically involve application of lower of cost or market accounting or write-downs of individual assets.
There were no changes to the techniques used to measure fair value during the period.
Following is a description of valuation methodologies used for assets recorded at fair value.
Investment Securities Available-for-Sale
Investment securities available-for-sale are recorded at fair value on a recurring basis. Fair value measurement is based upon quoted prices, if available. If quoted prices are not available, fair values are measured using independent pricing models or other model-based valuation techniques such as the present value of future cash flows, adjusted for the security’s credit rating, prepayment assumptions and other factors such as credit loss assumptions. Level 1 securities include those traded on an active exchange, such as the New York Stock Exchange, securities that are traded by dealers or brokers in active over-the-counter markets and money market funds. Level 2 securities include mortgage-backed securities issued by government sponsored entities, municipal bonds and corporate debt securities. Securities classified as Level 3 include asset-backed securities in less liquid markets.
Mortgage Banking Activity
The Company enters into interest rate lock commitments and commitments to sell mortgages. At December 31, 2010, the amount of fair value associated with these interest rate lock commitments was $101 thousand, which is included in other assets. The Company had no interest rate lock commitments at December 31, 2009. Forward loan sale commitments have been deemed insignificant.
Loans
The Company does not record loans at fair value on a recurring basis. However, from time to time, a loan is considered impaired and an allowance for loan losses is established. Loans for which it is probable that payment of interest and principal will not be made in accordance with the contractual terms of the loan agreement are considered impaired. Once a loan is identified as individually impaired, management measures impairment using one of several methods, including collateral value, market price and discounted cash flows. Those impaired loans not requiring an allowance represent loans for which the fair value of the expected repayments or collateral exceed the recorded investments in such loans. At December 31, 2010, the majority of the total impaired loans were evaluated based on the fair value of the
85
ECB BANCORP, INC. AND SUBSIDIARY
NOTES TO CONSOLIDATED FINANCIAL STATEMENTS—(Continued)
DECEMBER 31, 2010 and 2009
collateral. Impaired loans where an allowance is established based on the fair value of collateral require classification in the fair value hierarchy. When the fair value of the collateral is based on an observable market price or a current appraised value, the Company records the impaired loan as nonrecurring Level 2. When an appraised value is not available or management determines the fair value of the collateral is further impaired below the appraised value and there is no observable market price, the Company records the impaired loan as nonrecurring Level 3.
Real Estate and Repossessions Acquired in Settlement of Loans
Foreclosed assets are adjusted to fair value upon transfer of the loans to other real estate owned. Real estate acquired in settlement of loans is recorded initially at estimated fair value of the property less estimated selling costs at the date of foreclosure. The initial recorded value may be subsequently reduced by additional allowances, which are charged to earnings if the estimated fair value of the property less estimated selling costs declines below the initial recorded value. Fair value is based upon independent market prices, appraised values of the collateral or management’s estimation of the value of the collateral. When the fair value of the collateral is based on an observable market price or a current appraised value, the Company records the foreclosed asset as nonrecurring Level 2. When an appraised value is not available or management determines the fair value of the collateral is further impaired below the appraised value and there is no observable market price, the Company records the foreclosed asset as nonrecurring Level 3.
Assets recorded at fair value on a recurring basis
| December 31, 2010 |
Total | Level 1 | Level 2 | Level 3 | ||||||||||||
| (Dollars in thousands) | ||||||||||||||||
| Investment Securities Available-for-Sale |
||||||||||||||||
| Government-sponsored enterprises and FFCB bonds |
$ | 24,781 | $ | — | $ | 24,781 | $ | — | ||||||||
| Obligations of states and political subdivisions |
12,978 | — | 12,978 | — | ||||||||||||
| Mortgage-backed securities |
150,090 | 4,200 | 145,890 | — | ||||||||||||
| SBA-backed securities |
56,853 | 55,422 | 1,431 | — | ||||||||||||
| Corporate bonds |
28,527 | — | 26,811 | 1,716 | ||||||||||||
| Total Securities |
$ | 273,229 | $ | 59,622 | $ | 211,891 | $ | 1,716 | ||||||||
| Interest rate lock commitments |
$ | 101 | $ | — | $ | — | $ | 101 | ||||||||
| Total assets at fair value |
$ | 273,330 | $ | 59,622 | $ | 211,891 | $ | 1,817 | ||||||||
| December 31, 2009 |
Total | Level 1 | Level 2 | Level 3 | ||||||||||||
| (Dollars in thousands) | ||||||||||||||||
| Investment Securities Available-for-Sale |
||||||||||||||||
| Government-sponsored enterprises and FFCB bonds |
$ | 35,843 | $ | 8,626 | $ | 24,737 | $ | 2,480 | ||||||||
| Obligations of states and political subdivisions |
46,022 | 4,506 | 41,516 | — | ||||||||||||
| Mortgage-backed securities |
118,136 | 9,361 | 108,775 | — | ||||||||||||
| SBA backed securities |
32,665 | 26,363 | 6,302 | — | ||||||||||||
| Corporate bonds |
5,860 | — | 3,989 | 1,871 | ||||||||||||
| Equity securities |
806 | 806 | — | — | ||||||||||||
| Total Securities |
$ | 239,332 | $ | 49,662 | $ | 185,319 | $ | 4,351 | ||||||||
| Total assets at fair value |
$ | 239,332 | $ | 49,662 | $ | 185,319 | $ | 4,351 | ||||||||
86
ECB BANCORP, INC. AND SUBSIDIARY
NOTES TO CONSOLIDATED FINANCIAL STATEMENTS—(Continued)
DECEMBER 31, 2010 and 2009
Assets recorded at fair value on a nonrecurring basis
| December 31, 2010 |
Total | Level 1 | Level 2 | Level 3 | ||||||||||||
| (Dollars in thousands) | ||||||||||||||||
| Impaired Loans |
||||||||||||||||
| Real estate—construction and land development |
$ | 11,077 | $ | — | $ | 3,027 | $ | 8,050 | ||||||||
| Real estate—secured by residential properties |
3,834 | — | 3,666 | 168 | ||||||||||||
| Real estate—secured by nonfarm nonresidential properties |
2,550 | — | 2,467 | 83 | ||||||||||||
| Commercial and industrial |
77 | — | — | 77 | ||||||||||||
| Total impaired loans |
$ | 17,538 | $ | — | $ | 9,160 | $ | 8,378 | ||||||||
| Real estate and repossessions acquired in settlement of loans |
||||||||||||||||
| Total real estate and repossessions acquired in settlement of loans |
$ | 4,536 | $ | — | $ | 2,277 | $ | 2,259 | ||||||||
| Total assets at fair value |
$ | 22,074 | $ | — | $ | 11,437 | $ | 10,637 | ||||||||
| December 31, 2009 |
Total | Level 1 | Level 2 | Level 3 | ||||||||||||
| (Dollars in thousands) | ||||||||||||||||
| Impaired Loans |
||||||||||||||||
| Real estate—construction and land development |
$ | 6,882 | $ | — | $ | 5,510 | $ | 1,372 | ||||||||
| Real estate—secured by residential properties |
2,438 | — | 1,778 | 660 | ||||||||||||
| Real estate—secured by nonfarm nonresidential properties |
951 | — | 427 | 524 | ||||||||||||
| Commercial and industrial |
2,304 | — | — | 2,304 | ||||||||||||
| Total impaired loans |
$ | 12,575 | $ | — | $ | 7,715 | $ | 4,860 | ||||||||
| Real estate and repossessions acquired in settlement of loans |
||||||||||||||||
| Real estate and repossessions acquired in settlement of loans |
$ | 5,438 | $ | 606 | $ | 1,657 | $ | 3,175 | ||||||||
| Total assets at fair value |
$ | 18,013 | $ | 606 | $ | 9,372 | $ | 8,035 | ||||||||
As of December 31, 2010 there were $11.6 million of Level 2 investment securities available for sale that were reported as Level 1 as of December 31, 2009. The bonds were transferred from Level 1 to Level 2 during 2010 because the December 31, 2009 pricing was based on the Company’s actual trades for the securities at initial purchase while the December 31, 2010 pricing was through a pricing system. As of December 31, 2009 there was one Level 3 investment security available for sale valued at $2.5 million based on its current book value. Prior to sale during 2010, the investment was transferred to Level 2 given that the valuation was based on a third party market valuation that was based on quoted prices for similar instruments in active markets. The table below presents a reconciliation for all assets and liabilities measured at fair value on a recurring basis using significant unobservable inputs (Level 3) during 2010 and 2009.
| Government- sponsored enterprises and FFCB bonds |
Corporate Bonds |
Available-for Sale Debt Securities |
||||||||||
| (Dollars in thousands) | ||||||||||||
| Balance, December 31, 2009 |
$ | 2,480 | $ | 1,871 | $ | 4,351 | ||||||
| Total gains or losses (realized/unrealized): |
||||||||||||
| Included in earnings |
— | — | — | |||||||||
| Included in other comprehensive income |
— | (155 | ) | (155 | ) | |||||||
| Purchases, issuances, and settlements |
— | — | — | |||||||||
| Transfers in to/out of Level 3 |
(2,480 | ) | — | (2,480 | ) | |||||||
| Balance, December 31, 2010 |
$ | — | $ | 1,716 | $ | 1,716 | ||||||
87
ECB BANCORP, INC. AND SUBSIDIARY
NOTES TO CONSOLIDATED FINANCIAL STATEMENTS—(Continued)
DECEMBER 31, 2010 and 2009
| Government- sponsored enterprises and FFCB bonds |
Obligations of states and political subdivisions |
Mortgage- backed securities |
Corporate Bonds |
Available-for Sale Debt Securities |
||||||||||||||||
| (Dollars in thousands) | ||||||||||||||||||||
| Balance, December 31, 2008 |
$ | — | $ | 698 | $ | 8,374 | $ | 2,000 | $ | 11,072 | ||||||||||
| Total gains or losses (realized/unrealized): |
||||||||||||||||||||
| Included in earnings |
— | — | — | — | — | |||||||||||||||
| Included in other comprehensive income |
— | — | — | (129 | ) | (129 | ) | |||||||||||||
| Purchases, issuances, and settlements |
2,480 | — | — | — | 2,480 | |||||||||||||||
| Transfers in to/out of Level 3 |
— | (698 | ) | (8,374 | ) | — | (9,072 | ) | ||||||||||||
| Balance, December 31, 2009 |
$ | 2,480 | $ | — | $ | — | $ | 1,871 | $ | 4,351 | ||||||||||
15. REGULATORY MATTERS
The Company (on a consolidated basis) and the Bank are subject to various regulatory capital requirements administered by the federal banking agencies. Failure to meet minimum capital requirements can initiate certain mandatory and possibly additional discretionary actions by regulators that, if undertaken, could have a direct material effect on the Company’s and the Bank’s financial statements. Under capital adequacy guidelines and the regulatory framework for prompt corrective action, the Company and the Bank must meet specific capital guidelines that involve quantitative measures of their assets, liabilities, and certain off-balance sheet items as calculated under regulatory accounting practices. The capital amounts and classifications are also subject to qualitative judgments by the regulators about components, risk weightings, and other factors. Prompt corrective action provisions are not applicable to bank holding companies.
Quantitative measures established by regulation to ensure capital adequacy require the Company and the Bank to maintain minimum amounts and ratios (set forth in the table below) of total and Tier I capital (as defined in the regulations) to risk-weighted assets (as defined), and of Tier I capital to average assets (as defined). Management believes, as of December 31, 2010, that the Bank and the Company meet all capital adequacy requirements to which they are subject.
Based on the most recent notification from the FDIC, the Bank is well-capitalized under the regulatory framework for prompt corrective action. To be categorized as well-capitalized, the Bank must maintain minimum total risk-based, Tier I risk-based, and Tier I leverage ratios as set forth in the table below. There are no conditions or events since that notification that management believes have changed the Bank’s category.
The Bank’s actual capital amounts, in thousands, and ratios are presented in the following table:
| Actual | For Capital Adequacy Purposes |
To be Well Capitalized Under Prompt Corrective Action Provisions |
||||||||||||||
| Amount | Ratio | Ratio | Ratio | |||||||||||||
| As of December 31, 2010: |
||||||||||||||||
| Total Capital (to Risk Weighted Assets) |
$ | 88,578 | 13.34 | % | ³ | 8.00 | % | ³ | 10.00 | % | ||||||
| Tier 1 Capital (to Risk Weighted Assets) |
80,217 | 12.08 | ³ | 4.00 | ³ | 6.00 | ||||||||||
| Tier 1 Capital (to Average Assets) |
80,217 | 8.66 | ³ | 4.00 | ³ | 5.00 | ||||||||||
| As of December 31, 2009: |
||||||||||||||||
| Total Capital (to Risk Weighted Assets) |
73,499 | 11.28 | ³ | 8.00 | ³ | 10.00 | ||||||||||
| Tier 1 Capital (to Risk Weighted Assets) |
65,335 | 10.03 | ³ | 4.00 | ³ | 6.00 | ||||||||||
| Tier 1 Capital (to Average Assets) |
65,335 | 7.53 | ³ | 4.00 | ³ | 5.00 | ||||||||||
88
ECB BANCORP, INC. AND SUBSIDIARY
NOTES TO CONSOLIDATED FINANCIAL STATEMENTS—(Continued)
DECEMBER 31, 2010 and 2009
The following table lists Bancorp’s actual capital amounts, in thousands, and ratios:
| Actual | For Capital Adequacy Purposes |
To be Well Capitalized Under Prompt Corrective Action Provisions |
||||||||||||||
| Amount | Ratio | Ratio | Ratio | |||||||||||||
| As of December 31, 2010: |
||||||||||||||||
| Total Capital (to Risk Weighted Assets) |
$ | 88,578 | 13.34 | % | ³ | 8.00 | % | ³ | 10.00 | % | ||||||
| Tier 1 Capital (to Risk Weighted Assets) |
80,217 | 12.08 | ³ | 4.00 | ³ | 6.00 | ||||||||||
| Tier 1 Capital (to Average Assets) |
80,217 | 8.66 | ³ | 3.00 | ³ | 5.00 | ||||||||||
| As of December 31, 2009: |
||||||||||||||||
| Total Capital (to Risk Weighted Assets) |
91,371 | 14.02 | ³ | 8.00 | ³ | 10.00 | ||||||||||
| Tier 1 Capital (to Risk Weighted Assets) |
83,207 | 12.77 | ³ | 4.00 | ³ | 6.00 | ||||||||||
| Tier 1 Capital (to Average Assets) |
83,207 | 9.59 | ³ | 3.00 | ³ | 5.00 | ||||||||||
Dividends
The Company’s dividend payments are typically made from dividends received from the Bank. The Bank, as a North Carolina banking corporation, may pay dividends only out of undivided profits (retained earnings) as determined pursuant to North Carolina General Statutes Section 53-87. However, regulatory authorities may limit payment of dividends by any bank when it is determined that such a limitation is in the public interest and is necessary to ensure financial soundness of the Bank.
16. ECB BANCORP, INC. (PARENT COMPANY)
ECB Bancorp, Inc.’s principal asset is its investment in the Bank, and its principal source of income is dividends from the Bank. The Parent Company condensed balance sheets as of December 31, 2010 and 2009, and the related condensed statements of income and cash flows for the years ended December 31, 2010, 2009, and 2008 are as follows:
CONDENSED BALANCE SHEETS (dollars in thousands)
| 2010 | 2009 | |||||||
| Assets |
||||||||
| Cash |
$ | — | $ | 17,872 | ||||
| Receivable from subsidiary |
199 | 520 | ||||||
| Investment in subsidiary |
80,894 | 66,503 | ||||||
| Total assets |
$ | 81,093 | $ | 84,895 | ||||
| Liabilities and Shareholders’ Equity |
||||||||
| Dividends payable |
$ | 199 | $ | 520 | ||||
| Total liabilities |
199 | 520 | ||||||
| Total shareholders’ equity |
80,894 | 84,375 | ||||||
| Total liabilities and shareholders’ equity |
$ | 81,093 | $ | 84,895 | ||||
89
ECB BANCORP, INC. AND SUBSIDIARY
NOTES TO CONSOLIDATED FINANCIAL STATEMENTS—(Continued)
DECEMBER 31, 2010 and 2009
CONDENSED STATEMENTS OF INCOME (dollars in thousands)
| 2010 | 2009 | 2008 | ||||||||||
| Dividends from bank subsidiary |
$ | 1,695 | $ | 2,823 | $ | 3,864 | ||||||
| Equity in undistributed income (losses) of subsidiary |
(835 | ) | (1,321 | ) | (445 | ) | ||||||
| Net income |
$ | 860 | $ | 1,502 | $ | 3,419 | ||||||
CONDENSED STATEMENTS OF CASH FLOWS (dollars in thousands)
| 2010 | 2009 | 2008 | ||||||||||
| OPERATING ACTIVITIES: |
||||||||||||
| Net income |
$ | 860 | $ | 1,502 | $ | 3,419 | ||||||
| Undistributed (income) losses of subsidiary |
835 | 1,321 | 445 | |||||||||
| Net change in other assets & other liabilities |
321 | (1 | ) | (8 | ) | |||||||
| Stock based compensation |
36 | 85 | 212 | |||||||||
| Net cash provided by operating activities |
2,052 | 2,907 | 4,068 | |||||||||
| INVESTING ACTIVITIES: |
||||||||||||
| Payment for investments in subsidiary |
(17,927 | ) | (85 | ) | (10,793 | ) | ||||||
| Net cash used by investing activities |
(17,927 | ) | (85 | ) | (10,793 | ) | ||||||
| FINANCING ACTIVITIES: |
||||||||||||
| Repurchase of common stock |
— | — | (1,759 | ) | ||||||||
| Proceeds from issuance of common stock |
19 | 23 | — | |||||||||
| Proceeds from issuance of preferred stock |
— | 17,850 | — | |||||||||
| Cash dividends paid |
(2,016 | ) | (2,823 | ) | (2,096 | ) | ||||||
| Net cash provided (used) in financing activities |
(1,997 | ) | 15,050 | (3,855 | ) | |||||||
| Net change in cash |
$ | (17,872 | ) | $ | 17,872 | $ | (10,580 | ) | ||||
17. RELATED PARTY TRANSACTIONS
Bancorp and the Bank have had, and expect to have in the future, banking transactions in the ordinary course of business with directors, officers and their associates (“Related Parties”) on substantially the same terms, including interest rates and collateral, as those prevailing at the time for comparable transactions with others. Those transactions neither involve more than normal risk of collectability nor present any unfavorable features.
Loans at December 31, 2010 and 2009 include loans to officers and directors and their associates totaling approximately $4.2 million and $4.4 million, respectively. During 2010, $0.2 million in loans were disbursed to officers, directors and their associates and principal repayments of $0.4 million were received on such loans.
18. U.S. TREASURY’S TROUBLED ASSET RELIEF PROGRAM (TARP) CAPITAL PURCHASE PROGRAM
On January 16, 2009, the Company entered into an agreement with the United States Department of the Treasury (“Treasury”). The Company issued and sold to the Treasury 17,949 shares of the Company’s fixed rate cumulative preferred stock, series A. The preferred stock calls for cumulative dividends at a rate of 5% per year for the first five years, and at a rate of 9% per year in following years. The Company also issued warrants to purchase 144,984 shares of the Company’s common stock. The Company received $17,949,000 in cash. This resulted in restrictions on our ability to pay dividends on our common stock and to repurchase shares of our common stock. Unless all accrued dividends on the Series A Preferred Stock have been paid in full, (1) no dividends may be declared or paid on our common stock, and (2) we may
90
ECB BANCORP, INC. AND SUBSIDIARY
NOTES TO CONSOLIDATED FINANCIAL STATEMENTS—(Continued)
DECEMBER 31, 2010 and 2009
not repurchase any of our outstanding common stock. Additionally, until January 16, 2012, we are required to obtain the consent of the U.S. Treasury in order to declare or pay any dividend or make any distribution on our common stock other than regular quarterly cash dividends of not more than $0.1825 per share, or, subject to certain exceptions, repurchase outstanding shares of our common stock, unless we have redeemed all of the Series A Preferred Stock or the U.S. Treasury has transferred all of those shares to third parties.
91
Item 9. Changes in and Disagreements with Accountants on Accounting and Financial Disclosure
Not applicable.
Item 9A. Controls and Procedures
Our management, with the participation of our Chief Executive Officer and Chief Financial Officer, has evaluated the effectiveness of the design and operation of our disclosure controls and procedures in accordance with Rule 13a-15 of the Securities Exchange Act of 1934 (the “Exchange Act”). Based on their evaluation, our Chief Executive Officer and Chief Financial Officer concluded that, as of the end of the period covered by this report, our disclosure controls and procedures were effective to provide reasonable assurance that we are able to record, process, summarize and report in a timely manner the information required to be disclosed in reports we file under the Exchange Act.
Management’s Annual Report on Internal Control Over Financial Reporting, and a report of our independent registered public accounting firm regarding our internal control over financial reporting, appears on the following pages of this report.
In connection with the above evaluation of our disclosure controls and procedures no change in our internal control over financial reporting was identified that occurred during our fourth quarter of 2010 that has materially affected, or is reasonably likely to materially affect, our internal control over financial reporting.
92
MANAGEMENT’S ANNUAL REPORT ON INTERNAL CONTROL OVER FINANCIAL REPORTING
The management of ECB Bancorp, Inc. (ECB) is responsible for establishing and maintaining adequate internal control over financial reporting. ECBs’ internal control system was designed to provide reasonable assurance to the Company’s management and board of directors regarding the preparation and fair presentation of published financial statements.
All internal control systems, no matter how well designed, have inherent limitations. Therefore, even those systems determined to be effective can provide only reasonable assurance with respect to financial statement preparation and presentation.
ECB’s management assessed the effectiveness of the Company’s internal control over financial reporting as of December 31, 2010. In making this assessment, it used the criteria set forth by the Committee of Sponsoring Organizations of the Treadway Commission (COSO) in Internal Control—Integrated Framework. Based on that assessment, we believe that, as of December 31, 2010, the Company’s internal control over financial reporting is effective based on those criteria.
ECB’s independent auditors have issued an audit report on the Company’s internal control over financial reporting. This report appears on the following page.
| /S/ A. DWIGHT UTZ |
/S/ THOMAS M. CROWDER | |||
| A. Dwight Utz | Thomas M. Crowder | |||
| Chief Executive Officer | Chief Financial Officer |
93
REPORT OF INDEPENDENT REGISTERED PUBLIC ACCOUNTING FIRM
To the Board of Directors and Stockholders
ECB Bancorp, Inc. and Subsidiary
We have audited ECB Bancorp, Inc. and Subsidiary’s (the “Company”) internal control over financial reporting as of December 31, 2010, based on criteria established in Internal Control—Integrated Framework issued by the Committee of Sponsoring Organizations of the Treadway Commission. The Company’s management is responsible for maintaining effective internal control over financial reporting and for its assessment of the effectiveness of internal control over financial reporting, included in the accompanying Management’s Annual Report on Internal Control Over Financial Reporting. Our responsibility is to express an opinion on the Company’s internal control over financial reporting based on our audit.
We conducted our audit in accordance with the standards of the Public Company Accounting Oversight Board (United States). Those standards require that we plan and perform the audit to obtain reasonable assurance about whether effective internal control over financial reporting was maintained in all material respects. Our audit included obtaining an understanding of internal control over financial reporting, assessing the risk that a material weakness exists, and testing and evaluating the design and operating effectiveness of internal control based on the assessed risk. Our audit also included performing such other procedures as we considered necessary in the circumstances. We believe that our audit provides a reasonable basis for our opinion.
A company’s internal control over financial reporting is a process designed to provide reasonable assurance regarding the reliability of financial reporting and the preparation of financial statements for external purposes in accordance with generally accepted accounting principles. A company’s internal control over financial reporting includes those policies and procedures that (1) pertain to the maintenance of records that, in reasonable detail, accurately and fairly reflect the transactions and dispositions of the assets of the company; (2) provide reasonable assurance that transactions are recorded as necessary to permit preparation of financial statements in accordance with generally accepted accounting principles, and that receipts and expenditures of the company are being made only in accordance with authorizations of management and directors of the company; and (3) provide reasonable assurance regarding prevention or timely detection of unauthorized acquisition, use, or disposition of the company’s assets that could have a material effect on the financial statements.
Because of its inherent limitations, internal control over financial reporting may not prevent or detect misstatements. Also, projections of any evaluation of effectiveness to future periods are subject to the risk that controls may become inadequate because of changes in conditions, or that the degree of compliance with the policies or procedures may deteriorate.
In our opinion, ECB Bancorp, Inc. and Subsidiary maintained, in all material respects, effective internal control over financial reporting as of December 31, 2010, based on criteria established in Internal Control—Integrated Framework issued by the Committee of Sponsoring Organizations of the Treadway Commission.
We also have audited, in accordance with the standards of the Public Company Accounting Oversight Board (United States), the consolidated financial statements of ECB Bancorp, Inc. and Subsidiary as of and for the year ended December 31, 2010, and our report dated March 15, 2011, expressed an unqualified opinion on those consolidated financial statements.
Greenville, North Carolina
March 15, 2011
94
Item 9B. Other Information
None.
PART III
Item 10. Directors, Executive Officers and Corporate Governance
Directors and Executive Officers. Information regarding our directors and executive officers is incorporated by reference from the information under the headings “Proposal 1: Election of Directors” and “Executive Officers“ in our definitive Proxy Statement to be filed with the Securities and Exchange Commission in connection with our 2011 Annual Meeting.
Audit Committee. Information regarding our Audit Committee is incorporated by reference from the information under the captions “Committees of Our Board—General” and “—Audit Committee” in our definitive Proxy Statement to be filed with the Securities and Exchange Commission in connection with our 2011 Annual Meeting.
Audit Committee Financial Expert. Rules of the Securities and Exchange Commission (the “SEC”) require that we disclose whether our Board of Directors has determined that our Audit Committee includes a member who qualifies as an “audit committee financial expert” as that term is defined in the SEC’s rules. To qualify as an audit committee financial expert under the SEC’s rules, a person must have a relatively high level of accounting and financial knowledge or expertise which he or she has acquired through specialized education or training or through experience in certain types of positions.
We currently do not have an independent director who our Board believes can be considered an audit committee financial expert and, for that reason, there is no such person who the Board can appoint to our Audit Committee. In the future, financial expertise and experience will be one of many factors that our Board considers in selecting candidates to become directors. However, our current Audit Committee members have a level of financial knowledge and experience that we believe is sufficient for banks our size that, like us, do not engage in a wide variety of business activities, and, for that reason, the ability to qualify as an audit committee financial expert will not be the primary criteria in our Board’s selection of candidates to become new directors.
Section 16(a) Beneficial Ownership Reporting Compliance Information regarding compliance by our directors, executive officers and principal shareholders with the reporting requirements of Section 16(a) of the Securities Exchange Act of 1934 is incorporated by reference from the information under the caption “Beneficial Ownership of Our Common Stock—Section 16(a) Beneficial Ownership Reporting Compliance” in our definitive Proxy Statement to be filed with the Securities and Exchange Commission in connection with our 2011 Annual Meeting.
Code of Ethics. Information regarding our Code of Ethics that applies to our directors and to all our executive officers, including without limitation our principal executive officer and principal financial officer, is incorporated by reference from the information under the caption “Corporate Governance—Code of Ethics” in our definitive Proxy Statement to be filed with the Securities and Exchange Commission in connection with our 2011 Annual Meeting.
Item 11. Executive Compensation
Information regarding compensation paid to our executive officers and directors is incorporated by reference from the information under the headings “Executive Compensation” and “Director Compensation” in our definitive Proxy Statement to be filed with the Securities and Exchange Commission in connection with our 2011 Annual Meeting.
95
Item 12. Security Ownership of Certain Beneficial Owners and Management and Related Stockholder Matters
Beneficial Ownership of Securities. Information regarding the beneficial ownership of our common stock by our directors, executive officers and principal shareholders is incorporated by reference from the information under the heading “Beneficial Ownership of Our Common Stock” in our definitive Proxy Statement to be filed with the Securities and Exchange Commission in connection with our 2011 Annual Meeting.
Securities Authorized for Issuance Under Equity Compensation Plans. The following table summarizes all compensation arrangements which were in effect on December 31, 2010, and under which shares of our common stock have been authorized for issuance.
| EQUITY COMPENSATION PLAN INFORMATION(1) | ||||||||||||
| Plan category |
(a) Number of Shares to be Issued Upon Exercise of Outstanding Options |
(b) Weighted-average Exercise Price of Outstanding Options |
(c) Number of Shares Remaining Available for Future Issuance Under Equity Compensation Plans (Excluding Shares Reflected In Column (a)) |
|||||||||
| Equity compensation plans approved by our security holders |
28,513 | (1) | $ | 27.94 | 189,900 | (2) | ||||||
| Equity compensation plans not approved by our security holders |
-0- | N/A | -0- | |||||||||
| Total |
28,513 | $ | 27.94 | 189,900 | ||||||||
| (1) | Reflects the number of shares that are subject to outstanding, unexercised options previously granted under both our Omnibus Stock Ownership and Long-Term Incentive Plan (which expired during January 2008), and our 2008 Omnibus Equity Plan (which was approved by our shareholders at our 2008 Annual Meeting). |
| (2) | Reflects the number of shares that remained available for future issuance under the 2008 Omnibus Equity Plan on December 31, 2010. The Omnibus Stock Ownership and Long-Term Incentive Plan expired by its terms during January 2008 and no further awards may be granted under it. |
Item 13. Certain Relationships and Related Transactions, and Director Independence
Related Person Transactions. Information regarding transactions between us and our directors, executive officers and other related persons, and our policies and procedures for reviewing and approving related person transactions, is incorporated by reference from the information under the caption “Transactions with Related Persons” in our definitive Proxy Statement to be filed with the Securities and Exchange Commission in connection with our 2011 Annual Meeting.
Director Independence. Information regarding our independent directors is incorporated by reference from the information under the caption “Corporate Governance—Director Independence” in our definitive Proxy Statement to be filed with the Securities and Exchange Commission in connection with our 2011 Annual Meeting.
Item 14. Principal Accounting Fees and Services
Information regarding services provided to us by our independent accountants is incorporated by reference from the information under the caption “Services and Fees During 2010 and 2009” in our definitive Proxy Statement to be filed with the Securities and Exchange Commission in connection with our 2011 Annual Meeting.
96
PART IV
Item 15. Exhibits and Financial Statement Schedules
(a) Financial Statements. The following financial statements are included in Item 8 of this Report:
Report of Dixon Hughes PLLC
Consolidated Balance Sheets as of December 31, 2010 and 2009
Consolidated Statements of Income (Loss) for the years ended December 31, 2010, 2009 and 2008
Consolidated Statements of Shareholders’ Equity for the years ended December 31, 2010, 2009 and 2008
Consolidated Statements of Cash Flows for the years ended December 31, 2010, 2009 and 2008
Notes to Consolidated Financial Statements—December 31, 2010 and 2009
(b) Exhibits. An Exhibit Index listing exhibits that are being filed or furnished with, or incorporated by reference into, this Report appears immediately following the signature page and is incorporated herein by reference.
(c) Financial Statement Schedules. No separate financial statement schedules are being filed as all required schedules either are not applicable or are contained in the financial statements listed above or in Item 7 of this Report.
97
SIGNATURES
Pursuant to the requirements of Section 13 or 15(d) of the Securities Exchange Act of 1934, the Registrant has caused this Report to be signed on its behalf by the undersigned, thereunto duly authorized.
| Date: March 15, 2011 |
ECB BANCORP, INC. | |||
| By: | /S/ A. DWIGHT UTZ | |||
| A. Dwight Utz | ||||
| President and Chief Executive Officer | ||||
Pursuant to the requirements of the Securities Exchange Act of 1934, this Report has been signed below by the following persons on behalf of the Registrant and in the capacities and on the dates indicated.
| Signature |
Title |
Date | ||
| /S/ A. DWIGHT UTZ A. Dwight Utz |
President and Chief Executive Officer (principal executive officer) |
March 15, 2011 | ||
| /S/ THOMAS M. CROWDER Thomas M. Crowder |
Executive Vice President and Chief Financial Officer (principle financial and accounting officer) |
March 15, 2011 | ||
| /S/ GEORGE T. DAVIS George T. Davis, Jr. |
Vice Chairman |
March 15, 2011 | ||
| /S/ GREGORY C. GIBBS Gregory C. Gibbs |
Director |
March 15, 2011 | ||
| /S/ JOHN F. HUGHES, JR. John F. Hughes, Jr. |
Director |
March 15, 2011 | ||
| /S/ J. BRYANT KITTRELL III J. Bryant Kittrell III |
Director |
March 15, 2011 | ||
| /S/ JOSEPH T. LAMB, JR. Joseph T. Lamb, Jr. |
Director |
March 15, 2011 | ||
| /S/ B. MARTELLE MARSHALL B. Martelle Marshall |
Director |
March 15, 2011 | ||
| /S/ R. S. SPENCER, JR. R. S. Spencer, Jr. |
Chairman |
March 15, 2011 | ||
| /S/ MICHAEL D. WEEKS Michael D. Weeks |
Director |
March 15, 2011 | ||
98
EXHIBIT INDEX
| Exhibit No. |
Description of Exhibit | |||
| 3.01 | Registrant’s Articles of Incorporation, as amended (incorporated by reference from Exhibits to Registrant’s Current Report on Form 8-K dated January 15, 2009) | |||
| 3.02 | Registrant’s Bylaws (incorporated by reference from Exhibits to Registration Statement on Form SB-2, Reg. No. 333-61839) | |||
| 4.01 | Specimen common stock certificate (incorporated by reference from Exhibits to Registration Statement on Form S-1, Reg. No. 333-128843) | |||
| 4.02 | Specimen Series A Preferred Stock certificate (incorporated by reference from Exhibits to Registrant’s Current Report on Form 8-K dated January 15, 2009) | |||
| 4.03 | Warrant dated January 16, 2009, for the purchase of shares of Common Stock (incorporated by reference from Exhibits to Registrant’s Current Report on Form 8-K dated January 15, 2009) | |||
| 10.01 | Letter Agreement dated January 16, 2009, between the Registrant and the United States Department of the Treasury (incorporated by reference from Exhibits to Registrant’s Current Report on Form 8-K dated January 15, 2009) | |||
| 10.02 | Employment Agreement between A. Dwight Utz, the Bank and the Registrant (incorporated by reference from Exhibits to Registrant’s Current Report on Form 8-K dated August 26, 2009) | |||
| 10.03 | Capital Purchase Program Compliance Agreement between Arthur H. Keeney III and the Bank (incorporated by reference from Exhibits to Registrant’s Current Report on Form 8-K dated January 15, 2009) | |||
| 10.04 | Amended and Restated Agreement between J. Dorson White, Jr. and the Bank (incorporated by reference from Exhibits to Registrant’s Current Report on Form 8-K dated December 23, 2008) | |||
| 10.05 | Capital Purchase Program Compliance Agreement between J. Dorson White, Jr. and the Bank (incorporated by reference from Exhibits to Registrant’s Current Report on Form 8-K dated January 15, 2009) | |||
| 10.06 | Amended and Restated Agreement between T. Olin Davis and the Bank (incorporated by reference from Exhibits to Registrant’s Current Report on Form 8-K dated December 23, 2008) | |||
| 10.07 | Capital Purchase Program Compliance Agreement between T. Olin Davis and the Bank (incorporated by reference from Exhibits to Registrant’s Current Report on Form 8-K dated January 15, 2009) | |||
| 10.08 | Severance and Change in Control Agreement, as amended, between James J. Burson and the Bank (filed herewith) | |||
| 10.09 | Severance and Change in Control Agreement between Thomas M. Crowder and the Bank (incorporated by reference from Exhibits to Registrant’s Current Report on Form 8-K dated March 28, 2010) | |||
| 10.10 | Omnibus Stock Ownership and Long Term Incentive Plan (incorporated by reference from Exhibits to Registration Statement on Form SB-2, Reg. No. 333-61839) | |||
| 10.11 | 2008 Omnibus Equity Plan (incorporated by reference from Exhibits to Registrant’s Current Report on Form 8-K dated April 16, 2008) | |||
| 10.12 | Form of Employee Stock Option Agreement (incorporated by reference from Exhibits to Registration Statement on Form SB-2, Reg. No. 333-61839) | |||
| 10.13 | Form of Restricted Stock Agreement (incorporated by reference from Exhibits to Registration Statement on Form S-8, Reg. No. 333-77689) | |||
| 10.14 | Restricted Stock Award Agreement between A. Dwight Utz and the Registrant (incorporated by reference from Exhibits to Registrant’s September 30, 2009, Quarterly Report on Form 10-Q) | |||
| 10.15 | Executive Supplemental Retirement Plan Agreement between the Bank and Arthur H. Keeney III (incorporated by reference from Exhibits to Registrant’s March 31, 2002, Quarterly Report on Form 10-QSB) | |||
99
| Exhibit No. |
Description of Exhibit | |||
| 10.16 | Amendment to Executive Supplemental Retirement Plan Agreement between the Bank and Arthur H. Keeney III (incorporated by reference from Exhibits to Registrant’s 2008 Annual Report on Form 10-K) | |||
| 10.17 | Executive Supplemental Retirement Plan Agreement between the Bank and J. Dorson White, Jr. (incorporated by reference from Exhibits to Registrant’s March 31, 2002, Quarterly Report on Form 10-QSB) | |||
| 10.18 | Amendment to Executive Supplemental Retirement Plan Agreement between the Bank and J. Dorson White, Jr. (incorporated by reference from Exhibits to Registrant’s 2008 Annual Report on Form 10-K) | |||
| 10.19 | Executive Supplemental Retirement Plan Agreement between the Bank and T. Olin Davis (incorporated by reference from Exhibits to Registrant’s 2007 Annual Report on for 10-KSB) | |||
| 10.20 | Amendment to Executive Supplemental Retirement Plan Agreement between the Bank and T. Olin Davis (incorporated by reference from Exhibits to Registrant’s 2008 Annual Report on Form 10-K) | |||
| 10.21 | Split-Dollar Life Insurance Agreement between the Bank and Arthur H. Keeney III (incorporated by reference from Exhibits to Registrant’s March 31, 2002, Quarterly Report on Form 10-QSB) | |||
| 10.22 | Split-Dollar Life Insurance Agreement between the Bank and J. Dorson White, Jr. (incorporated by reference from Exhibits to Registrant’s March 31, 2002, Quarterly Report on Form 10-QSB) | |||
| 10.23 | Split-Dollar Life Insurance Agreement between the Bank and T. Olin Davis (incorporated by reference from Exhibits to Registrant’s 2007 Annual Report on for 10-KSB) | |||
| 10.24 | Form of Director Supplemental Retirement Plan Agreements between the Bank and George T. Davis, Jr., John F. Hughes, Jr., Arthur H. Keeney III, Joseph T. Lamb, Jr., and R. S. Spencer, Jr. (incorporated by reference from Exhibits to Registrant’s March 31, 2002, Quarterly Report on Form 10-QSB) | |||
| 10.25 | Form of Amendment to Director Supplemental Retirement Plan Agreements between the Bank and George T. Davis, Jr., John F. Hughes, Jr., Arthur H. Keeney III, Joseph T. Lamb, Jr., and R. S. Spencer, Jr. (incorporated by reference from Exhibits to Registrant’s 2008 Annual Report on Form 10-K) | |||
| 10.26 | Form of Director Supplemental Retirement Plan Agreements between the Bank and Gregory C. Gibbs, J. Bryant Kittrell III, and B. Martelle Marshall (incorporated by reference from Exhibits to Registrant’s March 31, 2002, Quarterly Report on Form 10-QSB) | |||
| 10.27 | Form of Amendment to Director Supplemental Retirement Plan Agreements between the Bank and Gregory C. Gibbs, J. Bryant Kittrell III, and B. Martelle Marshall (incorporated by reference from Exhibits to Registrant’s 2008 Annual Report on Form 10-K) | |||
| 10.29 | Form of Director Supplemental Retirement Plan Agreement between the Bank and Michael D. Weeks (incorporated by reference from Exhibits to Registrant’s 2008 Annual Report on Form 10-K) | |||
| 10.29 | Form of Amendment to Director Supplemental Retirement Plan Agreement between the Bank and Michael D. Weeks (incorporated by reference from Exhibits to Registrant’s 2008 Annual Report on Form 10-K) | |||
| 10.30 | Form of Split-Dollar Life Insurance Agreements between the Bank and George T. Davis, Jr., Gregory C. Gibbs, John F. Hughes, Jr., Arthur H. Keeney III, J. Bryant Kittrell III, Joseph T. Lamb, Jr., B. Martelle Marshall, and R. S. Spencer, Jr. (incorporated by reference from Exhibits to Registrant’s March 31, 2002, Quarterly Report on Form 10-QSB) | |||
| 10.31 | The East Carolina Bank Incentive Plan (incorporated by reference from Exhibits to Registrant’s 2004 Annual Report on Form 10-KSB) | |||
| 21.01 | List of Registrant’s subsidiaries (incorporated by reference from Exhibits to Registrant’s 2004 Annual Report on Form 10-KSB) | |||
| 23.01 | Consent of Dixon Hughes PLLC (filed herewith) | |||
| 31.01 | Certification of Chief Executive Officer (pursuant to Rule 13a-14) (filed herewith) | |||
| 31.02 | Certification of Chief Financial Officer (pursuant to Rule 13a-14) (filed herewith) | |||
100
| Exhibit No. |
Description of Exhibit | |||
| 32.01 | Certification of Chief Executive Officer and Chief Financial Officer (pursuant to 18 U.S.C. Section 1350) (filed herewith) | |||
| 99.01 | Certification of Chief Executive Officer and Chief Financial Officer (pursuant to Section III of EESA) (filed herewith) | |||
COPIES OF EXHIBITS ARE AVAILABLE UPON WRITTEN REQUEST TO THOMAS M. CROWDER,
CHIEF FINANCIAL OFFICER, AT ECB BANCORP, INC., P.O. BOX 337, ENGELHARD,
NORTH CAROLINA 27824.
101