Attached files
| file | filename |
|---|---|
| EX-31.1 - EX-31.1 - Danvers Bancorp, Inc. | a2202562zex-31_1.htm |
| EX-10.7 - EX-10.7 - Danvers Bancorp, Inc. | a2202562zex-10_7.htm |
| EX-31.3 - EX-31.3 - Danvers Bancorp, Inc. | a2202562zex-31_3.htm |
| EX-23.1 - EX-23.1 - Danvers Bancorp, Inc. | a2202562zex-23_1.htm |
| EX-10.9 - EX-10.9 - Danvers Bancorp, Inc. | a2202562zex-10_9.htm |
| EX-10.4 - EX-10.4 - Danvers Bancorp, Inc. | a2202562zex-10_4.htm |
| EX-31.2 - EX-31.2 - Danvers Bancorp, Inc. | a2202562zex-31_2.htm |
| EX-32.1 - EX-32.1 - Danvers Bancorp, Inc. | a2202562zex-32_1.htm |
| EX-32.2 - EX-32.2 - Danvers Bancorp, Inc. | a2202562zex-32_2.htm |
| EX-32.3 - EX-32.3 - Danvers Bancorp, Inc. | a2202562zex-32_3.htm |
| EX-21.1 - EX-21.1 - Danvers Bancorp, Inc. | a2202562zex-21_1.htm |
| EX-10.13 - EX-10.13 - Danvers Bancorp, Inc. | a2202562zex-10_13.htm |
| EX-10.26 - EX-10.26 - Danvers Bancorp, Inc. | a2202562zex-10_26.htm |
| EX-10.11 - EX-10.11 - Danvers Bancorp, Inc. | a2202562zex-10_11.htm |
| EX-10.15 - EX10.15 - Danvers Bancorp, Inc. | a2202562zex-10_15.htm |
Use these links to rapidly review the document
TABLE OF CONTENTS
TABLE OF CONTENTS
UNITED STATES
SECURITIES AND EXCHANGE COMMISSION
WASHINGTON, D.C. 20549
FORM 10-K
| ANNUAL REPORT PURSUANT TO SECTION 13 OR 15(d) OF THE SECURITIES EXCHANGE ACT OF 1934 | ||
For the fiscal year ended December 31, 2010 |
||
Commission file number: 001-33896 |
||
DANVERS BANCORP, INC.
(Exact Name of Registrant as Specified in Its Charter)
| Delaware | 04-3445675 | |
| (State or Other Jurisdiction of Incorporation of Organization) |
(I.R.S. Employer Identification No.) |
|
One Conant Street, Danvers, Massachusetts |
01923 |
|
| (Address of Principal Executive Officers) | (Zip Code) |
(978) 777-2200
(Registrant's telephone number, including area code)
Securities registered pursuant to Section 12(b) of the Act:
| Title of each class | Name of each exchange on which registered | |
|---|---|---|
| Common Stock, $0.01 par value | The NASDAQ Stock Market LLC |
Securities registered pursuant to Section 12(g) of the Act: None
Indicate by check mark if the registrant is a well-known seasoned issuer, as defined in Rule 405 of the Securities Act. Yes o No ý
Indicate by check mark if the registrant is not required to file reports pursuant to Section 13 or Section 15(d) of the Act. Yes o No ý
Indicate by check mark whether the registrant (1) has filed all reports required to be filed by Section 13 or 15(d) of the Securities Exchange Act of 1934 during the preceding 12 months (or for such shorter period that the registrant was required to file such reports), and (2) has been subject to such filing requirements for the past 90 days. Yes ý No o
Indicate by check mark whether the registrant has submitted electronically and posted on its corporate Web site, if any, every Interactive Data File required to be submitted and posted pursuant to Rule 405 of Regulation S-T (§232.405 of this chapter) during the preceding 12 months (or for such shorter period that the registrant was required to submit and post such files). Yes o No o
Indicate by check mark if disclosure of delinquent filers pursuant to Item 405 of Regulation S-K (§232.405) is not contained herein, and will not be contained, to the best of registrant's knowledge, in definitive proxy or information statements incorporated by reference in Part III of this Form 10-K or any amendment to this Form 10-K. o
Indicate by check mark whether the registrant is a large accelerated filer, an accelerated filer, a non-accelerated filer, or a smaller reporting company. See the definitions of "large accelerated filer," "accelerated filer" and "smaller reporting company" in Rule 12b-2 of the Exchange act. (Check one):
| Large accelerated filer o | Accelerated filer ý | Non-accelerated filer o (Do not check if smaller reporting company) |
Smaller reporting company o |
Indicate by check mark whether the registrant is a shell company (as defined in Rule 12b-2 of the Act). Yes o No ý
The aggregate market value of the voting and non-voting common equity held by non-affiliates as of June 30, 2010 was $275,104,186.
Shares outstanding of the registrant's common stock, $0.01 par value, at February 28, 2011: 20,686,592
DOCUMENTS INCORPORATED BY REFERENCE
None.
2
This report may contain statements that may be considered forward-looking statements within the meaning of the Private Securities Litigation Reform Act of 1995, Section 27A of the Securities Act of 1933, as amended (the "Securities Act") and Section 21E of the Securities Exchange Act of 1934, as amended (the "Exchange Act"). Forward-looking statements may be identified by the use of such words as "estimate," "project," "believe," "intend," "anticipate," "plan," "seek," "expect" and similar expressions. These forward-looking statements include, but are not limited to, the following:
- •
- statements of our goals, intentions and expectations;
- •
- statements regarding our business plans and prospects and growth and operating strategies;
- •
- statements regarding the asset quality of our loan and investment portfolios; and
- •
- estimates of our risks and future costs and benefits.
Actual results, performance or achievements could differ materially from those contemplated, expressed or implied by the forward-looking statements contained or incorporated by reference in this document. Important factors that could cause actual results to differ materially from our forward-looking statements are set forth in Part II, Item 7, "Management's Discussion and Analysis of Financial Condition and Results of Operations" and Item 1A, "Risk Factors." Forward-looking statements are based on the current assumptions and beliefs of management and are only expectations of future results. Our actual results could differ materially from those projected in the forward-looking statements as a result of the following factors:
- •
- significantly increased competition among depository and other financial institutions;
- •
- inflation and changes in the interest rate environment that reduce our margins or reduce the fair value of financial
instruments;
- •
- general economic conditions, whether national or regional, and conditions in the real estate markets that could affect the
demand for our loans and other products and ability of borrowers to repay loans, lead to further declines in credit quality and increased loan losses, and continue to negatively affect the value and
salability of the real estate that is the collateral for many of our loans or that we own directly;
- •
- changing business, banking, or regulatory conditions or policies, or new legislation affecting the financial services
industry, such as the Dodd-Frank Wall Street Reform and Consumer Protection Act of 2010 ("Dodd-Frank Act"), that could lead to changes in the competitive balance among
financial institutions, restrictions on bank activities, changes in costs (including deposit insurance premiums), increased regulatory scrutiny, declines in consumer confidence in depository
institutions, or changes in the secondary market for bank loan and other products;
- •
- the adequacy of loan loss reserves or deposit levels necessitating increased borrowing to fund loans and investments;
- •
- our ability to enter new markets successfully and take advantage of growth opportunities;
- •
- changes in consumer spending, borrowing and savings habits;
- •
- changes in loan defaults and charge-off rates;
- •
- changes in accounting policies and practices, as may be adopted by the bank regulatory agencies and the Financial
Accounting Standards Board ("FASB"); and
- •
- changes in our organization, compensation and benefit plans.
3
This not an exhaustive list and as a result of variations in any of these factors actual results may differ materially from any forward-looking statements. Because of these and other uncertainties, among others, our actual future results may be materially different from the results indicated by any forward-looking statements. We discuss these and other uncertainties in "Risk Factors" beginning on page 40. Forward-looking statements speak only as of the date they are made. You should not place undue reliance on these forward-looking statements. We undertake no obligation to update or revise publicly any forward-looking statements, whether as a result of new information, future events or otherwise.
4
Danvers Bancorp, Inc.
Danvers Bancorp, Inc. (the "Company" or "Danvers") is a Delaware-chartered corporation and registered bank holding company under the Bank Holding Company Act of 1956, as amended. Danvers' principal activity is the ownership and management of its wholly-owned banking subsidiary, Danversbank, a Massachusetts-chartered stock savings bank. The executive offices of Danvers are located at One Conant Street, Danvers, Massachusetts 01923, and our main telephone number is (978) 777-2200.
On October 30, 2009, the Company completed the acquisition of Beverly National Corporation ("Beverly") for a total purchase price of $62.1 million. Beverly stockholders received 1.66 shares of the Company's common stock in exchange for each common share of Beverly. Beverly, a Massachusetts-chartered corporation, was the holding company of Beverly National Bank, a federally-chartered bank, with one wholly-owned subsidiary, Beverly National Security Corporation. The Company merged Beverly National Bank with and into Danversbank after the close of business on February 12, 2010.
On January 20, 2011, the Company announced that it had entered into an Agreement and Plan of Merger (the "Merger Agreement") with People's United Financial, Inc., a Delaware corporation ("People's United"). Pursuant to the Merger Agreement, People's United will acquire the Company in a 55% stock and 45% cash merger transaction valued at approximately $493 million, based on the 10-day average closing price of People's United common stock for the period ended January 19, 2011. The Merger Agreement provides that at the Effective Time (as defined in the Merger Agreement), the Company will be merged with and into People's United (the "Merger"), with People's United continuing as the surviving corporation. Simultaneously with the effective time of the Merger, the Company's subsidiary bank, Danversbank, will be merged with and into People's United subsidiary bank, People's United Bank, with People's United Bank continuing as the surviving entity. Under the terms and conditions of the Merger Agreement, the Company's stockholders have the right to elect to receive (i) $23.00 in cash or (ii) 1.624 shares of People's United common stock for each share of Company common stock, subject to customary pro ration provisions, whereby 55% of Company shares are exchanged for stock and 45% for cash. Subject to the approval of the Company's common stockholders, regulatory approvals and other customary closing conditions, the parties anticipate completing the transaction late in the second quarter of 2011.
Danversbank
Danversbank (the "Bank") is a Massachusetts-chartered stock savings bank headquartered in Danvers, Massachusetts. Originally founded in 1850 as a Massachusetts-chartered mutual savings bank. Danversbank conducts business from its main office located at One Conant Street, Danvers, Massachusetts, and its 27 other branch offices located in Andover, Beverly, Boston, Cambridge, Chelsea, Danvers, Hamilton, Malden, Manchester, Middleton, Needham, Peabody, Reading, Revere, Salem, Saugus, Topsfield, Waltham, Wilmington, and Woburn, Massachusetts.
The Bank's deposits are insured by the Federal Deposit Insurance Corporation ("FDIC"). The Bank is also insured by the Depositors Insurance Fund ("DIF"). The DIF is a private, industry-sponsored insurance company that insures all deposits over the FDIC's per-depositor limits of $250,000 for self-directed retirement accounts and $250,000 for all other deposit accounts in 64 Massachusetts-chartered savings banks. The standard maximum FDIC deposit insurance has been permanently increased from $100,000 to $250,000 per depositor in per insured bank by the Dodd-Frank Wall Street
5
Reform and Consumer Protection Act. Danversbank is a member of the Federal Home Loan Bank of Boston ("FHLBB"), and is regulated by the FDIC and the Massachusetts Division of Banks.
Danversbank's business consists primarily of making loans to its customers, including commercial and industrial ("C&I") loans, commercial real estate loans, owner-occupied residential mortgages and consumer loans, and investing in a variety of investment securities. Danversbank funds these lending and investment activities with deposits from the general public, funds generated from operations and selected borrowings. Danversbank also provides non-deposit investment products and services, cash management, debit and credit card products, trust services and online banking services. Danversbank has five subsidiaries: Conant Ventures, Inc., Conant Investment Corporation, Five Conant Street Investment Corporation, One Conant Capital LLC and Beverly National Security Corporation.
As of December 31, 2010, Danversbank was the seventh largest bank headquartered in the Commonwealth of Massachusetts and the largest banking franchise headquartered in Essex County. Our corporate headquarters is in Danvers, Massachusetts, located approximately 20 miles north of Boston. Over the past eleven years, Danversbank has expanded its footprint to include locations in Middlesex and Suffolk Counties. In September 2001, we acquired RFS Bancorp, Inc., the parent company of Revere Federal Savings Bank. In February 2007, BankMalden, a Massachusetts co-operative bank, merged into Danversbank. In October 2009, we acquired Beverly National Corporation, a Massachusetts-chartered corporation, the parent company of Beverly National Bank, and on February 12, 2010, Beverly's subsidiary bank was merged with and into Danversbank. The counties in which Danversbank currently operates include a mixture of rural, suburban and urban markets. The economies of these areas were historically based on manufacturing, but, similar to many areas of the country, the underpinnings of these economies are now more service oriented, with employment spread across many economic sectors including service, finance, health-care, technology, real estate and government.
While our primary deposit-gathering area is concentrated in Essex and Middlesex Counties in Eastern Massachusetts, our lending area encompasses a somewhat broader market that includes portions of Suffolk County, southern New Hampshire and Rhode Island.
The majority of our loans are made to customers located in our primary deposit-gathering markets. Our large C&I and commercial real estate lending programs comprise a substantial portion of our total loan portfolio. As of December 31, 2010, loans from these loan types totaled $1.3 billion, or 71.2%, of our total loan portfolio. In particular, C&I loans represent more than 48% of the portfolio.
We face substantial competition in our efforts to originate loans and to attract deposits in our primary markets. Achieving meaningful growth is challenging given the number of competitors and the overall decline in the population of our primary market area. We face direct competition from not only locally based community banks but also a significant number of larger financial institutions that have a statewide, regional or national presence. Many of these financial institutions are significantly larger and have greater financial and technological resources than Danversbank. In our commercial real estate lending program, our major competitors also include life insurance companies and to a lesser extent pension funds. We compete with these institutions through competitive pricing coupled with superior service and complemented by very experienced lending teams—especially in the commercial real estate and C&I markets.
Our business objectives have focused on franchise growth and improved profitability while remaining a community-oriented financial institution that emphasizes personalized customer service. Over the past 11 years, we have expanded our branch network by establishing a number of de novo
6
branches, acquiring 11 branch banking offices through our acquisition of Revere Federal Savings Bank, BankMalden and Beverly and opening a loan production office in Boston. We have also upgraded 3 branch offices by relocating to full-service facilities in more attractive locations. In addition, our total loan portfolio has grown significantly, both through organic growth and the addition of experienced lending officers. In addition to opening new branches, we have selectively pursued acquisitions of non-interest income producing businesses and lending groups that will further expand our loan portfolio or grow our banking franchise.
Key elements of our business strategy have included:
Continued Expansion of Our Branch Network. We have expanded our retail banking franchise and generated additional deposits by increasing the number of full service branch offices. We currently maintain a main office and twenty-seven other branch locations, which offer extended hours of operation and increased customer convenience. Our branch network is complimented by a combination of 49 in-branch and free-standing ATMs.
Expansion of Our C&I and Commercial Real Estate Loan Portfolio. In recent years, we have substantially increased our originations of C&I loans and, on a selective basis, commercial real estate loans. We have accomplished this, in part, by hiring experienced senior C&I and commercial real estate lenders from other financial institutions operating in our market area in Eastern Massachusetts after their institutions were acquired by larger banks. In some instances, this has involved an individual lender and in other cases we executed lift-outs of commercial lending groups known to us. In September 2007, we broadened our C&I lending group by hiring two senior asset-based lenders.
Expanding Our Sources of Non-interest Income. We have increased non-interest income in recent periods by introducing additional fee-generating services, such as sales of non-deposit investment and insurance products.
Increased Transaction Accounts. We have developed various products designed to deepen our relationships with our customers, with the goal of ultimately becoming the customer's operating bank. Among local community banks, we are one of the earlier adopters of a deposit capture product, SnapdepositSM, which enables our commercial checking customers to process deposits and checks electronically from their locations. In addition, we offer and promote retail checking services that offer an above-market rate of interest and are tied to a broad suite of required electronic banking services that include, among others, direct deposit, debit card usage and electronic statements. These services have attracted new transaction account balances. While we compete on the basis of rates for certain deposit accounts through the use of periodic market promotions, we have worked to reduce our reliance on certificates of deposit, which generally are more costly than transaction accounts and more susceptible to being moved to other institutions offering higher rates.
Maintaining Asset Quality. We continue to focus on maintaining a high level of asset quality, which we believe is a key component of long-term financial success. At December 31, 2010, our ratio of total non-performing assets to total assets was 0.52%. We intend to maintain asset quality primarily through the maintenance of prudent underwriting standards and a centralized credit approval process.
General. Danversbank's gross loan portfolio totaled $1.8 billion at December 31, 2010, representing 62.5% of total assets at that date. In its lending activities, Danversbank originates C&I and asset based loans, commercial real estate loans, residential and commercial construction loans, residential real estate loans secured by owner-occupied one-to-four-family residences, home equity lines-of-credit, fixed rate home equity loans and other personal consumer loans. Total loans originated totaled $556.0 million in 2010 and $513.6 million in 2009.
7
Loans originated by Danversbank are subject to federal and state laws and regulations. Interest rates charged by Danversbank on its loans are influenced by the demand for such loans, the amount and cost of funding available for lending purposes, current asset/liability management objectives and the interest rates offered by competitors.
The following table summarizes the composition of Danversbank's loan portfolio at the dates indicated:
| |
December 31, | |||||||||||||||||||||||||||||||
|---|---|---|---|---|---|---|---|---|---|---|---|---|---|---|---|---|---|---|---|---|---|---|---|---|---|---|---|---|---|---|---|---|
| |
2010 | 2009 | 2008 | 2007 | 2006 | |||||||||||||||||||||||||||
| |
Amount | Percent | Amount | Percent | Amount | Percent | Amount | Percent | Amount | Percent | ||||||||||||||||||||||
| |
(Dollars in thousands) |
|||||||||||||||||||||||||||||||
Real estate mortgages: |
||||||||||||||||||||||||||||||||
Construction |
$ | 122,550 | 6.86 | % | $ | 125,952 | 7.55 | % | $ | 122,974 | 10.98 | % | $ | 108,638 | 11.94 | % | $ | 137,061 | 15.53 | % | ||||||||||||
Residential |
305,233 | 17.10 | 290,894 | 17.44 | 189,083 | 16.88 | 180,511 | 19.85 | 172,052 | 19.49 | ||||||||||||||||||||||
Commercial |
403,937 | 22.62 | 473,075 | 28.35 | 247,483 | 22.09 | 234,425 | 25.78 | 219,589 | 24.88 | ||||||||||||||||||||||
Home equity |
83,837 | 4.70 | 86,269 | 5.17 | 41,660 | 3.72 | 36,679 | 4.03 | 39,464 | 4.47 | ||||||||||||||||||||||
Other loans: |
||||||||||||||||||||||||||||||||
C&I |
866,445 | 48.53 | 687,808 | 41.22 | 510,359 | 45.55 | 339,669 | 37.35 | 304,016 | 34.44 | ||||||||||||||||||||||
Consumer |
3,355 | 0.19 | 4,523 | 0.27 | 8,725 | 0.78 | 9,564 | 1.05 | 10,530 | 1.19 | ||||||||||||||||||||||
Total loans |
1,785,357 | 100.00 | % | 1,668,521 | 100.00 | % | 1,120,284 | 100.00 | % | 909,486 | 100.00 | % | 882,712 | 100.00 | % | |||||||||||||||||
Allowance for loan losses |
(17,900 | ) | (14,699 | ) | (12,133 | ) | (9,096 | ) | (10,412 | ) | ||||||||||||||||||||||
Deferred loan fees, net |
(2,616 | ) | (2,357 | ) | (1,495 | ) | (989 | ) | (1,186 | ) | ||||||||||||||||||||||
Loans, net |
$ | 1,764,841 | $ | 1,651,465 | $ | 1,106,656 | $ | 899,401 | $ | 871,114 | ||||||||||||||||||||||
C&I Loans. Danversbank originates secured and unsecured C&I loans to business customers in its market area for the purpose of financing equipment purchases, working capital, expansion and other general business purposes. At December 31, 2010, Danversbank had $866.4 million in C&I loans in its total portfolio, representing 48.5% of such portfolio. Danversbank originated $295.4 million and $197.6 million in C&I loans during the years ended December 31, 2010 and 2009, respectively. Danversbank intends to continue to grow this segment of its lending business as market conditions permit.
Danversbank's C&I loans are generally collateralized by accounts receivable, inventory, equipment and other fixed assets and are usually supported by personal guarantees. Danversbank offers both term and revolving C&I loans. The term loans have either fixed or adjustable rates of interest and generally fully amortize over a term of between three and seven years. Revolving loans are generally written for a one- year term, renewable annually.
When making C&I loans, Danversbank considers the financial statements of the borrower, the payment histories of the borrower and guarantor with respect to both corporate and personal debt, the projected cash flows of the business, the viability of the industry in which the borrower operates and the value of the collateral pledged to Danversbank. Danversbank's C&I loans are not concentrated in any single industry.
The repayment of C&I loans is generally dependent on the successful operation of the borrower's business and the sufficiency of collateral, if any. Repayment of these loans, however, may be affected by adverse changes in the general economy. Further, collateral securing such loans may depreciate in value over time and may be difficult to appraise and to liquidate. Included in C&I loans are loans serviced for others in the amount of $37.5 million at December 31, 2010.
8
Commercial Real Estate Loans. Danversbank originated $54.3 million and $87.5 million of commercial real estate loans during the years ended December 31, 2010 and 2009, respectively. We had $403.9 million of commercial real estate loans in our portfolio as of December 31, 2010. These loans comprise 22.6% of the total loan portfolio as of December 31, 2010. Danversbank intends to further increase this segment of its loan portfolio. Danversbank generally originates commercial real estate loans for terms of up to 25 years, typically with interest rates that adjust over periods of one to seven years based on various rate indices plus a margin. Commercial real estate loans are generally secured by non-owner-occupied multi-family income properties, office buildings, retail facilities, warehouses and industrial properties. Generally, commercial real estate loans do not exceed 75% of the appraised value of the underlying collateral at the time the loan is originated. Included in commercial real estate loans are loans serviced for others in the amount of $14.8 million at December 31, 2010.
Danversbank monitors concentrations of commercial real estate loans by property type, location and borrower. For most of Danversbank's larger relationships, the extensions of credit are spread over multiple loans, varying property types and locations. In each instance, the relationships are with highly experienced real estate developers that have longstanding relationships or are well known to Danversbank.
In its evaluation of a commercial real estate loan application, Danversbank considers the net operating income of the property used as collateral, the creditworthiness of the building's tenant(s), the terms of the respective leases, the borrower's expertise, credit history and the profitability and value of the underlying property. Danversbank generally requires that the properties securing these loans have debt service coverage ratios (the ratio of cash flow before debt service to debt service) of at least 1.20x. As a general practice, Danversbank requires the borrowers seeking commercial real estate loans to personally guarantee those loans.
Commercial real estate loans generally have larger balances and involve a greater degree of risk than owner-occupied residential mortgage loans. Loan repayment is often dependent on the successful operation and management of the properties, as well as on the collateral value of the commercial real estate securing the loan. In addition, economic events could have an adverse impact on the cash flows generated by properties securing Danversbank's commercial real estate loans and on the value of such properties.
Construction Loans. Danversbank originates construction loans for one to four-family homes, residential condominiums, commercial, multi-family and other nonresidential purposes. Construction loans generally provide for the payment of interest only during the term of the loan, which is usually twelve to twenty-four months. One to four-family residential and residential condominium construction loans are made with a maximum loan-to-value ratio of 75%. Commercial, multi-family and other nonresidential construction loans are made with a maximum loan-to-value ratio of 75% of the upon-completion market value of the real estate and improvements. Danversbank originated $28.1 million and $28.2 million of construction loans during the years ended December 31, 2010 and 2009, respectively. We had $122.6 million of construction loans in our portfolio as of December 31, 2010. The construction loans are usually written with variable interest rates adjusted to each change in the index rate plus a margin. Danversbank began to reduce its exposure to construction lending through limited originations of construction loans starting in mid-2006 in response to a general downturn in the single-family residential and residential condominium markets, which is lengthening the amount of time required to sell the units that are built.
As with our commercial real estate loan portfolio, we monitor concentrations of construction loans by property type, by location and relative to the amount of construction financing extended to any one borrower. In addition, management monitors the aggregate number of speculative units that Danversbank finances at any one time. There are also limits on the number of speculative units financed for any specific construction project. This limit is generally established at two units per
9
project. However, exceptions to this policy are occasionally granted when the project involves a single building with multiple units. Danversbank's construction lending footprint encompasses an area similar to the franchise branch network, with the highest concentration located in Brookline, Massachusetts. Similar to the institution's commercial real estate portfolio, Danversbank has several large construction loan relationships with individual borrowers, but in each instance the relationship encompasses multiple loans, secured by varying types of properties in different locations. The borrowers involved are highly experienced real estate developers that have longstanding relationships with either a senior lending officer or Danversbank. At December 31, 2010, Danversbank's portfolio of construction loans was comprised of 38.6% residential condominiums, 15.0% single-family homes and subdivisions, 23.3% non-residential commercial real estate, 19.2% land loans, 1.6% apartment construction loans and 2.3% owner occupied residential construction loans. Based on our assessment that the inventory of residential condominiums listed for sale is continuing to decrease in our market area, we do not expect that the concentration of residential condominium construction loans will have a material impact on our revenues or net income.
Construction loans generally involve a greater degree of risk than permanent commercial and residential loan financing. Loan repayment is dependent on the successful completion of the project at an as completed value commensurate with the market value of the real estate and improvements. In addition, economic events could have an adverse impact on our construction loan portfolio and on the value of such properties.
Owner Occupied Residential Real Estate Loans. Danversbank offers fixed-rate and adjustable-rate residential mortgage loans for owner-occupied residential real estate with maturities of up to 40 years and maximum loan amounts generally of up to $3.0 million. As of December 31, 2010, this portfolio totaled $305.2 million, or 17.1% of the total loan portfolio. Of the residential mortgage loans outstanding on that date, $163.3 million were adjustable-rate loans with an average yield of 4.78%, and $141.9 million were fixed-rate mortgage loans with an average yield of 5.02%. Residential mortgage loan originations totaled $165.9 million and $186.0 million for the years ended December 31, 2010 and 2009, respectively. Danversbank does not originate or purchase any sub-prime or alternative-A residential mortgage loans.
The decision to originate loans for portfolio or for sale into the secondary market is made by Danversbank's Asset/Liability Management Committee, or ALCO, and is based on the borrower's interest rate risk profile. Residential mortgage loans sold into the secondary market totaled $44.9 million in 2010 and $66.2 million during 2009. Our current practice is to sell substantially all newly originated fixed-rate 20 and 30-year residential mortgage loans. These loans are underwritten in accordance with Freddie Mac and Fannie Mae standards and sold immediately after being originated by Danversbank. Newly originated, fixed-rate 10 and 15-year loans are typically held in portfolio. At December 31, 2010, fixed-rate residential mortgage loans held in the portfolio totaled $141.9 million, or 46.5% of total residential real estate mortgage loans. Danversbank services loans sold to Freddie Mac and Fannie Mae and earns a fee equal to 0.25% of the loan amounts outstanding for providing these services. The total of residential mortgage loans serviced for others as of December 31, 2010 was $129.5 million.
The adjustable-rate mortgage, or ARM, loans offered by Danversbank make up the largest component of the residential mortgage loans held in portfolio. At December 31, 2010, ARM loans totaled $163.3 million or 53.5% of total residential loans outstanding at that date. ARM's are offered for terms of up to 40 years with initial interest rates that are fixed for 1, 3, 5, 7 or 10 years. After the initial fixed-rate period, the interest rates on the loans are reset based on the relevant U.S. Treasury Constant Maturity Treasury, or CMT, Index plus margins of varying percentages, for one-year periods. Interest rate adjustments on such loans typically range from 2.0% to 3.0% during any adjustment period, excluding the 7 and 10 year ARM's that can adjust up to 6% on the first adjustment period, and 5.0% to 6.0% over the life of the loan. Periodic adjustments in the interest rates charged on ARM
10
Loans help to reduce our exposure to changes in interest rates. However, ARM loans generally possess an element of credit risk not inherent in fixed-rate mortgage loans, in that borrowers are potentially exposed to increases in debt service requirements over the life of the loan in the event market interest rates rise. The possibility of higher payments is taken into account during our underwriting process and many of our residential mortgage loans are made to existing Danversbank customers.
For our residential mortgage loan originations held in portfolio, Danversbank lends up to a maximum loan-to-value ratio of 100% for first-time home buyers and generally up to 80% for other buyers on mortgage loans secured by owner-occupied property. Private mortgage insurance is generally required for loans with a loan-to-value ratio in excess of 80%. Title insurance, hazard insurance and, if appropriate, flood insurance are required for all properties securing real estate loans made by Danversbank. A licensed appraiser appraises all properties securing residential first mortgage purchase loans and all real estate transactions greater than $250,000.
In an effort to provide financing for low and moderate-income first-time home buyers, Danversbank originates and services residential mortgage loans with private mortgage insurance provided by PMI and Genworth mortgage insurance companies as well as the Mortgage Insurance Fund, MIF, of the Massachusetts Housing Finance Agency. The program provides mortgage payment protection as an enhancement to mortgage insurance coverage. This no-cost benefit, known as MI Plus, provides up to six monthly principal and interest payments in the event that a borrower becomes unemployed.
Home Equity Lines-of-Credit and Term Loans. Danversbank offers home equity lines-of-credit and home equity term loans. Danversbank originated $11.3 million and $11.2 million of home equity lines-of-credit and term loans during the years ended December 31, 2010 and 2009, respectively. At December 31, 2010, the Company had $83.8 million of home equity lines-of-credit and loans outstanding. Danversbank does not originate or purchase any sub-prime home equity loans or lines. Home equity lines-of-credit and term loans are secured by first and second mortgages on one-to-four family owner occupied properties, and are made in amounts such that the combined first and second mortgage balances generally do not exceed 75% of the value of the property serving as collateral at time of origination. The lines-of-credit are available to be drawn upon for 10 years, at the end of which time they become term loans amortized over 10 years. Interest rates on home equity lines normally adjust based on the prime rate of interest as published by The Wall Street Journal. The undrawn portion of home equity lines-of-credit totaled $69.9 million at December 31, 2010.
Consumer and Other Loans. Danversbank offers a variety of consumer and other loans, including unsecured personal loans, automobile loans, loans secured by passbook savings or term certificate accounts, overdraft lines of credit, boat and recreational vehicle loans and loans to help finance the cost of education, including primary, secondary and graduate school. Danversbank originated $1.0 million and $3.1 million of consumer and other loans during the years ended December 31, 2010 and 2009, respectively. At December 31, 2010, we had $3.4 million of consumer and other loans outstanding.
Loan Origination and Underwriting. The primary source of originations is our loan personnel, and to a lesser extent, local mortgage brokers, advertising and referrals from customers. In a few instances, Danversbank has purchased participation interests in commercial real estate loans from banks located outside of Essex County. Danversbank underwrites such purchased loans using its own underwriting criteria. Danversbank issues loan commitments to prospective borrowers conditioned on the occurrence of certain events. Commitments are made in writing on specified terms and conditions and are generally honored for up to 60 days from approval. At December 31, 2010, Danversbank had loan commitments and unadvanced loans and lines-of-credit totaling $471.9 million. For information about loan commitments outstanding as of December 31, 2010, see "Quantitative and Qualitative Disclosures About Market Risk—Loan Commitments" on page 78. Danversbank charges origination fees, or points,
11
and collects fees to cover the costs of appraisals and credit reports on most residential mortgage loans originated. Danversbank also collects late charges on real estate loans, and origination fees and prepayment penalties on commercial mortgage loans and some types of C&I loans. For information regarding Danversbank's recognition of loan fees and costs, please refer to Note 2 to the Consolidated Financial Statements beginning on page F-8.
The following table sets forth certain information concerning Danversbank's portfolio loan activity, excluding loans originated for sale and sold:
| |
For the Years Ended December 31, | ||||||||||
|---|---|---|---|---|---|---|---|---|---|---|---|
| |
2010 | 2009 | 2008 | ||||||||
| |
(In thousands) |
||||||||||
Loan originations and purchases: |
|||||||||||
Loan originations: |
|||||||||||
Real estate mortgages: |
|||||||||||
Construction |
$ | 28,074 | $ | 28,240 | $ | 34,476 | |||||
Residential |
165,934 | 185,970 | 48,328 | ||||||||
Commercial |
54,289 | 87,525 | 59,609 | ||||||||
Home equity |
11,319 | 11,169 | 8,592 | ||||||||
Total real estate mortgages |
259,616 | 312,904 | 151,005 | ||||||||
C&I |
295,353 | 197,552 | 308,606 | ||||||||
Consumer |
989 | 3,097 | 2,925 | ||||||||
Total loan originations |
555,958 | 513,553 | 462,536 | ||||||||
Total loan purchases |
— | — | — | ||||||||
Transfer to other real estate owned |
(563 | ) | (1,906 | ) | (1,776 | ) | |||||
Loans acquired through Beverly acquisition, at fair value |
— | 319,994 | — | ||||||||
Loan principal repayments |
(438,559 | ) | (283,404 | ) | (249,962 | ) | |||||
Net increase in loan portfolio |
$ | 116,836 | $ | 548,237 | $ | 210,798 | |||||
Residential mortgage loans are underwritten by Danversbank's staff of residential loan underwriters. Residential mortgage loans that are less than the Freddie Mac and Fannie Mae limit require the approval of a residential loan underwriter to be held in Danversbank's loan portfolio. Residential mortgage loans greater than $1.0 million require the approval of the Board of Investment of the Board of Directors of Danversbank.
Commercial real estate and C&I loans are underwritten by commercial credit analysts. For commercial real estate loans, loan officers may approve loans up to their individual lending limits, which range from $100,000 to $2.0 million, while loans up to $3.0 million may be approved by the Senior Lending Officer and Danversbank's Chief Executive Officer. Danversbank's Senior Lending Officer may approve secured C&I loans of up to $3.0 million, while its Loan Committee may approve loans of up to $5.0 million. Loans over these limits require the approval of the Board of Investment of the Board of Directors of Danversbank.
Consumer loans are underwritten by consumer loan underwriters who have approval authorities ranging from $1,000 to $10,000 for unsecured borrowings and up to $750,000 for secured borrowings. Several senior lenders have authority to approve unsecured consumer loans up to $500,000 and secured borrowing up to $2.0 million. Loans above these limits require the approval of the Board of Investment of the Board of Directors of Danversbank.
12
Pursuant to its loan policy, Danversbank generally does not make loans aggregating more than $30 million as of December 31, 2010, to one borrower or related entity. Danversbank's internal lending limit is lower than the Massachusetts legal lending limit, which is 20.0% of a bank's capital stock, retained earnings and undivided profits, or $47.2 million for Danversbank as of December 31, 2010.
Danversbank has established a risk rating system for its commercial real estate, commercial construction and C&I loans. This system evaluates a number of factors useful in indicating the risk of default and risk of loss associated with a loan. Initial ratings are assigned by commercial credit analysts who do not have responsibility for loan originations. See "Business—Asset Quality—Classification of Assets and Loan Review" on page 14.
Loan Maturity. The following table summarizes the scheduled repayments based on the contractual maturity of Danversbank's loan portfolio at December 31, 2010. Demand loans, loans having no stated repayment schedule, and overdraft loans are reported as being due in one year or less.
| |
At December 31, 2010 | |||||||||||||||||||||||
|---|---|---|---|---|---|---|---|---|---|---|---|---|---|---|---|---|---|---|---|---|---|---|---|---|
| |
Real Estate Mortgages | |
|
|
||||||||||||||||||||
| |
Other | |
||||||||||||||||||||||
| |
|
|
|
Home Equity | |
|||||||||||||||||||
| |
Construction | Residential | Commercial | C&I | Consumer | Total | ||||||||||||||||||
| |
(In thousands) |
|||||||||||||||||||||||
Amounts Due: |
||||||||||||||||||||||||
One year or less |
$ | 76,630 | $ | 1,496 | $ | 13,444 | $ | 332 | $ | 187,452 | $ | 1,097 | $ | 280,451 | ||||||||||
After one year: |
||||||||||||||||||||||||
One to three years |
38,360 | 919 | 63,701 | 1,450 | 256,773 | 551 | 361,754 | |||||||||||||||||
Three to five years |
5,458 | 1,886 | 47,587 | 8,311 | 82,844 | 481 | 146,567 | |||||||||||||||||
Five to ten years |
2,102 | 12,925 | 54,938 | 5,654 | 64,416 | 629 | 140,664 | |||||||||||||||||
Ten to twenty years |
— | 48,172 | 181,224 | 63,678 | 150,161 | 495 | 443,730 | |||||||||||||||||
Over twenty years |
— | 239,835 | 43,043 | 4,412 | 124,799 | 102 | 412,191 | |||||||||||||||||
Total due after one year |
45,920 | 303,737 | 390,493 | 83,505 | 678,993 | 2,258 | 1,504,906 | |||||||||||||||||
Total loans |
$ | 122,550 | $ | 305,233 | $ | 403,937 | $ | 83,837 | $ | 866,445 | $ | 3,355 | 1,785,357 | |||||||||||
Allowance for loan losses |
(17,900 | ) | ||||||||||||||||||||||
Deferred loan fees, net |
(2,616 | ) | ||||||||||||||||||||||
Net loans |
$ | 1,764,841 | ||||||||||||||||||||||
The following table sets forth the dollar amount of total loans, net of unadvanced funds on loans, contractually due after December 31, 2010 and whether such loans have fixed interest rates or adjustable interest rates.
| |
Fixed | Adjustable | Total | ||||||||
|---|---|---|---|---|---|---|---|---|---|---|---|
| |
(In thousands) |
||||||||||
Real estate mortgages: |
|||||||||||
Construction |
$ | 5,187 | $ | 40,733 | $ | 45,920 | |||||
Residential |
141,213 | 162,524 | 303,737 | ||||||||
Commercial |
73,936 | 316,557 | 390,493 | ||||||||
Home equity |
7,077 | 76,428 | 83,505 | ||||||||
C&I |
141,034 | 537,959 | 678,993 | ||||||||
Consumer |
1,605 | 653 | 2,258 | ||||||||
Total loans |
$ | 370,052 | $ | 1,134,854 | $ | 1,504,906 | |||||
13
General. One of Danversbank's most important operating objectives is to maintain a high level of asset quality. Management uses a number of strategies in furtherance of this goal, including maintaining what we believe to be sound credit standards in loan originations, monitoring the loan portfolio through internal and third-party loan reviews, and employing active collection and workout processes for delinquent or problem loans.
Delinquent Loans. Management performs a monthly review of all delinquent loans. The actions taken with respect to delinquencies vary depending upon the nature of the delinquent loans and the period of delinquency. Generally, Danversbank's policy is to mail a delinquency notice no later than the 11th or 16th day, depending on loan type, after the payment due date. A late charge is normally assessed on loans where the scheduled payment remains unpaid after a ten to fifteen day grace period, once again dependent on the loan type. After mailing delinquency notices, Danversbank's loan collection personnel call the borrower to ascertain the reasons for delinquency and the prospects for repayment. On loans secured by one to four-family owner-occupied property, Danversbank initially attempts to work out a payment schedule with the borrower in order to avoid foreclosure. Any such loan restructurings must be approved by the level of officer authority required for a new loan of that amount. If these actions do not result in a satisfactory resolution, Danversbank refers the loan to legal counsel and counsel initiates foreclosure proceedings. For commercial real estate, construction and C&I loans, collection procedures may vary somewhat depending on the circumstances and size of the relationship.
The following table sets forth our loan delinquencies by type and by amount at the dates indicated.
| |
Loans Delinquent For | ||||||||||||||||||||
|---|---|---|---|---|---|---|---|---|---|---|---|---|---|---|---|---|---|---|---|---|---|
| |
30-89 Days | 90 Days and Over | Total | ||||||||||||||||||
| |
Number | Amount | Number | Amount | Number | Amount | |||||||||||||||
| |
(Dollars in thousands) |
||||||||||||||||||||
At December 31, 2010: |
|||||||||||||||||||||
Real estate mortgages: |
|||||||||||||||||||||
Construction |
— | $ | — | — | $ | — | — | $ | — | ||||||||||||
Residential |
15 | 3,586 | 10 | 3,710 | 25 | 7,296 | |||||||||||||||
Commercial |
— | — | — | — | — | — | |||||||||||||||
Home equity |
3 | 491 | — | — | 3 | 491 | |||||||||||||||
Total real estate mortgages |
18 | 4,077 | 10 | 3,710 | 28 | 7,787 | |||||||||||||||
C&I |
10 | 225 | 12 | 2,787 | 22 | 3,012 | |||||||||||||||
Consumer |
5 | 10 | 2 | 1 | 7 | 11 | |||||||||||||||
Total |
33 | $ | 4,312 | 24 | $ | 6,498 | 57 | $ | 10,810 | ||||||||||||
At December 31, 2009: |
|||||||||||||||||||||
Real estate mortgages: |
|||||||||||||||||||||
Construction |
1 | $ | 169 | 3 | $ | 935 | 4 | $ | 1,104 | ||||||||||||
Residential |
22 | 4,220 | 8 | 2,384 | 30 | 6,604 | |||||||||||||||
Commercial |
4 | 409 | 8 | 783 | 12 | 1,192 | |||||||||||||||
Home equity |
8 | 617 | 2 | 533 | 10 | 1,150 | |||||||||||||||
Total real estate mortgages |
35 | 5,415 | 21 | 4,635 | 56 | 10,050 | |||||||||||||||
C&I |
6 | 850 | 8 | 2,492 | 14 | 3,342 | |||||||||||||||
Consumer |
9 | 41 | 2 | 7 | 11 | 48 | |||||||||||||||
Total |
50 | $ | 6,306 | 31 | $ | 7,134 | 81 | $ | 13,440 | ||||||||||||
14
Other Real Estate Owned. Danversbank classifies property acquired through foreclosure or acceptance of a deed in lieu of foreclosure as other real estate owned, or OREO, in its consolidated financial statements. When property is classified as OREO, it is recorded at its fair value less estimated costs to sell at the date of foreclosure or acceptance of deed in lieu of foreclosure. At the time of classification as OREO, any excess of carrying value over fair value is charged to the allowance for loan losses. Subsequent to foreclosure, valuations are periodically performed by management taking into consideration estimated costs to complete, current economic conditions, selling prices and estimated selling costs. Due to changing market conditions, there are inherent uncertainties in the assumptions with respect to the estimated fair value of OREO. Therefore, the amount ultimately realized may differ from the amounts recorded in the consolidated financial statements. Holding costs and declines in fair value result in charges to expense after the property is acquired.
At December 31, 2010, Danversbank had $832,000 in property classified as OREO. The components of the Company's OREO properties consisted of one empty lot zoned for commercial use valued at $800,000 and 60 acres of undeveloped land valued at $200,000. Management does not anticipate any material losses on either property at this time.
Classification of Assets and Loan Review. Danversbank uses a ten-point internal rating system to monitor and evaluate the credit risk inherent in its loan portfolio. At the time a loan is approved, all commercial real estate, construction and C&I loans are assigned a risk rating based on all of the factors considered in originating the loan. The initial risk rating is recommended by the credit analyst charged with underwriting the loan, and subsequently approved by the relevant loan approval authority. Current financial information is required for all commercial real estate, construction and C&I borrowing relationships, and is evaluated on at least an annual basis to determine whether the risk rating classification is appropriate.
In Danversbank's loan rating system, there are four classified asset categories: special mention, substandard, doubtful and loss. An asset is classified special mention if it is currently protected but potentially weak. Potential concerns are that the borrower is exposed to unfavorable economic conditions, adverse operating trends or an unbalanced financial statement condition that could jeopardize the repayment of the loan. Other areas of exposure include an improperly supervised loan due to lack of officer expertise, an inadequate loan agreement, concerns over the condition or control of the collateral, lack of proper documentation or there is some other deviation from prudent lending practices that warrants such a classification. An asset is classified substandard if it is inadequately protected by the current net worth and paying capacity of the borrower and/or the collateral pledged, if any. Substandard assets are characterized by the distinct possibility that Danversbank will sustain some loss if the deficiencies are not corrected. Assets classified doubtful have the weaknesses of substandard assets with the additional characteristic that the weaknesses make collection or liquidation in full questionable, on the basis of currently existing facts, and there is a high probability of loss. If an asset or portion thereof is classified as loss, it is charged off in the quarter in which it is so classified. Assets classified as a loss are considered uncollectible and of such little value that to maintain it as an asset of Danversbank is not warranted. Assets that possess some weaknesses, but that do not expose Danversbank to risk sufficient to warrant classification as substandard, doubtful or loss, are designated as special mention. For assets designated as special mention, or classified substandard or doubtful, Danversbank establishes reserves in amounts management deems appropriate based on the risk of potential loss. This determination as to the classification of assets and the amount of the loss allowances are subject to review by regulatory agencies, which can order the establishment of additional loss allowances. See "Business—Asset Quality—Allowance for Loan Losses" on page 17 and "Management's Discussion and Analysis of Financial Condition and Results of Operation—Critical Accounting Policies—Allowance for Loan Losses" on page 63.
Danversbank currently engages an independent third party to conduct a review of its commercial real estate and C&I loan portfolios three times per year. These loan reviews provide a credit evaluation
15
of individual loans to determine whether the risk ratings assigned are appropriate. Independent loan review findings are presented directly to the Audit Committee of the Board of Directors.
At December 31, 2010, loans classified as special mention totaled $44.9 million, or 2.5%, of the loan portfolio compared to $64.0 million, or 3.8%, at December 31, 2009. Special mention loans consisted of $22.4 million in C&I loans, $17.1 million in commercial real estate construction and $5.4 million in commercial real estate loans at December 31, 2010 compared to $36.5 million in C&I loans, $24.5 million in commercial real estate construction and $3.0 million in commercial real estate loans at December 31, 2009.
Loans classified as substandard, including all impaired loans, totaled $21.2 million, or 1.2% of the loan portfolio, at December 31, 2010 compared to $40.7 million, or 2.4% of the loan portfolio, at December 31, 2009. Loans classified as substandard consisted of $10.3 million in C&I loans, $8.1 million in commercial real estate loans and $2.8 million in commercial real estate construction loans at December 31, 2010. Loans classified as substandard consisted of $20.4 million in C&I loans, $16.1 million in commercial real estate loans and $4.3 million in commercial real estate construction at December 31, 2009. There were no loans classified as doubtful or loss at December 31, 2010 and 2009.
| |
December 31, | |||||||||||||||||
|---|---|---|---|---|---|---|---|---|---|---|---|---|---|---|---|---|---|---|
| |
2010 | 2009 | 2008 | 2007 | 2006 | |||||||||||||
| |
(Dollars in thousands) |
|||||||||||||||||
Non-accrual loans: |
||||||||||||||||||
Real estate mortgages: |
||||||||||||||||||
Construction |
$ | — | $ | 935 | $ | 1,925 | $ | 2,618 | $ | 3,618 | ||||||||
Residential |
7,748 | 3,332 | 2,184 | 1,225 | 791 | |||||||||||||
Commercial |
1,072 | 926 | 263 | — | — | |||||||||||||
Home equity |
1,042 | 1,139 | 227 | 64 | 61 | |||||||||||||
Total real estate mortgages |
9,862 | 6,332 | 4,599 | 3,907 | 4,470 | |||||||||||||
C&I |
2,263 | 2,286 | 1,295 | 451 | 1,265 | |||||||||||||
Consumer |
13 | 6 | 38 | 29 | 17 | |||||||||||||
Troubled debt resructured loans—non-accrual |
947 | — | — | — | — | |||||||||||||
Total non-accrual loans(1) |
$ | 13,085 | $ | 8,624 | $ | 5,932 | $ | 4,387 | $ | 5,752 | ||||||||
Non-performing accrual loans(2) |
$ | — | $ | 1,496 | $ | — | $ | — | $ | — | ||||||||
Troubled debt resructured loans—accruing(3) |
$ | 927 | $ | 7,700 | $ | — | $ | — | $ | — | ||||||||
Total non-performing loans |
$ | 14,012 | $ | 17,820 | $ | 5,932 | $ | 4,387 | $ | 5,752 | ||||||||
Other real estate owned |
832 | 1,427 | 1,158 | 3,513 | — | |||||||||||||
Total non-performing assets |
$ | 14,844 | $ | 19,247 | $ | 7,090 | $ | 7,900 | $ | 5,752 | ||||||||
Total non-performing loans to total loans(4) |
0.78 | % | 1.07 | % | 0.53 | % | 0.48 | % | 0.65 | % | ||||||||
Total non-performing loans to total assets |
0.49 | % | 0.71 | % | 0.34 | % | 0.30 | % | 0.46 | % | ||||||||
Total non-performing assets to total assets |
0.52 | % | 0.77 | % | 0.41 | % | 0.55 | % | 0.46 | % | ||||||||
- (1)
- All
loans on non-accrual status are considered non-performing.
- (2)
- At
December 31, 2009, non-performing accrual loans consisted of six loans adequately secured and in the process of collection.
- (3)
- Restructured
loans that have been performing in accordance with their modified terms for a period of less than 12 months are considered
non-performing.
- (4)
- Total loans include loans held for sale.
16
If the non-accrual loans presented in the table above had been current, the gross interest income that would have been recorded for the year ended December 31, 2010 and 2009 was $399,000 and $342,000, respectively. Interest income of $363,000 and $249,000 from these loans was recognized on a cash basis and recorded in the net income for the years ended December 31, 2010 and 2009, respectively.
Loans are placed on non-accrual status when the loan is delinquent in excess of 90 days (based on contractual terms), unless the timing of collections are reasonably estimable and collection is probable. Restructured loans represent performing loans for which concessions were granted due to a borrower's financial condition and are included in impaired loans. Such concessions may include reductions of interest rates to below-market terms and/or extension of repayment terms.
At December 31, 2010, the OREO balance consists of two properties with no particular business segment or industry concentration.
Allowance for Loan Losses. In originating loans, Danversbank recognizes that losses will be experienced on loans and that the risk of loss may vary with many factors, including the type of loan being made, the creditworthiness of the borrower over the term of the loan, general economic conditions and, in the case of a secured loan, the quality of the collateral for the loan over the term of the loan. Danversbank maintains an allowance for loan losses to absorb losses inherent in the loan portfolio. This allowance represents management's best estimate of the probable known and inherent credit losses in the loan portfolio as of the date of the financial statements.
The allowance for loan losses is evaluated on a regular basis by management and the Board of Directors and is based upon management's periodic review of the collectability of the loans in light of historical loss experience, portfolio volume and mix, geographic and large borrower concentrations, estimated credit losses based on internal and external portfolio reviews, adverse situations that may affect the borrower's ability to repay, estimated value of any underlying collateral and prevailing economic conditions. This evaluation is inherently subjective as it requires estimates that are susceptible to significant revision as circumstances change or as more information becomes available.
The allowance consists of allocated, general and unallocated components. The allocated component relates to loans that are classified as impaired. For such loans that are classified as impaired, an allowance is established when the discounted cash flows or collateral value or observable market price of the impaired loan is lower than the carrying value of the loan. The general component covers non-impaired loans and is based on historical loss experience adjusted for qualitative factors. An unallocated component is maintained to cover uncertainties that could affect management's estimate of probable losses. The unallocated component of the allowance reflects the margin of imprecision inherent in the underlying assumptions used in the methodologies for estimating allocated and general losses in the portfolio. See "Business—Asset Quality—Delinquent Loans" page 14 and "Business—Asset Quality—Other Real Estate Owned" on page 15.
A loan is impaired when, based on current information and events, it is probable that a creditor will be unable to collect all amounts due in accordance with the contractual terms of the loan agreement. Impaired loans are measured based on the present value of expected future cash flows discounted at the loan's effective interest rate or, as a practical expedient, at the loan's observable market price or the fair value of the collateral if the loan is collateral-dependent. Generally, troubled debt restructures ("TDR's") are measured using the discounted cash flow method except in instances where foreclosure is probable in which case the fair value of the collateral is used. All other impaired loans are collateral dependent and are measured through the collateral method. All loans on non-accrual status and TDR's are considered to be impaired. When the measure of the impaired loan is less than the recorded investment in the loan, the impairment is recorded through the valuation allowance. All loans are individually evaluated for impairment according to the Bank's normal loan review process, including overall credit evaluation and rating, nonaccrual status and payment experience. At December 31, 2010, the unpaid principal balance on impaired loans totaled $13.9 million and had an aggregate valuation allowance of $1.4 million.
17
While management is of the opinion that it has established adequate allocations and general allowances for losses on loans, adjustments to the allowance for loan losses may be necessary if future conditions differ substantially from the information used in making the evaluations. In addition, as an integral part of their respective audit and examination processes, Danversbank's external auditors and regulators periodically review the allowance for loan losses. They may require management to recognize adjustments to the allowance for loan losses based on their judgments of information available to them at the time of their review, and the adjustments could negatively impact the Company's financial condition and earnings.
The following table sets forth activity in Danversbank's allowance for loan losses for the periods indicated:
| |
At or For the Years Ended December 31, | |||||||||||||||||
|---|---|---|---|---|---|---|---|---|---|---|---|---|---|---|---|---|---|---|
| |
2010 | 2009 | 2008 | 2007 | 2006 | |||||||||||||
| |
(Dollars in thousands) |
|||||||||||||||||
Allowance balance at beginning of year |
$ | 14,699 | $ | 12,133 | $ | 9,096 | $ | 10,412 | $ | 10,087 | ||||||||
Provision for loan losses |
5,150 | 5,110 | 4,225 | 800 | 1,000 | |||||||||||||
Charge-offs: |
||||||||||||||||||
Real estate mortgages: |
||||||||||||||||||
Construction |
— | 585 | 175 | 1,400 | 21 | |||||||||||||
Residential |
33 | 298 | 216 | 29 | — | |||||||||||||
Commercial |
1,824 | — | 210 | — | — | |||||||||||||
Home equity |
— | 207 | 14 | 1 | 3 | |||||||||||||
Total real estate mortgages |
1,857 | 1,090 | 615 | 1,430 | 24 | |||||||||||||
C&I |
163 | 1,411 | 537 | 715 | 605 | |||||||||||||
Consumer |
59 | 106 | 138 | 73 | 92 | |||||||||||||
Total charge-offs |
2,079 | 2,607 | 1,290 | 2,218 | 721 | |||||||||||||
Recoveries: |
||||||||||||||||||
Real estate mortgages: |
||||||||||||||||||
Construction |
— | 6 | — | — | — | |||||||||||||
Residential |
— | — | 9 | — | — | |||||||||||||
Commercial |
88 | — | — | — | — | |||||||||||||
Home equity |
— | — | — | 1 | — | |||||||||||||
Total real estate mortgages |
88 | 6 | 9 | 1 | — | |||||||||||||
C&I |
23 | 26 | 80 | 52 | 20 | |||||||||||||
Consumer |
19 | 31 | 13 | 49 | 26 | |||||||||||||
Total recoveries |
130 | 63 | 102 | 102 | 46 | |||||||||||||
Net charge-offs |
1,949 | 2,544 | 1,188 | 2,116 | 675 | |||||||||||||
Allowance balance at end of year |
$ | 17,900 | $ | 14,699 | $ | 12,133 | $ | 9,096 | $ | 10,412 | ||||||||
Total loans outstanding |
$ | 1,785,622 | $ | 1,668,521 | $ | 1,120,284 | $ | 909,486 | $ | 882,712 | ||||||||
Average loans outstanding |
$ | 1,691,942 | $ | 1,252,625 | $ | 1,011,304 | $ | 870,569 | $ | 873,150 | ||||||||
Allowance for loan losses as a percent of total loans outstanding |
1.00 | % | 0.88 | %(1) | 1.08 | % | 1.00 | % | 1.18 | % | ||||||||
Net loans charged off as a percent of average loans outstanding |
0.12 | % | 0.20 | % | 0.12 | % | 0.24 | % | 0.08 | % | ||||||||
Allowance for loan losses to non-performing loans |
127.75 | % | 82.49 | % | 204.53 | % | 207.34 | % | 181.02 | % | ||||||||
- (1)
- The acquisition of Beverly into the Company and the attendant "acquisition accounting" considerations are the reasons that the reserve represents a lower percentage of gross loans.
18
The following table sets forth Danversbank's percent of allowance by loan category and the percent of the loans to total loans in each of the categories listed at the dates indicated. The allowance for loan losses allocated to each category is not necessarily indicative of future losses in any particular category and does not restrict the use of the allowance to absorb losses in other categories:
| |
December 31, | |||||||||||||||||||||||||||||||
|---|---|---|---|---|---|---|---|---|---|---|---|---|---|---|---|---|---|---|---|---|---|---|---|---|---|---|---|---|---|---|---|---|
| |
2010 | 2009 | 2008 | 2007 | 2006 | |||||||||||||||||||||||||||
| |
Amount | Percent | Amount | Percent | Amount | Percent | Amount | Percent | Amount | Percent | ||||||||||||||||||||||
| |
(Dollars in thousands) |
|||||||||||||||||||||||||||||||
Real estate mortgages: |
||||||||||||||||||||||||||||||||
Construction |
$ | 2,134 | 6.86 | % | $ | 2,451 | 7.55 | % | $ | 1,728 | 10.97 | % | $ | 1,607 | 11.94 | % | $ | 1,567 | 15.53 | % | ||||||||||||
Residential |
824 | 17.10 | 549 | 17.44 | 481 | 16.89 | 458 | 19.85 | 506 | 19.49 | ||||||||||||||||||||||
Commercial |
4,267 | 22.62 | 3,346 | 28.35 | 2,615 | 22.09 | 2,353 | 25.78 | 2,042 | 24.88 | ||||||||||||||||||||||
Home equity |
343 | 4.70 | 257 | 5.17 | 207 | 3.72 | 187 | 4.03 | 187 | 4.47 | ||||||||||||||||||||||
C&I |
9,826 | 48.53 | 7,839 | 41.22 | 6,843 | 45.55 | 3,854 | 37.35 | 3,696 | 34.44 | ||||||||||||||||||||||
Consumer |
25 | 0.19 | 43 | 0.27 | 82 | 0.78 | 76 | 1.05 | 69 | 1.19 | ||||||||||||||||||||||
Unallocated |
481 | — | 214 | — | 177 | — | 561 | — | 2,345 | — | ||||||||||||||||||||||
Total allowances |
$ | 17,900 | 100.00 | % | $ | 14,699 | 100.00 | % | $ | 12,133 | 100.00 | % | $ | 9,096 | 100.00 | % | $ | 10,412 | 100.00 | % | ||||||||||||
Prior to 2008, management has maintained an unallocated reserve to account for a concentration in our commercial real estate portfolio, and more specifically in our construction loan portfolio, that relates to a segment of our originations made prior to 2002 that possessed underwriting characteristics and terms that were not consistent with the underwriting guidelines and credit administration processes that have been in effect since 2002. These projects are now either complete or have refinanced elsewhere and the unallocated portion of the reserve has been reduced accordingly.
General. The Board of Directors is responsible for establishing our investment policy. The Chief Operating Officer, Chief Financial Officer and Chief Investment Officer are authorized by the Board of Directors to implement this policy based on the established guidelines documented in the Company's Investment Policy. The primary objective of the investment portfolio is to achieve a competitive rate of return without incurring undue interest rate and credit risk, to complement our lending activities, to provide and maintain liquidity, and to assist in managing the interest rate sensitivity of our balance sheet. Individual investment decisions are made based on the safety of the investment, liquidity requirements, potential returns, cash flow targets, and consistency with investment policy and asset/liability management objectives.
Pursuant to FASB guidance on investments in debt and equity securities, our securities are classified as available for sale, held to maturity, or trading, depending on our intent with regard to the investment at the time of acquisition. At December 31, 2010, $723.6 million or 82.6% of the portfolio, was classified as available for sale and $152.7 million or 17.4% of the portfolio was classified as held to maturity. At December 31, 2010, the net unrealized loss on securities classified as available for sale was $3.2 million, before tax effect. We do not currently maintain a trading portfolio of securities. At December 31, 2010, we did not hold securities of any issuers, as defined in Section 2(a)(4) of the Securities Act, excluding those securities issued by government-sponsored enterprises, in which the aggregate book value of such securities exceeded 10% of our equity.
Government-Sponsored Enterprises. The largest segment of our investment portfolio is comprised of debt securities issued by the government-sponsored enterprises. While these debt securities provide somewhat lower yields compared to other investments in our portfolio, we maintain these investments, to the extent we deem appropriate, for liquidity purposes, as collateral for borrowings and other public
19
funds. At December 31, 2010, our government-sponsored enterprise securities portfolio had an average maturity of 8.10 years and totaled $491.3 million, or 56.0% of Danversbank's total investment portfolio.
Residential Mortgage-Backed Securities. At December 31, 2010, our portfolio of residential mortgage-backed securities totaled $333.2 million, or 38.0% of the investment portfolio on that date, and consisted exclusively of pass-through securities that are directly insured or guaranteed by the Federal National Mortgage Corporation, the Federal National Mortgage Association or the Government National Mortgage Association. Danversbank uses mortgage-backed securities as a source of liquidity and to supplement its lending activities. These securities are backed by pools of residential mortgages that have loans with interest rates that are within a set range and have varying maturities. These securities are frequently referred to as mortgage participation certificates or pass-through certificates. The interest rate risk characteristics of the underlying pool of mortgages and the prepayment risk are passed on to the certificate holder. The life of the pass-through security is equal to the life of the underlying mortgages. Expected maturities will differ from contractual maturities due to scheduled repayments and the fact that the underlying borrowers have the right to prepay their mortgage with or without penalty at any time. In our purchase of mortgage-backed obligations, we have targeted instruments with five to twelve year weighted average lives, with expected average life extensions up to a maximum of fifteen years in a rising rate environment. At December 31, 2010, our residential mortgage-backed securities portfolio had an average maturity of 22.95 years. The objective of this strategy has been to limit the potential interest rate risk due to extension of this portfolio in a rising rate environment. None of our mortgage-backed securities have sub-prime residential mortgage or home equity loans as part of their underlying loan pools.
Municipal Obligations. In recent periods, Danversbank has increased the amount of its investment in municipal bonds due to the tax advantages they provide. At December 31, 2010, our portfolio of municipal obligations totaled $50.8 million, or 5.8% of the portfolio at that date. Our policy requires that purchases of municipal obligations be restricted to those obligations that are rated "B" or better by a nationally recognized rating agency, are bank qualified and mature in seventeen years or less. At December 31, 2010, all investments in municipal obligations met these criteria and all of our holdings were privately insured.
Federal Home Loan Bank Stock. As a member of the FHLBB, the Bank is required to maintain an investment in capital stock of the FHLB. Based on redemption provisions of the FHLB, the stock has no quoted market value and is carried at cost. In December 2008, as part of a capital restoration initiative, the FHLBB established a moratorium on the repurchase of excess stock. The Bank reviews for impairment based on the ultimate recoverability of the cost basis on the FHLB stock. As of December 31, 2010 and 2009, no impairment has been recognized. At its discretion, the FHLB may declare dividends on the stock. On February 26, 2009, the FHLBB suspended dividends starting with the first quarter of 2009. On February 22, 2011, the FHLBB's Board of Directors reinstated a dividend equal to an annual yield of 0.30 percent, which is the approximate daily average three-month LIBOR yield for the fourth quarter of 2010 that was paid on March 2, 2011.
20
The following table sets forth certain information regarding the amortized cost and market values of securities at the dates indicated:
| |
December 31, | ||||||||||||||||||||
|---|---|---|---|---|---|---|---|---|---|---|---|---|---|---|---|---|---|---|---|---|---|
| |
2010 | 2009 | 2008 | ||||||||||||||||||
| |
Amortized Cost |
Fair Value |
Amortized Cost |
Fair Value |
Amortized Cost |
Fair Value |
|||||||||||||||
| |
(In thousands) |
||||||||||||||||||||
Available for sale |
|||||||||||||||||||||
Debt securities: |
|||||||||||||||||||||
U.S. Government |
$ | — | $ | — | $ | 15,488 | $ | 15,480 | $ | 2,007 | $ | 2,018 | |||||||||
Federal Home Loan Mortgage Corporation |
— | — | 6,038 | 6,012 | 1,147 | 1,148 | |||||||||||||||
Other government-sponsored enterprises |
406,827 | 402,620 | 172,706 | 172,121 | 216,369 | 220,623 | |||||||||||||||
Mortgage-backed |
265,509 | 269,356 | 254,644 | 261,577 | 245,089 | 247,990 | |||||||||||||||
Municipal bonds |
53,576 | 50,757 | 24,125 | 24,364 | 19,179 | 18,816 | |||||||||||||||
Other bonds |
250 | 250 | 250 | 250 | 250 | 250 | |||||||||||||||
Total debt securities |
726,162 | 722,983 | 473,251 | 479,804 | 484,041 | 490,845 | |||||||||||||||
Marketable equity securities: |
|||||||||||||||||||||
Warrants |
— | — | 779 | 692 | — | — | |||||||||||||||
Mutual funds |
612 | 627 | 602 | 599 | — | — | |||||||||||||||
Other equities |
— | — | 5 | 5 | — | — | |||||||||||||||
Total securities available for sale |
$ | 726,774 | $ | 723,610 | $ | 474,637 | $ | 481,100 | $ | 484,041 | $ | 490,845 | |||||||||
Held to maturity |
|||||||||||||||||||||
Debt securities: |
|||||||||||||||||||||
Federal Home Loan Mortgage Corporation |
$ | — | $ | — | $ | 1,698 | $ | 1,687 | $ | — | $ | — | |||||||||
Other government-sponsored enterprises |
88,639 | 85,977 | 51,815 | 50,950 | — | — | |||||||||||||||
Mortgage-backed |
63,892 | 64,250 | 47,968 | 47,360 | — | — | |||||||||||||||
Subordinated note |
— | — | 9,251 | 8,500 | — | — | |||||||||||||||
Other bonds |
200 | 200 | 200 | 200 | — | — | |||||||||||||||
Total debt securities |
$ | 152,731 | $ | 150,427 | $ | 110,932 | $ | 108,697 | $ | — | $ | — | |||||||||
21
The tables below set forth certain information regarding the amortized cost, weighted average yields and contractual maturities of our available for sale and held to maturity debt securities portfolio at December 31, 2010. In the case of residential mortgage-backed securities, the tables show the securities by their contractual maturities, however there are scheduled principal payments for these securities and there will also be unscheduled prepayments prior to their contractual maturity. State and municipal securities yields have not been adjusted to a tax-equivalent basis.
| |
One Year or Less | More Than One Year Through Five Years |
More Than Five Years Through Ten Years |
More Than Ten Years |
Total Securities | ||||||||||||||||||||||||||||||
|---|---|---|---|---|---|---|---|---|---|---|---|---|---|---|---|---|---|---|---|---|---|---|---|---|---|---|---|---|---|---|---|---|---|---|---|
| |
Amortized Cost |
Weighted Average Yield(1) |
Amortized Cost |
Weighted Average Yield(1) |
Amortized Cost |
Weighted Average Yield(1) |
Amortized Cost |
Weighted Average Yield(1) |
Amortized Cost |
Fair Value | Weighted Average Yield(1) |
||||||||||||||||||||||||
| |
(Dollars in thousands) |
||||||||||||||||||||||||||||||||||
Debt Securities Available for Sale |
|||||||||||||||||||||||||||||||||||
Government-sponsored enterprises |
$ | 8,250 | 0.97 | % | $ | 166,087 | 1.63 | % | $ | 171,245 | 3.33 | % | $ | 61,245 | 4.34 | % | $ | 406,827 | $ | 402,620 | 2.74 | % | |||||||||||||
Mortgage-backed |
— | — | 3,450 | 3.58 | 397 | 4.86 | 261,662 | 3.88 | 265,509 | 269,356 | 3.88 | ||||||||||||||||||||||||
Municipal bonds |
— | — | — | — | 4,106 | 3.72 | 49,470 | 4.13 | 53,576 | 50,757 | 4.10 | ||||||||||||||||||||||||
Other bonds |
— | — | 250 | 2.38 | — | — | — | — | 250 | 250 | 2.38 | ||||||||||||||||||||||||
Total Debt Securities Available for Sale |
$ | 8,250 | 0.97 | % | $ | 169,787 | 1.67 | % | $ | 175,748 | 3.34 | % | $ | 372,377 | 3.99 | % | $ | 726,162 | $ | 722,983 | 3.26 | % | |||||||||||||
- (1)
- Weighted average yield is based on par and does not account for amortization and accretion.
| |
One Year or Less | More Than One Year Through Five Years |
More Than Five Years Through Ten Years |
More Than Ten Years |
Total Securities | ||||||||||||||||||||||||||||||
|---|---|---|---|---|---|---|---|---|---|---|---|---|---|---|---|---|---|---|---|---|---|---|---|---|---|---|---|---|---|---|---|---|---|---|---|
| |
Amortized Cost |
Weighted Average Yield(1) |
Amortized Cost |
Weighted Average Yield(1) |
Amortized Cost |
Weighted Average Yield(1) |
Amortized Cost |
Weighted Average Yield(1) |
Amortized Cost |
Fair Value | Weighted Average Yield(1) |
||||||||||||||||||||||||
| |
(Dollars in thousands) |
||||||||||||||||||||||||||||||||||
Debt Securities Held to Maturity |
|||||||||||||||||||||||||||||||||||
Government-sponsored enterprises |
— | 0.00 | % | 3,000 | 2.65 | % | 26,653 | 3.20 | % | 58,986 | 3.96 | % | 88,639 | 85,977 | 3.69 | % | |||||||||||||||||||
Mortgage-backed |
— | — | — | — | — | — | 63,892 | 4.08 | 63,892 | 64,250 | 4.08 | ||||||||||||||||||||||||
Subordinated note |
— | — | — | — | — | — | — | — | — | — | — | ||||||||||||||||||||||||
Other bonds |
— | — | 200 | 1.75 | — | — | — | — | 200 | 200 | 1.75 | ||||||||||||||||||||||||
Total Debt Securities Held to Maturity |
$ | — | — | % | $ | 3,200 | 2.59 | % | $ | 26,653 | 3.20 | % | $ | 122,878 | 4.02 | % | $ | 152,731 | $ | 150,427 | 3.85 | % | |||||||||||||
- (1)
- Weighted average yield is based on par and does not account for amortization and accretion.
General. Deposits are the primary source of funds for our lending and investment activities. In addition to deposits, we obtain funds from the amortization and prepayment of loans and mortgage-backed securities, the sale or maturity of investment securities, advances from the FHLBB, repurchase agreements, and cash flows generated by operations.
Deposits. We gather consumer and commercial deposits through the offering of a broad selection of deposit products, including checking, regular savings, money market deposits, term certificates and individual retirement accounts. The FDIC insures deposits up to certain limits, which are generally $250,000 per depositor, and the DIF insures amounts in excess of these limits.
The maturities of term certificates range from one month to five years. In order to attract deposit and loan business, we offer a variety of commercial business products to small businesses operating within our primary market area. Among local community banks, we are one of the early adopters of a remote deposit capture product, SnapdepositSM, which enables our business customers to process deposits and checks electronically from their locations. We accept deposits from customers within our market area based primarily on posted rates but from time to time negotiate the rate on these instruments commensurate with the size of the deposit. We also generate term certificates through the
22
use of brokers and internet-based network deposits. There were no brokered and network deposits at December 31, 2010 and 2009.
We rely primarily on competitive pricing of our deposit products, customer service and long-standing relationships with customers to attract and retain deposits. Market interest rates, rates offered by financial service competitors, the availability of other investment alternatives, and general economic conditions significantly affect our ability to attract and retain deposit balances.
The Company does have one significant deposit customer with primarily transaction accounts. At December 31, 2010 and 2009, these transaction account balances in aggregate amounted to $135.4 million and $133.3 million, respectively, and are included in deposits.
The following table sets forth certain information relative to the composition of our deposit accounts and the weighted average interest rate on each category of deposits at the dates indicated:
| |
December 31, | ||||||||||||||||||||||||||||||
|---|---|---|---|---|---|---|---|---|---|---|---|---|---|---|---|---|---|---|---|---|---|---|---|---|---|---|---|---|---|---|---|
| |
2010 | 2009 | 2008 | ||||||||||||||||||||||||||||
| |
Balance | Percent | Weighted Average Rate |
Balance | Percent | Weighted Average Rate |
Balance | Percent | Weighted Average Rate |
||||||||||||||||||||||
| |
(Dollars in thousands) |
||||||||||||||||||||||||||||||
Deposit type: |
|||||||||||||||||||||||||||||||
Demand deposits |
$ | 246,973 | 11.76 | % | — | % | $ | 224,776 | 12.73 | % | — | % | $ | 123,414 | 11.04 | % | — | % | |||||||||||||
Interest-bearing transaction accounts: |
|||||||||||||||||||||||||||||||
Savings and NOW accounts |
449,036 | 21.38 | 1.18 | 376,975 | 21.35 | 1.39 | 176,365 | 15.77 | 1.31 | ||||||||||||||||||||||
Money market accounts |
837,647 | 39.89 | 1.03 | 621,683 | 35.21 | 1.42 | (1) | 440,931 | 39.43 | 2.69 | |||||||||||||||||||||
Total transaction accounts |
1,286,683 | 61.27 | 1.08 | 998,658 | 56.56 | 1.41 | 617,296 | 55.20 | 2.30 | ||||||||||||||||||||||
Term certificates |
566,370 | 26.97 | 1.77 | 542,369 | 30.71 | 2.18 | 377,573 | 33.76 | 3.37 | ||||||||||||||||||||||
Total deposits |
$ | 2,100,026 | 100.00 | % | 1.14 | % | $ | 1,765,803 | 100.00 | % | 1.47 | % | $ | 1,118,283 | 100.00 | % | 2.41 | % | |||||||||||||
The following table sets forth our term certificates classified by interest rate as of the dates indicated:
| |
December 31, | |||||||||||
|---|---|---|---|---|---|---|---|---|---|---|---|---|
| |
2010 | 2009 | 2008 | |||||||||
| |
(In thousands) |
|||||||||||
Certificates of Deposit by Interest Rate: |
||||||||||||
Less than 2.01% |
$ | 373,519 | $ | 270,984 | $ | 14,415 | ||||||
2.01% through 3.00% |
175,259 | 208,251 | 111,058 | |||||||||
3.01% through 4.00% |
14,638 | 57,769 | 223,756 | |||||||||
4.01% through 5.00% |
2,141 | 3,889 | 25,620 | |||||||||
5.01% through 6.00% |
813 | 1,476 | 2,706 | |||||||||
Over 6.00% |
— | — | 18 | |||||||||
Total |
$ | 566,370 | $ | 542,369 | $ | 377,573 | ||||||
23
The following table sets forth the amount by rate and maturities of term certificates at December 31, 2010:
| |
Maturing During the Years Ending December 31, |
|
|
|||||||||||||||||
|---|---|---|---|---|---|---|---|---|---|---|---|---|---|---|---|---|---|---|---|---|
Interest Rate
|
2011 | 2012 | 2013 | 2014 | Thereafter | Total | ||||||||||||||
| |
(In thousands) |
|||||||||||||||||||
Less than 2.01% |
$ | 322,082 | $ | 39,689 | $ | 11,533 | $ | 74 | $ | 141 | $ | 373,519 | ||||||||
2.01% through 3.00% |
65,693 | 21,277 | 75,329 | 1,060 | 11,900 | 175,259 | ||||||||||||||
3.01% through 4.00% |
4,657 | 3,202 | 3,269 | 1,111 | 2,399 | 14,638 | ||||||||||||||
4.01% through 5.00% |
740 | 1,060 | 341 | — | — | 2,141 | ||||||||||||||
5.01% through 6.00% |
685 | 128 | — | — | — | 813 | ||||||||||||||
Over 6.00% |
— | — | — | — | — | — | ||||||||||||||
Total |
$ | 393,857 | $ | 65,356 | $ | 90,472 | $ | 2,245 | $ | 14,440 | $ | 566,370 | ||||||||
As of December 31, 2010, the aggregate amount of outstanding term certificates in amounts greater than or equal to $100,000 was $344.2 million and the following table sets forth the maturity of those certificates:
| |
Amount | |||
|---|---|---|---|---|
| |
(In thousands) |
|||
Three months or less |
$ | 78,937 | ||
Over three months through six months |
62,451 | |||
Over six months through one year |
96,046 | |||
Over one year |
106,731 | |||
|
$ | 344,165 | ||
Borrowings. Danversbank utilizes short-term and long-term advances from the FHLBB and FRB as an alternative to retail deposits to fund its operations as part of its operating strategy. FHLBB advances are secured primarily by certain residential mortgage loans and investment securities and secondarily by our investment in capital stock of the FHLB. Advances are made pursuant to several FHLBB credit programs, each of which has its own terms, interest rates and range of maturities. The maximum amount that the FHLBB will advance to member institutions fluctuates from time to time in accordance with the policies of the FHLB. At December 31, 2010, we had outstanding $364.8 million in FHLBB advances and had the ability to borrow up to a total of $535.2 million based on available and pledged collateral. FRB advances are secured by municipal bond investment securities. Advances are made pursuant to several FRB credit programs, each of which has its own terms, interest rates and range of maturities. The maximum amount that the FRB will advance fluctuates from time to time in accordance with the policies of the Federal Reserve Bank. At December 31, 2010, we had outstanding $1.0 million in FRB advances and had the ability to borrow up to a total of $65.0 million based on available and pledged collateral.
Of the $364.8 million in advances outstanding at December 31, 2010, $175.8 million, bearing a weighted average interest rate of 4.18%, are callable by the FHLBB at various intervals in their respective contracts. In the event that the FHLBB calls some of these advances, we will evaluate our liquidity and interest rate sensitivity position at that time and determine whether to replace the called advances with new borrowings.
In addition to FHLBB advances, Danversbank's borrowings include securities sold under agreements to repurchase, or repurchase agreements. Repurchase agreements are contracts for the sale of securities owned by Danversbank, in this case to large commercial deposit customers, with an agreement to repurchase those securities at an agreed upon price and date. Danversbank uses repurchase agreements as a means of offering some of its commercial deposit customers a commercial sweep checking product. The collateral for these repurchase agreements comes from Danversbank's portfolio of government-sponsored enterprises obligations and all of the contracts and related borrowings are overnight. At December 31, 2010, we had outstanding $45.3 million in overnight repurchase agreements with certain commercial deposit customers.
24
The following table sets forth certain information concerning balances and interest rates on our borrowings at the dates and for the periods indicated:
| |
At or For the Years Ended December 31, |
|||||||||||
|---|---|---|---|---|---|---|---|---|---|---|---|---|
| |
2010 | 2009 | 2008 | |||||||||
| |
(Dollars in thousands) |
|||||||||||
Short-term borrowings: |
||||||||||||
Balance at end of period: |
||||||||||||
Federal Home Loan Bank advances |
$ | 168,000 | $ | 120,000 | $ | 139,000 | ||||||
Federal Reserve Bank—Discount Window |
1,000 | — | — | |||||||||
Federal Reserve—TAF |
— | — | — | |||||||||
Repurchase agreements |
45,330 | 52,829 | 29,276 | |||||||||
Total short-term borrowings |
$ | 214,330 | $ | 172,829 | $ | 168,276 | ||||||
Average balance during the period: |
||||||||||||
Federal Home Loan Bank advances |
$ | 19,564 | $ | 47,670 | $ | 15,503 | ||||||
Federal Reserve Bank—Discount Window |
3 | — | — | |||||||||
Federal Reserve—TAF |
— | 15,014 | — | |||||||||
Repurchase agreements |
41,054 | 35,468 | 30,906 | |||||||||
Total short-term borrowings |
$ | 60,621 | $ | 98,152 | $ | 46,409 | ||||||
Maximum outstanding at any month period: |
||||||||||||
Federal Home Loan Bank advances |
$ | 168,000 | $ | 120,000 | $ | 139,000 | ||||||
Federal Reserve Bank—Discount Window |
3 | — | — | |||||||||
Federal Reserve—TAF |
— | 65,000 | — | |||||||||
Repurchase agreements |
57,301 | 52,829 | 47,419 | |||||||||
Weighted average interest rate at end of period: |
||||||||||||
Federal Home Loan Bank advances |
0.28 | % | 0.20 | % | 0.07 | % | ||||||
Federal Reserve Bank—Discount Window |
0.75 | % | 0.00 | % | 0.00 | % | ||||||
Federal Reserve—TAF |
0.00 | % | 0.00 | % | 0.00 | % | ||||||
Repurchase agreements |
0.27 | % | 0.45 | % | 1.07 | % | ||||||
Total short-term borrowings |
0.28 | % | 0.28 | % | 0.27 | % | ||||||
Average interest rate during period: |
||||||||||||
Federal Home Loan Bank advances |
0.38 | % | 0.33 | % | 1.17 | % | ||||||
Federal Reserve Bank—Discount Window |
0.00 | % | 0.00 | % | 0.00 | % | ||||||
Federal Reserve—TAF |
0.00 | % | 0.25 | % | 0.00 | % | ||||||
Repurchase agreements |
0.42 | % | 0.50 | % | 1.27 | % | ||||||
Total short-term borrowings |
0.40 | % | 0.38 | % | 1.23 | % | ||||||
Long-term debt: |
||||||||||||
Balance at end of period |
$ | 196,778 | $ | 218,475 | $ | 163,022 | ||||||
Average balance during the period |
209,597 | 171,401 | 158,102 | |||||||||
Maximum outstanding at any month period |
$ | 216,355 | 219,857 | 164,505 | ||||||||
Weighted average interest rate at end of period |
4.06 |
% |
4.13 |
% |
4.39 |
% |
||||||
Average interest rate during period |
3.46 | % | 4.27 | % | 4.51 | % | ||||||
Subordinated debt: |
||||||||||||
Balance at end of period |
$ | 29,965 | $ | 29,965 | $ | 29,965 | ||||||
Average balance during the period |
29,965 | 29,965 | 29,965 | |||||||||
Maximum outstanding at any month period |
29,965 | 29,965 | 29,965 | |||||||||
Weighted average interest rate at end of period |
6.38 |
% |
6.36 |
% |
7.17 |
% |
||||||
Average interest rate during period |
6.21 | % | 6.56 | % | 7.68 | % | ||||||
25
As of December 31, 2010, the Company has 331 full time and 72 part-time employees. Employees are not represented by a collective bargaining unit and we consider our relationship with our employees to be good.
Conant Investment Corporation. Conant Investment Corporation, is a wholly-owned subsidiary of Danversbank that qualifies as a Massachusetts securities corporation through which Danversbank buys, sells and holds securities on Danversbank's and behalf. The subsidiary maintains an account at Danversbank, on terms and conditions generally available to regular customers, for the primary purpose of accumulating current earnings, payments and/or maturities from their securities until a level is reached that would allow the acquisition of additional securities at the normal level purchased by the corporation. The account is limited in amount and time so as to reasonably reflect the need for holding cash in an interest-bearing account on a short-term, temporary basis pending reinvestment. On a quarterly basis the activity of the subsidiary is reviewed to determine if a dividend is required to be declared and paid to Danversbank in order to be in compliance with Massachusetts Department of Revenue ("DOR") Regulations promulgated July 14, 2007.
Beverly National Security Corporation. Beverly National Security Corporation is a wholly-owned subsidiary of Danversbank that qualifies as a Massachusetts securities corporation through which Danversbank buys, sells and holds securities on Danversbank's behalf. This subsidiary maintains an account at Danversbank, on terms and conditions generally available to regular customers, for the primary purpose of accumulating current earnings, payments and/or maturities from its securities until a level is reached that would allow the acquisition of additional securities at the normal level purchased by the corporation. The accounts are limited in amount and time so as to reasonably reflect the need for holding cash in an interest-bearing account on a short-term, temporary basis pending reinvestment. On a quarterly basis the activity of this subsidiary is reviewed to determine if a dividend is required to be declared and paid to Danversbank in order to be in compliance with DOR Regulations promulgated July 14, 2007.
One Conant Capital LLC. One Conant Capital LLC is a limited liability company formed in 2006 under the Massachusetts Limited Liability Company Act, as amended. The establishment and purpose of the LLC as an operating subsidiary of Danversbank, pursuant to Massachusetts law, is to originate and hold loans secured by real estate, to originate and hold commercial and industrial loans, and to engage in any other activity in which Danversbank itself may engage. One Conant Capital LLC had aggregate loan balances of $57.2 million at December 31, 2010.
Conant Ventures, Inc. Conant Ventures, Inc. is a wholly-owned subsidiary of Danversbank that is allowed to engage in real estate investment activities permissible for a Massachusetts bank as defined in section 362 of the FDIC's Rules and Regulations. The subsidiary is effectively inactive but is utilized from time to time to hold deeds of properties that Danversbank takes into OREO. Conant Ventures, Inc. has not engaged in any real estate investment activities since 2000.
Five Conant Street Investment Corporation. Five Conant Street Investment Corporation, a wholly-owned subsidiary of Danversbank, was formed in April 2008. This corporation qualifies as a Massachusetts securities corporation through which Danversbank buys, sells and holds securities on Danversbank's behalf. This subsidiary maintains accounts at Danversbank, on terms and conditions generally available to regular customers, for the primary purpose of accumulating current earnings, payments and/or maturities from their securities until a level is reached that would allow the acquisition of additional securities at the normal level purchased by the corporation. The accounts are limited in amount and time so as to reasonably reflect the need for holding cash in an interest-bearing account on
26
a short-term, temporary basis pending reinvestment. On a quarterly basis the activity of this subsidiary is reviewed to determine if a dividend is required to be declared and paid to Danversbank in order to be in compliance with Massachusetts DOR Regulations promulgated July 14, 2007.
General. The Company is a Delaware corporation and a bank holding company registered with the Board of Governors of the Federal Reserve System (the "Federal Reserve") under the Bank Holding Company Act of 1956, as amended (the "BHCA"). The Company has one bank subsidiary, Danversbank, which is a Massachusetts-chartered stock savings bank. The Company and Danversbank are subject to specific requirements and restrictions and general regulatory oversight and policies. State and federal banking laws have as their principal objective the safety and soundness of depository institutions, the federal deposit insurance system, and the protection of depositors, rather than the protection of stockholders of a bank or its parent company. Compliance with these complex regulations and the Company's disclosure and financial reporting obligations requires significant investments of time and money and could adversely affect the Company's and Danversbank's profitability and restrict its ability to enter into new lines of business. Further, the regulations imposed by one jurisdiction may be inconsistent with the regulations imposed by another, and these differences may be difficult or costly to address. The regulatory environment of the Company and Danversbank is frequently altered by the enactment of new statutes and the adoption of new regulations as well as by revisions to, and evolving interpretations of, existing regulations. Any change in these statutory or regulatory requirements and policies could have a material adverse impact on the Company, Danversbank and their operations. See "Risk Factors—We Operate in a Highly Regulated Environment That is Subject to Future Change" on page 49.
The Company has not elected financial holding company status under the BHCA and, accordingly, may not engage in certain financial activities, such as merchant banking, that are authorized under the BHCA only for financial holding companies.
Danversbank's deposits are insured up to applicable limits by the FDIC's DIF and by the DIF for amounts in excess of the FDIC insurance limits. The Dodd-Frank Act permanently raises the standard maximum deposit insurance amount to $250,000, retroactive to January 1, 2008, and provides unlimited deposit insurance coverage for qualifying transaction accounts through December 31, 2012, without any need for institutions to opt in or out.
Danversbank is subject to regulation by the Massachusetts Commissioner of Banks, as its chartering agency, and by the FDIC. Danversbank is required to file reports with, and is periodically examined by, the FDIC and the Massachusetts Commissioner of Banks concerning its activities and financial condition and must obtain regulatory approvals prior to entering into certain transactions, including, but not limited to, mergers with or acquisitions of other financial institutions. Additionally, the Federal Reserve may directly examine the subsidiaries of the Company, including Danversbank. Regulation and supervision by federal and state banking agencies establishes a comprehensive framework of activities in which an institution can engage and is intended primarily for the protection of depositors and borrowers and, for purposes of the FDIC, the protection of the DIF. The regulatory structure also gives the regulatory authorities extensive discretion in connection with their supervisory and enforcement activities and examination policies, including policies with respect to the classification of assets and the establishment of adequate loan loss reserves for regulatory purposes. Danversbank is a member of the FHLBB.
Certain regulatory requirements applicable to Danversbank and to the Company are referred to below or elsewhere herein. The description of statutory provisions and regulations applicable to savings institutions and their holding companies set forth below and elsewhere in this document does not
27
purport to be a complete description of such statutes and regulations and their effects on Danversbank and the Company and is qualified in its entirety by reference to the actual laws and regulations.
Regulatory Reform. On July 21, 2010, the President signed the Dodd-Frank Act into law. The Dodd-Frank Act comprehensively reforms the regulation of financial institutions, products and services. Many of the provisions of the Dodd-Frank Act noted in this section are also discussed in other sections below. Furthermore, many of the provisions of the Dodd-Frank Act require studies or rulemaking by federal agencies, a process which will take months and years to fully implement. The Dodd-Frank Act calls fro over 200 rulemakings by various federal agencies.
Among other things, the Dodd-Frank Act provides for new capital standards that eliminate the treatment of trust preferred securities as Tier 1 capital. Existing trust preferred securities issued before May 19, 2010 are grandfathered for banking entities with less than $15 billion of assets, such as the Company. The payment of interest on business demand deposit accounts is permitted by the Dodd-Frank Act. The Dodd-Frank Act authorizes the Federal Reserve to regulate interchange fees for debit card transactions and establishes new minimum mortgage underwriting standards for residential mortgages. Further, the Dodd-Frank Act generally bars banking organizations, such as the Company, from engaging in proprietary trading and from sponsoring and investing in hedge funds and private equity funds, except as permitted under certain limited circumstances. The Dodd-Frank Act empowers the newly established Financial Stability Oversight Council to designate certain activities as posing a risk to the U.S. financial system and to recommend new or heightened standards and safeguards for financial institutions engaging in such activities.
Further, the Dodd-Frank Act establishes the Office of Financial Research which has the power to require reports from financial services companies such as the Company. The Dodd-Frank Act also establishes the Consumer Financial Protection Bureau ("CFPB") as an independent bureau of the Federal Reserve. The CFPB has the exclusive authority to prescribe rules implementing numerous laws governing the provision of consumer financial products and services, which in the case of Danversbank will be enforced by the FDIC.
The Dodd-Frank Act also contains numerous provisions relating to securities laws and corporate governance. Under the Dodd-Frank Act the SEC has adopted rules granting proxy access for shareholder nominees, and grants shareholders a non-binding vote on executive compensation and "golden parachute" payments. Pursuant to modifications of the proxy rules under the Dodd-Frank Act, the Company will be required to disclose the relationship between executive pay and financial performance, the ratio of the median pay of all employees to the pay of the chief executive officer, and employee and director hedging activities. The Dodd-Frank Act also requires that stock exchanges change their listing rules to require that each member of a listed company's compensation committee be independent and be granted the authority and funding to retain independent advisors and to prohibit the listing of any security of an issuer that does not adopt policies governing the claw back of excess executive compensation based on inaccurate financial statements. The SEC has approved the proposed regulations which prohibit incentive-based compensation arrangements that encourage inappropriate risk. The proposed regulations are still subject to approval by all other agencies listed in the release.
Capital Requirements for Banks and Bank Holding Companies.
The Federal Reserve and the FDIC have issued substantially similar risk-based and leverage capital guidelines applicable to United States banking organizations. In addition, these regulatory agencies may from time to time require that a banking organization maintain capital above the minimum levels, whether because of its financial condition or actual or anticipated growth, or for other supervisory reasons. The regulatory agencies have significant flexibility to require higher levels of capital above the minimum levels.
28
The Federal Reserve's risk-based guidelines define a three-tier capital framework. Tier 1 capital for bank holding companies generally consists of the sum of common stockholders' equity, perpetual preferred stock and trust preferred securities (both subject to certain limitations and, in the case of the latter, to specific limitations on the kind and amount of such securities which may be included as Tier 1 capital and certain additional restrictions described below; and as discussed below, the Dodd-Frank Act calls for trust preferred securities to be phased out of Tier 1 capital treatment), and minority interests in the equity accounts of consolidated subsidiaries, less goodwill and other non-qualifying intangible assets. Tier 2 capital generally consists of hybrid capital instruments, perpetual debt and mandatory convertible debt securities; perpetual preferred stock and trust preferred securities, to the extent it is not eligible to be included as Tier 1 capital; term subordinated debt and intermediate-term preferred stock; and, subject to limitations, general allowances for loan losses. The sum of Tier 1 and Tier 2 capital less certain required deductions, such as investments in unconsolidated banking or finance subsidiaries, represents qualifying total capital. Risk-based capital ratios are calculated by dividing Tier 1 and total capital, respectively, by risk-weighted assets. Assets and off-balance sheet credit equivalents are assigned to one of four categories of risk-weights, based primarily on relative credit risk. The minimum Tier 1 risk-based capital ratio is 4% and the minimum total risk-based capital ratio is 8%. The Company exceeded these requirements as of December 31, 2010.
Pursuant to Section 171 of the Dodd-Frank Act (more commonly known as the "Collins Amendment"), the capital requirements generally applicable to insured depository institutions will serve as a floor for any capital requirements the Federal Reserve may establish for the Company as a bank holding company. As a result, hybrid securities, including trust preferred securities, issued on or after May 19, 2010 are not eligible to be included in Tier 1 capital and instead may be included only in Tier 2 capital. The Company has not issued any trust preferred securities since May 19, 2010. However, as the Company had total consolidated assets of less than $15 billion as of December 31, 2009, its hybrid securities, including its trust preferred securities, issued before May 19, 2010 will remain eligible to be included in Tier 1 capital to the same extent as before the enactment of the Collins Amendment. The Collins Amendment also specifies that the Federal Reserve may not establish risk-based capital requirements for bank holding companies that are quantitatively lower than the risk-based capital requirements in effect for insured depository institutions as of July 21, 2010.
In addition to the risk-based capital requirements, the Federal Reserve requires top-rated bank holding companies to maintain a minimum leverage capital ratio of Tier 1 capital (defined by reference to the risk-based capital guidelines) to its average total consolidated assets of at least 3.0%. For most other bank holding companies (including the Company), the minimum leverage ratio is 4.0%. Bank holding companies with supervisory, financial, operational or managerial weaknesses, as well as bank holding companies that are anticipating or experiencing significant growth, are expected to maintain capital ratios well above the minimum levels. The Company exceeded this requirement as of December 31, 2010.
Pursuant to the Collins Amendment, as with the risk-based capital requirements discussed above, the leverage capital requirements generally applicable to insured depository institutions will serve as a floor for any leverage capital requirements the Federal Reserve may establish for bank holding companies, such as the Company. The Collins Amendment also specifies that the Federal Reserve may not establish leverage capital requirements for bank holding companies that are quantitatively lower than the leverage capital requirements in effect for insured depository institutions as of July 21, 2010.
The FDIC has promulgated regulations and adopted a statement of policy regarding the capital adequacy of state-chartered banks, which, like Danversbank, are not members of the Federal Reserve System. These requirements are substantially similar to those adopted by the Federal Reserve regarding bank holding companies, as described above. Moreover, the FDIC has promulgated corresponding regulations to implement the system of prompt corrective action established by Section 38 of the Federal Deposit Insurance Act ("FDIA"). Under the regulations, a bank is "well capitalized"
29
if it has: (1) a total risk-based capital ratio of 10.0% or greater; (2) a Tier 1 risk-based capital ratio of 6.0% or greater; (3) a leverage ratio of 5.0% or greater; and (4) is not subject to any written agreement, order, capital directive or prompt corrective action directive to meet and maintain a specific capital level for any capital measure. A bank is "adequately capitalized" if it has: (1) a total risk-based capital ratio of 8.0% or greater; (2) a Tier 1 risk-based capital ratio of 4.0% or greater; and (3) a leverage ratio of 4.0% or greater (3.0% under certain circumstances) and does not meet the definition of a "well capitalized bank."
Regulators also must take into consideration: (1) concentrations of credit risk; (2) interest rate risk; and (3) risks from non-traditional activities, as well as an institution's ability to manage those risks, when determining the adequacy of an institution's capital. This evaluation will be made as a part of the institution's regular safety and soundness examination. Danversbank is currently considered well-capitalized under all regulatory definitions.
Generally, a bank, upon receiving notice that it is not adequately capitalized (i.e., that it is "undercapitalized"), becomes subject to the prompt corrective action provisions of Section 38 of FDIA that, for example, (i) restrict payment of capital distributions and management fees, (ii) require that the FDIC monitor the condition of the institution and its efforts to restore its capital, (iii) require submission of a capital restoration plan, (iv) restrict the growth of the institution's assets and (v) require prior regulatory approval of certain expansion proposals. A bank that is required to submit a capital restoration plan must concurrently submit a performance guarantee by each company that controls the bank. A bank that is "critically undercapitalized" (i.e., has a ratio of tangible equity to total assets that is equal to or less than 2.0%) will be subject to further restrictions, and generally will be placed in conservatorship or receivership within 90 days.
The Company has not elected, and does not expect to elect, to calculate its risk-based capital requirements under the Internal-Ratings Based and Advanced Measurement Approaches (commonly referred to as the "advanced approaches" or "Basel II") proposed by the Basel Committee on Banking Supervision (the "Basel Committee"), as implemented in the U.S. by the federal banking agencies. In connection with Basel II, the federal banking agencies also issued, in 2008, a joint notice of proposed rulemaking that sought comment on implementation in the United States of certain aspects of the "standardized approach" of the international Basel II Accord (the "Standardized Approach Proposal"). However, the federal banking agencies have delayed finalizing the Standardized Approach Proposal until they can determine how best to eliminate its reliance on credit ratings, as required by Section 939A of the Dodd-Frank Act. Regardless, the Company does not currently expect to calculate its capital ratios in accordance with the Standardized Approach Proposal.
In response to the recent financial crisis, the Basel Committee released additional recommended revisions to existing capital rules throughout the world. These proposed revisions are intended to protect financial stability and promote sustainable economic growth by setting out higher and better capital requirements, better risk coverage, the introduction of a global leverage ratio, measures to promote the build up of capital that can be drawn down in periods of stress, and the introduction of two global liquidity standards (collectively, "Basel III"). The Federal Reserve has not yet adopted Basel III, and there remains considerable uncertainty regarding the timing for adoption and implementation of Basel III in the United States. If and when the Federal Reserve does implement Basel III, it may be with some modifications or adjustments. Accordingly, the Company is not yet in a position to determine the effect of Basel III on its capital requirements.
Massachusetts Bank Regulation
General. As a Massachusetts-chartered stock savings bank, Danversbank is subject to supervision, regulation and examination by the Massachusetts Commissioner of Banks and to various Massachusetts statutes and regulations which govern, among other things, investment powers, lending and
30
deposit-taking activities, borrowings, maintenance of retained earnings and reserve accounts, distribution of earnings and payment of dividends. In addition, Danversbank is subject to Massachusetts consumer protection and civil rights laws and regulations. The approval of the Massachusetts Commissioner of Banks or the Massachusetts Board of Bank Incorporation (the "BBI") is required for a Massachusetts-chartered bank to establish or close branches, merge with other financial institutions, organize a holding company, issue stock and undertake certain other activities.
In response to Massachusetts laws enacted in the last few years, the Massachusetts Commissioner of Banks adopted rules that generally allow Massachusetts banks to engage in activities permissible for federally chartered banks or banks chartered by another state. The Commissioner also has adopted procedures reducing regulatory burdens and expense and expediting branching by well-capitalized and well-managed banks that have "satisfactory" or higher Community Reinvestment Act ("CRA") records.
Investment Activities. In general, Massachusetts-chartered savings banks may invest in preferred and common stock of any corporation organized under the laws of the United States or any state provided such investments do not involve control of any corporation and do not, in the aggregate, exceed 4.0% of the bank's deposits. Massachusetts-chartered savings banks may in addition invest an amount equal to 1.0% of their deposits in equity securities of Massachusetts corporations or companies with substantial employment in Massachusetts, which have pledged to the Massachusetts Commissioner of Banks that such monies will be used for further development within the Commonwealth. However, these powers are constrained by federal law. See "Business—Regulation and Supervision—Federal Bank Regulation—Investment Activities" on page 32 for federal restrictions on equity investments.
Loans-to-One-Borrower Limitations. Massachusetts banking law grants broad lending authority. However, with certain limited exceptions, total obligations of one borrower to a bank may not exceed 20.0% of the total of the bank's capital stock, surplus and undivided profits.
Loans to a Bank's Insiders. The Massachusetts banking laws prohibit any executive officer, director or trustee from borrowing from, otherwise becoming indebted to, or becoming liable for a loan or other extension of credit by such bank to any other person, except for any of the following loans or extensions of credit: (i) loans or extension of credit, secured or unsecured, to an officer of the bank in an amount not exceeding $100,000; (ii) loans or extensions of credit intended or secured for educational purposes to an officer of the bank in an amount not exceeding $200,000; (iii) loans or extensions of credit secured by a mortgage on residential real estate to be occupied in whole or in part by the officer to whom the loan or extension of credit is made, in an amount not exceeding $750,000; and (iv) loans or extensions of credit to a director or trustee of the bank who is not also an officer of the bank in an amount permissible under the bank's loan to one borrower limit.
The loans listed above require the prior approval of the majority of the members of Danversbank's board of directors, excluding any member involved in the loan or extension of credit. No such loan or extension of credit may be granted with an interest rate or other terms that are preferential in comparison to loans granted to persons not affiliated with the savings bank.
Bank Dividends. A Massachusetts stock bank may declare from net profits cash dividends not more frequently than quarterly and non-cash dividends at any time. No dividends may be declared, credited or paid if the bank's capital stock is impaired. The approval of the Massachusetts Commissioner of Banks is required if the total of all dividends declared in any calendar year exceeds the total of its net profits for that year combined with its retained net profits of the preceding two years. Net profits for this purpose means the remainder of all earnings from current operations plus actual recoveries on loans and investments and other assets after deducting from the total thereof all current operating expenses, actual losses, accrued dividends on preferred stock, if any, and all federal and state taxes.
31
Regulatory Enforcement Authority. Any Massachusetts bank that does not operate in accordance with the regulations, policies and directives of the Massachusetts Commissioner of Banks may be subject to sanctions for non-compliance, including seizure of the property and business of the bank and suspension or revocation of its charter. The Massachusetts Commissioner of Banks may under certain circumstances suspend or remove officers or directors who have violated the law, conducted the bank's business in a manner which is unsafe, unsound or contrary to the depositors' interests or been negligent in the performance of their duties. In addition, upon finding that a bank has engaged in an unfair or deceptive act or practice, the Massachusetts Commissioner of Banks may issue an order to cease and desist and impose a fine on the bank concerned. Finally, Massachusetts consumer protection and civil rights statutes applicable to Danversbank permit private individual and class action law suits and provide for the rescission of consumer transactions, including loans, and the recovery of statutory and punitive damage and attorney's fees in the case of certain violations of those statutes.
Depositors Insurance Fund. Massachusetts-chartered savings banks are required to be members of the Depositors Insurance Fund, a corporation that insures savings bank deposits in excess of federal deposit insurance coverage, unless the deposits of a savings bank represent too large a portion of the total deposits insured by the Depositors Insurance Fund. Danversbank is a member of the Depositors Insurance Fund. The Depositors Insurance Fund is authorized to charge savings banks an annual assessment based on a savings bank's deposit balances in excess of amounts insured by the FDIC. The Depositors Insurance Fund is not affiliated with the Deposit Insurance Fund operated by the FDIC.
In many cases, Massachusetts has similar statutes to those under federal law that are applicable to Danversbank, certain of which are described below.
Federal Bank Regulation
Standards for Safety and Soundness. As required by statute, the federal banking agencies adopted final regulations and Interagency Guidelines Establishing Standards for Safety and Soundness to implement safety and soundness standards. The guidelines set forth the safety and soundness standards that the federal banking agencies use to identify and address problems at insured depository institutions before capital becomes impaired. The guidelines address internal controls and information systems, internal audit systems, credit underwriting, loan documentation, interest rate exposure, asset growth, asset quality, earnings and compensation, fees and benefits and customer information security. If the appropriate federal banking agency determines that an institution fails to meet any standard prescribed by the guidelines, the agency may require the institution to submit to the agency an acceptable plan to achieve compliance with the standard.
FDIC Restrictions on Bank Dividends. The FDIC has the authority to use its enforcement powers to prohibit a bank from paying dividends if, in its opinion, the payment of dividends would constitute an unsafe or unsound practice. Federal law also prohibits the payment of dividends by a bank that will result in the bank failing to meet its applicable capital requirements on a pro forma basis.
Investment Activities. Since the enactment of the FDIC Improvement Act, all state-chartered FDIC-insured banks, including savings banks, have generally been limited in their investment activities to principal and equity investments of the type and in the amount authorized for national banks, notwithstanding state law. The FDIC Improvement Act and the FDIC regulations permit exceptions to these limitations. For example, state chartered banks may, with FDIC approval, continue to exercise state authority to invest in common or preferred stocks listed on a national securities exchange or the NASDAQ Global Select Market and in the shares of an investment company registered under the Investment Company Act of 1940, as amended. The maximum permissible investment is 100.0% of Tier 1 Capital, as specified by the FDIC's regulations, or the maximum amount permitted by Massachusetts law, whichever is less. Danversbank received approval from the FDIC to retain and acquire such equity instruments equal to the lesser of 100.0% of Danversbank's Tier 1 capital or the
32
maximum permissible amount specified by Massachusetts law. Any such grandfathered authority may be terminated upon the FDIC's determination that such investments pose a safety and soundness risk or upon the occurrence of certain events such as the savings bank's conversion to a different charter. In addition, the FDIC is authorized to permit such institutions to engage in state authorized activities or investments not permissible for national banks (other than non-subsidiary equity investments) if they meet all applicable capital requirements and it is determined that such activities or investments do not pose a significant risk to the FDIC's Deposit Insurance Fund. The FDIC has adopted regulations governing the procedures for institutions seeking approval to engage in such activities or investments. The Gramm-Leach-Bliley Act of 1999 specifies that a non-member bank may control a subsidiary that engages in activities as principal that would only be permitted for a national bank to conduct in a "financial subsidiary" if a bank meets specified conditions and deducts its investment in the subsidiary for regulatory capital purposes.
Interstate Banking and Branching. The Riegle-Neal Interstate Banking and Branching Efficiency Act of 1994, or the Interstate Banking Act, and the Dodd-Frank Act permit well capitalized and well managed bank holding companies or banks to acquire banks in any state subject to specified concentration limits and other conditions. The Dodd-Frank Act authorizes a state-chartered bank, such as Danversbank, to establish new branches on an interstate basis to the same extent a bank chartered by the host state may establish branches.
Transaction with Affiliates.. Transactions between banks and their affiliates are governed by Sections 23A and 23B of the Federal Reserve Act and their implementing Regulation W. An affiliate of a bank is any company or entity that controls, is controlled by or is under common control with the bank. In a holding company context, the parent bank holding company and any companies which are controlled by such parent holding company are generally affiliates of the bank. The Dodd-Frank Act amended the definition of affiliate to include an investment fund for which the depository institution or one of its affiliates is an investment adviser. Sections 23A and 23B of the Federal Reserve Act and Regulation W (i) limit the extent to which the bank or its subsidiaries may engage in "covered transactions" with any one affiliate to an amount equal to 10.0% of such institution's capital stock and retained earnings, and contain an aggregate limit on "covered transactions" with all affiliates to an amount equal to 20.0% of such institution's capital stock and retained earnings and (ii) require that all affiliated transactions be on terms substantially the same, or at least as favorable, to the institution or subsidiary as those provided to a non-affiliate. The term "covered transaction" includes a loan or extension of credit to an affiliate, a purchase of or investment in securities issued by an affiliate, a purchase of assets from an affiliate unless exempted by the Federal Reserve, the acceptance of securities issued by an affiliate as collateral for a loan or extension of credit to any person or company, or the issuance of a guarantee, acceptance, or letter of credit on behalf of an affiliate, securities borrowing or lending transactions with an affiliate that creates a credit exposure to such affiliate, or a derivatives transaction with an affiliate that creates a credit exposure to such affiliate. In addition, loans or other extensions of credit by the financial institution to the affiliate are required to be collateralized in accordance with the requirements set forth in Section 23A of the Federal Reserve Act.
The Gramm-Leach-Bliley Act amended several provisions of Sections 23A and 23B of the Federal Reserve Act. The amendments provide that so-called "financial subsidiaries" of banks are treated as affiliates for purposes of Sections 23A and 23B of the Federal Reserve Act, but the amendment provides that (i) the 10.0% capital limit on transactions between the bank and such financial subsidiary as an affiliate is not applicable, and (ii) the investment by the bank in the financial subsidiary does not include retained earnings in the financial subsidiary. Certain anti-evasion provisions have been included that relate to the relationship between any financial subsidiary of a bank and sister companies of the bank: (1) any purchase of, or investment in, the securities of a financial subsidiary by any affiliate of the parent bank is considered a purchase or investment by the bank; and (2) if the Federal Reserve determines that such treatment is necessary, any loan made by an affiliate of the parent bank to the financial subsidiary is to be considered a loan made by the parent bank. Danversbank has no financial subsidiaries.
33
The Sarbanes-Oxley Act of 2002 generally prohibits loans by a company to its executive officers and directors. However, the law contains a specific exception for loans by a depository institution to its executive officers and directors in compliance with federal banking laws. Under such laws, Danversbank's authority to extend credit to executive officers, directors and 10% shareholders ("insiders") of the Company and Danversbank, as well as entities such persons control, is limited. The law limits both the individual and aggregate amount of loans Danversbank may make to insiders based, in part, on Danversbank's capital position and requires certain board approval procedures to be followed. Such loans are required to be made on terms substantially the same as those offered to unaffiliated individuals and not involve more than the normal risk of repayment. There is an exception for loans made pursuant to a benefit or compensation program that is widely available to all employees of the institution and does not give preference to insiders over other employees. Loans to executive officers are further limited by specific categories. Additionally, the Dodd-Frank Act requires that asset sale transactions with insiders be on market terms, and if the transaction represents more than 10% of the capital and surplus of the bank, be approved by a majority of the disinterested directors of the bank. Danversbank must also comply with Massachusetts banking laws regarding loans to insiders. See "Business—Regulation and Supervision—Massachusetts Bank Regulation—Loans to a Bank's Insiders" on page 31.
Enforcement. The FDIC has extensive enforcement authority over insured state savings banks, including Danversbank. This enforcement authority includes, among other things, the ability to assess civil money penalties, issue cease and desist orders and remove directors and officers. In general, these enforcement actions may be initiated in response to violations of laws and regulations and unsafe or unsound practices. The FDIC has authority under federal law to appoint a conservator or receiver for an insured bank under limited circumstances. The FDIC is required, with certain exceptions, to appoint a receiver or conservator for an insured state non-member bank if that bank was "critically undercapitalized" on average during the calendar quarter beginning 270 days after the date on which the institution became "critically undercapitalized." The FDIC may also appoint itself as conservator or receiver for an insured state non-member institution under specific circumstances on the basis of the institution's financial condition or upon the occurrence of other events, including: (1) insolvency; (2) substantial dissipation of assets or earnings through violations of law or unsafe or unsound practices; (3) existence of an unsafe or unsound condition to transact business; and (4) insufficient capital, or the incurring of losses that will deplete substantially all of the institution's capital with no reasonable prospect of replenishment without federal assistance.
FDIC Insurance Premiums. In February 2011, the FDIC adopted a final rule making certain changes to the deposit insurance assessment system, many of which were made as a result of provisions of the Dodd-Frank Act. The final rule also revises the assessment rate schedule effective April 1, 2011, and adopts additional rate schedules that will go into effect when the DIF reserve ratio reaches various milestones. The final rule changes the deposit insurance assessment system from one that is based on domestic deposits to one that is based on average consolidated total assets minus average tangible equity. In addition, the rule suspends FDIC dividend payments if the DIF reserve ratio exceeds 1.5 percent but provides for decreasing assessment rates when the DIF reserve ratio reaches certain thresholds. Danversbank is unable to predict the effect of the changes to the calculation of its deposit insurance assessment, but expects that its aggregate FDIC-deposit insurance premium payable June 30, 2011 will be higher than its December 31, 2010 payment.
In November 2009, the FDIC issued a final rule that mandated that insured depository institutions prepay their quarterly risk-based assessments to the FDIC for the fourth quarter of 2009 and for all of 2010, 2011, and 2012 on December 30, 2009. Each institution, including Danversbank, recorded the entire amount of its prepayment as an asset (a prepaid expense). The prepaid assessments bear a zero-percent risk weight for risk-based capital purposes. The prepaid assessment base for Danversbank was calculated using its third quarter 2009 assessment rate (using its CAMELS rating on that date).
34
That assessment base is adjusted quarterly with an estimated 5 percent annual growth in the assessment base through the end of 2012. The prepaid assessment rate for the fourth quarter of 2009 and for 2010 was based on Danversbank's base assessment rate for the third quarter of 2009, adjusted as if the assessment rate in effect on September 30, 2009 had been in effect for the entire third quarter. Further, the prepaid assessment rate for 2011 and 2012 is equal to the adjusted third quarter 2009 total base assessment rate plus 3 basis points. As of December 31, 2009, and each quarter thereafter, Danversbank recorded and will record an expense for its regular quarterly assessment for the quarter and a corresponding credit to the prepaid assessment subject to quarterly adjustments. The FDIC will not refund or collect additional prepaid assessments because of a decrease or growth in deposits over the next three years. However, should the prepaid assessment not be exhausted after collection of the amount due on June 30, 2013, the remaining amount of the prepayment will be returned to Danversbank. The timing of any refund of the prepaid assessment will not be affected by the change in the deposit insurance assessment calculation discussed above.
In 2008, the level of FDIC deposit insurance was temporarily increased from $100,000 to $250,000 per depositor and this level of insurance was made permanent under the Dodd-Frank Act. Additionally, the Dodd-Frank Act provides temporary unlimited deposit insurance coverage for noninterest-bearing transactions accounts beginning December 31, 2010, and ending December 31, 2012. This replaced the FDIC's Transaction Account Guarantee Program, which expired on December 31, 2010.
The FDIC may terminate insurance of deposits if it finds that the institution is in an unsafe or unsound condition to continue operations, has engaged in unsafe or unsound practices, or has violated any applicable law, regulation, rule, order or condition imposed by the FDIC. If an institution becomes undercapitalized, the FDIC will prohibit it from accepting certain employee benefit plan deposits. The management of Danversbank does not know of any practice, condition or violation that might lead to termination of Danversbank's deposit insurance.
Insured institutions are also required to assist in the repayment of bonds issued by the Financing Corporation in the late 1980s to capitalize the Federal Savings and Loan Insurance Corporation.
Privacy Regulations. Pursuant to the Gramm-Leach-Bliley Act, the FDIC has published regulations implementing the privacy protection provisions of the Gramm-Leach-Bliley Act. The regulations generally require that Danversbank disclose its privacy policy, including identifying with whom it shares a customer's "non-public personal information," to customers at the time of establishing the customer relationship and annually thereafter. In addition, Danversbank is required to provide its customers with the ability to "opt-out" of having their personal information shared with unaffiliated third parties and not to disclose account numbers or access codes to non-affiliated third parties for marketing purposes. Danversbank currently has a privacy protection policy in place and believes that such policy is in compliance with the regulations.
Customer Information Security. The FDIC and other bank regulatory agencies have adopted guidelines for establishing standards for safeguarding nonpublic personal information about customers that implement provisions of the Gramm-Leach Bliley Act ("Information Security Guidelines"). Among other things, the Information Security Guidelines require each financial institution, under the supervision and ongoing oversight of its board of directors or an appropriate committee thereof, to develop, implement and maintain a comprehensive written information security program designed to ensure the security and confidentiality of customer information, to protect against any anticipated threats or hazards to the security or integrity of such information; and to protect against unauthorized access to or use of such information that could result in substantial harm or inconvenience to any customer. The FDIC and other bank regulatory agencies have issued further guidance for the establishment of these Information Security Guidelines, requiring financial institutions to develop and implement response programs designed to address incidents of unauthorized access to sensitive customer information maintained by the financial institution or its service provider, including customer
35
notification procedures. Danversbank currently has Information Security Guidelines in place and believes that such guidelines are in compliance with the guidelines. Most of the states have enacted legislation concerning breaches of data security and Congress continues to consider federal legislation that would require consumer notice of data security breaches. In addition, Massachusetts has promulgated data security regulations, that became effective March 1, 2010, with respect to personal information of Massachusetts residents.
Identity Theft Red Flags. The federal banking agencies jointly issued final rules and guidelines in 2007 implementing section 114 of the Fair and Accurate Credit Transactions Act of 2003 ("FACT Act") and final rules implementing section 315 of the FACT Act. The rules implementing section 114 require each financial institution or creditor to develop and implement a written Identity Theft Prevention Program (the "Program") to detect, prevent, and mitigate identity theft in connection with the opening of certain accounts or certain existing accounts. In addition, the federal banking agencies issued guidelines to assist financial institutions and creditors in the formulation and maintenance of a Program that satisfies the requirements of the rules. The rules implementing section 114 also require credit and debit card issuers to assess the validity of notifications of changes of address under certain circumstances. Additionally, the federal banking agencies issued joint rules that became effective in 2008, under section 315 that provide guidance regarding reasonable policies and procedures that a user of consumer reports must employ when a consumer reporting agency sends the user a notice of address discrepancy.
Community Reinvestment Act. Under the Community Reinvestment Act, or CRA, as amended and as implemented by FDIC regulations, a bank has a continuing and affirmative obligation, consistent with its safe and sound operation, to help meet the credit needs of its entire community, including low and moderate income neighborhoods. The CRA does not establish specific lending requirements or programs for financial institutions nor does it limit an institution's discretion to develop the types of products and services that it believes are best suited to its particular community, consistent with the CRA. The CRA does require the FDIC, in connection with its examination of a bank, to assess the institution's record of meeting the credit needs of its community and to take such record into account in its evaluation of certain applications by such institution, including applications to acquire branches and other financial institutions. The CRA requires the FDIC to provide a written evaluation of an institution's CRA performance utilizing a four-tiered descriptive rating system. Danversbank's latest FDIC CRA rating was "Satisfactory."
Massachusetts has its own statutory counterpart to the CRA, which is also applicable to Danversbank. The Massachusetts version is generally similar to the CRA but utilizes a five-tiered descriptive rating system. Massachusetts law requires the Massachusetts Commissioner of Banks to consider, but not be limited to, a bank's record of performance under Massachusetts law in considering any application by the bank to establish a branch or other deposit-taking facility, to relocate an office or to merge or consolidate with or acquire the assets and assume the liabilities of banking institution. Danversbank's most recent rating under Massachusetts law was "Highly Satisfactory."
Consumer Protection and Fair Lending Regulations. Massachusetts savings banks are subject to a variety of federal and Massachusetts statutes and regulations that are intended to protect consumers and prohibit discrimination in the granting of credit. These statutes and regulations provide for a range of sanctions for non-compliance with their terms, including imposition of administrative fines and remedial orders, and referral to the Attorney General for prosecution of a civil action for actual and punitive damages and injunctive relief. Certain of these statutes authorize private individual and class action lawsuits and the award of actual, statutory and punitive damages and attorneys' fees for certain types of violations.
Further, as noted above, the Dodd-Frank Act established the CFPB, which has responsibility for making rules and regulations under the federal consumer protection laws relating to financial products
36
and services. The CFPB also has a broad mandate to prohibit unfair or deceptive acts and practices and is specifically empowered to require certain disclosures to consumers and draft model disclosure forms. Failure to comply with consumer protection laws and regulations can subject financial institutions to enforcement actions, fines and other penalties. The FDIC will enforce CFPB rules with respect to Danversbank.
Interchange Fees. Pursuant to the Dodd-Frank Act, the Federal Reserve has issued a proposed rule governing the interchange fees charged on debit cards. The proposed rule would cap the fee a bank could charge on a debit card transaction and shifts such interchange fees from a percentage of the transaction amount to a per transaction fee. Although the proposed rule does not directly apply to institutions with less than $10 billion in assets, market forces may result in debit card issuers of all sizes adopting fees that comply with this rule. If adopted by Danversbank, the proposed rule would result in a significant decrease in the fee income Danversbank earns from debit cards.
Mortgage Reform. The Dodd-Frank Act prescribes certain standards that mortgage lenders must consider before making a residential mortgage loan, including verifying a borrower's ability to repay such mortgage loan. The Dodd-Frank Act also allows borrowers to assert violations of certain provisions of the Truth-in-Lending Act as a defense to foreclosure proceedings. Under the Dodd-Frank Act, prepayment penalties are prohibited for certain mortgage transactions and creditors are prohibited from financing insurance policies in connection with a residential mortgage loan or home equity line of credit. The Dodd-Frank Act requires mortgage lenders to make additional disclosures prior to the extension of credit, in each billing statement and for negative amortization loans and hybrid adjustable rate mortgages.
Anti-Money Laundering Laws. Under the Bank Secrecy Act ("BSA"), a financial institution is required to have systems in place to detect certain transactions, based on the size and nature of the transaction. Financial institutions are generally required to report to the United States Treasury any cash transactions involving more than $10,000. In addition, financial institutions are required to file suspicious activity reports for transactions that involve more than $5,000 and which the financial institution knows, suspects or has reason to suspect involves illegal funds, is designed to evade the requirements of the BSA or has no lawful purpose. The Uniting and Strengthening America by Providing Appropriate Tools Required to Intercept and Obstruct Terrorism Act of 2001 (the "PATRIOT Act"), which amended the BSA, is designed to deny terrorists and others the ability to obtain anonymous access to the U.S. financial system. The PATRIOT Act has significant implications for financial institutions and businesses of other types involved in the transfer of money. The PATRIOT Act, together with the implementing regulations of various federal regulatory agencies, has caused financial institutions, such as Danversbank, to adopt and implement additional policies or amend existing policies and procedures with respect to, among other things, anti-money laundering compliance, suspicious activity, currency transaction reporting, customer identity verification and customer risk analysis. In evaluating an application under Section 3 of the BHCA to acquire a bank or an application under the Bank Merger Act to merge banks or affect a purchase of assets and assumption of deposits and other liabilities, the applicable federal banking regulator must consider the anti-money laundering compliance record of both the applicant and the target.
OFAC. The United States has imposed economic sanctions that affect transactions with designated foreign countries, nationals and others. These sanctions, which are administered by the Treasury Office of Foreign Assets Control ("OFAC"), take many different forms. Generally, however, they contain one or more of the following elements: (i) restrictions on trade with or investment in a sanctioned country, including prohibitions against direct or indirect imports from and exports to a sanctioned country and prohibitions on "U.S. persons" engaging in financial transactions relating to making investments in, or providing investment-related advice or assistance to, a sanctioned country; and (ii) a blocking of assets in which the government or specially designated nationals of the sanctioned
37
country have an interest, by prohibiting transfers of property subject to U.S. jurisdiction (including property in the possession or control of U.S. persons). Blocked assets (for example, property and bank deposits) cannot be paid out, withdrawn, set off or transferred in any manner without a license from OFAC. Failure to comply with these sanctions could have serious legal and reputational consequences for Danversbank.
Other Regulations
Interest and other charges collected or contracted for by Danversbank are subject to state usury laws and federal laws concerning interest rates. Danversbank's loan operations are also subject to state and federal laws applicable to credit transactions, including, but not limited to the following:
- •
- Home Mortgage Disclosure Act of 1975, requiring financial institutions to provide information to enable the public and
public officials to determine whether a financial institution is fulfilling its obligation to help to meet the housing needs of the community it serves;
- •
- Equal Credit Opportunity Act, prohibiting discrimination on the basis of race, creed or other prohibited factors in
extending credit;
- •
- Fair Credit Reporting Act of 1978, governing the use and provision of information to credit reporting agencies;
- •
- Massachusetts Debt Collection Regulations, establishing standards, by defining unfair or deceptive acts or practices, for
the collection of debts from persons within the Commonwealth of Massachusetts;
- •
- General Laws of Massachusetts, Chapter 167E, which governs Danversbank's lending powers;
- •
- General Laws of Massachusetts, Chapter 167G, which governs Danversbank's trust powers; and
- •
- Rules and regulations of the various federal and state agencies charged with the responsibility of implementing such federal and state laws.
The deposit operations of Danversbank also are subject to, among other laws, the:
- •
- Right to Financial Privacy Act, which imposes a duty to maintain confidentiality of consumer financial records and
prescribes procedures for complying with administrative subpoenas of financial records;
- •
- Electronic Fund Transfer Act and Regulation E promulgated thereunder, as well as Chapter 167B of the General
Laws of Massachusetts, which govern deposits to and withdrawals from deposit accounts and customers' rights and liabilities arising from the use of automated teller machines and other electronic
banking services;
- •
- Check Clearing for the 21st Century Act (also known as "Check 21"), which gives "substitute checks," such as
digital check images and copies made from that image, the same legal standing as the original paper check;
- •
- General Laws of Massachusetts, Chapter 167D, which governs Danversbank's deposit powers; and
- •
- Restrictions on brokered deposits pursuant to Section 29 of the FDIA and FDIC regulations for institutions that are less than well capitalized. Depository institutions, other than those in the lowest risk category, that have brokered deposits in excess of 10% of total deposits will be subject to increased FDIC deposit insurance premium assessments. As noted above in "Federal Bank Regulation—FDIC Insurance Premiums" the level of an institution's brokered deposits may affect its deposit insurance premium rate.
38
Federal Reserve System
Federal Reserve regulations require depository institutions to maintain non-interest earning reserves against their transaction accounts (primarily NOW and regular checking accounts). Federal Reserve regulations generally require that reserves be maintained against aggregate transaction accounts as follows: for that portion of transaction accounts aggregating between $10.7 million and $58.8 million (which may be adjusted by the Federal Reserve) the reserve requirement is 3.0%; and for amounts greater than $58.8 million, the reserve requirement is $1,443,000 plus 10.0% (which may be adjusted by the Federal Reserve between 8.0% and 14.0%), of the amount in excess of $58.8 million. The first $10.7 million of otherwise reservable balances (which may be adjusted by the Federal Reserve) are exempted from the reserve requirements. Danversbank is in compliance with these requirements.
Federal Home Loan Bank System
Danversbank is a member of the FHLBB. Each Federal Home Loan Bank serves as a reserve or central bank for its members within its assigned region and is funded primarily from proceeds derived from the sale of consolidated obligations of the FHLB. Danversbank is required to acquire and hold shares of capital stock in the FHLBB. Danversbank was in compliance with this requirement with an investment in stock of the FHLBB at December 31, 2010.
The Federal Home Loan Banks are required to provide funds for certain purposes including the resolution of insolvent thrifts in the late 1980s and to contributing funds for affordable housing programs. These requirements could reduce the amount of dividends that the Federal Home Loan Banks pay to their members and result in the Federal Home Loan Banks imposing a higher rate of interest on advances to their members. If interest on future Federal Home Loan Bank advances increased, a member bank affected by such reduction or increase would likely experience a reduction in its net interest income. Recent legislation has changed the structure of the Federal Home Loan Banks' funding obligations for insolvent thrifts, revised the capital structure of the Federal Home Loan Banks and implemented entirely voluntary membership for Federal Home Loan Banks. Further, there can be no assurance that the impact of recent or future legislation on the Federal Home Loan Banks also will not cause a decrease in the value of the FHLBB stock held by Danversbank. On February 26, 2009, due to deterioration in its financial condition, the FHLBB placed a moratorium on redemption of stock in excess of required levels of ownership and suspended payment of quarterly dividends on its stock. As of December 31, 2010, the redemption moratorium had not been lifted. On February 22, 2011, the FHLBB's Board of Directors reinstated a dividend equal to an annual yield of 0.30 percent, which is the approximate daily average three-month LIBOR yield for the fourth quarter of 2010 that was paid on March 2, 2011. See "Business—Investment Activity—Federal Home Loan Bank Stock" on page 20.
Holding Company Regulation
The Company is subject to examination, regulation, and periodic reporting under the BHCA, as amended, as administered by the Federal Reserve. The Company is required to obtain the prior approval of the Federal Reserve to acquire all, or substantially all, of the assets of any bank or bank holding company. Prior Federal Reserve approval is required for the Company to acquire direct or indirect ownership or control of any voting securities of any bank or bank holding company if, after such acquisition, it would, directly or indirectly, own or control more than 5% of any class of voting shares of the bank or bank holding company. In addition to the approval of the Federal Reserve, before any bank acquisition can be completed, prior approval may also be required to be obtained from other agencies having supervisory jurisdiction over the bank to be acquired.
A bank holding company is generally prohibited from engaging in, or acquiring, direct or indirect control of more than 5% of the voting securities of any company engaged in non-banking activities.
39
One of the principal exceptions to this prohibition is for activities found by the Federal Reserve to be so closely related to banking or managing or controlling banks as to be a proper incident thereto. Some of the principal activities that the Federal Reserve has determined by regulation to be so closely related to banking are: (i) making or servicing loans; (ii) performing certain data processing services; (iii) providing discount brokerage services; (iv) acting as fiduciary, investment or financial advisor; (v) leasing personal or real property; (vi) making investments in corporations or projects designed primarily to promote community welfare; and (vii) acquiring a savings and loan association.
As noted above, the Gramm-Leach-Bliley Act of 1999 authorizes a bank holding company that meets specified conditions, including being "well capitalized" and "well managed," to opt to become a financial holding company and thereby engage in a broader array of financial activities than previously permitted. Such activities can include insurance underwriting and investment banking.
A bank holding company is generally required to give the Federal Reserve prior written notice of any purchase or redemption of then outstanding equity securities if the gross consideration for the purchase or redemption, when combined with the net consideration paid for all such purchases or redemptions during the preceding 12 months, is equal to 10% or more of the company's consolidated net worth. The Federal Reserve may disapprove such a purchase or redemption if it determines that the proposal would constitute an unsafe and unsound practice, or would violate any law, regulation, Federal Reserve order or directive, or any condition imposed by, or written agreement with, the Federal Reserve. The Federal Reserve has adopted an exception to this approval requirement for well-capitalized bank holding companies that meet certain other conditions.
The Federal Reserve has issued a policy statement regarding the payment of dividends by bank holding companies. In general, the Federal Reserve's policies provide that dividends should be paid only out of current earnings and only if the prospective rate of earnings retention by the bank holding company appears consistent with the organization's capital needs, asset quality and overall financial condition. Under the Dodd-Frank Act, the Company is required to serve as a source of financial strength for Danversbank in the event Danversbank enters a state of financial distress. This provision codifies the longstanding policy of the Federal Reserve. The federal banking agencies must still issue regulations to implement the source of strength provisions of the Dodd-Frank Act. Under the prompt corrective action laws, the ability of a bank holding company to pay dividends may be restricted if a subsidiary bank becomes undercapitalized. These regulatory policies could affect the ability of the Company to pay dividends or otherwise engage in capital distributions.
Under the Federal Deposit Insurance Act, depository institutions are liable to the FDIC for losses suffered or anticipated by the FDIC in connection with the default of a commonly controlled depository institution or any assistance provided by the FDIC to such an institution in danger of default. This law would have potential applicability if the Company ever held as a separate subsidiary a depository institution in addition to Danversbank.
The Company and Danversbank will be affected by the monetary and fiscal policies of various agencies of the United States Government, including the Federal Reserve System. In view of changing conditions in the national economy and in the money markets, it is impossible for management to accurately predict future changes in monetary policy or the effect of such changes on the business or financial condition of the Company or Danversbank.
The status of the Company as a registered bank holding company under the BHCA will not exempt it from certain federal and state laws and regulations applicable to corporations generally, including, without limitation, certain provisions of the federal securities laws.
40
Massachusetts Holding Company Regulation. Under the Massachusetts banking laws, a company owning or controlling two or more banking institutions, including a savings bank, is regulated as a bank holding company. The term "company" is defined by the Massachusetts banking laws similarly to the definition of "company" under the BHCA. Each Massachusetts bank holding company: (i) must obtain the approval of the BBI before engaging in certain transactions, such as the acquisition of more than 5% of the voting stock of another banking institution; (ii) must register, and file reports, with the Division; and (iii) is subject to examination by the Division. The Company would become a Massachusetts bank holding company if it acquires a second banking institution and holds and operates it separately from Danversbank.
Federal Securities Laws. Our common stock is registered with the Securities and Exchange Commission (the "SEC") under Section 12(b) of the Securities Exchange Act of 1934, as amended (the "Exchange Act"). We are subject to information, proxy solicitation, insider trading restrictions, and other requirements under the Exchange Act.
The Sarbanes-Oxley Act. The Sarbanes-Oxley Act of 2002 addresses, among other issues, corporate governance, auditing and accounting, executive compensation, and enhanced and timely disclosure of corporate information. As directed by the Sarbanes-Oxley Act of 2002, the Company's principal executive officer and principal financial officer each is required to certify that the Company's quarterly and annual reports do not contain any untrue statement of a material fact. The rules adopted by the SEC under the Sarbanes-Oxley Act of 2002 have several requirements, including having these officers certify that: they are responsible for establishing, maintaining and regularly evaluating the effectiveness of our internal controls; they have made certain disclosures to our auditors and the Audit Committee of the board of directors about our internal controls; and they have included information in our quarterly and annual reports about their evaluation and whether there have been significant changes in our internal controls or in other factors that could significantly affect internal controls. The Company will be subject to further reporting and audit requirements under rules proposed by the SEC. The Company will prepare policies, procedures and systems designed to comply with these regulations to ensure compliance with these regulations.
The Company's Internet address is www.danversbank.com. The Company makes available on or through its Internet website, without charge, its annual reports on Form 10-K, quarterly reports on Form 10-Q, and current reports on Form 8-K and amendments to those reports filed or furnished pursuant to Section 13(a) or 15(d) of the Exchange Act, as amended, as soon as reasonably practicable after such reports are electronically filed with, or furnished to, the SEC. The Company's reports filed with, or furnished to, the SEC are also available at the SEC's website at www.sec.gov. Information on our website is not incorporated by reference into this document and should not be considered part of this Report.
Our operations involve various risks that could have adverse consequences, including those described below. You should refer to our discussion of the qualifications and limitations on forward-looking statements on page 3.
41
Risks Related to the Merger With People's United
Failure to Complete the Merger Could Negatively Impact the Stock Prices and Future Business and Financial Results of Danvers.
If the merger is not completed, our ongoing business may be adversely affected and we will be subject to several risks, including the following:
- •
- we may be required, under certain circumstances, to pay People's United a termination fee of $19,725,000 under the merger
agreement;
- •
- we will be required to pay certain costs relating to the merger, whether or not the merger is completed, such as legal,
accounting, financial advisor and printing fees;
- •
- under the merger agreement, we are subject to certain restrictions on the conduct of its business prior to completing the
merger which may adversely affect its ability to execute certain of its business strategies; and
- •
- matters relating to the merger may require substantial commitments of time and resources by our management, which could otherwise have been devoted to other opportunities that may have been beneficial to us as independent company, as the case may be.
In addition, if the merger is not completed, we may experience negative reactions from the financial markets and from our customers and employees. We also could be subject to litigation related to any failure to complete the merger or to enforcement proceedings commenced against People's United or Danvers to perform their respective obligations under the merger agreement. If the merger is not completed, we cannot assure you that the risks described above will not materialize and will not materially affect our business, financial results and stock price.
The Merger Agreement May Be Terminated in Accordance With Its Terms and the Merger May Not Be Completed.
The merger agreement is subject to a number of conditions which must be fulfilled in order to complete the merger. Those conditions include: adoption of the merger agreement by our stockholders, regulatory approvals, absence of orders prohibiting the completion of the merger, effectiveness of the registration statement of which this proxy statement/prospectus is a part, the continued accuracy of the representations and warranties by both parties and the performance by both parties of their covenants and agreements, and the receipt by both parties of legal opinions from their respective tax counsels.
In addition, we may choose to terminate the merger agreement if the average closing price of People's United common stock during the five trading day period ending on the trading day immediately preceding the date of receipt of all required regulatory approvals is less than $11.33 and People's United common stock underperforms a specified peer-group index by more than 20%. Any such termination would be subject to the right of People's United to increase the amount of People's United common stock to be provided to our stockholders pursuant to the formula prescribed in the merger agreement.
Lawsuits Challenging the Merger Have Been Filed Against Danvers, the Danvers Board of Directors and People's United, and an Adverse Judgment in Such Lawsuits or Any Future Similar Lawsuits May Prevent the Merger from Becoming Effective or from Becoming Effective Within the Expected Timeframe.
Danvers, the Danvers board of directors and People's United are named as defendants in three purported class action lawsuits, two in the Court of Chancery in the State of Delaware and one in the Superior Court of the Commonwealth of Massachusetts, challenging the proposed merger and seeking, among other things, to enjoin the defendants from completing the merger on the agreed-upon terms and rescission of the merger to the extent it has been completed.
42
One of the conditions to the closing of the merger is that no order, injunction or decree or other order (whether temporary or permanent) that prohibits the completion of the merger be in effect. If any plaintiff were successful in obtaining an injunction prohibiting the Danvers or People's United defendants from completing the merger on the agreed upon terms, then such injunction may prevent the merger from becoming effective or from becoming effective within the expected timeframe.
The Merger Agreement Limits Our Ability to Pursue Alternatives to the Merger.
The merger agreement contains provisions that make it more difficult for us to sell our business to a party other than People's United. These provisions include a general prohibition on our solicitation of any acquisition proposal or offer for a competing transaction, the requirement that we pay a termination fee of $19,725,000 if the merger agreement is terminated in specified circumstances and the requirement that we submit the adoption of the merger agreement to a vote of our stockholders even if our board of directors changes its recommendation in favor of the approval of the merger agreement in a manner adverse to People's United.
These provisions might discourage a third party that might have an interest in acquiring all or a significant part of Danvers from considering or proposing that acquisition, even if that party were prepared to pay consideration with a higher per share value than the current proposed merger consideration. Furthermore, a potential competing acquiror may propose to pay a lower per share price to our stockholders than it might otherwise have proposed to pay because of our obligation, in connection with termination of the merger agreement under certain circumstances, to pay People's United a $19,725,000 termination fee.
Our Directors and Executive Officers Have Financial Interests in the Merger That May Be Different From, or in Addition to, the Interests of Our Stockholders.
In considering the information contained in this proxy statement/prospectus, you should be aware that our executive officers and directors have financial interests in the merger that are different from, or in addition to, the interests of our stockholders generally. These interests include the vesting in full of outstanding our equity compensation awards and rights to continued indemnification and insurance coverage by People's United after the merger for acts or omissions occurring before the merger.
Danvers Stockholders Will Have a Reduced Ownership and Voting Interest After the Merger and Will Exercise Less Influence Over Management of the Combined Organization.
Our stockholders currently have the right to vote in the election of the Board of Directors and on other matters affecting us. Upon the completion of the merger, each Danvers stockholder that receives shares of People's United common stock will become a stockholder of People's United with a percentage ownership of the combined organization that is much smaller than the stockholder's percentage ownership of Danvers. Because of this, Danvers' stockholders will have significantly less influence on the management and policies of People's United than they now have on the management and policies of Danvers.
The Shares of People's United Common Stock to be Received by Danvers Stockholders as a Result of the Merger Will Have Different Rights from Shares of Our Common Stock.
Following completion of the merger, our stockholders will no longer be stockholders of Danvers. Our stockholders who receive shares of People's United in the merger will instead be stockholders of People's United. There will be important differences between your current rights as a Danvers stockholder and the rights to which you will be entitled as a People's United stockholder.
43
Risks Related to Our Business
Our Commercial Real Estate and C&I Loans May Expose Us to Increased Credit Risks, and These Risks Will Increase if We Succeed in Increasing These Types of Loans.
Commercial real estate and C&I loans represent a significant portion of our loan portfolio. Our goal is to increase the level of our C&I, and on a more selective basis our permanent commercial real estate, segments as a proportion of our portfolio over the next several years. In general, commercial real estate loans and C&I loans generate higher returns, but also pose greater credit risks, than owner occupied residential mortgage loans. As our various commercial loan portfolios increase, the corresponding risks and potential for losses from these loans may also increase.
The repayment of commercial real estate loans depends on the business and financial condition of borrowers, and a number of our borrowers have more than one commercial real estate loan outstanding with us. Further, these loans are concentrated primarily in Eastern Massachusetts. Economic events and changes in government regulations, which we and our borrowers cannot control or reliably predict, could have an adverse impact on the cash flows generated by properties securing our commercial real estate loans and on the values of the properties securing those loans.
We make both secured and, to a much lesser extent, unsecured C&I loans. Repayment of both secured and unsecured C&I loans depends substantially on the borrowers' underlying business, financial condition and cash flows. Unsecured loans generally involve a higher degree of risk of loss than secured loans because, without collateral, repayment is wholly dependent upon the success of the borrowers' businesses. Secured C&I loans are generally collateralized by equipment, leases, inventory, accounts receivable and other fixed assets. Compared to real estate, that type of collateral is more difficult to monitor, its value is harder to ascertain, it may depreciate more rapidly and it may not be as readily saleable if repossessed.
Our Focus on Construction Lending Could Expose Us to Risks Not Associated With Other Types of Lending.
We originate construction loans for one- to four-family homes, residential condominiums, commercial, multi-family and other non-residential purposes. Construction and land development loans carry higher levels of risk compared to other types of lending, predicated on whether the project can be completed on-time and on-budget and, for non-owner occupied projects, whether our customer can find tenants at rents that will service the debt or buyers that will pay the appraised value for the completed project. Construction loans are typically based upon estimates of costs to complete the project and an appraised value associated with the completed project. Cost estimates and completed appraised values are subject to changes in the market, and these values may change between the time a loan is approved and the project is completed. Delays or cost overruns in completing a project may arise from labor problems, material shortages and other unpredicted contingencies. If actual construction costs exceed budget, our borrowers may have to put more capital into their projects, or we may have to increase the loan amount to ensure the project is completed, potentially resulting in a higher loan-to-value ratio than anticipated. Where a non-owner occupied project is not pre-leased, changes in the market could result in a slow lease-up period or rents below the levels anticipated. For residential land development or construction loans for residential properties that have not been pre-sold, a general slowdown in home buying could result in slow sales and reduced prices. Either situation will strain our borrowers' cash flows and potentially cause deterioration in this segment of our portfolio.
The current slowdown in the sales of single-family and residential condominiums, and the related reduction in prices, has affected construction lending activities in our market area. These conditions have led us to curtail much of our construction lending activities. These same conditions have extended the durations of some of our existing construction loans, thereby increasing the risk of possible loss on these loans.
44
Our Continuing Concentration of Loans in Our Primary Market Area May Increase Our Risk.
Our success depends primarily on the general economic conditions, including growth in population, income levels, deposits and housing starts, in the counties in which we conduct business. If the communities in which we operate do not grow or if prevailing economic conditions locally or nationally continue to be unfavorable, our business may be adversely affected. Unlike larger banks that are more geographically diversified, we provide banking and financial services to customers primarily in Essex, Middlesex and, to a lesser extent, Suffolk Counties, in Eastern Massachusetts. The local economic conditions in our market area have a significant impact on the ability of our borrowers to repay their loans and the value of the collateral securing these loans. Tenant occupancy rates for commercial real estate and for residential properties have been declining in our market area. In addition, rental rates for both types of properties, particularly commercial, have also been declining. A continued decline in general economic conditions caused by inflation, recession, unemployment, a decline in real estate values, or other factors beyond our control would affect these local economic conditions and could adversely affect our financial condition and results of operations.
We May Incur Significant Losses as a Result of Ineffective Risk Management Processes and Strategies.
We seek to monitor and control our risk exposure through a risk and control framework encompassing a variety of separate but complementary financial, credit, operational, compliance and legal reporting systems, internal controls, management review processes and other mechanisms. While we employ a broad and diversified set of risk monitoring and risk mitigation techniques, those techniques and the judgments that accompany their application may not be effective and may not anticipate every economic and financial outcome in all market environments or the specifics and timing of such outcomes. Market conditions over the last several years have involved unprecedented dislocations and highlight the limitations inherent in using historical data to manage risk.
A Decline in Local Real Estate Values Could Reduce Our Profits.
A large segment of our real estate loans are secured by real estate in Essex and Middlesex Counties. As a result of this concentration, a downturn in the local economy could cause significant increases in non-performing loans, which would reduce our profits. Additionally, a decrease in asset quality could require additions to our allowance for loan losses, which would reduce our profits. A future decline in real estate values could cause some of our mortgage loans to become inadequately collateralized, which would expose us to a greater risk of loss. In addition, because we have a significant amount of commercial real estate loans, decreases in tenant occupancy may also have a negative effect on the ability of many of our borrowers to make timely repayments on their loans, which would have an adverse impact on our earnings. For a discussion of our market area, see "Business—Market Area and Competition" on page 6.
The Market Price and Trading Volume of Our Common Stock May be Volatile.
The market price of our common stock may be volatile. In addition, the trading volume in our common stock may fluctuate and cause significant price variations to occur. We cannot assure you that the market price of our common stock will not fluctuate or decline significantly in the future. Some of the factors that could negatively affect our share price or result in fluctuations in the price or trading volume of our common stock include:
- •
- quarterly variations in our operating results or the quality of our assets;
- •
- operating results that vary from the expectations of management, securities analysts and investors;
- •
- changes in expectations as to our future financial performance;
45
- •
- announcements of innovations, new products, strategic developments, significant contracts, acquisitions and other material
events by us or our competitors;
- •
- the operating and securities price performance of other companies that investors believe are comparable to us;
- •
- our past and future dividend practices;
- •
- future sales of our equity or equity-related securities; and
- •
- changes in global financial markets and global economies and general market conditions, such as interest or foreign exchange rates, stock, commodity or real estate valuations or volatility.
If Our Allowance For Loan Losses is Not Sufficient to Cover Actual Loan Losses, Our Earnings Could Decrease.
In the event that our loan customers do not repay their loans according to the terms of the loans, and the collateral securing the repayment of these loans is insufficient to cover any remaining loan balance, we could experience significant loan losses, which could have a material adverse effect on our operating results. We make various assumptions and judgments about the collectability of our loan portfolio, including the creditworthiness of our borrowers and the value of the real estate and other assets, if any, serving as collateral for the repayment of our loans. In determining the amount of our allowance for loan losses, we rely on our loan quality reviews, our experience and our evaluation of economic conditions, among other factors. If our assumptions are incorrect, our allowance for loan losses may not be sufficient to cover probable losses inherent in our loan portfolio, which may require additions to our allowance. Although we are unaware of any specific problems with our loan portfolio that would require any increase in our allowance at the present time, it may need to be increased in the future due to adverse developments affecting our construction loans or our emphasis on loan growth and on increasing our portfolio of C&I and commercial real estate loans. Any material additions to our allowance for loan losses would materially decrease our net income. Our business strategy calls for continued growth of commercial real estate loans and C&I loans. These loans typically expose us to greater risk than one- to four-family owner-occupied residential real estate loans. As we further increase the amount of these loans in our loan portfolio, we may increase our provisions for loan losses, which could adversely affect our consolidated results of operations.
In addition, bank regulators periodically review our allowance for loan losses and may require us to increase our provisions for loan losses or recognize further loan charge-offs. Any increase in our allowance for loan losses or loan charge-offs as required by regulatory authorities could have a material adverse effect on our consolidated results of operations and financial condition.
Prepayments of Loans May Negatively Impact Our Banking Business.
Generally, our customers may prepay the principal amount of their outstanding loans at any time. The speed at which such prepayments occur, as well as the size of such prepayments, are within our customers' discretion. If customers prepay the principal amount of their loans, and we are unable to lend those funds to other borrowers or invest the funds at the same or higher interest rates, our interest income will be reduced. A significant reduction in interest income could have a negative impact on our results of operations and financial condition.
Changes in Market Interest Rates Could Adversely Affect Our Financial Condition and Results of Operations.
Our profitability, like that of most community banks, depends to a large extent upon our net interest income, which is the difference, or spread, between our gross interest income on interest-earning assets, such as loans and securities, and our interest expense on interest-bearing liabilities, such as deposits and borrowed funds. Accordingly, our results of operations and financial condition depend
46
largely on movements in market interest rates and our ability to manage our interest-rate-sensitive assets and liabilities in response to these movements.
We are also subject to reinvestment risk relating to interest rate movements. Decreases in interest rates can result in increased prepayments of loans and mortgage-related securities, as borrowers refinance to reduce their borrowing costs. Under these circumstances, we are subject to reinvestment risk to the extent that we are not able to reinvest funds from such prepayments at rates that are comparable to the rates on the prepaid loans or securities. Additionally, increases in interest rates may decrease loan demand and/or make it more difficult for borrowers to repay adjustable rate loans.
Changes in interest rates also affect the value of our interest-earning assets, including, in particular, the value of our investment securities portfolio, which is comprised mainly of debt securities. Generally, the value of debt securities fluctuates inversely with changes in interest rates. Unrealized gains and losses on securities available for sale are reported as a separate component of stockholders' equity, net of related taxes. Decreases in the fair value of securities available for sale therefore would have an adverse affect on our stockholders' equity. See "Business—Investment Activities" on page 19.
Our Business Depends Upon Key Employees, and if We Are Unable to Retain the Services of These Key Employees or to Attract and Retain Additional Qualified Personnel, Our Business May Suffer.
We are substantially dependent on a number of key employees, including our executive officers. Our success has been, and will continue to be, dependent on our ability to retain the services of our existing key employees and to attract and retain additional qualified personnel in the future. The loss of the services of any one of our key employees, or the inability to identify, hire and retain other highly qualified personnel in the future, could adversely affect the quality and profitability of our business operations. In particular, the loss of key commercial loan officers, or the failure to attract and hire additional loan officers to expand our commercial real estate and C&I lending programs could have a material adverse effect on our business strategy. In connection with the conversion, we entered into employment agreements with our Chief Executive Officer, Chief Operating Officer, Chief Lending Officer, and our Chief Financial Officer in January 2008.
Strong Competition Within Our Market Area May Limit Our Growth and Profitability.
We face significant competition both in attracting deposits and in the origination of loans. See "Business—Market Area and Competition" on page 6. Savings banks, credit unions, co-operative banks, savings and loan associations and commercial banks operating in our primary market area have historically provided most of our competition for deposits. In addition, and particularly in times of high interest rates, we face additional and significant competition for funds from money-market mutual funds and issuers of corporate and government securities. Competition for the origination of real estate and other loans comes from other thrift institutions, commercial banks, insurance companies, finance companies, other institutional lenders and mortgage companies. Many of our competitors have substantially greater financial and other resources than we have as a community bank. Finally, credit unions do not pay federal or state income taxes and are subject to fewer regulatory constraints than savings banks and as a result, they may enjoy a competitive advantage over us. This advantage places significant competitive pressure on the prices of our loans and deposits.
We Continually Encounter Technological Change, and We May Have Fewer Resources Than Many of Our Larger Competitors to Continue to Invest in Technological Improvements.
The financial services industry is constantly undergoing technological changes, with frequent introductions of new technology-driven products and services. The effective use of technology increases efficiency and enables financial institutions to better serve customers and reduce costs. Our future success will depend, in part, upon our ability to address the needs of our customers by using technology
47
to provide products and services that will satisfy customer demands for convenience, as well as to create additional efficiencies in our operations. Many of our larger competitors have substantially greater resources to invest in technological improvements. We may not be able to effectively implement new technology-driven products and services or be successful in marketing these products and services to our customers.
We rely heavily on communications and information systems to conduct our business. Failures, interruptions or breaches in security of either of these systems could cause failures or disruptions in our customer relationship management, general ledger, deposits, servicing or loan origination systems. The occurrence of any of these failures or disruptions could result in monetary losses or a loss of customers, which could adversely affect our results of operations and financial condition.
Our Financial Statements are Based in Part on Assumptions and Estimates, Which, if Wrong, Could Cause Unexpected Losses in the Future.
Pursuant to U.S. GAAP, we are required to use certain assumptions and estimates in preparing our financial statements, including in determining credit loss reserves, reserves related to litigation and the fair value of certain assets and liabilities, among other items. If assumptions or estimates underlying our financial statements are incorrect, we may experience material losses.
Changes in Accounting Standards Can be Difficult to Predict and Can Materially Impact How we Record and Report our Financial Condition and Results of Operations.
Our accounting policies and methods are fundamental to how we record and report our financial condition and results of operations. From time to time, the FASB changes the financial accounting and reporting standards that govern the preparation of our financial statements. These changes can be hard to anticipate and implement and can materially impact how we record and report our financial condition and results of operations. For example, the FASB's current financial instruments project could, among other things, significantly change the way loan loss provisions are determined from an incurred loss model to an expected loss model, and may also result in most financial instruments being required to be reported at fair value.
We are a Holding Company and Depend on Danversbank for Dividends, Distributions and Other Payments.
We are a separate and distinct legal entity from Danversbank and depend on dividends, distributions and other payments from Danversbank to fund dividend payments on our stock and to fund all payments on our other obligations. Danversbank is subject to laws that authorize regulatory bodies to block or reduce the payment of cash dividends or other distributions from it to us. Regulatory action of that kind could impede access to funds we need to make payments on our obligations or dividend payments. Additionally, if Danversbank's earnings are not sufficient to make dividend payments to us while maintaining adequate capital levels, we may not be able to make dividend payments to our stockholders.
Our Stockholders May Not Receive Dividends on the Common Stock.
Holders of our common stock are entitled to receive dividends only when, as and if declared by our board of directors. Although we have historically declared cash dividends on our common stock, we are not required to do so and our board of directors may reduce or eliminate our common stock dividend in the future. Further, the Federal Reserve has issued guidelines for evaluating proposals by large bank holding companies to increase dividends or repurchase or redeem shares, which includes a requirement for such firms to develop a capital distribution plan. The Federal Reserve has indicated that it is considering expanding these requirements to cover all bank holding companies, which may in
48
the future restrict our ability to pay dividends. A reduction or elimination of dividends could adversely affect the market price of our common stock.
We Operate in a Highly Regulated Environment That Is Subject to Future Change.
We are subject to extensive regulation, supervision and examination, and the laws, regulations and policies to which we are subject may change at any time. See "Business—Regulation and Supervision" on page 27. This regulation and supervision limits the activities in which we may engage. Any change in the laws or regulations applicable to us, or in banking regulators' supervisory policies or examination procedures, particularly any changes relating to commercial real estate lending, C&I lending or other key components of our business, whether by the Massachusetts Commissioner of Banks, the FDIC, the Federal Reserve, other state or federal regulators, the United States Congress or the Massachusetts legislature, or our failure to comply with any of these laws or regulations, could have a material adverse effect on our business, financial condition, results of operations and cash flows.
We are subject to regulations promulgated by the Massachusetts Division of Banks, as the chartering authority for Danversbank, and by the FDIC, as well as to certain regulations promulgated by the Federal Reserve. We also belong to the FHLBB, and as a member of such system we are subject to certain requirements to continue to participate in the FHLBB programs. In addition, the Federal Reserve regulates Danvers Bancorp as a bank holding company.
The purpose of the regulation and supervision to which we are subject is primarily to protect our depositors and borrowers and, in the case of FDIC regulation, the FDIC's Deposit Insurance Fund. Regulatory authorities have extensive discretion in the exercise of their supervisory and enforcement powers. They may, among other things, impose restrictions on the operation of a banking institution, the classification of assets by such institution and such institution's allowance for loan losses. Regulatory and law enforcement authorities also have wide discretion and extensive enforcement powers under various consumer protection and civil rights laws, including the Truth-in-Lending Act, the Equal Credit Opportunity Act, the Fair Housing Act, the Real Estate Settlement Procedures Act and Massachusetts's deceptive acts and practices law. These laws also permit private individual and class action lawsuits and provide for the recovery of attorneys fees in certain instances. No assurance can be given that the foregoing regulations and supervision will not change so as to affect us adversely, or that we will not be found in noncompliance with any law, regulation or policy.
Recent Legislative Changes May Increase Our Operating Costs and May Negatively Impact Our Business.
On July 21, 2010, the Dodd-Frank Wall Street Reform and Consumer Protection Act (the "Dodd-Frank Act") was signed into law. This legislation makes sweeping changes to numerous sectors of the banking and financial industry. Among many other things, Dodd-Frank creates a new Consumer Financial Protection Bureau ("CFPB") as an independent bureau of the Federal Reserve, imposes clearing and margining requirements on many derivatives activities, and generally increases oversight and regulation of financial institutions and financial activities. It also requires bank holding companies with total consolidated assets greater than $500 million to be subject to the same capital requirements as insured depository institutions, meaning, for instance, that such bank holding companies will, going forward, no longer be able to count trust preferred securities as Tier 1 capital. However, bank holding companies with less than $15 billion in assets may continue to count existing securities issued before May 19, 2010 in Tier 1 capital if they qualified for inclusion in Tier 1 capital on that date.
The CFPB, which will begin operations on July 21, 2011, will have the authority to prescribe rules governing the provision of consumer financial products and services, which may result in rules and regulations that reduce the profitability of such products and services and/or impose greater costs on us and our subsidiaries.
49
In addition to the self-implementing provisions of the statute itself, Dodd-Frank calls for hundreds of administrative rulemakings by various federal agencies to implement various parts of the legislation. Though some rules have already been proposed or finalized, we cannot predict when all additional rules will be proposed and/or finalized, or what the content of any such rules will be.
Certain provisions of the Dodd-Frank Act that affect deposit insurance assessments, the payment of interest on demand deposits and interchange fees could increase the costs associated with Danversbank's deposit-generating activities, as well as place limitations on the revenues that those deposits may generate. For example, the Federal Reserve has proposed rules governing debit card interchange fees that apply to institutions with greater than $10 billion in assets, and this proposed rule would severely limit the amount that could be charged as a debit card interchange fee. Market forces may effectively require all banks to adopt debit card interchange fee structures which comply with these rules, which will significantly reduce the fee income earned from debit card transactions.
The financial reform legislation and any implementing rules that are ultimately issued could have adverse implications on the financial industry, the competitive environment, and our ability to conduct business.
Regulatory Capital Requirements Could Affect Our Operations.
Regulators may raise capital requirements above current levels in connection with the implementation of Basel III, the Dodd-Frank Act or otherwise, which may require us and Danversbank having to hold additional capital which could limit the manner in which we and Danversbank conduct their business and obtain financing. Furthermore, the imposition of liquidity requirements in connection with the implementation of Basel III in the United States, or otherwise, could result in us and Danversbank having to lengthen the term of funding, restructure business models, and/or increase holdings of liquid assets. If the federal banking agencies implement a capital conservation buffer and/or a countercyclical capital buffer, as proposed in Basel III, a failure by us or Danversbank to satisfy the applicable buffer's requirements would limit such institution's ability to make distributions, including paying out dividends or buying back shares.
A Change to the Conservatorship of Fannie Mae and Freddie Mac and Related Actions, Along With Any Changes in Laws and Regulations Affecting the Relationship Between Fannie Mae and Freddie Mac and the U.S. Government, Could Adversely Affect Our Business.
There continues to be substantial uncertainty regarding the future of government-sponsored enterprises ("GSEs") Fannie Mae and Freddie Mac, including whether they both will continue to exist in their current form. We sell many of our residential mortgages to Fannie Mae. Our ability to sell our residential mortgages into the secondary market is an important part of our overall interest rate risk management strategy.
Due to increased market concerns about the ability of Fannie Mae and Freddie Mac to withstand future credit losses associated with securities on which they provide guarantees and loans held in their investment portfolios without the direct support of the U.S. federal government, in September 2008, the Federal Housing Finance Agency (the "FHFA") placed Fannie Mae and Freddie Mac into conservatorship and, together with the U.S. Treasury, established a program designed to boost investor confidence in Fannie Mae and Freddie Mac by supporting the availability of mortgage financing and protecting taxpayers. The U.S. government program includes contracts between the U.S. Treasury and each of Fannie Mae and Freddie Mac that seek to ensure that each GSE maintains a positive net worth by providing for the provision of cash by the U.S. Treasury to Fannie Mae and Freddie Mac if FHFA determines that its liabilities exceed its assets. Although the U.S. government has described some specific steps that it intends to take as part of the conservatorship process, efforts to stabilize these entities may not be successful and the outcome and impact of these events remain highly uncertain.
50
It is widely anticipated that the U.S. Congress will address GSEs as part of its next major legislative undertaking, although it is not known when, or if, that will occur. In Section 1491 of the Dodd-Frank Act, Congress stated that the "hybrid public-private status of Fannie Mae and Freddie Mac is untenable and must be resolved" and, further, "[i]t is the sense of the Congress that efforts to enhance by [sic] the protection, limitation, and regulation of the terms of residential mortgage credit and the practices related to such credit would be incomplete without enactment of meaningful structural reforms of Fannie Mae and Freddie Mac." In February 2011, the Treasury Department and the Department of Housing and Urban Development issued a report offering three options for restructuring the GSEs' future role in housing finance, all of which involve a much greater role for private financing rather than government guarantees.
Future legislation could further change the relationship between Fannie Mae and Freddie Mac and the U.S. government, could change their business charters or structure, or could nationalize or eliminate such entities entirely. We cannot predict whether, or when, any such legislation may be enacted.
Item 1B. UNRESOLVED STAFF COMMENTS
None.
51
Danversbank currently conducts its business through its main office located in Danvers, Massachusetts and 27 other offices located in Essex, Middlesex and Suffolk Counties in Massachusetts, and we plan to continue to expand our branch network as discussed above in "Business—Business Strategy" on page 6. The following table sets forth information about our offices as of December 31, 2010:
Location
|
Leased or Owned |
Original Year Leased or Acquired |
Date of Lease Expiration |
Date of Lease Options Expiration |
||||
|---|---|---|---|---|---|---|---|---|
| Main Office/Branch: | ||||||||
One Conant Street Danvers, Massachusetts 01923 |
Owned |
1922 |
NA |
NA |
||||
Branch Offices: |
||||||||
Andover Office 18-20 Central Street Andover, Massachusetts 01810 |
Leased |
2002 |
03/31/12 |
03/31/22 |
||||
Beverly Office 240-246 Cabot Street Beverly, Massachusetts 01915 |
Owned |
2009 |
NA |
NA |
||||
Beverly Office 100 Cummings Center Suites 101M and 101N Beverly, Massachusetts 01915 |
Leased |
2009 |
09/30/16 |
09/30/16 |
||||
North Beverly Plaza Office 63 Dodge Street Beverly, Massachusetts 01915 |
Leased |
2009 |
10/30/26 |
10/31/26 |
||||
Boston Loan Office(1) One Post Office Square 37th Floor Boston, Massachusetts 02109 |
Leased |
2005 |
07/31/15 |
07/31/20 |
||||
Boston Office 86 Massachusetts Avenue Boston, Massachusetts 02115 |
Leased |
2008 |
01/31/19 |
01/31/29 |
||||
Boston Office(2) 50 Milk Street Boston, Massachusetts 02109 |
Leased |
2010 |
01/31/21 |
01/31/31 |
||||
Boston Office(2) 218 Cambridge Street Boston, Massachusetts 02114 |
Leased |
2010 |
11/30/20 |
11/30/30 |
||||
Boston Office(2) 176 Federal Street Boston, Massachusetts 02110 |
Leased |
2010 |
12/31/20 |
12/31/30 |
52
Location
|
Leased or Owned |
Original Year Leased or Acquired |
Date of Lease Expiration |
Date of Lease Options Expiration |
||||
|---|---|---|---|---|---|---|---|---|
| Cambridge Office 285 Massachusetts Avenue Cambridge, Massachusetts 02138 |
Leased | 2008 | 12/31/13 | 12/31/28 | ||||
Chelsea Office 357 Beacham Street Chelsea, Massachusetts 02150 |
Owned |
2001 |
NA |
NA |
||||
Federal Street Office 7 Federal Street Danvers, Massachusetts 01923 |
Leased |
2004 |
11/30/14 |
11/30/24 |
||||
High Street Office 107 High Street Danvers, Massachusetts 01923 |
Leased |
2009 |
08/31/24 |
08/31/24 |
||||
Hamilton South Office 25 Railroad Avenue South Hamilton, Massachusetts 01982 |
Owned |
2009 |
NA |
NA |
||||
Lexington Office(2) 46 Bedford Street Lexington, Massachusetts 02420 |
Leased |
2010 |
02/28/31 |
02/28/41 |
||||
Malden Office 51 Commercial Street Malden, Massachusetts 02148 |
Leased |
2007 |
02/14/17 |
02/14/27 |
||||
Manchester Office 11 Summer Street Manchester, Massachusetts 01944 |
Leased |
2009 |
12/31/28 |
12/31/28 |
||||
Middleton Office Two Central Street Middleton, Massachusetts 01949 |
Leased |
1998 |
08/14/18 |
08/14/18 |
||||
Needham Office 827-835 Highland Avenue Needham, Massachusetts 02492 |
Leased |
2009 |
08/08/15 |
08/08/35 |
||||
Peabody Office Two Central Street Peabody, Massachusetts 01960 |
Leased |
1998 |
09/30/18 |
09/30/28 |
||||
Reading Office 21-37 Harnden Street Reading, Massachusetts 01867 |
Leased |
1999 |
11/30/14 |
11/30/24 |
||||
Revere Office 310 Broadway Revere, Massachusetts 02151 |
Owned |
2001 |
NA |
NA |
||||
Salem Office 111-125 Canal Street Salem, Massachusetts 01970 |
Leased |
2001 |
10/31/11 |
10/31/21 |
53
Location
|
Leased or Owned |
Original Year Leased or Acquired |
Date of Lease Expiration |
Date of Lease Options Expiration |
||||
|---|---|---|---|---|---|---|---|---|
| Salem Office 6 Paradise Road Salem, Massachusetts 01970 |
Leased | 2009 | 04/30/17 | 04/30/32 | ||||
Salem Office 7 Traders Way Salem, Massachusetts 01970 |
Leased |
2007 |
07/31/27 |
07/31/47 |
||||
Saugus Office 584 Broadway Saugus, Massachusetts 01906 |
Owned |
2009 |
NA |
NA |
||||
Topsfield Office 15 Main Street Topsfield, Massachusetts 01983 |
Leased |
2009 |
02/28/15 |
02/28/15 |
||||
Wilmington Office 247 Main Street Wilmington, Massachusetts 01887 |
Leased |
2007 |
02/22/27 |
02/22/47 |
||||
Woburn Office 400 West Cummings Park Suite 1950 Woburn, Massachusetts 01801 |
Leased |
2002 |
03/30/12 |
03/30/22 |
||||
Waltham Office 775-781 Main Street Waltham, Massachusetts 02452 |
Leased |
2008 |
09/30/18 |
09/30/28 |
||||
Other Properties: |
||||||||
Lending Center 16 High Street Danvers, Massachusetts 01923 |
Owned |
2001 |
NA |
NA |
||||
Lending Center 51 High Street Danvers, Massachusetts 01923 |
Owned |
2004 |
NA |
NA |
||||
Cash Management/Lending Office 10 Elm Street Danvers, Massachusetts 01923 |
Leased |
2007 |
12/31/12 |
12/31/18 |
||||
Operations Center 75 Sylvan Street Danvers, Massachusetts 01923 |
Leased |
2007 |
06/30/18 |
06/30/28 |
||||
Asset Based Lending Office 6-10 High Street Danvers, Massachusetts 01923 |
Leased |
2002 |
12/31/11 |
NA |
- (1)
- This
Boston office has a full branch license.
- (2)
- New office expected to open in early to mid 2011.
54
We are not involved in any legal proceedings other than routine legal proceedings occurring in the ordinary course of business. Management believes that those routine legal proceedings involve, in the aggregate, amounts that are immaterial to our financial condition and results of operations.
Item 4. [REMOVED AND RESERVED]
55
Item 5. MARKET FOR REGISTRANT'S COMMON EQUITY, RELATED STOCKHOLDER MATTERS AND ISSUER PURCHASES OF EQUITY SECURITIES
Market information
The Company's common stock began trading on January 10, 2008 on the NASDAQ Stock Market LLC under the symbol "DNBK." Before that time, the Company was a mutual holding company and had never issued capital stock. The following table sets forth the high and low prices of our common stock and the dividends declared per share for the periods indicated:
| |
High | Low | Dividends Declared Per Share |
|||||||
|---|---|---|---|---|---|---|---|---|---|---|
2010 |
||||||||||
First Quarter |
$ | 15.00 | $ | 12.32 | $ | 0.02 | ||||
Second Quarter |
17.09 | 13.65 | 0.02 | |||||||
Third Quarter |
16.77 | 14.19 | 0.02 | |||||||
Fourth Quarter |
18.07 | 14.51 | 0.04 | |||||||
2009 |
||||||||||
First Quarter |
$ | 14.26 | $ | 11.75 | $ | 0.02 | ||||
Second Quarter |
15.27 | 12.80 | 0.02 | |||||||
Third Quarter |
13.82 | 12.37 | 0.02 | |||||||
Fourth Quarter |
14.05 | 12.71 | 0.02 | |||||||
Holders
As of February 28, 2011, there were 20,686,592 shares of common stock outstanding, which were held by approximately 1,226 registered holders. This number does not reflect the number of persons or entities holding stock in nominee name through banks, brokerage firms and other nominees.
Dividends
The Company has been paying quarterly dividends on its common stock since the third quarter of 2008 on its common stock and currently intends to continue to do so for the foreseeable future. In addition, the Board of Directors may declare and pay periodic special cash dividends in addition to, or in lieu of, regular cash dividends. In determining whether to declare or pay any dividends, whether regular or special, the Board of Directors will take into account applicable regulatory capital requirements, the Company's financial condition and results of operations, debt and equity structure, capital requirements in connection with possible future acquisitions, tax considerations, statutory and regulatory limitations, and general economic conditions. The regulatory restrictions that affect the payment of dividends by Danversbank to the Company discussed below will also be considered. The Company cannot guarantee that it will pay dividends or that, if paid, the Company will not reduce or eliminate dividends in the future. If the Company issues preferred stock, the holders of the preferred stock may have dividend preferences over the holders of common stock.
Dividends from the Company may depend, in part, upon receipt of dividends from Danversbank because the Company will have no source of income other than dividends from Danversbank, interest on the ESOP loan and earnings from investment of net proceeds from the conversion retained by the Company, Massachusetts banking law and FDIC regulations limit distributions from Danversbank to the Company. For example, Danversbank could not pay dividends if it were not in compliance with applicable regulatory capital requirements. See "Business—Regulation and Supervision—Massachusetts Bank Regulation—Bank Dividends" on page 31 and "Business—Supervision and Regulation—Federal
56
Bank Regulation—Prompt Corrective Regulatory Action" on page 32. In addition, the Company is subject to the Federal Reserve's policy that dividends should be paid only out of current earnings and only if the prospective rate of earnings retention by the Company appears consistent with its capital needs, asset quality and overall financial condition. See "Business—Regulation and Supervision—Holding Company Regulation" on page 39.
Securities Authorized for Issuance under Equity Compensation Plans.
The following table provides information as of December 31, 2010, with respect to shares of common stock that may be issued under the Company's 2008 Stock Option and Incentive Plan, approved by the stockholders at the September 12, 2008 Annual Meeting of Stockholders:
Plan Category
|
Number of Securities to be Issued Upon Exercise of Outstanding Options, Warrants and Rights (A) |
Weighted- Average Exercise Price of Outstanding Options, Warrants and Rights (B) |
Number of Securities Remaining Available for Future Issuance Under Equity Compensation Plans (Excluding Securities Reflected in Column (A)) |
Total Options Grantable |
||||||||||
|---|---|---|---|---|---|---|---|---|---|---|---|---|---|---|
Equity compensation plans approved by security stockholders: |
||||||||||||||
Stock options |
1,647,700 | $ | 13.01 | 136,550 | 1,784,250 | |||||||||
Restricted stock |
530,558 | $ | 13.01 | 183,142 | 713,700 | |||||||||
Equity compensation plans not approved by security stockholders |
— |
$ |
— |
— |
||||||||||
Total |
2,178,258 | $ | 13.01 | 319,692 | 2,497,950 | |||||||||
57
Performance Graph
The following graph compares the performance of the Company's common stock (assuming reinvestment of dividends) with the total return for companies with the Russell 200, SNL New England Thrift Index and the SNL New England Bank Index. The calculation of total cumulative return assumes a $100 investment was made at market close on January 10, 2008, the date the Company's stock began trading after the Company's initial public offering.
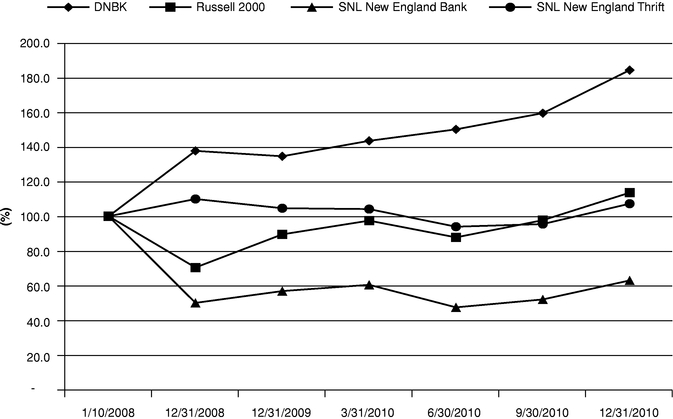
| |
1/10/2008 | 12/31/2008 | 12/31/2009 | 3/31/2010 | 6/30/2010 | 9/30/2010 | 12/31/2010 | |||||||||||||||
|---|---|---|---|---|---|---|---|---|---|---|---|---|---|---|---|---|---|---|---|---|---|---|
DNBK |
100.00 | 137.72 | 134.61 | 143.52 | 150.14 | 159.49 | 184.32 | |||||||||||||||
Russell 2000 |
100.00 | 70.41 | 89.54 | 97.47 | 87.80 | 97.71 | 113.59 | |||||||||||||||
SNL New England Bank |
100.00 | 50.00 | 56.82 | 60.43 | 47.42 | 51.99 | 62.94 | |||||||||||||||
SNL New England Thrift |
100.00 | 109.95 | 104.62 | 104.13 | 93.96 | 95.48 | 107.23 | |||||||||||||||
Use of Proceeds
There were no sales by us of unregistered securities during the year ended December 31, 2010.
Repurchase of Equity Securities by the Issuer
On May 24, 2010, the Company's Board of Directors adopted a stock repurchase program to purchase up to 5% of the Company's outstanding common stock. Repurchases under this program have been and will be made in open market transactions, through block trades and pursuant to any trading plan that may be adopted in accordance with Rule 10b5-1 of the Exchange Act. This authority may be exercised from time to time and in such amounts as market conditions warrant and subject to regulatory considerations. The timing and actual number of shares repurchased depends on a variety of factors including price, corporate and regulatory requirements, market conditions, and other corporate liquidity requirements and priorities. Open market purchases are subject to the limitations set forth in
58
Rule 10b-18 of the Exchange Act and other applicable legal requirements. The stock repurchase program may be suspended or terminated by the Company at any time without prior notice.
As of December 31, 2010, total repurchases under the stock repurchase plan were 817,143 at an average price of $14.97. In the fourth quarter of 2010, the Company purchased 259,343 shares, as follows:
Period
|
Total Number of Shares Purchased |
Average Price Paid per Share |
Total Number of Shares Purchased as Part of Publicly Announced Plans or Programs |
Maximum Number of Shares That May Yet be Purchased Under the Plans or Programs |
||||||||||
|---|---|---|---|---|---|---|---|---|---|---|---|---|---|---|
October 1 - 31 |
73,443 | $ | 15.20 | 73,443 | 446,551 | |||||||||
November 1 - 30 |
185,900 | $ | 14.94 | 185,900 | 260,651 | |||||||||
December 1 - 31 |
— | $ | — | — | 260,651 | |||||||||
Total |
259,343 | $ | 15.01 | 259,343 | ||||||||||
59
Item 6. SELECTED FINANCIAL DATA
The summary information presented below at each date or for each period is derived in part from the consolidated financial statements of the Company. The following information is only a summary, and should be read in conjunction with our consolidated financial statements and notes beginning on page F-1 of this report.
| |
At or For the Years Ended December 31, | |||||||||||||||
|---|---|---|---|---|---|---|---|---|---|---|---|---|---|---|---|---|
| |
2010 | 2009 | 2008 | 2007 | 2006 | |||||||||||
| |
(In thousands, except per share data) |
|||||||||||||||
Selected Financial Condition Data: |
||||||||||||||||
Total assets |
$ | 2,853,345 | $ | 2,499,749 | $ | 1,727,809 | $ | 1,448,303 | $ | 1,262,597 | ||||||
Loans, net |
1,764,841 | 1,651,465 | 1,106,656 | 899,401 | 871,114 | |||||||||||
Securities available for sale, at fair value |
723,610 | 481,100 | 490,845 | 406,715 | 273,083 | |||||||||||
Securities held to maturity, at cost |
152,731 | 110,932 | — | — | — | |||||||||||
Bank-owned life insurance |
34,250 | 32,900 | 24,826 | 23,665 | 22,694 | |||||||||||
Deposits |
2,100,026 | 1,765,803 | 1,118,283 | 998,148 | 953,220 | |||||||||||
Stock subscriptions |
— | — | — | 162,859 | — | |||||||||||
Short-term borrowings |
214,330 | 172,829 | 168,276 | 23,800 | 30,934 | |||||||||||
Long-term debt |
196,778 | 218,475 | 163,022 | 145,042 | 167,899 | |||||||||||
Subordinated debt |
29,965 | 29,965 | 29,965 | 29,965 | 29,965 | |||||||||||
Stockholders' equity |
285,274 | 285,666 | 233,008 | 73,496 | 65,079 | |||||||||||
Selected Operating Data: |
||||||||||||||||
Interest and dividend income |
$ | 119,009 | $ | 94,357 | $ | 85,530 | $ | 80,324 | $ | 73,726 | ||||||
Interest expense |
33,679 | 35,483 | 38,348 | 43,168 | 37,184 | |||||||||||
Net interest income |
85,330 | 58,874 | 47,182 | 37,156 | 36,542 | |||||||||||
Provision for loan losses |
5,150 | 5,110 | 4,225 | 800 | 1,000 | |||||||||||
Net interest income, after provision for loan losses |
80,180 | 53,764 | 42,957 | 36,356 | 35,542 | |||||||||||
Non-interest income |
13,369 | 7,589 | 7,027 | 5,780 | 5,012 | |||||||||||
Non-interest expense |
70,530 | 55,895 | 55,390 | 36,967 | 35,583 | |||||||||||
Income (loss) before income taxes |
23,019 | 5,458 | (5,406 | ) | 5,169 | 4,971 | ||||||||||
Provision (benefit) for income taxes |
4,818 | 149 | (2,703 | ) | 815 | 734 | ||||||||||
Net income (loss) |
$ | 18,201 | $ | 5,309 | $ | (2,703 | ) | $ | 4,354 | $ | 4,237 | |||||
Dividends paid per common share |
$ | 0.10 | $ | 0.08 | $ | 0.04 | N/A | N/A | ||||||||
Dividend payout ratio(1) |
10.99 | % | 25.81 | % | N/A | N/A | N/A | |||||||||
Earnings per share (basic)(1) |
0.91 | 0.31 | N/A | N/A | N/A | |||||||||||
Earnings per share (diluted)(1) |
0.91 | 0.31 | N/A | N/A | N/A | |||||||||||
- (1)
- Not applicable for the year ended December 31, 2008 and prior years, as the Company did not issue stock until January 9, 2008.
60
| |
At or For the Years Ended December 31, | |||||||||||||||
|---|---|---|---|---|---|---|---|---|---|---|---|---|---|---|---|---|
| |
2010 | 2009 | 2008 | 2007 | 2006 | |||||||||||
Selected Financial Ratios and Other Data: |
||||||||||||||||
Performance Ratios: |
||||||||||||||||
Return (loss) on assets (net income to average total assets) |
0.71 | % | 0.28 | % | (0.17 | %) | 0.34 | % | 0.34 | % | ||||||
Return (loss) on equity (net income to average equity) |
6.27 | % | 2.30 | % | (1.25 | %) | 6.50 | % | 6.90 | % | ||||||
Net interest rate spread(1) |
3.31 | % | 2.89 | % | 2.61 | % | 2.63 | % | 2.74 | % | ||||||
Net interest margin(2) |
3.56 | % | 3.27 | % | 3.22 | % | 3.08 | % | 3.10 | % | ||||||
Efficiency ratio(3) |
69.24 | % | 83.39 | % | 101.96 | %(4) | 85.82 | % | 85.31 | % | ||||||
Non-interest expenses to average total assets |
2.74 | % | 2.95 | % | 3.56 | %(4) | 2.89 | % | 2.87 | % | ||||||
Average interest-earning assets to interest bearing liabilities |
1.18x | 1.19x | 1.23x | 1.12x | 1.11x | |||||||||||
Asset Quality Ratios: |
||||||||||||||||
Non-performing assets to total assets |
0.52 | % | 0.77 | % | 0.41 | % | 0.55 | % | 0.46 | % | ||||||
Non-performing loans to total loans |
0.78 | % | 1.01 | % | 0.53 | % | 0.48 | % | 0.65 | % | ||||||
Allowance for loan losses to non-performing loans |
128.51 | % | 82.49 | %(5) | 204.53 | % | 207.34 | % | 181.02 | % | ||||||
Allowance for loan losses to total loans |
1.00 | % | 0.88 | %(5) | 1.08 | % | 1.00 | % | 1.18 | % | ||||||
Capital Ratios: |
||||||||||||||||
Risk-based capital (to risk-weighted assets) |
15.36 | % | 15.68 | % | 22.03 | % | 10.99 | % | 11.09 | % | ||||||
Tier 1 risk-based capital (to risk-weighted assets) |
14.45 | % | 14.87 | % | 21.03 | % | 9.57 | % | 9.19 | % | ||||||
Tier 1 leverage capital (to average assets) |
10.44 | % | 12.13 | % | 16.55 | % | 6.94 | % | 6.87 | % | ||||||
Stockholders' equity to total assets |
10.00 | % | 11.43 | % | 13.49 | % | 5.07 | % | 5.15 | % | ||||||
Average stockholders' equity to average assets |
11.29 | % | 12.17 | % | 13.96 | % | 5.24 | % | 4.95 | % | ||||||
Other Data: |
||||||||||||||||
Number of full service offices |
27 | 25 | 16 | 15 | 14 | |||||||||||
Full time equivalent employees |
378 | 372 | 269 | 247 | 237 | |||||||||||
- (1)
- Net
interest rate spread represents the difference between the yield on interest-earning assets and cost of interest-bearing liabilities.
- (2)
- The
net interest margin represents net interest income divided by average interest-earning assets.
- (3)
- The
efficiency ratio represents non-interest expense for the period minus expenses related to the amortization of intangible assets divided by
the sum of net interest income (before the loan loss provision) plus non-interest income.
- (4)
- Increase
due to the contribution to the Danversbank Charitable Foundation and payout of the Company's Phantom Stock Plan, as a result of the conversion, in
the amount of $6,850,000 and $3,743,000, respectively in the first quarter of 2008.
- (5)
- The acquisition of Beverly into the Company and the attendant "acquisition accounting" considerations are the reasons that the reserve represents a lower percentage non-performing loans and total loans.
61
Item 7. MANAGEMENT'S DISCUSSION AND ANALYSIS OF FINANCIAL CONDITION AND RESULTS OF OPERATION
The purpose of Management's Discussion and Analysis is to focus on certain significant factors that have affected our operating results and financial condition, and to provide shareholders a more comprehensive review of the financial data contained in the report. This section should be read in conjunction with the consolidated financial statements and notes to the consolidated financial statements that appear elsewhere in this report.
General
Long-term growth is an essential element in our business plan. Lending is the major driver of revenue and we are committed to supporting our loan growth. We recognize that loan and deposit growth are interdependent and over the long term both must grow consistently. One of our biggest challenges has been to grow our customer base and to grow the depth and breadth of our customer relationships. We have addressed this challenge by maintaining our focus on anticipating, understanding and assisting our customers in achieving their financial goals.
Our results of operations depend, to a large extent, on net interest income, which is the difference between the income earned on our loan and investment portfolios and interest expense on deposits and borrowings. Interest income represented 89.9% and 92.6% of our total revenue for the years ended December 31, 2010 and 2009, respectively, and our net interest margin was 3.56% and 3.27%, respectively.
Our results of operations are also significantly affected by general economic and competitive conditions, particularly changes in interest rates, government policies and actions of the regulatory agencies. General economic conditions and a continued decline in the real estate markets could affect the demand for our loan and other products and the ability of borrowers to repay loans, which could in turn lead to a decline in credit quality and increased loan losses. Future changes in applicable laws, regulations or government policies may materially impact our financial condition and results of operations.
Results of operations are also affected by fee income from banking and non-banking operations, provisions for loan losses, loan servicing and other non-interest income. Non-interest expense principally consists of employee compensation and employee benefits, office occupancy and equipment expense, data processing, advertising, business development and other expense. We use the efficiency ratio (non-interest expense for the period minus expenses related to the amortization of intangible assets divided by the sum of net interest income (before the loan loss provision) plus non-interest income) and the expense ratio (non-interest expense to total average assets) as the primary measurements to monitor and control non-interest expense. For the years ended December 31, 2010 and 2009, our efficiency and non-interest expenses to average assets ratios were 69.24% and 83.39% and 2.74% and 2.95%, respectively.
Recent Developments—Pending Merger
Merger Agreement. On January 20, 2011, the Company entered into a Merger Agreement with People's United, pursuant to which People's United will acquire the Company in a 55% stock and 45% cash merger transaction valued at approximately $493 million. The Merger Agreement provides that upon consummation of the merger, the Company will be merged with and into People's United, with People's United continuing as the surviving corporation. Simultaneously with the consummation of the Merger, Danversbank will be merged with and into People's United's subsidiary bank, People's United Bank, with People's United Bank continuing as the surviving entity.
62
Under the terms and conditions of the Merger Agreement, the Company's stockholders have the right to elect to receive (i) $23.00 in cash or (ii) 1.624 shares of People's United common stock for each share of Company common stock, subject to customary pro ration provisions.
The Merger, which is expected to close in the second quarter of 2011, is subject to approval by bank regulatory authorities and by the stockholders of Danvers. People's United's shareholder approval is not required for the Merger.
Settlement Agreements. In connection with the merger, People's United, People's United Bank, the Company and Danversbank entered into settlement agreements with each of Kevin T. Bottomley, L. Mark Panella, James J. McCarthy and John J. O'Neil pursuant to which each executive will receive the payments and benefits provided under his settlement agreement in satisfaction of all rights to payments and benefits under the executive's individual employment agreement and the Supplemental Executive Retirement Plan or, in the case of Mr. Panella, the Supplemental Retirement Agreement. In connection with the merger, rights to most of these payments and benefits would have otherwise been triggered absent the settlement agreement. Upon the closing of the merger, each settlement agreement specifies that the executive will execute a release of claims against People's United, People's United Bank, Danvers Bancorp and Danversbank. Futher information about these agreements can be found in Part III—Item 11—Executive Compensation on page 87 of this report.
Post-2009 Acquisition
While this discussion focuses primarily on performance during 2010, there are several facets of our operation that were significantly affected in 2010 due to the October 30, 2009 Beverly acquisition and subsequent conversion. Specifically, the offering proceeds received during our 2008 offering substantially increased our capital and our capital ratios. However, as we have deployed the capital over the past three years, including on the Beverly acquisition, these ratios have declined.
Additionally, our non-interest expenses continue to increase as a result of becoming a public company, particularly in the areas of audit, investor relations, periodic filings, and compliance with new internal control reporting and governance requirements and branch expansion. We also incurred higher legal costs and other miscellaneous holding company expenses. There were increased expenses associated with employee benefits, particularly our employee stock ownership plans and phantom stock plan for which the change in control provisions were triggered by the conversion.
Critical Accounting Policies
Critical accounting policies are those that involve significant judgments and assessments by management, and which could potentially result in materially different results under different assumptions and conditions. We consider the following to be critical accounting policies:
Allowance for Loan Losses. The determination of the allowance for loan losses is considered critical due to the high degree of judgment involved, the subjectivity of the underlying assumptions used, and the potential for changes in the economic environment that could result in material changes in the amount of the allowance for loan losses considered necessary. The allowance is evaluated on a regular basis by management and the Board of Directors and is based on a periodic review of the collectability of the loans in light of historical experience, the nature and size of the loan portfolio, adverse situations that may affect borrowers' ability to repay, the estimated value of any underlying collateral and prevailing economic conditions. For a full discussion of the allowance for loan losses, please refer to "Business—Asset Quality—Allowance for Loan Losses" on page 17.
Other Than Temporary Impairment of Securities. Other than temporary impairment of securities ("OTTI") is required to be recognized if (1) the Company intends to sell the security; (2) it is "more likely than not" that the Company will be required to sell the security before recovery of its amortized
63
cost basis; or (3) for debt securities, the present value of expected cash flows is not sufficient to recover the entire amortized cost basis. Marketable equity securities are evaluated for OTTI based on the severity and duration of impairment and, if deemed to be other than temporary, the declines in fair values are reflected in earnings as realized losses. For impaired debt securities that the Company intends to sell, or more likely than not will be required to sell, the full amount of the depreciation is recognized as OTTI through earnings. For all other impaired debt securities, credit-related OTTI is recognized through earnings and non-credit related OTTI is recognized in other comprehensive income, net of applicable taxes.
Other Real Estate Owned. OREO includes property acquired through foreclosure or deed in lieu of foreclosure and is recorded at fair value, less estimated costs to sell, at the time of acquisition. The excess, if any, of the loan balance over the fair value of the property at the time of transfer from loans to OREO is charged to the allowance for loan losses. Subsequent to the transfer to OREO, if the fair value of the property less estimated selling costs is less than the carrying value of the property, the deficiency is charged to income. Due to changing market conditions, there are inherent uncertainties in the assumptions with respect to the estimated fair value of OREO. Therefore, the amount ultimately realized may differ from the amounts reflected in the accompanying consolidated financial statements. Revenue and expenses from operations, changes in the valuation allowance and any direct write-downs are included in other real estate owned expense.
Goodwill and Intangible Assets. The Company's goodwill asset represents the excess of the purchase price over the fair value of the assets acquired and the liabilities assumed arising from acquisitions of other financial institutions. The CDI asset represents the long-term value of depositor relationships arising from the contractual rights acquired in the acquisition of financial institutions. The Company accounts for its goodwill and intangible assets using the acquisition method. The recorded fair value of the assets acquired and liabilities assumed is an estimate determined by a third party valuation model. The Company tests for goodwill impairment at least annually or when events or changes in circumstances indicate the asset might be impaired. In addition, the Company periodically evaluates the realizability of intangible assets based on the value of the underlying depositor relationships. If the value is less than the carrying amount of the intangible asset, the Company would recognize an impairment of its CDI assets.
Income Taxes. Deferred income tax assets and liabilities are determined using the liability (or balance sheet) method. Under this method, the net deferred tax asset or liability is determined based on the tax effects of the temporary differences between the book and tax bases of the various balance sheet assets and liabilities and gives current recognition to changes in tax rates and laws. A valuation allowance is established against deferred tax assets when, based upon the available evidence including historical and projected taxable income, it is more likely than not that some or all of the deferred tax asset will not be realized (See Note 14 to Consolidated Financial Statements beginning on page F-41).
Income tax benefits related to stock compensation in excess of grant date fair value less any proceeds on exercise are recognized as an increase to additional paid-in capital upon vesting or exercising and delivery of the stock. Any income tax effects related to stock compensation that are less than grant date fair value less any proceeds on exercise would be recognized as a reduction of additional paid-in capital to the extent of previously recognized income tax benefits and then through income tax expense for the remaining amount.
This discussion has highlighted those accounting policies that management considers critical; however, all accounting policies are important, and therefore you are encouraged to review each of the policies included in Note 2 to the Consolidated Financial Statements beginning at page F-8 to gain a better understanding of how our financial performance is measured and reported.
64
Analysis of Net Interest Income
Net interest income represents the difference between income on interest-earning assets and the expense on interest-bearing liabilities. Net interest income depends upon the relative amounts of interest-earning assets and interest-bearing liabilities and the interest rates earned or paid on them. The following table sets forth average balance sheets, average yields and costs, and certain other information for the periods indicated. All average balances are daily average balances. The yields set forth below include the effect of deferred fees, and discounts and premiums that are amortized or accreted to interest income or expense. Tax-exempt income and yields have not been adjusted to a tax-equivalent basis. Danversbank does not accrue interest on loans on non-accrual status, however, the balance of these loans is included in the total average balance, which has the effect of lowering average loan yields.
65
The following table sets forth average balance sheets, average yields and costs and certain other information for the periods indicated:
| |
Years Ended December 31, | |||||||||||||||||||||||||||||
|---|---|---|---|---|---|---|---|---|---|---|---|---|---|---|---|---|---|---|---|---|---|---|---|---|---|---|---|---|---|---|
| |
2010 | 2009 | 2008 | |||||||||||||||||||||||||||
| |
Average Outstanding Balance |
Interest Earned/ Paid |
Average Yield/ Rate |
Average Outstanding Balance |
Interest Earned/ Paid |
Average Yield/ Rate |
Average Outstanding Balance |
Interest Earned/ Paid |
Average Yield/ Rate |
|||||||||||||||||||||
| |
(Dollars in thousands) |
|||||||||||||||||||||||||||||
Interest-earning assets: |
||||||||||||||||||||||||||||||
Interest-earning cash equivalents and certificates of deposit |
$ | 57,164 | $ | 125 | 0.22 | % | $ | 48,946 | $ | 406 | 0.83 | % | $ | 41,480 | $ | 1,100 | 2.65 | % | ||||||||||||
Debt securities:(1) |
||||||||||||||||||||||||||||||
U.S. Government |
4,712 | 8 | 0.17 | 3,091 | 18 | 0.58 | 2,027 | 78 | 3.85 | |||||||||||||||||||||
Gov't-sponsored enterprises and FHLMC |
293,546 | 9,759 | 3.32 | 202,486 | 9,412 | 4.65 | 174,224 | 8,390 | 4.82 | |||||||||||||||||||||
Mortgage-backed |
289,031 | 10,761 | 3.72 | 252,042 | 11,678 | 4.63 | 206,237 | 10,302 | 5.00 | |||||||||||||||||||||
Municipal bonds |
32,832 | 1,255 | 3.82 | 22,248 | 906 | 4.07 | 19,008 | 773 | 4.07 | |||||||||||||||||||||
Other |
7,743 | 769 | 9.93 | 4,710 | 514 | 10.91 | 283 | 14 | 4.95 | |||||||||||||||||||||
Equity securities |
18,752 | 12 | 0.06 | 14,791 | 6 | 0.04 | 11,447 | 403 | 3.52 | |||||||||||||||||||||
Real estate mortgages(2) |
917,957 | 52,517 | 5.72 | 694,412 | 39,330 | 5.66 | 581,447 | 36,401 | 6.26 | |||||||||||||||||||||
C&I loans(2) |
629,905 | 37,087 | 5.89 | 461,910 | 27,331 | 5.92 | 364,216 | 24,572 | 6.75 | |||||||||||||||||||||
IRBs(2) |
140,646 | 6,527 | 4.64 | 91,618 | 4,383 | 4.78 | 56,331 | 2,746 | 4.87 | |||||||||||||||||||||
Consumer loans(2) |
3,434 | 189 | 5.50 | 4,685 | 373 | 7.96 | 9,310 | 751 | 8.07 | |||||||||||||||||||||
Total interest-earning assets |
2,395,722 | 119,009 | 4.97 | 1,800,939 | 94,357 | 5.24 | 1,466,010 | 85,530 | 5.83 | |||||||||||||||||||||
Allowance for loan losses |
(16,031 | ) | (12,972 | ) | (10,214 | ) | ||||||||||||||||||||||||
Total earning assets less allowance for loan losses |
2,379,691 | 1,787,967 | 1,455,796 | |||||||||||||||||||||||||||
Non-interest-earning assets |
193,141 | 109,488 | 98,162 | |||||||||||||||||||||||||||
Total assets |
$ | 2,572,832 | $ | 1,897,455 | $ | 1,553,958 | ||||||||||||||||||||||||
Interest-bearing liabilities: |
||||||||||||||||||||||||||||||
Deposits: |
||||||||||||||||||||||||||||||
Savings and NOW accounts |
$ | 425,554 | 4,939 | 1.16 | $ | 230,857 | 2,717 | 1.18 | $ | 178,801 | 2,308 | 1.29 | ||||||||||||||||||
Money market accounts |
741,898 | 9,628 | 1.30 | 534,321 | 11,190 | 2.09 | 417,127 | 11,724 | 2.81 | |||||||||||||||||||||
Term certificates(3) |
558,238 | 9,761 | 1.75 | 442,476 | 11,922 | 2.69 | 360,500 | 14,310 | 3.97 | |||||||||||||||||||||
Total deposits |
1,725,690 | 24,328 | 1.41 | 1,207,654 | 25,829 | 2.14 | 956,428 | 28,342 | 2.96 | |||||||||||||||||||||
Borrowed funds: |
||||||||||||||||||||||||||||||
Short-term borrowings |
60,621 | 244 | 0.40 | 98,152 | 372 | 0.38 | 46,409 | 573 | 1.23 | |||||||||||||||||||||
Long-term debt |
209,597 | 7,246 | 3.46 | 171,401 | 7,317 | 4.27 | 158,102 | 7,131 | 4.51 | |||||||||||||||||||||
Subordinated debt |
29,965 | 1,861 | 6.21 | 29,965 | 1,965 | 6.56 | 29,965 | 2,302 | 7.68 | |||||||||||||||||||||
Total interest-bearing liabilities |
2,025,873 | 33,679 | 1.66 | 1,507,172 | 35,483 | 2.35 | 1,190,904 | 38,348 | 3.22 | |||||||||||||||||||||
Non-interest-bearing deposits |
235,001 | 145,025 | 138,481 | |||||||||||||||||||||||||||
Other non-interest-bearing liabilities |
21,509 | 14,359 | 7,596 | |||||||||||||||||||||||||||
Total non-interest-bearing liabilities |
256,510 | 159,384 | 146,077 | |||||||||||||||||||||||||||
Total liabilities |
2,282,383 | 1,666,556 | 1,336,981 | |||||||||||||||||||||||||||
Stockholders' equity |
290,449 | 230,899 | 216,977 | |||||||||||||||||||||||||||
Total liabilities and stockholders' equity |
$ | 2,572,832 | $ | 1,897,455 | $ | 1,553,958 | ||||||||||||||||||||||||
Net interest income |
$ | 85,330 | $ | 58,874 | $ | 47,182 | ||||||||||||||||||||||||
Net interest rate spread(4) |
3.31 | % | 2.89 | % | 2.61 | % | ||||||||||||||||||||||||
Net interest-earning assets(5) |
$ | 369,849 | $ | 293,767 | $ | 275,106 | ||||||||||||||||||||||||
Net interest margin(6) |
3.56 | % | 3.27 | % | 3.22 | % | ||||||||||||||||||||||||
Ratio of interest-earning assets |
||||||||||||||||||||||||||||||
to total interest-bearing liabilities |
1.18x | 1.19x | 1.23x | |||||||||||||||||||||||||||
- (1)
- Average balances are presented at average amortized cost.
66
- (2)
- Average
loans include non-accrual loans and are net of average deferred loan fees/costs.
- (3)
- In
2008, term certificates include brokered and non-brokered CDs.
- (4)
- Net
interest rate spread represents the difference between the yield on interest-earning assets and the cost of interest-bearing liabilities.
- (5)
- Net
interest-earning assets represent total interest-earning assets less total interest-bearing liabilities.
- (6)
- Net interest margin represents net interest income divided by average total interest-earning assets.
The following table presents the dollar amount of changes in interest income and interest expense for the major categories of Danversbank's interest-earning assets and interest-bearing liabilities. Information is provided for each category of interest-earning assets and interest-bearing liabilities with respect to (i) changes attributable to changes in volume (i.e., changes in average balances multiplied by the prior-period average rate) and (ii) changes attributable to rate (i.e., changes in average rate multiplied by prior-period average balances).
| |
Years Ended December 31, 2010 vs. 2009 |
Years Ended December 31, 2009 vs. 2008 |
||||||||||||||||||
|---|---|---|---|---|---|---|---|---|---|---|---|---|---|---|---|---|---|---|---|---|
| |
Increase (Decrease) Due to |
|
Increase (Decrease) Due to |
|
||||||||||||||||
| |
Total Increase (Decrease) |
Total Increase (Decrease) |
||||||||||||||||||
| |
Volume | Rate | Volume | Rate | ||||||||||||||||
| |
(In thousands) |
|||||||||||||||||||
Interest-earning assets: |
||||||||||||||||||||
Interest-earning cash equivalents and certificates of deposit |
$ | 68 | $ | (349 | ) | $ | (281 | ) | $ | 198 | $ | (892 | ) | $ | (694 | ) | ||||
Debt securities: |
||||||||||||||||||||
U.S. Government |
9 | (20 | ) | (11 | ) | 41 | (101 | ) | (60 | ) | ||||||||||
Gov't-sponsored enterprises and FHLMC |
4,233 | (3,886 | ) | 347 | 1,361 | (339 | ) | 1,022 | ||||||||||||
Mortgage-backed |
1,714 | (2,631 | ) | (917 | ) | 2,288 | (912 | ) | 1,376 | |||||||||||
Municipal bonds |
431 | (82 | ) | 349 | 132 | 1 | 133 | |||||||||||||
Other |
331 | (75 | ) | 256 | 219 | 281 | 500 | |||||||||||||
Equity securities |
2 | 4 | 6 | 118 | (515 | ) | (397 | ) | ||||||||||||
Real estate mortgages |
12,661 | 526 | 13,187 | 7,072 | (4,143 | ) | 2,929 | |||||||||||||
C&I loans |
9,940 | (184 | ) | 9,756 | 6,591 | (3,832 | ) | 2,759 | ||||||||||||
IRBs |
2,345 | (201 | ) | 2,144 | 1,720 | (83 | ) | 1,637 | ||||||||||||
Consumer loans |
(100 | ) | (84 | ) | (184 | ) | (373 | ) | (5 | ) | (378 | ) | ||||||||
Total interest-earning assets |
31,634 | (6,982 | ) | 24,652 | 19,367 | (10,540 | ) | 8,827 | ||||||||||||
Interest-bearing liabilities: |
||||||||||||||||||||
Deposits: |
||||||||||||||||||||
Savings and NOW accounts |
2,291 | (69 | ) | 2,222 | 672 | (263 | ) | 409 | ||||||||||||
Money market accounts |
4,347 | (5,909 | ) | (1,562 | ) | 3,294 | (3,828 | ) | (534 | ) | ||||||||||
Term certificates |
3,119 | (5,280 | ) | (2,161 | ) | 3,254 | (5,642 | ) | (2,388 | ) | ||||||||||
Total deposits |
9,757 | (11,258 | ) | (1,501 | ) | 7,220 | (9,733 | ) | (2,513 | ) | ||||||||||
Borrowed funds: |
||||||||||||||||||||
Short-term borrowings |
(142 | ) | 14 | (128 | ) | 639 | (840 | ) | (201 | ) | ||||||||||
Long-term debt |
1,631 | (1,702 | ) | (71 | ) | 600 | (414 | ) | 186 | |||||||||||
Subordinated debt |
— | (104 | ) | (104 | ) | — | (337 | ) | (337 | ) | ||||||||||
Total interest-bearing liabilities |
11,246 | (13,050 | ) | (1,804 | ) | 8,459 | (11,324 | ) | (2,865 | ) | ||||||||||
Increase in net interest income |
$ | 20,388 | $ | 6,068 | $ | 26,456 | $ | 10,908 | $ | 784 | $ | 11,692 | ||||||||
67
Comparison of Financial Condition at December 31, 2010 and December 31, 2009
Total Assets. Total assets increased by $353.6 million, or 14.1%, from $2.5 billion at December 31, 2009 to $2.9 billion at December 31, 2010. The balance sheet growth, and in particular the expansion of the loan portfolio is attributable to the continuing market transfer of credit opportunities from some of the larger institutions in the area to some of the community banking franchises. The Company experienced very strong deposit growth during the year. Deposit balances increased by $334.2 million, or 18.9%, for the year ended December 31, 2010. The Company has utilized these cash flows to fund loan originations and during the most recent quarter, selectively increase segments of the Company's investment portfolio.
Cash and Cash Equivalents. Cash, correspondent bank balances and cash equivalents consisting of federal funds sold decreased by $41.5 million to $30.3 million at December 31, 2010. This decrease in short-term liquidity was primarily the result of deploying excess cash to fund investment purchases.
Securities. The investment portfolio aggregated $876.3 million at December 31, 2010, an increase of $284.3 million, or 48.0%, from $592.0 million at December 31, 2009. The increase in the investment portfolio was largely due to the deployment of cash flows from deposits and the prefunding of anticipated 2011 cash flow from investment calls and maturities.
Net Loans. At December 31, 2010, net loans totaled $1.8 billion, an increase of $113.4 million, or 6.9%, from net loan balances of $1.7 billion as of December 31, 2009. The outstandings in the Company's C&I and residential real estate loan portfolios increased by $179.0 million and $14.3 million, respectively. The trend, as it has been for the better part of the past four years, has been to systematically wind down the Company's construction lending activities in favor of C&I and selected permanent commercial real estate opportunities.
Deposits. Deposits increased by $334.2 million, or 18.9%, to $2.1 billion at December 31, 2010 compared to $1.8 billion at December 31, 2009. During the past year, the Company experienced increases in all but one deposit category. This growth is attributable to the Company's expanded retail branch presence and online banking initiatives. The Company opened its Cambridge and Waltham locations in 2009 and its first Boston retail location in the first quarter of 2010 and its Needham location in the third quarter of 2010. These branches have already attracted $128.1 million in new deposit balances. Despite the low levels of short-term interest rates, the Company has experienced success in raising core deposit balances.
Borrowed Funds. Short-term FHLB advances increased by $48.0 million, or 40.0% in 2010. These additional short-term advances were used to fund investment purchases. Repurchase agreements and Federal Reserve Bank ("FRB") short-term advances decreased by $7.5 million and increased by $1.0 million, respectively, at December 31, 2010 compared to December 31, 2009. The Company had approximately $196.8 million in various FHLB term advances outstanding and an additional $214.3 million in short-term FHLB advances, overnight customer repurchase agreements and FRB short-term advances. From a funding and liquidity perspective, the Company has ready access to a number of large, stable and well diversified short-term funding sources and these alternatives are available at highly competitive rates given the current rate environment.
Stockholders' Equity. Stockholders' equity decreased by $392,000, or 0.14%, to $285.3 million at December 31, 2010 from a balance of $285.7 million as of December 31, 2009. This decrease in stockholders' equity was primarily due to stock repurchases as the Company purchased 1,000,504 shares of common stock in the open market at an average price of $14.85 per share during 2010. These purchases are part of the stock repurchase programs announced in May of 2009 and May of 2010. Stockholder's equity was also reduced by dividends declared of $2.0 million and increased by net income for the year of $18.2 million.
68
Comparison of Operating Results For the Years Ended December 31, 2010 and December 31, 2009
Net Income. Net income increased $12.9 million, or 242.8%, to net income of $18.2 million for the year ended December 31, 2010, compared to net income of $5.3 million for the year ended December 31, 2009. A $26.5 million increase in net interest income and $5.8 million in non-interest income more than offset the increases in non-interest expense between the two periods. Due to the organic growth of the loan portfolio during 2010, the Company's provision for loan losses increased $40,000 to $5.2 million for the year ended December 31, 2010. The Company experienced an increase in most expense categories as a result of operating the combined franchise in 2010. This increase was slightly offset by a decrease in deposit insurance of $137,000.
Net Interest Income. Net interest income increased to $85.3 million for the year ended December 31, 2010 compared to $58.9 million in 2009. Increases in interest income are the result of higher levels of interest-earning assets that were partially offset by higher levels of interest-bearing liabilities and the decrease in funding costs related to those interest-bearing liabilities. The cumulative effect of a larger balance sheet and a 29 basis point increase in our net interest margin was a $26.5 million or 44.9% increase in net interest income between the comparative time periods. Our net interest margin was 3.56% for the year ended December 31, 2010 compared to 3.27% for the year ended December 31, 2009.
Interest and Dividend Income. Interest income increased $24.7 million, or 26.1%, to $119.0 million for 2010 from $94.3 million for the prior year. The increase was due primarily to higher levels of interest-earning assets. In 2010 average loans outstanding increased by $439.3 million, or 35.1%. At the same time, the yield earned on loans decreased by 1 basis point to 5.69%. This decline reflects the general decrease in market interest rates in 2010. Consistent with the rate environment, yields on investment securities also decreased when compared to 2009. Yields on investments declined by 102 basis points to 3.49% for the year. The decline in yields was more than offset by an $147.2 million increase in the average balances of investment securities.
Interest Expense. Interest expense decreased $1.8 million, or 5.1%, to $33.7 million for the year ended December 31, 2010 from $35.5 million in the prior year. The primary reason was a decrease in the rates paid on interest-bearing deposits and borrowings, which declined by 69 basis points to 1.66% for 2010 from 2.35% for 2009. The result was a decrease in interest expense of $13.1 million. The fall in deposit and borrowing rates reflected a generally lower interest rate environment in 2010. The decline in deposit and borrowing rates was offset by an increase in the average balance of interest-bearing liabilities of $518.7 million. Interest-bearing liabilities averaged $2.0 billion in 2010 compared to $1.5 billion for 2009. The increase in these average balances resulted in an $11.3 million increase in interest expense.
Provision for Loan Losses. The Company's provision for loan losses increased by $40,000, or 0.78%, to $5.2 million in 2010 from $5.1 million in 2009. Provisions for both periods were reflective of growth in the loan portfolio, an evaluation of the quality of the portfolio, and net charge-offs, the difference between loan charge-offs and recoveries on loans previously charged off. In particular, the Company's total loan portfolio increased by $113.4 million, or 6.9%, in 2010. Net charge-offs were $1.9 million and $2.5 million for the years ended 2010 and 2009, respectively, and were very consistent with the Company's historical loss experience over the past few years. As a result of the higher provision, the allowance for loan losses increased to $17.9 million at December 31, 2010 and represented 1.00% of total loans, as compared to an allowance of $14.7 million, or 0.88% of total loans at December 31, 2009. The allowance was significantly impacted in 2009 by the purchase accounting considerations associated with the Beverly transaction.
Non-interest Income. Total non-interest income increased to $13.4 million in 2010 from $7.6 million in 2009. Service charges on deposit accounts continue to increase commensurate with the
69
expansion of the franchise and as a result there was an increase in service charges on deposit accounts of $1.0 million in 2010. Gains realized on the sale of loans increased by $103,000 due to an increase in mortgage refinance activity spurred by generally lower mortgage rates. Other operating income increased, in aggregate, $1.5 million between the comparable time periods, primarily as a result of a gain in one of the Company's limited partnership investments. There were also sizable increases in net gains on sales of securities and trust services fees of $2.1 million and $1.3 million, respectively.
Non-interest Expense. Non-interest expense increased $14.6 million, or 26.2%, to $70.5 million in 2010 as compared to $55.9 million in 2009. The increase is due to increases in other operating expense, salaries and employee benefits, deposit insurance expense and outside services related to the Beverly acquisition and the expansion of the franchise. There was an increase in salaries and employee benefits expenses for the year of $8.7 million as a result of additions to staff due to the Beverly acquisition and the Company's continued expansion of its branch footprint and lending activities. Included in the 2010 increase was $2.9 million in stock option plan expense. Occupancy expense increased $2.1 million, or 35.5%, to $8.1 million for 2010 primarily due to an increase in leases related to our branch expansion and the expanded premises due to the Beverly merger. The increase in equipment, outside services and other operating expense was $521,000, $52,000 and $3.2 million, respectively, and were all impacted by our expanding franchise and operating costs related to the Beverly merger.
Income Taxes. The Company recorded an income tax expense of $4.8 million for the year ended December 31, 2010, an increase of $4.7 million, compared to $149,000 for the year ended December 31, 2009. The combined federal and state effective tax rate was 20.9% in 2010, compared to 2.7% in 2009. Since the fully taxable components of the Company's revenues have increased as a result of the Beverly acquisition and organic growth of the franchise, the Company's 2010 effective tax rate has increased.
Comparison of Operating Results For the Years Ended December 31, 2009 and December 31, 2008
Net Income (Loss). Net income increased $8.0 million, or 296.4%, to net income of $5.3 million for the year ended December 31, 2009, which includes two months of Beverly operating results, compared to a net loss of $2.7 million for the year ended December 31, 2008. An $11.7 million increase in net interest income more than offset increases in provision for loan loss and non-interest expense between the two periods. It should be noted that the loss in 2008 was largely impacted by two non-recurring items: a $6.9 million pretax charge related to the establishment of the Danversbank Charitable Foundation and a $3.7 million pretax charge related to the acceleration of Danversbank's phantom stock plan. Both charges are directly related to the Company's conversion in 2008 from a mutual form of organization to a public stock holding company. Due to the organic or non-acquisition growth of the loan portfolio during 2009, the Company's provision for loan losses increased $885,000 to $5.1 million for the year ended December 31, 2009. The Company experienced a reduction of $2.0 million in OREO expense in 2009 that was largely offset by an increase in deposit insurance of $1.8 million.
Net Interest Income. Net interest income increased to $58.9 million for the year ended December 31, 2009 compared to $47.2 million in 2008. Increases in interest income are the result of higher levels of interest-earning assets that were partially offset by higher levels of interest-bearing liabilities and the decrease in funding costs related to those interest-bearing liabilities. The cumulative effect of a larger balance sheet and a 5 basis point increase in our net interest margin was an $11.7 million or 24.8% increase in net interest income between the comparative time periods. Our net interest margin was 3.27% for the year ended December 31, 2009 compared to 3.22% for the year ended December 31, 2008.
Interest and Dividend Income. Interest income increased $8.8 million, or 10.3%, to $94.4 million for 2009 from $85.5 million for the prior year. The increase was due primarily to higher levels of
70
interest-earning assets. In 2009 average loans outstanding increased by $241.3 million, or 23.9%. At the same time, the yield earned on loans decreased by 67 basis points to 5.70%. This decline reflects the general decrease in market interest rates in 2009. Consistent with the rate environment, yields on investment securities also decreased when compared to 2008. Yields on investments declined by 32 basis points to 4.51% for the year. The decline in yields was more than offset by an $86.1 million increase in the average balances of investment securities.
Interest Expense. Interest expense decreased $2.9 million, or 7.47%, to $35.4 million for the year ended December 31, 2009 from $38.3 million in the prior year. The primary reason was a decrease in the rates paid on interest-bearing deposits and borrowings, which declined by 87 basis points to 2.35% for 2009 from 3.22% for 2008. The result was a decrease in interest expense of $11.3 million. The fall in deposit and borrowing rates reflected a generally lower interest rate environment in 2009. The decline in deposit and borrowing rates was offset by an increase in the average balance of interest-bearing liabilities of $316.3 million. Interest-bearing liabilities averaged $1.5 billion in 2009 compared to $1.2 billion for 2008. The increase in these average balances resulted in an $8.4 million increase in interest expense.
Provision for Loan Losses. The Company's provision for loan losses increased by $885,000, or 20.9%, to $5.1 million in 2009 from $4.2 million in 2008. Provisions in both years were reflective of growth in the loan portfolio, an evaluation of the quality of the loan portfolio, and net charge-offs, the difference between loan charge-offs and recoveries on loans previously charged off. In particular, the Company's total loan portfolio increased by $548 million, or 48.92%, in 2009. Of the increase, $313 million is related to the Beverly loan portfolio and $235 million is related to non-acquisition growth. Net charge-offs were $2.5 million and $1.2 million for the years ended 2009 and 2008, respectively, and were generally in line with the Company's historical loss experience as a percentage of the total loan portfolio and the charges were spread over a number of credits and product types. As a result of the higher provision, the allowance for loan losses increased to $14.7 million at December 31, 2009 and represented 0.88% of total loans, as compared to an allowance of $12.1 million, or 1.08% of total loans at December 31, 2008. The merger of the two franchises and the attendant "acquisition accounting" considerations are the reasons that the reserve represents a lower percentage of gross loans at December 31, 2009.
Non-interest Income. Total non-interest income increased to $7.6 million in 2009 from $7.0 million in 2008. Service charges on deposit accounts continue to increase commensurate with the expansion of the franchise and as a result there was an increase in service charges on deposit accounts of $855,000 in 2009. Gains realized on the sale of loans increased by $549,000 due to an increase in mortgage refinance activity spurred by generally lower mortgage rates. Other operating income increased, in aggregate, $455,000 between the comparable time periods, primarily as a result of increases in debit card and wire transfer fee income. These fees reflect an overall increase in customer usage for these services. These increases were somewhat offset by decreases in gains on sale of securities, income on bank-owned life insurance and loan servicing fees of $915,000, $277,000 and $105,000, respectively.
Non-interest Expense. Non-interest expense increased $505,000, or 0.9%, to $55.9 million in 2009 as compared to $55.4 million in 2008. For the year ended 2009, the Company's overall non-interest expenses increased $11.1 million, after excluding the non-recurring items related to the conversion in 2008. The increase is due to increases in other operating expense, salaries and employee benefits, deposit insurance expense and outside services related to the Beverly acquisition and expansion of the franchise. There was an increase in salaries and employee benefits expenses for the year of $2.3 million as a result of additions to staff due to the Beverly acquisition and the Company's continued expansion of its branch footprint and lending activities. Included in the 2009 increase was $2.6 million in stock option plan expense. Deposit insurance increased by $1.8 million due to higher premiums and an $810,000 special assessment. Occupancy expense increased $885,000, or 17.4%, to $6.0 million for 2009
71
primarily due to an increase in leases related to our branch expansion. The increase in equipment, outside services and other operating expense was $482,000, $958,000 and $2.9 million, respectively, and were all impacted by our expanding franchise and transaction costs related to the Beverly merger.
Income Taxes. The Company recorded an income tax expense of $149,000 for the year ended December 31, 2009, an increase of $2.8 million, compared to recording a benefit of $2.7 million for the year ended December 31, 2008. The combined federal and state effective tax rate was 2.7% in 2009, compared to 50.0% in 2008. The effective tax rate for 2009 was the result of tax-exempt income related to the municipal income and the cash surrender value income on bank-owned life insurance. This was partially offset by non-deductible acquisition expenses. Due to the one-time expenses associated with the stock conversion, the Company recorded a substantial pre-tax loss in 2008. The combination of this loss with the other tax strategies the Company has in place resulted in the recognition of an income tax benefit.
In February 2008, the Company determined that the interest disallowance for its Industrial Revenue Bonds was applied incorrectly on the Company's tax return. This resulted in an understatement of income tax expense of $342,000, $255,000 and $138,000 or 6.6%, 5.1% and 19.0% as a percentage of income before income taxes for the years ended December 31, 2007, 2006 and 2005, respectively. This expense was recognized in 2008.
On July 3, 2008, the Commonwealth of Massachusetts enacted a law that included reducing the tax rate on net income applicable to financial institutions. The rate drops from the current rate of 10.5% to 10.0% for tax years beginning on January 1, 2010, 9.5% for tax years beginning on or after January 1, 2011, and to 9.0% for tax years beginning on or after January 1, 2012 and thereafter. As a result, the Company revalued its net deferred tax asset, and incurred an additional $182,000 of income tax expense in 2008.
Off-Balance Sheet and Derivative Transactions
On occasion, Danversbank has engaged in hedging activities as part of the asset/liability management process. In each case, the hedge was established to protect a portion of the interest income on our variable rate loan portfolio from a decline in interest rates. We document all relationships between hedging instruments and hedged items, as well as our risk-management objectives and strategy for undertaking various hedge transactions. This process includes linking all derivatives that are designated as fair value or cash flow hedges to specific assets and liabilities on the balance sheet. In conjunction with an independent third party, we also assess, both at the inception of the hedge and on an ongoing basis, whether the derivatives that are used in hedging transactions are effective in offsetting changes in fair values or cash flows of hedged items.
The Company offers certain derivative products directly to qualified commercial borrowers. The Company economically hedges derivative transactions executed with commercial borrowers by entering into mirror-image, offsetting derivatives with third parties. Derivative transactions executed as part of this program are not designated as qualifying hedging relationships and are, therefore, marked-to-market through earnings each period. Because the derivatives have mirror-image contractual terms, the changes in fair value substantially offset one another through earnings.
The Company has three interest rate swaps and one cap agreement that mature at various dates ranging from March 1, 2011 through May 1, 2015. The notional amount of the interest rate swaps and cap agreements was $30,163,000 with a variable pay rate of the 1 Month LIBOR and a fixed receive rate ranging from 6.20% through 7.29%.
As of December 31, 2010, the fair value of derivative assets and liabilities associated with the Company's program to provide derivatives to certain borrowing customers was $741,000 and $747,000, respectively, which includes an adjustment related to the consideration of nonperformance risk in
72
accordance with Accounting Standards Codification ("ASC") Topic 820 of $(24,000) and $18,000, respectively. Changes in fair value related to these non-hedge derivatives is recorded in other income. Fees earned in connection with the execution of derivatives related to this program are recognized in other non-interest income.
Danversbank does not have any off-balance sheet arrangements that have or are reasonably likely to have a current or future material effect on our financial condition, revenues or expenses, results of operations, liquidity, capital expenditures or capital resources.
Impact of Inflation and Changing Prices
The financial statements, accompanying notes, and related financial data presented herein have been prepared in accordance with generally accepted accounting principles, which require the measurement of financial position and operating results in terms of historical dollar amounts without considering the changes in the relative purchasing power of money over time due to inflation. The impact of inflation is reflected in the increased cost of our operations. Most of our assets and liabilities are monetary in nature, and therefore the impact of interest rates has a greater impact on its performance than do the effects of general levels of inflation. Interest rates do not necessarily move in the same direction or to the same extent as the prices of goods and services.
Impact of Recent Accounting Standards
In June 2009, the Financial Accounting Standards Board ("FASB") issued guidance changing the accounting principles and disclosure requirements related to securitizations and special purpose entities. Specifically, this guidance eliminates the concept of a "qualifying special-purpose entity", changes the requirements for derecognizing financial assets and changes how a company determines when an entity that is insufficiently capitalized or is not controlled through voting (or similar rights) should be consolidated. For situations in which only a portion of a financial asset is transferred, such as for a participation loan or the government guaranteed portion of a loan, if the transfer of the portion of the loan does not meet the criteria of a participating interest, then it must be accounted for as a secured borrowing rather than as a sale.
In order to meet the criteria for a participating interest, all cash flows from the loan must be divided proportionately, the rights of each loan holder must have the same priority, the loan holders must have no recourse to the transferor other than standard representations and warranties and no loan holder has the right to pledge or exchange the entire loan. This guidance expands existing disclosure requirements, became effective for the Company as of January 1, 2010 and did not have a material impact on the Company's consolidated financial statements.
In January 2010, the FASB issued an ASU, Fair Value Measurements and Disclosures, Improving Disclosures about Fair Value Measurement. This ASU requires new disclosures and clarification of existing disclosures regarding recurring and non recurring fair value measurements to provide increased transparency to users of the financial statements. The new disclosures and clarification of existing disclosures are effective for interim and annual periods beginning after December 15, 2009, except for the disclosures pertaining to the roll forward of activity for Level 3 fair value measurements, which are effective for fiscal years beginning after December 15, 2010, and for interim periods within those fiscal years. The Company adopted this statement, except for the roll forward of activity for Level 3 fair value measurements, as of January 1, 2010 and this adoption did not have a material impact on the Company's consolidated financial statements.
In July 2010, the FASB issued an ASU, Disclosures about the Credit Quality of Financing Receivables and the Allowance for Credit Losses. This ASU requires an entity to provide disclosures that facilitate financial statement users' evaluation of (1) the nature of credit risk inherent in the entity's loan portfolio (2) how that risk is analyzed and assessed in arriving at the allowance for loan and lease
73
losses and (3) the changes and reasons for those changes in the allowance for loan and lease losses. For public entities, the disclosures as of the end of a reporting period are effective for interim and annual reporting periods ending on or after December 15, 2010. The disclosures about activity that occurs during a reporting period are effective for interim and annual reporting periods beginning on or after December 15, 2010. The Company has provided the disclosures required as of December 31, 2010 (see Note 6 in the Consolidated Financial Statements beginning on page F-28). The adoption of this ASU had a significant impact on the disclosures in the Company's December 31, 2010 financial statements.
Item 7A. QUANTITATIVE AND QUALITATIVE DISCLOSURES ABOUT MARKET RISK
Management recognizes that managing risk is fundamental to the business of banking and to the safe and sound operation of Danversbank. Through the development, implementation and monitoring of its policies with respect to risk management, Danversbank strives to measure, evaluate and control the risks it faces. The most significant risks faced by Danversbank are credit risk, market risk including interest rate risk, liquidity risk, operational or transaction risk and compliance risk.
Within management, the responsibility for risk management rests with the Risk Management Committee chaired by the Executive Vice President and Chief Operating Officer, the Chief Executive Officer, Chief Information Officer, Chief Financial Officer, Compliance Officer and a number of other senior department heads. The Risk Management Committee periodically reviews the status of our risk management practices, internal and external audit findings, new business, product or service initiatives, emerging regulatory compliance standards and issues, technology initiatives, insurance, the activities of the Asset/Liability Committee, or ALCO, with respect to monitoring interest rate and liquidity risk and a host of other operational issues. The committee tracks any open items requiring corrective action with the goal of ensuring that each item is addressed on a timely basis. The Executive Vice President and Chief Operating Officer reports activities of the Risk Management Committee and status of risk management practices directly to the Danvers Bancorp, Inc. Audit Committee.
Management of Credit Risk. Danversbank considers credit risk to be the most significant risk it faces, in that it has the greatest potential to affect our financial condition and operating results. Credit risk is managed through a combination of policies established by the Board of Directors of Danversbank, the monitoring of compliance with these policies, and the periodic evaluation of loans in the portfolio, including those with problem characteristics. In general, Danversbank's policies establish maximums on the amount of credit that may be granted to a single borrower (including affiliates), the aggregate amount of loans outstanding by type in relation to total assets and capital, loan concentrations, underwriting authority and approval limits and processes. Collateral and debt service coverage ratios and other underwriting criteria are also specified. Policies also exist with respect to performing periodic credit reviews, the rating of loans, when loans should be placed on non-performing status and factors that should be considered in establishing Danversbank's allowance for possible loan losses. Management is aided in these efforts by the use of an independent third party that conducts outside reviews of Danversbank's loan portfolio three times per year. For additional information, refer to "Business—Lending Activities" on page 7.
Management of Market Risk. Market risk is the risk of loss due to adverse changes in market prices and rates, and typically encompasses exposures such as sensitivity to changes in market interest rates, foreign currency exchange rates, and commodity prices. Danversbank has no exposure to foreign currency exchange or commodity price movements. Because net interest income is Danversbank's primary source of revenue, interest rate risk is a significant market risk to which Danversbank is exposed.
Interest rate risk is the exposure of Danversbank's net interest income in response to movements in interest rates. Net interest income is affected by changes in interest rates as well as by fluctuations in
74
the level and duration of Danversbank's assets and liabilities. Over and above the influence that interest rates have on net interest income, changes in rates may also affect the volume of lending activity, the ability of borrowers to repay variable rate loans, the volume of loan prepayments and refinancing, the availability, mix and cost of deposits and other funding alternatives, and the market value of Danversbank's assets and liabilities.
Exposure to interest rate risk is managed by Danversbank through periodic evaluations of the current interest rate risk inherent in its rate-sensitive assets and liabilities, primarily deposits, borrowings, loans and investment securities, coupled with determinations of the level of risk considered appropriate given Danversbank's capital and liquidity requirements, business strategy and performance objectives. Through such management, Danversbank seeks to manage the vulnerability of its net interest income to changes in interest rates.
Strategies used by Danversbank to manage the potential volatility of its earnings may include:
- •
- Emphasizing the origination and retention of variable rate C&I loans and commercial real estate loans,
adjustable-rate residential mortgage loans and variable rate home equity lines-of-credit;
- •
- Investing in securities with relatively short maturities and/or expected average lives;
- •
- Classifying nearly all of the investment portfolio as "available for sale" in order to provide for flexibility in
liquidity management; and
- •
- Lengthening liabilities such as term certificates of deposit and Federal Home Loan Bank of Boston borrowings as appropriate.
The Asset/Liability Committee, or ALCO, chaired by the Chief Financial Officer and comprised of several members of senior management, is responsible for managing interest rate risk. On a quarterly basis, this committee reviews with the Board of Directors its analysis of our exposure to interest rate risk, the effect subsequent changes in interest rates could have on Danversbank's future net interest income, key interest rate risk strategies and other activities, and the effect of those strategies on Danversbank's operating results. This committee is also actively involved in Danversbank's planning and budgeting process as well as in determining pricing strategies for deposits and loans. Management is aided in these efforts by the use of an independent third party that convenes with management on a quarterly basis for a complete asset/liability analysis and review.
The primary method that ALCO uses for measuring and evaluating interest rate risk is an income simulation analysis. This analysis considers the maturity and interest rate repricing characteristics of all of our interest-earning assets and interest-bearing liabilities, as well as the relative sensitivities of these balance sheet components over a range of interest rate scenarios. Interest rate scenarios tested generally include parallel and flattening/steepening rate ramps over a one-year period, and static, or flat, rates. The simulation analysis is used to measure the exposure of net interest income to changes in interest rates over a specified time horizon, usually a two-year period. The simulations also show the net interest income volatility for up to five years.
For December 31, 2010, we used a simulation model to project changes for three rate scenarios. No simulation was run for the falling rate scenarios given that the Federal Funds rate is currently in the range between 0 and 25 basis points. This analysis calculates the difference between net interest income forecasts for these scenarios compared to the net interest income forecast using a flat rate scenario. In each of these instances, Federal Funds is used as the driving rate.
75
The table below sets forth, as of December 31, 2010, the estimated changes in Danversbank's net interest income that would result.
| |
Net Portfolio Value(2) | Net Interest Income | |||||||||||||||||||
|---|---|---|---|---|---|---|---|---|---|---|---|---|---|---|---|---|---|---|---|---|---|
| |
|
Estimated Increase (Decrease) |
|
Increase (Decrease) in Estimated Net Interest Income |
|||||||||||||||||
Change in Interest Rates (basis points)(1) |
Estimated NPV |
Estimated Net Interest Income |
|||||||||||||||||||
| Amount | Percent | Amount | Percent | ||||||||||||||||||
| |
(Dollars in thousands) |
||||||||||||||||||||
| +300bp | $ | 123,666 | $ | (133,592 | ) | (51.9 | %) | $ | 77,461 | $ | (17,647 | ) | (18.6 | %) | |||||||
| +200bp | 173,152 | (84,106 | ) | (32.7 | %) | 84,955 | (10,153 | ) | (10.7 | %) | |||||||||||
| +100bp | 221,905 | (35,353 | ) | (13.7 | %) | 89,570 | (5,538 | ) | (5.8 | %) | |||||||||||
| 0bp | 257,258 | — | 0.0 | % | 95,108 | — | 0.0 | % | |||||||||||||
- (1)
- Assumes
an instantaneous uniform change in interest rates at all maturities.
- (2)
- NPV is the discounted present value of expected cash flows from interest-earning assets, interest-bearing liabilities and off-balance sheet contracts.
The income simulation model includes various assumptions regarding the re-pricing relationships for each of our products. Many of our assets are floating rate loans tied to the Prime rate or LIBOR, which are assumed to re-price immediately and to the same extent as the change in market rates, according to their contracted index. Many of these credit relationships, however, now have interest rate "floors" at "above market" levels. Many of these loans may not re-price with the first couple of increases in short-term interest rates. Conversely, we have various transaction account products that would not increase or decrease in the same increments or at the same speed. Money market accounts, as an example, are assumed to increase sooner and in larger increments than savings and NOW accounts. These assumptions are based on our prior experience with the changes in rates paid on these non-maturity deposits coincident with changes in market interest rates. The model begins by disseminating data into appropriate repricing buckets. Assets and liabilities are then assigned a multiplier to simulate how much that particular balance sheet item will reprice when interest rates change. The final step is to simulate the timing effect of assets and liabilities with a month-by-month simulation to estimate the change in interest income and expense over the next 12 months.
This analysis indicates the impact of changes in net interest income for the given set of rate changes and assumptions. It does not incorporate any balance sheet growth, and it assumes that the structure and composition of the balance sheet will remain comparable to the structure at the start of the simulation. It does not account for other factors that might impact this analysis, including changes by management to mitigate the impact of interest rate changes or secondary impacts such as changes to our credit risk profile as interest rates change. Furthermore, loan prepayment rate estimates and spread relationships change regularly. Interest rate changes create changes in actual loan prepayment rates that differ from the market estimates incorporated in this analysis. Changes that vary significantly from the assumptions may have significant effects on our net interest income.
For the rising interest rate scenarios, the base market interest rate forecast was increased, on an instantaneous and sustained basis, by 100, 200 and 300 basis points. At December 31, 2010, our net interest income exposure related to these hypothetical changes in market interest rates was within our established guidelines.
There are inherent shortcomings to income simulations, given the number and variety of assumptions that must be made in performing the analysis. The assumptions relied upon in making these calculations of interest rate sensitivity include the level of market interest rates, the shape of the yield curve, the degree to which certain assets and liabilities with similar attributes react to changes in market interest rates, and the degree to which non-maturity deposits, such as checking accounts, react
76
to changes in market rates. Although the analysis shown above provides an indication of Danversbank's sensitivity to interest rate changes at a point in time, these estimates are not intended to and do not provide a precise forecast of the effect of changes in market interest rates on Danversbank's net interest income and may differ from actual results.
Liquidity Risk Management. Liquidity risk is the risk to earnings and capital arising from an organization's inability to meet its obligations without incurring unacceptable losses. This risk is managed by Danversbank's Chief Operating Officer and Chief Financial Officer, who monitor on a daily basis the adequacy of Danversbank's liquidity position. Oversight and updates are provided through weekly meetings of the Finance Department and by the ALCO, which reviews Danversbank's liquidity position on a quarterly basis. The Board of Directors of the Company reviews the adequacy of our liquidity resources on a quarterly basis as well.
Our primary sources of funds are from deposits, customer repurchase agreements, amortization, prepayments, the maturity of loans and mortgage-backed securities and the maturity of other investments, and other funds provided by operations. While scheduled payments from amortization of loans and mortgage-backed securities and maturing loans and investment securities are relatively predictable sources of funds, deposit flows and loan prepayments can be greatly influenced by the interest rate environment, economic conditions and competition. We maintain excess funding in the form of cash and short-term interest-bearing deposits with one or more of our correspondent banking relationships. At December 31, 2010, cash and due from banks and cash equivalents totaled $30.2 million or 1.06% of total assets.
We also rely on borrowings from the FHLBB as an additional funding source. Over the past several years, Danversbank has expanded its use of FHLBB advances to fund growth in the loan portfolio and to assist in the management of its interest rate risk. Danversbank's deposits increased by $334.2 million during the year ended December 31, 2010, and this was augmented by increases in outstanding FHLBB advances of $26.3 million. As of December 31, 2010, we had the ability to borrow an additional $168.4 million from the FHLBB.
We use our liquidity to fund existing and future loan commitments, to fund maturing certificates of deposit and borrowings, to fund other deposit withdrawals, to invest in other interest-earning assets and to meet operating expenses. Danversbank anticipates that it will continue to have sufficient funds and alternative funding sources to meet its commitments.
77
Contractual Obligations. The following table presents information indicating various contractual obligations and commitments of Danversbank as of December 31, 2010 and their respective maturity dates:
| |
Up to One Year |
More than One Year to Two Years |
More than Two Years to Three Years |
More than Three Years to Five Years |
More than Five Years |
Total | |||||||||||||
|---|---|---|---|---|---|---|---|---|---|---|---|---|---|---|---|---|---|---|---|
| |
(In thousands) |
||||||||||||||||||
Federal Home Loan Bank advances |
$ | 207,334 | $ | 13,897 | $ | 18,143 | $ | 6,910 | $ | 118,494 | $ | 364,778 | |||||||
Federal Reserve Bank—discount window |
1,000 | — | — | — | — | 1,000 | |||||||||||||
Repurchase agreements(1) |
45,330 | — | — | — | — | 45,330 | |||||||||||||
Subordinated debt |
— | — | — | — | 29,965 | 29,965 | |||||||||||||
Operating leases |
3,582 | 3,323 | 3,216 | 5,874 | 17,018 | 33,013 | |||||||||||||
Total |
$ | 257,246 | $ | 17,220 | $ | 21,359 | $ | 12,784 | $ | 165,477 | $ | 474,086 | |||||||
- (1)
- All repurchase agreements mature on a daily basis and are secured by obligations of government-sponsored enterprises.
On February 8, 2011, the Company exercised the call provision in the Trust II subordinated debt in the amount of $10,392,000, which consisted of principal and interest of $10,310,000 and $82,000, respectively.
Loan Commitments. Commitments to extend credit are agreements to lend to a customer as long as there is no violation of any condition established in the contract and generally have fixed expiration dates or other termination clauses. The following table presents information indicating various Danversbank's loan commitments outstanding and their respective maturity dates as of December 31, 2010:
| |
One Year or Less |
More than One Year to Two Years |
More than Two Years to Three Years |
More than Three Years to Five Years |
More than Five Years |
Total | |||||||||||||
|---|---|---|---|---|---|---|---|---|---|---|---|---|---|---|---|---|---|---|---|
| |
(In thousands) |
||||||||||||||||||
Commitments to grant loans |
$ | 26,118 | $ | — | $ | — | $ | — | $ | — | $ | 26,118 | |||||||
Unfunded commitments under lines of credit |
400,192 | — | — | — | — | 400,192 | |||||||||||||
Unadvanced funds on construction loans |
22,261 | 17,750 | 1,041 | — | — | 41,052 | |||||||||||||
Commercial and standby letters of credit |
4,002 | 316 | 192 | — | — | 4,510 | |||||||||||||
|
$ | 452,573 | $ | 18,066 | $ | 1,233 | $ | — | $ | — | $ | 471,872 | |||||||
Management of Other Risks. Two additional risk areas that receive significant attention by management and the Board of Directors are operational risk and compliance risk. Operational risk is the risk to earnings and capital arising from control deficiencies, problems with information systems, fraud, error or unforeseen catastrophes. Compliance risk is the risk arising from violations of, or nonconformance with, laws, rules, regulations, prescribed practices, internal policies and procedures or ethical standards. Compliance risk can expose Danversbank to fines, civil money penalties, payment of damages and the voiding of contracts.
78
Danversbank addresses such risks through the establishment of comprehensive policies and procedures with respect to internal controls, the management and operation of its information and communication systems, business contingency and disaster recovery, and compliance with laws, regulations and banking industry "best practice." Monitoring of the effectiveness of policies, procedures and our internal control structure is performed through a combination of Danversbank's internal audit program, through periodic internal and third-party compliance reviews, and through the ongoing attention of our managers charged with supervising compliance and operational controls. Oversight of these activities is provided by the Internal Audit Services department, Risk Committee and the Audit Committee of the Board of Directors of the Company.
Item 8. FINANCIAL STATEMENTS AND SUPPLEMENTARY DATA
The Consolidated Financial Statements of Danvers Bancorp, Inc. begin on page F-1 of this annual report.
Item 9. CHANGES IN AND DISAGREEMENTS WITH ACCOUNTANTS ON ACCOUNTING AND FINANCIAL DISCLOSURE
None.
Item 9A. CONTROLS AND PROCEDURES
Evaluation of Disclosure Controls and Procedures
The Company's President and Chief Executive Officer, Executive Vice President and Chief Operating Officer, Executive Vice President and Chief Financial Officer and other members of its senior management team have evaluated the effectiveness of the Company's disclosure controls and procedures as defined in Rules 13a-15(e) and 15d-15(e) under the Securities Exchange Act of 1934, as amended, (the Exchange Act"), as amended. Based upon their evaluation, the President and Chief Executive Officer, the Executive Vice President and Chief Operating Officer and the Executive Vice President and Chief Financial Officer have concluded that the Company's disclosure controls and procedures, as of the end of the period covered by this report, were effective to provide reasonable assurance that the information required to be disclosed by the Company, including its consolidated subsidiaries, in reports that are filed or submitted under the Exchange Act, is recorded, processed, summarized, and reported, within the time periods specified in the SEC's rules and forms.
The effectiveness of a system of disclosure controls and procedures is subject to various inherent limitations, including cost limitations, judgments used in decision making, assumptions about the likelihood of future events, the soundness of our systems, the possibility of human error, and the risk of fraud. Moreover, projections of any evaluation of effectiveness to future periods are subject to the risk that controls may become inadequate because of changes in condition and the risk that the degree of compliance with policies or procedures may deteriorate over time. Due to such inherent limitations, there can be no assurance that any system of disclosure controls and procedures will be successful in preventing all errors or fraud, or in making all material information known in a timely manner to the appropriate levels of management.
Management's Report on Internal Control Over Financial Reporting
Our management is responsible for establishing and maintaining adequate internal control over financial reporting, as such term is defined in Exchange Act Rules 13a-15(f) and 15d-15(f). Under the supervision and with the participation of our management, including our Chief Executive Officer, Chief Operating Officer and Chief Financial Officer, we conducted an evaluation of the effectiveness of our internal control over financial reporting as of December 31, 2010 based on the framework in Internal Control—Integrated Framework issued by the Committee of Sponsoring Organizations of the Treadway
79
Commission, commonly referred to as the "COSO" criteria. Based on that evaluation, our management concluded that our internal control over financial reporting was effective as of December 31, 2010. Additionally, based upon management's assessment there were no material weaknesses in internal control over financial reporting as of December 31, 2010.
Because of its inherent limitations, internal control over financial reporting may not prevent or detect misstatements. Also, projections of any evaluation of effectiveness to future periods are subject to the risk that controls may become inadequate because of changes in conditions, or that the degree of compliance with the policies or procedures may deteriorate.
Our management assessed the effectiveness of our internal control over financial reporting as of December 31, 2010. In making this assessment, we used criteria set forth by the Committee of Sponsoring Organizations of the Treadway Commission in Internal Control—Integrated Framework. Based on our assessment, we believe that, as of December 31, 2010, our internal control over financial reporting is effective based on those criteria.
Wolf & Company, P.C., the independent registered public accounting firm that reported on the Company's consolidated financial statements, has audited and issued a report on the Company's internal control over financial reporting as of December 31, 2010, which can be found on page F-2 of this report.
Changes in Internal Controls Over Financial Reporting
There were no changes in our internal control over financial reporting during the fourth quarter of the fiscal year ended December 31, 2010, which were identified in connection with management's evaluation required by paragraph (d) of Rules 13a-15 and 15d-15 under the Exchange Act, that have materially affected, or that are reasonably likely to materially affect, the Company's internal controls over financial reporting.
None.
80
ITEM 10. DIRECTORS, EXECUTIVE OFFICERS AND CORPORATE GOVERNANCE.
Directors and Executive Officers
Set forth below are the names and ages of our directors and executive officers and other biographical information. There are no family relationships between any director or executive officer.
Name
|
Position with Company | Age(1) | ||||
|---|---|---|---|---|---|---|
Kevin T. Bottomley |
Chairman, President and Chief Executive Officer | 57 | ||||
Diane C. Brinkley |
Director | 60 | ||||
Robert J. Broudo |
Director | 61 | ||||
Craig S. Cerretani |
Director | 56 | ||||
Brian C. Cranney |
Director | 53 | ||||
John P. Drislane |
Director | 66 | ||||
John R. Ferris |
Director | 53 | ||||
Thomas Ford |
Director | 54 | ||||
Mark B. Glovsky |
Director | 62 | ||||
Neal H. Goldman |
Director | 58 | ||||
Eleanor M. Hersey |
Director | 74 | ||||
David J. Lahive |
Senior Vice President and Chief Credit Officer | 46 | ||||
James J. McCarthy |
Director, Executive Vice President and Chief Operating Officer | 50 | ||||
Michael W. McCurdy |
Executive Vice President, General Counsel and Secretary and Director of Retail Banking | 42 | ||||
Mary C. McGovern |
Senior Vice President and Chief Accounting Officer | 46 | ||||
Mary Coffey Moran, CPA |
Director | 54 | ||||
Jack M. Murray, Jr. |
Senior Vice President and Chief Auditor | 59 | ||||
J. Michael O'Brien |
Director | 56 | ||||
John J. O'Neil |
Director, Executive Vice President and Chief Lending Officer | 56 | ||||
L. Mark Panella |
Executive Vice President and Chief Financial Officer | 55 | ||||
John M. Pereira |
Director | 54 | ||||
Pamela C. Scott |
Director | 58 | ||||
Peter Z. Shabowich |
Senior Vice President and Chief Investment Officer | 48 | ||||
Diane T. Stringer |
Director | 56 | ||||
Michael F. Tripoli |
Director | 52 | ||||
- (1)
- Age is as of December 31, 2010.
Kevin T. Bottomley, President and Chief Executive Officer. Mr. Bottomley currently serves as our President and Chief Executive Officer. Mr. Bottomley became President and Chief Executive Officer of Danversbank in 1996. He became Chairman of the Board of Directors in 2003. Prior to arriving at Danversbank, he was the Chief Lending Officer and Executive Vice President at Boston Private Bank & Trust Company. Mr. Bottomley began his career at Bankers Trust in 1976 in the Asia Pacific division and also worked for many years at The First National Bank of Boston as a Vice President in its Asia Pacific Division in the Reverse Multinational Group and in its London Branch. Mr. Bottomley earned his undergraduate degree from Harvard College in 1974 and earned his M.B.A. from the University of Virginia in 1976. Mr. Bottomley's qualifications to serve on the Board include his demonstrated experience in executive leadership, strategic planning and governance of a public company.
Diane C. Brinkley. Ms. Brinkley served as the President and owner of Murphy's Fruit Mart, Inc. in Danvers, Massachusetts from 1980 until her retirement in 2005. She has been a member of the Board of Directors of Danversbank since 1988. Ms. Brinkley brings to the Board many years of
81
business, management and customer based experience, along with a knowledge of crisis and risk management.
Robert J. Broudo. Mr. Broudo has served as Headmaster of the Landmark School in Beverly, Massachusetts, a private school for students with learning disabilities, since 1990. He has been a member of the faculty holding various positions at Landmark for over 40 years and throughout that time has been an active member of the North Shore community. Mr. Broudo served on the Boards of Trustees for the Waring and Glen Urquhart Schools. He currently serves on the Board of Trustees for the Brookwood School and is Chair of the Citizens' Advisory Council of the Beverly, Massachusetts Police Department. He has been a director at Danversbank since 1998. Mr. Broudo is a member of the Company's Governance and Compensation Committees. We believe Mr. Broudo's many years of service to the community and managerial experience at Landmark School have provided him with the qualifications to serve on the Board.
Craig S. Cerretani. Mr. Cerretani is a founding principal of Longfellow Financial, LLC and currently manages the company's Executive Benefit Practice in Boston, Massachusetts. Mr. Cerretani works extensively in the areas of executive and employee benefits planning as well as in wealth transfer techniques for closely held and/or family owned businesses. Mr. Cerretani earned his B.A. from The College of the Holy Cross in 1979. Additionally, Mr. Cerretani serves on a number of local community boards and provides leadership to a local community groups. Mr. Cerretani serves as the Chair of the Company's Governance Committee. Mr. Cerretani brings leadership, management and executive compensation skills to the Company's Board.
Brian C. Cranney. Mr. Cranney is President of the Cranney Companies in Danvers, Massachusetts, a diversified line of companies providing electrical, communications, HVAC and fabrication services for retail and commercial customers, which he founded in 1985. As president of the Cranney Companies, Mr. Cranney oversees the budget of a $16 million dollar company, determines costs for jobs and works on contract negotiations. He is an active member of the community, serving on several local, private company and non-profit Boards. As a member of the Board of Directors, he serves on the Company's Governance and Executive Committees. We believe Mr. Cranney's many years of hands-on business experience combined with his proven leadership skills make him an excellent member of the Board.
John P. Drislane. Mr. Drislane has been an independent commercial real estate developer since 2000 and is the former owner of Essex Bituminous Corp. Essex Bituminous Corp. was a manufacturer and supplier of construction materials to the heavy and highway construction industries. As head of the company, Mr. Drislane was involved the day-to-day running of the company including public relations, contract negotiations and labor relations, banking relations, and financial management. Mr. Drislane earned his B.A. in Finance from Babson College in 1970. He serves as the Chair of the Company's Audit Committee. With his many years of management experience and service to the community, we believe Mr. Drislane is well qualified to serve on the Board.
John R. Ferris. Mr. Ferris is the President of Boston Bay Group, LLC, an independent compensation and management consulting firm. From 2004 to 2010 he was the President and principal of Copley Capital, LLC, a management consulting firm. From 1995 to 2004, he served as President and COO of Mobility Services International. Prior to his tenure at Mobility Services, he was CEO of BioQuest and a Vice President of Freudenberg USA. He earned his B.A. in Economics from Boston College in 1979. He serves as Chair of the Company's Compensation Committee and as a member of the Governance Committee. Mr. Ferris brings his skills in the areas of compensation, strategic planning and marketing to the Board.
Thomas Ford. Mr. Ford has served as President of T Ford Company, Inc., a civil and environmental contracting company since 1987. In addition, he is principal in a number of real estate
82
developments that include residential and commercial land development, new home construction and commercial rental property. Mr. Ford earned his B.S. in Civil Engineering at Northeastern University in 1978 and his M.S. in Civil Engineering at the Georgia Institute of Technology in 1982. He also earned his M.S. in Real Estate Development at the Massachusetts Institute of Technology in 1985. In addition to serving on the Board at Danversbank, Mr. Ford is also on the Board of Hospice of the North Shore. He is active in the community, contributing to charitable and civic events. He serves on the Company's Audit Committee. Mr. Ford brings business, management, and customer-based experience to the Board. With his many years as head of T Ford Company, he also brings extensive leadership experience.
Mark B. Glovsky. Mr. Glovsky is the Managing Member of Glovsky & Glovsky LLC, a general practice law firm located in Beverly, Massachusetts. He has been with the firm since 1973. Mr. Glovsky earned his undergraduate degree from Dartmouth College in 1970 and his law degree from Boston College Law School in 1973. Mr. Glovsky has been involved in many community and non-profit organizations throughout his career, including serving as Chairman of the Board of Directors of the North Shore Chamber of Commerce and Chairman of the Board of Trustees of Montserrat College of Art. We believe Mr. Glovsky's qualifications to serve on the Board include his extensive legal and business experience along with his involvement in the North Shore community.
Neal H. Goldman. Mr. Goldman has served as Vice President for Industry Relations at Iron Mountain Group in Boston, Massachusetts since 1999. He earned his B.S. in Business from Boston University in 1973 and his M.B.A. from Babson College in 1979. Mr. Goldman serves as the President of the Iron Mountain Charitable Foundation, and on the Board of Directors for the Jewish Rehab Center in Swampscott, MA. Mr. Goldman serves on the Board of Directors for the Danversbank Charitable Foundation. He is a member of the Company's Compensation Committee. We believe Mr. Goldman's qualifications to serve on the Board of Directors include his demonstrated experience in executive leadership, strategic planning, and governance of a public company.
Eleanor M. Hersey. Ms. Hersey is a retired treasurer of The Wakefield Corporation, a position she held from 1975 to 1989. As treasurer, she was responsible for the corporation's financials. Since 2001, she has been a partner and treasurer of Sunset Acres LLC, a real estate and investment company. In addition to her professional accomplishments, Ms. Hersey is actively involved in the community. She has been on the Board of Directors of the Danvers Community Council since 1994. As part of her work with the Community Council, she co-founded the Danvers People to People Food Pantry later in 1994. These organizations provide valuable services to the Danvers community. Ms. Hersey serves on the Audit committee of Danversbank. She brings experience in accounting, finance, and business management to the Board.
David J. Lahive. Mr. Lahive currently serves as our Senior Vice President and Chief Credit Officer. Mr. Lahive is primarily responsible for the Company's credit quality administration, loan risk oversight, management of the loan review process and lending policies. Mr. Lahive joined Danversbank in May of 2002 as the Senior Vice President of Commercial Real Estate Lending and he was appointed Senior Credit Officer in October of 2007. He joined Danversbank from MetroWest Bank where he was the Senior Vice President of Commercial Real Estate Lending. Prior to MetroWest Bank, he was employed by The Boston Five Cents Savings Bank as a Commercial & Construction Lending Officer.
James J. McCarthy. Mr. McCarthy currently serves as our Executive Vice President and Chief Operating Officer. Mr. McCarthy was the President and Chief Executive Officer of Revere Federal Savings Bank and joined Danversbank as Executive Vice President when the merger of the two institutions took place in September 2001. Mr. McCarthy worked at Revere Federal Savings Bank for 16 years prior to the merger and became the Chief Operating Officer of Danversbank in 2003. Prior to Revere Federal, Mr. McCarthy worked at Ernst & Young LLP for five years. Mr. McCarthy received a B.S. in Accounting from Northeastern University and became a CPA in 1983. Mr. McCarthy currently
83
oversees the Finance, Retail Banking, Risk Management, Compliance, Facilities, Information Technology and Investment Departments of Danversbank. Mr. McCarthy brings business management, finance and accounting, along with industry knowledge, leadership, and strategic planning experience to the Board.
Michael W. McCurdy. Mr. McCurdy currently serves as our Executive Vice President, General Counsel, Secretary and Director of Retail Banking. Mr. McCurdy was the President and Chief Executive Officer of BankMalden and joined Danversbank as a Senior Vice President for Legal and Corporate Operations when the merger of the two institutions took place in February, 2007. Prior to his tenure at BankMalden, Mr. McCurdy worked as an associate with a Boston law firm. Mr. McCurdy earned his B.A. in Political Science from University of California at Santa Barbara in 1990 and his J.D. from Suffolk Law School in 1996.
Mary C. McGovern. Ms. McGovern currently serves as our Senior Vice President and Chief Accounting Officer. Ms. McGovern was promoted to Chief Account Officer in December 2006 and Senior Vice President in September of 2008. Ms. McGovern joined Danversbank in May of 1999 as an Assistant Treasurer in the Finance Department. She has 20 years of banking experience having worked as a Financial Officer at Boston Private Bank & Trust Company for seven years and for four years as Assistant Controller at Capital Crossing Bank in Boston. She has also held the positions of Assistant Vice President and Controller, Vice President, and First Vice. She manages the Finance Department, which is responsible for all financial reporting, wire transfer processing, budgeting, account reconciliations as well as maintaining all aspects of the general ledger. Ms. McGovern received her B.A. in Mathematics from Emmanuel College and her M.B.A. in Finance at Babson College.
Mary Coffey Moran, CPA. Ms. Moran managed her own financial consulting business, MCM Consulting. She founded the company in 2001. Ms. Moran earned her B.A. in Economics from The College of the Holy Cross in 1977 and an M.B.A. and M.S. in Accounting from Northeastern University in 1979. She currently serves as a Trustee at The College of the Holy Cross. Ms. Moran serves on the Company's Audit Committee and is the Audit Committee's Financial Expert. With her background in finance and accounting, Ms. Moran brings a valuable skill set to the Board.
Jack M. Murray, Jr. Mr. Murray currently serves as our Senior Vice President and Chief Auditor. Mr. Murray joined Danversbank in 2002 as Vice President, Risk Management. He previously held positions with MetroWest Bank as Senior Vice President—Director of Internal Audit from 1998 to 2001, and as Senior Manager at KPMG LLP from 1994 to 1998. Mr. Murray oversees the Internal Audit function. He reports directly to the Audit Committee of the Board of Directors and administratively to James J. McCarthy, Executive Vice President & Chief Operating Officer.
J. Michael O'Brien. Mr. O'Brien is Chief Executive Officer and President of Eagle Air Freight, Inc. and Trustee of O'Brien Realty Trust of Chelsea, Massachusetts. He has held both positions since 1981. Mr. O'Brien serves as the Company's Lead Director and is a member of its Compensation and Executive Committees. Mr. O'Brien brings his experience and expertise in business management, company leadership, and corporate governance to the Board.
John J. O'Neil. Mr. O'Neil currently serves as our Executive Vice President and Chief Lending Officer. Mr. O'Neil joined Danversbank as Executive Vice President, Senior Lending Officer in November of 2001. As a member of senior management, Mr. O'Neil is directly responsible for managing Danversbank's commercial and residential loan portfolios and developing new loan products. Mr. O'Neil joined Danversbank from MetroWest Bank, where he was Executive Vice President, Senior Lender. He was previously employed by Boston Private Bank & Trust Company, where he was Senior Vice President, Commercial Lending, and USTrust and Patriot Bank, where he was Senior Vice President, Commercial Lending. Mr. O'Neil also serves as President of One Conant Capital, a
84
subsidiary of Danversbank. Mr. O'Neil's extensive commercial lending, management and leadership experience provides value to the Board's deliberations and decision-making.
L. Mark Panella. Mr. Panella currently serves as our Executive Vice President and Chief Financial Officer. Mr. Panella joined the Danversbank in July of 1995 as Senior Vice President and Chief Financial Officer. He previously worked at Boston Private Bank & Trust Company as the Chief Financial Officer, Senior Operations Officer and Treasurer. He has also worked for two companies that provided software solutions to the banking industry. Mr. Panella is primarily responsible for the Company's financial reporting, investor relations, budgeting, insurance contract negotiations and overall accounting and regulatory compliance. He earned his B.A. in Economics from Dartmouth College in 1978.
John M. Pereira. Mr. Pereira has served as President of Combined Properties, Inc. since 1991, where he is currently Chief Executive Officer. Prior to joining Combined Properties Mr. Pereira was a partner at the law firm of Sherin and Lodgen. He earned his B.S. from the University of Massachusetts at Dartmouth and his J.D. from Boston College Law School in 1981. In addition to his work with the Board, he serves on the Board of Directors for the Malden YMCA, South Shore YMCA, and the Malden-based non-profit, Triangle. In addition to his position at Combined Properties, Mr. Pereira is a registered Real Estate Broker. As an attorney, Mr. Pereira brings his extensive legal and commercial real estate experience to the Board, along with his work in the business and non-profit communities.
Pamela C. Scott. Ms. Scott is President and CEO of LVCC, Inc., a corporate and non-profit business development and organizational consulting firm, founded in 2003. Ms. Scott has over 30 years of sales and management experience in financial and investment services. Previously, Ms. Scott managed client investments as a Senior Vice President at State Street Corporation and also led State Street Global Advisors' Charitable Asset Management department, serving non-profit organizations. Ms. Scott earned a B.A. in Economics from Rice University in 1973 and an M.B.A. in Finance from the Tuck School of Business at Dartmouth College in 1975. Ms. Scott brings investment management and non-profit organizational experience to the Company's Board.
Peter Z. Shabowich. Mr. Shabowich currently serves as our Senior Vice President and Chief Investment Officer. Mr. Shabowich joined Danversbank in June of 1983. Mr. Shabowich manages the Company's investment portfolio, is responsible for external borrowings, and formulates ALCO strategies. Mr. Shabowich works with the loan department on interest rate swaps and derivative products. In addition, Mr. Shabowich serves as the Company's Director of Security. Mr. Shabowich earned a B.A. from Merrimack College in 1986, his M.B.A. from Salem State College in 1993 and his M.S. in Criminal Justice Administration from Western New England College in 1995.
Diane T. Stringer. Ms. Stringer has served as the President and Chief Executive Officer of Hospice of the North Shore since 1989. She earned her B.S. in Nursing from Case Western Reserve University in 1976 and her M.S. in Health Policy from Harvard University in 1982. Ms. Stringer brings business and management experience, along with her extensive background in customer relations and care to the Board.
Michael F. Tripoli. Mr. Tripoli is a founding partner in the firm Grandmaison & Tripoli, LLP, a CPA firm located in Danvers, Massachusetts and founded in 1985. He earned his undergraduate degree from Merrimack College in 1980 and a Master of Science in Taxation from Bentley College in 1990. Mr. Tripoli is actively involved in several local community organizations, including the American Institute of CPA's, the Massachusetts' Society of CPA's, and the North Shore Chamber of Commerce. Mr.Tripoli serves on the Company's Audit and Risk Committees. He is also a past member of the Board of Advisors of Bishop Fenwick High School and the Past-Treasurer and Member of the Board of Trustees of North Shore Music Theater. Mr. Tripoli's experience and background in accounting and finance provides value to the Board.
85
Section 16(a) Beneficial Ownership Reporting Compliance
The Company's common stock is registered with the SEC pursuant to Section 12 of the Exchange Act. Accordingly, our directors, senior management and beneficial owners of more than 10% the Company's common stock are required to disclose beneficial ownership and changes in beneficial ownership on Forms 3, 4 and 5, which are filed with the SEC. Based on the Company's review of copies of these reports, the Company believes its directors and senior management timely complied with the reporting requirements of Section 16(a) for the period ended December 31, 2010.
Code of Business Conduct and Ethics
The Company has adopted a Code of Business Conduct and Ethics (the "Code") that set forth standards of ethical business conduct for all directors, officers and employees of the Company. Additionally, the Code of Business Conduct and Ethics is in conformity with the requirements of the Sarbanes-Oxley Act of 2002 and the NASDAQ Stock Market LLC listing standards. A copy of the Code and any amendments to or waivers of the requirements under the Code, are available on the Company's website under the investor relations tab at www.danversbank.com.
The board of directors has established a means for employees, customers, suppliers, stockholders and other interested parties to submit confidential and anonymous reports of suspected or actual violations of our Code of Business Conduct and Ethics relating, among other things, to:
- •
- Accounting practices, internal accounting controls or auditing matters and procedures;
- •
- Theft or fraud of any amount;
- •
- Insider trading;
- •
- Performance and execution of contracts;
- •
- Conflicts of interest; and
- •
- Violations of securities and antitrust laws.
Any employee, stockholder or other interested party can submit a report to the Audit Committee either in writing to: Internal Audit Services, P.O. Box 161, Danvers, Massachusetts 01923; or by calling the Ethics Reporting Program at (800) 765-3277. Such reports may be submitted confidentially or anonymously. In addition, a report may be submitted by email to audit.services@danversbank.com. (Please note, however, that anonymity cannot be maintained for email.)
Nomination Process
There have not been any material changes to the procedures by which stockholders may submit nominees to the Board of Directors.
Audit Committee
The Audit Committee currently consists of John P. Drislane (Chair), Thomas Ford, Eleanor M. Hersey, Mary Coffey Moran and Michael F. Tripoli. The Board of Directors has determined that Ms. Moran qualifies as an "audit committee financial expert" as defined by the SEC and that all members of the Audit Committee are independent and financially sophisticated in accordance with the listing standards of the NASDAQ Stock Market LLC.
86
ITEM 11. EXECUTIVE COMPENSATION.
Compensation Discussion and Analysis
This section provides a description of the roles and responsibilities of the Compensation Committee of the Company's Board of Directors. Additionally, this section details the Company's executive compensation philosophy and contains a discussion of each material element of the Company's executive officer compensation program as it relates to the following "named executive officers" (the "Named Officers") whose compensation information is detailed more completely in the tables contained in the following section:
| Kevin T. Bottomley | President & Chief Executive Officer | |
James J. McCarthy |
Executive Vice President/Chief Operating Officer |
|
John J. O'Neil |
Executive Vice President/Chief Lending Officer |
|
L. Mark Panella |
Executive Vice President/Chief Financial Officer |
|
Michael W. McCurdy |
Executive Vice President/General Counsel and Secretary/Director of Retail Banking |
|
Donat A. Fournier(1) |
Executive Vice President/Wealth Management |
- (1)
- Mr. Fournier voluntarily resigned from his position effective December 6, 2010. Had he remained with the Company through December 31, 2010, he would have been a Named Officer, thus his information will be disclosed in this Compensation Discussion and Analysis where appropriate. Mr. Fournier began his employment with the Company on November 1, 2009.
Executive Summary
The Company's success depends on our ability to hire and retain highly qualified executives that have the potential to influence our performance and enhance shareholder value over time. The Company seeks to accomplish this goal in a way that is aligned with the long-term interests of the Company's shareholders. The Compensation Committee oversees the executive compensation program and determines the compensation for the Company's executive officers. The Committee believes that the Named Officers were instrumental in helping the Company thrive and achieve strong financial performance in the challenging economic environment in 2010.
In 2010, the Company reported relatively strong financial results. At year end, the Company recorded net income of $18.2 million and assets of $2.9 billion. The Company's total deposit balances increased by $334 million, or 18.9% for the year ended December 31, 2010, and the Company opened new branch locations in Boston and Needham. In 2010, the Company reported loan growth (including loans held for sale) of $113 million and its asset quality metrics remained relatively stable. Also, the Company completed the successful integration of Beverly National Corporation following the merger of Beverly National Bank and Danversbank in early, 2010. For additional information, see Item 7—Management's Discussion and Analysis of Financial Condition and Results of Operation on page 62.
The Company believes that the executive compensation program has served the Company well, as evidenced by the Company's strong performance in 2010.
Role of the Compensation Committee
The Compensation Committee is responsible for discharging the Board's responsibilities regarding the compensation philosophy, program and practices as they relate to the Company's directors and Named Officers. The primary purpose of the Compensation Committee is to develop, approve and
87
implement compensation policies and plans that are fair and appropriate to attract, retain and motivate executives to further the Company's long-term strategic plan and drive stockholder value.
The Compensation Committee meets throughout the year and held six meetings in 2010. The frequency of the meetings was indicative of the work undertaken by the Compensation Committee to provide for a reasonable, competitive and sound compensation program. Four members of the Board serve on the Compensation Committee, each of whom is independent.
Use of Consultants
The Compensation Committee has the authority to engage independent compensation consultants to assist it in the compensation process. The consultants are retained by and report directly to the Compensation Committee. The Compensation Committee places no restrictions on consultants within the scope of contracted services. The Compensation Committee does not prohibit management from engaging these consultants for other services; however, any engagements must be approved by the Compensation Committee. The consultants provide expertise and information about competitive trends in the employment marketplace, including established and emerging compensation practices at other companies.
During 2010, the firm of Pearl Meyer & Partners ("PM&P"), a nationally-recognized executive compensation firm was engaged by the Company to serve as the Compensation Committee's independent compensation consultant for the purpose of evaluating the Company's compensation philosophy and objectives and compensation programs, including a comprehensive review of executive officer and Board compensation and providing ongoing advice to the Compensation Committee throughout the year. Additionally, the Compensation Committee utilized the services of the law firms of Goodwin Procter LLP and Hogan Lovells LLP on issues related to executive and board compensation. The Compensation Committee has direct access to these legal and compensation advisors throughout the year.
Role of Executive Officers and Management
The Compensation Committee regularly meets in executive session. The Compensation Committee occasionally requests one or more members of executive or senior management to be present at committee meetings where executive compensation and Company or individual performance are discussed and evaluated. Executives may provide insight, suggestions or recommendations regarding executive compensation. However, only Compensation Committee members vote on decisions regarding executive compensation.
The Company's President and Chief Executive Officer provides recommendations to the Compensation Committee on matters of compensation philosophy, performance measures, plan design and the general guidelines for executive officer compensation and these recommendations are then considered by the Compensation Committee. The Compensation Committee meets with the President and Chief Executive Officer to discuss his performance and compensation package, but ultimately decisions regarding his compensation is made solely based upon the Compensation Committee's deliberations, as well as input from the compensation consultant as requested. The Compensation Committee reviews recommendations from the President and Chief Executive Officer, as well as input from the compensation consultant as requested, in its approval of compensation decisions regarding other executive officers.
Compensation Philosophy and Objectives
The Compensation Committee believes that the most effective compensation program is one that is designed to attract and retain qualified and experienced officers and, at the same time, is reasonable, competitive, and aligned with our compensation (or pay for performance) philosophy. The
88
Compensation Committee uses a combination of widely recognized industry surveys and publicly available data from proxy statements for purposes of comparing appropriate compensation levels for all of the Company's senior executives. In utilizing these surveys and data, the Compensation Committee gives particular attention to banks of comparable size and geographic location, and seeks to ensure the Company's compensation programs are reasonably structured when compared with banking franchises of similar size, scope and business model.
Our philosophy is to align our executive compensation with performance which is represented through a combination of short and long-term incentives. This allows us to target market median total compensation for meeting our performance goals while varying actual compensation to reflect our actual performance both short-term and long-term. We believe that superior performance should be rewarded with above-average pay (e.g., 75th percentile) while less than average performance should result in lower than average pay. We recognize that the pay-performance relationship is dynamic and varies year to year. However, our goal is that sustained high performance should be rewarded by above market total compensation.
Compensation Benchmarking
In late 2009, following the acquisition of Beverly National Corporation, the Compensation Committee instructed PM&P to update the Peer Group used by the Compensation Committee to make compensation decisions to ensure that it included companies of similar asset size and complexity. As a result, the 2010 Peer Group was updated and now consists of 24 institutions ranging from $1 billion to $5 billion in total asset size.
The Peer Group was as follows:
| Assets of $1 Billion—$5 Billion | ||
|---|---|---|
• Independent Bank Corp. |
• Suffolk Bancorp |
|
• Hudson Valley Holding Corp. |
• Northfield Bancorp, Inc. (MHC) |
|
• Washington Trust Bancorp, Inc. |
• Dime Community Bancshares, Inc. |
|
• Tompkins Financial Corporation |
• WSFS Financial Corporation |
|
• Berkshire Hills Bancorp, Inc. |
• TrustCo Bank Corp NY |
|
• Financial Institutions, Inc. |
• Sun Bancorp, Inc. |
|
• Camden National Corporation |
• Provident New York Bancorp |
|
• State Bancorp, Inc. |
• Lakeland Bancorp,Inc. |
|
• Arrow Financial Corporation |
• Smithtown Bancorp, Inc. |
|
• Century Bancorp, Inc. |
• Kearny Financial Corp (MHC) |
|
• Flushing Financial Corporation |
• OceanFirst Financial Corp |
|
• Oritani Financial Corp (MHC) |
• First of Long Island Corporation |
|
2010 Compensation Elements and Decisions
In 2010, the compensation of the Named Officers primarily consisted of the following elements:
- •
- base salaries;
- •
- annual cash bonuses;
- •
- equity incentive awards;
- •
- retirement benefits; and
- •
- perquisites and other personal benefits.
89
Base Salaries
The Company provides its executive officers with an annual base salary to compensate them for services rendered during the year. The Compensation Committee targets annual base salary ranges that are competitive with the market median (e.g. 50th percentile) for each executive's specific role. Competitive pay ranges represent a range +/-15% of the market median to provide guidelines for the Compensation Committee in making pay decisions. Actual pay levels for each executive are reviewed and determined annually based on an assessment of the executive officer's level of achievement and performance in the role. Merit increases normally take effect in January of each year. During its review of base salaries for executives, the Compensation Committee considered:
- •
- market data;
- •
- an internal review of the executive's compensation, both individually and relative to other executive officers;
- •
- the individual performance of the executive;
- •
- the qualifications, performance and contributions of the officer; and
- •
- the Company's financial condition and results of operations.
In 2010, the Compensation Committee set the annual base salaries for the Named Officers at levels that were consistent with the market analysis and pay guidelines developed by PM&P and reflective of the Compensation Committee's assessment of the individual officer's level of achievement, experience and performance.
In certain cases, the annual base salary for a Named Officer exceeded the 50th percentile of the Peer Group. In these cases, the Compensation Committee determined that the unique leadership and experience of these individuals warranted an annual base salary that exceeded the median level but was still within the market range guidelines for the position.
Named Officer
|
2010 Base Salary | Increase | |||||
|---|---|---|---|---|---|---|---|
| Mr. Bottomley | $ | 493,765 | $ | 23,512 | |||
| Mr. McCarthy | $ | 270,000 | $ | 15,020 | |||
| Mr. O'Neil | $ | 261,145 | $ | 12,435 | |||
| Mr. Panella | $ | 216,320 | $ | 8,320 | |||
| Mr. McCurdy(1) | $ | 190,000 | $ | 10,000 | |||
| Mr. Fournier(2) | $ | 261,332 | — | ||||
- (1)
- Mr. McCurdy
was promoted from Senior Vice President to Executive Vice President in March, 2010 and on July 2, 2010 his base salary was
increased to $210,000. Mr. McCurdy's annualized salary for 2010 was $200,370.
- (2)
- 2010 was Mr. Fournier's first full year of employment with the Company.
Short-term Incentives
The Company's Annual Incentive Plan (the "Incentive Plan") is designed to recognize and reward employees for their collective contributions to the Company's success. The Incentive Plan rewards participants based on overall performance reflecting a combination of Company and individual performance goals that are critical to the Company's growth and profitability.
In 2010, the Company's Named Officers were eligible to receive an annual cash bonus as part of the Company's Incentive Plan. The Incentive Plan provides for cash target awards of 40% of annual base salary for the President and Chief Executive Officer and 35% of annual base salary for the other
90
Named Officers. The actual opportunity for each executive ranges from 50% of target for achieving threshold or minimum performance to 150% of target for achieving superior performance. If acceptable performance for the Company or the executive is not achieved at least at threshold level, an incentive award will not be paid.
The actual bonuses awarded under the Incentive Plan are determined at the end of the fiscal year based on a combination of Company and individual performance.
Funding and Description of the Incentive Plan
The funding of the Company's Incentive Plan was based on the Company achieving 75% of its budgeted net income for 2010. Once the Company achieved this target, the Incentive Plan was funded and the Company's employees were eligible to receive a cash bonus under the Incentive Plan. In the event that the Company's actual net income for 2010 did not equal at least 75% of the budgeted net income figure, the Incentive Plan pool would not fund and no cash bonuses would be paid out.
To determine the amount of the pool that would be used to pay employee cash bonuses, the Compensation Committee, in consultation with members of the Company's executive management team and PM&P, defined a set of Company performance metrics that were critical to the Company's success in 2010. The Company's performance in these areas was then compared to the results achieved by those companies in the Company's Peer Group and, based on the Company's favorable performance relative to those in the 80th percentile of its Peer Group, employees were then eligible to receive a cash bonus.
The Compensation Committee defined eight specific areas of performance that were to be used to measure the Company's performance against that of its peers to determine the amount of bonus pool that was available for payment to Company employees. Specifically, the Company's performance in the following areas was measured against the composite performance of those companies in the 80th percentile of the Company's Peer Group: (1) loan growth; (2) deposit growth; (3) non-interest income as a percentage of average assets; (4) cost of interest bearing liabilities; (5) total assets per full-time employees; (6), total deposits per full-time employee; (7) non-performing loans as a percentage of total loans; and, (8) net charged off loans as a percentage of total loans. If the Company's performance in a specific metric exceeded the performance of the 80th percentile in its Peer Group, the full percentage of the bonus assigned to that metric was paid out. If the Company's performance did not exceed the 80th percentile, the percentage achieved relative to the 80th percentile was paid out.
The following table sets forth the performance metrics and their assigned weights:
Danvers Bancorp, Inc. and Subsidiaries
Incentive Compensation Metrics
Metric
|
% of Total Available Bonus |
|||
|---|---|---|---|---|
| Loan Growth | 5.00 | % | ||
| Deposit Growth | 5.00 | % | ||
| Non-Interest Income as a Percentage of Average Assets | 10.00 | % | ||
| Cost of Interest-Bearing Liabilities | 10.00 | % | ||
| Total Assets per Full-time Employee | 12.50 | % | ||
| Total Deposits per Full-time Employee | 12.50 | % | ||
| Non-Performing Loans as a Percentage of Total Loans | 12.50 | % | ||
| Net Charged Off Loans as a Percentage of Total Loans | 12.50 | % | ||
| Budget-to-Actual | 20.00 | % | ||
In addition to Company performance, individual performance goals were established for the purpose of evaluating the performance of individual employees. The individual performance goals for Named Officers are determined by their role, the members of the executive management team and, in the case of the President and Chief Executive Officer, the Compensation Committee.
91
Payment of Annual Cash Incentive
In 2010, the Company reported net income of $18.2 million against a budgeted net income figure of $14.8 million. As a result, the Incentive Plan was funded and the Company's employees were eligible to receive a cash bonus.
Additionally, the Company successfully achieved 88.66% of the performance goals that were established in the Incentive Plan. The following table sets forth the Company's performance in specified areas compared to the performance of the financial institutions in the 80th percentile of the Company's Peer Group:
Danvers Bancorp, Inc. and Subsidiaries
Incentive Compensation Percentage Payout
Metric
|
Peer Group 80th Percentile |
Danvers Bancorp, Inc. |
Performance Relative to Peer Group 80th Percentile |
% of Potential Bonus |
% of Bonus Paid |
|||||||||||
|---|---|---|---|---|---|---|---|---|---|---|---|---|---|---|---|---|
Loan Growth |
6.07% | 6.00% | 98.91% | 5.00% | 4.95% | |||||||||||
Deposit Growth |
10.21% | 20.67% | 100.00% | 5.00% | 5.00% | |||||||||||
Non-Interest Income as a Percentage of Average Assets |
1.17% | 0.44% | 37.54% | 10.00% | 3.75% | |||||||||||
Cost of Interest-Bearing Liabilities |
1.13% | 1.70% | 49.56% | 10.00% | 4.96% | |||||||||||
Total Assets per Full-time Employee |
6.10 | 7.02 | 100.00% | 12.50% | 12.50% | |||||||||||
Total Deposits per Full-time Employee |
5.12 | 5.44 | 100.00% | 12.50% | 12.50% | |||||||||||
Non-Performing Loans as a Percentage of Total Loans |
1.24% | 1.05% | 100.00% | 12.50% | 12.50% | |||||||||||
Net Charged Off Loans as a Percentage of Total Loans |
0.26% | 0.15% | 100.00% | 12.50% | 12.50% | |||||||||||
YTD Actual |
YTD Budget |
|||||||||||||||
Budget-to-Actual |
$ | 18,201 | $ | 14,813 | 100.00% | 20.00% | 20.00% | |||||||||
|
2010 Performance: |
88.66% |
||||||||||||||
After reviewing the Company's performance in these areas, and in consideration of its successful integration of the Beverly National Corporation and the conversion of Beverly National Bank, the Compensation Committee exercised its discretion and set the bonus payout at 90% of target for all eligible employees.
In addition to the cash bonuses awarded under the Company's Incentive Plan, the Compensation Committee considers additional Company and individual performance factors when making bonus awards to Named Officers.
Despite continued uncertainty and instability in the financial services industry throughout 2010, the Company's performance remained strong. The Company was able to outperform its Peer Group in a majority of the performance goals established by the Compensation Committee, successfully complete the integration of the Beverly National Bank franchise following its conversion in February, 2010, and continue its branch expansion into new markets, including Boston and Needham. The Compensation Committee considered these achievements in addition to its evaluation of the individual performance of the Company's Named Officers.
92
After reviewing the Company's performance in these areas combined with its evaluation of the individual achievement of each Named Officer, the Compensation Committee authorized incentive payments for Named Officers for the fiscal year 2010. In accordance with the Incentive Plan, each Named Officer can receive incentive awards ranging from 0% to 150% of their target. In the case of the President and Chief Executive Officer, the Chief Operating Officer and Chief Lending Officer, the Compensation Committee awarded a bonus equivalent to 150% of the target awards to reflect superior individual performance and leadership. The Compensation Committee awarded the Chief Financial Officer and General Counsel/Director of Retail Banking cash incentive awards that were equivalent to 125% of the target incentive level.
The Company's Executive Vice President and Director of Wealth Management resigned effective December 6, 2010. In consideration of his service to the Company throughout 2010, his efforts in reorganizing the Danversbank Wealth Management Group following the integration of the Beverly National Trust department, and consistent with Company practice regarding the payment of its cash bonuses, the Compensation Committee exercised it discretion and awarded him a bonus of 100% of his targeted bonus payout.
The awards were within the plan guidelines and reflect individual and Company performance. We report any awards above the 90% funded Incentive Plan amounts as discretionary bonuses in our Summary Compensation Table since these individual awards were above the Incentive Plan funding target.
Long-Term Incentives
2008 Stock Option and Incentive Plan. In 2008, the stockholders approved the Danvers Bancorp, Inc. 2008 Stock Option and Incentive Plan (the "Stock Plan") to provide officers, employees and directors of the Company with additional incentives to promote the growth and performance of the Company, to align management and Board interests with those of the Company's stockholders, and provide a means for the Company to attract and retain superior employees and directors.
Employees and outside directors of the Company or its subsidiaries are eligible to receive awards under the Stock Plan. Awards may be granted in a combination of incentive and non-statutory stock options or restricted stock awards. The exercise price of options granted under the plan may not be less than the fair market value on the date the stock option is granted.
On February 4, 2010, the Compensation Committee approved the restricted stock and stock option grants to the directors of the Company and five (5) members of senior management, including the Named Officers. Awards were made within regulatory limits and in line with the Company's compensation philosophy. In making award decisions, the Compensation Committee reviewed regulatory guidelines, industry and market data, and input provided by independent compensation consultants. In particular, the Compensation Committee considered the stock award grants of converted financial institutions in determining stock award grants for the members of the executive and senior management teams. The Compensation Committee also considered recommendations from the Chief Executive Officer for grants to other Named Officers.
In addition, on November 2, 2010, the Compensation Committee approved a stock option grant to a new member of senior management. The decision to grant stock awards to a number of officers at the Company is consistent with the goal of compensating employees for sustained long-term growth and achieving shareholder value, as stock options deliver value only when the value of the Company's stock increases.
All stock options awarded to the Named Officers were incentive stock options, to the maximum extent permitted by law. All awards of restricted stock and options on common stock reflected in the Stock Compensation Table for Named Officers reflect a five-year vesting schedule (20% per year).
93
Pursuant to the awards, all awardees, including the Named Officers, are entitled to cash dividends on common stock awards, whether such awards are vested or not. Currently, the cash dividend rate on restricted stock is $0.04 per share per quarter.
Vesting of an option or restricted stock award will accelerate upon the occurrence of the Named Officer's death or disability. Upon the occurrence of an event constituting a change in control of the Company as defined in the Stock Plan, all stock options will become fully vested, and all restricted stock awards then outstanding will vest free of restrictions.
Retirement Benefits
401(k) Plan. The Company provides all of its employees, including the Named Officers, with tax-qualified retirement benefits through the Company's 401(k) plan. We believe that a 401(k) plan is an attractive retirement vehicle in recruiting superior officers. All Named Officers that meet the eligibility requirements participate in the 401(k) plan on a non-discriminatory basis. Named Officers, like other employees, may begin deferring compensation as of the first day of the month following the completion of twelve months of employment with the Company. The Company provides a 401(k) match equal to 100% of participant contributions, up to 4% of each participant's compensation.
The Company's 401(k) plan has an individual account for each participant's contributions and allows each participant to direct the investment of his or her account in a variety of investment funds. One investment alternative is the Danvers Bancorp Stock Fund. The Danvers Bancorp Stock Fund permits participants to invest up to 50% of their account balances in the Company's common stock.
Nonqualified Deferred Compensation Plan. Since contributions to the 401(k) plan are subject to IRS limits, the Company offers a nonqualified deferred compensation plan to provide certain Named Officers, with the opportunity for additional deferrals. A similar arrangement is also available to the Company's directors. Deferrals are credited with interest at a rate equal to the rate on the highest yielding certificate of deposit issued by the Bank during the calendar quarter. Under the plan, Named Officers designated as participants by the Board of Directors may defer bonus payments otherwise payable to them in the calendar year. Participants are 100 percent vested in their voluntary deferrals. Participants receive distributions from the plan upon separation from service or death, or on a fixed date selected by the participants. Plan benefits are paid in a lump sum or annual installments over a period not exceeding ten years, in accordance with participants' elections. Upon the death of the participant, the designated beneficiary receives any remaining payments due under the plan.
No Named Officers are participating in our deferred compensation plan. Accordingly, the "Nonqualified Deferred Compensation Table" is omitted.
Supplemental Executive Retirement Plan. The Company also provides supplemental executive retirement benefits for Messrs. Bottomley, McCarthy, O'Neil and Panella through a supplemental executive retirement plan (the "SERP"). The Company provides these retirement benefits in order to remain competitive and to attract and retain our senior executives who were hired later on in their careers. Under this SERP, the Company provides Messrs. Bottomley, McCarthy, O'Neil and Panella with an annual benefit payable for 15 years upon retirement and after attaining age 65 equal to a fixed percentage of the average compensation of their highest three calendar years within the final five calendar years of their employment, reduced by the sum of the benefits payable under our pension plan, the bank-funded benefits under our 401(k) plan and 50 percent of Social Security benefits. The fixed percentage is 75 percent in the case of Mr. Bottomley and 65 percent for Messrs. McCarthy and O'Neil and 60 percent for Mr. Panella.
If a participant dies while employed by the Company, his beneficiary is entitled to receive 15 annual payments equal to a fixed percentage of the average compensation of the participant's highest three calendar years within the final five calendar years of the participant's employment. The fixed
94
percentage is 75 percent in the case of Mr. Bottomley, 65 percent for Messrs. McCarthy and O'Neil, and 60 percent for Mr. Panella. Participants may also retire early at age 60 with ten years of service and receive a reduced benefit. Reduced benefits are also payable if a participant is terminated without cause prior to attaining early or normal retirement age. The reduction for payment of benefits prior to attainment of age 65 is waived if a participant's employment is terminated on account of death, disability or termination of employment after a change of control. The Company believes that the benefits payable to participants after termination are appropriate and consistent with the purposes of providing competitive retirement benefits and attracting and retaining our senior executives who were hired later on in their careers. The Company's executives view the SERP benefit as a critical component of their compensation package. If they are unable to continue working for us until their normal retirement age as a result of disability, death or termination without cause, the Company believes it is appropriate to provide them with a certain level of benefits in these circumstances. In lieu of payments over 15 years, a participant may also elect to receive his benefit in a present value lump sum and all participants have made this election.
Employee Stock Ownership Plan. In January 2008, the Company adopted an employee stock ownership plan for its eligible employees who have attained age 21 and have completed one year of service. The Company engaged an independent third party trustee to purchase, on behalf of the employee stock ownership plan, that number of shares equal to 8% of the sum of the number of shares sold in our initial public offering plus the number of shares contributed to the Charitable Foundation, the total of which is 1,427,400 shares. The third party trustee funded its purchase in the offering through a loan from the Company. The loan was equal to 100% of the aggregate purchase price of the Common Stock. The loan to the employee stock ownership plan is repaid principally from the Company's contributions to the employee stock ownership plan and dividends payable on Common Stock held by the employee stock ownership plan over the anticipated 20-year term of the loan at a rate of 3.25%, adjustable annually.
Participants will vest in the benefits allocated under the employee stock ownership plan upon completion of three years of service. A participant will also become fully vested at retirement, upon death or disability or upon termination of the employee stock ownership plan. Benefits are generally distributable upon a participant's termination from employment. Any unvested shares that are forfeited upon a participant's termination of employment will be reallocated among the remaining plan participants.
Plan participants are entitled to direct the plan trustee on how to vote common stock credited to their accounts. The trustee will vote allocated shares held in the employee stock ownership plan as instructed by the plan participants and unallocated shares will be voted in the same ratio on any matter as those shares for which instructions are given, subject to the fiduciary responsibilities of the trustee.
ESOP Restoration Plan. In 2008, the Company implemented an ESOP Restoration Plan that provides benefits to selected officers whose benefits under the Company's employee stock ownership plan are limited by applicable tax limits. The amount of benefits is limited to the amount that would have been provided under our employee stock ownership plan but for the application of the tax limits. Benefits are payable in cash to participants upon their termination of employment. In 2010, 2009 and 2008, Messrs. Bottomley, McCarthy and O'Neil were eligible for coverage by the Company's ESOP Restoration Plan.
Split-Dollar Life Insurance Agreement. The Company is the sole owner of a life insurance policy pertaining to Mr. Bottomley, whereby the Company will pay to Mr. Bottomley's estate or beneficiary a portion of the death benefit that the Company will receive as beneficiary of such policy.
Employment Agreements. The Company provides Employment Agreements for certain Named Officers. The Company entered into these agreements in connection with its conversion to a
95
publicly-held stock institution. The agreements were intended to provide the Company with the continued employment and undivided attention of its Named Officers during and following the conversion without the potential distraction resulting from the reduction of job security inherent in employment by a publicly held institution. The agreements provide assurances to Named Officers regarding the continued payment of salary and benefits in the event of involuntary termination or a change in control of the Company. The agreements appropriately reflect the changed nature of executive employment with a publicly-held company compared to a mutual institution. See "Item 11—Executive Compensation—Employment Agreements" beginning on page 104 of this Annual Report on Form 10-K.
Perquisites and Other Personal Benefits
The Company's benefits program is designed to provide moderately competitive market/industry income replacement plans in the event of executive retirement, sickness, accident, death and disability. Given the Company's desire to focus the majority of its total compensation on performance-based rewards, the Company strives to provide meaningful financial and welfare benefit security for the Named Officers of the Company.
The Company also offers various fringe benefits to its Named Officers including group policies for medical insurance and individual long term care insurance (excluding Mr. McCurdy and Mr. Fournier). The Company provides individual and family coverage to Named Officers, with the executive officer being responsible for a portion of the premium. The Company's Named Officers are provided with an automobile allowance, and the Company pays club dues for certain Named Officers and provides tax gross-ups for these perquisites. The Compensation Committee believes these benefits are appropriate and assist these officers in fulfilling their employment obligations.
Impact of Accounting and Tax on the Form of Compensation
The Compensation Committee and management consider the accounting and tax (individual and corporate) consequences of the compensation plans prior to making changes to the plans. In the consideration of equity awards going forward the Compensation Committee intends to consider the impact of ASC Topic 718 and Section 162(m) of the Internal Revenue Code (which limits deduction of compensation paid to certain Named Officers to $1,000,000 unless the compensation is "performance-based").
Clawback Policy
In addition to any other remedies available to the Company and subject to applicable law, if the Board or any committee of the Board determines that it is appropriate, the Company may recover in whole or in part any bonus, incentive payment, equity award or other compensation received by an officer of the Company to the extent that such bonus, incentive payment, equity award or other compensation is or was based on any financial results or operating metrics that were impacted by the officer's knowing or intentional fraudulent or illegal conduct, including the making of a material misrepresentation contained in the Company's financial statements.
Stock Ownership Guidelines
The Compensation Committee believes that Company stock ownership by Company directors and executive officers strengthens their commitment to the Company's future and further aligns their interests with those of the Company's stockholders. The Compensation Committee encourages the Company's directors and executive officers to purchase and own Company stock and discourages sales of Company stock except pursuant to a pre-arranged plan. The Compensation Committee is of the opinion that the number of shares of the Company's stock owned by each director and executive officer
96
is a personal decision and, independent of any stock ownership requirements that are imposed by law, does not require directors or executive officers to purchase and/or own Company stock. The Compensation Committee will review the Company's policy on Company stock ownership on a periodic basis to evaluate the stock ownership practices of directors and executive officers and to consider any necessary changes or enhancements to the Company's policy on Company stock ownership.
Compensation Committee Interlocks and Insider Participation
The Compensation Committee consists of Messrs. Ferris (Chair), Broudo, Goldman, and O'Brien. No member of the Compensation Committee is a current or former officer or employee of the Corporation or the Bank.
Compensation Committee Report(1)
The Compensation Committee has reviewed and discussed the Compensation Discussion and Analysis required by Item 402(b) of Regulation S-K with management, and based on such review and discussions, the Compensation Committee recommended to the Board that the Compensation Discussion and Analysis be included in this Annual Report on Form 10-K for the year ended December 31, 2010 for filing with the SEC.
- (1)
- The following Compensation Committee Report is provided in accordance with the rules and regulations of the SEC. Pursuant to such rules and regulations, this report shall not be deemed "soliciting materials," filed with the SEC, subject to Regulation 14A or 14C of the SEC or subject to the liabilities of Section 18 of the Exchange Act.
The Compensation Committee
John R. Ferris (Chair)
Robert J. Broudo
Neal H. Goldman
J. Michael O'Brien
Dated: March 8, 2011
97
Executive and Director Compensation Tables
Summary Compensation Table. The following table sets forth the cash and non-cash compensation for the fiscal years ended December 31, 2010, 2009 and 2008 awarded to or earned by our Named Officers.
Name and Principal Position
|
Year | Salary ($) |
Bonus ($)(1) |
Stock Awards ($)(2) |
Option Awards ($)(3) |
Non-Equity Incentive Plan Compensation ($)(4) |
Change in Pension Value and Nonqualified Deferred Compensation Earnings ($)(5) |
All Other Compensation ($) |
Total ($) |
||||||||||||||||||||
|---|---|---|---|---|---|---|---|---|---|---|---|---|---|---|---|---|---|---|---|---|---|---|---|---|---|---|---|---|---|
Kevin T. Bottomley |
2010 | 493,765 | 98,753 | — | — | 197,506 | 1,176,801 | 104,403 | (6) | 2,071,228 | |||||||||||||||||||
President/Chief |
2009 | 470,253 | 107,161 | 2,319,602 | 1,331,440 | 169,291 | 379,551 | 88,108 | 4,865,406 | ||||||||||||||||||||
Executive Officer |
2008 | 450,000 | 126,000 | — | — | 144,000 | 351,201 | 73,138 | 1,144,339 | ||||||||||||||||||||
L. Mark Panella |
2010 |
216,320 |
18,928 |
— |
— |
75,712 |
359,040 |
56,896 |
(7) |
726,896 |
|||||||||||||||||||
Executive Vice |
2009 | 208,000 | 22,280 | 462,800 | 266,288 | 65,520 | 113,743 | 45,948 | 1,184,579 | ||||||||||||||||||||
President/Chief Financial Officer |
2008 | 200,000 | 7,500 | — | — | 56,000 | 291,024 | 40,795 | 595,319 | ||||||||||||||||||||
James J. McCarthy |
2010 |
270,000 |
47,250 |
— |
— |
94,500 |
382,597 |
74,564 |
(8) |
868,911 |
|||||||||||||||||||
Executive Vice |
2009 | 254,980 | 36,143 | 1,035,255 | 499,290 | 80,319 | 73,530 | 69,917 | 2,049,434 | ||||||||||||||||||||
President/Chief Operating |
2008 | 244,000 | 59,780 | — | — | 68,320 | 86,279 | 50,168 | 508,547 | ||||||||||||||||||||
John J. O'Neil |
2010 |
261,145 |
45,700 |
— |
— |
91,401 |
443,647 |
67,397 |
(9) |
909,290 |
|||||||||||||||||||
Executive Vice |
2009 | 248,710 | 35,255 | 1,034,833 | 499,290 | 78,344 | 138,757 | 62,495 | 2,097,684 | ||||||||||||||||||||
President/Chief Lending Officer |
2008 | 238,000 | 58,310 | — | — | 66,640 | 165,135 | 59,456 | 587,541 | ||||||||||||||||||||
Michael W. McCurdy |
2010 |
200,370 |
17,533 |
— |
25,560 |
70,130 |
— |
54,139 |
(10) |
367,732 |
|||||||||||||||||||
Executive Vice President/ |
2009 | 180,000 | 15,000 | 185,120 | 66,572 | 48,600 | — | 33,692 | 528,984 | ||||||||||||||||||||
General Counsel and Secretary/ |
2008 | 157,500 | 12,500 | — | — | 44,100 | — | 26,983 | 241,083 | ||||||||||||||||||||
Director of Retail Banking |
|||||||||||||||||||||||||||||
Donat A. Fournier |
2010 |
261,332 |
— |
197,700 |
85,200 |
82,320 |
— |
25,031 |
(11) |
651,583 |
|||||||||||||||||||
Executive Vice |
2009 | N/A | N/A | N/A | N/A | N/A | N/A | N/A | N/A | ||||||||||||||||||||
President/ |
2008 | N/A | N/A | N/A | N/A | N/A | N/A | N/A | N/A | ||||||||||||||||||||
Director of Wealth Management |
|||||||||||||||||||||||||||||
- (1)
- The
amounts in this column represent the bonus granted at the discretion of the Compensation Committee in excess of the amount of non-equity
incentive plan compensation paid. The amount earned in 2010, 2009 and 2008 were paid in 2011, 2010 and 2009, respectively.
- (2)
- Represents
the grant date fair value of stock awards granted under the Company's 2008 Stock Option and Incentive Plan.
- (3)
- Represents
the grant date fair value of option awards granted under the Company's 2008 Stock Option and Incentive Plan.
- (4)
- Compensation
shown in this column represents payments earned under the Annual Incentive Compensation Plan. The amounts earned in 2010, 2009 and 2008 were
paid in 2011, 2010 and 2009, respectively.
- (5)
- In
2010, the amounts in this column are comprised of the change in the value of accumulated benefits under the SERPs.
- (6)
- In 2010, the amount includes: (1) a 401(k) plan match, which was 100% up to the first 4% of participant compensation, in the amount of $9,800, (2) an automobile expense of $20,813, (3) a country club membership of $15,368, (4) a tax gross up on certain perquisites of $14,314, (5) a split-dollar life insurance premium in the amount of $10,095, (6) a long-term care insurance premium of $14,788 and (6) an ESOP share allocation of $19,225, and (7) an ESOP Restoration Plan allocation of $18,841.
98
- (7)
- In
2010, the amount includes (1) a 401(k) plan match, which was 100% up to the first 4% of participant compensation, in the amount of $8,653,
(2) an automobile expense of $14,865, (3) a tax gross up on certain perquisites of $1,610, (4) an ESOP share allocation of $16,981, and (5) a long-term care
insurance premium of $14,787.
- (8)
- In
2010, the amount includes: (1) a 401(k) plan match, which was 100% up to the first 4% of participant compensation, in the amount of $9,800,
(2) an automobile expense of $17,622, (3) a country club membership of $5,355, (4) a tax gross up on certain perquisites of $6,784, (5) a long-term care
insurance premiums of $15,778 and (6) an ESOP share allocation of $19,225, and (7) an ESOP Restoration Plan allocation of $1,587
- (9)
- In
2010, the amount includes: (1) a 401(k) plan match, which was 100% up to the first 4% of participant compensation, in the amount of $9,800,
(2) an automobile expense of $11,287, (3) a country club membership of $6,100, (4) a tax gross up on certain perquisites of $6,805, (5) a long-term care
insurance premium of $14,180, and (6) an ESOP share allocation of $19,225, and (7) an ESOP Restoration Plan allocation of $904
- (10)
- In
2010, the amount includes: (1) a 401(k) plan match, which was 100% up to the first 4% of participant compensation, in the amount of $8,015,
(2) an automobile expense of $17,246, (3) a country club membership of $5,201 (4) a tax gross up on certain perquisites of $7,948, and (5) an ESOP share allocations of
$15,729.
- (11)
- Mr. Fournier joined the Company in 2010 as a result of the Company's acquisition of Beverly National Corporation. In 2010, the amount includes: (1) a 401(k) plan match, which was 100% up to the first 4% of participant compensation, in the amount of $9,800, (2) an automobile expense of $12,901, and (3) a country club membership of $2,330.
The assumptions used in determining the grant date fair value can be found in Note 19 to the Company's financial statements included elsewhere in this report.
Outstanding Equity Awards at Fiscal Year-End. The following table itemizes outstanding option awards and stock awards held by the Company's Named Officers as of December 31, 2010:
| |
|
Option Awards | Stock Awards | |||||||||||||||||||
|---|---|---|---|---|---|---|---|---|---|---|---|---|---|---|---|---|---|---|---|---|---|---|
Name
|
Grant Date |
Number of Securities Underlying Unexercised Options Exercisable (#)(1) |
Number of Securities Underlying Unexercised Options Unexercisable (#)(1) |
Option Exercise Price ($) |
Options Expiration Date(2) |
Number of Shares or Units of Stock that Have Not Vested (#)(3) |
Market Value of Shares or Units of Stock that Have Not Vested ($)(4) |
|||||||||||||||
Kevin T. Bottomley |
02/09/09 | 71,200 | 284,800 | 13.00 | 02/09/19 | 142,825 | 2,523,718 | |||||||||||||||
L. Mark Panella |
02/09/09 | 14,240 | 56,960 | 13.00 | 02/09/19 | 28,480 | 503,242 | |||||||||||||||
James J. McCarthy |
02/09/09 | 26,700 | 106,800 | 13.00 | 02/09/19 | 63,953 | 1,130,050 | |||||||||||||||
John J. O'Neil |
02/09/09 | 26,700 | 106,800 | 13.00 | 02/09/19 | 63,921 | 1,129,484 | |||||||||||||||
Michael W. McCurdy |
02/09/09 | 3,560 | 14,240 | 13.00 | 02/09/19 | 11,392 | 201,297 | |||||||||||||||
|
02/04/10 | — | 6,000 | 13.18 | 02/04/20 | — | — | |||||||||||||||
Donat A. Fournier |
02/04/10 | — | 20,000 | 13.18 | 02/04/20 | 15,000 | 265,050 | |||||||||||||||
- (1)
- Option
awards vest 20% per year from the date of the grant and are fully vested in year five.
- (2)
- Options
expire ten years from the grant date (five years for a 10% owner).
- (3)
- Stock
awards vest 20% per year over a five-year period.
- (4)
- The
amount shown represents the number of stock awards that have not vested multiplied by the closing price of the Company's common stock on
December 31, 2010, which was $17.67.
- (5)
- As a result of Mr. Fournier's resignation he forfeited all shares of Company stocked granted to him on February 4, 2010.
99
Grants of Plan-Based Awards. The following table provides additional information about cash incentive awards payable on 2010 performance and restricted stock and option awards granted to the Company's Named Officers during 2010:
| |
|
Estimated Possible Payouts Under Non-Equity Incentive Plan Awards(1) |
All Other Stock Awards: Number of Shares of Stock or Units (#) |
All Other Option Awards: Number of Securities Underlying Options (#) |
|
|
||||||||||||||||
|---|---|---|---|---|---|---|---|---|---|---|---|---|---|---|---|---|---|---|---|---|---|---|
| |
|
Exercise or Base Price of Option Awards ($/Sh)(3) |
Grant Date Fair Value of Stock and Option Awards ($)(4) |
|||||||||||||||||||
Name
|
Grant Date |
Target ($) |
Maximum ($) |
|||||||||||||||||||
Kevin T. Bottomley |
02/28/10 | 197,506 | 296,259 | |||||||||||||||||||
|
02/04/10 | 425 | 5,602 | |||||||||||||||||||
|
02/04/10 | — | 13.18 | — | ||||||||||||||||||
|
5,602 | |||||||||||||||||||||
L. Mark Panella |
02/28/10 | 75,712 | 113,568 | |||||||||||||||||||
|
02/04/10 | — | — | |||||||||||||||||||
|
02/04/10 | — | 13.18 | — | ||||||||||||||||||
|
— | |||||||||||||||||||||
James J. McCarthy |
02/28/10 | 94,500 | 141,750 | |||||||||||||||||||
|
02/04/10 | 1,297 | 17,094 | |||||||||||||||||||
|
02/04/10 | — | 13.18 | — | ||||||||||||||||||
|
17,094 | |||||||||||||||||||||
John J. O'Neil |
02/28/10 | 91,401 | 137,101 | |||||||||||||||||||
|
02/04/10 | 1,265 | 16,673 | |||||||||||||||||||
|
02/04/10 | — | 13.18 | — | ||||||||||||||||||
|
16,673 | |||||||||||||||||||||
Michael W. McCurdy |
02/28/10 | 70,130 | 105,194 | |||||||||||||||||||
|
02/04/10 | — | — | |||||||||||||||||||
|
02/04/10 | 6,000 | 13.18 | 25,560 | ||||||||||||||||||
|
25,560 | |||||||||||||||||||||
Donat A. Fournier |
02/28/10 | 91,466 | 137,199 | |||||||||||||||||||
|
02/04/10 | 15,000 | 197,700 | |||||||||||||||||||
|
02/04/10 | 20,000 | 13.18 | 85,200 | ||||||||||||||||||
|
282,900 | |||||||||||||||||||||
- (1)
- Company's
Named Officers were eligible to receive an annual cash bonus as part of the Company's Incentive Plan. The Incentive Plan provides for cash target
awards of 40% of annual base salary for the President and Chief Executive Officer and 35% of annual base salary for the remaining Named Officers. The actual opportunity for each executive ranges from
50% of target for achieving threshold or minimum performance to 150% of target for achieving superior performance. If acceptable performance for the Company or the executive is not achieved at least
at threshold level, an incentive award will not be paid (a detailed description of the plan is included in "Short-term Incentives" beginning on page 24).
- (2)
- Represents
time based share awards discussed in "Long-term Incentives" above.
- (3)
- The
exercise price is the closing price of the Company's common stock on the NASDAQ Stock Market LLC on the grant date.
- (4)
- For
the restricted stock, fair value is the market value of the underlying stock on the grant date (which is the same as the exercise price). For options,
the fair value on the grant date was $4.26, which was calculated using the Black Scholes option-pricing model, which can be found in Note 19 to the Company's financial statements contained
elsewhere in this report.
- (5)
- As a result of Mr. Fournier's resignation he forfeited all shares of Company stock granted to him on February 4, 2010.
100
Outstanding Equity Awards. The following table itemizes outstanding option awards and stock awards held by the Company's Directors as of December 31, 2010:
| |
|
Option Awards | |
|
|||||||||||||||||||||
|---|---|---|---|---|---|---|---|---|---|---|---|---|---|---|---|---|---|---|---|---|---|---|---|---|---|
| |
|
|
|
Equity Incentive Plan Awards: Number of Securities Underlying Unexercised Unearned Options (#) |
|
|
Stock Awards | ||||||||||||||||||
Name
|
Grant Date |
Number of Securities Underlying Unexercised Options Exercisable (#)(1) |
Number of Securities Underlying Unexercised Options Unexercisable (#)(1) |
Option Exercise Price ($) |
Options Expiration Date (2) |
Number of Shares or Units of Stock that Have Not Vested (#)(3) |
Market Value of Shares or Units of Stock that Have Not Vested ($)(4) |
||||||||||||||||||
Brinkley, Diane C. |
02/04/10 | — | — | — | 983 | 17,370 | |||||||||||||||||||
|
02/09/09 | 6,700 | 26,800 | 26,800 | 13.00 | 02/09/19 | 12,208 | 215,715 | |||||||||||||||||
Broudo, Robert J. |
02/04/10 | — | — | — | 983 | 17,370 | |||||||||||||||||||
|
02/09/09 | 6,700 | 26,800 | 26,800 | 13.00 | 02/09/19 | 12,208 | 215,715 | |||||||||||||||||
Cerretani, Craig S. |
02/04/10 | — | — | — | 983 | 17,370 | |||||||||||||||||||
|
02/09/09 | 6,700 | 26,800 | 26,800 | 13.00 | 02/09/19 | 12,208 | 215,715 | |||||||||||||||||
Cranney, Brian C. |
02/04/10 | — | — | — | 983 | 17,370 | |||||||||||||||||||
|
02/09/09 | 6,700 | 26,800 | 26,800 | 13.00 | 02/09/19 | 12,208 | 215,715 | |||||||||||||||||
Drislane, John P. |
02/04/10 | — | — | — | 983 | 17,370 | |||||||||||||||||||
|
02/09/09 | 6,700 | 26,800 | 26,800 | 13.00 | 02/09/19 | 12,208 | 215,715 | |||||||||||||||||
Ferris, John R. |
02/04/10 | — | — | — | 983 | 17,370 | |||||||||||||||||||
|
02/09/09 | 6,700 | 26,800 | 26,800 | 13.00 | 02/09/19 | 12,208 | 215,715 | |||||||||||||||||
Ford, Thomas |
02/04/10 | — | — | — | 983 | 17,370 | |||||||||||||||||||
|
02/09/09 | 6,700 | 26,800 | 26,800 | 13.00 | 02/09/19 | 12,208 | 215,715 | |||||||||||||||||
Glovsky, Mark B. |
02/04/10 | — | 10,000 | 10,000 | 13.18 | 02/04/20 | 983 | 17,370 | |||||||||||||||||
Goldman, Neal H. |
02/04/10 | — | — | — | 983 | 17,370 | |||||||||||||||||||
|
02/09/09 | 6,700 | 26,800 | 26,800 | 13.00 | 02/09/19 | 12,208 | 215,715 | |||||||||||||||||
Hersey, Eleanor M. |
02/04/10 | — | — | — | 983 | 17,370 | |||||||||||||||||||
|
02/09/09 | 6,700 | 26,800 | 26,800 | 13.00 | 02/09/19 | 12,208 | 215,715 | |||||||||||||||||
Moran, Mary C. |
02/04/10 | — | — | — | 983 | 17,370 | |||||||||||||||||||
|
02/09/09 | 6,700 | 26,800 | 26,800 | 13.00 | 02/09/19 | 12,208 | 215,715 | |||||||||||||||||
O'Brien, J. Michael |
02/04/10 | — | — | — | 983 | 17,370 | |||||||||||||||||||
|
02/09/09 | 6,700 | 26,800 | 26,800 | 13.00 | 02/09/19 | 12,208 | 215,715 | |||||||||||||||||
Pereira, John M. |
02/04/10 | — | — | — | 983 | 17,370 | |||||||||||||||||||
|
02/09/09 | 6,700 | 26,800 | 26,800 | 13.00 | 02/09/19 | 12,208 | 215,715 | |||||||||||||||||
Scott, Pamela C. |
02/04/10 | — | 10,000 | 10,000 | 13.18 | 02/04/20 | 983 | 17,370 | |||||||||||||||||
Stringer, Diane T. |
02/04/10 | — | — | — | 983 | 17,370 | |||||||||||||||||||
|
02/09/09 | 6,700 | 26,800 | 26,800 | 13.00 | 02/09/19 | 12,208 | 215,715 | |||||||||||||||||
Tripoli, Michael F. |
02/04/10 | — | 10,000 | 10,000 | 13.18 | 02/04/20 | 983 | 17,370 | |||||||||||||||||
- (1)
- Option
awards vest 20% per year from the date of the grant and are fully vested in year five.
- (2)
- Options
expire ten years from the grant date (five years for a 10% owner).
- (3)
- Stock
awards vest 20% per year over a five-year period.
- (4)
- The amount shown represents the number of stock awards that have not vested multiplied by the closing price of the Company's common stock on December 31, 2010, which was $17.67.
101
Option Exercises and Stock Vested.
The following table sets forth, for each of our Named Officers, the value of securities vested as of December 31, 2010. No stock option awards were exercised in 2010.
| |
Option Awards | Stock Awards | |||||||||||
|---|---|---|---|---|---|---|---|---|---|---|---|---|---|
Officer
|
Number of Securities Acquired on Exercise (#) |
Value Received on Exercise ($) |
Number of Securities Acquired on Vesting (#) |
Value Received on Vesting (#) |
|||||||||
Kevin T. Bottomley |
— | — | 35,600 | 482,380 | |||||||||
L. Mark Panella |
— | — | 7,120 | 96,476 | |||||||||
James J. McCarthy |
— | — | 15,664 | 212,247 | |||||||||
John J. O'Neil |
— | — | 15,664 | 212,247 | |||||||||
Michael W. McCurdy |
— | — | 2,848 | 38,590 | |||||||||
Pension Benefits Table. The following table sets forth, for each of our Named Officers, the present value of accumulated benefits payable under the SERP.
Name
|
Plan Name | Number of Years Credited Service (#) |
Present Value of Accumulated Benefit ($)(1) |
|||||||
|---|---|---|---|---|---|---|---|---|---|---|
| Kevin T. Bottomley | Supplemental Executive Retirement Plan | 15 | 4,033,503 | |||||||
| President / Chief Executive Officer | ||||||||||
L. Mark Panella |
Supplemental Executive Retirement Plan |
16 |
971,616 |
|||||||
| Executive Vice President / Chief Financial Officer | ||||||||||
James J. McCarthy |
Supplemental Executive Retirement Plan |
25 |
1,111,936 |
|||||||
| Executive Vice President / Chief Operating Officer | ||||||||||
John J. O'Neil |
Supplemental Executive Retirement Plan |
9 |
1,594,650 |
|||||||
| Executive Vice President / Chief Lending Officer | ||||||||||
Michael W. McCurdy |
Supplemental Executive Retirement Plan |
N/A |
N/A |
|||||||
| Executive Vice President/General Counsel and Secretary/Director of Retail Banking | ||||||||||
Donat A. Founnier |
Supplemental Executive Retirement Plan |
N/A |
N/A |
|||||||
| Executive Vice President/Director of Wealth Management | ||||||||||
- (1)
- Present value of accumulated benefits under the SERP and mortality rate assumptions are consistent with those used for our financial reporting purposes, as of December 31, 2010, that retirement age is based upon the earliest retirement age.
102
Potential Payments upon Termination or Change-in-Control. Assuming the employment of the Company's Named Officers were to be terminated under the circumstances listed below, each as of December 31, 2010, the following individuals would be entitled to the following payments and benefits under the terms of their employment agreements and other arrangements:
Payment and Benefits Upon Separation
|
Voluntary Separation |
Involuntary Termination Not For Cause or Termination For Good Reason |
Involuntary Termination For Cause |
Termination Upon Death |
Termination Upon Disability |
Termination After Change-in- Control Without Cause |
|||||||||||||
|---|---|---|---|---|---|---|---|---|---|---|---|---|---|---|---|---|---|---|---|
Cash Payment |
$ | — | $ | 2,370,072 | $ | — | $ | 320,947 | $ | — | $ | 2,370,072 | |||||||
Stock Plan |
— | 3,221,678 | — | 4,186,238 | 4,186,238 | 4,186,238 | |||||||||||||
SERP Payments |
4,033,503 | 4,272,507 | — | 6,005,523 | 5,489,040 | 5,489,040 | |||||||||||||
Total: |
$ | 4,033,503 | $ | 9,864,257 | $ | — | $ | 10,512,708 | $ | 9,675,278 | $ | 12,045,350 | |||||||
Payment and Benefits Upon Separation
|
Voluntary Separation |
Involuntary Termination Not For Cause or Termination For Good Reason |
Involuntary Termination For Cause |
Termination Upon Death |
Termination Upon Disability |
Termination After Change-in- Control Without Cause |
|||||||||||||
|---|---|---|---|---|---|---|---|---|---|---|---|---|---|---|---|---|---|---|---|
Cash Payment |
$ | — | $ | 932,880 | $ | — | $ | 129,792 | $ | — | $ | 932,880 | |||||||
Stock Plan |
— | 643,434 | — | 835,746 | 835,746 | 835,746 | |||||||||||||
SERP Payments |
971,616 | 1,029,189 | — | 1,845,459 | 1,508,890 | 1,508,890 | |||||||||||||
Total: |
$ | 971,616 | $ | 2,605,503 | $ | — | $ | 2,810,997 | $ | 2,344,636 | $ | 3,277,516 | |||||||
Payment and Benefits Upon Separation
|
Voluntary Separation |
Involuntary Termination Not For Cause or Termination For Good Reason |
Involuntary Termination For Cause |
Termination Upon Death |
Termination Upon Disability |
Termination After Change-in- Control Without Cause |
|||||||||||||
|---|---|---|---|---|---|---|---|---|---|---|---|---|---|---|---|---|---|---|---|
Cash Payment |
$ | — | $ | 1,235,250 | $ | — | $ | 152,988 | $ | — | $ | 1,235,250 | |||||||
Stock Plan |
— | 1,342,855 | — | 1,753,495 | 1,753,495 | 1,753,495 | |||||||||||||
SERP Payments |
1,111,936 | 1,177,823 | — | 2,661,745 | 2,151,910 | 2,151,910 | |||||||||||||
Total: |
$ | 1,111,936 | $ | 3,755,928 | $ | — | $ | 4,568,228 | $ | 3,905,405 | $ | 5,140,655 | |||||||
Payment and Benefits Upon Separation
|
Voluntary Separation |
Involuntary Termination Not For Cause or Termination For Good Reason |
Involuntary Termination For Cause |
Termination Upon Death |
Termination Upon Disability |
Termination After Change-in- Control Without Cause |
|||||||||||||
|---|---|---|---|---|---|---|---|---|---|---|---|---|---|---|---|---|---|---|---|
Cash Payment |
$ | — | $ | 1,194,738 | $ | — | $ | 156,687 | $ | — | $ | 1,194,738 | |||||||
Stock Plan |
— | 1,342,516 | — | 1,752,929 | 1,752,929 | 1,752,929 | |||||||||||||
SERP Payments |
1,594,650 | 1,689,141 | — | 2,591,896 | 2,267,753 | 2,267,753 | |||||||||||||
Total: |
$ | 1,594,650 | $ | 4,226,395 | $ | — | $ | 4,501,512 | $ | 4,020,682 | $ | 5,215,420 | |||||||
103
Payment and Benefits Upon Separation
|
Voluntary Separation |
Involuntary Termination Not For Cause or Termination For Good Reason |
Involuntary Termination For Cause |
Termination Upon Death |
Termination Upon Disability |
Termination After Change-in- Control Without Cause |
|||||||||||||
|---|---|---|---|---|---|---|---|---|---|---|---|---|---|---|---|---|---|---|---|
Cash Payment |
$ | — | $ | — | $ | — | $ | — | $ | — | $ | 864,096 | |||||||
Stock Plan |
— | — | — | 311,363 | 311,363 | 311,363 | |||||||||||||
SERP Payments |
— | — | — | — | — | — | |||||||||||||
Total: |
$ | — | $ | — | $ | — | $ | 311,363 | $ | 311,363 | $ | 1,175,459 | |||||||
Employment Agreements. In January 2008, the Company entered into employment agreements with Kevin T. Bottomley, L. Mark Panella, James J. McCarthy and John J. O'Neil, referred to below as the executives or executive. The Company's continued success depends to a significant degree on the executives' skill and competence, and the employment agreements help to ensure a stable management base.
The employment agreements provide for three-year terms. The three-year term of each employment agreement shall automatically be extended each day after the commencement of such agreement, so that at any point during each executive's employment the then remaining term is three years. In addition to the base salary, the employment agreements provide for, among other things, participation in stock benefits plans, an automobile allowance and other fringe benefits applicable to executive personnel.
The employment agreements provide for termination by the Company for "cause," as defined in the employment agreement, at any time. If the executive's employment is terminated for cause, the executive (or his authorized representative or estate) shall be entitled to receive earned but unpaid base salary, incentive compensation earned but not yet paid, unpaid expense reimbursements, accrued but unused vacation and any vested benefits the executive may have under any executive officer benefit plan, including without limitation the SERP.
If the Company chooses to terminate an executive's employment without "cause," or if an executive resigns with "good reason" (defined as: (i) a substantial diminution or other substantial adverse change, not consented to by the executive in writing, in the nature or scope of the executive's responsibilities, authorities, powers, functions or duties; (ii) any removal, during the term, from the executive of his title that is not consented to in writing by the executive; (iii) an involuntary reduction in the executive's base salary except for across-the-board salary reductions based on our financial performance similarly affecting all senior management personnel; (iv) a breach by the Company of any of its material obligations under the employment agreement; (v) the involuntary relocation of the Company's offices at which the executive is principally employed or the involuntary relocation of the offices of the executive's primary workgroup to a location more than 25 miles from such offices; (vi) the Company's failure to obtain an effective agreement from any successor to assume and agree to perform the terms of the employment agreement; (vii) a change in control; or (viii) a determination by the Board not to continue to extend the term of employment), the executive will receive a lump sum amount equal to three times the sum of (A) the executive's base salary and (B) the greater of his target cash bonus for the year of termination or his highest cash bonuses earned in the preceding three years. The Company will also provide them with a payment equal to the value of the stock options and restricted stock they would have earned if they had remained employed with the Company for three additional years. The Company would also continue and/or pay for the executive's health, vision and dental coverage for three years. In addition, the executive is entitled to receive (and in the case of his death, his surviving spouse, or estate if there is no surviving spouse) a pro rata portion of the his target cash bonus for the year of termination, based on the portion of the calendar year during which the executive was employed before termination. The
104
employment agreements provide that the executive will receive a tax gross-up payment, relating to excise tax or penalties imposed on benefits and severance received in connection with a change in control of the Company. The employment agreements further provide that the Company will indemnify the executive to the fullest extent legally allowable. In return for the benefits provided by the employment agreements, each executive agrees to certain restrictive covenants, including noncompetition and nonsolicitation agreements for 12 months (18 months in the event the executive terminates within 30 days after a change in control) after termination of employment.
On February 23, 2007, Danversbank entered into a three-year employment agreement with Michael W. McCurdy. Under the agreement, Mr. McCurdy received a base salary, annual cash bonus, health, dental and vision benefit coverage for a term of 36 months following termination of employment. The agreement terminated on February 23, 2010.
Change in Control Agreement. On February 1, 2010, the Company entered into a change in control agreement with Michael W. McCurdy, which will be in effect for 12 months following a change in control, which replaced an existing change in control agreement. Under the agreement, in the event that within 12 months after a change in control, as defined in the agreement, Danversbank or Danvers Bancorp, Inc. or their successors terminates the employment of an individual covered by the agreement without cause, as defined in the agreement, or if the individual voluntarily resigns with good reason, as defined in the agreement, the individual will receive a lump sum payment in the amount equal to three times the sum of (a) the officer's annual base salary and (b) the greater of the officer's target cash bonus for the year of termination or the officer's highest cash bonus earned in the preceding three years, subject to the limitations imposed by Section 280G of the Internal Revenue Code. The agreements also provide for continued health, dental and vision benefit coverage for 36 months following termination of employment. In connection with the merger, Mr. McCurdy could receive aggregate compensation and benefits equal to approximately $989,436 under his change in control agreement, subject to the limitations imposed by Section 280G of the Internal Revenue Code.
Settlement Agreements. In connection with the merger, People's United, People's United Bank, Danvers Bancorp and Danversbank entered into settlement agreements with each of Kevin T. Bottomley, L. Mark Panella, James J. McCarthy and John J. O'Neil pursuant to which each executive will receive the payments and benefits provided under his settlement agreement in satisfaction of all rights to payments and benefits under the executive's individual employment agreement and the Supplemental Executive Retirement Plan or, in the case of Mr. Panella, the Supplemental Retirement Agreement. In connection with the merger, rights to most of these payments and benefits would have otherwise been triggered absent the settlement agreement. Upon the closing of the merger, each settlement agreement specifies that the executive will execute a release of claims against People's United, People's United Bank, Danvers Bancorp and Danversbank.
The terms of each settlement agreement are substantially similar, except as noted below. Under the settlement agreements Messrs. Bottomley, Panella, McCarthy and O'Neil will receive lump sum severance amounts equal to the total of (i) $2,538,777, $965,328, $1,325,250 and $1,281,303, respectively, (ii) an amount equal to a pro rata portion of the executive's target cash annual bonus for calendar year 2011 and (iii) a gross-up for any excise taxes imposed on the executive under Section 4999 of the Code as a result of the merger. The amount of the gross-up for any excise taxes imposed on the executive under Section 4999 of the Code is subject to adjustment pursuant to the terms of each executive's employment agreement but is expected to be approximately $4,030,620, $1,283,447, $1,740,337 and $1,769,714, respectively, assuming a merger closing on June 30, 2011.
Each of Messrs. Bottomley, Panella, McCarthy and O'Neil will also receive a lump sum payment in satisfaction of all rights to payments and benefits under the SERP, as described below, equal to $5,489,034, $1,508,890, $2,151,910, and $2,267,753 respectively.
105
In addition, in satisfaction of the obligations contained in each executive's employment agreement, the executives and their dependents will receive continued group health, dental and vision insurance coverage for thirty-six months, with the executive paying the same share of any premiums the executive was paying as an employee.
In order for each executive to pay the remaining premiums due on the long-term care insurance policies maintained for the benefit of the executive and the executive's spouse, Messrs. Bottomley, Panella, McCarthy and O'Neil will also receive lump sum payments on the closing date of $103,512, $103,507, $110,447 and $99,257, respectively. The settlement agreements for Messrs. Panella, McCarthy and O'Neil also provide that these executives will receive ownership and title of the company-provided automobile utilized by the executive.
SERP Payments. The amounts shown in the tables above represent payments under the Supplemental Executive Retirement Plan. For further discussion of the Supplemental Executive Retirement Plan or the Supplemental Retirement Agreement. See "Retirement Benefits—Supplemental Executive Retirement Plan" on page 94.
In connection with the merger, Messrs. Bottomley, Panella, McCarthy and O'Neil would have been entitled to receive lump sum payments under the Supplemental Executive Retirement Plan equal to approximately $5,489,040, $1,508,890, $2,151,910 and $2,267,753, respectively. Under the settlement agreements described above, Messrs. Bottomley, Panella, McCarthy and O'Neil have agreed to accept the lump sum distributions specified in their respective settlement agreements in full satisfaction of all rights to payments or benefits under the Supplemental Executive Retirement Plan.
Director Compensation. The Company's primary goal is to provide competitive and reasonable compensation to independent directors in order to attract and retain qualified candidates to serve on the Company's Board. Directors who are also officers of the Company are not eligible to receive board fees. All fees earned are paid in cash and are eligible for deferral under the Non Qualified Deferred Compensation Plan, as defined below.
Cash Retainer and Meeting Fees for Non-Employee Directors. The following table sets forth the applicable retainers and fees paid to our non-employee directors for their service on the Board of Directors of Danvers Bancorp, Inc. and Danversbank during 2010:
Fee per board meeting attended |
$ | 800 | ||
Fee per committee meeting attended |
$ | 700 | ||
Annual retainer |
$ | 10,000 / year | ||
Danversbank Board of Investment Committee member fee |
$ | 15,000 / year |
106