Attached files
| file | filename |
|---|---|
| EX-21.1 - EXHIBIT 21.1 - TRUE RELIGION APPAREL INC | a2202584zex-21_1.htm |
| EX-31.2 - EXHIBIT 31.2 - TRUE RELIGION APPAREL INC | a2202584zex-31_2.htm |
| EX-31.1 - EXHIBIT 31.1 - TRUE RELIGION APPAREL INC | a2202584zex-31_1.htm |
| EX-32.2 - EXHIBIT 32.2 - TRUE RELIGION APPAREL INC | a2202584zex-32_2.htm |
| EX-32.1 - EXHIBIT 32.1 - TRUE RELIGION APPAREL INC | a2202584zex-32_1.htm |
| EX-23.1 - EXHIBIT 23.1 - TRUE RELIGION APPAREL INC | a2202584zex-23_1.htm |
| EX-10.10 - EXHIBIT 10.10 - TRUE RELIGION APPAREL INC | a2202584zex-10_10.htm |
| EX-10.11 - EXHIBIT 10.11 - TRUE RELIGION APPAREL INC | a2202584zex-10_11.htm |
| EX-10.13 - EXHIBIT 10.13 - TRUE RELIGION APPAREL INC | a2202584zex-10_13.htm |
| EX-10.16 - EXHIBIT 10.16 - TRUE RELIGION APPAREL INC | a2202584zex-10_16.htm |
| EX-10.14 - EXHIBIT 10.14 - TRUE RELIGION APPAREL INC | a2202584zex-10_14.htm |
UNITED STATES
SECURITIES AND EXCHANGE COMMISSION
Washington, DC 20549
FORM 10-K
| ý | ANNUAL REPORT PURSUANT TO SECTION 13 OR 15(d) OF THE SECURITIES EXCHANGE ACT OF 1934 | |
For the fiscal year ended December 31, 2010 |
||
or |
||
o |
TRANSITION REPORT PURSUANT TO SECTION 13 OR 15(d) OF THE SECURITIES EXCHANGE ACT OF 1934 |
|
For the transition period from to |
||
Commission file number 000-51483
TRUE RELIGION APPAREL, INC.
(Exact Name of Registrant as Specified in Its Charter)
| Delaware | 98-0352633 | |
| (State or Other Jurisdiction of Incorporation or Organization) |
(I.R.S. Employer Identification Number) |
|
2263 E. Vernon Ave. Vernon, California |
90058 |
|
| (Address of Principal Executive Offices) | (Zip Code) |
(323) 266-3072
(Registrant's Telephone Number, Including Area Code)
| Securities registered pursuant to Section 12(b) of the Exchange Act: | ||
Common Stock, par value $0.0001 per share (Title of Class) |
Nasdaq Global Market (Name of Each Exchange on Which Registered) |
|
Securities registered under Section 12(g) of the Act: |
||
| None (Title of Class) |
None (Name of Each Exchange on Which Registered) |
|
Indicate by check mark whether the registrant is a well-known seasoned issuer, as defined in Rule 405 of the Securities Act. Yes o No ý
Indicate by check mark if the registrant is not required to file reports pursuant to Section 13 or Section 15(d) of the Act. Yes o No ý
Indicate by check mark whether the registrant (1) has filed all reports required to be filed by Section 13 or 15(d) of the Securities Exchange Act of 1934 during the preceding 12 months (or for such shorter period that the registrant was required to file such reports), and (2) has been subject to such filing requirements for the past 90 days. Yes ý No o
Indicate by check mark whether the registrant has submitted electronically and posted on its corporate Web site, if any, every Interactive Data File required to be submitted and posted pursuant to Rule 405 of Regulation S-T (§232.405 of this chapter) during the preceding 12 months (or for such shorter period that the registrant was required to submit and post such files). Yes o No o
Indicate by check mark if disclosure of delinquent filers pursuant to Item 405 of Regulation S-K (§229.405 of this chapter) is not contained herein, and will not be contained, to the best of registrant's knowledge, in definitive proxy or information statements incorporated by reference in Part III of this Form 10-K or any amendments to this Form 10-K. o
Indicate by check mark whether the registrant is a large accelerated filer, an accelerated filer, a non-accelerated filer or a smaller reporting company. See definitions of "large accelerated filer," "accelerated filer," "non-accelerated filer" and "smaller reporting company" in Rule 12b-2 of the Exchange Act. (Check one):
| Large accelerated filer o | Accelerated filer ý | Non-accelerated filer o (Do not check if a smaller reporting company) |
Smaller reporting company o |
Indicate by check mark whether the Registrant is a shell company (as defined in Rule 12b-2 of the Exchange Act). Yes o No ý
The aggregate market value of the voting common equity held by non-affiliates as of June 30, 2010, was approximately $527,258,000, computed by reference to the price of $22.07 per share, the price at which the common equity was last sold on such date as reported on the Nasdaq Global Market. For purposes of this computation, it is assumed that the shares beneficially held by directors and officers of the registrant would be deemed to be stock held by affiliates.
On March 9, 2011, 25,124,585 shares of common stock were outstanding.
ANNUAL REPORT ON FORM 10-K
FOR THE YEAR ENDED DECEMBER 31, 2010
TABLE OF CONTENTS
Exhibit 10.10
Exhibit 10.11
Exhibit 10.13
Exhibit 10.14
Exhibit 10.16
Exhibit 21.1
Exhibit 23.1
Exhibit 31.1
Exhibit 31.2
Exhibit 32.1
Exhibit 32.2
FORWARD-LOOKING STATEMENTS
This Annual Report on Form 10-K contains statements that constitute "forward-looking statements" within the meaning of Section 21E of the Securities Exchange Act of 1934 and Section 27A of the Securities Act of 1933. The words "expect," "estimate," "anticipate," "predict," "believe" and similar expressions and variations thereof are intended to identify forward-looking statements. Such statements appear in a number of places in this filing and include statements regarding the intent, belief or current expectations of the Company, our directors or officers with respect to, among other things (a) trends affecting our financial condition and (b) our business and growth strategies. Our stockholders are cautioned not to put undue reliance on such forward-looking statements. Such forward-looking statements are not guarantees of future performance and involve risks and uncertainties, and actual results may differ materially from those projected in this Report, for the reasons, among others, discussed in the Sections—"Management's Discussion and Analysis of Financial Condition and Results of Operations," and "Risk Factors." The following discussion should be read in conjunction with our financial statements and related notes, which are part of this Report or incorporated by reference to our reports filed with the Securities Exchange Commission. We undertake no obligation to publicly revise these forward-looking statements to reflect events or circumstances that arise after the date hereof.
General
True Religion Apparel, Inc. (referred to in this Annual Report on Form 10-K as "the Company," "our," "we," or "True Religion") designs, markets, distributes, and sells apparel under the brand name "True Religion Brand Jeans" to fashion-conscious consumers on six continents, including North America, Europe, Asia, Australia, Africa and South America. We seek to be a trend setting leader in the design, marketing, distribution and sale of fashion jeans and related sportswear apparel. Our products can be categorized as denim, knit and non-denim, and most come in 'tops' and 'bottoms'. Knit styles include hoodies, t-shirts and sweats, and non-denim fabrics include corduroy and twill. Tops range from shirts to jackets, and bottoms encompass pants, shorts and skirts. We operate in four distinct but integrated segments: U.S. Wholesale, International, U.S. Consumer Direct and Core Services, which includes licensing activity. Our U.S. Consumer Direct segment consists of branded retail stores located in the United States and e-commerce sales. The Core Services segment provides product design, production, distribution, marketing and other overhead resources to the other segments. During the past eight years, we have developed a recognizable brand, expanded vertically into the U.S. Consumer Direct segment, expanded our product offerings, and initiated a strategy to leverage our brand by entering into product licensing agreements.
We market our products to domestic and international wholesale customers by attendance at industry trade shows. Our collections are also presented to the wholesale customers in our showrooms, located in New York City, Los Angeles, Hong Kong, Seoul, Tokyo, London, Milan, Dusseldorf and Munich. We have wholesale sales teams at each of our showrooms. Wholesale customers can be found in six continents and include specialty stores, major department stores, off-price retailers, and wholesale distributors.
Our products are sold in the United States in leading national premium stores, including Bloomingdale's, Neiman Marcus, Nordstrom, Saks Fifth Avenue, and in approximately 750 boutique and specialty stores. We also sell our products in the United States through our 94 branded retail stores and through our True Religion Brand Jeans website, which is operated for us by a third party. Our products are sold internationally through our seven branded retail stores and distributed internationally through our wholesale sales teams, international distributors and sales agents, who sell
1
our products to boutiques and specialty stores in major cities throughout Africa, Asia, Australia, Europe, the Middle East, South America and Canada.
Business Strategy
Our strategy is to build brand recognition by marketing our products to fashion-conscious, affluent consumers who shop in our own branded retail stores, premium nationwide stores, select boutiques and specialty stores, and who want to wear and be seen in the latest and most fashionable premium jeans and related apparel. True Religion Brand Jeans often sell in the range of $168 to $376 per pair at retail; occasionally, we offer specialty items at higher prices. We continually update our product offerings to be seen as a trend-setter in the high fashion jeans apparel market.
For our adult denim jeans and other fabrications, we utilize contract manufacturers located in the United States. We brand products as having been "Made in the U.S.A." Local contract manufacturing helps us control our costs, ensures fast turnaround of popular styles, and keeps fixed overhead to a minimum. Approximately 80 percent of our sportswear is made in the USA by contract manufacturers, and the remaining merchandise is made by foreign contract manufacturers.
We maintain and exercise control over advertising and marketing activities from our headquarters, where we set the tone for integrity, consistency and direction of the True Religion Brand Jeans brand image worldwide. Furthermore, we control our brand image by controlling the distribution of our products. We sell our in-season merchandise only through our own branded retail stores, premium nationwide stores, boutiques and specialty stores, and international distributors that display and merchandise our products in a way that supports our brand image and is in synch with the lifestyle and shopping experience expected by our customers. We sell our prior season merchandise and 'seconds' through our own branded retail stores located in outlet malls and through select off-price retailers.
Our Brand and Products
Since 2003, our brand name has become a familiar name in premium denim and apparel. We believe the strength of the True Religion Brand Jeans brand name and image is due mainly to our emphasis on seeking innovative and distinctive product designs that stand for exceptional fit, styling details and quality. We seek to be an innovator in premium lifestyle branding. Our fashion perspective is significantly influenced by our Chairman, Chief Executive Officer and Chief Merchant, Jeffrey Lubell.
Our principal products are high fashion denim jeans in a wide variety of styles that we design, market, distribute and sell under the True Religion Brand Jeans trademarks. We currently sell men's, women's and kid's styles. Our products are sold in the United States and abroad through our branded retail stores, upscale retailers and boutiques and specialty stores. In addition to denim jeans, we sell a wide variety of related products for men, women and children, including corduroy pants and jackets, cotton, twill, linen and velvet pants and jackets, fleece sweat suits and hooded sweatshirts, skirts, knit shirts, t-shirts, shorts and sportswear. Many of our products can be viewed on our website located at www.truereligionbrandjeans.com. We intend to continue to introduce new styles and styling details in jeans and sportswear.
True Religion Brand Jeans products are made with high quality fabrics primarily from the United States, Turkey, Japan, and Italy that are gently and naturally aged, hand finished and boldly stitched in multiple thread colors. Although we operate in a highly competitive market, we seek to distinguish True Religion Brand Jeans products by emphasizing superior fit and unique styling details. Many of our products are made to look, feel and fit like they have been owned for years. We believe that we have a competitive advantage in the detailing of the design, the quality of the fabric and the superiority of the fit.
2
Each year we introduce new collections that we expect will be considered trend setting by fashion-conscious consumers.
Our 2010 net sales categorized by gender were approximately as follows: women—48%; men—48%; and kids—4%. Our largest retail product category in terms of units sold in 2010 was denim bottoms, which accounted for 72% of total units sold in our U.S. Consumer Direct segment. Our average sales price for women's products in our full price retail stores was $170 in 2010; for men's products, it was $175; and for kid's products, it was $104.
Our Sales Segments
Information regarding net sales, gross profit and operating income, attributable to each of our segments, is included within Item 7. Management's Discussion and Analysis of Financial Condition and Results of Operations, and within Item 8. Financial Statements and Supplementary Data in Note 15, Segment Information, of our Notes to Consolidation Financial Statements, which are incorporated herein by reference.
Our U.S. Consumer Direct Segment
Our U.S. Consumer Direct segment includes our United States branded retail stores and our e-commerce sales. As of December 31, 2010, we operated 94 branded retail stores in the United States, including 27 stores located in outlet centers. We added 24 branded retail stores in 2010, and in 2011 we expect to add approximately15 branded retail stores in the United States. Our branded retail stores are located across the United States in a variety of upscale shopping areas ("street" locations, regional malls, and a limited number of outlet centers). Our typical branded retail store is approximately 1,700 square feet, while our typical branded retail store located in an outlet center is approximately 2,500 square feet. Our branded retail stores showcase the full range of our branded merchandise including licensed products, in an environment that emphasizes our unique "Malibu hippie-bohemian chic" image through an extensive use of hand-hewn hickory pecan wood. Our e-commerce sales are made through a third-party who receives sales commissions in exchange for operating the 'True Religion Brand Jeans' website, accepting customer orders and fulfilling customer orders from their distribution center, where they hold our merchandise on consignment. In 2010, our U.S. Consumer Direct segment generated net sales of $189.1 million, comprising 52.0% of our total net sales.
Our U.S. Wholesale Segment
Our U.S. Wholesale segment sells our products to leading nationwide premium department stores, specialty retailers and boutiques that have the image and merchandising expertise that we demand for the effective presentation of our products. In 2010, our products were sold in Bloomingdale's, Neiman Marcus, Nordstrom and Saks Fifth Avenue, and in approximately 750 specialty and boutique stores. Our U.S. Wholesale segment also sells our products, primarily prior season or excess merchandise, to off-price retailers. In 2010, our U.S. Wholesale segment generated net sales of $104.9 million, comprising 28.8% of our total net sales.
Our International Segment
Our International segment sells our products through a variety of channels, including subsidiaries that operate retail stores and sell to wholesale customers who operate retail stores; distributors and sales agents who sell to upscale boutiques in their respective territory; and directly to wholesale customers who operate retail stores. As of December 31, 2010, our International segment includes one full price and three outlet retail stores in Japan, one full price retail store in the United Kingdom, one full price retail store in Canada and one full price retail store in Germany. Through our wholesale sales teams, international distributors and sales agents, our products are found in major cities throughout
3
Africa, Asia, Australia, Europe, the Middle East, North America and South America. In 2010, our International segment generated net sales of $64.4 million, comprising 17.7% of our total net sales. We have established a Europe, Middle East, and Africa (EMEA) regional office in Switzerland and a regional office for Asia/Pacific in Hong Kong. We plan to grow our net sales and net earnings from the International segment by presenting our merchandise at True Religion Brand Jeans stores and at premium retailers' stores in markets where fashion-conscious consumers shop. In 2011, we expect to open a total of approximately eight branded retail stores in Canada, the United Kingdom, Germany and the Netherlands.
Our Licensing Business
We selectively license our brand name and logo to be included on products sold by other companies to enhance and extend the True Religion Brand Jeans brand. Through licensing alliances, we combine our consumer insight, design, and marketing skills with the specific product competencies of our licensing partners to create, build and expand our product offerings to fashion-conscious consumers. We grant our product licensees the right to design, manufacture and sell at wholesale specified categories of products under our trademark. We have the right to approve or disapprove the licensees' designs, products and wholesale customers. Each licensing partner pays us royalties based upon its wholesale sales of products that use our trademark. In addition, licensing partners may be required to allocate a portion of their sales revenues to advertise our products and share in the creative costs associated with these products. Our licenses typically have three year terms and may grant the licensee conditional renewal options. We recognized $5.3 million in royalty revenue through our licensing business in 2010 as a component of our Core Services segment.
At the end of 2010, our licensed merchandise categories were: footwear, fragrances, headwear (including scarves and gloves), sunglasses and swimwear. In 2010, we terminated our legwear licensed merchandise category.
Marketing
The True Religion Brand Jeans marketing and public relations strategy is designed to communicate the signature design aesthetic and lifestyle of our brand, and to reinforce our position as a global leader in premium denim. Our unique, "bohemian-chic" style was created by our founder, Chief Executive Officer and Chief Merchant, Mr. Jeffrey Lubell. Mr. Lubell continues to oversee every aspect of our marketing, including the creative aspect.
The True Religion Brand Jeans marketing department is based in Vernon, California. The department works hand-in-hand with Mr. Lubell to create seasonal advertising campaigns which serve as the basis for all of our media and marketing communication efforts. The marketing mix consists of a variety of channels including: national and international print advertising, strategic outdoor advertising, in-store advertising, digital advertising, and social media. This mix of media and channels is designed to support the brand's growth across diverse consumer groups and markets. In addition, the brand strategically cultivates and enjoys a strong and loyal celebrity following. These unpaid celebrity endorsements have been, and continue to be, highly effective in expanding our brand awareness and affinity.
Trademarks
We have 26 trademarks registered in the United States for "True Religion Brand Jeans" logos and marks. We have also secured international trademark registrations in 43 countries and we continue to seek trademark registrations that we believe are necessary to protect the True Religion Brand Jeans brand. Generally, our trademarks remain valid and enforceable so long as we continue to use the marks in commerce and the required registration renewals are filed. We consider our trademarks as
4
valuable assets in the marketing of our products and seek to protect them from infringement worldwide.
We have been issued a patent in the United States for our Joey style jeans and three patents for our QT stitch, which are distinctive designs. The patent for our Joey style jeans will expire in 2021 and the three patents for our QT stitch will expire in 2024. We have also been issued six patents in the European Community for our QT stitch which will expire in 2035.
Sources and Availability of Raw Materials
The fabrics used in our denim products are sourced from fabric manufacturers located in the United States, Italy and Japan. Generally, the fabric used in our products is not purchased directly by us but by our contract manufacturers. The thread and other materials are sourced from various industry suppliers within the United States. Our contract manufacturers use high quality fabric in the manufacturing of our products. Although we do not currently have any long-term agreements in place for the supply of our fabric, thread or other components, such high quality fabric is currently readily available from a number of suppliers, including mills located both in the United States and abroad.
Design and Product Development
Our design team, which has 29 employees and is led by Mr. Lubell, is responsible for the design and development of our products. We do not currently have a formal research and development effort but our design team plans to continue to develop new merchandise styles for each season. Our design team is diverse in all our product categories and is known for designing leading fashion trends. Our washes are constantly in development to react to the demand for new and exciting products for consumers. The development of our products from concept through manufacturing is engineered to be not only fashionable but durable as well.
Manufacturing
We outsource all of our manufacturing to third parties on an order-by-order basis. Currently, we have contract manufacturers in the United States for our women's and men's denim, knits and some fleece products, Mexico for our kid's denim, knits, and some fleece products, and Asia for knit shirts, outerwear, woven shirts and non-denim bottoms. We believe we can meet our current production needs using these and other available contract manufacturers. These contractors purchase the fabric and materials and then sew and finish our products to our design specifications. In addition to the contract manufacturers, we utilize various laundry and finishing houses in the Los Angeles area to complete the production of many of our products.
Our production and sourcing staff oversee the manufacturing and quality control of our products and researches and develops new sources of supply for the materials used in the manufacturing of our products.
Quality Control
Our quality control program ensures that products meet our high quality standards. We monitor the quality of the fabrics used by our contract manufacturers prior to the production of garments and inspect prototypes of each product before production runs commence. We also perform random on-site quality control checks during and after production before our products are shipped from our contract manufacturers. Final random inspections of our products occur when our products are received in our distribution center. We believe that our policy of inspecting our products at both our distribution centers and on-site at our contract manufacturers' facilities is integral in maintaining the quality, consistency and reputation of our products.
5
Government Regulation and Supervision
We are subject to customs, truth-in-advertising and other laws, including consumer protection regulations and zoning and occupancy ordinances that regulate retailers generally and/or govern the promotion and sale of merchandise and the operation of retail stores. Some of our merchandise is manufactured by factories located outside of the United States. These products are imported and are subject to U.S. customs laws, which impose tariffs as well as import quota restrictions for textiles and apparel. While importation of goods from some countries from which we buy our products may be subject to embargo by U.S. customs authorities if shipments exceed quota limits, we currently are not restricted by quotas in the operation of our business. In addition, custom duties and tariffs do not comprise a material portion of the cost of our products.
We are committed to product quality and safety; we focus our efforts to adhere to all applicable Federal and state laws and regulations including Consumer Product Safety Improvement Act ("CPSIA"), and all Federal Trade Commission ("FTC") rules and regulations for product labeling. Labeling and advertising of our products is subject to regulation by the FTC. We use a government approved third party testing lab to verify all federally mandated testing requirements for wearing apparel as applicable. We believe that we are in material compliance with these regulations.
Competition
The retail apparel industry is highly competitive. We compete with numerous designers and manufacturers of apparel and accessories, domestic and foreign, including 7 for All Mankind, AG Adriano Goldschmied, Citizens of Humanity, Diesel, G-Star, J Brand, Joe's Jeans and Levi Strauss & Co,. Some of our competitors may be significantly larger and have substantially greater resources than us. We compete primarily on the basis of fashion, fit and quality, which depend on our ability to:
- •
- anticipate and respond to changing consumer demands in a timely manner;
- •
- maintain favorable brand recognition;
- •
- develop and produce high quality products that appeal to consumers;
- •
- appropriately price our products;
- •
- ensure product availability; and
- •
- obtain sufficient retail floor space and effectively present our products at retail.
Employees
As of December 31, 2010, we employed on a full or part-time basis a total of 1,663 employees, consisting of 1,367 in our retail stores, 149 in design and production, and 147 in general administration.
Website Availability of Our Reports Filed with the Securities and Exchange Commission
Our Internet Web site address is www.truereligionbrandjeans.com. We make available free of charge on or through our Internet Web site our Annual Reports on Form 10-K, Quarterly Reports on Form 10-Q, current reports on Form 8-K, and amendments to those reports as soon as reasonably practicable after we electronically file the report with or furnish it to the SEC.
6
Risks Relating to Our Industry
Our business may be negatively impacted by general economic conditions and the current global financial crisis.
Our performance is subject to worldwide economic conditions and their impact on levels of consumer spending that affect not only the ultimate consumer, but also retailers, our largest direct customers. The United States and global economies have suffered from a prolonged recession for the past several years and as a result consumer spending has deteriorated significantly from pre-recession levels and may remain depressed, or be subject to further deterioration, for the foreseeable future. The worldwide apparel industry is heavily influenced by general economic cycles. Purchases of high-fashion apparel and accessories tend to decline in periods of recession or uncertainty regarding future economic prospects, as disposable income declines. During periods of recession or economic uncertainty, we may not be able to maintain or increase our sales to existing customers, make sales to new customers, open and operate new retail stores, maintain sales levels at our existing stores or the mix between full price and off-price stores, maintain or increase our international operations on a profitable basis, or maintain our earnings from operations as a percentage of net sales. As a result, our operating results may be adversely and materially affected by continued downward trends or uncertainty in the United States or global economies.
Our continued operations depend on current fashion trends. If our designs and products do not continue to be fashionable, our business could be adversely affected.
Our success depends in large part on our ability to develop, market and deliver innovative and stylish products that are consistent with and build on our brand and image at a pace and intensity competitive with our competition. The novelty and the design of our True Religion Brand Jeans apparel is critical to our success and competitive position. The apparel industry is subject to rapidly evolving fashion trends and shifting consumer demands. If we are unable to continue to develop and offer unique products to our customers, our sales and margins will decline and we may be faced with a significant amount of unsold finished goods inventory. We cannot be certain that high-fashion denim and related apparel will continue to be fashionable. Should the trend steer away from high-fashion denim and related apparel, our sales could decrease and our business could be adversely affected. In addition, our future designs and plans to expand our product offerings may not be successful, and any unsuccessful designs or product offerings could adversely affect our business.
Our business and the success of our products could be harmed if we are unable to maintain our brand image.
Our success to date has been due in large part to the growth of our brand image. If we are unable to timely and appropriately respond to changing consumer demand, our brand name and brand image may be impaired. Even if we react appropriately to changes in consumer preferences, consumers may consider our brand image to be outdated or associate our brand with styles that are no longer popular. In the past, many apparel companies have experienced periods of rapid growth in sales and earnings followed by periods of declining sales and losses. Our business may be similarly affected in the future.
We face intense competition, including competition from companies with significantly greater resources than ours, and if we are unable to compete effectively with these companies, our market share may decline and our business could be harmed.
We face intense competition in the apparel industry from other established companies. A number of our competitors may have significantly greater financial, technological, manufacturing, sales, marketing and distribution resources than we do. Their greater capabilities in these areas may enable them to better withstand periodic downturns in the apparel industry, compete more effectively on the
7
basis of price and production, and more quickly develop new products. In addition, there are low barriers of entry into this industry and new companies may enter the markets in which we compete, further increasing competition in the industry. Our branded retail stores compete with many other retailers, including department stores, some of whom are our major wholesale customers. We believe that our ability to compete successfully depends on a number of factors, including the style and quality of our products and the strength of our brand name, as well as many factors beyond our control. We may not be able to compete successfully in the future, and increased competition may result in price reductions, reduced profit margins, loss of market share and an inability to generate cash flows that are sufficient to maintain or expand our development and marketing of new products, which would adversely impact the trading price of our common stock.
Increases in the price of raw materials or their reduced availability could increase our cost of goods and decrease our profitability.
The principal fabrics used in our business are cotton, blends, synthetics and wools. The prices we pay our suppliers for our products are dependent in part on the market price for raw materials—primarily cotton—used to produce them. The price and availability of cotton may fluctuate substantially, depending on a variety of factors, including demand, crop yields, weather, supply conditions, transportation costs, work stoppages, government regulation, economic climates and other unpredictable factors. Cotton prices world-wide have increased significantly in the past year, and the outlook for future prices is uncertain. Increases in raw material costs, together with other factors, will make it difficult for us to sustain the gross margin level we have achieved in recent years and result in a decrease of our profitability unless we are able to pass higher prices on to our wholesale and retail customers, reduce the costs of other inputs, or improve our production process so we reduce the amount of excess inventory that is sold at a discount. Moreover, any decrease in the availability of cotton could impair our ability to meet our production requirements in a timely manner.
We may be unable to sustain our past growth or manage our future growth, which may have a material adverse effect on our future operating results.
We have experienced rapid growth since our inception, and have increased our net sales from $140.5 million in 2006 to $363.7 million in 2010. We anticipate that our future growth rate will depend upon various factors, including the strength of our brand image, the market success of our current and future products, the success or our growth strategies, competitive conditions and our ability to manage our future growth. Future growth may place a significant strain on our management and operations. As we continue to grow in our operations, our operational, administrative, financial and legal procedures and controls will need to be expanded. As a result, we may need to train and manage an increasing number of employees, which could distract our management team from our business. Our future success will depend substantially on the ability of our management team to manage our anticipated growth. If we are unable to anticipate or manage our growth effectively, our future operating results could be adversely affected.
Our profitability may decline as a result of increasing pressure on margins.
The high fashion apparel industry is subject to significant pricing pressure caused by many factors, including intense competition, consolidation in the retail industry, pressure from retailers to reduce the costs of products and changes in consumer spending patterns. These factors may cause us to reduce our sales prices for sales of products to retailers and directly to consumers in our Consumer Direct segment which could cause our gross margin to decline. If our sale prices decline and we are unable to offset such price reductions with comparable reductions in our operating costs, our future operating results could be adversely affected.
8
The loss of our Chief Executive Officer or other key management personnel would have an adverse impact on our future development and could impair our ability to succeed.
Our performance is substantially dependent upon the expertise of our Chief Executive Officer, Jeffrey Lubell, and other key management personnel. In addition to his executive officer functions, Mr. Lubell is our chief merchant and heads our design team. His leadership in the design, marketing and operational areas of our business has been instrumental to our growth. The death or disability of Mr. Lubell or other extended or permanent loss of his services, or any negative market or industry perception with respect to him or arising from his loss, could have a material adverse effect on our business. Our other executive officers and other members of senior management have substantial experience and expertise in our business and have made significant contributions to our growth and success. The unexpected loss of services of one or more of these individuals could also have a material adverse effect on us. We do not maintain "key man" insurance with respect to Mr. Lubell or any of our other key management personnel, and any of them may leave us at any time, which could severely disrupt our business and future operating results.
Our business could be harmed if we fail to maintain proper inventory levels.
We place orders with our manufacturers for some of our products prior to the time we receive all of our customers' orders. We do this to minimize purchasing costs, the time necessary to fill customer orders and the risk of non-delivery. We also maintain an inventory of certain products that we anticipate will be in greater demand. However, we may be unable to sell the products we have ordered in advance from manufacturers or that we have in our inventory. Inventory levels in excess of customer demand may result in inventory write-downs, and the sale of excess inventory at discounted prices could significantly impair our brand image and have a material adverse effect on our operating results and financial condition. Conversely, if we underestimate consumer demand for our products or if our manufacturers fail to supply the quality products that we require at the time we need them, we may experience inventory shortages. Inventory shortages might delay shipments to customers, negatively impact retailer and distributor relationships, and diminish brand loyalty.
Increasing the number of branded company-operated stores will require us to develop new capabilities and increase our expenditures.
Our growth strategy is dependent in part on our ability to open and operate new stores and the availability of suitable store locations on acceptable terms. Although we operated 94 branded retail stores in the United States and seven international branded retail stores as of December 31, 2010, we historically have been primarily a wholesaler. In 2011, we plan to open approximately 15 company-operated branded retail and outlet stores in the United States and eight stores in other countries. The success of this strategy is dependent upon, among other factors, the identification of suitable markets and sites for store locations, the negotiation of acceptable lease terms, the hiring, training and retention of competent sales personnel, and making capital expenditures for these stores. We must also offer a broad product assortment, appropriately manage retail inventory levels, install and operate effective retail systems, execute effective pricing strategies and integrate our stores into our overall business mix. An increase in the number of branded company-operated stores will place increased demands on our operational, managerial and administrative resources and require us to further develop our retailing skills and capabilities. These increased demands could cause us to operate our business less effectively, which in turn could cause deterioration in the financial performance of our existing stores. The commitments associated with our expansion will increase our operating expenses may be costly to terminate, and these investments may be difficult to recapture if we decide to close a store or change our strategy.
9
We may be unsuccessful in implementing our planned international expansion, which could impair the value of our brand, harm our business and negatively affect our result of operation.
We plan to grow our net sales and net earnings from our International segment by opening True Religion Brand Jeans stores in various international markets. For example, we recently established a regional office for EMEA in Switzerland and a regional office for Asia/Pacific in Hong Kong and currently plan to open stores in Canada, the United Kingdom, Germany and the Netherlands. As we expand outside the United States, we may incur significant costs relating to starting up, maintaining and expanding foreign operations. Costs may include, but are not limited to obtaining prime locations for stores, setting foreign offices and hiring personnel. We may be unable to open and operate new stores successfully and our growth may be limited, unless we are able to:
- •
- identify desirable markets and sites for store locations;
- •
- negotiate acceptable lease terms;
- •
- efficiently build and equip new stores;
- •
- hire, train and retain competent store personnel;
- •
- manage inventory effectively to meet the needs of new and existing stores on a timely basis;
- •
- successfully integrate stores into our existing operations;
- •
- manage foreign currency risk effectively;
- •
- satisfy the fashion preferences of customers in new geographic areas; and
- •
- achieve acceptable operating margins from new stores.
We cannot be sure that we can successfully open new stores or that our new stores will be profitable. Additionally, our international expansion may place increased demands on our operational, managerial and administrative resources and these increased demands may cause the Company to operate its business less efficiently, which could harm the performance of its existing stores.
We must successfully maintain and/or upgrade our information technology systems.
We rely on various information technology systems to manage our operations, which subjects us to inherent costs and risks associated with maintaining, upgrading, replacing and changing these systems, including impairment of our ability to fulfill customer orders, potential disruption of our internal control structure, substantial capital expenditures, demands on management time and other risks of delays or difficulties in upgrading, transitioning to new systems or of integrating new systems into our current systems.
We rely on contract manufacturing of our products. Our inability to secure production sources meeting our quality, cost, working conditions and other requirements, or failures by our contractors to perform, could harm our sales, service levels and reputation.
We source our products from independent manufacturers who purchase fabric and other raw materials. As a result, we must locate and secure production capacity. We depend on independent manufacturers to maintain adequate financial resources, secure a sufficient supply of raw materials, and maintain sufficient development and manufacturing capacity in an environment characterized by continuing cost pressure and demands for product innovation and speed-to-market. In addition, we do not have material long-term contracts with any of our independent manufacturers, and these manufacturers generally may unilaterally terminate their relationship with us at any time.
Our dependence on contract manufacturing could subject us to difficulty in obtaining timely delivery of products of acceptable quality. A manufacturer's failure to ship products to us in a timely
10
manner or to meet our quality standards could cause us to miss the delivery date requirements of our wholesale customers. In addition, any interference with our ability to receive shipments from those manufacturers, such as conditions at ports or issues that otherwise affect transportation and warehousing providers, could cause delayed delivery of product. Additionally, if we experience a significant increase in demand, or if we need to replace any of the manufacturers that we currently use, we may have to expand our third party manufacturing capacity. This capacity may not be available to us, or available on terms that are acceptable to us. Failing to make timely deliveries may cause our customers to cancel orders, refuse to accept deliveries, impose non-compliance charges through invoice deductions or other charge-backs, demand reduced prices or reduce future orders, any of which could harm our sales and margins.
Our success depends on the continued protection of our trademark and other proprietary intellectual property rights.
Our trademark and other intellectual property rights are important to our success and competitive position, and the loss of or inability to enforce trademark and other proprietary intellectual property rights could harm our business. We devote substantial resources to the establishment and protection of our trademark and other proprietary intellectual property rights on a worldwide basis. Despite any precautions we may take to protect our intellectual property, policing unauthorized use of our intellectual property is difficult, expensive and time consuming, and we may be unable to adequately protect our intellectual property or determine the extent of any unauthorized use, particularly in those foreign countries where the laws do not protect proprietary rights as fully as in the United States. Our efforts to establish and protect our trademark and other proprietary intellectual property rights may not be adequate to prevent imitation or counterfeiting of our products by others or to prevent others from seeking to block sales of our products for violating their trademarks and proprietary rights. Unauthorized copying of our products or unauthorized use of our trademarks or other proprietary rights may not only erode sales of our products but may also cause significant damage to our brand names and our ability to effectively represent ourselves to our customers. Also, we cannot assure you that others will not assert rights in, or ownership of, trademarks and other proprietary rights of True Religion, that our proprietary rights would be upheld if challenged or that we would, in that event, not be prevented from using our trademarks, any of which could have a material adverse effect on our financial condition and results of operations. Further, we could incur substantial costs in legal actions relating to our use of intellectual property or the use of our intellectual property by others. Even if we are successful in these actions, the costs we incur could have a material adverse effect on us.
Our business could suffer from the financial instability of our customers.
In the United States, we sell our products to certain retail companies on open account with 30 to 60 day payment terms. We generally request a letter of credit or wire transfer before shipment to our foreign distributors, but these arrangements are not always possible. Customer financial difficulties could result in losses to us.
A significant disruption at our distribution center could have a material adverse impact on our business and operating results.
We primarily rely on a single distribution center located at our corporate offices in Vernon, California to receive, store and distribute merchandise to all of our stores and wholesale customers. Any significant interruption in the operation of our Vernon distribution center due to natural disasters, accidents, system failures or other unforeseen causes could have a material adverse effect on our business and operating results.
11
Our ability to attract customers to our stores depends heavily on the success of the shopping centers and street locations in which they are located.
In order to generate customer traffic, we locate many of our stores in prominent locations within successful shopping centers or in fashionable shopping districts. We cannot control the development of new shopping centers or districts; the availability or cost of appropriate locations within existing or new shopping centers or districts; competition with other retailers for prominent locations; or the success of individual shopping centers or districts. All of these factors may impact our ability to meet our growth targets and could have a material adverse effect on our financial condition or results of operations.
A privacy breach could damage our reputation and our relationship with our customers, expose the Company to litigation risk and adversely affect our business.
As part of our normal course of business, we collect, process and retain sensitive and confidential customer information. Despite security measures we have in place, our facilities and systems, and those of the Company's third party service providers, may be vulnerable to security breaches, acts of vandalism, computer viruses, misplaced or lost data, programming and/or human errors, or other similar events. Any security breach involving the misappropriation, loss or other unauthorized disclosure of confidential information, whether by the Company or its vendors, could severely damage our reputation and our relationships with our customers, expose the Company to risks of litigation and liability and adversely affect our business.
Our ability to conduct business in international markets may be affected by legal, regulatory, political and economic risks.
As we continue to increase our international operations, we face the possibility of greater losses from a number of risks inherent in doing business in international markets and from a number of factors which are beyond our control. These factors include, among other things:
- •
- political instability or acts of terrorism, which disrupt trade with the countries in which our contractors, suppliers or
customers are located; difficulties in managing our foreign operations;
- •
- local business practices that do not conform to legal or ethical guidelines; adoption of additional or revised quotas,
restrictions or regulations relating to imports or exports;
- •
- additional or increased customs duties, tariffs, taxes and other charges on imports;
- •
- significant fluctuations in the value of the dollar against foreign currencies;
- •
- increased difficulty in protecting our intellectual property rights in foreign jurisdictions;
- •
- social, legal or economic instability in the foreign markets in which we do business, which could influence our ability to
sell our products in these international markets;
- •
- restrictions on the transfer of funds between the United States and foreign jurisdictions; and
- •
- the ability of our international distributors to locate and continue to open desirable new retail locations.
Foreign currency fluctuations could adversely impact our financial condition and results of operations.
We generally purchase our products in U.S. dollars. However, we source some of our products overseas. The cost of these products may be affected by changes in the value of the applicable currencies. Changes in currency exchange rates may also affect the U.S. dollar value of the foreign currency denominated prices at which our international business will sell products. Furthermore, our international sales and some of our licensing revenue are generally derived from sales in foreign currencies. This revenue, when translated into U.S. dollars for consolidated reporting purposes, could
12
be materially affected by fluctuations in the U.S. dollar, negatively impacting our results of operations and our ability to generate revenue growth.
Our licensees may not comply with our product quality, manufacturing standards, marketing and other requirements.
We license our trademarks to third parties for manufacturing, marketing and distribution of various products. While we enter into agreements with our licensees covering product design, product quality, sourcing, manufacturing, marketing and other requirements, our licensees may not comply fully with those agreements. Non-compliance could include marketing products under our brand names that do not meet our quality and other requirements or engaging in manufacturing practices that do not meet our standards. These activities could harm our brand equity, our reputation and our business.
Violation of labor laws and practices by our licensees or suppliers could harm our business.
We require our licensing partners and suppliers to operate in compliance with applicable laws and regulations. While our code of conduct promotes ethical business practices, we do not control our licensees or suppliers or their labor practices. The violation of labor or other laws by any of our licensees or suppliers, or divergence of a licensee's or supplier's labor practices from those generally accepted as ethical in the United States, could interrupt or otherwise disrupt the shipment of our products, harm the value of our trademarks, damage our reputation or expose us to potential liability for their wrongdoings.
Our quarterly sales and operating results fluctuate as a result of a variety of factors, including seasonal fluctuations in demand for premium denim and related apparel, and accessories, delivery date delays, timing of new store openings, recognition of stock-based compensation and potential fluctuations in our annualized tax rate, which may result in volatility of our stock price.
Our quarterly sales and operating results have varied significantly in the past and can be expected to fluctuate in the future due to a number of factors, many of which are beyond our control. For example, sales of our products have historically been somewhat seasonal in nature with the largest sales generally occurring in the second half of the year. Delays in scheduling or pickup of products by our wholesale customers could negatively impact our net sales and results of operations for any given quarter. The timing of new store openings and the amount of sales contributed by new stores could also impact our net sales and results of operations for any given quarter. The compensation expense for the awards that vest immediately caused an increase in our selling, general and administrative expenses and reduced our net income and earnings per share in our quarterly income statements. Also, our annualized tax rate is based on projections of our operating results for the year, which we review and revise as necessary at the end of each quarter. Any quarterly fluctuations in our annualized tax rate that may occur could have a material impact on our quarterly operating results. As a result of these specific and other general factors, our operating results will likely vary from quarter to quarter and the results for any particular quarter may not be necessarily indicative of results for the full year. Any shortfall in sales or net income from levels expected by securities analysts and investors could cause a decrease in the trading price of our common stock.
Item 1B. Unresolved Staff Comments.
None.
We lease our corporate headquarters facility, which is a 119,000 square foot industrial building located in Vernon, California. The lease agreement expires on August 31, 2016, and we have the right
13
to renew the lease agreement for up to ten years if we comply with the lease agreement terms. We conduct our design, administrative and distribution operations at this facility.
We lease our retail store locations under operating lease agreements expiring on various dates through 2022. Standard store lease agreements cover a period of ten years and do not include a renewal option. These facilities are located in the United States, the United Kingdom, Japan, Canada and Germany. Many of the store lease agreements allow us to terminate the agreement, generally in the third or fourth year, if our sales do not meet a pre-determined level. As of December 31, 2010, we had 101 stores open, including four in Japan and one each in the United Kingdom, Canada and Germany. In 2011, we expect to open approximately 15 stores in the United States and eight stores internationally. At the end of 2010, our total retail square footage, which includes international retail stores and storage space at all stores, was approximately 209,000. Our retail stores range in size from 600 to 4,700 square feet.
We also lease our domestic and international showrooms and international administrative offices under lease agreements expiring on various dates through 2019. The showrooms are located in Los Angeles, New York, Duesseldorf, Munich and Milan and total approximately 17,000 square feet. The international administrative offices are located in Tokyo, Dusseldorf, Hong Kong and Seoul and total approximately 11,000 square feet. The offices in Tokyo, Hong Kong and Seoul include showroom spaces.
In the ordinary course of business, we are involved in various legal proceedings. We do not believe that these matters, either alone or in the aggregate, will have a material impact on our financial condition.
14
Item 5. Market for Registrant's Common Equity, Related Stockholder Matters and Issuer Purchases of Equity Securities.
Market Information
Our common stock trades under the symbol "TRLG" on the Nasdaq Global Market. The high and low sales prices for our common stock, as reported by the Nasdaq Global Market for the periods indicated are as follows:
| |
2010 | 2009 | |||||||||||
|---|---|---|---|---|---|---|---|---|---|---|---|---|---|
| |
High | Low | High | Low | |||||||||
First Quarter |
$ | 30.85 | $ | 18.73 | $ | 14.13 | $ | 7.83 | |||||
Second Quarter |
$ | 33.11 | $ | 22.07 | $ | 24.52 | $ | 11.87 | |||||
Third Quarter |
$ | 25.79 | $ | 17.54 | $ | 26.51 | $ | 19.64 | |||||
Fourth Quarter |
$ | 23.86 | $ | 18.73 | $ | 28.33 | $ | 17.57 | |||||
Holders
As of March 4, 2011 there were 57 record holders and approximately 16,500 beneficial holders of our Common Stock.
Dividends
We have not declared or paid any cash dividends since inception and we do not intend to pay any cash dividends in the foreseeable future. There are no restrictions that limit our ability to pay dividends on our common shares. Any future determination as to the payment of dividends on our common stock will be at the discretion of our Board of Directors and will depend on our results of operations, financial condition, capital requirements and other factors deemed relevant by the Board of Directors, including the General Corporation Law of the State of Delaware, which provides that dividends are only payable out of surplus or current net profits.
15
Stock Price Performance
The following graph compares, for each of the last five fiscal years, commencing on December 31, 2005 and ending December 31, 2010, the cumulative total return of True Religion Apparel, Inc. common stock, Standard & Poor's 500 Index, and Standard & Poor's 1500 Apparel, Accessories & Luxury Goods Index. The Apparel, Accessories & Luxury Goods Index is comprised of 17 companies, also representing a sector of the Standard & Poor's 500 Index. The cumulative total return of True Religion Apparel, Inc. common stock assumes $100 invested on December 31, 2005 in our common stock and in each of the foregoing indices. The stock price performance graph is not necessarily indicative of future stock price performance. The return on $100 invested in the S&P 500 and the S&P 1500 Apparel, Accessories & Luxury Goods Index over the 5 year period from December 2005 to December 2010 was $112 and $152, respectively.
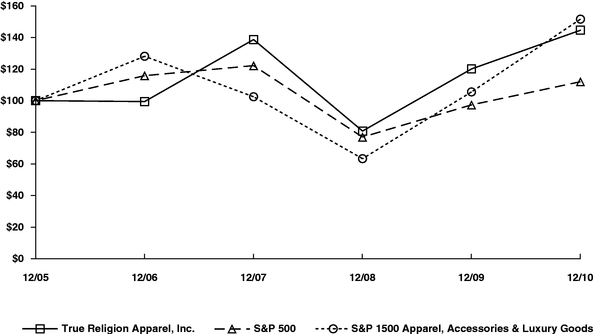
- *
- $100 invested on 12/31/05 in stock or index, including reinvestment or dividends.
Fiscal year ending December 31.
Copyright ©2011 S&P, a division of The McGraw-Hill Companies, Inc. All rights reserved.
Transactions in Our Equity Securities
For the period covered by this report, we have not engaged in any transactions involving the sale of our unregistered equity securities that were not disclosed in a quarterly report on Form 10-Q or a current report on Form 8-K. We have not engaged in any sales of registered securities for which the
16
use of proceeds is required to be disclosed. This table provides certain information with respect to our purchases of shares of our common stock during the fourth quarter of 2010:
Period
|
Total Number of Shares Purchased(a) |
Average Price Paid Per Share(a) |
Total Number of Shares Purchased as Part of Publicly Announced Plan |
Approximate Dollar Value of Shares That May Yet Be Purchased Under the Plan |
|||||||||
|---|---|---|---|---|---|---|---|---|---|---|---|---|---|
October 1, 2010—October 31, 2010 |
1,346 | $ | 22.04 | — | — | ||||||||
November 1, 2010—November 30, 2010 |
245 | $ | 20.82 | — | — | ||||||||
December 1, 2010—December 31, 2010 |
— | $ | — | — | — | ||||||||
Total |
1,591 | $ | 21.85 | — | — | ||||||||
- (a)
- These columns reflect the surrender to us of shares of common stock to satisfy minimum statutory tax withholding obligations in connection with the vesting of restricted stock awards issued to employees.
Item 6. Selected Financial Data.
The following selected financial data are derived from the audited Consolidated Financial Statements and should be read in conjunction with Item 1A "Risk Factors," Item 7 "Management's Discussion and Analysis of Financial Condition and Results of Operations," and our Consolidated Financial Statements and the related notes included in Item 8 Financial Statements and Supplementary Data of this Annual Report on Form 10-K.
| |
For the Years Ended December 31, | |||||||||||||||
|---|---|---|---|---|---|---|---|---|---|---|---|---|---|---|---|---|
| |
2010 | 2009 | 2008 | 2007 | 2006 | |||||||||||
Statement of operations data (In Thousands): |
||||||||||||||||
Net sales |
$ | 363,714 | $ | 311,001 | $ | 270,000 | $ | 173,256 | $ | 140,489 | ||||||
Operating income |
69,922 | 77,597 | 68,876 | 47,142 | 34,977 | |||||||||||
Provision for income taxes |
26,690 | 30,434 | 25,570 | 21,100 | 14,035 | |||||||||||
Net income attributable to True Religion Apparel, Inc. |
43,496 | 47,332 | 44,371 | 27,845 | 21,746 | |||||||||||
Earnings per share attributable to True Religion Apparel, Inc.: |
||||||||||||||||
Basic |
$ | 1.78 | $ | 1.97 | $ | 1.89 | $ | 1.21 | $ | 0.97 | ||||||
Diluted |
$ | 1.75 | $ | 1.92 | $ | 1.83 | $ | 1.16 | $ | 0.92 | ||||||
Weighted number of shares outstanding—basic |
24,495 | 23,993 | 23,511 | 22,964 | 22,496 | |||||||||||
Weighted number of shares outstanding—diluted |
24,852 | 24,659 | 24,270 | 23,949 | 23,608 | |||||||||||
| |
As of December 31, | |||||||||||||||
|---|---|---|---|---|---|---|---|---|---|---|---|---|---|---|---|---|
| |
2010 | 2009 | 2008 | 2007 | 2006 | |||||||||||
Balance sheet data ($000's): |
||||||||||||||||
Working capital |
$ | 211,833 | $ | 166,565 | $ | 113,108 | $ | 72,846 | $ | 58,845 | ||||||
Total assets |
$ | 295,884 | $ | 229,806 | $ | 166,452 | $ | 113,258 | $ | 79,751 | ||||||
Stockholders' equity |
$ | 249,032 | $ | 197,854 | $ | 142,250 | $ | 95,247 | $ | 64,147 | ||||||
17
Item 7. Management's Discussion and Analysis of Financial Condition and Results of Operations.
Executive Summary
We design, market, distribute and sell premium denim apparel, centered on our core denim products using the brand name "True Religion Brand Jeans." Our products include pants, tops and jackets, made from denim, fleece, corduroy and other fabrics. We are known for our unique fit and styling details. Through multiple wholesale and retail channels, our expanding product line reaches fashion-conscious consumers on six continents, including North America, Europe, Asia, Australia, Africa and South America.
Strategic Initiatives
We believe that our brand, differentiated design vision, high-quality supply chain and diversified business strategy anchored by our direct to consumer sales model enable us to be well positioned to expand our business and enhance shareholder value through execution of our strategy and focusing on key strategic initiatives, which include:
- •
- Expand in International markets—We believe that our net sales
in our international segment can grow significantly in the future. Our approach to each market may vary, but in general we intend to have our merchandise presented in multi-brand retail stores
(wholesale channel) and in True Religion Brand Jeans stores (retail channel), which is consistent with our domestic presentation. We have established three regions to manage our international
business: Asia Pacific, based in Hong Kong; Europe, Middle East and Africa (EMEA), based in Switzerland; and Americas, based at our company headquarters in Vernon, California. We have leadership teams
in place in each of these three regions to direct the growth of our international business.
- •
- Grow our U.S. Direct to Consumer store base while achieving targeted
margins—From the beginning of 2008 to the end of 2010, we opened 79 stores in the United States, reaching 94 stores at December 31, 2010. Our goal for each
domestic retail store is to achieve a 30 percent operating margin. We are studying our current store base in an attempt to identify factors that are linked to
better-than-average financial results; if we identify these factors, we will use them as we consider and rollout future store locations. Also, we are adding experienced retail
business leaders to manage our operating expenses better.
- •
- Increase sales to the boutique and specialty stores in the
U.S.—We transitioned from a third party sales agent to an in-house sales team in 2010. The in-house sales team will direct more effort
toward increasing sales to specialty boutique stores.
- •
- Develop our ecommerce business—Many consumers use the internet
to learn about fashion trends and purchase merchandise. We are refining our on-line merchandise strategy and considering new on-line marketing approaches to enhance our fashion
brand position and increase our on-line sales.
- •
- Build overall brand awareness—Since True Religion Brand Jeans was founded in 2002, the brand was recognized for innovative styling and fit. Many consumers were introduced to the brand and its latest styles as it was presented in leading fashion retailers and in our own branded retail stores. In the future, we seek new avenues to present our innovative, trendsetting merchandise to existing and new consumers. To do this, we are expanding our use of product placement, social media and on-line search.
Presentation of Segment Financial Information
We have reclassified certain prior period segment information to conform to the current year presentation. We reclassified our reportable segment formerly titled "Other" to include the functions
18
which support the overall business and were previously classified in the U.S. Wholesale segment. The functions that were reclassified include the design, production, marketing, distribution, credit, customer service, information technology and accounting departments. In connection with this reclassification, we renamed the segment "Core Services". As a result of this change, we have reclassified certain SG&A expenses previously presented in the U.S. Wholesale segment to Core Services in order to conform to the revised presentation. We made the change to our reportable segments to more closely align them with how management reviews and monitors the performance of our operating segments. Total consolidated SG&A expenses and total consolidated operating income were not changed as a result of these reclassifications. The reclassifications had no impact upon previously reported consolidated net sales and consolidated gross profit by reportable segment. Additionally, these reclassifications did not impact the consolidated balance sheets, statements of income, or statements of cash flows.
2010 Compared to 2009
The following table summarizes results of operations for 2010 compared to 2009 (dollar amounts in thousands, except per share data):
| |
Years Ended December 31, | |||||||||||||||||||
|---|---|---|---|---|---|---|---|---|---|---|---|---|---|---|---|---|---|---|---|---|
| |
2010 | 2009 | |
|
||||||||||||||||
| |
Amount | % | Amount | % | Change | % | ||||||||||||||
Net sales |
$ | 363,714 | 100.0 | % | $ | 311,001 | 100.0 | % | $ | 52,713 | 16.9 | % | ||||||||
Gross profit |
229,979 | 63.2 | % | 195,562 | 62.9 | % | 34,417 | 17.6 | % | |||||||||||
Selling, general and administrative expenses |
160,057 | 44.0 | % | 117,965 | 37.9 | % | 42,092 | 35.7 | % | |||||||||||
Operating income |
69,922 | 19.2 | % | 77,597 | 25.0 | % | (7,675 | ) | (9.9 | )% | ||||||||||
Other income, net |
403 | 0.1 | % | 169 | 0.0 | % | 234 | 138.5 | % | |||||||||||
Provision for income taxes |
26,690 | 7.3 | % | 30,434 | 9.8 | % | (3,744 | ) | (12.3 | )% | ||||||||||
Net Income attributable to True Religion Apparel, Inc. |
$ | 43,496 | 12.0 | % | $ | 47,332 | 15.2 | % | $ | (3,836 | ) | (8.1 | )% | |||||||
Earnings per share attributable to True Religion Apparel, Inc.: |
||||||||||||||||||||
Basic |
$ | 1.78 | $ | 1.97 | $ | (0.19 | ) | (9.6 | )% | |||||||||||
Diluted |
$ | 1.75 | $ | 1.92 | $ | (0.17 | ) | (8.9 | )% | |||||||||||
Net Sales
The following table summarizes net sales by segment (dollar amounts in thousands):
| |
Years Ended December 31, | Change | |||||||||||
|---|---|---|---|---|---|---|---|---|---|---|---|---|---|
| |
2010 | 2009 | Amount | % | |||||||||
U.S. Consumer Direct |
189,097 | 129,030 | 60,067 | 46.6 | % | ||||||||
U.S. Wholesale |
104,874 | 123,203 | (18,329 | ) | (14.9 | )% | |||||||
International |
64,443 | 54,479 | 9,964 | 18.3 | % | ||||||||
Core Services |
5,300 | 4,289 | 1,011 | 23.6 | % | ||||||||
Total net sales |
$ | 363,714 | $ | 311,001 | $ | 52,713 | 16.9 | % | |||||
19
The following table summarizes percentage of total net sales by segment:
| |
December 31, | Change | ||||||||
|---|---|---|---|---|---|---|---|---|---|---|
| |
2010 | 2009 | % | |||||||
U.S. Consumer Direct |
52.0 | % | 41.5 | % | 10.5 | % | ||||
U.S. Wholesale |
28.8 | 39.6 | (10.8 | )% | ||||||
International |
17.7 | 17.5 | 0.2 | % | ||||||
Core Services |
1.5 | 1.4 | 0.1 | % | ||||||
Total net sales |
100.0 | % | 100.0 | % | ||||||
U.S. Consumer Direct net sales increased by 46.6% to $189.1 million in 2010, primarily because we opened 24 stores in 2010, finishing the year with 94 stores compared to 70 stores at the end of 2009. In addition, our same store sales increased 9.6% as we introduced a strategy to offer new styles regularly in our retail stores. In 2011, we expect to open approximately15 branded retail stores in the United States.
U.S. Wholesale net sales decreased 14.9% to $104.9 million. Net sales to major accounts, which include Nordstrom, Bloomingdale's, Saks Fifth Avenue and Neiman Marcus, decreased as we continue to be impacted by the overall sales decline in the women's premium denim category at the major department stores. In addition, we reduced our sales to off-price retailers to maintain our premium brand positioning. Partially offsetting these decreases was an increase in our net sales to specialty retailers.
International net sales increased 18.3% to $64.4 million primarily due to increased sales to the Europe, Middle East and Africa ("EMEA") and Asia Pacific regions. The increase in net sales to the EMEA region was driven by the addition of our German joint venture in August 2010 and the opening of a retail store in London, England in May 2010. The increase in net sales in the Asia Pacific region was driven by the additional of our Hong Kong-based Asia Pacific team beginning in late 2009. During 2010, we opened three international branded retail stores: one in Toronto, Canada, one in London, England and one in Tokyo, Japan. Our Store in Cologne, Germany was opened in March 2010, shortly before we acquired it in August 2010. In 2011, we expect to open eight international branded retail stores.
Core services net sales increased 23.6% to $5.3 million in 2010 from $4.3 million in 2009, due to increases in royalties due under existing licensing contracts.
Gross Profit
The following table summarizes gross profit by segment (dollar amounts in thousands):
| |
Years Ended December 31, | Change | |||||||||||
|---|---|---|---|---|---|---|---|---|---|---|---|---|---|
| |
2010 | 2009 | Amount | % | |||||||||
U.S. Consumer Direct |
$ | 136,915 | $ | 95,276 | $ | 41,639 | 43.7 | % | |||||
U.S. Wholesale |
53,362 | 65,882 | (12,520 | ) | (19.0 | )% | |||||||
International |
34,402 | 30,115 | 4,287 | 14.2 | % | ||||||||
Core Services |
5,300 | 4,289 | 1,011 | 23.6 | % | ||||||||
Total gross profit |
$ | 229,979 | $ | 195,562 | $ | 34,417 | 17.6 | % | |||||
20
The following table summarizes gross profit as a percentage of net sales ("gross margin") by segment:
| |
December 31, | Change | ||||||||
|---|---|---|---|---|---|---|---|---|---|---|
| |
2010 | 2009 | % | |||||||
U.S. Consumer Direct |
72.4 | % | 73.8 | % | (1.4 | )% | ||||
U.S. Wholesale |
50.9 | 53.5 | (2.6 | )% | ||||||
International |
53.4 | 55.3 | (1.9 | )% | ||||||
Core Services |
100.0 | 100.0 | 0.0 | % | ||||||
Total gross margin |
63.2 | % | 62.9 | % | 0.3 | % | ||||
Overall gross margin improved from 62.9% of net sales in 2009 to 63.2% of net sales in 2010, primarily reflecting the ongoing net sales mix shift towards the higher-margin U.S. Consumer Direct business.
The U.S. Consumer Direct gross margin decreased to 72.4% in 2010 from 73.8% in 2009 as a higher percentage of the segment's net sales came from the lower margin outlet stores as compared to the full price stores and an increase in sales of the lower margin sportswear.
U.S. Wholesale gross profit decreased to 50.9% in 2010 from 53.5% in 2009 primarily due to additional sales discounts that we offered to spur sales of merchandise on hand.
International gross margin decreased to 53.4% in 2010 from 55.3% in 2009 primarily because the gross margin earned on sales in the third quarter by our new German joint venture was driven by merchandise that was acquired from our former distributor at a higher cost.
Selling, General and Administrative Expenses
The following table presents the components of selling, general & administrative expenses ("SG&A") by segment (dollar amounts in thousands):
| |
Years Ended December 31, | Change | |||||||||||
|---|---|---|---|---|---|---|---|---|---|---|---|---|---|
| |
2010 | 2009 | Amount | % | |||||||||
U.S. Consumer Direct |
$ | 72,274 | $ | 50,510 | $ | 21,764 | 43.1 | % | |||||
U.S. Wholesale |
7,097 | 5,775 | 1,322 | 22.9 | % | ||||||||
International |
16,915 | 4,948 | 11,967 | 241.9 | % | ||||||||
Core Services |
63,771 | 56,732 | 7,039 | 12.4 | % | ||||||||
Total selling, general and administrative expenses |
$ | 160,057 | $ | 117,965 | $ | 42,092 | 35.7 | % | |||||
The following table summarizes SG&A as a percentage of segment net sales ("SG&A rate"), by segment:
| |
December 31, | Change | ||||||||
|---|---|---|---|---|---|---|---|---|---|---|
| |
2010 | 2009 | % | |||||||
U.S. Consumer Direct |
38.2 | % | 39.1 | % | (0.9 | )% | ||||
U.S. Wholesale |
6.8 | 4.7 | 2.1 | % | ||||||
International |
26.2 | 9.1 | 17.1 | % | ||||||
Core Services |
NM | NM | NM | |||||||
Total SG&A rate |
44.0 | % | 37.9 | % | 6.1 | % | ||||
21
The U.S. Consumer Direct SG&A increase of $21.8 million or 43.1% is directly related to the growth in the number of stores over the prior year, from 70 at the end of 2009 to 94 at the end of 2010. As a percentage of net sales, the U.S. Consumer Direct SG&A rate decreased from 39.1% in 2009 to 38.2% in 2010 primarily due to the segment's same store sales increase producing leverage on fixed costs.
U.S. Wholesale SG&A increased $1.3 million, or 22.9%, primarily as a result of the costs incurred over the first half of 2010 in connection with the transition from a sales agent to an in-house sales team.
International SG&A increased $12.0 million, or 241.9%, primarily due to the new wholesale sales teams in Asia Pacific and Germany, the opening of four new retail stores, and the costs to set up a European regional office in Switzerland.
Core Services SG&A increased $7.0 million or 12.4% primarily due to $4.3 million in separation costs associated with the termination of our former president in May 2010. In addition, our advertising costs increased as well as depreciation expense in 2010 as we installed a new wholesale and financial information technology system in the second half of 2009.
Operating Income
The following table summarizes operating income by segment (dollar amounts in thousands):
| |
Years Ended December 31, | Change | |||||||||||
|---|---|---|---|---|---|---|---|---|---|---|---|---|---|
| |
2010 | 2009 | Amount | % | |||||||||
U.S. Consumer Direct |
$ | 64,641 | $ | 44,766 | $ | 19,875 | 44.4 | % | |||||
U.S. Wholesale |
46,265 | 60,107 | (13,842 | ) | (23.0 | )% | |||||||
International |
17,487 | 25,167 | (7,680 | ) | (30.5 | )% | |||||||
Core Services |
(58,471 | ) | (52,443 | ) | (6,028 | ) | 11.5 | % | |||||
Total operating income |
$ | 69,922 | $ | 77,597 | $ | (7,675 | ) | (9.9 | )% | ||||
The following table summarizes operating income as a percentage of net sales ("operating margin"), by segment:
| |
December 31, | Change | ||||||||
|---|---|---|---|---|---|---|---|---|---|---|
| |
2010 | 2009 | % | |||||||
U.S. Consumer Direct |
34.2 | % | 34.7 | % | (0.5 | )% | ||||
U.S. Wholesale |
44.1 | 48.8 | (4.7 | )% | ||||||
International |
27.1 | 46.2 | (19.1 | )% | ||||||
Core Services |
NM | NM | NM | |||||||
Total SG&A rate |
19.2 | % | 25.0 | % | (5.8 | )% | ||||
The U.S. Consumer Direct operating margin decreased from 34.7% in 2009 compared to 34.2% in 2010 primarily due to the decreased gross margin as a result of higher percentage of the segment's sales came from the lower margin outlet stores as compared to the full price stores and an increase in sales of the lower margin sportswear.
U.S. Wholesale operating income decreased as a percentage of U.S. Wholesale net sales from 48.8% in 2009 to 44.1% in 2010 primarily due to the decrease in gross margin and the deleveraging of SG&A expenses caused by the net sales decline.
22
International operating income decreased as a percentage of International net sales, from 46.2% in 2009 to 27.1% in 2010 primarily due to the increase in SG&A expenses as a result of our strategic initiative to expand our brand's presence in the Asia Pacific and EMEA regions.
Other Income, net
Other income, net was $0.4 million in 2010 compared to $0.2 million in 2009. This increase is primarily due to foreign exchange gains on our intercompany balances with our foreign subsidiaries.
Provision for Income Taxes
Our effective tax rate was 38.0% for 2010 compared to 39.1% in 2009. The decrease in the effective tax rate is primarily due to an increase in 2010, in the U.S. Federal Domestic Activity Production deduction percentage.
Net Income attributable to True Religion Apparel, Inc. and Earnings Per Diluted Share
Net income attributable to True Religion Apparel, Inc. was $43.5 million, or $1.75 per diluted share, for 2010 compared to $47.3 million, or $1.92 per diluted share, for 2009. The separation costs of $4.3 million ($2.7 million net of taxes) reduced our diluted earnings per share attributable to True Religion Apparel, Inc. by $0.11 for 2010. Net income attributable to True Religion Apparel, Inc. excluding separation costs for 2010 would have been $46.2 million, or $1.86 per diluted share. The remaining decrease in net income attributable to True Religion Apparel, Inc. and diluted earnings per share attributable to True Religion Apparel, Inc. is primarily due to the overall slowdown in sales of women's premium denim at the major department stores.
2009 Compared to 2008
The following table summarizes results of operations for 2009 compared to 2008 (dollar amounts in thousands, except per share data):
| |
Years Ended December 31, | |||||||||||||||||||
|---|---|---|---|---|---|---|---|---|---|---|---|---|---|---|---|---|---|---|---|---|
| |
2009 | 2008 | |
|
||||||||||||||||
| |
Amount | % | Amount | % | Change | % | ||||||||||||||
Net sales |
$ | 311,001 | 100.0 | % | $ | 270,000 | 100.0 | % | $ | 41,001 | 15.2 | % | ||||||||
Gross profit |
195,562 | 62.9 | % | 157,001 | 58.1 | % | 38,561 | 24.6 | % | |||||||||||
Selling, general and administrative expenses |
117,965 | 37.9 | % | 88,125 | 32.6 | % | 29,840 | 33.9 | % | |||||||||||
Operating income |
77,597 | 25.0 | % | 68,876 | 25.5 | % | 8,721 | 12.7 | % | |||||||||||
Interest income, net |
169 | 0.0 | % | 1,065 | 0.4 | % | (896 | ) | (84.1 | )% | ||||||||||
Provision for income taxes |
30,434 | 9.8 | % | 25,570 | 9.5 | % | 4,864 | 19.0 | % | |||||||||||
Net Income attributable to True Religion Apparel, Inc. |
$ | 47,332 | 15.2 | % | $ | 44,371 | 16.4 | % | $ | 2,961 | 6.7 | % | ||||||||
Earnings per share attributable to True Religion Apparel, Inc.: Basic |
$ | 1.97 | $ | 1.89 | $ | 0.08 | 4.2 | % | ||||||||||||
Diluted |
$ | 1.92 | $ | 1.83 | $ | 0.09 | 4.9 | % | ||||||||||||
23
Net Sales
The following table summarizes net sales by segment (dollar amounts in thousands):
| |
Years Ended December 31, | Change | |||||||||||
|---|---|---|---|---|---|---|---|---|---|---|---|---|---|
| |
2009 | 2008 | Amount | % | |||||||||
U.S. Consumer Direct |
129,030 | 75,314 | 53,716 | 71.3 | % | ||||||||
U.S. Wholesale |
123,203 | 153,235 | (30,032 | ) | (19.6 | )% | |||||||
International |
54,479 | 40,044 | 14,435 | 36.0 | % | ||||||||
Core Services |
4,289 | 1,407 | 2,882 | 204.8 | % | ||||||||
Total net sales |
$ | 311,001 | $ | 270,000 | $ | 41,001 | 15.2 | % | |||||
The following table summarizes percentage of total net sales by segment:
| |
December 31, | Change | ||||||||
|---|---|---|---|---|---|---|---|---|---|---|
| |
2009 | 2008 | % | |||||||
U.S. Consumer Direct |
41.5 | % | 27.9 | % | 13.6 | % | ||||
U.S. Wholesale |
39.6 | 56.8 | (17.2 | )% | ||||||
International |
17.5 | 14.8 | 2.7 | % | ||||||
Core Services |
1.4 | 0.5 | 0.9 | % | ||||||
Total net sales |
100.0 | % | 100.0 | % | ||||||
U.S. Consumer Direct net sales increased by 71.3% to $129.0 million in 2009 as we finished the year with 70 stores compared to 42 stores at the end of 2008. The additional sales from new stores were partially offset by a decrease in sales at our 15 stores which opened before the end of 2007 due to a reduction in shoppers visiting our stores caused by the challenging economic and consumer environment.
U.S. Wholesale net sales decreased 19.6% to $123.2 million. In 2009, our net sales to boutique customers decreased sharply; these customers were more impacted by the challenging retail environment as they generally depend to a larger extent on external financing. Our sales to "major" accounts, which consist of customers such as Nordstrom, Bloomingdale's, Saks Fifth Avenue and Neiman Marcus, decreased 14.9% from the prior year as these customers experienced a decline in sales of premium denim due to the economic recession. Partially offsetting these decreases was a slight increase in our sales to off-price retailers of $0.7 million to $38.5 million. Sales to Nordstrom, Inc. accounted for 15.2% of our net sales in 2009.
International net sales increased 36.0% to $54.5 million primarily due to increased sales to distributors in Asia and Europe. Our sales to customers in Japan increased in 2009 as compared to 2008 because we terminated our Japanese distributor in the second quarter of 2008 and established our own subsidiary, which is selling merchandise to wholesale accounts and operating three outlet stores. Our brand is less established outside the U.S., so this segment's sales are growing in spite of the challenging retail environment in many international markets as our brand gains greater exposure.
24
Gross Profit
The following table summarizes gross profit by segment (dollar amounts in thousands):
| |
Years Ended December 31, | Change | |||||||||||
|---|---|---|---|---|---|---|---|---|---|---|---|---|---|
| |
2009 | 2008 | Amount | % | |||||||||
U.S. Consumer Direct |
$ | 95,276 | $ | 57,669 | $ | 37,607 | 65.2 | % | |||||
U.S. Wholesale |
65,882 | 78,670 | (12,788 | ) | (16.3 | )% | |||||||
International |
30,115 | 19,255 | 10,860 | 56.4 | % | ||||||||
Core Services |
4,289 | 1,407 | 2,882 | 204.8 | % | ||||||||
Total gross profit |
$ | 195,562 | $ | 157,001 | $ | 38,561 | 24.6 | % | |||||
The following table summarizes gross profit as a percentage of net sales ("gross margin") by segment:
| |
December 31, | Change | ||||||||
|---|---|---|---|---|---|---|---|---|---|---|
| |
2009 | 2008 | % | |||||||
U.S. Consumer Direct |
73.8 | % | 76.6 | % | (2.8 | )% | ||||
U.S. Wholesale |
53.5 | 51.3 | 2.2 | % | ||||||
International |
55.3 | 48.1 | 7.2 | % | ||||||
Core Services |
100.0 | 100.0 | 0.0 | % | ||||||
Total gross margin |
62.9 | % | 58.1 | % | 4.8 | % | ||||
Overall gross margin improved from 58.1% of net sales in 2008 to 62.9% of net sales in 2009, primarily reflecting the ongoing net sales mix shift towards the higher-margin U.S. Consumer Direct business.
The U.S. Consumer Direct gross margin decreased to 73.8% in 2009 from 76.6% in 2008 as a larger share of U.S. Consumer Direct sales came from the outlet stores as compared to the full price store sales. Outlet stores sales generate lower gross margins because the merchandise is sold at a discounted price. Also causing the decrease was the expected decline of the outlet stores' gross margin as we are relying more on our own outlet stores to sell slow-moving merchandise and as the outlet stores now have fewer higher-margin irregulars in their merchandise assortment.
U.S. Wholesale gross profit decreased 16.3% to $65.9 million in 2009 compared to $78.7 million in 2008, due to the decline in U.S. Wholesale net sales. However, this segment's gross margin increased to 53.5% in 2009 from 51.3% in 2008, due to the continued improvements in our sourcing and production processes, including an increase in the gross margin of off-price sales.
International gross margin increased to 55.3% in 2009 from 48.1% in 2008, primarily due to the increase in direct sales to select Asian markets, which carry higher gross margins than sales through distributors.
25
Selling, General and Administrative Expenses
The following table presents the components of SG&A by segment (dollar amounts in thousands):
| |
Years Ended December 31, | Change | |||||||||||
|---|---|---|---|---|---|---|---|---|---|---|---|---|---|
| |
2009 | 2008 | Amount | % | |||||||||
U.S. Consumer Direct |
$ | 50,510 | $ | 29,859 | $ | 20,651 | 69.2 | % | |||||
U.S. Wholesale |
5,775 | 6,786 | (1,011 | ) | (14.9 | )% | |||||||
International |
4,948 | 2,494 | 2,454 | 98.4 | % | ||||||||
Core Services |
56,732 | 48,986 | 7,746 | 15.8 | % | ||||||||
Total selling, general and administrative expenses |
$ | 117,965 | $ | 88,125 | $ | 29,840 | 33.9 | % | |||||
The following table summarizes SG&A as a percentage of segment net sales ("SG&A rate"), by segment:
| |
December 31, | Change | ||||||||
|---|---|---|---|---|---|---|---|---|---|---|
| |
2009 | 2008 | % | |||||||
U.S. Consumer Direct |
39.1 | % | 39.6 | % | (0.5 | )% | ||||
U.S. Wholesale |
4.7 | 4.4 | 0.3 | % | ||||||
International |
9.1 | 6.2 | 2.9 | % | ||||||
Core Services |
NM | NM | NM | |||||||
Total SG&A rate |
37.9 | % | 32.6 | % | 5.3 | % | ||||
In 2009, SG&A increased 33.9% to $118.0 million, compared to $88.1 million in 2008.
The U.S. Consumer Direct SG&A increased $20.7 million, from $29.9 million in 2008 to $50.5 million in 2009. This increase is directly related to the growth in the number of stores over the prior year, from 42 at the end of 2008 to 70 at the end of 2009. The slight decrease in U.S. Consumer Direct SG&A rate from 39.6% in 2008 to 39.1% in 2009, is primarily due to the reduction of labor expenses as a percentage of net sales.
U.S. Wholesale SG&A decreased by 14.9% primarily due to a decrease in sales commissions linked to the U.S. Wholesale net sales decrease.
International SG&A increased $2.5 million, or 98.4%, primarily due to the expansion of our international operations.
Core Services SG&A increased $7.7 million, from $49.0 million in 2008 to $56.7 million in 2009. This increase is primarily attributable to executive performance-based compensation. Our executive compensation program was redesigned in 2008 to condition a greater portion of executive compensation on the satisfaction of earnings targets. Our 2009 performance outpaced our 2009 earnings target by a higher rate than in 2008. Also contributing to this increase is an increase in design, production, warehouse and operations accounting employees to support our overall business growth and an increase in share-based compensation. The increase in share-based compensation is due to meeting company-wide earnings targets on performance-based awards that were granted in 2009. Core Services SG&A, as a percentage of total net sales, remained relatively flat (18.2% in 2009 compared to 18.1% in 2008).
26
Operating Income
The following table summarizes operating income by segment (dollar amounts in thousands):
| |
Years Ended December 31, | Change | |||||||||||
|---|---|---|---|---|---|---|---|---|---|---|---|---|---|
| |
2009 | 2008 | Amount | % | |||||||||
U.S. Consumer Direct |
$ | 44,766 | $ | 27,810 | $ | 16,956 | 61.0 | % | |||||
U.S. Wholesale |
60,107 | 71,884 | (11,777 | ) | (16.4 | )% | |||||||
International |
25,167 | 16,761 | 8,406 | 50.2 | % | ||||||||
Core Services |
(52,443 | ) | (47,579 | ) | (4,864 | ) | 10.2 | % | |||||
Total operating income |
$ | 77,597 | $ | 68,876 | $ | 8,721 | 12.7 | % | |||||
The following table summarizes operating income as a percentage of net sales ("operating margin"), by segment:
| |
December 31, | Change | ||||||||
|---|---|---|---|---|---|---|---|---|---|---|
| |
2009 | 2008 | % | |||||||
U.S. Consumer Direct |
34.7 | % | 37.0 | % | (2.3 | )% | ||||
U.S. Wholesale |
48.8 | 46.9 | 1.7 | % | ||||||
International |
46.2 | 41.9 | 4.3 | % | ||||||
Core Services |
NM | NM | NM | |||||||
Total SG&A rate |
25.0 | % | 25.5 | % | (0.5 | )% | ||||
The U.S. Consumer Direct operating margin decreased from 37.0% in 2008 to 34.7% in 2009. This decrease in operating margin was due to a combination of a decline in sales at our 15 stores opened before the end of 2007 due to the challenging retail environment, and the planned, lower operating margin for stores opened in 2009. Overall, the stores opened in 2008 have improved their operating margin in 2009 as compared to 2008.
U.S. Wholesale operating income increased as a percentage of U.S. Wholesale net sales from 46.9% in 2008 to 48.8% in 2009 due to the increase in gross margin as a result of the continued improvements in our sourcing and production processes.
International operating income increased as a percentage of International net sales, from 41.9% in 2008 to 46.2% in 2009, primarily due to the increase in direct sales to customers versus wholesale distributors.
Interest Income, net
Interest income, net was $0.2 million in 2009 compared to $1.1 million in 2008. While we had an increase in our cash equivalents and investments in 2009 compared to 2008, the average yield on our investments has decreased due to changes in the investment market and our shift to more conservative investments.
27
Provision for Income Taxes
The effective tax rate was 39.1% for 2009 compared to 36.6% in 2008. In 2008, we implemented a tax planning strategy that retroactively changed our filing status in certain states, which reduced our cumulative tax provision by $1.5 million. We also finalized our 2007 tax returns during the 2008 period, which included additional analysis of our federal and state tax obligations; as a result of this analysis, we reduced our income tax provision in 2008 by $0.6 million. These factors were the primary drivers resulting in a lower effective tax rate of 36.6% in 2008.
Net Income attributable to True Religion Apparel, Inc. and Earnings Per Diluted Share
Net income attributable to True Religion Apparel, Inc. was $47.3 million in 2009 compared to $44.4 million in 2008, an increase of 6.7%. This increase is attributable primarily to the increase in net sales. Earnings per diluted share increased 4.9% from $1.83 in 2008 to $1.92 in 2009.
Inflation
Historically, our operations have not been materially affected by inflation. We cannot assure that our operations will not be affected by inflation in the future.
Financial Condition
Net cash provided by operating activities in 2010 was $67.8 million. Although our net income decreased by $3.8 million in 2010 as compared to 2009, more of our expenses were for non-cash items, including depreciation and stock-based compensation. Therefore, our net cash provided by operating activities increased in 2010 by $1.3 million as compared to $66.5 million in 2009.
Net cash used in investing activities was $13.5 million in 2010 compared to $15.3 million in 2009. This decrease of $1.8 million is primarily due to a decrease in capital expenditures of $2.6 million. During 2009, we had $1.9 million in capital expenditures for the new information technology system that was implemented in the third quarter of 2009; we did not have similar capital expenditures in 2010. Our expenditures for new stores were consistent in both years. This decrease in capital expenditures was partially offset by the business acquisition of our German joint venture assets of $0.8 million in 2010.
Net cash used in financing activities was $6.1 million in 2010 compared to net cash used of $3.0 million in 2009. This increase is due to an increase in cash used for statutory tax withholding payments for stock-based compensation, which was partially offset by an increase in the excess tax benefit from stock-based compensation. These increases are primarily due to an increase in the number of shares vesting and an increase in our stock price when shares vested in 2010, which resulted in higher taxable compensation.
Liquidity and Capital Resources
Our primary ongoing cash requirements are currently expected to be for our ongoing operations, capital expenditures for new branded retail stores, our expansion internationally, and information technology and other infrastructure needs. Management believes that cash flow from continuing operations and on-hand cash and cash equivalents will provide adequate funds for the foreseeable working capital needs and planned capital expenditures. Over the long term, we manage our cash and capital structure to maximize shareholder return, strengthen our financial position and maintain flexibility for future strategic initiatives. We believe our cash, cash equivalents, short-term investments and future operating cash flows, as well as any potential future borrowing facilities, will be sufficient, for at least the next twelve months, to fund scheduled future payments and potential long-term initiatives. The availability of financing in the form of debt or equity is influenced by many factors,
28
including our profitability, operating cash flows, debt levels, debt ratings, contractual restrictions, and market conditions, and we cannot guarantee that we would be able to obtain financing on favorable terms, if needed.
We had investments in auction rate securities (ARS) which had experienced an illiquid market since 2008. In October 2008, we were notified that the two brokers who sold ARS to us would purchase the ARS at a price of par plus accrued interest, and on November 11, 2008, we accepted the offers from these brokers. The first portion of the ARS, in the amount of $4.9 million, was purchased by the broker in January 2009 at par plus accrued interest, and the second portion, in the amount of $5.0 million, was purchased by the second broker in July 2010 at par plus accrued interest. See Item 6A Quantitative and Qualitative Disclosures about Market Risk.
Capital expenditures for 2011 are expected to approximate $24 million.
Tabular Disclosure of Contractual Obligations
The following table sets forth, as of December 31, 2010, our scheduled contractual cash obligations due for each of the periods indicated below (dollar amounts in thousands):
| |
Payment Due by Period | |||||||||||||||
|---|---|---|---|---|---|---|---|---|---|---|---|---|---|---|---|---|
Contractual Obligations
|
Total | Less than One Year |
1 - 3 Years | 3 - 5 Years | More Than 5 Years |
|||||||||||
Operating lease obligations |
170,038 | 20,289 | 41,154 | 40,764 | 67,831 | |||||||||||
Purchase obligations |
28,900 | 28,900 | — | — | — | |||||||||||
Total |
$ | 198,938 | $ | 49,189 | $ | 41,154 | $ | 40,764 | $ | 67,831 | ||||||
Seasonality of Business
Due to the holiday shopping season in December, our U.S. Wholesale segment sales historically have been higher in the second half of the year and our U.S. Consumer Direct segment sales historically have been higher in the fourth quarter.
Critical Accounting Policies
The preparation of our financial statements in accordance with accounting principles generally accepted in the United States requires management to make estimates and assumptions that affect the reported amounts of assets and liabilities and disclosure of contingent assets and liabilities at the date of the financial statements, and revenues and expenses during the period. Our management bases its estimates on historical experience and on other factors and assumptions that management believes to be reasonable under the circumstances. Actual results may differ from these estimates. The following discussion highlights the policies management believes are critical. For a summary of all our significant accounting policies, including those discussed below, see Note 2—Summary of Significant Accounting Policies in our consolidated financial statements provided under Part II, Item 8 of this Annual Report on Form 10-K.
Sales Recognition
Sales are recognized across all segments of the business when there is persuasive evidence of an arrangement, delivery has occurred, price has been fixed or is determinable, and collectability can be reasonably assured.
Sales within our U.S. Wholesale and International segments are recognized at the time title passes and risk of loss is transferred to the customer. Sales are recorded net of estimates for returns, discounts, operational chargebacks and markdown allowances. Returns and allowances require
29
pre-approval by management and discounts are based on trade terms. We review and refine these estimates on a quarterly basis using historical trends, seasonal results, and current economic and market conditions. Our historical estimates of these costs have not differed materially from actual results.
Retail store sales are recognized net of estimated returns at the time of sale to consumers. E-commerce sales of products ordered through our retail internet site known as www.truereligionbrandjeans.com are recognized upon estimated delivery of the shipment to the customers. E-commerce sales also are reduced by an estimate of returns. Retail store sales and E-commerce sales exclude sales taxes. We recognize revenue associated with our gift cards upon redemption of the gift card. We currently do not recognize gift card breakage as we do not have sufficient historical evidence.
Revenues from licensing arrangements are recognized when earned in accordance with the terms of the underlying agreements, generally based upon the higher of (a) contractually guaranteed minimum royalty levels and (b) a percentage of wholesale sales of licensed product by our licensees.
Uncollectible Accounts
Management evaluates our accounts receivables to assess if they will ultimately be collected. In performing this evaluation, significant judgment is used, including an analysis of specific risks on a customer-by-customer basis for larger accounts. Based on this information, management provides a reserve for the estimated amounts believed to be uncollectible.
Inventories
Slow-moving merchandise is typically sold at prices exceeding our cost in our outlet retail stores or to wholesale customers who specialize in off-price merchandise. As of December 31, 2010 and 2009, we recorded inventory impairment charges for slow-moving inventory of $0.7 million and $0.5 million, respectively, based upon analysis of balances on hand by style, recent sales trends, projected future sales, and historical markdown trends.
Stock-Based Compensation
We recognize restricted stock compensation expense, net of estimated forfeitures, for awards with only service conditions using the straight-line method over the requisite service period of the entire award. The requisite service period is the period during which an employee is required to provide service in exchange for an award, which often is the vesting period. If a portion of the restricted stock vests immediately or in another period such that the cumulative vested amount exceeds the cumulative straight line expense amount, we record compensation expense equal to at least the cumulative compensation expense of the vested amount of the restricted stock. Compensation expense for restricted stock awards with performance based conditions is recognized on an accelerated basis using the graded attribution method over the requisite service period.
Income Taxes
We use the asset and liability method of accounting for income taxes. Using this method, deferred tax assets and liabilities are recorded based on differences between financial reporting and tax basis of assets and liabilities. The deferred tax assets and liabilities are calculated using the enacted tax rates and laws that are expected to be in effect when the differences are expected to reverse. We establish valuation allowances for tax benefits when we believe it is more likely than not that such assets will not be realized.
30
FASB ASC 740: Accounting for Income Taxes ("FASB ASC 740") clarifies the accounting for uncertainty in income taxes recognized in financial statements. In accordance with FASB ASC 740, we regularly evaluate the likelihood of recognizing the benefit for income tax positions we have taken in various federal, state and foreign filings by considering all relevant facts, circumstances, and information available. For those benefits that we believe it is more likely than not that the benefit will be sustained, we recognize the largest amount we believe is cumulatively greater than 50% likely to be realized.
We record interest and penalties, if any, on any underpayment of income taxes as a component of provision for income taxes and selling, general and administrative expenses, respectively.
Item 7A. Quantitative and Qualitative Disclosures about Market Risk.
Exchange Rate Risk
We operate a wholesale business and four retail stores in Japan and most of our wholesale sales and all of our retail sales and SG&A expenses in Japan are denominated in Japanese Yen. We operate a retail store in the U.K. All of that store's retail sales and SG&A expenses are denominated in British Pounds. Since August 2010, we have operated a wholesale business in part of Europe and a retail store in Germany through a joint venture. All of the joint venture's sales and SG&A expenses are denominated in Euro, except for merchandise which is purchased in U.S. Dollars. Since October 2010, we have operated a retail store in Canada. All of that store's retail sales and SG&A expenses are denominated in Canadian Dollars. Since November 2010, we established a regional sales office in Switzerland. All SG&A expenses are denominated in Euro. Because these operations are not significant to our overall business, our exposure to fluctuations in the U.S. Dollar and Japanese Yen exchange rate; the U.S. Dollar and Great Britain Pound exchange rate; the U.S. Dollar and Euro exchange rate and the U.S. Dollar and Canadian Dollar exchange rate are not considered material as of December 31, 2010. We received U.S. Dollars for all other merchandise sales and licensing revenue during the year ended December 31, 2010. Merchandise purchases from contract manufacturers are denominated in U.S. Dollars.
Investments
We had investments in auction rate securities (ARS) which had experienced an illiquid market since 2008. In October 2008, we were notified that the two brokers who sold ARS to us would purchase the ARS at a price of par plus accrued interest, and on November 11, 2008, we accepted the offers from these brokers. The first portion of the ARS, in the amount of $4.9 million, was purchased by the broker in January 2009 at par plus accrued interest, and the remaining portion, in the amount of $5.0 million, was purchased by the second broker in July 2010 at par plus accrued interest.
Item 8. Financial Statements and Supplementary Data.
The information required by this Item is incorporated herein by reference to the Consolidated Financial Statements and Supplementary Data listed in Item 15. Exhibits, Financial Statements Schedules of Part IV of this report.
Item 9. Changes in and Disagreements with Accountants on Accounting and Financial Disclosure.
None
31
Item 9A. Controls and Procedures.
Evaluation of Disclosure Controls and Procedures.
Conclusion Regarding the Effectiveness of Disclosure Controls and Procedures
As of the end of the period covered by this Annual Report on Form 10-K, we performed an evaluation under the supervision and with the participation of management, including our Chief Executive Officer and our Chief Financial Officer, of the design and effectiveness of our disclosure controls and procedures (as defined in Rules 13a-15(e) or 15d-15(e) under the Exchange Act of 1934 as amended). Based upon that evaluation, our Chief Executive Officer and Chief Financial Officer concluded that, as of the end of the period covered by this Annual Report, our disclosure controls and procedures were effective in the timely and accurate recording, processing, summarizing and reporting of material financial and non-financial information within the time periods specified within the Commission's rules and forms. Our Chief Executive Officer and Chief Financial Officer also concluded that our disclosure controls and procedures were effective to ensure that information required to be disclosed in the reports that we file or submit under the Exchange Act is accumulated and communicated to our management, including our Chief Executive Officer and Chief Financial Officer, to allow timely decisions regarding required disclosure.
Management's Annual Report on Internal Control Over Financial Reporting
Our management's report on internal control over financial reporting, and the related report of our independent registered public accounting firm, are included in Part II Item 8 Financial Statements and Supplementary Data in our Annual Report on Form 10-K under Management's Annual Report on Internal Control Over Financial Reporting and Report of Independent Registered Public Accounting Firm on Internal Control Over Financial Reporting, on pages F-2 and F-3 respectively, and are incorporated by reference.
Because of its inherent limitations, internal control over financial reporting may not prevent or detect all misstatements. Also, projections of any evaluation of effectiveness to future periods are subject to the risk that controls may become inadequate because of changes in conditions, or that the degree of compliance with the policies or procedures may deteriorate.
Changes in Internal Control Over Financial Reporting
There were no changes in our internal control over financial reporting (as defined in Rules 13a-15(f) or 15d-15(f) under the Exchange Act) during our most recently completed fiscal quarter that have materially affected, or are reasonably likely to materially affect, our internal control over financial reporting.
None.
32
Item 10. Directors, Executive Officers and Corporate Governance.
The information required under this item is included in our Proxy Statement for our 2011 Annual Meeting of Stockholders, which is incorporated by reference herein and will be filed within 120 days after the end of our fiscal year.
Item 11. Executive Compensation.
The information required under this item is included in our Proxy Statement for our 2011 Annual Meeting of Stockholders, which is incorporated by reference herein and will be filed within 120 days after the end of our fiscal year.
Item 12. Security Ownership of Certain Beneficial Owners and Management and Related Stockholders Matters.
The information required under this item is included in our Proxy Statement for our 2011 Annual Meeting of Stockholders, which is incorporated by reference herein and will be filed within 120 days after the end of our fiscal year.
Item 13. Certain Relationships and Related Transactions and Director Independence.
The information required under this item is included in our Proxy Statement for our 2011 Annual Meeting of Stockholders, which is incorporated by reference herein and will be filed within 120 days after the end of our fiscal year.
Item 14. Principal Accountant Fees and Services.
The information required under this item is included in our Proxy Statement for our 2011 Annual Meeting of Stockholders, which is incorporated by reference herein and will be filed within 120 days after the end of our fiscal year.
33
Item 15. Exhibits, Financial Statements Schedules.
| (a) | (1) | FINANCIAL STATEMENTS—See Index to Consolidated Financial Statements of this Annual Report on Form 10-K. | ||
(2) |
FINANCIAL STATEMENT SCHEDULES—See Index to consolidated Financial Statements on page F-1 hereof |
|||
(3) |
EXHIBITS—See Exhibit Index below. |
EXHIBIT INDEX
| Exhibit No. | Description | ||
|---|---|---|---|
| 3.1 | Certificate of Incorporation (incorporated by reference from our Form 8-K Current Report, filed August 22, 2005). | ||
3.2 |
Amended and Restated Bylaws (incorporated by reference from our Form 8-K Current Report, filed December 12, 2008). |
||
4.1 |
Specimen Common Stock Certificate (incorporated by reference from our Form 8-K Current Report, filed August 22, 2005). |
||
4.2 |
Form of True Religion Apparel, Inc. 2009 Equity Incentive Plan Restricted Stock Award Certificate (incorporated by reference from our Registration Statement on Form S-8 filed on July 29, 2009). |
||
4.3 |
Form of True Religion Apparel, Inc. 2009 Equity Incentive Plan Performance Award Certificate (Restricted Stock) (incorporated by reference from our Registration Statement on Form S-8 filed on July 29, 2009). |
||
10.1 |
Form of Indemnification Agreement between True Religion Apparel, Inc. and its officers and directors (incorporated by reference from our Form 10-Q Quarterly Report, filed November 8, 2010). |
||
10.2 |
Employment Agreement by and between the Company and Jeffrey Lubell dated January 4, 2006 (incorporated by reference from our Form 8-K Current Report, filed on January 10, 2006).* |
||
10.3 |
Standard Industrial/Commercial Single-Tenant Lease—Gross dated May 17, 2006, among SDJ Enterprises, Ltd., Guru Denim, Inc. and the Company (incorporated by reference from our Form 8-K Current Report, filed April 14, 2006). |
||
10.4 |
Amendment to Employment Agreement dated May 31, 2006, by and between Jeffrey Lubell and the Company (incorporated by reference from our Form 8-K Current Report, filed June 5, 2006).* |
||
10.5 |
Amendment to the True Religion Apparel, Inc. 2005 Stock Incentive Plan (incorporated by reference from our Form 8-K Current Report filed on March 8, 2007).* |
||
10.6 |
True Religion Apparel, Inc. Executive Cash Incentive Bonus Plan (incorporated by reference from our Form 8-K Current Report filed on April 3, 2008).* |
||
10.7 |
Amendment No. 2 to Employment Agreement by and between the Company and Jeffrey Lubell dated September 12, 2008 (incorporated by reference from our Form 8-K Current Report filed September 17, 2008). |
||
34
| Exhibit No. | Description | ||
|---|---|---|---|
| 10.8 | Amended and Restated True Religion Apparel, Inc. 2009 Equity Incentive Plan (incorporated by reference from our Registration Statement on Form S-8 filed on July 29, 2009).* | ||
10.9 |
Employment Agreement by and between the Company and Lynne Koplin (incorporated by reference from our Form 8-K Current Report filed on January 6, 2010)* |
||
10.10 |
Summary of Executive Officer Compensation.*† |
||
10.11 |
Summary of Board of Directors Compensation.*† |
||
10.12 |
Employment Agreement, dated as of May 13, 2010, by and between the Company and Michael Egeck (incorporated by reference from our Form 10-Q Quarterly Report, filed August 5, 2010).* |
||
10.13 |
Amendment to Employment Agreement by and between the Company and Michael Egeck dated August 13, 2010.*† |
||
10.14 |
Amendment to Employment Agreement by and between the Company and Lynne Koplin dated August 13, 2010.*† |
||
10.15 |
Employment Agreement by and between the Company and Peter Collins dated August 13, 2010 (incorporated by reference from our Form 8-K Current Report, filed on August 13, 2010).* |
||
10.16 |
Amendment to Standard Industrial/Commercial Single-Tenant Lease, among SDJ Enterprises, Ltd., Guru Denim, Inc. and the Company dated November 22, 2010.*† |
||
14.1 |
True Religion Apparel, Inc. Code of Conduct (incorporated by reference from our Form 8-K Current Report filed October 8, 2008). |
||
21.1 |
Subsidiaries of the Company† |
||
23.1 |
Consent of Independent Registered Public Accounting Firm, Deloitte & Touche LLP† |
||
24.1 |
Powers of Attorney.† |
||
31.1 |
Certification of Principal Executive Officer, pursuant to Rule 13a-14 and 15d-14 of the Securities Exchange Act of 1934.† |
||
31.2 |
Certification of Principal Financial Officer, pursuant to Rule 13a-14 and 15d-14 of the Securities Exchange Act of 1934.† |
||
32.1 |
Certification of Principal Executive Officer, pursuant to 18 U.S.C. Section 1350, as adopted pursuant to Section 906 of the Sarbanes-Oxley Act of 2002.† |
||
32.2 |
Certification of Principal Financial Officer, pursuant to 18 U.S.C. Section 1350, as adopted pursuant to Section 906 of the Sarbanes-Oxley Act of 2002.† |
||
- *
- Represents
a management contract or compensatory plan, contract or arrangement in which any director or any of the named executives participates.
- †
- Filed herewith.
35
Pursuant to the requirements of Section 13 or 15(d) of the Securities Exchange Act of 1934, as amended, Registrant has duly caused this report to be signed on its behalf by the undersigned, thereunto duly authorized.
| TRUE RELIGION APPAREL, INC. | ||||
Dated: March 11, 2011 |
/s/ JEFFREY LUBELL Jeffrey Lubell Chief Executive Officer and Chairman of the Board |
|||
Pursuant to the requirements of the Securities Exchange Act of 1934, as amended, this report has been signed below by the following persons on behalf of Registrant and in the capacities and on the dates indicated.
Name
|
Position
|
Date
|
||
|---|---|---|---|---|
| /s/ JEFFREY LUBELL Jeffrey Lubell |
Chairman of the Board and Chief Executive Officer (Principal Executive Officer) | March 11, 2011 | ||
/s/ PETER F. COLLINS Peter F. Collins |
Chief Financial Officer (Principal Financial and Accounting Officer) |
March 11, 2011 |
||
/s/ JOSEPH H. COULOMBE Joseph H. Coulombe |
Director |
March 11, 2011 |
||
/s/ G. LOUIS GRAZIADIO III G. Louis Graziadio III |
Director |
March 11, 2011 |
||
/s/ ROBERT L. HARRIS, II Robert L. Harris, II |
Director |
March 11, 2011 |
||
/s/ MARK S. MARON Mark S. Maron |
Director |
March 11, 2011 |
||
/s/ MARCELLO BOTTOLI Marcello Bottoli |
Director |
March 11, 2011 |
||
/s/ SETH R. JOHNSON Seth R. Johnson |
Director |
March 11, 2011 |
36
TRUE RELIGION APPAREL, INC. AND SUBSIDIARIES
INDEX TO CONSOLIDATED FINANCIAL STATEMENTS
| |
Pages | |
|---|---|---|
Report of Management on Internal Control Over Financial Reporting |
F-2 | |
Reports of Independent Registered Public Accounting Firm |
F-3 |
|
Consolidated Balance Sheets as of December 31, 2010 and 2009 |
F-5 |
|
Consolidated Statements of Income for the years ended December 31, 2010, 2009 and 2008 |
F-6 |
|
Consolidated Statements of Cash Flows for the years ended December 31, 2010, 2009 and 2008 |
F-7 |
|
Consolidated Statements of Stockholders' Equity for the years ended December 31, 2010, 2009 and 2008 |
F-8 |
|
Notes to Consolidated Financial Statements |
F-9 |
|
Consolidated Financial Statement Schedule: |
||
Valuation and Qualifying Accounts as of and for the years ended December 31, 2010, 2009, and 2008 |
F-29 |
F-1
REPORT OF MANAGEMENT ON
INTERNAL CONTROL OVER FINANCIAL REPORTING
Our management is responsible for establishing and maintaining adequate internal control over financial reporting, as is defined in the Securities Exchange Act of 1934, as amended. These internal controls are designed to provide reasonable assurance that the reported financial information is presented fairly, that disclosures are adequate and that the judgments inherent in the preparation of financial statements are reasonable. There are inherent limitations in the effectiveness of any system of internal control, including the possibility of human error and overriding of controls. Also, projections of any evaluation of effectiveness to future periods are subject to the risk that controls may become inadequate because of changes in conditions, or that the degree of compliance with the policies or procedures may deteriorate. Consequently, an effective internal control system can only provide reasonable, not absolute, assurance with respect to reporting financial information.
Our management conducted an evaluation, under the supervision and with the participation of our Chief Executive Officer and Chief Financial Officer, of the effectiveness of our internal control over financial reporting based on the framework in Internal Control—Integrated Framework issued by the Committee of Sponsoring Organizations of the Treadway Commission (COSO). Based on this evaluation, our management concluded that our internal control over financial reporting was effective as of December 31, 2010.
Our internal control over financial reporting as of December 31, 2010 has been audited by Deloitte & Touche LLP, an independent registered public accounting firm, as stated in their report, which is included herein on page F-3.
F-2
REPORT OF INDEPENDENT REGISTERED PUBLIC ACCOUNTING FIRM
To
the Board of Directors and Stockholders of
True Religion Apparel, Inc.
Vernon, California:
We have audited the internal control over financial reporting of True Religion Apparel, Inc. and Subsidiaries ("the Company") as of December 31, 2010, based on criteria established in Internal Control—Integrated Framework issued by the Committee of Sponsoring Organizations of the Treadway Commission. The Company's management is responsible for maintaining effective internal control over financial reporting and for its assessment of the effectiveness of internal control over financial reporting included in the accompanying Report of Management on Internal Control Over Financial Reporting. Our responsibility is to express an opinion on the Company's internal control over financial reporting based on our audit.
We conducted our audit in accordance with the standards of the Public Company Accounting Oversight Board (United States). Those standards require that we plan and perform the audit to obtain reasonable assurance about whether effective internal control over financial reporting was maintained in all material respects. Our audit included obtaining an understanding of internal control over financial reporting, assessing the risk that a material weakness exists, testing and evaluating the design and operating effectiveness of internal control based on the assessed risk, and performing such other procedures as we considered necessary in the circumstances. We believe that our audit provides a reasonable basis for our opinion.
A company's internal control over financial reporting is a process designed by, or under the supervision of, the company's principal executive and principal financial officers, or persons performing similar functions, and effected by the company's board of directors, management, and other personnel to provide reasonable assurance regarding the reliability of financial reporting and the preparation of financial statements for external purposes in accordance with generally accepted accounting principles. A company's internal control over financial reporting includes those policies and procedures that (1) pertain to the maintenance of records that, in reasonable detail, accurately and fairly reflect the transactions and dispositions of the assets of the company; (2) provide reasonable assurance that transactions are recorded as necessary to permit preparation of financial statements in accordance with generally accepted accounting principles, and that receipts and expenditures of the company are being made only in accordance with authorizations of management and directors of the company; and (3) provide reasonable assurance regarding prevention or timely detection of unauthorized acquisition, use, or disposition of the company's assets that could have a material effect on the financial statements.
Because of the inherent limitations of internal control over financial reporting, including the possibility of collusion or improper management override of controls, material misstatements due to error or fraud may not be prevented or detected on a timely basis. Also, projections of any evaluation of the effectiveness of the internal control over financial reporting to future periods are subject to the risk that the controls may become inadequate because of changes in conditions, or that the degree of compliance with the policies or procedures may deteriorate.
In our opinion, the Company maintained, in all material respects, effective internal control over financial reporting as of December 31, 2010, based on the criteria established in Internal Control—Integrated Framework issued by the Committee of Sponsoring Organizations of the Treadway Commission.
We have also audited, in accordance with the standards of the Public Company Accounting Oversight Board (United States), the consolidated financial statements and financial statement schedule as of and for the year ended December 31, 2010, of the Company and our report dated March 11, 2011 expressed an unqualified opinion on those financial statements and financial statement schedule.
/S/
DELOITTE & TOUCHE LLP
Los Angeles, California
March 11, 2011
F-3
REPORT OF INDEPENDENT REGISTERED PUBLIC ACCOUNTING FIRM
The
Board of Directors and Stockholders of
True Religion Apparel, Inc.
Vernon, California:
We have audited the accompanying consolidated balance sheets of True Religion Apparel, Inc. and Subsidiaries (the "Company") as of December 31, 2010 and 2009, and the related consolidated statements of income, stockholders' equity, and cash flows for each of the three years in the period ended December 31, 2010. Our audits also included the financial statement schedule listed in Item 15(a)(2). These financial statements and financial statement schedule are the responsibility of the Company's management. Our responsibility is to express an opinion on these financial statements and financial statement schedule based on our audits.
We conducted our audits in accordance with the standards of the Public Company Accounting Oversight Board (United States). Those standards require that we plan and perform the audit to obtain reasonable assurance about whether the financial statements are free of material misstatement. An audit includes examining, on a test basis, evidence supporting the amounts and disclosures in the financial statements. An audit also includes assessing the accounting principles used and significant estimates made by management, as well as evaluating the overall financial statement presentation. We believe that our audits provide a reasonable basis for our opinion.
In our opinion, such consolidated financial statements present fairly, in all material respects, the financial position of True Religion Apparel, Inc. and Subsidiaries as of December 31, 2010 and 2009, and the results of their operations and their cash flows for each of the three years in the period ended December 31, 2010, in conformity with accounting principles generally accepted in the United States of America. Also, in our opinion, such financial statement schedule, when considered in relation to the basic consolidated financial statements taken as a whole, presents fairly, in all material respects, the information set forth therein.
We have also audited, in accordance with the standards of the Public Company Accounting Oversight Board (United States), the Company's internal control over financial reporting as of December 31, 2010, based on the criteria established in Internal Control—Integrated Framework issued by the Committee of Sponsoring Organizations of the Treadway Commission and our report dated March 11, 2011 expressed an unqualified opinion on the Company's internal control over financial reporting.
/S/
DELOITTE & TOUCHE LLP
Los Angeles, California
March 11, 2011
F-4
TRUE RELIGION APPAREL, INC. AND SUBSIDIARIES
CONSOLIDATED BALANCE SHEETS
(Amounts in thousands, except par amounts)
| |
As of December 31, | ||||||||
|---|---|---|---|---|---|---|---|---|---|
| |
2010 | 2009 | |||||||
ASSETS |
|||||||||
Current Assets: |
|||||||||
Cash and cash equivalents |
$ | 153,792 | $ | 105,531 | |||||
Short-term investments |
— | 4,948 | |||||||
Accounts receivable, net of allowances |
27,856 | 27,217 | |||||||
Inventory |
41,691 | 34,502 | |||||||
Deferred income tax assets |
9,660 | 8,753 | |||||||
Prepaid expenses and other current assets |
10,280 | 7,000 | |||||||
Total current assets |
243,279 | 187,951 | |||||||
Property and equipment, net |
48,448 | 39,693 | |||||||
Other assets |
4,157 | 2,162 | |||||||
TOTAL ASSETS |
$ | 295,884 | $ | 229,806 | |||||
LIABILITIES AND STOCKHOLDERS' EQUITY |
|||||||||
Current Liabilities: |
|||||||||
Accounts payable and accrued expenses |
$ | 17,234 | $ | 11,717 | |||||
Accrued salaries, wages and benefits |
9,501 | 8,843 | |||||||
Income taxes payable |
4,711 | 826 | |||||||
Total current liabilities |
31,446 | 21,386 | |||||||
Long-term deferred rent |
11,286 | 7,851 | |||||||
Long-term deferred income tax liabilities |
2,195 | 2,715 | |||||||
Total long-term liabilities |
13,481 | 10,566 | |||||||
Total liabilities |
44,927 | 31,952 | |||||||
Commitments and contingencies (Note 10) |
|||||||||
Redeemable noncontrolling interest |
1,925 | — | |||||||
Stockholders' Equity: |
|||||||||
Preferred stock, $0.0001 par value, 20,000 shares authorized, none issued and outstanding, respectively |
— | — | |||||||
Common stock, $0.0001 par value, 80,000 shares authorized, 25,336 and 25,250 issued and outstanding, respectively |
3 | 3 | |||||||
Additional paid in capital |
66,468 | 49,840 | |||||||
Retained earnings |
181,634 | 147,809 | |||||||
Accumulated other comprehensive income, net of tax |
927 | 202 | |||||||
Total stockholders' equity |
249,032 | 197,854 | |||||||
TOTAL LIABILITIES AND STOCKHOLDERS' EQUITY |
$ | 295,884 | $ | 229,806 | |||||
The accompanying notes are an integral part of these consolidated financial statements.
F-5
TRUE RELIGION APPAREL, INC. AND SUBSIDIARIES
CONSOLIDATED STATEMENTS OF INCOME
(Amounts in thousands, except per share amounts)
| |
Years Ended December 31, | ||||||||||
|---|---|---|---|---|---|---|---|---|---|---|---|
| |
2010 | 2009 | 2008 | ||||||||
Net sales |
$ | 363,714 | $ | 311,001 | $ | 270,000 | |||||
Cost of sales |
133,735 | 115,439 | 112,999 | ||||||||
Gross profit |
229,979 | 195,562 | 157,001 | ||||||||
Selling, general, and administrative expenses |
160,057 | 117,965 | 88,125 | ||||||||
Operating income |
69,922 | 77,597 | 68,876 | ||||||||
Other income, net |
403 | 169 | 1,065 | ||||||||
Income before provision for income taxes |
70,325 | 77,766 | 69,941 | ||||||||
Provision for income taxes |
26,690 | 30,434 | 25,570 | ||||||||
Net income |
43,635 | 47,332 | 44,371 | ||||||||
Less: Net income attributable to redeemable noncontrolling interest |
139 | — | — | ||||||||
Net income attributable to True Religion Apparel, Inc. |
$ | 43,496 | $ | 47,332 | $ | 44,371 | |||||
Earnings per share attributable to True Religion Apparel, Inc: |
|||||||||||
Basic |
$ | 1.78 | $ | 1.97 | $ | 1.89 | |||||
Diluted |
$ | 1.75 | $ | 1.92 | $ | 1.83 | |||||
Weighted average shares outstanding: |
|||||||||||
Basic |
24,495 | 23,993 | 23,511 | ||||||||
Diluted |
24,852 | 24,659 | 24,270 | ||||||||
The accompanying notes are an integral part of these consolidated financial statements.
F-6
TRUE RELIGION APPAREL, INC. AND SUBSIDIARIES
CONSOLIDATED STATEMENTS OF CASH FLOWS
(Amounts in thousands)
| |
Years Ended December 31, | |||||||||||
|---|---|---|---|---|---|---|---|---|---|---|---|---|
| |
2010 | 2009 | 2008 | |||||||||
CASH FLOWS FROM OPERATING ACTIVITIES: |
||||||||||||
Net income |
$ | 43,635 | $ | 47,332 | $ | 44,371 | ||||||
Adjustments to reconcile net income to net cash provided by operating activities: |
||||||||||||
Depreciation and amortization |
10,342 | 6,492 | 3,427 | |||||||||
Provision for bad debts |
556 | 99 | 577 | |||||||||
Stock-based compensation |
13,059 | 11,899 | 10,297 | |||||||||
Tax benefit from stock-based compensation |
3,569 | 54 | 229 | |||||||||
Excess tax benefit from stock-based compensation |
(3,569 | ) | (54 | ) | (229 | ) | ||||||
Deferred income taxes |
(1,421 | ) | (642 | ) | (128 | ) | ||||||
Other, net |
141 | 206 | 305 | |||||||||
Changes in operating assets and liabilities: |
||||||||||||
Accounts receivable |
(1,111 | ) | 5,779 | (6,357 | ) | |||||||
Inventory |
(5,329 | ) | (8,719 | ) | (4,377 | ) | ||||||
Prepaid expenses and other current assets |
(2,733 | ) | (2,861 | ) | (1,834 | ) | ||||||
Other assets |
(1,803 | ) | (280 | ) | (448 | ) | ||||||
Accounts payable and accrued expenses |
4,471 | 2,800 | (825 | ) | ||||||||
Accrued salaries, wages and benefits |
659 | 1,954 | 2,831 | |||||||||
Income taxes payable |
3,859 | (884 | ) | (2,168 | ) | |||||||
Long-term deferred rent |
3,436 | 3,315 | 3,391 | |||||||||
Net cash provided by operating activities |
67,761 | 66,490 | 49,062 | |||||||||
CASH FLOWS FROM INVESTING ACTIVITIES: |
||||||||||||
Purchases of property and equipment |
(17,446 | ) | (20,082 | ) | (18,187 | ) | ||||||
Sales of investments |
4,950 | 4,900 | 5,550 | |||||||||
Business acquisition |
(845 | ) | — | — | ||||||||
Expenditures to establish trademarks |
(176 | ) | (128 | ) | (81 | ) | ||||||
Net cash used in investing activities |
(13,517 | ) | (15,310 | ) | (12,718 | ) | ||||||
CASH FLOWS FROM FINANCING ACTIVITIES: |
||||||||||||
Statutory tax withholding payment for stock-based compensation |
(9,671 | ) | (3,031 | ) | (8,110 | ) | ||||||
Excess tax benefit from stock-based compensation |
3,569 | 54 | 229 | |||||||||
Proceeds from exercise of stock options |
— | — | 25 | |||||||||
Net cash used in financing activities |
(6,102 | ) | (2,977 | ) | (7,856 | ) | ||||||
Effect of exchange rate changes in cash |
119 | 83 | 71 | |||||||||
Net increase in cash and cash equivalents |
48,261 | 48,286 | 28,559 | |||||||||
Cash and cash equivalents, beginning of year |
105,531 | 57,245 | 28,686 | |||||||||
Cash and cash equivalents, end of year |
$ | 153,792 | $ | 105,531 | $ | 57,245 | ||||||
The accompanying notes are an integral part of these consolidated financial statements.
F-7
TRUE RELIGION APPAREL, INC. AND SUBSIDIARIES
CONSOLIDATED STATEMENTS OF STOCKHOLDERS' EQUITY
(Amounts in thousands)
| |
Shares | Amount | Additional Paid In Capital |
Accumulated Other Comprehensive Income |
Retained Earnings |
Total | ||||||||||||||
|---|---|---|---|---|---|---|---|---|---|---|---|---|---|---|---|---|---|---|---|---|
Balance at January 1, 2008 |
23,587 | $ | 2 | $ | 26,491 | $ | — | $ | 68,754 | $ | 95,247 | |||||||||
Net income attributable to True Religion Apparel, Inc. for the year ended December 31, 2008 |
— | 44,371 | 44,371 | |||||||||||||||||
Other comprehensive income, net: |
||||||||||||||||||||
Unrealized losses arising during year |
(1,583 | ) | (1,583 | ) | ||||||||||||||||
Losses on available for sale securities reclassified to trading |
1,583 | 1,583 | ||||||||||||||||||
Cumulative translation adjustment |
186 | 186 | ||||||||||||||||||
Comprehensive net income |
44,557 | |||||||||||||||||||
Stock-based compensation |
10,297 | — | 10,297 | |||||||||||||||||
Issuance of restricted shares |
659 | — | — | — | — | |||||||||||||||
Exercise of stock options |
836 | — | 1,537 | — | 1,537 | |||||||||||||||
Retirement of common stock |
(583 | ) | — | — | — | (9,617 | ) | (9,617 | ) | |||||||||||
Forfeiture of restricted shares |
(49 | ) | — | — | — | — | ||||||||||||||
Tax benefit on stock-based compensation |
229 | — | 229 | |||||||||||||||||
Balance at December 31, 2008 |
24,450 | 2 | 38,554 | $ | 186 | 103,508 | 142,250 | |||||||||||||
Net income attributable to True Religion Apparel, Inc. for the year ended December 31, 2009 |
— | 47,332 | 47,332 | |||||||||||||||||
Other comprehensive income, net: |
||||||||||||||||||||
Cumulative translation adjustment |
16 | 16 | ||||||||||||||||||
Comprehensive net income |
47,348 | |||||||||||||||||||
Stock-based compensation |
11,899 | — | 11,899 | |||||||||||||||||
Issuance of restricted shares |
1,135 | 1 | (1 | ) | — | — | ||||||||||||||
Retirement of common stock |
(223 | ) | — | — | — | (3,031 | ) | (3,031 | ) | |||||||||||
Forfeiture of restricted shares |
(112 | ) | — | — | — | — | ||||||||||||||
Tax deficiency on stock-based compensation |
(612 | ) | — | (612 | ) | |||||||||||||||
Balance at December 31, 2009 |
25,250 | $ | 3 | $ | 49,840 | $ | 202 | $ | 147,809 | $ | 197,854 | |||||||||
Net income attributable to True Religion Apparel, Inc. for the year ended December 31, 2010 |
— | 43,496 | 43,496 | |||||||||||||||||
Other comprehensive income, net: |
||||||||||||||||||||
Cumulative translation adjustment |
725 | 725 | ||||||||||||||||||
Comprehensive net income |
44,221 | |||||||||||||||||||
Stock-based compensation |
13,059 | — | 13,059 | |||||||||||||||||
Issuance of restricted shares |
693 | — | — | — | — | |||||||||||||||
Retirement of common stock |
(393 | ) | — | — | — | (9,671 | ) | (9,671 | ) | |||||||||||
Forfeiture of restricted shares |
(214 | ) | — | — | — | — | ||||||||||||||
Tax benefit on stock-based compensation |
3,569 | — | 3,569 | |||||||||||||||||
Balance at December 31, 2010 |
25,336 | $ | 3 | $ | 66,468 | $ | 927 | $ | 181,634 | $ | 249,032 | |||||||||
The accompanying notes are an integral part of these consolidated financial statements.
F-8
TRUE RELIGION APPAREL, INC. AND SUBSIDIARIES
NOTES TO CONSOLIDATED FINANCIAL STATEMENTS
NOTE 1—DESCRIPTION OF BUSINESS
True Religion Apparel, Inc. and subsidiaries (referred to in this Annual Report on Form 10-K as "the Company," "our," "we," or "True Religion") designs, markets, sells and distributes premium fashion apparel, centered on our core denim products using the brand name "True Religion Brand Jeans." Our products include jeans, pants, woven and knit tops and outerwear made from denim, fleece, jersey and other fabrics. We are known for our unique fits, washes and styling details. Our products are distributed through multiple wholesale and retail segments on six continents, including North America, Europe, Asia, Australia, Africa and South America.
We operate in four primary business segments: U.S. Consumer Direct, U.S. Wholesale, International, and Core Services. We sell directly to consumers in the United States through full-price branded retail stores, branded outlet stores and through our retail internet site located at www.truereligionbrandjeans.com. Our U.S. Wholesale sales are made to leading upscale nationwide-retailers, boutiques and off-price retailers. Our International sales are made through a variety of channels, including subsidiaries and joint ventures that operate retail stores and sell to wholesale customers who operate retail stores; distributors who warehouse products at their expense and they ship to, and collect payment from, their customers; and directly to wholesale customers who operate retail stores. As of December 31, 2010, our international segment includes one full price and three outlet retail stores in Japan, one full price retail store in England, one full price retail store in Canada and one full price retail store in Germany. In addition, we selectively license to third parties the right to use our various trademarks in connection with the manufacture and sale of designated products in specified geographical areas for specified periods. This licensing business is included in our Core Services segment. Our corporate operations, which include the design, production, marketing, distribution, credit, customer service, information technology, accounting, executive, legal, and human resources departments, are also included in the Core Services segment.
NOTE 2—SUMMARY OF SIGNIFICANT ACCOUNTING POLICIES
Basis of Consolidation
The accompanying consolidated financial statements include the accounts of True Religion Apparel, Inc., its subsidiaries and its majority owned subsidiary which operates according to a joint venture agreement with its noncontrolling interest holder. All intercompany accounts and transactions have been eliminated upon consolidation.
Use of Estimates
The preparation of financial statements in conformity with accounting principles generally accepted in the United States ("GAAP") requires management to make estimates and assumptions that affect the amounts reported in the consolidated financial statements and notes thereto. Actual results could differ materially from those estimates.
Significant estimates inherent in the preparation of the accompanying consolidated financial statements include reserves for customer returns; chargebacks; allowances for bad debts; inventory valuation; contingencies; fixed asset useful lives; income taxes and other tax contingencies; and the valuation of stock-based compensation and related forfeiture rates.
F-9
TRUE RELIGION APPAREL, INC. AND SUBSIDIARIES
NOTES TO CONSOLIDATED FINANCIAL STATEMENTS (Continued)
NOTE 2—SUMMARY OF SIGNIFICANT ACCOUNTING POLICIES (Continued)
Fair Value Measurements
We use the fair value measurement hierarchy which is based on the inputs used to measure fair value. The following is a list of defined levels in the fair value hierarchy based on the data and/or methods used to determine fair value:
| |
|
|
||
|---|---|---|---|---|
• |
Level 1: | Quoted market prices in active markets for identical assets or liabilities | ||
• |
Level 2: |
Observable market-based inputs or unobservable inputs that are corroborated by market data |
||
• |
Level 3: |
Unobservable inputs reflecting the reporting entity's own assumptions |
We use observable market inputs (quoted market prices) when measuring fair value and require a Level 1 quoted price to be used to measure fair value whenever possible. Our cash equivalents represent Level 1 investments, which are valued based on quoted market prices. Our auction rate securities represent Level 3 investments, which are valued based on broker quotes as well as subsequent auctions, if any (see Note 3).
Sales Recognition
Sales are recognized across all segments of the business when there is persuasive evidence of an arrangement, delivery has occurred, price has been fixed or is determinable, and collectibility can be reasonably assured.
Sales within our U.S. Wholesale and International segments are recognized at the time title passes and risk of loss is transferred to the customer. Sales are recorded net of estimates for returns, discounts, operational chargebacks and markdown allowances. Returns and allowances require pre-approval by management and discounts are based on trade terms. We review and refine these estimates on a quarterly basis using historical trends, seasonal results, and current economic and market conditions. Our historical estimates of these costs have not differed materially from actual results.
Retail store sales are recognized net of estimated returns at the time of sale to consumers. E-commerce sales of products ordered through our retail internet site known as www.truereligionbrandjeans.com are recognized upon estimated delivery of the shipment to the customers. E-commerce sales also are reduced by an estimate of returns. Retail store sales and E-commerce sales exclude sales taxes. We recognize revenue associated with our gift cards upon redemption of the gift card. We currently do not recognize gift card breakage as we do not have sufficient historical evidence.
Revenue from licensing arrangements are recognized when earned in accordance with the terms of the underlying agreements, generally based upon the higher of (a) contractually guaranteed minimum royalty levels and (b) estimates of sales and royalty data received from our licensees.
Classification of Certain Costs and Expenses
We classify merchandise, inbound freight costs and out-bound shipping costs in cost of sales. Selling, general & administrative expenses ("SG&A") include merchandise design and pre-production,
F-10
TRUE RELIGION APPAREL, INC. AND SUBSIDIARIES
NOTES TO CONSOLIDATED FINANCIAL STATEMENTS (Continued)
NOTE 2—SUMMARY OF SIGNIFICANT ACCOUNTING POLICIES (Continued)
marketing and advertising, sales commissions, customer service, U.S. Consumer Direct expenses and general and administrative expenses. U.S. Consumer Direct expenses include wages and commissions, retail occupancy costs, supplies and direct segment management costs. General and administrative expenses include wages and performance compensation for our executive, finance, human resources, legal, and information systems departments, headquarters occupancy costs (including the portion used by the distribution function), and professional service costs. Included in selling, general and administrative expenses in the accompanying consolidated statements of income are handling charges of $4.5 million, $4.0 million and $3.6 million in 2010, 2009 and 2008, respectively.
Advertising Costs
Advertising costs, including the costs to produce advertising, are expensed when the advertisement is first exhibited. Cooperative advertising costs paid to wholesale customers are expensed as an advertising cost because the identified advertising benefit is sufficiently separable from the purchase of our products by the wholesale customers and the fair value of such benefit is reasonably measurable. These advertising expenses are recorded as a component of SG&A in the accompanying consolidated statements of income.
Advertising expenses amounted to $8.0 million, $5.4 million and $3.9 million for the years ended December 31, 2010, 2009 and 2008, respectively.
Comprehensive Income
Comprehensive income for the years ended December 31, 2010, 2009 and 2008, consists of net income, cumulative translation adjustments and adjustments to available for sale securities.
Net Income per Common Share
Net income per common share is determined in accordance with FASB ASC 260: Earnings per Share. Basic net income per common share is computed based upon the weighted average number of common shares outstanding, and diluted net income per common share is computed based upon the weighted average number of common shares outstanding plus dilutive common share equivalents outstanding during the periods using the treasury stock method. Dilutive common share equivalents consist of incentive stock options, non-qualified stock options and restricted stock awards, other than performance awards which are excluded from diluted shares outstanding until the performance condition is achieved. Once the performance condition is achieved on performance awards, the shares are included in diluted common share equivalents weighted from the beginning of the quarter during which the minimum earnings target was achieved.
F-11
TRUE RELIGION APPAREL, INC. AND SUBSIDIARIES
NOTES TO CONSOLIDATED FINANCIAL STATEMENTS (Continued)
NOTE 2—SUMMARY OF SIGNIFICANT ACCOUNTING POLICIES (Continued)
The weighted-average number of common shares outstanding used to calculate basic net income per common share is reconciled to those shares used in calculating diluted net income per common share as follows (amounts in thousands):
| |
Years Ended December 31, | |||||||||
|---|---|---|---|---|---|---|---|---|---|---|
| |
2010 | 2009 | 2008 | |||||||
Basic |
24,495 | 23,993 | 23,511 | |||||||
Dilutive effect of unvested restricted stock awards and stock options |
357 | 666 | 759 | |||||||
Diluted shares |
24,852 | 24,659 | 24,270 | |||||||
Stock-Based Compensation
We recognize restricted stock compensation expense, net of estimated forfeitures, for awards with only service conditions using the straight-line method over the requisite service period of the entire award. The requisite service period is the period during which an employee is required to provide service in exchange for an award, which often is the vesting period. If a portion of the restricted stock vests immediately or in another period such that the cumulative vested amount exceeds the cumulative straight line expense amount, we record compensation expense equal to at least the cumulative compensation expense of the vested amount of the restricted stock. Compensation expense for restricted stock awards with performance based conditions is recognized on an accelerated basis using the graded attribution method over the requisite service period.
Cash and Cash Equivalents
We consider all highly liquid debt instruments purchased with an initial maturity of three months or less to be cash equivalents. Cash equivalents are carried at cost, which approximates their fair market value. At December 31, 2010, cash equivalents consist of an investment in a money market fund that invest only in U.S. Treasury securities.
Accounts Receivable
Management evaluates our accounts receivables to assess if they will ultimately be collected. In performing this evaluation, significant judgment is used, including an analysis of specific risks on a customer-by-customer basis for larger accounts. Based on this information, management provides a reserve for the estimated amounts believed to be uncollectible. Based on historical losses, existing economic conditions and collection practices, our allowance for doubtful accounts has been estimated to be $0.5 million and $0.3 million at December 31, 2010 and 2009, respectively. Our actual credit losses for the periods presented have not significantly exceeded management's estimates.
Concentration of Credit Risks
For the year ended December 31, 2010 no sale to any one customer accounted for more than 10% or our net sales. For the years ended December 31, 2009 and 2008, sales to one customer accounted for 15% of our net sales. As of December 31, 2010, 27% of our net accounts receivable was due from
F-12
TRUE RELIGION APPAREL, INC. AND SUBSIDIARIES
NOTES TO CONSOLIDATED FINANCIAL STATEMENTS (Continued)
NOTE 2—SUMMARY OF SIGNIFICANT ACCOUNTING POLICIES (Continued)
one of our customers. As of December 31, 2009, 27% and 10% of our net accounts receivable were due from two of our customers.
Inventories
Wholesale and U.S. Consumer Direct inventories are stated at the lower of cost or market value. Cost is determined using the average cost which approximates the first-in, first-out method.
Slow-moving merchandise is typically sold at prices exceeding our cost in our outlet retail stores or to wholesale customers who specialize in off-price merchandise. As of December 31, 2010 and 2009, we recorded inventory impairment charges for slow-moving inventory of $0.7 million and $0.5 million, respectively, based upon analysis of balances on hand by style, recent sales trends, projected future sales, and historical markdown trends.
Our denim manufacturing process includes two phases: i) cut and sew; and ii) washing and finishing. At times, we will instruct our contract manufacturers to send goods to us that have been completed through the cut and sew phase only. By delaying the second phase of the manufacturing process, we can use updated market information about which washes and finishes are most popular before we send these unwashed goods to the laundries and finishing houses to complete the manufacturing process. The denim products that we hold between the cut and sew phase and the wash and finish phase are considered work-in-progress.
Property and Equipment, Net
Property and equipment, net, is stated at cost less accumulated depreciation. Depreciation is calculated using the straight-line method based upon the estimated useful lives of depreciable assets, which are typically three years for computer systems & equipment and trade show booths, five years for furniture & fixtures and machinery & equipment, and three to ten years for leasehold improvements. Leasehold improvements are depreciated over periods equal to the shorter of the estimated useful lives of the respective assets or the lease term.
Expenditures for repairs and maintenance are charged to operations as incurred, while renewals and betterments are capitalized.
Property and equipment are evaluated for impairment periodically whenever events or changes in circumstances indicate that their related carrying amounts may not be recoverable. In evaluating long-lived assets for recoverability, we use our best estimate of future cash flows expected to result from the use of the asset and eventual disposition. To the extent that projected undiscounted future net cash flows attributable to the asset (or asset group for our retail stores) are less than the carrying amount, an impairment loss is recognized in an amount equal to the difference between the carrying value of such asset or asset group and its estimated discounted net cash flows.
Income Taxes
We use the asset and liability method of accounting for income taxes. Using this method, deferred tax assets and liabilities are recorded based on differences between financial reporting and tax basis of assets and liabilities. The deferred tax assets and liabilities are calculated using the enacted tax rates and laws that are expected to be in effect when the differences are expected to reverse. We establish
F-13
TRUE RELIGION APPAREL, INC. AND SUBSIDIARIES
NOTES TO CONSOLIDATED FINANCIAL STATEMENTS (Continued)
NOTE 2—SUMMARY OF SIGNIFICANT ACCOUNTING POLICIES (Continued)
valuation allowances for tax benefits when we believe it is more likely than not that such assets will not be realized.
In accordance with FASB ASC 740: Accounting for Income Taxes ("FASB ASC 740"), we regularly evaluate the likelihood of recognizing the benefit for income tax positions we have taken in various federal, state and foreign filings by considering all relevant facts, circumstances, and information available. For those benefits that we believe it is more likely than not that the benefit will be sustained, we recognize the largest amount we believe is cumulatively greater than 50% likely to be realized.
We record interest and penalties, if any, on any underpayment of income taxes as a component of provision for income taxes and SG&A, respectively, in the accompanying consolidated statements of income.
Foreign Currency Translation
The local currency is the functional currency for all of our significant international operations, except for EMEA, whose functional currency is Euros. In accordance with ASC 830-30, assets and liabilities of our foreign operations are translated from foreign currencies into U.S. dollars at period-end rates, while income and expense are translated at the weighted-average exchange rates for the period. The related translation adjustments are reflected as a foreign currency translation adjustment in accumulated other comprehensive income (loss) within stockholders' equity.
Foreign Currency Transaction Gains and Losses
Transaction gains and losses that arise from exchange rate fluctuations on transactions denominated in a currency other than the local functional currency are included in the consolidated statements of income or accumulated other comprehensive income (loss), as appropriate.
Leases
We lease our corporate headquarters facility and all of our branded retail stores. All of these leases are classified as operating leases and they expire at various dates through 2022. We have no significant individual or master lease agreements.
Our fixed, noncancelable lease terms generally are 5 to 10 years. Some of our leases include options that allow us to extend the lease term beyond the initial commitment period, subject to terms agreed to at lease inception.
For leases that contain predetermined, fixed escalations of the minimum rent, we recognize the rent expense on a straight-line basis over the lease term and record the difference between the rent expense and the rent payable as deferred rent.
Most of our leases also provide for payment of operating expenses, such as common area charges, real estate taxes and other executory costs. Some leases require additional payments based on sales which are recorded in rent expense when the contingent rent is probable.
In some lease agreements, we receive landlord incentives to reimburse us for leasehold improvements. These incentives are recorded as a deferred rent credit and recognized as a reduction to rent expense on a straight-line basis over the lease term. As of December 31, 2010 and 2009, landlord incentives comprised $5.2 million and $3.5 million, respectively, of the deferred rent liability balance.
F-14
TRUE RELIGION APPAREL, INC. AND SUBSIDIARIES
NOTES TO CONSOLIDATED FINANCIAL STATEMENTS (Continued)
NOTE 2—SUMMARY OF SIGNIFICANT ACCOUNTING POLICIES (Continued)
Reclassifications
We have reclassified certain prior period amounts to conform to the current year presentation. We have revised our previously reported consolidated balance sheet for the year ended December 31, 2009 to combine the accounts receivable from factor with accounts receivable from customers into one line item called accounts receivable, net of allowances. We have also revised our consolidated statements of cash flows for the years ended December 31, 2009 and 2008 to combine the accounts receivable from factor with accounts receivable from customers into one line item called accounts receivable. These reclassifications are not considered material to the consolidated financial statements.
We have also reclassified certain prior period segment information to conform to the current year presentation. We reclassified our reportable segment formerly titled "Other" to include the functions which support the overall business and were previously classified in the U.S. Wholesale segment. The functions that were reclassified include the design, production, marketing, distribution, credit, customer service, information technology and accounting departments. In connection with this reclassification, we renamed the segment "Core Services". As a result of this change, we have reclassified certain SG&A expenses previously presented in the U.S. Wholesale segment to Core Services in order to conform to the revised presentation. We made the change to our reportable segments to more closely align them with how management reviews and monitors the performance of our operating segments. Total consolidated SG&A expenses and total consolidated operating income were not changed as a result of these reclassifications. The reclassifications had no impact upon previously reported consolidated net sales and consolidated gross profit by reportable segment. Additionally, these reclassifications did not impact the consolidated balance sheets, statements of income, or statements of cash flows. The following table summarizes the reclassifications made for the years ended December 31, 2009 and 2008 (amounts in thousands):
| |
2009 | ||||||||||
|---|---|---|---|---|---|---|---|---|---|---|---|
| |
As Originally Reported |
Reclassification | As Revised |
||||||||
Operating Income: |
|||||||||||
U.S. Wholesale |
$ | 30,763 | $ | 29,344 | $ | 60,107 | |||||
Core Services |
$ | (23,099 | ) | $ | (29,344 | ) | $ | (52,443 | ) | ||
|
|||||||||||
Capital expenditures: |
|||||||||||
U.S. Wholesale |
$ | 1,673 | $ | (1,557 | ) | $ | 116 | ||||
Core Services |
$ | 3,625 | $ | 1,557 | $ | 5,182 | |||||
|
|||||||||||
| |
2008 | ||||||||||
| |
As Originally Reported |
Reclassification | As Revised |
||||||||
Operating Income: |
|||||||||||
U.S. Wholesale |
$ | 47,452 | $ | 24,432 | $ | 71,884 | |||||
Core Services |
$ | (23,147 | ) | $ | (24,432 | ) | $ | (47,579 | ) | ||
Capital expenditures: |
|||||||||||
U.S. Wholesale |
$ | 810 | $ | (714 | ) | $ | 96 | ||||
Core Services |
$ | 1,459 | $ | 714 | $ | 2,173 | |||||
F-15
TRUE RELIGION APPAREL, INC. AND SUBSIDIARIES
NOTES TO CONSOLIDATED FINANCIAL STATEMENTS (Continued)
NOTE 3—CASH EQUIVALENTS AND INVESTMENTS
As of December 31, 2010 and 2009, we held $133.6 million and $94.3 million, respectively, of cash equivalents measured at fair value using quoted prices in active markets (Level 1 input).
As of December 31, 2009, investments consisted of auction rate securities ("'ARS") aggregating $5.0 million. These investments, with a par amount of $5.0 million, were purchased from us by a broker during the year ended December 31, 2010 at par plus accrued interest.
Our ARS and put option represent Level 3 assets. Our ARS were recorded at fair value using broker quotes. The fair value of the put option was determined by an internally developed discounted cash flow model. The following table provides a summary of changes in fair value of our Level 3 financial assets during the two years ended December 31, 2010 (amounts in thousands):
| |
Level 3 Assets | ||||||||||||||||||
|---|---|---|---|---|---|---|---|---|---|---|---|---|---|---|---|---|---|---|---|
| |
Short-Term | Long-Term | |||||||||||||||||
| |
ARS | Put Option | Total | ARS | Put Option | Total | |||||||||||||
Balance at December 31, 2008 |
$ | 3,263 | $ | 1,587 | $ | 4,850 | $ | 4,114 | $ | 876 | $ | 4,990 | |||||||
Transfer to short-term |
4,618 | 347 | 4,965 | (4,618 | ) | (347 | ) | (4,965 | ) | ||||||||||
Net settlements |
(3,288 | ) | (1,587 | ) | (4,875 | ) | (25 | ) | (25 | ) | |||||||||
Realized gain included in interest income, net |
(45 | ) | (45 | ) | 529 | 529 | |||||||||||||
Revaluation of put option included in interest income, net |
53 | 53 | (529 | ) | (529 | ) | |||||||||||||
Balance at December 31, 2009 |
4,548 | 400 | 4,948 | $ | — | $ | — | $ | — | ||||||||||
Net settlements |
(4,807 | ) | (143 | ) | (4,950 | ) | |||||||||||||
Realized gain (loss) included in interest income, net |
259 | 259 | |||||||||||||||||
Revaluation of put option included in interest income, net |
(257 | ) | (257 | ) | |||||||||||||||
Balance at December 31, 2010 |
$ | — | $ | — | $ | — | |||||||||||||
NOTE 4—ACCOUNTS RECEIVABLE
We recorded the following allowances against our wholesale accounts receivable as of December 31 (amounts in thousands):
| |
2010 | 2009 | ||||||
|---|---|---|---|---|---|---|---|---|
Reserve for returns |
$ | 390 | $ | 606 | ||||
Reserve for chargebacks and markdown allowances |
597 | 467 | ||||||
Reserve for bad debt |
566 | 297 | ||||||
Total |
$ | 1,553 | $ | 1,370 | ||||
In addition to the above reserves, we recorded an allowance for trade discounts of $0.4 million as of December 31, 2010 and $0.6 million as of December 31, 2009.
F-16
TRUE RELIGION APPAREL, INC. AND SUBSIDIARIES
NOTES TO CONSOLIDATED FINANCIAL STATEMENTS (Continued)
NOTE 5—INVENTORY
Inventory consisted of the following as of December 31 (amounts in thousands):
| |
2010 | 2009 | ||||||
|---|---|---|---|---|---|---|---|---|
Raw Materials |
$ | 1,284 | $ | 604 | ||||
Work-in-Progress |
1,599 | 1,800 | ||||||
Finished Goods |
38,808 | 32,098 | ||||||
Total |
$ | 41,691 | $ | 34,502 | ||||
NOTE 6—PROPERTY AND EQUIPMENT
Property and equipment consisted of the following as of December 31 (amounts in thousands):
| |
2010 | 2009 | ||||||
|---|---|---|---|---|---|---|---|---|
Computer systems & equipment |
$ | 9,916 | $ | 7,943 | ||||
Furniture & fixtures |
7,568 | 4,009 | ||||||
Leasehold improvements |
44,831 | 34,154 | ||||||
Machinery & equipment |
3,308 | 2,305 | ||||||
Trade show booths |
1,592 | 1,013 | ||||||
Construction in progress |
3,404 | 2,728 | ||||||
|
70,619 | 52,152 | ||||||
Less: accumulated depreciation |
22,171 | 12,459 | ||||||
Property and equipment, net |
$ | 48,448 | $ | 39,693 | ||||
Construction in progress at December 31, 2010 and 2009 represents the capital expenditures for leasehold improvements that will be used in our new branded retail stores. When these projects are completed, these balances are transferred to the appropriate property and equipment category and depreciated according to their estimated useful life.
Depreciation expense, which is included as a component of selling, general and administrative expenses in the accompanying consolidated statements of income, was $10.3 million, $6.3 million and $3.4 million for the years ended December 31, 2010, 2009 and 2008, respectively.
NOTE 7—ACCOUNTS PAYABLE AND ACCRUED EXPENSES
Accounts payable and accrued expenses consisted of the following as of December 31 (amounts in thousands):
| |
2010 | 2009 | ||||||
|---|---|---|---|---|---|---|---|---|
Accrued expenses |
$ | 5,836 | $ | 2,714 | ||||
Accounts payable |
3,580 | 1,602 | ||||||
Accrued sales and use taxes |
2,632 | 2,025 | ||||||
Accrued percentage rent |
2,029 | 1,367 | ||||||
Other |
3,157 | 4,009 | ||||||
Accounts payable and accrued expenses |
$ | 17,234 | $ | 11,717 | ||||
F-17
TRUE RELIGION APPAREL, INC. AND SUBSIDIARIES
NOTES TO CONSOLIDATED FINANCIAL STATEMENTS (Continued)
NOTE 8—LICENSING REVENUE
We have six license agreements whereby we granted to the licensee the right to use the True Religion Brand Jeans trademark and related intellectual property. Each licensee is required to pay us an annual royalty fee equal to the greater of a percentage of the licensee's actual annual net sales or minimum annual net sales (as defined in the underlying agreement). Additionally, each licensee will pay us an annual minimum advertising contribution fee equal to a percentage of the minimum annual net sales (as defined in the underlying agreement).
We recognized licensing revenue of $5.3 million, $4.3 million and $1.4 million for the years ended December 31, 2010, 2009 and 2008 as a component of net sales in the accompanying consolidated statements of income. These licensing revenues included prepayments recognized ratably and estimated sales and royalties based on information obtained from the licensee.
NOTE 9—STOCK-BASED COMPENSATION
On April 7, 2009, our Board of Directors approved the True Religion Apparel, Inc. 2009 Equity Incentive Plan (the "2009 Incentive Plan") which was approved by the shareholders at our Annual Shareholder Meeting on June 2, 2009. Upon approval of the 2009 Incentive Plan by the shareholders, grants under the Company's 2005 Stock Incentive Plan (the "2005 Incentive Plan") were discontinued and any shares available for issuance under the 2005 Incentive Plan were rolled into the 2009 Incentive Plan. The 2009 Incentive Plan reserves for issuance an aggregate of 1,000,000 shares of common stock, increased by 613,761 shares that rolled into the plan from our 2005 Incentive Plan.
The following table summarizes our annual stock-based compensation expense, which is included in selling, general and administrative expenses in the accompanying consolidated statements of income (amounts in thousands):
| |
December 31, | |||||||||
|---|---|---|---|---|---|---|---|---|---|---|
| |
2010 | 2009 | 2008 | |||||||
Stock-based compensation expense, before tax benefits |
$ | 13,059 | $ | 11,899 | $ | 10,297 | ||||
Tax benefits |
5,256 | 4,502 | 2,732 | |||||||
Stock-based compensation expense, after tax benefits |
$ | 7,803 | $ | 7,397 | $ | 7,565 | ||||
Restricted Stock Awards
Shares awarded under the 2009 and 2005 Incentive Plans entitle the shareholder to all the rights of common stock ownership except that the shares may not be sold, transferred, pledged, exchanged or otherwise disposed of during the restriction period. The restriction period is determined by the Compensation Committee of the Board of Directors and may not exceed 10 years. Restricted stock awards have generally been granted with vesting periods of up to three years. Subject to employment agreements entered into with senior executives, all unvested restricted shares are forfeited if the recipient of the restricted stock award no longer provides services, as defined, to us.
Non-vested performance-based awards
During the years ended December 31, 2010, 2009 and 2008, we awarded performance-based restricted stock to executive officers and others, which are subject to certain performance and service conditions. Upon achieving the performance condition, the non-vested performance awards partially
F-18
TRUE RELIGION APPAREL, INC. AND SUBSIDIARIES
NOTES TO CONSOLIDATED FINANCIAL STATEMENTS (Continued)
NOTE 9—STOCK-BASED COMPENSATION (Continued)
vest on the first anniversary of the grant date and the remainder on the second anniversary of the grant for a combined service period of two years. In order for these performance awards to vest, the Company's annual earnings before interest and income tax expenses (EBIT) must exceed a minimum amount; depending upon the Company's actual annual EBIT, additional restricted stock may be earned, up to a maximum number. The actual number of shares of the performance-based award earned in 2010 was 309,437, which is equal to the sum of the "Awards granted in 2010, at maximum" and the "Performance forfeited" amounts in the table below.
The following table summarizes our non-vested performance-based restricted stock activities for the year ended December 31, 2010:
| |
Shares | Weighted Average Grant Date Fair Value |
Weighted Average Remaining Contractual Life (Years) |
Intrinsic Value ($000's) |
|||||||||||
|---|---|---|---|---|---|---|---|---|---|---|---|---|---|---|---|
Prior year awards: |
|||||||||||||||
Non-vested, beginning of year |
838,322 | $ | 11.31 | ||||||||||||
Vested |
(653,995 | ) | $ | 11.38 | |||||||||||
Service forfeited |
(5,975 | ) | $ | 12.56 | |||||||||||
Non-vested, end of year |
178,352 | ||||||||||||||
Awards granted in 2010, at maximum: |
447,037 | $ | 28.76 | ||||||||||||
Performance forfeited |
(137,600 | ) | $ | 28.93 | |||||||||||
Service forfeited |
(24,135 | ) | $ | 29.28 | |||||||||||
Non-vested, end of year |
285,302 | ||||||||||||||
Total non-vested, end of year |
463,654 | $ | 21.87 | 0.8 | $ | 10,321 | |||||||||
Our policy for attributing the value of graded vesting to these share-based payments is the graded attribution (accelerated) method. The estimated fair value of the performance stock awarded is based on the price of our common stock on the date of grant and an assumed forfeiture rate of 5.3% in 2010, 3.4% in 2009, and 4.6% in 2008; these forfeiture rate assumptions were based on historical experience. The fair value of the performance shares awarded and earned was $8.9 million in 2010, $8.8 million in 2009, and $2.0 million in 2008. The total fair value of performance stock vested during the year ended December 31, 2010, 2009 and 2008 was $7.4 million, $1.4 million and $0, respectively. As of December 31, 2010, the total unamortized stock-based compensation expense related to the non-vested performance stock awards was $2.8 million, which is expected to be recognized over a weighted average period of 0.8 years.
During May 2010, we entered into a separation agreement with our former president which accelerated the vesting of his unvested 2009 performance share award and modified the service period requirement on a portion of his unvested 2010 performance share award. As a result of this separation agreement, we recorded an additional $3.0 million in stock-based compensation expense during the year ended December 31, 2010 due to the modification of these awards.
F-19
TRUE RELIGION APPAREL, INC. AND SUBSIDIARIES
NOTES TO CONSOLIDATED FINANCIAL STATEMENTS (Continued)
NOTE 9—STOCK-BASED COMPENSATION (Continued)
Non-vested service-based awards
During the years ended December 31, 2010, 2009 and 2008, we awarded service-based restricted stock to employees, officers and directors that vest over a period of up to three years.
The following table summarizes our non-vested service-based restricted stock activities for the year ended December 31, 2010:
| |
Shares | Weighted Average Grant Date Fair Value |
Weighted Average Remaining Contractual Life (Years) |
Intrinsic Value ($000's) |
||||||||||
|---|---|---|---|---|---|---|---|---|---|---|---|---|---|---|
Non-vested, beginning of year |
360,166 | $ | 16.23 | |||||||||||
Granted |
246,079 | $ | 25.06 | |||||||||||
Vested |
(275,534 | ) | $ | 17.44 | ||||||||||
Forfeited |
(46,449 | ) | $ | 21.38 | ||||||||||
Non-vested, end of year |
284,262 | $ | 21.86 | 1.5 | $ | 6,328 | ||||||||
Our policy for attributing the value of graded vesting of these share-based payments is the straight-line single option approach. The estimated fair value of the non-vested service-based stock awarded is based on the price of our common stock on the date of grant and an assumed forfeiture rate of 5.3% in 2010, 3.4% in 2009, and 4.6% in 2008; these forfeiture rate assumptions were based on historical experience. The fair value of the non-vested service-based stock awards was $6.2 million in 2010, $2.8 million in 2009, and $9.7 million in 2008. The total fair value of service-based stock awards vested during the year ended December 31, 2010, 2009 and 2008 was $4.8 million, $8.2 million and $7.0 million, respectively. As of December 31, 2010, the total unamortized stock-based compensation expense related to the non-vested service-based stock awards was $4.0 million, which is expected to be recognized over a weighted average period of 1.5 years.
We have a practice of withholding common shares, upon an employee's request, to satisfy employee minimum statutory income tax withholdings for restricted shares when they vest. During the years ended December 31, 2010, 2009 and 2008, we withheld 393,000, 223,275 and 150,926 shares for a total value of $9.7 million, $3.0 million and $2.8 million, respectively. These amounts are considered a financing activity and recorded as statutory tax withholding payment for stock-based compensation in the accompanying 2010, 2009 and 2008 consolidated statements of cash flows.
Included in the non-vested service based awards amount for 2010 is an inducement award of 100,000 shares issued outside of the 2009 Incentive Plan. This inducement award vests one third per year over a three year period beginning in June 2010.
Stock Options
Stock options were granted under the prior plans. Option grants were for a term of five years and vested over a period of zero to three years. We did not grant any new stock options during the years ended December 31, 2010, 2009 and 2008, and all options previously granted have been exercised or forfeited.
F-20
TRUE RELIGION APPAREL, INC. AND SUBSIDIARIES
NOTES TO CONSOLIDATED FINANCIAL STATEMENTS (Continued)
NOTE 9—STOCK-BASED COMPENSATION (Continued)
During the years ended December 31, 2010 and 2009, no options to acquire shares of our common stock were exercised. During the year ended December 31, 2008, options to acquire 836,665 shares of our common stock were exercised, of which 432,255 of these shares were withheld by us to meet the related employee minimum statutory income tax withholding requirement of $5.3 million and exercise price of $1.5 million. The minimum statutory income tax withholding amounts are recorded as tax withholding payments for stock-based compensation as a financing activity in the accompanying consolidated statements of cash flows.
The total intrinsic value of options exercised during the year ended December 31, 2008 was $11.6 million.
We receive a tax deduction for certain stock option exercises during the period the options are exercised, generally for the excess of the fair value of stock at the date of exercise over the exercise price of the options. We also receive a tax deduction that may be different than our financial statement expense for restricted stock when it vests. FASB ASC 718: Compensation—Stock Compensation ("FASB ASC 718") requires cash flows resulting from tax benefits in excess of the related stock-based compensation to be classified as part of cash flows from financing activities. In accordance with FASB ASC 718, we reported $3.6 million, $0.1 million and $0.2 million of excess tax benefits as financing cash flows for the years ended December 31, 2010, 2009 and 2008, respectively. The total tax (deficit) benefit realized from stock option exercises or restricted stock vesting for the years ended December 31, 2010, 2009 and 2008 was $3.6 million, $(0.6) million and $0.2 million, respectively. Cash received from stock option exercises was less than $0.1 million for the year ended December 31, 2008.
NOTE 10—COMMITMENTS AND CONTINGENCIES
Leases
We lease our headquarters facility and retail store locations under operating lease agreements expiring on various dates through January 2022. Some of these leases require us to make periodic payments for property taxes, utilities and common area operating expenses. Certain leases include lease incentives, rent abatements and fixed rent escalations, for which the effects are being recorded and amortized over the initial lease term on a straight-line basis. We have options to renew certain leases under various terms as specified within each lease agreement. We have no capitalized lease obligations.
As of December 31, 2010, we had 119 long-term lease agreements, which consisted of 100 retail stores in the U.S., seven international retail stores, our headquarters facility in Vernon, California which includes a parking annex, four showrooms in the U.S., and administrative offices and showrooms in Japan, South Korea, Hong Kong, Germany and Italy. Our leased properties aggregate 375,000 square feet of space, which consists of 150,000 square feet for our headquarters, international administrative and distribution facilities, 208,000 square feet of retail space and 17,000 square feet of showroom space. Our lease agreements for 94 of the retail stores leases require payment of a percentage of sales, ranging from 4% to 18%, if our net sales at the retail store exceed a defined threshold. As of December 31, 2010 we had 94 retail stores that were open in the U.S., 6 stores in the U.S. that had not been opened yet, four retail stores in Japan, one retail store in the U.K., one retail store in Germany and one retail store in Canada.
F-21
TRUE RELIGION APPAREL, INC. AND SUBSIDIARIES
NOTES TO CONSOLIDATED FINANCIAL STATEMENTS (Continued)
NOTE 10—COMMITMENTS AND CONTINGENCIES (Continued)
Rent expense was $24.1 million, $16.2 million and $9.3 million in 2010, 2009 and 2008, respectively. These amounts include contingent rental expense of $2.7 million, $1.6 million and $0.8 million in 2010, 2009 and 2008, respectively.
Future minimum lease payments under these operating leases as of December 31, 2010 are summarized as follows (amounts in thousands):
Year ending December 31,
|
|
|||
|---|---|---|---|---|
2011 |
$ | 20,289 | ||
2012 |
20,581 | |||
2013 |
20,573 | |||
2014 |
20,453 | |||
2015 |
20,311 | |||
Thereafter |
67,831 | |||
Total minimum lease payments |
$ | 170,038 | ||
Subsequent to December 31, 2010, we entered into 10 new retail leases, which have expiration dates through May 2021 and future minimum lease payments of approximately $16.3 million.
Legal Proceedings
From time to time, we are involved in various legal proceedings, which are incidental to the ordinary course of business. We do not believe that these routine matters are material to our business or financial condition.
NOTE 11—BUSINESS ACQUISITION AND REDEEMABLE NONCONTROLLING INTEREST
In July 2010, we entered into a joint venture agreement through our newly formed wholly owned subsidiary, True Religion Brand Jeans Germany GmbH (TRBJ Germany), with our former German distributor, UNIFA Premium GmbH ("UP") for the wholesale and retail distribution of True Religion Brand Jeans products in Germany, Switzerland, Austria, the Netherlands, Belgium and Luxembourg. In connection with the joint venture agreement, we canceled the distribution agreement with UP and entered into a new distribution agreement with TRBJ Germany and we entered into an agreement with UP whereby we purchased certain assets, including inventory and fixed assets, of UP for an immaterial cash payment; and, UP purchased a redeemable noncontrolling interest in TRBJ Germany. Following these transactions, we own a controlling 60% interest in TRBJ Germany, and UP owns a 40% interest. We have accounted for the transaction as a business combination and have allocated the total consideration consisting of cash and the 40% interest in TRBJ Germany to the tangible assets. Consideration transferred did not result in a purchase price excess, thus no goodwill was recognized as of our valuation date. The business of TRBJ Germany operates according to a joint venture agreement that includes a call option and a put option on UP's 40% redeemable noncontrolling interest, allowing us to purchase UP's shares (the call option) or UP to sell us their shares (the put option) at a purchase price equal to the fair market value of UP's shares at the time of delivery of the call or put option. Both options can be exercised beginning on the five year anniversary of the joint venture agreement and on every anniversary date thereafter. Additionally, the exercise of such options may be accelerated upon the occurrence of certain changes in control as defined in the joint venture agreement. As the
F-22
TRUE RELIGION APPAREL, INC. AND SUBSIDIARIES
NOTES TO CONSOLIDATED FINANCIAL STATEMENTS (Continued)
NOTE 11—BUSINESS ACQUISITION AND REDEEMABLE NONCONTROLLING INTEREST (Continued)
redeemable interest is considered probable of becoming currently redeemable in the future, the redeemable interest will be adjusted to its estimated fair value at each reporting period.
We calculated the fair value of the redeemable noncontrolling interest by discounting the future cash flows of TRBJ Germany and determined that the fair value of the noncontrolling interest approximated the carrying value as of December 31, 2010.
The total consideration paid is summarized below (amounts in thousands):
| |
As of August 1, 2010 |
|||
|---|---|---|---|---|
Cash |
$ | 845 | ||
Redeemable noncontrolling interest |
1,763 | |||
Total consideration paid |
$ | 2,608 | ||
The purchase price allocation is summarized below (amounts in thousands):
| |
As of August 1, 2010 |
|||
|---|---|---|---|---|
Fixed assets |
$ | 642 | ||
Inventory |
1,449 | |||
Other assets |
517 | |||
Total assets acquired |
$ | 2,608 | ||
The following table presents a reconciliation of the redeemable noncontrolling interest (amounts in thousands):
| |
For the Year Ended December 31, 2010 |
||||
|---|---|---|---|---|---|
Redeemable noncontrolling interest, January 1, 2010 |
$ | — | |||
Net income attributable to redeemable noncontrolling interest |
139 | ||||
Foreign currency translation adjustment |
23 | ||||
Capital contributions by redeemable noncontrolling interest |
1,763 | ||||
Redeemable noncontrolling interest, December 31, 2010 |
$ | 1,925 | |||
F-23
TRUE RELIGION APPAREL, INC. AND SUBSIDIARIES
NOTES TO CONSOLIDATED FINANCIAL STATEMENTS (Continued)