Attached files
| file | filename |
|---|---|
| EX-3.1 - EXHIBIT 3.1 - THESTREET, INC. | exhibit3_1.htm |
| EX-32.2 - EXHIBIT 32.2 - THESTREET, INC. | exhibit32_2.htm |
| EX-23.2 - EXHIBIT 23.2 - THESTREET, INC. | exhibit23_2.htm |
| EX-31.2 - EXHIBIT 31.2 - THESTREET, INC. | exhibit31_2.htm |
| EX-21.1 - EXHIBIT 21.1 - THESTREET, INC. | exhibit21_1.htm |
| EX-31.1 - EXHIBIT 31.1 - THESTREET, INC. | exhibit31_1.htm |
| EX-32.1 - EXHIBIT 32.1 - THESTREET, INC. | exhibit32_1.htm |
| EX-23.1 - EXHIBIT 23.1 - THESTREET, INC. | exhibit23_1.htm |
| EX-10.36 - EXHIBIT 10.36 - THESTREET, INC. | exhibit10_36.htm |
| EX-10.37 - EXHIBIT 10.37 - THESTREET, INC. | exhibit10_37.htm |
| EX-10.38 - EXHIBIT 10.38 - THESTREET, INC. | exhibit10_38.htm |
| EX-10.34 - EXHIBIT 10.34 - THESTREET, INC. | exhibit10_34.htm |
| EX-10.35 - EXHIBIT 10.35 - THESTREET, INC. | exhibit10_35.htm |
| EX-10.33 - EXHIBIT 10.33 - THESTREET, INC. | exhibit10_33.htm |
|
|
|
UNITED STATES
|
|
SECURITIES AND EXCHANGE COMMISSION
|
|
Washington, D.C. 20549
|
FORM 10-K
ANNUAL REPORT PURSUANT TO SECTION 13 OR 15(d) OF THE
SECURITIES EXCHANGE ACT OF 1934
FOR THE FISCAL YEAR ENDED DECEMBER 31, 2010
COMMISSION FILE NUMBER 0-25779
|
THESTREET.COM, INC.
|
||||||||
|
(Exact name of Registrant as specified in its charter)
|
||||||||
|
Delaware
|
06-1515824
|
|||||||
|
(State or other jurisdiction of incorporation or organization)
|
(I.R.S. Employer Identification No.)
|
|||||||
|
14 Wall Street, 15th Floor
New York, New York
|
10005
|
|||||||
|
(Address of principal executive offices)
|
(Zip code)
|
|||||||
|
Registrant’s telephone number, including area code: (212) 321-5000
|
||||||||
Securities registered pursuant to Section 12(b) of the Act:
|
Title of Each Class
|
Name of Each Exchange on Which the Securities are Registered
|
|
|
Common Stock, par value $0.01 per share
|
Nasdaq Global Market
|
Securities registered pursuant to Section 12(g) of the Act: None
Indicate by check mark if the Registrant is a well-known seasoned issuer, as defined in Rule 405 of the Securities Act. Yes □ Nox
Indicate by check mark if the Registrant is not required to file reports pursuant to Section 13 or Section 15(d) of the Exchange Act. Yes □ No x
Indicate by a check mark whether the Registrant (1) has filed all reports required to be filed by Section 13 or 15(d) of the Securities Exchange Act of 1934 during the preceding 12 months (or for such shorter period that the Registrant was required to file such reports), and (2) has been subject to such filing requirements for the past 90 days. Yes x No □
Indicate by check mark whether the Registrant has submitted electronically and posted on its corporate web site, if any, every Interactive Data File required to be submitted and posted pursuant to Rule 405 of Regulation S-T (§232.405 of this chapter) during the preceding 12 months (or for such shorter period that the registrant as required to submit and post such files). Yes x No □
Indicate by check mark if disclosure of delinquent filers pursuant to Item 405 of Regulation S-K (§229.405 of this chapter) is not contained herein, and will not be contained, to the best of the Registrant’s knowledge, in definitive proxy or information statements incorporated by reference in Part III of this Form 10-K or any amendment to this Form 10-K. □
Indicate by check mark whether the Registrant is a large accelerated filer, an accelerated filer, a non-accelerated filer, or a smaller reporting company. See the definitions of “large accelerated filer,” “accelerated filer” and “smaller reporting company” in Rule 12b-2 of the Exchange Act.
|
Large accelerated filer □
|
Accelerated filer x
|
Non-accelerated filer □
|
Smaller reporting company □
|
Indicate by check mark whether the Registrant is a shell company (as defined in Rule 12b-2 of the Act). Yes No x
The aggregate market value of the Registrant’s common stock held by non-affiliates of the Registrant (assuming, for the sole purpose of this calculation, that all directors and executive officers of the Registrant are “affiliates”), based upon the closing price of the Registrant’s common stock on June 30, 2010 as reported by Nasdaq, was approximately $74million.
Indicate the number of shares outstanding of each of the Registrant’s classes of common stock, as of the latest practicable date.
|
Title of Each Class
|
Number of Shares Outstanding as of March 9, 2011
|
|
Common Stock, par value $0.01 par value
|
31,933,893
|
Documents Incorporated By Reference
|
Part III of this Form 10-K incorporates by reference certain information from the Registrant’s Definitive Proxy Statement for its Annual Meeting of Stockholders to be held on May 26, 2011, to be filed with the Securities and Exchange Commission within 120 days after the end of the fiscal year covered by this Report.
|
i
THESTREET.COM, INC.
2010 ANNUAL REPORT ON FORM 10-K
|
Page
|
|||
ii
THESTREET.COM, INC.
2010 ANNUAL REPORT ON FORM 10-K
Special Note Regarding Forward-Looking Statements – all statements contained in this Report that are not descriptions of historical facts are forward-looking statements within the meaning of Section 27A of the Securities Act of 1933, as amended (the “Securities Act”), and Section 21E of the Securities Exchange Act of 1934, as amended (the “Exchange Act”). Forward-looking statements are inherently subject to risks and uncertainties, and actual results could differ materially from those reflected in the forward-looking statements due to a number of factors, which include, but are not limited to, the factors set forth under the heading “Risk Factors” and elsewhere in this Report, and in other documents we file with the Securities and Exchange Commission from time to time. Certain forward-looking statements may be identified by terms such as “may,” “will,” “should,” “could,” “expects,” “plans,” “intends,” “anticipates,” “believes,” “estimates,” “predicts,” “forecasts,” “potential,” or “continue” or similar terms or the negative of these terms. All statements relating to our plans, strategies and objectives are deemed forward-looking statements. Although we believe that the expectations reflected in the forward-looking statements are reasonable, we cannot guarantee future results, levels of activity, performance or achievements. We have no obligation to update these forward-looking statements, whether as a result of new information, future developments or otherwise.
Overview
TheStreet.com, Inc., together with its wholly owned subsidiaries (“we”, “us” or the “Company”), is a digital financial media company. Our goal is to be the primary independent online-only source of reliable and actionable investing ideas, news and analysis, markets and rate data and analytical tools for a large audience of active self-directed investors, as well as to assist advertisers desiring to connect with our affluent audience. We distribute our fee-based premium content and advertising-supported content through a network of proprietary electronic services including: Web sites, blogs, widgets, email services, mobile devices, podcasts and online video channels. We also syndicate our content for distribution by financial institutions and other media organizations.
We pioneered online publishing of business and investment information through our creation of TheStreet, which launched in 1996 as a paid subscription financial news and commentary Web site. Today, TheStreet is our flagship advertising-supported property, a leading site in its category and a major source of subscribers to a variety of our premium subscription products. Our subscription products, which include paid Web sites such as, RealMoney, RealMoney Silver, Options Profits, Actions Alerts PLUS, and Stocks Under $10 – are designed to address the needs of investors with various areas of interest and increasing levels of financial sophistication. The majority of our subscription revenue derives from annual subscriptions, although products also are offered on a monthly subscription basis.
We believe we are one of the first companies to successfully create a large scale, consumer-focused, digital premium services content business. We believe we have been able to successfully build our premium services business because we have established a track record for almost 15 years of providing high quality, independent investing ideas that have produced financial value for our readers. We believe our track record provides us with a competitive advantage and we will seek to enhance the value of our leading brand and our ability to monetize that value. Steps we intend to take in this regard include the following: first, we will focus on creating additional subscription products, at various price points, to more precisely target the needs of investors willing to pay for high quality, actionable investing ideas, analysis, data and tools. Second, we will continue to refine our marketing strategy, seeking to identify cost-effective promotional opportunities with a variety of third-party media providers, improving our efficiency in promoting our offerings in our own expanding collection of properties and expanding direct sales efforts by a growing internal sales force. Third, we will seek continually to ensure and enhance the quality and competitiveness of our products and to make them available on the widest choice of digital platforms.
In addition to our consumer-focused subscription products, our premium services business also includes information services revenue from our RateWatch business, which maintains a constantly-updated database of financial rate and fee data collected from more than 80,000 financial institutions (at the branch level), including certificate of deposit, money market account, savings account, checking account, home mortgage, home equity loan, credit card and auto loan rates. This information is sold to banks and financial institutions on a subscription basis, in the form of standard and custom reports that outline the competitive landscape for our clients, and also serves as the foundation for the data available on BankingMyWay, a free advertising-supported Web site that enables consumers to search for the most competitive local and national rates from the RateWatch data. Our premium services revenue also includes revenue generated from syndication and licensing of certain of our content, including data from TheStreet Ratings (“Ratings”), which tracks the risk-adjusted performance of more than 16,000 mutual funds and exchange-traded funds (ETFs) and more than 5,000 stocks. We intend to expand our licensing arrangements to make some of our proprietary content available in channels we do not presently serve. Premium services contributed 67% of our total revenue in 2010, as compared to 63% in 2009 and 58% in 2008.
Our advertising-supported properties, which include TheStreet, Stockpickr, MainStreet and BankingMyWay, attract one of the largest and most affluent audiences of any digital publisher in our content vertical. We believe our flagship site, TheStreet, with its enviable track record as a leading and distinctive digital voice in the financial category since the early days of the consumer Internet, is regarded as a must-buy for our core online brokerage advertisers and a highly effective means for other financial services companies and non-endemic advertisers to communicate with our active, affluent audience. We believe we are able to command pricing for our advertising inventory that is strong relative to most Web sites. We sell banner, tile and sponsorship advertising exclusively through our experienced internal sales force and also generate revenue from contextual and search-based advertising provided by third party technology providers.
We generate advertising revenue from our content through the sale of the following types of advertising placements:
|
|
·
|
banner, tile, contextual, performance-based and interactive advertisement and sponsorship placements in our advertising-supported Web sites, as well as on select paid subscription sites;
|
|
|
·
|
advertisement placements in our free email newsletters and stand-alone emails sent on behalf of our advertisers to our registered users; and
|
|
|
·
|
advertisements in TheStreet TV, TheStreet services for mobile and tablet devices, RSS feeds, blogs and in our podcasts.
|
During the years ended December 31, 2009 and 2008, we also generated interactive marketing services revenue from our former Promotions.com subsidiary, which we acquired in August 2007 and sold in December 2009. Promotions.com implemented online and mobile interactive promotions – including sweepstakes, instant win games and customer loyalty programs – for some of the world’s largest brands. Including Promotions.com, advertising and marketing services contributed 33% of our total revenue in 2010, as compared to 37% in 2009 and 42% in 2008.
We will seek to increase the traffic to our network of Web sites both by expanding the range of content we offer (which may include repurposing content from one site to address the needs of another site) and by expanding our relationships with third parties having larger or complimentary audiences. We believe our expertise at monetizing our content offerings through a variety of sources, and the value we have built in our brand over the past 15 years as a leading voice in our content vertical – as well as our independence from any larger media organization – enables us to successfully partner with a variety of high-traffic Web sites and portals, providing expertise in our content category under arrangements that provide benefits to both our partners and ourselves.
Marketing
We pursue a variety of sales and marketing initiatives to sell subscriptions to our premium services, increase traffic to our sites, license our content, expose our brands, and build our customer databases. These initiatives include promoting our services through online, email, radio and television marketing, telemarketing and establishing content syndication and subscription distribution relationships with leading companies. Our in-house online marketing and creative design teams create a variety of marketing campaigns, which are then implemented by our technical and operations team and by third-party service providers. We also have a reporting and analysis group that analyzes traffic and subscription data to determine the effectiveness of the campaigns.
We use content syndication and subscription distribution arrangements to capitalize on the cost efficiencies of online delivery and create additional value from content we already have produced for our own properties. By syndicating our content to other leading Web sites to host on their own sites, we expose our brands and top-quality writing to millions of potential users. In one type of syndication arrangement, we provide leading Web sites, including Yahoo! Finance, MSN Money and CNN Money, with article headlines that these partners display on their stock quote result pages, providing links back to our site. This type of arrangement exposes new audiences to our brands and content and generates additional traffic to our sites, creating the opportunity for us to increase our advertising revenue and subscription sales.
We are intensely focused on generating additional visitors to our sites through search engine optimization efforts, in order to increase the visibility of our content on search engines such as Google Search and Microsoft’s Bing, and through efforts to increase our presence on a variety of social media platforms, such as Facebook and Twitter. In addition, we are focused on increasing the engagement our visitors have with our sites, measured by visits per visitor, page views per visit and by time spent on site, and we continuously seek to improve the experience our sites offer.
We also use subscription distribution arrangements with online financial services firms and other companies. These agreements allow their customers to receive discounts on certain of our premium subscription services or to access our free and premium content, thereby exposing our brands and content to new audiences.
In addition, we obtain exposure through other media outlets who cite our writers and our stories or who invite our writers to appear on segments. In 2010, we were mentioned or featured in numerous reports by major news outlets, including The Wall Street Journal, Bloomberg, Newsweek and The New York Times; and some of our writers appeared on various television and radio stations, including CNBC, CNN, ABC, PBS and MSNBC.
Competition
Our services face intense competition from other providers of business, personal finance, investing and ratings content, including:
|
|
·
|
online services or Web sites focused on business, personal finance, or investing, such as The Wall Street Journal Digital Network, CNN Money, Reuters.com, Bloomberg.com and CNBC.com, as well as financial portals such as Yahoo! Finance, AOL Money & Finance and MSN Money;
|
|
|
·
|
publishers and distributors of traditional media focused on business, personal finance or investing, including print and radio, such as The Wall Street Journal and financial talk radio programs, and business television networks such as CNBC and the Fox Business Channel;
|
|
|
·
|
investment newsletter publishers; and
|
|
|
·
|
established ratings services, such as Standard & Poor’s, Morningstar and Lipper, with respect to our Ratings products, and rate database providers such as Informa, with respect to our RateWatch products.
|
Many of these competitors have significantly greater scale and resources than we do. Additionally, advances in technology have reduced the cost of production and online distribution of written, audio and video content, which has resulted in the proliferation of small, often self-published providers of free content, such as bloggers.
According to comScore, Inc., an independent Web measurement company (“comScore”), based upon average monthly numbers for the three months ending December 31, 2010, our network of sites had the following ranking among the top 15 sites, as measured by total unique visitors among the 139 listed competitors in the Business/Finance – News/Research category: our sites were second in terms of average minutes per visit; ninth in terms of average visits per visitor; tenth in terms of total minutes spent on site; eleventh in terms of average daily visitors, total pages viewed and total visits; and twelfth in terms of total unique visitors.
While we believe that comScore significantly undercounts our site traffic as measured by our own servers, we believe that advertisers and agencies often look to independent measurement data such as that provided by comScore in order to gain a sense of the performance of various sites, in relation to their peer category, when determining where to allocate advertising dollars. We believe that advertisers and agencies also look to demographic data provided by independent parties such as Nielsen @Plan, which routinely ranks our network of sites as having one of the highest concentrations of affluent, self-directed investors among measured sites.
We compete with these other content providers for customers, including subscribers, readers and viewers of our video content, for advertising revenue, and for employees and contributors to our services. Our ability to compete successfully depends on many factors, including the quality, originality, timeliness, insightfulness and trustworthiness of our content and that of our competitors, the reputations of our contributors and our brands, the success of our recommendations and research, our ability to introduce products and services that keep pace with new investing trends, the experience we and our competitors offer our users and the effectiveness of our sales and marketing efforts.
Infrastructure, Operations and Technology
Our main technological infrastructure consists of proprietary and Drupal-based content management, subscription management, Ratings models, and e-commerce systems, which are hosted primarily at a third-party facility. Our operations are dependent in part on our ability, and that of our various hosting facilities, to protect our systems against damage from fire, earthquakes, power loss, telecommunications failure, break-ins, computer viruses, hacker attacks, terrorist attacks and other events beyond our control.
Our content-management systems are based on proprietary software and the Drupal Content Management System. They allow our stories, videos and data to be prepared for distribution online to a large audience. These systems enable us to distribute and syndicate our content economically and efficiently to multiple destinations in a variety of technical formats.
Our subscription-management system is based on proprietary software and allows us to communicate automatically with readers during their free-trial and subscription periods. The system is capable of yielding a wide variety of customized subscription offers to potential subscribers, using various communication methods and platforms.
Our e-commerce system is based on proprietary software and controls user access to a wide array of service offerings. The system automatically controls all aspects of online daily credit card billing, based upon user-selected billing terms. All financial revenue-recognition reports are automatically generated, providing detailed reporting on all account subscriptions. This generally allows a user to sign up and pay for an online service for his or her selected subscription term (annual or monthly). We are currently migrating this system to a customized off-the-shelf system.
Our Ratings business is based on a set of proprietary statistical models that use key financial metrics and indicators to rate stocks, mutual funds and ETFs. The data and output from these models are managed and stored within a content management system and updated daily based on changes in markets. The system is capable of search-based syndication of customized ratings data that can be distributed in a variety of technical formats.
Intellectual Property
To protect our rights to intellectual property, we rely on a combination of trademarks, copyrights, trade secret protection, confidentiality agreements and other contractual arrangements with our employees, affiliates, customers, strategic partners and others. We have registered certain of our trademarks in the United States and we have pending U.S. applications for other trademarks. Additionally, we police Internet message boards and other Web sites for copyrighted content of ours that has been republished without our permission and we will aggressively pursue the poster, the site hosting the content and any Internet service provider in order to protect our copyright. To protect our intellectual property rights as well as protect against infringement claims in our relationships with business partners, we generally look to incorporate contractual provisions protecting our intellectual property and seeking indemnification for any third-party infringement claims. However, the protective steps we have taken may be inadequate to deter misappropriation of our proprietary information. We may be unable to detect the unauthorized use of, or take appropriate steps to enforce, our intellectual property rights. Failure to adequately protect our intellectual property could harm our brand, devalue our proprietary content and affect our ability to compete effectively.
Some of our services incorporate licensed third-party technology. In these license agreements, the licensors have generally agreed to defend, indemnify and hold us harmless with respect to any claim by a third party that the licensed technology infringes any patent or other proprietary right. We cannot provide assurance that the foregoing provisions will be adequate to protect us from infringement claims. In addition, we may be accused of violating the intellectual property rights of others for reasons unrelated to any third-party technology we use. Any infringement claims, even if not meritorious, could result in the expenditure of significant financial and managerial resources on our part, which could materially adversely affect our business, results of operations and financial condition.
Customers; Seasonality
In 2010, no customer accounted for 10% or more of our consolidated revenue. There does not tend to be significant seasonality to our premium services revenue. Advertising spending by our customers generally tends to be higher in the fourth calendar quarter as compared to other quarters, and the first and third calendar quarters often are lower than the other quarters.
Working Capital
Our current assets at December 31, 2010 consisted primarily of marketable securities, cash and cash equivalents, and accounts receivable. We do not hold inventory. Our current liabilities at December 31, 2010 consisted primarily of deferred revenue, accrued expenses and accounts payable. At December 31, 2010, our current assets were approximately $55.7 million, 1.97 times greater than our current liabilities. With respect to most of our annual subscription products, we offer the ability to receive a refund during the first 30 days but none thereafter. We do not as a general matter offer any other refunds for any premium services products or offer refunds for advertising that has run.
Geography
During 2010, 2009 and 2008, all of our long-lived assets were located in the United States. Substantially all of our revenue in 2010, 2009 and 2008 was generated from customers in the United States.
Employees
As of December 31, 2010, the Company had 291employees. The Company has never had a work stoppage and none of its employees are represented under collective bargaining agreements. The Company considers its relations with its employees to be good.
Government Regulation
We are subject to government regulation in connection with securities laws and regulations applicable to all publicly-owned companies, as well as laws and regulations applicable to businesses generally. We are also increasingly subject to government regulation and legislation specifically targeting Internet companies, such as privacy regulations adopted at the local, state, national and international levels and taxes levied at the state level. Due to the increasing popularity and use of the Internet, enforcement of existing laws, such as consumer protection regulations, in connection with Web-based activities has become more aggressive, and we expect that new laws and regulations will continue to be enacted at the local, state, national and international levels. Such new legislation, alone or combined with increasingly aggressive enforcement of existing laws, could decrease the demand for our services or otherwise have a material adverse effect on our future operating performance and business.
Available Information
We were founded in 1996 as a limited liability company, and reorganized as a C corporation in 1998. We consummated our initial public offering in 1999 and we file annual, quarterly and current reports, proxy statements and other information with the Securities and Exchange Commission (“SEC”). Our CorporateWeb site is located at http://www.t.st. We make available free of charge, on or through our Web site, our annual, quarterly and current reports, and any amendments to those reports, as soon as reasonably practicable after electronically filing such reports with the SEC. Information contained on our Web site is not part of this Report or any other report filed with the SEC.
You may read and copy any materials we file with the SEC at the SEC’s Public Reference Room at 100 F Street, NW, Washington, D.C. 20549. You may obtain information on the operation of the Public Reference Room by calling the SEC at 1-800-SEC-0330. The SEC maintains an Internet site (http://www.sec.gov) that contains reports, proxy and information statements and other information regarding issuers that file electronically with the SEC.
Note – investing in our Common Stock involves a high degree of risk. You should carefully consider the following risk factors, as well as the other information in this Report, before deciding whether to invest in our Common Stock. Our business, prospects, financial condition or operating results could be materially adversely affected by any of these risks, as well as other risks not currently known to us or that we currently consider immaterial. The trading price of our Common Stock could decline as a result of any of these risks, and you could lose part or all of your investment in our Common Stock. When deciding whether to invest in our Common Stock, you should also refer to the other information in this Report, including our consolidated financial statements and related notes and the information contained in Part II, Item 7 of this Report entitled “Management’s Discussion and Analysis of Financial Condition and Results of Operations.” You should carefully consider the following material risks we face. If any of the following risks occur, our business, results of operations or financial condition could be materially adversely affected. Please also refer to the Special Note Regarding Forward-Looking Statements appearing in Part I, Item 1 of this Report.
Our Quarterly Financial Results May Fluctuate and our Future Revenue Is Difficult to Forecast
Our quarterly operating results may fluctuate significantly in the future as a result of a variety of factors, many of which are outside our control, including:
|
|
·
|
the level of interest and investment in the stock market by both individual and institutional investors;
|
|
|
·
|
the willingness of investors to pay for content distributed over the Internet, where a large quantity of content is available for free;
|
|
|
·
|
demand and pricing for advertising on our Web sites, which is affected by advertising budget cycles of our customers, general economic conditions, demand for advertising on the Internet generally, the supply of advertising inventory in the market and actions by our competitors;
|
|
|
·
|
subscription price reductions attributable to decreased demand or increased competition;
|
|
|
·
|
new products or services introduced by our competitors;
|
|
|
·
|
content distribution fees or other costs;
|
|
|
·
|
costs or lost revenue associated with system downtime affecting the Internet generally or our Web sites in particular; and
|
|
|
·
|
general economic and market conditions.
|
We had a large net loss in fiscal year 2009 and have incurred net losses for most years of our history. We may not be cash-flow positive or generate net income in future periods. We forecast our current and future expense levels based on expected revenue and our operating plans. Because of the above factors, as well as other material risks we face, as described elsewhere in this Report, our operating results may be below the expectations of public market analysts and investors in some future quarters. In such an event, the price of our Common Stock is likely to decline.
Key Writers, Particularly James J. Cramer, are Essential Sources of Revenue
Some of our products, particularly our editorial subscription products, reflect the talents, efforts, personalities and reputations of their respective writers. As a result, the services of these key writers, including our co-founder James J. Cramer, form an essential element of our subscription revenue. In addition, Mr. Cramer’s popularity and visibility have provided public awareness of our services and introduced our content to new audiences. Accordingly, we seek to compensate and provide incentives for these key writers through competitive salaries, stock ownership and bonus plans and/or royalty arrangements, and we have entered into employment or contributor agreements with certain of them, including Mr. Cramer. Mr. Cramer has a three-year employment agreement, which will expire on December 31, 2013. We can give no assurances that we will be able to retain key writers, or, should we lose the services of one or more of our key writers to death, disability, loss of reputation or other reason, to attract new writers acceptable to readers of our network of Web sites and editorial subscription products. The loss of services of one or more of our key writers could have a material adverse effect on our business, results of operations and financial condition.
The Loss of the Services of Other Key Employees Could Affect Our Business
Our ability to compete in the marketplace depends upon the retention of other key employees, including executives to operate our business, technology personnel to run our publishing, commerce, communications, video and other systems, and salespersons to sell our advertising inventory. Several, but not all, of our key employees are bound by agreements containing non-competition provisions. There can be no assurances that these arrangements with key employees will provide adequate protections to us or will not result in management changes that would have material adverse impact on us. In addition, we may incur increased costs to continue to compensate our key executives, as well as other employees, through competitive salaries, stock ownership and bonus plans. Nevertheless, we can make no assurances that these programs will allow us to retain key employees or hire new employees. The loss of one or more of our key employees, or our inability to attract experienced and qualified replacements, could materially adversely affect our business, results of operations and financial condition.
We May Have Difficulty Maintaining or Increasing Our Advertising Revenue, a Significant Portion of Which Is Concentrated Among Our Top Advertisers and Subject to Industry and Other Factors
Our ability to maintain or increase our advertising revenue depends on a variety of factors. Such factors include: general market conditions; seasonal fluctuations in financial news consumption and overall online usage; our ability to maintain or increase our unique visitors, page view inventory and user engagement; our ability to attract audiences possessing demographic characteristics most desired by our advertisers; and our ability to win advertisers from other Web sites, television, newspapers, magazines, newsletters or other new media. Advertising revenue could decline if the relationships we have with portals and other high-traffic Web sites is adversely affected. In addition, our advertising revenue may decline as a result of pricing pressures on Internet advertising rates due to industry developments, changes in consumer interest in the financial media and other factors in and outside of our control, including in particular as a result of any significant or prolonged downturn in, or periods of extreme volatility of, the financial markets. In addition, any advertising revenue that is performance-based may be adversely impacted by the foregoing and other factors. If our advertising revenue significantly decreases, our business, results of operations and financial condition could be materially adversely affected.
In 2010, our top five advertisers accounted for approximately 29% of our total advertising revenue, a decrease from 36% for 2009. Furthermore, although we have advertisers from outside the financial services industry, such as travel, automotive and technology, a large proportion of our top advertisers are concentrated in financial services, particularly in the online brokerage business. Recent consolidation of financial institutions and other factors could cause us to lose a number of our top advertisers, which could have a material adverse affect on our business, results of operations and financial condition. As is typical in the advertising industry, our advertising contracts have short notice cancellation provisions.
Investment of Our Cash Carries Risks
Financial instruments that subject us to concentrations of credit risk consist primarily of cash, cash equivalents, debt securities available for sale and restricted cash. We maintain all of our cash, cash equivalents, marketable securities and restricted cash in seven financial institutions, although substantially all of the balance is within one institution. We perform periodic evaluations of the relative credit standing of the seven institutions. No assurances can be made that the third-party institutions will retain acceptable credit ratings or investment practices. Investment decisions of third parties and market conditions may adversely affect our cash balances and financial condition.
We Have Recorded Impairments of Goodwill and Intangible Assets and There Can be No Assurances that We Will Not Have to Record Additional Impairments in the Future
In 2009 and 2008, we recorded impairments of goodwill and intangible assets that totaled $22.6 million and $2.3 million, respectively. The recorded impairments were the primarily the result of a reduction in our revenue, cash flows and enterprise value. In addition, we reduced the carrying value of a long-term investment, in the amount of $0.6 million in 2010 and $1.5 million in 2009. We may have to record additional impairments in the future which may materially adversely affect our results of operations and financial condition.
We Face Intense Competition
Our services face intense competition from other providers of business, personal finance, investing and ratings content, including:
|
|
·
|
online services or Web sites focused on business, personal finance, or investing, such as The Wall Street Journal digital network, CNN Money, Reuters.com, Bloomberg.com and CNBC.com, as well as financial portals such as Yahoo! Finance, AOL Money & Finance and MSN Money;
|
|
|
·
|
publishers and distributors of traditional media focused on business, personal finance or investing, including print and radio, such as The Wall Street Journal and financial talk radio programs, and business television networks such as CNBC and the Fox Business Channel;
|
|
|
·
|
investment newsletter publishers; and
|
|
|
·
|
established ratings services, such as Standard & Poor’s, Morningstar and Lipper, with respect to our Ratings products, and rate database providers such as Informa, with respect to our RateWatch products.
|
Additionally, advances in technology have reduced the cost of production and online distribution of print, audio and video content, which has resulted in the proliferation of small, often self-published providers of free content, such as bloggers. We compete with these other publications and services for customers, including subscribers, readers and viewers of our video content, for advertising revenue, and for employees and contributors to our services. Our ability to compete successfully depends on many factors, including the quality, originality, timeliness, insightfulness and trustworthiness of our content and that of our competitors, the success of our recommendations and research, our ability to introduce products and services that keep pace with new investing trends, the ease of use of services developed either by us or our competitors and the effectiveness of our sales and marketing efforts.
Many of our competitors have longer operating histories, greater name recognition, larger customer bases and significantly greater financial, technical and marketing resources than we have. Increased competition could result in price reductions, reduced margins or loss of market share, any of which could materially adversely affect our business, results of operations and financial condition. Accordingly, we cannot guarantee that we will be able to compete effectively with our current or future competitors or that this competition will not significantly harm our business.
Risks Associated with Our Strategic Acquisitions Could Adversely Affect Our Business
We have completed several acquisitions within recent years, and we expect to make additional acquisitions and strategic investments in the future. Acquisitions involve numerous risks, including difficulties in the assimilation of the operations and services of the acquired companies as well as the diversion of management's attention from other business concerns. In addition, there may be expenses incurred in connection with the acquisition and subsequent assimilation of operations and services and the potential loss of key employees of the acquired company. There can be no assurance that our acquisitions will be successfully integrated into our operations. In addition, there can be no assurance that we will complete any future acquisitions or that acquisitions will contribute favorably to our operations and financial condition.
Although due diligence and detailed analysis were conducted before these acquisitions, there can be no assurance that these can fully expose all hidden problems that the acquired company may have. In addition, our valuations and analyses are based on numerous assumptions, and there can be no assurance that those assumptions will be proven correct or appropriate. Relevant facts and circumstances of our analyses could have changed over time, and new facts and circumstances may come to light as to render the previous assumptions and the valuations and analyses based thereon incorrect. Further, we may not necessarily be able to successfully integrate the acquired companies, may not be able to derive any synergy from the acquisitions and may not realize the benefits intended in such acquisitions.
System Failure or Interruption May Result in Reduced Traffic, Reduced Revenue and Harm to Our Reputation
Our ability to provide timely, updated information depends on the efficient and uninterrupted operation of our computer and communications hardware and software systems. Similarly, our ability to track, measure and report the delivery of advertisements on our Web sites depends on the efficient and uninterrupted operation of a third-party system. Our operations depend in part on the protection of our data systems and those of our third-party providers against damage from human error, natural disasters, fire, power loss, water damage, telecommunications failure, computer viruses, terrorist acts, vandalism, sabotage, and other adverse events. Although we utilize the services of third-party data-center hosts with both physical and procedural security systems and have put in place certain other disaster recovery measures, including offsite storage of backup data, these disaster recovery measures currently may not be comprehensive enough and there is no guarantee that our Internet access and other data operations will be uninterrupted, error-free or secure. Any system failure, including network, software or hardware failure, that causes an interruption in our service or a decrease in responsiveness of our Web sites could result in reduced traffic, reduced revenue and harm to our reputation, brand and relations with our advertisers and strategic partners. Our insurance policies may not adequately compensate us for such losses. In such event, our business, results of operations and financial condition could be materially adversely affected.
Our Ratings models, purchased from a third party, were written in legacy technologies that do not have robust backup or recovery provisions. The ongoing production of valid ratings data is based upon the successful continued migration of these legacy systems to more robust and current systems. The hardware platforms upon which these applications run have been migrated to more modern equipment within our multi-redundant hosting facilities; however, many of the core application code remains in production. Migration of such complex applications is time consuming, resource intensive and can pose considerable risk.
Difficulties in New Product Development Could Harm Our Business
In the past few years, we have introduced several new products and services, and expect to continue to do so. However, we may experience difficulties that could delay or prevent us from introducing new products and services in the future, or cause our costs to be higher than anticipated, which could materially adversely affect our business, results of operations and financial condition.
Failure to Establish and Maintain Successful Strategic Relationships with Other Companies Could Decrease our Subscriber and User Base
We rely in part on establishing and maintaining successful strategic relationships with other companies to attract and retain a portion of our current subscriber and reader base and to enhance public awareness of our brands. In particular, our relationships with Yahoo! Finance, MSN Money and CNN Money, which index our headlines and/or hosts our content including our video offerings, have been important components of our effort to enhance public awareness of our brands, which awareness we believe also is enhanced by the public appearances of James J. Cramer, in particular on his “Mad Money” television program telecast by CNBC. There is intense competition for relationships with these firms and for content placement on their Web sites and for distribution of our audio and video content, and we may have to pay significant fees, or be unable, to establish additional relationships with large, high-traffic partners or maintain existing relationships in the future. From time to time, we enter into agreements with advertisers that require us to exclusively feature these parties in sections of our Web sites. Existing and future exclusivity arrangements may prevent us from entering into other advertising or sponsorship arrangements or other strategic relationships. If we do not successfully establish and maintain our strategic relationships on commercially reasonable terms or if these relationships do not attract significant revenue, our business, results of operations and financial condition could be materially adversely affected.
Difficulties Associated With Our Brand Development May Harm Our Ability to Attract Subscribers to Our Paid Services and Users to Our Advertising-Supported Services
We believe that maintaining and growing awareness about our services is an important aspect of our efforts to continue to attract users. Our new services do not have widely recognized brands, and we will need to increase awareness of these brands among potential users. Our efforts to build brand awareness may not be cost effective or successful in reaching potential users, and some potential users may not be receptive to our marketing efforts or advertising campaigns. Accordingly, we can make no assurances that such efforts will be successful in raising awareness of our brands or in persuading potential users to subscribe to or use our services.
Failure to Maintain Our Reputation for Trustworthiness May Harm Our Business
Our brand is based upon the integrity of our editorial content. We are proud of the trust and reputation for quality we have developed in our 15 years and we seek to renew and deepen that trust continually. We require all of our writers, whether employees or outside contributors, to adhere to strict standards of integrity, including standards that are designed to prevent any actual or potential conflict of interest, and to comply with all applicable laws, including securities laws.The occurrence of events such as our misreporting a news story, the non-disclosure of a stock ownership position by one or more of our writers, or the manipulation of a security by one or more of our writers, or any other breach of our compliance policies, could harm our reputation for trustworthiness and reduce readership. In addition, in the event the reputation of any of our directors, officers or key contributors was harmed for any other reason, we could suffer as result of our association with the individual, and also could suffer if the quantity or value of future services we received from the individual was diminished. These events could materially adversely affect our business, results of operations and financial condition.
We May Face Liability for, or Incur Costs to Defend, Information Published in Our Services
We may be subject to claims for defamation, libel, copyright or trademark infringement, fraud or negligence, or based on other theories of liability, in each case relating to the articles, commentary, investment recommendations, ratings, or other information we publish in our services. These types of claims have been brought, sometimes successfully, against media companies in the past, and we presently are defending against two suits alleging libel, both of which suits we believe are without merit and in both of which we are vigorously defending ourselves. We could also be subject to claims based upon the content that is accessible from our Web sites through links to other Web sites. While we maintain insurance to provide coverage with respect to many such claims, our insurance may not adequately protect us against these claims.
We May Not Adequately Protect Our Own Intellectual Property and May Incur Costs to Defend Against, or Face Liability for, Intellectual Property Infringement Claims of Others
To protect our rights to our intellectual property, we rely on a combination of trademark and copyright law, trade secret protection, confidentiality agreements and other contractual arrangements with our employees, affiliates, customers, strategic partners and others. We have registered certain of our trademarks in the United States and we have pending U.S. applications for other trademarks. Additionally, we police Internet message boards and other Web sites for copyrighted content of ours that has been republished without our permission and we will aggressively pursue the poster, the site hosting the content and any Internet service provider in order to protect our copyright. To protect our intellectual property rights as well as protect against infringement claims in our relationships with business partners, we generally look to incorporate contractual provisions protecting our intellectual property and seeking indemnification for any third-party infringement claims. Some of our services incorporate licensed third-party technology. In these license agreements, the licensors have generally agreed to defend, indemnify and hold us harmless with respect to any claim by a third party that the licensed technology infringes any patent or other proprietary right.
The protective steps we have taken may be inadequate to deter misappropriation of our proprietary information. We may be unable to detect the unauthorized use of, or take appropriate steps to enforce, our intellectual property rights. Failure to adequately protect our intellectual property could harm our brand, devalue our proprietary content and affect our ability to compete effectively. In addition, other parties may assert infringement claims against us or claim that we have violated a patent or infringed a copyright, trademark or other proprietary right belonging to them, whether on our own or by virtue of our use of certain third-party technology. We cannot assure you that the steps we have taken will be adequate to protect us from infringement claims. Protecting our intellectual property rights, or defending against infringement claims, even if not meritorious, could result in the expenditure of significant financial and managerial resources on our part, which could materially adversely affect our business, results of operations and financial condition.
We Face Government Regulation and Legal Uncertainties
Internet Communications, Commerce and Privacy Regulation. The growth and development of the market for Internet commerce and communications has prompted both federal and state laws and regulations concerning the collection and use of personally identifiable information (including consumer credit and financial information under the Gramm-Leach-Bliley Act), consumer protection, the content of online publications, the taxation of online transactions and the transmission of unsolicited commercial email, popularly known as “spam.” More laws and regulations are under consideration by various governments, agencies and industry self-regulatory groups. Although our compliance with applicable federal and state laws, regulations and industry guidelines has not had a material adverse effect on us, new laws and regulations may be introduced and modifications to existing laws may be enacted that require us to make changes to our business practices. Although we believe that our practices are in compliance with applicable laws, regulations and policies, if we were required to defend our practices against investigations of state or federal agencies or if our practices were deemed to be violative of applicable laws, regulations or policies, we could be penalized and our activities enjoined. Any of the foregoing could increase the cost of conducting online activities, decrease demand for our services, lessen our ability to effectively market our services, or otherwise materially adversely affect our business, financial condition and results of operations.
Securities Industry Regulation. Our activities include, among other things, the offering of stand-alone services providing stock recommendations and analysis to subscribers. The securities industry in the United States is subject to extensive regulation under both federal and state laws. A failure to comply with regulations applicable to securities industry participants could materially and adversely affect our business, results of operations and financial condition.
New regulation, changes in existing regulation, or changes in the interpretation or enforcement of existing laws and rules could have a material adverse effect on our business, results of operations and financial condition.
Regulation of Sweepstakes and Promotions. Our activities have included and from time to time may include, conducting online sweepstakes and contests for clients. We use best efforts to comply with all sweepstakes, contest and bonding requirements as specified under various state laws. In the event, however, that we were later determined to have violated any applicable law or regulation, we could suffer a material adverse effect on our business, results of operations and financial condition.
Foreign Regulation. Although we do not actively seek customers and have no property outside the United States, regulatory entities of foreign governments could seek to exercise jurisdiction over our activities. If we were required to defend our practices against investigations of foreign regulatory agencies or if our practices were deemed to be violative of the laws, regulations or policies of such jurisdictions, we could be penalized and our activities enjoined. Any of the foregoing could materially adversely affect our business, financial condition and results of operations.
Any Failure of Our Internal Security Measures or Breach of Our Privacy Protections Could Cause Us to Lose Users and Subject Us to Liability
Users who subscribe to our paid subscription services are required to furnish certain personal information (including name, mailing address, phone number, email address and credit card information), which we use to administer our services. We also require users of some of our free services and features to provide us with some personal information during the membership registration process. Additionally, we rely on security and authentication technology licensed from third parties to perform real-time credit card authorization and verification, and at times rely on third parties, including technology consulting firms, to help protect our infrastructure from security threats. We may have to continue to expend capital and other resources on the hardware and software infrastructure that provides security for our processing, storage and transmission of personal information.
In this regard, our users depend on us to keep their personal information safe and private and not to disclose it to third parties or permit our security to be breached. However, advances in computer capabilities, new discoveries in the field of cryptography or other events or developments, including improper acts by third parties, may result in a compromise or breach of the security measures we use to protect the personal information of our users. If a party were to compromise or breach our information security measures or those of our agents, such party could misappropriate the personal information of our users, cause interruptions in our operations, expose us to significant liabilities and reporting obligations, damage our reputation and discourage potential users from registering to use our Web sites or other services, any of which could have a material adverse effect on our business, results of operations and financial condition.
We utilize various third parties to assist with various aspects of our business. Some of these partnerships require the exchange of user information. This is required because some features of our Web sites may be hosted by these third parties. While we take significant measures to guarantee the security of our customer data and require such third parties to comply with our privacy and security policies as well as be contractually bound to defend, indemnify and hold us harmless with respect to any claim by a thirdparty related to any breach of relevant privacy laws, we are still at risk if any of these third-party systems are breached or compromised and may in such event suffer a material adverse effect to business, results of operations and financial condition.
Control by Principal Stockholders, Officers and Directors Could Adversely Affect Our Stockholders, and the Terms of Our Series B Preferred Stock Include Significant Control Rights
Our officers, directors and greater-than-five-percent stockholders (and their affiliates), acting together, may have the ability to control our management and affairs, and substantially all matters submitted to stockholders for approval (including the election and removal of directors and any merger, consolidation or sale of all or substantially all of our assets). Some of these persons acting individually or together, even in the absence of control, may be able to exert a significant degree of influence over such matters. The interests of persons having this concentration of ownership may not always coincide with our interests or the interests of other stockholders. This concentration of ownership, for example, may have the effect of delaying, deferring or preventing a change in control of the Company, impeding a merger, consolidation, takeover or other business combination involving the Company or discouraging a potential acquirer from making a tender offer or otherwise attempting to obtain control of the Company, which in turn could materially adversely affect the market price of the Common Stock.
In November 2007, we issued to and sold to TCV VI, L.P. and TCV Member Fund, L.P., for an aggregate purchase price of approximately $55 million, a total of 5,500 shares of our Series B preferred stock, par value $0.01 per share (“Series B Preferred Stock”), which are convertible into an aggregate of 3,856,942 shares of our Common Stock, at a conversion price of $14.26 per share and warrants to purchase 1,157,083 shares of Common Stock at an exercise price of $15.69 per share. The holders of the Series B Preferred Stock have the right to vote on any matter submitted to a vote of the stockholders of the Company and are entitled to vote that number of votes equal to the aggregate number of shares of Common Stock issuable upon the conversion of such holders’ shares of Series B Preferred Stock. In addition, so long as 2,200 shares of Series B Preferred Stock remain outstanding, the holders of a majority of such shares will have the right to appoint one person to our board of directors.
So long as 30% of the shares of the currently-outstanding Series B Preferred Stock remain outstanding, the affirmative vote of the holders of a majority of such shares will be necessary to take any of the following actions: (i) authorize, create or issue any class or classes of our capital stock ranking senior to, or on a parity with (as to dividends or upon a liquidation event) the Series B Preferred Stock or any securities exercisable or exchangeable for, or convertible into, any now or hereafter authorized capital stock ranking senior to, or on a parity with (as to dividends or upon a liquidation event) the Series B Preferred Stock (including, without limitation, the issuance of any shares of Series B Preferred Stock (other than shares of Series B Preferred Stock issued as a stock dividend or in a stock split)); (ii) any increase or decrease in the authorized number of shares of Series B Preferred Stock; (iii) any amendment, waiver, alteration or repeal of our certificate of incorporation or bylaws in a way that adversely affects the rights, preferences or privileges of the Series B Preferred Stock; (iv) the payment of any dividends (other than dividends paid in our capital stock or any of our subsidiaries) in excess of $0.10 per share per annum on the Common Stock unless after the payment of such dividends we have unrestricted cash (net of all indebtedness for borrowed money, purchase money obligations, promissory notes or bonds) in an amount equal to at least two times the product obtained by multiplying the number of shares of Series B Preferred Stock outstanding at the time such dividend is paid by the liquidation preference; and (v) the purchase or redemption of: (A) any Common Stock (except for the purchase or redemption from employee, directors and consultants pursuant to agreements providing us with repurchase rights upon termination of their service with us) unless after such purchase or redemption we have unrestricted cash (net of all indebtedness for borrowed money, purchase money obligations, promissory notes or bonds) equal to at least two times the product obtained by multiplying the number of shares of Series B Preferred Stock outstanding at the time such dividend is paid by the liquidation preference; or (B) any class or series of now or hereafter of our authorized stock that ranks junior to (upon a liquidation event) the Series B Preferred Stock.
As a result of the foregoing, the requisite holders of the Series B Preferred Stock may be able to block the proposed approval of any of the above actions, which blockage may prevent us from achieving strategic or other goals dependent on such actions, including without limitation additional capital raising, certain dividend increases, and the redemption of outstanding Common Stock. All of the foregoing rights may limit our ability to take certain actions deemed in the interests of all of our stockholders but as to which the holders of the Series B Preferred Stock have control rights.
Our Staggered Board and Certain Other Provisions in Our Certificate of Incorporation, By-Laws or Delaware Law Could Prevent or Delay a Change of Control
Provisions of our restated certificate of incorporation and amended and restated bylaws and Delaware law – including without limitation the fact that we have a staggered board, with only approximately one-third of our directors standing for re-election each year – could make it more difficult for a third party to acquire the Company, even if doing so would be beneficial to our stockholders.
Our Revenue Could Be Adversely Affected if the Securities Markets Decline, are Stagnant or Experience Extreme Volatility
Our results of operations, particularly related to subscription revenue, are affected by certain economic factors, including the performance of the securities markets. While we believe investors are seeking more information related to the financial markets from trusted sources, the existence of adverse or stagnant securities markets conditions and lack of investor confidence could result in investors decreasing their interest in investor-related publications, which could adversely affect the subscription revenue we derive from our subscription based Web sites and newsletters.
The Utilization of Tax Operating Loss Carryforwards Depends Upon Future Income
We have net operating loss carryforwards of approximately $139 million as of December 31, 2010, available to offset future taxable income through 2030. Our ability to fully utilize these net operating loss carryforwards is dependent upon the generation of future taxable income before the expiration of the carryforward period attributable to these net operating losses.
We Had Material Weaknesses in Internal Controls at December 31, 2008 and December 31, 2009
We determined that we had material weaknesses in our internal control over financial reporting as of December 31, 2008 and as of December 31, 2009. While we remediated those material weaknesses, there can be no assurance that a material weakness will not arise in the future. As a result, current and potential stockholders could lose confidence in our financial reporting, which would harm our business and the trading price of our Common Stock.
Not applicable.
We do not own any real property and we lease all of our facilities. Our principal administrative, sales, marketing, and editorial facilities currently reside in a facility encompassing approximately 35,000 square feet of office space on one floor in an office building at 14 Wall Street in New York, New York. Bankers Financial Products Corporation (d/b/a RateWatch) occupies approximately 15,000 square feet of office space in Fort Atkinson, Wisconsin. We also remain responsible for a sublease of approximately 6,500 square feet of office space in an office building at 29 West 38th Street in New York, New York, which we sublease. Regional locations of certain of our operations include 2,500 square feet of office space in Boston, Massachusetts primarily related to editorial staff. We also lease small satellite office space for our West Coast bureau in Los Angeles, California and our Midwest bureau in Chicago, Illinois as well as TheStreet Ratings in Jupiter, Florida.
Our main technological infrastructure consists of proprietary content-management, subscription management, Ratings models, and e-commerce systems, which are hosted primarily at a facility of Equinix, Inc. in New Jersey. We have certain backup systems at a facility in Nebraska and RateWatch systems in Wisconsin.
As previously disclosed, in 2001, the Company, certain of its current or former officers and directors and certain underwriters were named in a securities class action related to the Company’s initial public offering (“IPO”). Similar suits were filed against approximately 300 other issuers and their underwriters, all of which are included in a single coordinated proceeding in the district court (the “IPO Litigations”). The complaints allege that the prospectus and the registration statement for the IPO failed to disclose that the underwriters allegedly solicited and received “excessive” commissions from investors and that some investors in the IPO allegedly agreed with the underwriters to buy additional shares in the aftermarket in order to inflate the price of the Company’s stock. The complaints seek unspecified damages, attorney and expert fees, and other unspecified litigation costs. In 2003, the district court granted the Company’s motion to dismiss the claims against it under Rule 10b-5 but motions to dismiss the claims under Section 11 of the Securities Act of 1933 were denied as to virtually all of the defendants in the consolidated cases, including the Company. In addition, some of the individual defendants in the IPO Litigations, including Mr. Cramer, signed a tolling agreement and were dismissed from the action without prejudice on October 9, 2002. In 2003, a proposed collective partial settlement of this litigation was structured between the plaintiffs, the issuer defendants in the consolidated actions, the issuer officers and directors named as defendants, and the issuers’ insurance companies. The court granted preliminary approval of the settlement in 2005 but in 2007 the settlement was terminated, in light of a ruling by the appellate court in related litigation in 2006 that reversed the trial court’s certification of classes in that related litigation. In 2009, another settlement was entered into and approved by the trial court. Under the settlement, the Company’s obligation of approximately $339,000 would be paid by the issuers’ insurance companies. The settlement has been appealed. There can be no assurance that the approval of the settlement will not be reversed on appeal and that the settlement will be implemented in its current form, or at all. Due to the inherent uncertainties of litigation, the ultimate outcome of the matter is uncertain.
As previously disclosed, we conducted a review of the accounting in our former Promotions.com subsidiary, which subsidiary we sold in December 2009. As a result of this review, in February 2010 we filed a Form 10-K/A for the year ended December 31, 2008 and a Form 10-Q/A for the quarter ended March 31, 2009, respectively, to restate and correct certain previously-reported financial information as well as filed Forms 10-Q for the quarters ended June 30, 2009 and September 30, 2009, respectively. The SEC commenced an investigation in March 2010 into the facts surrounding our restatement of previously issued financial statements and related matters. We are cooperating fully with the SEC. The investigation could result in the SEC seeking various penalties and relief including, without limitation, civil injunctive relief and/or civil monetary penalties or administrative relief. The nature of the relief or remedies the SEC may seek, if any, cannot be predicted at this time.
As previously disclosed, in April 2010, we and one of our reporters were named in a lawsuit captioned Generex Biotechnology Corporation v. Feuerstein et al. (N.Y. Supreme Court, County of New York, Index No. 10104433), in which plaintiff alleges that certain articles we published concerning plaintiff were libelous. In May 2010 we filed an answer denying all claims. We intend to vigorously defend ourselves in this matter and believe we have meritorious defenses. Due to the preliminary stage of this matter and the inherent uncertainties of litigation, the ultimate outcome of the matter is uncertain.
In December 2010, the Company was named as one of several defendants in a lawsuit captioned EIT Holdings LLC v. WebMD, LLC et al., (U.S.D.C., D. Del.), on the same day that plaintiff filed a substantially identical suit against a different group of defendants in a lawsuit captioned EIT Holdings LLC v. Yelp!, Inc. et al., (U.S.D.C., N. D. Cal.). The complaints allege that defendants infringe U.S. Patent No. 5,828,837, putatively owned plaintiff, related to a certain method of displaying information to an Internet-accessible device. In February 2011, by agreement of plaintiff and the Company, the Company was dismissed from the Delaware action without prejudice and named as a defendant in the California action. The Company intends to vigorously defend itself and believes it has meritorious defenses. Due to the early stage of this matter and the inherent uncertainties of litigation, the ultimate outcome of this matter is uncertain.
The Company is party to other legal proceedings arising in the ordinary course of business or otherwise, none of which other proceedings is deemed material.
|
Market for Registrant’s Common Equity, Related Stockholder Matters and Issuer Purchases of Equity Securities.
|
We have been a Nasdaq-listed company since May 11, 1999 and our Common Stock currently is quoted on the Nasdaq Global Market under the symbol TST. The following table sets forth, for the periods indicated, the high and low closing sales prices per share of the Common Stock as reported on the Nasdaq Global Market.
|
Low
|
High
|
|||||||
|
2009
|
||||||||
|
First quarter
|
$ | 1.70 | $ | 3.49 | ||||
|
Second quarter
|
$ | 1.85 | $ | 2.47 | ||||
|
Third quarter
|
$ | 1.94 | $ | 2.90 | ||||
|
Fourth quarter
|
$ | 2.12 | $ | 3.08 | ||||
|
2010
|
||||||||
|
First quarter
|
$ | 2.22 | $ | 3.76 | ||||
|
Second quarter
|
$ | 2.79 | $ | 3.93 | ||||
|
Third quarter
|
$ | 2.63 | $ | 3.15 | ||||
|
Fourth quarter
|
$ | 2.55 | $ | 3.14 | ||||
On March 9, 2011, the last reported sale price for our Common Stock was $3.29 per share.
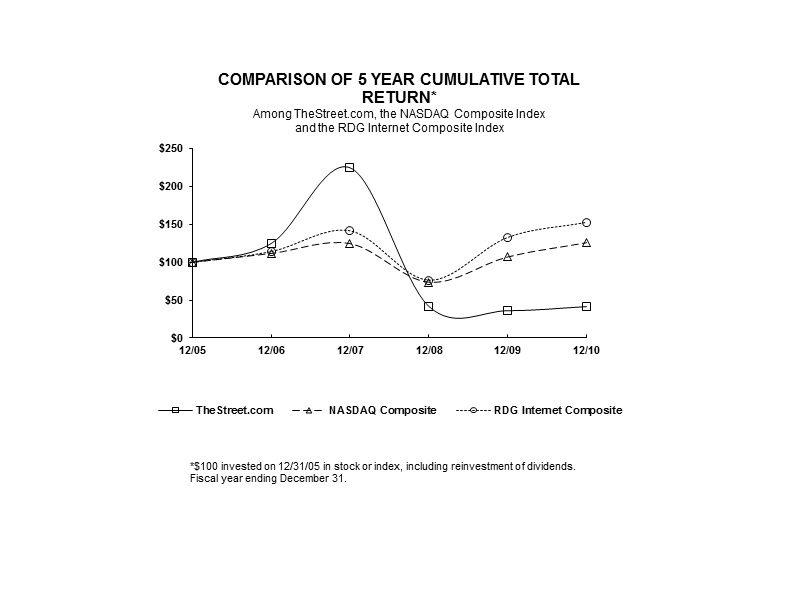
Set forth below is a graph comparing the cumulative total stockholder return on the Company’s Common Stock from December 31, 2005 through December 31, 2010 with the cumulative total return on the Nasdaq Composite Index and the Research Data Group (RDG) Internet Composite Index. The RDG Internet Composite Index is included as the Company believes that this index adequately represents its industry. The performance graph is based upon closing prices on December 31st of each year other than 2006, which is based on the closing price on December 29,2006, the last trading day before December 31, 2006. The comparison assumes $100 was invested on December 31, 2005 in the Company’s Common Stock and in each of the foregoing indices and assumes reinvestment of dividends. The closing price of our Common Stock on December 31, 2005 was $7.21.
|
December 31,
|
||||||||||||||||||||||||
|
2005
|
2006
|
2007
|
2008
|
2009
|
2010
|
|||||||||||||||||||
|
TheStreet.com
|
100.00 | 124.72 | 224.61 | 41.73 | 36.12 | 41.55 | ||||||||||||||||||
|
NASDAQ Composite
|
100.00 | 111.74 | 124.67 | 73.77 | 107.12 | 125.93 | ||||||||||||||||||
|
RDG Internet Composite
|
100.00 | 114.13 | 141.53 | 76.47 | 132.93 | 152.77 | ||||||||||||||||||
Holders
The number of holders of record of our Common Stock on March 9, 2011 was 243, which does not include beneficial owners of our Common Stock whose shares are held in the names of various dealers, clearing agencies, banks, brokers and other fiduciaries.
Dividends
During the years ended December 31, 2010 and December 31, 2009, the Company paid four quarterly cash dividends of $0.025 per share on its Common Stock and its Series B Preferred Stock on a converted common share basis. For the year ended December 31, 2010, dividends paid totaled approximately $3.7million, as compared to approximately $3.6 million for the year ended December 31, 2009. The Company’s Board of Directors reviews the dividend payment each quarter and there can be no assurance that we will continue to pay this cash dividend in the future.
Issuer Purchases of Equity Securities
The following table presents information related to repurchases of its Common Stock made by the Company during the three months ended December 31, 2010.
|
Period
|
(a)
Total Number of Shares(or Units)Purchased
|
(b)
Average Price Paid per Share (or Unit)
|
(c)
Total Number of Shares (or Units)Purchased as Part of Publicly Announced Plans or Programs
|
(d)
Maximum Number(or Approximate Dollar Value) of Shares (or Units) that May Yet Be Purchased Under the Plans or Programs*
|
|||||||||||||
|
October 1 - 31, 2010
|
—
|
$
|
—
|
—
|
$
|
2,678,878
|
|||||||||||
|
November 1 - 30, 2010
|
—
|
$
|
—
|
—
|
$
|
2,678,878
|
|||||||||||
|
December 1 - 31, 2010
|
—
|
$
|
—
|
—
|
$
|
2,678,878
|
|||||||||||
|
Total
|
—
|
$
|
—
|
—
|
$
|
2,678,878
|
|||||||||||
_____________
|
*
|
In December 2000, the Company’s Board of Directors authorized the repurchase of up to $10 million worth of the Company’s Common Stock, from time to time, in private purchases or in the open market. In February 2004, the Company’s Board approved the resumption of this program under new price and volume parameters, leaving unchanged the maximum amount available for repurchase under the program. The program does not have a specified expiration date and is subject to certain limitations. See “Risk Factors — Control by principal stockholders, officers and directors could adversely affect our stockholders, and the terms of our Series B preferred stock include significant control rights.”
|
The following selected financial data is qualified by reference to, and should be read in conjunction with, our audited consolidated financial statements and the notes to those statements and “Management’s Discussion and Analysis of Financial Condition and Results of Operations” appearing elsewhere herein. The selected statement of operations data presented below for the years ended December 31, 2010, 2009 and 2008, and the balance sheet data as of December 31, 2010 and 2009, are derived from our audited consolidated financial statements included elsewhere herein. The selected statement of operations data presented below for the years ended December 31, 2007 and 2006 and the balance sheet data as of December 31, 2008, 2007 and 2006 have been derived from our audited consolidated financial statements, which are not included herein.
|
For the Year Ended December 31,
|
||||||||||||||||
|
2010
|
2009
|
2008
|
2007
|
2006
|
||||||||||||
|
(In thousands, except per share data)
|
||||||||||||||||
|
Statement of Operations Data:
|
||||||||||||||||
|
Revenue:
|
||||||||||||||||
|
Premium services
|
$
|
38,598
|
$
|
37,989
|
$
|
41,186
|
$
|
38,421
|
$
|
35,442
|
||||||
|
Marketing services
|
18,588
|
22,251
|
29,662
|
26,160
|
15,447
|
|||||||||||
|
Total revenue
|
57,186
|
60,240
|
70,848
|
64,581
|
50,889
|
|||||||||||
|
Operating expense:
|
||||||||||||||||
|
Cost of services
|
25,557
|
29,100
|
31,985
|
25,491
|
18,450
|
|||||||||||
|
Sales and marketing
|
15,841
|
12,078
|
14,263
|
12,209
|
9,616
|
|||||||||||
|
General and administrative
|
18,053
|
18,916
|
17,521
|
12,215
|
10,674
|
|||||||||||
|
Asset impairments
|
555
|
24,137
|
2,326
|
—
|
—
|
|||||||||||
|
Depreciation and amortization
|
4,693
|
4,985
|
5,894
|
2,528
|
1,089
|
|||||||||||
|
Restructuring and other charges
|
—
|
3,461
|
—
|
—
|
—
|
|||||||||||
|
(Gain) loss on disposition of assets
|
(1,319
|
)
|
530
|
—
|
—
|
—
|
||||||||||
|
Total operating expense
|
63,380
|
93,207
|
71,989
|
52,443
|
39,829
|
|||||||||||
|
Operating (loss) income
|
(6,194
|
)
|
(32,967
|
)
|
(1,141
|
)
|
12,138
|
11,060
|
||||||||
|
Net interest income
|
846
|
950
|
1,574
|
2,476
|
2,037
|
|||||||||||
|
Gain on sales of marketable securities
|
—
|
295
|
121
|
—
|
—
|
|||||||||||
|
Other income
|
21
|
154
|
—
|
—
|
—
|
|||||||||||
|
(Loss) income from continuing operations before income taxes
|
(5,327
|
)
|
(31,568
|
)
|
554
|
14,614
|
13,097
|
|||||||||
|
(Provision) benefit for income taxes
|
—
|
(16,134
|
)
|
(2
|
)
|
15,694
|
(261
|
)
|
||||||||
|
(Loss) income from continuing operations
|
(5,327
|
)
|
(47,702
|
)
|
552
|
30,308
|
12,836
|
|||||||||
|
Discontinued operations: (*)
|
||||||||||||||||
|
(Loss) income on disposal of discontinued operations
|
(7
|
)
|
(15
|
)
|
(8
|
)
|
(13
|
)
|
32
|
|||||||
|
(Loss) income from discontinued operations
|
(7
|
)
|
(15
|
)
|
(8
|
)
|
(13
|
)
|
32
|
|||||||
|
Net (loss) income
|
(5,334
|
)
|
(47,717
|
)
|
544
|
30,295
|
12,868
|
|||||||||
|
Preferred stock deemed dividends
|
—
|
—
|
—
|
1,803
|
—
|
|||||||||||
|
Preferred stock cash dividends
|
386
|
386
|
386
|
96
|
—
|
|||||||||||
|
Preferred stock dividends
|
386
|
386
|
386
|
1,899
|
—
|
|||||||||||
|
Net (loss) income attributable to common stockholders
|
$
|
(5,720
|
)
|
$
|
(48,103
|
)
|
$
|
158
|
$
|
28,396
|
$
|
12,868
|
||||
|
Cash dividends paid on common shares
|
$
|
3,350
|
$
|
3,201
|
$
|
3,093
|
$
|
2,932
|
$
|
2,737
|
||||||
|
Basic net (loss) income per share:
|
||||||||||||||||
|
(Loss) income from continuing operations
|
$
|
(0.17
|
)
|
$
|
(1.56
|
)
|
$
|
0.02
|
$
|
1.05
|
$
|
0.48
|
||||
|
(Loss) income on disposal of discontinued operations
|
(0.00
|
)
|
(0.00
|
)
|
(0.00
|
)
|
(0.00
|
)
|
0.00
|
|||||||
|
(Loss) income from discontinued operations
|
(0.00
|
)
|
(0.00
|
)
|
(0.00
|
)
|
(0.00
|
)
|
0.00
|
|||||||
|
Net (loss) income
|
(0.17
|
)
|
(1.56
|
)
|
0.02
|
1.05
|
0.48
|
|||||||||
|
Preferred stock dividends
|
(0.01
|
)
|
(0.01
|
)
|
(0.01
|
)
|
(0.07
|
)
|
—
|
|||||||
|
Net (loss) income attributable to common stockholders
|
$
|
(0.18
|
)
|
$
|
(1.57
|
)
|
$
|
0.01
|
$
|
0.98
|
$
|
0.48
|
||||
|
Diluted net (loss) income per share:
|
||||||||||||||||
|
(Loss) income from continuing operations
|
$
|
(0.17
|
)
|
$
|
(1.56
|
)
|
$
|
0.02
|
$
|
1.03
|
$
|
0.47
|
||||
|
(Loss) income from disposal of discontinued operations
|
(0.00
|
)
|
(0.00
|
)
|
(0.00
|
)
|
(0.00
|
)
|
0.00
|
|||||||
|
(Loss) income from discontinued operations
|
(0.00
|
)
|
(0.00
|
)
|
(0.00
|
)
|
(0.00
|
)
|
0.00
|
|||||||
|
Net (loss) income
|
(0.17
|
)
|
(1.56
|
)
|
0.02
|
1.03
|
0.47
|
|||||||||
|
Preferred stock dividends
|
(0.01
|
)
|
(0.01
|
)
|
(0.01
|
)
|
(0.06
|
)
|
—
|
|||||||
|
Net (loss) income attributable to common stockholders
|
$
|
(0.18
|
)
|
$
|
(1.57
|
)
|
$
|
0.01
|
$
|
0.97
|
$
|
0.47
|
||||
|
Weighted average basic shares outstanding
|
31,593
|
30,586
|
30,427
|
28,830
|
27,014
|
|||||||||||
|
Weighted average diluted shares outstanding
|
31,593
|
30,586
|
30,835
|
29,388
|
27,546
|
|||||||||||
|
December 31,
|
||||||||||||||||||||
|
2010
|
2009
|
2008
|
2007
|
2006
|
||||||||||||||||
|
(In thousands)
|
||||||||||||||||||||
|
Balance Sheet Data:
|
||||||||||||||||||||
|
Cash, cash equivalents, restricted cash, short and long term marketable securities
|
$ | 78,555 | $ | 82,573 | $ | 76,379 | $ | 79,748 | $ | 46,555 | ||||||||||
|
Working capital
|
27,352 | 46,063 | 69,211 | 72,437 | 33,797 | |||||||||||||||
|
Total assets
|
129,542 | 133,714 | 171,687 | 176,515 | 64,570 | |||||||||||||||
|
Long-term obligations, less current maturities
|
3,236 | 1,519 | 80 | 90 | — | |||||||||||||||
|
Total stockholders’ equity
|
97,993 | 104,474 | 151,615 | 151,706 | 44,191 | |||||||||||||||
____________
|
(*)
|
In June 2005, the Company committed to a plan to discontinue the operations of its wholly owned subsidiary, Independent Research Group LLC, which operated the Company’s securities research and brokerage segment. Accordingly, the operating results relating to this segment have been segregated from continuing operations and reported as discontinued operations on a separate line item on the consolidated statements of operations.
|
Please refer to the Special Note Regarding Forward-Looking Statements appearing in Part I, Item 1 of this Report.
The following discussion and analysis should be read in conjunction with the Company’s audited consolidated financial statements and notes thereto.
Overview
TheStreet.com, Inc. together with its wholly owned subsidiaries (“we”, “us” or the “Company”), is a digital financial media company. Our goal is to be the primary independent online-only source of reliable and actionable investing ideas, news and analysis, markets and rate data and analytical tools for a large audience of active self-directed investors, as well as to assist advertisers desiring to connect with our affluent audience. We distribute our fee-based premium content and advertising-supported content through a network of proprietary electronic services including: Web sites, blogs, widgets, email services, mobile devices, podcasts and online video channels. We also syndicate our content for distribution by financial institutions and other media organizations.
We pioneered online publishing of business and investment information through our creation of TheStreet, which launched in 1996 as a paid subscription financial news and commentary Web site. Today, TheStreet is our flagship advertising-supported property, a leading site in its category and a major source of subscribers to a variety of our premium subscription products. Our subscription products, which include paid Web sites such as RealMoney, RealMoneySilver, Options Profits, Actions Alerts PLUS and Stocks Under $10, are designed to address the needs of investors with various areas of interest and increasing levels of financial sophistication. The majority of our subscription revenue derives from annual subscriptions, although some products also are offered on a monthly subscription basis.
In addition to our consumer-focused subscription products, our premium services business also includes information services revenue from our RateWatch business, which maintains a constantly-updated database of financial rate and fee data collected from more than 80,000 financial institutions (at the branch level), including certificate of deposit, money market account, savings account, checking account, home mortgage, home equity loan, credit card and auto loan rates. This information is sold to banks and financial institutions on a subscription basis, in the form of standard and custom reports that outline the competitive landscape for our clients, and also serves as the foundation for the data available on BankingMyWay, a free advertising-supported Web site that enables consumers to search for the most competitive local and national rates from the RateWatch data. Our premium services revenue also includes revenue generated from syndication and licensing of certain of our content, including data from TheStreet Ratings (“Ratings”), which tracks the risk-adjusted performance of more than 16,000 mutual funds and exchange-traded funds (ETFs) and more than 5,000 stocks. We intend to expand our licensing arrangements to make some of our proprietary content available in channels we do not presently serve. Premium services contributed 67% of our total revenue in 2010, as compared to 63% in 2009 and 58% in 2008.
Our advertising-supported properties, which include TheStreet, Stockpickr, MainStreet and BankingMyWay, attract one of the largest and most affluent audiences of any digital publisher in our content vertical. We believe our flagship site, TheStreet, with its enviable track record as a leading and distinctive digital voice in the financial category since the early days of the consumer Internet, is regarded as a must-buy for our core online brokerage advertisers, and a highly effective means for other financial services companies and non-endemic advertisers to communicate with our active, affluent audience. We believe we are able to command pricing for our advertising inventory that is strong relative to most Web sites. We sell banner, tile and sponsorship advertising exclusively through our experienced internal sales force and also generate revenue from contextual and search-based advertising provided by third party technology providers.
We generate advertising revenue from our content through the sale of the following types of advertising placements:
|
|
·
|
banner, tile, contextual, performance-based and interactive advertisement and sponsorship placements in our advertising-supported Web sites, as well as on select paid subscription sites;
|
|
|
·
|
advertisement placements in our free email newsletters and stand-alone emails sent on behalf of our advertisers to our registered users; and
|
|
|
·
|
advertisements in TheStreet TV, TheStreet services for mobile and tablet devices, RSS feeds, blogs and in our podcasts.
|
We also generated interactive marketing services revenue from our former Promotions.com subsidiary, which we acquired in August 2007 and sold in December 2009. Promotions.com implemented online and mobile interactive promotions – including sweepstakes, instant win games and customer loyalty programs – for some of the world’s largest brands. Including Promotions.com, advertising and marketing services contributed 33% of our total revenue in 2010, as compared to 37% in 2009 and 42% in 2008.
Critical Accounting Estimates
General
The Company’s discussion and analysis of its financial condition and results of operations are based upon its consolidated financial statements, which have been prepared in accordance with U.S. generally accepted accounting principles (“GAAP”). The preparation of these financial statements requires management to make estimates and assumptions that affect the reported amounts of assets and liabilities and disclosure of contingent assets and liabilities at the date of the financial statements and the reported amounts of revenue and expense during the reporting period. Actual results could differ from those estimates. Estimates and assumptions are reviewed periodically and the effects of revisions are reflected in the consolidated financial statements in the period they are deemed to be necessary. Significant estimates made in the accompanying consolidated financial statements include, but are not limited to, the following:
Revenue Recognition
We generate our revenue primarily from premium and marketing services.
Premium services include subscription fees paid by customers for access to particular services for the term of the subscription as well as syndication and licensing revenue. Subscriptions are generally charged to customers’ credit cards or are directly billed to corporate subscribers. These are generally billed in advance on a monthly or annual basis. We calculate net subscription revenue by deducting from gross revenue an estimate of potential refunds from cancelled subscriptions as well as chargebacks of disputed credit card charges. Net subscription revenue is recognized ratably over the subscription periods. Deferred revenue relates to subscription fees for which amounts have been collected but for which revenue has not been recognized because services have not yet been provided.
Subscription revenue is subject to estimation and variability due to the fact that, in the normal course of business, subscribers may for various reasons contact us or their credit card companies to request a refund or other adjustment for a previously purchased subscription. With respect to most of our annual subscription products, we offer the ability to receive a refund during the first 30 days but none thereafter. Accordingly, we maintain a provision for estimated future revenue reductions resulting from expected refunds and chargebacks related to subscriptions for which revenue was recognized in a prior period. The calculation of this provision is based upon historical trends and is reevaluated each quarter. The provision was not material for the three years ended December 31, 2010.
Marketing services include advertising revenue, which is derived from the sale of Internet sponsorship arrangements and from the delivery of banner, tile, contextual, performance-based and interactive advertisement and sponsorship placements in our advertising-supported Web sites, and is recognized as the advertising is displayed, provided that collection of the resulting receivable is reasonably assured.
Marketing services also include revenue associated with our former subsidiary, Promotions.com, which we sold in December 2009 – See Note 3 in Notes to Consolidated Financial Statements (Acquisitions and Divestitures). Promotions.com generated revenue from Website design, promotion management and hosting services. We typically entered into arrangements on a fixed fee basis for these services. Revenue generated from Website design services were recognized upon acceptance from the customer or on a straight-line basis over the hosting period if we performed Web site design services and hosted the software. Revenue from promotions management services was recognized straight-line over the promotion period as the promotion was designed to only operate on Promotions.com proprietary platform. Hosting services were recognized straight-line over the hosting period.
During the period that the Company owned Promotions.com, revenue for contracts with multiple elements was allocated based on the element’s fair value. Fair value is determined based on the prices charged when each element is sold separately. Elements qualify for separation when the services have value on a stand-alone basis and fair value of the undelivered elements exits. Determining fair value and identifying separate elements required judgment; generally, fair value was not readily identifiable as we did not sell those elements individually at consistent pricing.
Capitalized Software and Web Site Development Costs
We expense all costs incurred in the preliminary project stage for software developed for internal use and capitalize all external direct costs of materials and services consumed in developing or obtaining internal-use computer software in accordance with Financial Accounting Standards Board (“FASB”) Accounting Standards Codification (“ASC”) 350, Intangibles – Goodwill and Other (“ASC 350”). In addition, for employees who are directly associated with and who devote time to internal-use computer software projects, to the extent of the time spent directly on the project, we capitalize payroll and payroll-related costs of such employees incurred once the development has reached the applications development stage. For the years ended December 31, 2010, 2009 and 2008, we capitalized software development costs totaling $0.8 million, $0.5 million, and $0.6 million, respectively. All costs incurred for upgrades, maintenance and enhancements that do not result in additional functionality are expensed.
We also account for our Web site development costs under ASC 350, which provides guidance on the accounting for the costs of development of company Web sites, dividing the Web site development costs into five stages: (1) the planning stage, during which the business and/or project plan is formulated and functionalities, necessary hardware and technology are determined, (2) the Web site application and infrastructure development stage, which involves acquiring or developing hardware and software to operate the Web site, (3) the graphics development stage, during which the initial graphics and layout of each page are designed and coded, (4) the content development stage, during which the information to be presented on the Web site, which may be either textual or graphical in nature, is developed, and (5) the operating stage, during which training, administration, maintenance and other costs to operate the existing Web site are incurred. The costs incurred in the Web site application and infrastructure stage, the graphics development stage and the content development stage are capitalized; all other costs are expensed as incurred. Amortization of capitalized costs will not commence until the project is completed and placed into service. For the years ended December 31, 2010, 2009 and 2008, we capitalized Web site development costs totaling $0.6 million, $0.3 million and $2.1 million, respectively.
Capitalized software and Web site development costs are amortized using the straight-line method over the estimated useful life of the software or Web site. Total amortization expense was $1.6 million, $1.2 million and $0.9 million, for the years ended December 31, 2010, 2009 and 2008, respectively.
Property and Equipment
Property and equipment are stated at cost, net of accumulated depreciation and amortization. Property and equipment are depreciated on a straight-line basis over the estimated useful lives of the assets. The estimated useful life of computer equipment, computer software and telephone equipment is three years; of furniture and fixtures is five years; and of capitalized software and Web site development costs is variable based upon the applicable project. During the year ended December 31, 2010, completed capitalized software and Web site development projects were deemed to have a three to five year useful life. Leasehold improvements are amortized on a straight-line basis over the shorter of the respective lease term or the estimated useful life of the asset. If the useful lives of the assets differ materially from the estimates contained herein, additional costs could be incurred, which could have an adverse impact on our expenses.
Goodwill and Other Intangible Assets
Goodwill represents the excess of purchase price and related acquisition costs over the value assigned to the net tangible and identifiable intangible assets of businesses acquired. Under the provisions of ASC 350, goodwill is required to be tested for impairment on an annual basis and between annual tests whenever indications of impairment exist. Impairment exists when the carrying amount of goodwill exceeds its implied fair value, resulting in an impairment charge for this excess.
We evaluate goodwill for impairment using a two-step impairment test approach at the Company level. In the first step, the fair value of the Company is compared to its book value, including goodwill. If the fair value of the Company is less than the book value, a second step is performed that compares the implied fair value of the Company's goodwill to the book value of the goodwill. The fair value for the goodwill is determined based on the difference between the fair value of the Company and the net fair values of identifiable assets and liabilities. If the fair value of the goodwill is less than the book value, the difference is recognized as impairment. We test for goodwill impairment at the enterprise level as the Company is considered to operate as a single reporting unit.
We evaluate the remaining useful lives of intangible assets each year to determine whether events or circumstances continue to support their useful life. There have been no changes in useful lives of intangible assets for each period presented.
Based upon annual impairment tests performed as of September 30, 2010 and 2009, no impairment was indicated as the Company’s fair value exceeded its book value by approximately 38% and 34%, respectively.
In connection with the disposition of our former Promotions.com subsidiary and acquisition of Kikucall, Inc. in December 2009, and the disposition of certain assets of TheStreet Ratings business (those pertaining to banking and insurance ratings) in May 2010 (see Note 3 to Consolidated Financial Statements (Acquisitions and Divestitures)), we concluded that these events warranted an additional impairment test which resulted in no additional impairment as the Company’s fair value exceeded its book value by approximately 21% in December 2009 and by 45% in May 2010.
In the first quarter of 2009, we performed an interim impairment test of our goodwill and intangible assets due to certain impairment indicators, including a continued decline in both advertising and subscription revenue resulting from the challenging economic environment and a reduction in our enterprise value. As a result of this test, we recorded an impairment charge of $22.6 million, as follows:
|
|
·
|
The total Company fair value was estimated using a combination of a discounted cash flow model (present value of future cash flows) and our business enterprise value based upon the fair value of our outstanding common and preferred shares. The fair value of our goodwill is the residual fair value after allocating the Company’s total fair value to its other assets, net of liabilities. This analysis resulted in an impairment of our goodwill of approximately $19.8 million. The review also revealed an additional impairment to our intangible assets related to certain customer relationships and noncompete agreements of approximately $2.8 million. See Note 3 to Consolidated Financial Statements (Acquisitions and Divestitures) for further information related to the individual impairments recorded.
|
Based upon an annual impairment test as of September 30, 2008, we recorded an impairment charge totaling $0.5 million representing the value remaining from the trade name of Smartportfolio, which we had acquired in December 2000, as the last product carrying the Smartportfolio name was discontinued. Additionally, we experienced a decline in anticipated revenue associated with our Promotions.com client relationships and noncompete agreements. Using an income approach based upon estimated future cash flows, we determined that the carrying value of the client relationships and noncompete agreements exceeded its fair value at December 31, 2008, and therefore we recorded an impairment charge of $1.8 million.
Investments
We believe that conservative investment policies are appropriate and we are not motivated to strive for aggressive spreads above Treasury rates. Preservation of capital is of foremost concern, and by restricting investments to investment grade securities of relatively short maturities, we believe that our capital will be largely protected from severe economic conditions or drastic shifts in interest rates. A high degree of diversification adds further controls over capital risk.
Financial instruments that subject us to concentrations of credit risk consist primarily of cash, cash equivalents and restricted cash. We maintain all of our cash, cash equivalents and restricted cash in seven domestic financial institutions, although substantially all of the balance is within one institution. We perform periodic evaluations of the relative credit standing of the seven institutions.
Marketable securities consist of cash reserves in liquid short-term U.S. Treasuries, government agencies, certificates of deposit (insured up to FDIC limits), investment grade corporate and municipal bonds, and corporate floating rate notes, totaling approximately $56.8 million. The maximum maturity for any investment is three years. We also hold investments in two municipal auction rate securities (“ARS”) issued by the District of Columbia with a par value of $1.9 million. The ARS pay interest in accordance with their terms at each respective auction date, typically every 35 days, and mature in the year 2038.
During 2008, the Company made an investment in Debtfolio, Inc., doing business as Geezeo, an online financial management solutions provider for banks and credit unions. The investment totaled $1.9 million for an 18.5% ownership stake. Additionally, the Company incurred approximately $0.2 million of legal fees in connection with this investment. During the first quarter of 2009, the carrying value of the Company’s investment was written down to fair value based upon an estimate of the market value of the Company’s equity in light of Debtfolio’s efforts to raise capital at the time from third parties. The impairment charge approximated $1.5 million. The Company performed an additional impairment test as of December 31, 2009 and no additional impairment in value was noted. During the three months ended June 30, 2010, the Company determined it necessary to record a second impairment charge, writing the value of the investment to zero. This was deemed necessary by management based upon their consideration of Debtfolio, Inc.’s continued negative cash flow from operations, current financial position and lack of current liquidity.
See Note 6 to Consolidated Financial Statements (Fair Value Measurements)for additional information about the investment of the Company's cash.
Credit Risks of Customers and Business Concentrations
Our customers are primarily concentrated in the United States and we carry accounts receivable balances. We perform ongoing credit evaluations, generally do not require collateral, and establish an allowance for doubtful accounts based upon factors surrounding the credit risk of customers, historical trends and other information. To date, actual losses have been within management’s expectations.
For the years ended December 31, 2010, 2009 and 2008, no individual client accounted for 10% or more of consolidated revenue. As of December 31, 2010, one client accounted for more than10% of our gross accounts receivable balance. As of December 31, 2009, two clients accounted for more than 10% each of our gross accounts receivable balance. As of December 31, 2008, no client accounted for 10% or more of our gross accounts receivable balance.
Stock-Based Compensation
We account for stock-based compensation under ASC 718-10,Share Based Payment Transactions (“ASC 718-10”). This requires that the cost resulting from all share-based payment transactions be recognized in the financial statements based upon estimated fair values.
Stock-based compensation expense recognized for the years ended December 31, 2010, 2009 and 2008 was approximately $2.3 million,$2.7 million and $3.5 million, respectively. As of December 31, 2010, there was approximately $4.4 million of unrecognized stock-based compensation expense remaining to be recognized over a weighted-average period of 3.03 years.
We estimate the fair value of share-based payment awards on the date of grant. The value of stock options granted to employees and directors is estimated using an option-pricing model. The value of each restricted stock unit under our1998 Stock Incentive Plan (the “1998 Plan”) is equal to the closing price per share of our Common Stock on the trading day immediately prior to the date of grant. The value of each restricted stock unit under our 2007 Performance Incentive Plan (the “2007 Plan”) is equal to the closing price per share of our Common Stock on the date of grant. The value of the portion of the award that is ultimately expected to vest is recognized as expense over the requisite service periods.
Stock-based compensation expense recognized in our consolidated statements of operations for the years ended December 31, 2010, 2009 and 2008 includes compensation expense for all share-based payment awards based upon the estimated grant date fair value. We recognize compensation expense for share-based payment awards on a straight-line basis over the requisite service period of the award. As stock-based compensation expense recognized in the years ended December 31, 2010, 2009 and 2008 is based upon awards ultimately expected to vest, it has been reduced for estimated forfeitures. We estimate forfeitures at the time of grant which are revised, if necessary, in subsequent periods if actual forfeitures differ from those estimates.
We estimate the value of employee stock options on the date of grant using the Black-Scholes option-pricing model. This determination is affected by our stock price as well as assumptions regarding expected volatility, risk-free interest rate, and expected dividends. The amount of equity-based compensation expense recorded each period is net of estimated forfeitures. The weighted-average fair value of employee stock options granted during the year ended December 31, 2010 was $1.15, using the Black-Scholes model with the following weighted-average assumptions. No employee stock options were granted during the year ended December 31, 2009. Because option-pricing models require the use of subjective assumptions, changes in these assumptions can materially affect the fair value of the options. The assumptions presented in the table below represent the weighted-average value of the applicable assumption used to value stock options at their grant date. In determining the volatility assumption, we used a historical analysis of the volatility of our share price for the preceding three and one half years, which is equal to the expected option lives. The expected option lives, which represent the period of time that options granted are expected to be outstanding, were estimated based upon the “simplified” method for “plain-vanilla” options. The risk-free interest rate assumption is based upon observed interest rates appropriate for the term of our employee stock options. The dividend yield assumption is based on the history and expectation of future dividend payouts.
|
Expected option lives
|
3.5 years
|
|
Expected volatility
|
56.97%
|
|
Risk-free interest rate
|
1.67%
|
|
Expected dividends
|
3.69%
|
The impact of stock-based compensation expense has been significant to reported results of operations and per share amounts (see Note 1 to Consolidated Financial Statements (Organization, Nature of Business and Summary of Operations and Significant Accounting Policies)). Because option-pricing models require the use of subjective assumptions, changes in these assumptions can materially affect the fair value of the options. For each 1% increase in the risk-free interest rate used in the Black-Scholes option-pricing model, the resulting estimated impact to our total operating expense for the year ended December 31, 2010 would have increased by approximately $11,000. For each 10% increase in the expected volatility used in the Black-Scholes option-pricing model, the resulting estimated impact to the Company’s total operating expense for the year ended December 31, 2010 would have increased by approximately $63,000. Because options are expensed over three to five years from the date of grant, the foregoing estimated increases include potential expense for options granted during the prior years. In calculating the amount of each variable that is included in the Black-Scholes options-pricing model (i.e., option exercise price, stock price, option term, risk free interest rate, annual dividend rate, and volatility), the weighted average of such variable for all grants issued in a given year was used.
If factors change and we employ different assumptions in future periods, the compensation expense that we record may differ significantly from what we have recorded in the current period.
Income Taxes
We account for our income taxes in accordance with ASC 740-10, Income Taxes (“ASC 740-10”). Under ASC 740-10, deferred tax assets and liabilities are recognized for the future tax consequences attributable to differences between the financial statement carrying amounts of existing assets and liabilities and their tax bases. ASC 740-10 also requires that deferred tax assets be reduced by a valuation allowance if it is more likely than not that some or all of the deferred tax assets will not be realized based on all available positive and negative evidence.
ASC 740-10 also prescribes a recognition threshold and a measurement attribute for the financial statement recognition and measurement of tax positions taken or expected to be taken in a tax return. For those benefits to be recognized, a tax position must be more likely than not to be sustained upon examination by taxing authorities. Differences between tax positions taken or expected to be taken in a tax return and the benefit recognized and measured pursuant to the interpretation are referred to as “unrecognized benefits.” A liability is recognized for an unrecognized tax benefit because it represents an enterprise’s potential future obligation to the taxing authority for a tax position that was not recognized as a result of applying the provisions of ASC 740-10. As of December 31, 2010 and 2009, no liability for unrecognized tax benefits was required to be recorded.
Deferred tax assets pertaining to windfall tax benefits on exercise of share awards and the corresponding credit to additional paid-in capital are recorded if the related tax deduction reduces tax payable. The Company has elected the “with-and-without approach” regarding ordering of windfall tax benefits to determine whether the windfall tax benefit did reduce taxes payable in the current year. Under this approach, the windfall tax benefits would be recognized in additional paid-in capital only if an incremental tax benefit is realized after considering all other tax benefits presently available to us.
Legal Contingencies
As previously disclosed, in 2001, the Company, certain of its current or former officers and directors and certain underwriters were named in a securities class action related to the Company’s initial public offering (“IPO”). Similar suits were filed against approximately 300 other issuers and their underwriters, all of which are included in a single coordinated proceeding in the district court (the “IPO Litigations”). The complaints allege that the prospectus and the registration statement for the IPO failed to disclose that the underwriters allegedly solicited and received “excessive” commissions from investors and that some investors in the IPO allegedly agreed with the underwriters to buy additional shares in the aftermarket in order to inflate the price of the Company’s stock. The complaints seek unspecified damages, attorney and expert fees, and other unspecified litigation costs. In 2003, the district court granted the Company’s motion to dismiss the claims against it under Rule 10b-5 but motions to dismiss the claims under Section 11 of the Securities Act of 1933 were denied as to virtually all of the defendants in the consolidated cases, including the Company. In addition, some of the individual defendants in the IPO Litigations, including Mr. Cramer, signed a tolling agreement and were dismissed from the action without prejudice on October 9, 2002. In 2003, a proposed collective partial settlement of this litigation was structured between the plaintiffs, the issuer defendants in the consolidated actions, the issuer officers and directors named as defendants, and the issuers’ insurance companies. The court granted preliminary approval of the settlement in 2005 but in 2007 the settlement was terminated, in light of a ruling by the appellate court in related litigation in 2006 that reversed the trial court’s certification of classes in that related litigation. In 2009, another settlement was entered into and approved by the trial court. Under the settlement, the Company’s obligation of approximately $339,000 would be paid by the issuers’ insurance companies. The settlement has been appealed. There can be no assurance that the approval of the settlement will not be reversed on appeal and that the settlement will be implemented in its current form, or at all. Due to the inherent uncertainties of litigation, the ultimate outcome of the matter is uncertain.
As previously disclosed, we conducted a review of the accounting in our former Promotions.com subsidiary, which subsidiary we sold in December 2009. As a result of this review, in February 2010 we filed a Form 10-K/A for the year ended December 31, 2008 and a Form 10-Q/A for the quarter ended March 31, 2009, respectively, to restate and correct certain previously-reported financial information as well as filed Forms 10-Q for the quarters ended June 30, 2009 and September 30, 2009, respectively. The SEC commenced an investigation in March 2010 into the facts surrounding our restatement of previously issued financial statements and related matters. We are cooperating fully with the SEC. The investigation could result in the SEC seeking various penalties and relief including, without limitation, civil injunctive relief and/or civil monetary penalties or administrative relief. The nature of the relief or remedies the SEC may seek, if any, cannot be predicted at this time.
As previously disclosed, in April 2010, we and one of our reporters were named in a lawsuit captioned Generex Biotechnology Corporation v. Feuerstein et al. (N.Y. Supreme Court, County of New York, Index No. 10104433), in which plaintiff alleges that certain articles we published concerning plaintiff were libelous. In May 2010 we filed an answer denying all claims. We intend to vigorously defend ourselves in this matter and believe we have meritorious defenses. Due to the preliminary stage of this matter and the inherent uncertainties of litigation, the ultimate outcome of the matter is uncertain.
In December 2010, the Company was named as one of several defendants in a lawsuit captioned EIT Holdings LLC v. WebMD, LLC et al., (U.S.D.C., D. Del.), on the same day that plaintiff filed a substantially identical suit against a different group of defendants in a lawsuit captioned EIT Holdings LLC v. Yelp!, Inc. et al., (U.S.D.C., N. D. Cal.). The complaints allege that defendants infringe U.S. Patent No. 5,828,837, putatively owned plaintiff, related to a certain method of displaying information to an Internet-accessible device. In February 2011, by agreement of plaintiff and the Company, the Company was dismissed from the Delaware action without prejudice and named as a defendant in the California action. The Company intends to vigorously defend itself and believes it has meritorious defenses. Due to the early stage of this matter and the inherent uncertainties of litigation, the ultimate outcome of this matter is uncertain.
We are party to other legal proceedings arising in the ordinary course of business or otherwise, none of which other proceedings is deemed material.
Results of Operations
Comparison of Fiscal Years Ended December 31, 2010 and 2009
Revenue
|
For the Year Ended December 31,
|
||||||||||||||||||||
|
Revenue
|
2010
|
Percent of
Total
Revenue
|
2009
|
Percent of
Total
Revenue
|
Percent
Change
|
|||||||||||||||
|
Premium services
|
$ | 38,597,877 | 67 | % | $ | 37,988,579 | 63 | % | -2 | % | ||||||||||
|
Marketing services
|
18,588,502 | 33 | % | 22,251,432 | 37 | % | -16 | % | ||||||||||||
|
Total Revenue
|
$ | 57,186,379 | 100 | % | $ | 60,240,011 | 100 | % | -5 | % | ||||||||||
Premium services. Premium service revenue is comprised of subscriptions, licenses and fees for access to investment information and rate services. Revenue is recognized ratably over the contract period.
Premium services revenue for the year ended December 31, 2010 increased by 2% when compared to the year ended December 31, 2009. The increase is primarily attributable to an increase in revenue from subscriptions to our equity investment information and RateWatch products, offset in part by a decrease in revenue from our TheStreet Ratings products.
The increase in revenue from our subscription products of 5% is primarily the result of a 6% increase in the weighted-average number of subscriptions during the year ended December 31, 2010 as compared to the prior year period, partially offset by a 1% decrease in the average revenue recognized per subscription during the year ended December 31, 2010 when compared to the year ended December 31, 2009. The increase in the weighted-average number of subscriptions during the year ended December 31, 2010 as compared to the prior year period is primarily the result of increased subscriber acquisition and renewal efforts. The decrease in the average revenue recognized per subscription during the period is primarily a result of lower average selling prices for a number of our subscription products.
The decline in revenue from our TheStreet Ratings products totaled 64% and was primarily related to the expiration of a requirement imposed by the global research settlement previously arranged by the office of the New York State Attorney General with several major Wall Street brokerage firms which required them to provide their clients with independent investment analysis. During the period of time that the settlement mandated distribution of independent research, we generated revenue from certain brokerage firms as a result of the settlement. Since the expiration of the settlement period in July 2009, we have experienced a significant decline in such revenues, and revenue for the year ended December 31, 2010 declined by approximately $1.2 million when compared to the year ended December 31, 2009. Additionally, the sale of certain assets of TheStreet Ratings business in May 2010 reduced the revenue of the business for the year ended December 31, 2010 by approximately $0.7 million as compared to the prior year. See Note 3 in Notes to Consolidated Financial Statements(Acquisitions and Divestitures).
Marketing services. During the year ended December 31, 2010, marketing services revenue was comprised of fees charged for the placement of advertising and sponsorships within our services, including $0.6 million in barter revenue. During the year ended December 31, 2009, marketing services revenue also included interactive marketing work performed by our former Promotions.com subsidiary, which was sold in December 2009.
|
For the Year Ended December 31,
|
||||||||||||
|
2010
|
2009
|
Percent
Change
|
||||||||||
|
Marketing services:
|
||||||||||||
|
Advertising and sponsorships
|
$ | 18,588,502 | $ | 17,637,343 | 5 | % | ||||||
|
Interactive marketing services (Promotions.com)
|
- | 4,614,089 | -100 | % | ||||||||
|
Total
|
$ | 18,588,502 | $ | 22,251,432 | -16 | % | ||||||
Marketing services revenue for the year ended December 31, 2010 decreased by 16% when compared to the year ended December 31, 2009. The decline in marketing services revenue was primarily the result of the sale of our former Promotions.com subsidiary in December 2009, partially offset by a 5% increase in advertising revenue. The increased advertising revenue resulted primarily from higher demand from new advertisers, partially offset by reduced demand from existing advertisers whose campaigns had run their course.
Operating Expense
|
For the Year Ended December 31,
|
||||||||||||||||||||
|
Operating Expense
|
2010
|
Percent of
Total
Revenue
|
2009
|
Percent of
Total
Revenue
|
Percent
Change
|
|||||||||||||||
|
Cost of Services
|
$ | 25,557,162 | 45 | % | $ | 29,100,204 | 48 | % | -12 | % | ||||||||||
|
Sales and marketing
|
15,841,470 | 28 | % | 12,077,546 | 20 | % | 31 | % | ||||||||||||
|
General and administrative
|
18,052,633 | 32 | % | 18,916,456 | 31 | % | -5 | % | ||||||||||||
|
Depreciation and amortization
|
4,692,520 | 8 | % | 4,985,297 | 8 | % | -6 | % | ||||||||||||
|
Asset impairments
|
555,000 | 1 | % | 24,137,069 | 40 | % | -98 | % | ||||||||||||
|
Restructuring and other charges
|
- | N/A | 3,460,914 | 6 | % | -100 | % | |||||||||||||
|
(Gain) loss on disposition of assets
|
(1,318,607 | ) | -2 | % | 529,708 | 1 | % | N/A | ||||||||||||
|
Total operating expenses
|
$ | 63,380,178 | $ | 93,207,194 | -32 | % | ||||||||||||||
Cost of services. Cost of services expense includes compensation, benefits, outside contributor costs related to the creation of our content, licensed data and the technology required to publish our content.
Cost of services expense decreased by approximately $3.5 million, or 12%, over the periods. The decrease was largely the result of the sale of our former Promotions.com subsidiary, which accounted for $4.1 million of expense in the year ended December 31, 2009. Other savings were the result of lower stock-based and cash incentive compensation, data related services, hosting and internet charges, and fulfillment fees, the aggregate sum of which totaled approximately $1.6 million. These savings were partially offset by higher compensation and related expenses due to a 4% increase in headcount, increased payments to nonemployee content providers, fewer salaries capitalized for software and Web site development projects, and higher consulting fees, the aggregate sum of which totaled approximately $2.1 million. As a percentage of revenue, cost of services expense decreased to 45% in the year ended December 31, 2010, from 48% in the prior year.
Sales and marketing. Sales and marketing expense consists primarily of advertising and promotion, promotional materials, credit card processing fees, and compensation expense for the direct sales force, marketing services, and customer service departments.
Sales and marketing expense increased by approximately $3.8 million, or 31%, over the periods. The increase was primarily the result of an investment in the sales and marketing of our premium subscription based products, including a 28% increase in headcount as well as higher advertising and promotion costs (including $0.5 million of barter advertising), the aggregate sum of which totaled approximately $4.8 million. These cost increases were partially offset by the absence of costs associated with our former Promotions.com subsidiary, which was sold in December 2009, totaling approximately $0.8 million. As a percentage of revenue, sales and marketing expense increased to 28% in the year ended December 31, 2010, from 20% in the prior year.
General and administrative. General and administrative expense consists primarily of compensation for general management, finance and administrative personnel, occupancy costs, professional fees, insurance, and other office expenses.
General and administrative expense decreased by approximately $0.9 million, or 5%, over the periods. The decrease was largely the result of the sale of our former Promotions.com subsidiary, which accounted for $2.0 million of expense in the year ended December 31, 2009. Other savings were the result of reduced costs associated with a review of certain accounting matters in our former Promotions.com subsidiary, and lower bad debt expenses, the aggregate sum of which totaled approximately $1.0 million. These savings were partially offset by higher compensation and related expenses due to a 4% increase in headcount, as well as increased recruiting, training, occupancy costs and professional fees, the aggregate sum of which totaled approximately$2.0 million. Although the dollar amount of general and administrative expense decreased over the periods, general and administrative expense as a percentage of revenue increased to 32% in the year ended December 31, 2010 as compared to 31% in the prior year, in light of the decline in our revenue.
Depreciation and amortization. Depreciation and amortization expense decreased by approximately $0.3 million, or 6%, over the periods. The decrease is largely attributable to reduced intangible asset amortization resulting from the sale of our former Promotions.com subsidiary in December 2009, the sale of certain assets of TheStreet Ratings business in May 2010 and from impairment charges recorded as of March 31, 2009 (see Note 3 in Notes to Consolidated Financial Statements (Acquisitions and Divestitures),and asset impairments below), partially offset by increased amortization expense resulting from a reduction to the estimated useful life of certain past capitalized Web site development projects. Although the dollar amount of depreciation and amortization expense decreased over the periods, depreciation and amortization expense as a percentage of revenue remained flat at 8%for each of the years ended December 31, 2010 and 2009, in light of the decline in our revenue.
Asset impairments. During the three months ended June 30, 2010, the Company recorded an impairment charge to its long term investment of approximately $0.6 million based upon management’s consideration of Debtfolio, Inc.’s continued negative cash flow from operations, current financial position and lack of current liquidity.
In the first quarter of 2009, the Company performed an interim impairment test of its goodwill, intangible assets and a long-term investment due to certain impairment indicators, including a continued decline in both advertising and subscription revenue resulting from the challenging economic environment and a reduction in the Company’s enterprise value. As a result of this test, the Company recorded an impairment charge of $24.1 million, as follows:
|
|
·
|
The total Company fair value was estimated using a combination of a discounted cash flow model (present value of future cash flows) and our business enterprise value based upon the fair value of our outstanding common and preferred shares. The fair value of our goodwill is the residual fair value after allocating the Company’s total fair value to its other assets, net of liabilities. This analysis resulted in an impairment of our goodwill of approximately $19.8 million. The review also revealed an additional impairment to our intangible assets related to certain customer relationships and noncompete agreements of approximately $2.8 million.
|
|
|
·
|
The carrying value of our long-term investment was written down to fair value based upon the most current estimate of the market value of our equity stake in Debtfolio, Inc, which was determined based upon current equity raising efforts by Debtfolio, Inc. with third-parties. The impairment approximated $1.5 million.
|
Restructuring and other charges. In March 2009, the Company announced and implemented a reorganization plan, including an approximate 8% reduction in its workforce, to align resources with strategic business objectives. Additionally, effective March 21, 2009, the Company’s then Chief Executive Officer tendered his resignation, effective May 8, 2009, the Company’s then Chief Financial Officer tendered his resignation, and in December 2009 we sold our Promotions.com subsidiary and entered into negotiations to sublease certain office space maintained by Promotions.com. As a result of these activities, we incurred restructuring and other charges from continuing operations of approximately$3.5 million during the year ended December 31, 2009. Included in this charge were severance and other payroll related expenses, totaling approximately $1.9 million, $0.8 million related to the sublease of office space previously occupied by our former Promotions.com subsidiary, $0.6 million of professional fees, and $0.2 million related to the write-off of certain assets.
(Gain) loss on disposition of assets. On May 4, 2010, the Company sold certain assets of TheStreet Ratings business (those pertaining to banking and insurance ratings) resulting in a gain of approximately $1.3 million.
On December 18, 2009, the Company sold all of its membership interest in its Promotions.com subsidiary resulting in a loss of approximately $0.5 million.
Net Interest Income
|
For the Year Ended December 31,
|
||||||||||||
|
2010
|
2009
|
Percent
Change
|
||||||||||
|
Net interest income
|
$ | 846,157 | $ | 949,727 | -11 | % | ||||||
The decrease in net interest income is primarily the result of lower interest rates on bank deposits combined with reduced cash balances.
Gain on Sales of Marketable Securities
|
For the Year Ended December 31,
|
||||||||||||
|
2010
|
2009
|
Percent
Change
|
||||||||||
|
Gain on sales from marketable securities
|
$ | - | $ | 295,430 | -100 | % | ||||||
During the year ended December 31, 2009, we sold several of our corporate floating rate notes prior to their maturity date realizing gains on each sale, which gains totaled $0.3 million.
Provision for Income Taxes
|
For the Year Ended December 31,
|
||||||||||||
|
2010
|
2009
|
Percent
Change
|
||||||||||
|
Provision for income taxes
|
$ | - | $ | 16,133,964 | -100 | % | ||||||
We account for our income taxes in accordance with ASC 740-10, Accounting for Income Taxes (“ASC 740-10”). Under ASC 740-10, deferred tax assets and liabilities are recognized for the future tax consequences attributable to differences between the financial statement carrying amounts of existing assets and liabilities and their tax bases. ASC 740-10 also requires that deferred tax assets be reduced by a valuation allowance if it is more likely than not that some or all of the deferred tax assets will not be realized based on all available positive and negative evidence.
As of December 31, 2010 and 2009, respectively, we had approximately $139 million and $133 million of federal and state net operating loss carryforwards and had previously recognized a deferred tax asset for a portion of such net operating losses in the amount of $16.1 million. During the three months ended March 31, 2009, we recorded a full valuation allowance against all of our net deferred tax assets as management concluded that it was more likely than not that we would not realize the benefit of this portion of our deferred tax assets through taxable income to be generated in future years. The decision to record this valuation allowance was based on a projected loss for 2009, the resulting expected cumulative pre-tax loss for the three years ended December 31, 2009, the inability to carryback the net operating losses, limited future reversals of existing temporary differences and the limited availability of tax planning strategies. As of December 31, 2010, we continue to maintain a full valuation allowance against our deferred tax assets.
We expect to continue to provide a full valuation allowance until, or unless, we can sustain a level of profitability that demonstrates our ability to utilize these assets.
In accordance with Section 382 of the Internal Revenue Code, the ability to utilize our net operating loss carryforwards may be limited in the event of a change in ownership. The ultimate realization of net operating loss carryforwards is dependent upon the generation of future taxable income during the periods following an ownership change. As such, a portion of the existing net operating loss carryforwards may be subject to limitation.
Net Loss
Net loss for the year ended December 31, 2010 totaled $5.3 million, or $0.17 per basic and diluted share, compared to net loss totaling$47.7 million, or $1.56 per basic and diluted share, for the year ended December 31, 2009.
Comparison of Fiscal Years Ended December 31, 2009 and 2008
Net Revenue
|
For the Year Ended December 31,
|
||||||||||||||||||||
|
Revenue
|
2009
|
Percent of
Total
Revenue
|
2008
|
Percent of
Total
Revenue
|
Percent
Change
|
|||||||||||||||
|
Premium Services
|
$ | 37,988,579 | 63 | % | $ | 41,185,988 | 58 | % | -8 | % | ||||||||||
|
Marketing Services
|
22,251,432 | 37 | % | 29,662,045 | 42 | % | -25 | % | ||||||||||||
|
Total revenue
|
$ | 60,240,011 | 100 | % | $ | 70,848,033 | 100 | % | -15 | % | ||||||||||
Premium services.
Premium services revenue for the year ended December 31, 2009 decreased by 8% when compared to the year ended December 31, 2008. The decrease is primarily attributable to a 10% decrease in revenue from our equity investment information products and a 24% decrease in revenue from our Ratings products, offset in part by an 8% increase in revenue from our RateWatch products.
The decline in revenue from our equity investment information products is primarily the result of a decline in the weighted-average number of subscribers during the year ended December 31, 2009 as compared to the year ended December 31, 2008 as new and renewal subscriptions did not keep pace with nonrenewals on average. Our renewal rates declined slightly during fiscal 2009 as compared to the prior year period and our ability to attract new subscribers was negatively impacted, in our opinion, by the continued period of uncertainty in the stock market during 2009. We believe that a period of prolonged decline in the stock market reduces the size of the potential market for subscribers as more investors turn away from the stock market in their search for investment growth and preservation of principal. We noted that the major stock market indexes bottomed during the first quarter of 2009, and while our equity investment information services bookings showed year-over-year declines in each the first two quarters of 2009, those bookings showed low double digit increases in each of the last two quarters of 2009.
The decline in revenue from our Ratings products was primarily related to the end of the global research settlement previously arranged by the office of the New York State Attorney General with several major Wall Street brokerage firms which required them to provide their clients with independent investment analysis. During the period of time that the settlement mandated distribution of independent research, we generated revenue from certain brokerage firms as a result of the settlement. The settlement period ended in July 2009 and thus contributed only seven months of revenue during the year ended December 31, 2009, as compared to twelve months of revenue during the prior year. Settlement revenue for the year ended December31, 2009 was approximately $1.3 million as compared to approximately $2.2 million for the year ended December 31, 2008.
Marketing services.
|
For the Year Ended December 31,
|
||||||||||||
|
2009
|
2008
|
Percent
Change
|
||||||||||
|
Marketing Services
|
||||||||||||
|
Advertising
|
$ | 17,637,343 | $ | 23,126,532 | -24 | % | ||||||
|
Interactive marketing services (Promotions.com)
|
4,614,089 | 6,535,513 | -29 | % | ||||||||
|
Total
|
$ | 22,251,432 | $ | 29,662,045 | -25 | % | ||||||
Marketing services revenue for the year ended December 31, 2009, decreased by 25% when compared to the year ended December 31, 2008, attributable to a 29% decrease in interactive marketing services revenue and a 24% decrease in advertising revenue. Interactive marketing services revenue was generated by the operation of our Promotions.com subsidiary, which we sold in December 2009. We believe that our marketing services businesses were impacted by a poor macro-economic environment, which caused our clients to reduce their overall marketing spending during 2009 as compared to the prior year.
Operating Expense
|
For the Year Ended December 31,
|
||||||||||||||||||||
|
Operating Expense
|
2009
|
Percent of
Total
Revenue
|
2008
|
Percent of
Total
Revenue
|
Percent
Change
|
|||||||||||||||
|
Cost of Services
|
$ | 29,100,204 | 48 | % | $ | 31,984,778 | 45 | % | -9 | % | ||||||||||
|
Sales and marketing
|
12,077,546 | 20 | % | 14,263,199 | 20 | % | -15 | % | ||||||||||||
|
General and administrative
|
18,916,456 | 31 | % | 17,521,238 | 25 | % | 8 | % | ||||||||||||
|
Asset impairments
|
24,137,069 | 40 | % | 2,325,481 | 3 | % | 938 | % | ||||||||||||
|
Depreciation and amortization
|
4,985,297 | 8 | % | 5,894,186 | 8 | % | -15 | % | ||||||||||||
|
Restructuring and other charges
|
3,460,914 | 6 | % | - | N/A | N/A | ||||||||||||||
|
Loss on disposition of assets
|
529,708 | 1 | % | - | N/A | N/A | ||||||||||||||
|
Total operating expenses
|
$ | 93,207,194 | $ | 71,988,882 | 29 | % | ||||||||||||||
Cost of services. Cost of services expense decreased by approximately $2.9 million, or 9%, over the periods. The decrease was largely the result of lower compensation and related costs totaling approximately $1.9 million resulting from lower salary and temporary help expense of approximately $3.3 million due to a reduction of approximately 17% in the average headcount in this expense category, partially offset by higher levels of incentive compensation accruals and noncash compensation totaling approximately $1.4 million. The year over year savings were also the result of reduced costs in hosting and internet fees, fulfillment, recruiting, data and employee travel and entertainment expenses, the sum of which totaled approximately $0.9 million. Although the dollar amount of cost of services expense decreased over the periods, cost of services expense as a percentage of revenue increased to 48% for the year ended December 31, 2009, as compared to 45% the year ended December 31, 2008, as our cost cutting initiatives did not completely offset the decline in revenue.
Sales and marketing. Sales and marketing expense decreased by approximately $2.2 million, or 15%, over the periods. The decrease was largely the result of reduced advertising and promotion expenditures of approximately $1.8 million, together with lower compensation and related costs totaling approximately $0.3 million resulting primarily from reduced commission payments, noncash stock compensation expenses and salaries due to lower sales and a reduction of approximately 3% in the average headcount in this expense category. Additional savings were the result of lower public relations costs, and employee travel and entertainment expenses, the sum of which was approximately $0.2 million. These savings were partially offset by increased consulting fees totaling approximately $0.3 million. Although the dollar amount of sales and marketing expense decreased over the periods, sales and marketing expense as a percentage of revenue remained flat at 20% for each of the years ended December 31, 2009 and 2008, in light of the decline in our revenue.
General and administrative. General and administrative expense increased by approximately $1.4 million, or 8%, over the periods. The increase was primarily the result of one-time costs related to a review of the recording of certain revenue in a non-core business, Promotions.com, and professional fees associated with the sale of Promotions.com and the acquisition of Kikucall, Inc., the sum of which totaled approximately $2.8 million, together with increased consulting fees totaling approximately $0.5 million. These increased costs were partially offset by lower professional fees, occupancy costs, bad debt expense, insurance, employee travel and entertainment expenses, and recruiting fees, the sum of which totaled approximately $1.7 million. Additional savings of approximately $0.1 million were achieved through reduced compensation and related costs resulting primarily from lower noncash compensation and salary expense related to a reduction of approximately 11% in the average headcount within this expense category, partially offset by increased levels of incentive compensation. As a percentage of revenue, general and administrative expense increased to 31% in the year ended December 31, 2009, from 25% in the prior year.
Depreciation and amortization. Depreciation and amortization expense decreased by approximately $0.9 million, or 15%, over the periods. The decrease is largely attributable to reduced amortization expense resulting from the impairment charges recorded during the three months ended March 31, 2009. Although the dollar amount of depreciation and amortization expense decreased over the periods, depreciation and amortization expense as a percentage of revenue remained flat at 8% for each of the years ended December 31, 2009 and 2008, in light of the decline in our revenue.
Asset impairments. In the first quarter of 2009, we performed an interim impairment test of its goodwill, intangible assets and a long-term investment due to certain impairment indicators, including a continued decline in both advertising and subscription revenue resulting from the challenging economic environment and a reduction in the Company’s enterprise value. As a result of this test, the Company recorded an impairment charge of $24.1 million, as follows:
|
|
·
|
The total Company fair value was estimated using a combination of a discounted cash flow model (present value of future cash flows) and our business enterprise value based upon the fair value of our outstanding common and preferred shares. The fair value of our goodwill is the residual fair value after allocating the Company’s total fair value to its other assets, net of liabilities. This analysis resulted in an impairment of our goodwill of approximately $19.8 million. The review also revealed an additional impairment to our intangible assets related to certain customer relationships and noncompete agreements of approximately $2.8 million.
|
|
|
·
|
The carrying value of our long-term investment was written down to fair value based upon the most current estimate of the market value of our equity stake in Debtfolio, Inc, which was determined based upon current equity raising efforts by Debtfolio, Inc. with third-parties. The impairment approximated $1.5 million.
|
Restructuring and other charges. In March 2009, we announced and implemented a reorganization plan, including an approximate 8% reduction in our workforce, to align our resources with our strategic business objectives. Additionally, effective March 21, 2009, our then Chief Executive Officer tendered his resignation, effective May 8, 2009, our then Chief Financial Officer tendered his resignation, and in December 2009, we sold our Promotions.com subsidiary and entered into negotiations to sublease certain office space maintained by Promotions.com. As a result of these activities, we incurred restructuring and other charges from continuing operations of approximately$3.5 million during the year ended December 31, 2009. Included in this charge were severance and other payroll related expenses, totaling approximately $1.9 million, $0.8 million related to the sublease of office space previously occupied by our former Promotions.com subsidiary, $0.6 million of professional fees, and $0.2 million related to the write-off of certain assets.
Loss on disposition of assets. On December 18, 2009, the Company sold all of its membership interest in its Promotions.com subsidiary resulting in a loss of approximately $0.5 million.
Net Interest Income
|
For the Year Ended December 31,
|
||||||||||||
|
2009
|
2008
|
Percent
Change
|
||||||||||
|
Net interest income
|
$ | 949,727 | $ | 1,573,752 | -40 | % | ||||||
Net interest income decreased to $0.9 million in the year ended December 31, 2009, as compared to $1.6 million in the prior year. The decrease in net interest income is primarily the result of lower interest rates we could obtain in the year ended December 31, 2009 as compared to the prior year.
Gain on Sales of Marketable Securities
|
For the Year Ended December 31,
|
||||||||||||
|
2009
|
2008
|
Percent
Change
|
||||||||||
|
Gain on sales of marketable securities
|
$ | 295,430 | $ | 120,937 | 144 | % | ||||||
During the year ended December 31, 2009, we sold several of our corporate floating rate notes prior to their maturity date realizing gains on each sale, which gains totaled $0.3 million. In November 2008, we sold a U.S. Treasury Bill that bore interest at the rate of 1.78% per annum and had a maturity date of August 27, 2009, realizing a $0.1 million gain on the sale.
Provision for Income Taxes
|
For the Year Ended December 31,
|
||||||||
|
2009
|
2008
|
|||||||
|
Provision for income taxes
|
$ | 16,133,964 | $ | 2,040 | ||||
We account for our income taxes in accordance with ASC 740-10. Under ASC 740-10, deferred tax assets and liabilities are recognized for the future tax consequences attributable to differences between the financial statement carrying amounts of existing assets and liabilities and their tax bases. ASC 740-10 also requires that deferred tax assets be reduced by a valuation allowance if it is more likely than not that some or all of the deferred tax assets will not be realized based on all available positive and negative evidence.
As of December 31, 2009 and 2008, respectively, we had approximately $133 million and $125 million of federal and state net operating loss carryforwards. We had recognized a deferred tax asset for a portion of such net operating loss carryforwards in the amount of $16.1 million as of December 31, 2008, which reflected the maintenance of a valuation allowance against the majority of the gross deferred tax asset at that date. During the three months ended March 31, 2009, we recorded a valuation allowance against these deferred tax assets as management concluded that it was more likely than not that we would not realize the benefit of this portion of our deferred tax assets by generating sufficient taxable income in future years. The decision to record this valuation allowance was based on management evaluating all positive and negative evidence. The significant negative evidence included a projected loss for the year ended December 31, 2009, an expected cumulative pre-tax loss for the three years ended December 31, 2009, the inability to carryback the net operating losses, limited future reversals of existing temporary differences and the limited availability of tax planning strategies. We expect to continue to provide a full valuation allowance until, or unless, we can sustain a level of profitability that demonstrates our ability to utilize these assets.
In accordance with Section 382 of the Internal Revenue Code, the ability to utilize our net operating loss carryforwards may be limited in the event of a change in ownership. The ultimate realization of net operating loss carryforwards is dependent upon the generation of future taxable income during the periods following an ownership change. As such, a portion of the existing net operating loss carryforwards may be subject to limitation.
Net (Loss) Income
Net loss for the year ended December 31, 2009 totaled $47.7 million, or $(1.56) per basic and diluted share, compared to net income totaling $0.5 million, or $0.02 per basic and diluted share, for the year ended December 31, 2008.
Liquidity and Capital Resources
We generally have invested in money market funds and other short-term, investment grade instruments that are highly liquid and of high-quality, with the intent that such funds are available for sale for operating purposes. As of December 31, 2010, our cash, cash equivalents, marketable securities, and restricted cash amounted to $78.6 million, representing 61% of total assets. Our cash and cash equivalents primarily consisted of money market funds and checking accounts. Our marketable securities consisted of approximately $56.8 million of liquid short-term U.S. Treasuries, government agencies, certificates of deposit (insured up to FDIC limits), investment grade corporate and municipal bonds and corporate floating rate notes, with a maximum maturity of three years, and two auction rate securities issued by the District of Columbia with a par value of $1.9 million. Our total cash-related position is as follows:
|
December 31, 2010
|
December 31, 2009
|
|||
|
Cash and cash equivalents
|
$20,089,660
|
$60,542,494
|
||
|
Current and noncurrent marketable securities
|
56,805,373
|
20,328,087
|
||
|
Current and noncurrent restricted cash
|
1,660,370
|
1,702,079
|
||
|
Total cash and cash equivalents, current and noncurrent marketable securities and current and noncurrent restricted cash
|
$78,555,403
|
$82,572,660
|
Financial instruments that subject us to concentrations of credit risk consist primarily of cash, cash equivalents and restricted cash. We maintain all of our cash, cash equivalents and restricted cash in seven domestic financial institutions, although substantially all of the balance is within one institution, and perform periodic evaluations of the relative credit standing of these institutions.
Cash generated from operations was sufficient to cover our expenses during the year ended December 31, 2010. Net cash provided by operating activities totaled $3.4 million and $14.2 million for the years ended December 31, 2010 and 2009, respectively. The decrease in net cash provided by operating activities is primarily related to the following:
|
|
·
|
a smaller increase in accrued expenses in the year ended December 31, 2010, as compared to the year ended December 31, 2009, primarily related to our incentive compensation, restructuring and advertising accruals;
|
|
|
·
|
a reduction in the level of accounts receivable collected during the year ended December 31, 2010, as compared to the year ended December 31, 2009, the result of a large collection effort that took place in the prior year period;
|
|
|
·
|
a decrease in the growth of deferred revenue in the year ended December 31, 2010, as compared to the year ended December 31, 2009; and
|
|
|
·
|
a smaller increase in accounts payable in the year ended December 31, 2010, as compared to the year ended December 31, 2009, primarily related to the timing of invoice payments.
|
These changes in net cash provided by operating activities were partially offset by a decrease in income from continuing operations, partially offset by increased noncash expenses.
Net cash used in investing activities of $40.1 million for the year ended December 31, 2010 was primarily the result of $36.5 million net purchase of marketable securities and $6.7 million of capital expenditures, partially offset by $3.1 million proceeds received from the disposition of assets. Capital expenditures include $3.5 million related to the renovation of the Company’s corporate headquarters.
Net cash used in financing activities of $3.8 million for the year ended December 31, 2010 primarily consisted of cash dividends paid and the purchase of treasury stock by retaining shares issuable upon the vesting of restricted stock units in connection with the minimum tax withholding requirements.
We have a total of $1.7 million of cash that serves as collateral for an outstanding letter of credit, and which cash is therefore restricted. The letter of credit serves as a security deposit for our office space in New York City.
We believe that our current cash and cash equivalents will be sufficient to meet our anticipated cash needs for at least the next 12 months. We are committed to cash expenditures in an aggregate amount of approximately $1.1 million through December 31, 2011, in respect of the contractual obligations set forth below under “Commitments and Contingencies.” Additionally, our Board of Directors declared four quarterly cash dividends in the amount of $0.025 per share of Common Stock and preferred stock (on a common share equivalent basis) during year ended December 31, 2010, which resulted in cash expenditures of approximately $3.7 million. Our Board of Directors reviews the dividend payment each quarter and there can be no assurance that we will continue to pay this cash dividend in the future.
As of December 31, 2010 and 2009, respectively, we had approximately $139 million and $133 million of federal and state net operating loss carryforwards. We had recognized a deferred tax asset for a portion of such net operating loss carryforwards in the amount of $16.1 million as of December 31, 2008. During the three months ended March 31, 2009, we recorded a valuation allowance against these deferred tax assets as management concluded that it was more likely than not that we would not realize the benefit of this portion of our deferred tax assets by generating sufficient taxable income in future years. The decision to record this valuation allowance was based on management evaluating all positive and negative evidence. The significant negative evidence included a projected loss for the year ended December 31, 2009, an expected cumulative pre-tax loss for the three years ended December 31, 2009, the inability to carryback the net operating losses, limited future reversals of existing temporary differences and the limited availability of tax planning strategies. We expect to continue to provide a full valuation allowance until, or unless, we can sustain a level of profitability that demonstrates our ability to utilize these assets.
In accordance with Section 382 of the Internal Revenue Code, the ability to utilize our net operating loss carryforwards may be limited in the event of a change in ownership. The ultimate realization of net operating loss carryforwards is dependent upon the generation of future taxable income during the periods following an ownership change. As such, a portion of the existing net operating loss carryforwards may be subject to limitation.
Treasury Stock
In December 2000, our Board of Directors authorized the repurchase of up to $10 million worth of our Common Stock, from time to time, in private purchases or in the open market. In February 2004, our Board of Directors approved the resumption of the stock repurchase program (the “Program”) under new price and volume parameters, leaving unchanged the maximum amount available for repurchase under the program. However, so long as at least 30% of the shares of the currently-outstanding Series B Preferred Stock remain outstanding, the affirmative vote of the holders of a majority of the outstanding shares of Series B Preferred Stock, voting separately as a single class, is necessary in order for us to be able to repurchase our Common Stock (except for the purchase or redemption from employee, directors and consultants pursuant to agreements providing us with repurchase rights upon termination of their service with us), unless after such purchase we have unrestricted cash (net of all indebtedness for borrowed money, purchase money obligations, promissory notes or bonds) equal to at least two times the product obtained by multiplying the number of shares of Series B Preferred Stock outstanding at the time such dividend is paid by the liquidation preference. During the years ended December 31, 2010 and 2009, we did not purchase any shares of Common Stock under the Program. Since inception of the Program, we have purchased a total of 5,453,416 shares of Common Stock at an aggregate cost of $7.3 million, for an average price of $1.34 per share. In addition, pursuant to the terms of the 1998 Plan and 2007 Plan, and certain procedures adopted by the Compensation Committee of our Board of Directors, in connection with the exercise of stock options by certain of our employees, and the issuance of restricted stock units, we may withhold shares in lieu of payment of the exercise price and/or the minimum amount of applicable withholding taxes then due. Through December 31, 2010, we had withheld an aggregate of 446,095 shares which have been recorded as treasury stock. In addition, we received an aggregate of 208,270 shares as partial settlement of the working capital and debt adjustment from the acquisition of Corsis Technology Group II LLC, 104,055 of which were received in October 2008 and 104,215 of which were received in September 2009. These shares have been recorded as treasury stock.
Commitments and Contingencies
We are committed under operating leases, principally for office space, which expire at various dates through December 31, 2020. Certain leases contain escalation clauses relating to increases in property taxes and maintenance costs. Rent and equipment rental expenses were $1.7 million, $2.4 million and $2.6 million for the years ended December 31, 2010, 2009 and 2008, respectively. Additionally, we have agreements with certain of our outside contributors, whose future minimum payments are dependent on the future fulfillment of their services thereunder. As of December 31, 2010, total future minimum cash payments are as follows:
|
Payments Due by Year
|
|||||||||||||||||||||||||||
|
After
|
|||||||||||||||||||||||||||
|
Contractual obligations:
|
Total
|
2011
|
2012
|
2013
|
2014
|
2015
|
2015
|
||||||||||||||||||||
|
Operating leases
|
$
|
17,612,290
|
$
|
964,008
|
$
|
1,974,972
|
$
|
1,961,074
|
$
|
1,848,604
|
$
|
1,839,882
|
$
|
9,023,750
|
|||||||||||||
|
Outside contributors
|
150,000
|
150,000
|
—
|
—
|
—
|
—
|
—
|
||||||||||||||||||||
|
Total contractual cash obligations
|
$
|
17,762,290
|
$
|
1,114,008
|
$
|
1,974,972
|
$
|
1,961,074
|
$
|
1,848,604
|
$
|
1,839,882
|
$
|
9,023,750
|
|||||||||||||
Future minimum cash payments for the year ended December 31, 2011 related to operating leases has been reduced by approximately $1.3 million related to a leasehold improvement work credit contained in the Third Amendment of Lease dated December 31, 2008 relating to the Company’s corporate office, and payments to be received related to a sublease of office space.
See Note 12 (Commitments and Contingencies) in Notes to Consolidated Financial Statements for a discussion of contingencies.
We believe that our market risk exposures are immaterial as we do not have instruments for trading purposes, and reasonable possible near-term changes in market rates or prices will not result in material near-term losses in earnings, material changes in fair values or cash flows for all instruments.
We maintain all of our cash, cash equivalents and restricted cash in seven domestic financial institutions, although substantially all of the balance is within one institution, and we perform periodic evaluations of the relative credit standing of these institutions. However, no assurances can be given that the third party institutions will retain acceptable credit ratings or investment practices.
The Company’s consolidated financial statements required by this item are included in Item 15 of this Report.
None.
(a) Disclosure Controls and Procedures. The Company maintains disclosure controls and procedures that are designed to ensure that information required to be disclosed in the Company’s reports under the Securities Exchange Act of 1934, as amended, (“Exchange Act”) is recorded, processed, summarized and reported within the time periods specified in the SEC’s rules and forms, and that such information is accumulated and communicated to management, including the Company’s Chief Executive Officer and Chief Financial Officer, as appropriate, to allow timely decisions regarding required disclosures. The Company’s management, with the participation of our Chief Executive Officer (our principal executive officer) and Chief Financial Officer (our principal financial officer), has evaluated the effectiveness of the Company’s disclosure controls and procedures (as defined in Exchange Act Rules 131-15(e) and 15d-15(e)) as of December 31, 2010. Based on that evaluation, the Company’s management concluded that the Company’s disclosure controls and procedures were effective as of December 31, 2010.
(b) Management’s Annual Report on Internal Controls over Financial Reporting. The Company’s management is responsible for establishing and maintaining adequate internal control over financial reporting as defined in Exchange Act Rules 13a-15(f) and 15d-15(f). The Company’s internal control system was designed to provide reasonable assurance regarding the reliability of financial reporting and the preparation and fair presentation of published financial statements in accordance with generally accepted accounting principles and includes those policies and procedures that:
|
|
·
|
pertain to the maintenance of records that in reasonable detail accurately and fairly reflect the transactions and dispositions of its assets;
|
|
|
·
|
provide reasonable assurance that transactions are recorded as necessary to permit preparation of its financial statements in accordance with generally accepted accounting principles, and that its receipts and expenditures are being made only in accordance with authorizations of its management and directors; and
|
|
|
·
|
provide reasonable assurance regarding prevention or timely detection of unauthorized acquisition, use or disposition of the Company's assets that could have a material effect on its financial statements.
|
Internal control over financial reporting may not prevent or detect misstatements due to its inherent limitations. Management's projections of any evaluation of the effectiveness of internal control over financial reporting as to future periods are subject to the risks that controls may become inadequate because of changes in conditions, or that the degree of compliance with the policies or procedures may deteriorate.
The Company’s management assessed the effectiveness of the Company’s internal control over financial reporting as of December 31, 2010 and in making this assessment used the criteria set forth by the Committee of Sponsoring Organizations of the Treadway Commission in Internal Control-Integrated Framework in accordance with the standards of the Public Company Accounting Oversight Board (United States).
We previously reported two material weaknesses in our internal control over financial reporting as of December 31, 2009, which were described in Item 9A, Controls and Procedures, in our Annual Report on Form 10-K for the fiscal year ended December 31, 2009.
The two material weaknesses as of December 31, 2009 were as follows:
|
|
·
|
Inadequate and ineffective controls over recognition of revenue at our former Promotions.com subsidiary, which was sold in December 2009; and
|
|
|
|
|
|
·
|
Inadequate and ineffective controls over complex and non-recurring transactions.
|
|
|
|
A material weakness is a deficiency, or a combination of deficiencies, in internal control over financial reporting such that there is a reasonable possibility that a material misstatement of the annual or interim financial statements will not be prevented or detected on a timely basis.
Our management believes that each of the material weaknesses described above has been remediated and our Chief Executive Officer and Chief Financial Officer have concluded that, as of December 31, 2010, the Company's internal control over financial reporting was effective.
(c) Changes in Internal Control Over Financial Reporting
During the year ended December 31, 2010, the following changes were made to our internal control over revenue recognition related to our former Promotions.com subsidiary and accounting for complex and non-recurring transactions that materially affected, or were reasonably likely to materially affect, our internal control over financial reporting.
In order to improve controls, we performed the following:
|
|
·
|
Hired a new controller in January of 2010 and a new chief financial officer in September 2010;
|
|
|
·
|
Continued to work with an internal control and compliance consultant to assist us with improving the design, functioning and testing of our internal control over financial reporting; and
|
|
|
·
|
Enhanced procedures to help ensure that the proper accounting for all complex and non-routine transactions is researched, detailed in memoranda and reviewed by senior management prior to recording.
|
The certifications of our principal executive officer and principal financial officer required in accordance with Section 302 of the Sarbanes-Oxley Act are attached as exhibits to this Form 10-K. The disclosures set forth in this Item 4 contain information concerning the evaluation of our disclosure controls and procedures, and changes in internal control over financial reporting, referred to in paragraph 4 of the certifications. This Item 4 should be read in conjunction with the officer certifications for a more complete understanding of the topics presented.
As a result of the above measures, management has determined that the material weaknesses identified as of December 31, 2009 have been remediated as of December 31, 2010.
The Company’s independent registered public accounting firm, KPMG LLP, have audited and issued an audit report on the effectiveness of our internal control over financial reporting as of December 31, 2010. Their report appears on page F-3.
None.
The information required by this Item is incorporated herein by reference to the Company’s definitive Proxy Statement for its Annual Meeting of Stockholders to be held on May 26, 2011, to be filed with the Securities and Exchange Commission within 120 days after the end of the fiscal year covered by this Report.
The information required by this Item is incorporated herein by reference to the Company’s definitive Proxy Statement for its Annual Meeting of Stockholders to be held on May 26, 2011, to be filed with the Securities and Exchange Commission within 120 days after the end of the fiscal year covered by this Report.
Other than the information provided below, the information required by this Item is incorporated herein by reference to the Company’s definitive Proxy Statement for its Annual Meeting of Stockholders to be held on May 26, 2011, to be filed with the Securities and Exchange Commission within 120 days after the end of the fiscal year covered by this Report.
Equity Compensation Plan Information
Under the terms of the 1998 Plan, 8,900,000 shares of Common Stock of the Company were reserved for awards of incentive stock options, nonqualified stock options, restricted stock, deferred stock, restricted stock units, or any combination thereof. Under the terms of the 2007 Plan, 4,250,000 shares of Common Stock of the Company were reserved for awards of incentive stock options, nonqualified stock options, stock appreciation rights, restricted stock, restricted stock units or other stock-based awards. The 2007 Plan also authorized cash performance awards. Additionally, under the terms of the 2007 Plan, unused shares authorized for award under the 1998 Plan are available for issuance under the 2007 Plan. No further awards will be made under the 1998 Plan. Awards may be granted to such directors, employees and consultants of the Company as the Compensation Committee of the Board of Directors shall select in its discretion or delegate management to select. Only employees of the Company are eligible to receive incentive stock options. Awards generally vest over a three- to five-year period and stock options generally have terms of five years. The following table sets forth certain information, as of December 31, 2010, concerning shares of Common Stock authorized for issuance under the 2007 Plan.
|
Number of securities to be
issued upon exercise of outstanding options, warrants and rights
|
Weighted-average exercise price of outstanding options, warrants and rights
|
Number of securities remaining available for future issuance under equity compensation plans(excluding securities reflected in column (a))
|
||||||||||
|
(a)
|
(b)
|
(c)
|
||||||||||
|
Equity compensation plans approved by security holders
|
2,773,921
|
$2.11
|
2,311,204*
|
|||||||||
|
*
|
Aggregate number of shares available for grant under the 2007 Plan, which grants may be in the form of incentive stock options, nonqualified stock options, stock appreciation rights, restricted stock, restricted stock units or other stock-based awards in the discretion of the Board of Directors, with respect to non-employee director grants, or the Compensation Committee, with respect to all other grants. The 2007 Plan also authorizes cash performance awards.
|
|||||||||||
The information required by this Item is incorporated herein by reference to the Company’s definitive Proxy Statement for its Annual Meeting of Stockholders to be held on May 26, 2011, to be filed with the Securities and Exchange Commission within 120 days after the end of the fiscal year covered by this Report.
The information required by this Item is incorporated herein by reference to the Company’s definitive Proxy Statement for its Annual Meeting of Stockholders to be held on May 26, 2011, to be filed with the Securities and Exchange Commission within 120 days after the end of the fiscal year covered by this Report.
|
(a)
|
1.
|
Consolidated Financial Statements:
|
|
See TheStreet.com, Inc. Index to Consolidated Financial Statements on page F-1.
|
||
|
2.
|
Consolidated Financial Statement Schedules:
|
|
|
See TheStreet.com, Inc. Index to Consolidated Financial Statements on page F-1.
|
||
|
3.
|
Exhibits:
|
The following exhibits are filed herewith or are incorporated by reference to exhibits previously filed with the Securities and Exchange Commission:
|
Exhibit
|
|||||||
|
Number
|
Description
|
||||||
|
3.1
|
Restated Certificate of Incorporation of the Company.
|
||||||
|
*3.2
|
Amended and Restated Bylaws of the Company, incorporated by reference to the Exhibits to the Company’s Annual Report on Form 10-K filed March 30, 2000.
|
||||||
|
*4.1
|
Amended and Restated Registration Rights Agreement dated December 21, 1998, by and among the Company and the stockholders named therein, incorporated by reference to the Exhibits to the Company’s Registration Statement on Form S-1 filed February 23, 1999.
|
||||||
|
*4.2
|
Certificate of Designation of the Company’s Series A Junior Participating Preferred Stock, incorporated by reference to the Exhibits to the Company’s Registration Statement on Form S-1 filed February 23, 1999.
|
||||||
|
*4.3
|
Certificate of Designation of the Company’s Series B Preferred Stock, as filed with the Secretary of State of the State of Delaware on November 15, 2007, incorporated by reference to the Exhibits to the Company’s Current Report on Form 8-K filed November 20, 2007.
|
||||||
|
*4.4
|
Option to Purchase Common Stock dated November 1, 2007, incorporated by reference to the Company’s Current Report on Form 8-K filed November 6, 2007.
|
||||||
|
*4.5
|
Investor Rights Agreement dated November 15, 2007 by and among the Company, TCV VI, L.P. and TCV Member Fund, L.P., incorporated by reference to the Exhibits to the Company’s Current Report on Form 8-K filed November 20, 2007.
|
||||||
|
*4.6
|
Warrant dated November 15, 2007 issued by the Company to TCV VI, L.P., incorporated by reference to the Exhibits to the Company’s Current Report on Form 8-K filed November 20, 2007.
|
||||||
|
*4.7
|
Warrant dated November 15, 2007 issued by the Company to TCV Member Fund, L.P., incorporated by reference to the Exhibits to the Company’s Current Report on Form 8-K filed November 20, 2007.
|
||||||
|
*4.8
|
Specimen certificate for the Company’s shares of Common Stock, incorporated by reference to the Exhibits to Amendment 3 to the Company’s Registration Statement on Form S-1 filed April 19, 1999.
|
||||||
|
+*10.1
|
Amended and Restated 1998 Stock Incentive Plan, dated May 29, 2002, incorporated by reference to the Exhibits to the Company’s Quarterly Report on Form 10-Q filed August 14, 2002.
|
||||||
|
+*10.2
|
Form of Stock Option Grant Agreement under the 1998 Stock Incentive Plan, incorporated by reference to the Exhibits to the Company’s Annual Report on Form 10-K filed March 16, 2005.
|
||||||
|
+*10.3
|
Form of Restricted Stock Unit Grant Agreement under the 1998 Stock Incentive Plan, incorporated by reference to the Exhibits to the Company’s Annual Report on Form 10-K filed March 16, 2006.
|
||||||
|
+*10.4
|
Amended and Restated 2007 Performance Incentive Plan, incorporated by reference to Appendix A to the Company’s 2010 Definitive Proxy Statement on Schedule 14A filed April 16, 2010.
|
||||||
|
+*10.5
|
Form of Stock Option Grant Agreement under the Company’s 2007 Performance Incentive Plan, incorporated by reference to the Exhibits to the Company’s Quarterly Report on Form 10-Q filed August 9, 2007.
|
||||||
|
+*10.6
|
Form of Restricted Stock Unit Grant Agreement under the Company’s 2007 Performance Incentive Plan, incorporated by reference to the Exhibits to the Company’s Quarterly Report on Form 10-Q filed August 9, 2007.
|
||||||
|
+*10.7
|
Form of Cash Performance Award Agreement under the Company’s 2007 Performance Incentive Plan, incorporated by reference to the Exhibits to the Company’s Quarterly Report on Form 10-Q filed August 9, 2007.
|
||||||
|
+*10.8
|
Employment Agreement dated April 9, 2008 between James Cramer and the Company, incorporated by reference to the Exhibits to the Company’s Current Report on Form 8-K filed April 9, 2008.
|
||||||
|
+*10.9
|
Amendment to Employment Agreement dated July 30, 2008 between James Cramer and the Company, incorporated by reference to the Exhibits to the Company’s Current Report on Form 8-K filed July 30, 2008.
|
||||||
|
*10.10
|
Stock Purchase Agreement dated November 1, 2007 by and among BFPC Newco LLC, Larry Starkweather, Kyle Selberg, Rachelle Zorn, Robert Quinn and Larry Starkweather as Agent, incorporated by reference to the Exhibits to the Company’s Current Report on Form 8-K filed November 6, 2007.
|
||||||
|
*10.11
|
Securities Purchase Agreement dated November 15, 2007 by and among the Company, TCV VI, L.P. and TCV Member Fund, L.P., incorporated by reference to the Exhibits to the Company’s Current Report on Form 8-K filed November 20, 2007.
|
||||||
|
*10.12
|
Agreement of Lease, dated July 22, 1999, between 14 Wall Street Holdings 1, LLC (as successor to W12/14 Wall Acquisition Associates LLC), as Landlord, and the Company, as Tenant, incorporated by reference to the Exhibits to the Company’s Quarterly Report on Form 10-Q filed August 16, 1999.
|
||||||
|
*10.13
|
Amendment of Lease dated October 31, 2001, between 14 Wall Street Holdings 1, LLC (as successor to W12/14 Wall Acquisition Associates LLC), as Landlord, and the Company, as Tenant, incorporated by reference to the Exhibits to the Company’s Annual Report on Form 10-K filed March 16, 2005.
|
||||||
|
*10.14
|
Second Amendment of Lease dated March 21, 2007, between 14 Wall Street Holdings 1, LLC as Landlord, and the Company, as Tenant, incorporated by reference to the Exhibits to the Company’s Annual Report on Form 10-K filed March 12, 2008.
|
||||||
|
*10.15
|
Third Amendment of Lease dated December 31, 2008, between CRP/Capstone 14W Property Owner, L.L.C. as Landlord, and the Company, as Tenant, incorporated by reference to the Exhibits to the Company’s Annual Report on Form 10-K filed March 13, 2009.
|
||||||
|
+*10.16
|
Amendment to Employment Agreement dated December 23, 2008 between James J. Cramer and the Company, incorporated by reference to the Exhibits to the Company’s Annual Report on Form 10-K/A filed February 8, 2010.
|
||||||
|
+*10.17
|
Separation Agreement and Mutual Release between the Company and Thomas J. Clarke, Jr. dated March 13, 2009, incorporated by reference to the Exhibits to the Company’s Current Report on Form 8-K filed March 13, 2009.
|
||||||
|
+*10.18
|
Term Sheet between the Company and Daryl Otte dated as of May 15, 2009, incorporated by reference to the Exhibits to the Company’s Quarterly Report on Form 10-Q for the Quarter Ended June 30, 2009, filed February 8, 2010.
|
||||||
|
+*10.19
|
Agreement for Grant of Restricted Stock Units Under 2007 Performance Incentive Plan dated as of June 9, 2009 between the Company and Daryl Otte, incorporated by reference to the Exhibits to the Company’s Quarterly Report on Form 10-Q for the Quarter Ended June 30, 2009, filed February 8, 2010.
|
||||||
|
+*10.20
|
Change of Control and Severance Agreement dated as of June 9, 2009 between the Company and Daryl Otte, incorporated by reference to the Exhibits to the Company’s Quarterly Report on Form 10-Q for the Quarter Ended June 30, 2009, filed February 8, 2010.
|
||||||
|
+*10.21
|
Term Sheet between the Company and Gregory Barton dated as of June 2, 2009, incorporated by reference to the Exhibits to the Company’s Quarterly Report on Form 10-Q for the Quarter Ended June 30, 2009, filed February 8, 2010.
|
||||||
|
+*10.22
|
Notice of Waiver dated April 2, 2009 by James J. Cramer under Employment Agreement between the Company and James J. Cramer, incorporated by reference to the Exhibits to the Company’s Quarterly Report on Form 10-Q for the Quarter Ended June 30, 2009, filed February 8, 2010.
|
||||||
|
+*10.23
|
Letter agreement dated April 30, 2009 between the Company and Richard Broitman, incorporated by reference to the Exhibits to the Company’s Quarterly Report on Form 10-Q for the Quarter Ended June 30, 2009, filed February 8, 2010.
|
||||||
|
+*10.24
|
Letter agreement dated May 8, 2009 between the Company and Eric Ashman, incorporated by reference to the Exhibits to the Company’s Quarterly Report on Form 10-Q for the Quarter Ended June 30, 2009, filed February 8, 2010.
|
||||||
|
+*10.25
|
Letter agreement dated as of March 13, 2009 between the Company and Daryl Otte, incorporated by reference to the Exhibits to the Company’s Annual Report on Form 10-K filed March 30, 2010.
|
||||||
|
+*10.26
|
Letter agreement dated June 10, 2009 between the Company and Teresa Santos, incorporated by reference to the Exhibits to the Company’s Quarterly Report on Form 10-Q for the Quarter Ended June 30, 2009, filed February 8, 2010.
|
||||||
|
+*10.27
|
Form of Agreement of Restricted Stock Units Under the Company’s 2007 Performance Incentive Plan, incorporated by reference to the Exhibits to the Company’s Quarterly Report on Form 10-Q for the Quarter Ended September 30, 2009, filed February 8, 2010.
|
||||||
|
+*10.28
|
Form of Agreement of Grant of Cash Performance Award Under the Company’s 2007 Performance Incentive Plan, incorporated by reference to the Exhibits to the Company’s Quarterly Report on Form 10-Q for the Quarter Ended September 30, 2009, filed February 8, 2010.
|
||||||
|
+*10.29
|
Agreement of Grant of Restricted Stock Units dated July 14, 2009 between Gregory Barton and the Company, incorporated by reference to the Exhibits to the Company’s Quarterly Report on Form 10-Q for the Quarter Ended September 30, 2009, filed February 8, 2010.
|
||||||
|
+*10.30
|
Severance Agreement dated July 14, 2009 between Gregory Barton and the Company, incorporated by reference to the Exhibits to the Company’s Quarterly Report on Form 10-Q for the Quarter Ended September 30, 2009, filed February 8, 2010.
|
||||||
|
+*10.31
|
Form of Indemnification Agreement for directors and executive officers of the Company, incorporated by reference to the Exhibits to the Company’s Annual Report on Form 10-K filed March 30, 2010.
|
||||||
|
+*10.32
|
Amendment to Employment Agreement dated October 27, 2009 by and between James J. Cramer and the Company, incorporated by reference to the Exhibits to the Company’s Annual Report on Form 10-K filed March 30, 2010.
|
||||||
|
+10.33
|
Amendment dated January 5, 2010 to Employment Agreement between James J. Cramer and the Company.
|
||||||
|
+10.34
|
Term Sheet dated as of July 28, 2010 between Thomas Etergino and the Company.
|
||||||
|
+10.35
|
Agreement for Grant of Restricted Stock Units dated as of September 7, 2010 between Thomas Etergino and the Company.
|
||||||
|
+10.36
|
Severance Agreement dated as of September 7, 2010 between Thomas Etergino and the Company.
|
||||||
|
+§10.37
|
Employment Agreement dated as of December 10, 2010 between James J. Cramer and the Company.
|
||||||
|
+10.38
|
Amendment No. 1 dated December 16, 2010 to Employment Agreement between James J. Cramer and the Company.
|
||||||
|
*14.1
|
Code of Business Conduct and Ethics, incorporated by reference to the Exhibits to the Company’s Current Report on Form 8-K filed January 31, 2005.
|
||||||
|
21.1
|
Subsidiaries of the Company
|
||||||
|
23.1
|
Consent of KPMG LLP.
|
||||||
|
23.2
|
Consent of Marcum LLP.
|
||||||
|
31.1
|
Rule 13a-14(a) Certification of CEO.
|
||||||
|
31.2
|
Rule 13a-14(a) Certification of CFO.
|
||||||
|
32.1
|
Section 1350 Certification of CEO.
|
||||||
|
32.2
|
Section 1350 Certification of CFO.
|
||||||
|
*
|
Incorporated by reference
|
|
|
+
|
Indicates management contract or compensatory plan or arrangement
|
|
|
§
|
Indicates confidential treatment has been requested for a portion of this exhibit.
|
Pursuant to the requirements of Section 13 or 15(d) of the Securities Exchange Act of 1934, as amended, the Registrant has duly caused this report to be signed on its behalf by the undersigned, thereunto duly authorized.
|
TheStreet.com, Inc.
|
||
|
Date: March 11, 2011
|
By:
|
/s/ Daryl Otte
|
|||
|
Name:
|
Daryl Otte
|
||||
|
Title:
|
Chief Executive Officer
|
||||
Pursuant to the requirements of the Securities Exchange Act of 1934, as amended, this report has been signed below by the following persons on behalf of the Registrant and in the capacities and on the dates indicated:
|
Signature
|
Title
|
Date
|
||
|
/s/ Daryl Otte
|
Chief Executive Officer
|
March 11, 2011
|
||
|
(Daryl Otte)
|
||||
|
/s/ Thomas Etergino
|
Chief Financial Officer
|
March 11, 2011
|
||
|
(Thomas Etergino)
|
||||
|
/s/ Richard Broitman
|
Chief Accounting Officer
|
March 11, 2011
|
||
|
(Richard Broitman)
|
||||
|
/s/ Christopher Marshall
|
Chairman of the Board
|
March 11, 2011
|
||
|
(Christopher Marshall)
|
||||
|
/s/ Ronni Ballowe
|
Director
|
March 11, 2011
|
||
|
(Ronni Ballowe)
|
||||
|
/s/ James J. Cramer
|
Director
|
March 11, 2011
|
||
|
(James J. Cramer)
|
||||
|
/s/ William R. Gruver
|
Director
|
March 11, 2011
|
||
|
(William R. Gruver)
|
||||
|
/s/ Derek Irwin
|
Director
|
March 11, 2011
|
||
|
(Derek Irwin)
|
||||
|
/s/ Martin Peretz
|
Director
|
March 11, 2011
|
||
|
(Martin Peretz)
|
||||
|
/s/ Vivek Shah
|
Director
|
March 11, 2011
|
||
|
(Vivek Shah)
|
THESTREET.COM, INC.
Item 15(a)
F-1
The Board of Directors and Stockholders
TheStreet.com, Inc.:
We have audited the accompanying consolidated balance sheets of TheStreet.com, Inc. and subsidiaries (the Company) as of December 31, 2010 and 2009, and the related consolidated statements of operations, stockholders’ equity and comprehensive income (loss), and cash flows for each of the years in the two-year period ended December 31, 2010. In connection with our audits of the consolidated financial statements, we also have audited financial statement schedule II for each of the years ended December 31, 2010 and 2009. These consolidated financial statements and the financial statement schedule are the responsibility of the Company’s management. Our responsibility is to express an opinion on these consolidated financial statements and financial statement schedule based on our audits.
We conducted our audits in accordance with the standards of the Public Company Accounting Oversight Board (United States). Those standards require that we plan and perform the audits to obtain reasonable assurance about whether the financial statements are free of material misstatement. An audit includes examining, on a test basis, evidence supporting the amounts and disclosures in the financial statements. An audit also includes assessing the accounting principles used and significant estimates made by management, as well as evaluating the overall financial statement presentation. We believe that our audits provide a reasonable basis for our opinions.
In our opinion, the consolidated financial statements referred to above present fairly, in all material respects, the financial position of TheStreet.com, Inc. and subsidiaries as of December 31, 2010 and 2009, and the results of their operations and their cash flows for each of the years in the two-year period ended December 31, 2010, in conformity with U.S. generally accepted accounting principles. Also in our opinion, the related financial statement schedule, when considered in relation to the basic consolidated financial statements taken as a whole, presents fairly, in all material respects, the information set forth therein.
We also have audited, in accordance with the standards of the Public Company Accounting Oversight Board (United States), TheStreet.com Inc.’s internal control over financial reporting as of December 31, 2010, based on criteria established in Internal Control – Integrated Framework issued by the Committee of Sponsoring Organizations of the Treadway Commission (COSO), and our report dated March 11, 2011 expressed an unqualified opinion on the effectiveness of the Company’s internal control over financial reporting.
|
/s/ KPMG llp
|
|
New York, New York
|
|
March 11, 2011
|
The Board of Directors and Stockholders
TheStreet.com, Inc.:
We have audited TheStreet.com, Inc.’s and subsidiaries’ (the Company) internal control over financial reporting as of December 31, 2010, based on criteria established in Internal Control – Integrated Framework issued by the Committee of Sponsoring Organizations of the Treadway Commission (COSO). The Company’s management is responsible for maintaining effective internal control over financial reporting and for its assessment of the effectiveness of internal control over financial reporting, included in the accompanying Management’s Annual Report on Internal Control Over Financial Reporting. Our responsibility is to express an opinion on the Company’s internal control over financial reporting based on our audit.
We conducted our audit in accordance with the standards of the Public Company Accounting Oversight Board (United States). Those standards require that we plan and perform the audit to obtain reasonable assurance about whether effective internal control over financial reporting was maintained in all material respects. Our audit included obtaining an understanding of internal control over financial reporting, assessing the risk that a material weakness exists, and testing and evaluating the design and operating effectiveness of internal control based on the assessed risk. Our audit also included performing such other procedures as we considered necessary in the circumstances. We believe that our audit provides a reasonable basis for our opinion.
A company’s internal control over financial reporting is a process designed to provide reasonable assurance regarding the reliability of financial reporting and the preparation of financial statements for external purposes in accordance with generally accepted accounting principles. A company’s internal control over financial reporting includes those policies and procedures that (1) pertain to the maintenance of records that, in reasonable detail, accurately and fairly reflect the transactions and dispositions of the assets of the company; (2) provide reasonable assurance that transactions are recorded as necessary to permit preparation of financial statements in accordance with generally accepted accounting principles, and that receipts and expenditures of the company are being made only in accordance with authorizations of management and directors of the company; and (3) provide reasonable assurance regarding prevention or timely detection of unauthorized acquisition, use, or disposition of the company’s assets that could have a material effect on the financial statements.
Because of its inherent limitations, internal control over financial reporting may not prevent or detect misstatements. Also, projections of any evaluation of effectiveness to future periods are subject to the risk that controls may become inadequate because of changes in conditions, or that the degree of compliance with the policies or procedures may deteriorate.
In our opinion, TheStreet.com, Inc. maintained, in all material respects, effective internal control over financial reporting as of December 31, 2010, based on criteria established in Internal Control – Integrated Framework issued by the Committee of Sponsoring Organizations of the Treadway Commission (COSO).
We also have audited, in accordance with the standards of the Public Company Accounting Oversight Board (United States), the consolidated balance sheets of TheStreet.com, Inc.’s and subsidiaries as of December 31, 2010 and 2009, and the related consolidated statements of operations, stockholders’ equity and comprehensive income (loss), and cash flows for each of the years in the two-year period ended December 31, 2010, and our report dated March 11, 2011 expressed an unqualified opinion on those consolidated financial statements.
|
/s/ KPMG llp
|
|
New York, New York
|
|
March 11, 2011
|
To the Audit Committee of the
Board of Directors and Shareholders
TheStreet.com, Inc.
We have audited the accompanying consolidated statements of operations, stockholders’ equity and comprehensive loss, and cash flows of TheStreet.com, Inc. (the “Company”) for the year ended December 31, 2008. Our audit also included the financial statement schedule as of and for the year ended December 31, 2008 listed in the index at item 15. These financial statements and financial statement schedule are the responsibility of the Company’s management. Our responsibility is to express an opinion on these financial statements and financial statement schedule based on our audit.
We conducted our audit in accordance with the standards of the Public Company Accounting Oversight Board (United States). Those standards require that we plan and perform the audit to obtain reasonable assurance about whether the financial statements are free of material misstatement. An audit also includes examining, on a test basis, evidence supporting the amounts and disclosures in the financial statements, assessing the accounting principles used and significant estimates made by management, as well as evaluating the overall financial statement presentation. We believe that our audit provide a reasonable basis for our opinion.
In our opinion, the financial statements referred to above present fairly, in all material respects, the consolidated results of the Company’s operations and its cash flows for the year ended December 31, 2008, in conformity with United States generally accepted accounting principles. Also, in our opinion, the related financial statement schedule, when considered in relation to the basic consolidated financial statements taken as a whole presents fairly, in all material respects, the information set forth therein.
/s/ Marcum llp
|
Marcum llp
|
|
|
(Formerly Marcum & Kliegman llp)
|
|
|
New York, NY
|
|
|
March 10, 2009, except for the effects of the restatement as discussed in Note 16
|
|
|
to the consolidated financial statements (not presented herein) appearing under
Item 8 of the Company’s 2008 Annual Report on Form 10-K/A (Amendment
No. 1), as to which the date is February 3, 2010.
|
|
|
December 31,
|
||||||||
|
2010
|
2009
|
|||||||
|
assets
|
||||||||
|
Current Assets:
|
||||||||
|
Cash and cash equivalents
|
$ | 20,089,660 | $ | 60,542,494 | ||||
|
Accounts receivable, net of allowance for doubtful accounts of $238,228 as of December 31, 2010 and $276,668 as of December 31, 2009
|
6,623,261 | 5,963,209 | ||||||
|
Marketable securities
|
26,502,945 | 2,812,400 | ||||||
|
Other receivables
|
663,968 | 2,774,898 | ||||||
|
Prepaid expenses and other current assets
|
1,785,007 | 1,691,038 | ||||||
|
Total current assets
|
55,664,841 | 73,784,039 | ||||||
|
Property and equipment, net of accumulated depreciation and amortization of $12,845,359 as of December 31, 2010 and $13,263,460 as of December 31, 2009
|
10,887,732 | 7,493,020 | ||||||
|
Marketable securities
|
30,302,428 | 17,515,687 | ||||||
|
Long term investment
|
— | 555,000 | ||||||
|
Other assets
|
243,611 | 167,477 | ||||||
|
Goodwill
|
24,057,616 | 24,286,616 | ||||||
|
Other intangibles, net
|
6,725,462 | 8,210,105 | ||||||
|
Restricted cash
|
1,660,370 | 1,702,079 | ||||||
|
Total assets
|
$ | 129,542,060 | $ | 133,714,023 | ||||
|
liabilities and stockholders’ equity
|
||||||||
|
Current Liabilities:
|
||||||||
|
Accounts payable
|
$ | 2,455,894 | $ | 2,164,809 | ||||
|
Accrued expenses
|
8,239,064 | 7,894,136 | ||||||
|
Deferred revenue
|
17,431,381 | 17,306,737 | ||||||
|
Other current liabilities
|
184,328 | 132,682 | ||||||
|
Liabilities of discontinued operations
|
1,871 | 223,165 | ||||||
|
Total current liabilities
|
28,312,538 | 27,721,529 | ||||||
|
Deferred tax liability
|
288,000 | 288,000 | ||||||
|
Other liabilities
|
2,948,181 | 1,230,591 | ||||||
|
Total liabilities
|
31,548,719 | 29,240,120 | ||||||
|
Stockholders’ Equity
|
||||||||
|
Preferred stock; $0.01 par value; 10,000,000 shares authorized; 5,500 issued and outstanding as of December 31, 2010 and December 31, 2009; the aggregate liquidation preference as of December 31, 2010 and December 31, 2009 totals $55,000,000
|
55 | 55 | ||||||
|
Common stock; $0.01 par value; 100,000,000 shares authorized; 37,775,381 shares issued and 31,667,600 shares outstanding as of December 31, 2010, and 37,246,362 shares issued and 31,164,628 shares outstanding as of December 31, 2009
|
377,754 | 372,464 | ||||||
|
Additional paid-in capital
|
270,644,658 | 271,715,956 | ||||||
|
Accumulated other comprehensive income
|
331,311 | 344,372 | ||||||
|
Treasury stock at cost; 6,107,781 shares as of December 31, 2010 and 6,081,734 shares as of December 31, 2009
|
(10,478,838 | ) | (10,411,952 | ) | ||||
|
Accumulated deficit
|
(162,881,599 | ) | (157,546,992 | ) | ||||
|
Total stockholders’ equity
|
97,993,341 | 104,473,903 | ||||||
|
Total liabilities and stockholders’ equity
|
$ | 129,542,060 | $ | 133,714,023 | ||||
|
The accompanying Notes to Consolidated Financial Statements are an integral part of these financial statements
|
|
For the Years Ended December 31,
|
||||||||||
|
2010
|
2009
|
2008
|
||||||||
|
Net revenue:
|
||||||||||
|
Premium services
|
$
|
38,597,877
|
$
|
37,988,579
|
$
|
41,185,988
|
||||
|
Marketing services
|
18,588,502
|
22,251,432
|
29,662,045
|
|||||||
|
Total net revenue
|
57,186,379
|
60,240,011
|
70,848,033
|
|||||||
|
Operating expense:
|
||||||||||
|
Cost of services
|
25,557,162
|
29,100,204
|
31,984,778
|
|||||||
|
Sales and marketing
|
15,841,470
|
12,077,546
|
14,263,199
|
|||||||
|
General and administrative
|
18,052,633
|
18,916,456
|
17,521,238
|
|||||||
|
Depreciation and amortization
|
4,692,520
|
4,985,297
|
5,894,186
|
|||||||
|
Asset impairments
|
555,000
|
24,137,069
|
2,325,481
|
|||||||
|
Restructuring and other charges
|
—
|
3,460,914
|
—
|
|||||||
|
(Gain) loss on disposition of assets
|
(1,318,607
|
)
|
529,708
|
—
|
||||||
|
Total operating expense
|
63,380,178
|
93,207,194
|
71,988,882
|
|||||||
|
Operating loss
|
(6,193,799
|
)
|
(32,967,183
|
)
|
(1,140,849
|
)
|
||||
|
Net interest income
|
846,157
|
949,727
|
1,573,752
|
|||||||
|
Gain on sales of marketable securities
|
—
|
295,430
|
120,937
|
|||||||
|
Other income
|
20,374
|
153,677
|
—
|
|||||||
|
(Loss) income from continuing operations before income taxes
|
(5,327,268
|
)
|
(31,568,349
|
)
|
553,840
|
|||||
|
Provision for income taxes
|
—
|
(16,133,964
|
)
|
(2,040
|
)
|
|||||
|
(Loss) income from continuing operations
|
(5,327,268
|
)
|
(47,702,313
|
)
|
551,800
|
|||||
|
Discontinued operations:
|
||||||||||
|
Loss from discontinued operations
|
(7,339
|
)
|
(15,321
|
)
|
(8,012
|
)
|
||||
|
Net (loss) income
|
(5,334,607
|
)
|
(47,717,634
|
)
|
543,788
|
|||||
|
Preferred stock cash dividends
|
385,696
|
385,696
|
385,696
|
|||||||
|
Net (loss) income attributable to common stockholders
|
$
|
(5,720,303
|
)
|
$
|
(48,103,330
|
)
|
$
|
158,092
|
||
|
Basic net (loss) income per share:
|
||||||||||
|
(Loss) income from continuing operations
|
$
|
(0.17
|
)
|
$
|
(1.56
|
)
|
$
|
0.02
|
||
|
Loss from discontinued operations
|
(0.00
|
)
|
(0.00
|
)
|
(0.00
|
)
|
||||
|
Net (loss) income
|
(0.17
|
)
|
(1.56
|
)
|
0.02
|
|||||
|
Preferred stock dividends
|
(0.01
|
)
|
(0.01
|
)
|
(0.01
|
)
|
||||
|
Net (loss) income attributable to common stockholders
|
$
|
(0.18
|
)
|
$
|
(1.57
|
)
|
$
|
0.01
|
||
|
Diluted net (loss) income per share:
|
||||||||||
|
(Loss) income from continuing operations
|
$
|
(0.17
|
)
|
$
|
(1.56
|
)
|
$
|
0.02
|
||
|
Loss from discontinued operations
|
(0.00
|
)
|
(0.00
|
)
|
(0.00
|
)
|
||||
|
Net (loss) income
|
(0.17
|
)
|
(1.56
|
)
|
0.02
|
|||||
|
Preferred stock dividends
|
(0.01
|
)
|
(0.01
|
)
|
(0.01
|
)
|
||||
|
Net (loss) income attributable to common stockholders
|
$
|
(0.18
|
)
|
$
|
(1.57
|
)
|
$
|
0.01
|
||
|
Weighted average basic shares outstanding
|
31,593,341
|
30,586,460
|
30,427,421
|
|||||||
|
Weighted average diluted shares outstanding
|
31,593,341
|
30,586,460
|
30,835,131
|
|||||||
The accompanying Notes to Consolidated Financial Statements are an integral part of these financial statements
THESTREET.COM, INC.
|
Common Stock
|
Series B Preferred Stock
|
Treasury Stock
|
||||||||||||||||||||||||||||||||||||||
|
Shares
|
Par Value
|
Shares
|
Par Value
|
Additional Paid in Capital
|
Accumulated Other
Comprehensive Income |
Shares
|
Cost
|
Accumulated Deficit
|
Total Stockholders' Equity
|
|||||||||||||||||||||||||||||||
|
Balance at December 31, 2007
|
36,006,137 | $ | 360,061 | 5,500 | $ | 55 | $ | 270,752,308 | $ | - | (5,752,000 | ) | $ | (9,033,471 | ) | $ | (110,373,146 | ) | $ | 151,705,807 | ||||||||||||||||||||
|
Unrealized loss
on marketable
securities
|
- | - | - | - | - | (290,000 | ) | - | - | - | (290,000 | ) | ||||||||||||||||||||||||||||
|
Exercise and
Issuance of
equity grants
|
256,409 | 2,564 | - | - | 586,310 | - | - | - | - | 588,874 | ||||||||||||||||||||||||||||||
|
Costs associated
with issuance
of preferred
stock
|
- | - | - | - | (125,000 | ) | - | - | - | - | (125,000 | ) | ||||||||||||||||||||||||||||
|
Stock repurchase
|
- | - | - | - | - | - | (131,652 | ) | (866,813 | ) | - | (866,813 | ) | |||||||||||||||||||||||||||
|
Stock-based
consideration
for services
|
- | - | - | - | 3,537,085 | - | - | - | - | 3,537,085 | ||||||||||||||||||||||||||||||
|
Common stock
cash dividends
|
- | - | - | - | (3,093,433 | ) | - | - | - | - | (3,093,433 | ) | ||||||||||||||||||||||||||||
|
Preferred stock
cash dividends
|
- | - | - | - | (385,696 | ) | - | - | - | - | (385,696 | ) | ||||||||||||||||||||||||||||
|
Net income
|
- | - | - | - | - | - | - | - | 543,788 | 543,788 | ||||||||||||||||||||||||||||||
|
Balance at December 31, 2008
|
36,262,546 | 362,625 | 5,500 | 55 | 271,271,574 | (290,000 | ) | (5,883,652 | ) | (9,900,284 | ) | (109,829,358 | ) | 151,614,612 | ||||||||||||||||||||||||||
|
Unrealized gain
on marketable
securities
|
- | - | - | - | - | 634,372 | - | - | - | 634,372 | ||||||||||||||||||||||||||||||
|
Exercise and
issuance of
equity grants
|
335,915 | 3,360 | - | - | (3,360 | ) | - | (93,867 | ) | (230,287 | ) | - | (230,287 | ) | ||||||||||||||||||||||||||
|
Issuance of
common stock
for acquisition
|
647,901 | 6,479 | - | - | 1,418,903 | - | - | - | - | 1,425,382 | ||||||||||||||||||||||||||||||
|
Stock repurchase
|
- | - | - | - | - | - | (104,215 | ) | (281,381 | ) | - | (281,381 | ) | |||||||||||||||||||||||||||
|
Stock-based
consideration
for services
|
- | - | - | - | 2,615,484 | - | - | - | - | 2,615,484 | ||||||||||||||||||||||||||||||
|
Common stock
cash dividends
|
- | - | - | - | (3,200,949 | ) | - | - | - | - | (3,200,949 | ) | ||||||||||||||||||||||||||||
|
Preferred stock
cash dividends
|
- | - | - | - | (385,696 | ) | - | - | - | - | (385,696 | ) | ||||||||||||||||||||||||||||
|
Net loss
|
- | - | - | - | - | - | - | - | (47,717,634 | ) | (47,717,634 | ) | ||||||||||||||||||||||||||||
|
Balance at December 31, 2009
|
37,246,362 | 372,464 | 5,500 | 55 | 271,715,956 | 344,372 | (6,081,734 | ) | (10,411,952 | ) | (157,546,992 | ) | 104,473,903 | |||||||||||||||||||||||||||
|
Unrealized gain
on marketable
securities
|
- | - | - | - | - | (13,061 | ) | - | - | - | (13,061 | ) | ||||||||||||||||||||||||||||
|
Exercise and
issuance of
equity grants
|
529,019 | 5,290 | - | - | (5,290 | ) | - | (26,047 | ) | (66,886 | ) | - | (66,886 | ) | ||||||||||||||||||||||||||
|
Stock-based
consideration
for services
|
- | - | - | - | 2,669,443 | - | - | - | - | 2,669,443 | ||||||||||||||||||||||||||||||
|
Common stock
cash dividends
|
- | - | - | - | (3,349,755 | ) | - | - | - | - | (3,349,755 | ) | ||||||||||||||||||||||||||||
|
Preferred stock
cash dividends
|
- | - | - | - | (385,696 | ) | - | - | - | - | (385,696 | ) | ||||||||||||||||||||||||||||
|
Net loss
|
- | - | - | - | - | - | - | - | (5,334,607 | ) | (5,334,607 | ) | ||||||||||||||||||||||||||||
|
Balance at December 31, 2010
|
37,775,381 | $ | 377,754 | 5,500 | $ | 55 | $ | 270,644,658 | $ | 331,311 | (6,107,781 | ) | $ | (10,478,838 | ) | $ | (162,881,599 | ) | $ | 97,993,341 | ||||||||||||||||||||
|
For the Years Ended December 31,
|
|||||||||||
|
2010
|
2009
|
2008
|
|||||||||
|
Cash Flows from Operating Activities:
|
|||||||||||
|
Net (loss) income
|
$ | (5,334,607 | ) | $ | (47,717,634 | ) | $ | 543,788 | |||
|
Loss from discontinued operations
|
7,339 | 15,321 | 8,012 | ||||||||
|
(Loss) income from continuing operations
|
(5,327,268 | ) | (47,702,313 | ) | 551,800 | ||||||
|
Adjustments to reconcile (loss) income from continuing operations to net cash provided by operating activities:
|
|||||||||||
|
Stock-based compensation expense
|
2,336,443 | 2,739,566 | 3,537,085 | ||||||||
|
Provision for doubtful accounts
|
62,559 | 408,425 | 692,406 | ||||||||
|
Depreciation and amortization
|
4,692,520 | 4,985,297 | 5,894,186 | ||||||||
|
Valuation allowance on deferred taxes
|
— | 16,404,790 | (116,790 | ) | |||||||
|
Impairment charges
|
555,000 | 24,137,069 | 2,325,481 | ||||||||
|
Restructuring and other charges
|
— | 451,695 | — | ||||||||
|
Deferred rent
|
1,703,614 | 1,233,700 | 195,665 | ||||||||
|
(Gain) loss on disposition of assets
|
(1,318,607 | ) | 529,708 | — | |||||||
|
(Gain) loss on disposal of equipment
|
(20,600 | ) | — | 17,117 | |||||||
|
Changes in operating assets and liabilities:
|
|||||||||||
|
Accounts receivable
|
(672,611 | ) | 2,386,497 | (644,981 | ) | ||||||
|
Other receivables
|
314,054 | (275,665 | ) | 579,548 | |||||||
|
Prepaid expenses and other current assets
|
(129,121 | ) | (5,316 | ) | (193,389 | ) | |||||
|
Other assets
|
(97,115 | ) | 18,616 | 143,896 | |||||||
|
Accounts payable
|
292,477 | 1,865,890 | (1,908,790 | ) | |||||||
|
Accrued expenses
|
659,907 | 4,722,270 | (2,125,309 | ) | |||||||
|
Deferred revenue
|
488,571 | 2,143,804 | (581,009 | ) | |||||||
|
Other current liabilities
|
50,455 | 194,847 | (8,816 | ) | |||||||
|
Other liabilities
|
15,167 | (11,206 | ) | (66,196 | ) | ||||||
|
Net cash provided by continuing operations
|
3,605,445 | 14,227,674 | 8,291,904 | ||||||||
|
Net cash used in discontinued operations
|
(228,633 | ) | (18,081 | ) | (14,329 | ) | |||||
|
Net cash provided by operating activities
|
3,376,812 | 14,209,593 | 8,277,575 | ||||||||
|
Cash Flows from Investing Activities:
|
|||||||||||
|
Long-term investment
|
— | — | (2,042,970 | ) | |||||||
|
Purchase of marketable securities
|
(130,963,472 | ) | (29,204,799 | ) | (39,945 | ) | |||||
|
Sale of marketable securities
|
94,473,125 | 11,169,263 | — | ||||||||
|
Purchase of Bankers Financial Products Corporation
|
— | — | (94,184 | ) | |||||||
|
Purchase of Corsis Technology Group II LLC.
|
— | — | (28,270 | ) | |||||||
|
Purchase of Stockpickr LLC
|
— | — | (6,209 | ) | |||||||
|
Purchase of Kikucall, Inc.
|
— | (3,816,521 | ) | — | |||||||
|
Sale of Promotions.com
|
1,746,876 | 1,000,000 | — | ||||||||
|
Sale of certain assets of TheStreet Ratings
|
1,348,902 | — | — | ||||||||
|
Capital expenditures
|
(6,717,749 | ) | (1,956,355 | ) | (5,234,806 | ) | |||||
|
Proceeds from the sale of fixed assets
|
43,300 | — | 28,153 | ||||||||
|
Net cash used in investing activities
|
(40,069,018 | ) | (22,808,412 | ) | (7,418,231 | ) | |||||
|
Cash Flows from Financing Activities:
|
|||||||||||
|
Proceeds from the exercise of stock options
|
— | — | 588,874 | ||||||||
|
Costs associated with the sale of preferred stock
|
— | — | (125,000 | ) | |||||||
|
Cash dividends paid on common stock
|
(3,349,755 | ) | (3,200,949 | ) | (3,093,433 | ) | |||||
|
Cash dividends paid on preferred stock
|
(385,696 | ) | (385,696 | ) | (482,120 | ) | |||||
|
Restricted cash
|
41,709 | 516,951 | (1,702,079 | ) | |||||||
|
Purchase of treasury stock
|
(66,886 | ) | (230,287 | ) | (866,813 | ) | |||||
|
Net cash used in financing activities
|
(3,760,628 | ) | (3,299,981 | ) | (5,680,571 | ) | |||||
|
Net decrease in cash and cash equivalents
|
(40,452,834 | ) | (11,898,800 | ) | (4,821,227 | ) | |||||
|
Cash and cash equivalents, beginning of period
|
60,542,494 | 72,441,294 | 77,262,521 | ||||||||
|
Cash and cash equivalents, end of period
|
$ | $20,089,660 | $ | 60,542,494 | $ | 72,441,294 | |||||
|
Supplemental disclosures of cash flow information:
|
|||||||||||
|
Cash payments made for interest
|
$ | 1,720 | $ | 9,803 | $ | 36,813 | |||||
|
Cash payments made for income taxes
|
$ | — | $ | 85,000 | $ | 348,240 | |||||
|
Noncash investing and financing activities:
|
|||||||||||
|
Stock issued for business combinations
|
$ | — | $ | 1,425,382 | $ | — | |||||
|
Notes received for sale of Promotions.com
|
$ | — | $ | 2,127,184 | $ | — | |||||
|
Treasury shares received in settlement of Promotions.com working capital and debt adjustment
|
$ | — | $ | 281,381 | $ | 541,084 | |||||
|
The accompanying Notes to Consolidated Financial Statements are an integral part of these financial statements
|
Organization and Nature of Business
TheStreet.com, Inc. together with its wholly owned subsidiaries (“we”, “us” or the “Company”), is a digital financial media company. The Company’s goal is to be the primary independent online-only source of reliable and actionable investing ideas, news and analysis, market rate data and analytical tools for a large audience of active self-directed investors, as well as to assist advertisers desiring to connect with its affluent audience. The Company distributes its fee-based premium content and advertising-supported content through a network of proprietary electronic services including: Web sites, blogs, widgets, email services, mobile devices, podcasts and online video channels. The Company also syndicates its content for distribution by financial institutions and other media organizations.
In June 2005, the Company committed to a plan to discontinue the operations of its wholly-owned subsidiary, Independent Research Group LLC, which operated the Company’s securities research and brokerage segment. Accordingly, the operating results relating to this segment have been segregated from continuing operations and reported as a separate line item on the consolidated statements of operations. See Note 2 to Consolidated Financial Statements (Discontinued Operations). Since that time the Company has only had one reportable operating segment.
Substantially all of the Company’s revenue in 2010, 2009 and 2008 was generated from customers in the United States. During 2010, 2009 and 2008, all of the Company’s long-lived assets were located in the United States.
Use of Estimates
The preparation of financial statements in conformity with U.S. generally accepted accounting principles (“GAAP”) requires management to make estimates and assumptions. Significant estimates include the allowance for doubtful accounts receivable, valuation allowance of deferred taxes, the useful lives of long-lived assets, the valuation of goodwill and intangible assets, the carrying value of marketable securities and the Company’s long term investment, as well as accrued expense estimates, including income tax liabilities and certain estimates and assumptions used in the calculation of the fair value of equity compensation issued to employees, that affect the reported amounts of assets and liabilities and disclosure of contingent assets and liabilities at the date of the financial statements and the reported amounts of revenue and expense during the reporting period. Actual results could differ from those estimates.
Consolidation
The consolidated financial statements have been prepared in accordance with GAAP and include the accounts of TheStreet.com, Inc. and its wholly-owned subsidiaries. All intercompany balances and transactions have been eliminated in consolidation.
Revenue Recognition
The Company generates its revenue primarily from premium and marketing services.
Premium services include subscription fees paid by customers for access to particular services for the term of the subscription as well as syndication and licensing revenue. Subscriptions are generally charged to customers’ credit cards or are directly billed to corporate subscribers. These are generally billed in advance on a monthly or annual basis. The Company calculates net subscription revenue by deducting from gross revenue an estimate of potential refunds from cancelled subscriptions as well as chargebacks of disputed credit card charges. Net subscription revenue is recognized ratably over the subscription periods. Deferred revenue relates to subscription fees for which amounts have been collected but for which revenue has not been recognized because services have not yet been provided.
Subscription revenue is subject to estimation and variability due to the fact that, in the normal course of business, subscribers may, for various reasons, contact us or their credit card companies to request a refund or other adjustment for a previously purchased subscription. With respect to most of our annual subscription products, we offer the ability to receive a refund during the first 30 days but none thereafter. Accordingly, we maintain a provision for estimated future revenue reductions resulting from expected refunds and chargebacks related to subscriptions for which revenue was recognized in a prior period. The calculation of this provision is based upon historical trends and is reevaluated each quarter. The provision was not material for the three years ended December 31, 2010.
Marketing services include advertising revenue, which is derived from the sale of Internet sponsorship arrangements and from the delivery of banner, tile, contextual, performance-based and interactive advertisement and sponsorship placements in our advertising-supported Web sites, and is recognized as the advertising is displayed, provided that collection of the resulting receivable is reasonably assured.
Marketing services also include revenue associated with the Company’s former subsidiary, Promotions.com, which the Company sold in December 2009 – see Note 3 (Acquisitions and Divestitures) for further discussion. Promotions.com generated revenue from Website design, promotion management and hosting services. The Company typically entered into arrangements on a fixed fee basis for these services. Revenue generated from Website design services were recognized upon acceptance from the customer or on a straight-line basis over the hosting period if the Company performed Web site design services and hosted the software. Revenue from promotions management services was recognized straight-line over the promotion period as the promotion was designed to only operate on Promotions.com proprietary platform. Hosting services were recognized straight-line over the hosting period.
During the period that the Company owned Promotions.com, revenue for contracts with multiple elements was allocated based on the element’s fair value. Fair value was determined based on the prices charged when each element was sold separately. Elements qualified for separation when the services had value on a stand-alone basis and fair value of the undelivered elements existed. Determining fair value and identifying separate elements required judgment, generally fair value was not readily identifiable as the Company did not sell those elements individually at consistent pricing.
Cash, Cash Equivalents and Restricted Cash
The Company considers all short-term investment-grade securities with original maturities of three months or less from the date of purchase to be cash equivalents. The Company has a total of $1.7 million of cash invested in certificates of deposit that serve as collateral for an outstanding letter of credit, and which cash is therefore restricted. The letter of credit serves as a security deposit for the Company’s office space in New York City. The office lease does not expire within the next 12 months, and the restricted cash is therefore classified as a noncurrent asset.
Property and Equipment
Property and equipment are stated at cost, net of accumulated depreciation and amortization. Property and equipment are depreciated on a straight-line basis over the estimated useful lives of the assets. The estimated useful life of computer equipment, computer software and telephone equipment is three years; of furniture and fixtures is five years; and of capitalized software and Web site development costs is variable based upon the applicable project. During the year ended December 31, 2010, completed capitalized software and Web site development projects were deemed to have a three to five year useful life. Leasehold improvements are amortized on a straight-line basis over the shorter of the respective lease term or the estimated useful life of the asset.
Capitalized Software and Web Site Development Costs
The Company expenses all costs incurred in the preliminary project stage for software developed for internal use and capitalizes all external direct costs of materials and services consumed in developing or obtaining internal-use computer software in accordance with Accounting Standards Codification (“ASC”) 350, Intangibles – Goodwill and Other(“ASC 350”).In addition, for employees who are directly associated with and who devote time to internal-use computer software projects, to the extent of the time spent directly on the project, the Company capitalizes payroll and payroll-related costs of such employees incurred once the development has reached the applications development stage. For the years ended December 31, 2010, 2009 and 2008, the Company capitalized software development costs totaling $0.8 million, $0.5 million and $0.6 million, respectively. All costs incurred for upgrades, maintenance and enhancements that do not result in additional functionality are expensed.
The Company also accounts for its Web site development costs under ASC 350, which provides guidance on the accounting for the costs of development of company Web sites, dividing the Web site development costs into five stages: (1) the planning stage, during which the business and/or project plan is formulated and functionalities, necessary hardware and technology are determined, (2) the Web site application and infrastructure development stage, which involves acquiring or developing hardware and software to operate the Web site, (3) the graphics development stage, during which the initial graphics and layout of each page are designed and coded, (4) the content development stage, during which the information to be presented on the Web site, which may be either textual or graphical in nature, is developed, and (5) the operating stage, during which training, administration, maintenance and other costs to operate the existing Web site are incurred. The costs incurred in the Web site application and infrastructure stage, the graphics development stage and the content development stage are capitalized; all other costs are expensed as incurred. Amortization of capitalized costs will not commence until the project is completed and placed into service. For the years ended December 31, 2010, 2009 and 2008, the Company capitalized Web site development costs totaling $0.6 million, $0.3 million and $2.1 million, respectively.
Capitalized software and Web site development costs are amortized using the straight-line method over the estimated useful life of the software or Web site. Total amortization expense was $1.6 million, $1.2 million and $0.9 million, for the years ended December 31, 2010, 2009 and 2008, respectively.
Goodwill and Other Intangible Assets
Goodwill represents the excess of purchase price and related acquisition costs over the value assigned to the net tangible and identifiable intangible assets of businesses acquired. Under the provisions of ASC 350, goodwill is required to be tested for impairment on an annual basis and between annual tests whenever indications of impairment exist. Impairment exists when the carrying amount of goodwill exceeds its implied fair value, resulting in an impairment charge for this excess.
The Company evaluates goodwill for impairment using a two-step impairment test approach at the Company level. In the first step, the fair value of the Company is compared to its book value, including goodwill. If the fair value of the Company is less than the book value, a second step is performed that compares the implied fair value of the Company's goodwill to the book value of the goodwill. The fair value for the goodwill is determined based on the difference between the fair value of the Company and the net fair values of identifiable assets and liabilities. If the fair value of the goodwill is less than the book value, the difference is recognized as impairment. We test for goodwill impairment at the enterprise level as the Company is considered to operate as a single reporting unit.
The Company evaluates the remaining useful lives of intangible assets each year to determine whether events or circumstances continue to support their useful life. There have been no changes in useful lives of intangible assets for each period presented.
Based upon annual impairment tests performed as of September 30, 2010 and 2009, no impairment was indicated as the Company’s fair value exceeded its book value by approximately 38% and 34%, respectively.
In connection with the disposition of our former Promotions.com subsidiary and the acquisition of Kikucall, Inc. in December 2009, and the disposition of certain assets of TheStreet Ratings business (those pertaining to banking and insurance ratings) in May 2010 (see Note 3 (Acquisitions and Divestitures)), the Company concluded that these events warranted additional impairment tests which resulted in no additional impairment as the Company’s fair value exceeded its book value by approximately 21% in December 2009 and by 45% in May 2010.
In the first quarter of 2009, the Company performed an interim impairment test of its goodwill and intangible assets due to certain impairment indicators, including a continued decline in both advertising and subscription revenue resulting from the challenging economic environment and a reduction in the Company’s enterprise value. As a result of this test, the Company recorded an impairment charge of $22.6 million, as follows:
|
|
·
|
The total Company fair value was estimated using a combination of a discounted cash flow model (present value of future cash flows) and the Company’s business enterprise value based upon the fair value of its outstanding common and preferred shares. The fair value of the Company’s goodwill is the residual fair value after allocating the Company’s total fair value to its other assets, net of liabilities. This analysis resulted in an impairment of the Company’s goodwill of approximately $19.8 million. The review also revealed an additional impairment to the Company’s intangible assets related to certain customer relationships and noncompete agreements of approximately $2.8 million. See Note 3(Acquisitions and Divestitures) for further information related to the individual impairments recorded.
|
Based upon an annual impairment test as of September 30, 2008, the Company recorded an impairment charge totaling $0.5 million representing the value remaining from the trade name of Smartportfolio, which it had acquired in December 2000, as the last product carrying the Smartportfolio name was discontinued. Additionally, the Company experienced a decline in anticipated revenue during the year ended December 31, 2008 associated with its Promotions.com client relationships and noncompete agreements. Using an income approach based upon estimated future cash flows, the Company determined that the carrying value of the client relationships and noncompete agreements exceeded its fair value at December 31, 2008 and therefore recorded an impairment charge of $1.8 million.
Long-Lived Assets
The Company evaluates long-lived assets, including amortizable identifiable intangible assets, for impairment whenever events or changes in circumstances indicate that the carrying amount of an asset may not be recoverable. Upon such an occurrence, recoverability of assets to be held and used is measured by comparing the carrying amount of an asset to forecasted undiscounted net cash flows expected to be generated by the asset. If the carrying amount of the asset exceeds its estimated future cash flows, an impairment charge is recognized by the amount by which the carrying amount of the asset exceeds the fair value of the asset. For long-lived assets held for sale, assets are written down to fair value, less cost to sell. Fair value is determined based on discounted cash flows, appraised values or management's estimates, depending upon the nature of the assets. Management does not believe that there is any impairment of long-lived assets at December 31, 2010.
Income Taxes
The Company accounts for its income taxes in accordance with ASC 740-10, Income Taxes(“ASC 740-10”). Under ASC 740-10, deferred tax assets and liabilities are recognized for the future tax consequences attributable to differences between the financial statement carrying amounts of existing assets and liabilities and their tax bases. ASC 740-10 also requires that deferred tax assets be reduced by a valuation allowance if it is more likely than not that some or all of the deferred tax assets will not be realized based on all available positive and negative evidence.
Deferred tax assets pertaining to windfall tax benefits on exercise of share awards and the corresponding credit to additional paid-in capital are recorded if the related tax deduction reduces tax payable. The Company has elected the “with-and-without approach” regarding ordering of windfall tax benefits to determine whether the windfall tax benefit did reduce taxes payable in the current year. Under this approach, the windfall tax benefits would be recognized in additional paid-in capital only if an incremental tax benefit is realized after considering all other tax benefits presently available to the Company.
To account for uncertainties in income tax positions, the Company prescribes a recognition threshold and a measurement attribute for the financial statement recognition and measurement of tax positions taken or expected to be taken in a tax return. For those benefits to be recognized, a tax position must be more likely than not to be sustained upon examination by taxing authorities. Differences between tax positions taken or expected to be taken in a tax return and the benefit recognized and measured pursuant to the interpretation are referred to as “unrecognized benefits.” A liability is recognized for an unrecognized tax benefit because it represents an enterprise’s potential future obligation to the taxing authority for a tax position that was not recognized. As of December 31, 2010 and 2009, no liability for unrecognized tax benefits was required to be recorded.
The Company calculates interest costs related to unrecognized tax benefits and classifies such costs within “Net interest income” in the consolidated statements of operations. Penalties would be recognized as a component of “General and administrative” expenses. There is no interest expense or penalty related to tax uncertainties reported in the consolidated statements of operations.
The Company files income tax returns in the United States (federal) and in various state and local jurisdictions. In most instances, the Company is no longer subject to federal, state and local income tax examinations by tax authorities for years prior to 2007, and is not currently under examination by any federal, state or local jurisdiction. It is not anticipated that unrecognized tax benefits will significantly change in the next twelve months.
Fair Value of Financial Instruments
The carrying amounts of cash and cash equivalents, restricted cash, accounts and other receivables, accounts payable, accrued expenses and deferred revenue approximate fair value due to the short-term maturities of these instruments.
Business Concentrations and Credit Risk
Financial instruments that subject the Company to concentrations of credit risk consist primarily of cash, cash equivalents and restricted cash. The Company maintains all of its cash, cash equivalents and restricted cash in seven domestic financial institutions, although substantially all of the balance is within one institution. The Company performs periodic evaluations of the relative credit standing of the seven institutions. As of December 31, 2010, the Company’s cash and cash equivalents primarily consisted of money market funds and checking accounts.
For the years ending December 31, 2010, 2009 and 2008, no individual client accounted for 10% or more of consolidated revenue. As of December 31, 2010, one client accounted for more than 10% of our gross accounts receivable balance. As of December 31, 2009, two clients accounted for more than 10% each of our gross accounts receivable balance. As of December 31, 2008 no client accounted for 10% or more of our gross accounts receivable balance.
The Company’s customers are primarily concentrated in the United States. The Company performs ongoing credit evaluations, generally does not require collateral, and establishes an allowance for doubtful accounts based upon factors surrounding the credit risk of customers, historical trends and other information. To date, actual losses have been within management’s expectations.
Other Comprehensive (Loss) Income
Comprehensive (loss) income is a measure of income which includes both net (loss) income and other comprehensive (loss) income. Other comprehensive(loss)income results from items deferred from recognition into the statement of operations. Accumulated other comprehensive (loss) income is separately presented on the Company's consolidated balance sheet as part of stockholders’ equity.
Net (Loss) Income Per Share of Common Stock
Basic net (loss) income per share is computed using the weighted average number of common shares outstanding during the period. Diluted net (loss) income per share is computed using the weighted average number of common shares and, if dilutive, potential common shares outstanding during the period. Potential common shares consist of restricted stock units (using the treasury stock method), the incremental common shares issuable upon the exercise of stock options (using the treasury stock method), and the conversion of the Company’s convertible preferred stock and warrants (using the if-converted method). For the years ended December 31, 2010 and 2009, approximately 4.0 million and 3.4 million options and warrants to purchase Common Stock, respectively, were excluded from the calculation, as their effect would be anti-dilutive because the exercise prices were greater than the average market price of the Common Stock during the respective periods and because the Company recorded a net loss.
Advertising Costs
Advertising costs are expensed as incurred with the exception of direct response radio and television advertising, which is capitalized and expensed over a one year period. For the years ended December 31, 2010, 2009 and 2008, advertising expense totaled $4.1 million, $1.7 million and$3.3 million, respectively. As of December 31, 2010 and 2009, there was $0.3 million and $0.1 million, respectively, of deferred direct response advertising costs. There was no deferred direct response advertising cost deferred as of December 31, 2008.
Stock-Based Compensation
Stock-based compensation expense recognized for the years ended December 31, 2010, 2009 and 2008 were $2.3 million, $2.7 million and $3.5 million, respectively. As of December 31, 2010, there was approximately $4.4 million of unrecognized stock-based compensation expense remaining to be recognized over a weighted-average period of 3.03 years.
The Company estimates the fair value of share-based payment awards on the date of grant. The value of stock options granted to employees and directors is estimated using an option-pricing model. The value of each restricted stock unit under the Company’s 1998 Stock Incentive Plan (the “1998 Plan”) is equal to the closing price per share of the Company’s Common Stock on the trading day immediately prior to the date of grant. The value of each restricted stock unit under the Company’s 2007 Performance Incentive Plan (the “2007 Plan”) is equal to the closing price per share of the Company’s Common Stock on the date of grant. The value of the portion of the award that is ultimately expected to vest is recognized as expense over the requisite service periods.
Stock-based compensation expense recognized in the Company’s consolidated statements of operations for the years ended December 31, 2010, 2009 and 2008 includes compensation expense for all share-based payment awards based upon the estimated grant date fair value. The Company recognizes compensation expense for share-based payment awards on a straight-line basis over the requisite service period of the award. As stock-based compensation expense recognized in the years ended December 31, 2010, 2009 and 2008 is based upon awards ultimately expected to vest, it has been reduced for estimated forfeitures. The Company estimates forfeitures at the time of grant which are revised, if necessary, in subsequent periods if actual forfeitures differ from those estimates.
The Company estimates the value of employee stock options on the date of grant using the Black-Scholes option-pricing model. This determination is affected by the Company’s stock price as well as assumptions regarding expected volatility, risk-free interest rate, and expected dividends. The weighted-average fair value of employee stock options granted during the years ended December 31, 2010 and 2008 was $1.15 and $3.27, respectively, using the Black-Scholes model with the weighted-average assumptions presented below. No employee stock options were granted during the year ended December 31, 2009. Because option-pricing models require the use of subjective assumptions, changes in these assumptions can materially affect the fair value of the options. The assumptions presented below represent the weighted-average value of the applicable assumption used to value stock options at their grant date. In determining the volatility assumption, the Company used a historical analysis of the volatility of the Company’s share price for the preceding period equal to the expected option lives. The expected option lives, which represent the period of time that options granted are expected to be outstanding, were estimated based upon the “simplified” method for “plain-vanilla” options. The risk-free interest rate assumption was based upon observed interest rates appropriate for the term of the Company’s employee stock options. The dividend yield assumption was based on the history and expectation of future dividend payouts. The periodic expense is determined based on the valuation of the options, and at that time an estimated forfeiture rate is used to reduce the expense recorded. The Company’s estimate of pre-vesting forfeitures is primarily based on the Company’s historical experience and is adjusted to reflect actual forfeitures as the options vest.
|
For the Years Ended December 31,
|
|||
|
2010
|
2008
|
||
|
Expected option lives
|
3.5 years
|
3.5 years
|
|
|
Expected volatility
|
56.97%
|
48.20%
|
|
|
Risk-free interest rate
|
1.67%
|
2.32%
|
|
|
Expected dividends
|
3.69%
|
0.96%
|
|
The Company utilizes the alternative transition method for calculating the tax effects of stock-based compensation. Under the alternative transition method the Company established the beginning balance of the additional paid-in capital pool (“APIC pool”) related to the tax effects of employee stock-based compensation and then determines the subsequent impact on the APIC pool and cash flows of the tax effects of employee stock-based compensation awards that are outstanding.
Performance Incentive Plan
In 2007, the Company adopted its 2007 Performance Incentive Plan, whereby executive officers, directors, employees and consultants may be eligible to receive cash or equity-based performance awards based on set performance criteria.
In 2010, 2009 and 2008, the Compensation Committee granted short-term cash performance awards, payable to certain officers upon the Company’s achievement of specified performance goals for such year. In 2008, but not 2010 or 2009, the Compensation Committee also granted long-term cash performance awards payable to certain executive officers upon the Company’s achievement of specified performance goals for such year. The target short-term and long-term cash bonus opportunities for officers reflected a percentage of the officer’s base salary.
The short-term cash incentives were based upon achievement of a revenue target and, depending upon the year, a net income target or an Adjusted EBITDA target. Potential payout with respect to each measure was zero if a threshold percentage of the target was not achieved and a sliding scale thereafter, subject to a cap, starting at a figure less than 100% if the threshold was achieved but the target was not met and ending at a figure above 100% if the target was exceeded. Short-term incentives of $2.2 million and $2.0 million were deemed earned with respect to the year ended December 31, 2010 and 2009; respectively. No short-term incentive payment was declared for the year ended December 31, 2008.
The long-term cash incentive in 2008 was based on a comparison of the Company’s Enterprise Multiple as compared to a peer group, on a sliding scale calculated within a range whose target was benchmarked at the Company’s performance against the peer group. Potential payout was zero if a threshold percentage of the target was not achieved and a sliding scale thereafter, subject to a cap, starting at a figure less than 100% if the threshold was achieved but the target was not met and ending at a figure above 100% if the target was exceeded. The amount of long-term cash incentive earned was determined following the end of the applicable year and converted into phantom shares of the Company whereby the value of the grant in shares was recorded as a liability until paid. The value of the liability was adjusted each reporting period to equal the market value of the underlying shares until vested. The account was credited with dividend equivalents, which were converted into additional phantom shares. On December 31 of the first three years following the year of grant, provided the officer was still employed by the Company, one-third of the phantom shares vested, and the value was distributed to the officer in cash.
As of December 31, 2010, 2009 and 2008, $0.0 million, $0.0 million and $0.2 million, respectively, in awards were earned pursuant to the long-term cash incentive awards, based upon the closing market value of the Company’s stock on that date.
Common Stock Purchase Warrants
The Company accounts for the issuance of Common Stock purchase warrants issued in connection with capital financing transactions in accordance with the provisions of ASC 815, Derivatives and Hedging (“ASC 815”). The Company classifies as equity any contracts that (i) require physical settlement or net-share settlement or (ii) gives the Company a choice of net-cash settlement or settlement in its own shares (physical settlement or net-share settlement). The Company classifies as assets or liabilities any contracts that (i) require net-cash settlement (including a requirement to net-cash settle the contract if an event occurs and if that event is outside the control of the Company) or (ii) gives the counterparty a choice of net-cash settlement or settlement in shares (physical settlement or net-share settlement).
The Company assessed the classification of its derivative financial instruments as of December 31, 2007, which consist of Common Stock purchase warrants, and determined that such derivatives met the criteria for equity classification. No additional Common Stock purchase warrants have been issued since that date nor has there been any change to the classification.
Convertible Instruments
The Company evaluates and accounts for conversion options embedded in its convertible instruments in accordance with ASC 815.
ASC 815 generally provides three criteria that, if met, require companies to bifurcate conversion options from their host instruments and account for them as free-standing derivative financial instruments. These three criteria include circumstances in which (a) the economic characteristics and risks of the embedded derivative instrument are not clearly and closely related to the economic characteristics and risks of the host contract, (b) the hybrid instrument that embodies both the embedded derivative instrument and the host contract is not remeasured at fair value under otherwise applicable generally accepted accounting principles with changes in fair value reported in earnings as they occur and (c) a separate instrument with the same terms as the embedded derivative instrument would be considered a derivative instrument. ASC 815 also provides an exception to this rule when the host instrument is deemed to be conventional.
The Company accounts for convertible instruments (when it has determined that the embedded conversion options should not be bifurcated from their host instruments) in accordance with ASC 815. Accordingly, the Company records, when necessary, discounts to convertible notes for the intrinsic value of conversion options embedded in debt instruments based upon the differences between the fair value of the underlying Common Stock at the commitment date of the note transaction and the effective conversion price embedded in the note. Debt discounts under these arrangements are amortized over the term of the related debt to their earliest date of redemption. The Company also records when necessary deemed dividends for the intrinsic value of conversion options embedded in preferred shares based upon the differences between the fair value of the underlying Common Stock at the commitment date of the note transaction and the effective conversion price embedded in the note.
The Company evaluated the conversion option embedded in the Series B Convertible Preferred Stock that it issued during the year ended December 31, 2007 and determined that such conversion option does not meet the criteria requiring bifurcation of these instruments. The characteristics of the Common Stock that is issuable upon a holder’s exercise of the conversion option embedded in the Series B Convertible Preferred Stock are deemed to be clearly related to the characteristics of the preferred shares. Additionally, the Company’s conversion options, if free standing, would not be considered derivatives.
Preferred Stock
The Company applies the guidance in ASC 480,Distinguishing Liabilities from Equity (“ASC 480”) when determining the classification and measurement of its convertible preferred shares. Preferred shares subject to mandatory redemption (if any) are classified as liability instruments and are measured at fair value. Accordingly the Company classifies conditionally redeemable preferred shares (if any), which includes preferred shares that feature redemption rights that are either within the control of the holder or subject to redemption upon the occurrence of uncertain events not solely within the Company’s control, as temporary equity. At all other times, the Company classifies its preferred shares as a component of stockholders’ equity.
The Company’s Series B Convertible Preferred Stock does not feature any redemption rights within the holders’ control or conditional redemption features not solely within the Company’s control as of December 31, 2010. Accordingly, the Series B Convertible Preferred Stock is presented as a component of stockholders’ equity.
Subsequent Events
The Company has evaluated subsequent events for recognition or disclosure.
Immaterial Revision of Prior Year Financial Statements
The Company made an immaterial revision to the prior year financial statements related to the correction of an error incorrectly netting a deferred tax liability on an indefinite lived intangible against its net deferred tax assets when recording the valuation allowance during the first quarter of 2009. The effect of such revisions results in the tax provision, loss from continuing operations, net loss, and net loss attributable to common stockholders each increasing by $0.3 million for the three months ended March 31, 2009, due to an increase in the valuation allowance by $0.3 million, a $0.3 million net deferred tax liability being recorded on the balance sheet as of December 31, 2009, and an increase in the accumulated deficit totaling $0.3 million. Management does not deem this revision to be material to the prior year financial statements.
New Accounting Pronouncements
In June 2009, the Financial Accounting Standards Board (“FASB”) issued Accounting Standards Update (“ASU”) 2009-16 (formerly SFAS No. 166, Accounting for Transfers of Financial Assets - An amendment of FASB Statement No. 140) (“ASU 2009-16”). ASU 2009-16 removes the concept of a qualifying special-purpose entity (QSPE) from ASC 860-10 and removes the exception from applying ASC 810-10. This statement also clarifies the requirements for isolation and limitations on portions of financial assets that are eligible for sale accounting. This statement is effective for fiscal years beginning after November 15, 2009. The implementation of ASU 2009-16did not have a material impact on the Company’s consolidated financial statements.
In June 2009, the FASB issued ASU 2009-17 (formerly SFAS No. 167, Amendments to FASB Interpretation No. 46R) (“ASU 2009-17”). ASU 2009-17 amends ASC 810-10 to require an analysis to determine whether a variable interest gives the entity a controlling financial interest in a variable interest entity. This statement requires an ongoing reassessment and eliminates the quantitative approach previously required for determining whether an entity is the primary beneficiary. This statement is effective for fiscal years beginning after November 15, 2009. The implementation of ASU 2009-17did not have a material impact on the Company’s consolidated financial statements.
In October 2009, the FASB issued ASU 2009-13 (an update to ASC 605-25), Revenue Recognition: Multiple-Element Arrangements (“ASU 2009-13”) which is effective for annual periods ending after June 15, 2010; however, early adoption is permitted. In arrangements with multiple deliverables, ASU 2009-13 permits entities to use management’s best estimate of selling price to value individual deliverables when those deliverables have never been sold separately or when third-party evidence is not available. In addition, any discounts provided in multiple-element arrangements will be allocated on the basis of the relative selling price of each deliverable. The implementation of ASU 2009-13did not have a material impact on the Company’s consolidated financial statements.
In January 2010, the FASB issued ASU No. 2010-06, Improving Disclosures about Fair Value Measurements (Topic 820)—Fair Value Measurements and Disclosures (“ASU 2010-06”) to add additional disclosures about the different classes of assets and liabilities measured at fair value, the valuation techniques and inputs used, the activity in Level 3 fair value measurements, and the transfers between Levels 1, 2, and 3. Levels 1, 2 and 3 of fair value measurements are defined in Note 6 (Fair Value Measurements) below. The implementation of ASU 2010-06did not have a material impact on the Company’s consolidated financial statements.
(2) Discontinued Operations
In June 2005, the Company committed to a plan to discontinue the operations of the Company’s securities research and brokerage segment. Accordingly, the operating results relating to this segment have been segregated from continuing operations and reported as a separate line item in the accompanying consolidated statements of operations.
For the years ended December 31, 2010, 2009 and 2008, there was no net revenue from discontinued operations. Loss from discontinued operations was immaterial during the same periods.
The fair market values of the liabilities of the discontinued operation as of December 31, 2010 and 2009 were $0.0 million and $0.2 million, respectively, and consist of accounts payable and accrued expenses.
The following table displays the net activity and balances of the provisions related to discontinued operations:
|
Initial
Charge
|
Year 2005
Activity
|
Year 2006
Activity
|
Year 2007
Activity
|
Year 2008
Activity
|
Year 2009
Activity
|
Year 2010
Activity
|
Balance
12/31/2010
|
|
|
Net asset write-off
|
$666,546
|
$(666,546)
|
$ -
|
$ -
|
$ -
|
$ -
|
$ -
|
$ -
|
|
Severance payments
|
1,134,323
|
(905,566)
|
(6,332)
|
-
|
-
|
-
|
(222,425))
|
-
|
|
Extinguishment of lease and other obligations
|
582,483
|
(531,310)
|
(51,173)
|
9,817
|
(6,317)
|
(2,760)
|
1,131
|
1,871
|
|
$2,383,352
|
$(2,103,422)
|
$(57,505)
|
$9,817
|
$(6,317)
|
$(2,760)
|
$(221,294))
|
$1,871
|
In 2010, the Company settled the sole remaining severance claim related to discontinued operations; 2010 activity reflects consumption of the then-remaining balance of the severance accrual, which balance exceeded the settlement payment.
|
(3)
|
Acquisitions and Divestures
|
Corsis Technology Group II LLC (renamed Promotions.com LLC)
On August 2, 2007, the Company acquired, through a newly-created subsidiary, 100% of the membership interests of Corsis Technology Group II LLC, a leading provider of custom solutions for advertisers, marketers and content publishers. The acquisition of Corsis also included the Promotions.com business, which was a full-service online promotions agency that implemented interactive promotions campaigns for some of the largest brands in the world. The purchase price of the acquisition was approximately $20.7 million, consisting of approximately $12.5 million in cash and the issuance of 694,230 unregistered shares of the Company’s Common Stock, having a value on the closing date of approximately $8.2 million.
Since the acquisition through December 31, 2008, the Company experienced a decline in anticipated revenue associated with its Promotions.com subsidiary. Accordingly, the Company reduced its future revenue expectations and estimated future cash flows for that business. Using an income approach based upon the estimated present value of future cash flows, the Company determined that the carrying value of the client relationships and noncompete agreements exceeded its fair value at December 31, 2008 and recorded an impairment charge of $1.8 million.
In the first quarter of 2009, the Company performed an interim impairment test of its intangible assets due to certain impairment indicators, including a continued decline in both advertising and subscription revenue resulting from the challenging economic environment and a reduction in the Company’s enterprise value. As a result of this test, the Company determined that the carrying value of the Promotions.com client relationships exceeded its fair value at March 31, 2009 and recorded an impairment charge of $0.5 million.
On December 18, 2009, the Company sold all of its membership interest in its Promotions.com subsidiary, for an aggregate price of approximately $3.1 million (the “Sale Price”). The purchaser (the “Purchaser”) is a company owned by the managers of the Promotions.com business, who prior to the closing were employees of the Company. In connection with the sale, the Company received a payment of $1.0 million in cash and notes in an aggregate principal amount of approximately $2.1 million. The notes were payable in six equal monthly installments commencing April 1, 2010. The purchaser to date has failed to pay an aggregate amount of $0.3 million with respect to the notes, contending that such sums are not due pursuant to the terms of the purchase agreement. The Company strongly disagrees and the parties presently are engaged in discussions concerning this matter. The Company was granted a security interest in the securities and assets of the Promotions.com business until the notes are fully paid, and one of the notes (with a principal amount of $0.3 million) is guaranteed by the principals of the Purchaser. In the event that, prior to December 18, 2011, there is a change in control of the Purchaser or all or substantially all of the assets of the Promotions.com business are sold, among other events, for consideration (as defined therein) in excess of the Sale Price, the Company will be entitled to receive an additional payment from the Purchaser, equal to 50% of such excess if the event occurred on or before December 18, 2010 and 25% of such excess if the event occurs after December 18, 2010 and prior to December 18, 2011. Loss on disposition of assets totaled $0.5 million.
Kikucall, Inc. – Related Party Transaction
On December 16, 2009 (the “Closing Date”), the Company, through a wholly-owned acquisition subsidiary, acquired all of the outstanding securities of Kikucall, Inc., a subscription marketing services company (the “Acquisition”), for an aggregate purchase price of approximately $5.2 million, subject to adjustment as provided therein. In connection with the Acquisition, the Company paid approximately $3.8 million in cash and issued to the target company’s stockholders 647,901 unregistered shares of the Company’s Common Stock, having a value on the payment date of approximately $1.4 million, a portion of which was placed in escrow pursuant to the terms of an escrow agreement entered into in connection with the Acquisition. In the first quarter of 2011, the Company received $16 thousand in cash and 3,338 shares of the Company’s Common Stock related to a working capital adjustment to the purchase price; the remaining one-half of the original escrow (together with interest and dividends) was delivered to Kikucall’s stockholder representative. The balance of the escrow account (less any indemnification reserve amounts then outstanding and less any amounts paid out previously with respect to indemnification claims, exclusive of the working capital adjustment) is scheduled to be released on the second anniversary of the Closing Date (or sooner upon the occurrence of a change of control, as defined therein, of the Company).
Two of the Company’s directors, Daryl Otte (who is also our Chief Executive Officer) and Martin Peretz, were directors of the acquired company, and, both directly and indirectly through investment vehicles, were stockholders and creditors of the acquired company. As a result of the Acquisition, the following amounts were received, respectively, on the Closing Date by (i) Mr. Otte, (ii) Dr. Peretz, (iii) investment vehicles in which Mr. Otte and Dr. Peretz had a direct or indirect interest and (iv) other investment vehicles in which Dr. Peretz had a direct or indirect interest, or by Dr. Peretz’s children: (i) approximately $190,000 cash and 34,524 shares of Stock, having an aggregate value of approximately $265,000 on the Closing Date; (ii) approximately $155,000 cash and 20,023 shares of Stock, having an aggregate value of approximately $200,000 on the Closing Date; (iii) approximately $520,000 cash and 120,127 shares of Stock, having an aggregate value of approximately $785,000 on the Closing Date; and (iv) approximately $680,000 cash and 68,526 shares of Stock, having an aggregate value of approximately $830,000 on the Closing Date. Certain additional amounts were or are to be delivered in connection with the initial distribution from the escrow described above. Mr.Otte and Dr. Peretz each donated to charity an amount that approximated the respective gain such donor recognized as a result of the Acquisition. The negotiation of the Acquisition was overseen by the Company’s Audit Committee, comprised solely of independent directors, on behalf of the Company and the Acquisition was unanimously approved by the Audit Committee and the Company’s board of directors.
Based on the Company’s evaluation, the Company recorded $4.7 million of goodwill and $0.5 million of intangible assets related to software which is being amortized over its estimated useful life of five years. The goodwill is not deductible for tax purposes.
Unaudited pro forma consolidated financial information is presented below as if the acquisition had occurred as of the first day of the earliest period presented. The results have been adjusted to account for the amortization of acquired intangible assets. The pro forma information presented below does not purport to present what actual results would have been if the acquisition had occurred at the beginning of such periods, nor does the information project results for any future period. The unaudited pro forma consolidated financial information should be read in conjunction with the historical financial information of the Company included in this report. The unaudited pro forma consolidated financial information for the years ended December 31, 2009 and 2008 are as follows:
|
For the Year Ended December 31,
|
||||||||
|
2009
|
2008
|
|||||||
|
Total net revenue
|
$ | 60,963,012 | $ | 71,992,091 | ||||
|
Net loss
|
$ | (47,661,651 | ) | $ | (782,885 | ) | ||
|
Basic net (loss) income per share
|
$ | (1.53 | ) | $ | (0.03 | ) | ||
|
Diluted net loss per share
|
$ | (1.53 | ) | $ | (0.02 | ) | ||
|
Weighted average basic shares outstanding
|
31,234,361 | 31,075,322 | ||||||
|
Weighted average diluted shares outstanding
|
31,234,361 | 31,483,032 | ||||||
TheStreet Ratings
On May 4, 2010, the Company sold certain assets of TheStreet Ratings business (those pertaining to banking and insurance ratings) for an aggregate price of approximately $1.7 million, subject to adjustment as provided in the agreement. The purchaser is an entity under the same control as was the entity from which the Company had purchased TheStreet Ratings business in August 2006. In connection with the sale, the purchaser assumed a net $0.3 million of liabilities ($0.4 million of deferred revenue liabilities offset in part by working capital items) and paid the Company $1.3 million in cash, subject to adjustment. Gain on disposition of assets approximated $1.3 million.
(4) Net (Loss) Income Per Share
Basic net (loss) income per share is computed using the weighted average number of common shares outstanding during the period. Diluted net (loss) income per share is computed using the weighted average number of common shares and, if dilutive, potential common shares outstanding during the period. Potential common shares consist of restricted stock units (using the treasury stock method), the incremental common shares issuable upon the exercise of stock options (using the treasury stock method), and the conversion of the Company’s convertible preferred stock and warrants (using the if-converted method). For the years ended December 31, 2010 and 2009, approximately 4.0 million and 3.4 million options and warrants to purchase Common Stock, respectively, were excluded from the calculation, as their effect would be anti-dilutive because the exercise prices were greater than the average market price of the Common Stock during the respective periods and because the Company recorded a net loss.
The following table reconciles the numerator and denominator for the calculation.
|
For the Years Ended December 31,
|
||||||||||||||
|
2010
|
2009
|
2008
|
||||||||||||
|
Basic net (loss) income per share
Numerator:
|
||||||||||||||
|
(Loss) income from continuing operations
|
$
|
(5,327,268
|
)
|
$
|
(47,702,313
|
)
|
$
|
551,800
|
||||||
|
Loss from discontinued operations
|
(7,339
|
)
|
(15,321
|
)
|
(8,012
|
)
|
||||||||
|
Preferred stock cash dividends
|
(385,696
|
)
|
(385,696
|
)
|
(385,696
|
)
|
||||||||
|
Numerator for basic earnings per share – Net (loss) income attributable to common stockholders
|
$
|
(5,720,303
|
)
|
$
|
(48,103,330
|
)
|
$
|
158,092
|
||||||
|
Denominator:
|
||||||||||||||
|
Weighted average basic shares outstanding
|
31,593,341
|
30,586,460
|
30,427,421
|
|||||||||||
|
Net (loss) income per basic share:
|
||||||||||||
|
(Loss) income from continuing operations
|
$
|
(0.17
|
)
|
$
|
(1.56
|
)
|
$
|
0.02
|
||||
|
Loss from discontinued operations
|
(0.00
|
)
|
(0.00
|
)
|
(0.00
|
)
|
||||||
|
Preferred stock cash dividends
|
(0.01
|
)
|
(0.01
|
)
|
(0.01
|
)
|
||||||
|
Net (loss) income attributable to common stockholders
|
$
|
(0.18
|
)
|
$
|
(1.57
|
)
|
$
|
0.01
|
||||
|
Diluted net (loss) income per share:
Numerator:
|
||||||||||||
|
(Loss) income from continuing operations
|
$
|
(5,327,268
|
)
|
$
|
(47,702,313
|
)
|
$
|
551,800
|
||||
|
Loss from discontinued operations
|
(7,339
|
)
|
(15,321
|
)
|
(8,012
|
)
|
||||||
|
Preferred stock cash dividends
|
(385,696
|
)
|
(385,696
|
)
|
(385,696
|
)
|
||||||
|
Numerator for diluted earnings per share - Net (loss) income attributable to common stockholders
|
$
|
(5,720,303
|
)
|
$
|
(48,103,330
|
)
|
$
|
158,092
|
||||
|
Denominator:
|
||||||||||||
|
Weighted average basic shares outstanding
|
31,593,341
|
30,586,460
|
30,427,421
|
|||||||||
|
Weighted average effect of dilutive securities:
|
||||||||||||
|
Employee stock options and restricted stock units
|
—
|
—
|
407,710
|
|||||||||
|
Weighted average diluted shares outstanding
|
31,593,341
|
30,586,460
|
30,835,131
|
|||||||||
|
Net (loss) income per diluted share:
|
||||||||||||
|
(Loss) income from continuing operations
|
$
|
(0.17
|
)
|
$
|
(1.56
|
)
|
$
|
0.02
|
||||
|
Loss from discontinued operations
|
(0.00
|
)
|
(0.00
|
)
|
(0.00
|
)
|
||||||
|
Preferred stock cash dividend
|
(0.01
|
)
|
(0.01
|
)
|
(0.01
|
)
|
||||||
|
Net (loss) income attributable to common stockholders
|
$
|
(0.18
|
)
|
$
|
(1.57
|
)
|
$
|
0.01
|
||||
(5) Cash and Cash Equivalents, Marketable Securities and Restricted Cash
The Company’s cash and cash equivalents primarily consist of money market funds and checking accounts totaling $20.1 million. Marketable securities consist of cash reserves in liquid short-term U.S. Treasuries, government agencies, certificates of deposit (insured up to FDIC limits), investment grade corporate and municipal bonds, corporate floating rate notes, and two municipal auction rate securities (“ARS”) issued by the District of Columbia with a par value of $1.9 million. As of December 31, 2010, the total fair value of these investments was approximately $56.8 million and the total book value was approximately $56.5 million. The maximum maturity for any investment is three years. The ARS pay interest in accordance with their terms at each respective auction date, typically every 35 days, and mature in the year 2038. The Company accounts for its marketable securities in accordance with the provisions of ASC 320-10. The Company classifies these securities as available for sale and the securities are reported at fair value. Unrealized gains and losses are recorded as a component of accumulated other comprehensive income and excluded from net (loss) income. See Note 16(Comprehensive (Loss) Income). Additionally, the Company has a total of $1.7 million of cash invested in certificates of deposit that serve as collateral for outstanding letters of credit, and which cash is therefore restricted. The letters of credit serve as security deposits for our office space in New York City.
|
As of December 31,
|
||||||||
|
2010
|
2009
|
|||||||
|
Cash and cash equivalents
|
$ | 20,089,660 | $ | 60,542,494 | ||||
|
Current and noncurrent marketable securities
|
56,805,373 | 20,328,087 | ||||||
|
Current and noncurrent restricted cash
|
1,660,370 | 1,702,079 | ||||||
|
Total cash and cash equivalents, current and noncurrent marketable securities and current and noncurrent restricted cash
|
$ | 78,555,403 | $ | 82,572,660 | ||||
(6) Fair Value Measurements
The Company measures the fair value of its financial instruments in accordance withASC 820-10, which refines the definition of fair value, provides a framework for measuring fair value and expands disclosures about fair value measurements. ASC 820-10 defines fair value as the price that would be received to sell an asset or paid to transfer a liability (an exit price) in an orderly transaction between market participants at the reporting date. The statement establishes consistency and comparability by providing a fair value hierarchy that prioritizes the inputs to valuation techniques into three broad levels, which are described below:
|
•
|
Level 1: Inputs are quoted market prices in active markets for identical assets or liabilities (these are observable market inputs).
|
||
|
•
|
Level 2: Inputs are inputs other than quoted prices included within Level 1 that are observable for the asset or liability (includes quoted market prices for similar assets or identical or similar assets in markets in which there are few transactions, prices that are not current or vary substantially).
|
||
|
•
|
Level 3: Inputs are unobservable inputs that reflect the entity’s own assumptions in pricing the asset or liability (used when little or no market data is available).
|
Financial assets and liabilities included in our financial statements and measured at fair value as of December 31, 2010 are classified based on the valuation technique level in the table below:
|
Description:
|
Total
|
Level 1
|
Level 2
|
Level 3
|
||||||||
|
Cash and cash equivalents (1)
|
$20,089,660
|
$20,089,660
|
$ —
|
$ —
|
||||||||
|
Marketable securities (2)
|
56,805,373
|
54,995,373
|
—
|
1,810,000
|
||||||||
|
Total at fair value
|
$76,895,033
|
$75,085,033
|
$ —
|
$1,810,000
|
||||||||
|
(1) Cash and cash equivalents, totaling $20,089,660, consists primarily of money market funds and checking accounts for which we determine fair value through quoted market prices.
(2) Marketable securities consist of liquid short-term U.S. Treasuries, government agencies, certificates of deposit (insured up to FDIC limits), investment grade corporate and municipal bonds, and corporate floating rate notes for which we determine fair value through quoted market prices. Marketable securities also consist of two municipal ARS issued by the District of Columbia having a fair value totaling $1.8 million as of December 31, 2010. Historically, the fair value of ARS investments approximated par value due to the frequent resets through the auction process. Due to events in credit markets, the auction events, which historically have provided liquidity for these securities, have been unsuccessful. The result of a failed auction is that these ARS holdings will continue to pay interest in accordance with their terms at each respective auction date; however, liquidity of the securities will be limited until there is a successful auction, the issuer redeems the securities, the securities mature or until such time as other markets for these ARS holdings develop. For each of our ARS, we evaluate the risks related to the structure, collateral and liquidity of the investment, and forecast the probability of issuer default, auction failure and a successful auction at par, or a redemption at par, for each future auction period. Temporary impairment charges are recorded in accumulated other comprehensive income, whereas other-than-temporary impairment charges are recorded in our consolidated statement of operations. As of December 31, 2010, the Company determined there was a decline in the fair value of its ARS investments of $40 thousand from its cost basis, which was deemed temporary and was included within accumulated comprehensive (loss) income. The Company used a discounted cash flow model to determine the estimated fair value of its investment in ARS. The assumptions used in preparing the discounted cash flow model include estimates for interest rate, timing and amount of cash flows and expected holding period of ARS.
|
||||||||||||
The following table provides a reconciliation of the beginning and ending balance for the Company’s marketable securities measured at fair value using significant unobservable inputs (Level 3):
|
Marketable Securities
|
Long Term
Investment
|
||||
|
Balance at January 1, 2010
|
$1,770,000
|
$ 555,000
|
|||
|
Increase in fair value of investment
|
65,000
|
—
|
|||
|
Redemption of Auction Rate Security
|
(25,000))
|
—
|
|||
|
Impairment in value of long term investment
|
—
|
(555,000))
|
|||
|
Balance at December 31, 2010
|
$1,810,000
|
$ —
|
|||
(7) Property and Equipment
Property and equipment as of December 31, 2010 and 2009 consists of the following:
|
December 31,
|
||||||||
|
2010
|
2009
|
|||||||
|
Computer equipment
|
$ | 18,245,134 | $ | 16,499,509 | ||||
|
Furniture and fixtures
|
2,454,268 | 1,354,932 | ||||||
|
Leasehold improvements
|
3,033,689 | 2,902,039 | ||||||
| 23,733,091 | 20,756,480 | |||||||
|
Less accumulated depreciation and amortization
|
12,845,359 | 13,263,460 | ||||||
|
Property and equipment, net
|
$ | 10,887,732 | $ | 7,493,020 | ||||
Included in computer equipment are capitalized software and Web site development costs of $7.3 million and $6.1 million at December 31, 2010 and 2009, respectively. A summary of the activity of capitalized software and Web site development costs is as follows:
|
Balance December 31, 2009
|
$6,122,002
|
|
|
Additions
|
1,399,354
|
|
|
Deletions
|
(208,917))
|
|
|
Balance December 31, 2010
|
$7,312,439
|
Depreciation and amortization expense for the above noted property and equipment aggregated $3.3 million, $3.2 million and $3.1 million for the years ended December 31, 2010, 2009 and 2008, respectively. The Company does not include depreciation and amortization expense in cost of services.
(8) Goodwill and Other Intangible Assets
The Company’s goodwill and other intangible assets and related accumulated amortization as of December 31, 2010 and 2009 consist of the following:
|
December 31,
|
||||||||
|
2010
|
2009
|
|||||||
|
Total goodwill not subject to amortization
|
$ | 24,057,616 | $ | 24,286,616 | ||||
|
Other intangible assets not subject to amortization:
|
||||||||
|
Trade name
|
$ | 720,000 | $ | 720,000 | ||||
|
Total other intangible assets not subject to amortization
|
720,000 | 720,000 | ||||||
|
Other intangible assets subject to amortization:
|
||||||||
|
Customer relationships
|
6,862,136 | 6,862,136 | ||||||
|
Syndication agreement
|
- | 870,000 | ||||||
|
Software models
|
1,841,194 | 2,070,000 | ||||||
|
Noncompete agreements
|
1,339,535 | 1,536,678 | ||||||
|
Products database
|
137,000 | 137,000 | ||||||
|
Total other intangible assets subject to amortization
|
10,179,865 | 11,475,814 | ||||||
|
Less accumulated amortization
|
(4,174,403 | ) | (3,985,709 | ) | ||||
|
Net other intangible assets subject to amortization
|
6,005,462 | 7,490,105 | ||||||
|
Total other intangible assets
|
$ | 6,725,462 | $ | 8,210,105 | ||||
In the first quarter of 2009, the Company performed an interim impairment test of its goodwill, intangible assets and a long-term investment due to certain impairment indicators, including a continued decline in both advertising and subscription revenue resulting from the challenging economic environment and a reduction in the Company’s enterprise value. The total Company fair value was estimated using a combination of a discounted cash flow model (present value of future cash flows) and the Company’s business enterprise value based upon the fair value of its outstanding common and preferred shares. The fair value of the Company’s goodwill is the residual fair value after allocating the Company’s total fair value to its other assets, net of liabilities. This analysis resulted in an impairment of the Company’s goodwill of approximately $19.8 million. The analysis also revealed an additional impairment to the Company’s intangible assets related to certain customer relationships and noncompete agreements of approximately $2.8 million.
Amortization expense totaled $1.4 million,$1.8 million and $2.8 million for the years ended December 31, 2010, 2009 and 2008, respectively. The estimated amortization expense for the next five years is as follows:
|
For the Years Ended
|
||
|
December 31,
|
Amount
|
|
|
2011
|
$1,355,326
|
|
|
2012
|
1,118,236
|
|
|
2013
|
793,814
|
|
|
2014
|
793,814
|
|
|
2015
|
686,214
|
|
|
Thereafter
|
1,258,058
|
|
|
Total
|
$6,005,462
|
(9) Accrued Expenses
Accrued expenses as of December 31, 2010 and 2009consist of the following:
|
December 31,
|
||||||||
|
2010
|
2009
|
|||||||
|
Payroll and related costs
|
$ | 3,666,233 | $ | 3,731,342 | ||||
|
Professional fees
|
869,962 | 1,092,214 | ||||||
|
Restructuring and other charges (see Note 15)
|
844,761 | 1,230,056 | ||||||
|
Advertising
|
545,277 | 190,245 | ||||||
|
Business development
|
515,690 | 327,852 | ||||||
|
Other liabilities
|
1,797,141 | 1,322,427 | ||||||
|
Total accrued expenses
|
$ | 8,239,064 | $ | 7,894,136 | ||||
(10) Income Taxes
The Company accounts for its income taxes in accordance with ASC 740. Under ASC 740, deferred tax assets and liabilities are recognized for the future tax consequences attributable to differences between the financial statement carrying amounts of existing assets and liabilities and their tax bases. ASC 740 also requires that deferred tax assets be reduced by a valuation allowance if it is more likely than not that some or all of the deferred tax assets will not be realized based on all available positive and negative evidence.
As of December 31, 2010 and 2009, respectively, the Company had approximately $139 million and $133 million of federal and state net operating loss carryforwards. The Company had recognized a deferred tax asset for a portion of such net operating loss carryforwards in the amount of $16.1 million as of December 31, 2008. During the three months ended March 31, 2009, the Company recorded a valuation allowance against these deferred tax assets as management concluded that it was more likely than not that the Company would not realize the benefit of this portion of its deferred tax assets by generating sufficient taxable income in future years. The decision to record the valuation allowance was based on management evaluating all positive and negative evidence. The significant negative evidence included an anticipated loss for the year ended December 31, 2009, an expected cumulative pre-tax loss for the three years ended December 31, 2009, the inability to carryback the net operating losses, limited future reversals of existing temporary differences and the limited availability of tax planning strategies. The Company’s position on its valuation allowance remains the same at December 31, 2010.
The Company has not recognized a deferred tax asset for the net operating loss carryforwards at December 31, 2010 and expects to continue to provide a full valuation allowance until, or unless, it can sustain a level of profitability that demonstrates its ability to utilize these assets. Subject to potential Section 382 limitations as discussed below, the federal losses are available to offset future taxable income through 2030 and expire from 2020 through 2030. Since the Company does business in various states and each state has its own rules with respect to the number of years losses may be carried forward, the state net operating loss carryforwards expire from 2011 through 2030. The net operating loss carryforwards as of December 31, 2010 and 2009 include approximately $17 million and $17 million, respectively, related to windfall tax benefits for which a benefit would be recorded to additional paid in capital when realized.
In accordance with Section 382 of the Internal Revenue code, the ability to utilize the Company’s net operating loss carryforwards could be limited in the event of a change in ownership and as such a portion of the existing net operating loss carryforwards may be subject to limitation. Such an ownership change would create an annual limitation on the usage of the Company’s net operating loss carryover. The Company is in the process of evaluating the effect of Section 382 ownership changes on the Company’s net operation loss carryforwards generated through 2010. During the year ended December 31, 2009, the Company acquired approximately $3 million of net operating loss carryforwards when it acquired the stock of Kikucall, Inc. In accordance with Section 382 of the Internal Revenue code, the usage of the Kikucall, Inc. net operating loss carryforward could be limited.
The Company is subject to federal and state and local corporate income taxes. The components of the provision for income taxes reflected on the consolidated statements of operations from continuing operations are set forth below:
|
For the years ended December 31,
|
||||||||||||
|
2010
|
2009
|
2008
|
||||||||||
|
(in thousands)
|
||||||||||||
|
Current taxes:
|
||||||||||||
|
U.S. federal
|
$ | - | $ | (364 | ) | $ | (82 | ) | ||||
|
State and local
|
- | 93 | 201 | |||||||||
|
Total current tax expense (benefit)
|
$ | - | $ | (271 | ) | $ | 119 | |||||
|
Deferred taxes:
|
||||||||||||
|
U.S. federal
|
$ | - | $ | 13,944 | $ | (99 | ) | |||||
|
State and local
|
- | 2,461 | (18 | ) | ||||||||
|
Total deferred tax expense (benefit)
|
$ | - | $ | 16,405 | $ | (117 | ) | |||||
|
Total tax expense
|
$ | - | $ | 16,134 | $ | 2 | ||||||
A reconciliation of the statutory U.S. federal income tax rate to the Company's effective income tax rate is set forth below:
|
For the years ended December 31,
|
|||||||||||||
|
2010
|
2009
|
2008
|
|||||||||||
|
U.S. statutory federal income tax rate
|
34.0 | % | 34.0 | % | 34.0 | % | |||||||
|
State income taxes, net of federal tax benefit
|
6.0 | 3.5 | 22.4 | ||||||||||
|
Effect of permanent differences
|
(2.3 | ) | (9.7 | ) | 8.0 | ||||||||
|
Change to valuation allowance
|
(42.3 | ) | (76.7 | ) | (62.0 | ) | |||||||
|
Other
|
4.6 | (2.2 | ) | (2.0 | ) | ||||||||
|
Effective income tax rate
|
(0.0 | )% | (51.1 | )% | 0.4 | % | |||||||
Deferred income taxes reflect the net tax effects of temporary difference between the financial reporting and tax bases of assets and liabilities and are measured using the enacted tax rates and laws that will be in effect when such differences are expected to reverse. Significant components of the Company's net deferred tax assets and liabilities are set forth below:
|
As of December 31,
|
|||
|
2010
|
2009
|
||
|
(in thousands)
|
|||
|
Deferred tax assets:
|
|||
|
Operating loss carryforward
|
$ 55,314
|
$ 52,996
|
|
|
Windfall tax benefit carryforward
|
(6,945))
|
(6,923))
|
|
|
Goodwill
|
2,147
|
2.477
|
|
|
Intangible assets
|
363
|
-
|
|
|
Accrued expenses
|
1,972
|
1,518
|
|
|
Other
|
821
|
594
|
|
|
Total deferred tax assets
|
53,672
|
50,662
|
|
|
Deferred tax liabilities:
|
|||
|
Depreciation
|
(1,261)
|
(1,062)
|
|
|
Intangible assets
|
-
|
(37)
|
|
|
Total deferred tax liabilities
|
(1,261))
|
(1,099))
|
|
|
Less: valuation allowance
|
(52,699))
|
(49,851))
|
|
|
Net deferred tax liability
|
$ ( 288))
|
$(288))
|
|
The implementation of ASC 740 did not result in any current adjustment or any cumulative effect, and therefore, no adjustment was recorded to retained earnings upon adoption. For the years ended December 31, 2010, 2009 and 2008, the Company performed a tax analysis in accordance with ASC 740. Based upon such analysis the Company was not required to accrue any liabilities pursuant to ASC 740 for the years ended December 31, 2010, 2009 and 2008, respectively.
(11) Stockholders’ Equity
Preferred Stock
Securities Purchase Agreement
On November 15, 2007, the Company entered into a Securities Purchase Agreement (the “Purchase Agreement”) with TCV VI, L.P., a Delaware limited partnership, and TCV Member Fund, L.P., a Delaware limited partnership (collectively, the “Purchasers”).
Pursuant to the Purchase Agreement, the Company sold the Purchasers an aggregate of 5,500 shares of its newly-created Series B convertible preferred stock, par value $0.01 per share (“Series B Preferred Stock”), that are immediately convertible into an aggregate of 3,856,942 shares of its Common Stock at a conversion price of $14.26 per share, and warrants (the “Warrants”) to purchase an aggregate of 1,157,083 shares of Common Stock for $15.69 per share. The consideration paid for the Series B Preferred Stock and the Warrants was $55 million. As of December 31, 2010, no Series B Preferred Stock has been converted. Neither the Series B Preferred Stock nor the Warrants have been registered and the Company has not registered the shares of Common Stock issuable upon the conversion of the Series B Preferred Stock or upon the exercise of the Warrants.
Investor Rights Agreement
On November 15, 2007, the Company also entered into an Investor Rights Agreement with the Purchasers (the “Investor Rights Agreement”) pursuant to which, among other things, the Company agreed to grant the Purchasers certain registration rights including the right to require the Company to file a registration statement within 30 days to register the Common Stock issuable upon conversion of the Series B Preferred Stock and upon exercise of the Warrants and to use its reasonable best efforts to cause the registration to be declared effective within 90 days after the date the registration is filed. To date, no such request has been made.
Certificate of Designation
Pursuant to a Certificate of Designation for the Series B Preferred Stock (the “Certificate of Designation”) filed by the Company with the Secretary of State of the State of Delaware on November 15, 2007: (i) the Series B Preferred Stock has a purchase price per share equal to $10,000 (the “Original Issue Price”); (ii) in the event of any Liquidation Event (as defined in the Certificate of Designation), the holders of shares of Series B Preferred Stock are entitled to receive, prior to any distribution to the holders of the Common Stock, an amount per share equal to the Original Issue Price, plus any declared and unpaid dividends; (iii) the holders of the Series B Preferred Stock have the right to vote on any matter submitted to a vote of the stockholders of the Company and are entitled to vote that number of votes equal to the aggregate number of shares of Common Stock issuable upon the conversion of such holders’ shares of Series B Preferred Stock; (iv) for so long as 40% of the shares of Series B Preferred Stock remain outstanding, the holders of a majority of such shares will have the right to elect one person to the Company’s board of directors; (v) the Series B Preferred Stock automatically converts into an aggregate of 3,856,942 shares of Common Stock in the event that the Common Stock trades on a trading market at or above a closing price equal to $28.52 per share for 90 consecutive trading days and any demand registration previously requested by the holders of the Series B Preferred Stock has become effective; and (vi) so long as 30% of the shares of the currently-outstanding Series B Preferred Stock remain outstanding, the affirmative vote of the holders of a majority of such shares will be necessary to take any of the following actions: (a) authorize, create or issue any class or classes of our capital stock ranking senior to, or on a parity with (as to dividends or upon a liquidation event) the Series B Preferred Stock orany securities exercisable or exchangeable for, or convertible into, any now or hereafter authorized capital stock ranking senior to, or on a parity with (as to dividends or upon a liquidation event) the Series B Preferred Stock (including, without limitation, the issuance of any shares of Series B Preferred Stock (other than shares of Series B Preferred Stock issued as a stock dividend or in a stock split)); (b) any increase or decrease in the authorized number of shares of Series B Preferred Stock; (c) any amendment, waiver, alteration or repeal of our certificate of incorporation or bylaws in a way that adversely affects the rights, preferences or privileges of the Series B Preferred Stock; (d) the payment of any dividends (other than dividends paid in our capital stock or any of our subsidiaries) in excess of $0.10 per share per annum on the Common Stock unless after the payment of such dividends we have unrestricted cash (net of all indebtedness for borrowed money, purchase money obligations, promissory notes or bonds) in an amount equal to at least two times the product obtained by multiplying the number of shares of Series B Preferred Stock outstanding at the time such dividend is paid by the liquidation preference; and (e) the purchase or redemption of: (1) any Common Stock (except for the purchase or redemption from employee, directors and consultants pursuant to agreements providing us with repurchase rights upon termination of their service with us) unless after such purchase or redemption we have unrestricted cash (net of all indebtedness for borrowed money, purchase money obligations, promissory notes or bonds) equal to at least two times the product obtained by multiplying the number of shares of Series B Preferred Stock outstanding at the time such dividend is paid by the liquidation preference; or (2) any class or series of now or hereafter of our authorized stock that ranks junior to (upon a liquidation event) the Series B Preferred Stock.
Warrants
As discussed above, the Warrants entitle the Purchasers to purchase an aggregate of 1,157,083 shares of Common Stock for $15.69 per share. The Warrants expire on the fifth anniversary of the date they were first issued, or earlier in certain circumstances. As of December 31, 2010, no Warrants have been exercised.
Treasury Stock
In December 2000, the Company’s Board of Directors authorized the repurchase of up to $10 million worth of the Company’s Common Stock, from time to time, in private purchases or in the open market. In February 2004, the Company’s Board of Directors approved the resumption of the stock repurchase program (the “Program”) under new price and volume parameters, leaving unchanged the maximum amount available for repurchase under the Program. However, the affirmative vote of the holders of a majority of the outstanding shares of Series B Preferred Stock, voting separately as a single class, is necessary for the Company to repurchase its stock (except as described above). During the years ended December 31, 2010 and 2009, the Company did not purchase any shares of Common Stock under the Program. Since inception of the Program, the Company has purchased a total of 5,453,416 shares of Common Stock at an aggregate cost of $7.3 million. In addition, pursuant to the terms of the Company’s 1998 Plan and 2007 Plan, and certain procedures adopted by the Compensation Committee of the Board of Directors, in connection with the exercise of stock options by certain of the Company’s employees, and the issuance of restricted stock units, the Company may withhold shares in lieu of payment of the exercise price and/or the minimum amount of applicable withholding taxes then due. Through December 31, 2010, the Company had withheld an aggregate of 446,095 shares which have been recorded as treasury stock. In addition, the Company received an aggregate of 208,270 shares as partial settlement of the working capital and debt adjustment from the acquisition of Corsis Technology Group II LLC, 104,055 of which were received in December 2008 and 104,215 of which were received in September 2009. These shares have been recorded as treasury stock.
Dividends
During the year ended December 31, 2010, the Company paid four quarterly cash dividends of $0.025 per share on its Common Stock and its Series B Preferred Stock on a converted common share basis. For the year ended December 31, 2010, dividends paid totaled approximately $3.7 million, as compared to approximately $3.6 million for the year ended December 31, 2009.The Company’s Board of Directors reviews the dividend payment each quarter and there can be no assurance that we will continue to pay this cash dividend in the future.
Stock Options
Under the terms of the 1998 Plan, 8,900,000 shares of Common Stock of the Company were reserved for awards of incentive stock options, nonqualified stock options, restricted stock, deferred stock, restricted stock units, or any combination thereof. Under the terms of the 2007 Plan, 4,250,000 shares of Common Stock of the Company were reserved for awards of incentive stock options, nonqualified stock options, stock appreciation rights, restricted stock, restricted stock units, or other stock-based awards. The 2007 Plan also authorized cash performance awards. Additionally, under the terms of the 2007 Plan, unused shares authorized for award under the 1998 Plan are available for issuance under the 2007 Plan. No further awards will be made under the 1998 Plan. Awards may be granted to such directors, employees and consultants of the Company as the Compensation Committee of the Board of Directors shall select in its discretion or delegate to management to select. Only employees of the Company are eligible to receive grants of incentive stock options. Awards generally vest over a three- to five-year period and stock options generally have terms of five years. As of December 31, 2010, there remained 2,311,204 shares available for future awards under the 2007 Plan. Stock-based compensation expense for the years ended December 31, 2010, 2009 and 2008 was $2.3 million, $2.7 million and $3.5 million, respectively.
A stock option represents the right, once the option has vested and become exercisable, to purchase a share of the Company’s Common Stock at a particular exercise price set at the time of the grant. A restricted stock unit (“RSU”) represents the right to receive one share of the Company’s Common Stock (or, if provided in the award, the fair market value of a share in cash) on the applicable vesting date for such RSU. Until the stock certificate for a share of common stock represented by an RSU is delivered, the holder of an RSU does not have any of the rights of a stockholder with respect to the Common Stock. However, the grant of an RSU includes the grant of dividend equivalents with respect to such RSU. The Company records cash dividends for RSUs to be paid in the future at an amount equal to the rate paid on a share of Common Stock for each then-outstanding RSU granted. The accumulated dividend equivalents related to outstanding grants vest on the applicable vesting date for the RSU with respect to which such dividend equivalents were credited, and are paid in cash at the time a stock certificate evidencing the shares represented by such vested RSU is delivered.
A summary of the activity of the 1998 and 2007 Plans pertaining to stock option grants is as follows:
|
Shares Underlying Awards
|
Weighted Average Exercise Price
|
Aggregate Intrinsic Value ($000)
|
Weighted Average Remaining Contractual Life (In Years)
|
|||||
|
Awards outstanding, December 31, 2009
|
714,030
|
$ 8.28
|
||||||
|
Options granted
|
348,500
|
$ 3.39
|
||||||
|
Options cancelled
|
(59,835))
|
$ 5.29
|
||||||
|
Options expired
|
(157,167))
|
$ 5.85
|
||||||
|
Awards outstanding, December 31, 2010
|
845,528
|
$ 6.92
|
$ -
|
2.39
|
||||
|
Awards vested and expected to vest at December 31, 2010
|
804,954
|
$ 7.10
|
$ -
|
2.30
|
||||
|
Awards exercisable at December 31, 2010
|
466,817
|
$ 9.11
|
$ -
|
1.12
|
A summary of the activity of the 1998 and 2007 Plans pertaining to grants of restricted stock units is as follows:
|
Shares Underlying Awards
|
Weighted Average Exercise Price
|
Aggregate Intrinsic Value ($000)
|
Weighted Average Remaining Contractual Life (In Years)
|
|||||
|
Awards outstanding, December 31, 2009
|
1,956,190
|
$ -
|
||||||
|
Restricted stock units granted
|
565,916
|
$ -
|
||||||
|
Restricted stock units settled by delivery of Common Stock upon vesting
|
(549,709))
|
$ -
|
||||||
|
Restricted stock units cancelled
|
(44,004))
|
$ -
|
||||||
|
Awards outstanding, December 31, 2010
|
1,928,393
|
$ -
|
$5,149
|
3.13
|
||||
|
Awards vested and expected to vest at December 31, 2010
|
1,640,552
|
$ -
|
$4,380
|
2.93
|
||||
|
Awards exercisable at December 31, 2010
|
20,690
|
$ -
|
$ 55
|
-
|
|
A summary of the status of the Company’s unvested share-based payment awards as of December 31, 2010 and changes in the year then ended is as follows:
|
|
Unvested Awards
|
Awards
|
Weighted Average Grant Date Fair Value
|
|||
|
Shares underlying awards unvested at December31, 2009
|
2,170,746
|
$3.37
|
|||
|
Shares underlying options granted
|
348,500
|
$1.15
|
|||
|
Shares underlying restricted stock units granted
|
565,916
|
$2.59
|
|||
|
Shares underlying options vested
|
(124,510
|
)
|
$3.42
|
||
|
Shares underlying restricted stock units issued
|
(549,709
|
)
|
$4.23
|
||
|
Shares underlying unvested options cancelled
|
(59,835
|
)
|
$1.86
|
||
|
Shares underlying unvested restricted stock units cancelled
|
(44,004
|
)
|
$3.24
|
||
|
Shares underlying awards unvested at December 31, 2010
|
2,307,104
|
$2.72
|
|||
The number of employee stock options granted during the years ended December 31, 2010, 2009 and 2008 were 348,500, zero and 657,106, respectively. The weighted-average fair value of employee stock options granted during the years ended December 31, 2010 and 2008 was $1.15 and $3.27, respectively. For the years ended December 31, 2010, 2009 and 2008, the total fair value of share-based awards vested was $1.3 million, $4.3 million and $1.5 million, respectively. There were no employee stock options exercised during the years ended December 31, 2010 and 2009. For the year ended December 31, 2008, the total intrinsic value of options exercised was $1.2 million. As of December 31, 2010, there was approximately $4.4 million of unrecognized stock-based compensation expense remaining to be recognized over a weighted-average period of 3.03 years.
(12) Commitments and Contingencies
Operating Leases and Employment Agreements
The Company is committed under operating leases, principally for office space, which expire at various dates through December 31, 2020. Certain leases contain escalation clauses relating to increases in property taxes and maintenance costs. Rent and equipment rental expenses were $1.7 million, $2.4 million and $2.6 million for the years ended December 31, 2010, 2009 and 2008, respectively. Additionally, the Company has agreements with certain of its outside contributors, whose future minimum payments are dependent on the future fulfillment of their services thereunder. As of December 31, 2010, total future minimum cash payments are as follows:
|
Payments Due by Year
|
|||||||||||||||||||||||||||
|
After
|
|||||||||||||||||||||||||||
|
Contractual obligations:
|
Total
|
2011
|
2012
|
2013
|
2014
|
2015
|
2015
|
||||||||||||||||||||
|
Operating leases
|
$
|
17,612,290
|
$
|
964,008
|
$
|
1,974,972
|
$
|
1,961,074
|
$
|
1,848,604
|
$
|
1,839,882
|
$
|
9,023,750
|
|||||||||||||
|
Outside contributors
|
150,000
|
150,000
|
—
|
—
|
—
|
—
|
—
|
||||||||||||||||||||
|
Total contractual cash obligations
|
$
|
17,762,290
|
$
|
1,114,008
|
$
|
1,974,972
|
$
|
1,961,074
|
$
|
1,848,604
|
$
|
1,839,882
|
$
|
9,023,750
|
|||||||||||||
Future minimum cash payments for the year ended December 31, 2011 related to operating leases has been reduced by approximately $1.3 million related to a leasehold improvement work credit contained in the Third Amendment of Lease dated December 31, 2008 relating to the Company’s corporate office, and payments to be received related to a sublease of office space.
Legal Proceedings
As previously disclosed, in 2001, the Company, certain of its current or former officers and directors and certain underwriters were named in a securities class action related to the Company’s initial public offering (“IPO”). Similar suits were filed against approximately 300 other issuers and their underwriters, all of which are included in a single coordinated proceeding in the district court (the “IPO Litigations”). The complaints allege that the prospectus and the registration statement for the IPO failed to disclose that the underwriters allegedly solicited and received “excessive” commissions from investors and that some investors in the IPO allegedly agreed with the underwriters to buy additional shares in the aftermarket in order to inflate the price of the Company’s stock. The complaints seek unspecified damages, attorney and expert fees, and other unspecified litigation costs. In 2003, the district court granted the Company’s motion to dismiss the claims against it under Rule 10b-5 but motions to dismiss the claims under Section 11 of the Securities Act of 1933 were denied as to virtually all of the defendants in the consolidated cases, including the Company. In addition, some of the individual defendants in the IPO Litigations, including Mr. Cramer, signed a tolling agreement and were dismissed from the action without prejudice on October 9, 2002. In 2003, a proposed collective partial settlement of this litigation was structured between the plaintiffs, the issuer defendants in the consolidated actions, the issuer officers and directors named as defendants, and the issuers’ insurance companies. The court granted preliminary approval of the settlement in 2005 but in 2007 the settlement was terminated, in light of a ruling by the appellate court in related litigation in 2006 that reversed the trial court’s certification of classes in that related litigation. In 2009, another settlement was entered into and approved by the trial court. Under the settlement, the Company’s obligation of approximately $339,000 would be paid by the issuers’ insurance companies. The settlement has been appealed. There can be no assurance that the approval of the settlement will not be reversed on appeal and that the settlement will be implemented in its current form, or at all. Due to the inherent uncertainties of litigation, the ultimate outcome of the matter is uncertain.
As previously disclosed, we conducted a review of the accounting in our former Promotions.com subsidiary, which subsidiary we sold in December 2009. As a result of this review, in February 2010 we filed a Form 10-K/A for the year ended December 31, 2008 and a Form 10-Q/A for the quarter ended March 31, 2009, respectively, to restate and correct certain previously-reported financial information as well as filed Forms 10-Q for the quarters ended June 30, 2009 and September 30, 2009, respectively. The SEC commenced an investigation in March 2010 into the facts surrounding our restatement of previously issued financial statements and related matters. We are cooperating fully with the SEC. The investigation could result in the SEC seeking various penalties and relief including, without limitation, civil injunctive relief and/or civil monetary penalties or administrative relief. The nature of the relief or remedies the SEC may seek, if any, cannot be predicted at this time.
As previously disclosed, in April 2010, we and one of our reporters were named in a lawsuit captioned Generex Biotechnology Corporation v. Feuerstein et al. (N.Y. Supreme Court, County of New York, Index No. 10104433), in which plaintiff alleges that certain articles we published concerning plaintiff were libelous. In May 2010 we filed an answer denying all claims. We intend to vigorously defend ourselves in this matter and believe we have meritorious defenses. Due to the preliminary stage of this matter and the inherent uncertainties of litigation, the ultimate outcome of the matter is uncertain.
In December 2010, the Company was named as one of several defendants in a lawsuit captioned EIT Holdings LLC v. WebMD, LLC et al., (U.S.D.C., D. Del.), on the same day that plaintiff filed a substantially identical suit against a different group of defendants in a lawsuit captioned EIT Holdings LLC v. Yelp!, Inc. et al., (U.S.D.C., N. D. Cal.). The complaints allege that defendants infringe U.S. Patent No. 5,828,837, putatively owned plaintiff, related to a certain method of displaying information to an Internet-accessible device. In February 2011, by agreement of plaintiff and the Company, the Company was dismissed from the Delaware action without prejudice and named as a defendant in the California action. The Company intends to vigorously defend itself and believes it has meritorious defenses. Due to the early stage of this matter and the inherent uncertainties of litigation, the ultimate outcome of this matter is uncertain.
The Company is party to other legal proceedings arising in the ordinary course of business or otherwise, none of which other proceedings is deemed material.
(13) Long Term Investment
During 2008, the Company made an investment in Debtfolio, Inc., doing business as Geezeo, an online financial management solutions provider for banks and credit unions. The investment totaled $1.9 million for an 18.5% ownership stake. Additionally, the Company incurred approximately $0.2 million of legal fees in connection with this investment. The Company retained the option to purchase the company based on an equity value of $12 million at any point prior to April 23, 2009, but did not exercise the option. During the first quarter of 2009, the carrying value of the Company’s investment was written down to fair value based upon an estimate of the market value of the Company’s equity in light of Debtfolio’s efforts to raise capital at the time from third parties. The impairment charge approximated $1.5 million. The Company performed an additional impairment test as of December 31, 2009 and no additional impairment in value was noted. During the three months ended June 30, 2010, the Company determined it necessary to record a second impairment charge, writing the value of the investment to zero. This was deemed necessary by management based upon their consideration of Debtfolio, Inc.’s continued negative cash flow from operations, current financial position and lack of current liquidity.
(14) Impairment Charge
The Company holds a long-term investment in Debtfolio, Inc., doing business as Geezeo, a Web-based personal finance site. During the first quarter of 2009, the carrying value of the Company’s investment was written down to fair value based upon an estimate of the market value of the Company’s equity in light of Debtfolio’s efforts to raise capital at the time from third parties. The impairment charge recorded was approximately $1.5 million. The Company performed an additional impairment test as of December 31, 2009 and no additional impairment in value was noted. During the three months ended June 30, 2010 the Company determined it necessary to record a second impairment charge totaling $0.6 million, writing the value of the investment to zero. This was deemed necessary by management based upon their consideration of Debtfolio, Inc.’s continued negative cash flow from operations, current financial position and lack of current liquidity.
In the first quarter of 2009, the Company performed an interim impairment test of its goodwill, intangible assets and a long-term investment due to certain impairment indicators, including a continued decline in both advertising and subscription revenue resulting from the challenging economic environment and a reduction in the Company’s enterprise value. As a result of this test, the Company recorded an impairment charge of $24.1 million, as follows:
|
|
·
|
The total Company fair value was estimated using a combination of a discounted cash flow model (present value of future cash flows) and the Company’s business enterprise value based upon the fair value of its outstanding common and preferred shares. The fair value of the Company’s goodwill is the residual fair value after allocating the Company’s total fair value to its other assets, net of liabilities. This analysis resulted in an impairment of the Company’s goodwill of approximately $19.8 million. The review also revealed an additional impairment to the Company’s intangible assets related to certain customer relationships and noncompete agreements of approximately $2.8 million.
|
|
|
·
|
The carrying value of the Company’s long term investment was written down to fair value based upon the most current estimate of the market value of the Company’s equity stake in Debtfolio, Inc. The impairment approximated $1.5 million. (See Note 13(Long-Term Investment)).
|
(15) Restructuring and Other Charges
In March 2009, the Company announced and implemented a reorganization plan, including an approximate 8% reduction in the Company’s workforce, to align the Company’s resources with its strategic business objectives. Additionally, effective March 21, 2009, the Company’s then Chief Executive Officer tendered his resignation, effective May 8, 2009, the Company’s then Chief Financial Officer tendered his resignation, and in December 2009, the Company sold its Promotions.com subsidiary and entered into negotiations to sublease certain office space maintained by Promotions.com. As a result of these activities, the Company incurred restructuring and other charges from continuing operations of approximately$3.5 million during the year ended December 31, 2009. Included in this charge were severance and other payroll related expenses, totaling approximately $1.9 million, $0.8 million related to the sublease of office space previously occupied by our former Promotions.com subsidiary, $0.6 million of professional fees, and $0.2 million related to the write-off of certain assets.
Total cash outlay for the restructuring and other charge will approximate $3.0 million, of which approximately $0.8 million is included in accrued expenses on the Company’s consolidated balance sheet as of December 31, 2010.
The following table displays the activity of the restructuring and other charges reserve account from the initial charges during the first quarter 2009 through December 31, 2010:
|
Initial Charge
|
2009 Additions
|
2009 Payments
|
2009 Noncash Deductions
|
Balance 12/31/09
|
2010 Payments
|
Balance 12/31/10
|
||||||||
|
Workforce reduction
|
$1,741,752
|
$726,385
|
$(1,779,163)
|
$(208,918)
|
$ 480,056
|
$152,634
|
$327,422
|
|||||||
|
Lease termination
|
-
|
750,000
|
-
|
-
|
750,000
|
232,661
|
517,339
|
|||||||
|
Asset write-off
|
242,777
|
-
|
-
|
(242,777)
|
-
|
-
|
-
|
|||||||
|
Total
|
$1,984,529
|
$1,476,385
|
$(1,779,163)
|
$(451,695)
|
$1,230,056
|
$385,295
|
$844,761
|
(16) Comprehensive (Loss) Income
Comprehensive (loss) income consists of the following:
|
For the Year Ended December 31,
|
||||||||||||
|
2010
|
2009
|
2008
|
||||||||||
|
Net (loss) income
|
$ | (5,334,607 | ) | $ | (47,717 ,634 | ) | $ | 543,788 | ||||
|
Recovery (temporary impairment) of ARS
|
65,000 | 185,000 | (290,000 | ) | ||||||||
|
Unrealized (loss) gain on marketable securities
|
(78,287 | ) | 744,802 | - | ||||||||
|
Reclass from AOCI to earnings due to sale
|
226 | (295,430 | ) | - | ||||||||
|
Comprehensive (loss) income
|
$ | (5,347,668 | ) | $ | (47,083,262 | ) | $ | 253,788 | ||||
|
(17)
|
Other Receivables
|
Other receivables consist of the following:
|
As of December 31,
|
||||||||
|
2010
|
2009
|
|||||||
|
Note receivable, net
|
$ | 255,776 | $ | 2,052,652 | ||||
|
Other receivables
|
408,192 | 722,246 | ||||||
| Total | $ | 663,968 | $ | 2,774,898 | ||||
On December 18, 2009, the Company sold all of its membership interest in its Promotions.com subsidiary, for an aggregate price of approximately $3.1 million. The purchaser was a company owned by the managers of the Promotions.com business, who prior to the closing were employees of the Company. In connection with the sale, the Company received notes in an aggregate principal amount of approximately $2.1 million. The notes were payable in six equal monthly installments commencing April 1, 2010. The purchaser to date has failed to pay an aggregate amount of $0.3 million with respect to the notes, contending that such sums are not due pursuant to the terms of the purchase agreement. The Company strongly disagrees and the parties presently are engaged in discussions concerning this matter.
(18) Other Liabilities
Other liabilities consist of the following:
|
Dec 2010
|
Dec 2009
|
|||||||
|
Actual
|
Actual
|
|||||||
|
Deferred rent
|
$ | 2,933,014 | $ | 1,230,591 | ||||
|
Other liabilities
|
15,167 | - | ||||||
|
Total other liabilities
|
$ | 2,948,181 | $ | 1,230,591 | ||||
(19) Employee Benefit Plan
The Company maintains a noncontributory savings plan in accordance with Section 401(k) of the Internal Revenue Code. The 401(k) plan covers all eligible employees and provides an employer match of 50% of employee contributions, up to a maximum of 4% of each employee’s total compensation within statutory limits. The Company’s matching contribution totaled $0.3 million, $0.4 million and $0.4 million for the years ended December 31, 2010, 2009 and 2008, respectively.
(20) Selected Quarterly Financial Data (Unaudited)
|
For the Year Ended December 31, 2010
|
||||||||||||||
|
First Quarter
|
Second Quarter
|
Third Quarter
|
Fourth Quarter
|
|||||||||||
|
(In thousands, except per share data)
|
||||||||||||||
|
Total revenue
|
$
|
13,500
|
$
|
14,664
|
$
|
14,337
|
$
|
14,685
|
||||||
|
Total operating expense
|
15,096
|
15,227
|
16,405
|
16,652
|
||||||||||
|
Loss from continuing operations before income taxes
|
(1,399
|
)
|
(337
|
)
|
(1,829
|
)
|
(1,762
|
)
|
||||||
|
Provision for income tax
|
—
|
—
|
—
|
—
|
||||||||||
|
Loss from continuing operations
|
(1,399
|
)
|
(337
|
)
|
(1,829
|
)
|
(1,762
|
)
|
||||||
|
(Loss) income from discontinued operations
|
(19
|
)
|
(2
|
)
|
(2
|
)
|
16
|
|||||||
|
Netloss
|
(1,418
|
)
|
(339
|
)
|
(1,831
|
)
|
(1,746
|
)
|
||||||
|
Preferred stock dividends
|
96
|
97
|
96
|
97
|
||||||||||
|
Net loss attributable to common stockholders
|
$
|
(1,514
|
)
|
$
|
(436
|
)
|
$
|
(1,927
|
)
|
$
|
(1,843
|
)
|
||
|
Basic net loss per share:
|
||||||||||||||
|
Loss from continuing operations
|
$
|
(0.05
|
)
|
$
|
(0.01
|
)
|
$
|
(0.06
|
)
|
$
|
(0.06
|
)
|
||
|
Loss from discontinued operations
|
(0.00
|
)
|
(0.00
|
)
|
(0.00
|
)
|
(0.00
|
)
|
||||||
|
Net loss
|
(0.05
|
)
|
(0.01
|
)
|
(0.06
|
)
|
(0.06
|
)
|
||||||
|
Preferred stock dividends
|
(0.00
|
)
|
(0.00
|
)
|
(0.00
|
)
|
(0.00
|
)
|
||||||
|
Net loss attributable to common stockholders
|
$
|
(0.05
|
)
|
$
|
(0.01
|
)
|
$
|
(0.06
|
)
|
$
|
(0.06
|
)
|
||
|
Diluted net loss per share:
|
||||||||||||||
|
Loss from continuing operations
|
$
|
(0.05
|
)
|
$
|
(0.01
|
)
|
$
|
(0.06
|
)
|
$
|
(0.06
|
)
|
||
|
Loss from discontinued operations
|
(0.00
|
)
|
(0.00
|
)
|
(0.00
|
)
|
(0.00
|
)
|
||||||
|
Net loss
|
(0.05
|
)
|
(0.01
|
)
|
(0.06
|
)
|
(0.06
|
)
|
||||||
|
Preferred stock dividends
|
(0.00
|
)
|
(0.00
|
)
|
(0.00
|
)
|
(0.00
|
)
|
||||||
|
Net loss attributable to common stockholders
|
$
|
(0.05
|
)
|
$
|
(0.01
|
)
|
$
|
(0.06
|
)
|
$
|
(0.06
|
)
|
||
|
For the Year Ended December 31, 2009
|
||||||||||||||
|
First Quarter
|
Second Quarter
|
Third Quarter
|
Fourth Quarter
|
|||||||||||
|
(In thousands, except per share data)
|
||||||||||||||
|
Total revenue
|
$
|
13,500
|
$
|
14,992
|
$
|
15,236
|
$
|
16,512
|
||||||
|
Total operating expense
|
43,357
|
15,263
|
16,752
|
17,836
|
||||||||||
|
(Loss) income from continuing operations before income taxes
|
(29,472
|
)
|
350
|
(1,295
|
)
|
(1,151
|
)
|
|||||||
|
(Provision) benefit for income tax
|
(16,515
|
)
|
—
|
—
|
381
|
|||||||||
|
(Loss) income from continuing operations
|
(45,987
|
)
|
350
|
(1,295
|
)
|
(770
|
)
|
|||||||
|
Income (loss)from discontinued operations
|
1
|
(10
|
)
|
(2
|
)
|
(5
|
)
|
|||||||
|
Net (loss) income
|
(45,986
|
)
|
340
|
(1,297
|
)
|
(775
|
)
|
|||||||
|
Preferred stock dividends
|
96
|
96
|
96
|
96
|
||||||||||
|
Net (loss) income attributable to common stockholders
|
$
|
(46,082
|
)
|
$
|
244
|
$
|
(1,393
|
)
|
$
|
(871
|
)
|
|||
|
Basic net (loss) income per share:
|
||||||||||||||
|
(Loss) income from continuing operations
|
$
|
(1.51
|
)
|
$
|
0.01
|
$
|
(0.05
|
)
|
$
|
(0.03
|
)
|
|||
|
Income (loss)from discontinued operations
|
0.00
|
(0.00
|
)
|
(0.00
|
)
|
(0.00
|
)
|
|||||||
|
Net (loss) income
|
(1.51
|
)
|
0.01
|
(0.05
|
)
|
(0.03
|
)
|
|||||||
|
Preferred stock dividends
|
(0.00
|
)
|
(0.00
|
)
|
(0.00
|
)
|
(0.00
|
)
|
||||||
|
Net (loss) income attributable to common stockholders
|
$
|
(1.51
|
)
|
$
|
0.01
|
$
|
(0.05
|
)
|
$
|
(0.03
|
)
|
|||
|
Diluted net (loss) income per share:
|
||||||||||||||
|
(Loss) income from continuing operations
|
$
|
(1.51
|
)
|
$
|
0.01
|
$
|
(0.05
|
)
|
$
|
(0.03
|
)
|
|||
|
Income (loss)from discontinued operations
|
0.00
|
(0.00
|
)
|
(0.00
|
)
|
(0.00
|
)
|
|||||||
|
Net (loss) income
|
(1.51
|
)
|
0.01
|
(0.05
|
)
|
(0.03
|
)
|
|||||||
|
Preferred stock dividends
|
(0.00
|
)
|
(0.00
|
)
|
(0.00
|
)
|
(0.00
|
)
|
||||||
|
Net (loss) income attributable to common stockholders
|
$
|
(1.51
|
)
|
$
|
0.01
|
$
|
(0.05
|
)
|
$
|
(0.03
|
)
|
|||
|
Allowance for Doubtful Accounts
|
Balance at Beginning of Period
|
Provisions Charged to Expense
|
Write-offs
|
Disposal Related to Sale of Promotions.com
|
Balance at End of Period
|
|||||||||||||||
|
For the year ended December 31, 2010
|
$ | 276,668 | $ | 12,559 | $ | 50,999 | $ | - | $ | 238,228 | ||||||||||
|
For the year ended December 31, 2009
|
$ | 531,092 | $ | 408,425 | $ | 235,347 | $ | 427,502 | $ | 276,668 | ||||||||||
|
For the year ended December 31, 2008
|
$ | 242,807 | $ | 692,405 | $ | 404,120 | $ | - | $ | 531,092 | ||||||||||
EXHIBIT INDEX
|
Exhibit
|
|||||||
|
Number
|
Description
|
||||||
|
3.1
|
Restated Certificate of Incorporation of the Company.
|
||||||
|
*3.2
|
Amended and Restated Bylaws of the Company, incorporated by reference to the Exhibits to the Company’s Annual Report on Form 10-K filed March 30, 2000.
|
||||||
|
*4.1
|
Amended and Restated Registration Rights Agreement dated December 21, 1998, by and among the Company and the stockholders named therein, incorporated by reference to the Exhibits to the Company’s Registration Statement on Form S-1 filed February 23, 1999.
|
||||||
|
*4.2
|
Certificate of Designation of the Company’s Series A Junior Participating Preferred Stock, incorporated by reference to the Exhibits to the Company’s Registration Statement on Form S-1 filed February 23, 1999.
|
||||||
|
*4.3
|
Certificate of Designation of the Company’s Series B Preferred Stock, as filed with the Secretary of State of the State of Delaware on November 15, 2007, incorporated by reference to the Exhibits to the Company’s Current Report on Form 8-K filed November 20, 2007.
|
||||||
|
*4.4
|
Option to Purchase Common Stock dated November 1, 2007, incorporated by reference to the Company’s Current Report on Form 8-K filed November 6, 2007.
|
||||||
|
*4.5
|
Investor Rights Agreement dated November 15, 2007 by and among the Company, TCV VI, L.P. and TCV Member Fund, L.P., incorporated by reference to the Exhibits to the Company’s Current Report on Form 8-K filed November 20, 2007.
|
||||||
|
*4.6
|
Warrant dated November 15, 2007 issued by the Company to TCV VI, L.P., incorporated by reference to the Exhibits to the Company’s Current Report on Form 8-K filed November 20, 2007.
|
||||||
|
*4.7
|
Warrant dated November 15, 2007 issued by the Company to TCV Member Fund, L.P., incorporated by reference to the Exhibits to the Company’s Current Report on Form 8-K filed November 20, 2007.
|
||||||
|
*4.8
|
Specimen certificate for the Company’s shares of Common Stock, incorporated by reference to the Exhibits to Amendment 3 to the Company’s Registration Statement on Form S-1 filed April 19, 1999.
|
||||||
|
+*10.1
|
Amended and Restated 1998 Stock Incentive Plan, dated May 29, 2002, incorporated by reference to the Exhibits to the Company’s Quarterly Report on Form 10-Q filed August 14, 2002.
|
||||||
|
+*10.2
|
Form of Stock Option Grant Agreement under the 1998 Stock Incentive Plan, incorporated by reference to the Exhibits to the Company’s Annual Report on Form 10-K filed March 16, 2005.
|
||||||
|
+*10.3
|
Form of Restricted Stock Unit Grant Agreement under the 1998 Stock Incentive Plan, incorporated by reference to the Exhibits to the Company’s Annual Report on Form 10-K filed March 16, 2006.
|
||||||
|
+*10.4
|
Amended and Restated 2007 Performance Incentive Plan, incorporated by reference to Appendix A to the Company’s 2010 Definitive Proxy Statement on Schedule 14A filed April 16, 2010.
|
||||||
|
+*10.5
|
Form of Stock Option Grant Agreement under the Company’s 2007 Performance Incentive Plan, incorporated by reference to the Exhibits to the Company’s Quarterly Report on Form 10-Q filed August 9, 2007.
|
||||||
|
+*10.6
|
Form of Restricted Stock Unit Grant Agreement under the Company’s 2007 Performance Incentive Plan, incorporated by reference to the Exhibits to the Company’s Quarterly Report on Form 10-Q filed August 9, 2007.
|
||||||
|
+*10.7
|
Form of Cash Performance Award Agreement under the Company’s 2007 Performance Incentive Plan, incorporated by reference to the Exhibits to the Company’s Quarterly Report on Form 10-Q filed August 9, 2007.
|
||||||
|
+*10.8
|
Employment Agreement dated April 9, 2008 between James Cramer and the Company, incorporated by reference to the Exhibits to the Company’s Current Report on Form 8-K filed April 9, 2008.
|
||||||
|
+*10.9
|
Amendment to Employment Agreement dated July 30, 2008 between James Cramer and the Company, incorporated by reference to the Exhibits to the Company’s Current Report on Form 8-K filed July 30, 2008.
|
||||||
|
*10.10
|
Stock Purchase Agreement dated November 1, 2007 by and among BFPC Newco LLC, Larry Starkweather, Kyle Selberg, Rachelle Zorn, Robert Quinn and Larry Starkweather as Agent, incorporated by reference to the Exhibits to the Company’s Current Report on Form 8-K filed November 6, 2007.
|
||||||
|
*10.11
|
Securities Purchase Agreement dated November 15, 2007 by and among the Company, TCV VI, L.P. and TCV Member Fund, L.P., incorporated by reference to the Exhibits to the Company’s Current Report on Form 8-K filed November 20, 2007.
|
||||||
|
*10.12
|
Agreement of Lease, dated July 22, 1999, between 14 Wall Street Holdings 1, LLC (as successor to W12/14 Wall Acquisition Associates LLC), as Landlord, and the Company, as Tenant, incorporated by reference to the Exhibits to the Company’s Quarterly Report on Form 10-Q filed August 16, 1999.
|
||||||
|
*10.13
|
Amendment of Lease dated October 31, 2001, between 14 Wall Street Holdings 1, LLC (as successor to W12/14 Wall Acquisition Associates LLC), as Landlord, and the Company, as Tenant, incorporated by reference to the Exhibits to the Company’s Annual Report on Form 10-K filed March 16, 2005.
|
||||||
|
*10.14
|
Second Amendment of Lease dated March 21, 2007, between 14 Wall Street Holdings 1, LLC as Landlord, and the Company, as Tenant, incorporated by reference to the Exhibits to the Company’s Annual Report on Form 10-K filed March 12, 2008.
|
||||||
|
*10.15
|
Third Amendment of Lease dated December 31, 2008, between CRP/Capstone 14W Property Owner, L.L.C. as Landlord, and the Company, as Tenant, incorporated by reference to the Exhibits to the Company’s Annual Report on Form 10-K filed March 13, 2009.
|
||||||
|
+*10.16
|
Amendment to Employment Agreement dated December 23, 2008 between James J. Cramer and the Company, incorporated by reference to the Exhibits to the Company’s Annual Report on Form 10-K/A filed February 8, 2010.
|
||||||
|
+*10.17
|
Separation Agreement and Mutual Release between the Company and Thomas J. Clarke, Jr. dated March 13, 2009, incorporated by reference to the Exhibits to the Company’s Current Report on Form 8-K filed March 13, 2009.
|
||||||
|
+*10.18
|
Term Sheet between the Company and Daryl Otte dated as of May 15, 2009, incorporated by reference to the Exhibits to the Company’s Quarterly Report on Form 10-Q for the Quarter Ended June 30, 2009, filed February 8, 2010.
|
||||||
|
+*10.19
|
Agreement for Grant of Restricted Stock Units Under 2007 Performance Incentive Plan dated as of June 9, 2009 between the Company and Daryl Otte, incorporated by reference to the Exhibits to the Company’s Quarterly Report on Form 10-Q for the Quarter Ended June 30, 2009, filed February 8, 2010.
|
||||||
|
+*10.20
|
Change of Control and Severance Agreement dated as of June 9, 2009 between the Company and Daryl Otte, incorporated by reference to the Exhibits to the Company’s Quarterly Report on Form 10-Q for the Quarter Ended June 30, 2009, filed February 8, 2010.
|
||||||
|
+*10.21
|
Term Sheet between the Company and Gregory Barton dated as of June 2, 2009, incorporated by reference to the Exhibits to the Company’s Quarterly Report on Form 10-Q for the Quarter Ended June 30, 2009, filed February 8, 2010.
|
||||||
|
+*10.22
|
Notice of Waiver dated April 2, 2009 by James J. Cramer under Employment Agreement between the Company and James J. Cramer, incorporated by reference to the Exhibits to the Company’s Quarterly Report on Form 10-Q for the Quarter Ended June 30, 2009, filed February 8, 2010.
|
||||||
|
+*10.23
|
Letter agreement dated April 30, 2009 between the Company and Richard Broitman, incorporated by reference to the Exhibits to the Company’s Quarterly Report on Form 10-Q for the Quarter Ended June 30, 2009, filed February 8, 2010.
|
||||||
|
+*10.24
|
Letter agreement dated May 8, 2009 between the Company and Eric Ashman, incorporated by reference to the Exhibits to the Company’s Quarterly Report on Form 10-Q for the Quarter Ended June 30, 2009, filed February 8, 2010.
|
||||||
|
+*10.25
|
Letter agreement dated as of March 13, 2009 between the Company and Daryl Otte, incorporated by reference to the Exhibits to the Company’s Annual Report on Form 10-K filed March 30, 2010.
|
||||||
|
+*10.26
|
Letter agreement dated June 10, 2009 between the Company and Teresa Santos, incorporated by reference to the Exhibits to the Company’s Quarterly Report on Form 10-Q for the Quarter Ended June 30, 2009, filed February 8, 2010.
|
||||||
|
+*10.27
|
Form of Agreement of Restricted Stock Units Under the Company’s 2007 Performance Incentive Plan, incorporated by reference to the Exhibits to the Company’s Quarterly Report on Form 10-Q for the Quarter Ended September 30, 2009, filed February 8, 2010.
|
||||||
|
+*10.28
|
Form of Agreement of Grant of Cash Performance Award Under the Company’s 2007 Performance Incentive Plan, incorporated by reference to the Exhibits to the Company’s Quarterly Report on Form 10-Q for the Quarter Ended September 30, 2009, filed February 8, 2010.
|
||||||
|
+*10.29
|
Agreement of Grant of Restricted Stock Units dated July 14, 2009 between Gregory Barton and the Company, incorporated by reference to the Exhibits to the Company’s Quarterly Report on Form 10-Q for the Quarter Ended September 30, 2009, filed February 8, 2010.
|
||||||
|
+*10.30
|
Severance Agreement dated July 14, 2009 between Gregory Barton and the Company, incorporated by reference to the Exhibits to the Company’s Quarterly Report on Form 10-Q for the Quarter Ended September 30, 2009, filed February 8, 2010.
|
||||||
|
+*10.31
|
Form of Indemnification Agreement for directors and executive officers of the Company, incorporated by reference to the Exhibits to the Company’s Annual Report on Form 10-K filed March 30, 2010.
|
||||||
|
+*10.32
|
Amendment to Employment Agreement dated October 27, 2009 by and between James J. Cramer and the Company, incorporated by reference to the Exhibits to the Company’s Annual Report on Form 10-K filed March 30, 2010.
|
||||||
|
+10.33
|
Amendment dated January 5, 2010 to Employment Agreement between James J. Cramer and the Company.
|
||||||
|
+10.34
|
Term Sheet dated as of July 28, 2010 between Thomas Etergino and the Company.
|
||||||
|
+10.35
|
Agreement for Grant of Restricted Stock Units dated as of September 7, 2010 between Thomas Etergino and the Company.
|
||||||
|
+10.36
|
Severance Agreement dated as of September 7, 2010 between Thomas Etergino and the Company.
|
||||||
|
+§10.37
|
Employment Agreement dated as of December 10, 2010 between James J. Cramer and the Company.
|
||||||
|
+10.38
|
Amendment No. 1 dated December 16, 2010 to Employment Agreement between James J. Cramer and the Company.
|
||||||
|
*14.1
|
Code of Business Conduct and Ethics, incorporated by reference to the Exhibits to the Company’s Current Report on Form 8-K filed January 31, 2005.
|
||||||
|
21.1
|
Subsidiaries of the Company
|
||||||
|
23.1
|
Consent of KPMG LLP.
|
||||||
|
23.2
|
Consent of Marcum LLP.
|
||||||
|
31.1
|
Rule 13a-14(a) Certification of CEO.
|
||||||
|
31.2
|
Rule 13a-14(a) Certification of CFO.
|
||||||
|
32.1
|
Section 1350 Certification of CEO.
|
||||||
|
32.2
|
Section 1350 Certification of CFO.
|
||||||
|
*
|
Incorporated by reference
|
|
|
+
|
Indicates management contract or compensatory plan or arrangement
|
|
|
§
|
Indicates confidential treatment has been requested for a portion of this exhibit.
|