Attached files
| file | filename |
|---|---|
| 10-K - FORM 10-K - FARMERS NATIONAL BANC CORP /OH/ | c13966e10vk.htm |
| EX-23 - EXHIBIT 23 - FARMERS NATIONAL BANC CORP /OH/ | c13966exv23.htm |
| EX-21 - EXHIBIT 21 - FARMERS NATIONAL BANC CORP /OH/ | c13966exv21.htm |
| EX-31.1 - EXHIBIT 31.1 - FARMERS NATIONAL BANC CORP /OH/ | c13966exv31w1.htm |
| EX-10.2 - EXHIBIT 10.2 - FARMERS NATIONAL BANC CORP /OH/ | c13966exv10w2.htm |
| EX-31.2 - EXHIBIT 31.2 - FARMERS NATIONAL BANC CORP /OH/ | c13966exv31w2.htm |
| EX-32.1 - EXHIBIT 32.1 - FARMERS NATIONAL BANC CORP /OH/ | c13966exv32w1.htm |
| EX-32.2 - EXHIBIT 32.2 - FARMERS NATIONAL BANC CORP /OH/ | c13966exv32w2.htm |
Exhibit 13


CORPORATE PROFILE
Farmers National Banc Corp. (the “Company”) is a multi-bank holding company registered
under the Bank Holding Company Act of 1956, as amended. The Company provides full banking services
through its nationally chartered subsidiary, The Farmers National Bank of Canfield (the “Bank”).
The Company provides trust services through its subsidiary, Farmers Trust Company, and insurance
services through the Bank’s subsidiary, Farmers National Insurance. Farmers Trust Company has a
state-chartered bank license to conduct trust business from the Ohio Department of Commerce —
Division of Financial Institutions.
The Farmers National Bank, chartered in 1887, is a full-service financial services company
engaged in commercial and retail banking with a total of seventeen (17) retail offices and two (2)
trust offices located in the counties of Mahoning, Columbiana and Trumbull in the State of Ohio. In
addition, the Farmers National Bank provides 24-hour access to a network of Automated Teller
Machines and offers Internet and telephone banking services. Farmers National Bank competes with
state and national banks, as well as with a large number of other financial institutions, such as
thrifts, insurance companies, consumer finance companies, credit unions and commercial finance
leasing companies for deposits, loans and other financial service business. The principal methods
by which Farmers National Bank competes are loan interest rates, the rates paid for funds, the fees
charged for services and the availability of services.
As a national banking association, Farmers National Bank is a member of the Federal Reserve
System, is subject to the supervision and regulation of the Office of the Comptroller of the
Currency, and deposits are insured by the Federal Deposit Insurance Corporation to the extent
provided by law.
CORE VALUES/ BELIEFS
Integrity
Respect
Diligence
Stewardship
Commitment
Relationships
Respect
Diligence
Stewardship
Commitment
Relationships
MISSION STATEMENT
“Our organization will strive to be the premier financial partner providing the best products
and services to achieve innovative solutions for customers, associates, shareholders and the
community. We will do so with integrity, respect and commitment to quality.”

TABLE OF CONTENTS
Financial Highlights |
3 | |||
Letters To Our Shareholders |
4-9 | |||
Investor Information |
10 | |||
Selected Financial Data |
11-14 | |||
Management’s Discussion & Analysis |
14-24 | |||
Management’s Report on Internal Control Over Financial Reporting |
25 | |||
Report of Independent Auditors |
26 | |||
Consolidated Financial Statements & Notes |
27-48 | |||
Community Giving |
49 | |||
Farmers National Financial Group |
50 | |||
Board of Directors & Executive Team |
51 |
ANNUAL MEETING NOTICE
The Annual Meeting of Shareholders will be held at the Family Life
Center Banquet Hall at St. Michael Parish at 300 North Broad Street,
Canfield, OH 44406 at 3:30 p.m. local time,
on Thursday, April 28, 2011.
FINANCIAL HIGHLIGHTS
(Dollar Amounts in Thousands Except for Per Share Data)
| For the Year | 2010 | 2009 | 2008 | |||||||||
Net Income |
$ | 8,991 | $ | 5,842 | $ | 5,665 | ||||||
Return on Average Assets |
0.87 | % | 0.60 | % | 0.67 | % | ||||||
Return on Average Equity |
10.46 | % | 7.32 | % | 7.67 | % | ||||||
Per Share |
||||||||||||
Net Income (Basic) |
$ | 0.66 | $ | 0.44 | $ | 0.43 | ||||||
Net Income (Diluted) |
0.66 | 0.44 | 0.43 | |||||||||
Book Value |
6.45 | 5.96 | 5.83 | |||||||||
Balances at Year-End |
||||||||||||
Total Assets |
$ | 982,751 | $ | 1,014,808 | $ | 880,370 | ||||||
Earning Assets |
915,224 | 948,187 | 829,173 | |||||||||
Total Deposits |
761,050 | 777,552 | 648,010 | |||||||||
Net Loans |
581,060 | 601,995 | 546,452 | |||||||||
Total Stockholders’ Equity |
88,048 | 80,628 | 77,102 | |||||||||
Cash Dividends |
1,626 | 4,801 | 6,802 | |||||||||
Common Shares Outstanding |
13,646 | 13,520 | 13,230 | |||||||||
3
FROM THE DESK OF:
JOHN S. GULAS, PRESIDENT & CEO
JOHN S. GULAS, PRESIDENT & CEO

For 124 years, we have maintained disciplined focus on our core values. We will continue to stay focused on those values as we chart a course for the future.
Dear Fellow Shareholders:
The past two years were the most challenging for banks since “The Great Depression” and were dubbed
by many as “The Great Recession”. From December 31, 2008 to December 31, 2010, federal regulators
closed almost 300 banks. Many of these failed institutions were community banks caught up in a
changing regulatory environment and stressed credit quality situations.
Your Bank took a different approach than many. We focused on strategies and actions that
strengthened our company now and afforded us the opportunity to invest for our future success.
Farmers shunned TARP, tried to anticipate regulatory changes and established a plan to attain
profitable growth while maintaining — and improving — sound operations and risk management.
Farmers has remained profitable
throughout this past cycle and has taken advantage of opportunities
presented. From December 31, 2008 to December 31, 2010, we
grew assets by 12%,
loans by 6% and core
deposits by 13% resulting in revenue growth of 26%.
For 124 years, we have maintained disciplined focus on our core values and will continue to stay
focused on those values as we chart a course for the future. The road ahead will be full of new
challenges and we will need to be more flexible to address those challenges. The regulatory
landscape will continue to evolve and we must adapt. We must actively address our structural
limitations if we are to replace revenue streams currently under attack by new regulations.
CAPITAL RAISING INITIATIVES
We are pleased to report that with your help, we have successfully raised $15 million in new
capital. This new capital represents the fuel we need to take us into a secure future. It will
position us to generate additional assets and revenues that should create additional profits that
can be reinvested in our business and distributed as dividends to our shareholders. The key to our
success in increasing the revenues necessary to meet our goals will include proper deployment of
this capital and the ability to be more flexible in identifying and opportunistically acting on
new, profitable growth situations.
RISK MANAGEMENT AND ASSET QUALITY
This will continue to be a key differentiator for successful banks and will remain a focus for
Farmers. We made significant investments in 2010 and will again in 2011 to make sure that we have
the right people and processes in place to ensure proper credit, investment, rate, market,
reputation and overall enterprise risk management. This process has provided protection for our
shareholders in the past and will continue to ensure our viability into the future.
BRAND ENHANCEMENT
We have found that a focus on being Farmers National Bank has served us well. There is value
in our brand. We are engaged with the community and recognized as the bank of choice for customers
looking for a true relationship-focused community bank. Our campaigns have demonstrated your Bank
to be “Rock Solid,” a “Safe Harbor” and that we “Stand Strong”. All supporting the sound claim that
Farmers is the strongest local bank, providing us with the image and exposure needed to gain a
larger percentage of the market in the Valley.
4
ATTRACT, DEVELOP AND RETAIN QUALITY PEOPLE
We are continuing our focus on attracting and retaining the right people. We have improved our
health benefits program while cutting costs. Our 401-k plan has expanded investment options with
reduced administrative costs. Farmers Academy is in its second year of training our internal talent
as leaders for the future. We need motivated, dedicated and responsible associates to deliver the
quality service we envision for our customers and return value to our shareholders. To retain the
right people, we will need to improve our compensation programs to compete with our peers. By
treating employees fairly, and with dignity and respect, we will retain and attract a satisfied
workforce focused on adding value to themselves and our shareholders.
LEVERAGE TECHNOLOGY
We made needed upgrades to our systems and infrastructure over the last two years. We are now
seeing the benefits of these upgrades in improved products and services, to meet the changing needs
of our customers. These improvements have also aided management with improved financial and risk
reporting allowing us to achieve improved profitability, as evidenced by our 54% improvement in
earnings and attainment of a 61% efficiency ratio and 4.1% net-interest margin. Our IT area is now
properly staffed and has only touched the surface of value-added enhancements that will contribute
to additional successes.
EXPAND ASSET BASE THROUGH LOAN AND CORE DEPOSIT GROWTH
One of our greatest opportunities in 2011 will be the continued expansion of our quality loan
portfolio and core deposits in the Mahoning Valley. Our current market share is still below what we
believe to be our fair share of the marketplace. Our approximate market share in Mahoning and
Columbiana counties is 10% and is about 7% in Trumbull County. Our strategy for organic growth is
to attain a more significant market share in each of these markets in order to become one of the
top providers of financial services in each of these markets. During this time of economic
upheaval, we appreciate the need to diversify our market risk, but not to reach beyond our core
competencies. We will look for opportunistic situations that fit our risk profile in Northeastern
Ohio and Western Pennsylvania.
DIVERSIFY FINANCIALS
Diversification of revenue sources
has also been very important to Farmers in the past two
years. Excluding security gains and impairment of securities, we have experienced 117% growth in
our non-interest income since 2008. This growth contributed to our ability to meet the added cost of
regulatory mandates and the economic impacts to our credit customers. These new revenues should
allow us to move toward improved dividends as earnings continue to improve and the economic cycle
returns to normal. Our new tool kit of services allows us to penetrate and expand our customer
base, while reducing our interest rate risk. Farmers Trust Company has grown 50% since its
acquisition in 2009 and our Farmers National Investments group added 57% in net revenues over their
2009 production. Farmers National Insurance is still in its formative period, but should provide
great opportunities for revenue growth as it completes its first full year in 2011.
I think you will agree we have had many successes. We believe these successes are only a taste of
what the future holds for Farmers. We believe that we are well-positioned to take advantage of
opportunities within the Mahoning Valley; however, we need your assistance in making additional
changes to our governance documents so that we have the flexibility to meet future challenges and
capitalize on new opportunities. These changes are more fully described in the accompanying proxy
statement and you will be asked to vote on these changes at our Annual Meeting. I encourage you to
call me with any questions that you have regarding our business vision, our hopes and our desires.
In addition, I would be happy to discuss any of the items we are requesting shareholders to vote on
at our upcoming Annual Meeting. Your support is imperative to our long-term success, especially in
light of the ever changing economic and regulatory environment in which we operate, and we urge you
to vote on the matters presented at the Annual Meeting.
I thank you, as does our entire Senior Team and Board of Directors, for your past and future
support in securing the future of Farmers
National Banc Corp.
Sincerely,

John S. Gulas
President & CEO
5
FROM THE DESK OF:
FRANK L. PADEN, EXECUTIVE CHAIRMAN OF THE BOARD
FRANK L. PADEN, EXECUTIVE CHAIRMAN OF THE BOARD

This new capital injection was the first of its kind for the Company in over 30 years.
Letter from the Executive Chairman of the Board to the Shareholders:
I encourage you to read this 2010 Annual Report to Shareholders. You will find favorable reports on
how this Company adjusted accordingly to the changing regulatory environment, produced amazing
results in difficult economic conditions, and took many steps to invest responsibly for future
growth and revenue enhancement opportunities.
Our Board of Directors made some very hard business decisions during this past year. Our record of
financial stability enabled us to make key strategic decisions to leverage our conservative
operating model that provides us with a strong core revenue stream together with diverse revenue
sources that enhance our opportunities for future growth and profitability. To support this growth
and pursue our strategic initiatives, during January 2011, we successfully completed a rights and
public offering of our common shares. Through the sale of 5,000,000 shares of common shares, we
were able to generate gross proceeds of $15,000,000 as a source of new capital. These funds will be
used to enable the Company to continue pursuing our program of controlled growth and diversifying
our sources of revenue. This new capital injection was the first of its kind for the Company in
over 30 years.
In July of this past year, the Board promoted Mr. John S. Gulas to the position of President and
CEO for Farmers National Banc Corp. and the subsidiary bank, Farmers National Bank. At that same
time, having served as President & CEO for the past 14 years, the Board of Directors appointed me
to serve as the Executive Chairman of the Board during the final stage of this management
succession plan.
Mr. Gulas, who was also appointed to the Board of Directors at that time, reshaped the Senior
Leadership team and reinvigorated our Company.
Additionally, two new directors were appointed to the Board in order to fill the retirements of Mr.
James R. Fisher and Mr. Benjamin R. Brown. Mr. Lance J. Ciroli joined the Board in October
following a 33 year career in the bank regulatory industry supervising community banks. Mr. David
Z. Paull was added to the Board on January 1, 2011. Mr. Paull is employed with RTI International
Metals, Inc. as a Vice President Human Resources Operations and Labor Relations for over 32 years.
In February 2011, Mr. Joseph D. Lane informed the Board that he would not seek to be elected for a
new three year term. Our Corporate Governance and Nominating Committee is pleased to nominate and
recommend the approval of Mr. Gregory C. Bestic to fill the spot held by Mr. Lane. Mr. Bestic, a
CPA and Cr. F. A., is the Managing Principal with the local accounting firm of Schroedel, Scullin
and Bestic, LLC and brings over 33 years of public accounting experience.
Our success has hinged on the community service and the loyalty and dedication of all our
customers. I’m extremely proud of our knowledgeable, caring staff, the leadership of management and
our Board of Directors. I personally thank all of the shareholders for your support and trust you
have in our Company.
Very truly yours,

Frank L. Paden
Executive Chairman of the Board
6
FROM THE DESK OF:
JAMES H. SISEK, ESQ. PRESIDENT & CEO
AND WILLIAM HANSHAW, ESQ. EXECUTIVE V.P. & SECRETARY
JAMES H. SISEK, ESQ. PRESIDENT & CEO
AND WILLIAM HANSHAW, ESQ. EXECUTIVE V.P. & SECRETARY

|
 |
|
James H. Sisek, Esq.
|
William Hanshaw, Esq. | |
President & CEO
|
Executive V.P. & Secretary |
On behalf of Farmers Trust Company,
we are pleased to announce record growth in assets and earnings
for the calendar year 2010. Trust assets increased in value from $822 million in December
of 2009
to $912 million in December of 2010. Operating earnings before tax and amortization increased to
$1.1 million. While some of the growth is due to the rebound in the equity markets, we attribute most of the
growth to the desire of individuals and charitable institutions to have their financial affairs and
family wealth managed locally with individuals they know and trust. The growth of Farmers Trust
Company, together with the synergy of Farmers National Bank, continues to benefit clients and
shareholders.
Other highlights during 2010 include:
| • | The reorganization of our Investment Department to our downtown Youngstown offices with five investment officers. |
| • | The retirement, after 14 years, of Karen L. Cipperley as Chief Investment Officer. |
| • | The promotion of Scott R. Schulick to Senior Trust Investment Officer and Treasurer, and Amy L. Jones to Trust Officer. |
| • | The promotion of four employees to officer positions: Margaret S. Adams, Esq., William F. Moss III, Michelle M. Schenker, and Eric R. Watson. |
| • | The growth of our Employee Benefits Department with assets increased to $163 million. |
| • | The expansion of our Tax Department, which files in excess of 1,000 tax returns electronically on both the Federal and State level. |
| • | The establishment of a formal Business Development division. |

During the calendar year 2010, continuing improvements were made to the Metavante Trust Accounting
System, which daily tracks and balances all securities in the Company together with posted
dividends and interest. All securities are valued on a daily basis and are available for client
view through our internet information service known as Portfolio Online. This feature allows
clients to monitor their portfolios and market value information at their convenience 24/7, and to
discuss any issues with the appropriate administrative or investment office assigned to the account
in a timely manner.
Clients of Farmers Trust Company continue to be among the most generous in the Mahoning Valley.
During the year, individuals, private foundations, and charitable trusts contributed in excess of
$6 million to beneficiaries throughout the community. Significant grants were made in the field of
education to Youngstown State University, Mount Union College, Westminster College and the College
of Wooster. Distributions to local health providers were made to St. Elizabeth Medical Center,
Akron Children’s Hospital, and Trumbull Memorial Hospital, as well as to Western Reserve Care
System. Humanitarian grants were made to the American Red Cross, Hospice and the Rescue Mission
among others, while cultural programs such as the Mahoning Valley Historical Society, The
Youngstown Symphony Center, Henry H. Stambaugh Auditorium, and the Butler Institute of American Art
were also recipients.
With offices in downtown Youngstown and in Howland, our professional staff of 28 is skilled in
administering all types of personal trusts, charitable trusts, estates, employee benefits, and
personal financial planning. Maintaining local administrative, investment, operations, employee
benefits, tax and business development departments, Farmers Trust Company looks forward to
additional growth in the Valley during the calendar year 2011. Thank you for your continued
confidence and allowing us to assist you with your investments, charitable and estate planning, and
personal and business affairs.
Sincerely,
Sincerely,

|
 |
|
James H. Sisek, Esq.
|
William Hanshaw, Esq. | |
President & CEO
|
Executive V.P. & Secretary |
7
FROM THE DESK OF:
CARL D. CULP, EXECUTIVE VICE PRESIDENT & CFO
CARL D. CULP, EXECUTIVE VICE PRESIDENT & CFO

The net interest margin improved from 3.88% at December 31, 2009 to 4.10% for 2010, or 22 basis points.
To Our Shareholders,
The following paragraphs provide a brief overview of relevant information regarding your Company’s
financial performance in 2010.
Net income for 2010 was $9.0 million, or $0.66 basic and diluted earnings per share, compared to
$5.8 million, or $0.44 diluted earnings per share in 2009, increases of 53.9% and 50%,
respectively. The results for 2010 included security gains of $2.7 million, compared to $1.0
million in 2009.
The net interest margin improved from 3.88% at December 31, 2009 to 4.10% for 2010, or 22 basis
points. Total average earning assets increased 5.63%, while the yields on those average-earning
assets decreased 47 basis points from 5.72% in 2009 to 5.25% in 2010. Total interest-bearing
liabilities increased 5.62%, and the cost on the average interest-bearing liabilities decreased
from 2.01% in 2009 to 1.27% in 2010, or 74 basis points. The decrease in cost was the result of
lower rates of interest paid on interest-bearing deposits and repurchase agreements. The increase
in net
interest margin combined with a higher level of earning assets resulted in a significant
improvement in net interest income from the previous year.
Noninterest income increased by $3.8 million in 2010, primarily as a result of an increase of $1.4
million in trust income and a $1.7 million increase in security gains. The addition of Farmers
Trust Company in March 2009 continues to complement our existing core retail and asset management
services.
DEPOSITS
Average deposits increased 7.51% during the past year, as the growth in money market accounts
was offset by a decrease in time deposits when our customers moved deposit dollars from time
deposits seeking liquidity. Your Company’s focus is on core deposit growth and we will continue to
price deposit rates to remain competitive within the market and to retain customers. At December
31, 2010, core deposits, which are defined as savings and money market accounts, time deposits less
than $100 thousand, demand deposits and interest-bearing demand deposits, represent 86% of our
total deposits.
8
LOANS
Average loans increased 3% during 2010. The Company continues to build on a strategy developed
a few years ago to diversify the loan portfolio and employ a more balanced portfolio management
model between commercial, commercial real estate, residential real estate and consumer loans. At
year-end, we have approximately 13% of the loan portfolio in commercial loans, 34% in commercial
real estate loans, 30% in residential real estate loans and 23% in consumer loans. Our team of
experienced loan officers remains focused on increasing our portfolio by building long-term
customer relationships.
During the year, management provided $8.08 million to the allowance for loan losses. Although the
Company has a lower level of non-performing loans at December 31, 2010, compared to the same time
in 2009, management believed an increase in the allowance for loan losses was necessary because of
an increase in the historical loss experience of commercial real estate loans and commercial and
industrial loans that are classified as substandard. Substandard loans are those that exhibit one
or more structural weakness and are characterized by the distinct possibility that the Company will
sustain some loss on the loan unless the weaknesses are corrected. Two key ratios to monitor asset
quality performance are the allowance for loan losses to total loans and the allowance for loan
losses to non-performing loans. At year-end 2010, these ratios improved to 1.58% and 105%,
respectively compared to 1.21% and 73% in 2009. Management remains diligent in monitoring local
economic conditions and the impact that it may have on our loan portfolio.
Loan strategies for the upcoming year are to grow balances in our loan portfolios responsibly,
while maintaining our underwriting standards and carefully pricing new loans in a potentially
rising interest rate environment.
STOCKHOLDERS EQUITY
Stockholders’ equity increased $7.4 million, or 9.2%, during 2010. At the end of the year,
Farmers National Bank is “well capitalized” under regulatory guidelines. In order to preserve
capital and create a stronger position for long-term shareholder value, we decreased our quarterly
cash dividend to $0.03 per share during the first quarter 2010. Total cash dividends declared were
$1.6 million in 2010 and $4.8 million in 2009.
At the beginning of 2011, our Company was successful in raising new capital that will provide the
fuel needed to again grow our asset base and provide additional revenue producing opportunities. We
will continue to remain focused on our core values as we strive to build shareholder value.
Sincerely,

Carl D. Culp
Executive Vice President & CFO

9
INVESTOR INFORMATION
Corporate Headquarters: Farmers National Banc Corp., 20 South Broad Street, P.O.
Box 555, Canfield, OH 44406. Phone 330-533-5127 or Toll Free 1-888-988-3276.
Website: www.farmersbankgroup.com
Dividend Payments: Subject to the approval of the Board of Directors, quarterly cash dividends are
customarily payable on or about the 30th day of March, June, September and December.
Transfer Agent: Registrar and Transfer Company, Attention: Stock Transfer Services, 10 Commerce
Drive, Cranford, NJ 07016
Dividend Reinvestment Plan (DRIP): Registered shareholders can purchase additional common shares
of Farmers’ common stock through Farmers Dividend Reinvestment Plan. Participation is voluntary
and allows for automatic reinvestment of cash dividends and the safekeeping of stock certificates.
To obtain a prospectus, contact the Registrar and Transfer Co. at 1-800-368-5948.
Direct Deposit of Cash Dividends: The direct deposit program, which is offered at no charge,
provides for automatic deposit of quarterly dividends directly to a checking or savings account.
For information regarding this program, please contact the Registrar and Transfer Co. at
1-800-368-5948.
Annual Report on Form 10-K: A copy of the Annual Report on Form 10-K filed with the Securities and
Exchange Commission will be provided to any shareholder on request to the Company, to the
attention: Mr. Carl D. Culp, Farmers National Banc Corp., 20 South Broad Street, P.O. Box 555
Canfield, OH 44406
Common Stock Listing and Information as to Stock Prices and Dividends: The Company’s common shares
trade on the OTC Bulletin Board under the symbol FMNB.OB. There are approximately six local and/or
regional brokerage firms that are known to be relatively active in trading the Company’s common
shares. Set forth in the accompanying table are per share prices at which common shares have
actually been purchased and sold in transactions during the periods indicated, to the knowledge of
the Company. Also included in the table are dividends per share paid on the outstanding Company’s
common shares and any shares dividends paid. As of December 31, 2010, there were 13,646,035 shares
outstanding and 3,691 shareholders of record of common shares.
MARKET AND DIVIDEND SUMMARY
| Dividend Date | High | Low | Dividend | |||||||||
March 2009 |
$ | 6.74 | $ | 3.65 | $ | 0.12 | ||||||
June 2009 |
$ | 6.80 | $ | 4.70 | $ | 0.12 | ||||||
September 2009 |
$ | 6.20 | $ | 4.70 | $ | 0.06 | ||||||
December 2009 |
$ | 5.40 | $ | 4.00 | $ | 0.06 | ||||||
March 2010 |
$ | 4.80 | $ | 4.10 | $ | 0.03 | ||||||
June 2010 |
$ | 4.65 | $ | 3.50 | $ | 0.03 | ||||||
September 2010 |
$ | 4.10 | $ | 3.47 | $ | 0.03 | ||||||
December 2010 |
$ | 3.70 | $ | 3.45 | $ | 0.03 | ||||||
The following graph compares the cumulative five year total return to shareholders on Farmers
National Banc Corp.’s common shares relative to the cumulative total returns of the NASDAQ
Composite index and the NASDAQ Bank index. The graph assumes that the value of the investment
in the Company’s common shares and in each of the indexes (including reinvestment of
dividends) was $100 on 12/31/2005 and tracks it through 12/31/2010.
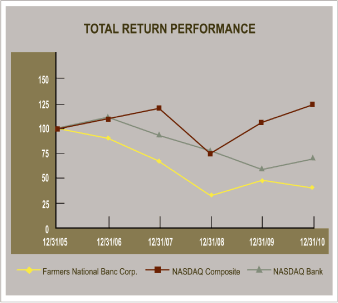
| 12/31/05 | 12/31/06 | 12/31/07 | 12/31/08 | 12/31/09 | 12/31/10 | |||||||||||||||||||
Farmers National Banc Corp. |
100.00 | 87.70 | 68.44 | 33.72 | 47.66 | 38.88 | ||||||||||||||||||
NASDAQ Composite |
100.00 | 110.39 | 122.15 | 73.32 | 106.57 | 125.91 | ||||||||||||||||||
NASDAQ Bank |
100.00 | 113.82 | 91.16 | 71.52 | 59.87 | 68.34 | ||||||||||||||||||
The stock price performance included in this graph is not
necessarily indicative of future stock price performance.
10
SELECTED FINANCIAL DATA
(Table Dollar Amounts In Thousands except Share and Per Share Data)
| For the Years Ending December 31, | 2010 | 2009 | 2008 | 2007 | 2006 | |||||||||||||||
SUMMARY OF EARNINGS |
||||||||||||||||||||
Total Interest Income (including fees on loans) |
$ | 48,365 | $ | 49,775 | $ | 46,415 | $ | 45,538 | $ | 44,098 | ||||||||||
Total Interest Expense |
10,998 | 16,547 | 19,947 | 21,893 | 20,199 | |||||||||||||||
Net Interest Income |
37,367 | 33,228 | 26,468 | 23,645 | 23,899 | |||||||||||||||
Provision for Loan Losses |
8,078 | 6,050 | 1,420 | 570 | 200 | |||||||||||||||
Noninterest Income (1) |
13,210 | 9,388 | 2,617 | 4,408 | 5,134 | |||||||||||||||
Noninterest Expense |
30,964 | 29,655 | 21,013 | 20,382 | 19,619 | |||||||||||||||
Income Before Income Taxes |
11,535 | 6,911 | 6,652 | 7,101 | 9,214 | |||||||||||||||
Income Taxes |
2,544 | 1,069 | 987 | 1,176 | 1,999 | |||||||||||||||
NET INCOME |
$ | 8,991 | $ | 5,842 | $ | 5,665 | $ | 5,925 | $ | 7,215 | ||||||||||
PER SHARE DATA |
||||||||||||||||||||
Basic earnings per share |
$ | 0.66 | $ | 0.44 | $ | 0.43 | $ | 0.46 | $ | 0.55 | ||||||||||
Diluted earnings per share |
0.66 | 0.44 | 0.43 | 0.46 | 0.55 | |||||||||||||||
Cash Dividends Paid |
0.12 | 0.36 | 0.52 | 0.64 | 0.64 | |||||||||||||||
Book Value at Year-End |
6.45 | 5.96 | 5.83 | 5.67 | 5.83 | |||||||||||||||
Tangible Book Value (2) |
5.95 | 5.41 | 5.83 | 5.67 | 5.83 | |||||||||||||||
BALANCES AT YEAR-END |
||||||||||||||||||||
Total Assets |
$ | 982,751 | $ | 1,014,808 | $ | 880,370 | $ | 798,236 | $ | 821,584 | ||||||||||
Earning Assets |
915,224 | 948,187 | 829,173 | 745,482 | 778,719 | |||||||||||||||
Total Deposits |
761,050 | 777,552 | 648,010 | 593,428 | 619,747 | |||||||||||||||
Short-Term Borrowings |
105,634 | 125,912 | 105,435 | 74,174 | 77,792 | |||||||||||||||
Long-Term Borrowings |
24,733 | 27,169 | 46,464 | 52,455 | 41,602 | |||||||||||||||
Net Loans |
581,060 | 601,995 | 546,452 | 508,647 | 502,594 | |||||||||||||||
Total Stockholders’ Equity |
88,048 | 80,628 | 77,102 | 73,920 | 76,223 | |||||||||||||||
AVERAGE BALANCES |
||||||||||||||||||||
Total Assets |
$ | 1,030,516 | $ | 970,163 | $ | 841,630 | $ | 804,968 | $ | 818,549 | ||||||||||
Total Stockholders’ Equity |
85,968 | 79,775 | 73,889 | 74,615 | 75,143 | |||||||||||||||
SIGNIFICANT RATIOS |
||||||||||||||||||||
Return on Average Assets (ROA) |
0.87 | % | 0.60 | % | 0.67 | % | 0.74 | % | 0.88 | % | ||||||||||
Return on Average Equity (ROE) |
10.46 | 7.32 | 7.67 | 7.94 | 9.60 | |||||||||||||||
Average Earning Assets/Average Assets |
92.28 | 92.79 | 93.67 | 94.86 | 94.98 | |||||||||||||||
Average Equity/Average Assets |
8.34 | 8.22 | 8.78 | 9.26 | 9.18 | |||||||||||||||
Loans/Deposits |
77.57 | 78.37 | 85.18 | 86.63 | 82.00 | |||||||||||||||
Allowance for Loan Losses/Total Loans |
1.58 | 1.21 | 1.01 | 1.06 | 1.10 | |||||||||||||||
Allowance for Loan Losses/Nonperforming Loans |
104.56 | 73.25 | 104.05 | 231.22 | 324.85 | |||||||||||||||
Efficiency Ratio (On tax equivalent basis) |
61.10 | 67.00 | 63.02 | 68.00 | 64.98 | |||||||||||||||
Net Interest Margin |
4.10 | 3.88 | 3.58 | 3.33 | 3.29 | |||||||||||||||
Dividend Payout Rate |
18.08 | 82.18 | 120.07 | 140.24 | 115.14 | |||||||||||||||
Tangible Common Equity Ratio (3) |
8.31 | 7.26 | 8.76 | 9.26 | 9.28 | |||||||||||||||
| (1) | Noninterest income includes a securities impairment charge of $74 thousand, $2.7 million and $873 thousand, respectively, for the years ended December 31, 2009, 2008 and 2007. | |
| (2) | Tangible book value per share is total stockholders’ equity minus goodwill and other intangible assets divided by the number of shares outstanding. |
11
SELECTED FINANCIAL DATA
(Table Dollar Amounts In Thousands except Share and Per Share Data)
(Table Dollar Amounts In Thousands except Share and Per Share Data)
| (3) | The tangible common equity ratio is calculated by dividing total common stockholders’ equity by total assets, after reducing both amounts by intangible assets. The tangible common equity ratio is not required by United States generally accepted accounting principals (U.S. GAAP) or by applicable bank regulatory requirements, but is a metric used by management to evaluate the adequacy of the Company’s capital levels. Since there is no authoritative requirement to calculate the tangible common equity ratio, the Company’s tangible common equity ratio is not necessarily comparable to similar capital measures disclosed or used by other companies in the financial services industry. Tangible common equity and tangible assets are non U.S. GAAP financial measures and should be considered in addition to, not as a substitute for or superior to, financial measures determined in accordance with U.S. GAAP. With respect to the calculation of the actual unaudited tangible common equity ratio as of December 31, reconciliations of tangible common equity to U.S. GAAP total common stockholders’ equity and tangible assets to U.S. GAAP total assets are set forth below: |
Reconciliation of Common Stockholders’ Equity to Tangible Common Equity
| December 31, | 2010 | 2009 | 2008 | 2007 | 2006 | |||||||||||||||
Stockholders’ Equity |
$ | 88,048 | $ | 80,628 | $ | 77,102 | $ | 73,920 | $ | 76,223 | ||||||||||
Less Goodwill and other intangibles |
6,920 | 7,500 | 0 | 0 | 0 | |||||||||||||||
Tangible Common Equity |
$ | 81,128 | $ | 73,128 | $ | 77,102 | $ | 73,920 | $ | 76,223 | ||||||||||
Reconciliation of Total Assets to Tangible Assets
| December 31, | 2010 | 2009 | 2008 | 2007 | 2006 | |||||||||||||||
Total Assets |
$ | 982,751 | $ | 1,014,808 | $ | 880,370 | $ | 798,236 | $ | 821,584 | ||||||||||
Less Goodwill and other intangibles |
6,920 | 7,500 | 0 | 0 | 0 | |||||||||||||||
Tangible Assets |
$ | 975,831 | $ | 1,007,308 | $ | 880,370 | $ | 798,236 | $ | 821,584 | ||||||||||
12
AVERAGE BALANCE SHEETS AND RELATED YIELDS AND RATES
(Table Dollar Amounts In Thousands except Share and Per Share Data)
(Table Dollar Amounts In Thousands except Share and Per Share Data)
| Years Ended December 31, | 2010 | 2009 | 2008 | |||||||||||||||||||||||||||||||||
| AVERAGE | AVERAGE | AVERAGE | ||||||||||||||||||||||||||||||||||
| BALANCE | INTEREST | RATE | BALANCE | INTEREST | RATE | BALANCE | INTEREST | RATE | ||||||||||||||||||||||||||||
EARNING ASSETS |
||||||||||||||||||||||||||||||||||||
Loans (1) (3) (5) |
$ | 598,931 | $ | 37,235 | 6.22 | % | $ | 581,629 | $ | 38,130 | 6.56 | % | $ | 515,671 | $ | 35,351 | 6.86 | % | ||||||||||||||||||
Taxable securities (2) |
252,450 | 8,755 | 3.47 | 224,784 | 9,399 | 4.18 | 183,201 | 8,063 | 4.40 | |||||||||||||||||||||||||||
Tax-exempt securities (2) (5) |
62,804 | 3,729 | 5.94 | 60,911 | 3,667 | 6.02 | 67,666 | 3,985 | 5.89 | |||||||||||||||||||||||||||
Equity securities (4) (5) |
4,126 | 189 | 4.58 | 5,147 | 263 | 5.11 | 7,414 | 420 | 5.66 | |||||||||||||||||||||||||||
Federal funds sold |
32,638 | 56 | 0.17 | 27,769 | 32 | 0.12 | 14,402 | 338 | 2.35 | |||||||||||||||||||||||||||
Total earning assets |
950,949 | 49,964 | 5.25 | 900,240 | 51,491 | 5.72 | 788,354 | 48,157 | 6.11 | |||||||||||||||||||||||||||
NONEARNING ASSETS |
||||||||||||||||||||||||||||||||||||
Cash and due from banks |
22,926 | 23,098 | 23,089 | |||||||||||||||||||||||||||||||||
Premises and equipment |
14,292 | 14,230 | 14,363 | |||||||||||||||||||||||||||||||||
Allowance for Loan Losses |
(7,885 | ) | (6,377 | ) | (5,433 | ) | ||||||||||||||||||||||||||||||
Unrealized gains (losses) on
securities |
10,030 | 5,980 | (1,089 | ) | ||||||||||||||||||||||||||||||||
Other assets (1) |
40,204 | 32,992 | 22,346 | |||||||||||||||||||||||||||||||||
Total Assets |
$ | 1,030,516 | $ | 970,163 | $ | 841,630 | ||||||||||||||||||||||||||||||
INTEREST-BEARING LIABILITIES |
||||||||||||||||||||||||||||||||||||
Time deposits |
$ | 289,581 | $ | 7,156 | 2.47 | % | $ | 312,511 | $ | 9,742 | 3.12 | % | $ | 286,980 | $ | 12,216 | 4.26 | % | ||||||||||||||||||
Savings deposits |
300,538 | 1,762 | 0.59 | 238,618 | 2,670 | 1.12 | 186,022 | 2,964 | 1.59 | |||||||||||||||||||||||||||
Demand deposits |
107,890 | 125 | 0.12 | 101,470 | 314 | 0.31 | 97,401 | 468 | 0.48 | |||||||||||||||||||||||||||
Short term borrowings |
144,583 | 872 | 0.60 | 123,758 | 1,847 | 1.49 | 80,621 | 2,047 | 2.54 | |||||||||||||||||||||||||||
Long term borrowings |
25,472 | 1,083 | 4.25 | 45,543 | 1,974 | 4.33 | 49,261 | 2,252 | 4.57 | |||||||||||||||||||||||||||
Total Interest-Bearing
Liabilities |
868,064 | 10,998 | 1.27 | 821,900 | 16,547 | 2.01 | 700,285 | 19,947 | 2.85 | |||||||||||||||||||||||||||
NONINTEREST-BEARING LIABILITIES
AND STOCKHOLDERS’ EQUITY |
||||||||||||||||||||||||||||||||||||
Demand deposits |
73,044 | 64,563 | 62,350 | |||||||||||||||||||||||||||||||||
Other Liabilities |
3,440 | 3,925 | 5,106 | |||||||||||||||||||||||||||||||||
Stockholders’ equity |
85,968 | 79,775 | 73,889 | |||||||||||||||||||||||||||||||||
Total Liabilities and
Stockholders’ Equity |
$ | 1,030,516 | $ | 970,163 | $ | 841,630 | ||||||||||||||||||||||||||||||
Net interest income and
interest rate spread |
$ | 38,966 | 3.98 | % | $ | 34,944 | 3.71 | % | $ | 28,210 | 3.26 | % | ||||||||||||||||||||||||
Net interest margin |
4.10 | % | 3.88 | % | 3.58 | % | ||||||||||||||||||||||||||||||
| (1) | Non-accrual loans and overdraft deposits are included in other assets. | |
| (2) | Includes unamortized discounts and premiums. Average balance and yield are computed using the average historical amortized cost. | |
| (3) | Interest on loans includes fee income of $2.0 million, $2.3 million and $1.9 million for 2010, 2009 and 2008, respectively, and is reduced by amortization of $1.8 million, $1.5 million and $1.1 million for 2010, 2009 and 2008, respectively. | |
| (4) | Equity securities include restricted shares, which is included in other assets on the consolidated balance sheets. | |
| (5) | For 2010, adjustments of $360 thousand and $1.2 million are made to tax equate income on tax exempt loans and tax exempt securities. For 2009, adjustments of $496 thousand and $1.2 million are made to tax equate income on tax exempt loans and tax exempt securities. For 2008, adjustments of $386 thousand, $1.3 million, and $32 thousand respectively are made to tax equate income on tax exempt loans, tax exempt securities and to reflect a dividends received deduction on equity securities. These adjustments are based on a marginal federal income tax rate of 35%, less disallowances. |
13
RATE AND VOLUME ANALYSIS
(Table Dollar Amounts In Thousands except Share and Per Share Data)
(Table Dollar Amounts In Thousands except Share and Per Share Data)
| The following table analyzes by rate and volume the dollar amount of changes in the components of the interest differential: |
| 2010 change from 2009 | 2009 change from 2008 | |||||||||||||||||||||||
| Net | Change Due | Change Due | Net | Change Due | Change Due | |||||||||||||||||||
| Change | To Volume | To Rate | Change | To Volume | To Rate | |||||||||||||||||||
TAX EQUIVALENT INTEREST INCOME |
||||||||||||||||||||||||
Loans |
$ | (895 | ) | $ | 1,134 | $ | (2,029 | ) | $ | 2,779 | $ | 4,522 | $ | (1,743 | ) | |||||||||
Taxable securities |
(644 | ) | 1,157 | (1,801 | ) | 1,336 | 1,830 | (494 | ) | |||||||||||||||
Tax-exempt securities |
62 | 114 | (52 | ) | (318 | ) | (398 | ) | 80 | |||||||||||||||
Equity securities |
(74 | ) | (52 | ) | (22 | ) | (157 | ) | (128 | ) | (29 | ) | ||||||||||||
Federal funds sold |
24 | 6 | 18 | (306 | ) | 314 | (620 | ) | ||||||||||||||||
Total interest income |
$ | (1,527 | ) | $ | 2,359 | $ | (3,886 | ) | $ | 3,334 | $ | 6,140 | $ | (2,806 | ) | |||||||||
INTEREST EXPENSE |
||||||||||||||||||||||||
Time deposits |
$ | (2,586 | ) | $ | (715 | ) | $ | (1,871 | ) | $ | (2,474 | ) | $ | 1,087 | $ | (3,561 | ) | |||||||
Savings deposits |
(908 | ) | 693 | (1,601 | ) | (294 | ) | 838 | (1,132 | ) | ||||||||||||||
Demand deposits |
(189 | ) | 20 | (209 | ) | (154 | ) | 20 | (174 | ) | ||||||||||||||
Short term borrowings |
(975 | ) | 310 | (1,285 | ) | (200 | ) | 1,095 | (1,295 | ) | ||||||||||||||
Long term borrowings |
(891 | ) | (869 | ) | (22 | ) | (278 | ) | (170 | ) | (108 | ) | ||||||||||||
Total interest expense |
$ | (5,549 | ) | $ | (561 | ) | $ | (4,988 | ) | $ | (3,400 | ) | $ | 2,870 | $ | (6,270 | ) | |||||||
Increase (decrease) in tax equivalent
net interest income |
$ | 4,022 | $ | 2,920 | $ | 1,102 | $ | 6,734 | $ | 3,270 | $ | 3,464 | ||||||||||||
The amount of change not solely due to rate or volume changes was allocated between
the change due to rate and the change due to volume based on the relative size of the rate and
volume changes.
MANAGEMENT’S DISCUSSION AND ANALYSIS OF FINANCIAL CONDITION AND RESULTS OF OPERATIONS
Management’s discussion and analysis represents a review of the Company’s consolidated
financial condition and results of operations. This review should be read in conjunction with the
consolidated financial statements and footnotes.
Forward Looking Statements
Discussions in this report that are not statements of historical fact (including
statements that include terms such as “will,” “may,” “should,” “believe,” “expect,” “anticipate,”
“estimate,” “project,” intend,” and “plan”) are forward-looking statements that involve risks and
uncertainties. Any forward-looking statement is not a guarantee of future performance and actual
future results could differ materially from those contained in forward-looking information. Factors
that could cause or contribute to such differences include, without limitation, risks and
uncertainties detailed from time to time in the Company’s filings with the Securities and Exchange
Commission, including, without limitation, the risk factors disclosed in Item 1A, “Risk Factors,”
in the Company’s 2010 Annual Report on Form 10-K.
Many of these factors are beyond the Company’s ability to control or predict, and readers are
cautioned not to put undue reliance on those forward-looking statements. The following list, which
is not intended to be an all-encompassing list of risks and uncertainties affecting the Company,
summarizes several factors that could cause the Company’s actual results to differ materially from
those anticipated or expected in these forward-looking statements:
| • | general economic conditions in market areas where the Company conducts business, which could materially impact credit quality trends; | ||
| • | business conditions in the banking industry; | ||
| • | the regulatory environment; | ||
| • | fluctuations in interest rates; | ||
| • | demand for loans in the market areas where the Company conducts business; | ||
| • | rapidly changing technology and evolving banking industry standards; | ||
| • | competitive factors, including increased competition with regional and national financial institutions; | ||
| • | new service and product offerings by competitors and price pressures; and | ||
| • | other like items. |
14
MANAGEMENT’S DISCUSSION
(Table Dollar Amounts In Thousands except Share and Per Share Data)
(Table Dollar Amounts In Thousands except Share and Per Share Data)
Other factors not currently anticipated may also materially and adversely affect
the Company’s results of operations, cash flows and financial position. There can be no assurance
that future results will meet expectations. While the Company believes that the forward-looking
statements in this Annual Report are reasonable, the reader should not place undue reliance on any
forward-looking statement. In addition, these statements speak only as of the date made. The
Company does not undertake, and expressly disclaims, any obligation to update or alter any
statements whether as a result of new information, future events or otherwise, except as may be
required by applicable law.
Results of Operations:
Comparison of Operating Results for the Years Ended December 31, 2010 and 2009.
The Company’s net income totaled $9.0 million during 2010, compared to $5.8 million for
2009. On a per share basis, diluted earnings per share were $0.66 as compared to $0.44 diluted
earnings per share for 2009. Common comparative ratios for results of operations include the return
on average assets and return on average stockholders’ equity. For 2010, the return on average
equity was 10.46%, compared to 7.32% for 2009 and the return on average assets was 0.87% for 2010
and 0.60% for 2009.
The results for 2010 included $2.7 million in gains on sales of securities, compared to $1.0
million in 2009.
Net interest income,
the principal source of the Company’s earnings, represents the difference
between interest income on interest-earning assets and interest expense on interest-bearing
liabilities. For 2010, taxable equivalent net interest income
increased $4.0 million,
or 11.51%, from
2009. Interest-earning assets averaged $950.9 million during 2010 increasing
$50.7 million or 5.63%,
compared to 2009. The Company’s interest-bearing liabilities increased 5.62% from
$821.9 million in
2009 to $868.1 million in 2010.
The Company finances its earning assets with a combination of interest-bearing and
interest-free funds. The interest-bearing funds are composed of deposits, short-term borrowings and
long-term debt. Interest paid for the use of these funds is the second factor in the net interest
income equation. Interest-free funds, such as demand deposits and stockholders’ equity, require no
interest expense and, therefore, contribute significantly to net interest income.
The profit margin, or spread, on invested funds is a key performance measure. The Company
monitors two key performance indicators — net interest spread and net interest margin. The net
interest spread represents the difference between the average rate earned on interest-earning
assets and the average rate paid on interest-bearing liabilities. The net interest spread in 2010
was 3.98%, increasing from 3.71% in 2009. The net interest margin represents the overall profit
margin: net interest income as a percentage of total interest-earning assets. This performance
indicator gives effect to interest earned for all investable funds, including the substantial
volume of interest-free funds. For 2010, the net interest margin, measured on a fully taxable
equivalent basis increased to 4.10%, compared to 3.88% in 2009.
Total taxable equivalent interest income was $50.0 million for 2010, which is $1.5 million
less than the $51.5 million reported in 2009. This decrease is primarily the result of a decline on
the yield of earning assets, offset by growth in the level of average earning assets. Average loans
increased $17.3 million, or 2.97%, in 2010, but the yields decreased from 6.56% in 2009 to 6.22% in
2010. Income from securities and federal funds decreased $632 thousand, or 4.73%, in 2010, as the
Company saw its yields on these assets decrease from 4.19% in 2009 to 3.62% in 2010. The average
balance of investment securities and federal funds sold increased 10.49% in 2010, mainly due to
increases in customer deposits.
Total interest expense amounted to $11.0 million for 2010, a 33.53% decrease from $16.5
million reported in 2009. The decrease in 2010 is the result of lower rates of interest paid on
interest-bearing deposits and repurchase agreements. The cost of interest-bearing liabilities
decreased from 2.01% in 2009 to 1.27% in 2010.
Management will continue to evaluate future changes in interest rates and the shape of the
treasury yield curve so that assets and liabilities may be priced accordingly to minimize the
impact on the net interest margin.
Noninterest Income
Total noninterest income increased by $3.8 million in 2010. Some of this increase is a
result of a $1.7 million increase in gains on sales of securities. The Company sold $69.4 million
in securities to recognize market appreciation on existing holdings and to further diversify the
securities portfolio.
The increase in noninterest income was also the result of a $1.4 million increase in trust fee
income. Farmers Trust Company was purchased on March 31, 2009; therefore, the prior year’s results
included only nine months of income compared to twelve months in 2010. The addition of Farmers
Trust Company, and its growth from $822 million in trust assets at December 31, 2009 to over $912
million in assets at December 31, 2010, complements the Company’s existing core retail and asset
management services.
Bank owned life insurance income also increased $372 thousand. This increase is primarily due
to the receipt of death benefit proceeds in excess of cash value, which are included in income.
Service charges on deposit accounts decreased by $522 thousand. Most of this decrease was primarily
a result of a decline in overdraft fee income. The Company is uncertain of the future trend in
reduced overdraft fees in light of new consumer regulatory provisions associated with these fees.
Insurance agency commissions increased by $154 thousand in 2010. Farmers National Insurance
commenced operations in August 2009; therefore the prior year’s results included only five months
of income compared to twelve months in 2010. Other operating income also increased by $454 thousand
during 2010. Most of this increase is the result of a one-time income item recognized from a $285
thousand arbitration settlement.
Excluding gains on sales of securities, noninterest income for the twelve months ended
December 31, 2010 would have improved by 24.69% when compared to the same period of 2009.
15
MANAGEMENT’S DISCUSSION
(Table Dollar Amounts In Thousands except Share and Per Share Data)
(Table Dollar Amounts In Thousands except Share and Per Share Data)
Noninterest Expenses
Noninterest expense for 2010 was $31.0 million, compared to $29.7 million for the same period
in 2009, representing an increase of $1.3 million, or 4.41%. The increase resulted from the
inclusion of expenses associated with Farmers Trust Company throughout 2010. Because Farmers Trust
Company was acquired on March 31, 2009, results for 2009 included only nine months of expenses
associated with its operations. Farmers Trust Company’s noninterest expense was $4.6 million for
2010, compared to $3.4 million reported for the same period in 2009.
Core processing charges increased by $742 thousand in 2010. During late 2009 the Company
outsourced core processing services that were previously performed in house, resulting in the
increase over 2009. Professional fees also increased by $379 thousand. Most of this increase is due
to legal expenses associated with the Company’s capital raising activities.
Below is a detail of noninterest expense line items classified between Farmers
Trust Company, the Company excluding Farmers Trust Company, and the total Company for the year
ending December 31, 2010. The Company purchased Farmers Trust Company on March 31, 2009,
subsequently only nine months of trust noninterest expense is detailed in the following table
for the year ended December 31, 2009:
| For the Year Ended: | December 31, 2010 | December 31, 2009 | ||||||||||||||||||||||
| Farmers | Farmers | |||||||||||||||||||||||
| Trust | Bank | Total | Trust | Bank | Total | |||||||||||||||||||
| Company | and Others | Company | Company | and Others | Company | |||||||||||||||||||
Noninterest expense |
||||||||||||||||||||||||
Salaries and employee benefits |
$ | 2,607 | $ | 13,799 | $ | 16,406 | $ | 2,072 | $ | 13,073 | $ | 15,145 | ||||||||||||
Occupancy and equipment |
509 | 3,200 | 3,709 | 343 | 3,195 | 3,538 | ||||||||||||||||||
State and local taxes |
116 | 784 | 900 | 47 | 883 | 930 | ||||||||||||||||||
Professional fees |
56 | 1,343 | 1,399 | 36 | 984 | 1,020 | ||||||||||||||||||
Advertising |
9 | 628 | 637 | 24 | 571 | 595 | ||||||||||||||||||
FDIC insurance |
0 | 1,306 | 1,306 | 0 | 1,543 | 1,543 | ||||||||||||||||||
Merger related costs |
0 | 0 | 0 | 0 | 453 | 453 | ||||||||||||||||||
Intangible amortization |
580 | 0 | 580 | 449 | 0 | 449 | ||||||||||||||||||
Core processing charges |
0 | 973 | 973 | 0 | 231 | 231 | ||||||||||||||||||
Other operating expenses |
711 | 4,343 | 5,054 | 429 | 5,322 | 5,751 | ||||||||||||||||||
Total noninterest expense |
$ | 4,588 | $ | 23,376 | $ | 30,964 | $ | 3,400 | $ | 26,255 | $ | 29,655 | ||||||||||||
The Company’s tax equivalent efficiency ratio for the twelve month period ended December 31,
2010 was 61.10%, compared to 67.00% for the same period in 2009. The improvement in the efficiency
ratio was the result of the 12.5% improvement in net interest income and a $2.1 million increase in
noninterest income, excluding gains on sales of securities. The efficiency ratio is calculated as
follows: noninterest expense divided by the sum of tax equivalent net interest income plus
noninterest income, excluding security gains and losses and intangible amortization. This ratio is
a measure of the expense incurred to generate a dollar of revenue. Management will continue to closely monitor
and keep the increases in other expenses to a minimum.
16
MANAGEMENT’S DISCUSSION
(Table Dollar Amounts In Thousands except Share and Per Share Data)
(Table Dollar Amounts In Thousands except Share and Per Share Data)
Income Taxes
Income tax expense totaled $2.5 million for 2010 and $1.1 million for 2009. Income taxes are
computed using the appropriate effective tax rates for each period. The effective tax rates are
less than the statutory tax rate primarily due to nontaxable interest and dividend income. The
effective income tax rate was 22% for 2010 and 15% for 2009. The increase in the effective tax rate
was due to the Company having relatively comparable tax exempt income in 2010 and 2009, while
income before income taxes was significantly higher in 2010. Thus, tax exempt income had a more
significant impact on the effective tax rate in 2009. Refer to Note 14 (Income Taxes) to the
consolidated financial statements for additional information regarding the effective tax rate.
COMPARISON OF OPERATING RESULTS FOR THE YEARS ENDED DECEMBER 31, 2009 AND 2008.
The Company’s net income totaled $5.8 million during 2009 compared to $5.7 million for 2008.
On a per share basis, diluted earnings per share was $0.44 for 2009 as compared to $0.43 for 2008.
For 2009, the return on average equity was 7.32% as compared to 7.67% for 2008. The return on
average assets was 0.60% for 2009 and 0.67% for 2008. For 2009, taxable equivalent net interest
income increased $6.7 million, or 23.87%, more than 2008. Interest-earning assets averaged $900.2
million during 2009 increasing $111.9 million, or 14.19%, compared to 2008. For 2009, the net
interest margin, measured on a fully taxable equivalent basis, was 3.88%, in comparison to 3.58%
for 2008. The results for 2009 included a pre-tax charge of $74 thousand recognized for
other-than-temporary impairment of securities, compared to $2.7 million of impairment charges
recognized in 2008.
Total taxable equivalent interest income was $51.5 million for 2009, which was $3.3 million
more than the $48.2 million reported in 2008. This increase was primarily the result of an increase
in the level of average earning assets, increasing 14.2% in 2009. Average loan balances increased
$66.0 million or 12.79%, but the yields decreased from 6.86% in 2008 to 6.56% in 2009. Income from
securities and federal funds sold increased $555 thousand, or 4.33%, in 2009, but the Company saw
its yields on these assets decrease from 4.70% in 2008 to 4.19% in 2009. The average balances of
investment securities and federal funds sold increased 16.8% in 2009, mainly due to increases in
customer deposits.
Total interest expense amounted to $16.5 million for 2009, a 17.1% decrease from $19.9 million
reported in 2008. The decrease in 2009 is the result of lower rates of interest paid on
interest-bearing deposits and repurchase agreements more than offsetting higher average balances of
interest-bearing liabilities. The cost of interest-bearing liabilities decreased from 2.85% in 2008
to 2.01% in 2009.
Noninterest Income
Total noninterest income in 2009, excluding $74 thousand and $2.7 million pre-tax impairment
charges in 2009 and 2008, respectively, increased by $4.1 million from 2008. Most of this
increase is due to an addition of $3.5 million in trust income. During 2009, the Company
completed an acquisition of Butler Wick Trust Company now known as Farmers Trust Company.
Noninterest income was also impacted by gains on the sales of securities. Security gains were
$1.0 million in 2009 compared to $474 thousand in 2008.
Noninterest Expenses
Total noninterest expenses for 2009 increased 41.1%, or $8.6 million, from 2008, and was
mainly the result of an increase of $3.5 million in salaries and employee benefits, $1.4 million in
FDIC insurance premiums, $453 thousand in merger costs and $449 thousand in intangible amortization
associated with the Farmers Trust Company acquisition. Most of the $3.5 million increase in
salaries and employee benefits can be attributed to increases of $2.6 million in salaries and $561
thousand in employee health insurance expense of the Farmers Trust Company. The Company’s
tax-equivalent efficiency ratio declined from 63% in 2008 to 67% in 2009. The efficiency ratio was
adversely impacted by the merger expenses and FDIC insurance expenses.
Income Taxes
Income tax expense totaled $1.1 million for 2009 and $987 thousand for 2008. The effective
income tax rate was 15% for the years ending 2009 and 2008.
Market Risk
Important considerations in asset/liability management are liquidity, the balance between
interest rate sensitive assets and liabilities and the adequacy of capital. Interest rate sensitive
assets and liabilities are those which have yields on rates subject to change within a future time
period due to maturity of the instrument or changes in market rates. While liquidity management
involves meeting the funds flow requirements of the Company, the management of interest rate
sensitivity focuses on the structure of these assets and liabilities with respect to maturity and
repricing characteristics. Balancing interest rate sensitive assets and liabilities provides a
means of tempering fluctuating interest rates and maintaining net interest margins through periods
of changing interest rates. The Company monitors interest rate sensitive assets and liabilities to
determine the overall interest rate position over various time frames.
The Company considers the primary market exposure to be interest rate risk. Simulation
analysis is used to monitor the Company’s exposure to changes in interest rates, and the effect of
the change to net interest income. The following table shows the effect on net interest income and
the net present value of equity in the event of a sudden and sustained 200 basis point increase or
decrease in market interest rates:
| Changes In Interest Rate | 2010 | 2009 | ALCO | |||||||||
| (basis points) | Result | Result | Guidelines | |||||||||
Net Interest
Income Change |
||||||||||||
+200 |
-3.54 | % | -6.41 | % | 15.00 | % | ||||||
-200 |
-3.10 | % | -2.09 | % | 15.00 | % | ||||||
Net Present Value
Of Equity Change |
||||||||||||
+200 |
-2.24 | % | -6.32 | % | 20.00 | % | ||||||
-200 |
-32.08 | % | -31.98 | % | 20.00 | % | ||||||
17
MANAGEMENT’S DISCUSSION
(Table Dollar Amounts In Thousands except Share and Per Share Data)
(Table Dollar Amounts In Thousands except Share and Per Share Data)
It should be noted that the change in the net present value of equity exceeded policy
when the simulation model assumed a sudden decrease in rates of 200 basis points (2%). This occurs
primarily because the positive impact on the fair value of assets would not be as great as the
negative impact on the fair value of certain liabilities. Specifically, because core deposits
typically bear relatively low interest rates, their fair value would be negatively impacted as the
rates could not be adjusted by the full extent of the sudden decrease in rates. Management does not
believe that a 200 basis rate decline is realistic in the current interest rate environment. The
remaining results of this analysis comply with internal limits established by the Company. A report
on interest rate risk is presented to the Board of Directors and the Asset/Liability Committee on a
quarterly basis. The Company has no market risk sensitive instruments held for trading purposes,
nor does it hold derivative financial instruments, and does not plan to purchase these instruments
in the near future.
With the largest amount of interest sensitive assets and liabilities maturing within twelve
months, the Company monitors this area most closely. Early withdrawal of deposits, prepayments of
loans and loan delinquencies are some of the factors that can impact actual results in comparison
to our simulation analysis. In addition, changes in rates on interest sensitive assets and
liabilities may not be equal, which could result in a change in net interest margin.
Interest rate sensitivity management provides some degree of protection against net interest
income volatility. It is not possible or necessarily desirable to attempt to eliminate this risk
completely by matching interest sensitive assets and liabilities. Other factors, such as market
demand, interest rate outlook, regulatory restraint and strategic planning also have an effect on
the desired balance sheet structure.
Liquidity
The Company maintains, in the opinion of management, liquidity sufficient to satisfy
depositors’ requirements and meet the credit needs of customers. The Company depends on its ability
to maintain its market share of deposits as well as acquiring new funds. The Company’s ability to
attract deposits and borrow funds depends in large measure on its profitability, capitalization and
overall financial condition.
Principal sources of liquidity for the Company include assets considered relatively liquid
such as short-term investment securities, federal funds sold and cash and due from banks.
Along with its liquid assets, the Company has additional sources of liquidity available which
help to insure that adequate funds are available as needed. These other sources include, but are
not limited to, loan repayments, the ability to obtain deposits through the adjustment of interest
rates and the purchasing of federal funds and borrowings on an approved line of credit of $8.0
million, at a major domestic bank, that is below prime rate. At December 31, 2010, the Company had
not borrowed against this line of credit. Management feels that its liquidity position is more than
adequate and will continue to monitor
the position on a monthly basis. The Company also has additional borrowing capacity with the
Federal Home Loan Bank of Cincinnati (“FHLB”), as well as access to the Federal Reserve Discount
Window, which provides an additional source of funds. The Company views its membership in the FHLB
as a solid source of liquidity. As of December 31, 2010, Farmers National Bank is eligible to
borrow an additional $53.3 million from the FHLB under various fixed rate and variable rate credit
facilities. Advances outstanding from the Federal Home Loan Bank at December 31, 2010 amounted to
$24.5 million.
The primary investing activities of the Company are originating loans and purchasing
securities. During 2010, net cash from investing activities amounted to $6.7 million, compared to
$105.5 million used in 2009. Net decreases in loans were $12.1 million in 2010, compared to a net
increase of $62.2 million in 2009. Purchases of securities available for sale were $138.2 million
in 2010, compared to $126.5 million in 2009. Proceeds from maturities and sales of securities
available for sale were $132.1 million in 2010, compared to $92.9 million in 2009.
The primary financing activities of the Company are obtaining deposits, repurchase agreements
and other borrowings. Net cash used by financing activities amounted to $40.4 million for 2010,
compared to $127.4 million provided in 2009. Most of this change is a result of the net decrease in
deposits. Deposits decreased $16.5 million in 2010 compared to a $129.5 million increase in 2009.
Short-term borrowings decreased $20.3 million in 2010 compared to a $20.5 million increase in 2009.
18
MANAGEMENT’S DISCUSSION
(Table Dollar Amounts In Thousands except Share and Per Share Data)
(Table Dollar Amounts In Thousands except Share and Per Share Data)
LOAN PORTFOLIO
Maturities and Sensitivities of Loans to Interest Rates
The following schedule shows the composition of loans and the percentage of loans in each
category at the dates indicated:
| Years Ended December 31, | 2010 | 2009 | 2008 | 2007 | 2006 | |||||||||||||||||||||||||||||||||||
Commercial Real Estate |
$ | 203,894 | 34.5 | % | $ | 215,917 | 35.4 | % | $ | 195,244 | 35.4 | % | $ | 193,187 | 37.6 | % | $ | 181,128 | 35.6 | % | ||||||||||||||||||||
Commercial |
76,635 | 13.0 | 75,893 | 12.5 | 70,410 | 12.7 | 45,844 | 8.9 | 40,698 | 8.0 | ||||||||||||||||||||||||||||||
Residential Real Estate |
177,067 | 30.0 | 180,877 | 29.7 | 173,246 | 31.4 | 170,006 | 33.1 | 169,937 | 33.5 | ||||||||||||||||||||||||||||||
Consumer |
132,771 | 22.5 | 136,708 | 22.4 | 113,105 | 20.5 | 105,069 | 20.4 | 116,425 | 22.9 | ||||||||||||||||||||||||||||||
Total Loans |
$ | 590,367 | 100.0 | % | $ | 609,395 | 100.0 | % | $ | 552,005 | 100.0 | % | $ | 514,106 | 100.0 | % | $ | 508,188 | 100.0 | % | ||||||||||||||||||||
The following schedule sets forth maturities based on remaining scheduled repayments of
principal for commercial and commercial real estate loans listed above as of December 31, 2010:
| Types of Loans | 1 Year or less | 1 to 5 Years | Over 5 Years | |||||||||
Commercial and Commercial Real Estate |
$ | 33,971 | $ | 41,884 | $ | 204,674 | ||||||
The amounts of commercial and commercial real estate loans as of December 31, 2010, based on
remaining scheduled repayments of principal, are shown in the following table:
| Loan Sensitivities | 1 Year or less | Over 1 Year | Total | |||||||||
Floating or Adjustable Rates of Interest |
$ | 25,930 | $ | 187,309 | $ | 213,239 | ||||||
Fixed Rates of Interest |
8,041 | 59,249 | 67,290 | |||||||||
Total Loans |
$ | 33,971 | $ | 246,558 | $ | 280,529 | ||||||
Total loans were $590.4 million at year-end 2010, compared to $609.4 million at
year-end 2009, representing a decrease of 3.12%. Loans comprised 62.98% of Farmers National Bank’s
average earning assets in 2010, compared to 64.61% in 2009. The product mix in the loan portfolio
includes commercial loans comprising 13.0%, residential real estate loans 30.0%, commercial real
estate loans 34.5% and consumer loans 22.5% at December 31, 2010, compared with 12.5%, 29.7%, 35.4%
and 22.4%, respectively, at December 31, 2009.
Loans contributed 74.5% of total taxable equivalent interest income in 2010 and 74.1% in 2009.
Loan yield was 6.22% in 2010, 97 basis points greater than the average rate for total earning
assets. Management recognizes that while the Loan Portfolio holds some of Farmers National Bank’s
highest yielding assets, it is inherently the most risky portfolio. Accordingly, management
attempts to balance credit risk versus return with conservative credit standards. Management has
developed and maintains comprehensive underwriting guidelines and a loan review function that
monitors credits during and after the approval process. To minimize risks associated with changes
in the borrower’s future repayment capacity, Farmers National Bank generally requires scheduled
periodic principal and interest payments on all types of loans and normally requires collateral.
Consumer loans decreased from $136.7 million on December 31, 2009 to $132.8 million on
December 31, 2010, representing a 2.88% decrease.
Management continues to target the automobile dealer network to purchase indirect installment
loans. Dealer paper was purchased using strict underwriting guidelines with an emphasis on quality.
Indirect installment loans comprise 90.4% of the consumer loan portfolio. Net loan losses in the
consumer loan portfolio have decreased to $639 thousand in 2010 as compared to $833 thousand in
2009.
Residential real estate mortgage loans decreased 2.11% to $177.1 million at December 31, 2010,
compared to $180.9 million in 2009. Commercial real estate loans decreased from $215.9 million in
2009 to $203.9 million in 2010. The Company originated both fixed rate and adjustable rate
mortgages during 2010. Fixed rate terms are generally limited to fifteen year terms while
adjustable rate products are offered with maturities up to thirty years.
Commercial loans at December 31, 2010 increased 0.98% from year-end 2009 with outstanding
balances of $76.6 million. Farmers National Bank’s commercial loans are granted to customers within
the immediate trade area of the Bank. The mix is diverse, covering a wide range of borrowers,
business types and local municipalities. Farmers National Bank monitors and controls concentrations
within a particular industry or segment of the economy. These loans are made for purposes such as
equipment purchases, capital and leasehold improvements, the purchase of inventory, general working
capital and small business lines of credit.
19
MANAGEMENT’S DISCUSSION
(Table Dollar Amounts In Thousands except Share and Per Share Data)
(Table Dollar Amounts In Thousands except Share and Per Share Data)
SUMMARY OF LOAN LOSS EXPERIENCE
The following is an analysis of the allowance for loan losses for the periods indicated:
| Years Ended December 31, | 2010 | 2009 | 2008 | 2007 | 2006 | |||||||||||||||
Balance at Beginning of Year |
$ | 7,400 | $ | 5,553 | $ | 5,459 | $ | 5,594 | $ | 5,860 | ||||||||||
Charge-Offs: |
||||||||||||||||||||
Commercial Real Estate |
(1,910 | ) | (2,389 | ) | (767 | ) | (385 | ) | (9 | ) | ||||||||||
Commercial |
(2,898 | ) | (911 | ) | (94 | ) | (48 | ) | (19 | ) | ||||||||||
Residential Real Estate |
(760 | ) | (251 | ) | (75 | ) | (67 | ) | (181 | ) | ||||||||||
Consumer |
(1,177 | ) | (1,248 | ) | (795 | ) | (612 | ) | (850 | ) | ||||||||||
Total Charge-Offs |
(6,745 | ) | (4,799 | ) | (1,731 | ) | (1,112 | ) | (1,059 | ) | ||||||||||
Recoveries on Previous Charge-Offs: |
||||||||||||||||||||
Commercial Real Estate |
26 | 178 | 0 | 0 | 2 | |||||||||||||||
Commercial |
8 | 2 | 19 | 3 | 24 | |||||||||||||||
Residential Real Estate |
2 | 1 | 0 | 5 | 0 | |||||||||||||||
Consumer |
538 | 415 | 386 | 399 | 567 | |||||||||||||||
Total Recoveries |
574 | 596 | 405 | 407 | 593 | |||||||||||||||
Net Charge-Offs |
(6,171 | ) | (4,203 | ) | (1,326 | ) | (705 | ) | (466 | ) | ||||||||||
Provision for Loan Losses |
8,078 | 6,050 | 1,420 | 570 | 200 | |||||||||||||||
Balance at End of Year |
$ | 9,307 | $ | 7,400 | $ | 5,553 | $ | 5,459 | $ | 5,594 | ||||||||||
Ratio of Net Charge-Offs to Average
Loans Outstanding |
1.02 | % | 0.72 | % | 0.26 | % | 0.14 | % | 0.09 | % | ||||||||||
Provisions charged to operations amounted to $8.1 million in 2010, compared to $6.1
million in 2009. The provision for loan losses charged to operating expense is based on
management’s judgment after taking into consideration all factors connected with the collectibility
of the existing loan portfolio. Management evaluates the loan portfolio in light of economic
conditions, changes in the nature and volume of the loan portfolio, industry standards and other
relevant factors. Specific factors considered by management in determining the amounts charged to
operating expenses include previous charge-off experience, the status of past due interest and
principal payments, the quality of financial information supplied by loan customers and the general
condition of the industries in the community to which loans have been made.
The allowance for loan losses increased $1.9 million during the year. The primary reason for
the increase in the current year was the increase in net charge-offs which increased the historical
loss experience of commercial real estate loans and commercial and industrial loans that are
classified as substandard. Substandard loans are those that exhibit one or more structural
weaknesses and there is a distinct possibility that Farmers National Bank will suffer a loss on the
loan unless the weakness is corrected. At December 31, 2010, loans considered to be impaired
totaled $7.1 million with an allowance allocation of $605 thousand. At the end of 2009, loans
considered to be impaired were $13.5 million with an allowance allocation of $2.1 million. Loans
individually identified as impaired include nonaccrual commercial and commercial real estate loans
and loans with their contractual terms modified such that they represent troubled debt
restructurings. Impaired loans are carried at the fair value of the underlying collateral, less
estimated disposition costs, if repayment of the loan is expected to be solely dependent on the
sale of the collateral. Otherwise, impaired loans are carried at the present value of expected cash
flows.
The valuation of collateral-dependent impaired loans is a challenging component of the
Company’s financial reporting process due to the timing of when a loan is identified as impaired
and the need to timely close the Company’s books for a given period. Typically, commercial and
commercial real estate loans are identified as impaired when they become ninety days past due, or
earlier if management believes it is probable that the Company will not collect all amounts due
under the terms of the loan agreement. When the Company identifies a loan as impaired and also
concludes that the loan is collateral dependent, the Company performs an internal collateral
valuation as an interim measure. The Company typically obtains an external appraisal to validate
its internal collateral valuation as soon as is practical. To the extent that an external appraisal
returns a value estimate that is materially different from the Company’s internally generated
estimate before the release of its interim or annual financial statements, the Company will adjust
the associated specific loss reserve and, if necessary, the Company’s consolidated financial
statements for the difference.
The increase in net charge-offs and the historical loss experience of commercial real estate
loans and commercial and industrial loans mentioned above is offset by the improvement in asset
quality indicators in the loan portfolio. The ratio of nonperforming loans to total loans decreased
from 1.66% at December 31, 2009 to 1.51% at December 31, 2010. As of December 31, 2010, total
non-performing loans were $8.9 million, compared to $10.1 million at the end of 2009. The ratio of
the allowance for loan losses to non-performing loans at December 31, 2010 was 104.56%, compared to
73.25% at December 31, 2009. The decrease in non-performing loans is primarily due to a decline in
the level of commercial and industrial loans and commercial real estate loans that are in default
according to the terms of the contract. The balance in the allowance for loan losses is $9.3
million or 1.58% of loans at December 31, 2010. This ratio has increased from the 1.21% reported at
December 31, 2009.
20
MANAGEMENT’S DISCUSSION
(Table Dollar Amounts In Thousands except Share and Per Share Data)
(Table Dollar Amounts In Thousands except Share and Per Share Data)
NONPERFORMING ASSETS
| December 31, | 2010 | 2009 | 2008 | 2007 | 2006 | |||||||||||||||
Nonaccrual loans: |
||||||||||||||||||||
Commercial Real Estate |
$ | 3,972 | $ | 5,677 | $ | 2,820 | $ | 975 | $ | 171 | ||||||||||
Commercial |
400 | 1,504 | 342 | 0 | 38 | |||||||||||||||
Residential Real Estate |
4,177 | 2,281 | 1,485 | 975 | 975 | |||||||||||||||
Consumer |
27 | 172 | 128 | 77 | 101 | |||||||||||||||
Total Nonaccrual Loans |
$ | 8,576 | $ | 9,634 | $ | 4,775 | $ | 2,027 | $ | 1,285 | ||||||||||
Loans Past Due 90 Days or More |
325 | 469 | 562 | 334 | 437 | |||||||||||||||
Total Nonperforming Loans |
$ | 8,901 | $ | 10,103 | $ | 5,337 | $ | 2,361 | $ | 1,722 | ||||||||||
Other Real Estate Owned |
532 | 374 | 65 | 0 | 0 | |||||||||||||||
Total Nonperforming Assets |
$ | 9,433 | $ | 10,477 | $ | 5,402 | $ | 2,361 | $ | 1,722 | ||||||||||
Loans modified in troubled debt restructuring (1) |
$ | 2,974 | $ | 5,440 | $ | 0 | $ | 0 | $ | 0 | ||||||||||
Percentage of Nonperforming Loans to Loans |
1.51 | % | 1.66 | % | 0.97 | % | 0.46 | % | 0.34 | % | ||||||||||
Percentage of Nonperforming Assets to Total Assets |
0.96 | % | 1.03 | % | 0.61 | % | 0.30 | % | 0.21 | % | ||||||||||
Loans Delinquent 30-90 days |
7,924 | 9,212 | 9,660 | 4,667 | 4,142 | |||||||||||||||
Percentage of Loans Delinquent 30-90 days to Total Loans |
1.34 | % | 1.51 | % | 1.75 | % | 0.91 | % | 0.82 | % | ||||||||||
| (1) | Not included in nonaccrual loans |
The
company has forgone interest income of approximately $325 thousand
from nonaccrual loans as of December 31, 2010 that would have been
earned during the year if all loans had performed in accordance with
their original terms.
Net charge-offs as a percentage of average loans outstanding increased from 0.72% for
2009 to 1.02% for 2010. The Company’s net charge-offs were primarily concentrated in commercial,
commercial real estate and consumer loans. The net losses in commercial loans accounted for 46.8%
of the total net losses, commercial real estate loans accounted for 30.5% of the total net losses,
and the consumer loans represented 10.4% of the total.
A significant allocation in the Company’s allowance for loan losses is for performing
commercial and commercial real estate loans classified by the Company’s internal loan review as
substandard. The Company’s loss experience on the average balance of this category of loans for the past two years has been
approximately 11.35% of the principal balance of these loans, which is management’s allocation for
these loans. This equates to an allocation of approximately $3.7 million at the end of 2010,
compared to an allocation of $2.0 million at the end of 2009. The allocation increased primarily
due to an increase in the historical loss experience in the balance of these loans. The Company’s
actual loss experience may be more or less than the amount allocated. At December 31, 2010, the
amount of substandard loans that continue to accrue interest is $36.0 million. As always,
management is working to address weaknesses in each of these specific loans that may result in
loss.
The allowance is allocated among the loan categories based upon the consistent,
quarterly procedures determined by management. However, the entire allowance for loan losses is
available to absorb future losses in any loan category. The following table details the
allocation of the allowance for loan losses at December 31:
| December 31, | 2010 | 2009 | 2008 | 2007 | 2006 | |||||||||||||||||||||||||||||||||||
| Loans | Loans | Loans | Loans | Loans | ||||||||||||||||||||||||||||||||||||
| to Total | to Total | to Total | to Total | to Total | ||||||||||||||||||||||||||||||||||||
| Amount | Loans | Amount | Loans | Amount | Loans | Amount | Loans | Amount | Loans | |||||||||||||||||||||||||||||||
Commercial Real Estate |
$ | 5,780 | 34.5 | % | $ | 4,111 | 35.4 | % | $ | 3,126 | 35.4 | % | $ | 2,956 | 37.6 | % | $ | 2,910 | 35.6 | % | ||||||||||||||||||||
Commercial |
1,707 | 13.0 | % | 1,738 | 12.5 | % | 933 | 12.7 | % | 506 | 8.9 | % | 302 | 8.0 | % | |||||||||||||||||||||||||
Residential Real Estate |
881 | 30.0 | % | 328 | 29.7 | % | 696 | 31.4 | % | 1,026 | 33.1 | % | 1,084 | 33.5 | % | |||||||||||||||||||||||||
Consumer |
875 | 22.5 | % | 1,223 | 22.4 | % | 798 | 20.5 | % | 971 | 20.4 | % | 1,298 | 22.9 | % | |||||||||||||||||||||||||
Unallocated |
64 | — | — | — | — | — | — | — | — | — | ||||||||||||||||||||||||||||||
| $ | 9,307 | 100.0 | % | $ | 7,400 | 100.0 | % | $ | 5,553 | 100.0 | % | $ | 5,459 | 100.0 | % | $ | 5,594 | 100.0 | % | |||||||||||||||||||||
21
MANAGEMENT’S DISCUSSION
(Table Dollar Amounts In Thousands except Share and Per Share Data)
(Table Dollar Amounts In Thousands except Share and Per Share Data)
The allowance allocated to each of the four loan categories should not be interpreted
as an indication that charge-offs in 2011 will occur in the same proportions or that the allocation
indicates future charge-off trends. The allowance allocated to the one-to-four family real estate
loan category and the consumer loan category is based upon the Company’s allowance methodology for
homogeneous loans, and increases and decreases in the balances of those portfolios. In previous
years, the indirect installment loan category has represented the largest percentage of loan
losses. The one-to-four family real estate loan category represents approximately 30.0% of total
loans, but historically has represented a very small percentage of loan losses. For the commercial
loan category, which represents only 13.0% of the total loan portfolio, management relies on Farmer
National Bank’s internal loan review procedures and allocates accordingly based on loan
classifications. The commercial real estate loan category represents 34.5% of the total loan
portfolio.
LOAN COMMITMENTS AND LINES OF CREDIT
In the normal course of business, the Bank has extended various commitments for credit.
Commitments for mortgages, revolving lines of credit and letters of credit generally are extended
for a period of one month up to one year. Normally no fees are charged on any unused portion.
Normally, an annual fee of two percent is charged for the issuance of a letter of credit.
As of December 31, 2010, there were no concentrations of loans exceeding 10% of total loans
that are not disclosed as a category of loans. As of that date also, there were no other
interest-earning assets that are either nonaccrual, past due, restructured or non-performing.
INVESTMENT SECURITIES
The investment securities portfolio increased $5.0 million in 2010. Excess balances of federal
funds sold were strategically invested throughout the year. The Company also sold $69.4 million in
securities in 2010, resulting in net security gains of $2.7 million. The Company sold securities to
recognize market appreciation on existing holdings and to further diversify the securities
portfolio.
The Company’s objective in managing the investment portfolio is to preserve and enhance
corporate liquidity through investment in primarily short and intermediate term securities which
are readily marketable and of the highest credit quality. In general, investment in securities is
limited to those funds Farmers National Bank feels it has in excess of funds used to satisfy loan
demand and operating considerations.
Mortgage-backed securities are created by the pooling of mortgages and issuance of a security.
Mortgage-backed securities typically represent a participation interest in a pool of single-family
or multi-family mortgages. Investments in mortgage-backed securities involve a risk that actual
principal prepayments will be greater than estimated prepayments over the life of the security.
Prepayment estimates for mortgage-backed securities are performed at purchase to ensure that
prepayment assumptions are reasonable considering the underlying collateral for the mortgage-backed
securities at issue and current mortgage interest rates and to determine the yield and estimated
maturity of the mortgage-backed security portfolio. Prepayments that are faster
than anticipated may shorten the life of the security and may result in faster amortization of any
premiums paid and thereby reduce the net yield on such securities. During periods of declining
mortgage interest rates, refinancing generally increases and accelerates the prepayment of the
underlying mortgages and the related security. All holdings of mortgage-backed securities were
issued by U.S. government sponsored enterprises.
The following table shows the carrying value of investment securities by type of obligation at
the dates indicated:
TYPE
| December 31, | 2010 | 2009 | 2008 | |||||||||
U.S. Treasury securities |
$ | 101 | $ | 101 | $ | 800 | ||||||
U.S. government sponsored
enterprise debt securities |
69,877 | 99,732 | 43,881 | |||||||||
Mortgage-backed securities |
163,437 | 145,580 | 165,822 | |||||||||
Obligations of state and
political subdivisions |
80,466 | 63,432 | 60,906 | |||||||||
Other securities |
466 | 523 | 196 | |||||||||
| $ | 314,347 | $ | 309,368 | $ | 271,605 | |||||||
A summary of debt securities held at December 31, 2010 classified according to maturity and
including weighted average yield for each range of maturities is set forth below:
| December 31, 2010 | ||||||||
| Weighted | ||||||||
| Fair | Average | |||||||
| Type and Maturity Grouping | Value | Yield (1) | ||||||
U.S. Treasury securities |
||||||||
Maturing after one year but within five years |
$ | 101 | 0.73 | % | ||||
U.S. government sponsored enterprise |
||||||||
Debt securities |
||||||||
Maturing within one year |
$ | 1,060 | 0.99 | % | ||||
Maturing after one year but within five years |
55,086 | 2.67 | % | |||||
Maturing after five years but within ten years |
8,100 | 3.60 | % | |||||
Maturing after ten years |
5,631 | 4.81 | % | |||||
Total U.S. government sponsored
enterprise debt securities |
$ | 69,877 | 2.91 | % | ||||
Mortgage-backed securities (2) |
||||||||
Maturing within one year |
$ | 38,893 | 3.73 | % | ||||
Maturing after one year but within five years |
67,379 | 3.51 | % | |||||
Maturing after five years but within ten years |
29,512 | 3.17 | % | |||||
Maturing after ten years |
27,653 | 2.98 | % | |||||
Total mortgage-backed securities: |
$ | 163,437 | 3.41 | % | ||||
Obligations of state and political subdivisions |
||||||||
Maturing within one year |
$ | 1,533 | 5.24 | % | ||||
Maturing after one year but within five years |
20,892 | 5.73 | % | |||||
Maturing after five years but within ten years |
37,217 | 5.63 | % | |||||
Maturing after ten years |
20,824 | 6.22 | % | |||||
Total obligations of state and
political subdivisions |
$ | 80,466 | 5.81 | % | ||||
Corporate debt securities |
||||||||
Maturing after one year but within five years |
$ | 267 | 5.00 | % | ||||
| (1) | The weighted average yield has been computed by dividing the total contractual interest income adjusted for amortization of premium or accretion of discount over the life of the security by the par value of the securities outstanding. The weighted average yield of tax-exempt obligations of state and political subdivisions has been calculated on a fully taxable equivalent basis. The amounts of adjustments to interest which are based on the statutory tax rate of 35% were $27 thousand, $382 thousand, $680 thousand and $408 thousand for the four ranges of maturities. | |
| (2) | Payments based on contractual maturity. |
22
MANAGEMENT’S DISCUSSION
(Table Dollar Amounts In Thousands except Share and Per Share Data)
(Table Dollar Amounts In Thousands except Share and Per Share Data)
Deposits
Deposits represent the Company’s principal source of funds. The deposit base consists of
demand deposits, savings and money market accounts and other time deposits. During the year, the
Company’s average total deposits increased 7.51% from $717.2 million in 2009 to $771.1 million in
2010. Money market account balances have increased $30.9 million since December 31, 2009. The
growth in money market accounts was offset by a decrease in time deposits of $69.0 million as
customers have moved deposit dollars from time deposits seeking liquidity. The Company’s focus is
on core deposit growth and the Company will continue to price deposit rates to remain competitive
within the market and to retain customers. At December 31, 2010, core deposits — savings and money
market accounts, time deposits less than $100 thousand, demand deposits and interest bearing demand
deposits represented approximately 87.17% of total deposits.
Bank Owned Life Insurance
The Company owns bank owned life insurance policies on the lives of certain members of
management. The purpose of this transaction is to help fund the costs of employee benefit plans.
The cash surrender value of these policies is $11.5 million at December 31, 2010 compared to $11.4
million at December 31, 2009.
Borrowings
Short-term borrowings decreased $20.3 million or 16.1% since December 31, 2009. Most of this
decrease resulted from securities sold under repurchase agreements, decreasing $20.6 million, or
16.5%. Long-term borrowings decreased $2.4 million or 8.97%, mainly as a result of repayment of
Federal Home Loan Bank advances.
Contractual Obligations, Commitments, Contingent Liabilities and Off-Balance Sheet Arrangements
The following table presents, as of December 31, 2010, the Company’s significant fixed and
determinable contractual obligations by payment date. The payment amounts represent those amounts
contractually due to the recipient and do not include any unamortized premiums or discounts or
other similar carrying value adjustments. Further discussion of the nature of each obligation is
included in referenced note to the consolidated financial statements.
Commitments
12/31/2010
12/31/2010
| Note | There- | |||||||||||||||||||||||||||
| Ref. | 2011 | 2012 | 2013 | 2014 | 2015 | after | ||||||||||||||||||||||
Deposits without
maturity |
— | $ | 504,955 | — | — | — | — | — | ||||||||||||||||||||
Certificates
of deposit |
7 | 107,666 | 46,559 | 23,719 | 16,645 | 59,891 | 1,615 | |||||||||||||||||||||
Repurchase
agreements |
8 | 103,753 | — | — | — | — | — | |||||||||||||||||||||
Other short-term
borrowed funds |
8 | 1,881 | — | — | — | — | — | |||||||||||||||||||||
Federal Home Loan
Bank advances |
9 | 1,751 | 812 | 764 | 10,969 | 5,248 | 5,000 | |||||||||||||||||||||
Other long-term
borrowed funds |
9 | 60 | 65 | 64 | — | — | — | |||||||||||||||||||||
Operating leases |
5 | 219 | 130 | 130 | 119 | 69 | — | |||||||||||||||||||||
Note 10 (Commitments and Contingent Liabilities) to the consolidated financial statements
discusses in greater detail other commitments and contingencies and the various obligations that
exists under those agreements. Examples of these commitments and contingencies include commitments
to extend credit and standby letters of credit.
At December 31, 2010, the Company had no unconsolidated, related special purpose entities, nor
did the Company engage in derivatives and hedging contracts, such as interest rate swaps, that may
expose the Company to liabilities greater than the amounts recorded on the consolidated balance
sheet. Management’s policy is to not engage in derivatives contracts for speculative trading
purposes.
Capital Resources
Total Stockholders’ Equity increased
9.2% from $80.6 million at December 31, 2009 to $88.0
million in 2010. The increase in equity was a result of net income, offset by mark to market
adjustments in the Company’s investment securities and cash dividends paid to stockholders during
the past twelve months. During the year, the Company issued 126 thousand shares through the
dividend reinvestment program. Stockholders received a total of $0.12 per share cash dividends paid
in the past four quarters. Book value increased 8.2% from $5.96 per share at December 31, 2009 to
$6.45 per share at December 31, 2010. The Company’s tangible book value increased 10.0% from $5.41
per share at December 31, 2009 to $5.95 per share at December 31, 2010.
Farmers National Bank, as a national bank, is subject to the dividend restrictions set forth
by the Office of the Comptroller of the Currency, which must approve declaration of any dividends
in excess of the sum of profits for the current year and retained net profits for the preceding two
years (as defined). Farmers National Bank and the Company are required to maintain minimum amounts
of capital to total “risk weighted” assets, as defined by the banking regulators. At December 31,
2010, Farmers National Bank and the Company are required to have a minimum Tier 1 and Total Capital
ratios of 4.00% and 8.00%, respectively. Farmers National Bank and the Company had capital ratios
above the minimum levels at December 31, 2010 and 2009. At year-end 2010 and 2009, the most recent
regulatory notifications categorized Farmers National Bank as well capitalized under the regulatory
framework for prompt corrective action.
23
MANAGEMENT’S DISCUSSION
(Table Dollar Amounts In Thousands except Share and Per Share Data)
(Table Dollar Amounts In Thousands except Share and Per Share Data)
Critical Accounting Policies
The Company follows financial accounting and reporting policies that are in accordance
with generally accepted accounting principles (“GAAP”) in the United States of America and conform to
general practices within the banking industry. Some of these accounting policies are considered to
be critical accounting policies. Critical accounting policies are those policies that require
management’s most difficult, subjective or complex judgments, often as a result of the need to make
estimates about the effect of matters that are inherently uncertain. The Company has identified two
accounting policies that are critical accounting policies and an understanding of these policies is
necessary to understand the consolidated financial statements. These policies relate to determining
the adequacy of the allowance for loan losses and other-than-temporary impairment of securities.
Additional information regarding these policies is included in the notes to the consolidated
financial statements, Note 1 (Summary of Significant Accounting Policies), Note 2 (Securities),
Note 3 (Loans), and the sections above captioned “Loan Portfolio” and “Investment Securities.”
Management believes that the judgments, estimates and assumptions used in the preparation of the
consolidated financial statements are appropriate given the factual circumstances at the time.
The Company maintains an allowance for loan losses. The allowance for loan losses is presented
as a reserve against loans on the balance sheets. Loan losses are charged-off against the allowance
for loan losses, while recoveries of amounts previously charged-off are credited to the allowance
for loan losses. A provision for loan losses is charged to operations based on management’s
periodic evaluation of adequacy of the allowance. The provision for credit losses provides for
probable losses on loans.
Estimating the amount of the allowance for loan losses requires significant judgment and the
use of estimates related to the amount and timing of expected future cash flows on impaired loans,
estimated losses on pools of homogeneous loans based on historical loss experience, and
consideration of current economic trends and conditions, all of which may be susceptible to
significant change. The loan portfolio represents the largest asset category on the consolidated
balance sheets. Management’s assessment of the adequacy of the allowance for loan losses considers
individually impaired loans, pools of homogeneous loans with similar risk characteristics and other
environmental risk factors.
Pools of homogeneous loans with similar risk characteristics are assessed for probable losses.
Probable losses are estimated through application of historical loss experience. Historical loss
experience data used to establish loss estimates may not precisely correspond to the current
portfolio. As a result, the historical loss experience used in the allowance analysis may not be
representative of actual unrealized losses inherent in the portfolio.
Management also evaluates the impact of environmental factors which pose additional risks that
may not adequately be addressed in the analyses described above. Such environmental factors could
include: levels of, and trends in, delinquencies and impaired loans, charge-offs and recoveries;
trends in volume and terms of loans; effects of any changes in lending policies and procedures
including those for underwriting, collection, charge-off, and recovery; experience, ability, and
depth of lending management and staff; national and local economic trends and
conditions; industry and geographic conditions; concentrations of credit such as, but not limited
to, local industries, their employees, suppliers; or any other common risk factor that might affect
loss experience across one or more components of the portfolio. The determination of this component
of the allowances requires considerable management judgment. To the extent actual outcomes differ
from management estimates, additional provision for credit losses could be required that could
adversely affect earnings or financial position in future periods. The “Loan Portfolio” section of
this financial review includes a discussion of the factors driving changes in the allowance for
loan losses during the current period.
Other-than-temporary impairment of securities is the second critical accounting policy.
Declines in the fair value of securities below their cost that are other-than-temporary are
reflected as realized losses. In estimating other-than-temporary losses, management considers: (1)
the length of time, extent, and reasons that fair value has been less than cost, (2) the financial
condition and near term prospects of the issuer, and (3) whether the Company has the intent to sell
the debt security or more likely than not will be required to sell the debt security before its
anticipated recovery.
Management believes that the accounting for goodwill and other intangible assets also involves
a higher degree of judgment than most other significant accounting policies. GAAP establishes
standards for the amortization of acquired intangible assets and the impairment assessment of
goodwill. Goodwill arising from business combinations represents the value attributable to
unidentifiable intangible assets in the business acquired. The Company’s goodwill relates to the
value inherent in the banking industry and that value is dependent upon the ability of Farmers
Trust Company to provide quality, cost-effective trust services in a competitive marketplace. The
goodwill value is supported by revenue that is in part driven by the volume of business transacted.
A decrease in earnings resulting from a decline in the customer base or the inability to deliver
cost-effective services over sustained periods can lead to impairment of goodwill that could
adversely impact earnings in future periods. GAAP requires an annual evaluation of goodwill for
impairment, or more frequently if events or changes in circumstances indicate that the asset might
be impaired. The fair value of the goodwill, which resides on the books of the Farmers Trust
Company, is estimated by reviewing the past and projected operating results for the subsidiary and
trust banking industry comparable information.
At December 31, 2010, on a consolidated basis, the Company had intangibles of $3.2 million
subject to amortization and $3.7 million of goodwill, which was not subject to periodic
amortization.
Recent Accounting Pronouncements and Developments
Note 1 (Summary of Significant Accounting Policies) to the consolidated financial
statements discusses new accounting policies adopted by the Company during 2010 and the expected
impact of accounting policies recently issued or proposed but not yet required to be adopted. To
the extent the adoption of new accounting standards materially affects financial condition, results
of operations, or liquidity, the impacts are discussed in the applicable sections of this financial
review and notes to the consolidated financial statements.
24
MANAGEMENT’S REPORT ON
INTERNAL CONTROL OVER FINANCIAL REPORTING
INTERNAL CONTROL OVER FINANCIAL REPORTING
March 14, 2011
The management of Farmers National Banc Corp. (the Company) is responsible for establishing and
maintaining adequate internal control over financial reporting as defined in Rules 13a-15(f) and
15d-15(f) under the Securities and Exchange Act of 1934. The Company’s internal control over
financial reporting is designed to provide reasonable assurance regarding the reliability of
financial reporting and the preparation of financial statements for external purposes in accordance
with generally accepted accounting principles.
The Company’s internal control over financial reporting includes those policies and procedures
that: (i) pertain to the maintenance of records that, in reasonable detail, accurately and fairly
reflect the transactions and dispositions of the assets of the Company; (ii) provide reasonable
assurance that transactions are recorded as necessary to permit preparation of financial statements
in accordance with generally accepted accounting principles, and that receipts and expenditures of
the Company are being made only in accordance with authorizations of management and directors of
the Company; and (iii) provide reasonable assurance regarding prevention or timely detection of
unauthorized acquisition, use or disposition of the Company’s assets that could have a material
effect on the financial statements.
Because of its inherent limitations, internal control over financial reporting may not prevent or
detect misstatements. Also, projections of any evaluation of effectiveness to future periods are
subject to the risk that controls may become inadequate because of changes in conditions, or that
the degree of compliance with the policies or procedures may deteriorate.
Management assessed the effectiveness of the Company’s internal control over financial reporting as
of December 31, 2010. In making this assessment, management used the criteria set forth by the
Committee of Sponsoring Organizations of the Treadway Commission (COSO) in Internal
Control-Integrated Framework. Based on our assessment and those criteria, management concluded that
the Company maintained effective internal control over financial reporting as of December 31, 2010.
The Company’s independent registered public accounting firm, Crowe Horwath LLP, has audited the
Company’s consolidated financial statements included in this Annual Report and the Company’s
internal control over financial reporting as of December 31, 2010, and has issued their Report of
Independent Registered Public Accounting Firm, which appears in this Annual Report.

|
 |
|
John S. Gulas
|
Carl D. Culp | |
President and CEO
|
Executive Vice President and Treasurer |
25

| Crowe Horwath LLP | ||
| Independent Member Crowe Horwath International |
REPORT OF INDEPENDENT REGISTERED PUBLIC ACCOUNTING FIRM
To the Board of Directors and Shareholders
Farmers National Banc Corp.
Canfield, Ohio
Farmers National Banc Corp.
Canfield, Ohio
We have audited the accompanying consolidated balance sheets of Farmers National Banc Corp. as of
December 31, 2010 and 2009 and the related consolidated statements of income and comprehensive
income, stockholders’ equity and cash flows for each of the three years in the period ended
December 31, 2010. We also have audited Farmers National Banc Corp.’s internal control over
financial reporting as of December 31, 2010, based on criteria established in Internal Control —
Integrated Framework issued by the Committee of Sponsoring Organizations of the Treadway Commission
(COSO). Farmers National Banc Corp.’s management is responsible for these financial statements, for
maintaining effective internal control over financial reporting, and for its assessment of the
effectiveness of internal control over financial reporting, included in the accompanying
Management’s Report on Internal Control over Financial Reporting. Our responsibility is to express
an opinion on these financial statements and an opinion on the Company’s internal control over
financial reporting based on our audits.
We conducted our audits in accordance with the standards of the Public Company Accounting Oversight
Board (United States). Those standards require that we plan and perform the audits to obtain
reasonable assurance about whether the financial statements are free of material misstatement and
whether effective internal control over financial reporting was maintained in all material
respects. Our audits of the financial statements included examining, on a test basis, evidence
supporting the amounts and disclosures in the financial statements, assessing the accounting
principles used and significant estimates made by management, and evaluating the overall financial
statement presentation. Our audit of internal control over financial reporting included obtaining
an understanding of internal control over financial reporting, assessing the risk that a material
weakness exists, and testing and evaluating the design and operating effectiveness of internal
control based on the assessed risk. Our audits also included performing such other procedures as we
considered necessary in the circumstances. We believe that our audits provide a reasonable basis
for our opinions.
A company’s internal control over financial reporting is a process designed to provide reasonable
assurance regarding the reliability of financial reporting and the preparation of financial
statements for external purposes in accordance with generally accepted accounting principles. A
company’s internal control over financial reporting includes those policies and procedures that (1)
pertain to the maintenance of records that, in reasonable detail, accurately and fairly reflect the
transactions and dispositions of the assets of the company; (2) provide reasonable assurance that
transactions are recorded as necessary to permit preparation of financial statements in accordance
with generally accepted accounting principles, and that receipts and expenditures of the company
are being made only in accordance with authorizations of management and directors of the company;
and (3) provide reasonable assurance regarding prevention or timely detection of unauthorized
acquisition, use, or disposition of the company’s assets that could have a material effect on the
financial statements.
Because of its inherent limitations, internal control over financial reporting may not prevent or
detect misstatements. Also, projections of any evaluation of effectiveness to future periods are
subject to the risk that controls may become inadequate because of changes in conditions, or that
the degree of compliance with the policies or procedures may deteriorate.
In our opinion, the consolidated financial statements referred to above present fairly, in all
material respects, the financial position of Farmers National Banc Corp. as of December 31, 2010
and 2009, and the results of its operations and its cash flows for each of the three years in the
period ended December 31, 2010, in conformity with U.S. generally accepted accounting principles.
Also in our opinion, Farmers National Banc Corp. maintained, in all material respects, effective
internal control over financial reporting as of December 31, 2010, based on criteria established in
Internal Control — Integrated Framework issued by the COSO.

Crowe Horwath LLP
Cleveland, Ohio
March 14, 2011
March 14, 2011
26
CONSOLIDATED BALANCE SHEETS
(Table Dollar Amounts In Thousands except Share and Per Share Data)
(Table Dollar Amounts In Thousands except Share and Per Share Data)
| December 31, | 2010 | 2009 | ||||||
ASSETS |
||||||||
Cash and due from banks |
$ | 30,772 | $ | 25,713 | ||||
Federal funds sold |
6,533 | 25,447 | ||||||
TOTAL CASH AND CASH EQUIVALENTS |
37,305 | 51,160 | ||||||
Securities available for sale |
314,347 | 309,368 | ||||||
Loans |
590,367 | 609,395 | ||||||
Less allowance for loan losses |
9,307 | 7,400 | ||||||
NET LOANS |
581,060 | 601,995 | ||||||
Premises and equipment, net |
13,944 | 14,193 | ||||||
Goodwill |
3,709 | 3,709 | ||||||
Other intangibles |
3,211 | 3,791 | ||||||
Bank owned life insurance |
11,529 | 11,438 | ||||||
Other assets |
17,646 | 19,154 | ||||||
TOTAL ASSETS |
$ | 982,751 | $ | 1,014,808 | ||||
LIABILITIES AND STOCKHOLDERS’ EQUITY |
||||||||
Deposits: |
||||||||
Noninterest-bearing |
$ | 77,728 | $ | 68,420 | ||||
Interest-bearing |
683,322 | 709,132 | ||||||
TOTAL DEPOSITS |
761,050 | 777,552 | ||||||
Short-term borrowings |
105,634 | 125,912 | ||||||
Long-term borrowings |
24,733 | 27,169 | ||||||
Other liabilities |
3,286 | 3,547 | ||||||
TOTAL LIABILITIES |
894,703 | 934,180 | ||||||
Commitments and contingent liabilities |
||||||||
Stockholders’ Equity |
||||||||
Common Stock — Authorized 25,000,000 shares;
issued 15,699,184 in 2010 and 15,572,703 in 2009 |
96,142 | 95,650 | ||||||
Retained earnings |
14,502 | 7,137 | ||||||
Accumulated other comprehensive income |
2,907 | 3,344 | ||||||
Treasury stock, at cost; 2,053,149 shares in 2010 and 2,053,098 shares in 2009 |
(25,503 | ) | (25,503 | ) | ||||
TOTAL STOCKHOLDERS’ EQUITY |
88,048 | 80,628 | ||||||
TOTAL LIABILITIES AND STOCKHOLDERS’ EQUITY |
$ | 982,751 | $ | 1,014,808 | ||||
See accompanying notes.
27
CONSOLIDATED STATEMENTS OF INCOME
AND COMPREHENSIVE INCOME
(Table Dollar Amounts In Thousands except Share and Per Share Data)
AND COMPREHENSIVE INCOME
(Table Dollar Amounts In Thousands except Share and Per Share Data)
| Years ended December 31, | 2010 | 2009 | 2008 | |||||||||
INTEREST AND DIVIDEND INCOME |
||||||||||||
Loans, including fees |
$ | 36,875 | $ | 37,634 | $ | 34,965 | ||||||
Taxable securities |
8,755 | 9,399 | 8,063 | |||||||||
Tax exempt securities |
2,490 | 2,447 | 2,661 | |||||||||
Dividends |
189 | 263 | 388 | |||||||||
Federal funds sold |
56 | 32 | 338 | |||||||||
TOTAL INTEREST AND DIVIDEND INCOME |
48,365 | 49,775 | 46,415 | |||||||||
INTEREST EXPENSE |
||||||||||||
Deposits |
9,043 | 12,726 | 15,648 | |||||||||
Short-term borrowings |
872 | 1,847 | 2,047 | |||||||||
Long-term borrowings |
1,083 | 1,974 | 2,252 | |||||||||
TOTAL INTEREST EXPENSE |
10,998 | 16,547 | 19,947 | |||||||||
NET INTEREST INCOME |
37,367 | 33,228 | 26,468 | |||||||||
Provision for loan losses |
8,078 | 6,050 | 1,420 | |||||||||
NET INTEREST INCOME AFTER
PROVISION FOR LOAN LOSSES |
29,289 | 27,178 | 25,048 | |||||||||
NONINTEREST INCOME |
||||||||||||
Service charges on deposit accounts |
2,071 | 2,593 | 2,685 | |||||||||
Bank owned life insurance income, including death benefits |
993 | 621 | 531 | |||||||||
Trust fees |
4,900 | 3,469 | 0 | |||||||||
Insurance agency commissions |
234 | 80 | 0 | |||||||||
Security gains |
2,680 | 1,017 | 474 | |||||||||
Impairment of equity securities |
0 | (74 | ) | (2,711 | ) | |||||||
Investment commissions |
540 | 344 | 354 | |||||||||
Other operating income |
1,792 | 1,338 | 1,284 | |||||||||
TOTAL NONINTEREST INCOME |
13,210 | 9,388 | 2,617 | |||||||||
NONINTEREST EXPENSE |
||||||||||||
Salaries and employee benefits |
16,406 | 15,145 | 11,626 | |||||||||
Occupancy and equipment |
3,709 | 3,538 | 2,898 | |||||||||
State and local taxes |
900 | 930 | 819 | |||||||||
Professional fees |
1,399 | 1,020 | 701 | |||||||||
Advertising |
637 | 595 | 563 | |||||||||
FDIC insurance |
1,306 | 1,543 | 187 | |||||||||
Merger related costs |
0 | 453 | 0 | |||||||||
Intangible amortization |
580 | 449 | 0 | |||||||||
Core processing charges |
973 | 231 | 63 | |||||||||
Other operating expenses |
5,054 | 5,751 | 4,156 | |||||||||
TOTAL NONINTEREST EXPENSE |
30,964 | 29,655 | 21,013 | |||||||||
INCOME BEFORE INCOME TAXES |
11,535 | 6,911 | 6,652 | |||||||||
INCOME TAXES |
2,544 | 1,069 | 987 | |||||||||
NET INCOME |
8,991 | 5,842 | 5,665 | |||||||||
OTHER COMPREHENSIVE INCOME (LOSS), NET OF TAX: |
||||||||||||
Change in net unrealized gains (losses) on securities,
net of reclassifications |
(437 | ) | 1,052 | 2,945 | ||||||||
COMPREHENSIVE INCOME |
$ | 8,554 | $ | 6,894 | $ | 8,610 | ||||||
EARNINGS PER SHARE: |
||||||||||||
Basic |
$ | 0.66 | $ | 0.44 | $ | 0.43 | ||||||
Diluted |
$ | 0.66 | $ | 0.44 | $ | 0.43 | ||||||
See accompanying notes.
28
CONSOLIDATED STATEMENTS OF STOCKHOLDERS’ EQUITY
(Table Dollar Amounts In Thousands except Share and Per Share Data)
(Table Dollar Amounts In Thousands except Share and Per Share Data)
| Years ended December 31, | 2010 | 2009 | 2008 | |||||||||
COMMON STOCK |
||||||||||||
Balance at beginning of year |
$ | 95,650 | $ | 94,217 | $ | 91,741 | ||||||
Stock option expense (1) |
0 | 0 | 0 | |||||||||
126,481 shares issued from dividend reinvestment in 2010,
289,183 in 2009 and 362,414 in 2008 |
492 | 1,433 | 2,476 | |||||||||
Balance at end of year |
96,142 | 95,650 | 94,217 | |||||||||
RETAINED EARNINGS |
||||||||||||
Balance at beginning of year |
7,137 | 6,096 | 7,233 | |||||||||
Net income |
8,991 | 5,842 | 5,665 | |||||||||
Dividends declared: |
||||||||||||
$.12 cash dividends per share in 2010,
$.36 in 2009 and $.52 in 2008 |
(1,626 | ) | (4,801 | ) | (6,802 | ) | ||||||
Balance at end of year |
14,502 | 7,137 | 6,096 | |||||||||
ACCUMULATED OTHER COMPREHENSIVE INCOME (LOSS) |
||||||||||||
Balance at beginning of year |
3,344 | 2,292 | (653 | ) | ||||||||
Change in net unrealized gains (losses) on securities,
net of reclassifications and tax effects |
(437 | ) | 1,052 | 2,945 | ||||||||
Balance at end of year |
2,907 | 3,344 | 2,292 | |||||||||
TREASURY STOCK, AT COST |
||||||||||||
Balance at beginning of year |
(25,503 | ) | (25,503 | ) | (24,401 | ) | ||||||
Purchase of 51 shares in 2010, 40 in 2009 and
160,328 in 2008 (2) |
0 | 0 | (1,102 | ) | ||||||||
Balance at end of year |
(25,503 | ) | (25,503 | ) | (25,503 | ) | ||||||
TOTAL STOCKHOLDERS’ EQUITY AT END OF YEAR |
$ | 88,048 | $ | 80,628 | $ | 77,102 | ||||||
| (1) | Stock option expense for 2010, 2009 and 2008, was less than $1,000 and rounded to $0. | |
| (2) | Treasury stock repurchased in 2010 and 2009 was less than $1,000 and rounded to $0. |
See accompanying notes.
29
CONSOLIDATED STATEMENTS OF CASH FLOWS
(Table Dollar Amounts In Thousands except Share and Per Share Data)
(Table Dollar Amounts In Thousands except Share and Per Share Data)
| Years ended December 31, | 2010 | 2009 | 2008 | |||||||||
CASH FLOWS FROM OPERATING ACTIVITIES |
||||||||||||
Net income |
$ | 8,991 | $ | 5,842 | $ | 5,665 | ||||||
Adjustments to reconcile net income
to net cash from operating activities: |
||||||||||||
Provision for loan losses |
8,078 | 6,050 | 1,420 | |||||||||
Depreciation and amortization |
1,711 | 1,530 | 1,079 | |||||||||
Net amortization of securities |
3,089 | 539 | 271 | |||||||||
Security gains |
(2,680 | ) | (1,017 | ) | (474 | ) | ||||||
Loss on sale of other real estate owned |
92 | 47 | 0 | |||||||||
Impairment of securities |
0 | 74 | 2,711 | |||||||||
Federal Home Loan Bank dividends |
0 | 0 | (174 | ) | ||||||||
Earnings on bank owned life insurance |
(483 | ) | (531 | ) | (531 | ) | ||||||
Income recognized from death benefit on bank owned life insurance |
(510 | ) | (90 | ) | 0 | |||||||
Net change in other assets and liabilities |
1,587 | (7,233 | ) | (2,114 | ) | |||||||
NET CASH FROM OPERATING ACTIVITIES |
19,875 | 5,211 | 7,853 | |||||||||
CASH FLOWS FROM INVESTING ACTIVITIES |
||||||||||||
Proceeds from maturities and repayments of securities available
for sale |
62,726 | 66,715 | 61,161 | |||||||||
Proceeds from sales of securities available for sale |
69,383 | 26,185 | 31,058 | |||||||||
Purchases of securities available for sale |
(138,215 | ) | (126,524 | ) | (141,650 | ) | ||||||
Proceeds from sale of Federal Home Loan Bank stock |
0 | 1,414 | 0 | |||||||||
Purchase of trust entity, net |
0 | (10,511 | ) | 0 | ||||||||
Loan originations and payments, net |
12,096 | (62,218 | ) | (39,403 | ) | |||||||
Proceeds from sale of other real estate owned |
541 | 269 | 113 | |||||||||
Improvements to real estate owned |
(30 | ) | 0 | 0 | ||||||||
Proceeds from BOLI death benefit |
902 | 204 | 0 | |||||||||
Additions to premises and equipment |
(783 | ) | (990 | ) | (612 | ) | ||||||
NET CASH FROM INVESTING ACTIVITIES |
6,620 | (105,456 | ) | (89,333 | ) | |||||||
CASH FLOWS FROM FINANCING ACTIVITIES |
||||||||||||
Net change in deposits |
(16,502 | ) | 129,542 | 54,582 | ||||||||
Net change in short-term borrowings |
(20,278 | ) | 20,477 | 11,261 | ||||||||
Proceeds from Federal Home Loan Bank borrowings and other debt |
0 | 0 | 25,000 | |||||||||
Repayment of Federal Home Loan Bank borrowings and other debt |
(2,436 | ) | (19,295 | ) | (10,991 | ) | ||||||
Repurchase of common stock |
0 | 0 | (1,102 | ) | ||||||||
Cash dividends paid |
(1,626 | ) | (4,801 | ) | (6,802 | ) | ||||||
Proceeds from dividend reinvestment |
492 | 1,433 | 2,476 | |||||||||
NET CASH FROM FINANCING ACTIVITIES |
(40,350 | ) | 127,356 | 74,424 | ||||||||
NET CHANGE IN CASH AND CASH EQUIVALENTS |
(13,855 | ) | 27,111 | (7,056 | ) | |||||||
Beginning cash and cash equivalents |
51,160 | 24,049 | 31,105 | |||||||||
Ending cash and cash equivalents |
$ | 37,305 | $ | 51,160 | $ | 24,049 | ||||||
Supplemental cash flow information: |
||||||||||||
Interest paid |
$ | 11,450 | $ | 16,713 | $ | 20,183 | ||||||
Income taxes paid |
1,990 | 2,215 | 1,870 | |||||||||
Supplemental noncash disclosures: |
||||||||||||
Transfer of loans to other real estate owned |
$ | 761 | $ | 625 | $ | 178 | ||||||
| Farmers National Banc Corp acquired all of the stock of Butler Wick Trust Company for $12 million on March 31, 2009. | ||||||||||||
The assets acquired and liabilities
assumed were as follows: |
||||||||||||
Fair value of assets acquired |
$ | 12,394 | ||||||||||
Purchase price |
12,125 | |||||||||||
Liabilities assumed |
$ | 269 | ||||||||||
See accompanying notes.
30
NOTES TO CONSOLIDATED FINANCIAL STATEMENTS
(Table Dollar Amounts In Thousands except Share and Per Share Data)
(Table Dollar Amounts In Thousands except Share and Per Share Data)
NOTE 1 — SUMMARY OF SIGNIFICANT ACCOUNTING POLICIES
Principles of Consolidation:
The consolidated financial statements include the accounts of Farmers National Banc Corp.
and its wholly-owned subsidiaries, The Farmers National Bank (Bank) of Canfield and Farmers Trust
Company. The consolidated financial statements also include the accounts of the Farmers National
Bank of Canfield’s subsidiary, Farmers National Insurance. Together the entities are referred to as
“the Company.” All significant intercompany balances and transactions have been eliminated in
consolidation.
Nature of Operations:
The Company provides full banking services through its nationally chartered subsidiary,
The Farmers National Bank of Canfield. As a national bank, the Bank is subject to regulation of the
Office of the Comptroller of the Currency and the Federal Deposit Insurance Corporation. The area
served by the Bank is the northeastern region of Ohio and service is provided at seventeen (17)
locations. The Company provides trust services through its subsidiary, Farmers Trust Company, and
insurance services through the Bank’s subsidiary, Farmers National Insurance. Farmers Trust Company
has a state-chartered bank license to conduct trust business from the Ohio Department of Commerce – Division of Financial Institutions.
Estimates:
The preparation of financial statements in conformity with U.S. generally accepted
accounting principles requires management to make estimates and assumptions that affect the
reported amounts of assets and liabilities and disclosure of contingent assets and liabilities at
the date of the financial statements and the reported amounts of revenues and expenses during the
reporting period. Actual results could differ from those estimates. The allowance for loan losses,
deferred tax assets, carrying amount of goodwill and fair values of financial instruments are
particularly subject to change.
Cash Flows:
Cash and cash equivalents include cash on hand, deposits with other financial institutions
and federal funds sold. Generally, federal funds are purchased and sold for one-day periods. Net
cash flows are reported for loan and deposit transactions, short term borrowings, and other assets
and liabilities.
Securities Available for Sale:
Debt securities are classified as available for sale when they might be sold before
maturity. Equity securities with readily determinable fair values are classified as available for
sale. Securities available for sale are carried at fair value, with unrealized holding gains and
losses reported in other comprehensive income, net of tax.
Interest income includes amortization of purchase premium or discount. Premiums and discounts
on securities are amortized on the level-yield method without anticipating prepayments, except for
mortgage backed securities where prepayments are anticipated. Gains and losses on sales are
recorded on the trade date and determined using the specific identification method. Purchases are
recognized on the trade date.
Management evaluates securities for other-than-temporary impairment (OTTI) at least on a
quarterly basis, and more frequently when economic or market conditions warrant. For securities in
an unrealized loss position, management considers the extent and duration of the unrealized loss,
and the financial condition and near-term prospects of the issuer. Management also assesses whether
it intends to sell, or it is more likely than not that it will be required to sell, a security in
an unrealized loss position before recovery of its amortized cost basis. If either of the criteria
regarding intent or requirement to sell is met, the entire difference between amortized cost and
fair value is recognized as impairment through earnings. For debt securities that do not meet the
aforementioned criteria, the amount of impairment is split into two components as follows: 1) OTTI
related to credit loss, which must be recognized in the income statement and 2)
other-than-temporary impairment (OTTI) related to other factors, which is recognized in other
comprehensive income. The credit loss is defined as the difference between the present value of the
cash flows expected to be collected and the amortized cost basis. For equity securities, the entire
amount of impairment is recognized through earnings.
Loans:
Loans that management has the intent and ability to hold for the foreseeable future or
until maturity or payoff are reported at the principal balance outstanding, net of deferred loan
fees and costs, and an allowance for loan losses. Substantially all loans are secured by specific
items of collateral including business assets, consumer assets, and commercial and residential real
estate.
Interest income is accrued on the unpaid principal balance. Loan origination fees, net of
certain direct origination costs, are deferred and recognized in interest income using the level
yield method without anticipating prepayments. Interest income on mortgage and commercial loans is
discontinued at the time the loan is 90 days delinquent unless the loan is well-secured and in
process of collection. Consumer and credit card loans are typically charged-off no later than 120
days past due. Past due status is based on the contractual terms of the loan. In all cases, loans
are placed on nonaccrual or charged-off at an earlier date if collection of principal or interest
is considered doubtful. Nonaccrual loans and loans past due 90 days still on accrual include both
smaller balance homogeneous loans that are collectively evaluated for impairment and individually
classified impaired loans. A loan is moved to nonaccrual status in accordance with the Company’s
policy, typically after 90 days of non-payment.
When interest accruals are discontinued, interest accrued but not received for loans placed on
nonaccrual is reversed against interest income. Interest on such loans is thereafter recorded on a
cash-basis or cost-recovery method, until qualifying for return to accrual. Loans are returned to
accrual status when all the principal and interest amounts contractually due are brought current
and future payments are reasonably assured.
Concentration of Credit Risk:
There are no significant concentrations of loans to any one industry or customer. However,
most of the Company’s business activity is with customers located within Mahoning, Trumbull and
Columbiana counties (Tri-County area). Therefore, the Company’s exposure to credit risk is
significantly affected by changes in the economy of the Tri-County area.
31
NOTES TO CONSOLIDATED FINANCIAL STATEMENTS
(Table Dollar Amounts In Thousands except Share and Per Share Data)
(Table Dollar Amounts In Thousands except Share and Per Share Data)
Allowance for Loan Losses:
The allowance for loan losses is a valuation allowance for probable incurred loan losses,
increased by the provision for loan losses and decreased by charge-offs less recoveries. The
allowance is based on management’s judgment taking into consideration past loss experience, reviews
of individual loans, current economic conditions and other factors considered relevant by
management at the financial statement date. While management uses the best information available to
establish the allowance, future adjustments to the allowance may be necessary, which may be
material, if economic conditions differ substantially from the assumptions used in estimating the
allowance. If additions to the original estimate of the allowance for loan losses are deemed
necessary, they will be reported in earnings in the period in which they become reasonably
estimable. Allocations of the allowance may be made for specific loans, but the entire allowance is
available for any loan that, in management’s judgment, should be charged-off.
The allowance consists of specific and general components. The specific component relates to
loans that are individually classified as impaired.
A loan is considered impaired when, based on the current information and events, it is
probable that the Company will be unable to collect the scheduled payments of principal or interest
when due according to the contractual terms of the loan agreement. Loans, for which the terms have
been modified, and for which the borrower is experiencing financial difficulties, are considered
troubled debt restructurings and classified as impaired. Factors considered by management in
determining impairment include payment status, collateral value, and the probability of collecting
scheduled principal and interest payments when due. Loans that experience insignificant payment
delays and payment shortfalls generally are not classified as impaired. Management determines the
significance of payment delays and payment shortfalls on a case-by-case basis, taking into
consideration all of the circumstances surrounding the loan and the borrower, including the length
of the delay, the reasons for the delay, the borrower’s prior payment record, and the amount of the
shortfall in relation to the principal and interest owed. Impairment is measured on a loan by loan
basis for commercial and commercial real estate loans over $250 thousand by either the present
value of expected future cash flows discounted at the loan’s effective interest rate, the loan’s
obtainable market price, or the fair value of the collateral if the loan is collateral dependent.
Large groups of smaller balance homogeneous loans are collectively evaluated for impairment.
Accordingly, the Company considers the guidance on troubled debt restructuring for individual
consumer and residential loans when evaluating for impairment disclosure. Troubled debt
restructurings are measured at the present value of estimated future cash flow using the loan’s
effective rate at inception. If a troubled debt restructuring is considered to be a collateral
dependent loan, the loan is reported, net, at the fair value of the collateral. For troubled debt
restructurings that subsequently default, the Company determines the amount of reserve in
accordance with the accounting policy for the allowance for loan losses.
The general component covers non impaired loans and is based on historical loss experience
adjusted for current factors. The historical loss experience is determined by portfolio segment and
is based on the actual loss history experienced by the Company over the most recent 2 years. This
actual loss experience is supplemented with other economic factors based on the risks present for
each portfolio segment. These economic factors
include consideration of the following: levels of and trends in delinquencies and impaired loans;
levels of and trends in charge-offs and recoveries; trends in volume and terms of loans; effects of
any changes in risk selection and underwriting standards; other changes in lending policies,
procedures, and practices; experience, ability, and depth of lending management and other relevant
staff; national and local economic trends and conditions; industry conditions; and effects of
changes in credit concentrations. The following portfolio segments have been identified:
Commercial Loans. Commercial credit is extended to commercial customers for use in normal
business operations to finance working capital needs, equipment purchases, or other projects. The
majority of these borrowers are customers doing business within our geographic regions. These loans
are generally underwritten individually and secured with the assets of the company and the personal
guarantee of the business owners. Commercial loans are made based primarily on the historical and
projected cash flow of the borrower and the underlying collateral provided by the borrower.
Commercial Real Estate Loans. Commercial real estate loans are subject to underwriting
standards and processes similar to commercial loans. These loans are viewed primarily as cash flow
loans and the repayment of these loans is largely dependent on the successful operation of the
property. Loan performance may be adversely affected by factors impacting the general economy or
conditions specific to the real estate market such as geographic location and property type.
Consumer Loans. Consumer loans are primarily comprised of loans made directly to consumers and
indirectly through automobile dealerships. These loans have a specific matrix which consists of
several factors including debt to income, type of collateral and loan to collateral value, credit
history and relationship with the borrower. Consumer lending uses risk-based pricing in the
underwriting process.
Residential Mortgage Loans. Residential mortgage loans represent loans to consumers for the
purchase or refinance of a residence. These loans are generally financed up to 15 years, and in
most cases, are extended to borrowers to finance their primary residence. Real estate market values
at the time of origination directly affect the amount of credit extended and, in the event of
default, subsequent changes in these values may impact the severity of losses.
Foreclosed Assets:
Assets acquired through or instead of loan foreclosure are initially recorded at fair
value less costs to sell when acquired, establishing a new cost basis. These assets are
subsequently accounted for at lower of cost or fair value less estimated costs to sell. The
balance of foreclosed assets was $532 thousand and $374 thousand at December 31, 2010 and 2009,
respectively. If fair value declines subsequent to foreclosure, a valuation allowance is recorded
through expense. Operating costs after acquisition are expensed.
Premises and Equipment:
Land is carried at cost. Premises and equipment are stated at cost, less accumulated
depreciation. Buildings and related components are depreciated using the straight-line method with
useful lives ranging from 5 to 40 years. Furniture, fixtures and equipment are depreciated using
the straight-line method with useful lives ranging from 3 to 10 years.
32
NOTES TO CONSOLIDATED FINANCIAL STATEMENTS
(Table Dollar Amounts In Thousands except Share and Per Share Data)
(Table Dollar Amounts In Thousands except Share and Per Share Data)
Restricted Stock:
The Bank is a member of the Federal Home Loan Bank (FHLB) system. Members are required to own
a certain amount of stock based on the level of borrowings and other factors, and may invest in
additional amounts. The Bank is also a member of and owns stock in the Federal Reserve Bank. These
stocks are carried at cost, classified as restricted securities included in other assets, and
periodically evaluated for impairment based on ultimate recovery of par value. Both cash and stock
dividends are reported as income.
Bank Owned Life Insurance:
The Company has purchased life insurance policies on certain key officers. Bank owned life
insurance is recorded at the amount that can be realized under the insurance contract at the
balance sheet date, which is the cash surrender value adjusted for other charges or other amounts
due that are probable at settlement.
Long-term Assets:
Premises and equipment and other long-term assets are reviewed for impairment when events
indicate their carrying amount may not be recoverable from future undiscounted cash flows. If
impaired, the assets are recorded at fair value.
Goodwill and Other Intangible Assets:
Goodwill resulting from a business combination is generally determined as the excess of the
fair value of the consideration transferred over the fair value of the net assets acquired as of
the acquisition date. Goodwill acquired in a purchase business combination and determined to have
an indefinite useful life is not amortized, but tested for impairment at least annually. The
Company has selected September 30 as the date to perform the annual impairment test. Intangible
assets with definite useful lives are amortized over their estimated useful lives. Goodwill is the
only intangible asset with an indefinite life on our balance sheet. Non-compete contracts are
amortized on a straight line basis over the term of the agreement which is two years. Customer
relationship intangibles are amortized over 13 years on an accelerated method.
Loan Commitments and Related Financial Instruments:
Financial instruments include off balance sheet credit instruments, such as commitments to
make loans and commercial letters of credit, issued to meet customer financing needs. The face
amount for these items represents the exposure to loss, before considering customer collateral or
ability to repay. Such financial instruments are recorded when they are funded.
Stock-Based Compensation:
Compensation cost is recognized for stock options issued to employees, based on the fair value
of these awards at the date of grant. A Black-Scholes model is utilized to estimate the fair value
of stock options. Compensation cost is recognized over the required service period, generally
defined as the vesting period. For awards with graded vesting, compensation cost is recognized on a
straight-line basis over the requisite service period for the entire award.
Income Taxes:
Income tax expense is the total of the current year income tax due or refundable and the
change in deferred tax assets and liabilities. Deferred tax assets and liabilities are the expected
future tax amounts for the temporary differences between carrying amounts and tax bases of assets
and liabilities, computed using enacted tax rates. A valuation allowance, if needed, reduces
deferred tax assets to the amount expected to be realized.
A tax position is recognized as a benefit only if it is “more likely than not” that the tax
position would be sustained in a tax examination, with a tax examination being presumed to occur.
The amount recognized is the largest amount of tax benefit that is greater than 50% likely of being
realized on examination. For tax positions not meeting the “more likely than not” test, no tax
benefit is recorded.
The Company recognizes interest and/or penalties related to income tax matters in income tax
expense.
Retirement Plans:
Employee 401(k) and profit sharing plan expense is the amount of matching contributions.
Deferred compensation and supplemental retirement plan expense allocates the benefits over years of
service.
Earnings Per Common Share:
Basic earnings per common share is net income divided by the weighted average number of common
shares outstanding during the period. Diluted earnings per common share include the dilutive effect
of additional potential common shares issuable under stock options. Earnings and dividends per
share are restated for all stock splits and stock dividends through the date of issuance of the
financial statements.
Comprehensive Income:
Comprehensive income consists of net income and other comprehensive income or loss. Other
comprehensive income or loss consists solely of unrealized gains and losses on securities available
for sale and is recognized as a separate component of equity, net of tax effects.
Loss Contingencies:
Loss contingencies, including claims and legal actions arising in the ordinary course of
business, are recorded as liabilities when the likelihood of loss is probable and an amount or
range of loss can be reasonably estimated. Management does not believe there are such matters that
will have a material effect on the financial statements.
Restrictions on Cash:
Cash on hand or on deposit with the Federal Reserve Bank was required to meet regulatory
reserve and clearing requirements.
Equity:
Treasury stock is carried at cost.
Dividend Restriction:
Regulations require maintaining certain capital levels and may limit the dividends paid by the
Bank to the holding company or by the holding company to shareholders.
Fair Value of Financial Instruments:
Fair values of financial instruments are estimated using relevant market information and other
assumptions as more fully disclosed in Note 4. Fair value estimates involve uncertainties and
matters of significant judgment regarding interest rates, credit risk, prepayments and other
factors, especially in the absence of broad markets for particular items. Changes in assumptions or
in market conditions could significantly affect the estimates.
33
NOTES TO CONSOLIDATED FINANCIAL STATEMENTS
(Table Dollar Amounts In Thousands except Share and Per Share Data)
(Table Dollar Amounts In Thousands except Share and Per Share Data)
Operating Segments:
While the chief decision-makers monitor the revenue streams of the various products and
services, operations are managed and financial performance is primarily aggregated and reported in
two lines of business, the Bank segment and the Trust segment. The Company discloses segment
information in Note 19.
Adoption of New Accounting Standards:
In June 2009, the FASB issued guidance on accounting for transfers of financial assets. This
guidance amends previous guidance relating to the transfers of financial assets and eliminates the
concept of a qualifying special purpose entity. This guidance must be applied as of the beginning
of each reporting entity’s first annual reporting period that begins after November 15, 2009, for
interim periods within that first annual reporting period and for interim and annual reporting
periods thereafter. This guidance must be applied to transfers occurring on or after the effective
date. Additionally, on and after the effective date, the concept of a qualifying special-purpose
entity is no longer relevant for accounting purposes. Therefore, formerly qualifying
special-purpose entities should be evaluated for consolidation by reporting entities on and after
the effective date in accordance with the applicable consolidation guidance. Additionally, the
disclosure provisions of this guidance were also amended and apply to transfers that occurred both
before and after the effective date of this Statement. The adoption of this guidance did not have a
material effect on the results of operations or financial position.
NOTE 2 — SECURITIES AVAILABLE FOR SALE
The following table summarizes the amortized cost and fair value of the available-for-sale
securities portfolio at December 31, 2010 and 2009 and the corresponding amounts of gross
unrealized gains and losses recognized in accumulated other comprehensive income (loss) were as
follows:
| Gross | Gross | |||||||||||||||
| Amortized | Unrealized | Unrealized | Fair | |||||||||||||
| 2010 | Cost | Gains | Losses | Value | ||||||||||||
U.S. Treasury and U.S.
government sponsored entities |
$ | 67,376 | $ | 2,768 | $ | (166 | ) | $ | 69,978 | |||||||
State and political subdivisions |
81,397 | 1,215 | (2,146 | ) | 80,466 | |||||||||||
Mortgage-backed securities — residential |
140,681 | 4,099 | (1,003 | ) | 143,777 | |||||||||||
Collateralized mortgage
obligations |
20,021 | 1 | (362 | ) | 19,660 | |||||||||||
Equity securities |
149 | 66 | (16 | ) | 199 | |||||||||||
Other securities |
250 | 17 | 0 | 267 | ||||||||||||
TOTALS |
$ | 309,874 | $ | 8,166 | $ | (3,693 | ) | $ | 314,347 | |||||||
| Gross | Gross | |||||||||||||||
| Amortized | Unrealized | Unrealized | Fair | |||||||||||||
| 2009 | Cost | Gains | Losses | Value | ||||||||||||
U.S. Treasury and U.S.
government sponsored entities |
$ | 98,746 | $ | 1,424 | $ | (337 | ) | $ | 99,833 | |||||||
State and political subdivisions |
62,809 | 1,070 | (447 | ) | 63,432 | |||||||||||
Mortgage-backed securities — residential |
141,915 | 3,758 | (411 | ) | 145,262 | |||||||||||
Collateralized mortgage
obligations |
309 | 9 | 0 | 318 | ||||||||||||
Equity securities |
149 | 129 | (19 | ) | 259 | |||||||||||
Other securities |
250 | 14 | 0 | 264 | ||||||||||||
TOTALS |
$ | 304,178 | $ | 6,404 | $ | (1,214 | ) | $ | 309,368 | |||||||
The proceeds from sales of available-for-sale securities and the associated gains and losses
were as follows:
| 2010 | 2009 | 2008 | ||||||||||
Proceeds |
$ | 69,383 | $ | 26,185 | $ | 31,058 | ||||||
Gross gains |
2,685 | 1,019 | 523 | |||||||||
Gross losses |
(5 | ) | (2 | ) | (49 | ) | ||||||
The tax provision related to these net realized gains was $938,000, $356,000, and $166,000
respectively.
The amortized cost and fair value of the debt securities portfolio are shown by expected
maturity. Expected maturities may differ from contractual maturities if issuers have the right to
call or prepay obligations with or without call or prepayment penalties. Mortgage-backed securities
are not due at a single maturity date and are shown separately.
| December 31, 2010 | ||||||||
| Amortized | Fair | |||||||
| Available for sale | Cost | Value | ||||||
Maturity |
||||||||
Within one year |
$ | 2,588 | $ | 2,593 | ||||
One to five years |
73,969 | 76,346 | ||||||
Five to ten years |
46,151 | 45,317 | ||||||
Beyond ten years |
26,315 | 26,455 | ||||||
Mortgage-backed securities |
160,702 | 163,437 | ||||||
TOTALS |
$ | 309,725 | $ | 314,148 | ||||
Securities with a carrying amount of $182 million at December 31, 2010 and $206 million at
December 31, 2009 were pledged to secure public deposits and repurchase agreements.
In each year, there were no holdings of any other issuer that exceeded 10% of shareholders’
equity, other than the U.S. government and its agencies.
34
NOTES TO CONSOLIDATED FINANCIAL STATEMENTS
(Table Dollar Amounts In Thousands except Share and Per Share Data)
(Table Dollar Amounts In Thousands except Share and Per Share Data)
The following table summarizes the investment securities with unrealized losses at December
31, 2010 and December 31, 2009 aggregated by major security type and length of time in a continuous
unrealized loss position:
| 2010 | Less than 12 Months | 12 Months or More | Total | |||||||||||||||||||||
| Fair | Unrealized | Fair | Unrealized | Fair | Unrealized | |||||||||||||||||||
| Description of Securities | Value | Loss | Value | Loss | Value | Loss | ||||||||||||||||||
U.S. Treasury and U.S. government sponsored entities |
$ | 8,458 | $ | (160 | ) | $ | 313 | $ | (6 | ) | $ | 8,771 | $ | (166 | ) | |||||||||
State and political subdivisions |
36,118 | (1,981 | ) | 790 | (165 | ) | 36,908 | (2,146 | ) | |||||||||||||||
Mortgage-backed securities — residential |
45,567 | (1,002 | ) | 26 | (1 | ) | 45,593 | (1,003 | ) | |||||||||||||||
Collateralized mortgage obligations |
19,594 | (362 | ) | 0 | 0 | 19,594 | (362 | ) | ||||||||||||||||
Equity securities |
0 | 0 | 8 | (16 | ) | 8 | (16 | ) | ||||||||||||||||
Total temporarily impaired |
$ | 109,737 | $ | (3,505 | ) | $ | 1,137 | $ | (188 | ) | $ | 110,874 | $ | (3,693 | ) | |||||||||
| 2009 | Less than 12 Months | 12 Months or More | Total | |||||||||||||||||||||
| Fair | Unrealized | Fair | Unrealized | Fair | Unrealized | |||||||||||||||||||
| Description of Securities | Value | Loss | Value | Loss | Value | Loss | ||||||||||||||||||
U.S. Treasury and U.S. government sponsored entities |
$ | 44,854 | $ | (330 | ) | $ | 359 | $ | (7 | ) | $ | 45,213 | $ | (337 | ) | |||||||||
State and political subdivisions |
13,336 | (162 | ) | 3,035 | (285 | ) | 16,371 | (447 | ) | |||||||||||||||
Mortgage-backed securities — residential |
40,304 | (410 | ) | 60 | (1 | ) | 40,364 | (411 | ) | |||||||||||||||
Equity securities |
28 | (3 | ) | 7 | (16 | ) | 35 | (19 | ) | |||||||||||||||
Total temporarily impaired |
$ | 98,522 | $ | (905 | ) | $ | 3,461 | $ | (309 | ) | $ | 101,983 | $ | (1,214 | ) | |||||||||
The Company’s equity securities include preferred Federal National Mortgage Association (FNMA)
and local and regional bank holdings. For the year ended December 31, 2009, the Company recognized
a $74 thousand pre-tax charge for the other-than-temporary decline in fair value on its local and
regional bank holdings. During 2008, the Company made the determination that an impairment of the
FNMA stock was other-than-temporary and recorded a $2.7 million pre-tax impairment charge. When a
decline in fair value below cost is deemed to be other-than-temporary, the difference between the
amortized cost basis of the equity security and its fair value must be recognized as a charge to
earnings. No other-than-temporary impairment was recognized for the year ended December 31, 2010.
As of December 31, 2010, the Company’s security portfolio consisted of 406 securities,
97 of which were in an unrealized loss position. The majority of unrealized losses are related to
the Company’s holdings in securities issued by U.S. government sponsored entities, state and
political subdivisions, and mortgage-backed securities, as discussed below:
Securities issued by U.S. Government sponsored entities and agencies:
Unrealized losses on debt securities issued by U.S. government sponsored entities and agencies
have not been recognized into income because the securities are of high credit quality, management
does not have the intent to sell these securities before their anticipated recovery and the decline
in fair value is largely due to changes in market interest rates and not credit quality. The fair
value is expected to recover as the securities approach their maturity date.
Securities issued by State and Political subdivisions:
Unrealized losses on debt securities issued by state and political subdivisions have not been
recognized into income. Generally these securities have maintained their investment grade ratings
and management does not have the intent to sell these securities before their anticipated recovery.
The fair value is expected to recover as the securities approach their maturity date.
Mortgage-backed securities:
All of the Company’s holdings of mortgage-backed securities at year end 2010 and 2009 were
issued by U.S. government sponsored enterprises. Unrealized losses on mortgage-backed securities
have not been recognized into income. Because the decline in fair value is attributable to changes
in interest rates and illiquidity, and not credit quality, and because the Company does not have
the intent to sell these mortgage-backed securities and it is likely that it will not be required
to sell the securities before their anticipated recovery, the Company does not consider these
securities to be other-than-temporarily impaired at December 31, 2010.
Collateralized mortgage obligations:
The Company’s securities portfolio includes collateralized mortgage obligations with a market
value of $19.6 million which had unrealized losses of approximately $362 thousand at December 31,
2010. The Company monitors to insure it has adequate credit support and as of December 31, 2010,
the Company believes there is no OTTI and does not have the intent to sell these securities and it
is likely that it will not be required to sell the securities before their anticipated recovery.
35
NOTES TO CONSOLIDATED FINANCIAL STATEMENTS
(Table Dollar Amounts In Thousands except Share and Per Share Data)
(Table Dollar Amounts In Thousands except Share and Per Share Data)
NOTE 3 — LOANS
Loans at year end were as follows:
| 2010 | 2009 | |||||||
Commercial real estate |
||||||||
Owner occupied |
$ | 111,261 | $ | 114,942 | ||||
Non-owner occupied |
84,758 | 79,433 | ||||||
Other |
8,416 | 22,101 | ||||||
Commercial |
76,635 | 75,893 | ||||||
Residential real estate |
||||||||
1-4 family residential |
154,132 | 154,417 | ||||||
Home equity lines of credit |
23,624 | 27,138 | ||||||
Consumer |
||||||||
Indirect |
116,999 | 120,977 | ||||||
Direct |
11,302 | 11,027 | ||||||
Other |
1,485 | 1,522 | ||||||
Subtotal |
588,612 | 607,450 | ||||||
Net deferred loan (fees) costs |
1,755 | 1,945 | ||||||
Allowance for loan losses |
(9,307 | ) | (7,400 | ) | ||||
NET LOANS |
$ | 581,060 | $ | 601,995 | ||||
Activity in the allowance for loan losses was as follows:
| 2010 | 2009 | 2008 | ||||||||||
Balance at beginning of year |
$ | 7,400 | $ | 5,553 | $ | 5,459 | ||||||
Provision for loan losses |
8,078 | 6,050 | 1,420 | |||||||||
Loans charged-off |
(6,745 | ) | (4,799 | ) | (1,731 | ) | ||||||
Recoveries |
574 | 596 | 405 | |||||||||
Balance at end of year |
$ | 9,307 | $ | 7,400 | $ | 5,553 | ||||||
The following table presents the balance in the allowance for loan losses and the recorded
investment in loans by portfolio segment and based on impairment method as of December 31, 2010.
The recorded investment in loans includes the unpaid principal balance and unamortized loan
origination fees and costs, but excludes accrued interest receivable which is not considered to be
material.
| Commercial | Residential | |||||||||||||||||||||||
| Allowance for loan losses: | Real Estate | Commercial | Real Estate | Consumer | Unallocated | Total | ||||||||||||||||||
Ending allowance balance attributable to loans: |
||||||||||||||||||||||||
Individually evaluated for impairment |
$ | 547 | $ | 58 | — | — | — | $ | 605 | |||||||||||||||
Collectively evaluated for impairment |
5,233 | 1,649 | $ | 881 | $ | 875 | $ | 64 | 8,702 | |||||||||||||||
Total ending allowance balance |
$ | 5,780 | $ | 1,707 | $ | 881 | $ | 875 | $ | 64 | $ | 9,307 | ||||||||||||
Loans: |
||||||||||||||||||||||||
Loans individually evaluated for impairment |
$ | 6,045 | $ | 1,015 | — | — | — | $ | 7,060 | |||||||||||||||
Loans collectively evaluated for impairment |
197,849 | 75,620 | $ | 177,067 | $ | 132,771 | — | 583,307 | ||||||||||||||||
Total ending loans balance |
$ | 203,894 | $ | 76,635 | $ | 177,067 | $ | 132,771 | — | $ | 590,367 | |||||||||||||
36
NOTES TO CONSOLIDATED FINANCIAL STATEMENTS
(Table Dollar Amounts In Thousands except Share and Per Share Data)
(Table Dollar Amounts In Thousands except Share and Per Share Data)
Individually impaired loans were as follows:
| 2010 | 2009 | |||||||
Year-end loans with no allocated
allowance for loan losses |
$ | 2,452 | $ | 425 | ||||
Year-end loans with allocated
allowance for loan losses |
4,630 | 13,071 | ||||||
| $ | 7,082 | $ | 13,496 | |||||
Amount of the allowance for
loan losses allocated |
$ | 605 | $ | 2,058 | ||||
| 2010 | 2009 | 2008 | ||||||||||
Average of individually impaired
loans during year |
$ | 7,755 | $ | 11,407 | $ | 1,157 | ||||||
Interest income recognized during impairment for all periods was immaterial.
The following table presents loans individually evaluated for impairment by class of loans as
of December 31, 2010:
| Unpaid | Allowance for | |||||||||||
| Principal | Recorded | Loan Losses | ||||||||||
| Balance | Investment | Allocated | ||||||||||
With no related allowance recorded: |
||||||||||||
Commercial real estate |
||||||||||||
Owner occupied |
$ | 821 | $ | 818 | $ | — | ||||||
Non-owner occupied |
466 | 465 | — | |||||||||
Other |
365 | 364 | — | |||||||||
Commercial |
800 | 798 | — | |||||||||
Residential real estate |
||||||||||||
1 - 4 family residential |
— | — | — | |||||||||
Home equity lines of credit |
— | — | — | |||||||||
Consumer |
||||||||||||
Indirect |
— | — | — | |||||||||
Direct |
— | — | — | |||||||||
Other |
— | — | — | |||||||||
With an allowance recorded: |
||||||||||||
Commercial real estate |
||||||||||||
Owner occupied |
3,147 | 3,141 | 134 | |||||||||
Non-owner occupied |
167 | 167 | 3 | |||||||||
Other |
1,097 | 1,090 | 435 | |||||||||
Commercial |
219 | 217 | 33 | |||||||||
Residential real estate |
||||||||||||
1 - 4 family residential |
— | — | — | |||||||||
Home equity lines of credit |
— | — | — | |||||||||
Consumer |
||||||||||||
Indirect |
— | — | — | |||||||||
Direct |
— | — | — | |||||||||
Other |
— | — | — | |||||||||
Total |
$ | 7,082 | $ | 7,060 | $ | 605 | ||||||
The following table presents the recorded investment in nonaccrual and loans past due over
90 days still on accrual by class of loans as of December 31, 2010:
| Loans Past Due | ||||||||
| Over 90 Days | ||||||||
| Still | ||||||||
| Nonaccrual | Accruing | |||||||
Commercial real estate |
||||||||
Owner occupied |
$ | 1,960 | $ | — | ||||
Non-owner occupied |
550 | — | ||||||
Other |
1,462 | — | ||||||
Commercial |
400 | — | ||||||
Residential real estate |
||||||||
1 - 4 family residential |
3,362 | 190 | ||||||
Home equity lines of credit |
815 | 10 | ||||||
Consumer |
||||||||
Indirect |
27 | 53 | ||||||
Direct |
— | 48 | ||||||
Other |
— | 24 | ||||||
Total |
$ | 8,576 | $ | 325 | ||||
Nonaccrual loans and loans past due 90 days still on accrual include both smaller balance
homogeneous loans that are collectively evaluated for impairment and individually classified
impaired loans.
At December 31, 2009, there were $9.6 million of nonaccrual loans and $469 thousand of loans
past due over 90 days and still accruing.
37
NOTES TO CONSOLIDATED FINANCIAL STATEMENTS
(Table Dollar Amounts In Thousands except Share and Per Share Data)
(Table Dollar Amounts In Thousands except Share and Per Share Data)
The following table presents the aging of the recorded investment in past due loans as of
December 31, 2010 by class of loans:
| 30 - 59 | 60 - 89 | Greater Than | ||||||||||||||||||||||
| Days | Days | 90 Days | Total | Loans Not | ||||||||||||||||||||
| Past Due | Past Due | Past Due | Past Due | Past Due | Total | |||||||||||||||||||
Commercial real estate |
||||||||||||||||||||||||
Owner occupied |
$ | 407 | $ | 91 | $ | 1,960 | $ | 2,458 | $ | 108,509 | $ | 110,967 | ||||||||||||
Non-owner occupied |
499 | 59 | 550 | 1,108 | 75,281 | 76,389 | ||||||||||||||||||
Other |
— | — | 1,462 | 1,462 | 15,076 | 16,538 | ||||||||||||||||||
Commercial |
286 | 275 | 400 | 961 | 75,674 | 76,635 | ||||||||||||||||||
Residential real estate |
||||||||||||||||||||||||
1 - 4 family residential |
2,981 | 435 | 3,552 | 6,968 | 146,475 | 153,443 | ||||||||||||||||||
Home equity lines of credit |
334 | 16 | 825 | 1,175 | 22,449 | 23,624 | ||||||||||||||||||
Consumer |
||||||||||||||||||||||||
Indirect |
1,668 | 519 | 80 | 2,267 | 117,716 | 119,983 | ||||||||||||||||||
Direct |
253 | 91 | 48 | 392 | 10,911 | 11,303 | ||||||||||||||||||
Other |
9 | 1 | 24 | 34 | 1,451 | 1,485 | ||||||||||||||||||
Total |
$ | 6,437 | $ | 1,487 | $ | 8,901 | $ | 16,825 | $ | 573,542 | $ | 590,367 | ||||||||||||
TROUBLED DEBT RESTRUCTURINGS:
Included in loans individually impaired are loans with balances of $3.0 million and $5.4
million for which the Company has modified the repayment terms in 2010 and 2009. The Company has
allocated $40 thousand and $333 thousand of specific reserves to customers whose loan terms have
been modified in troubled debt restructurings as of December 31, 2010 and 2009. There are no
commitments to lend additional amounts to borrowers with loans that are classified as troubled
debt restructurings at December 31, 2010. The Company had committed to lend additional amounts
totaling up to $24 thousand as of December 31, 2009 to customers with outstanding loans that are
classified as troubled debt restructurings.
CREDIT QUALITY INDICATORS:
The Company categorizes loans into risk categories based on relevant information about
the ability of borrowers to service their debt such as: current financial information, historical
payment experience, credit documentation, public information, and current economic trends, among
other factors. The Company analyzes loans individually by classifying the loans as to credit
risk. This analysis is performed on a monthly basis. The Company uses the following definitions
for risk ratings:
Special Mention. Loans classified as special mention have a potential weakness that
deserves management’s close attention. If left uncorrected, these potential weaknesses
may result in deterioration of the repayment prospects for the loan or of the
institution’s credit position at some future date. Special mention assets are not
adversely classified and do not expose an institution to sufficient risk to warrant
adverse classification.
Substandard. Loans classified as substandard are inadequately protected by the current net
worth and paying capacity of the obligor or of the collateral pledged, if any. Loans so
classified have a well-defined weakness or weaknesses that jeopardize the liquidation of
the debt. They are characterized by the distinct possibility that the institution will
sustain some loss if the deficiencies are not corrected.
Doubtful. Loans classified as doubtful have all the weaknesses inherent in those
classified as substandard, with the added characteristic that the weaknesses make
collection or liquidation in full, on the basis of currently existing facts,
conditions, and values, highly questionable and improbable.
Loans not meeting the criteria above that are analyzed individually as part of the
above described process are considered to be pass rated loans. As of December 31, 2010,
and based on the most recent analysis performed, the risk category of loans by class of
loans is as follows:
| Special | Not | |||||||||||||||||||
| Pass | Mention | Substandard | Doubtful | Rated | ||||||||||||||||
Commercial real estate |
||||||||||||||||||||
Owner occupied |
$ | 91,976 | $ | 3,893 | $ | 15,098 | $ | — | $ | — | ||||||||||
Non-owner occupied |
63,502 | 1,075 | 11,812 | — | — | |||||||||||||||
Other |
12,005 | 786 | 3,747 | — | — | |||||||||||||||
Commercial |
65,358 | 4,076 | 7,201 | — | — | |||||||||||||||
Total |
$ | 232,841 | $ | 9,830 | $ | 37,858 | $ | — | $ | — | ||||||||||
38
NOTES TO CONSOLIDATED FINANCIAL STATEMENTS
(Table Dollar Amounts In Thousands except Share and Per Share Data)
(Table Dollar Amounts In Thousands except Share and Per Share Data)
The Company considers the performance of the loan portfolio and its impact on the
allowance for loan losses. For residential, consumer and indirect loan classes, the Company also
evaluates credit quality based on the aging status of the loan, which was previously presented, and
by payment activity. The following table presents the recorded investment in residential, consumer
and indirect auto loans based on payment activity as of December 31, 2010. Nonperforming loans are
loans past due 90 days and still accruing interest and nonaccrual loans.
| Residential Real Estate | ||||||||||||||||||||
| 1-4 Family | Home Equity | Consumer | ||||||||||||||||||
| Residential | Lines of Credit | Indirect | Direct | Other | ||||||||||||||||
Performing |
$ | 149,891 | $ | 22,799 | $ | 119,903 | $ | 11,255 | $ | 1,461 | ||||||||||
Nonperforming |
3,552 | 825 | 80 | 48 | 24 | |||||||||||||||
Total |
$ | 153,443 | $ | 23,624 | $ | 119,983 | $ | 11,303 | $ | 1,485 | ||||||||||
NOTE 4 — FAIR VALUE
Fair value is the exchange price that would be received for an asset or paid to transfer a
liability (exit price) in the principal or most advantageous market for the asset or liability in
an orderly transaction between market participants on the measurement date. There are three levels
of inputs that may be used to measure fair values:
Level 1 — Quoted prices (unadjusted) for identical assets or liabilities in active markets
that the entity has the ability to access as of the measurement date.
Level 2 — Significant other observable inputs other than Level 1 prices such as quoted prices for
similar assets or liabilities; quoted prices in markets that are not active; or other inputs that
are observable or can be corroborated by observable market data.
Level 3 — Significant unobservable inputs that reflect a reporting entity’s own assumptions about
the assumptions that market participants would use in pricing an asset or liability.
The Company used the following methods and significant assumptions to estimate the fair value
of each type of financial instrument:
Investment Securities:
The fair values for investment securities are determined by quoted market prices, if
available (Level 1). For securities where quoted prices are not available, fair values are
calculated based on market prices of similar securities (Level 2). For securities where quoted
prices or market prices of similar securities are not available, fair values are calculated using
discounted cash flows or other market indicators (Level 3).
Impaired Loans:
The fair value of impaired loans with specific allocations of the allowance for loan
losses is generally based on recent real estate appraisals. These appraisals may utilize a single
valuation approach or a combination of approaches including comparable sales and the income
approach. Adjustments are routinely made in the appraisal process by the appraisers to adjust for
differences between the comparable sales and income data available. Such adjustments are usually
significant and typically result in a Level 3 classification of the inputs for determining fair
value.
Assets and liabilities measured at fair value on a recurring basis, including financial
assets and liabilities for which the Company has elected the fair value option, are summarized
below:
| Fair Value Measurements | ||||||||||||||||
| at December 31, 2010 Using | ||||||||||||||||
| Quoted Prices in | Significant | |||||||||||||||
| Active Markets | Other | Significant | ||||||||||||||
| for Identical | Observable | Unobservable | ||||||||||||||
| Carrying | Assets | Inputs | Inputs | |||||||||||||
| Value | (Level 1) | (Level 2) | (Level 3) | |||||||||||||
Financial Assets: |
||||||||||||||||
Investment securities
available-for sale |
||||||||||||||||
U.S. Treasury and
U.S. government —
sponsored entities |
$ | 69,978 | $ | 0 | $ | 69,978 | $ | 0 | ||||||||
State and political
subdivisions |
80,466 | 0 | 80,466 | 0 | ||||||||||||
Mortgage-backed
securities — residential |
143,777 | 0 | 143,765 | 12 | ||||||||||||
Collateralized mortgage
obligations |
19,660 | 0 | 19,660 | 0 | ||||||||||||
Equity securities |
199 | 199 | 0 | 0 | ||||||||||||
Other securities |
267 | 0 | 267 | 0 | ||||||||||||
Total investment securities |
$ | 314,347 | $ | 199 | $ | 314,136 | $ | 12 | ||||||||
| Fair Value Measurements | ||||||||||||||||
| at December 31, 2009 Using | ||||||||||||||||
| Quoted Prices in | Significant | |||||||||||||||
| Active Markets | Other | Significant | ||||||||||||||
| for Identical | Observable | Unobservable | ||||||||||||||
| Carrying | Assets | Inputs | Inputs | |||||||||||||
| Value | (Level 1) | (Level 2) | (Level 3) | |||||||||||||
Financial Assets: |
||||||||||||||||
Investment securities
available-for-sale |
||||||||||||||||
U.S. Treasury and
U.S. government —
sponsored entities |
$ | 99,833 | $ | 0 | $ | 99,833 | $ | 0 | ||||||||
State and political
subdivisions |
63,432 | 0 | 63,432 | 0 | ||||||||||||
Mortgage-backed
securities — residential |
145,262 | 0 | 145,249 | 13 | ||||||||||||
Collateralized
mortgage obligations |
318 | 0 | 318 | 0 | ||||||||||||
Equity securities |
259 | 259 | 0 | 0 | ||||||||||||
Other securities |
264 | 0 | 264 | 0 | ||||||||||||
Total investment securities |
$ | 309,368 | $ | 259 | $ | 309,096 | $ | 13 | ||||||||
There were no significant transfers between Level 1 and Level 2 during 2010.
39
NOTES TO CONSOLIDATED FINANCIAL STATEMENTS
(Table Dollar Amounts In Thousands except Share and Per Share Data)
(Table Dollar Amounts In Thousands except Share and Per Share Data)
The table below presents a reconciliation of all assets measured at fair value on a
recurring basis using significant unobservable inputs (Level 3) for the period ended December 31:
| Investment Securities | ||||||||
| Available-for-Sale | ||||||||
| (Level 3) | ||||||||
| 2010 | 2009 | |||||||
Balance of recurring Level 3 assets at January 1 |
$ | 13 | $ | 8,977 | ||||
Total unrealized gains or losses: |
||||||||
Included in other comprehensive income |
0 | (379 | ) | |||||
Purchases, sales, issuances and settlements, net |
(1 | ) | (1,613 | ) | ||||
Transfers in and/or out of Level 3 |
0 | (6,972 | ) | |||||
Balance of recurring Level 3 assets at December 31 |
$ | 12 | $ | 13 | ||||
There is no impact to earnings as a result of fair value measurements on items valued on a
recurring basis, using level 3 inputs.
Assets Measured on a Non-Recurring Basis
Assets measured at fair value on a non-recurring basis are summarized below:
| Fair Value Measurements | ||||||||||||||||
| at December 31, 2010 Using | ||||||||||||||||
| Quoted Prices in | Significant | |||||||||||||||
| Active Markets | Other | Significant | ||||||||||||||
| for Identical | Observable | Unobservable | ||||||||||||||
| Carrying | Assets | Inputs | Inputs | |||||||||||||
| Value | (Level 1) | (Level 2) | (Level 3) | |||||||||||||
Financial Assets |
||||||||||||||||
Impaired Loans |
||||||||||||||||
Commercial Real Estate |
||||||||||||||||
Owner occupied |
$ | 1,239 | 0 | 0 | $ | 1,239 | ||||||||||
Non-owner occupied |
164 | 0 | 0 | 164 | ||||||||||||
Other |
662 | 0 | 0 | 662 | ||||||||||||
Commercial |
186 | 0 | 0 | 186 | ||||||||||||
| Fair Value Measurements | ||||||||||||||||
| at December 31, 2009 Using | ||||||||||||||||
| Quoted Prices in | Significant | |||||||||||||||
| Active Markets | Other | Significant | ||||||||||||||
| for Identical | Observable | Unobservable | ||||||||||||||
| Carrying | Assets | Inputs | Inputs | |||||||||||||
| Value | (Level 1) | (Level 2) | (Level 3) | |||||||||||||
Financial Assets |
||||||||||||||||
Impaired loans |
$ | 5,904 | $ | 0 | $ | 0 | $ | 5,904 | ||||||||
Impaired
loans that are measured for impairment using the fair value of the collateral
for collateral dependent loans, had a principal balance of $2.8 million, net of a valuation
allowance of $565 thousand at December 31, 2010. Loans measured at fair value throughout
the year resulted in an additional provision for loan
losses of $2.2 million for the year ending December 31, 2010. At December 31, 2009, impaired loans
had a carrying amount of $7.6 million, with a valuation allowance of $1.7 million.
Loans measured at fair value throughout the year resulted in an
additional provision for loan losses of $1.5 million for the year ending December 31, 2009.
Excluded from the fair value of impaired loans disclosed above are $1.8 million and $5.4 million of
loans classified as troubled debt restructurings at December 31, 2010 and 2009.
Fair Value of Financial Instruments
The carrying amounts and estimated fair values of financial instruments, at December 31,
2010 and December 31, 2009 are as follows:
| 2010 | 2009 | |||||||||||||||
| Carrying | Fair | Carrying | Fair | |||||||||||||
| Amount | Value | Amount | Value | |||||||||||||
Financial assets |
||||||||||||||||
Cash, due from banks,
federal funds sold and
money market investments |
$ | 37,305 | $ | 37,305 | $ | 51,160 | $ | 51,160 | ||||||||
Securities available-for-sale |
314,347 | 314,347 | 309,368 | 309,368 | ||||||||||||
Restricted stock |
3,977 | n/a | 3,977 | n/a | ||||||||||||
Loans, net |
581,060 | 590,331 | 601,995 | 609,127 | ||||||||||||
Accrued interest receivable |
4,125 | 4,125 | 4,370 | 4,370 | ||||||||||||
Financial liabilities |
||||||||||||||||
Deposits |
$ | 761,050 | $ | 764,170 | $ | 777,552 | $ | 781,703 | ||||||||
Short-term borrowings |
105,634 | 105,634 | 125,912 | 125,912 | ||||||||||||
Long-term borrowings |
24,733 | 27,080 | 27,169 | 28,990 | ||||||||||||
Accrued interest payable |
703 | 703 | 1,155 | 1,155 | ||||||||||||
The methods and assumptions used to estimate fair value are described as follows:
Carrying amount is the estimated fair value for cash and cash equivalents, accrued interest
receivable and payable, demand deposits, short term debt, and variable rate loans or deposits that
reprice frequently and fully. The methods for determining the fair values for securities were
described previously. For fixed rate loans or deposits and for variable rate loans or deposits with
infrequent repricing or repricing limits, fair value is based on discounted cash flows using
current market rates applied to the estimated life and credit risk. Fair value of debt is based on
current rates for similar financing. It was not practicable to determine the fair value of
restricted stock due to restrictions placed on its transferability. The fair value of off-balance
sheet items is not considered material.
NOTE 5 — PREMISES AND EQUIPMENT
Year-end premises and equipment were as follows:
| 2010 | 2009 | |||||||
Land |
$ | 3,079 | $ | 2,834 | ||||
Buildings |
15,921 | 15,812 | ||||||
Furniture, fixtures and equipment |
9,676 | 9,247 | ||||||
Leasehold improvements |
203 | 203 | ||||||
| 28,879 | 28,096 | |||||||
Less accumulated depreciation |
(14,935 | ) | (13,903 | ) | ||||
NET BOOK VALUE |
$ | 13,944 | $ | 14,193 | ||||
Depreciation expense was $1.0 million for the year ended December 31, 2010, $980 thousand for
2009 and $989 thousand for 2008.
40
NOTES TO CONSOLIDATED FINANCIAL STATEMENTS
(Table Dollar Amounts In Thousands except Share and Per Share Data)
(Table Dollar Amounts In Thousands except Share and Per Share Data)
The Company leases certain branch properties under operating leases. Rent expense
was $257, $203 and $73 thousand for 2010, 2009 and 2008. In addition to rent expense, under the
leases, common area maintenance and property taxes are paid and the amount can fluctuate according
to the costs incurred. Rent commitments, before considering renewal options that generally are
present, were as follows:
2011 |
$ | 219 | ||
2012 |
130 | |||
2013 |
130 | |||
2014 |
119 | |||
2015 |
69 | |||
TOTAL |
$ | 667 | ||
NOTE 6 — GOODWILL AND INTANGIBLE ASSETS
The acquisition of Farmers Trust Company on March 31, 2009, more fully described in Note
18, resulted in $3.7 million of goodwill.
Impairment exists when a reporting unit’s carrying value of goodwill exceeds its fair value,
which is determined through a two-step impairment test. Step 1 includes the determination of the
carrying value of our reporting unit, including the existing goodwill and intangible assets, and
estimating the fair value of the reporting unit. We determined the fair value of our reporting unit
exceeded its carrying amount. If the carrying amount of a reporting unit exceeds its fair value, we
are required to perform a second step to the impairment test.
Acquired Intangible Assets:
Acquired intangible assets, which also resulted from the acquisition of Farmers Trust
Company, were as follows at year end:
| 2010 | 2009 | |||||||||||||||
| Gross | Gross | |||||||||||||||
| Carrying | Accumulated | Carrying | Accumulated | |||||||||||||
| Amount | Amortization | Amount | Amortization | |||||||||||||
Amortized intangible assets: |
||||||||||||||||
Customer relationship intangibles |
$ | 3,990 | $ | (810 | ) | $ | 3,990 | $ | (355 | ) | ||||||
Non-compete contracts |
250 | (219 | ) | 250 | (94 | ) | ||||||||||
TOTAL |
$ | 4,240 | $ | (1,029 | ) | $ | 4,240 | $ | (449 | ) | ||||||
Aggregate amortization expense was $580 thousand and $449 thousand for 2010 and 2009.
Estimated amortization expense for each of the next five years:
2011 |
$ | 479 | ||
2012 |
409 | |||
2013 |
393 | |||
2014 |
354 | |||
2015 |
319 | |||
Thereafter |
1,257 |
NOTE 7 — INTEREST BEARING DEPOSITS
Time deposits of $100 thousand or more were $97.4 million and $131.0 million at year-end
2010 and 2009.
Following is a summary of scheduled maturities of certificates of deposit during the years
following December 31, 2010:
2011 |
$ | 107,666 | ||
2012 |
46,559 | |||
2013 |
23,719 | |||
2014 |
16,645 | |||
2015 |
59,891 | |||
Thereafter |
1,615 | |||
TOTAL |
$ | 256,095 | ||
Following is a summary of year-end interest bearing deposits:
| 2010 | 2009 | |||||||
Demand |
$ | 109,403 | $ | 106,410 | ||||
Money Market |
229,605 | 198,747 | ||||||
Savings |
88,219 | 78,901 | ||||||
Certificates of Deposit |
256,095 | 325,074 | ||||||
TOTAL |
$ | 683,322 | $ | 709,132 | ||||
NOTE 8 — SECURITIES SOLD UNDER AGREEMENTS TO REPURCHASE AND OTHER SHORT-TERM BORROWINGS
Securities sold under repurchase agreements are secured by the Bank’s holdings of debt
securities issued by U.S. government sponsored entities and agencies with a carrying amount of
$166.0 million and $152.3 million at year-end 2010 and 2009.
Repurchase agreements are financing arrangements that mature within 89 days. Under the
agreements, customers agree to maintain funds on deposit with the Bank and in return acquire an
interest in a pool of securities pledged as collateral against the funds. The securities are held
in segregated safekeeping accounts at the Federal Reserve Bank and Farmers Trust Company.
Information concerning securities sold under agreements to repurchase is summarized as follows:
| 2010 | 2009 | 2008 | ||||||||||
Average balance during the year |
$ | 142,871 | $ | 123,119 | $ | 77,952 | ||||||
Average interest rate during the year |
0.58 | % | 1.49 | % | 2.60 | % | ||||||
Maximum month-end balance during the year |
$ | 148,765 | $ | 148,765 | $ | 101,706 | ||||||
Weighted average year-end interest rate |
0.40 | % | 1.23 | % | 2.30 | % | ||||||
Balance at year-end |
$ | 103,753 | $ | 124,313 | $ | 83,874 | ||||||
The Bank has a short-term U.S. Treasury interest-bearing demand note with a balance of $781
thousand at December 31, 2010 and $849 thousand at December 31, 2009. The demand note was interest
free at December 31, 2010 and 2009.
41
NOTES TO CONSOLIDATED FINANCIAL STATEMENTS
(Table Dollar Amounts In Thousands except Share and Per Share Data)
(Table Dollar Amounts In Thousands except Share and Per Share Data)
The Bank has access to a line of credit in the amount of $8 million at a major
domestic bank that is below prime rate. The line and terms are periodically reviewed by the bank
and are generally subject to withdrawal at their discretion. There were no borrowings under this
line at December 31, 2010 or 2009.
Farmers National Banc Corp has an unsecured $1.5 million revolving line of credit. The line
can be renewed annually. The outstanding balance was $1.1 million and $750 thousand at December 31,
2010 and 2009. The interest rate is prime with a floor of 4.5%. The interest rate at December 31,
2010 and 2009 was 4.5%.
NOTE 9 — FEDERAL HOME LOAN BANK ADVANCES AND OTHER LONG-TERM BORROWINGS
At year end, long-term advances from the Federal Home Loan Bank were as follows:
| 2010 | 2009 | |||||||||||||||
| Weighted | Weighted | |||||||||||||||
| Average | Average | |||||||||||||||
| Amount | Rate | Amount | Rate | |||||||||||||
Fixed-rate constant payment advances,
at rates from 3.16% to 5.25% at
December 31, 2010 |
$ | 4,544 | 4.65 | % | $ | 6,924 | 4.62 | % | ||||||||
Convertible and putable fixed-rate
advances,
at rates from 2.82% to 4.88% at
December 31, 2010 |
20,000 | 4.12 | % | 20,000 | 4.12 | % | ||||||||||
Total advances |
$ | 24,544 | 4.22 | % | $ | 26,924 | 4.25 | % | ||||||||
At year end 2010 and 2009, $5 million of the FHLB fixed-rate advances are convertible to a
floating rate advance on or after certain specific dates at the option of the FHLB. Should the FHLB
elect to convert, the Bank has the right to prepay any or all of the borrowing at the time of
conversion and on any interest payment due date, thereafter, without penalty.
At year end 2010 and 2009, $15 million of the FHLB fixed-rate advances are putable on or after
certain specific dates at the option of the FHLB. Should the FHLB elect the put, the Bank is
required to repay the advance on that date without penalty.
Federal Home Loan Bank advances are secured by a blanket pledge of residential mortgage loans
totaling $95.3 million and $108.2 million at year end 2010 and 2009. Based on this collateral and
the Company’s holdings of FHLB stock, the Bank is eligible to borrow an additional $53.3 million at
year end 2010. Each advance is subject to a prepayment penalty if paid prior to its maturity date.
Scheduled repayments of long-term FHLB advances are as follows:
Maturing in: |
||||
2011 |
$ | 1,751 | ||
2012 |
812 | |||
2013 |
764 | |||
2014 |
10,969 | |||
2015 |
5,248 | |||
Later years |
5,000 | |||
TOTAL |
$ | 24,544 | ||
The Bank has a note payable secured by real estate totaling $189 thousand in 2010 and $245
thousand in 2009. This note carries a fixed interest rate of 7.50%. Scheduled principal repayments
of the note payable are as follows:
Maturing in: |
||||
2011 |
$ | 60 | ||
2012 |
65 | |||
2013 |
64 | |||
TOTAL |
$ | 189 | ||
NOTE 10 — COMMITMENTS AND CONTINGENT LIABILITIES
Some financial instruments, such as loan commitments, credit lines, letters of credit and
overdraft protection, are issued to meet customer financing needs. These are agreements to provide
credit or to support the credit of others, as long as conditions established in the contract are
met, and usually have expiration dates. Commitments may expire without being used.
Off-balance-sheet risk to credit loss exists up to the face amount of these instruments, although
material losses are not anticipated. The same credit policies are used to make such commitments as
are used for loans, including obtaining collateral at exercise of the commitment.
The contractual amount of financial instruments with off-balance-sheet risk at year end were
as follows:
| 2010 | 2009 | |||||||||||||||
| Fixed | Variable | Fixed | Variable | |||||||||||||
| Rate | Rate | Rate | Rate | |||||||||||||
Commitments to make loans |
$ | 1,265 | $ | 4,617 | $ | 845 | $ | 8,872 | ||||||||
Unused lines of credit |
$ | 29,999 | $ | 32,462 | $ | 33,368 | $ | 34,619 | ||||||||
Commitments to make loans are generally made for periods of 30 days or less. The fixed
rate loan commitments for 2010 have interest rates ranging from 4.75% to 6.25% and maturities
ranging from fifteen to thirty years. The fixed rate commitments for 2009 have interest rates
ranging from 4.75% to 5.88% and maturities ranging from fifteen to thirty years. Fixed rate unused
lines of credit have interest rates ranging from 3.25% to 18.00% at December 31, 2010 as well as
3.25% to 18.00% at December 31, 2009.
Standby letters of credit are considered financial guarantees. The standby letters of credit
have a contractual value of $3.2 million in 2010 and $3.6 million in 2009. The carrying amount of
these items on the balance sheet is not material.
42
NOTES TO CONSOLIDATED FINANCIAL STATEMENTS
(Table Dollar Amounts In Thousands except Share and Per Share Data)
(Table Dollar Amounts In Thousands except Share and Per Share Data)
NOTE 11 — STOCK OPTIONS
The Company’s Stock Option Plan, which was shareholder-approved, permitted the grant of
share options to its directors, officers and employees for up to 375 thousand shares of common
stock. The Company believes that such awards better align the interests of its employees with those
of its shareholders. Option awards were granted with an exercise price equal to the market price of
the Company’s common stock at the date of grant; those option awards have vesting periods of 5
years and have 10-year contractual terms. Option exercises are expected to be satisfied with either
newly issued shares or treasury shares. The fair value of the Company’s stock at December 31, 2010
and 2009 was less than the fair value option exercise price, therefore the outstanding and
exercisable options had no intrinsic value.
The fair value of each option award is estimated on the date of grant using a closed form
option valuation Black-Scholes model that uses the assumptions noted in the table below. Expected
volatilities are based on historical volatilities of the Company’s common stock. The Company uses
historical data to estimate option exercise and post-vesting termination behavior. The expected
term of options granted is based on historical data and represents the period of time that options
granted are expected to be outstanding, which takes into account that the options are not
transferable. The risk-free interest rate for the expected term of the option is based on the U.S.
Treasury yield curve in effect at the time of the grant.
The fair value of options granted was determined using the following weighted-average
assumptions as of the grant date during 2008. There were no options granted in 2010 or 2009.
| 2008 | ||||
Risk-free interest rate |
2.51 | % | ||
Expected term |
5 yrs | |||
Expected stock price volatility |
15.48 | % | ||
Dividend yield |
7.14 | % | ||
Fair value |
$ | 0.46 | ||
A summary of the activity in the stock option plan for 2010 is as follows:
| Weighted | ||||||||||||
| Weighted | Average | |||||||||||
| Average | Remaining | |||||||||||
| Exercise | Contractual | |||||||||||
| Shares | Price | Life | ||||||||||
Outstanding at beginning of
year |
37,000 | $ | 10.40 | 2.8 yrs | ||||||||
Granted |
0 | |||||||||||
Exercised |
0 | |||||||||||
Forfeited or expired |
(8,500 | ) | 11.00 | |||||||||
Outstanding at end of year |
28,500 | $ | 10.22 | 2.0 yrs | ||||||||
Exercisable at end of year |
25,500 | $ | 10.65 | 1.4 yrs | ||||||||
The Company expects all outstanding options to vest. As of December 31, 2010, the total
unrecognized compensation cost related to nonvested stock options granted under the Plan was
immaterial.
NOTE 12 — REGULATORY MATTERS
Banks and bank holding companies are subject to various regulatory capital requirements
administered by the federal banking agencies. Capital adequacy guidelines and, additionally for
banks, prompt corrective action regulations, involve quantitative measures of assets, liabilities,
and certain off balance sheet items calculated under regulatory accounting practices. Capital
amounts and classifications are also subject to qualitative judgments by regulators. Failure to
meet capital requirements can initiate regulatory action by regulators that, if undertaken, could
have a direct material effect on the financial statements. Management believes as of December 31,
2010, the Company and Bank meet all capital adequacy requirements to which they are subject.
Prompt corrective action regulations provide five classifications: well capitalized,
adequately capitalized, undercapitalized, significantly undercapitalized, and critically
undercapitalized, although these terms are not used to represent overall financial condition. If
adequately capitalized, regulatory approval is required to accept brokered deposits. If
undercapitalized, capital distributions are limited, as is asset growth and expansion, and capital
restoration plans are required. At year end 2010 and 2009, the most recent regulatory notifications
categorized the Bank as well capitalized under the regulatory framework for prompt corrective
action. There are no conditions or events since that notification that management believes have
changed the institution’s category.
Dividend Restrictions: The Corporation’s principal source of funds for dividend payments is
dividends received from the Bank. The Bank, as a national bank, is subject to the dividend
restrictions set forth by the Comptroller of the Currency. The Comptroller of the Currency must
approve declaration of any dividends in excess of the sum of profits for the current year and
retained net profits for the preceding two years. During 2011, the Bank could, without prior
approval, declare dividends of approximately $1.2 million plus any 2011 net profits retained to the
date of the dividend declaration.
Due to the continuing growth in the Bank’s business and the increase in its allowance for loan
losses associated with current economic conditions, senior management and the Board have determined
that higher levels of capital are appropriate. The OCC concurred in the Board’s view that
additional capital would be beneficial in supporting its continued growth and operations. As a
result, effective February 2, 2010, the OCC proposed and the Bank accepted the following individual
minimum capital requirements for Farmers National Bank: Tier I Capital to Adjusted Total Assets of
7.20% and Total Capital to Risk-Weighted Assets of 11.00%. As of December 31, 2010, the Bank is in
compliance with these minimum capital requirements.
43
NOTES TO CONSOLIDATED FINANCIAL STATEMENTS
(Table Dollar Amounts In Thousands except Share and Per Share Data)
Actual and required capital amounts and ratios are presented below at year-end:
| Requirement | To be Well Capitalized | |||||||||||||||||||||||||
| For Capital | Under Prompt Corrective | |||||||||||||||||||||||||
| Actual | Adequacy Purposes: | Action Provisions: | ||||||||||||||||||||||||
| Amount | Ratio | Amount | Ratio | Amount | Ratio | |||||||||||||||||||||
2010 |
||||||||||||||||||||||||||
Total Capital to risk weighted assets |
Consolidated | $ | 85,942 | 13.99 | % | $ | 49,143 | 8.00 | % | N/A | N/A | |||||||||||||||
| Bank | 81,936 | 13.36 | % | 49,056 | 8.00 | % | $ | 61,320 | 10.00 | % | ||||||||||||||||
Tier I Capital to risk weighted assets |
Consolidated | 78,220 | 12.73 | % | 24,572 | 4.00 | % | N/A | N/A | |||||||||||||||||
| Bank | 74,238 | 12.11 | % | 24,528 | 4.00 | % | 36,792 | 6.00 | % | |||||||||||||||||
Tier I Capital to average assets |
Consolidated | 78,220 | 7.65 | % | 40,885 | 4.00 | % | N/A | N/A | |||||||||||||||||
| Bank | 74,238 | 7.38 | % | 40,225 | 4.00 | % | 50,282 | 5.00 | % | |||||||||||||||||
2009 |
||||||||||||||||||||||||||
Total Capital to risk weighted assets |
Consolidated | $ | 77,297 | 12.03 | % | $ | 51,402 | 8.00 | % | N/A | N/A | |||||||||||||||
| Bank | 72,692 | 11.36 | % | 51,197 | 8.00 | % | $ | 63,996 | 10.00 | % | ||||||||||||||||
Tier I Capital to risk weighted assets |
Consolidated | 69,847 | 10.87 | % | 25,701 | 4.00 | % | N/A | N/A | |||||||||||||||||
| Bank | 65,251 | 10.20 | % | 25,598 | 4.00 | % | 38,398 | 6.00 | % | |||||||||||||||||
Tier I Capital to average assets |
Consolidated | 69,847 | 6.87 | % | 40,659 | 4.00 | % | N/A | N/A | |||||||||||||||||
| Bank | 65,251 | 6.52 | % | 40,028 | 4.00 | % | 50,035 | 5.00 | % | |||||||||||||||||
NOTE 13 — EMPLOYEE BENEFIT PLANS
The Company has a qualified 401(k) deferred compensation Retirement Savings Plan. All
employees of the Company who have completed at least 90 days of service and meet certain other
eligibility requirements are eligible to participate in the Plan. Under the terms of the Plan,
employees may voluntarily defer a portion of their annual compensation pursuant to section 401(k)
of the Internal Revenue Code. The Company matches a percentage of the participants’ voluntary
contributions up to 6% of gross wages. In addition, at the discretion of the Board of Directors,
the Company may make an additional profit sharing contribution to the Plan. Total expense was $268
thousand, $236 thousand and $182 thousand for the years ended December 31, 2010, 2009 and 2008,
respectively.
The Company maintains a deferred compensation plan for certain existing employees and
retirees. Expense under the Plan was $43 thousand, $21 thousand and $26 thousand for the years
ended December 31, 2010, 2009 and 2008, respectively. The liability under the Plan at December 31,
2010 and 2009 was $257 thousand and $383 thousand.
The Company also has a postretirement benefit plan covering individuals retired from the
Company that have met certain service and age requirements and certain other active employees that
have met similar service requirements. The postretirement health care plan includes a limit on the
Company’s share of costs for recent and future retirees. Expense under this plan for 2010, 2009,
and 2008 was not material. The accrued postretirement benefit liability
under this plan is also not material. Due to the immateriality of the Plan, the disclosures
required under U.S. generally accepted accounting principles have
been omitted.
NOTE 14 — INCOME TAXES
The provision for income taxes (credit) consists of the following:
| 2010 | 2009 | 2008 | ||||||||||
Current expense |
$ | 3,332 | $ | 1,875 | $ | 1,911 | ||||||
Deferred expense |
(788 | ) | (806 | ) | (924 | ) | ||||||
TOTALS |
$ | 2,544 | $ | 1,069 | $ | 987 | ||||||
Effective tax rates differ from federal statutory rate of 35% applied to income before income
taxes due to the following:
| 2010 | 2009 | 2008 | ||||||||||
Statutory tax |
$ | 4,037 | $ | 2,419 | $ | 2,328 | ||||||
Effect of nontaxable interest |
(1,062 | ) | (1,060 | ) | (1,053 | ) | ||||||
Bank owned life insurance, net |
(158 | ) | (172 | ) | (172 | ) | ||||||
Effect of nontaxable life insurance
death proceeds |
(179 | ) | (32 | ) | 0 | |||||||
Other |
(94 | ) | (86 | ) | (116 | ) | ||||||
ACTUAL TAX |
$ | 2,544 | $ | 1,069 | $ | 987 | ||||||
Deferred tax assets (liabilities) are comprised of the following:
| 2010 | 2009 | |||||||
Deferred tax assets: |
||||||||
Allowance for credit losses |
$ | 3,257 | $ | 2,590 | ||||
Security valuation |
1,771 | 1,771 | ||||||
Deferred and accrued compensation |
314 | 317 | ||||||
Deferred loan fees and costs |
432 | 436 | ||||||
Capital loss carryover |
11 | 11 | ||||||
Post-retirement benefits |
165 | 155 | ||||||
Other |
214 | 132 | ||||||
Gross deferred tax assets |
$ | 6,164 | $ | 5,412 | ||||
44
NOTES TO CONSOLIDATED FINANCIAL STATEMENTS
(Table Dollar Amounts In Thousands except Share and Per Share Data)
Deferred tax liabilities: |
||||||||
Depreciation |
$ | (753 | ) | $ | (742 | ) | ||
Net unrealized gain on securities
available for sale |
(1,566 | ) | (1,846 | ) | ||||
Federal Home Loan Bank dividends |
(482 | ) | (482 | ) | ||||
Prepaid expenditures |
(93 | ) | (124 | ) | ||||
Other |
(16 | ) | (32 | ) | ||||
Gross deferred tax liabilities |
(2,910 | ) | (3,226 | ) | ||||
NET DEFERRED TAX ASSET |
$ | 3,254 | $ | 2,186 | ||||
No valuation allowance for deferred tax assets was recorded at December 31, 2010 and 2009.
Income taxes applicable to realized investment securities gains in 2010, 2009 and 2008 were $938
thousand, $356 thousand and $166 thousand, respectively. The capital loss carryover of $33
thousand, which can be used to offset future capital gain income, expires on December 31, 2013.
At December 31, 2010 and December 31, 2009, the Company had no unrecognized tax benefits
recorded. The Company does not expect the amount of unrecognized tax benefits to significantly
change within the next twelve months.
There were no penalties or interest recorded in the income statement for the years ended
December 31, 2010, 2009 and 2008 and no amounts accrued for penalties or interest as of December
31, 2010 and 2009.
The Company is subject to U.S. federal income tax. The Company is no longer subject to
examination by the federal taxing authority for years prior to 2007. The tax years 2007 — 2009
remain open to examination by the U.S. taxing authority.
NOTE 15 — RELATED PARTY TRANSACTIONS
Loans to principal officers, directors, and their affiliates during 2010 were as follows:
Total loans at December 31, 2009 |
$ | 5,133 | ||
New loans |
400 | |||
Effect of changes in composition of related parties |
0 | |||
Repayments |
(698 | ) | ||
Total loans at December 31, 2010 |
$ | 4,835 | ||
Deposits from principal officers, directors, and their affiliates at year-end 2010 and 2009
were $751 thousand and $1.8 million.
NOTE 16 — EARNINGS PER SHARE
The factors used in the earnings per share computation follow:
| 2010 | 2009 | 2008 | ||||||||||
Basic EPS |
||||||||||||
Net income |
$ | 8,991 | $ | 5,842 | $ | 5,665 | ||||||
Weighted average
shares outstanding |
13,563,734 | 13,363,445 | 13,103,761 | |||||||||
Basic earnings per share |
$ | .66 | $ | .44 | $ | .43 | ||||||
Diluted EPS |
||||||||||||
Net income |
$ | 8,991 | $ | 5,842 | $ | 5,665 | ||||||
Weighted average shares outstanding for basic
earnings per share |
13,563,734 | 13,363,445 | 13,103,761 | |||||||||
Effect of Stock Options |
0 | 0 | 0 | |||||||||
Weighted average shares for
diluted earnings per share |
13,563,734 | 13,363,445 | 13,103,761 | |||||||||
Diluted earnings per share |
$ | .66 | $ | .44 | $ | .43 | ||||||
Stock options for 28,500, 37,000 and 44,500 shares of common stock were not considered in
computing diluted earnings per share for 2010, 2009 and 2008, respectively, because they were
antidilutive.
NOTE 17 — OTHER COMPREHENSIVE INCOME (LOSS)
Other comprehensive income (loss) components and related tax effects were as follows:
| 2010 | 2009 | 2008 | ||||||||||
Net unrealized holding gains
(losses)
on available for sale securities |
$ | 1,963 | $ | 2,607 | $ | 2,294 | ||||||
Reclassification adjustment
for (gains) losses realized in
income |
(2,680 | ) | (943 | ) | 2,237 | |||||||
Net unrealized gains (losses) |
(717 | ) | 1,664 | 4,531 | ||||||||
Tax effect |
280 | (612 | ) | (1,586 | ) | |||||||
Net-of-tax amount |
$ | (437 | ) | $ | 1,052 | $ | 2,945 | |||||
Reclassification adjustment for (gains) losses realized in income includes
other-than-temporary impairment losses of $74 thousand and $2.7 million for 2009 and 2008. All
impairment losses relate to equity securities thus all other-than-temporary impairment has been
recognized in net income.
NOTE 18 — BUSINESS COMBINATION
On March 31, 2009, the Company acquired 100% of the capital stock of Butler Wick Trust
Company, a wholly owned subsidiary of Butler Wick Corporation in exchange for $12.1 million. With
the acquisition, the Company has added trust and estate services to complement its core retail
banking and investment services. The newly acquired trust entity is operating under the name
Farmers Trust Company. Merger-related costs are recognized as expense in the Company’s income
statement for the year ended December 31, 2009.
The goodwill of $3.7 million arising from the acquisition consisted largely of synergies and
other benefits that flow from control over the combining of the operations of the companies. The
amount of goodwill that is expected to be deductible for income taxes purposes is $3.7 million. The
fair value of $4.2 million of intangible assets is related to customer relationships and
noncompetition agreements with two key Trust Company employees. The following table summarizes the
amounts of assets acquired and liabilities assumed at the acquisition date:
Cash and due from banks |
$ | 1,614 | ||
Securities available for sale |
2,071 | |||
Premises and equipment |
44 | |||
Identifiable intangible assets |
4,240 | |||
Other assets |
716 | |||
Liabilities assumed |
(269 | ) | ||
Total identifiable net assets |
8,416 | |||
Goodwill |
3,709 | |||
Total net assets acquired |
$ | 12,125 | ||
45
NOTES TO CONSOLIDATED FINANCIAL STATEMENTS
(Table Dollar Amounts In Thousands except Share and Per Share Data)
(Table Dollar Amounts In Thousands except Share and Per Share Data)
NOTE 19 — SEGMENT INFORMATION
The reportable segments are determined by the products and services offered, primarily
distinguished between banking and trust operations. They are also distinguished by the level of
information provided to the chief operating decision makers in the Company, who use such
information to review performance of various components of the business, which are then aggregated.
Loans, investments, and deposits provide the revenues in the banking operation, and trust service
fees provide the revenue in trust operations. All operations are domestic.
Accounting policies for segments are the same as those described in Note 1. Segment
performance is evaluated using operating income. Income taxes are calculated on operating income.
Transactions among segments are made at fair value.
Significant segment totals are reconciled to the financial statements as follows:
| Trust | Bank | Consolidated | ||||||||||||||
| December 31, 2010 | Segment | Segment | Others | Totals | ||||||||||||
Assets |
||||||||||||||||
Cash and due from banks |
$ | 1,122 | $ | 36,343 | $ | (160 | ) | $ | 37,305 | |||||||
Securities available for sale |
2,627 | 311,601 | 119 | 314,347 | ||||||||||||
Net loans |
0 | 581,060 | 0 | 581,060 | ||||||||||||
Premises and equipment, net |
113 | 13,831 | 0 | 13,944 | ||||||||||||
Goodwill and other intangibles |
6,920 | 0 | 0 | 6,920 | ||||||||||||
Other assets |
425 | 28,336 | 414 | 29,175 | ||||||||||||
Total Assets |
$ | 11,207 | $ | 971,171 | $ | 373 | $ | 982,751 | ||||||||
Liabilities and Stockholders’ Equity |
||||||||||||||||
Deposits, borrowings and other liabilities |
$ | 368 | $ | 894,052 | $ | 283 | $ | 894,703 | ||||||||
Stockholders’ equity |
10,839 | 77,119 | 90 | 88,048 | ||||||||||||
Total Liabilities and Stockholders’ Equity |
$ | 11,207 | $ | 971,171 | $ | 373 | $ | 982,751 | ||||||||
| Trust | Bank | Consolidated | ||||||||||||||
| December 31, 2009 | Segment | Segment | Others | Totals | ||||||||||||
Assets |
||||||||||||||||
Cash and due from banks |
$ | 866 | $ | 50,327 | $ | (33 | ) | $ | 51,160 | |||||||
Securities available for sale |
3,519 | 305,734 | 115 | 309,368 | ||||||||||||
Net loans |
0 | 601,995 | 0 | 601,995 | ||||||||||||
Premises and equipment, net |
112 | 14,081 | 0 | 14,193 | ||||||||||||
Goodwill and other intangibles |
7,500 | 0 | 0 | 7,500 | ||||||||||||
Other assets |
475 | 29,881 | 236 | 30,592 | ||||||||||||
Total Assets |
$ | 12,472 | $ | 1,002,018 | $ | 318 | $ | 1,014,808 | ||||||||
Liabilities and Stockholders’ Equity |
||||||||||||||||
Deposits, borrowings and other liabilities |
$ | 255 | $ | 933,273 | $ | 652 | $ | 934,180 | ||||||||
Stockholders’ equity |
12,217 | 68,745 | (334 | ) | 80,628 | |||||||||||
Total Liabilities and Stockholders’ Equity |
$ | 12,472 | $ | 1,002,018 | $ | 318 | $ | 1,014,808 | ||||||||
| Trust | Bank | Consolidated | ||||||||||||||
| For year ended 2010 | Segment | Segment | Others | Totals | ||||||||||||
Net interest income |
$ | 61 | $ | 37,349 | $ | (43 | ) | $ | 37,367 | |||||||
Provision for loan losses |
0 | 8,078 | 0 | 8,078 | ||||||||||||
Service fees, security gains and
other noninterest income |
5,053 | 7,835 | 318 | 13,210 | ||||||||||||
Noninterest expense |
4,588 | 25,893 | 479 | 30,964 | ||||||||||||
Income before taxes |
526 | 11,213 | (204 | ) | 11,535 | |||||||||||
Income tax |
182 | 2,445 | (83 | ) | 2,544 | |||||||||||
Net Income |
$ | 344 | $ | 8,768 | $ | (121 | ) | $ | 8,991 | |||||||
| Trust | Bank | Consolidated | ||||||||||||||
| For year ended 2009 | Segment | Segment | Others | Totals | ||||||||||||
Net interest income |
$ | 66 | $ | 33,154 | $ | 8 | $ | 33,228 | ||||||||
Provision for loan losses |
0 | 6,050 | 0 | 6,050 | ||||||||||||
Service fees, security gains and
other noninterest income |
3,467 | 6,057 | (136 | ) | 9,388 | |||||||||||
Noninterest expense |
3,400 | 25,760 | 495 | 29,655 | ||||||||||||
Income before taxes |
133 | 7,401 | (623 | ) | 6,911 | |||||||||||
Income tax |
46 | 1,235 | (212 | ) | 1,069 | |||||||||||
Net Income |
$ | 87 | $ | 6,166 | $ | (411 | ) | $ | 5,842 | |||||||
The Bank
segment includes Farmers National Insurance for 2010.
NOTE 20 — SUBSEQUENT EVENT
On December 20, 2010 the Company announced the terms of its offering of 5 million common
shares of Farmers National Banc Corp stock. The offering of the 5 million shares at $3 per share
involved a rights offering with existing shareholders, an offering with standby investors and an
offering to the public. At the close of the offering on February 4, 2011 all 5 million shares had
been sold and the gross amount of $15 million was raised.
After advisory fees, selling agent commissions and expenses, the estimated net proceeds will
be approximately $14.1 million. The Company intends to contribute $8 to $10 million to the Bank for
general operating purposes which may include, among others, payment of expenses, payments of
dividends, and pursuing strategic opportunities which may be presented to the Bank from time to
time.
46
NOTES TO CONSOLIDATED FINANCIAL STATEMENTS
(Table Dollar Amounts In Thousands except Share and Per Share Data)
(Table Dollar Amounts In Thousands except Share and Per Share Data)
NOTE 21 — QUARTERLY FINANCIAL DATA (UNAUDITED)
| Quarter Ended 2010 | March 31 | June 30 | September 30 | December 31 | ||||||||||||
Total interest income |
$ | 12,126 | $ | 12,099 | $ | 12,160 | $ | 11,980 | ||||||||
Total interest expense |
3,312 | 2,923 | 2,545 | 2,218 | ||||||||||||
Net interest income |
8,814 | 9,176 | 9,615 | 9,762 | ||||||||||||
Provision for loan losses |
2,778 | 1,600 | 1,500 | 2,200 | ||||||||||||
Other income |
2,336 | 2,721 | 3,697 | 4,456 | ||||||||||||
Other expense |
7,532 | 7,645 | 7,917 | 7,870 | ||||||||||||
Income before income taxes |
840 | 2,652 | 3,895 | 4,148 | ||||||||||||
Income taxes |
(7 | ) | 618 | 1,041 | 892 | |||||||||||
Net income |
$ | 847 | $ | 2,034 | $ | 2,854 | $ | 3,256 | ||||||||
Earnings per share — basic and diluted |
$ | 0.06 | $ | 0.15 | $ | 0.21 | $ | 0.24 | ||||||||
| Quarter Ended 2009 | March 31 | June 30 | September 30 | December 31 | ||||||||||||
Total interest income |
$ | 11,994 | $ | 12,329 | $ | 12,649 | $ | 12,803 | ||||||||
Total interest expense |
4,311 | 4,101 | 4,178 | 3,957 | ||||||||||||
Net interest income |
7,683 | 8,228 | 8,471 | 8,846 | ||||||||||||
Provision for loan losses |
450 | 1,050 | 1,550 | 3,000 | ||||||||||||
Other income |
1,118 | 2,643 | 2,609 | 3,018 | ||||||||||||
Other expense |
6,256 | 7,803 | 7,675 | 7,921 | ||||||||||||
Income before income taxes |
2,095 | 2,018 | 1,855 | 943 | ||||||||||||
Income taxes |
411 | 361 | 299 | (2 | ) | |||||||||||
Net income |
$ | 1,684 | $ | 1,657 | $ | 1,556 | $ | 945 | ||||||||
Earnings per share — basic and diluted |
$ | 0.13 | $ | 0.12 | $ | 0.12 | $ | 0.07 | ||||||||
During the third and fourth quarters of 2010, the Bank sold certain investment securities
and recognized security gains of $2.6 million.
NOTE 22 — PARENT COMPANY ONLY CONDENSED FINANCIAL INFORMATION
Below is condensed financial information of Farmers National Banc Corp. (parent company
only). This information should be read in conjunction with the consolidated financial statements
and related notes.
BALANCE SHEETS
| December 31, 2010 | December 31, 2009 | |||||||
Assets: |
||||||||
Cash |
$ | 691 | $ | 275 | ||||
Investment in subsidiaries |
87,957 | 80,962 | ||||||
Securities available for sale |
119 | 115 | ||||||
Other |
449 | 237 | ||||||
TOTAL ASSETS |
$ | 89,216 | $ | 81,589 | ||||
Liabilities: |
||||||||
Other liabilities |
$ | 34 | $ | 171 | ||||
Note payable |
1,100 | 750 | ||||||
Other accounts payable |
34 | 40 | ||||||
TOTAL LIABILITIES |
1,168 | 961 | ||||||
Stockholders’ equity: |
||||||||
Common stock |
96,142 | 95,650 | ||||||
Retained earnings |
14,502 | 7,137 | ||||||
Accumulated other comprehensive income (loss) |
2,907 | 3,344 | ||||||
Treasury stock, at cost; 2,053,149 shares in 2010 and
2,053,098 shares in 2009 |
(25,503 | ) | (25,503 | ) | ||||
TOTAL STOCKHOLDERS’ EQUITY |
88,048 | 80,628 | ||||||
TOTAL LIABILITIES AND STOCKHOLDERS’ EQUITY |
$ | 89,216 | $ | 81,589 | ||||
47
NOTES TO CONSOLIDATED FINANCIAL STATEMENTS
(Table Dollar Amounts In Thousands except Share and Per Share Data)
(Table Dollar Amounts In Thousands except Share and Per Share Data)
STATEMENTS OF INCOME
| Years ended December 31, | 2010 | 2009 | 2008 | |||||||||
Income: |
||||||||||||
Dividends from subsidiary |
$ | 1,730 | $ | 13,746 | $ | 0 | ||||||
Interest and dividends on securities |
3 | 8 | 45 | |||||||||
Security gains/(losses) |
0 | (74 | ) | (87 | ) | |||||||
Other income |
225 | 0 | 0 | |||||||||
TOTAL INCOME |
1,958 | 13,680 | (42 | ) | ||||||||
Interest on borrowings |
(46 | ) | 0 | 0 | ||||||||
Other expenses |
(465 | ) | (557 | ) | (249 | ) | ||||||
Income before income tax benefit and undistributed subsidiary income |
1,447 | 13,123 | (291 | ) | ||||||||
Income tax benefit |
109 | 212 | 99 | |||||||||
Equity in undistributed net income of subsidiaries
(dividends in excess of net income) |
7,435 | (7,493 | ) | 5,857 | ||||||||
NET INCOME |
$ | 8,991 | $ | 5,842 | $ | 5,665 | ||||||
STATEMENTS OF CASH FLOWS
| Years ended December 31, | 2010 | 2009 | 2008 | |||||||||
Cash flows from operating activities: |
||||||||||||
Net income |
$ | 8,991 | $ | 5,842 | $ | 5,665 | ||||||
Adjustments to reconcile net income to net cash
provided by operating activities: |
||||||||||||
Security (gains)/losses |
0 | 0 | 49 | |||||||||
Impairment of securities |
0 | 74 | 38 | |||||||||
Dividends in excess of net income
(Equity in undistributed net income of subsidiary) |
(7,435 | ) | 7,493 | (5,857 | ) | |||||||
Other |
(356 | ) | (290 | ) | (102 | ) | ||||||
NET CASH FROM OPERATING ACTIVITIES |
1,200 | 13,119 | (207 | ) | ||||||||
Cash flows from investing activities: |
||||||||||||
Proceeds from maturities of investment securities available for sale |
0 | 800 | 1,600 | |||||||||
Proceeds from sales of securities available for sale |
0 | 0 | 61 | |||||||||
Investment in subsidiaries |
0 | (12,260 | ) | 0 | ||||||||
Purchases of securities available for sale |
0 | (1 | ) | (1,587 | ) | |||||||
NET CASH FROM INVESTING ACTIVITIES |
0 | (11,461 | ) | 74 | ||||||||
Cash flows from financing activities: |
||||||||||||
Purchase of treasury stock |
0 | 0 | (1,102 | ) | ||||||||
Dividends paid |
(1,626 | ) | (4,801 | ) | (6,802 | ) | ||||||
Proceeds of borrowings |
350 | 750 | 0 | |||||||||
Proceeds from dividend reinvestment |
492 | 1,433 | 2,476 | |||||||||
NET CASH FROM FINANCING ACTIVITIES |
(784 | ) | (2,618 | ) | (5,428 | ) | ||||||
NET CHANGE IN CASH AND CASH EQUIVALENTS |
416 | (960 | ) | (5,561 | ) | |||||||
Beginning cash and cash equivalents |
275 | 1,235 | 6,796 | |||||||||
Ending cash and cash equivalents |
$ | 691 | $ | 275 | $ | 1,235 | ||||||
48
COMMUNITY GIVING
INVESTING IN OUR COMMUNITIES
Farmers National Bank continues to “Stand Strong” by giving back to our community. As a community
bank, Farmers has the honor and privilege of supporting the organizations that make our Valley a
better place in which to live. Local decision-making gives us the ability to financially support
the projects and services that make the biggest positive impact on our neighbors and in our
communities. By doing so, Farmers believes we are supporting important efforts that attract new
residents and businesses to the Valley. In 2010, over 250 local organizations received our
financial support as we donated $155,116 to enhance and improve the communities in which we live
and work. Commitment — whether to our home area or our neighbors — is a bedrock principle for
Farmers. Our founders saw the importance of community engagement back in 1887 and we are proud to
continue the tradition 124 years later.

In 2010, Farmers National Bank introduced a new mascot, Rocky, the Rock-Solid dog. Pictured above:
Rocky with the YSU Cheerleaders at the Farmers National Bank tailgate event.
49
FARMERS NATIONAL FINANCIAL GROUP
| FARMERS NATIONAL INVESTMENTS |  |
Farmers National Investments experienced unprecedented growth during a time of significant
economic uncertainty in the financial market. Our customers demonstrated confidence in our
experienced and trusted financial advisors, leading to a 67% increase in Gross Revenues. Farmers
National Investments produced over $1 Million in Gross Revenues in 2010. In addition, they grew
their portfolios over 35% and now have over $143 Million in Assets Under Management.
Our services cover all areas of financial management, from investment and retirement planning to
risk management and estate conservation. We specialize in helping our clients develop a
comprehensive, cohesive financial strategy that fits their unique needs and enables them to meet
both short- and long-term objectives.

From left to right: Vince Dobransky, Phil Lammers, Dan Cvercko, Steve Fisher
Professional Services Offered:
| • | Portfolio Strategy |
|
| • | Insurance Needs |
|
| • | Asset Allocation |
|
| • | Retirement Planning |
|
| • | College Funding |
|
| • | Tax-Favored Investing |
|
| • | Health Care Concerns |
|
| • | Business Owner Needs |
|
| • | Estate Issues* |
| * | Please note that neither Farmers National Investments nor any of its representatives may give
legal or tax advice. |
PrimeVest Financial Services, Inc. is an independent, registered broker-dealer, member SIPC/FINRA.
Securities and insurance products offered by PrimeVest: — Not FDIC/NCUSIF insured. — May go down
in value. — Not financial institution guaranteed. — Not a deposit. — Not insured by any federal
government agency. Advisory services may only be offered by Investment Adviser Representatives in
connection with an appropriate PrimeVest Advisory Services Agreement and disclosure brochure as
provided.

David G. Frank, CLU, ChFC
Insurance Director
Insurance Director
FARMERS NATIONAL INSURANCE
In March 2010, Farmers National Insurance became a fully operational agency offering life, health,
property casualty and Medicare supplemental products. In the first nine months of operation,
Farmers National Insurance sold over 100 Property and Casualty Insurance policies resulting in
additional fee income for the Bank’s income statement. With a wide array of products and services,
the Insurance agency expects to bolster their sales throughout the next fiscal year.
Farmers National Insurance offers:
| • | Auto Insurance |
|
| • | Homeowners Insurance |
|
| • | Personal Liability Insurance |
|
| • | Business Insurance |
|
| • | Pet Insurance |
|
| • | Dental & Health Insurance |
|
| • | Medicare Supplements |
50
BOARD OF DIRECTORS

From left to right: Anne Frederick Crawford, John S. Gulas, Joseph D. Lane, Ronald V.
Wertz, Lance J. Ciroli, Benjamin R. Brown- Retired, Earl R. Scott, Ralph D. Macali,
Frank L. Paden. Not pictured: James R. Fisher- Retired, David Z. Paull
John S. Gulas
President & Chief Executive Officer
President & Chief Executive Officer
Frank L. Paden
Executive Chairman of the Board
Executive Chairman of the Board
Benjamin R. Brown, Retired
President and Owner, Castruction Company
President and Owner, Castruction Company
Lance J. Ciroli 2, 3, 5
Co-founder of NBE Bank Consulting
Services Retired Assistant Deputy Comptroller in the Cleveland/
Detroit Field Office, Office of the Comptroller of the Currency
Co-founder of NBE Bank Consulting
Services Retired Assistant Deputy Comptroller in the Cleveland/
Detroit Field Office, Office of the Comptroller of the Currency
Anne Frederick Crawford 2, 3, 4
Attorney-at-Law
Self-employed/Sole Proprietor
Attorney-at-Law
Self-employed/Sole Proprietor
James R. Fisher, Retired
Certified Public Accountant (CPA)
Owner/Director, Akron Auto Auction, Inc.
Certified Public Accountant (CPA)
Owner/Director, Akron Auto Auction, Inc.
Joseph D. Lane 2, 4
Attorney and Principal of Lane & Rusu Co. L.P.A.
President & CEO of Lane Funeral Homes, Inc. and
Lane Life Paramedics Ambulance Services
Attorney and Principal of Lane & Rusu Co. L.P.A.
President & CEO of Lane Funeral Homes, Inc. and
Lane Life Paramedics Ambulance Services
Ralph D. Macali 1, 2, 5
Vice President of Palmer J. Macali, Inc.
Partner in P.M.R.P. Partnership
Partner in the Macali Family Limited Partnership
Vice President of Palmer J. Macali, Inc.
Partner in P.M.R.P. Partnership
Partner in the Macali Family Limited Partnership
David Z. Paull 1, 2, 3
Vice President, Human Resources Operations and
Labor Relations, RTI International Metals, Inc.
Vice President, Human Resources Operations and
Labor Relations, RTI International Metals, Inc.
Earl R. Scott 1, 2, 5
Certified Public Accountant (CPA) and President,
Reali, Giampetro & Scott
Certified Public Accountant (CPA) and President,
Reali, Giampetro & Scott
Ronald V. Wertz 2, 3, 4
Retired Vice President, CPCU, CIC, Risk
Management Consultant, Acordia Insurance
Retired Vice President, CPCU, CIC, Risk
Management Consultant, Acordia Insurance
| 1 | Audit Committee |
|
| 2 | Board Loan Committee |
|
| 3 | Compensation Committee |
|
| 4 | Corporate Governance and Nominating Committee |
|
| 5 | Risk Management Committee |
2010 EXECUTIVE TEAM

From Left to right: Brian E. Jackson, Vice President, Chief Information Officer, James H. Sisek,
Esq., President & CEO, Farmers Trust Company, Mark L. Graham, Senior Vice President and Senior Loan
Officer, Kevin J. Helmick, Senior Vice President, Retail Services/Wealth Management, Bradley S.
Henderson, Vice President Facilities Management/Security, Carl D. Culp, Executive Vice President,
Cashier & CFO, Mark A. Nicastro, Vice President, Director of Human Resources, John S. Gulas,
President & CEO, Frank L. Paden, Executive Chairman of the Board, Amber B. Wallace, Senior Vice
President, Director of Marketing
51