Attached files
| file | filename |
|---|---|
| 8-K - ESSEX PROPERTY TRUST 8-K 3-14-2011 - ESSEX PROPERTY TRUST, INC. | form8k.htm |
Exhibit 99.1

Essex Property Trust
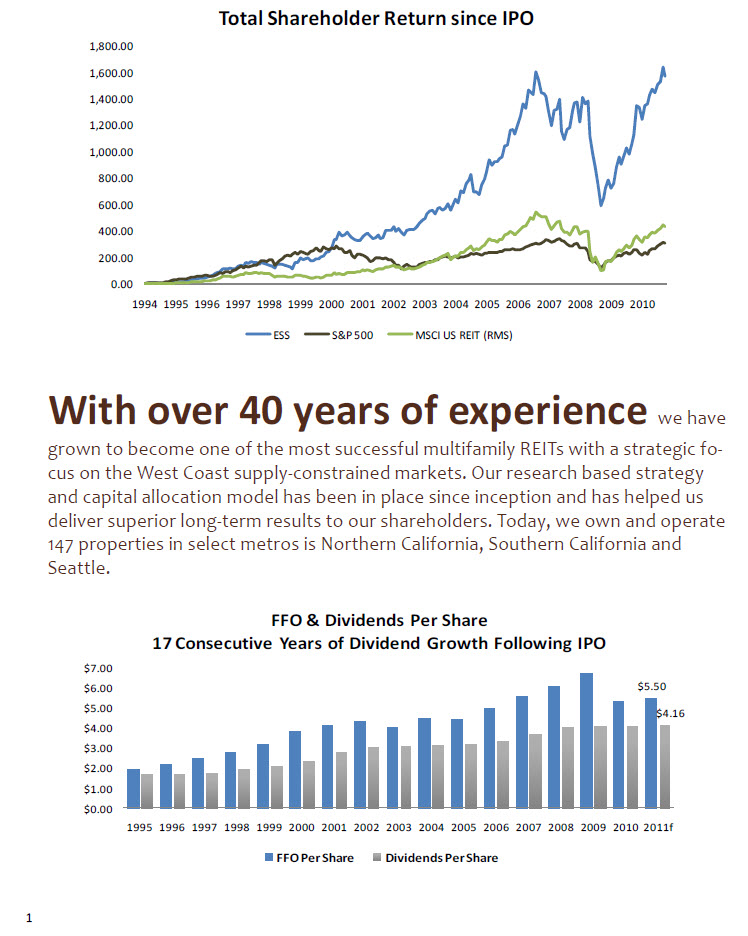
Total Shareholder Return since IPO 1,800.00 200.00 400.00 600.00 800.00 1,000.00 1,200.00 1,400.00 1,600.00 1994 1995 1996 1997 1998 1999 2000 2001 2002 2003 2004 2005 2006 2007 2008 2009 2010 ESS S&P 500 MSCI US REIT (RMS) With over 40 years of experience we have grown to become one of the most successful multifamily REITs with a strategic focus on the West Coast supply-constrained markets. Our research based strategy and capital allocation model has been in place since inception and has helped us deliver superior long-term results to our shareholders. Today, we own and operate 147 properties in select metros is Northern California, Southern California and Seattle. 0.00 200.00 400.00 600.00 800.00 1,000.00 1,200.00 1,400.00 1,600.00 1,800.00 1994 1995 1996 1997 1998 1999 2000 2001 2002 2003 2004 2005 2006 2007 2008 2009 2010 Total Shareholder Return since IPO ESS S&P 500 MSCI US REIT (RMS) $5.50 $4.16 $0.00 $1.00 $2.00 $3.00 $4.00 $5.00 $6.00 $7.00 1995 1996 1997 1998 1999 2000 2001 2002 2003 2004 2005 2006 2007 2008 2009 2010 2011f FFO & Dividends Per Share 17 Consecutive Years of Dividend Growth Following IPO FFO Per Share Dividends Per Share
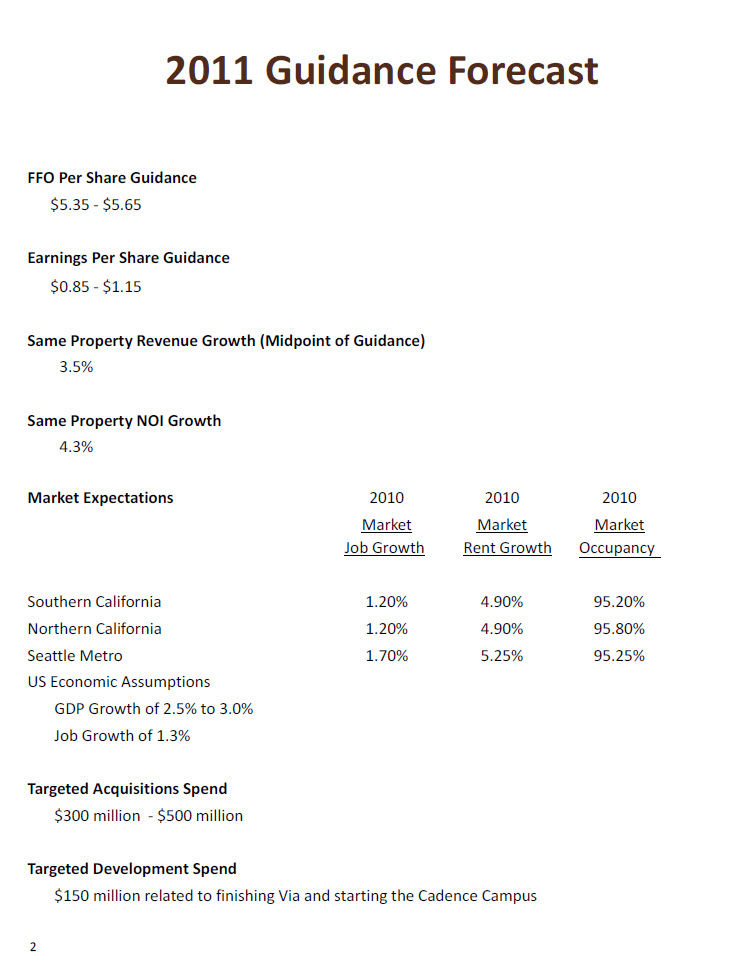
2011 Guidance Forecast FFO Per Share Guidance $5.35 - $5.65 Earnings Per Share Guidance $0.85 - $1.15 Same Property Revenue Growth (Midpoint of Guidance) 3.5% Same Property NOI Growth 4.3% Market Expectations 2010 2010 2010 Market Market Market Job Growth Rent Growth Occupancy Southern California 1.20% 4.90% 95.20% Northern California 1.20% 4.90% 95.80% Seattle Metro 1.70% 5.25% 95.25% US Economic Assumptions GDP Growth of 2.5% to 3.0% Job Growth of 1.3% Targeted Acquisitions Spend $300 million - $500 million Targeted Development Spend $150 million related to finishing Via and starting the Cadence Campus

In 2010 we invested $584 million in new acquisitions in markets we believe will experience attractive growth in the coming years due to forecasted job growth as well as low levels of new housing supply and single family home affordability. 0% 25% 50% 75% 100% 125% 150% 175% 200% 225% 250% 275% 300% Single Family Home Affordability * * * * * * * Condo maps 3


Seattle Gap = 10.0% of Current Rents Average Rent as a % of Median Household Income (in 000's) $80 $70 $30 $40 $50 $60 10% 12% 14% 16% 18% 20% 8% '90 '91 '92 '93 '94 '95 '96 '97 '98 '99 '00 '01 '02 '03 '04 '05 '06 '07 '08 '09 '10 '11f Average Rent as a % of Median Household Income (in 000's) Median Household Income (left axis) Rent as % Income (right axis) Average Value 1990- '10 (right axis)

Job Growth vs. Total Residential Supply (% change) -4.0% -2.0% 0.0% 2.0% 4.0% 6.0% 8.0% -6.0% Jobs Supply Population

San Jose Average Rent as a % of Median Household Income (in 000's) of Current Rents 8% 10% 12% 14% 16% 18% 20% 22% 24% 26% 28% $30 $40 $50 $60 $70 $80 $90 $100 '90 '91 '92 '93 '94 '95 '96 '97 '98 '99 '00 '01 '02 '03 '04 '05 '06 '07 '08 '09 '10 '11f

Job Growth vs. Total Residential Supply (% change) -6.0% -4.0% -2.0% 0.0% 2.0% 4.0% 6.0% 8.0% Jobs Supply Population 101 San Fernando—San Jose, CA Percentage of Jobs by Sector* Construction Manufacturing Trade/Transportation/Utilities Information Finance Non Info/Financial Services** Government -6% -4% -2% 0% 2% 4% Construction Manufacturing Trade/Transportation/Utilities Information Finance Non Info/Financial Services** Government Totals Job Growth by Sector* (January 2010 through January 2011) San Jose U.S. -6.0% -4.0% -2.0% 0.0% 2.0% 4.0% 6.0% 8.0% * Source: BLS ** Non Info/Financial Services: Professional & Business Services, Education & Health, Leisure & Hospitality and Other Services

Los Angeles Average Rent as a % of Median Household Income (in 000's) Median Household Income (left ax is) Rent as % Income (right axis) Average Value 1990- '10 (right axis) Gap = 10.0% of Current Rents $30 $40 $50 $60 $70 '90 '91 '92 '93 '94 '95 '96 '97 '98 '99 '00 '01 '02 '03 '04 '05 '06 '07 '08 '09 '10 '11f Median Household Income (left axis) Rent as % Income (right axis) Average Value 1990- '10 (right axis)

-4.0% -2.0% 0.0% 2.0% 4.0% Job Growth vs. Total Residential Supply (% change) Jobs Supply Population -10% -8% -6% -4% -2% 0% 2% 4% Construction Manufacturing Trade/Transportation/Utilities Information Finance Non Info/Financial Services** Government Totals Job Growth by Sector * (January 2010 through January 2011) Los Angeles U.S. -4.0% -2.0% 0.0% 2.0% 4.0% Job Growth vs. Total Residential Supply (% change) Jobs Supply Population 3% 10% 19% 5% 6% 41% 16% Percentage of Jobs by Sector* Construction Manufacturing Trade/Transportation/Utilities Information Finance Non Info/Financial Services** Government * Source: BLS ** Non Info/Financial Services: Professional & Business Services, Education & Health, Leisure & Hospitality and Other Services

Orange County 8% 13% 18% 22% 27% $30 $40 $50 $60 $70 $80 '90 '91 '92 '93 '94 '95 '96 '97 '98 '99 '00 '01 '02 '03 '04 '05 '06 '07 '08 '09 '10 '11f Average Rent as a % of Median Household Income (in 000's) Gap = 6.0% of Current Rents Median Household Income (left axis) Rent as % Income (right axis) Average Value 1990- '10 (right axis)

Job Growth vs. Total Residential Supply (% change) -4.0% -2.0% 0.0% 2.0% 4.0% 6.0% -6.0% Jobs Supply Population Percentage of Jobs by Sector* Construction Manufacturing Trade/Transportation/Utilities Info Finance Non Info/Financial Services Government 13 13 * Source: BLS ** Non Info/Financial Services: Professional & Business Services, Education & Health, Leisure & Hospitality and Other Services -6% -4% -2% 0% 2% 4% Construction Manufacturing Trade/Transportation/Utilities Information Finance Non Info/Financial Services** Government Totals Job Growth by Sector* (January 2010 through January 2011) Orange U.S. -6.0% -4.0% -2.0% 0.0% 2.0% 4.0% 6.0% Job Growth vs. Total Residential Supply (% change) Jobs Supply Population Anavia— Anaheim, CA 5% 11% 18% 8% 2% 44% 12%
