Attached files
| file | filename |
|---|---|
| 8-K - FORM 8-K - ENERGEN CORP | d8k.htm |
 Focusing on Oil & Liquids
Wells Fargo Securities 2
nd
Annual E&P Forum
March 15, 2011
Exhibit 99.1 |
 This presentation contains statements expressing expectations
of future plans, objectives, and performance that constitute
forward-looking statements made pursuant to the Safe Harbor
Provision of the Private Securities Litigation Reform Act of
1995. Unless noted, these statements do not reflect possible or
pending acquisitions, divestitures, or restructurings.
Statements based on expectations
are forward-looking
statements
that are dependent on certain events, risks, and
uncertainties that could cause actual results to differ materially
from those anticipated. A discussion of risks and uncertainties
is included in the Company’s periodic reports filed with the
SEC.
2 |
 Energen
is a top 25
independent producer
of domestic natural gas,
oil, & natural gas
liquids and the largest
distributor of natural
gas in Alabama.
3 |
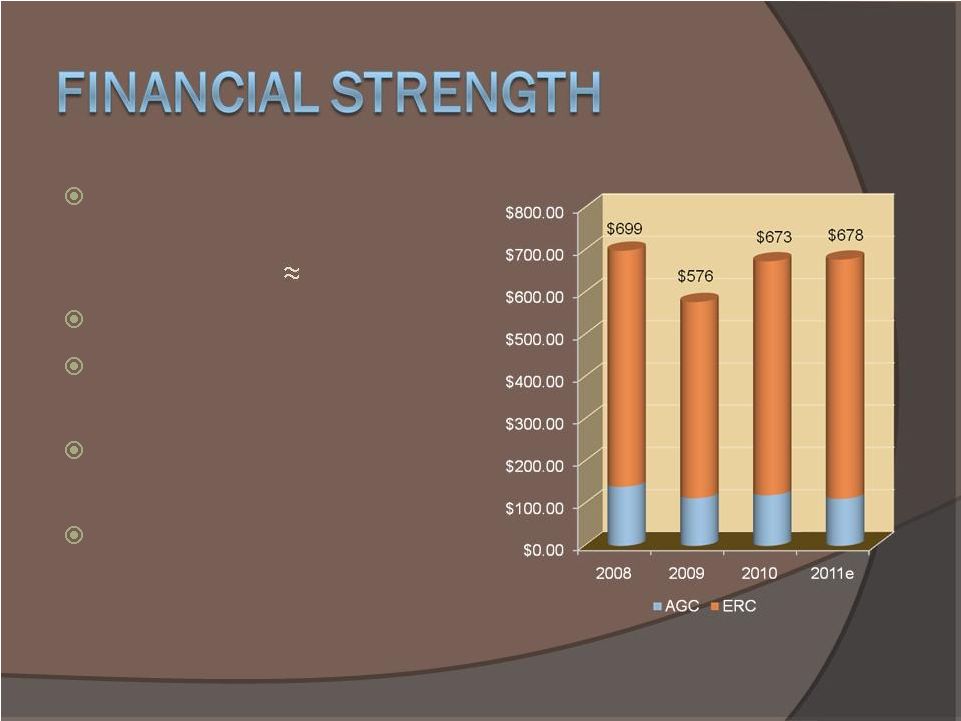 Excellent balance sheet
(debt-to-total cap at YE11
estimated at 25%)
Significant ATCF
$1.0 B syndicated credit
facility
Oil/NGLs comprise 47%
of 2010 proved reserves
Hedging strategy
4
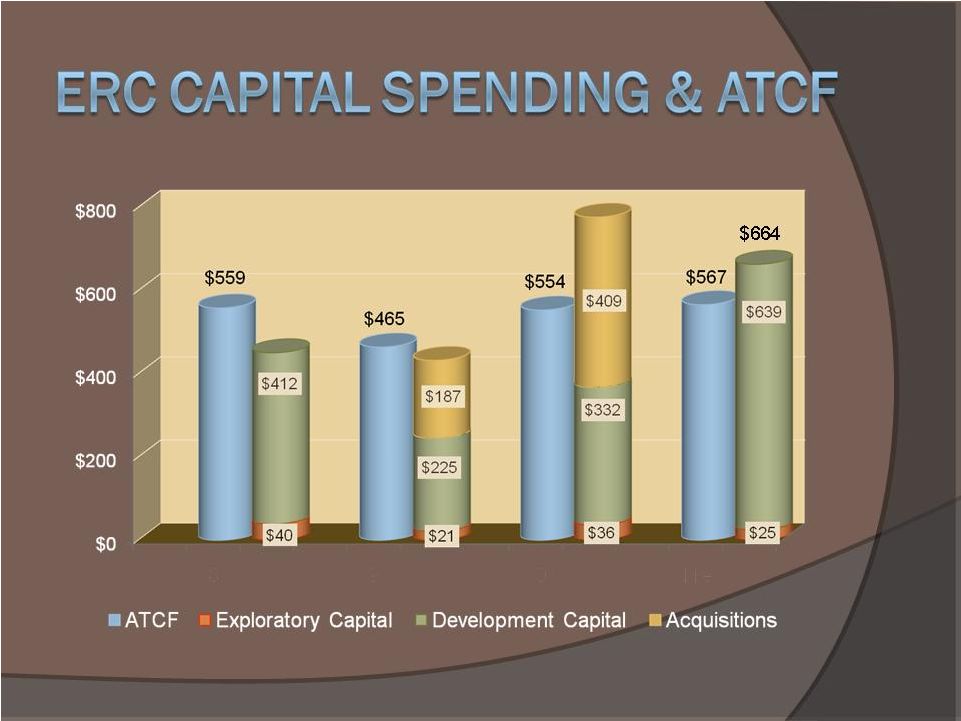
ATCF ($MM)
(2011e ATCF reflects mid-point of guidance range)
|
 5
2008
2010
2011e
2009
$451
$433
$777
($MM)
(Energen Resources’
2011e ATCF reflects mid-point of guidance range)
|
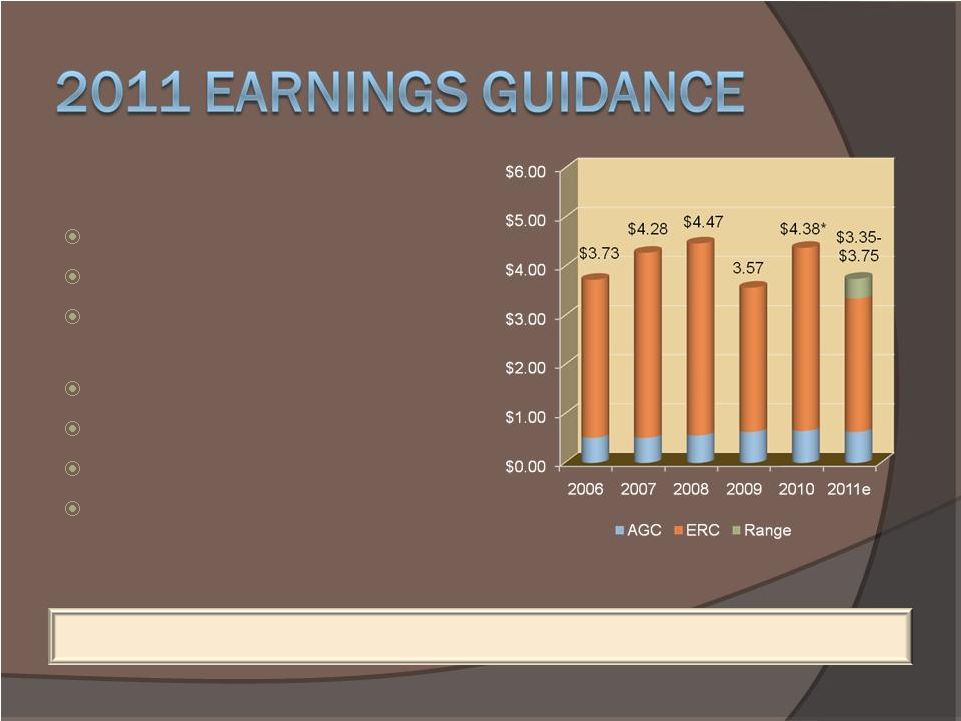 Liquids Production Growth: 20%
2011 Assumptions
69% of est. production hedged
9% production growth
Unhedged price assumptions:
$4.25 gas, $80 oil, $0.83 NGL
LOE: $12.18/BOE
DD&A: $11.46/BOE
G&A: $2.94/BOE
AGC average equity of $346
MM
6
EPS diluted
* Excludes $0.34
non-cash write-off of Alabama shale acreage |
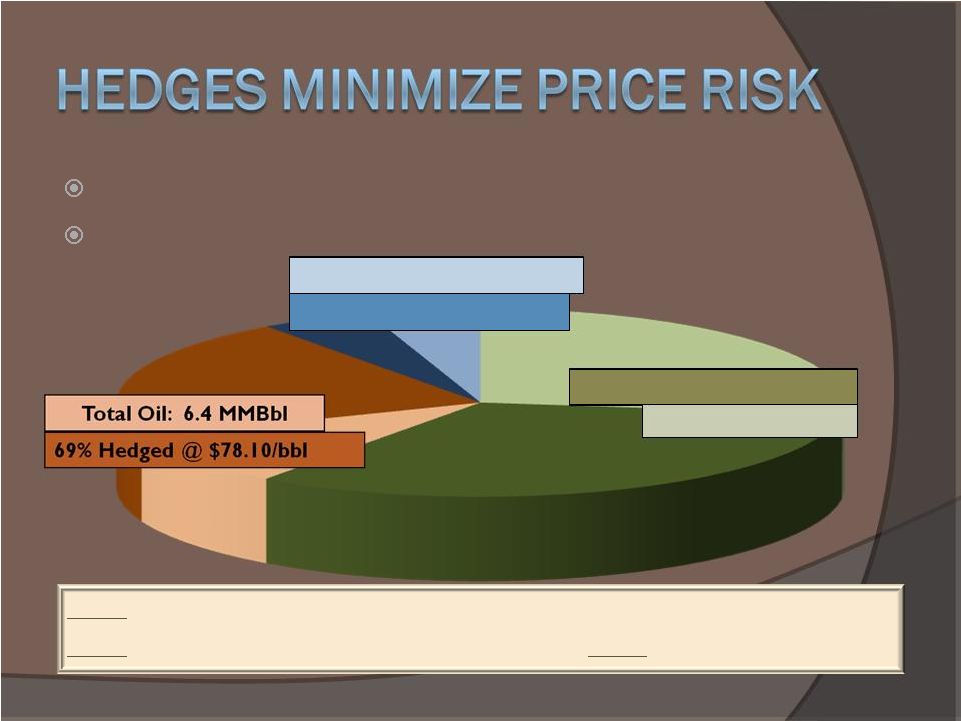 69% of 2011(e) production hedged
2011(e) cash costs: $15.06/BOE
49% Hedged @ $0.90/gal
Total NGL: 86.7 MMgal
2012:
3.7
MMBbl
at
$82.34,
40.5
Bcf
at
$5.02,
39.9
MMgal
at
$0.86
2013: 3.2 MMBbl
at
$85.32,
28.0
Bcf
at
$5.30;
2014:
2.7
MMBbl
at
$87.44
73% Hedged @ $6.20/Mcf
Total Gas: 72.1Bcf
7 |
 8 |
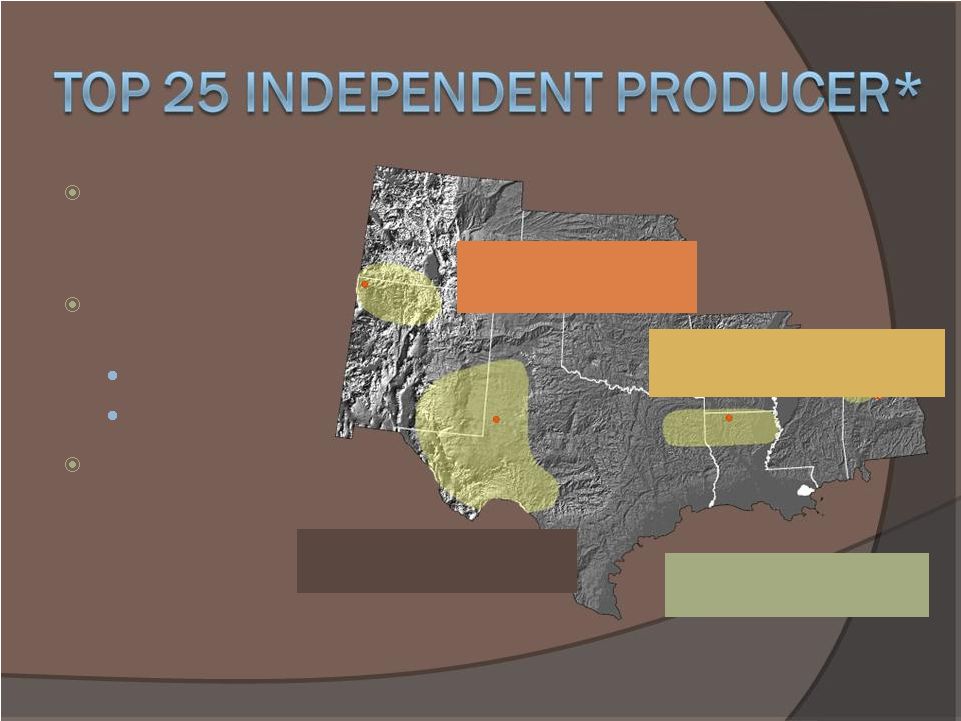 303 MMBOE of
proved reserves @
YE2010
2011e production
mix:
59% gas
41% oil/NGL
Major presence in
3 largest areas of
operation
* Based on U.S. Proved Reserves
TX
Black Warrior Basin:
154 Bcf
(8%)
N. LA/E. TX/Other:
51 Bcfe
(3%)
San Juan Basin:
815 Bcfe
(45%)
Permian Basin: 133
MMBOE (44%)
Farmington
Midland
Arcadia
Birmingham
NM
CO
LA
AL
9 |
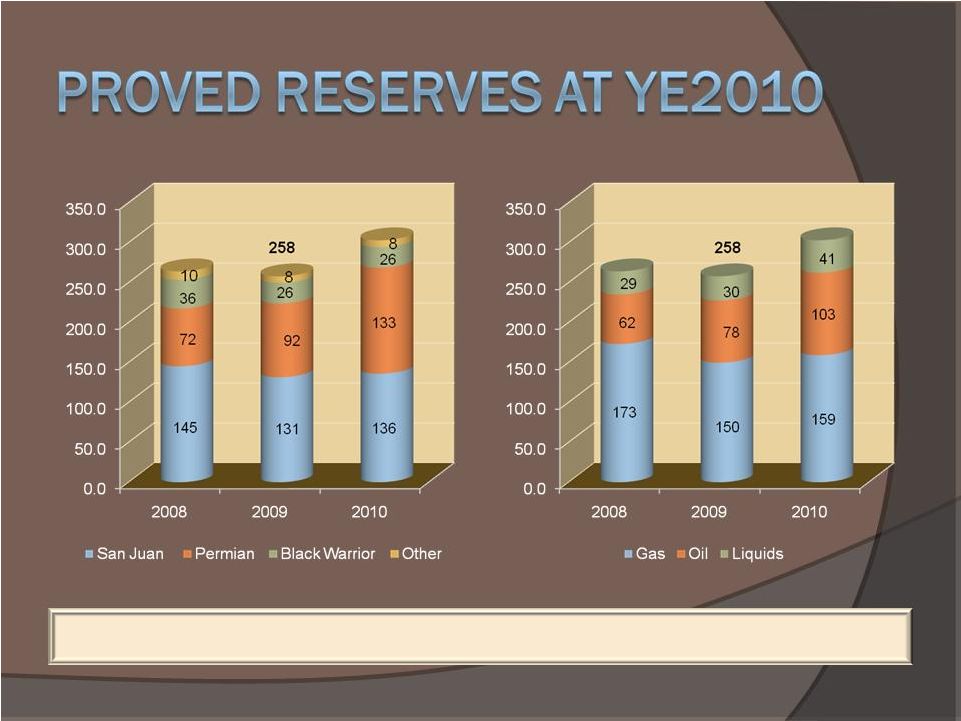 Estimated Probable & Possible Reserves: 315+ MMBOE
10
(MMBOE)
264
303
264
303
(MMBOE) |
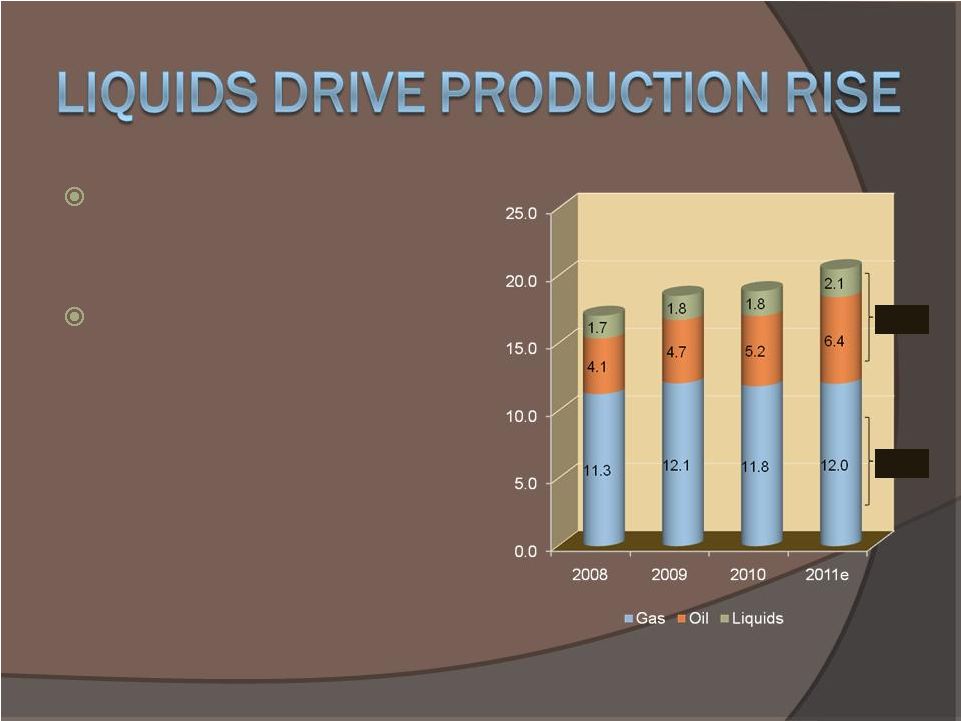 Oil/NGL comprise 41% of
estimated production in 2011.
Based on pace of drilling and
risking incorporated into
acquisition models, oil and NGL
production could increase
approximately 60% from 2010
to 2013.
11
Production (MMBOE)
41%
59%
20.5
18.8
18.6
17.1 |
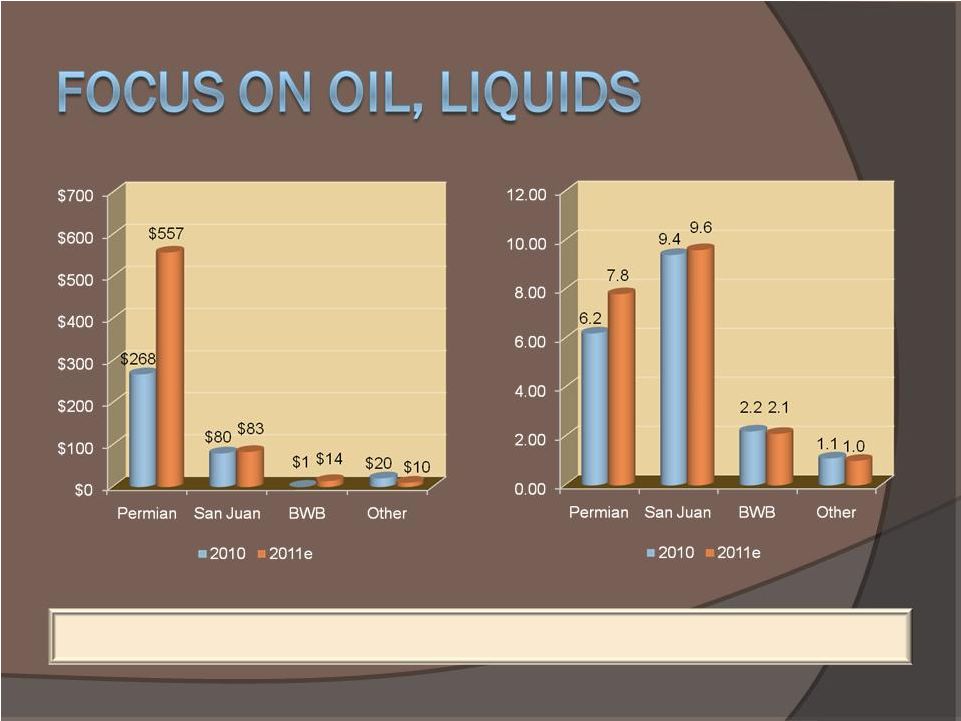 >80% of 2011 capital spending in Permian Basin
12
Production by Basin (MBOE)
Capital Spending by Basin ($MM) |
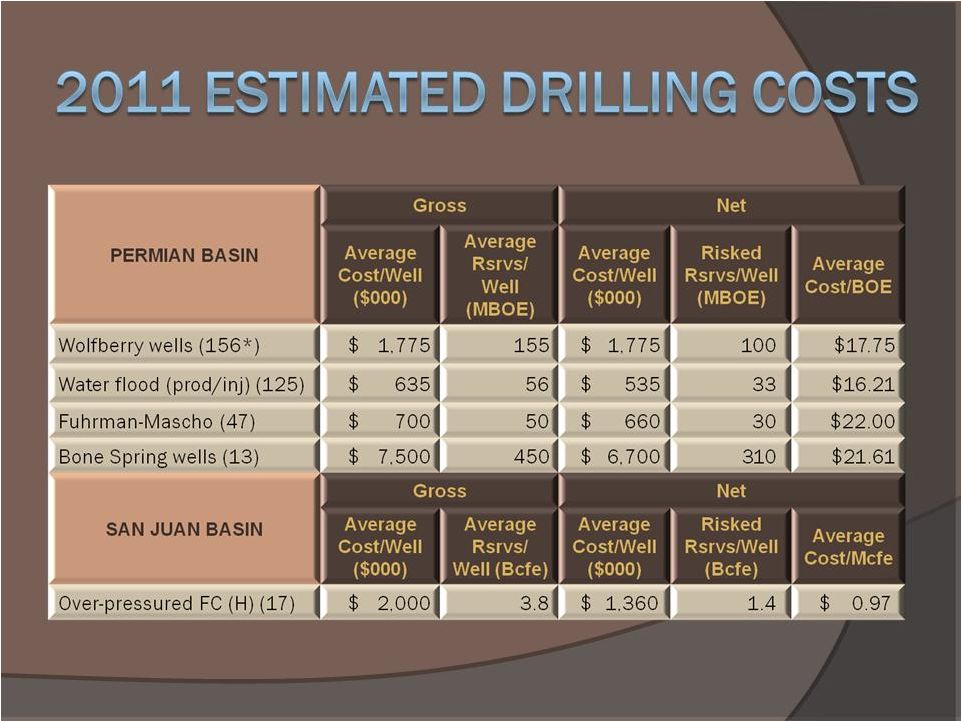 13
* Net wells to be drilled |
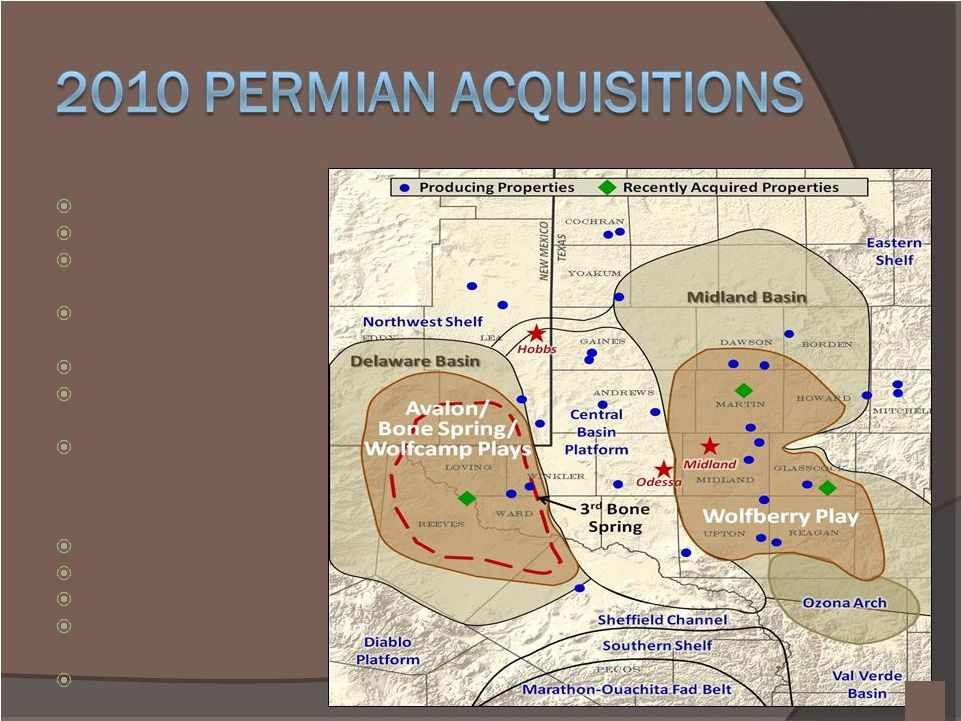 Bone Spring/Avalon
Seller: SandRidge
Energy
40,000
net
acres
-
Avalon
21,300
net
acres
-
Bone
Spring
21 MMBOE unproved
reserves (net unrisked)
$110 MM + closing adj.
Future cost to develop Bone
Spring potential: $465 MM
Potential drilling locations:
62 Bone Spring, 125 Avalon
Wolfberry
Private sellers
19,060 net acres
$260 MM + closing adj.
Future cost to develop: $755
MM
Future drilling locations:
205 PUD, 219 probable
14 |
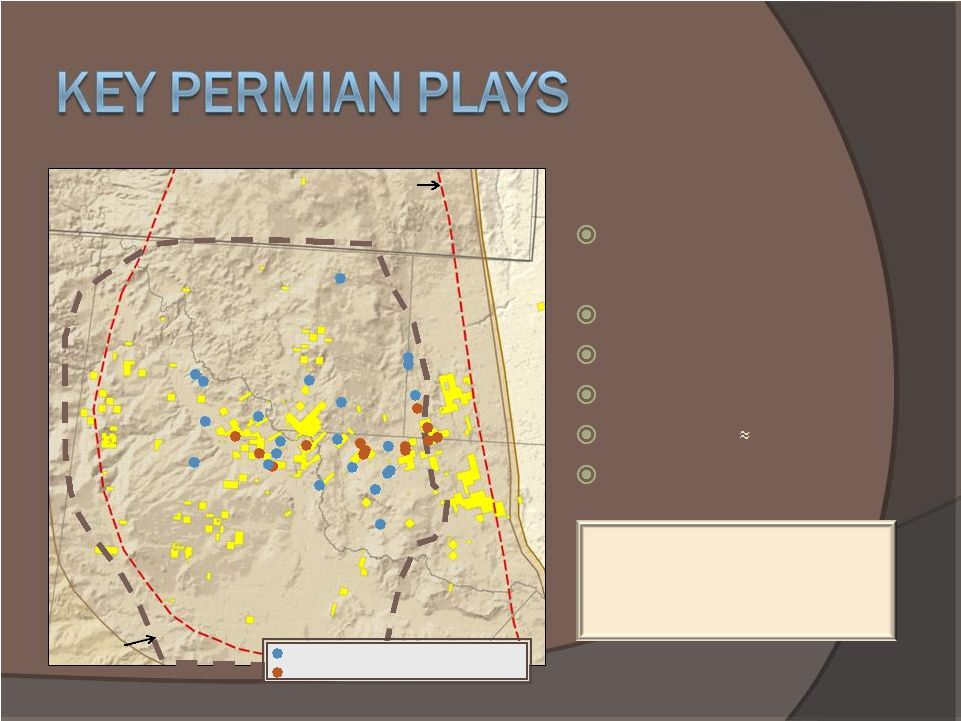 3rd Bone Spring
Vertical depth:
11,000’
–
11,300’
Horizontal wells
Multi-stage fracs (8-10)
EUR:
400
–
500
MBOE
Well cost:
$7.5 Million
Rigs in 2011: 4-5
15
NEW MEXICO
TEXAS
Loving
Winkler
Reeves
Ward
Avalon ERC
Area of Interest
3
Bone Spring
ERC Area of
Interest
50,000 net undeveloped acres;
150 potential locations on
320-acre spacing
Recently Drilled Bone Spring Wells
ERC 3
Bone Spring Wells
rd
rd |
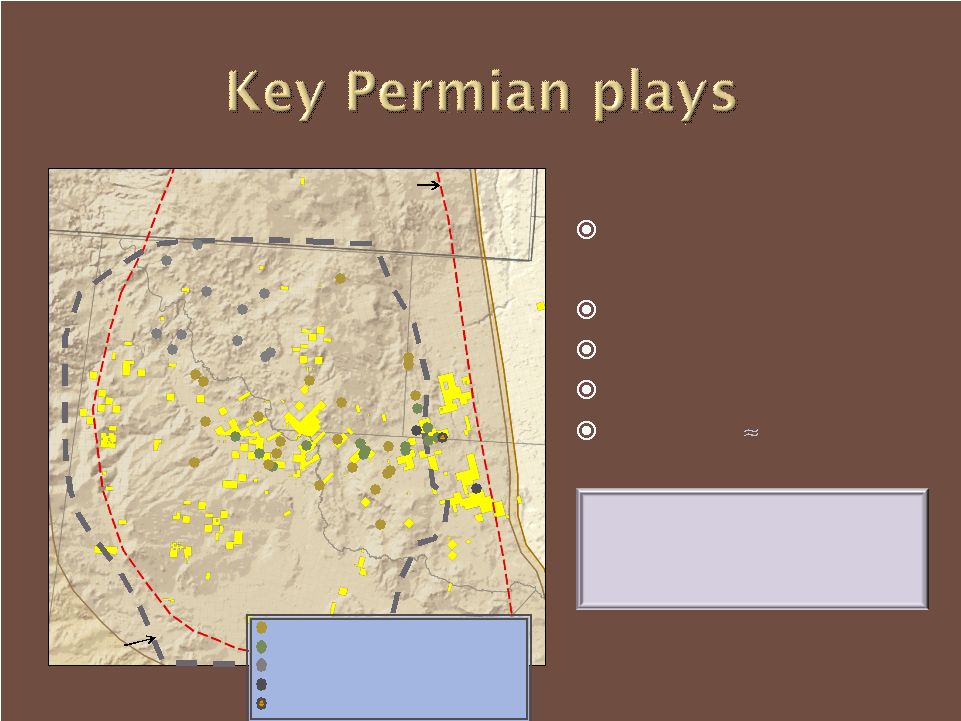 Avalon Shale
Vertical depth:
8,500’
-
9,000’
Horizontal wells
Multi-stage fracs (8-10)
EUR: 300 –
350 MBOE
Well cost:
$5.5 Million
16
NEW MEXICO
TEXAS
Loving
Winkler
Reeves
Ward
Avalon ERC
Area of Interest
3
rd
Bone Spring ERC
Area of Interest
80,000
net
undeveloped
acres;
250
potential
locations
on 320-
acre
spacing
Recently Drilled Bone Spring Wells
ERC 3
rd
Bone Spring Wells
Recently Drilled Avalon Wells
Avalon Test Wells (vertical)
ERC Avalon Well |
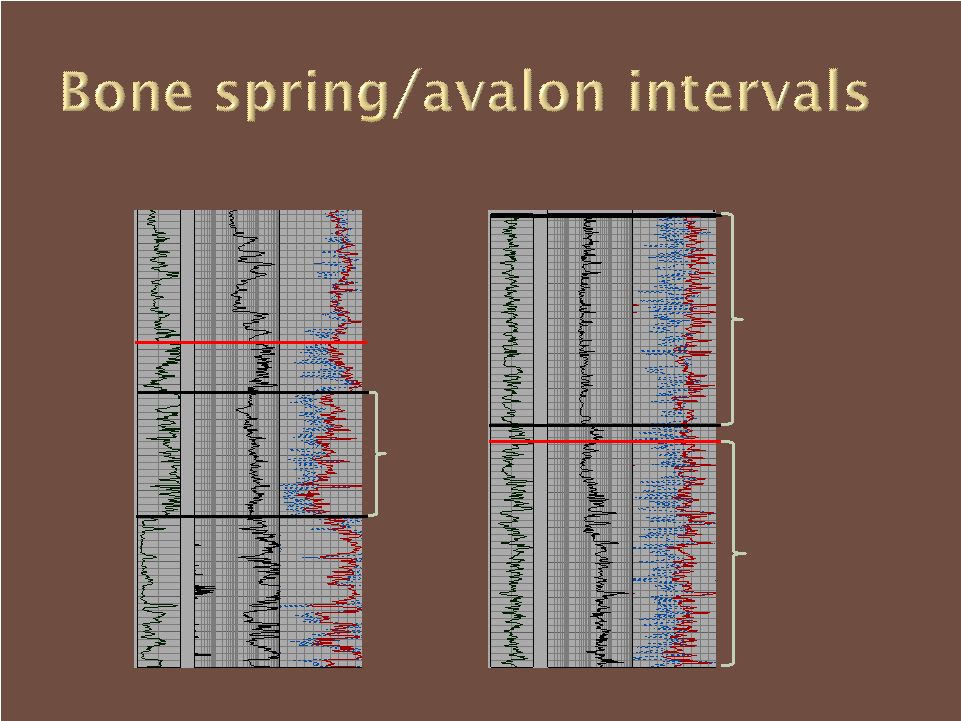 0.2
2000
0.3
17
11,000’
8,750’
11,900’
3
rd
Bone
Spring
Sands
Avalon
Avalon
Shale
Shale
Top of
Top of
Bone
Bone
Spring
Spring
Interval
Interval
Top of
Top of
Wolfcamp
Wolfcamp
8,500’
11,300’
8,550’
Upper
Upper
Wolfcamp
Wolfcamp |
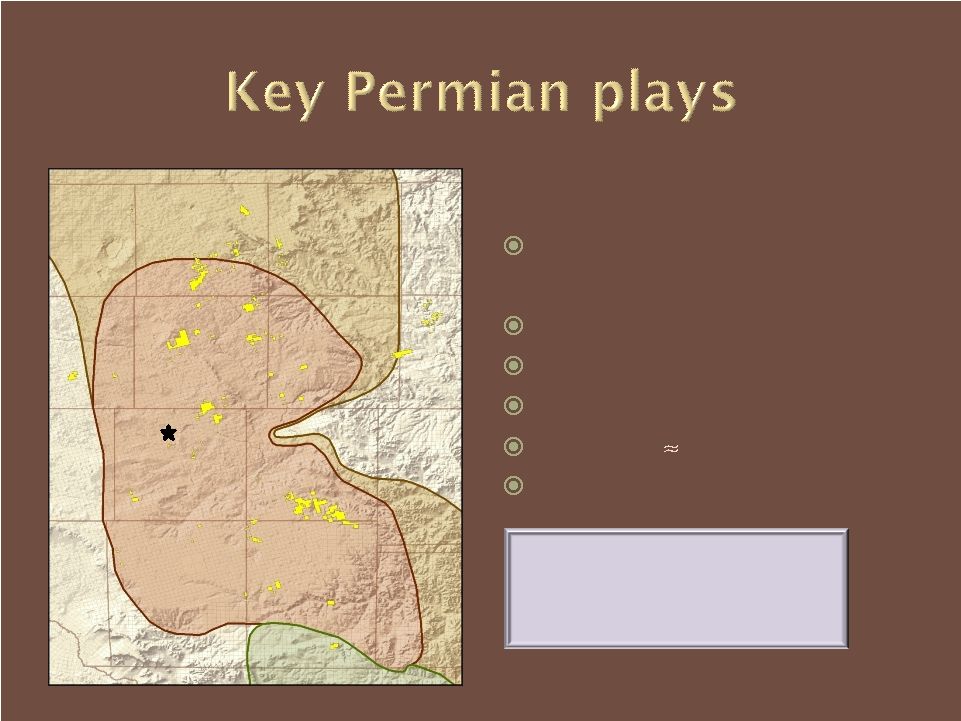 26,300
net
undeveloped
acres;
650
potential
locations
on
40-
acre
spacing
Wolfberry
Completion
interval:
7,500’
–
10,500’
Vertical wells
Multi-stage fracs (6-8)
EUR: 125 –
175MBOE
Well
cost:
$1.8
Million
Rigs in 2011: 7
18
Gaines
Dawson
Borden
Andrews
Martin
Howard
Glasscock
Midland
Ector
Crane
Upton
Reagan
Sterling
Irion
Midland |
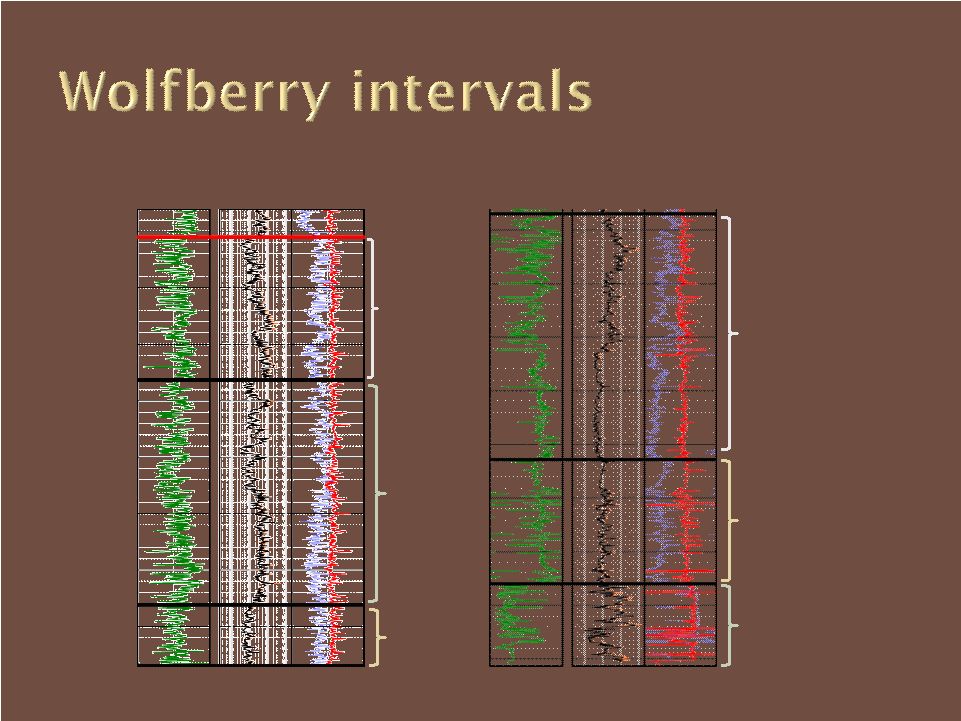 19
7,500’
9,000’
9,000’
10,600’
Wolfcamp
Wolfcamp
Lower
Lower
Spraberry
Spraberry
Cline
Cline
Upper
Upper
Spraberry
Spraberry
Dean
Dean
Strawn
Strawn
8,000’
8,750’
9,900’
10,400’ |
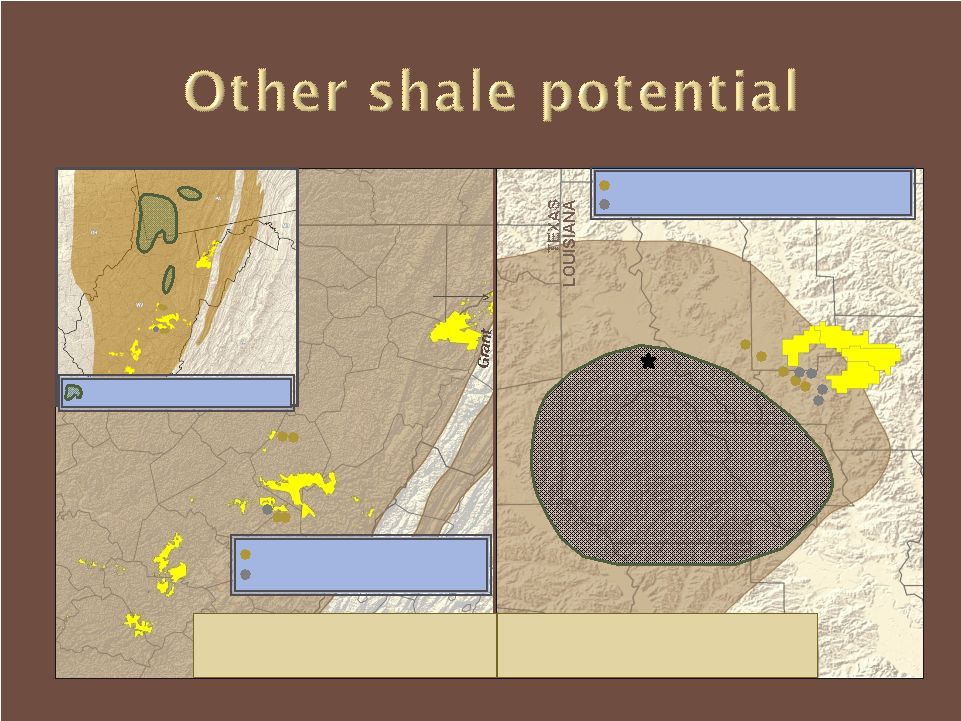
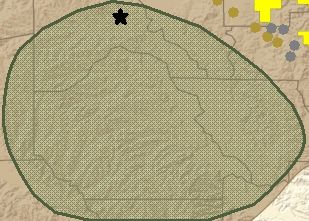
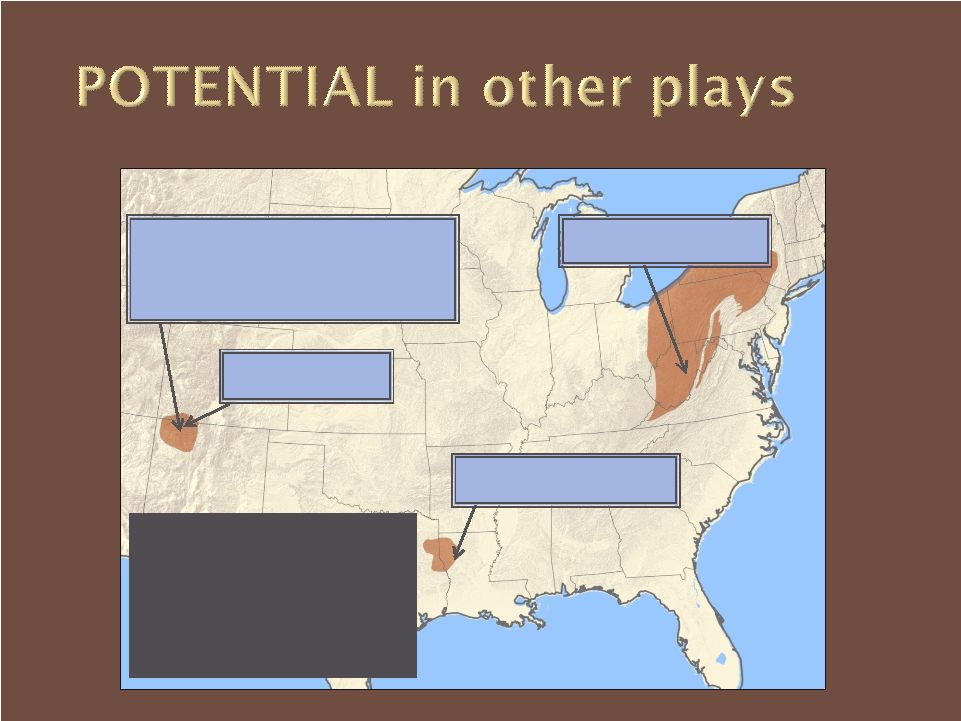 20
Haynesville Shale
12,000 acres
Lewis Shale
55,500 acres
Mancos/Niobrara Shale -
Gas
55,500 acres
Mancos/Niobrara Shale -
Oil
54,000 acres
Marcellus Shale
200,000 acres
Net
Net
Undeveloped
Undeveloped
Acres
Acres |
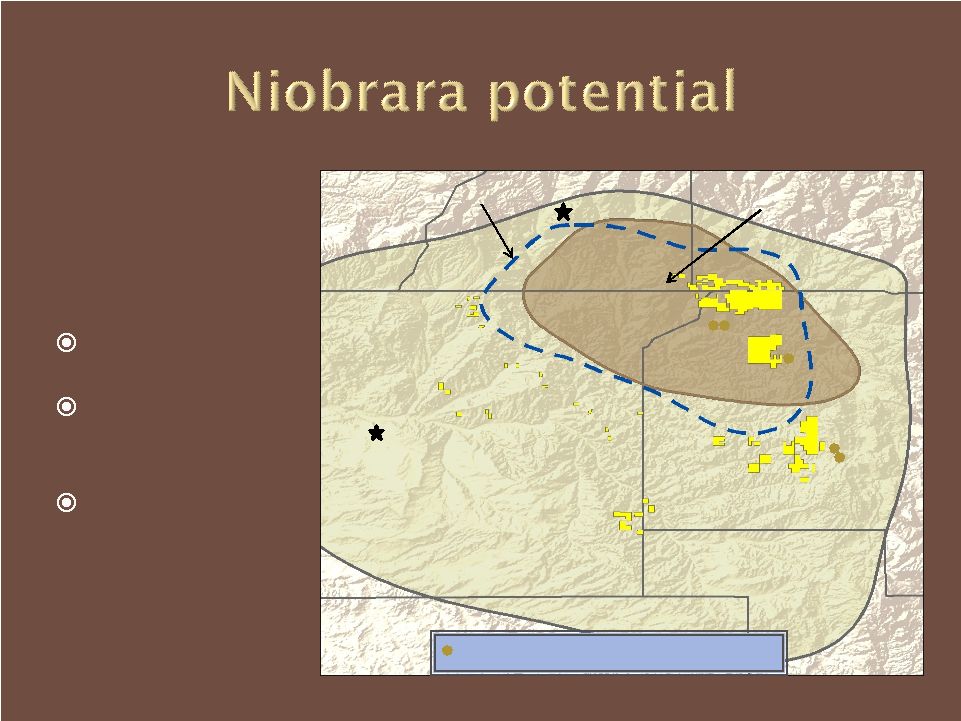 Net
Undeveloped
Acres
Lewis Shale: 55,500
Niobrara
Shale
Gas:
55,500
Niobrara
Shale
Oil: 54,000
21
Niobrara Shale Oil
Lewis Shale
Farmington
Durango
San Juan
Rio Arriba
Sandoval
La Plata
Archuleta
Niobrara Shale Gas
Recently
Drilled
Niobrara
Shale
Wells
(horizontal) |
   22
OHIO
Shreveport
Bienville
Webster
PENN.
W. VIRGINIA
MD
Pocahontas
Nicholas
Webster
Fayette
Raleigh
Wyoming
Boone
Tucker
Mineral
Haynesville
12,000 Net Undeveloped Acres
Area of Major
Haynesville
Development
Recently
Completed
Haynesville
Wells
Recently
Drilled
Haynesville
Wells
Permitted
Marcellus
Wells
(hrzntl)
6
Completed
Marcellus
Wells
(vert)
Marcellus –
Appalachia
200,000 Net Undeveloped Acres
Areas
of
Major
Marcellus
Activity
Garrett |
 Complementary business
Excellent rate of return
Primary source of dividend
23 |
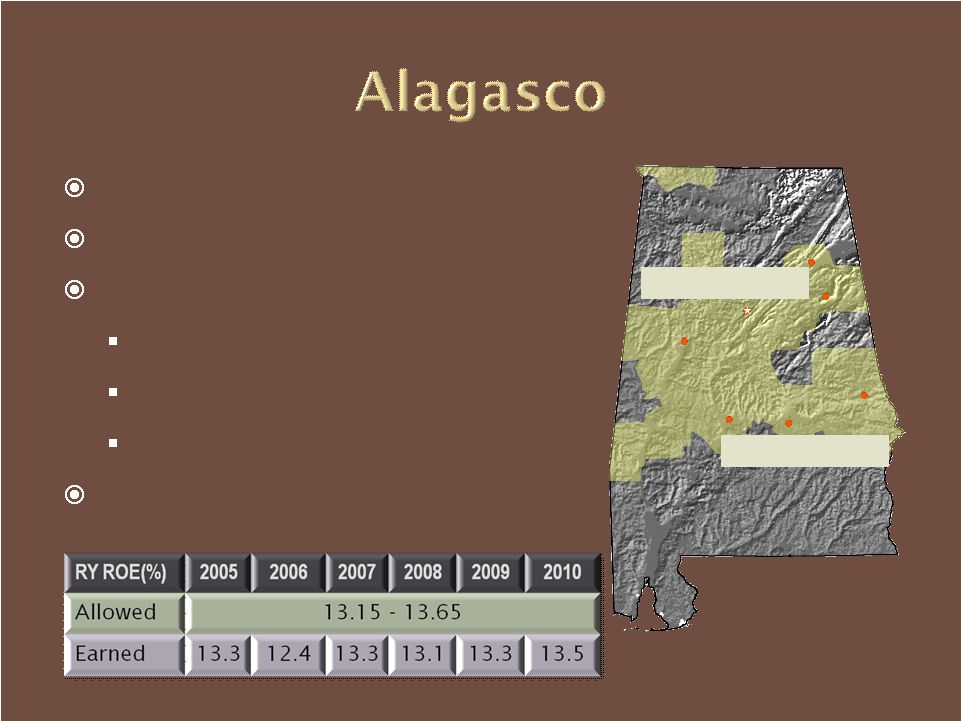 Single-state utility
More than 437,000 customers
Progressive regulation
RSE through rate-year 2015
Allowed ROE: 13.15%-13.65%
Forward-looking test year
Temperature adjustment
Birmingham
Montgomery
24 |
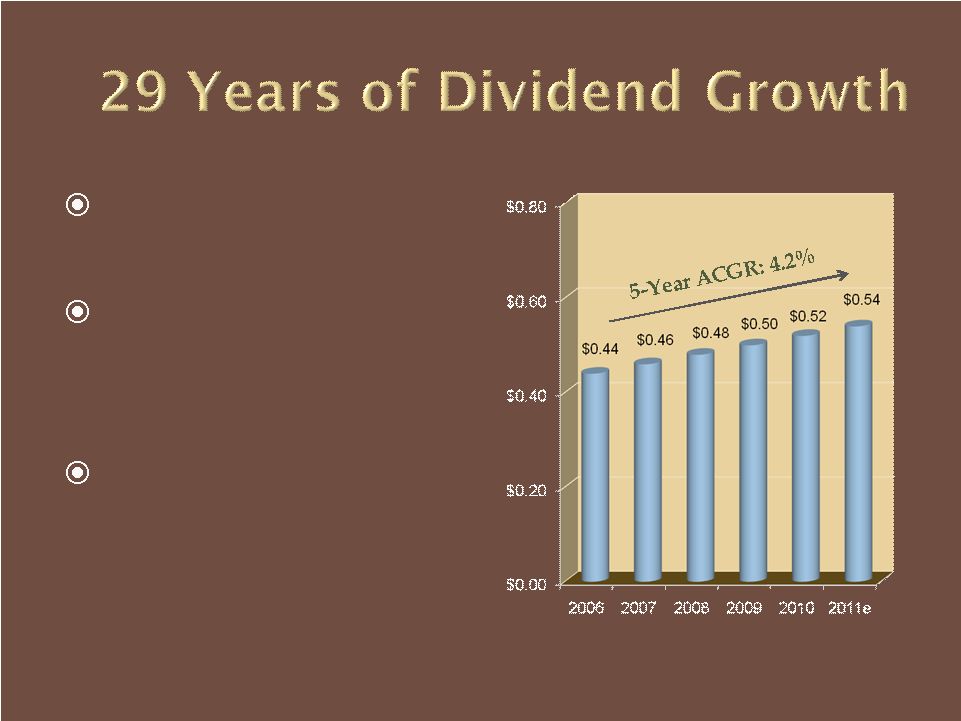 2011 dividend raised 3.8%
Alagasco funds dividend
at utility payout over 65%
ERC may make small
payout contribution
25
Annual Dividend Rate |
 Liquids-focused
Significant Hedges
Strong Cash Flows
Excellent
Fundamentals
Proven Track Record
26 |
 Julie S. Ryland
Vice President –
Investor Relations
205-326-8421
jryland@energen.com
www.energen.com
27 |
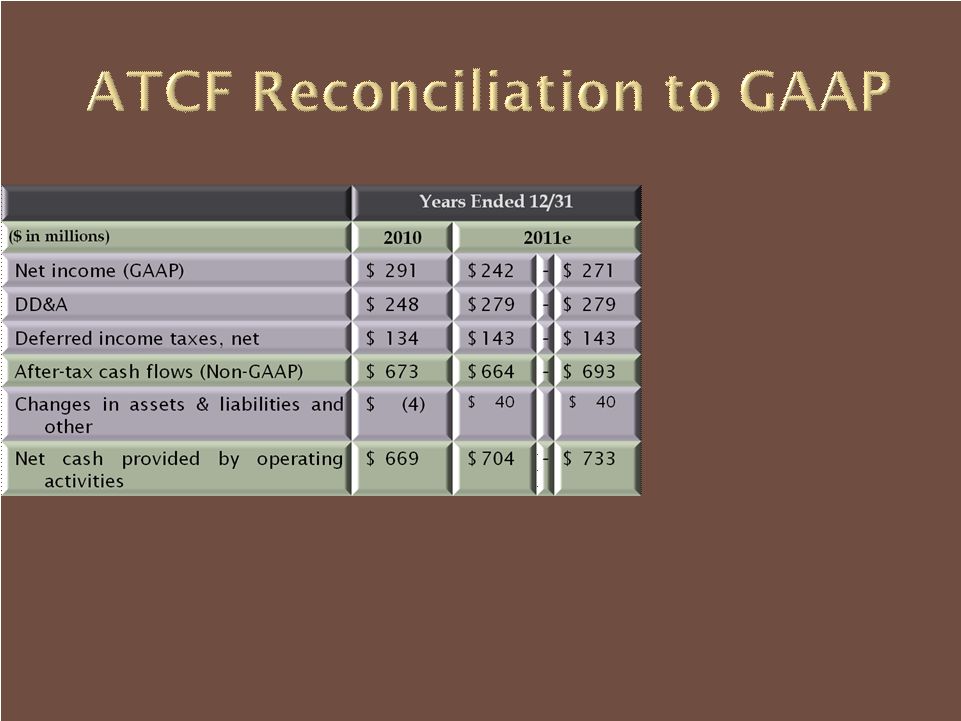 Note: 2011e data constitute forward-looking statements
The
U.S.
Securities
and
Exchange
Commission
(SEC)
requires
public
companies
to
reconcile
Non-
GAAP
financial
measures
to
related
GAAP
measures.
GAAP
refers
to
generally
accepted
accounting
principles.
After-tax
Cash
Flow
(ATCF)
is
a
Non-GAAP
financial
measure.
Energen
believes
ATCF
is
relevant
as
a
measure
of
cash
available
to
fund
its
capital
expenditures,
dividends,
debt
reduction,
and
other
investments.
28 |
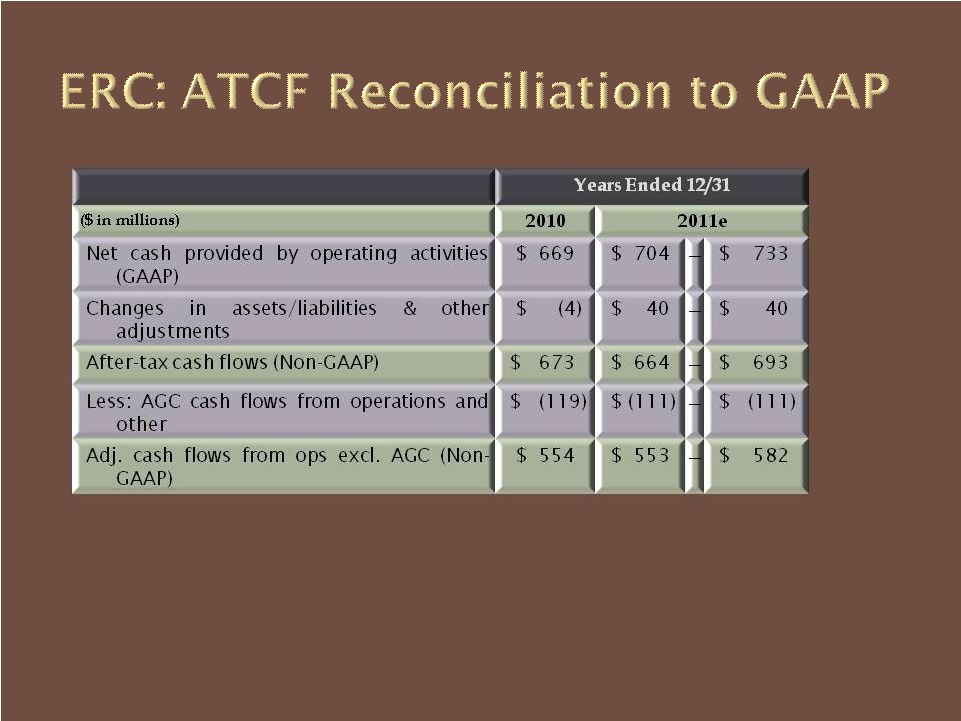 29
After-tax
Cash
Flow
(ATCF)
is
a
Non-GAAP
financial
measure.
Energen
believes
ATCF
is
relevant
as
a
measure
of
cash
available
to
fund
its
capital
expenditures,
dividends,
debt
reduction,
and
other
investments.
Adjusted
Cash
Flows
from
Operations
Excluding
Alagasco
reflect
information
specific
to
Energen’s
non-regulated
activities. |
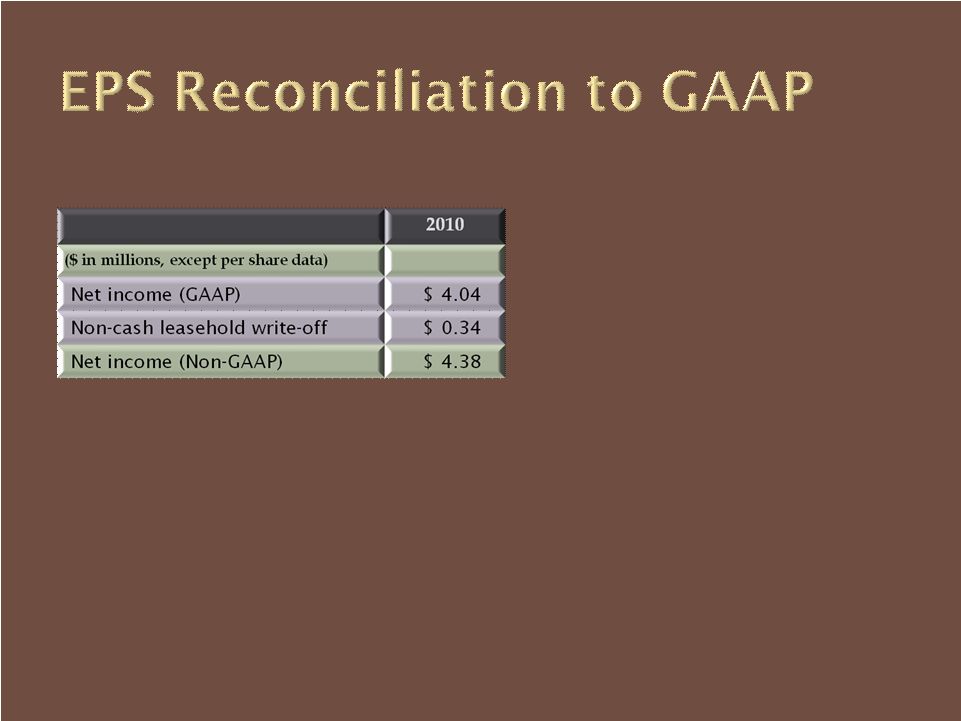 30
The
U.S.
Securities
and
Exchange
Commission
(SEC)
requires
public
companies
to
reconcile
Non-
GAAP
financial
measures
to
related
GAAP
measures.
GAAP
refers
to
generally
accepted
accounting
principles.
Net
Income
excluding
the
non-cash,
after-tax
unproved
leasehold
write-
off is
a
Non-
GAAP
financial
measure.
Energen
believes
that
excluding
it
for
comparative
purposes
better
reflects
financial
performance
of
the
company’s
on-going
operations. |
 March 15, 2011
Wells
Fargo
Securities
2
nd
Annual
E&P
Forum
Focusing on Oil & Liquids |