Attached files
Table of Contents
SECURITIES AND EXCHANGE COMMISSION
Washington, DC 20549
FORM 10-K
| [X] | ANNUAL REPORT PURSUANT TO SECTION 13 OR 15(d) OF THE SECURITIES EXCHANGE ACT OF 1934 For the fiscal year ended December 31, 2010 | |
| OR | ||
| [ ] | TRANSITION REPORT PURSUANT TO SECTION 13 OR 15(d) OF THE SECURITIES EXCHANGE ACT OF 1934 For the transition period from to | |
Commission file number 0-15366
ALLIANCE FINANCIAL CORPORATION
(Exact name of Registrant as specified in its charter)
| New York |
16-1276885 | |||
| (State or Other Jurisdiction of Incorporation or Organization) | (I.R.S. Employer Identification No.) |
120 Madison Street, 18th Floor, Syracuse, NY 13202
(Address of principal executive offices, including zip code)
Registrant’s telephone number including area code: (315) 475-2100
Securities registered pursuant to Section 12(b) of the Act:
Title of Each Class: Common Stock, $1.00 par value per share
Name of each exchange on which registered: The NASDAQ Stock Market LLC
Securities registered pursuant to Section 12(g) of the Act: None
Indicate by check mark if the registrant is a well-known seasoned issuer, as defined in Rule 405 of the Securities Act. Yes No X
Indicate by check mark if the registrant is not required to file reports pursuant to Section 13 or Section 15(d) of the Exchange Act.
Yes No X
Indicate by check mark whether the Registrant (1) has filed all reports required to be filed by Section 13 or 15(d) of the Securities Exchange Act of 1934 during the preceding 12 months (or for such shorter period that the Registrant was required to file such reports), and (2) has been subject to such filing requirements for the past 90 days. Yes X No
Indicate by check mark whether the registrant has submitted electronically and posted on its corporate Web site, if any, every Interactive Data File required to be submitted and posted pursuant to Rule 405 of Regulation S-T during the preceding 12 months (or for such shorter period that the registrant was required to submit and post such files). Yes No
Indicate by check mark if disclosure of delinquent filers pursuant to Item 405 of Regulation S-K is not contained herein, and will not be contained, to the best of registrant’s knowledge, in definitive proxy or information statements incorporated by reference in Part III of this Form 10-K or any amendment to this Form 10-K. [ ]
Indicate by check mark whether the registrant is a large accelerated filer, an accelerated filer, a non-accelerated filer, or a smaller reporting company. See definition of “accelerated filer, large accelerated filer and smaller reporting company” in Rule 12b-2 of the Exchange Act.
Large Accelerated Filer [ ] Accelerated Filer [X] Non-accelerated filer [ ] Smaller Reporting Company [ ]
Indicate by check mark whether the registrant is a shell company (as defined in Rule 12b-2 of the Exchange Act). Yes No X
As of June 30, 2010, the aggregate market value of the voting stock held by non-affiliates of the registrant was $119.2 million based on the closing sale price as reported on the NASDAQ Global Market.
The number of outstanding shares of our common stock, $1 par value per share, on March 10, 2011 was 4,745,491 shares.
DOCUMENTS INCORPORATED BY REFERENCE:
Portions of the proxy statement for the 2011 annual meeting of shareholders (the “Proxy Statement”) are incorporated by reference in Part III of this Annual Report on Form 10-K.
Table of Contents
FORM 10-K ANNUAL REPORT
FOR THE YEAR ENDED
DECEMBER 31, 2010
ALLIANCE FINANCIAL CORPORATION
| Page | ||||||
| i | ||||||
| Item 1. |
1 | |||||
| Item 1A. |
6 | |||||
| Item 1B. |
11 | |||||
| Item 2. |
12 | |||||
| Item 3. |
12 | |||||
| Item 4. |
12 | |||||
| Item 5. |
13 | |||||
| Item 6. |
15 | |||||
| Item 7. |
Management’s Discussion and Analysis of Financial Condition and Results of Operations |
19 | ||||
| Item 7A. |
37 | |||||
| Item 8. |
39 | |||||
| Item 9. |
Changes in and Disagreements with Accountants on Accounting and Financial Disclosure |
84 | ||||
| Item 9A. |
84 | |||||
| Item 9B. |
84 | |||||
| Item 10. |
85 | |||||
| Item 11. |
85 | |||||
| Item 12. |
Security Ownership of Certain Beneficial Owners and Management and Related Stockholder Matters |
85 | ||||
| Item 13. |
Certain Relationships and Related Transactions and Director Independence |
85 | ||||
| Item 14. |
85 | |||||
| Item 15. |
86 | |||||
Table of Contents
CAUTIONARY NOTE REGARDING FORWARD-LOOKING STATEMENTS
We may, from time to time, make written or oral “forward-looking statements” within the meaning of the Private Securities Litigation Reform Act of 1995, including statements contained in our filings with the Securities and Exchange Commission (the “SEC”), our reports to shareholders and in other communications by us. This Annual Report on Form 10-K contains “forward-looking statements” which may be identified by the use of such words as “believe,” “expect,” “anticipate,” “should,” “planned,” “estimated,” and “potential.” Examples of forward-looking statements include, but are not limited to, statements of our goals, intentions and expectations, statements regarding our business plans and prospects and growth and operating strategies, estimates of our risks, and future costs and benefits that are subject to various factors which could cause actual results to differ materially from these estimates. These factors include, but are not limited to:
| • | an increase in competitive pressure in the banking industry; |
| • | changes in interest rates; |
| • | changes in the regulatory environment; |
| • | general economic conditions, both nationally and regionally, resulting, among other things, in a deterioration in credit quality; |
| • | changes in business conditions and inflation; |
| • | changes in the securities markets; |
| • | changes in technology used in the banking business; |
| • | changes in laws and regulations to which we are subject; |
| • | our ability to maintain and increase market share and control expenses; and |
| • | other factors detailed from time to time in our SEC filings. |
Any or all of our forward-looking statements in this Annual Report on Form 10-K, and in any other public statements we make may turn out to be wrong. They can be affected by inaccurate assumptions we might make or by known or unknown risks and uncertainties. Consequently, no forward-looking statements can be guaranteed. We disclaim any obligation to subsequently revise any forward-looking statements to reflect events or circumstances after the date of such statements, or to reflect the occurrence of anticipated or unanticipated events.
Unless the context indicates otherwise, all references in this prospectus to “Alliance” “we,” “us,” “our company,” “corporation” and “our” refer to Alliance Financial Corporation and its subsidiaries (including the Bank and Ladd’s Agency Inc). References to the “Bank” are to Alliance Bank, N.A., our wholly-owned bank subsidiary.
i
Table of Contents
General
Alliance Financial Corporation is a New York corporation and a registered financial holding company formed on November 25, 1998 as a result of the merger of Cortland First Financial Corporation and Oneida Valley Bancshares, Inc. Alliance is the holding company of Alliance Bank, N.A. which was formed as the result of the merger of First National Bank of Cortland and Oneida Valley National Bank in 1999.
We provide financial services from 29 retail branches and customer service facilities in the New York counties of Cortland, Madison, Oneida, Onondaga, Oswego, and from a Trust Administration Center in Buffalo, NY. Our primary services include commercial, retail and municipal banking, consumer finance, mortgage financing and servicing, trust and investment management services. The Bank has a substantially wholly-owned subsidiary, Alliance Preferred Funding Corp., which is engaged in residential real estate activity, and a wholly-owned subsidiary, Alliance Leasing, Inc.
Our corporate and administrative offices are located on the 18th Floor, AXA Tower II, 120 Madison St., Syracuse, New York. Banking services are provided at the administrative offices as well as at Alliance’s 29 customer service facilities.
On February 18, 2005, the Bank acquired a portfolio of personal trust accounts and related assets under management from HSBC, USA, N.A. The Bank assumed the successor trustee role from HSBC on approximately 1,800 personal trust accounts and further assumed approximately $560 million in assets under management. Combined with its existing trust business, the Bank now manages approximately $829 million of related investment assets at December 31, 2010.
On October 6, 2006, Alliance completed its acquisition of Bridge Street Financial, Inc. (“Bridge Street”) and its wholly-owned subsidiaries, Oswego County National Bank (“OCNB”) and Ladd’s Agency Inc. (“Ladd’s”), an insurance agency. In connection with the acquisition, Alliance issued approximately 1,292,000 shares of common stock valued at $38.1 million, and paid cash of $13.2 million for total merger consideration of $51.3 million. At the time of the acquisition, Bridge Street had $219.3 million in assets, $148.3 million in gross loans, and $169.2 million in deposits. In the acquisition, Bridge Street was merged into Alliance, Ladd’s became a wholly-owned subsidiary of Alliance, and Oswego County National Bank was merged into the Bank. In December 2010, we sold substantially all of the assets of Ladd’s and discontinued its operations.
Alliance formed Alliance Financial Capital Trust I and Alliance Financial Capital Trust II (collectively “Capital Trusts”) for the purpose of issuing corporation-obligated mandatorily redeemable capital securities to third-party investors and investing the proceeds from the sale of such capital securities solely in junior subordinated debt securities of Alliance.
At December 31, 2010, we had 339 full-time equivalent employees. Our employees are not represented by any collective bargaining group. We consider our employee relations to be good.
The Bank is a member of the Federal Reserve System and the Federal Home Loan Bank System, and its deposits are insured by the Federal Deposit Insurance Corporation up to applicable limits.
Services
We offer full-service banking with a broad range of financial products to meet the needs of our commercial, retail, government, and investment management customers. Depository account services include interest and non-interest-bearing checking accounts, money market accounts, savings accounts, time deposit accounts, and individual retirement accounts. Our lending activities include the making of residential and commercial mortgage loans, business lines of credit, working capital facilities and business term loans, as well as installment loans, home equity loans, and personal lines of credit to individuals. Investment management and trust services include personal trust, employee benefit trust, investment management, custodial, and financial planning. Through UVEST Financial Services, a subsidiary of LPL Financial Institution Services and member NASD/SIPC, we provide financial counseling and brokerage services. We also offer safe deposit boxes, wire transfers, collection services, drive-up banking facilities, 24-hour night depositories, automated teller machines, 24-hour telephone banking, and on-line internet banking.
1
Table of Contents
Competition
Our business is extremely competitive. We compete not only with other commercial banks, but also with other financial institutions such as thrifts, credit unions, money market and mutual funds, insurance companies, brokerage firms, and a variety of other financial services companies.
Supervision and Regulation
The following discussion summarizes some of the laws and regulations applicable to bank holding companies and national banks and provides certain specific information relevant to Alliance. This regulatory framework is primarily intended for the protection of depositors, consumers, and the deposit insurance funds that insure bank deposits, and not for the protection of shareholders or creditors of bank holding companies and banks. To the extent that the following information describes statutory and regulatory provisions, it is qualified in its entirety by reference to those provisions. Moreover, Congress, regulatory agencies, and state legislatures frequently propose changes to the law and regulations affecting the banking industry. The likelihood and timing of any changes and the impact such changes might have on us are impossible to accurately predict. A change in the statutes, regulations, or regulatory policies applicable to us or our subsidiaries may have a material adverse effect on our business.
Recent Legislative and Regulatory Changes
Over the past two years, a number of additional laws have been enacted directed at stabilizing the economy and infusing capital into financial institutions and markets. These laws affect banks and their holding companies. The Dodd-Frank Act is the most recent in a series of legislative initiatives aimed at stabilizing and improving the U.S. economy. The Dodd-Frank Act passed into law on July 21, 2010, is a broad-ranging financial reform law that affects numerous aspects of the U.S. financial regulatory system. It calls for over 200 rulemakings by numerous federal agencies, some of which have begun to issue rules. However, numerous rules have yet to be proposed or finalized. The Dodd-Frank Act covers subject matter including, but not limited to, systemic risk, corporate governance, executive compensation, credit rating agencies, capital and derivatives. Many of the Dodd-Frank’s effects will not be known for months or years to come, pending, for instance, the issuance of final regulations implementing all of its provisions.
The Dodd-Frank Act also creates a Consumer Financial Protection Bureau (“CFPB”) as an independent bureau of the Federal Reserve Board. The CFPB will have the authority to write regulations on consumer financial products and services that will apply to depository institutions and many other entities that provide consumer financial products and services. The CFPB will begin operations on July 21, 2011.
Bank Holding Company Regulation
General
Alliance is a bank holding company registered under the Bank Holding Company Act of 1956 and, as such, is subject to supervision, regulation and examination by the Board of Governors of the Federal Reserve System (the “Federal Reserve Board” or “FRB”). The Bank Holding Company Act and other federal laws and regulations subject bank holding companies to restrictions on the types of activities in which they may engage, as well as to a supervisory regime that provides for possible regulatory enforcement actions for violations of laws and regulations. Alliance elected to also become a financial holding company on June 21, 2006. A bank holding company that also qualifies as a financial holding company can expand into a wide variety of services that are deemed by the FRB to be financial in nature, including securities underwriting, dealing and market making; sponsoring mutual funds and investment companies; insurance underwriting; and merchant banking. In order for a bank holding company to qualify for financial holding company status, each one of the bank holding company’s subsidiary depository institutions must be deemed “well capitalized” and “well managed” by regulators and must have received at least a “Satisfactory” rating on its last Community Reinvestment Act (“CRA”) examination.
The Bank Holding Company Act requires every bank holding company to obtain the prior approval of the Federal Reserve Board before it may acquire all or substantially all of the assets of any bank, or ownership or control of any voting shares of any bank, if after such acquisition it would own or control, directly or indirectly, more than 5% of the voting shares of such bank. In approving bank acquisitions by bank holding companies, the Federal Reserve Board is required to consider factors including the financial and managerial resources and future prospects of the bank holding company and the banks concerned; the convenience and needs of the communities to be served; and competitive factors. The Change in Bank Control Act prohibits a person or group of persons from acquiring “control” of a bank or bank holding company unless the Federal Reserve Board has been notified and has not objected to the transaction. In addition, any entity is required to obtain the approval of the Federal Reserve Board under the Bank Holding Company Act before acquiring 25% (5% in the case of an
2
Table of Contents
acquirer that is a bank holding company) or more of Alliance’s outstanding common stock, or otherwise obtaining control or a “controlling influence” over Alliance.
The FRB has broad authority to prohibit activities of bank holding companies and their nonbanking subsidiaries that represent unsafe or unsound practices or which constitute violations of laws or regulations, and can bring enforcement actions, including the assessment of civil money penalties, for certain violations or practices.
Under FRB regulations, a bank holding company is expected to act as a source of financial and managerial strength to each of its banking subsidiaries and to commit resources to their support. The Federal Reserve Board may charge the holding company with engaging in unsafe and unsound practices for failure to commit resources to a subsidiary bank when required. Any capital loans by Alliance to its subsidiary bank would be subordinate in right of payment to depositors and to certain other indebtedness of the subsidiary bank.
Our ability to pay dividends to our shareholders is primarily dependent on the ability of the Bank to pay dividends to us. The ability of both Alliance and the Bank to pay dividends is limited by federal statutes, regulations and policies. For example, it is the policy of the Federal Reserve Board that holding companies should pay cash dividends on common stock only out of income available over the past year, and only if prospective earnings retention is consistent with the holding company’s expected future needs and financial condition. The policy provides that holding companies should not maintain a level of cash dividends that undermines the holding company’s ability to serve as a source of strength to its banking subsidiaries. Furthermore, the Bank must obtain regulatory approval for the payment of dividends if the total of all dividends declared in any calendar year would exceed the total of the Bank’s net profits, as defined by applicable regulations, for that year, combined with its retained net profits for the preceding two years. The Bank may not pay a dividend in an amount greater than its undivided profits then on hand after deducting its losses and bad debts, as defined by applicable regulations.
Capital Adequacy Guidelines for Bank Holding Companies
The Federal Reserve Board has established risk-based capital guidelines that are applicable to bank holding companies. The guidelines establish a framework intended to make regulatory capital requirements more sensitive to differences in risk profiles among banking organizations and take off-balance sheet exposures into explicit account in assessing capital adequacy. The Federal Reserve Board guidelines define the components of capital, categorize assets into different risk classes, and include certain off-balance sheet items in the calculation of risk-weighted assets. At least half of the total capital must be comprised of common equity, retained earnings and a limited amount of perpetual preferred stock, less goodwill (“Tier 1 capital”). Bank holding companies that are subject to the guidelines are required to maintain a ratio of Tier 1 capital to risk-weighted assets of at least 4.00% and a ratio of total capital to risk-weighted assets of at least 8.00%. The appropriate regulatory authority may set higher capital requirements when an organization’s particular circumstances warrant. The remainder (“Tier 2 capital”) may consist of a limited amount of subordinated debt, limited-life preferred stock, certain other instruments and a limited amount of loan and lease loss reserves. The sum of Tier 1 capital and Tier 2 capital is “total risk-based capital.” Alliance’s Tier 1 and total risk-based capital ratios as of December 31, 2010 were 13.43% and 14.65%, respectively. In addition, the Federal Reserve Board has established a minimum leverage ratio of Tier 1 capital to quarterly average assets less goodwill (“Tier 1 leverage ratio”) of 3.00% for the bank holding companies with the highest supervisory ratings. All other financial holding companies are required to maintain a Tier 1 leverage ratio of at least 4.00%. Alliance’s Tier 1 leverage ratio as of December 31, 2010 was 8.28%. The guidelines provide that banking organizations experiencing internal growth or making acquisitions will be expected to maintain strong capital positions substantially above the minimum supervisory levels, without significant reliance on intangible assets.
On March 1, 2005 the Federal Reserve Board issued a final rule allowing the continued inclusion of trust preferred securities in the Tier 1 capital of bank holding companies within certain limits. At December 31, 2010, Alliance’s trust preferred securities comprised 21% of the sum of Alliance’s Tier 1 capital.
However, pursuant to the Dodd-Frank Wall Street Reform and Consumer Protection Act (the “Dodd-Frank Act”), enacted on July 21, 2010, the ability of bank holding companies to continue to include trust preferred securities in Tier 1 capital will be limited in the future. Under Section 171 of the Dodd-Frank Act, the Federal Reserve must promulgate regulations implementing capital requirements for bank holding companies with assets greater than $500 million that are no less stringent than those applicable to insured depository institutions. Since depository institutions may not count trust preferred securities in Tier 1 capital (but may count them in Tier 2 capital), bank holding companies with over $500 million in assets will no longer be able to do so. Thus, trust preferred securities issued on or after May 19, 2010 may no longer be counted in Tier 1 capital of bank holding companies with over $500 million in assets. Trust preferred securities issued before May 19, 2010 by bank holding companies with assets of less than $15 billion as of year-end 2009 may continue to be included in Tier 1 capital.
3
Table of Contents
Transactions with Affiliates
The Bank’s authority to engage in transactions with its affiliates is limited by Sections 23A and 23B of the Federal Reserve Act and the Federal Reserve Board’s Regulation W. In general, these transactions must be on terms that are at least as favorable to the Bank as comparable transactions with non-affiliates. In addition, certain types of these transactions are restricted to an aggregate percentage of the Bank’s capital. Collateral in specified amounts must usually be provided by affiliates in order to receive loans from the Bank.
Loans to Insiders
The Bank’s authority to extend credit to its directors, executive officers and principal shareholders, as well as to entities controlled by such persons (collectively, “insiders”), is currently governed by the requirements of Sections 22(g) and 22(h) of the Federal Reserve Act and Regulation O of the Federal Reserve Board. Among other things, these provisions require that extensions of credit to insiders: (i) be made on terms that are substantially the same as, and follow credit underwriting procedures that are not less stringent than, those prevailing for comparable transactions with unaffiliated persons and that do not involve more than the normal risk of repayment or present other unfavorable features; and (ii) not exceed certain limitations on the amount of credit extended to such persons, individually and in the aggregate, which limits are based, in part, on the amount of the Bank’s capital. In addition, extensions for credit in excess of certain limits must be approved by the Bank’s Board of Directors.
Bank Regulation
As a national bank, the Bank is subject to primary supervision, regulation, and examination by the Office of the Comptroller of the Currency (“OCC”). The Bank must file periodic reports with the OCC concerning its activities and financial condition, and must obtain regulatory approval to enter into certain transactions or conduct certain activities. Like other federal banking regulators, the OCC has broad authority to examine and supervise the Bank and to evaluate the Bank’s compliance with applicable laws, regulations and guidance. The OCC may initiate enforcement actions to sanction, remedy, or prevent unsafe or unsound banking practices, breaches of fiduciary duty, and/or violations of law.
The Bank is subject to a wide variety of statutes and regulations that significantly affect its business and activities. Such statutes and regulations include those relating to capital requirements, allowable investments, underwriting of loans, reserves against deposits, trust activities, mergers and consolidations, payment of dividends, establishment of branches and certain other facilities, limitations on loans to one borrower and loans to affiliated persons, and numerous other aspects of the business of banks. Additionally, bank holding companies and their affiliates are prohibited from tying the provision of certain services, such as extensions of credit, to other services offered by a holding company or its affiliates.
Consumer Compliance
The Bank is also subject to certain consumer laws and regulations that are designed to protect consumers in transactions with banks. These laws and regulations include, among others, the Truth in Lending Act, the Truth in Savings Act, the Electronic Fund Transfer Act, the Expedited Funds Availability Act, the Fair Credit Reporting Act, provisions of the Gramm-Leach-Bliley Act of 1999 relating to privacy and safeguarding of consumer information, the Equal Credit Opportunity Act, the Fair Housing Act, the Home Mortgage Disclosure Act, and the Real Estate Settlement Procedures Act. These laws and regulations mandate certain disclosures and, in certain cases, restrict the terms on which the Bank may offer products and services to consumers.
Community Reinvestment
Additionally, the Bank is subject to the Community Reinvestment Act of 1977 (“CRA”) and the regulations issued thereunder, which are intended to encourage banks to help meet the credit needs of their service area, including low-to-moderate-income (“LMI”) neighborhoods, consistent with safe and sound operations. The CRA also provides for regulatory assessment of a bank’s record in meeting the needs of its service area when considering applications regarding establishing branches, mergers or other bank or branch acquisitions. In the case of a bank holding company, the CRA performance record of the banks involved in the transaction are reviewed in connection with the filing of an application to acquire ownership or control of shares or assets of a bank or to merge with any other bank holding company. An unsatisfactory record can substantially delay or block the transaction. The Bank received a rating of “Satisfactory” at its last CRA exam.
Anti-Money Laundering
Alliance and the Bank are also subject to the Bank Secrecy Act, as amended by the USA PATRIOT Act, which gives the federal government powers to address money laundering and terrorist threats through enhanced domestic security measures,
4
Table of Contents
expanded surveillance powers, and mandatory transaction reporting obligations. For example, the Bank Secrecy Act imposes an affirmative obligation on the Bank to report currency transactions that exceed certain thresholds and to report other transactions determined to be suspicious. Title III of the USA PATRIOT Act takes measures intended to encourage information sharing among financial institutions, bank regulatory agencies and law enforcement bodies. Further, certain provisions of Title III impose affirmative obligations on a broad range of financial institutions, including banks, thrifts, brokers, dealers, credit unions, money transfer agents and parties registered under the Commodity Exchange Act. Among other provisions, the USA PATRIOT Act and the related regulations require banks operating in the United States to supplement and enhance the anti-money laundering compliance programs, due diligence policies and controls required by the Bank Secrecy Act and Office of Foreign Assets Control regulations to ensure the detection and reporting of money laundering.
The Bank has in place a comprehensive program to ensure compliance with these requirements. In 2010, the Bank engaged in a very limited number of transactions of any kind with foreign financial institutions or foreign persons.
Capital and Prompt Corrective Action
Under the Prompt Corrective Action (“PCA”) provisions of the Federal Deposit Insurance Corporation Improvement Act of 1991 (“FDICIA”), federal banking regulators are required to take “prompt corrective action” regarding depository institutions that do not meet certain minimum capital requirements. The PCA provisions impose progressively more restrictive constraints on banks as their capital levels decline. The PCA provisions identify the following capital categories for financial institutions: “well capitalized,” “adequately capitalized,” “undercapitalized,” “significantly undercapitalized,” and “critically undercapitalized.” Rules adopted by the federal banking agencies implementing PCA provide that an institution is deemed to be “well capitalized” if it has a total risk-based capital ratio of 10.0% or greater, a Tier 1 risk-based ratio of 6.0% or greater, and a leverage ratio of 5.0% or greater, and the institution is not subject to an order, written agreement, capital directive, or PCA directive to meet and maintain a specific level for any capital measure. Additionally, under FDIC regulations, no FDIC-insured bank can accept brokered deposits unless it is well capitalized, or is adequately capitalized and receives a waiver from the FDIC. In addition, these regulations prohibit any bank that is not well capitalized from paying an interest rate on brokered deposits above certain levels.
At December 31, 2010, Alliance and the Bank were in the “well capitalized” category.
Insurance of Deposits
The deposits of the Bank are insured up to the applicable limits established by law and are subject to the deposit insurance premium assessments of the Deposit Insurance Fund (“DIF”). Under Dodd-Frank, the standard deposit insurance amount has been permanently increased to $250,000. The FDIC currently maintains a risk-based assessment system under which assessment rates vary based on the level of risk posed by the institution to the DIF.
In February 2011, the FDIC adopted a final rule making certain changes to the deposit insurance assessment system, many of which were made as a result of provisions of the Dodd-Frank Act. The final rule also revises the assessment rate schedule effective April 1, 2011, and adopts additional rate schedules that will go into effect when the DIF reserve ratio reaches various milestones. The final rule changes the deposit insurance assessment system from one that is based on domestic deposits to one that is based on average consolidated total assets minus average tangible equity. In addition, the rule suspends FDIC dividend payments if the DIF reserve ratio exceeds 1.5 percent but provides for decreasing assessment rates when the DIF reserve ratio reaches certain thresholds.
In calculating assessment rates, the rule adopts a new “scorecard” assessment scheme for insured depository institutions with $10 billion or more in assets. It retains the risk category system for insured depository institutions with less than $10 billion in assets, assigning each institution to one of four risk categories based upon the institution’s capital evaluation and supervisory evaluation, as defined by the rule.
The rule will take effect for the quarter beginning April 1, 2011, and will be reflected in the invoices for assessments due September 30, 2011.
Monetary and Fiscal Policies
The earnings of Alliance are significantly affected by the monetary and fiscal policies of governmental authorities, including the Federal Reserve Board. Among the instruments of monetary policy used by the Federal Reserve Board to implement these objectives are open-market operations in U.S. government securities and federal funds, changes in the discount rate on member bank borrowings, and changes in reserve requirements against member bank deposits. These instruments of monetary policy are used in varying combinations to influence the overall level of bank loans, investments and deposits, and the interest rates charged on loans and paid for deposits. The Federal Reserve Board frequently uses these instruments of
5
Table of Contents
monetary policy, especially its open-market operations and the discount rate, to influence the level of interest rates and to affect the strength of the economy, the level of inflation or the price of the dollar in foreign exchange markets. The monetary policies of the Federal Reserve Board have had a significant effect on the operating results of banking institutions in the past and are expected to continue to do so in the future. It is not possible to predict the nature of future changes in monetary and fiscal policies, or the effect that they may have on Alliance’s business and earnings.
The Sarbanes-Oxley Act of 2002
The Sarbanes-Oxley Act of 2002 (“Sarbanes-Oxley”) also imposes numerous requirements designed to address corporate and accounting fraud. Sarbanes-Oxley requires chief executive officers and chief financial officers, or their equivalent, to certify the accuracy of periodic reports filed with the SEC, subject to civil and criminal penalties if they knowingly or willfully violate this certification requirement. In addition, under Sarbanes-Oxley, legal counsel is required to report evidence of a material violation of the securities laws or a breach of fiduciary duty by a company to the chief executive officer or chief financial officer, and, if such officer does not appropriately respond, to report such evidence to the audit committee or other similar committee of the Board of Directors or the Board itself. Executives are also prohibited from insider trading during retirement plan “blackout” periods, and loans to company executives are restricted.
Available Information
We file annual reports, quarterly reports, proxy statements and other documents with the SEC under the Securities Exchange Act of 1934 (the “Exchange Act”). The public may read and copy any materials that we file with the SEC at the SEC’s Public Reference Room at 100 F. Street, N.E., Room 1580, Washington, D.C. 20549. The public may obtain information on the operation of the Public Reference Room by calling the SEC at 1-800-SEC-0330. Also, the SEC maintains a website that contains reports, proxy and information statements, and other information regarding issuers, including Alliance, that file electronically with the SEC. The public can obtain any documents that we file with the SEC at www.sec.gov.
We also make available, free of charge through our website (www.alliancebankna.com), Alliance’s Annual Report on Form 10-K, Quarterly Reports on Form 10-Q, Current Reports on Form 8-K, and, if applicable, amendments to those reports filed or furnished pursuant to the Exchange Act as soon as reasonably practicable after we electronically file such material with, or furnishes it to, the SEC.
There are risks inherent to our business. The material risks and uncertainties that management believes affect us are described below. The risks and uncertainties described below are not the only ones facing us. Additional risks and uncertainties that management is not aware of or focused on or that management currently deems immaterial may also impair our business operations. This report is qualified in its entirety by these risk factors. If any of the following risks actually occur, our financial condition and results of operations could be materially and adversely affected.
We Are Subject to Interest Rate Risk
Our earnings and cash flows are largely dependent upon our net interest income. Net interest income is the difference between interest income earned on interest-earning assets such as loans and securities and interest expense paid on interest-bearing liabilities such as deposits and borrowed funds. Interest rates are highly sensitive to many factors that are beyond our control, including general economic and credit market conditions and policies of various governmental and regulatory agencies, particularly the Federal Reserve System. Changes in monetary policy, including changes in interest rates, could not only influence the interest we receive on loans and securities and the amount of interest we pay on deposits and borrowings, but could also affect (i) our ability to originate loans and obtain deposits, (ii) the fair value of our financial assets and liabilities, and (iii) the average duration of our mortgage-backed securities portfolio. If the interest rates paid on deposits and other borrowings increase at a faster rate than the interest rates earned on loans and other investments, our net interest income, and therefore our earnings, could be adversely affected. Earnings could also be adversely affected if the interest rates earned on loans and other investments fall more quickly than the interest rates paid on deposits and other borrowings.
Although management believes it has implemented effective asset and liability management strategies to reduce the potential effects of changes in interest rates on our results of operations, any substantial, unexpected, prolonged change in market interest rates could have a material adverse effect on our financial condition and results of operations.
6
Table of Contents
See the section captioned “Net Interest Income” in Item 7, Management’s Discussion and Analysis of Financial Condition and Results of Operations and Item 7A, Quantitative and Qualitative Disclosure About Market Risk located elsewhere in this report for further discussion related to our management of interest rate risk.
We Are Subject to Lending Risk
There are inherent risks associated with our lending activities. These risks include, among other things, the impact of changes in interest rates and changes in the economic or credit market conditions in the markets where we operate as well as the State of New York and the entire United States. Increases in interest rates and/or weakening economic or credit market conditions could adversely impact the ability of borrowers to repay outstanding loans or the value of the collateral securing these loans. We are also subject to various laws and regulations that affect our lending activities. Failure to comply with applicable laws and regulations could subject us to regulatory enforcement action that could result in the assessment of significant civil money penalties against us.
As of December 31, 2010, approximately 32.5% of our loan and lease portfolio consisted of commercial loans and leases net of unearned income. These types of loans are generally viewed as having more risk of default than conventional residential real estate loans or most consumer loans. Commercial loans are also typically larger than residential real estate loans and consumer loans. Because our loan portfolio contains a significant number of commercial loans with relatively large balances, the deterioration of one or a few of these loans could cause a significant increase in nonperforming loans. An increase in nonperforming loans could result in a net loss of earnings from these loans, an increase in the provision for credit losses and an increase in loan charge-offs, all of which could have a material adverse effect on our financial condition and results of operations.
See the section captioned “Loans and Leases” in Item 7. Management’s Discussion and Analysis of Financial Condition and Results of Operations located elsewhere in this report for further discussion related to commercial loans and leases.
Our Allowance for Credit Losses May Be Insufficient
We maintain an allowance for credit losses, which is a reserve established through a provision for credit losses charged to expense, that represents management’s best estimate of probable losses incurred within the existing portfolio of loans and leases. The allowance is necessary to provide for estimated credit losses and risks inherent in the loan and lease portfolio. The level of the allowance reflects management’s continuing evaluation of industry concentrations; specific credit risks; loan loss experience; current loan and lease portfolio quality; present economic, political and regulatory conditions and unidentified losses inherent in the current loan and lease portfolio. The determination of the appropriate level of the allowance for credit losses inherently involves a significant degree of subjectivity and requires us to make estimates of current credit risks, all of which may undergo material changes. Changes in economic conditions affecting borrowers, new information regarding existing loans, identification of additional problem loans and other factors, both within and outside of our control, may require an increase in the allowance for credit losses. In addition, bank regulatory agencies periodically review our allowance for credit losses and may require an increase in the provision for credit losses or the recognition of further loan charge-offs, based on judgments different than those of management. In addition, if charge-offs in future periods exceed the allowance for credit losses, we will need additional provisions to increase the allowance for credit losses. These increases in the allowance for credit losses will result in a decrease in net income and, possibly, capital, and may have a material adverse affect on our financial condition and results of operations.
See the section captioned “Asset Quality and the Allowance for Credit Losses” in Item 7. Management’s Discussion and Analysis of Financial Condition and Results of Operations located elsewhere in this report for further discussion related to our process for determining the appropriate level of the allowance for credit losses.
Our Profitability Depends Significantly on Economic Conditions in Central New York
Our profitability depends significantly on the general economic conditions of Central New York and the specific local markets in which we operate. Unlike larger national or other regional banks that are more geographically diversified, we provide banking and financial services to customers primarily in the Central New York counties of Cortland, Erie, Madison, Oneida, Onondaga and Oswego. The local economic conditions in these areas have a significant impact on the demand for our products and services as well as the ability of our customers to repay loans, the value of the collateral securing loans and the stability of our deposit funding sources. A significant decline in general economic conditions, caused by inflation, recession, acts of terrorism, outbreak of hostilities or other international or domestic occurrences, unemployment, changes in securities or credit markets or other factors could impact these local economic conditions and, in turn, have a material adverse effect on our financial condition and results of operations.
7
Table of Contents
We Operate in a Highly Competitive Industry and Market Area
We face substantial competition in all areas of our operations from a variety of different competitors, many of which are larger and may have more financial resources. Such competitors primarily include national, regional, and community banks within the various markets where we operate. We also face competition from many other types of financial institutions, including, without limitation, savings and loans, credit unions, finance companies, brokerage firms, insurance companies, factoring companies and other financial intermediaries. The financial services industry could become even more competitive as a result of legislative, regulatory and technological changes and continued consolidation. Banks, securities firms and insurance companies can merge under the umbrella of a financial holding company, which can offer virtually any type of financial service, including banking, securities underwriting, insurance (both agency and underwriting) and merchant banking. Also, technology has lowered barriers to entry and made it possible for non-banks to offer products and services traditionally provided by banks, such as automatic transfer and automatic payment systems. Many of our competitors have fewer regulatory constraints and may have lower cost structures. Additionally, due to their size, many competitors may be able to achieve economies of scale and, as a result, may offer a broader range of products and services as well as better pricing for those products and services than we can. Our ability to compete successfully depends on a number of factors, including, among other things:
| • | The ability to develop, maintain and build upon long-term customer relationships based on top quality service, high ethical standards and safe and sound practices. |
| • | The ability to maintain high asset quality. |
| • | The ability to expand our market position. |
| • | The scope, relevance and pricing of products and services offered to meet customer needs and demands. |
| • | The rate at which we introduce new products and services relative to our competitors. |
| • | Customer satisfaction with our level of service. |
| • | Industry and general economic trends. |
| • | Our ability to upgrade and acquire technology and information systems to support the sales and service of deposit and loan products. |
Failure to perform in any of these areas could significantly weaken our competitive position, which could adversely affect our growth and profitability, which, in turn, could have a material adverse effect on our financial condition and results of operations.
We Are Subject to Extensive Government Regulation and Supervision
We are subject to extensive federal regulation and supervision. Banking regulations are primarily intended to protect depositors’ funds, federal deposit insurance funds and the banking system as a whole, not shareholders. These regulations affect our lending practices, capital structure, investment practices, dividend policy and growth, among other things. Congress and federal regulatory agencies continually review banking laws, regulations and policies for areas warranting changes. Changes to statutes, regulations or regulatory policies, including changes in interpretation or implementation of statutes, regulations or policies, could affect us in substantial and unpredictable ways. Such changes could subject us to additional costs, limit the types of financial services and products we may offer and/or increase the ability of non-banks to offer competing financial services and products, among other things. Failure to comply with laws, regulations or policies could result in sanctions by regulatory agencies, civil money penalties, private lawsuits, and/or reputation damage, which could have a material adverse effect on our business, financial condition and results of operations. While we have policies and procedures designed to prevent any such violations, there can be no assurance that such violations will not occur.
See the section captioned “Supervision and Regulation” in Item 1. Business, which is located elsewhere in this report, for further discussion.
Compliance with the Recently Enacted Dodd-Frank Act Will Increase Our Regulatory Compliance Burdens, and May Increase Our Operating Costs and/or Adversely Impact Our Earnings and/or Capital Ratios
On July 21, 2010, President Obama signed the Dodd-Frank Act into law. The Dodd-Frank Act represents a significant overhaul of many aspects of the regulation of the financial-services industry. Among other things, the Dodd-Frank Act creates a new federal CFPB, tightens capital standards, imposes clearing and margining requirements on many derivatives activities, and generally increases oversight and regulation of financial institutions and financial activities.
The CFPB will begin operations on July 21, 2011. It will have broad authority to write regulations regarding consumer financial products and services. These regulations will apply to numerous types of entities, including insured depository institutions such as the Bank. Such regulations will not be proposed until the CFPB begins operations. It is impossible to predict at this time the content or number of such regulations.
8
Table of Contents
The Dodd-Frank Act also requires depository institution holding companies with assets greater than $500 million to be subject to the same capital requirements as insured depository institutions, meaning, for instance, that such holding companies will no longer be able to count trust preferred securities issued on or after May 19, 2010 as Tier 1 capital. Holding companies with total consolidated assets of less than $15 billion will be allowed to continue to count securities, including trust preferred securities, issued before May 19, 2010 in Tier 1 capital if the securities qualified as Tier 1 capital on that date. Holding companies with total consolidated assets of $15 billion or greater will be required to phase out existing trust preferred and other non-qualifying securities from Tier 1 capital over a 3-year period beginning on January 1, 2013.
In addition to the self-implementing provisions of the statute, the Dodd-Frank Act calls for over 200 administrative rulemakings by various federal agencies to implement various parts of the legislation. While some rules have been finalized and/or issued in proposed form, many have yet to be proposed. It is impossible to predict when all such additional rules will be issued or finalized, and what the content of such rules will be. We will have to apply resources to ensure that we are in compliance with all applicable provisions of the Dodd-Frank Act and any implementing rules, which may increase our costs of operations and adversely impact our earnings.
The Dodd-Frank Act and any implementing rules that are ultimately issued could have adverse implications on the financial industry, the competitive environment, and/or our ability to conduct business.
We Cannot Predict the Effect On Our Operations of Any Future Legislative or Regulatory Initiatives
We cannot predict what, if any, additional legislative or regulatory initiatives any governmental entity may undertake in the future, and what, if any, effects such initiatives may have on our operations. The U.S. federal and state governments and many foreign governments have taken or are considering extraordinary actions in response to the worldwide financial crisis and the severe decline in the global economy. Recently, for example, the U.S. Congress and President Obama have expressed an intent to pass legislation to reform the system of government-sponsored enterprises (GSEs), including Fannie Mae and Freddie Mac. At this time, there is no certainty that such legislation will be introduced or passed.
There can be no assurance that the enactment or adoption of any such initiative will be effective at dealing with the ongoing economic crisis or will have the effect of improving economic conditions globally, nationally or in our markets, or that any such initiative will not have adverse consequences to us.
A Change to the Conservatorship of Fannie Mae and Freddie Mac and Related Actions, Along with Any Changes in Laws and Regulations Affecting the Relationship Between Fannie Mae and Freddie Mac and the U.S. Federal Government, Could Adversely Affect Our Business
There continues to be substantial uncertainty regarding the future of GSEs Fannie Mae and Freddie Mac, including whether they both will continue to exist in their current form. We sell the majority of our residential mortgages to Fannie Mae, Freddie Mac, and the Federal Home Loan Bank. Our ability to sell our residential mortgages into the secondary market is an important part of our overall interest rate risk, liquidity risk and capital management strategies.
Due to increased market concerns about the ability of Fannie Mae and Freddie Mac to withstand future credit losses associated with securities on which they provide guarantees and loans held in their investment portfolios without the direct support of the U.S. federal government, in September 2008, the Federal Housing Finance Agency (the “FHFA”) placed Fannie Mae and Freddie Mac into conservatorship and, together with the U.S. Treasury, established a program designed to boost investor confidence in Fannie Mae and Freddie Mac by supporting the availability of mortgage financing and protecting taxpayers. The U.S. government program includes contracts between the U.S. Treasury and each of Fannie Mae and Freddie Mac that seek to ensure that each GSE maintains a positive net worth by providing for the provision of cash by the U.S. Treasury to Fannie Mae and Freddie Mac if FHFA determines that its liabilities exceed its assets. Although the U.S. government has described some specific steps that it intends to take as part of the conservatorship process, efforts to stabilize these entities may not be successful and the outcome and impact of these events remain highly uncertain.
It is widely anticipated that the U.S. Congress will address GSEs as part of its next major legislative undertaking, although it is not known when, or if, that will occur. In Section 1491 of the Dodd-Frank Act, Congress stated that the “hybrid public-private status of Fannie Mae and Freddie Mac is untenable and must be resolved” and, further, “[i]t is the sense of the Congress that efforts to enhance by [sic] the protection, limitation, and regulation of the terms of residential mortgage credit and the practices related to such credit would be incomplete without enactment of meaningful structural reforms of Fannie Mae and Freddie Mac.” Future legislation could further change the relationship between Fannie Mae and Freddie Mac and the U.S. government, could change their business charters or structure, or could nationalize or eliminate such entities entirely. We cannot predict whether, or when, any such legislation may be enacted.
9
Table of Contents
The Soundness of Other Financial Services Institutions May Adversely Affect Our Credit Risk
We rely on other financial services institutions through trading, clearing, counterparty, and other relationships. We maintain limits and monitor concentration levels of our counterparties as specified in our internal policies. Our reliance on other financial services institutions exposes us to credit risk in the event of default by these institutions or counterparties. These losses could adversely affect our results of operations and financial condition.
Increases in FDIC Deposit Insurance Premiums and Assessments Could Adversely Affect Our Financial Condition
FDIC insurance premiums increased substantially in 2009 and we expect to continue to pay high FDIC premiums in the future. FDIC insured bank failures have significantly depleted the insurance fund of the FDIC and reduced the ratio of reserves to insured deposits. The FDIC adopted a revised risk-based deposit insurance assessment schedule on February 27, 2009, which raised deposit insurance premiums. On May 22, 2009, the FDIC also implemented a five basis point special assessment of each insured depository institution’s assets minus Tier 1 capital as of June 30, 2009, but no more than 10 basis points times the institution’s assessment base for the second quarter of 2009, which was collected on September 30, 2009. Additional special assessments may be imposed by the FDIC for future periods.
In December 2009, the FDIC enacted a proposal that required most FDIC-insured banks to prepay their projected insurance assessments for the years 2010 through 2012. In December 2009, we advanced approximately $5.7 million of such prepaid assessments. The prepaid assessments were capitalized as an asset and are being amortized based on the expected period in which the assessment would have been incurred. The actual FDIC insurance expense could be higher if the balance in the deposit insurance fund reaches levels that cause the FDIC to implement additional special assessments or take other actions that result in an increase to the amounts paid by banks under the FDIC insurance program.
The Dodd-Frank Act also broadens the base for Federal Deposit Insurance Corporation insurance assessments. Assessments will now be based on the average consolidated total assets less tangible equity capital of a financial institution.
Certain of Our Intangible Assets May Become Impaired in the Future
Intangible assets are tested for impairment on a periodic basis. Impairment testing incorporates the current market price of our common stock, the estimated fair value of our assets and liabilities, and certain information of similar companies. It is possible that future impairment testing could result in a decline in value of our intangibles which may be less than the carrying value, which may adversely affect our financial condition. If we determine that an impairment exists at a given point in time, our earnings and the book value of the related intangibles will be reduced by the amount of the impairment. Notwithstanding the foregoing, the results of impairment testing on our intangible assets have no impact on our tangible book value or regulatory capital levels.
Our Controls and Procedures May Fail or Be Circumvented
Management regularly reviews and updates our internal controls, disclosure controls and procedures, and corporate governance policies and procedures. Any system of controls, however well designed and operated, is based in part on certain assumptions and can provide only reasonable, not absolute, assurances that the objectives of the system are met. Any failure or circumvention of our controls and procedures or failure to comply with regulations related to controls and procedures could have a material adverse effect on our business, results of operations and financial condition.
New Lines of Business or New Products and Services May Subject Us to Additional Risks
From time to time, we may implement new lines of business or offer new products and services within existing lines of business. There are substantial risks and uncertainties associated with these efforts, particularly in instances where the markets are not fully developed. In developing and marketing new lines of business and/or new products and services, we may invest significant time and resources. Initial timetables for the introduction and development of new lines of business and/or new products or services may not be achieved and price and profitability targets may not prove feasible. External factors, such as compliance with regulations, competitive alternatives, and shifting market preferences, may also impact the successful implementation of a new line of business or a new product or service. Furthermore, any new line of business and/or new product or service could have a significant impact on the effectiveness of our system of internal controls. Failure to successfully manage these risks in the development and implementation of new lines of business or new products or services could have a material adverse effect on our business, results of operations and financial condition.
10
Table of Contents
We Rely on Dividends from Our Subsidiary for Most of Our Revenue
We receive substantially all of our revenue from dividends from the Bank. These dividends are the principal source of funds to pay dividends on our common stock and interest and principal on our debt. Various federal and/or state laws and regulations limit the amount of dividends that the Bank may pay to us. Also, our right to participate in a distribution of assets upon a subsidiary’s liquidation or reorganization is subject to the prior claims of the subsidiary’s creditors. In the event the Bank is unable to pay dividends to us, we may not be able to service debt, pay obligations or pay dividends on our common stock.
The inability to receive dividends from the Bank could have a material adverse affect on our business, financial condition and results of operations. See the section captioned “Supervision and Regulation” in Item 1. Business and Note 16 – Dividends and Restrictions in the notes to consolidated financial statements included in Item 8. Financial Statements and Supplementary Data, which are located elsewhere in this report.
We May Not Be Able To Attract and Retain Skilled People
Our success depends, in large part, on our ability to attract and retain key human resource talent. Competition for the best people in most activities we are engaged in can be intense and we may not be able to hire people or to retain them. The unexpected loss of services of one or more of our key personnel could have a material adverse impact on our business because of their skills, knowledge of our market, years of industry experience and the difficulty of promptly finding qualified replacement personnel.
Our Information Systems May Experience an Interruption or Breach In Security
We rely heavily on communications and information systems to conduct our business. Any failure, interruption or breach in security of these systems could result in failures or disruptions in our customer relationship management, general ledger, deposit, loan and other systems. While we have policies and procedures designed to prevent or limit the effect of the failure, interruption or security breach of our information systems, there can be no assurance that any such failures, interruptions or security breaches will not occur or, if they do occur, that they will be adequately addressed. The occurrence of any failures, interruptions or security breaches of our information systems could damage our reputation, result in a loss of customer business, subject us to additional regulatory scrutiny and/or enforcement actions, or expose us to civil litigation and possible financial liability, any of which could have a material adverse effect on our financial condition and results of operations.
We Continually Encounter Technological Changes
The financial services industry is continually undergoing rapid technological change with frequent introductions of new technology-driven products and services. The effective use of technology increases efficiency and enables financial institutions to better serve customers and to reduce costs. Our future success depends, in part, upon our ability to address the needs of our customers by using technology to provide products and services that will satisfy customer demands, as well as to create additional efficiencies in our operations. Many of our competitors have substantially greater resources to invest in technological enhancements. We may not be able to effectively implement new technology-driven products and services or be successful in marketing these products and services to our customers. Failure to successfully keep pace with technological change affecting the financial services industry could have a material adverse impact on our business and, in turn, our financial condition and results of operations.
Our Articles of Incorporation, By-Laws and Shareholder Rights Plan As Well As Certain Banking Laws May Have an Anti-Takeover Effect
Provisions of our articles of incorporation and by-laws, federal banking laws, including regulatory approval requirements, and our stock purchase rights plan could make it more difficult for a third party to acquire us, even if doing so would be perceived to be beneficial to our stockholders. The combination of these provisions effectively inhibits a non-negotiated merger or other business combination, which, in turn, could adversely affect the market price of our common stock.
Item 1B. Unresolved Staff Comments
Not applicable.
11
Table of Contents
We conduct business in Central New York State through 29 banking offices and two administrative centers. We lease our corporate administrative center, located in Syracuse, NY. Eleven banking offices and one of the administrative centers are subject to leases and/or long-term land leases. The remaining banking offices and administrative center are owned.
We are subject to various claims, legal proceedings and matters that arise in the ordinary course of business. In management’s opinion, no pending action, if adversely decided, would materially affect our financial condition.
Item 4. [Removed and Reserved]
12
Table of Contents
Item 5. Market for the Registrant’s Common Equity, Related Stockholder Matters and Issuer Purchases of Equity Securities
Common Stock Data
Our common stock is listed on the NASDAQ Global Market under the symbol “ALNC.” There were 903 shareholders of record as of December 31, 2010. The following table presents the high and low sales price during the periods indicated, as well as dividends declared.
| 2010 | 2009 | |||||||||||
| High | Low | Dividend Declared |
High | Low | Dividend Declared | |||||||
| 1st Quarter |
$29.50 | $26.25 | $0.28 | $21.78 | $14.96 | $0.26 | ||||||
| 2nd Quarter |
$31.00 | $26.78 | $0.28 | $29.28 | $18.45 | $0.26 | ||||||
| 3rd Quarter |
$31.55 | $27.57 | $0.30 | $30.35 | $24.26 | $0.28 | ||||||
| 4th Quarter |
$33.40 | $29.11 | $0.30 | $30.49 | $20.51 | $0.28 | ||||||
Dividends
We have historically paid regular quarterly cash dividends on our common stock, and the Board of Directors presently intends to continue the payment of regular quarterly cash dividends, subject to the need for those funds for debt service and other purposes. However, because substantially all of the funds available for the payment of dividends are derived from the Bank, future dividends will depend upon the earnings of the Bank, its financial condition and its need for funds. Furthermore, there are a number of federal banking policies and regulations that restrict our ability to pay dividends. In particular, because the Bank is a depository institution whose deposits are insured by the FDIC, it may not pay dividends or distribute capital assets if it is in default on any assessment due the FDIC. Also, as a national bank, the Bank is subject to OCC regulations which impose certain minimum capital requirements that would affect the amount of cash available for distribution to us. In addition, under Federal Reserve policy, we are required to maintain adequate regulatory capital, are expected to serve as a source of financial strength to the Bank and to commit resources to support the Bank. These policies and regulations may have the effect of reducing the amount of dividends that we can declare to our shareholders.
Automatic Dividend Reinvestment Plan
We have an automatic dividend reinvestment plan which is administered by our transfer agent, American Stock Transfer & Trust Company. The plan offers a convenient way for shareholders to increase their investment in us by enabling them to reinvest cash dividends on all or part of their common stock in additional shares of our common stock without paying brokerage commissions or service charges. Shareholders who are interested in this program may visit the Shareholder Services section of American Stock Transfer & Trust Company’s website for more information (www.amstock.com). Shareholders may also receive a Plan Prospectus and enrollment card by calling ASTC Dividend Reinvestment at 1-800-278-4353, or writing to the following address:
Dividend Reinvestment
American Stock Transfer & Trust Company
59 Maiden Lane
New York, NY 10038
Sales of Unregistered Securities and Purchases of Equity Securities
There were no sales by us of unregistered securities during the year ended December 31, 2010. There were no purchases made by or on behalf of us of our common stock during the fourth quarter of 2010.
13
Table of Contents
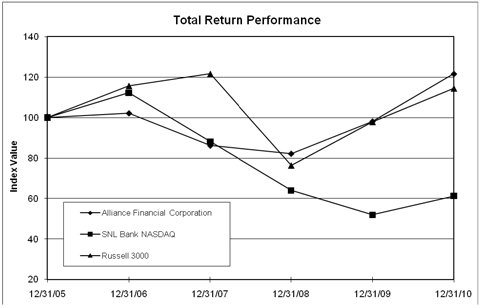
Stock Performance Graph
The graph below matches our cumulative 5-year total shareholder return on common stock with the cumulative total returns of the Russell 3000 index and the SNL Bank NASDAQ index. The graph tracks the performance of a $100 investment in our common stock and in each of the indexes (with the reinvestment of all dividends) from 12/31/2005 to 12/31/2010.
| Period Ending | ||||||||||||||||||||||||
| Index | 12/31/05 | 12/31/06 | 12/31/07 | 12/31/08 | 12/31/09 | 12/31/10 | ||||||||||||||||||
| Alliance Financial Corporation |
100.00 | 102.20 | 86.28 | 82.23 | 98.20 | 121.65 | ||||||||||||||||||
| SNL Bank NASDAQ |
100.00 | 112.27 | 88.14 | 64.01 | 51.93 | 61.26 | ||||||||||||||||||
| Russell 3000 |
100.00 | 115.71 | 121.66 | 76.27 | 97.89 | 114.46 | ||||||||||||||||||
14
Table of Contents
Item 6. Selected Financial Data
The summary information presented below at or for each of the years presented is derived in part from our consolidated financial statements. The following information is only a summary, and you should read it in conjunction with our consolidated financial statements and notes beginning on page 40.
| Year ended December 31, | ||||||||||||||||||||
| 2010 | 2009 | 2008 | 2007 | 2006 | ||||||||||||||||
| Selected Financial Condition Data | (In thousands) | |||||||||||||||||||
| Total assets |
$1,454,622 | $1,417,244 | $1,367,358 | $1,307,014 | $1,272,967 | |||||||||||||||
| Loans & leases, net of unearned income |
898,537 | 914,162 | 910,755 | 895,533 | 881,411 | |||||||||||||||
| Allowance for credit losses |
10,683 | 9,414 | 9,161 | 8,426 | 7,029 | |||||||||||||||
| Securities available-for-sale |
414,410 | 362,158 | 310,993 | 282,220 | 261,987 | |||||||||||||||
| Goodwill |
30,844 | 32,073 | 32,073 | 32,187 | 33,456 | |||||||||||||||
| Intangible assets, net |
8,638 | 10,075 | 11,528 | 13,183 | 14,912 | |||||||||||||||
| Deposits |
1,134,598 | 1,075,671 | 937,882 | 945,230 | 936,671 | |||||||||||||||
| Borrowings |
142,792 | 172,707 | 238,972 | 200,757 | 178,575 | |||||||||||||||
| Junior subordinated obligations |
25,774 | 25,774 | 25,774 | 25,774 | 25,774 | |||||||||||||||
| Shareholders’ equity |
133,131 | 123,935 | 144,481 | 115,560 | 109,506 | |||||||||||||||
| Common shareholders’ equity |
133,131 | 123,935 | 117,563 | 115,560 | 109,506 | |||||||||||||||
| Investment assets under management (Market value, not included in total assets) |
$829,426 | $786,302 | $ 726,019 | $ 971,078 | $ 927,674 | |||||||||||||||
| Year ended December 31, | ||||||||||||||||||||
| 2010 | 2009 | 2008 | 2007 | 2006 | ||||||||||||||||
| (In thousands, except share and per share data) | ||||||||||||||||||||
| Selected Operating Data |
||||||||||||||||||||
| Interest income |
$ 60,342 | $ 63,962 | $ 67,964 | $ 71,032 | $ 57,673 | |||||||||||||||
| Interest expense |
16,053 | 20,581 | 30,267 | 38,550 | 29,951 | |||||||||||||||
| Net interest income |
44,289 | 43,381 | 37,697 | 32,482 | 27,722 | |||||||||||||||
| Provision for credit losses |
4,085 | 6,100 | 5,502 | 3,790 | 2,477 | |||||||||||||||
| Net interest income after provision for credit losses |
40,204 | 37,281 | 32,195 | 28,692 | 25,245 | |||||||||||||||
| Non-interest income |
20,505 | 20,811 | 20,360 | 21,292 | 17,714 | |||||||||||||||
| Total operating income |
60,709 | 58,092 | 52,555 | 49,984 | 42,959 | |||||||||||||||
| Non-interest expense |
44,480 | 43,208 | 39,378 | 37,638 | 33,886 | |||||||||||||||
| Income before taxes |
16,229 | 14,884 | 13,177 | 12,346 | 9,073 | |||||||||||||||
| Income tax expense |
4,605 | 3,436 | 2,820 | 2,869 | 1,762 | |||||||||||||||
| Net income |
$ 11,624 | $ 11,448 | $ 10,357 | $ 9,477 | $ 7,311 | |||||||||||||||
| Dividends and accretion of discount on preferred stock |
— | 1,084 | 47 | — | — | |||||||||||||||
| Net income available to common shareholders |
$ 11,624 | $ 10,364 | $ 10,310 | $9,477 | $7,311 | |||||||||||||||
| Stock and Per Share Data |
||||||||||||||||||||
| Basic earnings per common share |
$ 2.49 | $ 2.25 | $ 2.23 | $ 1.98 | $ 1.89 | |||||||||||||||
| Diluted earnings per common share |
$ 2.48 | $ 2.24 | $ 2.21 | $ 1.96 | $ 1.87 | |||||||||||||||
| Basic weighted average common shares outstanding |
4,619,718 | 4,514,268 | 4,542,957 | 4,710,530 | 3,799,626 | |||||||||||||||
| Diluted weighted average common shares outstanding |
4,640,096 | 4,543,069 | 4,565,709 | 4,754,045 | 3,855,386 | |||||||||||||||
| Cash dividends declared |
$ 1.16 | $ 1.08 | $ 1.00 | $ 0.90 | $ 0.88 | |||||||||||||||
| Dividend payout ratio(1) |
46.8% | 48.2% | 44.6% | 45.5% | 46.8% | |||||||||||||||
| Common book value |
$ 28.15 | $ 26.86 | $ 25.67 | $ 24.53 | $ 22.81 | |||||||||||||||
| Tangible common book value(2) |
$ 19.80 | $ 17.72 | $ 16.15 | $ 14.90 | $ 12.74 | |||||||||||||||
15
Table of Contents
| Year ended December 31, | ||||||||||||||||||||
| Selected Financial and Other Data(3) |
2010 | 2009 | 2008 | 2007 | 2006 | |||||||||||||||
| Performance Ratios |
||||||||||||||||||||
| Return on average assets |
0.81% | 0.81% | 0.78% | 0.74% | 0.69% | |||||||||||||||
| Return on average equity |
9.17% | 8.68% | 8.77% | 8.48% | 9.40% | |||||||||||||||
| Return on average common equity |
9.17% | 8.46% | 8.80% | 8.48% | 9.40% | |||||||||||||||
| Return on average tangible common equity |
13.64% | 13.02% | 14.19% | 14.77% | 11.28% | |||||||||||||||
| Non-interest income to total income(4) |
30.44% | 30.06% | 34.86% | 39.29% | 38.99% | |||||||||||||||
| Efficiency ratio(5) |
69.86% | 69.66% | 68.04% | 70.35% | 74.58% | |||||||||||||||
| Rate/Yield Information |
||||||||||||||||||||
| Yield on interest-earning assets (tax equivalent) |
4.78% | 5.15% | 5.88% | 6.36% | 6.06% | |||||||||||||||
| Cost of interest-bearing liabilities |
1.42% | 1.85% | 2.87% | 3.78% | 3.46% | |||||||||||||||
| Net interest rate spread |
3.36% | 3.30% | 3.01% | 2.58% | 2.60% | |||||||||||||||
| Net interest margin (tax equivalent)(6) |
3.55% | 3.55% | 3.35% | 3.02% | 3.02% | |||||||||||||||
| At or for the Year Ended December 31, | ||||||||||||||||||||
| 2010 | 2009 | 2008 | 2007 | 2006 | ||||||||||||||||
| Asset Quality Ratios |
||||||||||||||||||||
| Non-performing loans and leases to total loans and leases |
0.95% | 0.94% | 0.49% | 0.75% | 0.30% | |||||||||||||||
| Non-performing assets to total assets |
0.63% | 0.64% | 0.38% | 0.53% | 0.21% | |||||||||||||||
| Allowance for credit losses to non-performing loans and leases |
125.8% | 109.7% | 204.6% | 125.7% | 266.4% | |||||||||||||||
| Allowance for credit losses to total loans and leases |
1.19% | 1.03% | 1.01% | 0.94% | 0.80% | |||||||||||||||
| Net charge-offs to average loans and leases |
0.31% | 0.63% | 0.53% | 0.27% | 0.23% | |||||||||||||||
| Equity Ratios |
||||||||||||||||||||
| Total common shareholders’ equity to total assets |
9.15% | 8.74% | 8.60% | 8.84% | 8.60% | |||||||||||||||
| Tangible common equity to tangible assets(8) |
6.62% | 5.95% | 5.59% | 5.56% | 4.99% | |||||||||||||||
| Regulatory Ratios |
||||||||||||||||||||
| Consolidated: |
||||||||||||||||||||
| Tier 1 (core) capital |
8.28% | 7.55% | 9.59% | 7.53% | 7.53% | |||||||||||||||
| Tier 1 risk-based capital |
13.43% | 12.07% | 14.05% | 10.64% | 10.42% | |||||||||||||||
| Tier 1 risk based common capital(7) |
10.56% | 9.22% | 11.24% | 8.76% | 8.39% | |||||||||||||||
| Total risk-based capital |
14.65% | 13.14% | 15.08% | 11.59% | 11.26% | |||||||||||||||
| Bank: |
||||||||||||||||||||
| Tier 1 (core) capital |
7.72% | 7.14% | 8.97% | 7.26% | 7.00% | |||||||||||||||
| Tier 1 risk-based capital |
12.56% | 11.47% | 13.15% | 10.34% | 9.65% | |||||||||||||||
| Total risk-based capital |
13.79% | 12.55% | 14.19% | 11.30% | 10.48% | |||||||||||||||
| (1) | Cash dividends declared per share divided by diluted earnings per share |
| (2) | Common shareholders’ equity less goodwill and intangible assets divided by common shares outstanding |
| (3) | Averages presented are daily averages |
| (4) | Non-interest income (net of realized gains and losses on securities and non-recurring items) divided by the sum of net interest income and non-interest income (net of realized gains and losses on securities and non-recurring items) |
| (5) | Non-interest expense divided by the sum of net interest income and non-interest income (net of realized gains and losses on securities and non-recurring items) |
| (6) | Tax equivalent net interest income divided by average interest-earning assets |
| (7) | Tier 1 capital excluding junior subordinated obligations issued to unconsolidated trusts divided by total risk-adjusted assets |
| (8) | We use certain non-GAAP financial measures, such as the Tangible Common Equity to Tangible Assets ratio (TCE), to provide information for investors to effectively analyze financial trends of ongoing business activities, and to enhance comparability with peers across the financial sector. We believe TCE is useful because it is a measure utilized by regulators, market analysts and investors in evaluating a company’s financial condition and capital strength. TCE, as defined by us, represents common equity less goodwill and intangible assets. A reconciliation from our GAAP Total Equity to Total Assets ratio to the Non-GAAP Tangible Common Equity to Tangible Assets ratio is presented below (dollars in thousands): |
16
Table of Contents
| Year ended December 31, | ||||||||||||||||||||
| 2010 | 2009 | 2008 | 2007 | 2006 | ||||||||||||||||
| Total assets |
$ | 1,454,622 | $ | 1,417,244 | $ | 1,367,358 | $ | 1,307,014 | $ | 1,272,967 | ||||||||||
| Less: Goodwill and intangible assets, net |
39,482 | 42,148 | 43,601 | 45,370 | 48,368 | |||||||||||||||
| Tangible assets (non-GAAP) |
1,415,140 | 1,375,096 | 1,323,757 | 1,261,644 | 1,224,599 | |||||||||||||||
| Total Common Equity |
133,131 | 123,935 | 117,563 | 115,560 | 109,506 | |||||||||||||||
| Less: Goodwill and intangible assets, net |
39,482 | 42,148 | 43,601 | 45,370 | 48,368 | |||||||||||||||
| Tangible Common Equity (non-GAAP) |
93,649 | 81,787 | 73,962 | 70,190 | 61,138 | |||||||||||||||
| Total Equity/Total Assets |
9.15% | 8.74% | 8.60% | 8.84% | 8.60% | |||||||||||||||
| Tangible Common Equity/Tangible Assets (non-GAAP) |
6.62% | 5.95% | 5.59% | 5.56% | 4.99% | |||||||||||||||
17
Table of Contents
Summarized quarterly financial information for the years ended December 31, 2010 and 2009 is as follows:
| Year ended | Three months ended | |||||||||||||||||||
| 12/31/10 | 12/31/10 | 9/30/10 | 6/30/10 | 3/31/10 | ||||||||||||||||
| (Dollars in thousands, except share and per share data) | ||||||||||||||||||||
| Total interest income |
$60,342 | $14,406 | $15,102 | $15,378 | $15,456 | |||||||||||||||
| Total interest expense |
16,053 | 3,588 | 3,942 | 4,188 | 4,335 | |||||||||||||||
| Net interest income |
44,289 | 10,818 | 11,160 | 11,190 | 11,121 | |||||||||||||||
| Provision for credit losses |
4,085 | 800 | 1,095 | 1,095 | 1,095 | |||||||||||||||
| Non-interest income |
20,505 | 5,946 | 5,139 | 4,859 | 4,561 | |||||||||||||||
| Non-interest expense |
44,480 | 11,346 | 11,210 | 10,963 | 10,961 | |||||||||||||||
| Income before income taxes |
16,229 | 4,618 | 3,994 | 3,991 | 3,626 | |||||||||||||||
| Income tax expense |
4,605 | 1,825 | 904 | 999 | 877 | |||||||||||||||
| Net Income |
$11,624 | $ 2,793 | $ 3,090 | $ 2,992 | $ 2,749 | |||||||||||||||
| Net Income available to common shareholders |
$11,624 | $ 2,793 | $ 3,090 | $ 2,992 | $ 2,749 | |||||||||||||||
| Basic earnings per share |
$ 2.49 | $ 0.59 | $ 0.66 | $ 0.64 | $ 0.59 | |||||||||||||||
| Diluted earnings per share |
$ 2.48 | $ 0.59 | $ 0.66 | $ 0.64 | $ 0.59 | |||||||||||||||
| Basic weighted average shares outstanding |
4,619,718 | 4,646,934 | 4,624,819 | 4,622,660 | 4,583,617 | |||||||||||||||
| Diluted weighted average shares outstanding |
4,640,097 | 4,660,463 | 4,646,889 | 4,643,679 | 4,614,060 | |||||||||||||||
| Cash dividends declared per share |
$ 1.16 | $ 0.30 | $ 0.30 | $ 0.28 | $ 0.28 | |||||||||||||||
| Net interest margin (tax equivalent) |
3.55% | 3.45% | 3.57% | 3.56% | 3.61% | |||||||||||||||
| Return on average assets |
0.81% | 0.77% | 0.86% | 0.83% | 0.77% | |||||||||||||||
| Return on average equity |
9.17% | 8.59% | 9.57% | 9.62% | 8.93% | |||||||||||||||
| Return on average common equity |
9.17% | 8.59% | 9.57% | 9.62% | 8.93% | |||||||||||||||
| Return on average tangible common equity |
13.64% | 12.51% | 14.09% | 14.48% | 13.55% | |||||||||||||||
| Non-interest income to total income |
30.44% | 32.17% | 30.21% | 30.28% | 29.08% | |||||||||||||||
| Efficiency ratio |
69.86% | 71.14% | 70.10% | 68.31% | 69.90% | |||||||||||||||
| Year ended | Three months ended | |||||||||||||||||||
| 12/31/09 | 12/31/09 | 9/30/09 | 6/30/09 | 3/31/09 | ||||||||||||||||
| (Dollars in thousands, except share and per share data) | ||||||||||||||||||||
| Total interest income |
$63,962 | $16,069 | $16,129 | $15,875 | $15,889 | |||||||||||||||
| Total interest expense |
20,581 | 4,585 | 4,899 | 5,253 | 5,844 | |||||||||||||||
| Net interest income |
43,381 | 11,484 | 11,230 | 10,622 | 10,045 | |||||||||||||||
| Provision for credit losses |
6,100 | 1,425 | 1,125 | 1,800 | 1,750 | |||||||||||||||
| Non-interest income |
20,811 | 5,923 | 4,762 | 4,766 | 5,360 | |||||||||||||||
| Non-interest expense |
43,208 | 11,342 | 10,900 | 10,899 | 10,067 | |||||||||||||||
| Income before income taxes |
14,884 | 4,640 | 3,967 | 2,689 | 3,588 | |||||||||||||||
| Income tax expense |
3,436 | 1,143 | 1,009 | 653 | 631 | |||||||||||||||
| Net Income |
$11,448 | $ 3,497 | $ 2,958 | $ 2,036 | $ 2,957 | |||||||||||||||
| Dividends and accretion of discount on preferred stock |
1,084 | — | — | 726 | 358 | |||||||||||||||
| Net Income available to common shareholders |
$10,364 | $ 3,497 | $ 2,958 | $ 1,310 | $ 2,599 | |||||||||||||||
| Basic earnings per share |
$ 2.25 | $ 0.76 | $ 0.64 | $ 0.29 | $ 0.57 | |||||||||||||||
| Diluted earnings per share |
$ 2.24 | $ 0.75 | $ 0.64 | $ 0.28 | $ 0.57 | |||||||||||||||
| Basic weighted average shares outstanding |
4,514,268 | 4,546,819 | 4,521,331 | 4,495,439 | 4,492,810 | |||||||||||||||
| Diluted weighted average shares outstanding |
4,543,069 | 4,585,800 | 4,563,168 | 4,518,827 | 4,495,787 | |||||||||||||||
| Cash dividends declared per share |
$ 1.08 | $ 0.28 | $ 0.28 | $ 0.26 | $ 0.26 | |||||||||||||||
| Net interest margin (tax equivalent) |
3.55% | 3.68% | 3.62% | 3.50% | 3.42% | |||||||||||||||
| Return on average assets |
0.81% | 0.97% | 0.82% | 0.58% | 0.86% | |||||||||||||||
| Return on average equity |
8.68% | 11.13% | 9.68% | 5.82% | 8.07% | |||||||||||||||
| Return on average common equity |
8.46% | 11.13% | 9.68% | 4.33% | 8.69% | |||||||||||||||
| Return on average tangible common equity |
13.02% | 16.76% | 14.85% | 6.71% | 13.65% | |||||||||||||||
| Non-interest income to total income |
30.06% | 29.35% | 29.78% | 30.97% | 30.19% | |||||||||||||||
| Efficiency ratio |
69.66% | 69.77% | 68.17% | 70.83% | 69.96% | |||||||||||||||
18
Table of Contents
Item 7. Management’s Discussion and Analysis of Financial Condition and Results of Operations
2010 Highlights and Overview
Our results of operations are dependent primarily on net interest income, which is the difference between the income earned on our loans and leases and securities and our cost of funds, consisting of the interest paid on deposits and borrowings. Results of operations are also affected by the provision for credit losses, securities and loan sale activities, loan servicing activities, service charges and fees collected on our deposit accounts, income collected from trust and investment advisory services and the income earned on our investment in bank-owned life insurance. Our expenses primarily consist of salaries and employee benefits, occupancy and equipment expense, marketing expense, professional services, technology expense, amortization of intangible assets, other expense and income tax expense. Results of operations are also significantly affected by general economic and competitive conditions, particularly changes in interest rates, inflation, government policies and the actions of regulatory authorities.
The following is a summary of key financial results for the year ended December 31, 2010:
| • | At December 31, 2010, total assets were $1.5 billion and total deposits were $1.1 billion. |
| • | Net income was $11.6 million in 2010, compared to $11.4 million in 2009. |
| • | Net income available to common shareholders was $11.6 million in 2010, compared to $10.4 million in 2009. |
| • | Net income per diluted common share was $2.48 in 2010, compared with $2.24 in 2009. Preferred dividends and the accretion of the discount on preferred stock issued under the U.S. Department of the Treasury’s Capital Purchase Program was $0.24 per diluted share in 2009. The Company redeemed the preferred stock in May 2009. |
| • | The tax-equivalent net interest margin was 3.55% in 2010 and 2009. |
| • | Provision for credit losses was $4.1 million in 2010, compared to $6.1 million in 2009. |
| • | Total non-performing assets were $9.1 million or 0.63% of total assets at December 31, 2010 compared with $9.0 million or 0.64% at December 31, 2009. |
| • | Non-interest income, excluding securities gains, was 30.4% of total revenue in 2010 compared with 30.1% in 2009. |
| • | Our efficiency ratio was 69.9% in 2010 compared with 69.7% in 2009. |
The following discussion is intended to assist in understanding our financial condition and results of operations. This discussion should be read in conjunction with our consolidated financial statements and accompanying notes contained elsewhere in this report.
19
Table of Contents
Average Balance Sheet
The following table sets forth information concerning average interest-earning assets and interest-bearing liabilities and the yields and rates thereon. Interest income and yield information is adjusted for items exempt from federal income taxes and assumes a 34% tax rate. Non-accrual loans have been included in the average balances. Securities are shown at average amortized cost.
| Years ended December 31, | ||||||||||||||||||||||||||||||||||||
| 2010 |
2009 |
2008 |
||||||||||||||||||||||||||||||||||
| Avg. Balance |
Amt. of |
Avg. Yield/ Rate |
Avg. Balance |
Amt. of |
Avg. Yield/ Rate |
Avg. Balance |
Amt. of Interest |
Avg. Yield/ Rate |
||||||||||||||||||||||||||||
| (Dollars in thousands) | ||||||||||||||||||||||||||||||||||||
| Assets: |
||||||||||||||||||||||||||||||||||||
| Interest-earning assets: |
||||||||||||||||||||||||||||||||||||
| Federal funds sold |
$ 8,823 | $ 8 | 0.10% | $ 13,084 | $ 15 | 0.11% | $ 4,856 | $ 100 | 2.06% | |||||||||||||||||||||||||||
| Taxable investment securities |
314,271 | 10,795 | 3.43% | 256,494 | 10,143 | 3.95% | 189,164 | 8,796 | 4.65% | |||||||||||||||||||||||||||
| Nontaxable investment securities |
74,456 | 4,352 | 5.84% | 85,173 | 5,172 | 6.07% | 88,667 | 5,420 | 6.11% | |||||||||||||||||||||||||||
| FHLB and FRB stock |
9,005 | 499 | 5.54% | 10,875 | 558 | 5.13% | 11,063 | 634 | 5.73% | |||||||||||||||||||||||||||
| Residential real estate loans |
351,922 | 18,731 | 5.32% | 344,707 | 19,087 | 5.54% | 294,829 | 17,442 | 5.92% | |||||||||||||||||||||||||||
| Commercial loans |
209,574 | 11,084 | 5.29% | 202,020 | 11,221 | 5.55% | 207,931 | 14,068 | 6.77% | |||||||||||||||||||||||||||
| Non-taxable commercial loans |
8,639 | 478 | 5.53% | 9,449 | 570 | 6.03% | 8,618 | 565 | 6.56% | |||||||||||||||||||||||||||
| Taxable leases (net of unearned income) |
39,978 | 2,384 | 5.96% | 68,334 | 4,068 | 5.95% | 103,726 | 6,436 | 6.20% | |||||||||||||||||||||||||||
| Nontaxable leases (net of unearned income) |
13,908 | 900 | 6.47% | 16,472 | 1,069 | 6.49% | 16,284 | 1,020 | 6.26% | |||||||||||||||||||||||||||
| Indirect auto loans |
182,085 | 9,194 | 5.05% | 187,919 | 10,339 | 5.50% | 179,762 | 10,180 | 5.66% | |||||||||||||||||||||||||||
| Consumer loans |
91,389 | 3,865 | 4.23% | 91,387 | 4,036 | 4.42% | 90,675 | 5,685 | 6.27% | |||||||||||||||||||||||||||
| Total interest-earning assets |
1,304,050 | 62,290 | 4.78% | 1,285,914 | 66,278 | 5.15% | 1,195,575 | 70,346 | 5.88% | |||||||||||||||||||||||||||
| Non-interest-earning assets: |
||||||||||||||||||||||||||||||||||||
| Other assets |
137,803 | 136,512 | 133,780 | |||||||||||||||||||||||||||||||||
| Allowance for credit losses |
(10,370) | (9,990) | (8,686) | |||||||||||||||||||||||||||||||||
| Net unrealized gains on available-for-sale securities |
9,610 | 6,912 | 1,867 | |||||||||||||||||||||||||||||||||
| Total |
$1,441,093 | $1,419,348 | $1,322,536 | |||||||||||||||||||||||||||||||||
| Liabilities & Shareholders’ Equity: |
||||||||||||||||||||||||||||||||||||
| Demand deposits |
$ 141,124 | $ 490 | 0.35% | $ 117,113 | $ 531 | 0.45% | $ 107,204 | $ 733 | 0.68% | |||||||||||||||||||||||||||
| Savings deposits |
99,799 | 377 | 0.38% | 92,114 | 454 | 0.49% | 86,239 | 492 | 0.57% | |||||||||||||||||||||||||||
| MMDA deposits |
357,572 | 2,675 | 0.75% | 303,344 | 3,347 | 1.10% | 225,590 | 4,732 | 2.10% | |||||||||||||||||||||||||||
| Time deposits |
359,532 | 7,216 | 2.01% | 382,420 | 9,622 | 2.52% | 385,275 | 15,277 | 3.97% | |||||||||||||||||||||||||||
| Total interest-bearing deposits |
958,027 | 10,758 | 1.13% | 894,991 | 13,954 | 1.56% | 804,308 | 21,234 | 2.64% | |||||||||||||||||||||||||||
| Borrowings |
146,296 | 4,650 | 3.18% | 193,648 | 5,819 | 3.01% | 223,230 | 7,634 | 3.42% | |||||||||||||||||||||||||||
| Junior subordinated obligations issued to unconsolidated subsidiary trusts |
25,774 | 645 | 2.50% | 25,774 | 808 | 3.13% | 25,774 | 1,399 | 5.43% | |||||||||||||||||||||||||||
| Total interest-bearing liabilities |
1,130,097 | 16,053 | 1.42% | 1,114,413 | 20,581 | 1.85% | 1,053,312 | 30,267 | 2.87% | |||||||||||||||||||||||||||
| Non-interest-bearing liabilities: |
||||||||||||||||||||||||||||||||||||
| Demand deposits |
167,912 | 156,396 | 133,997 | |||||||||||||||||||||||||||||||||
| Other liabilities |
16,383 | 16,685 | 17,138 | |||||||||||||||||||||||||||||||||
| Shareholders’ equity |
126,701 | 131,854 | 118,089 | |||||||||||||||||||||||||||||||||
| Total |
$1,441,093 | $1,419,348 | $1,322,536 | |||||||||||||||||||||||||||||||||
| Net interest income (tax equivalent) |
$46,237 | $45,697 | $40,079 | |||||||||||||||||||||||||||||||||
| Net interest rate spread |
3.36% | 3.30% | 3.01% | |||||||||||||||||||||||||||||||||
| Net interest margin (tax equivalent) |
3.55% | 3.55% | 3.35% | |||||||||||||||||||||||||||||||||
| Federal tax exemption on nontaxable investment securities, loans and leases included in interest income |
1,948 | 2,316 | 2,382 | |||||||||||||||||||||||||||||||||
| Net interest income |
$44,289 | $43,381 | $37,697 | |||||||||||||||||||||||||||||||||
20
Table of Contents
Rate/Volume Analysis
The following table sets forth the dollar volume of increase (decrease) in interest income and interest expense resulting from changes in the volume of interest-earning assets and interest-bearing liabilities, and from changes in rates. Volume changes are computed by multiplying the volume difference by the prior year’s rate. Rate changes are computed by multiplying the rate difference by the prior year’s volume. The change in interest due to both rate and volume has been allocated proportionally between the volume and rate variances.
| 2010 Compared to
2009 Increase (decrease) due to |
2009 Compared to
2008 Increase (decrease) due to |
|||||||||||||||||||||||
| Volume | Rate | Net Change |
Volume | Rate | Net Change |
|||||||||||||||||||
| (In thousands) | ||||||||||||||||||||||||
| Federal funds sold |
$ (5) | $ (2) | $ (7) | $ 67 | $ (152) | $ (85) | ||||||||||||||||||
| Taxable investment securities |
2,095 | (1,443) | 652 | 2,808 | (1,461) | 1,347 | ||||||||||||||||||
| Non-taxable investment securities |
(630) | (190) | (820) | (213) | (35) | (248) | ||||||||||||||||||
| FHLB and FRB stock |
(101) | 42 | (59) | (11) | (65) | (76) | ||||||||||||||||||
| Residential real estate loans |
401 | (757) | (356) | 2,817 | (1,172) | 1,645 | ||||||||||||||||||
| Commercial loans |
405 | (542) | (137) | (388) | (2,459) | (2,847) | ||||||||||||||||||
| Non-taxable commercial loans |
(47) | (45) | (92) | 52 | (47) | 5 | ||||||||||||||||||
| Taxable leases (net of unearned income) |
(1,691) | 7 | (1,684) | (2,114) | (254) | (2,368) | ||||||||||||||||||
| Non-taxable leases (net of unearned income) |
(166) | (3) | (169) | 12 | 37 | 49 | ||||||||||||||||||
| Indirect loans |
(315) | (830) | (1,145) | 456 | (297) | 159 | ||||||||||||||||||
| Consumer loans |
— | (171) | (171) | 44 | (1,693) | (1,649) | ||||||||||||||||||
| Total interest-earning assets |
$ (54) | $(3,934) | $(3,988) | $3,530 | $(7,598) | $(4,068) | ||||||||||||||||||
| Interest-bearing demand deposits |
93 | (134) | (41) | 64 | (266) | (202) | ||||||||||||||||||
| Savings deposits |
34 | (111) | (77) | 33 | (71) | (38) | ||||||||||||||||||
| MMDA deposits |
522 | (1,194) | (672) | 1,309 | (2,694) | (1,385) | ||||||||||||||||||
| Time deposits |
(549) | (1,857) | (2,406) | (113) | (5,542) | (5,655) | ||||||||||||||||||
| Borrowings |
(1,485) | 316 | (1,169) | (953) | (862) | (1,815) | ||||||||||||||||||
| Junior subordinated obligations issued to unconsolidated subsidiary trusts |
— | (163) | (163) | — | (591) | (591) | ||||||||||||||||||
| Total interest-bearing liabilities |
$(1,385) | $(3,143) | $(4,528) | $ 340 | $(10,026) | $(9,686) | ||||||||||||||||||
| Net interest income (tax equivalent) |
$ 1,331 | $ (791) | $ 540 | $3,190 | $ 2,428 | $ 5,618 | ||||||||||||||||||
Comparison of Operating Results for the Years Ended December 31, 2010 and 2009
General
Net income was $11.6 million for the year ended December 31, 2010, compared with $11.4 million in 2009. Net income available to common shareholders was $11.6 million or $2.48 per diluted share in 2010, compared with $10.4 million or $2.24 per diluted share in 2009. Preferred dividends and the accretion of the discount on preferred stock issued under the U.S. Department of the Treasury’s Capital Purchase Program was $1.1 million or $0.24 per diluted share in 2009. The Company redeemed the preferred stock in May 2009.
Net Interest Income
Net interest income totaled $44.3 million in 2010, which was an increase of $908,000 or 2.1% compared with $43.4 million in 2009. Average interest-earning assets increased $18.1 million in 2010 compared with 2009, with a $47.1 million increase in securities offsetting a $22.8 million decrease in loans and leases. The tax-equivalent net interest margin was 3.55% in 2010 and 2009. The tax-equivalent yield on interest-earning assets decreased 37 basis points in 2010 compared to 2009, which was offset by a 43 basis point decrease in our cost of interest-bearing liabilities over the same period. The tax-equivalent yield on our interest-earning assets was 4.78% in 2010, compared to 5.15% in 2009. Our cost of interest-bearing liabilities was 1.42% in 2010, compared to 1.85% in 2009.
Between September 2007 and December 2008, the Federal Reserve reduced its target fed funds rate from 5.25% to between zero and 0.25%, where the target rate remains. The Federal Reserve’s monetary policy, volatility in equity markets, economic recession and federal government economic stimulus efforts, among other factors, have caused yields on U.S. Treasury securities to drop to exceptionally low levels throughout much of the past three years. This persistently low interest
21
Table of Contents
rate environment has caused an ongoing decline over the past three years in the returns on our interest-earning assets, consistent with much of the financial industry. Yields on our securities portfolio and on our commercial loans and consumer loans were most affected by the low interest rate environment, due to the significant annual amortization in these portfolios as a result of their relatively shorter duration. Also, our commercial loan and consumer loan portfolios are more sensitive to changes in interest rates due to the variable rate characteristics of a portion of these portfolios. The tax-equivalent yield on our securities portfolio decreased 58 basis points in 2010 compared to 2009. The yield on our commercial loans and consumer (including indirect) loans decreased 26 basis points and 37 basis points, respectively, in 2010.
Changes in our asset mix also contributed to the decline in the interest-earning assets yield in 2010, as securities comprised a larger portion of our earning assets in 2010 as compared to 2009 due to difficulty in growing our loan portfolio as the result of the difficult economic and credit market conditions. The yields on the securities we hold are typically lower than the yields on our loans and leases. Securities comprised 29.8% of average interest-earning assets in 2010, compared with 26.6% in 2009.
The cost of our interest-bearing liabilities decreased in 2010 due to a combination of the low interest rate environment, our deposit pricing strategies and a favorable change in the mix of our interest-bearing liabilities, with lower-cost interest-bearing transaction accounts (savings, demand and money market) comprising a larger portion of our interest-bearing liabilities in 2010. The average balance of interest-bearing transaction accounts increased $85.9 million or 16.8% in 2010. The average cost of money market and time deposits dropped 35 basis points and 51 basis points, respectively in 2010.
Our liability mix changed favorably during 2010 as we continued to focus on increasing our transaction account balances and as we refrained from offering premium rates on time accounts. Our effort to increase our transaction account balances has been enhanced by retail and municipal depositor’s reluctance to lock up funds in time accounts at what are very low, yet competitive rates, and to the buildup of cash on corporate customers’ balance sheets. The aggregate average balance of transaction accounts (including non-interest bearing demand deposits) was $766.4 million in 2010, which was an increase of $97.4 million or 14.6% from the aggregate average balances of $669.0 million in 2009. Average transaction account balances comprised 68.1% of total average deposits in 2010, compared with 63.6% in 2009. Average time account balances in 2010 were $359.5 million or 31.9% of total average deposits in 2010, compared with $382.4 million or 36.4% in 2009. Our ability to gather transaction deposits over the past year has been greatly enhanced by our strong financial position and earnings performance, enhanced product offerings including upgraded treasury management and internet banking platforms, and a high positive awareness of our brand and by environmental factors such as equity market volatility and risk aversion among retail investors.
Our tax-equivalent net interest margin declined over the course of 2010 as decreases in the cost of our interest-bearing liabilities did not keep pace with declines in the yield on our interest-earning assets. Our tax-equivalent net interest margin was 3.45% in the fourth quarter of 2010, compared with 3.61% in the first quarter of the year. We expect our net interest margin to compress further in coming quarters as the persistently low interest rate environment continues to negatively affect the return on our loans and investments at a rate that is likely to be greater than the potential reduction we may be able to achieve in our cost of our funds.
Non-Interest Income
Our non-interest income is comprised of service charges on deposits, fees from investment management and brokerage services, mortgage banking operations that include gains from sales and income from servicing, and other recurring operating income fees from normal banking operations, along with non-core components that primarily consist of net gains or losses from sales of investment securities.
The following table sets forth certain information on non-interest income for the years indicated:
| Years ended December 31, | ||||||||||||||||
| 2010 | 2009 | Change | ||||||||||||||
| (In thousands) | ||||||||||||||||
| Investment management income |
$ 7,316 | $ 7,134 | $182 | 2.6% | ||||||||||||
| Service charges on deposit accounts |
4,509 | 5,037 | (528) | (10.5)% | ||||||||||||
| Card-related fees |
2,563 | 2,248 | 315 | 14.0% | ||||||||||||
| Insurance agency income |
1,283 | 1,387 | (104) | (7.5)% | ||||||||||||
| Income from bank-owned life insurance |
1,058 | 1,014 | 44 | 4.3% | ||||||||||||
| Gain on sale of loans |
1,394 | 748 | 646 | 86.4% | ||||||||||||
| Gains on sale of securities available-for-sale |
308 | 2,168 | (1,860) | (85.8)% | ||||||||||||
| Other non-interest income |
2,074 | 1,075 | 999 | 92.9% | ||||||||||||
| Total non-interest income |
$20,505 | $20,811 | $(306) | (1.5)% | ||||||||||||
22
Table of Contents
Non-interest income decreased $306,000 or 1.5% to $20.5 million in 2010. Service charges on deposit accounts decreased $528,000 or 10.5% primarily due to the impact of a new regulation covering overdraft protection programs, which took effect in the third quarter. Gains on sales of loans increased $646,000 or 86.4% as a result of a higher volume of residential mortgage sales in 2010. We sold a larger portion of our originations in 2010 in connection with our balance sheet management activities.
Gains on sales of investment securities decreased $1.9 million or 85.8% on a sharply lower volume of sales in 2010.
In December 2010, we sold substantially all of the assets of our insurance agency subsidiary, Ladd’s Inc. and discontinued its operations. The discontinuation of Ladd’s operations will have no material net effect on our future financial results. A gain of $815,000 was recognized on the sale of Ladd’s and is included in other non-interest income. The gain was nearly entirely offset by taxes of $806,000 resulting from a difference in the tax basis of such assets versus the book value.
Non-interest income (excluding securities gains and gain on Ladd’s sale) comprised 30.4% of total revenue in 2010 compared with 30.1% in 2009.
Non-Interest Expenses
The following table sets forth certain information on non-interest expenses for the years indicated:
| Years ended December 31 | ||||||||||||||||
| 2010 | 2009 | Change | ||||||||||||||
| (In thousands) | ||||||||||||||||
| Salaries and employee benefits |
$22,319 | $20,428 | $ | 1,891 | 9.3% | |||||||||||
| Occupancy and equipment expenses |
7,375 | 7,047 | 328 | 4.7% | ||||||||||||
| Communication expense |
664 | 756 | (92) | (12.2)% | ||||||||||||
| Office supplies and postage expense |
1,158 | 1,337 | (179) | (13.4)% | ||||||||||||
| Marketing expense |
1,068 | 932 | 136 | 14.6% | ||||||||||||
| Amortization of intangible assets |
1,127 | 1,453 | (326) | (22.4)% | ||||||||||||
| Professional fees |
3,250 | 2,893 | 357 | 12.3% | ||||||||||||
| FDIC insurance premium |
1,601 | 2,284 | (683) | (29.9)% | ||||||||||||
| Other non-interest expense |
5,918 | 6,078 | (160) | (2.6)% | ||||||||||||
| Total non-interest expenses |
$44,480 | $43,208 | $ | 1,272 | 2.9% | |||||||||||
Non-interest expenses increased $1.3 million or 2.9% to $44.5 million in 2010. Salaries and benefits expense increased $1.9 million or 9.3% compared to 2009. Approximately $1.3 million or 67% of the increase in salaries and benefits represents incremental recurring expense from a combination of new customer service and business development positions and normal salary increases. As required under generally accepted accounting principles, the deferral of salaries and benefits expense in connection with successfully originated loans was approximately $317,000 or 17% of the increase in salaries and benefits in 2010 compared to the same period in 2009, due to substantially higher residential mortgage origination volume in 2009.
Professional fees increased $357,000 or 12.3% in 2010 due primarily to outside consulting services related to various projects. The FDIC insurance premium decreased $683,000 or 29.9% in 2010 due to a special assessment required of all FDIC-insured banks in 2009. We paid a special assessment of $676,000 in the second quarter of 2009.
Our efficiency ratio was 69.9% in 2010 compared with 69.7% in 2009.
Income Tax Expense
Our effective tax rate (excluding the gain and related tax on the Ladd’s transaction) was 24.6% in 2010 compared to 23.1% in 2009.
Comparison of Operating Results for the Years Ended December 31, 2009 and 2008
General
Net income was $11.4 million for the year ended December 31, 2009, compared with $10.4 million in 2008. Net income available to common shareholders was $10.4 million or $2.24 per diluted share in 2009, compared with $10.3 million or $2.21 per diluted share in 2008. Net income for 2009 included gains on sales of securities totaling $1.3 million after taxes or $0.29 per diluted share which offset non-recurring expenses of approximately $482,000 after taxes or $0.11 per diluted
23
Table of Contents
share. Preferred stock dividends and the accretion of the preferred stock discount were $1.1 million or $0.24 per diluted share in 2009.
Net Interest Income
Net interest income totaled $43.4 million in 2009, an increase of $5.7 million or 15.1% compared to $37.7 million in 2008. The increase in net interest income resulted from a combination of growth in interest-earning assets and a higher net interest margin. Average interest-earning assets increased $90.3 million in 2009 compared to 2008, due primarily to growth in the residential loan and securities portfolios. The tax-equivalent net interest margin was 3.55% in 2009, compared to 3.35% in 2008. The net interest margin growth in 2009 was primarily the result of our ongoing balance sheet management and deposit pricing strategies and the effects of those strategies in the low interest rate environment throughout 2009. The net interest margin increased 26 basis points during 2009, from 3.42% in the first quarter to 3.68% in the fourth quarter. The rate of growth in our net interest margin slowed in the last quarter of 2009 as interest rates on a substantial component of our interest-bearing liabilities had adjusted to the lower rates in effect during the period.
The tax-equivalent yield on interest-earning assets decreased 73 basis points in 2009 compared to 2008, which was more than offset by a 102 basis point decrease in our cost of interest-bearing liabilities over the same period. The tax-equivalent yield on our interest-earning assets was 5.15% in 2009, compared to 5.88% in 2008. Our cost of interest-bearing liabilities was 1.85% in 2009, compared to 2.87% in 2008.
As discussed previously in this Form 10-K, the significant easing of monetary policy by the Federal Reserve since September 2007, along with volatility in equity markets, economic recession and federal government monetary and economic stimulus efforts, along with other factors have contributed to a sharp decline in the yields on U.S. Treasury securities. The yields on two-year, five-year and ten-year treasury securities dropped 339 basis points, 272 basis points and 230 basis points, respectively from August 31, 2007 to December 31, 2008. Treasury yields rebounded somewhat in 2009, with yields increasing 38 basis points, 113 basis points and 159 basis points on the two-year, five-year and ten-year treasury securities, respectively from the end of 2008. The low interest rate environment during this period resulted in declining yields for all of our interest- earning assets. Yields on commercial loans and consumer loans were most affected by these conditions, with yields on these assets down 122 basis points and 185 basis points, respectively, in 2009 compared with 2008.
Changes in our asset mix also contributed to the decline in the yield on interest-earning assets in 2009, as securities and residential mortgages comprised a larger portion of our interest-earning assets in 2009 compared with 2008. The yields on these assets are typically lower than yields on commercial loans and leases. Growth in the securities and residential portfolios combined with low demand for commercial loans and the planned runoff of the equipment lease portfolio resulted in the securities and residential mortgage portfolios increasing to 53.4% of earning assets in 2009, compared to 47.9% in 2008.
Our cost of interest-bearing liabilities declined markedly in 2009 in all categories except savings accounts. The average cost of money market and time deposits dropped 100 basis points and 145 basis points, respectively in 2009 as a result of the lower rate environment and our deposit pricing strategies. Our wholesale funding costs also dropped significantly in 2009, with the average cost of our borrowings down 41 basis points.
The average cost on our junior subordinated obligations decreased 230 basis points in 2009 due to the sharp decline in the three-month Libor index to which these variable rate obligations are tied.
Our liability mix changed favorably during 2009 similar to that which occurred in 2010. The aggregate average balance of transaction accounts (including non-interest bearing demand accounts) was $669.0 million in 2009, which was an increase of $115.9 million or 21.0% from the aggregate average balances of $553.0 million in 2008. Average transaction account balances comprised 63.6% of total average deposits in 2009, compared with 58.9% in 2008. Average time account balances in 2009 were $382.4 million or 36.4% of total average deposits in 2009, compared with $385.3 million or 41.1% in 2008. Our ability to gather core transaction deposits during 2009 was greatly enhanced by our strong financial position and earnings performance, enhanced product offerings and the high positive awareness of our brand, combined with negative operating performance or other challenges experienced by certain larger competitors operating in our market.
24
Table of Contents
Non-Interest Income
The following table sets forth certain information on non-interest income for the years indicated:
| Years ended December 31, | ||||||||||||||||
| 2009 | 2008 | Change | ||||||||||||||
| (In thousands) | ||||||||||||||||
| Investment management income |
$ 7,134 | $ 8,670 | $ | (1,536) | (17.7)% | |||||||||||
| Service charges on deposit accounts |
5,037 | 5,164 | (127) | (2.5)% | ||||||||||||
| Card-related fees |
2,248 | 2,106 | 142 | 6.7% | ||||||||||||
| Insurance agency income |
1,387 | 1,583 | (196) | (12.4)% | ||||||||||||
| Income from bank-owned life insurance |
1,014 | 856 | 158 | 18.5% | ||||||||||||
| Gain on sale of loans |
748 | 252 | 496 | 196.8% | ||||||||||||
| Gains on sale of securities available-for-sale |
2,168 | 137 | 2,031 | 1482.5% | ||||||||||||
| Other non-interest income |
1,075 | 1,592 | (517) | (32.5)% | ||||||||||||
| Total non-interest income |
$20,811 | $20,360 | $ | 451 | 2.2% | |||||||||||
Total non-interest income increased $451,000 or 2.2% in 2009. A $2.0 million increase in gains on sales of securities in 2009 offset a $1.5 million decrease in investment management income and a $517,000 decrease in other non-interest income. The decrease in investment management income resulted from the sharp drop in the public equity markets in 2008 and the first quarter of 2009. Investment management income increased 4.8% in the fourth quarter of 2009 from the first quarter low due largely to a rebound in the equity markets. Other non-interest income decreased largely as the result of fewer, individually immaterial, non-recurring items in 2009.
Non-interest income (excluding securities gains) comprised 30.1% of total revenue in 2009 compared with 34.9% for 2008.
Non-Interest Expenses
The following table sets forth certain information on operating expenses for the years indicated:
| Years ended December 31 | ||||||||||||||||
| 2009 | 2008 | Change | ||||||||||||||
| (In thousands) | ||||||||||||||||
| Salaries and employee benefits |
$20,428 | $19,823 | $605 | 3.1% | ||||||||||||
| Occupancy and equipment expenses |
7,047 | 7,032 | 15 | 0.2% | ||||||||||||
| Communication expense |
756 | 791 | (35) | (4.4)% | ||||||||||||
| Office supplies and postage expense |
1,337 | 1,137 | 200 | 17.6% | ||||||||||||
| Marketing expense |
932 | 1,090 | (158) | (14.5)% | ||||||||||||
| Amortization of intangible assets |
1,453 | 1,622 | (169) | (10.4)% | ||||||||||||
| Professional fees |
2,893 | 2,661 | 232 | 8.7% | ||||||||||||
| FDIC insurance premium |
2,284 | 557 | 1,727 | 310.1% | ||||||||||||
| Other non-interest expense |
6,078 | 4,665 | 1,413 | 30.3% | ||||||||||||
| Total non-interest expenses |
$43,208 | $39,378 | $ | 3,830 | 9.7% | |||||||||||
Total non-interest expenses increased $3.8 million or 9.7% in 2009. FDIC insurance expense increased $1.7 million in 2009 compared with 2008, due in large part to a special charge assessed by the Federal Deposit Insurance Corporation to all FDIC-insured banks, and to overall higher rates charged in 2009. We paid a special assessment of $676,000 in the second quarter of 2009.
In December 2009, the FDIC enacted a proposal that required most FDIC-insured banks to prepay their projected insurance assessments for the years 2010 through 2012. In December 2009, we prepaid approximately $5.7 million of such assessments. The amount of this advance was based on a 22% increase in assessment rates and assumed our average insured deposits grow 5% annually through 2012. The prepaid assessments were capitalized as an asset and are being amortized based on the expected period in which the assessment would have been incurred.
Other non-interest expense increased $1.4 million or 30.3% due to a combination of growth related expenses, increased loan collection costs and approximately $786,000 of miscellaneous individually non-material non-recurring items in 2009.
Our efficiency ratio was 69.7% in 2009, compared with 68.0% in 2008. Excluding the $676,000 special FDIC insurance assessment, the efficiency ratio was 68.6% in 2009.
25
Table of Contents
Income Tax Expense
Our effective tax rate was 23.1% in 2009 and 21.4% in 2008. The increase in the effective tax rate in 2009 primarily reflects a decrease in the percentage of non-taxable income to pre-tax income.
Comparison of Financial Condition at December 31, 2010 and December 31, 2009
General
Total assets were $1.5 billion at December 31, 2009, an increase of $37.4 million or 2.6% from December 31, 2009. Securities available-for-sale increased $52.3 million in 2010 to $414.4 million at the end of 2010. Total loans and leases (net of unearned income) decreased $15.6 million to $898.5 million at December 31, 2010. The decrease in our loan and lease portfolio resulted from the planned and actively managed runoff of the lease portfolio and our decision to sell a large portion of our residential mortgage originations, which was substantially offset by strong commercial loan growth.
Securities
The securities portfolio is designed to provide a favorable total return utilizing low-risk, high-quality securities while at the same time assisting in meeting the liquidity needs of our loan and deposit operations, and supporting our interest rate risk objectives. Our securities portfolio is predominately comprised of investment grade mortgage-backed securities, securities issued by U.S. government sponsored corporations and municipal securities. We classify the majority of our securities as available-for-sale. We do not engage in securities trading or derivatives activities in carrying out our investment strategies.
The following table sets forth the amortized cost and market value for our available-for-sale securities portfolio:
| At December 31, | ||||||||||||||||||||||||
| 2010 | 2009 | 2008 | ||||||||||||||||||||||
| Amortized Cost |
Fair Value |
Amortized Cost |
Fair Value |
Amortized Cost |
Fair Value |
|||||||||||||||||||
| Securities available for sale: | (In thousands) | |||||||||||||||||||||||
| Debt securities: |
||||||||||||||||||||||||
| U.S. Treasury obligations |
$ — | $ — | $ 100 | $ 101 | $ 101 | $ 102 | ||||||||||||||||||
| Obligations of U.S. government-sponsored corporations |
4,020 | 4,186 | 5,864 | 6,129 | 34,489 | 35,143 | ||||||||||||||||||
| Obligations of states and political subdivisions |
77,246 | 78,212 | 75,104 | 77,147 | 89,154 | 91,033 | ||||||||||||||||||
| Mortgage-backed securities - residential |
324,294 | 329,010 | 273,499 | 275,680 | 167,753 | 169,960 | ||||||||||||||||||
| Total debt securities |
405,560 | 411,408 | 354,567 | 359,057 | $291,497 | $296,238 | ||||||||||||||||||
| Stock investments: |
||||||||||||||||||||||||
| Equity securities |
1,852 | 1,995 | 1,958 | 2,104 | 1,958 | 1,923 | ||||||||||||||||||
| Mutual funds |
1,000 | 1,007 | 1,000 | 997 | 1,000 | 988 | ||||||||||||||||||
| Total stock investments |
2,852 | 3,002 | 2,958 | 3,101 | 2,958 | 2,911 | ||||||||||||||||||
| Total available for sale |
408,412 | 414,410 | 357,525 | 362,158 | 294,455 | 299,149 | ||||||||||||||||||
| Net unrealized gains on available-for-sale securities |
5,998 | 4,633 | 4,694 | |||||||||||||||||||||
| Total carrying value |
$414,410 | $362,158 | $299,149 | |||||||||||||||||||||
We increased the size of our securities portfolio in 2010 in order to generate interest-earning asset growth to offset the decline in our loan and lease portfolio. Our securities portfolio totaled $414.4 million at December 31, 2010, compared with $362.2 million at December 31, 2009. Our portfolio is comprised entirely of investment grade securities, the majority of which are rated “AAA” by one or more of the nationally recognized rating agencies. The breakdown of our securities portfolio at December 31, 2010 was 79% guaranteed mortgage-backed securities, 19% municipal securities and 1% obligations of U.S. government sponsored corporations. Mortgage-backed securities, which totaled $329.0 million at December 31, 2010, are comprised primarily of pass-through securities backed by conventional residential mortgages and guaranteed by Fannie-Mae, Freddie-Mac or Ginnie Mae, which in turn are backed by the U.S. government. Our municipal bond portfolio, which totaled $78.2 million at the end of 2010, is comprised 99.9% of general obligation bonds issued by local municipalities and school districts in New York State. We do not invest in any securities backed by sub-prime, Alt-A or other high-risk mortgages. We also do not hold any preferred stock, corporate debt or trust preferred securities in our portfolio.
26
Table of Contents
Net unrealized gains in our securities portfolio totaled $6.0 million at December 31, 2010, compared with net unrealized gains of $4.6 million at December 31, 2009.
The following table sets forth as of December 31, 2010, the maturities and the weighted-average yields of our debt securities, which have been calculated on the basis of the amortized cost, weighted for scheduled maturity of each security, and adjusted to a fully tax-equivalent basis (in thousands):
| At December 31, 2010 | ||||||||||||||||||||
| Amount Maturing Within One Year or Less |
Amount Maturing After One Year but Within Five Years |
Amount Maturing After Five Years but Within Ten Years |
Amount Maturing After Ten Years |
Total Amortized Cost |
||||||||||||||||
| Obligations of U.S. government-sponsored corporations |
$ — | $ 4,020 | $ — | $ — | $ 4,020 | |||||||||||||||
| Obligations of states and political subdivisions |
9,514 | 27,160 | 33,017 | 7,555 | 77,246 | |||||||||||||||
| Mortgage-backed securities |
82,520 | 171,522 | 57,190 | 13,062 | 324,294 | |||||||||||||||
| Total debt securities available-for-sale |
$92,034 | $202,702 | $90,207 | $20,617 | $405,560 | |||||||||||||||
| Weighted average yield at year end (1) |
3.37% | 3.42% | 3.77% | 3.80% | 3.50% | |||||||||||||||
| (1) | Weighted average yields on the tax-exempt obligations have been computed on a fully tax-equivalent basis assuming a marginal federal tax rate of 34%. These yields are an arithmetic computation of interest income divided by average balance and may differ from the yield to maturity, which considers the time value of money. |
Loans and Leases
The loan and lease portfolio is the largest component of our interest-earning assets and it generates the greatest portion of our interest income. We provide a full range of credit products through our branch network and through our commercial lending line of business. Consistent with our focus on providing community banking services, we generally do not attempt to diversify geographically by making a significant amount of loans to borrowers outside of our primary service area. Loans are primarily internally generated and the majority of our lending activity takes place in the New York State counties of Cortland, Madison, Onondaga, Oneida, and Oswego. In addition, we originate indirect auto loans in the western counties of New York State. In connection with our ongoing strategic planning and balance sheet management processes, Alliance Leasing, Inc. ceased origination of new transactions in the third quarter of 2008. The operations of Alliance Leasing are currently limited to servicing the existing lease portfolio.
Total loans and leases, net of unearned income and deferred costs, were $898.5 million at December 31, 2010, compared with $914.2 million at December 31, 2009.
Residential mortgages totaled $335.0 million at the end of 2010, which was a decrease of $21.9 million or 6.1% from the end of 2009. Originations were strong in 2010, but lower than a year-ago largely due to slightly higher interest rates in 2010 which diminished refinancing activity. We originated $119.7 million of residential mortgages in 2010, compared to $159.1 million in 2009. Our portfolio declined slightly in 2010 as we sold a large portion of our originations on the secondary market in order to manage our overall interest rate risk position. Sales of residential mortgages totaled $66.2 million in 2010, compared with $46.2 million in 2009. Substantially all our residential mortgage originations are conventional mortgages originated in our market area. We do not originate sub-prime, Alt-A, negative amortizing or other higher risk residential mortgages.
Commercial loans and mortgages increased $41.9 million or 20.1% in 2010. The investment we made in human resources and product offerings to enhance and expand our commercial lending business late in 2009 and early 2010 contributed to a substantial increase in commercial loan originations in 2010 over the prior year. Our commercial lending business finished 2010 strongly, with originations in the fourth quarter up 104.0% over the fourth quarter of 2009 and up 96.5% over the third quarter of 2010. Commercial loan and mortgage originations for all of 2010 totaled $80.4 million, which was an increase of 55.4% over 2009’s originations of $51.7 million.
Our lease portfolio (net of unearned income) continued to amortize in 2010 as a result of our previously announced decision to cease new lease originations. Leases decreased $25.8 million or 37.8% in 2010 to $42.5 million at the end of the year. Leases are expected to continue to amortize down at a similar rate in 2011.
27
Table of Contents
Indirect auto loan balances decreased $8.8 million or 4.8% in 2010 due largely to increased rate driven competition and a resurgent role played by captive auto finance companies in the market for auto finance. We originated $79.5 million of indirect auto loans in 2010, compared with $90.9 million in 2009. We originate auto loans through a network of reputable, well-established automobile dealers located in Central and Western New York. Applications received through our indirect lending program are subject to the same comprehensive underwriting criteria and procedures as are employed in its direct lending programs. Credit quality metrics within this portfolio remain stable and compare favorably to the industry.
The following table sets forth the composition of our loan and lease portfolio at the dates indicated:
| At December 31, | ||||||||||||||||||||||||||||||||||||||||
| 2010 |
2009 |
2008 |
2007 |
2006 |
||||||||||||||||||||||||||||||||||||
| Amount |
Percent |
Amount |
Percent |
Amount |
Percent |
Amount |
Percent |
Amount |
Percent |
|||||||||||||||||||||||||||||||
| (Dollars in thousands) | ||||||||||||||||||||||||||||||||||||||||
| Residential real estate |
$ | 334,967 | 37.4% | $ | 356,906 | 39.2% | $ | 314,039 | 34.6% | $ | 273,465 | 30.6% | $ | 252,134 | 28.7% | |||||||||||||||||||||||||
| Commercial loans |
133,787 | 14.9% | 111,243 | 12.2% | 118,756 | 13.1% | 121,204 | 13.6% | 122,006 | 13.9% | ||||||||||||||||||||||||||||||
| Commercial real estate |
116,066 | 13.0% | 96,753 | 10.7% | 95,559 | 10.5% | 95,932 | 10.8% | 101,594 | 11.5% | ||||||||||||||||||||||||||||||
| Leases, net of unearned income |
42,466 | 4.8% | 68,224 | 7.5% | 104,655 | 11.6% | 131,300 | 14.7% | 131,048 | 14.9% | ||||||||||||||||||||||||||||||
| Indirect auto loans |
176,125 | 19.7% | 184,947 | 20.3% | 182,807 | 20.2% | 176,115 | 19.7% | 181,929 | 20.7% | ||||||||||||||||||||||||||||||
| Other consumer loans |
91,619 | 10.2% | 92,022 | 10.1% | 90,906 | 10.0% | 94,246 | 10.6% | 90,438 | 10.3% | ||||||||||||||||||||||||||||||
| 895,030 | 100.0% | 910,095 | 100.0% | 906,722 | 100.0% | 892,262 | 100.0% | 879,149 | 100.0% | |||||||||||||||||||||||||||||||
| Net deferred loan costs |
3,507 | 4,067 | 4,033 | 3,271 | 2,262 | |||||||||||||||||||||||||||||||||||
| Total loans and leases |
898,537 | 914,162 | 910,755 | 895,533 | 881,411 | |||||||||||||||||||||||||||||||||||
| Allowance for credit losses |
(10,683) | (9,414) | (9,161) | (8,426) | (7,029) | |||||||||||||||||||||||||||||||||||
| Net loans and leases |
$ | 887,854 | $ | 904,748 | $ | 901,594 | $ | 887,107 | $ | 874,382 | ||||||||||||||||||||||||||||||
The following table shows the amount of loans and leases outstanding as of December 31, 2010, which, based on remaining scheduled payments of principal, are due in the periods indicated:
| Maturing within one year or less |
Maturing after one but within five years |
Maturing after five but within ten years |
Maturing after ten years |
Total | ||||||||||||||||
| (In thousands) | ||||||||||||||||||||
| Residential real estate |
$ 14,475 | $ 61,275 | $ 81,777 | $177,440 | $334,967 | |||||||||||||||
| Commercial loans and commercial real estate |
68,723 | 97,955 | 45,453 | 37,722 | 249,853 | |||||||||||||||
| Leases, net of unearned income |
14,605 | 21,274 | 6,368 | 219 | 42,466 | |||||||||||||||
| Indirect auto loans |
54,094 | 120,229 | 1,590 | 212 | 176,125 | |||||||||||||||
| Other consumer loans |
20,680 | 43,082 | 23,132 | 4,725 | 91,619 | |||||||||||||||
| Total loans and leases, net of unearned income |
$172,577 | $343,815 | $158,320 | $220,318 | $895,030 | |||||||||||||||
The following table sets forth the sensitivity to changes in interest rates as of December 31, 2010:
| Fixed Rate | Variable Rate | Total | ||||||||||
| (In thousands) | ||||||||||||
| Due after one year, but within five years |
$252,215 | $91,600 | $343,815 | |||||||||
| Due after five years |
265,646 | 112,992 | 378,638 | |||||||||
Asset Quality and the Allowance for Credit Losses
The following table summarizes delinquent loans and leases grouped by the number of days delinquent at the dates indicated:
| Delinquent loans and leases |
December 31, 2010 | December 31, 2009 | ||||||||||||||
| $ |
%(1) |
$ |
%(1) |
|||||||||||||
| (Dollars in thousands) | ||||||||||||||||
| 30 days past due |
$6,711 | 0.75% | $ 7,883 | 0.87% | ||||||||||||
| 60 days past due |
1,083 | 0.12% | 2,271 | 0.25% | ||||||||||||
| 90 days past due and still accruing |
19 | —% | — | —% | ||||||||||||
| Non-accrual |
8,474 | 0.95% | 8,582 | 0.94% | ||||||||||||
| Total |
$16,287 | 1.82% | $18,736 | 2.06% | ||||||||||||
(1) As a percentage of total loans and leases, excluding deferred costs
28
Table of Contents
Delinquent loans and leases (including non-performing) decreased to $16.3 million at December 31, 2010, compared to $18.7 million at the end of 2009. Loan and lease delinquencies, as measured by the number of days past due on all delinquent loans and leases, have remained relatively stable throughout 2010. Approximately 41% of all delinquent loans and leases at the end of 2010 were past due less than sixty days, compared with 42% at the end of 2009.
The following table represents information concerning the aggregate amount of non-performing assets:
| December 31, | ||||||||||||||||||||
| 2010 | 2009 | 2008 | 2007 | 2006 | ||||||||||||||||
| (In thousands) | ||||||||||||||||||||
| Non-accrual loans and leases: |
||||||||||||||||||||
| Residential real estate |
$3,543 | $2,843 | $1,506 | $1,118 | $ 298 | |||||||||||||||
| Commercial loans and commercial real estate |
3,296 | 4,013 | 1,997 | 4,988 | 1,248 | |||||||||||||||
| Leases |
697 | 1,418 | 595 | 320 | 99 | |||||||||||||||
| Indirect auto |
212 | 109 | 101 | 83 | 63 | |||||||||||||||
| Consumer |
726 | 199 | 153 | 158 | 141 | |||||||||||||||
| Total non-accrual loans and leases |
8,474 | 8,582 | 4,352 | 6,667 | 1,849 | |||||||||||||||
| Accruing loans and leases past due 90 days or more |
19 | — | 126 | 39 | 790 | |||||||||||||||
| Total non-performing loans |
8,493 | 8,582 | 4,478 | 6,706 | 2,639 | |||||||||||||||
| Other real estate owned and other repossessed assets |
652 | 445 | 657 | 229 | — | |||||||||||||||
| Total non-performing assets |
$9,145 | $9,027 | $5,135 | $6,935 | $2,639 | |||||||||||||||
| Restructured loans not included in above |
$1,131 | $ 110 | $ — | $ — | $ — | |||||||||||||||
| Total non-performing loans and leases to total loans and leases |
0.95% | 0.94% | 0.49% | 0.75% | 0.30% | |||||||||||||||
| Total non-performing assets to total assets |
0.63% | 0.64% | 0.38% | 0.53% | 0.21% | |||||||||||||||
| Allowance for credit losses to non-performing loans and leases |
125.8% | 109.7% | 204.6% | 125.7% | 266.4% | |||||||||||||||
| Allowance for credit losses to total loans and leases |
1.19% | 1.03% | 1.01% | 0.94% | 0.80% | |||||||||||||||
Nonperforming assets, defined as non-accruing loans and leases plus loans and leases 90 days or more past due, along with other real estate owned and other repossessed assets were $9.1 million or 0.63% of total assets at December 31, 2010, compared to $9.0 million or 0.64% of total assets at the end of 2009. Included in nonperforming assets at the end of 2010 were nonperforming loans and leases totaling $8.5 million, compared with $8.6 million at the end of 2009. Conventional residential mortgages comprised $3.5 million (47 loans) or 41.7% of nonperforming loans and leases at December 31, 2010. Nonperforming commercial loans totaled $3.3 million (29 loans) or 38.8% of nonperforming loans and leases and leases on nonperforming status totaled $697,000 (22 leases) or 8.2% of nonperforming loans and leases at the end of 2010.
The economy in our market area is a relatively stable, slow growth economy, with few conditions that give rise to boom and bust cycles. The housing market generally does not exhibit significant volatility and is not significantly impacted by speculative influences. These external factors, combined with our disciplined credit culture and consistently sound underwriting guidelines, are the primary reasons that our levels of delinquent loans and non-performing assets have remained relatively low in recent years despite significant industry-wide asset quality issues.
As a recurring part of our portfolio management program, we have identified approximately $16.6 million in potential problem loans at December 31, 2010, as compared to $9.1 million at December 31, 2009. The average balance of identified potential problem loans was $339,000 and $252,000 at December 31, 2010 and December 31, 2009, respectively. Potential problem loans are loans that are currently performing, but where the borrower’s operating performance or other relevant factors could result in potential credit problems, and are classified by our loan rating system as “substandard.” At December 31, 2010, potential problem loans primarily consisted of commercial loans and leases and commercial real estate. There can be no assurance that additional loans will not become nonperforming, require restructuring, or require increased provision for loan losses.
We have a loan and lease monitoring program that it believes appropriately evaluates non-performing loans and leases and the loan and lease portfolio in general. The loan and lease review program continually audits the loan and lease portfolio to confirm management’s loan and lease risk rating system, and systematically tracks such problem loans and leases to ensure compliance with loan and lease policy underwriting guidelines, and to evaluate the adequacy of the allowance for credit losses.
Our policy is to place a loan or lease on non-accrual status and recognize income on a cash basis when a loan or lease is more than 90 days past due, unless in the opinion of management, the loan or lease is well secured and in the process of collection.
29
Table of Contents
The impact of interest not recognized on non-accrual loans and leases was $277,000 in 2010, $342,000 in 2009, and $264,000 in 2008. We consider a loan or lease impaired when, based on current information and events, it is probable that we will be unable to collect the scheduled payments of principal and interest when due according to the contractual terms of the loan or lease agreement.
The allowance for credit losses represents management’s best estimate of probable incurred losses in our loan and lease portfolio. Management’s quarterly evaluation of the allowance for credit losses is a comprehensive analysis that builds a total allowance by evaluating the probable incurred losses within each loan and lease portfolio segment. Our portfolio segments are as follows: commercial loan and commercial real estate loans, commercial leases, residential real estate, indirect consumer loans and other consumer loans. Our allowance for credit losses consists of specific valuation allowances based on probable credit losses on specific loans, historical valuation allowances based on loan loss experience for similar loans with similar characteristics and trends and general valuation allowances based on general economic conditions and other qualitative risk factors both internal and external to the organization.
Historical valuation allowances are calculated for commercial loans and leases based on the historical loss experience of specific types of loans and leases and the internal risk grade 24 months prior to the time they were charged off. The internal credit risk grading process evaluates, among other things, the borrower’s ability to repay, the underlying collateral, if any, and the economic environment and industry in which the borrower operates. Historical valuation allowances for residential real estate and consumer loan segments are based on the average loss rates for each class of loans for the time period that includes the current year and two full prior years. We calculate historical loss ratios for pools of similar consumer loans based upon the product of the historical loss ratio and the principal balance of the loans in the pool. Historical loss ratios are updated quarterly based on actual loss experience. Our general valuation allowances are based on general economic conditions and other qualitative risk factors which affect our company. Factors considered include trends in our delinquency rates, macro-economic and credit market conditions, changes in asset quality, changes in loan and lease portfolio volumes, concentrations of credit risk, the changes in internal loan policies, procedures and internal controls, experience and effectiveness of lending personnel. Management evaluates the degree of risk that each one of these components has on the quality of the loan and lease portfolio on a quarterly basis.
For commercial loan and lease segments, we maintain a specific allocation methodology for those classified in our internal risk grading system as substandard, doubtful or loss with a principal balance in excess of $200,000. A loan or lease is considered impaired, based on current information and events, if it is probable that we will be unable to collect the scheduled payments of principal or interest when due according to the contractual terms of the loan or lease agreement. The measurement of impaired loans and leases is generally discounted at the historical effective interest rate, except that all collateral-dependent loans and leases are measured for impairment based on the estimated fair value of the collateral. Loans with modified terms in which a concession to the borrower has been made that it would not otherwise consider unless the borrower was experiencing financial difficulties, are considered troubled debt restructurings and classified as impaired. As of December 31, 2010, there was $3.9 million in impaired loans for which $421,000 in related allowance for credit losses was allocated. There was $3.7 million in impaired loans for which $332,000 in related allowance for credit losses was allocated as of December 31, 2009.
Loans and leases are charged against the allowance for credit losses, in accordance with our loan and lease policy, when they are determined by management to be uncollectible. Recoveries on loans and leases previously charged off are credited to the allowance for credit losses when they are received. When management determines that the allowance for credit losses is less than adequate to provide for probable incurred losses, a direct charge to operating income is recorded.
The following table summarizes changes in the allowance for credit losses arising from loans and leases charged off, recoveries on loans and leases previously charged off and additions to the allowance, which have been charged to expense.
30
Table of Contents
| Years ended December 31, | ||||||||||||||||||||
| 2010 | 2009 | 2008 | 2007 | 2006 | ||||||||||||||||
| (In thousands) | ||||||||||||||||||||
| Balance at beginning of year |
$9,414 | $9,161 | $8,426 | $7,029 | $4,960 | |||||||||||||||
| Loans and leases charged-off: |
||||||||||||||||||||
| Residential real estate |
322 | 76 | 276 | 103 | 33 | |||||||||||||||
| Commercial loans and commercial real estate |
634 | 1,622 | 1,940 | 545 | 689 | |||||||||||||||
| Leases |
1,345 | 4,122 | 1,844 | 881 | 560 | |||||||||||||||
| Indirect auto |
251 | 317 | 295 | 211 | 195 | |||||||||||||||
| Consumer |
1,055 | 1,135 | 1,284 | 1,487 | 913 | |||||||||||||||
| Total loans and leases charged off |
3,607 | 7,272 | 5,639 | 3,227 | 2,390 | |||||||||||||||
| Recoveries of loans and leases previously charged off: |
||||||||||||||||||||
| Residential real estate |
54 | 59 | 32 | 1 | 1 | |||||||||||||||
| Commercial loans and commercial real estate |
34 | 514 | 113 | 48 | 59 | |||||||||||||||
| Leases |
81 | 165 | 40 | 13 | — | |||||||||||||||
| Indirect auto |
133 | 133 | 91 | 119 | 213 | |||||||||||||||
| Consumer |
489 | 554 | 596 | 653 | 412 | |||||||||||||||
| Total recoveries |
791 | 1,425 | 872 | 834 | 685 | |||||||||||||||
| Net loans and leases charged off |
2,816 | 5,847 | 4,767 | 2,393 | 1,705 | |||||||||||||||
| Provision for credit losses |
4,085 | 6,100 | 5,502 | 3,790 | 2,477 | |||||||||||||||
| Allowance acquired from Bridge Street Financial Inc. |
— | — | — | — | 1,297 | |||||||||||||||
| Balance at end of year |
$10,683 | $9,414 | $9,161 | $8,426 | $7,029 | |||||||||||||||
The provision for credit losses decreased 33.0% in 2010 compared to 2009 as the result of a 51.8% decrease in net charge-offs in 2010. The provision expense was $4.1 million in 2010 compared to $6.1 million in 2009.
Net charge-offs totaled $2.8 million in 2010 compared to $5.8 million in 2009. The decrease in net charge-offs was largely the result of a 67.4% drop in lease charge-offs in 2010 compared to 2009. Charge-offs in the lease portfolio totaled $1.3 million or 37.3% of gross charge-offs in 2010, down from $4.1 million or 56.7% of gross charge-offs in 2009. The charge-offs in our lease portfolio in 2009 were concentrated in four distinct segments of the portfolio, which accounted for 78% of all lease net charge-offs in 2009. These four segments stabilized in 2010 and charge-offs in our lease portfolio dropped sharply in 2010 as a result. The aggregate remaining balance of these four lease segments was $2.4 million at the end of 2010.
Net charge-offs in our commercial portfolio decreased 45.8% in 2010 compared to 2009, though net charge-offs for both years in dollar terms were not exceptionally high. Total net charge-offs equaled 0.31% of average loans and leases in 2010, compared to 0.64% in 2009.
The provision for credit losses as a percentage of net charge-offs was 145% in 2010, compared to 104% in 2009. The allowance for credit losses was $10.7 million at December 31, 2010, compared with $9.4 million at the end of 2009. The ratio of the allowance for credit losses to total loans and leases was 1.19% at December 31, 2010, compared with 1.03% at December 31, 2009. The ratio of the allowance for credit losses to nonperforming loans and leases was 126% at December 31, 2010, compared with 110% at the end of 2009.
The allowance for credit losses has been allocated within the following categories of loans and leases at the dates indicated with the corresponding percent of loans to total loans for each category (dollars in thousands):
| At December 31, | ||||||||||||||||||||||||||||||||||||||||
| 2010 | 2009 | 2008 | 2007 | 2006 | ||||||||||||||||||||||||||||||||||||
| Amount of |
Percent Total |
Amount of |
Percent Total |
Amount of |
Percent Total |
Amount of |
Percent Total |
Amount of |
Percent Loans to Total |
|||||||||||||||||||||||||||||||
| Residential real estate |
$ 946 | 37.4% | $ 891 | 39.2% | $ 850 | 34.6% | $ 978 | 30.6% | $ 969 | 28.7% | ||||||||||||||||||||||||||||||
| Commercial(1) |
5,568 | 27.9% | 3,771 | 22.9% | 3,988 | 23.6% | 4,097 | 24.4% | 3,143 | 25.4% | ||||||||||||||||||||||||||||||
| Leases |
1,583 | 4.8% | 2,212 | 7.5% | 2,673 | 11.6% | 1,951 | 14.7% | 1,468 | 14.9% | ||||||||||||||||||||||||||||||
| Indirect auto |
933 | 19.7% | 973 | 20.3% | 879 | 20.2% | 685 | 19.7% | 785 | 20.7% | ||||||||||||||||||||||||||||||
| Consumer |
779 | 10.2% | 818 | 10.1% | 771 | 10.0% | 715 | 10.6% | 664 | 10.3% | ||||||||||||||||||||||||||||||
| Unallocated |
874 | —% | 749 | —% | — | — | — | — | — | — | ||||||||||||||||||||||||||||||
| Total |
$10,683 | 100.0% | $9,414 | 100.0% | $9,161 | 100.0% | $8,426 | 100.0% | $7,029 | 100.0% | ||||||||||||||||||||||||||||||
(1) includes commercial real estate loans
31
Table of Contents
The allowance for credit losses is allocated according to the amount deemed to be reasonably necessary to provide for the probable incurred losses within each category of loans and leases. Increases in the amount allocated to the commercial and lease portfolios reflect the higher outstanding balances of these portfolios coupled with the higher inherent risk of these portfolios compared with residential and consumer lending.
Deposits
Our primary source of funds is deposits, consisting of demand, savings, money market and time accounts, of retail, commercial and municipal customers gathered through our branch network. We continuously monitor market pricing, competitors’ rates, and internal interest rate spreads to maintain and promote growth and profitability.
The following table sets forth the composition of our deposits by business line at year-end (dollars in thousands):
| December 31, 2010 | ||||||||||||||||||||
| Retail | Commercial | Municipal | Total | Percent | ||||||||||||||||
| Non-interest checking |
$ 41,962 | $133,979 | $ 3,977 | $ 179,918 | 15.9% | |||||||||||||||
| Interest checking |
109,682 | 12,906 | 29,306 | 151,894 | 13.3% | |||||||||||||||
| Total checking |
151,644 | 146,885 | 33,283 | 331,812 | 29.2% | |||||||||||||||
| Savings |
88,785 | 11,646 | 2,668 | 103,099 | 9.1% | |||||||||||||||
| Money market |
88,870 | 109,282 | 159,733 | 357,885 | 31.5% | |||||||||||||||
| Time deposits |
257,489 | 23,677 | 60,636 | 341,802 | 30.2% | |||||||||||||||
| Total deposits |
$586,788 | $291,490 | $256,320 | $1,134,598 | 100.0% | |||||||||||||||
| December 31, 2009 | ||||||||||||||||||||
| Retail | Commercial | Municipal | Total | Percent | ||||||||||||||||
| Non-interest checking |
$ 40,320 | $115,304 | $ 3,525 | $ 159,149 | 14.8% | |||||||||||||||
| Interest checking |
97,580 | 15,559 | 17,229 | 130,368 | 12.1% | |||||||||||||||
| Total checking |
137,900 | 130,863 | 20,754 | 289,517 | 26.9% | |||||||||||||||
| Savings |
82,328 | 9,714 | 2,482 | 94,524 | 8.8% | |||||||||||||||
| Money market |
82,103 | 96,760 | 138,188 | 317,051 | 29.5% | |||||||||||||||
| Time deposits |
311,626 | 20,568 | 42,385 | 374,579 | 34.8% | |||||||||||||||
| Total deposits |
$613,957 | $257,905 | $203,809 | $1,075,671 | 100.0% | |||||||||||||||
Total deposits were $1.1 billion at December 31, 2010, which was an increase of $58.9 million or 5.5% compared with December 31, 2009. Total deposits increased $113.8 million excluding brokered time deposits of $54.9 million which matured in 2010 that we chose to not replace. Deposit growth was spread across all of our retail, commercial and municipal business lines and across all deposit types, reflecting the strength of our brand and the breadth of our deposit gathering capabilities through our branches and commercial and municipal relationships. Our deposit growth during 2010 and our deposit mix at the end of the year continued to be weighted heavily in lower cost demand, savings and money market accounts (transaction accounts). Growth in these account types totaled $91.7 million in 2010, and they comprised 69.8% of total deposits at the end of 2010, compared with 65.0% at the end of 2009. Our ability to gather transaction deposits over the past year has been greatly enhanced by our strong financial position and earnings performance, enhanced product offerings including upgraded treasury management and internet banking platforms, and a high positive awareness of Alliance’s brand. Environmental factors such as equity market volatility and risk aversion among retail investors, and the buildup of cash on corporate balance sheets have also played a role in the growth in our transaction accounts.
Time deposits in excess of $100,000, which tend to be more volatile and sensitive to interest rates, totaled $137.0 million at December 31, 2010, representing 40.0% of total time deposits and 12.1% of total deposits. These deposits totaled $108.3 million, representing 28.9% of total time deposits and 10.1% of total deposits at year-end 2009.
32
Table of Contents
The following table schedules the amount of our time deposits of $100,000 or more by time remaining until maturity as of December 31, 2010 (in thousands):
| Less than three months |
$ | 21,642 | ||
| Three months to six months |
25,984 | |||
| Six months to one year |
39,302 | |||
| Over one year |
50,066 | |||
| Total |
$ | 136,994 | ||
Borrowings
We offer retail repurchase agreements primarily to our larger business customers. Under the terms of the agreements, we sell investment portfolio securities to the customer and agree to repurchase the securities on the next business day. We use this arrangement as a deposit alternative for our business customers. As of December 31, 2010, retail repurchase agreement balances amounted to $25.8 million compared to balances of $17.2 million at December 31, 2009.
During 2010, we utilized collateralized repurchase agreements with various brokers and advances from the Federal Home Loan Bank of New York (FHLB) as alternative sources of funding and as a liability management tool. At December 31, 2010, the combination of repurchase agreements and FHLB advances was $117.0 million, compared with $155.5 million at December 31, 2009. Detailed information regarding our borrowings is included in Note 7 in the consolidated financial statements section of this report.
Total borrowings declined $29.9 million or 17.3% in 2010 as we used our deposit inflows to pay down borrowings which matured during the year.
Capital
We use certain non-GAAP financial measures, such as the Tangible Common Equity to Tangible Assets ratio (TCE), to provide information for investors to effectively analyze financial trends of ongoing business activities, and to enhance comparability with peers across the financial sector. We believe TCE is useful because it is a measure utilized by regulators, market analysts and investors in evaluating a company’s financial condition and capital strength. TCE, as defined by us, represents common equity less goodwill and intangible assets. A reconciliation from the our GAAP Total Equity to Total Assets ratio to the Non-GAAP Tangible Common Equity to Tangible Assets ratio is presented below:
| (in thousands) | December 31, 2010 | |||
| Total assets |
$1,454,622 | |||
| Less: Goodwill and intangible assets, net |
39,482 | |||
| Tangible assets (non-GAAP) |
1,415,140 | |||
| Total Common Equity |
133,131 | |||
| Less: Goodwill and intangible assets, net |
39,482 | |||
| Tangible Common Equity (non-GAAP) |
93,649 | |||
| Total Equity/Total Assets |
9.15% | |||
| Tangible Common Equity/Tangible Assets (non-GAAP) |
6.62% | |||
Shareholders’ equity was $133.1 million at December 31, 2010, compared with $123.9 million at December 31, 2009. Net income for 2010 increased shareholders’ equity by $11.6 million and was partially offset by common stock dividends declared of $5.4 million or $1.16 per common share. Common stock and paid-in surplus increased $2.7 million in 2010 on the exercise of employee stock options, purchases of our common stock under our Directors’ Stock-Based Deferral Plan and amortization of unvested restricted stock grants.
Our consolidated Tier 1 leverage ratio was 8.28% and our consolidated total risk-based capital ratio was 14.65% at the end of 2010, both of which exceeded regulatory minimum thresholds for capital adequacy purposes. Our tangible common equity capital ratio was 6.62% at the end of 2010.
We are subject to various regulatory capital requirements administered by the federal banking agencies. Failure to meet minimum capital requirements can initiate certain mandatory and possibly discretionary actions by regulators that, if undertaken, could have a direct material effect on our financial statements. Under capital adequacy guidelines and the regulatory framework for prompt corrective action, we must meet specific capital guidelines that involve quantitative
33
Table of Contents
measures of our assets, liabilities, and certain off-balance-sheet items as calculated under regulatory accounting practices. Our capital amounts and classifications are also subject to qualitative judgments by the regulators about components, risk weightings, and other factors. Quantitative measures established by regulation to ensure capital adequacy require Alliance and the Bank to maintain minimum amounts and ratios, as defined in the regulations, of total and risk-based capital, Tier 1 capital to risk-weighted assets and of Tier 1 Capital to average assets.
As of December 31, 2010, the most recent notification from the Office of the Comptroller of the Currency categorized the Bank as “well-capitalized,” under the regulatory framework for prompt corrective action. Management believes that, as of December 31, 2010, Alliance and the Bank met all capital adequacy requirements to which they were subject. A more comprehensive analysis of regulatory capital requirements, including ratios for Alliance and the Bank, is included in Note 18 of the consolidated financial statements.
Liquidity and Capital Resources
Our liquidity is primarily measured by our ability to provide funds to meet loan requests, to accommodate possible outflows of deposits, and to take advantage of market interest rate opportunities. Funding of loan commitments, providing for liability outflows, and management of interest rate fluctuations require continuous analysis in order to match the maturities of specific categories of short-term loans and investments with specific types of deposits and borrowings. Liquidity is normally considered in terms of the nature and mix of our sources and uses of funds. Our Asset Liability Management Committee (ALCO) is responsible for implementing the policies and guidelines for the maintenance of prudent levels of liquidity. Management believes, as of December 31, 2010, that our liquidity measurements are in compliance with our policy guidelines.
Our principal sources of funds for operations are cash flows generated from earnings, deposits, securities, loan and lease repayments, borrowings from the FHLB, and securities sold under repurchase agreements. During the year ended December 31, 2010, cash and cash equivalents increased by $5.8 million, as net cash provided by operating and financing activities of $44.5 million was partially offset by net cash used in investing activities of $38.7 million. Net cash used in investing activities primarily resulted from securities purchases exceeding maturities, sales and principal repayments by $53.3 million, partially offset by a net decrease in loans of $11.7 million and $1.9 million in proceeds from sale of the insurance agency. The net cash provided by financing activities principally reflects a $58.9 million net increase in deposits and $1.6 million in proceeds from stock options, partly reduced by a net decrease in borrowings of $29.9 million and cash dividends of $5.3 million in the year ended December 31, 2010. Net cash from operating activities was primarily provided by net income in the amount of $11.6 million.
As a member of the FHLB, the Bank is eligible to borrow up to an established credit limit against certain residential mortgage loans and investment securities that have been pledged as collateral. As of December 31, 2010, the Bank’s credit limit with the FHLB was $310.7 million with outstanding borrowings in the amount of $117.0 million.
The Bank had a $150.0 million line of credit at December 31, 2010 with the Federal Reserve Bank of New York through its Discount Window, and has pledged as collateral indirect auto loans and securities totaling $177.6 million and $6.9 million, respectively, at December 31, 2010. We did not draw any funds on this line of credit in 2010. At December 31, 2010 and 2009, the Bank also had available $78.5 million of federal funds lines of credit with other financial institutions, none of which was in use at December 31, 2010 and 2009, respectively.
In December 2003, we formed Alliance Financial Capital Trust I, a wholly-owned subsidiary of Alliance. The trust was formed for the purpose of issuing $10.0 million of Company-obligated mandatorily redeemable capital securities (the capital securities) to third-party investors and investing the proceeds from the sale of such capital securities solely in our junior subordinated debt securities. The debentures held by the trust are the sole assets of that trust. Distributions on the capital securities issued by the trust are payable quarterly at a rate per annum equal to the interest rate being earned by the trust on the debentures held by the trust. The capital securities have a variable annual coupon rate that resets quarterly based upon three-month LIBOR plus 285 basis points (3.14% at December 31, 2010). The capital securities have a 30-year maturity and are redeemable at par beginning in January 2009.
In September 2006, we formed Alliance Financial Capital Trust II, a wholly-owned subsidiary of the Company. The trust was formed for the purpose of issuing $15.0 million of Company-obligated mandatorily redeemable capital securities (the capital securities) to third-party investors and investing the proceeds from the sale of such capital securities solely in our junior subordinated debt securities. The debentures held by the trust are the sole assets of that trust. Distributions on the capital securities issued by the trust are payable quarterly at a rate per annum equal to the interest rate being earned by the trust on the debentures held by the trust. The capital securities have a variable annual coupon rate that resets quarterly based upon
34
Table of Contents
three-month LIBOR plus 165 basis points (1.95% at December 31, 2010). The capital securities have a 30-year maturity and are redeemable at par in September 2011 and any time thereafter.
Contractual Obligations, Commitments, and Off-Balance Sheet Arrangements
Contractual Obligations
We have various financial obligations, including contractual obligations and commitments that may require future cash payments. The following table presents as of December 31, 2010, significant fixed and determinable contractual obligations to third parties by payment date. Further discussion of the nature of each obligation is included in the referenced note to the consolidated financial statements.
| Payments Due In | ||||||||||||||||||||||||
| Note Reference |
One Year or Less |
One
to Three Years |
Three
to Five Years |
Over Five Years |
Total | |||||||||||||||||||
| (Dollars in thousands) | ||||||||||||||||||||||||
| Time deposits* |
6 | $180,274 | $146,409 | $12,816 | $ 2,303 | $341,802 | ||||||||||||||||||
| Borrowings* |
7 | 42,792 | 60,000 | 40,000 | — | 142,792 | ||||||||||||||||||
| Junior subordinated obligations issued to unconsolidated subsidiaries* |
8 | — | — | — | 25,774 | 25,774 | ||||||||||||||||||
| Operating leases |
15 | 1,086 | 1,993 | 1,671 | 8,644 | 13,394 | ||||||||||||||||||
| Purchase obligations |
15 | 172 | 344 | 344 | 1,365 | 2,225 | ||||||||||||||||||
| Total |
$224,324 | $208,746 | $54,831 | $38,086 | $525,987 | |||||||||||||||||||
*Excludes interest
We have obligations under our pension, post-retirement plan, directors’ retirement and supplemental executive retirement plans as described in Note 12 to the consolidated financial statements. The supplemental executive retirement, pension and postretirement benefit and directors’ retirement payments represent actuarially determined future benefit payments to eligible plan participants.
Commitments and Off-Balance Sheet Arrangements
In the normal course of business, to meet the financing needs of our customers and to reduce our exposure to fluctuations in interest rates, we are a party to financial instruments with off-balance sheet risk, held for purposes other than trading. The financial instruments involve, to varying degrees, elements of credit and interest rate risk in excess of the amount recognized in the consolidated balance sheets. Our exposure to credit loss in the event of nonperformance by the other party to the financial instrument, for loan commitments and standby letters of credit, is represented by the contractual amount of those instruments, assuming that the amounts are fully advanced and that collateral or other security is of no value. We use the same credit policies in making commitments and conditional obligations as we do for on-balance sheet loans. The amount of collateral obtained, if deemed necessary by us upon extension of credit, is based on management’s credit evaluation of the borrower. Collateral held varies, but may include accounts receivable, inventory, property, plant and equipment, and income-producing commercial properties. Commitments to originate loans, unused lines of credit, and un-advanced portions of construction loans are agreements to lend to a customer provided there is no violation of any condition established in the contract. Commitments generally have fixed expiration dates or other termination clauses and may require payment of a fee. Many of the commitments are expected to expire without being drawn upon. Therefore, the amounts presented below do not necessarily represent future cash requirements. Standby letters of credit are conditional commitments issued by the Bank to guarantee the performance by a customer to a third party. These guarantees are issued primarily to support public and private borrowing arrangements, bond financing, and similar transactions. The credit risk involved in issuing letters of credit is essentially the same as that involved in extending loan commitments to customers.
35
Table of Contents
The following table details the amounts and expected maturities of significant commitments and off-balance sheet arrangements as of December 31, 2010. Further discussion of these commitments and off-balance sheet arrangements is included in Note 15 to the consolidated financial statements.
| Commitments to extend credit: | One Year or Less |
One
to Three Years |
Three to Five Years |
Over Five Years |
Total | |||||||||||||||
| (Dollars in thousands) | ||||||||||||||||||||
| Residential real estate |
$ 9,433 | $ — | $ — | $ — | $ 9,433 | |||||||||||||||
| Commercial loans and leases |
45,009 | 6,603 | 566 | 32,132 | 84,310 | |||||||||||||||
| Revolving home equity lines |
1,994 | 16,236 | 8,522 | 25,317 | 52,069 | |||||||||||||||
| Consumer revolving credit |
31,309 | — | — | — | 31,309 | |||||||||||||||
| Standby letters of credit |
3,223 | — | — | — | 3,223 | |||||||||||||||
| Total |
$90,968 | $22,839 | $9,088 | $57,449 | $180,344 | |||||||||||||||
Application of Critical Accounting Policies
Our consolidated financial statements are prepared in accordance with accounting principles generally accepted in the United States. Application of these principles requires management to make estimates, assumptions, and judgments that affect the amounts reported in the financial statements and accompanying notes. These estimates, assumptions, and judgments are based on information available as of the date of the financial statements; accordingly, as this information changes, the financial statements could reflect different estimates, assumptions, and judgments. Certain policies inherently have a greater reliance on the use of estimates, assumptions, and judgments and as such have a greater possibility of producing results that could be materially different than originally reported. Estimates, assumptions, and judgments are necessary when assets and liabilities are required to be recorded at fair value or when an asset or liability needs to be recorded contingent upon a future event. Carrying assets and liabilities at fair value inherently results in more financial statement volatility. The fair values and information used to record valuation adjustments for certain assets and liabilities are based on quoted market prices or are provided by other third-party sources, when available. When third-party information is not available, valuation adjustments are estimated in good faith by management.
Our most significant accounting policies are presented in Note 1 to the consolidated financial statements included elsewhere in this Annual Report on Form 10-K. These policies, along with the disclosures presented in the other financial statement notes and in this discussion, provide information on how significant assets and liabilities are valued in the financial statements and how those values are determined. Based on the valuation techniques used and the sensitivity of financial statement amounts to the methods, assumptions, and estimates underlying those amounts, management has identified the determination of the allowance for credit losses, accrued income taxes, pensions and post-retirement obligations and the fair value analysis of goodwill and intangible assets to be the accounting areas that require the most subjective and complex judgments, and as such could be the most subject to revision as new information becomes available. Actual results could differ from those estimates.
The allowance for credit losses represents management’s estimate of probable incurred loan and lease losses inherent in the loan and lease portfolio. Determining the amount of the allowance for credit losses is considered a critical accounting estimate because it requires significant judgment and the use of estimates related to the amount and timing of expected future cash flows on impaired loans and leases, estimated losses on pools of homogeneous loans and leases based on historical loss experience, and consideration of current economic trends and conditions, all of which may be susceptible to significant change. The loan and lease portfolio also represents the largest asset type on the consolidated balance sheet. Note 1 to the consolidated financial statements describes the methodology used to determine the allowance for credit losses, and a discussion of the factors driving changes in the amount of the allowance for credit losses is included in this report.
We estimate our tax expense based on the amount we expect to owe the respective tax authorities. Taxes are discussed in more detail in Note 10 to the consolidated financial statements section of this report. Accrued taxes represent the net estimated amount due or to be received from taxing authorities. In estimating accrued taxes, management assesses the relative merits and risks of the appropriate tax treatment of transactions, taking into account statutory, judicial and regulatory guidance in the context of our tax position. If the final resolution of taxes payable differs from our estimates due to regulatory determination or legislative or judicial actions, adjustments to tax expense may be required.
We utilize significant estimates and assumptions in determining the fair value of our goodwill and intangible assets for purposes of impairment testing. The valuation requires the use of assumptions, including, among others, discount rates, rates of return on assets, account attrition rates and costs of servicing. Impairment testing for goodwill requires that the fair value of each of our reporting units be compared to the carrying amount of its net assets, including goodwill. Determining the fair value of a reporting unit requires us to use a high degree of subjective judgment. We utilize both market-based valuation multiples and discounted cash flow valuation models that incorporate such variables as revenue growth rates, expense trends,
36
Table of Contents
interest rates and terminal values. Based upon an evaluation of key data and market factors, we select the specific variables to be incorporated into the valuation model. Future changes in the economic environment or operations of our reporting units could cause changes to these variables, which could result in impairment being identified.
The valuation of our obligations associated with pension, post-retirement, directors’ retirement and supplemental executive retirement plans utilize various actuarial assumptions. These assumptions include discount rate, rate of future compensation increases and expected return on plan assets. Specific discussion of the assumptions used by management is discussed in Note 12 to the consolidated financial statements section of this report.
Item 7A. Quantitative and Qualitative Disclosures about Market Risk
Market risk is the risk of loss in a financial instrument arising from adverse changes in market rates or prices such as interest rates, foreign currency exchange rates, commodity prices, and equity prices. Our market risk arises principally from interest rate risk in its lending, investing, deposit gathering and borrowing activities. Other types of market risks do not arise in the normal course of our business activities.
The Bank’s ALCO is responsible for reviewing the interest rate sensitivity position and establishing policies to monitor and manage exposure to interest rate risk. The policies and guidelines established by the ALCO are reviewed and approved by our Board of Directors annually.
Interest rate risk is monitored primarily through financial modeling of net interest income and net portfolio value estimation (discounted present value of assets minus discounted present value of liabilities). Both measures are highly assumption dependent and change regularly as the balance sheet and interest rates change; however, taken together, they represent a reasonably comprehensive view of the magnitude of interest rate risk, the distribution of risk along the yield curve, the level of risk through time, and the amount of exposure to changes in certain interest rate relationships. The key assumptions employed by these measures are analyzed and reviewed monthly by the ALCO.
The table that follows is provided pursuant to the market risk disclosure rules set forth in Item 305 of Regulation S-K of the Securities and Exchange Commission. The information provided in the following table is based on significant estimates and assumptions and constitutes, like certain other statements included herein, a forward-looking statement. The base case (no rate change) information in the table shows (1) an estimate of our net portfolio value at December 31, 2010 arrived at by discounting estimated future cash flows at current market rates and (2) an estimate of net interest income for the twelve months ending December 31, 2011 assuming that maturing assets or liabilities are replaced with new balances of the same type, in the same amount, and at current (December 31, 2010) rate levels and repricing balances are adjusted to current (December 31, 2010) rate levels. The rate change information (rate shocks) in the table shows estimates of net portfolio value at December 31, 2010 and net interest income for the twelve months ending December 31, 2011 assuming instantaneous rate changes of up 100, 200, and 300 basis points and down 100 basis points. Cash flows for non-maturity deposits are based on a decay or runoff rate based on average account age. Rate changes in the rate shock scenario are assumed to be shock or immediate changes and occur uniformly across the yield curve. In projecting future net interest income under the rate shock scenarios, activity is simulated by replacing maturing balances with new balances of the same type, in the same amount, but at the assumed post shock rate levels. Balances that reprice are assumed to reprice at post shock rate levels.
37
Table of Contents
Based on the foregoing assumptions and as depicted in the table that follows, an immediate increase in interest rates of 100, 200, or 300 basis points would have a negative effect on net interest income over a twelve month time period. This is principally because the Bank’s interest-bearing deposit accounts are assumed to reprice faster than its loans and investment securities. However, if the Bank does not increase the rates paid on its deposit accounts as quickly or to the same magnitude as increases in market interest rates, the negative impact on net interest income will likely be lower. Over a longer period of time, and assuming that interest rates remain stable after the initial rate increase and the Bank purchases securities and originates loans at yields higher than those maturing and reprices loans at higher yields, the impact of an increase in interest rates should be positive. This occurs primarily because with the passage of time more loans and investment securities will reprice at the higher rates and there will be no offsetting increase in interest expense for those loans and investment securities funded by noninterest-bearing checking deposits and capital. Generally, the reverse should be true of an immediate decrease in interest rates of 100 basis points. However, the positive impact on net interest income of a decline in interest rates of 100 basis points is currently constrained by the absolute low level of deposit and borrowing rates.
| Net Portfolio Value at Dec 31, 2010 | Net Interest
Income Twelve Months Ending Dec 31, 2011 |
|||||||||||||||||||||||||
| Change from Base | Change from Base | |||||||||||||||||||||||||
| Rate Change Scenario | Amount | Dollar | Percent | Amount | Dollar | Percent | ||||||||||||||||||||
| (Dollars in thousands) | ||||||||||||||||||||||||||
| +300 basis point rate shock |
$274,661 | $(36,511) | (11.7)% | $33,465 | $(11,873) | (26.2)% | ||||||||||||||||||||
| +200 basis point rate shock |
282,044 | (29,129) | (9.4)% | 37,476 | (7,862) | (17.3)% | ||||||||||||||||||||
| +100 basis point rate shock |
294,836 | (16,336) | (5.2)% | 41,486 | (3,852) | (8.5)% | ||||||||||||||||||||
| Base case (no rate change) |
311,172 | — | —% | 45,338 | — | —% | ||||||||||||||||||||
| -100 basis point rate shock |
301,135 | (10,038) | (3.2)% | 44,347 | (991) | (2.2)% | ||||||||||||||||||||
38
Table of Contents
Item 8. Financial Statements and Supplementary Data
REPORT OF INDEPENDENT REGISTERED PUBLIC ACCOUNTING FIRM
To the Board of Directors and Shareholders
Alliance Financial Corporation
Syracuse, New York
We have audited the accompanying consolidated balance sheets of Alliance Financial Corporation as of December 31, 2010 and 2009 and the related consolidated statements of income, comprehensive income, shareholders’ equity and cash flows for each of the three years in the three-year period ended December 31, 2010. We also have audited Alliance Financial Corporation’s internal control over financial reporting as of December 31, 2010, based on criteria established in Internal Control – Integrated Framework issued by the Committee of Sponsoring Organizations of the Treadway Commission (COSO). Alliance Financial Corporation’s management is responsible for these financial statements, for maintaining effective internal control over financial reporting, and for its assessment of the effectiveness of internal control over financial reporting, included in the accompanying Management’s Report on Internal Control over Financial Reporting. Our responsibility is to express an opinion on these financial statements and an opinion on the company’s internal control over financial reporting based on our audits.
We conducted our audits in accordance with the standards of the Public Company Accounting Oversight Board (United States). Those standards require that we plan and perform the audits to obtain reasonable assurance about whether the financial statements are free of material misstatement and whether effective internal control over financial reporting was maintained in all material respects. Our audits of the financial statements included examining, on a test basis, evidence supporting the amounts and disclosures in the financial statements, assessing the accounting principles used and significant estimates made by management, and evaluating the overall financial statement presentation. Our audit of internal control over financial reporting included obtaining an understanding of internal control over financial reporting, assessing the risk that a material weakness exists, and testing and evaluating the design and operating effectiveness of internal control based on the assessed risk. Our audits also included performing such other procedures as we considered necessary in the circumstances. We believe that our audits provide a reasonable basis for our opinions.
A company’s internal control over financial reporting is a process designed to provide reasonable assurance regarding the reliability of financial reporting and the preparation of financial statements for external purposes in accordance with generally accepted accounting principles. A company’s internal control over financial reporting includes those policies and procedures that (1) pertain to the maintenance of records that, in reasonable detail, accurately and fairly reflect the transactions and dispositions of the assets of the company; (2) provide reasonable assurance that transactions are recorded as necessary to permit preparation of financial statements in accordance with generally accepted accounting principles, and that receipts and expenditures of the company are being made only in accordance with authorizations of management and directors of the company; and (3) provide reasonable assurance regarding prevention or timely detection of unauthorized acquisition, use, or disposition of the company’s assets that could have a material effect on the financial statements.
Because of its inherent limitations, internal control over financial reporting may not prevent or detect misstatements. Also, projections of any evaluation of effectiveness to future periods are subject to the risk that controls may become inadequate because of changes in conditions, or that the degree of compliance with the policies or procedures may deteriorate.
In our opinion, the consolidated financial statements referred to above present fairly, in all material respects, the financial position of Alliance Financial Corporation as of December 31, 2010 and 2009, and the results of its operations and its cash flows for each of the three years in the three-year period ended December 31, 2010, in conformity with accounting principles generally accepted in the United States of America. Also in our opinion, Alliance Financial Corporation maintained, in all material respects, effective internal control over financial reporting as of December 31, 2010, based on criteria established in Internal Control – Integrated Framework issued by the COSO.
/s/Crowe Horwath LLP
Crowe Horwath LLP
New York, New York
March 14, 2011
39
Table of Contents
Alliance Financial Corporation and Subsidiaries
Consolidated Balance Sheets
December 31, 2010 and 2009
| (Dollars in thousands, except per share data) | 2010 | 2009 | ||||||
| Assets: |
||||||||
| Cash and due from banks |
$32,501 | $ 26,696 | ||||||
| Securities available-for-sale |
414,410 | 362,158 | ||||||
| Federal Home Loan Bank of NY (“FHLB”) and Federal Reserve Bank (“FRB”) Stock |
8,652 | 10,074 | ||||||
| Loans held for sale |
2,940 | 1,023 | ||||||
| Loans and leases, net of unearned income |
898,537 | 914,162 | ||||||
| Less allowance for credit losses |
(10,683) | (9,414) | ||||||
| Net loans and leases |
887,854 | 904,748 | ||||||
| Premises and equipment, net |
18,975 | 20,086 | ||||||
| Accrued interest receivable |
4,149 | 4,167 | ||||||
| Bank-owned life insurance |
28,412 | 27,354 | ||||||
| Goodwill |
30,844 | 32,073 | ||||||
| Intangible assets, net |
8,638 | 10,075 | ||||||
| Other assets |
17,247 | 18,790 | ||||||
| Total assets |
$1,454,622 | $1,417,244 | ||||||
| Liabilities and shareholders’ equity: |
||||||||
| Liabilities: |
||||||||
| Deposits |
||||||||
| Non-interest bearing |
$ 179,918 | $ 159,149 | ||||||
| Interest bearing |
954,680 | 916,522 | ||||||
| Total deposits |
1,134,598 | 1,075,671 | ||||||
| Borrowings |
142,792 | 172,707 | ||||||
| Accrued interest payable |
1,391 | 1,745 | ||||||
| Other liabilities |
16,936 | 17,412 | ||||||
| Junior subordinated obligations issued to unconsolidated subsidiary trusts |
25,774 | 25,774 | ||||||
| Total liabilities |
1,321,491 | 1,293,309 | ||||||
| Commitments and contingent liabilities (Note 15) |
— | — | ||||||
| Shareholders’ equity: |
||||||||
| Preferred stock – par value $1.00 a share; 900,000 shares authorized, none issued and outstanding |
— | — | ||||||
| Preferred stock – par value $1.00 a share; 100,000 shares authorized, Series A, junior preferred stock, none issued and outstanding |
— | — | ||||||
| Common stock – par value $1.00 a share; 10,000,000 shares authorized, 5,051,347 and 4,937,233 shares issued, and 4,729,035 and 4,614,921 shares outstanding for 2010 and 2009, respectively |
5,051 | 4,937 | ||||||
| Surplus |
45,620 | 43,013 | ||||||
| Undivided profits |
92,380 | 86,194 | ||||||
| Accumulated other comprehensive income |
1,713 | 946 | ||||||
| Directors’ stock-based deferred compensation plan: 120,237 and 103,512 shares, respectively |
(2,977) | (2,499) | ||||||
| Treasury stock, at cost: 322,312 shares |
(8,656) | (8,656) | ||||||
| Total Shareholders’ Equity |
133,131 | 123,935 | ||||||
| Total Liabilities and Shareholders’ Equity |
$1,454,622 | $1,417,244 | ||||||
The accompanying notes are an integral part of the consolidated financial statements.
40
Table of Contents
Alliance Financial Corporation and Subsidiaries
Consolidated Statements of Income
Years Ended December 31, 2010, 2009 and 2008
| 2010 | 2009 | 2008 | ||||||||||
| Interest Income: | (In thousands, except per share data) | |||||||||||
| Interest and fees on loans and leases |
$46,168 | $49,832 | $54,857 | |||||||||
| Federal funds sold and interest bearing deposits |
8 | 15 | 100 | |||||||||
| Interest and dividends on taxable securities |
11,294 | 10,701 | 9,430 | |||||||||
| Interest and dividends on nontaxable securities |
2,872 | 3,414 | 3,577 | |||||||||
| Total interest income |
60,342 | 63,962 | 67,964 | |||||||||
| Interest Expense: |
||||||||||||
| Deposits: |
||||||||||||
| Savings accounts |
377 | 454 | 492 | |||||||||
| Money market accounts |
2,675 | 3,347 | 4,732 | |||||||||
| Time accounts |
7,216 | 9,622 | 15,277 | |||||||||
| NOW accounts |
490 | 531 | 733 | |||||||||
| 10,758 | 13,954 | 21,234 | ||||||||||
| Borrowings: |
||||||||||||
| Repurchase agreements |
833 | 955 | 1,584 | |||||||||
| FHLB advances |
3,817 | 4,864 | 6,050 | |||||||||
| Junior subordinated obligations |
645 | 808 | 1,399 | |||||||||
| Total interest expense |
16,053 | 20,581 | 30,267 | |||||||||
| Net interest income |
44,289 | 43,381 | 37,697 | |||||||||
| Provision for credit losses |
4,085 | 6,100 | 5,502 | |||||||||
| Net interest income after provision for credit losses |
40,204 | 37,281 | 32,195 | |||||||||
| Non-interest income: |
||||||||||||
| Investment management income |
7,316 | 7,134 | 8,670 | |||||||||
| Service charges on deposit accounts |
4,509 | 5,037 | 5,164 | |||||||||
| Card-related fees |
2,563 | 2,248 | 2,106 | |||||||||
| Insurance agency income |
1,283 | 1,387 | 1,583 | |||||||||
| Income from bank-owned life insurance |
1,058 | 1,014 | 856 | |||||||||
| Gain on the sale of loans |
1,394 | 748 | 252 | |||||||||
| Gain on sale of securities available-for-sale |
308 | 2,168 | 137 | |||||||||
| Other non-interest income |
2,074 | 1,075 | 1,592 | |||||||||
| Total non-interest income |
20,505 | 20,811 | 20,360 | |||||||||
| Non-interest expense: |
||||||||||||
| Salaries and employee benefits |
22,319 | 20,428 | 19,823 | |||||||||
| Occupancy and equipment expense |
7,375 | 7,047 | 7,032 | |||||||||
| Communication expense |
664 | 756 | 791 | |||||||||
| Office supplies and postage expense |
1,158 | 1,337 | 1,137 | |||||||||
| Marketing expense |
1,068 | 932 | 1,090 | |||||||||
| Amortization of intangible assets |
1,127 | 1,453 | 1,622 | |||||||||
| Professional fees |
3,250 | 2,893 | 2,661 | |||||||||
| FDIC insurance premium |
1,601 | 2,284 | 557 | |||||||||
| Other non-interest expense |
5,918 | 6,078 | 4,665 | |||||||||
| Total non-interest expenses |
44,480 | 43,208 | 39,378 | |||||||||
| Income before income tax expense |
16,229 | 14,884 | 13,177 | |||||||||
| Income tax expense |
4,605 | 3,436 | 2,820 | |||||||||
| Net income |
$11,624 | $11,448 | $10,357 | |||||||||
| Dividends and accretion of discount on preferred stock |
— | 1,084 | 47 | |||||||||
| Net income available to common shareholders |
$11,624 | $10,364 | $10,310 | |||||||||
| Earnings Per Common Share: |
||||||||||||
| Basic |
$ 2.49 | $ 2.25 | $ 2.23 | |||||||||
| Diluted |
$ 2.48 | $ 2.24 | $ 2.21 | |||||||||
The accompanying notes are an integral part of the consolidated financial statements.
41
Table of Contents
Alliance Financial Corporation and Subsidiaries
Consolidated Statements of Changes in Shareholders’ Equity
Years Ended December 31, 2010, 2009 and 2008
| Issued and Outstanding Common Shares |
Preferred Stock |
Common Stock |
Surplus |
Undivided Profits |
Accumulated Other Comprehensive Income (Loss) |
Treasury Stock |
Directors’ Deferred Stock |
Total |
||||||||||||||||||||||||||||
| (In thousands, except per share data) | ||||||||||||||||||||||||||||||||||||
| Balance at January 1, 2008 |
4,710,885 | $ — | $4,889 | $38,847 | $75,844 | $1,205 | $(5,225) | $ — | $115,560 | |||||||||||||||||||||||||||
| Comprehensive income: |
||||||||||||||||||||||||||||||||||||
| Net income |
— | — | — | — | 10,357 | — | — | — | 10,357 | |||||||||||||||||||||||||||
| Other comprehensive income, net of taxes |
— | — | — | — | — | (195) | — | — | (195) | |||||||||||||||||||||||||||
| Total comprehensive income |
10,162 | |||||||||||||||||||||||||||||||||||
| Cumulative effect of change in pension measurement date |
— | — | — | — | 44 | (39) | — | — | 5 | |||||||||||||||||||||||||||
| Cumulative effect of change in accounting for adoption of ASC Topic 715-60 |
— | — | — | — | (462) | — | — | — | (462) | |||||||||||||||||||||||||||
| Issuance of preferred stock and warrants |
— | 26,325 | — | 593 | — | — | — | — | 26,918 | |||||||||||||||||||||||||||
| Accretion of preferred stock discount |
— | 6 | — | — | (6) | — | — | — | — | |||||||||||||||||||||||||||
| Issuance of restricted stock |
15,500 | — | 16 | (16) | — | — | — | — | — | |||||||||||||||||||||||||||
| Forfeiture of restricted stock |
(3,575) | — | (4) | (11) | — | — | — | — | (15) | |||||||||||||||||||||||||||
| Amortization of restricted stock |
— | — | — | 374 | — | — | — | — | 374 | |||||||||||||||||||||||||||
| Tax benefit of stock-based compensation |
— | — | — | 37 | — | — | — | — | 37 | |||||||||||||||||||||||||||
| Cash dividend $1.00 per common share |
— | — | — | — | (4,626) | — | — | — | (4,626) | |||||||||||||||||||||||||||
| Preferred stock dividend |
— | — | — | — | (41) | — | — | — | (41) | |||||||||||||||||||||||||||
| Treasury stock purchased |
(143,900) | — | — | — | — | — | (3,431) | — | (3,431) | |||||||||||||||||||||||||||
| Directors’ deferred stock plan purchase |
— | — | — | 2,098 | — | — | — | (2,098) | — | |||||||||||||||||||||||||||
| Balance at December 31, 2008 |
4,578,910 | $26,331 | $4,901 | $41,922 | $81,110 | $971 | $(8,656) | $(2,098) | $144,481 | |||||||||||||||||||||||||||
| Comprehensive income: |
||||||||||||||||||||||||||||||||||||
| Net income |
— | — | — | — | 11,448 | — | — | — | 11,448 | |||||||||||||||||||||||||||
| Other comprehensive loss, net of taxes |
— | — | — | — | — | (25) | — | — | (25) | |||||||||||||||||||||||||||
| Total comprehensive income |
11,423 | |||||||||||||||||||||||||||||||||||
| Redemption of preferred stock |
— | (26,918) | — | — | — | — | — | — | (26,918) | |||||||||||||||||||||||||||
| Accretion of preferred stock discount |
— | 587 | — | — | (587) | — | — | — | — | |||||||||||||||||||||||||||
| Issuance of restricted stock |
11,850 | — | 12 | (12) | — | — | — | — | — | |||||||||||||||||||||||||||
| Forfeiture of restricted stock |
(16,450) | — | (16) | (49) | — | — | — | — | (65) | |||||||||||||||||||||||||||
| Retirement of common stock |
(14,078) | — | (14) | (407) | — | — | — | — | (421) | |||||||||||||||||||||||||||
| Amortization of restricted stock |
— | — | — | 373 | — | — | — | — | 373 | |||||||||||||||||||||||||||
| Stock options exercised |
54,689 | — | 54 | 1,298 | — | — | — | — | 1,352 | |||||||||||||||||||||||||||
| Tax benefit of stock-based compensation |
— | — | — | 80 | — | — | — | — | 80 | |||||||||||||||||||||||||||
| Cash dividend $1.08 per common share |
— | — | — | — | (4,973) | — | — | — | (4,973) | |||||||||||||||||||||||||||
| Preferred stock dividend |
— | — | — | — | (497) | — | — | — | (497) | |||||||||||||||||||||||||||
| Repurchase of warrant |
— | — | — | (593) | (307) | — | — | — | (900) | |||||||||||||||||||||||||||
| Directors’ deferred stock plan purchase |
— | — | — | 401 | — | — | — | (401) | — | |||||||||||||||||||||||||||
| Balance at December 31, 2009 |
4,614,921 | $ — | $4,937 | $43,013 | $86,194 | $946 | $(8,656) | $(2,499) | $123,935 | |||||||||||||||||||||||||||
| Comprehensive income: |
||||||||||||||||||||||||||||||||||||
| Net income |
— | — | — | — | 11,624 | — | — | — | 11,624 | |||||||||||||||||||||||||||
42
Table of Contents
Alliance Financial Corporation and Subsidiaries
Consolidated Statements of Changes in Shareholders’ Equity (Cont’d.)
Years Ended December 31, 2010, 2009 and 2008
| Issued and Outstanding Common Shares |
Preferred Stock |
Common Stock |
Surplus |
Undivided Profits |
Accumulated Other Comprehensive Income (Loss) |
Treasury Stock |
Directors’ Deferred Stock |
Total |
||||||||||||||||||||||||||||
| (In thousands, except per share data) | ||||||||||||||||||||||||||||||||||||
| Other comprehensive income, net of taxes |
— | — | — | — | — | 767 | — | — | 767 | |||||||||||||||||||||||||||
| Total comprehensive income |
12,391 | |||||||||||||||||||||||||||||||||||
| Issuance of restricted stock |
34,097 | — | 34 | (34) | — | — | — | — | — | |||||||||||||||||||||||||||
| Forfeiture of restricted stock |
(3,865) | — | (4) | 1 | — | — | — | — | (3) | |||||||||||||||||||||||||||
| Retirement of common stock |
(766) | — | (1) | (19) | — | — | — | — | (20) | |||||||||||||||||||||||||||
| Amortization of restricted stock |
— | — | — | 360 | — | — | — | — | 360 | |||||||||||||||||||||||||||
| Stock options exercised |
84,648 | — | 85 | 1,513 | — | — | — | — | 1,598 | |||||||||||||||||||||||||||
| Tax benefit of stock-based compensation |
— | — | — | 308 | — | — | — | — | 308 | |||||||||||||||||||||||||||
| Cash dividend $1.16 per common share |
— | — | — | — | (5,438) | — | — | — | (5,438) | |||||||||||||||||||||||||||
| Directors’ deferred stock plan purchase |
— | — | — | 478 | — | — | — | (478) | — | |||||||||||||||||||||||||||
| Balance at December 31, 2010 |
4,729,035 | $— | $5,051 | $45,620 | $92,380 | $1,713 | $(8,656) | $(2,977) | $133,131 | |||||||||||||||||||||||||||
The accompanying notes are an integral part of the consolidated financial statements
43
Table of Contents
Alliance Financial Corporation and Subsidiaries
Consolidated Statements of Comprehensive Income
Years Ended December 31, 2010, 2009 and 2008
| 2010 | 2009 | 2008 | ||||||||||
| (In thousands) | ||||||||||||
| Net income |
$11,624 | $11,448 | $10,357 | |||||||||
| Other comprehensive income (loss) net of tax: |
||||||||||||
| Net unrealized gains for the period on securities available for sale, net of tax expense of $622 in 2010, $816 in 2009, and $1,275 in 2008 |
1,051 | 1,291 | 2,021 | |||||||||
| Reclassification adjustment for security gains included in net income, net of tax expense of $119 in 2010, $839 in 2009, and $53 in 2008 |
(189) | (1,329) | (84) | |||||||||
| Change in accumulated unrealized loss and prior service costs for benefit obligations, net of tax (benefit) expense of $(61) in 2010, $9 in 2009 and $(1,371) in 2008 |
(95) | 13 | (2,132) | |||||||||
| Total other comprehensive income (loss), net of tax |
767 | (25) | (195) | |||||||||
| Comprehensive income |
$12,391 | $11,423 | $10,162 | |||||||||
The accompanying notes are an integral part of the consolidated financial statements.
44
Table of Contents
Alliance Financial Corporation and Subsidiaries
Consolidated Statements of Cash Flows
Years Ended December 31, 2010, 2009 and 2008
| 2010 | 2009 | 2008 | ||||||||||
| Operating activities: | (In thousands) | |||||||||||
| Net income |
$11,624 | $11,448 | $10,357 | |||||||||
| Adjustments to reconcile net income to net cash provided by operating activities: |
||||||||||||
| Provision for credit losses |
4,085 | 6,100 | 5,502 | |||||||||
| Depreciation expense |
2,353 | 2,405 | 2,516 | |||||||||
| Increase in surrender value of life insurance |
(1,058) | (1,014) | (856) | |||||||||
| Deferred income tax (benefit) provision |
(1,213) | 150 | 439 | |||||||||
| Amortization of investment security discounts and premiums, net |
2,700 | 1,488 | 189 | |||||||||
| Net gain on sale of securities available-for-sale |
(308) | (2,168) | (137) | |||||||||
| Net gain on sale of premises and equipment |
(8) | (16) | — | |||||||||
| Impairment write-down on premises |
— | 105 | — | |||||||||
| Proceeds from the sale of loans and leases held-for-sale |
67,604 | 46,968 | 25,281 | |||||||||
| Origination of loans held-for-sale |
(68,710) | (46,752) | (12,223) | |||||||||
| Net gains on sale of loans and leases |
(1,394) | (748) | (252) | |||||||||
| Write-down of leases transferred to held-for-sale |
— | — | 160 | |||||||||
| Gain on sale of insurance agency |
(815) | — | — | |||||||||
| Gain on sale of assets held-for-sale |
— | — | (99) | |||||||||
| (Gain) loss on foreclosed real estate-owned |
(5) | 8 | (71) | |||||||||
| Amortization of capitalized servicing rights |
329 | 321 | 272 | |||||||||
| Amortization of intangible assets |
1,127 | 1,453 | 1,622 | |||||||||
| Restricted stock expense, net |
357 | 308 | 359 | |||||||||
| Change in prepaid/accrued FDIC insurance premium |
1,479 | (5,551) | 133 | |||||||||
| Change in other assets and liabilities |
1,226 | (1,924) | 1,130 | |||||||||
| Net cash provided by operating activities |
19,373 | 12,581 | 34,322 | |||||||||
| Investing activities: |
||||||||||||
| Proceeds from maturities, redemptions, calls and principal repayments of investment securities, available-for-sale |
116,279 | 139,782 | 84,456 | |||||||||
| Proceeds from sales of investment securities available-for-sale |
9,571 | 94,943 | 6,299 | |||||||||
| Purchase of investment securities available-for-sale |
(179,129) | (297,115) | (114,040) | |||||||||
| Purchase of FRB and FHLB stock |
(11,656) | (25,997) | (22,466) | |||||||||
| Redemption of FRB and FHLB stock |
13,078 | 27,767 | 20,129 | |||||||||
| Net decrease (increase) in loans and leases |
11,671 | (9,694) | (31,468) | |||||||||
| Purchases of premises and equipment |
(1,418) | (1,409) | (1,553) | |||||||||
| Proceeds from the sale of premises and equipment |
168 | 31 | 119 | |||||||||
| Proceeds from disposition of assets held-for-sale |
— | — | 176 | |||||||||
| Proceeds from disposition of foreclosed assets |
855 | 211 | 689 | |||||||||
| Purchase of bank-owned life insurance |
— | (1,400) | (7,000) | |||||||||
| Proceeds from sale of insurance agency |
1,904 | — | — | |||||||||
| Net cash used in investing activities |
(38,677) | (72,881) | (64,659) | |||||||||
| Financing activities: |
||||||||||||
| Net increase in demand deposits, NOW, money market and savings accounts |
91,704 | 118,321 | 56,886 | |||||||||
| Net (decrease) increase in time deposits |
(32,777) | 19,468 | (64,234) | |||||||||
| Net (decrease) increase in short-term borrowings |
(14,915) | (32,488) | 5,215 | |||||||||
| Payments on long-term borrowings |
(15,000) | (68,777) | (17,000) | |||||||||
| Proceeds from long-term borrowings |
— | 35,000 | 50,000 | |||||||||
| Proceeds from the exercise of stock options |
1,598 | 1,352 | — | |||||||||
| Retirement of common stock |
(20) | (421) | — | |||||||||
| Treasury stock purchased |
— | — | (3,431) | |||||||||
| Purchase of shares for directors’ deferred stock-based plan |
(478) | (401) | (2,098) | |||||||||
| Tax benefit of stock-based compensation |
308 | 80 | 37 | |||||||||
| Issuance of preferred stock and warrants |
— | — | 26,918 | |||||||||
| Redemption of preferred stock |
— | (26,918) | — | |||||||||
| Repurchase of warrant |
— | (900) | — | |||||||||
| Cash dividends paid to common shareholders |
(5,311) | (4,872) | (4,570) | |||||||||
| Cash dividends paid to preferred shareholders |
— | (538) | — | |||||||||
| Net cash provided by financing activities |
25,109 | 38,906 | 47,723 | |||||||||
| Net increase (decrease) in cash and cash equivalents |
5,805 | (21,394) | 17,386 | |||||||||
| Cash and cash equivalents at beginning of year |
26,696 | 48,090 | 30,704 | |||||||||
| Cash and cash equivalents at end of year |
$32,501 | $26,696 | $48,090 | |||||||||
45
Table of Contents
Alliance Financial Corporation and Subsidiaries
Consolidated Statements of Cash Flows (cont’d)
Years Ended December 31, 2010, 2009 and 2008
| 2010 | 2009 | 2008 | ||||||||||
| Supplemental Disclosures of Cash Flow Information: | (In thousands) | |||||||||||
| Interest received during the year |
$60,360 | $64,013 | $68,336 | |||||||||
| Interest paid during the year |
16,407 | 21,873 | 31,113 | |||||||||
| Income taxes paid |
5,542 | 3,657 | 1,377 | |||||||||
| Non-cash investing activities: |
||||||||||||
| Change in unrealized loss on securities available-for-sale |
1,365 | (61) | 3,203 | |||||||||
| Transfer between premises and equipment and assets held-for-sale |
— | — | 724 | |||||||||
| Transfer of loans to foreclosed real estate |
1,138 | 440 | 660 | |||||||||
| Transfer of leases to held-for-sale |
— | — | 10,819 | |||||||||
| Non-cash financing activities: |
||||||||||||
| Dividends declared and unpaid |
1,419 | 1,292 | 1,232 | |||||||||
The accompanying notes are an integral part of the consolidated financial statements.
46
Table of Contents
Alliance Financial Corporation and Subsidiaries
Notes to Consolidated Financial Statements
Nature of Operations
Alliance Financial Corporation (the “Company” or “Alliance”) is a financial holding company which owns and operates Alliance Bank, N.A. (the “Bank”), Alliance Financial Capital Trust I, Alliance Financial Capital Trust II (collectively the “Capital Trusts”) and Ladd’s Agency, Inc. (“Ladd’s Agency”), a multi-line insurance agency. In December 2010, Alliance sold substantially all of the assets of Ladd’s Agency Inc. and discontinued its operations. Alliance provides financial services through the Bank in 29 retail branches and customer service facilities in the New York counties of Cortland, Madison, Oneida, Onondaga, Oswego, and from a Trust Administration Center in Buffalo, NY. Primary services include commercial, retail and municipal banking, consumer finance, mortgage financing and servicing, and investment management services. The Capital Trusts were formed for the purpose of issuing company-obligated mandatorily redeemable capital securities to third-party investors and investing the proceeds from the sale of such capital securities solely in junior subordinated debt securities of Alliance. The Bank has a substantially wholly-owned subsidiary, Alliance Preferred Funding Corp., which is engaged in residential real estate activity, and a wholly-owned subsidiary, Alliance Leasing, Inc., which was engaged in commercial equipment financing activity in over thirty states until the third quarter of 2008, at which time Alliance Leasing, Inc. ceased the origination of new leases.
1. Basis of Presentation and Significant Accounting Policies
Principles of Consolidation
The consolidated financial statements include the accounts of Alliance, the Bank, and Ladd’s Agency, Inc., after elimination of intercompany accounts and transactions. The Capital Trusts qualify as variable interest entities under Accounting Standards Topic 810-10-05, “Consolidation of Variable Interest Entities”. However, Alliance is not the primary beneficiary and therefore has not consolidated the accounts of the Capital Trusts in its consolidated financial statements.
Critical Accounting Estimates and Policies
The preparation of financial statements in conformity with United States generally accepted accounting principles requires management to make estimates and assumptions that affect the reported amounts of assets and liabilities and disclosure of contingent assets and liabilities at the date of the financial statements and the reported amounts of revenues and expenses during the reporting period. Management has identified the allowance for credit losses, income taxes, and the carrying value of goodwill and intangible assets to be the accounting areas that require the most subjective and complex judgments, and as such could be the most subject to revision as new information becomes available. Actual results could differ from those estimates.
Risk and Uncertainties
In the normal course of its business, Alliance encounters economic and regulatory risks. There are three main components of economic risk: interest rate risk, credit risk and market risk. Alliance is subject to interest rate risk to the degree that its interest-bearing liabilities mature or reprice at different speeds, or on different bases, from its interest-earning assets. Alliance’s primary credit risk is the risk of default on Alliance’s loan and lease portfolio that results from the borrowers’ inability or unwillingness to make contractually required payments. Market risk reflects potential changes in the value of collateral underlying loans, the fair value of investment securities, and the value of loans held for sale.
Alliance is subject to regulations of various governmental agencies. These regulations can and do change significantly from period to period. Alliance also undergoes periodic examinations by the regulatory agencies, which may subject it to further changes with respect to asset valuations, amounts of required loan and lease loss allowances, and operating restrictions resulting from the regulators’ judgments based on information available to them at the time of their examinations.
Alliance is also subject to liquidity risk which is the current and prospective risk to earnings or capital arising from a bank’s ability to meet its obligations when they come due without incurring unacceptable losses. Alliance’s liquidity is primarily measured by the Bank’s ability to provide funds to meet loans requests, to accommodate possible outflows of deposits, and to take advantage of market interest rate opportunities.
47
Table of Contents
Alliance Financial Corporation and Subsidiaries
Notes to Consolidated Financial Statements
Cash Flows
Cash and cash equivalents include cash, deposits with other financial institutions with maturities fewer than 90 days, and federal funds sold. Net cash flows are reported for customer loan, lease and deposit transactions, interest-bearing deposits in other financial institutions, and federal funds purchased and repurchase agreements.
Securities
Alliance classifies debt securities as held-to-maturity or available-for-sale at the time of purchase. Held-to-maturity debt securities are those that Alliance has the positive intent and ability to hold to maturity, and are reported at cost, adjusted for amortization of premiums and accretion of discounts. Debt securities not classified as held-to-maturity are classified as available-for-sale and are reported at fair value, with net unrealized gains and losses reflected as a separate component of accumulated other comprehensive income, net of taxes. None of Alliance’s debt securities have been classified as trading securities or held-to-maturity. Equity securities with readily determinable fair values are classified as available-for-sale.
Gains and losses on the sale of securities are based on the specific identification method. Premiums and discounts on securities are amortized and accreted into income using the interest method over the life of the security without anticipating prepayments, except for mortgage-backed securities where prepayments are anticipated. Purchases and sales of securities are recognized on a trade-date basis.
Securities are reviewed regularly for other than temporary impairment. When an investment is impaired, we assess whether we intend to sell the security, or it is more likely than not that we will be required to sell the security before recovery of its amortized cost basis less any current-period credit losses. For debt securities, that are considered other than temporarily impaired and that we do not intend to sell and will not be required to sell prior to recovery of our amortized cost basis, we separate the amount of the impairment into the amount that is credit related (credit loss component) and the amount due to all other factors. The credit loss component is recognized in earnings and is calculated as the difference between the investment’s amortized cost basis and the present value of its expected future cash flows discounted at the accretable yield. The cost basis of individual equity securities is written down to estimated fair value through a charge to earnings when decline in value below cost are considered to be other than temporary.
Federal Home Loan Bank of New York (“FHLB”) and Federal Reserve Bank (“FRB”) Stock
Alliance is a member of the FHLB system and the FRB. Members are required to own a certain amount of stock based on the level of borrowings and other factors, and may invest in additional amounts. FHLB and FRB stock is carried at cost, classified as a restricted security, and periodically evaluated for impairment based on ultimate recovery of par value. Both cash and stock dividends are reported as income.
Securities Sold under Agreements to Repurchase
Repurchase agreements are accounted for as collateralized borrowings, and the obligations to repurchase securities sold are reflected as a liability in the balance sheet, since Alliance maintains effective control over the transferred securities. The securities underlying the agreements remain in Alliance’s securities portfolio. The fair value of the collateral provided to a third party is continually monitored, and additional collateral is provided to the third party, or surplus collateral is returned to Alliance as deemed appropriate.
Loans Held for Sale and Mortgage Servicing Rights
Mortgage loans originated and intended for sale in the secondary market are carried at the lower of aggregate cost or fair value, as determined by outstanding commitments from investors. Net unrealized losses, if any, are charged to earnings.
Mortgage loans held for sale are generally sold with servicing rights retained. The carrying value of mortgage loans sold is reduced by the amount allocated to the servicing right. Gains and losses on sales of mortgage loans are based on the difference between the selling price and the carrying value of the related loan sold.
Mortgage servicing rights are recognized separately when they are acquired through sales of loans. When mortgage loans are sold, servicing rights are initially recorded at fair value with the income statement effect recorded in gains on sale of loans. Fair value is based on a valuation model that calculates the present value of estimated future net servicing income. The valuation model incorporates assumptions that market participants would use in estimating future net servicing income, such as the cost to service, the
48
Table of Contents
Alliance Financial Corporation and Subsidiaries
Notes to Consolidated Financial Statements
discount rate, the custodial earnings rate, an inflation rate, ancillary income, prepayment speeds and default rates and losses. All classes of servicing assets are subsequently measured using the amortization method which requires servicing rights to be amortized into non-interest income in proportion to, and over the period of, the estimated future net servicing income of the underlying loans.
Servicing assets are evaluated for impairment based upon the fair value of the rights as compared to carrying amount. Impairment is determined by stratifying rights into groupings based on predominant risk characteristics, such as interest rate, loan type and investor type. Impairment is recognized through a valuation allowance for an individual grouping, to the extent that fair value is less than the carrying amount. If Alliance later determines that all or a portion of the impairment no longer exists for a particular grouping, a reduction of the allowance may be recorded as an increase to income. The fair values of servicing rights are subject to significant fluctuations as a result of changes in estimated and actual prepayment speeds and default rates and losses.
Servicing fee income which is reported on the income statement as other non-interest income is recorded for fees earned for servicing loans and recorded as income when earned. The amortization of mortgage servicing rights is netted against loans servicing fee income.
Loans and Leases
Loans and leases held for investment are stated at unpaid principal balances, unearned interest income, net deferred loan origination fees and costs, and the allowance for credit losses. Interest on loans is based upon the principal amount outstanding. Interest on loans is accrued except when in management’s opinion the collectibility of interest is doubtful, at which time the accrual of interest on the loan is discontinued and the amount of accrued interest is reversed. Loan and lease origination fees and certain direct origination costs are deferred and the net amount is amortized as a yield adjustment over the life of the loan or lease. For disclosure purposes, the unpaid principal balance approximates the recorded investment in loans and leases which is net of any partial charge-offs, but excludes accrued interest receivable and net deferred costs.
Loans are made to individuals as well as commercial and tax exempt entities. Specific loan terms vary as to interest rate, repayment and collateral requirements based on the type of loan and credit worthiness of the prospective borrower. Credit risk tends to be geographically concentrated in that a majority of the loan customers are located in the markets serviced by Alliance.
Commercial credits typically comprise working capital loans, loans for physical assets expansion, asset acquisition loans and other business loans. Commercial loans are made based primarily on the historical and projected cash flows of the borrower and secondarily the underlying collateral provided by the borrower. Loans to closely held businesses will generally be guaranteed in full or for a meaningful amount by the businesses major owners. The cash flows of borrowers, however, may not behave as forecasted and collateral values may fluctuate due to economic or individual performance factors. Minimum standards and underwriting guidelines have been established for all commercial loan types.
Commercial real estate loans are subject to underwriting standards and processes similar to commercial loans. These loans are viewed primarily as cash flow loans and the repayment of these loans is largely dependent on the successful operation of the property. Commercial real estate loans may be more adversely affected by conditions in the real estate markets or the general economy.
Lease financings, included in portfolio loans and leases on the consolidated balance sheet consist of direct financing leases of commercial equipment, primarily computers and office equipment, manufacturing equipment, commercial truck and trailers, and medical equipment. Income attributable to finance leases is initially recorded as unearned income and subsequently recognized as finance income at level rates of return over the term of the leases. The recorded residual values of Alliance’s leased assets are estimated at the inception of the lease to be the expected fair market value of the assets at the end of the lease term. Alliance reviews commercial lease residual values at least annually and recognizes residual value impairments deemed to be other than temporary. In accordance with U.S. generally accepted accounting principles, anticipated increases in specific future residual values are not recognized before realization. Operating leases are stated at cost of the equipment less scheduled depreciation. Equipment on operating leases is depreciated on a straight-line basis to its estimated residual value over the lease term. Operating lease income is recognized on a straight-line basis over the term of the lease.
Alliance originates direct and indirect consumer loans including residential real estate, home equity lines and loans, indirect vehicle loans, and other consumer direct loan types. Each loan type has a separate automated decision system which consists of several factors including debt to income, type of collateral and loan to collateral value, credit history and our relationship with the borrower.
Alliance’s credit policy includes an independent loan review process that reviews and validates the credit risk program on a periodic basis.
49
Table of Contents
Alliance Financial Corporation and Subsidiaries
Notes to Consolidated Financial Statements
Allowance for Credit Losses
The allowance for credit losses represents management’s best estimate of probable incurred losses in Alliance’s loan and lease portfolio. Management’s quarterly evaluation of the allowance for credit losses is a comprehensive analysis that builds a total allowance by evaluating the probable incurred losses within each loan and lease portfolio segment. Alliance’s portfolio segments are as follows: commercial loan and commercial real estate loans, commercial leases, residential real estate, indirect consumer loans and other consumer loans. Alliance’s allowance for credit losses consists of specific valuation allowances based on probable credit losses on specific loans, historical valuation allowances based on loan loss experience for similar loans with similar characteristics and trends and general valuation allowances based on general economic conditions and other qualitative risk factors both internal and external to the organization.
Historical valuation allowances are calculated for commercial loans and leases based on the historical loss experience of specific types of loans and leases and the internal risk grade 24 months prior to the time they were charged off. The internal credit risk grading process evaluates, among other things, the borrower’s ability to repay, the underlying collateral, if any, and the economic environment and industry in which the borrower operates. Historical valuation allowances for residential real estate and consumer loan segments are based on the average loss rates for each class of loans for the time period that includes the current year and two full prior years. Alliance calculates historical loss ratios for pools of similar consumer loans based upon the product of the historical loss ratio and the principal balance of the loans in the pool. Historical loss ratios are updated quarterly based on actual loss experience.
For commercial loan and lease segments, Alliance evaluates those classified in our internal risk grading system as substandard, doubtful or loss with a principal balance in excess of $200,000 to determine if they are impaired. A loan or lease is considered impaired, based on current information and events, if it is probable that Alliance will be unable to collect the scheduled payments of principal or interest when due according to the contractual terms of the loan or lease agreement. The measurement of impaired loans and leases is generally discounted at the historical effective interest rate, except that all collateral-dependent loans and leases are measured for impairment based on the estimated fair value of the collateral. Loans with modified terms in which a concession to the borrower has been made that we would not otherwise consider unless the borrower was experiencing financial difficulties, are considered troubled debt restructurings and classified as impaired. Impaired loans and leases are measured at the present value of their estimated future cash flows using the instruments’ effective rate at inception. If a troubled debt restructuring is considered to be a collateral dependent loan, the loan is reported, net, at the fair value of the collateral. For troubled debt restructurings that subsequently default, Alliance determines the amount of reserve in accordance with the accounting policy for the allowance for credit losses. Large groups of smaller balance homogenous loans, such as consumer and residential real estate loans less than $200,000, are collectively evaluated for impairment, and accordingly, they are not separately identified for impairment disclosures.
General valuation allowances are based on general economic conditions and other qualitative risk factors which affect our company. Factors considered include trends in our delinquency rates, macro-economic and credit market conditions, changes in asset quality, changes in loan and lease portfolio volumes, concentrations of credit risk, the changes in internal loan policies, procedures and internal controls, experience and effectiveness of lending personnel. Management evaluates the degree of risk that each one of these components has on the quality of the loan and lease portfolio on a quarterly basis.
Loans and leases are charged off when they are considered a loss regardless of the delinquency status. From a delinquency standpoint, the policy of Alliance is to charge off loans when they are 120 days past due unless extenuating circumstances are documented that attest to the ability to collect the loan. Special circumstances to include fraudulent loans and loans in bankruptcy will be charged off no later than 90 days of discovery or 120 days delinquent, whichever is shorter. In lieu of charging off the entire loan balance, loans with collateral may be written down to the value of the collateral, less cost to sell, if foreclosure or repossession of collateral is assured and is in process.
Income Recognition on Impaired and Non-Accrual Loans and Leases
Loans and leases, including impaired loans or leases, are generally classified as non-accrual if they are past due as to maturity of payment of principal or interest for a period of more than 90 days unless they are well secured and are in the process of collection. While a loan or lease is classified as non-accrual and the future collectibility of the recorded loan or lease balance is doubtful, collections of interest and principal are generally applied as a reduction to principal outstanding.
50
Table of Contents
Alliance Financial Corporation and Subsidiaries
Notes to Consolidated Financial Statements
Goodwill and Intangible Assets
Goodwill represents the excess of the purchase price over the fair value of net assets acquired for transactions accounted for under the purchase method of accounting for business combinations. Goodwill is not being amortized, but is evaluated at least annually for impairment. Alliance has selected October 31 as the date to perform the annual impairment test. Intangible assets resulting from the acquisition of Bridge Street Financial, Inc. in 2006 include core deposit intangibles, customer relationship intangibles and a covenant to not compete. The core deposit intangible is being amortized over 10 years using an accelerated method. The non-compete covenant was being amortized on a straight-line basis over a period of 3 years based on the agreement. The customer list intangible related to the Ladd’s Agency was being amortized over 10 years using an accelerated method and was sold in December 2010. The investment management intangible related to the purchase of certain trust accounts and related assets under management from HSBC, USA, N.A. in 2005 is being amortized over the expected useful life of the relationships acquired. These intangibles are tested for impairment whenever events or changes in circumstances indicate that the carrying amounts may not be recoverable. Goodwill is the only intangible asset with an indefinite life on Alliance’s balance sheet.
Premises and Equipment
Land is carried at cost. Bank premises, furniture, and equipment are stated at cost less accumulated depreciation and amortization. Depreciation and amortization are calculated using the straight-line method over the estimated useful lives of the assets. Useful lives range from one year to 10 years for furniture, fixtures and equipment; three to five years for software, hardware, and data handling equipment; and 10 to 39 years for buildings and building improvements. Leasehold improvements are amortized over the term of the respective lease. Maintenance and repairs are charged to operating expenses as incurred. The asset cost and accumulated depreciation are removed from the accounts for assets sold or retired and any resulting gain or loss is included in the determination of the income.
Long-Term Assets
Premises and equipment, core deposit and other intangible assets, and other long-term assets are reviewed for impairment when events indicate their carrying amount may not be recoverable from future undiscounted cash flows. If impaired, the assets are recorded at fair value.
Bank-Owned Life Insurance
The Bank has purchased life insurance policies on certain employees, key executives and directors. Bank-owned life insurance is recorded at the amount that can be realized under the insurance contract at the balance sheet date, which is the cash surrender value adjusted for other charges or other amounts due that are probable at settlement.
Foreclosed Assets
Assets acquired through or instead of loan foreclosure are initially recorded at fair value less costs to sell when acquired, establishing a new cost basis. If fair value declines subsequent to foreclosure, a valuation allowance is recorded through expense. Operating costs after acquisition are expensed.
Loan Commitments and Related Financial Instruments
Financial instruments include off-balance sheet credit instruments, such as commitments to make loans and commercial letters of credit, issued to meet customer financing needs. The face amount for these items represents the exposure to loss, before considering customer collateral or ability to repay. Such financial instruments are recorded when they are funded.
Retirement Plans
Pension expense is the net of service and interest cost, return on plan assets and amortization of gains and losses not immediately recognized. Employee 401(k) and profit sharing plan expense is the amount of matching contributions and employer fixed and discretionary contributions. Deferred compensation and supplemental retirement plan expense allocates the benefits over years of service.
51
Table of Contents
Alliance Financial Corporation and Subsidiaries
Notes to Consolidated Financial Statements
Stock-Based Compensation
Compensation cost is recognized for stock options and restricted stock awards issued to employees, based on the fair value of these awards at the date of grant. A Black-Scholes model was utilized to estimate the fair value of stock options, while the market price of Alliance’s common stock at the date of grant is used for restricted stock awards. Compensation cost is recognized over the required service period, generally defined as the vesting period. For awards with graded vesting, compensation cost is recognized on a straight-line basis over the requisite service period for the entire award.
Directors Stock-Based Deferral Plan
In accordance with Accounting Standards Codification Topic 710-10-25 “Deferred Compensation – Rabbi Trusts,” the stock held in the trust is classified in equity similar to the manner in which treasury stock is classified.
Earnings Per Common Share
Earnings per share is computed using the two-class method. Basic earnings per common share is computed by dividing net income allocated to common stock by the weighted average number of common shares outstanding during the period which excludes the participating securities. All outstanding unvested restricted stock awards containing rights to nonforfeitable dividends are considered participating securities for this calculation. Diluted earnings per common share includes the dilutive effect of additional potential common shares from stock compensation awards and warrants, but excludes awards considered participating securities.
Loss Contingencies
Loss contingencies, including claims and legal actions arising in the ordinary course of business, are recorded as liabilities when the likelihood of loss is probable and an amount or range of loss can be reasonably estimated. Management does not believe there now are such matters that will have a material effect on the financial statements.
Comprehensive Income
Comprehensive income consists of net income and other comprehensive income. Other comprehensive income includes unrealized gains and losses on securities available for sale and changes in funded status of the pension plan, post-retirement medical plan, supplemental executive retirement plans, and directors’ retirement plan which are also recognized as separate components of equity.
Income Taxes
Provision for income taxes is based on taxes currently payable or refundable and deferred income taxes on temporary differences between the tax basis of assets and liabilities and their reported amount in the financial statements. Deferred tax assets and liabilities are reported in the financial statements at currently enacted income tax rates applicable to the period in which the deferred tax assets and liabilities are expected to be realized or settled.
A tax position is recognized as a benefit only if it is more likely than not that the tax position would be sustained in a tax examination, with a tax examination being presumed to occur. The amount recognized is the largest amount of tax benefit that is greater than 50% likely of being realized on examination. For tax positions not meeting the “more likely than not” test, no tax benefit is recorded. Alliance accounts for interest and penalties related to uncertain tax positions as part of its provision for federal and state income taxes.
Restrictions on Cash
Cash on hand or on deposit with the FRB was required to meet regulatory reserve and clearing requirements.
Dividend Restriction
Banking regulations require maintaining certain capital levels and may limit the dividends paid by the Bank to the holding company or by the holding company to shareholders.
52
Table of Contents
Alliance Financial Corporation and Subsidiaries
Notes to Consolidated Financial Statements
Fair Value of Financial Instruments
Fair values of financial instruments are estimated using relevant market information and other assumptions, as more fully disclosed in a separate note. Fair value estimates involve uncertainties and matters of significant judgment regarding interest rates, credit risk, prepayments, and other factors, especially in the absence of broad markets for particular items. Changes in assumptions or in market conditions could significantly affect the estimates.
Segment Reporting
Alliance’s operations are solely in the financial services industry and include providing to its customers traditional banking, equipment leasing and other financial services including investment management services. Alliance operates primarily in the geographical regions of Cortland, Madison, Oneida, Onondaga, and Oswego counties of New York State, and from a Trust Administration Center in Buffalo, NY. In addition, Alliance Leasing conducted business in over thirty states. While Alliance’s chief decision-makers monitor the revenue streams of the various company products and services, the segments that could be separated from Alliance’s primary business of banking do not meet the criteria for separate disclosure. Accordingly, all of Alliance’s financial service operations are considered by management to be combined in one reportable operating segment.
Investment Assets Under Management
Assets held in fiduciary or agency capacities for customers are not included in the accompanying consolidated statements of condition, since such items are not assets of Alliance. Fees associated with providing investment management services are recorded using a method that approximates the accrual basis.
Adoption of New Accounting Standards and New Accounting Updates
In June 2009, FASB issued Accounting Standard Update (“ASU”) Number 2009-16, “Accounting for Transfers of Financial Assets - An Amendment of FASB Statement No. 140.” The new accounting requirement amends previous guidance relating to the transfers of financial assets and eliminates the concept of a qualifying special purpose entity. This statement must be applied as of the beginning of each reporting entity’s first annual reporting period that begins after November 15, 2009, for interim periods within that first annual reporting period and for interim and annual reporting periods thereafter. This statement must be applied to transfers occurring on or after the effective date. Additionally, on and after the effective date, the concept of a qualifying special-purpose entity is no longer relevant for accounting purposes. Therefore, formerly qualifying special-purpose entities should be evaluated for consolidation by reporting entities on and after the effective date in accordance with the applicable consolidation guidance. Additionally, the disclosure provisions of this statement were also amended and apply to transfers that occurred both before and after the effective date of this statement. The adoption did not have a material impact on Alliance’s consolidated financial position, results of operations or cash flows.
Accounting Standards Codification (“ASC”) Topic 810-10-65-2, “Amendments to FASB Interpretation No. 46(R),” which amended guidance for consolidation of variable interest entities by replacing the quantitative-based risks and rewards calculation for determining which enterprise, if any, has a controlling financial interest in a variable interest entity with an approach focused on identifying which enterprise has the power to direct the activities of a variable interest entity that most significantly impact the entity’s economic performance and (1) the obligation to absorb losses of the entity or (2) the right to receive benefits from the entity. This statement also requires additional disclosures about an enterprise’s involvement in variable interest entities. This statement was effective as of the beginning of each reporting entity’s first annual reporting period that begins after November 15, 2009, for interim periods within that first annual reporting period, and for interim and annual reporting periods thereafter. Early adoption is prohibited. The adoption did not have a material impact on Alliance’s consolidated financial position, results of operations or cash flows.
In January 2011, FASB issued Accounting Standards Update No. 2011-01, “Deferral of the Effective Date of Disclosures about Troubled Debt Restructurings in Update No, 2010-20.” The amendments in this Update temporarily delay the effective date of the disclosures about troubled debt restructurings in Accounting Standards Update No. 2010-20, Receivables (Topic 310): Disclosures about the Credit Quality of Financing Receivables and the Allowance for Credit Losses,” for public entities. The delay is intended to allow the Board time to complete its deliberations on what constitutes a troubled debt restructuring. The effective date of the new disclosures about troubled debt restructurings for public entities and the guidance for determining what constitutes a troubled debt restructuring will then be coordinated.
53
Table of Contents
Alliance Financial Corporation and Subsidiaries
Notes to Consolidated Financial Statements
2. Securities
The amortized cost and estimated fair value of securities at December 31 are as follows (in thousands):
| December 31, 2010 | ||||||||||||||||
| Amortized Cost |
Gross Unrealized Gains |
Gross Unrealized Losses |
Estimated Fair Value |
|||||||||||||
| Debt Securities: |
||||||||||||||||
| Obligations of U.S. government-sponsored corporations |
$ 4,020 | $ 166 | $ — | $ 4,186 | ||||||||||||
| Obligations of states and political subdivisions |
77,246 | 1,624 | 658 | 78,212 | ||||||||||||
| Mortgage-backed securities - residential |
324,294 | 5,716 | 1,000 | 329,010 | ||||||||||||
| Total debt securities |
405,560 | 7,506 | 1,658 | 411,408 | ||||||||||||
| Stock Investments: |
||||||||||||||||
| Equity securities |
1,852 | 143 | — | 1,995 | ||||||||||||
| Mutual funds |
1,000 | 25 | 18 | 1,007 | ||||||||||||
| Total stock investments |
2,852 | 168 | 18 | 3,002 | ||||||||||||
| Total available-for-sale |
$408,412 | $7,674 | $1,676 | $414,410 | ||||||||||||
Mortgage-backed securities, which totaled $329.0 million at December 31, 2010, are comprised primarily of pass-through securities backed by conventional residential mortgages and guaranteed by Fannie-Mae, Freddie-Mac or Ginnie Mae, which in turn are backed by the federal government. Alliance does not invest in any securities backed by sub-prime, Alt-A or other high-risk mortgages. Alliance also does not hold any preferred stock, corporate debt or trust preferred securities in its investment portfolio. At December 31, 2010 and 2009, there were no holdings of securities of anyone issuer other than the U.S. government and its agencies in an amount greater than 10% of shareholders’ equity.
| December 31, 2009 | ||||||||||||||||
| Amortized Cost |
Gross Unrealized Gains |
Gross Unrealized Losses |
Estimated Fair Value |
|||||||||||||
| Debt Securities: |
||||||||||||||||
| U.S. Treasury obligations |
$ 100 | $ 1 | $ — | $ 101 | ||||||||||||
| Obligations of U.S. government-sponsored corporations |
5,864 | 265 | — | 6,129 | ||||||||||||
| Obligations of states and political subdivisions |
75,104 | 2,135 | 92 | 77,147 | ||||||||||||
| Mortgage-backed securities - residential |
273,499 | 4,030 | 1,849 | 275,680 | ||||||||||||
| Total debt securities |
354,567 | 6,431 | 1,941 | 359,057 | ||||||||||||
| Stock Investments: |
||||||||||||||||
| Equity securities |
1,958 | 153 | 7 | 2,104 | ||||||||||||
| Mutual funds |
1,000 | 19 | 22 | 997 | ||||||||||||
| Total stock investments |
2,958 | 172 | 29 | 3,101 | ||||||||||||
| Total available-for-sale |
$357,525 | $6,603 | $1,970 | $362,158 | ||||||||||||
The carrying value and estimated fair value of debt securities at December 31, by contractual maturity, are shown as follows (in thousands). The maturities of mortgage-backed securities are based on average life of the security. All other expected maturities differ from contractual maturities because borrowers may have the right to call or prepay obligations with or without call or prepayment penalties.
| December 31, 2010 | ||||||||
| Amortized Cost | Estimated Fair Value | |||||||
| Due in one year or less |
$ 92,034 | $ 93,651 | ||||||
| Due after one year through five years |
202,702 | 206,541 | ||||||
| Due after five years through ten years |
90,207 | 90,885 | ||||||
| Due after ten years |
20,617 | 20,331 | ||||||
| Total debt securities |
$405,560 | $411,408 | ||||||
54
Table of Contents
Alliance Financial Corporation and Subsidiaries
Notes to Consolidated Financial Statements
| December 31, 2009 | ||||||||
| Amortized Cost | Estimated Fair Value | |||||||
| Due in one year or less |
$ 85,572 | $ 86,901 | ||||||
| Due after one year through five years |
177,199 | 179,738 | ||||||
| Due after five years through ten years |
71,930 | 72,368 | ||||||
| Due after ten years |
19,866 | 20,050 | ||||||
| Total debt securities |
$354,567 | $359,057 | ||||||
At December 31, 2010 and 2009, securities with a carrying value of $402.3 million and $319.0 million, respectively, were pledged as collateral for certain deposits and other purposes as required or permitted by law.
Alliance recognized gross gains on sales of securities of $313,000, $2.2 million, and $137,000, for 2010, 2009, and 2008, respectively, and gross losses of $5,000, $0, and $0, for 2010, 2009, and 2008, respectively. The tax provision related to these net realized gains was $119,000, $839,000, and $53,000, respectively.
The following table shows the securities with unrealized losses at year end, aggregated by investment category and length of time that individual securities have been in a continuous unrealized loss position, at the dates indicated (in thousands):
| December 31, 2010 | ||||||||||||||||||||||||
| Less than 12 Months | 12 Months or Longer | Total | ||||||||||||||||||||||
| Type of Security |
Estimated Fair Value |
Unrealized Losses |
Estimated Fair Value |
Unrealized
Losses |
Estimated Fair Value |
Unrealized Losses |
||||||||||||||||||
| Obligations of states and political subdivisions |
$21,482 | $ 658 | $ — | $ — | $21,482 | $658 | ||||||||||||||||||
| Mortgage-backed securities |
58,211 | 909 | 1,579 | 91 | 59,790 | 1,000 | ||||||||||||||||||
| Subtotal, debt securities |
79,693 | 1,567 | 1,579 | 91 | 81,272 | 1,658 | ||||||||||||||||||
| Mutual funds |
— | — | 482 | 18 | 482 | 18 | ||||||||||||||||||
| Total temporarily impaired securities |
$79,693 | $1,567 | $2,061 | $109 | $81,754 | $1,676 | ||||||||||||||||||
| December 31, 2009 | ||||||||||||||||||||||||
| Less than 12 Months | 12 Months or Longer | Total | ||||||||||||||||||||||
| Type of Security |
Estimated Fair Value |
Unrealized Losses |
Estimated Fair Value |
Unrealized Losses |
Estimated Fair Value |
Unrealized Losses |
||||||||||||||||||
| Obligations of states and political subdivisions |
$ 7,013 | $ 87 | $ 200 | $ 5 | $ 7,213 | $ 92 | ||||||||||||||||||
| Mortgage-backed securities |
82,274 | 1,773 | 1,747 | 76 | 84,021 | 1,849 | ||||||||||||||||||
| Subtotal, debt securities |
89,287 | 1,860 | 1,947 | 81 | 91,234 | 1,941 | ||||||||||||||||||
| Equity securities |
— | — | 23 | 7 | 23 | 7 | ||||||||||||||||||
| Mutual funds |
— | — | 478 | 22 | 478 | 22 | ||||||||||||||||||
| Total temporarily impaired securities |
$89,287 | $1,860 | $2,448 | $110 | $91,735 | $1,970 | ||||||||||||||||||
Management does not believe any individual unrealized loss as of December 31, 2010 represents an other-than-temporary impairment. A total of 104 available-for-sale securities were in a continuous unrealized loss position for less than 12 months and 4 securities for 12 months or longer. The unrealized losses relate primarily to debt securities issued by FNMA, GNMA, FHLMC, FHLB, the State of New York, and various political subdivisions within the State of New York. These unrealized losses are primarily attributable to changes in interest rates and other market conditions such as the variability of risk premiums demanded by investors. Alliance does not intend to sell these securities and does not believe it will be required to sell them prior to recovery of the amortized cost.
55
Table of Contents
Alliance Financial Corporation and Subsidiaries
Notes to Consolidated Financial Statements
3. Loans and Leases
Major classifications of loans and leases at December 31 are as follows (in thousands):
| 2010 | 2009 | |||||||
| Residential real estate |
$334,967 | $356,906 | ||||||
| Commercial loans |
133,787 | 111,243 | ||||||
| Commercial real estate |
116,066 | 96,753 | ||||||
| Leases |
47,549 | 76,224 | ||||||
| Consumer: |
||||||||
| Indirect auto loans |
176,125 | 184,947 | ||||||
| Home equity line of credit |
68,762 | 63,662 | ||||||
| Other consumer loans |
22,857 | 28,360 | ||||||
| Total |
900,113 | 918,095 | ||||||
| Unearned income |
(5,083) | (8,000) | ||||||
| Net deferred loan costs |
3,507 | 4,067 | ||||||
| Total loans and leases |
898,537 | 914,162 | ||||||
| Allowance for credit losses |
(10,683) | (9,414) | ||||||
| Net loans and leases |
$887,854 | $904,748 | ||||||
Mortgage loans serviced for others are not included in the accompanying consolidated balance sheet. The unpaid principal balances of mortgage loans serviced for others were $188.8 million and $151.0 million at December 31, 2010 and 2009, respectively. Servicing fee income, net of mortgage servicing rights amortization, totaled $90,000, $42,000, and $82,000 for the years ended December 31, 2010, 2009 and 2008.
The following table summarizes the changes in the carrying value of mortgage servicing rights (in thousands):
| 2010 | 2009 | 2008 | ||||||||||
| Balance at January 1 |
$ 909 | $845 | $976 | |||||||||
| Additions |
583 | 385 | 141 | |||||||||
| Amortization |
(329) | (321) | (272) | |||||||||
| Balance at December 31 |
$1,163 | $909 | $845 | |||||||||
The fair value of mortgage servicing rights was $1.3 million and $1.1 million at December 31, 2010 and 2009, respectively. Fair value at December 31, 2010 was determined using a discount rate of 7.75%, prepayment speed assumptions (PSA) ranging from 352% in the first year to 257% in the third year and servicing cost per loan of $56. Fair value at December 31, 2009 was determined using a discount rate of 8.28%, prepayment speed assumptions (PSA) ranging from 339% in the first year to 241% in the third year and servicing cost per loan of $56.
The estimated residual value of leased assets was $242,000 and $297,000 at December 31, 2010 and 2009, respectively.
At December 31, 2010, the minimum future lease payments to be received from lease financings were as follows (in thousands):
| Year ending December 31: |
||||
| 2011 |
$ | 17,099 | ||
| 2012 |
12,434 | |||
| 2013 |
5,269 | |||
| 2014 |
3,325 | |||
| 2015 |
2,671 | |||
| Thereafter |
6,509 | |||
56
Table of Contents
Alliance Financial Corporation and Subsidiaries
Notes to Consolidated Financial Statements
Directors and executive officers of Alliance and their affiliated companies were customers of, and had other transactions with, Alliance during 2010. Loan transactions with related parties are summarized as follows (in thousands):
| 2010 | ||||
| Balance at beginning of year |
$3,497 | |||
| New loans and advances |
518 | |||
| Loan payments |
(1,674) | |||
| Balance at end of year |
$2,341 | |||
Nonperforming and Delinquent Loans and Leases
Nonperforming loans and leases at December 31 are as follows (in thousands):
| 2010 | 2009 | |||||||
| Loans and leases 90 days past due and still accruing |
$ 19 | $ — | ||||||
| Non-accrual loans and leases |
8,474 | 8,582 | ||||||
| Total nonperforming loans and leases |
$8,493 | $8,582 | ||||||
Non-accrual loans and leases and loans past due 90 days still accruing include both smaller balance homogeneous loans and leases that are collectively evaluated for impairment and individually classified as impaired loans. The following table presents the recorded investment in non-accrual and loans and leases and loans and leases 90 days past due and still accruing as of December 31, 2010 (in thousands):
| Non-accrual | Greater than 90 Days Past Due and Still Accruing |
Non-performing Loans and Leases |
||||||||||
| Commercial |
$1,212 | $ — | $1,212 | |||||||||
| Commercial real estate |
2,084 | — | 2,084 | |||||||||
| Leases |
697 | — | 697 | |||||||||
| Residential real estate |
3,543 | — | 3,543 | |||||||||
| Consumer: |
||||||||||||
| Indirect |
212 | 10 | 222 | |||||||||
| Home equity line of credit |
490 | — | 490 | |||||||||
| Other |
236 | 9 | 245 | |||||||||
| Total |
$8,474 | $19 | $8,493 | |||||||||
The following table presents the aging of the recorded investment in past due loans and leases, including nonperforming loans and leases, as of December 31, 2010 (in thousands):
| 30-59 Days Past Due |
60-89 Days Past Due |
Greater than 90 Days Past Due |
Total Past Due |
Loans Not Past Due |
Total Loans and Leases |
|||||||||||||||||||
| Commercial |
$ 520 | $ 361 | $1,077 | $ 1,958 | $131,829 | $133,787 | ||||||||||||||||||
| Commercial real estate |
1,511 | 308 | 934 | 2,753 | 113,313 | 116,066 | ||||||||||||||||||
| Leases, net of unearned income |
203 | 306 | 172 | 681 | 41,785 | 42,466 | ||||||||||||||||||
| Residential real estate |
4,000 | 440 | 3,543 | 7,983 | 326,984 | 334,967 | ||||||||||||||||||
| Consumer: |
||||||||||||||||||||||||
| Indirect |
969 | 58 | 94 | 1,121 | 175,004 | 176,125 | ||||||||||||||||||
| Home equity line of credit |
164 | 24 | 366 | 554 | 68,208 | 68,762 | ||||||||||||||||||
| Other |
212 | 70 | 97 | 379 | 22,478 | 22,857 | ||||||||||||||||||
| Total |
$7,579 | $1,567 | $6,283 | $15,429 | $879,601 | $895,030 | ||||||||||||||||||
57
Table of Contents
Alliance Financial Corporation and Subsidiaries
Notes to Consolidated Financial Statements
The following table details activity in the allowance for credit losses and the recorded investment by portfolio segment and based on impairment method as of December 31 (in thousands):
| 2010 | ||||||||||||||||||||||||||||
| Commercial & Commercial Real Estate |
Leases, net |
Residential
Real Estate |
Consumer
Indirect |
Consumer
Other |
Unallocated | Total | ||||||||||||||||||||||
| Allowance for credit losses: |
||||||||||||||||||||||||||||
| Beginning balance |
$3,771 | $2,212 | $891 | $973 | $818 | $749 | $9,414 | |||||||||||||||||||||
| Charge-offs |
(634) | (1,345) | (322) | (251) | (1,055) | (3,607) | ||||||||||||||||||||||
| Recoveries |
34 | 81 | 54 | 133 | 489 | 791 | ||||||||||||||||||||||
| Net charge-offs |
(600) | (1,264) | (268) | (118) | (566) | (2,816) | ||||||||||||||||||||||
| Provision |
2,397 | 635 | 323 | 78 | 527 | 125 | 4,085 | |||||||||||||||||||||
| Ending Balance |
$5,568 | $1,583 | $946 | $933 | $779 | $874 | $10,683 | |||||||||||||||||||||
| Ending allowance balance attributable to loans and leases |
||||||||||||||||||||||||||||
| Individually evaluated for impairment |
$ 319 | $ 18 | $ 84 | $— | $— | $ 421 | ||||||||||||||||||||||
| Collectively evaluated for impairment |
5,249 | 1,565 | 862 | 933 | 779 | 874 | 10,262 | |||||||||||||||||||||
| Loans and leases balance: |
||||||||||||||||||||||||||||
| Individually evaluated for impairment |
$2,345 | $412 | $1,131 | $— | $— | $3,888 | ||||||||||||||||||||||
| Collectively evaluated for impairment |
247,508 | 42,054 | 333,836 | 176,125 | 91,619 | 891,142 | ||||||||||||||||||||||
| Total ending loans and leases balance |
$249,853 | $42,466 | $334,967 | $176,125 | $91,619 | $895,030 | ||||||||||||||||||||||
| 2009 | ||||||||||||||||||||||||||||
| Commercial & Commercial Real Estate |
Leases, net |
Residential Real Estate |
Consumer Indirect |
Consumer Other |
Unallocated | Total | ||||||||||||||||||||||
| Allowance for credit losses: |
||||||||||||||||||||||||||||
| Beginning balance |
$3,993 | $2,673 | $850 | $879 | $766 | $9,161 | ||||||||||||||||||||||
| Charge-offs |
(1,622) | (4,122) | (76) | (317) | (1,135) | (7,272) | ||||||||||||||||||||||
| Recoveries |
514 | 165 | 59 | 133 | 554 | 1,425 | ||||||||||||||||||||||
| Net charge-offs |
(1,108) | (3,957) | (17) | (184) | (581) | (5,847) | ||||||||||||||||||||||
| Provision |
886 | 3,496 | 58 | 278 | 633 | 749 | 6,100 | |||||||||||||||||||||
| Ending Balance |
$3,771 | $2,212 | $891 | $973 | $818 | $749 | $9,414 | |||||||||||||||||||||
| Ending allowance balance attributable to loans and leases |
||||||||||||||||||||||||||||
| Individually evaluated for impairment |
$ 208 | $ 124 | $— | $— | $— | $ 332 | ||||||||||||||||||||||
| Collectively evaluated for impairment |
3,563 | 2,088 | 891 | 973 | 818 | 749 | 9,082 | |||||||||||||||||||||
| Loans and leases balance: |
||||||||||||||||||||||||||||
| Individually evaluated for impairment |
$2,368 | $1,251 | $110 | $— | $— | $3,729 | ||||||||||||||||||||||
| Collectively evaluated for impairment |
205,628 | 66,973 | 356,796 | 184,947 | 92,022 | 906,366 | ||||||||||||||||||||||
| Total ending loans and leases balance |
$207,996 | $68,224 | $356,906 | $184,947 | $92,022 | $910,095 | ||||||||||||||||||||||
58
Table of Contents
Alliance Financial Corporation and Subsidiaries
Notes to Consolidated Financial Statements
Changes in the allowance for credit losses for the year ended December 31, 2008 are summarized as follows (in thousands):
| 2008 | ||||
| Balance at beginning of year |
$8,426 | |||
| Loans and leases charged off |
(5,639) | |||
| Recoveries |
872 | |||
| Provision for credit losses |
5,502 | |||
| Balance at end of year |
$9,161 | |||
The following table presents loans and leases balances disaggregated on the basis of Alliance’s impairment methodology as of December 31 (in thousands):
| 2010 | 2009 | |||||||||||||||||||||||
| Unpaid Contractual Principal Balance(1) |
Recorded Investment |
Related Allowance |
Unpaid Contractual Principal Balance(1) |
Recorded Investment |
Related Allowance |
|||||||||||||||||||
| With no related allowance recorded: |
||||||||||||||||||||||||
| Commercial |
$2,134 | $1,080 | $3,813 | $1,855 | ||||||||||||||||||||
| Leases |
1,253 | 365 | 1,492 | 856 | ||||||||||||||||||||
| Residential real estate |
738 | 738 | 110 | 110 | ||||||||||||||||||||
| 4,125 | 2,183 | 5,415 | 2,821 | |||||||||||||||||||||
| With an allowance recorded: |
||||||||||||||||||||||||
| Commercial |
1,277 | 1,265 | $319 | 519 | 513 | $208 | ||||||||||||||||||
| Leases |
63 | 47 | 18 | 393 | 395 | 124 | ||||||||||||||||||
| Residential real estate |
393 | 393 | 84 | — | — | — | ||||||||||||||||||
| 1,733 | 1,705 | 421 | 912 | 908 | 332 | |||||||||||||||||||
| Total: |
||||||||||||||||||||||||
| Commercial |
3,411 | 2,345 | 319 | 4,332 | 2,368 | 208 | ||||||||||||||||||
| Leases |
1,316 | 412 | 18 | 1,885 | 1,251 | 124 | ||||||||||||||||||
| Residential real estate |
1,131 | 1,131 | 84 | 110 | 110 | — | ||||||||||||||||||
| $5,858 | $3,888 | $421 | $6,327 | $3,729 | $332 | |||||||||||||||||||
| (1) | Unpaid contractual principal balance includes any partial charge-offs taken on loans and leases. |
The average recorded investment in impaired loans for 2010, 2009 and 2008 totaled $3.1 million, $3.2 million and $2.1 million, respectively. There was no interest recognized on impaired loans while they were considered to be impaired.
Troubled debt restructured loans had a carrying amount of $393,000 with a specific reserve of $84,000 at December 31, 2010. The modifications under the troubled debt restructurings did not extend additional amounts of credit to loans classified as troubled debt restructurings.
Credit Quality Indicators
Alliance establishes a risk rating at origination for commercial loan, commercial real estate and commercial lease relationships over $250,000 based on relevant information about the ability of the borrowers to service their debt such as current financial information, historical payment experience, credit documentation, public information and current economic trends, among other factors. Commercial relationship managers monitor the loans and leases in their portfolios on an ongoing basis for any changes in the borrower’s ability to service their debt and affirm the risk ratings for the loans and leases in their respective portfolios on a quarterly basis.
Alliance uses the risk rating system to identify criticized and classified loans and leases. Commercial relationships within the criticized and classified risk ratings are analyzed quarterly. Alliance uses the following definitions for criticized and classified loans and leases which are consistent with regulatory guidelines:
59
Table of Contents
Alliance Financial Corporation and Subsidiaries
Notes to Consolidated Financial Statements
Special Mention
A special mention loan has potential weaknesses that deserve management’s close attention. If left uncorrected, these potential weaknesses may result in deterioration of the repayment prospects for the loan or in the institution’s credit position at some future date.
Substandard
A substandard loan is inadequately protected by the current sound worth and paying capacity of the obligor or of the collateral pledged, if any. Loans so classified must have a well-defined weakness, or weaknesses, that jeopardize the liquidation of the debt. They are characterized by the distinct possibility that the bank will sustain some loss if the deficiencies are not corrected.
Doubtful
A loan classified doubtful has all the weaknesses inherent in one classified substandard with the added characteristic that the weaknesses make collection or liquidation in full, on the basis of currently existing facts, conditions, and values, highly questionable and improbable.
Loss
Loans classified as Loss are considered non-collectable and of such little value that their continuance as bankable assets are not warranted.
Loans and leases not meeting the criteria above that are analyzed individually as part of the above described process are considered to be pass rated loans and leases. Commercial loans and leases listed as not rated are credits less than $250,000. In some instances, the commercial loans and lease portfolios were segmented into groups of homogeneous pools based on similar risk and loss characteristics. Commercial loans that are not risk rated were segregated into a risk category based upon the loans being originated using an automated decision system (credit scoring model). Commercial leases were further segregated into a risk category based on the risk and loss characteristics of certain third party servicers. Loans and leases to municipalities are segregated into a separate risk category.
As of December 31, 2010 and based on the most recent analysis performed, the recorded investment by risk category and class of loans and leases is as follows (in thousands):
| Commercial and Commercial Real Estate Loans |
Commercial Leases |
|||||||
| Credit risk profile by internally assigned grade: |
||||||||
| Pass |
$195,360 | $25,538 | ||||||
| Special mention |
11,126 | 313 | ||||||
| Substandard |
16,163 | 1,051 | ||||||
| Substandard individually evaluated for impairment |
2,345 | 412 | ||||||
| Doubtful |
— | 142 | ||||||
| Not rated |
3,510 | — | ||||||
| $228,504 | $27,456 | |||||||
| Credit risk profile using other credit quality indicators: |
||||||||
| Loans and leases using a credit scoring model |
12,367 | 443 | ||||||
| Loans and leases to municipal entities |
8,982 | 12,856 | ||||||
| Certain third party servicers |
— | 1,711 | ||||||
| $249,853 | $42,466 | |||||||
For residential real estate and consumer loan classes, Alliance evaluates credit quality primarily based upon the aging status of the loan, which was previously presented, and by payment activity.
60
Table of Contents
Alliance Financial Corporation and Subsidiaries
Notes to Consolidated Financial Statements
The following table presents the recorded investment in residential real estate and consumer loans based on payment activity as of December 31, 2010 (in thousands):
| Residential Real Estate |
Indirect | Home Equity Line of Credit |
Other Consumer | |||||||||||||
| Performing |
$331,424 | $175,913 | $68,272 | $22,621 | ||||||||||||
| Non-performing |
3,543 | 212 | 490 | 236 | ||||||||||||
| Total |
$334,967 | $176,125 | $68,762 | $22,857 | ||||||||||||
4. Premises and Equipment
Bank premises, furniture and equipment at December 31 consist of the following (in thousands):
| 2010 | 2009 | |||||||
| Land |
$ 2,999 | $ 3,063 | ||||||
| Bank premises |
20,309 | 20,092 | ||||||
| Furniture and equipment |
25,800 | 25,141 | ||||||
| Total cost |
49,108 | 48,296 | ||||||
| Less: Accumulated depreciation |
30,133 | 28,210 | ||||||
| $18,975 | $20,086 | |||||||
At December 31, 2010 and 2009, furniture and equipment included $1.2 million in equipment leased to others under operating leases and the related accumulated depreciation of $668,000 and $569,000 at December 31, 2010 and 2009, respectively. Depreciation expense on equipment leased to others totaled $212,000, $218,000, and $226,000 in 2010, 2009 and 2008, respectively.
At December 31, 2010, the minimum future lease payments to be received from equipment leased to others were as follows (in thousands):
| Year ending December 31: |
||||
| 2011 |
$ | 231 | ||
| 2012 |
193 | |||
| 2013 |
174 | |||
5. Goodwill and Other Intangible Assets
The carrying value of goodwill was $30.8 million and $32.1 million at December 31, 2010 and 2009, respectively. Goodwill declined by $1.2 million in 2010 due to the sale of Ladd’s Insurance Agency. The insurance agency’s customer list intangible net carrying value of $310,000 was sold as part of the sale of Ladd’s assets. No goodwill impairment adjustments were recognized in 2010 or 2009. The following table summarizes Alliance’s intangible assets that are subject to amortization (in thousands):
| December 31, 2010 | ||||||||||||
| Gross Carrying Amount | Accumulated Amortization | Net Carrying Amount | ||||||||||
| Intangible Assets |
||||||||||||
| Core deposit intangible |
$ 4,202 | $2,712 | $1,490 | |||||||||
| Investment management intangible |
10,089 | 2,941 | 7,148 | |||||||||
| Total |
$14,291 | $5,653 | $8,638 | |||||||||
| December 31, 2009 | ||||||||||||
| Gross Carrying Amount | Accumulated Amortization | Net Carrying Amount | ||||||||||
| Intangible Assets |
||||||||||||
| Core deposit intangible |
$ 4,202 | $2,197 | $ 2,005 | |||||||||
| Non-compete covenant |
894 | 894 | — | |||||||||
| Investment management intangible |
10,089 | 2,436 | 7,653 | |||||||||
| Insurance agency customer intangible |
909 | 492 | 417 | |||||||||
| Total |
$16,094 | $6,019 | $10,075 | |||||||||
61
Table of Contents
Alliance Financial Corporation and Subsidiaries
Notes to Consolidated Financial Statements
Amortization expense for intangible assets for the next five years is estimated as follows (in thousands):
| Core Deposit
Intangible |
Investment Management Intangible |
Total | ||||||||||
| 2011 |
$ 439 | $ 504 | $ 943 | |||||||||
| 2012 |
363 | 504 | 867 | |||||||||
| 2013 |
287 | 504 | 791 | |||||||||
| 2014 |
210 | 504 | 714 | |||||||||
| 2015 |
134 | 504 | 638 | |||||||||
| Thereafter |
57 | 4,628 | 4,685 | |||||||||
6. Deposits
Deposits consisted of the following at December 31 (in thousands):
| 2010 | 2009 | |||||||
| Non-interest-bearing checking |
$ 179,918 | $ 159,149 | ||||||
| Interest-bearing checking |
151,894 | 130,368 | ||||||
| Savings accounts |
103,099 | 94,524 | ||||||
| Money market accounts |
357,885 | 317,051 | ||||||
| Time deposits |
341,802 | 374,579 | ||||||
| Total deposits |
$1,134,598 | $1,075,671 | ||||||
The following table indicates the maturities of Alliance’s time deposits at December 31 (in thousands):
| 2010 | 2009 | |||||||
| Due in one year |
$180,274 | $286,611 | ||||||
| Due in two years |
98,344 | 23,549 | ||||||
| Due in three years |
48,065 | 47,666 | ||||||
| Due in four years |
12,816 | 15,021 | ||||||
| Due in five years or more |
2,303 | 1,732 | ||||||
| Total time deposits |
$341,802 | $374,579 | ||||||
Total time deposits in excess of $100,000 as of December 31, 2010 and 2009 were $137.0 million and $108.3 million, respectively. Time deposits include $42.8 million and $97.7 million in accounts acquired through third party brokers at December 31, 2010 and 2009, respectively.
7. Borrowings
The following is a summary of borrowings outstanding at December 31 (in thousands):
| 2010 | 2009 | |||||||
| Short-term: |
||||||||
| FHLB overnight advances |
$ 2,000 | $ 5,500 | ||||||
| FHLB advances |
— | 20,000 | ||||||
| Repurchase agreements |
25,792 | 17,207 | ||||||
| Total short-term borrowings |
27,792 | 42,707 | ||||||
| Long-term: |
||||||||
| FHLB advances |
95,000 | 110,000 | ||||||
| Repurchase agreements |
20,000 | 20,000 | ||||||
| Total long-term borrowings |
115,000 | 130,000 | ||||||
| Total borrowings |
$142,792 | $172,707 | ||||||
62
Table of Contents
Alliance Financial Corporation and Subsidiaries
Notes to Consolidated Financial Statements
The following table sets forth certain information with respect to the overnight lines of credit, federal funds purchased and short term repurchase agreements (dollars in thousands):
| 2010 | 2009 | 2008 | ||||||||||
| FHLB overnight advances and short-term advances: |
||||||||||||
| Maximum month-end balance |
$22,800 | $37,700 | $48,900 | |||||||||
| Balance at end of year |
2,000 | 25,500 | 34,700 | |||||||||
| Average balance during the year |
4,382 | 16,514 | 19,284 | |||||||||
| Weighted average interest rate at end of year |
0.40% | 0.36% | 0.44% | |||||||||
| Weighted average interest rate during the year |
0.46% | 0.44% | 2.02% | |||||||||
| Repurchase agreements: |
||||||||||||
| Maximum month-end balance |
$25,792 | $35,982 | $45,667 | |||||||||
| Balance at end of year |
25,792 | 17,207 | 40,495 | |||||||||
| Average balance during the year |
20,252 | 27,249 | 43,400 | |||||||||
| Weighted average interest rate at end of year |
0.11% | 0.04% | 0.15% | |||||||||
| Weighted average interest rate during the year |
0.11% | 0.13% | 1.34% | |||||||||
As of the dates indicated, the contractual amounts of FHLB long term advances mature as follows (dollars in thousands):
| December 31, 2010 | December 31, 2009 | |||||||||||||||
| Maturing |
Amount | Weighted Average Rate |
Amount | Weighted Average Rate |
||||||||||||
| 2010 |
$ — | — | $ 15,000 | 3.20% | ||||||||||||
| 2011 |
15,000 | 3.47% | 15,000 | 3.47% | ||||||||||||
| 2012 |
10,000 | 3.54% | 10,000 | 3.54% | ||||||||||||
| 2013 |
35,000 | 3.33% | 35,000 | 3.33% | ||||||||||||
| 2014 |
15,000 | 3.25% | 15,000 | 3.25% | ||||||||||||
| 2015 |
20,000 | 3.75% | 20,000 | 3.75% | ||||||||||||
| Total FHLB term advances |
$95,000 | 3.37% | $110,000 | 3.42% | ||||||||||||
As of the dates indicated, the contractual amounts of long-term repurchase agreements mature as follows (in thousands):
| December 31, 2010 | December 31, 2009 | |||||||||||||||
| Maturing |
Amount | Weighted Average Rate |
Amount | Weighted Average Rate |
||||||||||||
| 2015 |
$20,000 | 4.01% | $20,000 | 4.01% | ||||||||||||
| Total repurchase agreements |
$20,000 | 4.01% | $20,000 | 4.01% | ||||||||||||
Alliance has access to various credit facilities through the FHLB, including an overnight line of credit, a one-month line of credit, and a Term Advance Program, under which it can borrow at various terms and interest rates. All of the credit facilities are subject to meeting certain ongoing collateral requirements of the FHLB. In addition to pledging securities, Alliance has also pledged, under a blanket collateral agreement, certain residential mortgage loans with balances at December 31, 2010 of $290.2 million. At December 31, 2010, Alliance had borrowed $117.0 million against the pledged mortgages. At December 31, 2010, Alliance had $193.7 million available under its various credit facilities with the FHLB.
Alliance had a $150.5 million line of credit at December 31, 2010 with the Federal Reserve Bank of New York through its Discount Window. Alliance has pledged indirect loans and securities totaling $177.6 million and $6.9 million, respectively, at December 31, 2010. At December 31, 2010, Alliance also had available $78.5 million of federal funds lines of credit with other financial institutions, none of which was in use at December 31, 2010.
Alliance offers retail repurchase agreements primarily to certain business customers. Under the terms of the agreement, Alliance sells investment portfolio securities to such customers agreeing to repurchase the securities on the next business day. Alliance views the borrowing as a deposit alternative for its business customers. On December 31, 2010, Alliance had securities with a market value of $33.7 million pledged as collateral for these agreements. Alliance also has agreements with the FHLB and Bank approved brokers to sell securities under agreements to repurchase. At December 31, 2010, securities with a market value of $22.6 million were pledged against repurchase agreements in the amount of $20.0 million. All of these repurchase agreements at December 31, 2010 were transacted with the FHLB.
63
Table of Contents
Alliance Financial Corporation and Subsidiaries
Notes to Consolidated Financial Statements
8. Junior Subordinated Obligations
In December 2003, Alliance formed a wholly-owned subsidiary, Alliance Financial Capital Trust I, a Delaware business trust. The Trust issued $10.0 million of 30-year floating rate Company-obligated pooled capital securities. Alliance borrowed the proceeds of the capital securities from its subsidiary by issuing floating rate junior subordinated deferrable interest debentures having substantially similar terms. The capital securities mature in 2034, but may be redeemed at Alliance’s option on predetermined dates with the first redemption date at par in five years. The capital securities of the trust are a pooled trust preferred fund of ALESCO Preferred Funding II, Ltd., and interest rates on the securities adjust quarterly based on the 3-month LIBOR plus 2.85% (3.14% at December 31, 2010). Alliance guarantees all of the securities.
In September 2006, Alliance formed a wholly-owned subsidiary, Alliance Financial Capital Trust II, a Delaware business trust. The Trust issued $15.0 million of 30-year floating rate company-obligated pooled capital securities. Alliance borrowed the proceeds of the capital securities from its subsidiary by issuing floating rate junior subordinated deferrable interest debentures having substantially similar terms. The capital securities mature in 2036, but may be redeemed at Alliance’s option on predetermined dates with the first redemption date at par in five years. The capital securities of the trust are a pooled trust preferred fund of Preferred Term Securities XXIV, Ltd., and interest rates on the securities adjust quarterly based on the 3-month LIBOR plus 1.65% (1.95% at December 31, 2010). Alliance guarantees all of the securities.
Alliance had a $310,000 investment in Capital Trust I at December 31, 2010 and 2009 and a $464,000 investment in Capital Trust II at December 31, 2010 and 2009.
The Capital Trusts are variable interest entities (“VIE’s”). Alliance is not the primary beneficiary of the VIE’s and as such they are not consolidated in Alliance’s financial statements in accordance with accounting guidance. Liabilities owed to the Capital Trusts, totaling $25.8 million, were reflected as liabilities in the consolidated balance sheets at December 31, 2010 and 2009, respectively.
9. Earnings Per Common Share
Alliance has granted stock compensation awards with non-forfeitable dividend rights which are considered participating securities. As such, earnings per share is computed using the two-class method as required by Accounting Standard Codification 206-10-45. Basic earnings per common share is computed by dividing net income allocated to common stock by the weighted average number of common shares outstanding during the period which excludes the participating securities. Diluted earnings per common share includes the dilutive effect of additional potential common shares from stock compensation awards and warrants, but excludes awards considered participating securities.
Basic and diluted net income per common share calculations for the years ended December 31 are as follows (in thousands, except share and per share amounts):
| 2010 | 2009 | 2008 | ||||||||||
| Basic |
||||||||||||
| Net income available to common shareholders |
$11,624 | $10,364 | $10,310 | |||||||||
| Less: dividends and undistributed earnings allocated to unvested restricted shares |
(128) | (185) | (201) | |||||||||
| Net earnings allocated to common shareholders |
$11,496 | $10,179 | $10,109 | |||||||||
| Weighted average common shares outstanding including shares considered participating securities |
4,669,324 | 4,601,861 | 4,630,578 | |||||||||
| Less: average participating securities |
(49,606) | (87,593) | (87,621) | |||||||||
| Weighted average shares |
4,619,718 | 4,514,268 | 4,542,957 | |||||||||
| Net income per common share – basic |
$ 2.49 | $ 2.25 | $ 2.23 | |||||||||
| Diluted |
||||||||||||
| Net earnings allocated to common shareholders |
$11,496 | $10,179 | $10,109 | |||||||||
| Weighted average common shares outstanding for basic earnings per common share |
4,619,717 | 4,514,268 | 4,542,957 | |||||||||
| Incremental shares from assumed conversion of stock options and warrants |
20,379 | 28,801 | 22,752 | |||||||||
| Average common shares outstanding – diluted |
4,640,096 | 4,543,069 | 4,565,709 | |||||||||
| Net income per common share – diluted |
$ 2.48 | $ 2.24 | $ 2.21 | |||||||||
64
Table of Contents
Alliance Financial Corporation and Subsidiaries
Notes to Consolidated Financial Statements
Dividends of $63,000, $83,000 and $87,000 for the years ended December 31, 2010, 2009 and 2008, respectively, were paid on unvested shares with non-forfeitable dividend rights. For 2010, there were no anti-dilutive stock options. For the years 2009 and 2008, 45,506 and 66,055 of anti-dilutive stock options were excluded from the diluted weighted average common share calculations.
10. Income Taxes
The provision for income taxes for the years ended December 31 is summarized as follows (in thousands):
| 2010 | 2009 | 2008 | ||||||||||
| Current tax expense: |
||||||||||||
| Federal |
$5,277 | $3,055 | $2,236 | |||||||||
| State |
541 | 231 | 145 | |||||||||
| 5,818 | 3,286 | 2,381 | ||||||||||
| Deferred tax (benefit) provision: |
||||||||||||
| Federal |
(987) | 244 | 422 | |||||||||
| State |
(226) | (94) | 17 | |||||||||
| (1,213) | 150 | 439 | ||||||||||
| Total |
$4,605 | $3,436 | $2,820 | |||||||||
A reconciliation between the statutory federal income tax rate and the effective income tax rate for the years indicated is as follows:
| 2010 | 2009 | 2008 | ||||||||||
| Statutory federal income tax rate |
34.0% | 34.0% | 34.0% | |||||||||
| State franchise tax, net of federal tax benefit |
1.3% | 0.6% | 0.8% | |||||||||
| Tax exempt interest income |
(7.6)% | (9.6)% | (11.3%) | |||||||||
| Tax exempt insurance income |
(2.2)% | (2.3)% | (2.2%) | |||||||||
| Sale of insurance agency assets |
2.6% | — | — | |||||||||
| Other, net |
0.3% | 0.4% | 0.1% | |||||||||
| Total |
28.4% | 23.1% | 21.4% | |||||||||
The components of deferred income taxes, included in other assets, at December 31, are as follows (in thousands):
| 2010 | 2009 | |||||||
| Assets: |
||||||||
| Loans |
$ 251 | $ 327 | ||||||
| Allowance for credit losses |
4,098 | 3,607 | ||||||
| Retirement benefits |
1,182 | 1,394 | ||||||
| Deferred compensation |
2,953 | 2,765 | ||||||
| Pension costs |
1,252 | 1,193 | ||||||
| Incentive compensation plans |
232 | 119 | ||||||
| Covenant not to compete |
215 | 235 | ||||||
| Other |
910 | 554 | ||||||
| Total deferred tax assets |
11,093 | 10,194 | ||||||
| Liabilities: |
||||||||
| Securities |
49 | 53 | ||||||
| Premises, furniture and equipment |
447 | 458 | ||||||
| Depreciation and leasing |
2,092 | 2,679 | ||||||
| Deferred fees |
1,374 | 1,428 | ||||||
| Intangible assets |
776 | 937 | ||||||
| Net unrealized gains on available-for-sale securities |
2,293 | 1,790 | ||||||
| Other |
896 | 452 | ||||||
| Total deferred tax liabilities |
7,927 | 7,797 | ||||||
| Net deferred tax asset at year-end |
$3,166 | $2,397 | ||||||
Realization of deferred tax assets is dependent upon the generation of future taxable income or the existence of sufficient taxable income. A valuation allowance is provided when it is more likely than not that some portion of the deferred tax assets will not be
65
Table of Contents
Alliance Financial Corporation and Subsidiaries
Notes to Consolidated Financial Statements
realized. In assessing the need for a valuation allowance, management considers the scheduled reversal of the deferred tax liabilities, the level of historical taxable income, and the projected future taxable income over the periods in which the temporary differences comprising the deferred tax assets will be deductible. Based on its assessment, management determined that no valuation allowance is necessary.
At December 31, 2010 Alliance did not have any unrecognized tax benefits. At December 31, 2009, Alliance had $115,000 of net unrecognized tax benefits and interest.
A reconciliation of the beginning and ending amount of unrecognized tax benefits (excluding interest and the federal income tax benefit of unrecognized state tax benefits) is as follows (in thousands):
| 2010 | 2009 | 2008 | ||||||||||
| Balance at January 1 |
$115 | $180 | $180 | |||||||||
| Reductions due to statute of limitations |
(115) | — | — | |||||||||
| Settlements |
— | (65) | — | |||||||||
| Balance at December 31 |
$ — | $115 | $180 | |||||||||
At December 31, 2010, there was no accrued interest related to uncertain tax positions. At December 31, 2009, accrued interest related to uncertain tax positions was $12,000, net of the related tax benefit. Alliance accounts for interest and penalties related to uncertain tax positions as part of its provision for federal and state income taxes. We do not expect the amount of unrecognized tax benefits to significantly increase in the next twelve months.
Alliance or one of its subsidiaries files income tax returns in the U.S. federal jurisdiction and various state jurisdictions. Alliance is no longer subject to U.S. federal or state examination for tax years prior to 2007. Our 2007-2009 New York State income tax returns are currently under examination. Management does not anticipate the New York State examination will result in an unfavorable material change to its financial position.
11. Accumulated Other Comprehensive Income
A summary of activity in accumulated other comprehensive income follows (in thousands):
| 2010 | 2009 | 2008 | ||||||||||
| Effect from unrealized net gains on securities available for sale |
||||||||||||
| Accumulated unrealized net gains on securities available-for-sale at January 1, net of tax |
$ 2,832 | $ 2,870 | $ 933 | |||||||||
| Net unrealized gains for the period, net of tax expense of $622 in 2010, $816 in 2009, and $1,275 in 2008 |
1,051 | 1,291 | 2,021 | |||||||||
| Reclassification adjustment for net gains included in net income, net of tax expense of $119 in 2010, $839 in 2009, and $53 in 2008 |
(189) | (1,329) | (84) | |||||||||
| Effect on other comprehensive income for the period |
862 | (38) | 1,937 | |||||||||
| Accumulated unrealized gains on securities available-for-sale at December 31, net of tax |
$3,694 | $ 2,832 | $ 2,870 | |||||||||
| Effect from retirement benefit plans | ||||||||||||
| Accumulated unrealized (losses) gains for retirement benefit plans at January 1, net of tax |
$(1,886) | $ (1,899) | $ 272 | |||||||||
| Amortization of prior service costs, net of tax benefit of $(9) in 2010, $(6) in 2009 and $(4) in 2008 |
17 | 8 | 6 | |||||||||
| Amortization of net (gain) loss, net of tax (benefit) expense of $(69) in 2010, $(71) in 2009 and $3 in 2008 |
109 | 113 | (7) | |||||||||
| Change in accumulated unrealized net losses for plan benefits, net of tax expense of $139 in 2010, $36 in 2009 and $1,185 in 2008 |
(221) | (57) | (1,839) | |||||||||
| Change in unrecognized prior service cost, net of tax expense of $32 in 2009 and $185 in 2008 |
— | (51) | (292) | |||||||||
| Effect on other comprehensive income for the period |
(95) | 13 | (2,132) | |||||||||
| Change in pension measurement date, net of tax benefit of $25 in 2008 |
— | — | (39) | |||||||||
| Accumulated unrealized losses and prior service costs for benefit obligations at December 31, net of tax |
$(1,981) | $ (1,886) | $ (1,899) | |||||||||
| Accumulated other comprehensive income at January 1, net of tax |
946 | 971 | 1,205 | |||||||||
| Other comprehensive income, net of tax |
767 | (25) | (195) | |||||||||
| Cumulative effect of change in accounting for change in pension measurement date |
— | — | (39) | |||||||||
| Accumulated other comprehensive income at December 31, net of tax |
$ 1,713 | $ 946 | $ 971 | |||||||||
66
Table of Contents
Alliance Financial Corporation and Subsidiaries
Notes to Consolidated Financial Statements
12. Employee and Director Benefit Plans
Defined Contribution Plan
Alliance provides retirement benefits through a defined contribution 401(k) plan that covers substantially all of its employees. Contributions to Alliance’s 401(k) plan are determined by the Board of Directors and are based on percentages of compensation for participating employees. Contributions are funded following the end of the plan (calendar) year. Company contributions to the plan were $505,000, $472,000, and $484,000 in 2010, 2009, and 2008, respectively.
Defined Benefit Plan and Post-Retirement Benefits
Alliance has a noncontributory defined benefit pension plan (“Pension Plan”) which it assumed from its acquisition of Bridge Street Financial, Inc. The Pension Plan covers substantially all former Bridge Street full-time employees who met eligibility requirements on October 6, 2006, at which time all benefits were frozen. Under the Pension Plan, retirement benefits are primarily a function of both the years of service and the level of compensation. The amount contributed to the Pension Plan is determined annually on the basis of (a) the maximum amount that can be deducted for federal income tax purposes, or (b) the amount certified by an actuary as necessary to avoid an accumulated funding deficiency as defined by the Employee Retirement Income Security Act of 1974.
In accordance with ASC Number 715-20-65-1, defined benefit plan assets and obligations are to be measured as of the date of the employer’s fiscal year-end, starting in 2008. Through 2007, Alliance utilized the early measurement date option available under previous accounting guidance and measured the funded status of the defined benefit plan assets and obligations as of October 1 each year. In accordance with the adoption provisions, the net periodic benefit cost for the period between the October 1 measurement date and the 2008 fiscal year end measurement were allocated proportionately between amounts to be recognized as an adjustment to retained earnings and net periodic benefit cost for the fiscal year. As a result of this adoption, Alliance reduced January 1, 2008 opening retained earnings by $44,000, increased deferred income taxes by $25,000, increased the pension liability by $20,000 and credited accumulated other comprehensive income for $39,000.
Alliance provides post-retirement medical and life insurance benefits (“Post-Retirement Plan”) to certain retirees who met plan eligibility requirements and their respective spouses.
The following table represents a reconciliation of the change in the benefit obligation, plan assets and funded status of the Pension Plan and Post-Retirement Plan at December 31 (using a measurement date of December 31):
| Pension Plan | Post-Retirement Plan | |||||||||||||||
| 2010 | 2009 | 2010 | 2009 | |||||||||||||
| Change in benefit obligation: | (In thousands) | |||||||||||||||
| Benefit obligation at beginning of year |
$ 5,087 | $ 4,864 | $ 4,288 | $ 4,129 | ||||||||||||
| Interest cost |
284 | 279 | 230 | 229 | ||||||||||||
| Actuarial loss |
170 | 169 | 47 | 135 | ||||||||||||
| Benefits paid |
(216) | (225) | (284) | (222) | ||||||||||||
| Participant contributions |
— | — | 9 | 17 | ||||||||||||
| Benefit obligation at end of year |
5,325 | 5,087 | 4,290 | 4,288 | ||||||||||||
| Change in plan assets: |
||||||||||||||||
| Fair value of plan assets at the beginning of the year |
3,581 | 3,245 | — | — | ||||||||||||
| Actual return on plan assets |
427 | 561 | — | — | ||||||||||||
| Benefits paid |
(216) | (225) | (284) | (222) | ||||||||||||
| Participant contributions |
— | — | 9 | 17 | ||||||||||||
| Employer contributions |
601 | — | 275 | 205 | ||||||||||||
| Fair value of plan assets at the end of year |
4,393 | 3,581 | — | — | ||||||||||||
| Funded status at end of year |
$(932) | $(1,506) | $(4,290) | $(4,288) | ||||||||||||
67
Table of Contents
Alliance Financial Corporation and Subsidiaries
Notes to Consolidated Financial Statements
Pre-tax amounts recognized in accumulated other comprehensive income at December 31 that has not been recognized as components of net periodic benefit or cost consist of:
| Pension Plan | Post-Retirement Plan | |||||||||||||||
| 2010 | 2009 | 2010 | 2009 | |||||||||||||
| (In thousands) | ||||||||||||||||
| Unrecognized actuarial loss |
$1,999 | $2,097 | $686 | $656 | ||||||||||||
| Unrecognized prior service benefit |
— | — | (519) | (563) | ||||||||||||
| $1,999 | $2,097 | $167 | $ 93 | |||||||||||||
The composition of the plan’s net periodic cost (benefit) for the years ended December 31 is as follows:
| Pension Plan | Post-Retirement Plan | |||||||||||||||||||||||
| 2010 | 2009 | 2008 | 2010 | 2009 | 2008 | |||||||||||||||||||
| (In thousands) | ||||||||||||||||||||||||
| Interest cost |
$284 | $279 | $257 | $230 | $229 | $241 | ||||||||||||||||||
| Amortization of unrecognized prior service benefit |
— | — | — | (44) | (44) | (44) | ||||||||||||||||||
| Amortization of unrecognized actuarial loss |
153 | 165 | — | 16 | 8 | — | ||||||||||||||||||
| Expected return on assets |
(311) | (282) | (433) | — | — | — | ||||||||||||||||||
| Total net periodic cost (benefit) |
$126 | $162 | $ (176) | $202 | $193 | $197 | ||||||||||||||||||
The estimated prior service benefit for the Post-Retirement Plan that is expected to be amortized from accumulated other comprehensive income into net periodic benefit over the next fiscal year is $44,000. The estimated unrecognized actuarial loss for the Pension Plan and Post-Retirement Plan that is expected to be amortized from accumulated other comprehensive income into net periodic benefit cost over the next fiscal year is $123,000 and $19,000, respectively.
The following weighted average assumptions were used to determine benefit obligations for these plans:
| Pension Plan | Post-Retirement Plan | |||||||||||||||
| 2010 | 2009 | 2010 | 2009 | |||||||||||||
| Discount rate |
5.54% | 5.70% | 5.44% | 5.60% | ||||||||||||
| Expected return on plan assets |
9.00% | 9.00% | — | — | ||||||||||||
The following weighted average assumptions were used to determine net periodic (benefit) cost for the years ended December 31:
| Pension Plan | Post-Retirement Plan | |||||||||||||||||||||||
| 2010 | 2009 | 2008 | 2010 | 2009 | 2008 | |||||||||||||||||||
| Discount rate |
5.70% | 5.87% | 6.29% | 5.60% | 5.77% | 6.38% | ||||||||||||||||||
| Expected return on plan assets |
9.00% | 9.00% | 9.00% | — | — | — | ||||||||||||||||||
The discount rates used in determining the benefit obligations for the Pension Plan and Post-Retirement Plan as of December 31, 2010, 2009 and 2008 were based upon the Citibank pension liability index. The Citibank pension liability index was determined to appropriately reflect the rate at which the Pension Plan and Post-Retirement Plan obligations could be effectively settled, based upon the expected duration of each plan.
The Pension Plan’s weighted-average asset allocations by asset category at December 31 are as follows:
| Asset Category |
2010 | 2009 | ||||||
| Equity securities |
65% | 63% | ||||||
| Debt Securities (Bond Mutual Funds) |
35% | 37% | ||||||
| Total |
100% | 100% | ||||||
Plan assets are invested in diversified investment funds of the RSI Retirement Trust (the “Trust”), a private placement investment fund. The investment funds include a series of equity and bond mutual funds or comingled trust funds, each with its own investment objectives, investment strategies and risks, as detailed in the Trust’s Statement of Investment Objectives and Guidelines. The Trust has been given discretion by the Plan Sponsor to determine the appropriate strategic asset allocation versus plan liabilities, as governed by the Trust’s Statement of Investment Objectives and Guidelines (the “Guidelines”).
68
Table of Contents
Alliance Financial Corporation and Subsidiaries
Notes to Consolidated Financial Statements
The long-term investment objectives are to maintain plan assets at a level that will sufficiently cover long-term obligations and to generate a return on plan assets that will meet or exceed the rate at which long-term obligations will grow. A broadly diversified combination of equity and fixed income portfolios and various risk management techniques are used to help achieve these objectives.
In addition, significant consideration is paid to the plan’s funding levels when determining the overall asset allocation. If the plan is considered to be well-funded, approximately 65% of the plan’s assets are allocated to equities and approximately 35% allocated to fixed income. If the plan does not satisfy the criteria for a well-funded plan, approximately 50% of the plan’s assets are allocated to equities and approximately 50% allocated to fixed income. Asset rebalancing normally occurs when the equity and fixed income allocations vary by more than 10% from their respective targets (i.e. a 20% policy range guideline). The plan is prohibited from investing in any investment strategy, fund or with any investment manager not specifically approved by the Board of Trustees of the RSI Retirement Trust.
The Pension Plan’s investment goal is to achieve investment results that will contribute to the proper funding of the Pension Plan by exceeding the rate of inflation over the long-term. In addition, investment managers for the Trust are expected to provide above average performance when compared to their peer managers. Performance volatility is also monitored. Risk/volatility is further managed by the distinct investment objectives of each of the Trust funds and the diversification within each fund.
Fair Value of Pension Plan Assets
Fair value is the exchange price that would be received for an asset in the principal or most advantageous market for the asset in an orderly transaction between market participants on the measurement date.
Alliance used the following methods and significant assumptions to estimate the fair value of each type of financial instrument:
Equity, Debt, Investment Funds and Other Securities
The fair values for investment securities are determined by quoted market prices, if available (Level 1). For securities where quoted prices are not available, fair values are calculated based on market prices of similar securities (Level 2). For securities where quoted prices or market prices of similar securities are not available, fair values are calculated using discounted cash flows or other market indicators (Level 3). At December 31, 2010, there are no Level 3 investment securities in the Pension Plan.
The fair value of the Plan assets at December 31, 2010, by asset category, is as follows (in thousands):
| Asset Category |
Total | Quoted Prices in Active Markets for Identical Assets (Level 1) |
Significant Observable Inputs (Level 2) |
|||||||||
| Mutual Funds Equity |
||||||||||||
| Large cap value(1) |
$ 396 | $ 396 | $ — | |||||||||
| Small cap core(2) |
527 | 527 | — | |||||||||
| Common/Collective Trusts Equity |
||||||||||||
| Large cap core(3) |
451 | — | 451 | |||||||||
| Large cap value(4) |
229 | — | 229 | |||||||||
| Large cap growth(5) |
648 | — | 648 | |||||||||
| International core(6) |
604 | — | 604 | |||||||||
| Common/Collective Trusts Fixed Income |
||||||||||||
| Market duration fixed(7) |
1,538 | — | 1,538 | |||||||||
| Total |
$4,393 | $923 | $3,470 | |||||||||
69
Table of Contents
Alliance Financial Corporation and Subsidiaries
Notes to Consolidated Financial Statements
The fair value of the Plan assets at December 31, 2009, by asset category, is as follows (in thousands):
| Asset Category |
Total | Quoted Prices in Active Markets for Identical Assets (Level 1) |
Significant Observable Inputs (Level 2) |
|||||||||
| Mutual Funds Equity |
||||||||||||
| Large cap value(1) |
$ 318 | $ 318 | $ — | |||||||||
| Small cap core(2) |
374 | 374 | — | |||||||||
| Common/Collective Trusts Equity |
||||||||||||
| Large cap core(3) |
357 | — | 357 | |||||||||
| Large cap value(4) |
178 | — | 178 | |||||||||
| Large cap growth(5) |
523 | — | 523 | |||||||||
| International core(6) |
506 | — | 506 | |||||||||
| Common/Collective Trusts Fixed Income |
||||||||||||
| Market duration fixed(7) |
1,325 | — | 1,325 | |||||||||
| Total |
$3,581 | $692 | $2,889 | |||||||||
| (1) | This category contains large cap stocks with above average yield. The portfolio typically holds between 60 and 70 stocks |
| (2) | This category contains stocks whose sector weightings are maintained within a narrow band around those of the Russell 2000 Index. The portfolio will typically hold more than 150 stocks |
| (3) | This fund tracks the performance of the S&P 500 Index by purchasing the securities represented in the index in approximately the same weightings as the Index |
| (4) | This category consists of investments whose sector and industry exposures are maintained within a narrow band around Russell 1000 Index. The portfolio holds approximately 150 stocks |
| (5) | This category consists of a portfolio of between 45 and 65 stocks that will typically be concentrated in the technology and health care sectors |
| (6) | This category consists of a broadly diversified portfolio of non-U.S. domiciled stocks. The portfolio will typically hold more than 200 stocks, with 0-35% invested in emerging markets securities |
| (7) | This category consists of an index fund that tracks a domestic bond index. The fund invests in Treasury, agency, corporate, mortgage-backed and asset-backed securities |
The Pension Plan’s long-term rate-of-return-on-assets assumption was set based on historical returns earned by equities and fixed income securities, adjusted to reflect expectations of future returns as applied to the plan’s target allocation of asset classes. Equities and fixed income securities were assumed to earn real rates of return in the ranges of 5-9% and 2-6%, respectively. The long-term inflation rate was estimated to be 3%. When these overall return expectations were applied to the Pension Plan’s target allocation, the result was an expected rate of return of 7% to 11%.
Alliance’s estimated contribution to the Pension Plan for 2011 is $67,000.
For measurement purposes, with respect to the Post-Retirement Plan, an 8.5% annual rate of increase in the per capita cost of covered health care benefits is assumed for 2011. The rate is assumed to decrease gradually to 4.5% by the year 2017 and remain at that level thereafter.
Assumed health care cost trend rates have a significant effect on the amounts reported for health care plans. A one percentage point change in assumed health care cost trend rates would have the following effects on the Post-Retirement Plan (in thousands):
| One Percentage Point Increase |
One Percentage Point Decrease |
|||||||
| Effect on total of service and interest cost |
$ 13 | $ (11) | ||||||
| Effect on post-retirement benefit obligations |
232 | (201) | ||||||
70
Table of Contents
Alliance Financial Corporation and Subsidiaries
Notes to Consolidated Financial Statements
The following benefit payments, which reflect expected future service, as appropriate, are expected to be paid from the Pension Plan (in thousands):
| Year ending December 31: |
||||
| 2011 |
$ 259 | |||
| 2012 |
265 | |||
| 2013 |
274 | |||
| 2014 |
273 | |||
| 2015 |
279 | |||
| Years 2016-2020 |
1,536 | |||
The following healthcare benefits are expected to be paid under the Post-Retirement Plan (in thousands):
| Year ending December 31: |
||||
| 2011 |
$ 346 | |||
| 2012 |
348 | |||
| 2013 |
347 | |||
| 2014 |
333 | |||
| 2015 |
333 | |||
| Years 2016-2020 |
1,600 | |||
The above benefit payments include expected life insurance claims, rather than the premiums that Alliance is paying to provide the life insurance.
Directors Retirement Plan
Alliance has a noncontributory defined benefit plan for non-employee directors (the “Directors Plan”). The Directors Plan provides for a normal retirement cash benefit equivalent to 35% of their average annual director’s fees, subject to increases based on the directors’ length and extent of service, payable in a number of circumstances, including normal retirement, death or disability and a change in control. Upon termination of service, the normal retirement benefit is payable in a lump sum or in ten equal installments.
The following table represents a reconciliation of the change in the benefit obligations, plan assets and funded status of the Directors Plan at December 31:
| 2010 | 2009 | |||||||
| Change in benefit obligation: | (In thousands) | |||||||
| Benefit obligation at beginning of year |
$ 676 | $ 518 | ||||||
| Service cost |
86 | 64 | ||||||
| Interest cost |
48 | 33 | ||||||
| Prior service cost |
— | 20 | ||||||
| Actuarial loss |
196 | 41 | ||||||
| Benefit obligation at end of year |
$ 1,006 | $ 676 | ||||||
| Plan assets |
— | — | ||||||
| Funded status at end of year |
$(1,006) | $(676) | ||||||
Pre-tax amounts recognized in accumulated other comprehensive income at December 31, 2010 that have not been recognized as components of net periodic benefit or cost consist of:
| 2010 | 2009 | |||||||
| (In thousands) | ||||||||
| Unrecognized actuarial loss |
$232 | $41 | ||||||
| Unrecognized prior service cost |
377 | 425 | ||||||
| $609 | $466 | |||||||
71
Table of Contents
Alliance Financial Corporation and Subsidiaries
Notes to Consolidated Financial Statements
The composition of the Directors Plan’s net periodic cost for the year ended December 31 is as follows (in thousands):
| 2010 | 2009 | |||||||
| Service cost |
$ 86 | $ 64 | ||||||
| Interest cost |
48 | 33 | ||||||
| Amortization of unrecognized prior service cost |
48 | 48 | ||||||
| Amortization of unrecognized actuarial loss |
5 | — | ||||||
| Total net periodic cost |
$187 | $145 | ||||||
The discount rate used in determining the benefit obligation for the Directors Plan as of December 31, 2010 and 2009 was 5.54% and 5.70%, respectively. The discount rate used to determine benefit obligations for the Directors Plan was based upon the Citibank pension liability index. The Citibank pension liability index was determined to appropriately reflect the rate at which the pension liabilities could be effectively settled based upon the expected duration of the Directors Plan. Directors’ fees were assumed to increase at an annual rate of 3.00%.
The following directors’ retirement benefit payments, which reflect expected future service, as appropriate, are expected to be paid (in thousands):
| Year ending December 31: |
||||
| 2011 |
$ — | |||
| 2012 |
41 | |||
| 2013 |
66 | |||
| 2014 |
66 | |||
| 2015 |
66 | |||
| Years 2016-2020 |
643 | |||
In 2011, $48,000 in unrecognized prior service costs and $30,000 in unrecognized actuarial losses are estimated to be amortized from accumulated other comprehensive income into the net periodic cost for the Directors’ Plan.
Supplemental Retirement Plans
Alliance has supplemental executive retirement plans (“SRP”) for certain current and former employees. Included in other assets, Alliance had segregated assets of $154,000, $166,000 and $174,000 at December 31, 2010, 2009 and 2008, respectively, to fund the estimated benefit obligation associated with certain SRP plans.
The following table represents a reconciliation of the change in the benefit obligations, plan assets and funded status of the SRP’s at December 31:
| 2010 | 2009 | |||||||
| Change in benefit obligation: | (In thousands) | |||||||
| Benefit obligation at beginning of year |
$ 3,564 | $ 3,466 | ||||||
| Service cost |
79 | 79 | ||||||
| Interest cost |
192 | 192 | ||||||
| Actuarial loss |
62 | 28 | ||||||
| Amendments |
— | 63 | ||||||
| Benefits paid |
(264) | (264) | ||||||
| Benefit obligation at end of year |
3,633 | 3,564 | ||||||
| Change in plan assets: |
||||||||
| Benefits paid |
(264) | (264) | ||||||
| Employer contributions |
264 | 264 | ||||||
| Fair value of plan assets at the end of year |
— | — | ||||||
| Funded status at end of year |
$(3,633) | $(3,564) | ||||||
72
Table of Contents
Alliance Financial Corporation and Subsidiaries
Notes to Consolidated Financial Statements
Pre-tax amounts recognized in accumulated other comprehensive income at December 31, 2010 that has not been recognized as components of net periodic benefit or cost consist of:
| 2010 | 2009 | |||||||
| (In thousands) | ||||||||
| Unrecognized actuarial loss |
$319 | $262 | ||||||
| Unrecognized prior service cost |
142 | 164 | ||||||
| $461 | $426 | |||||||
The composition of the SRP’s net periodic cost for the years ended December 31 is as follows (in thousands):
| 2010 | 2009 | 2008 | ||||||||||
| (In thousands) | ||||||||||||
| Service cost |
$ 79 | $ 79 | $ 61 | |||||||||
| Interest cost |
192 | 192 | 199 | |||||||||
| Amortization of unrecognized prior service cost |
22 | 10 | 10 | |||||||||
| Amortization of unrecognized actuarial loss |
4 | 10 | 9 | |||||||||
| Total net periodic cost |
$297 | $291 | $279 | |||||||||
Alliance amortizes unrecognized gain or losses and prior service costs in the SRP’s on a straight line basis over the future working lifetime of the participant expected to receive benefits under the plan. In the year of a participant’s retirement, any unrecognized gains or losses and prior service costs are fully recognized. Future unrecognized gains or losses arising after retirement are amortized over the participant’s remaining life expectancy.
The discount rate used in determining the benefit obligation of the SRP’s as of December 31, 2010, 2009 and 2008 was 5.44%, 5.60% and 5.77%, respectively. The discount rate used in determining the net periodic benefit cost was 5.60%, 5.77%, and 6.38%, for 2010, 2009, and 2008, respectively. The discount rate used to determine benefit obligations for the plans was based upon the Citibank pension liability index. The Citibank pension liability index, less an adjustment of 10 basis points, was determined to appropriately reflect the rate at which the pension liabilities could be effectively settled based upon the expected duration of the plans. Salaries were assumed to increase at an annual rate of 4.0% in 2010, 2009 and 2008.
The following SRP payments, which reflect expected future service, as appropriate, are expected to be paid (in thousands):
| Year ending December 31: |
||||
| 2011 |
$ 255 | |||
| 2012 |
252 | |||
| 2013 |
250 | |||
| 2014 |
302 | |||
| 2015 |
377 | |||
| Years 2016-2020 |
1,792 | |||
In 2011, $22,000 in unrecognized prior service costs and $4,000 in unrecognized actuarial losses are estimated to be amortized from accumulated other comprehensive income into the net periodic cost for the SRP’s.
Alliance assumed a SRP for directors from Bridge Street, providing for extended compensation after retirement. Alliance owns life insurance policies on these individuals to provide for the estimated benefit obligations for the SRP. Cash surrender value of these policies approximated $2.5 million at December 31, 2010 and 2009. At December 31, 2010 and 2009 other liabilities include approximately $666,000 and $696,000, respectively, accrued under the directors’ SRP from Bridge Street. Deferred compensation expense related to the SRP from Bridge Street for the year ended December 31, 2010, 2009 and 2008 approximated $64,000, $107,000 and $66,000, respectively.
13. Directors’ Deferred Compensation
Alliance has a stock-based deferral plan which provides directors and officers designated by the Board of Directors the opportunity to defer receipt of cash compensation and, thereby, accumulate additional shares of Alliance’s common stock. Only directors are deferring compensation under this plan. Alliance contributes the amount of compensation deferred to a trust, which purchases shares of Alliance’s common stock, and distributions are made in shares of Alliance’s common stock upon such events as are elected by
73
Table of Contents
Alliance Financial Corporation and Subsidiaries
Notes to Consolidated Financial Statements
participants. Dividends paid on shares are also converted to common stock. At December 31, 2010 and 2009, there were 120,237 and 103,512 shares held in trust with a cost basis of $3.0 million and $2.5 million, respectively.
Alliance maintained an optional deferred compensation plan for its directors, whereby fees normally received were deferred and paid by Alliance upon the retirement of the director. In March 2008, active directors transferred their plan balances into the stock-based deferred compensation plan and the remaining liability consists of the retired directors balances. At December 31, 2010 and 2009, other liabilities included approximately $408,000 and $533,000, respectively, relating to deferred compensation. Deferred compensation expense resulting from the earnings on deferred balances for the years ended December 31, 2010, 2009, and 2008 approximated $5,000, $9,000, and $76,000, respectively.
Alliance assumed a nonqualified deferred compensation plan for former directors of Bridge Street, under which participants were eligible to elect to defer all or part of their annual director fees. The plan provides that deferred fees are to be invested in mutual funds, as selected by the individual directors. Deferrals under the plan were discontinued effective with the acquisition of Bridge Street. At December 31, 2010 and 2009, deferred director fees included in other liabilities, and the corresponding assets included in other assets, aggregated approximately $287,000 and $372,000, respectively.
14. Stock Based Compensation Plans
The 2010 Restricted Stock Plan (“2010 Plan”) was approved by shareholders in May of 2010 authorizing the use of 200,000 shares of authorized but unissued common stock of Alliance. The purpose of the 2010 Plan is to promote the growth and profitability of Alliance and to provide eligible directors, certain key officers and employees of Alliance with an incentive to achieve corporate objectives, to attract and retain directors, key officers and employees of outstanding competence and to provide such directors, officers and employees with an equity interest in Alliance. Awards granted under this plan vest ratably over a five year period. In 2010, 34,097 restricted shares were granted to certain key officers under this plan.
Alliance also had a long-term incentive compensation plan (the “1998 Plan”) authorizing the use of 550,000 shares of authorized but unissued common stock of Alliance. Pursuant to the 1998 Plan, eligible individuals received incentive stock options, non-qualified stock options, and/or restricted stock awards. The 1998 Plan expired in 2009 and no further awards will be granted from this Plan.
Restricted shares granted under the 1998 Plan vest at the end of a 7-year period. Furthermore, 50% of the shares awarded, to all grantees except Alliance’s Chief Executive Officer, become vested on the date, at least three years after the award date, that Alliance’s stock price has closed at a price that is at least 160% of the award price for 15 consecutive days.
In 2009, Alliance’s Board of Directors approved a modification of the vesting schedule of restricted stock awards granted to all participating employees under the 1998 Plan. The modification provided for the immediate vesting of all restricted shares which would have vested as of November 24, 2009 had the original cliff-vesting schedule instead been a pro-rata vesting schedule over the same seven year period. The modification did not change the seven year cliff-vesting schedule for the remaining unvested shares held by plan participants.
Restricted stock awards are recorded as deferred compensation, a component of shareholders’ equity, at fair value at the date of the grant and amortized to compensation expense over the specified vesting periods.
Compensation expense associated with the amortization of the cost of all restricted shares issued for the years ended December 31, 2010, 2009 and 2008 was $357,000, $308,000, and $359,000, respectively. The fair value of the vested restricted shares was $57,000 in 2010. The unrecognized compensation cost for restricted stock awards was $1.4 million at December 31, 2010, which will be recognized as compensation expense over a weighted average period of 3.5 years.
74
Table of Contents
Alliance Financial Corporation and Subsidiaries
Notes to Consolidated Financial Statements
The following is a summary of Alliance’s restricted stock activity for the year ended December 31, 2010:
| Non- vested Shares |
Weighted Average Grant Date Fair Value |
|||||||
| Outstanding at beginning of year |
40,359 | $29.85 | ||||||
| Granted |
34,097 | 28.43 | ||||||
| Forfeited |
(3,865) | 28.43 | ||||||
| Vested |
(2,112) | 28.82 | ||||||
| Outstanding at end of year |
68,479 | $28.42 | ||||||
There were 28,700 options outstanding at December 31, 2010 under the 1998 Plan, that were issued with a 10-year term, vesting one year after the issue date, and exercisable based on Alliance achieving specified stock prices. No options were granted during 2010, 2009 and 2008.
Compensation expense recognized for stock options was $1,800 net of a tax benefit of $1,200 during 2008. As of December 31, 2008, there was no remaining unrecognized compensation cost related to non-vested stock option awards. Alliance generally uses authorized but unissued shares to satisfy stock option exercises.
Stock option activity in the Plan for the years ended December 31 was as follows:
| 2010 | ||||||||
| Options Outstanding |
Weighted Average Exercise Price |
|||||||
| Outstanding at beginning of year |
121,866 | $20.37 | ||||||
| Granted |
— | — | ||||||
| Exercised |
(84,648) | $19.03 | ||||||
| Forfeited |
(8,518) | $24.75 | ||||||
| Outstanding at end of year |
28,700 | $23.50 | ||||||
The following table summarizes Alliance’s stock options at December 31, 2010:
| Options Outstanding | Options Exercisable | |||||||||
| Exercise Price |
Options Outstanding |
Weighted Average Exercise Price |
Weighted Average Remaining Life (Years) |
Options Exercisable |
Weighted Average Exercise Price | |||||
| $23.50 |
28,700 | $23.50 | 1.0 | 28,700 | $23.50 | |||||
The total intrinsic value of options exercised during 2010 and 2009 was $903,000 and $170,000, respectively. The aggregate intrinsic value of shares outstanding and exercisable at December 31, 2010 was $254,000. Cash received from options exercised was $1.6 million and $1.4 million in 2010 and 2009, respectively. The tax benefit realized from stock options exercised was $283,000 and $48,000 in 2010 and 2009, respectively. No options were exercised in 2008.
15. Commitments and Contingent Liabilities
Alliance is a party to financial instruments with off-balance-sheet risk in the normal course of business to meet the financing needs of its customers. These financial instruments consist primarily of commitments to extend credit and letters of credit which involve, to varying degrees, elements of credit risk in excess of amounts recognized in the consolidated statements of condition. The contract amount of those commitments and letters of credit reflects the extent of involvement Alliance has in those particular classes of financial instruments. Alliance’s exposure to credit loss in the event of nonperformance by the counterparty to the financial instrument for commitments to extend credit and letters of credit is represented by the contractual amount of the instruments. Alliance uses the same credit policies in making commitments and letters of credit as it does for on-balance-sheet instruments.
75
Table of Contents
Alliance Financial Corporation and Subsidiaries
Notes to Consolidated Financial Statements
Financial instruments whose contract amounts represent credit risk (in thousands):
| Contract Amount | ||||||||||||
| 2010 | 2009 | 2008 | ||||||||||
| Commitments to extend credit, variable |
$148,031 | $134,540 | $129,818 | |||||||||
| Commitments to extend credit, fixed |
29,090 | 28,176 | 32,782 | |||||||||
| Standby letters of credit |
3,223 | 4,371 | 1,572 | |||||||||
Commitments to extend credit are agreements to lend to a customer as long as there is no violation of any condition established in the contract. Commitments generally have fixed expiration dates or other termination clauses and may require payments of a fee. Since some of the commitment amounts are expected to expire without being drawn upon, the total commitment amounts do not necessarily represent future cash requirements. Standby letters of credit written are conditional commitments issued by Alliance to guarantee the performance of a customer to a third party. Those guarantees are primarily issued to support public and private borrowing arrangements, including bond financing and similar transactions. The credit risk involved in issuing standby letters of credit is essentially the same as that involved in extending loan facilities to customers. Since the letters of credit are expected to expire without being drawn upon, the total commitment amounts do not necessarily represent future cash requirements. For both commitments to extend credit and standby letters of credit, the amount of collateral obtained, if deemed necessary by Alliance upon the extension of credit, is based on management’s credit evaluation of the counterparty. Collateral held varies, but includes residential and commercial real estate.
Alliance leases office space and certain branches under noncancelable operating lease agreements having initial terms which expire at various dates through 2025. Total rental expense was approximately $1.2 million in 2010, $1.2 million in 2009, and $1.2 million in 2008.
Minimum rental payments under the initial terms of these leases are summarized as follows (in thousands):
| Year ending December 31: |
||||
| 2011 |
$ 1,086 | |||
| 2012 |
1,046 | |||
| 2013 |
947 | |||
| 2014 |
844 | |||
| 2015 |
827 | |||
| Thereafter |
8,644 | |||
| Total minimum lease payments |
$13,394 | |||
The Bank entered into an agreement in 2005 with Onondaga County whereby the Bank obtained the naming rights to a sports stadium in Syracuse, NY for a 20-year term. Under the agreement, the Bank paid $152,000 in 2010, 2009 and 2008, and will pay $152,000 annually from 2011 through 2024.
Alliance is required to maintain a reserve balance as established by the Federal Reserve Bank of New York. The required average total reserve for the 14-day maintenance period ended December 31, 2010 was $600,000.
The ASC Topic on Asset Retirement Obligations refers to a legal obligation to perform an asset retirement activity in which the timing and (or) method of settlement are conditional on a future event that may or may not be within the control of Alliance. Alliance is required to recognize a liability for the fair value of a conditional asset retirement obligation when it is incurred, generally upon acquisition, construction, or development and (or) through the normal operation of the asset, and if the fair value of the liability can be reasonably estimated. The guidance acknowledges that in some cases sufficient information may not be available to reasonably estimate the fair value of an asset retirement obligation. Alliance acknowledges that some of its facilities were constructed years ago when asbestos was used for insulation and other construction purposes. Of our current 29 branches, nine are estimated to have been constructed when some use of asbestos was common. Regulations are now in place that require Alliance to handle and dispose of asbestos in a special manner if major renovations or demolition of a facility are to be completed. Alliance does not believe that it has sufficient information to estimate the fair value of the obligation at this time since no major renovations or demolition of any of its facilities have not been planned and if undertaken, would occur at an unknown future date. Accordingly, Alliance has not recognized a liability or a contingent liability in connection with potential future costs to remove and dispose of asbestos from its facilities.
76
Table of Contents
Alliance Financial Corporation and Subsidiaries
Notes to Consolidated Financial Statements
16. Dividends and Restrictions
The primary source of cash to pay dividends to Alliance’s shareholders is through dividends from its banking subsidiary. The FRB and the Office of the Comptroller of the Currency are authorized to determine certain circumstances that the payment of dividends would be an unsafe or unsound practice and to prohibit payment of such dividends. The payment of dividends that deplete a bank’s capital base could be deemed to constitute such an unsafe or unsound practice. Banking organizations may generally only pay dividends from the combined current year and prior two years’ net income less any dividends previously paid during that period. At December 31, 2010, approximately $16.2 million was available for the declaration of dividends by the Bank. There were no loans or advances from the subsidiary Bank to Alliance at December 31, 2010.
17. Fair Value Measurements
Fair value is the exchange price that would be received for an asset or paid to transfer a liability (exit price) in the principal or most advantageous market for the asset or liability in an orderly transaction between market participants on the measurement date. There are three levels of inputs that may be used to measure fair values:
Level 1: Quoted prices (unadjusted) for identical assets or liabilities in active markets that the entity has the ability to access as of the measurement date.
Level 2: Significant other observable inputs other than Level 1 prices such as quoted prices for similar assets or liabilities; quoted prices in markets that are not active; or other inputs that are observable or can be corroborated by observable market data.
Level 3: Significant unobservable inputs that reflect a reporting entity’s own assumptions about the assumptions that market participants would use in pricing an asset or liability.
Assets Measured on a Recurring Basis
The fair values of debt securities available-for-sale are determined by obtaining matrix pricing, which is a mathematical technique used widely in the industry to value debt securities without relying exclusively on quoted prices for the specific securities but rather by relying on the securities’ relationship to other benchmark quoted securities. The fair value of mutual fund and equity securities available-for-sale are determined by obtaining quoted prices on nationally recognized securities exchanges when available (Level 1). For mutual fund and equity securities where quoted prices are not available, fair values are calculated based on market prices of similar securities (Level 2).
Assets measured at fair value on a recurring basis are summarized below (in thousands):
| Fair Value Measurements at December 31, 2010 Using | ||||||||||||
| Fair Value | Quoted market prices in active markets for identical assets (Level 1) |
Significant other observable inputs (Level 2) |
||||||||||
| Debt Securities: |
||||||||||||
| Obligations of U.S. government-sponsored corporations |
$ 4,186 | $ — | $ 4,186 | |||||||||
| Obligations of states and political subdivisions |
78,212 | — | 78,212 | |||||||||
| Mortgage-backed securities - residential |
329,010 | — | 329,010 | |||||||||
| Total debt securities |
411,408 | — | 411,408 | |||||||||
| Stock Investments: |
||||||||||||
| Equity securities |
1,995 | — | 1,995 | |||||||||
| Mutual funds |
1,007 | 1,007 | — | |||||||||
| Total stock investments |
3,002 | 1,007 | 1,995 | |||||||||
| Total available-for-sale |
$414,410 | $1,007 | $413,403 | |||||||||
77
Table of Contents
Alliance Financial Corporation and Subsidiaries
Notes to Consolidated Financial Statements
| Fair Value Measurements at December 31, 2009 Using | ||||||||||||
| Fair Value | Quoted market prices in active markets for identical assets (Level 1) |
Significant other observable inputs (Level 2) |
||||||||||
| Debt Securities: |
||||||||||||
| U.S. Treasury obligations |
$ 101 | $ — | $ 101 | |||||||||
| Obligations of U.S. government-sponsored corporations |
6,129 | — | 6,129 | |||||||||
| Obligations of states and political subdivisions |
77,147 | — | 77,147 | |||||||||
| Mortgage-backed securities - residential |
275,680 | — | 275,680 | |||||||||
| Total debt securities |
359,057 | — | 359,057 | |||||||||
| Stock Investments: |
||||||||||||
| Equity securities |
2,104 | 16 | 2,088 | |||||||||
| Mutual funds |
997 | 997 | — | |||||||||
| Total stock investments |
3,101 | 1,013 | 2,088 | |||||||||
| Total available-for-sale |
$362,158 | $1,013 | $361,145 | |||||||||
Assets Measured on a Non-Recurring Basis
Impaired loans and leases – Loans and leases are generally not recorded at fair value on a recurring basis. Periodically, Alliance records nonrecurring adjustment to the carrying value of loans based on fair value measurements for partial charge-offs of the uncollectible portions of those loans. Nonrecurring adjustments also include certain impairment amounts for collateral-dependent loans calculated when establishing the allowance for credit losses. Such amounts are generally based on the fair value of the underlying collateral supporting the loan and, as a result, the carrying value of the loan less the calculated valuation amount does not necessarily represent the fair value of the loan. Real estate collateral is typically valued using independent appraisals or other indications of value based on recent comparable sales of similar properties or assumptions generally observable in the marketplace. These valuations are adjusted based on non-observable inputs and the related nonrecurring fair value measurement adjustments have generally been classified as Level 3. Estimates of fair value used for other collateral supporting commercial loans generally are based on assumptions not observable in the marketplace and, therefore, such valuations have been classified as Level 3.
Impaired loans, which are measured for impairment using the fair value of the collateral for collateral dependent loans, had a carrying amount of $1.7 million with a valuation allowance of $421,000 at December 31, 2010. At December 31, 2009, impaired loans had a carrying amount of $908,000, with a valuation allowance of $332,000. Changes in fair value recognized for partial charge-offs of loans and leases and impairment reserves on loans and leases were $1.6 million and $3.3 million during 2010 and 2009, respectively.
Loans held-for-sale – The fair value of loans held-for-sale is determined, when possible, using quoted secondary-market prices (Level 1), or if no such quoted price exists, the fair value of a loan is determined using quoted prices for a similar asset or assets, adjusted for the specific attributes of that loan (Level 2). There was no fair value allowance recorded on loans held-for-sale at December 31, 2010 and 2009. Losses of $4,000 and $52,000 during 2009 and 2008, respectively, were recorded in other income related to fair value adjustments on loans held-for-sale.
Leases held-for-sale – The fair value of leases held-for-sale is primarily determined using an unadjusted quoted price for those leases, when available. If no such quoted price exists, the fair value of a lease is determined using quoted prices for a similar asset or assets, adjusted for the specific attributes of that lease. There were no leases held for sale at December 31, 2010 and 2009. During 2008, a loss of $187,000 was recorded in other income.
78
Table of Contents
Alliance Financial Corporation and Subsidiaries
Notes to Consolidated Financial Statements
Assets measured at fair value on a non-recurring basis by fair value measurement used are summarized below (in thousands):
| At December 31, 2010 | At December 31, 2009 | |||||||||||||||
| Fair Value |
Significant unobservable inputs (Level 3) |
Fair Value |
Significant unobservable inputs (Level 3) |
|||||||||||||
| Impaired loans and leases: |
||||||||||||||||
| Commercial |
$ 946 | $ 946 | $305 | $305 | ||||||||||||
| Leases |
16 | 16 | 271 | 271 | ||||||||||||
| Residential real estate |
309 | 309 | — | — | ||||||||||||
| $1,271 | $1,271 | $576 | $576 | |||||||||||||
The carrying amounts and estimated fair values of financial instruments, not previously presented, at December 31 are as follows (in thousands):
| 2010 | 2009 | |||||||||||||||
| Carrying Amount |
Estimated Fair Value |
Carrying Amount |
Estimated Fair Value |
|||||||||||||
| Financial Assets: |
||||||||||||||||
| Cash and cash equivalents |
$ 32,501 | $ 32,501 | $ 26,696 | $ 26,696 | ||||||||||||
| FHLB and FRB stock |
8,652 | N/A | 10,074 | N/A | ||||||||||||
| Loans held for sale |
2,940 | 2,940 | 1,023 | 1,023 | ||||||||||||
| Net loans and leases |
887,854 | 923,899 | 904,748 | 943,818 | ||||||||||||
| Accrued interest receivable |
4,149 | 4,149 | 4,167 | 4,167 | ||||||||||||
| Financial Liabilities: |
||||||||||||||||
| Deposits |
$1,134,598 | $1,138,395 | $1,075,671 | $1,080,083 | ||||||||||||
| Borrowings |
142,792 | 147,575 | 172,707 | 175,914 | ||||||||||||
| Junior subordinated obligations |
25,774 | 10,253 | 25,774 | 9,271 | ||||||||||||
| Accrued interest payable |
1,391 | 1,391 | 1,745 | 1,745 | ||||||||||||
The fair value of commitments to extend credit and standby letters of credit is not significant.
Alliance’s fair value estimates are based on our existing on and off balance sheet financial instruments without attempting to estimate the value of any anticipated future business and the value of assets and liabilities that are not considered financial instruments. In addition, the tax ramifications related to the realization of the unrealized gains and losses can have a significant effect on our fair value estimates and have not been considered in these estimates.
The fair value estimates are made as of a specific point in time, based on relevant market information and information about the financial instruments, including our judgments regarding future expected loss experience, current economic conditions, risk characteristics of various financial instruments, and other factors. These estimates are subjective in nature and involve uncertainties and matters of significant judgment and therefore cannot be determined with precision. Changes in our assumptions could significantly affect the estimates.
The following methods and assumptions were used by Alliance in estimating its fair value disclosures for financial instruments:
Cash and Cash Equivalents
The carrying amounts reported in the consolidated balance sheet for cash and short-term instruments approximate those assets’ fair value.
FHLB and FRB Stock
It is not practicable to determine the fair value of FHLB and FRB stock due to restrictions placed on its transferability.
79
Table of Contents
Alliance Financial Corporation and Subsidiaries
Notes to Consolidated Financial Statements
Loans and Leases
Variable-rate loans reprice as the associated rate index changes. Therefore, the carrying value of these loans approximates fair value. The fair value of our fixed-rate loans and leases were calculated by discounting scheduled cash flows through the estimated maturity using current origination rates, credit adjusted for delinquent loans and leases. Our estimate of maturity is based on the contractual cash flows adjusted for prepayment estimates based on current economic and lending conditions. The fair value of accrued interest approximates carrying value.
Deposits
The fair values disclosed for non-interest-bearing accounts and accounts with no stated maturity are, by definition, equal to the amount payable on demand at the reporting date. The fair value of time deposits was estimated by discounting expected monthly maturities at interest rates approximating those currently being offered at the FHLB on similar terms. The fair value of accrued interest approximates carrying value.
Borrowings
The fair value of borrowings are estimated using discounted cash flow analysis, based on interest rates approximating those currently being offered for borrowings with similar terms.
Junior Subordinated Obligations
The fair value of trust preferred debentures has been estimated using a discounted cash flow analysis to maturity.
Off-Balance-Sheet Instruments
Off-balance-sheet financial instruments consist of commitments to extend credit and standby letters of credit, with fair value based on fees currently charged to enter into agreements with similar terms and credit quality. Amounts are not significant.
18. Capital and Regulatory Matters
Capital Requirements
Alliance and the Bank are subject to various regulatory capital requirements administered by the federal banking agencies. Failure to meet minimum capital requirements can initiate certain mandatory and possibly discretionary actions by regulators that, if undertaken, could have a direct material effect on Alliance’s financial statements. Under capital adequacy guidelines and the regulatory framework for prompt corrective action, Alliance and the Bank must meet specific capital guidelines that involve quantitative measures of their assets, liabilities, and certain off-balance-sheet items as calculated under regulatory accounting practices. Alliance’s and the Bank’s capital amounts and classifications are also subject to qualitative judgments by the regulators about components, risk weightings, and other factors.
Quantitative measures established by regulation to ensure capital adequacy require Alliance and the Bank to maintain minimum amounts and ratios, as defined in the regulations, of total risk-based capital and Tier 1 capital to risk-weighted assets. The leverage ratio reflects Tier 1 capital divided by the average total assets for the period. Average assets used in the calculation exclude Alliance’s intangible assets.
The capital levels at the Bank are maintained at or above the well-capitalized minimums of 10%, 6% and 5% for the total risk-based, Tier 1 capital, and leverage ratio, respectively. As of December 31, 2010, the most recent notification from the Office of the Comptroller of the Currency categorized the Bank as “well-capitalized” under the regulatory framework for prompt corrective action. There are no conditions or events since that notification that management believes have changed the institution’s category.
80
Table of Contents
Alliance Financial Corporation and Subsidiaries
Notes to Consolidated Financial Statements
Alliance’s and the Bank’s regulatory capital measures are presented in the following table (dollars in thousands):
| Actual | For
Capital Adequacy Purposes |
To Be Well
Capitalized Under Prompt Corrective Action Provisions |
||||||||||||||||||||||
| Amount | Ratio | Amount | Ratio | Amount | Ratio | |||||||||||||||||||
| As of December 31, 2010 |
||||||||||||||||||||||||
| Total risk-based capital |
||||||||||||||||||||||||
| Company |
$127,629 | 14.65% | $69,684 | ³8.00% | N/A | N/A | ||||||||||||||||||
| Bank |
119,203 | 13.79% | 69,136 | ³8.00% | $86,420 | ³10.00% | ||||||||||||||||||
| Tier 1 capital |
||||||||||||||||||||||||
| Company |
116,943 | 13.43% | 34,842 | ³4.00% | N/A | N/A | ||||||||||||||||||
| Bank |
108,517 | 12.56% | 34,568 | ³4.00% | 51,852 | ³6.00% | ||||||||||||||||||
| Leverage |
||||||||||||||||||||||||
| Company |
116,943 | 8.28% | 56,493 | ³4.00% | N/A | N/A | ||||||||||||||||||
| Bank |
108,517 | 7.72% | 56,202 | ³4.00% | 70,253 | ³5.00% | ||||||||||||||||||
| As of December 31, 2009 |
||||||||||||||||||||||||
| Total risk-based capital |
||||||||||||||||||||||||
| Company |
$115,308 | 13.14% | $70,210 | ³8.00% | N/A | N/A | ||||||||||||||||||
| Bank |
109,208 | 12.55% | 69,595 | ³8.00% | 86,994 | ³10.00% | ||||||||||||||||||
| Tier 1 capital |
||||||||||||||||||||||||
| Company |
105,894 | 12.07% | 35,105 | ³4.00% | N/A | N/A | ||||||||||||||||||
| Bank |
99,794 | 11.47% | 34,798 | ³4.00% | 52,196 | ³6.00% | ||||||||||||||||||
| Leverage |
||||||||||||||||||||||||
| Company |
105,894 | 7.55% | 56,113 | ³4.00% | N/A | N/A | ||||||||||||||||||
| Bank |
99,794 | 7.14% | 55,873 | ³4.00% | 69,841 | ³5.00% | ||||||||||||||||||
Preferred Stock and Warrants under the U.S. Treasury’s Capital Purchase Plan
In December 2008, the U.S. Department of Treasury (“Treasury Department”) purchased, in connection with the Capital Purchase Program (“CPP”) under the Troubled Asset Relief Program, 26,918 shares of Alliance’s newly issued, non-voting senior cumulative preferred stock (“Preferred Stock”) valued at $26.9 million, with an initial annual dividend of 5% for five years and 9% thereafter. Dividends were accrued as earned. The Preferred Stock qualified as Tier 1 capital for regulatory reporting purposes.
On May 13, 2009, Alliance redeemed all 26,918 shares of its Preferred Stock. Alliance paid $27.2 million to the Treasury Department to redeem the Preferred Stock, which included the original investment amount of $26.9 million plus accrued dividends of approximately $329,000. Alliance and Bank received unconditional approvals from their respective regulators and from the Treasury Department to redeem the Preferred Stock. As a result of the redemption, Alliance recorded a reduction in undivided profits of approximately $551,000 in the second quarter of 2009 associated with the accelerated discount accretion related to the difference between the amount at which the Preferred Stock sale was initially recorded and the redemption price. The Preferred Stock dividend and the acceleration of the accretion reduced the second quarter’s net income available to common shareholders and earnings per common share by $726,000 and $0.16, respectively.
In connection with the CPP, the Treasury Department was issued a warrant (“Warrant”) to purchase 173,069 shares of Alliance’s common stock with an exercise price of $23.33 per share representing an aggregate market price of $4.0 million. On June 17, 2009, Alliance repurchased the Warrant for $900,000. The repurchase of the Warrant was recorded as a reduction to shareholders’ equity and had no affect on Alliance’s net income and earnings per share.
81
Table of Contents
Alliance Financial Corporation and Subsidiaries
Notes to Consolidated Financial Statements
19. Parent Company Financial Information
Condensed financial statement information of Alliance Financial Corporation for the years ended December 31 is as follows (in thousands):
Condensed Balance Sheets
| Assets: | 2010 | 2009 | ||||||
| Investment in subsidiaries |
$149,656 | $142,944 | ||||||
| Cash |
3,619 | 2,146 | ||||||
| Securities |
1,666 | 1,694 | ||||||
| Investment in limited partnerships |
2,590 | 2,353 | ||||||
| Other assets |
2,868 | 1,941 | ||||||
| Total Assets |
$160,399 | $151,078 | ||||||
| Liabilities: |
||||||||
| Junior subordinated obligations |
$ 25,774 | $ 25,774 | ||||||
| Dividends payable |
1,419 | 1,292 | ||||||
| Other liabilities |
75 | 77 | ||||||
| Total Liabilities |
27,268 | 27,143 | ||||||
| Shareholders’ Equity: |
||||||||
| Common stock |
5,051 | 4,937 | ||||||
| Surplus |
45,620 | 43,013 | ||||||
| Undivided profits |
92,380 | 86,194 | ||||||
| Accumulated other comprehensive income |
1,713 | 946 | ||||||
| Directors’ stock-based deferred compensation plan |
(2,977) | (2,499) | ||||||
| Treasury stock |
(8,656) | (8,656) | ||||||
| Total Shareholders’ Equity |
133,131 | 123,935 | ||||||
| Total Liabilities and Shareholders’ Equity |
$160,399 | $151,078 | ||||||
Condensed Statements of Income
| 2010 | 2009 | 2008 | ||||||||||
| Dividend income from the Bank |
$ 4,500 | $ 6,000 | $ 9,500 | |||||||||
| Interest and dividends on securities |
20 | 25 | 43 | |||||||||
| Loss on sale of securities available-for-sale |
(5) | — | — | |||||||||
| Income from limited partnerships |
238 | 75 | 202 | |||||||||
| Gain on sale of insurance agency |
815 | — | — | |||||||||
| Interest expense on junior subordinated debentures |
(645) | (808) | (1,399) | |||||||||
| Non-interest expenses |
(65) | (72) | (129) | |||||||||
| Income tax expense |
(806) | — | — | |||||||||
| 4,052 | 5,220 | 8,217 | ||||||||||
| Equity in undistributed income of subsidiaries |
7,572 | 6,228 | 2,140 | |||||||||
| Net Income |
$11,624 | $11,448 | $10,357 | |||||||||
82
Table of Contents
Alliance Financial Corporation and Subsidiaries
Notes to Consolidated Financial Statements
Condensed Statements of Cash Flows
| 2010 | 2009 | 2008 | ||||||||||
| Operating Activities: |
||||||||||||
| Net income |
$11,624 | $11,448 | $10,357 | |||||||||
| Adjustments to reconcile net income to net cash provided by operating activities: |
||||||||||||
| Equity in undistributed net income of subsidiary |
(7,572) | (6,228) | (2,140) | |||||||||
| Depreciation expense |
50 | 57 | 116 | |||||||||
| Loss on sale of securities available-for-sale |
5 | — | — | |||||||||
| Provision for deferred income tax |
(199) | — | — | |||||||||
| Gain on sale of insurance agency |
(815) | — | — | |||||||||
| Net change in other assets and liabilities |
123 | 321 | 114 | |||||||||
| Net cash provided by operating activities |
3,216 | 5,598 | 8,447 | |||||||||
| Investing Activities: |
||||||||||||
| Proceeds from sale of securities available-for-sale |
21 | — | — | |||||||||
| Purchase of securities available-for-sale |
— | — | (23) | |||||||||
| Proceeds from sale of premises and equipment |
65 | — | — | |||||||||
| Proceeds from sale of insurance agency |
1,904 | — | — | |||||||||
| Net cash provided by (used in) investing activities |
1,990 | — | (23) | |||||||||
| Financing Activities: |
||||||||||||
| Treasury stock purchased |
— | — | (3.431) | |||||||||
| Proceeds from the exercise of stock options |
1,598 | 1,352 | — | |||||||||
| Retirement of common stock |
(20) | (421) | — | |||||||||
| Issuance of preferred stock |
— | — | 26,918 | |||||||||
| Redemption of preferred stock |
— | (26,918) | — | |||||||||
| Repurchase of warrant |
— | (900) | — | |||||||||
| Capital contribution to subsidiary |
— | — | (23,918) | |||||||||
| Return of capital from subsidiary |
— | 23,918 | — | |||||||||
| Cash dividends paid to common shareholders |
(5,311) | (4,872) | (4,570) | |||||||||
| Cash dividends paid to preferred shareholders |
— | (538) | — | |||||||||
| Net cash used in financing activities |
(3,733) | (8,379) | (5,001) | |||||||||
| Increase (decrease) in cash and cash equivalents |
1,473 | (2,781) | 3,423 | |||||||||
| Cash and cash equivalents at beginning of year |
2,146 | 4,927 | 1,504 | |||||||||
| Cash and cash equivalents at end of year |
$3,619 | $2,146 | $4,927 | |||||||||
| Supplemental Disclosures of Cash Flow Information: |
||||||||||||
| Non-cash financing activities: |
||||||||||||
| Dividend declared and unpaid |
$1,419 | $1,292 | $1,191 | |||||||||
In October 2001, Alliance’s Board of Directors adopted a shareholders’ rights plan. Under the plan, Series A Junior Participating Preferred Stock Purchase Rights were distributed at the close of business on October 29, 2001 to shareholders of record as of that date. The Rights trade with the Common Stock, and are exercisable and trade separately from the Common Stock only if a person or group acquires or announces a tender or exchange offer that would result in such person or group owning 20% or more of the Common Stock of Alliance. In the event the person or group acquires a 20% Common Stock position, the Rights allow other holders to purchase stock of Alliance at a discount to market value. Alliance is generally entitled to redeem the Rights at $.001 per Right at any time prior to the 10th day after a person or group has acquired a 20% Common Stock position. The Rights will expire on October 29, 2011 unless the plan is extended or the Rights are earlier redeemed or exchanged.
83
Table of Contents
Item 9. Changes in and Disagreements with Accountants on Accounting and Financial Disclosure
None.
Item 9A. Controls and Procedures
Evaluation of Disclosure Controls and Procedures
Management, including our President and Chief Executive Officer and Chief Financial Officer, has evaluated the effectiveness of our disclosure controls and procedures (as defined in Exchange Act Rules 13a-15(e) and 15d-15(e)) as of the end of the period covered by this report. Based upon that evaluation, our Chief Executive Officer and Chief Financial Officer concluded that the disclosure controls and procedures were effective to ensure that information required to be disclosed in the reports we file and submit under the Exchange Act (i) is recorded, processed, summarized and reported as and when required and (ii) accumulated and communicated to our management including the Chief Executive Officer and Chief Financial Officer, as appropriate to allow timely discussion regarding required disclosure.
Management’s Report on Internal Control Over Financial Reporting
Our management is responsible for establishing and maintaining adequate internal control over financial reporting, as such term is defined in Rules 13a-15(f) and 15d-15(f) of the Securities Exchange Act of 1934, as amended. Because of its inherent limitations, internal control over financial reporting may not prevent or detect misstatements. Also, projections of any evaluation of effectiveness to future periods are subject to the risk that controls may become inadequate because of changes in conditions, or that the degree of compliance with policies or procedures may deteriorate. Our internal control over financial reporting is a process designed under the supervision of our principal executive officer and principal financial officer to provide reasonable assurance regarding the reliability of financial reporting and the preparation of our financial statements for external reporting purposes in accordance with Unites States generally accepted accounting principles.
Under the supervision and with the participation of management, including our principal executive officer and principal financial officer, we conducted an evaluation of the effectiveness of our internal control over financial reporting based on the framework in Internal Control – Integrated Framework issued by the Committee of Sponsoring Organizations of the Treadway Commission. Based on our evaluation under that framework, management concluded that our internal control over financial reporting was effective as of December 31, 2010. In addition, based on our assessment, management has determined that there were no material weaknesses in our internal controls over financial reporting.
Attestation Report of the Registered Public Accounting Firm
The effectiveness of our internal control over financial reporting as of December 31, 2010 has been audited by Crowe Horwath LLP, our independent registered public accounting firm, as stated in its report, which is set forth in Item 8. “Financial Statements and Supplementary Data” on page 39 under the heading “Report of Independent Registered Public Accounting Firm” and is incorporated herein by reference.
Changes in Internal Control Over Financial Reporting
We regularly assess the adequacy of our internal control over financial reporting and enhance our controls in response to internal control assessments and internal and external audit and regulatory recommendations. There have been no changes in our internal control over financial reporting identified in connection with the evaluation that occurred during our last fiscal quarter that has materially affected, or that is reasonably likely to materially affect, our internal control over financial reporting.
None.
84
Table of Contents
Item 10. Directors and Executive Officers of the Registrant and Corporate Governance
The information required by this Item 10 is incorporated herein by reference to the sections entitled “Information About Our Board of Directors” and “Information About Our Executive Officers,” “Information about the Board of Directors and Corporate Governance,” “Code of Ethics,” “Section 16 (a) Beneficial Ownership Reporting Compliance,” “Committees of the Board of Directors – Corporate Governance Committee,” “Committees of the Board of Directors – Audit Committee” and “Report of the Audit Committee of the Board of Directors” in our Proxy Statement.
Item 11. Executive Compensation
The information required by this Item 11 is incorporated herein by reference to the sections entitled “Compensation Discussion and Analysis,” “Executive and Director Compensation Tables” and “Committees of the Board of Directors-Compensation Committee” in our Proxy Statement.
Item 12. Security Ownership of Certain Beneficial Owners and Management and Related Stockholder Matters
The information required by this item 12 is incorporated herein by reference to the sections entitled “Securities Authorized For Issuance Under Equity Compensation Plans,” “Information About Our Executive Officers” and “Security Ownership of Certain Beneficial Owners and Management” in our Proxy Statement.
Item 13. Certain Relationships and Related Transactions and Director Independence
The information required by this Item 13 is incorporated herein by reference to the sections entitled “Board of Directors Independence” and “Transactions With Related Persons” in our Proxy Statement.
Item 14. Principal Accountant Fees and Services
The information required by this Item 14 is incorporated herein by reference to the section entitled “Independent Registered Public Accounting Firm Fees and Services” in our Proxy Statement.
85
Table of Contents
Item 15. Exhibits and Financial Statement Schedules
The financial statement schedules and exhibits filed as part of this form 10-K are as follows:
(a)(1) Financial Statements
Reference is made to the Consolidated Financial Statements included in Item 8 of Part II hereof.
(a) (2) Financial Statement Schedules
Consolidated financial statement schedules have been omitted because the required information is not present, or not present in amounts sufficient to require submission of the schedules, or because the required information is provided in the consolidated financial statements or notes thereto.
(a) (3) Exhibits
The exhibits required to be filed as part of the Annual Report on Form 10-K are listed in the Exhibit Index attached hereto and are incorporated herein by reference.
86
Table of Contents
SIGNATURES
Pursuant to the requirements of Section 13 or 15(d) of the Securities Exchange Act of 1934, the registrant has duly caused this report to be signed on its behalf by the undersigned, thereunto duly authorized.
| ALLIANCE FINANCIAL CORPORATION | ||||
| (Registrant) | ||||
| Date March 14, 2011 |
By |
/s/Jack H. Webb | ||
| Jack H. Webb, Chairman, President & CEO | ||||
| (Principal Executive Officer) | ||||
| Date March 14, 2011 |
By |
/s/J. Daniel Mohr | ||
| J. Daniel Mohr, Executive Vice President & CFO | ||||
| (Principal Financial and Accounting Officer) | ||||
Pursuant to the requirements of the Securities Exchange Act of 1934, this report has been signed below by the following persons on behalf of the registrant, and in the capacities and on the dates indicated.
| /s/Mary Pat Adams |
Date March 14, 2011 | |||
| Mary Pat Adams, Director |
||||
| /s/Donald S. Ames |
Date March 14, 2011 | |||
| Donald S. Ames, Director |
||||
| /s/Donald H. Dew |
Date March 14, 2011 | |||
| Donald H. Dew, Director |
||||
| /s/John M. Endries |
Date March 14, 2011 | |||
| John M. Endries, Director |
||||
| /s/Samuel J. Lanzafame |
Date March 14, 2011 | |||
| Samuel J. Lanzafame, Director |
||||
| /s/Margaret G. Ogden |
Date March 14, 2011 | |||
| Margaret G. Ogden, Director |
||||
| /s/Lowell A. Seifter |
Date March 14, 2011 | |||
| Lowell A. Seifter, Director |
||||
| /s/Charles E. Shafer |
Date March 14, 2011 | |||
| Charles E. Shafer, Director |
||||
|
|
Date | |||
| Charles H. Spaulding, Director |
||||
| /s/Paul M. Solomon |
Date March 14, 2011 | |||
| Paul M. Solomon, Director |
||||
| /s/Deborah F. Stanley |
Date March 14, 2011 | |||
| Deborah F. Stanley, Director |
||||
| /s/John H. Watt, Jr. |
Date March 14, 2011 | |||
| John H. Watt, Jr., Executive Vice President & Director |
||||
| /s/Jack H. Webb |
Date March 14, 2011 | |||
| Jack H. Webb, Chairman, President & CEO and Director |
||||
| (Principal Executive Officer) |
||||
87
Table of Contents
EXHIBIT INDEX
| Exhibit |
Exhibit | |
| 3.1 |
Restated Certificate of Incorporation of Alliance (incorporated herein by reference to Exhibit 3.1 to Current Report on Form 8-K filed with the Commission on August 27, 2009). | |
| 3.2 † |
Amended and Restated Bylaws of Alliance. | |
| 4.1 |
Rights Agreement dated October 19, 2001 between Alliance Financial Corporation and American Stock Transfer & Trust Company, including the Certificate of Amendment to Alliance’s Certificate of Incorporation, the form of Rights Certificate and the Summary of Rights attached thereto as Exhibits A, B, and C, respectively (incorporated herein by reference to Exhibit 4.1 to Alliance’s Form 8-A12G filed with the SEC on October 25, 2001). | |
| 10.1 * |
Alliance Financial Corporation 2010 Restricted Stock Plan dated May 11, 2010 (incorporated herein by reference to Exhibit 10.1 of Alliance’s quarterly report on Form 10-Q filed with the SEC on August 6, 2010). | |
| 10.2 * |
Alliance Financial Corporation 2010 Restricted Stock Plan Form of Restricted Stock Award Notice (incorporated herein by reference to Exhibit 10.1 of Alliance’s quarterly report on Form 10-Q filed with the SEC on November 8, 2010). | |
| 10.3 * |
Alliance Financial Corporation 1998 Long Term Incentive Compensation Plan (incorporated herein by reference to Exhibit 10.1 to Alliance’s Registration Statement on Form S-4, Registration No. 333-62623, filed with the SEC on August 31, 1998, as amended). | |
| 10.4 * |
Employment Agreement dated January 26, 2010 by and between Alliance and Jack H. Webb (incorporated herein by reference to Exhibit 10.1 of Alliance’s Current Report on Form 8-K filed with the SEC on February 1, 2010). | |
| 10.5 * |
Amended and Restated Supplemental Retirement Agreement, dated as of November 28, 2006, by and among Alliance, Alliance Bank, N.A. and Jack H. Webb (incorporated herein by reference to Exhibit 10.5 to Alliance’s Current Report on Form 8-K filed with the SEC on February 1, 2010). | |
| 10.6 * |
First Amendment to the Amended and Restated Supplemental Retirement Agreement between Alliance, the Bank and Jack H. Webb (incorporated herein by reference to Exhibit 10.6 to Alliance’s Current Report on Form 8-K filed with the SEC on February 1, 2010). | |
| 10.7 * |
Split Dollar Agreement between the Bank and Jack H. Webb (incorporated herein by reference to Exhibit 10.4 to Alliance’s Current Report on Form 8-K filed with the SEC on February 1, 2010). | |
| 10.8 * |
Employment Agreement dated January 26, 2010 by and among Alliance and John H. Watt Jr. (incorporated herein by reference to Exhibit 10.2 to Alliance’s Current Report on Form 8-K filed with the SEC on February 1, 2010). | |
| 10.9 * |
Employment Agreement, dated January 26, 2010 by and between Alliance and J. Daniel Mohr (incorporated by reference to Exhibit 10.3 to Alliance’s Current Report on Form 8-K filed with the SEC on February 1, 2010) | |
| 10.10 * |
Form of Change of Control Agreement, dated January 27, 2009, by and between Alliance, Alliance Financial Corporation, and James W. Getman and Steven G. Cacchio (incorporated herein by reference to Exhibit 10.11 of Alliance’s annual report on Form 10-K filed with the SEC on March 13, 2009). | |
88
Table of Contents
| 10.11 * |
Director Supplemental Retirement Benefit Plan of Oswego County Savings Bank, dated as of March 15, 2000 (incorporated by reference to Exhibit 10.10 to Alliance’s Annual Report on Form 10-K filed with the SEC on March 13, 2007). | |
| 10.12 * |
Oswego County National Bank Voluntary Deferred Compensation Plan for Directors, Amended and Restated effective January 1, 2005 (incorporated by reference to Exhibit 10.11 to Alliance’s Annual Report on Form 10-K filed with the SEC on March 13, 2007). | |
| 10.13 * |
Directors Compensation Deferral Plan of Alliance (incorporated herein by reference to Exhibit 10.1 to Alliance’s Quarterly Report on Form 10-Q filed with the SEC on August 13, 1999). | |
| 10.14 * |
Alliance Financial Corporation Director Retirement Plan dated March 11, 2008 (incorporated herein by reference to Exhibit 10.1 to Alliance’s Current Report on Form 8-K filed with the SEC on March 14, 2008). | |
| 10.15 * |
Alliance Financial Corporation Stock-Based Deferral Plan dated March 11, 2008 (incorporated herein by reference to Exhibit 10.3 to Alliance’s Current Report on Form 8-K filed with the SEC on March 14, 2008). | |
| 10.16 * |
Alliance Bank Executive Incentive Retirement Plan dated March 11, 2008 (incorporated herein by reference to Exhibit 10.2 to Alliance’s Current Report on Form 8-K filed with the SEC on March 14, 2008). | |
| 10.17 * |
First National Bank of Cortland Excess Benefit Plan for David R. Alvord, dated December 31, 1991, and all amendments thereto (incorporated herein by reference to Exhibit 10.13 to Alliance’s Annual Report on Form 10-K filed with the SEC on March 30, 2001). | |
| 10.18 * |
Oneida Valley National Bank Supplemental Retirement Income Plan for John C. Mott, dated September 1, 1997, and all amendments thereto (incorporated herein by reference to Exhibit 10.14 to Alliance’s Annual Report on Form 10-K filed with the SEC on March 29, 2002). | |
| 21.1 † |
List of Subsidiaries. | |
| 23.1 † |
Consent of Crowe Horwath LLP. | |
| 31.1 † |
Certification of Jack H. Webb, Chairman of the Board, President and Chief Executive Officer of the Registrant, pursuant to Section 302 of the Sarbanes-Oxley Act of 2002. | |
| 31.2 † |
Certification of J. Daniel Mohr, Executive Vice President and Chief Financial Officer of the Registrant, pursuant to Section 302 of the Sarbanes-Oxley Act of 2002. | |
| 32.1 † |
Certification of Jack H. Webb, Chairman of the Board, President and Chief Executive Officer of the Registrant, pursuant to 18 U.S.C. Section 1350, as adopted pursuant to Section 906 of the Sarbanes-Oxley Act of 2002 | |
| 32.2 † |
Certification of J. Daniel Mohr, Executive Vice President and Chief Financial Officer of the Registrant, pursuant to 18 U.S.C. Section 1350, as adopted pursuant to Section 906 of the Sarbanes-Oxley Act of 2002. | |
| † | Filed herewith. |
| * | Management contract or compensatory plan or arrangement. |
89